Wichita, KS Map & Demographics
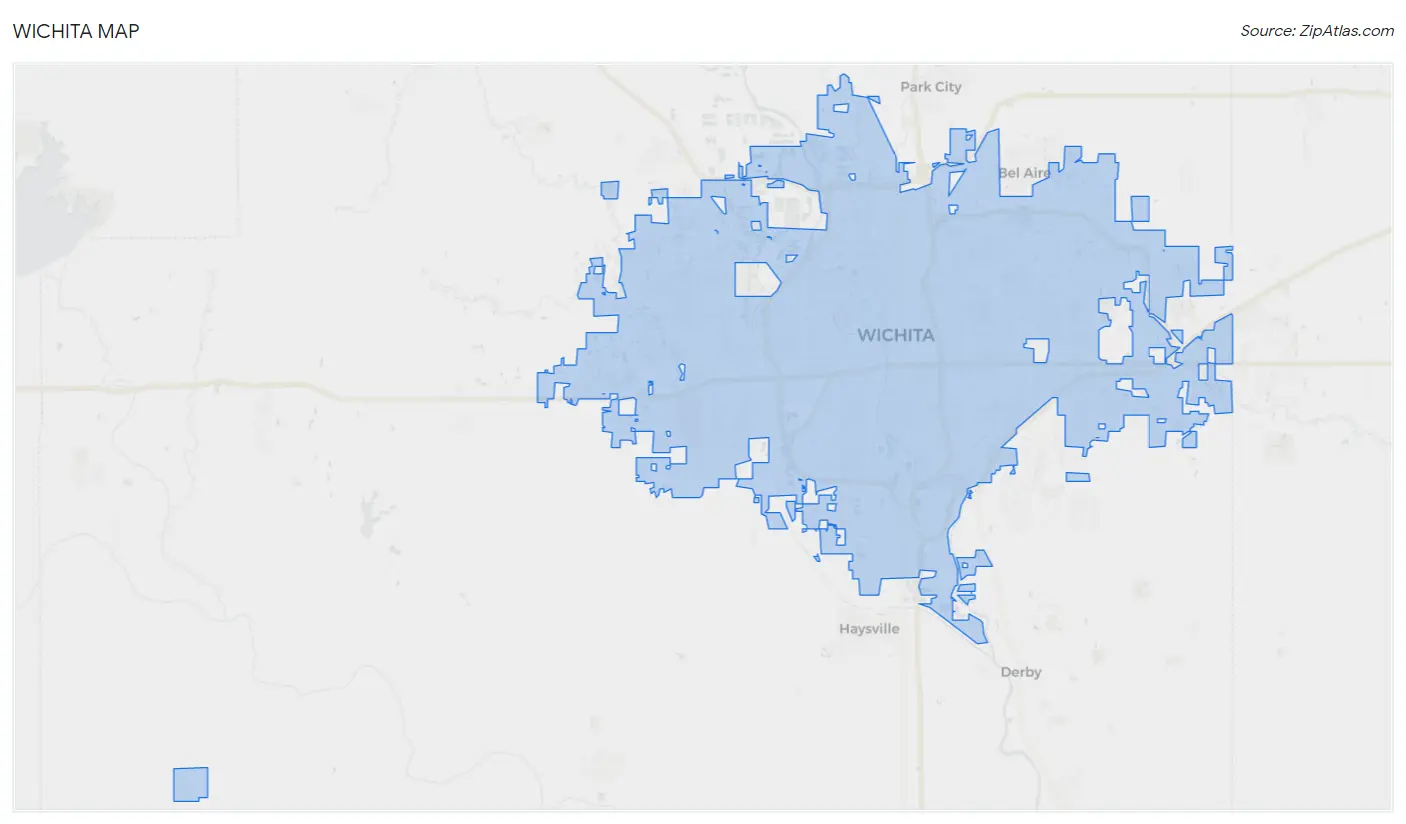
Wichita Map
Wichita Overview
$34,393
PER CAPITA INCOME
$77,916
AVG FAMILY INCOME
$60,712
AVG HOUSEHOLD INCOME
29.6%
WAGE / INCOME GAP [ % ]
70.4¢/ $1
WAGE / INCOME GAP [ $ ]
$11,123
FAMILY INCOME DEFICIT
0.47
INEQUALITY / GINI INDEX
395,951
TOTAL POPULATION
196,946
MALE POPULATION
199,005
FEMALE POPULATION
98.97
MALES / 100 FEMALES
101.05
FEMALES / 100 MALES
35.4
MEDIAN AGE
3.2
AVG FAMILY SIZE
2.5
AVG HOUSEHOLD SIZE
204,593
LABOR FORCE [ PEOPLE ]
66.0%
PERCENT IN LABOR FORCE
5.7%
UNEMPLOYMENT RATE
Wichita Zip Codes
Wichita Area Codes
Income in Wichita
Income Overview in Wichita
Per Capita Income in Wichita is $34,393, while median incomes of families and households are $77,916 and $60,712 respectively.
| Characteristic | Number | Measure |
| Per Capita Income | 395,951 | $34,393 |
| Median Family Income | 93,972 | $77,916 |
| Mean Family Income | 93,972 | $101,591 |
| Median Household Income | 156,054 | $60,712 |
| Mean Household Income | 156,054 | $84,475 |
| Income Deficit | 93,972 | $11,123 |
| Wage / Income Gap (%) | 395,951 | 29.63% |
| Wage / Income Gap ($) | 395,951 | 70.37¢ per $1 |
| Gini / Inequality Index | 395,951 | 0.47 |
Earnings by Sex in Wichita
Average Earnings in Wichita are $36,360, $43,292 for men and $30,465 for women, a difference of 29.6%.
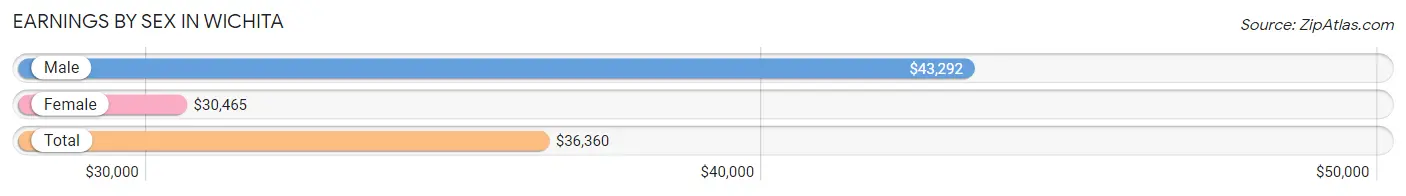
| Sex | Number | Average Earnings |
| Male | 111,370 (52.6%) | $43,292 |
| Female | 100,438 (47.4%) | $30,465 |
| Total | 211,808 (100.0%) | $36,360 |
Earnings by Sex by Income Bracket in Wichita
The most common earnings brackets in Wichita are $100,000+ for men (14,928 | 13.4%) and $25,000 to $29,999 for women (8,389 | 8.4%).
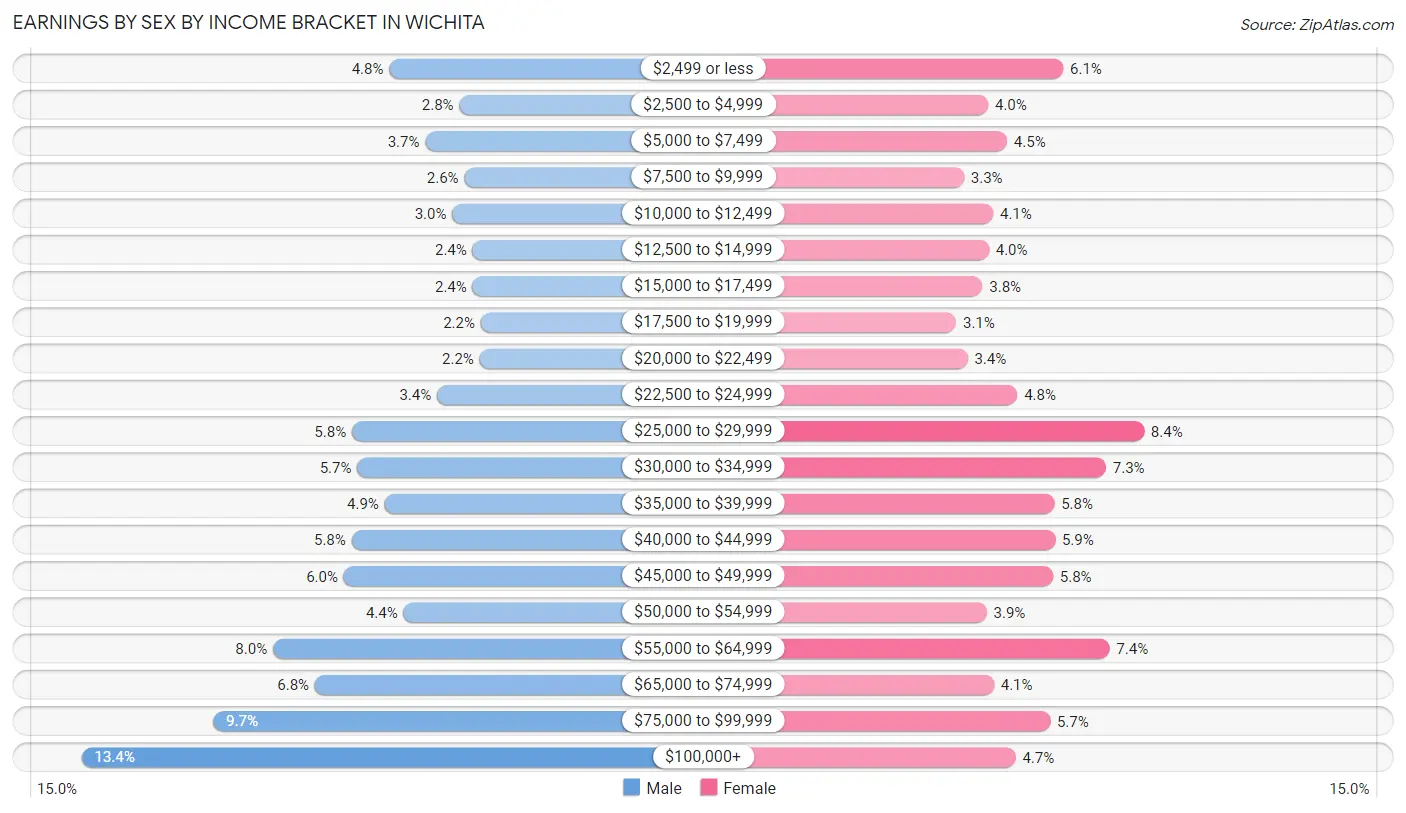
| Income | Male | Female |
| $2,499 or less | 5,289 (4.8%) | 6,108 (6.1%) |
| $2,500 to $4,999 | 3,101 (2.8%) | 3,984 (4.0%) |
| $5,000 to $7,499 | 4,165 (3.7%) | 4,520 (4.5%) |
| $7,500 to $9,999 | 2,945 (2.6%) | 3,303 (3.3%) |
| $10,000 to $12,499 | 3,314 (3.0%) | 4,127 (4.1%) |
| $12,500 to $14,999 | 2,679 (2.4%) | 4,012 (4.0%) |
| $15,000 to $17,499 | 2,683 (2.4%) | 3,825 (3.8%) |
| $17,500 to $19,999 | 2,427 (2.2%) | 3,085 (3.1%) |
| $20,000 to $22,499 | 2,463 (2.2%) | 3,409 (3.4%) |
| $22,500 to $24,999 | 3,802 (3.4%) | 4,812 (4.8%) |
| $25,000 to $29,999 | 6,458 (5.8%) | 8,389 (8.4%) |
| $30,000 to $34,999 | 6,295 (5.7%) | 7,315 (7.3%) |
| $35,000 to $39,999 | 5,438 (4.9%) | 5,854 (5.8%) |
| $40,000 to $44,999 | 6,468 (5.8%) | 5,872 (5.9%) |
| $45,000 to $49,999 | 6,715 (6.0%) | 5,818 (5.8%) |
| $50,000 to $54,999 | 4,843 (4.3%) | 3,946 (3.9%) |
| $55,000 to $64,999 | 8,934 (8.0%) | 7,417 (7.4%) |
| $65,000 to $74,999 | 7,617 (6.8%) | 4,145 (4.1%) |
| $75,000 to $99,999 | 10,806 (9.7%) | 5,739 (5.7%) |
| $100,000+ | 14,928 (13.4%) | 4,758 (4.7%) |
| Total | 111,370 (100.0%) | 100,438 (100.0%) |
Earnings by Sex by Educational Attainment in Wichita
Average earnings in Wichita are $49,581 for men and $35,248 for women, a difference of 28.9%. Men with an educational attainment of graduate degree enjoy the highest average annual earnings of $85,203, while those with less than high school education earn the least with $35,719. Women with an educational attainment of graduate degree earn the most with the average annual earnings of $58,266, while those with less than high school education have the smallest earnings of $22,981.
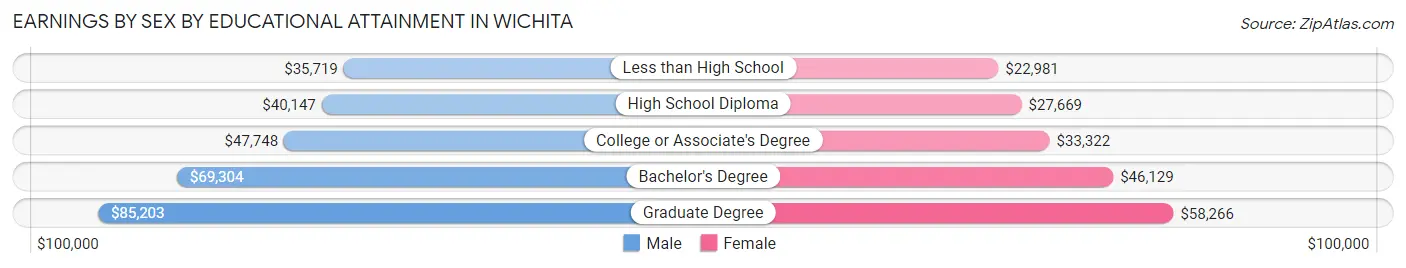
| Educational Attainment | Male Income | Female Income |
| Less than High School | $35,719 | $22,981 |
| High School Diploma | $40,147 | $27,669 |
| College or Associate's Degree | $47,748 | $33,322 |
| Bachelor's Degree | $69,304 | $46,129 |
| Graduate Degree | $85,203 | $58,266 |
| Total | $49,581 | $35,248 |
Family Income in Wichita
Family Income Brackets in Wichita
According to the Wichita family income data, there are 18,231 families falling into the $100,000 to $149,999 income range, which is the most common income bracket and makes up 19.4% of all families. Conversely, the $10,000 to $14,999 income bracket is the least frequent group with only 2,255 families (2.4%) belonging to this category.
| Income Bracket | # Families | % Families |
| Less than $10,000 | 3,101 | 3.3% |
| $10,000 to $14,999 | 2,255 | 2.4% |
| $15,000 to $24,999 | 4,793 | 5.1% |
| $25,000 to $34,999 | 5,920 | 6.3% |
| $35,000 to $49,999 | 10,901 | 11.6% |
| $50,000 to $74,999 | 17,479 | 18.6% |
| $75,000 to $99,999 | 15,129 | 16.1% |
| $100,000 to $149,999 | 18,231 | 19.4% |
| $150,000 to $199,999 | 8,364 | 8.9% |
| $200,000+ | 7,800 | 8.3% |
Family Income by Famaliy Size in Wichita
6-person families (3,540 | 3.8%) account for the highest median family income in Wichita with $95,652 per family, while 2-person families (44,997 | 47.9%) have the highest median income of $36,494 per family member.
| Income Bracket | # Families | Median Income |
| 2-Person Families | 44,997 (47.9%) | $72,987 |
| 3-Person Families | 18,733 (19.9%) | $77,110 |
| 4-Person Families | 15,878 (16.9%) | $92,422 |
| 5-Person Families | 8,580 (9.1%) | $80,417 |
| 6-Person Families | 3,540 (3.8%) | $95,652 |
| 7+ Person Families | 2,244 (2.4%) | $78,750 |
| Total | 93,972 (100.0%) | $77,916 |
Family Income by Number of Earners in Wichita
The median family income in Wichita is $77,916, with families comprising 3+ earners (10,748) having the highest median family income of $125,289, while families with 1 earner (32,168) have the lowest median family income of $54,084, accounting for 11.4% and 34.2% of families, respectively.
| Number of Earners | # Families | Median Income |
| No Earners | 12,869 (13.7%) | $55,383 |
| 1 Earner | 32,168 (34.2%) | $54,084 |
| 2 Earners | 38,187 (40.6%) | $97,201 |
| 3+ Earners | 10,748 (11.4%) | $125,289 |
| Total | 93,972 (100.0%) | $77,916 |
Household Income in Wichita
Household Income Brackets in Wichita
With 28,402 households falling in the category, the $50,000 to $74,999 income range is the most frequent in Wichita, accounting for 18.2% of all households. In contrast, only 7,335 households (4.7%) fall into the $10,000 to $14,999 income bracket, making it the least populous group.
| Income Bracket | # Households | % Households |
| Less than $10,000 | 8,427 | 5.4% |
| $10,000 to $14,999 | 7,335 | 4.7% |
| $15,000 to $24,999 | 12,484 | 8.0% |
| $25,000 to $34,999 | 15,605 | 10.0% |
| $35,000 to $49,999 | 21,223 | 13.6% |
| $50,000 to $74,999 | 28,402 | 18.2% |
| $75,000 to $99,999 | 20,755 | 13.3% |
| $100,000 to $149,999 | 22,316 | 14.3% |
| $150,000 to $199,999 | 10,144 | 6.5% |
| $200,000+ | 9,363 | 6.0% |
Household Income by Householder Age in Wichita
The median household income in Wichita is $60,712, with the highest median household income of $73,692 found in the 45 to 64 years age bracket for the primary householder. A total of 52,909 households (33.9%) fall into this category. Meanwhile, the 15 to 24 years age bracket for the primary householder has the lowest median household income of $37,237, with 9,392 households (6.0%) in this group.
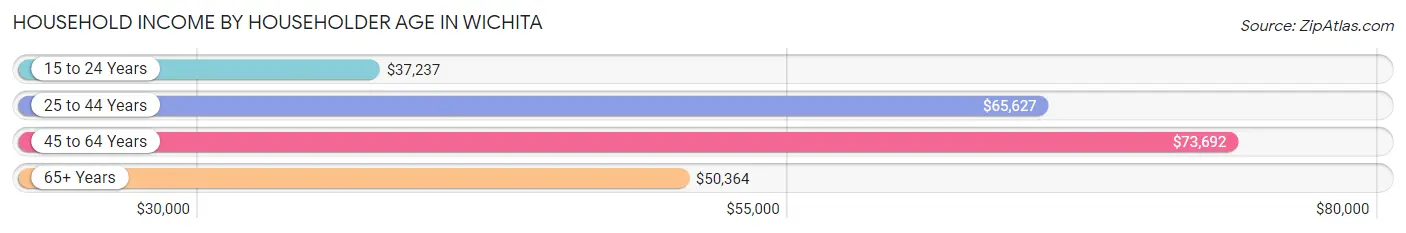
| Income Bracket | # Households | Median Income |
| 15 to 24 Years | 9,392 (6.0%) | $37,237 |
| 25 to 44 Years | 55,086 (35.3%) | $65,627 |
| 45 to 64 Years | 52,909 (33.9%) | $73,692 |
| 65+ Years | 38,667 (24.8%) | $50,364 |
| Total | 156,054 (100.0%) | $60,712 |
Poverty in Wichita
Income Below Poverty by Sex and Age in Wichita
With 14.7% poverty level for males and 16.3% for females among the residents of Wichita, under 5 year old males and 5 year old females are the most vulnerable to poverty, with 2,672 males (21.5%) and 534 females (25.8%) in their respective age groups living below the poverty level.
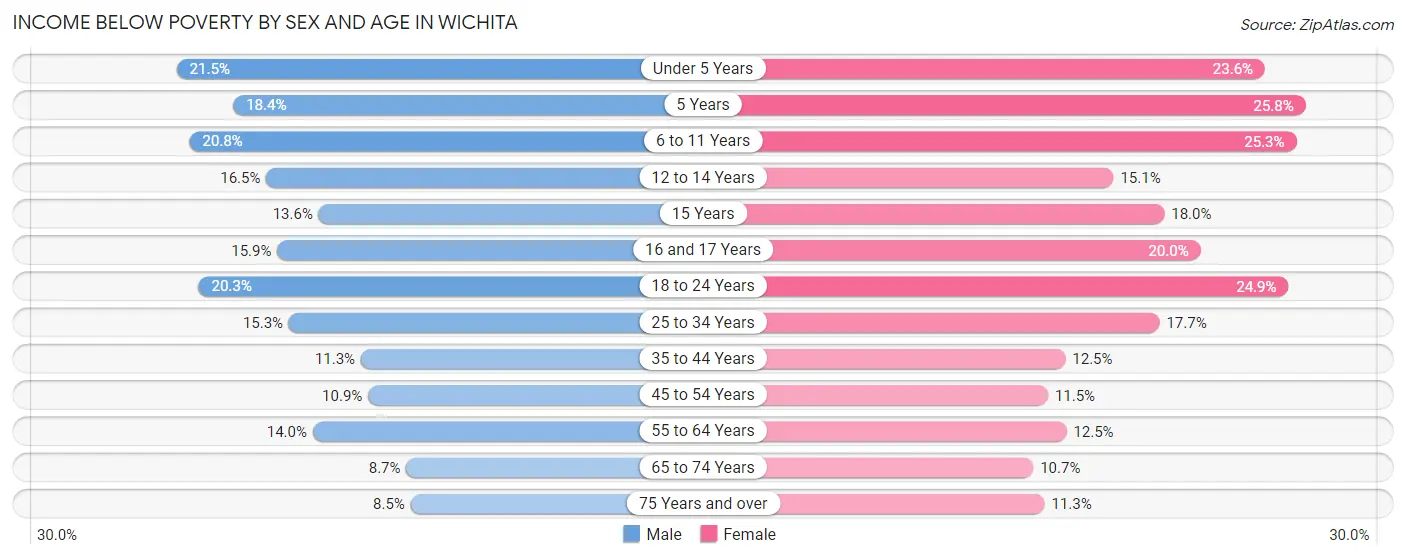
| Age Bracket | Male | Female |
| Under 5 Years | 2,672 (21.5%) | 2,864 (23.6%) |
| 5 Years | 432 (18.4%) | 534 (25.8%) |
| 6 to 11 Years | 3,590 (20.8%) | 3,818 (25.3%) |
| 12 to 14 Years | 1,432 (16.5%) | 1,385 (15.1%) |
| 15 Years | 367 (13.6%) | 464 (18.0%) |
| 16 and 17 Years | 907 (15.9%) | 1,109 (20.0%) |
| 18 to 24 Years | 3,917 (20.3%) | 4,695 (24.9%) |
| 25 to 34 Years | 4,474 (15.3%) | 5,080 (17.7%) |
| 35 to 44 Years | 2,817 (11.3%) | 3,043 (12.4%) |
| 45 to 54 Years | 2,383 (10.9%) | 2,539 (11.5%) |
| 55 to 64 Years | 3,179 (14.0%) | 2,928 (12.5%) |
| 65 to 74 Years | 1,477 (8.7%) | 2,006 (10.7%) |
| 75 Years and over | 785 (8.5%) | 1,478 (11.3%) |
| Total | 28,432 (14.7%) | 31,943 (16.3%) |
Income Above Poverty by Sex and Age in Wichita
According to the poverty statistics in Wichita, males aged 75 years and over and females aged 65 to 74 years are the age groups that are most secure financially, with 91.5% of males and 89.3% of females in these age groups living above the poverty line.
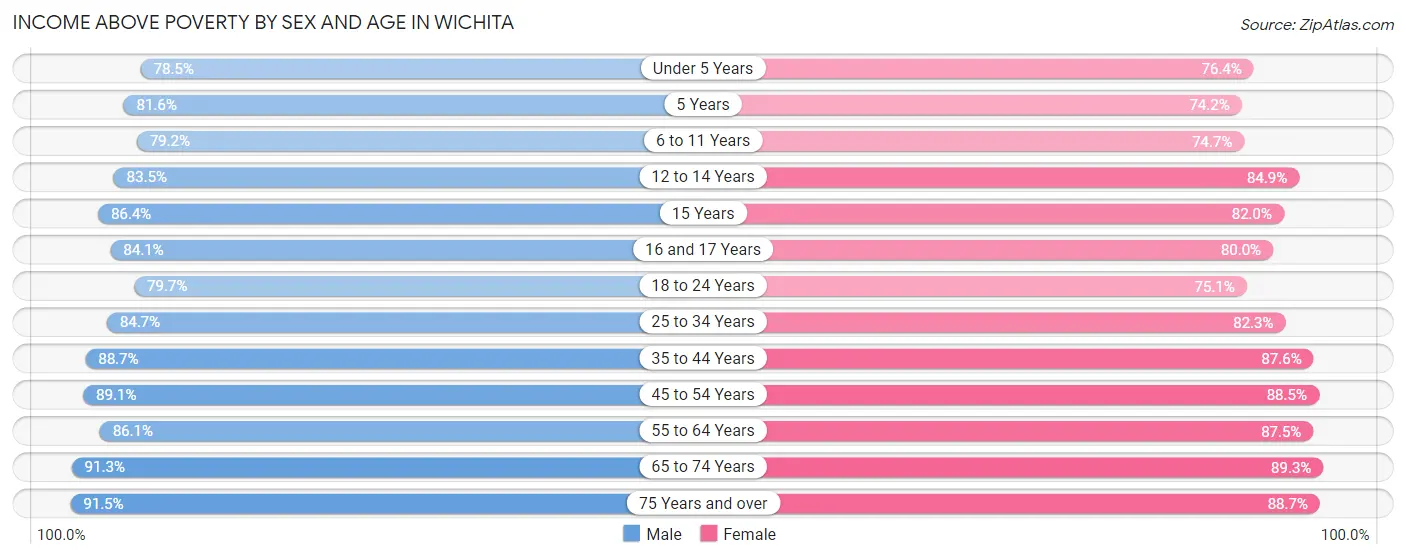
| Age Bracket | Male | Female |
| Under 5 Years | 9,739 (78.5%) | 9,292 (76.4%) |
| 5 Years | 1,919 (81.6%) | 1,534 (74.2%) |
| 6 to 11 Years | 13,656 (79.2%) | 11,268 (74.7%) |
| 12 to 14 Years | 7,228 (83.5%) | 7,766 (84.9%) |
| 15 Years | 2,328 (86.4%) | 2,120 (82.0%) |
| 16 and 17 Years | 4,787 (84.1%) | 4,442 (80.0%) |
| 18 to 24 Years | 15,365 (79.7%) | 14,192 (75.1%) |
| 25 to 34 Years | 24,810 (84.7%) | 23,637 (82.3%) |
| 35 to 44 Years | 22,173 (88.7%) | 21,403 (87.5%) |
| 45 to 54 Years | 19,536 (89.1%) | 19,570 (88.5%) |
| 55 to 64 Years | 19,602 (86.1%) | 20,483 (87.5%) |
| 65 to 74 Years | 15,427 (91.3%) | 16,820 (89.3%) |
| 75 Years and over | 8,449 (91.5%) | 11,611 (88.7%) |
| Total | 165,019 (85.3%) | 164,138 (83.7%) |
Income Below Poverty Among Married-Couple Families in Wichita
The poverty statistics for married-couple families in Wichita show that 5.7% or 3,790 of the total 66,401 families live below the poverty line. Families with 5 or more children have the highest poverty rate of 20.6%, comprising of 144 families. On the other hand, families with no children have the lowest poverty rate of 4.5%, which includes 1,726 families.
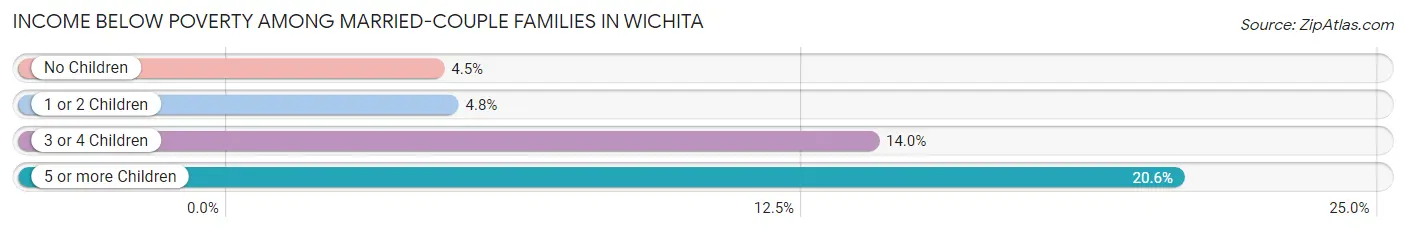
| Children | Above Poverty | Below Poverty |
| No Children | 36,705 (95.5%) | 1,726 (4.5%) |
| 1 or 2 Children | 19,616 (95.2%) | 990 (4.8%) |
| 3 or 4 Children | 5,735 (86.1%) | 930 (14.0%) |
| 5 or more Children | 555 (79.4%) | 144 (20.6%) |
| Total | 62,611 (94.3%) | 3,790 (5.7%) |
Income Below Poverty Among Single-Parent Households in Wichita
According to the poverty data in Wichita, 16.0% or 1,231 single-father households and 25.4% or 5,041 single-mother households are living below the poverty line. Among single-father households, those with 5 or more children have the highest poverty rate, with 81 households (75.7%) experiencing poverty. Likewise, among single-mother households, those with 5 or more children have the highest poverty rate, with 407 households (78.0%) falling below the poverty line.
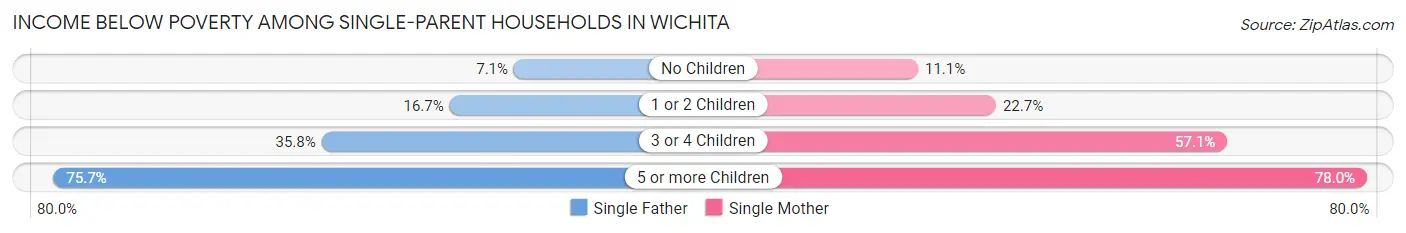
| Children | Single Father | Single Mother |
| No Children | 212 (7.1%) | 679 (11.1%) |
| 1 or 2 Children | 623 (16.7%) | 2,366 (22.7%) |
| 3 or 4 Children | 315 (35.7%) | 1,589 (57.1%) |
| 5 or more Children | 81 (75.7%) | 407 (78.0%) |
| Total | 1,231 (16.0%) | 5,041 (25.4%) |
Income Below Poverty Among Married-Couple vs Single-Parent Households in Wichita
The poverty data for Wichita shows that 3,790 of the married-couple family households (5.7%) and 6,272 of the single-parent households (22.8%) are living below the poverty level. Within the married-couple family households, those with 5 or more children have the highest poverty rate, with 144 households (20.6%) falling below the poverty line. Among the single-parent households, those with 5 or more children have the highest poverty rate, with 488 household (77.6%) living below poverty.
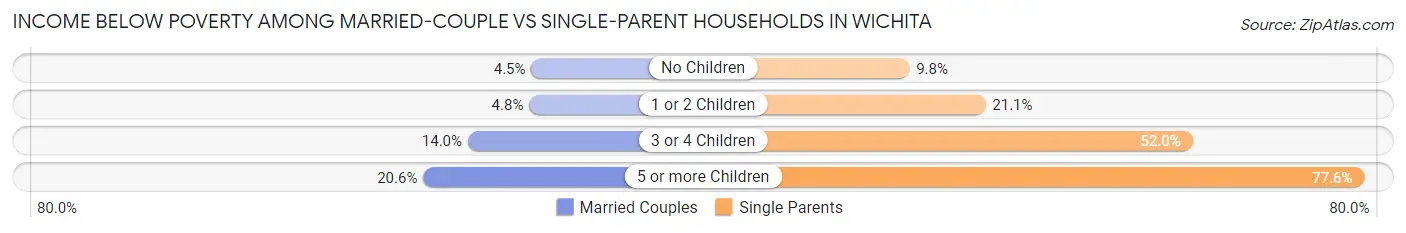
| Children | Married-Couple Families | Single-Parent Households |
| No Children | 1,726 (4.5%) | 891 (9.8%) |
| 1 or 2 Children | 990 (4.8%) | 2,989 (21.1%) |
| 3 or 4 Children | 930 (14.0%) | 1,904 (52.0%) |
| 5 or more Children | 144 (20.6%) | 488 (77.6%) |
| Total | 3,790 (5.7%) | 6,272 (22.8%) |
Race in Wichita
The most populous races in Wichita are White / Caucasian (273,113 | 69.0%), Hispanic or Latino (69,539 | 17.6%), and Two or more Races (39,749 | 10.0%).
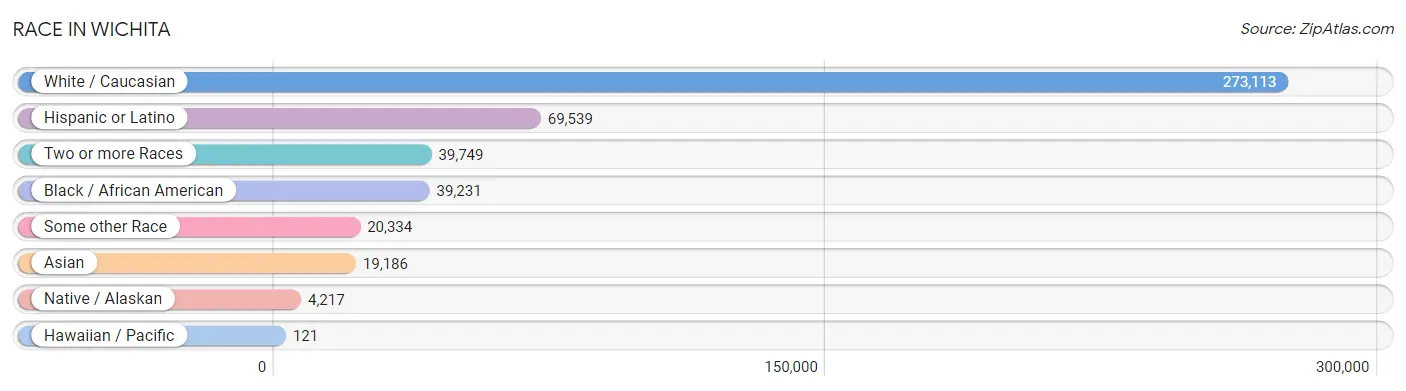
| Race | # Population | % Population |
| Asian | 19,186 | 4.9% |
| Black / African American | 39,231 | 9.9% |
| Hawaiian / Pacific | 121 | 0.0% |
| Hispanic or Latino | 69,539 | 17.6% |
| Native / Alaskan | 4,217 | 1.1% |
| White / Caucasian | 273,113 | 69.0% |
| Two or more Races | 39,749 | 10.0% |
| Some other Race | 20,334 | 5.1% |
| Total | 395,951 | 100.0% |
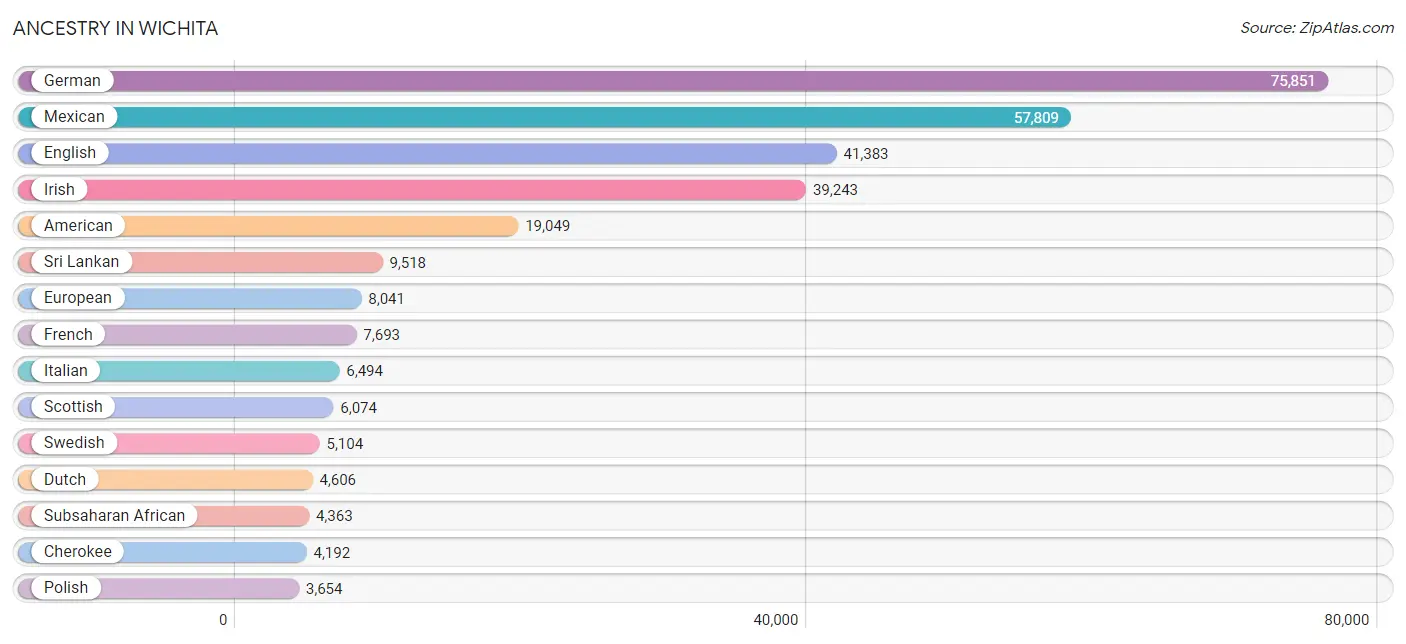
Ancestry in Wichita
The most populous ancestries reported in Wichita are German (75,851 | 19.2%), Mexican (57,809 | 14.6%), English (41,383 | 10.4%), Irish (39,243 | 9.9%), and American (19,049 | 4.8%), together accounting for 58.9% of all Wichita residents.
| Ancestry | # Population | % Population |
| African | 2,690 | 0.7% |
| Alaska Native | 17 | 0.0% |
| Aleut | 8 | 0.0% |
| Alsatian | 8 | 0.0% |
| American | 19,049 | 4.8% |
| Apache | 584 | 0.2% |
| Arab | 2,917 | 0.7% |
| Arapaho | 52 | 0.0% |
| Argentinean | 269 | 0.1% |
| Armenian | 54 | 0.0% |
| Australian | 23 | 0.0% |
| Austrian | 495 | 0.1% |
| Bahamian | 15 | 0.0% |
| Bangladeshi | 181 | 0.1% |
| Barbadian | 14 | 0.0% |
| Belgian | 382 | 0.1% |
| Bhutanese | 806 | 0.2% |
| Blackfeet | 915 | 0.2% |
| Bolivian | 29 | 0.0% |
| Brazilian | 175 | 0.0% |
| British | 2,648 | 0.7% |
| Bulgarian | 258 | 0.1% |
| Burmese | 681 | 0.2% |
| Cajun | 40 | 0.0% |
| Canadian | 330 | 0.1% |
| Celtic | 96 | 0.0% |
| Central American | 3,537 | 0.9% |
| Central American Indian | 246 | 0.1% |
| Cherokee | 4,192 | 1.1% |
| Cheyenne | 16 | 0.0% |
| Chickasaw | 70 | 0.0% |
| Chilean | 124 | 0.0% |
| Chippewa | 116 | 0.0% |
| Choctaw | 1,035 | 0.3% |
| Colombian | 293 | 0.1% |
| Comanche | 97 | 0.0% |
| Costa Rican | 140 | 0.0% |
| Cree | 32 | 0.0% |
| Creek | 840 | 0.2% |
| Croatian | 193 | 0.1% |
| Cuban | 337 | 0.1% |
| Czech | 1,438 | 0.4% |
| Czechoslovakian | 339 | 0.1% |
| Danish | 1,238 | 0.3% |
| Delaware | 168 | 0.0% |
| Dominican | 73 | 0.0% |
| Dutch | 4,606 | 1.2% |
| Dutch West Indian | 45 | 0.0% |
| Eastern European | 445 | 0.1% |
| Ecuadorian | 146 | 0.0% |
| Egyptian | 151 | 0.0% |
| English | 41,383 | 10.4% |
| Estonian | 6 | 0.0% |
| Ethiopian | 56 | 0.0% |
| European | 8,041 | 2.0% |
| Fijian | 58 | 0.0% |
| Filipino | 167 | 0.0% |
| Finnish | 195 | 0.1% |
| French | 7,693 | 1.9% |
| French American Indian | 21 | 0.0% |
| French Canadian | 1,210 | 0.3% |
| German | 75,851 | 19.2% |
| German Russian | 157 | 0.0% |
| Ghanaian | 126 | 0.0% |
| Greek | 541 | 0.1% |
| Guamanian / Chamorro | 200 | 0.1% |
| Guatemalan | 799 | 0.2% |
| Haitian | 93 | 0.0% |
| Honduran | 644 | 0.2% |
| Hopi | 18 | 0.0% |
| Hungarian | 634 | 0.2% |
| Icelander | 53 | 0.0% |
| Indian (Asian) | 2,209 | 0.6% |
| Indonesian | 148 | 0.0% |
| Inupiat | 16 | 0.0% |
| Iranian | 490 | 0.1% |
| Irish | 39,243 | 9.9% |
| Iroquois | 109 | 0.0% |
| Israeli | 16 | 0.0% |
| Italian | 6,494 | 1.6% |
| Jamaican | 295 | 0.1% |
| Japanese | 1,737 | 0.4% |
| Jordanian | 89 | 0.0% |
| Kenyan | 361 | 0.1% |
| Kiowa | 238 | 0.1% |
| Korean | 2,887 | 0.7% |
| Laotian | 98 | 0.0% |
| Latvian | 12 | 0.0% |
| Lebanese | 1,339 | 0.3% |
| Lithuanian | 113 | 0.0% |
| Luxembourger | 54 | 0.0% |
| Macedonian | 4 | 0.0% |
| Malaysian | 1,773 | 0.4% |
| Maltese | 10 | 0.0% |
| Mexican | 57,809 | 14.6% |
| Mexican American Indian | 697 | 0.2% |
| Mongolian | 163 | 0.0% |
| Moroccan | 180 | 0.1% |
| Native Hawaiian | 129 | 0.0% |
| Navajo | 132 | 0.0% |
| New Zealander | 12 | 0.0% |
| Nicaraguan | 106 | 0.0% |
| Nigerian | 386 | 0.1% |
| Northern European | 403 | 0.1% |
| Norwegian | 2,787 | 0.7% |
| Osage | 255 | 0.1% |
| Ottawa | 86 | 0.0% |
| Pakistani | 388 | 0.1% |
| Palestinian | 79 | 0.0% |
| Panamanian | 115 | 0.0% |
| Paraguayan | 41 | 0.0% |
| Pennsylvania German | 413 | 0.1% |
| Peruvian | 319 | 0.1% |
| Pima | 104 | 0.0% |
| Polish | 3,654 | 0.9% |
| Portuguese | 256 | 0.1% |
| Potawatomi | 192 | 0.1% |
| Pueblo | 358 | 0.1% |
| Puerto Rican | 2,702 | 0.7% |
| Puget Sound Salish | 4 | 0.0% |
| Romanian | 135 | 0.0% |
| Russian | 2,019 | 0.5% |
| Salvadoran | 1,733 | 0.4% |
| Samoan | 40 | 0.0% |
| Scandinavian | 1,252 | 0.3% |
| Scotch-Irish | 3,458 | 0.9% |
| Scottish | 6,074 | 1.5% |
| Seminole | 82 | 0.0% |
| Sioux | 335 | 0.1% |
| Slavic | 48 | 0.0% |
| Slovak | 193 | 0.1% |
| Slovene | 44 | 0.0% |
| South African | 23 | 0.0% |
| South American | 1,723 | 0.4% |
| South American Indian | 12 | 0.0% |
| Spaniard | 910 | 0.2% |
| Spanish | 325 | 0.1% |
| Spanish American | 42 | 0.0% |
| Spanish American Indian | 13 | 0.0% |
| Sri Lankan | 9,518 | 2.4% |
| Subsaharan African | 4,363 | 1.1% |
| Sudanese | 215 | 0.1% |
| Swedish | 5,104 | 1.3% |
| Swiss | 1,107 | 0.3% |
| Syrian | 148 | 0.0% |
| Thai | 2,312 | 0.6% |
| Trinidadian and Tobagonian | 14 | 0.0% |
| Turkish | 58 | 0.0% |
| U.S. Virgin Islander | 6 | 0.0% |
| Ugandan | 28 | 0.0% |
| Ukrainian | 353 | 0.1% |
| Uruguayan | 29 | 0.0% |
| Venezuelan | 473 | 0.1% |
| Vietnamese | 37 | 0.0% |
| Welsh | 2,108 | 0.5% |
| West Indian | 16 | 0.0% |
| Yaqui | 20 | 0.0% |
| Yugoslavian | 50 | 0.0% |
| Zimbabwean | 10 | 0.0% | View All 159 Rows |
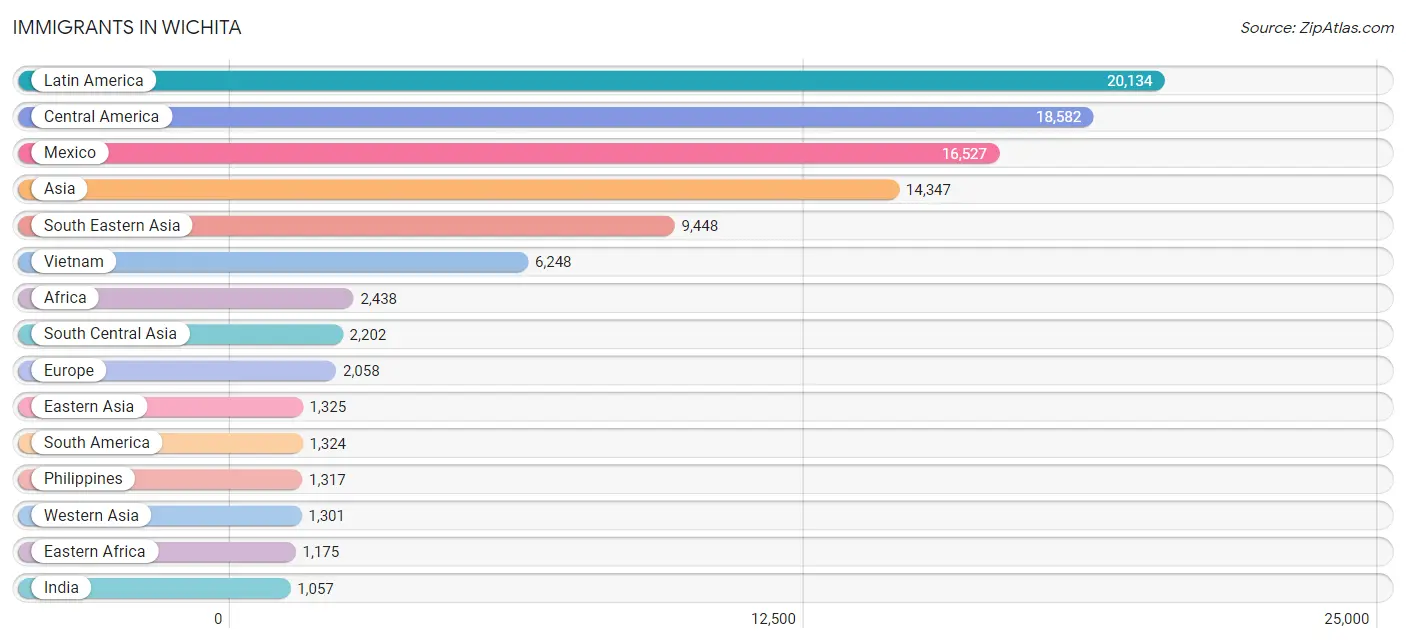
Immigrants in Wichita
The most numerous immigrant groups reported in Wichita came from Latin America (20,134 | 5.1%), Central America (18,582 | 4.7%), Mexico (16,527 | 4.2%), Asia (14,347 | 3.6%), and South Eastern Asia (9,448 | 2.4%), together accounting for 20.0% of all Wichita residents.
| Immigration Origin | # Population | % Population |
| Africa | 2,438 | 0.6% |
| Argentina | 61 | 0.0% |
| Armenia | 7 | 0.0% |
| Asia | 14,347 | 3.6% |
| Australia | 15 | 0.0% |
| Austria | 17 | 0.0% |
| Bahamas | 4 | 0.0% |
| Bangladesh | 170 | 0.0% |
| Bosnia and Herzegovina | 14 | 0.0% |
| Brazil | 192 | 0.1% |
| Bulgaria | 144 | 0.0% |
| Cambodia | 548 | 0.1% |
| Cameroon | 14 | 0.0% |
| Canada | 301 | 0.1% |
| Caribbean | 228 | 0.1% |
| Central America | 18,582 | 4.7% |
| Chile | 46 | 0.0% |
| China | 842 | 0.2% |
| Colombia | 156 | 0.0% |
| Congo | 241 | 0.1% |
| Costa Rica | 116 | 0.0% |
| Croatia | 13 | 0.0% |
| Cuba | 54 | 0.0% |
| Czechoslovakia | 15 | 0.0% |
| Dominican Republic | 70 | 0.0% |
| Eastern Africa | 1,175 | 0.3% |
| Eastern Asia | 1,325 | 0.3% |
| Eastern Europe | 659 | 0.2% |
| Ecuador | 158 | 0.0% |
| Egypt | 108 | 0.0% |
| El Salvador | 801 | 0.2% |
| England | 372 | 0.1% |
| Eritrea | 173 | 0.0% |
| Ethiopia | 176 | 0.0% |
| Europe | 2,058 | 0.5% |
| France | 68 | 0.0% |
| Germany | 296 | 0.1% |
| Ghana | 66 | 0.0% |
| Greece | 19 | 0.0% |
| Guatemala | 596 | 0.2% |
| Haiti | 27 | 0.0% |
| Honduras | 411 | 0.1% |
| Hong Kong | 87 | 0.0% |
| Hungary | 27 | 0.0% |
| India | 1,057 | 0.3% |
| Indonesia | 45 | 0.0% |
| Iran | 199 | 0.1% |
| Iraq | 283 | 0.1% |
| Ireland | 20 | 0.0% |
| Israel | 8 | 0.0% |
| Italy | 74 | 0.0% |
| Jamaica | 48 | 0.0% |
| Japan | 154 | 0.0% |
| Jordan | 99 | 0.0% |
| Kazakhstan | 5 | 0.0% |
| Kenya | 458 | 0.1% |
| Korea | 329 | 0.1% |
| Kuwait | 118 | 0.0% |
| Laos | 581 | 0.2% |
| Latin America | 20,134 | 5.1% |
| Lebanon | 514 | 0.1% |
| Malaysia | 188 | 0.1% |
| Mexico | 16,527 | 4.2% |
| Middle Africa | 417 | 0.1% |
| Moldova | 8 | 0.0% |
| Morocco | 104 | 0.0% |
| Nepal | 322 | 0.1% |
| Netherlands | 100 | 0.0% |
| Nicaragua | 38 | 0.0% |
| Nigeria | 252 | 0.1% |
| Northern Africa | 377 | 0.1% |
| Northern Europe | 796 | 0.2% |
| Norway | 23 | 0.0% |
| Oceania | 55 | 0.0% |
| Pakistan | 334 | 0.1% |
| Panama | 93 | 0.0% |
| Peru | 193 | 0.1% |
| Philippines | 1,317 | 0.3% |
| Poland | 42 | 0.0% |
| Romania | 90 | 0.0% |
| Russia | 33 | 0.0% |
| Saudi Arabia | 74 | 0.0% |
| Scotland | 18 | 0.0% |
| Singapore | 11 | 0.0% |
| South America | 1,324 | 0.3% |
| South Central Asia | 2,202 | 0.6% |
| South Eastern Asia | 9,448 | 2.4% |
| Southern Europe | 122 | 0.0% |
| Spain | 29 | 0.0% |
| Sri Lanka | 110 | 0.0% |
| Sudan | 75 | 0.0% |
| Sweden | 4 | 0.0% |
| Syria | 76 | 0.0% |
| Taiwan | 132 | 0.0% |
| Thailand | 405 | 0.1% |
| Trinidad and Tobago | 11 | 0.0% |
| Turkey | 100 | 0.0% |
| Uganda | 120 | 0.0% |
| Ukraine | 56 | 0.0% |
| Venezuela | 417 | 0.1% |
| Vietnam | 6,248 | 1.6% |
| Western Africa | 415 | 0.1% |
| Western Asia | 1,301 | 0.3% |
| Western Europe | 481 | 0.1% |
| Zaire | 162 | 0.0% |
| Zimbabwe | 29 | 0.0% | View All 106 Rows |
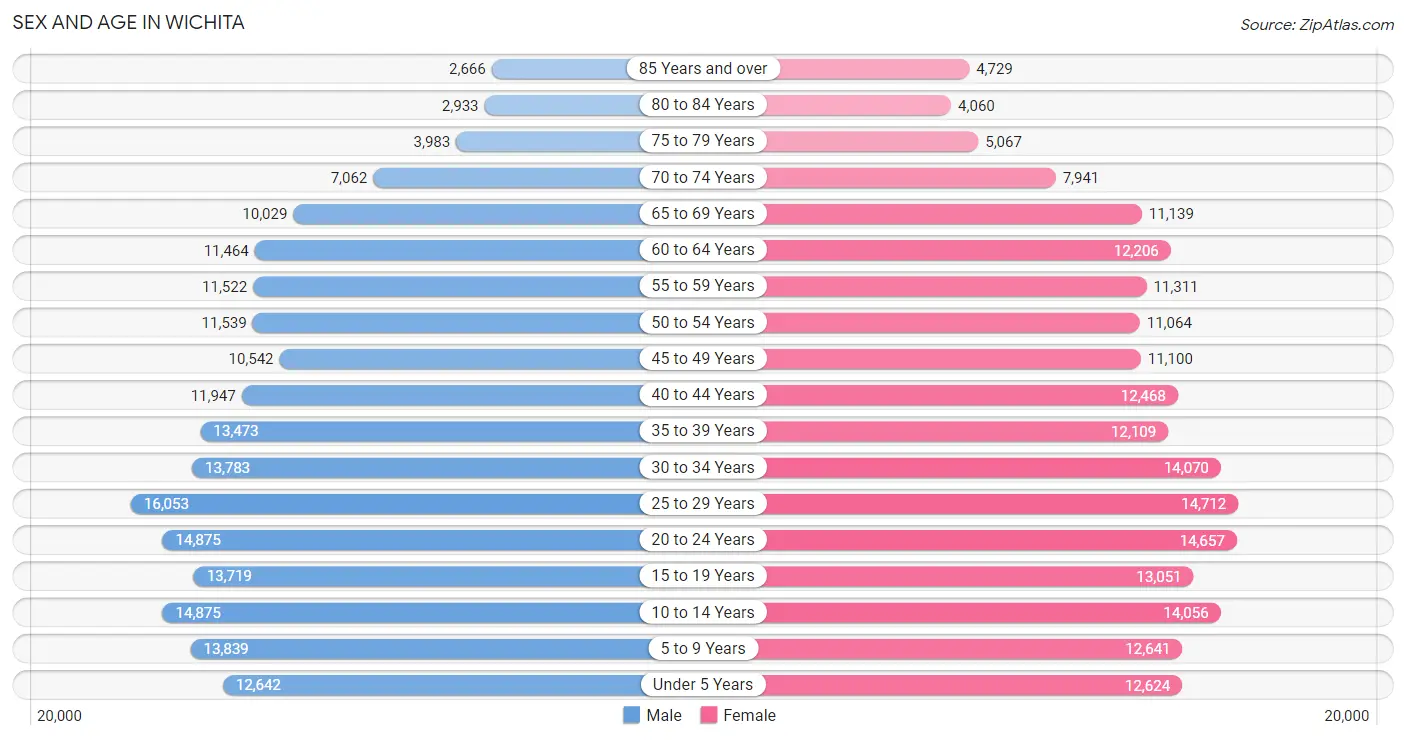
Sex and Age in Wichita
Sex and Age in Wichita
The most populous age groups in Wichita are 25 to 29 Years (16,053 | 8.2%) for men and 25 to 29 Years (14,712 | 7.4%) for women.
| Age Bracket | Male | Female |
| Under 5 Years | 12,642 (6.4%) | 12,624 (6.3%) |
| 5 to 9 Years | 13,839 (7.0%) | 12,641 (6.4%) |
| 10 to 14 Years | 14,875 (7.5%) | 14,056 (7.1%) |
| 15 to 19 Years | 13,719 (7.0%) | 13,051 (6.6%) |
| 20 to 24 Years | 14,875 (7.5%) | 14,657 (7.4%) |
| 25 to 29 Years | 16,053 (8.2%) | 14,712 (7.4%) |
| 30 to 34 Years | 13,783 (7.0%) | 14,070 (7.1%) |
| 35 to 39 Years | 13,473 (6.8%) | 12,109 (6.1%) |
| 40 to 44 Years | 11,947 (6.1%) | 12,468 (6.3%) |
| 45 to 49 Years | 10,542 (5.3%) | 11,100 (5.6%) |
| 50 to 54 Years | 11,539 (5.9%) | 11,064 (5.6%) |
| 55 to 59 Years | 11,522 (5.9%) | 11,311 (5.7%) |
| 60 to 64 Years | 11,464 (5.8%) | 12,206 (6.1%) |
| 65 to 69 Years | 10,029 (5.1%) | 11,139 (5.6%) |
| 70 to 74 Years | 7,062 (3.6%) | 7,941 (4.0%) |
| 75 to 79 Years | 3,983 (2.0%) | 5,067 (2.5%) |
| 80 to 84 Years | 2,933 (1.5%) | 4,060 (2.0%) |
| 85 Years and over | 2,666 (1.3%) | 4,729 (2.4%) |
| Total | 196,946 (100.0%) | 199,005 (100.0%) |
Families and Households in Wichita
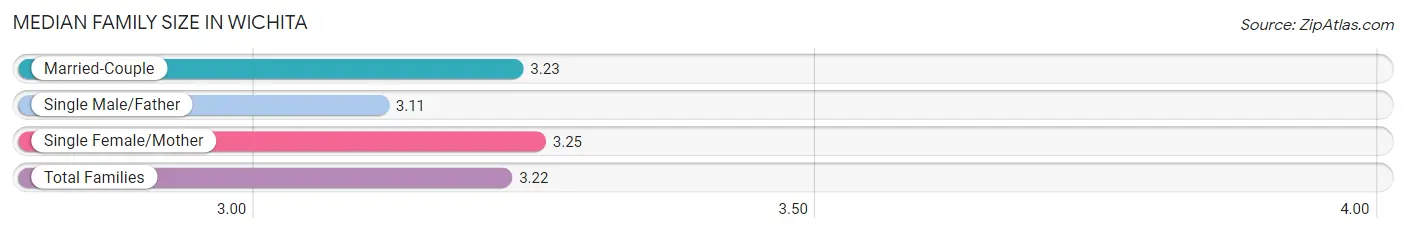
Median Family Size in Wichita
The median family size in Wichita is 3.22 persons per family, with single female/mother families (19,858 | 21.1%) accounting for the largest median family size of 3.25 persons per family. On the other hand, single male/father families (7,713 | 8.2%) represent the smallest median family size with 3.11 persons per family.
| Family Type | # Families | Family Size |
| Married-Couple | 66,401 (70.7%) | 3.23 |
| Single Male/Father | 7,713 (8.2%) | 3.11 |
| Single Female/Mother | 19,858 (21.1%) | 3.25 |
| Total Families | 93,972 (100.0%) | 3.22 |
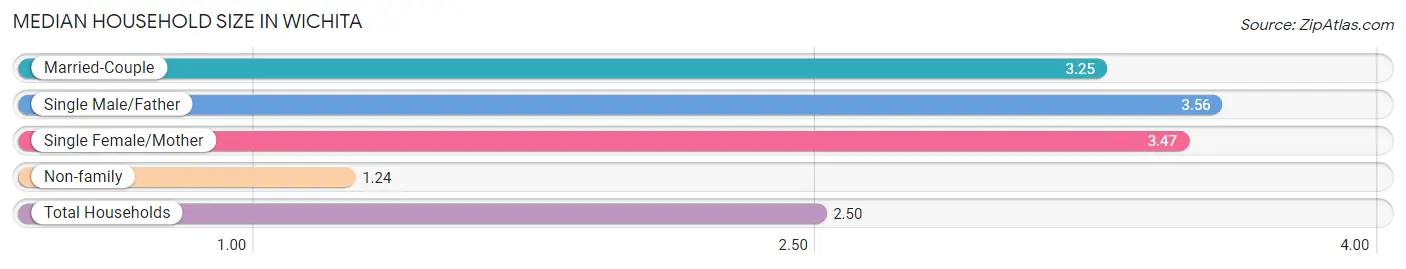
Median Household Size in Wichita
The median household size in Wichita is 2.50 persons per household, with single male/father households (7,713 | 4.9%) accounting for the largest median household size of 3.56 persons per household. non-family households (62,082 | 39.8%) represent the smallest median household size with 1.24 persons per household.
| Household Type | # Households | Household Size |
| Married-Couple | 66,401 (42.5%) | 3.25 |
| Single Male/Father | 7,713 (4.9%) | 3.56 |
| Single Female/Mother | 19,858 (12.7%) | 3.47 |
| Non-family | 62,082 (39.8%) | 1.24 |
| Total Households | 156,054 (100.0%) | 2.50 |
Household Size by Marriage Status in Wichita
Out of a total of 156,054 households in Wichita, 93,972 (60.2%) are family households, while 62,082 (39.8%) are nonfamily households. The most numerous type of family households are 2-person households, comprising 41,792, and the most common type of nonfamily households are 1-person households, comprising 51,435.
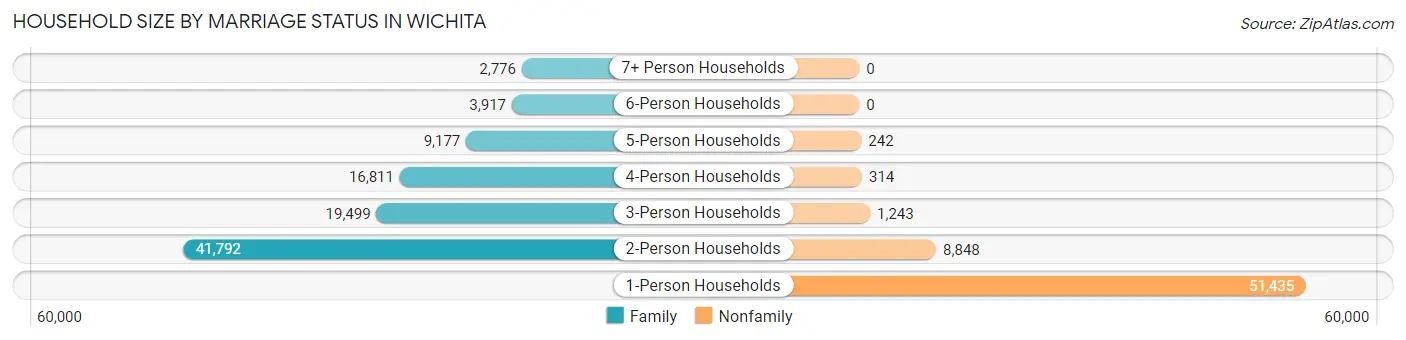
| Household Size | Family Households | Nonfamily Households |
| 1-Person Households | - | 51,435 (33.0%) |
| 2-Person Households | 41,792 (26.8%) | 8,848 (5.7%) |
| 3-Person Households | 19,499 (12.5%) | 1,243 (0.8%) |
| 4-Person Households | 16,811 (10.8%) | 314 (0.2%) |
| 5-Person Households | 9,177 (5.9%) | 242 (0.2%) |
| 6-Person Households | 3,917 (2.5%) | 0 (0.0%) |
| 7+ Person Households | 2,776 (1.8%) | 0 (0.0%) |
| Total | 93,972 (60.2%) | 62,082 (39.8%) |
Female Fertility in Wichita
Fertility by Age in Wichita
Average fertility rate in Wichita is 61.0 births per 1,000 women. Women in the age bracket of 20 to 34 years have the highest fertility rate with 94.0 births per 1,000 women. Women in the age bracket of 20 to 34 years acount for 71.4% of all women with births.
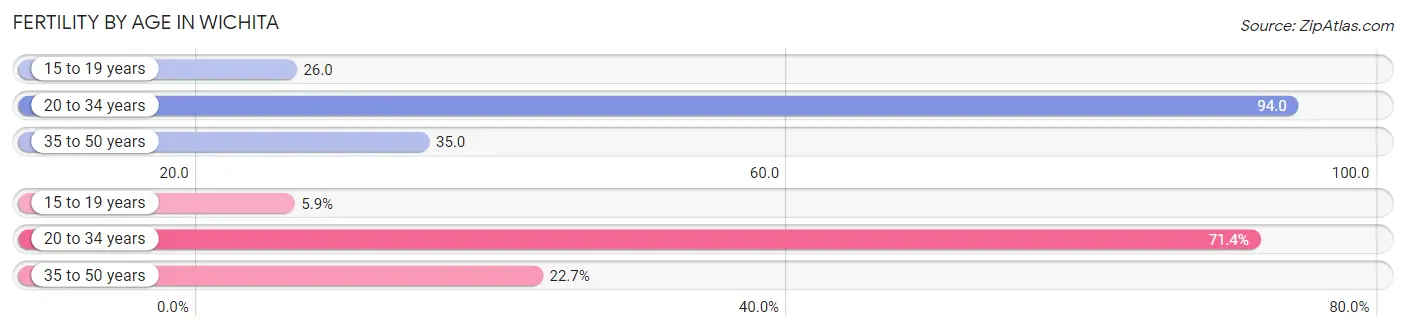
| Age Bracket | Women with Births | Births / 1,000 Women |
| 15 to 19 years | 336 (5.9%) | 26.0 |
| 20 to 34 years | 4,094 (71.4%) | 94.0 |
| 35 to 50 years | 1,301 (22.7%) | 35.0 |
| Total | 5,731 (100.0%) | 61.0 |
Fertility by Age by Marriage Status in Wichita
60.5% of women with births (5,731) in Wichita are married. The highest percentage of unmarried women with births falls into 15 to 19 years age bracket with 83.6% of them unmarried at the time of birth, while the lowest percentage of unmarried women with births belong to 35 to 50 years age bracket with 25.1% of them unmarried.
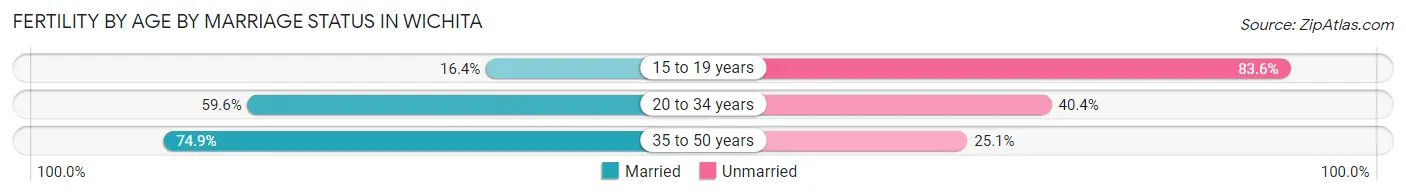
| Age Bracket | Married | Unmarried |
| 15 to 19 years | 55 (16.4%) | 281 (83.6%) |
| 20 to 34 years | 2,440 (59.6%) | 1,654 (40.4%) |
| 35 to 50 years | 974 (74.9%) | 327 (25.1%) |
| Total | 3,467 (60.5%) | 2,264 (39.5%) |
Fertility by Education in Wichita
Average fertility rate in Wichita is 61.0 births per 1,000 women. Women with the education attainment of high school diploma have the highest fertility rate of 71.0 births per 1,000 women, while women with the education attainment of less than high school have the lowest fertility at 38.0 births per 1,000 women. Women with the education attainment of college or associate's degree represent 37.4% of all women with births.
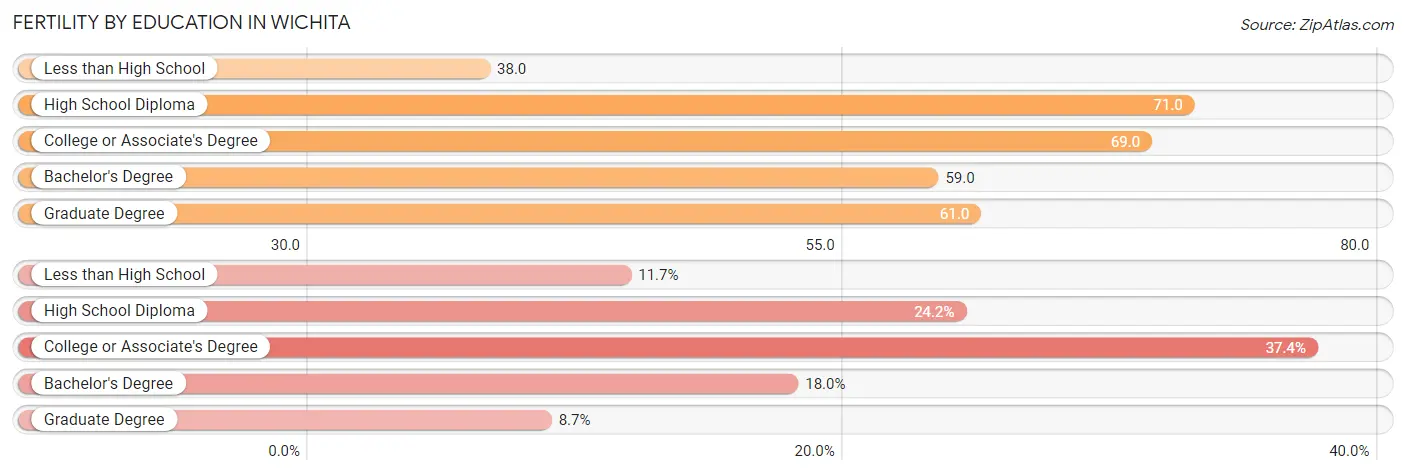
| Educational Attainment | Women with Births | Births / 1,000 Women |
| Less than High School | 670 (11.7%) | 38.0 |
| High School Diploma | 1,389 (24.2%) | 71.0 |
| College or Associate's Degree | 2,144 (37.4%) | 69.0 |
| Bachelor's Degree | 1,029 (17.9%) | 59.0 |
| Graduate Degree | 499 (8.7%) | 61.0 |
| Total | 5,731 (100.0%) | 61.0 |
Fertility by Education by Marriage Status in Wichita
39.5% of women with births in Wichita are unmarried. Women with the educational attainment of graduate degree are most likely to be married with 91.2% of them married at childbirth, while women with the educational attainment of high school diploma are least likely to be married with 63.4% of them unmarried at childbirth.
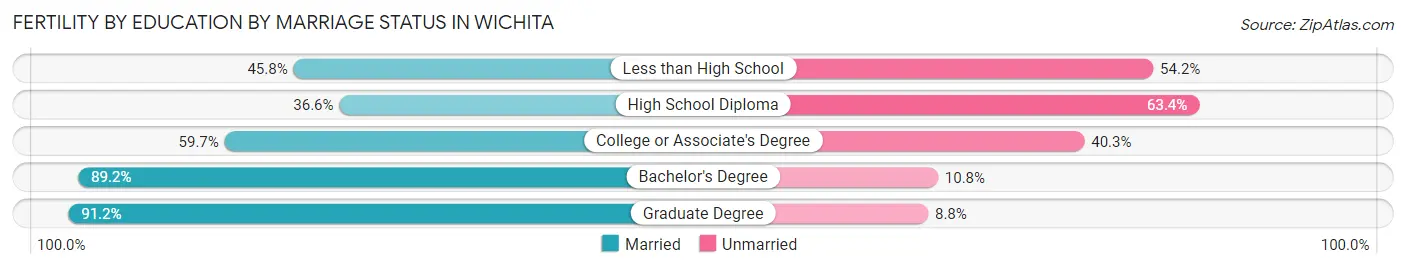
| Educational Attainment | Married | Unmarried |
| Less than High School | 307 (45.8%) | 363 (54.2%) |
| High School Diploma | 508 (36.6%) | 881 (63.4%) |
| College or Associate's Degree | 1,280 (59.7%) | 864 (40.3%) |
| Bachelor's Degree | 918 (89.2%) | 111 (10.8%) |
| Graduate Degree | 455 (91.2%) | 44 (8.8%) |
| Total | 3,467 (60.5%) | 2,264 (39.5%) |
Employment Characteristics in Wichita
Employment by Class of Employer in Wichita
Among the 189,388 employed individuals in Wichita, private company employees (134,419 | 71.0%), not-for-profit organizations (15,466 | 8.2%), and local government employees (12,496 | 6.6%) make up the most common classes of employment.
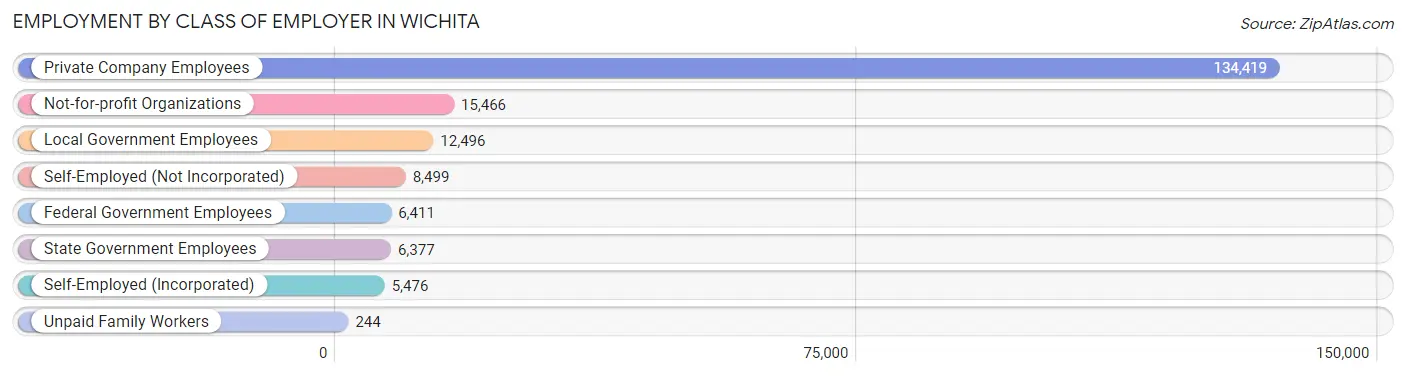
| Employer Class | # Employees | % Employees |
| Private Company Employees | 134,419 | 71.0% |
| Self-Employed (Incorporated) | 5,476 | 2.9% |
| Self-Employed (Not Incorporated) | 8,499 | 4.5% |
| Not-for-profit Organizations | 15,466 | 8.2% |
| Local Government Employees | 12,496 | 6.6% |
| State Government Employees | 6,377 | 3.4% |
| Federal Government Employees | 6,411 | 3.4% |
| Unpaid Family Workers | 244 | 0.1% |
| Total | 189,388 | 100.0% |
Employment Status by Age in Wichita
According to the labor force statistics for Wichita, out of the total population over 16 years of age (309,990), 66.0% or 204,593 individuals are in the labor force, with 5.7% or 11,662 of them unemployed. The age group with the highest labor force participation rate is 25 to 29 years, with 85.0% or 26,150 individuals in the labor force. Within the labor force, the 16 to 19 years age range has the highest percentage of unemployed individuals, with 20.1% or 2,064 of them being unemployed.
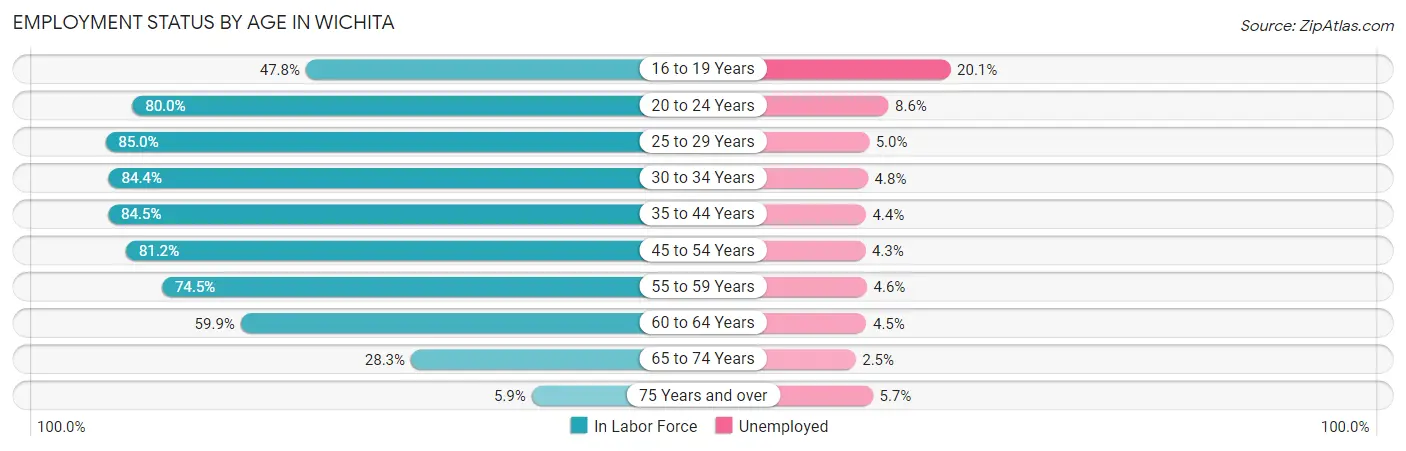
| Age Bracket | In Labor Force | Unemployed |
| 16 to 19 Years | 10,270 (47.8%) | 2,064 (20.1%) |
| 20 to 24 Years | 23,626 (80.0%) | 2,032 (8.6%) |
| 25 to 29 Years | 26,150 (85.0%) | 1,308 (5.0%) |
| 30 to 34 Years | 23,508 (84.4%) | 1,128 (4.8%) |
| 35 to 44 Years | 42,247 (84.5%) | 1,859 (4.4%) |
| 45 to 54 Years | 35,927 (81.2%) | 1,545 (4.3%) |
| 55 to 59 Years | 17,011 (74.5%) | 783 (4.6%) |
| 60 to 64 Years | 14,178 (59.9%) | 638 (4.5%) |
| 65 to 74 Years | 10,236 (28.3%) | 256 (2.5%) |
| 75 Years and over | 1,383 (5.9%) | 79 (5.7%) |
| Total | 204,593 (66.0%) | 11,662 (5.7%) |
Employment Status by Educational Attainment in Wichita
According to labor force statistics for Wichita, 79.8% of individuals (159,092) out of the total population between 25 and 64 years of age (199,363) are in the labor force, with 4.6% or 7,318 of them being unemployed. The group with the highest labor force participation rate are those with the educational attainment of bachelor's degree or higher, with 86.3% or 53,667 individuals in the labor force. Within the labor force, individuals with high school diploma education have the highest percentage of unemployment, with 7.0% or 2,548 of them being unemployed.
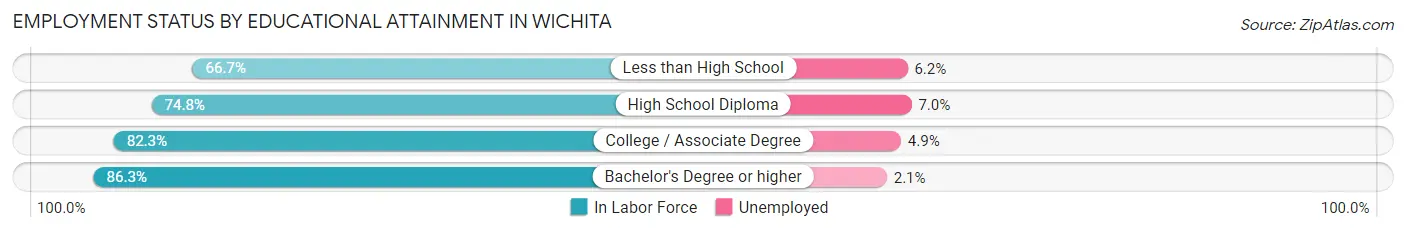
| Educational Attainment | In Labor Force | Unemployed |
| Less than High School | 16,698 (66.7%) | 1,552 (6.2%) |
| High School Diploma | 36,395 (74.8%) | 3,406 (7.0%) |
| College / Associate Degree | 52,247 (82.3%) | 3,111 (4.9%) |
| Bachelor's Degree or higher | 53,667 (86.3%) | 1,306 (2.1%) |
| Total | 159,092 (79.8%) | 9,171 (4.6%) |
Employment Occupations by Sex in Wichita
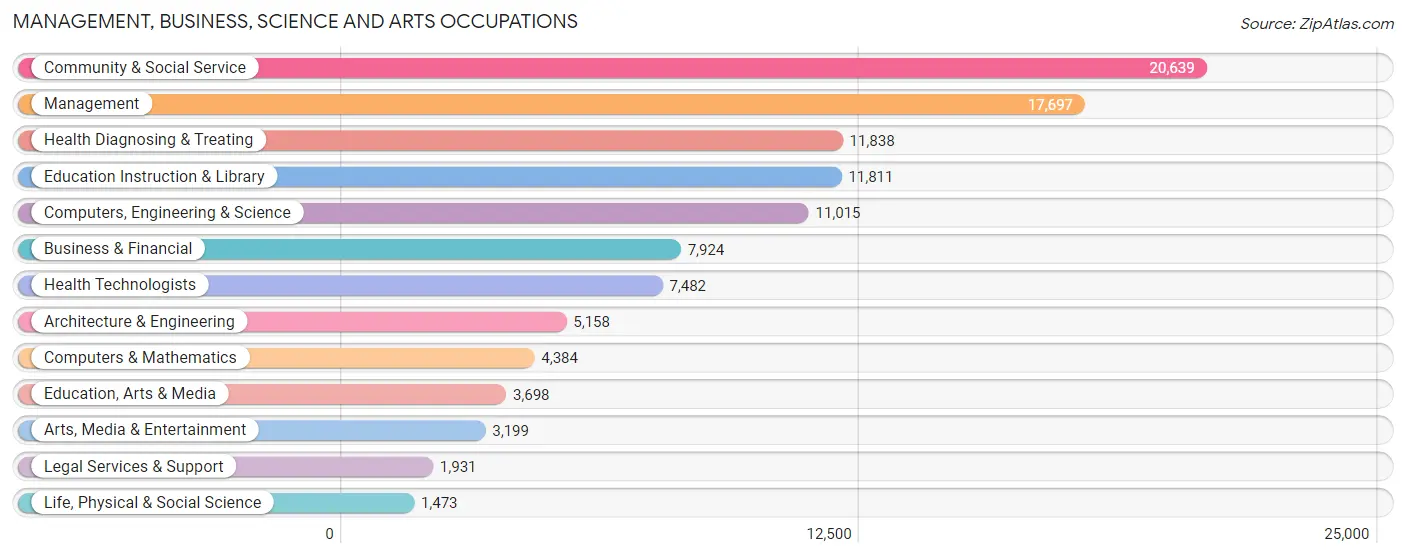
Management, Business, Science and Arts Occupations
The most common Management, Business, Science and Arts occupations in Wichita are Community & Social Service (20,639 | 10.8%), Management (17,697 | 9.2%), Health Diagnosing & Treating (11,838 | 6.2%), Education Instruction & Library (11,811 | 6.2%), and Computers, Engineering & Science (11,015 | 5.8%).
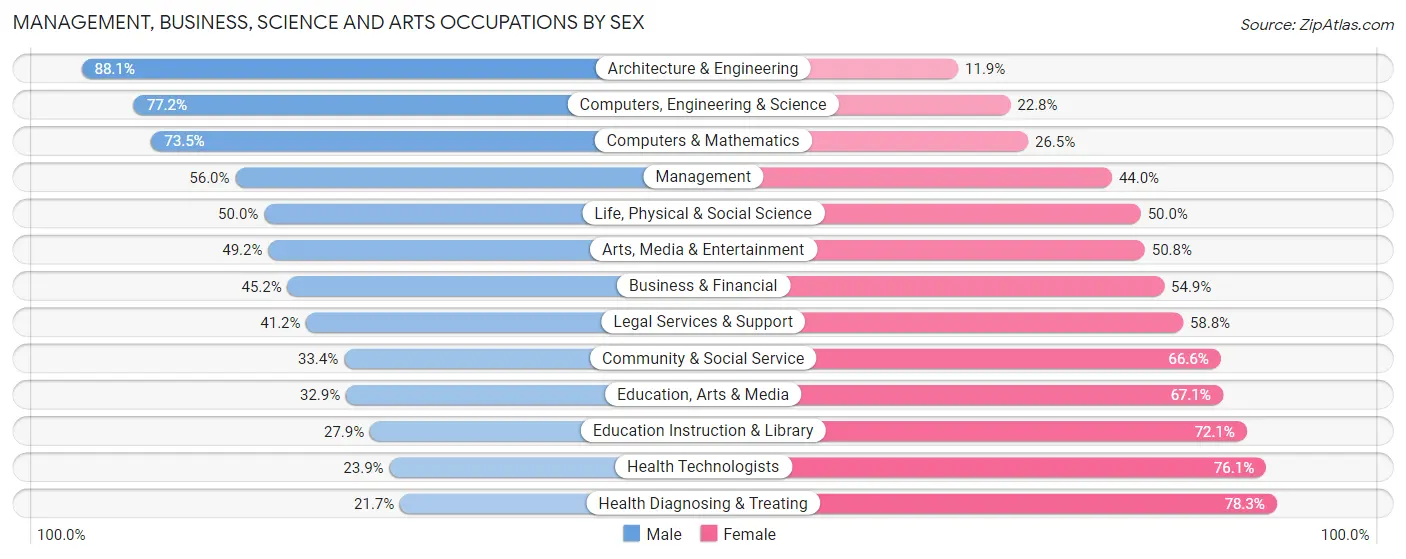
Management, Business, Science and Arts Occupations by Sex
Within the Management, Business, Science and Arts occupations in Wichita, the most male-oriented occupations are Architecture & Engineering (88.1%), Computers, Engineering & Science (77.2%), and Computers & Mathematics (73.5%), while the most female-oriented occupations are Health Diagnosing & Treating (78.3%), Health Technologists (76.1%), and Education Instruction & Library (72.1%).
| Occupation | Male | Female |
| Management | 9,916 (56.0%) | 7,781 (44.0%) |
| Business & Financial | 3,578 (45.2%) | 4,346 (54.8%) |
| Computers, Engineering & Science | 8,506 (77.2%) | 2,509 (22.8%) |
| Computers & Mathematics | 3,224 (73.5%) | 1,160 (26.5%) |
| Architecture & Engineering | 4,545 (88.1%) | 613 (11.9%) |
| Life, Physical & Social Science | 737 (50.0%) | 736 (50.0%) |
| Community & Social Service | 6,886 (33.4%) | 13,753 (66.6%) |
| Education, Arts & Media | 1,218 (32.9%) | 2,480 (67.1%) |
| Legal Services & Support | 796 (41.2%) | 1,135 (58.8%) |
| Education Instruction & Library | 3,299 (27.9%) | 8,512 (72.1%) |
| Arts, Media & Entertainment | 1,573 (49.2%) | 1,626 (50.8%) |
| Health Diagnosing & Treating | 2,565 (21.7%) | 9,273 (78.3%) |
| Health Technologists | 1,788 (23.9%) | 5,694 (76.1%) |
| Total (Category) | 31,451 (45.5%) | 37,662 (54.5%) |
| Total (Overall) | 100,250 (52.4%) | 91,174 (47.6%) |
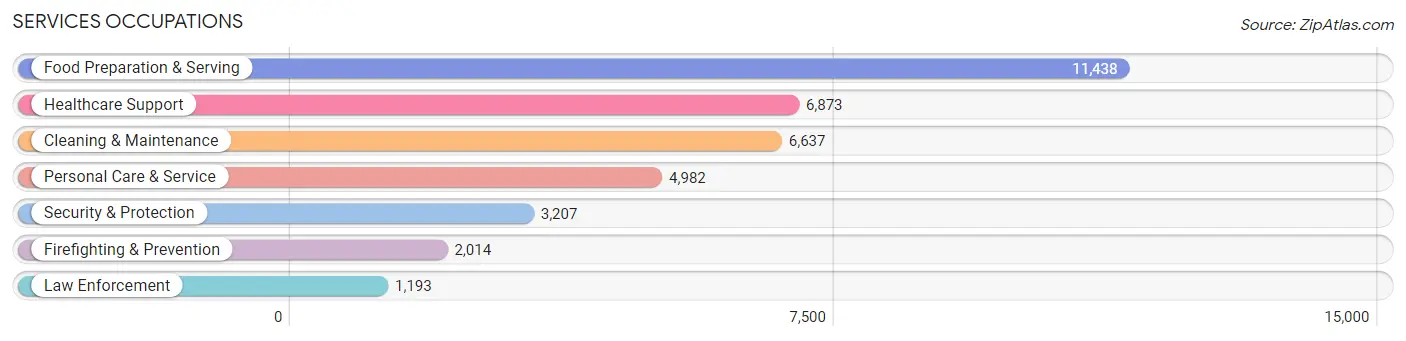
Services Occupations
The most common Services occupations in Wichita are Food Preparation & Serving (11,438 | 6.0%), Healthcare Support (6,873 | 3.6%), Cleaning & Maintenance (6,637 | 3.5%), Personal Care & Service (4,982 | 2.6%), and Security & Protection (3,207 | 1.7%).
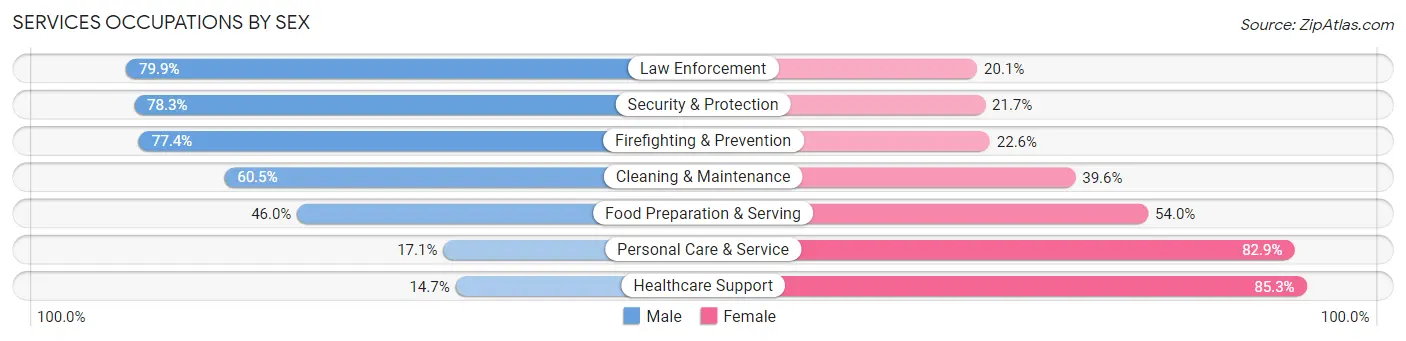
Services Occupations by Sex
Within the Services occupations in Wichita, the most male-oriented occupations are Law Enforcement (79.9%), Security & Protection (78.3%), and Firefighting & Prevention (77.4%), while the most female-oriented occupations are Healthcare Support (85.3%), Personal Care & Service (82.9%), and Food Preparation & Serving (54.0%).
| Occupation | Male | Female |
| Healthcare Support | 1,009 (14.7%) | 5,864 (85.3%) |
| Security & Protection | 2,511 (78.3%) | 696 (21.7%) |
| Firefighting & Prevention | 1,558 (77.4%) | 456 (22.6%) |
| Law Enforcement | 953 (79.9%) | 240 (20.1%) |
| Food Preparation & Serving | 5,264 (46.0%) | 6,174 (54.0%) |
| Cleaning & Maintenance | 4,012 (60.5%) | 2,625 (39.6%) |
| Personal Care & Service | 852 (17.1%) | 4,130 (82.9%) |
| Total (Category) | 13,648 (41.2%) | 19,489 (58.8%) |
| Total (Overall) | 100,250 (52.4%) | 91,174 (47.6%) |
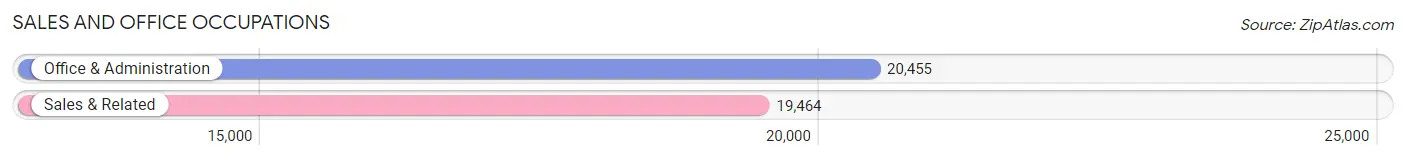
Sales and Office Occupations
The most common Sales and Office occupations in Wichita are Office & Administration (20,455 | 10.7%), and Sales & Related (19,464 | 10.2%).
Sales and Office Occupations by Sex
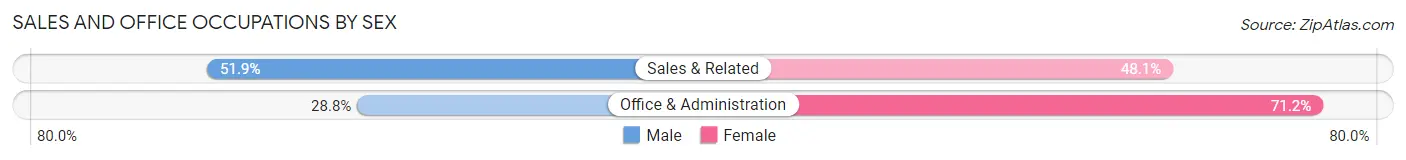
| Occupation | Male | Female |
| Sales & Related | 10,108 (51.9%) | 9,356 (48.1%) |
| Office & Administration | 5,899 (28.8%) | 14,556 (71.2%) |
| Total (Category) | 16,007 (40.1%) | 23,912 (59.9%) |
| Total (Overall) | 100,250 (52.4%) | 91,174 (47.6%) |
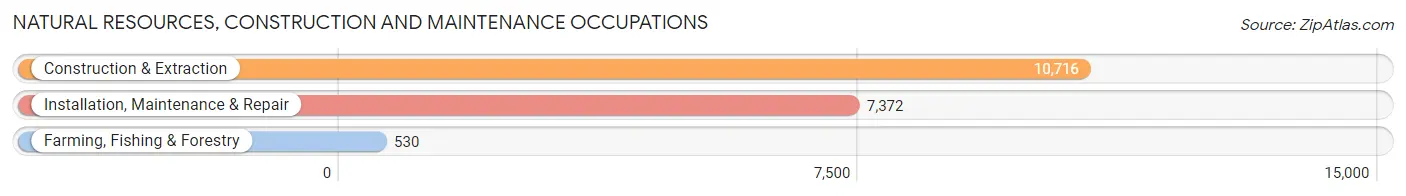
Natural Resources, Construction and Maintenance Occupations
The most common Natural Resources, Construction and Maintenance occupations in Wichita are Construction & Extraction (10,716 | 5.6%), Installation, Maintenance & Repair (7,372 | 3.8%), and Farming, Fishing & Forestry (530 | 0.3%).
Natural Resources, Construction and Maintenance Occupations by Sex
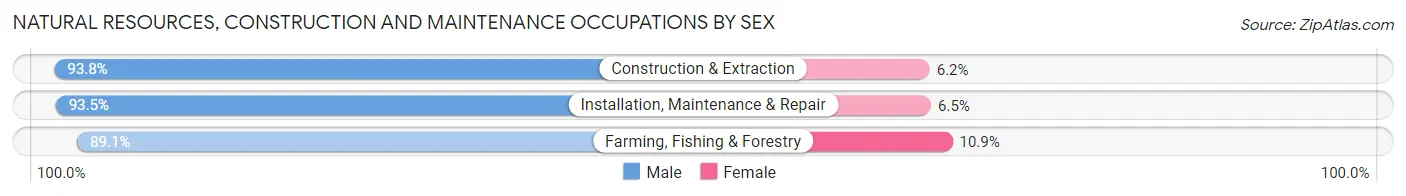
| Occupation | Male | Female |
| Farming, Fishing & Forestry | 472 (89.1%) | 58 (10.9%) |
| Construction & Extraction | 10,051 (93.8%) | 665 (6.2%) |
| Installation, Maintenance & Repair | 6,894 (93.5%) | 478 (6.5%) |
| Total (Category) | 17,417 (93.5%) | 1,201 (6.5%) |
| Total (Overall) | 100,250 (52.4%) | 91,174 (47.6%) |
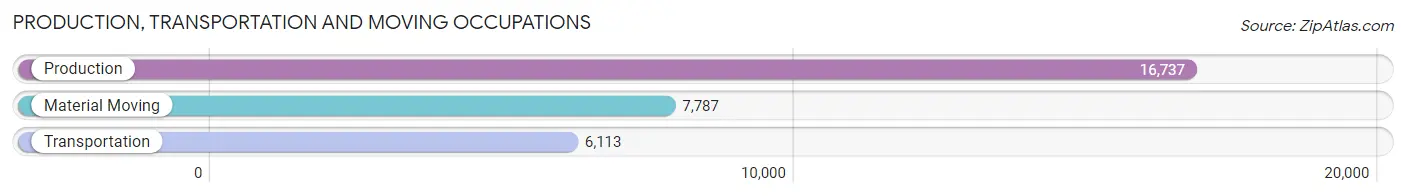
Production, Transportation and Moving Occupations
The most common Production, Transportation and Moving occupations in Wichita are Production (16,737 | 8.7%), Material Moving (7,787 | 4.1%), and Transportation (6,113 | 3.2%).
Production, Transportation and Moving Occupations by Sex
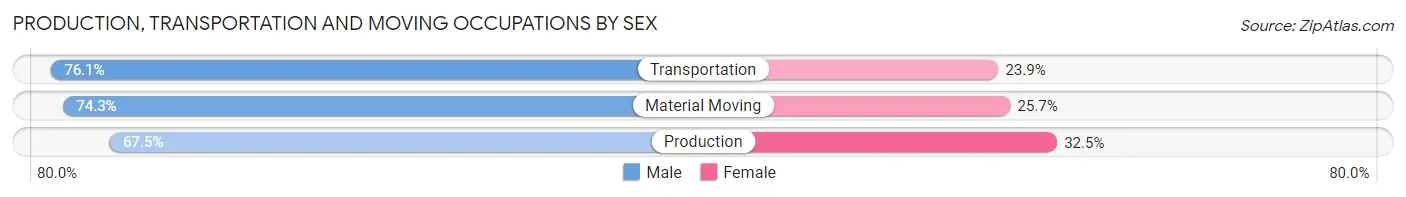
| Occupation | Male | Female |
| Production | 11,290 (67.5%) | 5,447 (32.5%) |
| Transportation | 4,651 (76.1%) | 1,462 (23.9%) |
| Material Moving | 5,786 (74.3%) | 2,001 (25.7%) |
| Total (Category) | 21,727 (70.9%) | 8,910 (29.1%) |
| Total (Overall) | 100,250 (52.4%) | 91,174 (47.6%) |
Employment Industries by Sex in Wichita
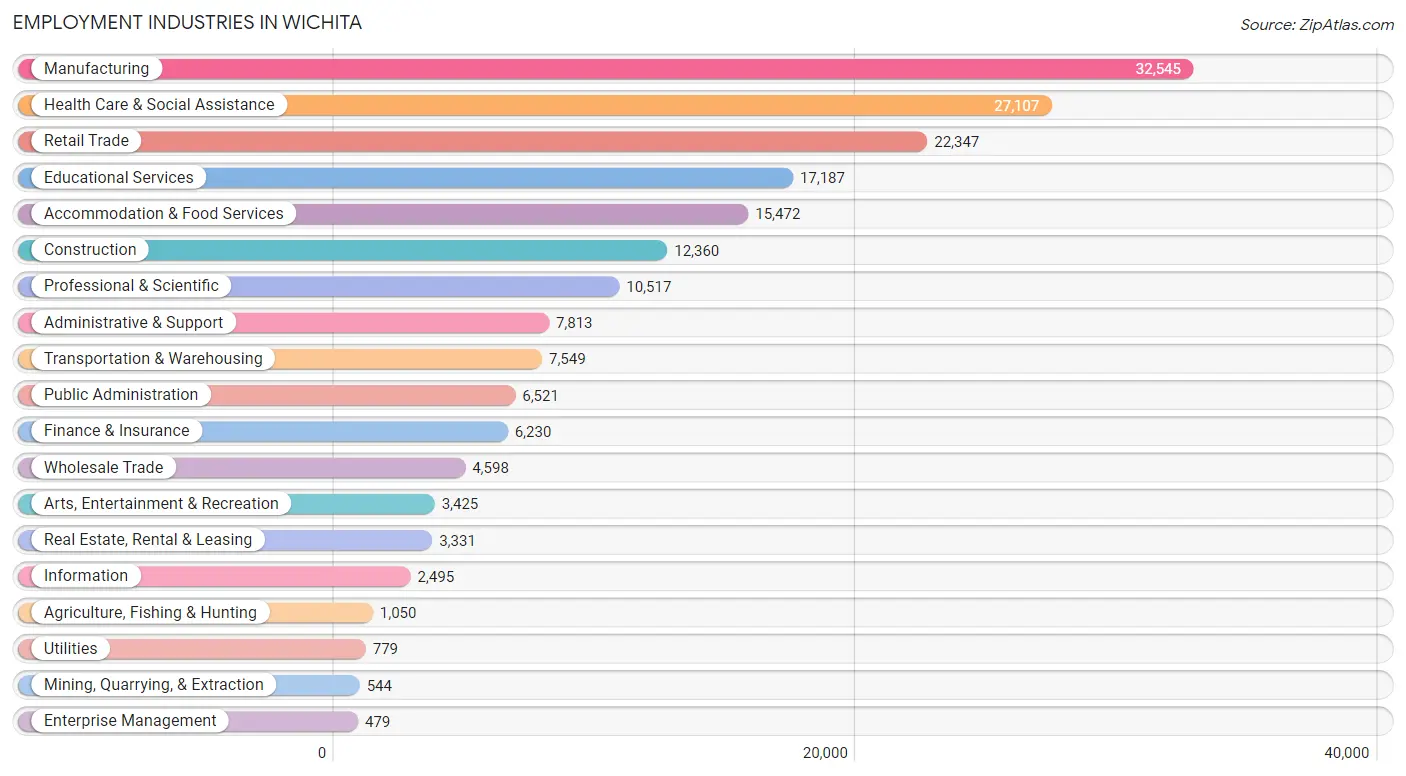
Employment Industries in Wichita
The major employment industries in Wichita include Manufacturing (32,545 | 17.0%), Health Care & Social Assistance (27,107 | 14.2%), Retail Trade (22,347 | 11.7%), Educational Services (17,187 | 9.0%), and Accommodation & Food Services (15,472 | 8.1%).
Employment Industries by Sex in Wichita
The Wichita industries that see more men than women are Mining, Quarrying, & Extraction (90.1%), Construction (89.8%), and Enterprise Management (85.8%), whereas the industries that tend to have a higher number of women are Health Care & Social Assistance (79.9%), Educational Services (67.9%), and Finance & Insurance (55.9%).
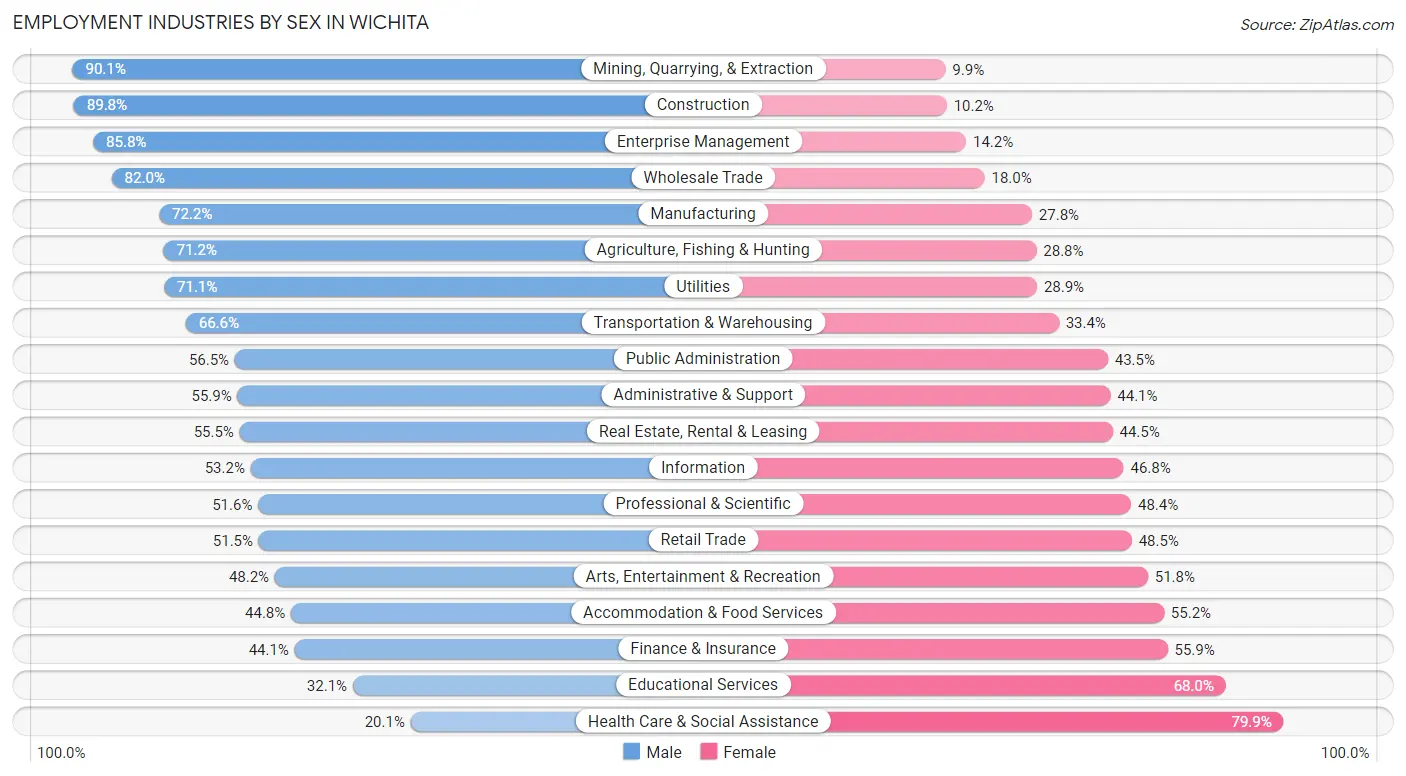
| Industry | Male | Female |
| Agriculture, Fishing & Hunting | 748 (71.2%) | 302 (28.8%) |
| Mining, Quarrying, & Extraction | 490 (90.1%) | 54 (9.9%) |
| Construction | 11,099 (89.8%) | 1,261 (10.2%) |
| Manufacturing | 23,484 (72.2%) | 9,061 (27.8%) |
| Wholesale Trade | 3,769 (82.0%) | 829 (18.0%) |
| Retail Trade | 11,511 (51.5%) | 10,836 (48.5%) |
| Transportation & Warehousing | 5,029 (66.6%) | 2,520 (33.4%) |
| Utilities | 554 (71.1%) | 225 (28.9%) |
| Information | 1,327 (53.2%) | 1,168 (46.8%) |
| Finance & Insurance | 2,747 (44.1%) | 3,483 (55.9%) |
| Real Estate, Rental & Leasing | 1,848 (55.5%) | 1,483 (44.5%) |
| Professional & Scientific | 5,431 (51.6%) | 5,086 (48.4%) |
| Enterprise Management | 411 (85.8%) | 68 (14.2%) |
| Administrative & Support | 4,369 (55.9%) | 3,444 (44.1%) |
| Educational Services | 5,509 (32.1%) | 11,678 (67.9%) |
| Health Care & Social Assistance | 5,443 (20.1%) | 21,664 (79.9%) |
| Arts, Entertainment & Recreation | 1,650 (48.2%) | 1,775 (51.8%) |
| Accommodation & Food Services | 6,937 (44.8%) | 8,535 (55.2%) |
| Public Administration | 3,682 (56.5%) | 2,839 (43.5%) |
| Total | 100,250 (52.4%) | 91,174 (47.6%) |
Education in Wichita
School Enrollment in Wichita
The most common levels of schooling among the 102,925 students in Wichita are middle school (22,562 | 21.9%), high school (22,138 | 21.5%), and elementary school (21,498 | 20.9%).
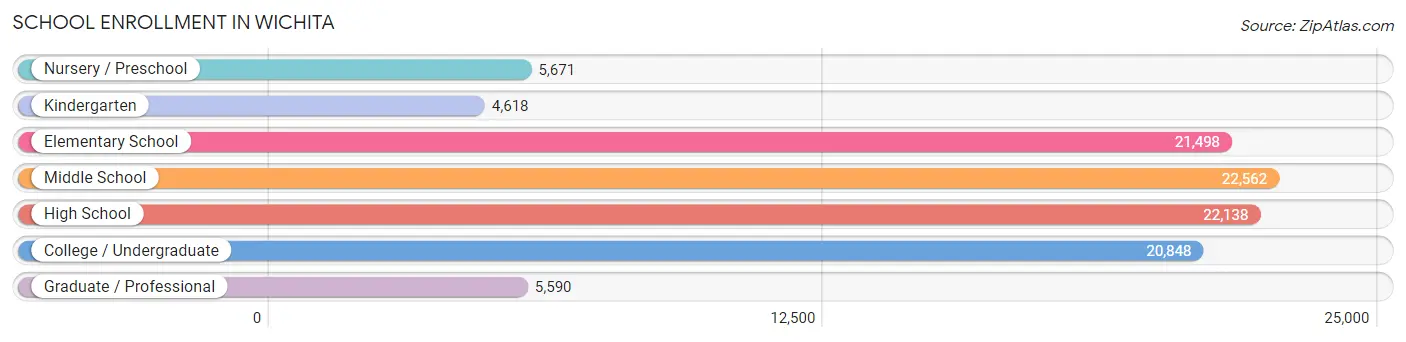
| School Level | # Students | % Students |
| Nursery / Preschool | 5,671 | 5.5% |
| Kindergarten | 4,618 | 4.5% |
| Elementary School | 21,498 | 20.9% |
| Middle School | 22,562 | 21.9% |
| High School | 22,138 | 21.5% |
| College / Undergraduate | 20,848 | 20.3% |
| Graduate / Professional | 5,590 | 5.4% |
| Total | 102,925 | 100.0% |
School Enrollment by Age by Funding Source in Wichita
Out of a total of 102,925 students who are enrolled in schools in Wichita, 17,394 (16.9%) attend a private institution, while the remaining 85,531 (83.1%) are enrolled in public schools. The age group of 3 to 4 year olds has the highest likelihood of being enrolled in private schools, with 1,631 (40.8% in the age bracket) enrolled. Conversely, the age group of 25 to 34 year olds has the lowest likelihood of being enrolled in a private school, with 6,677 (87.0% in the age bracket) attending a public institution.
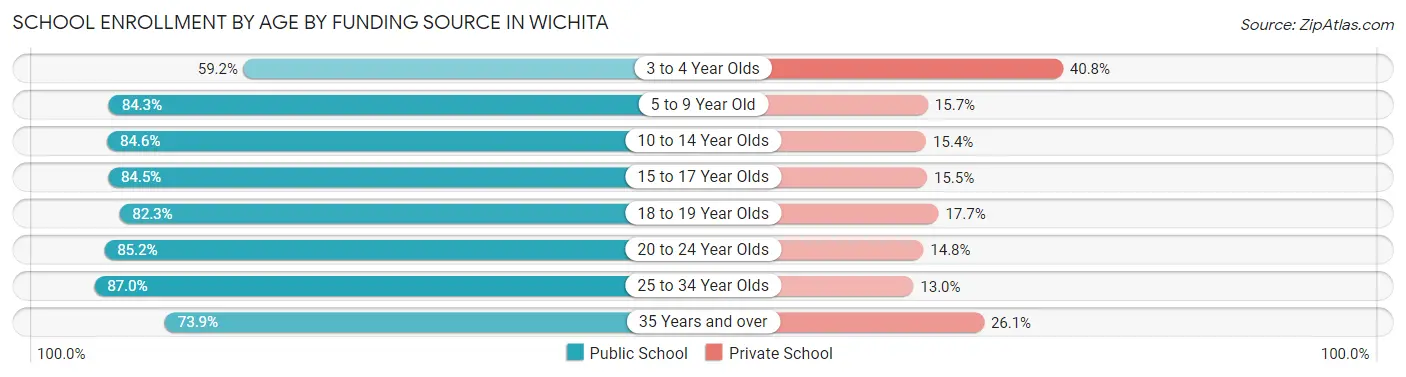
| Age Bracket | Public School | Private School |
| 3 to 4 Year Olds | 2,364 (59.2%) | 1,631 (40.8%) |
| 5 to 9 Year Old | 21,059 (84.3%) | 3,920 (15.7%) |
| 10 to 14 Year Olds | 23,793 (84.6%) | 4,317 (15.4%) |
| 15 to 17 Year Olds | 13,426 (84.5%) | 2,468 (15.5%) |
| 18 to 19 Year Olds | 5,172 (82.3%) | 1,109 (17.7%) |
| 20 to 24 Year Olds | 9,092 (85.2%) | 1,585 (14.8%) |
| 25 to 34 Year Olds | 6,677 (87.0%) | 996 (13.0%) |
| 35 Years and over | 3,927 (73.9%) | 1,389 (26.1%) |
| Total | 85,531 (83.1%) | 17,394 (16.9%) |
Educational Attainment by Field of Study in Wichita
Business (20,293 | 23.1%), education (11,701 | 13.3%), science & technology (9,444 | 10.7%), engineering (6,791 | 7.7%), and arts & humanities (5,814 | 6.6%) are the most common fields of study among 87,875 individuals in Wichita who have obtained a bachelor's degree or higher.
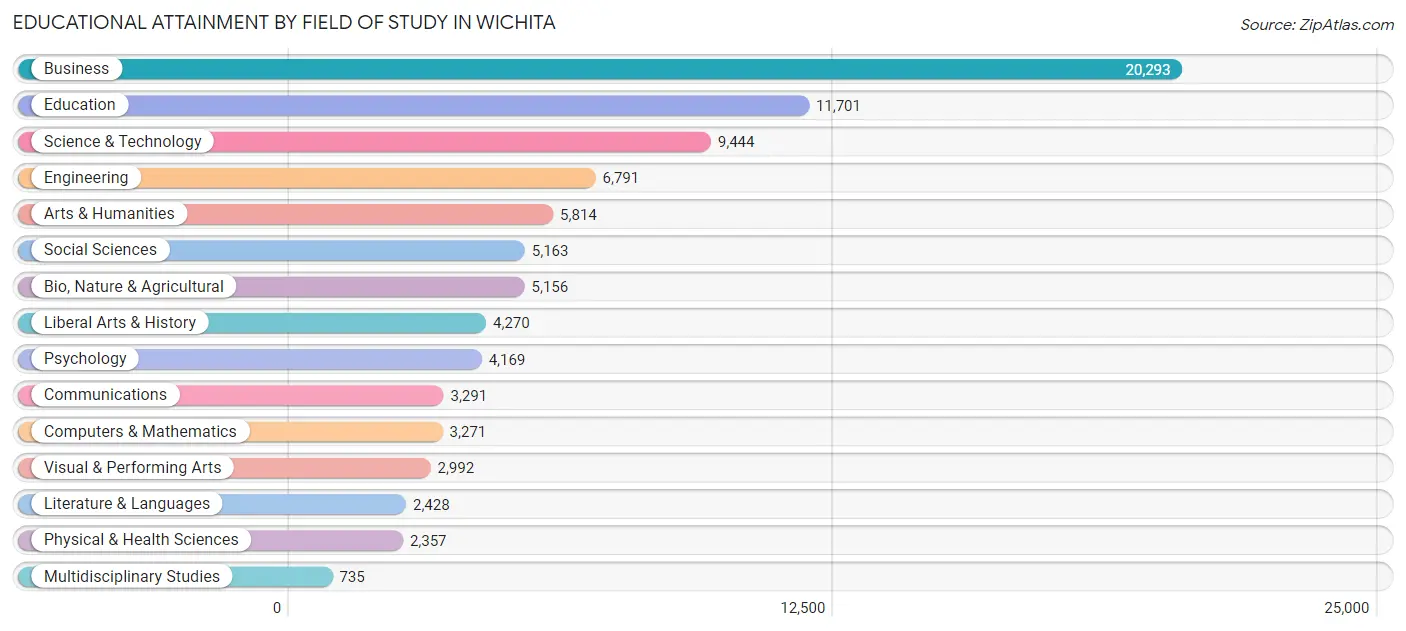
| Field of Study | # Graduates | % Graduates |
| Computers & Mathematics | 3,271 | 3.7% |
| Bio, Nature & Agricultural | 5,156 | 5.9% |
| Physical & Health Sciences | 2,357 | 2.7% |
| Psychology | 4,169 | 4.7% |
| Social Sciences | 5,163 | 5.9% |
| Engineering | 6,791 | 7.7% |
| Multidisciplinary Studies | 735 | 0.8% |
| Science & Technology | 9,444 | 10.7% |
| Business | 20,293 | 23.1% |
| Education | 11,701 | 13.3% |
| Literature & Languages | 2,428 | 2.8% |
| Liberal Arts & History | 4,270 | 4.9% |
| Visual & Performing Arts | 2,992 | 3.4% |
| Communications | 3,291 | 3.7% |
| Arts & Humanities | 5,814 | 6.6% |
| Total | 87,875 | 100.0% |
Transportation & Commute in Wichita
Vehicle Availability by Sex in Wichita
The most prevalent vehicle ownership categories in Wichita are males with 2 vehicles (40,883, accounting for 41.2%) and females with 2 vehicles (34,926, making up 45.7%).
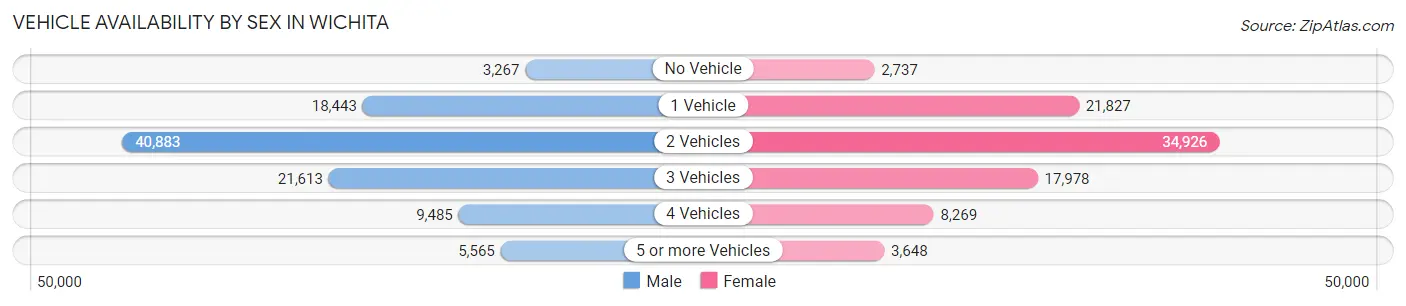
| Vehicles Available | Male | Female |
| No Vehicle | 3,267 (3.3%) | 2,737 (3.1%) |
| 1 Vehicle | 18,443 (18.6%) | 21,827 (24.4%) |
| 2 Vehicles | 40,883 (41.2%) | 34,926 (39.1%) |
| 3 Vehicles | 21,613 (21.8%) | 17,978 (20.1%) |
| 4 Vehicles | 9,485 (9.6%) | 8,269 (9.2%) |
| 5 or more Vehicles | 5,565 (5.6%) | 3,648 (4.1%) |
| Total | 99,256 (100.0%) | 89,385 (100.0%) |
Commute Time in Wichita
The most frequently occuring commute durations in Wichita are 15 to 19 minutes (46,350 commuters, 26.0%), 20 to 24 minutes (36,994 commuters, 20.8%), and 10 to 14 minutes (35,292 commuters, 19.8%).
| Commute Time | # Commuters | % Commuters |
| Less than 5 Minutes | 4,130 | 2.3% |
| 5 to 9 Minutes | 20,972 | 11.8% |
| 10 to 14 Minutes | 35,292 | 19.8% |
| 15 to 19 Minutes | 46,350 | 26.0% |
| 20 to 24 Minutes | 36,994 | 20.8% |
| 25 to 29 Minutes | 9,353 | 5.2% |
| 30 to 34 Minutes | 13,788 | 7.7% |
| 35 to 39 Minutes | 1,387 | 0.8% |
| 40 to 44 Minutes | 1,786 | 1.0% |
| 45 to 59 Minutes | 3,225 | 1.8% |
| 60 to 89 Minutes | 2,446 | 1.4% |
| 90 or more Minutes | 2,312 | 1.3% |
Commute Time by Sex in Wichita
The most common commute times in Wichita are 15 to 19 minutes (24,704 commuters, 26.0%) for males and 15 to 19 minutes (21,646 commuters, 26.0%) for females.
| Commute Time | Male | Female |
| Less than 5 Minutes | 1,893 (2.0%) | 2,237 (2.7%) |
| 5 to 9 Minutes | 10,789 (11.4%) | 10,183 (12.2%) |
| 10 to 14 Minutes | 18,418 (19.4%) | 16,874 (20.3%) |
| 15 to 19 Minutes | 24,704 (26.0%) | 21,646 (26.0%) |
| 20 to 24 Minutes | 20,505 (21.6%) | 16,489 (19.8%) |
| 25 to 29 Minutes | 4,694 (5.0%) | 4,659 (5.6%) |
| 30 to 34 Minutes | 7,742 (8.2%) | 6,046 (7.3%) |
| 35 to 39 Minutes | 742 (0.8%) | 645 (0.8%) |
| 40 to 44 Minutes | 1,097 (1.2%) | 689 (0.8%) |
| 45 to 59 Minutes | 1,732 (1.8%) | 1,493 (1.8%) |
| 60 to 89 Minutes | 1,426 (1.5%) | 1,020 (1.2%) |
| 90 or more Minutes | 1,180 (1.2%) | 1,132 (1.4%) |
Time of Departure to Work by Sex in Wichita
The most frequent times of departure to work in Wichita are 7:30 AM to 7:59 AM (13,345, 14.1%) for males and 7:30 AM to 7:59 AM (14,618, 17.6%) for females.
| Time of Departure | Male | Female |
| 12:00 AM to 4:59 AM | 5,612 (5.9%) | 3,247 (3.9%) |
| 5:00 AM to 5:29 AM | 3,992 (4.2%) | 1,700 (2.1%) |
| 5:30 AM to 5:59 AM | 6,312 (6.7%) | 3,202 (3.8%) |
| 6:00 AM to 6:29 AM | 8,456 (8.9%) | 4,680 (5.6%) |
| 6:30 AM to 6:59 AM | 11,082 (11.7%) | 8,051 (9.7%) |
| 7:00 AM to 7:29 AM | 12,730 (13.4%) | 10,909 (13.1%) |
| 7:30 AM to 7:59 AM | 13,345 (14.1%) | 14,618 (17.6%) |
| 8:00 AM to 8:29 AM | 7,176 (7.6%) | 8,763 (10.5%) |
| 8:30 AM to 8:59 AM | 4,133 (4.3%) | 4,855 (5.8%) |
| 9:00 AM to 9:59 AM | 4,329 (4.6%) | 5,344 (6.4%) |
| 10:00 AM to 10:59 AM | 2,580 (2.7%) | 2,950 (3.5%) |
| 11:00 AM to 11:59 AM | 1,198 (1.3%) | 1,778 (2.1%) |
| 12:00 PM to 3:59 PM | 7,988 (8.4%) | 7,125 (8.6%) |
| 4:00 PM to 11:59 PM | 5,989 (6.3%) | 5,891 (7.1%) |
| Total | 94,922 (100.0%) | 83,113 (100.0%) |
Housing Occupancy in Wichita
Occupancy by Ownership in Wichita
Of the total 156,054 dwellings in Wichita, owner-occupied units account for 91,242 (58.5%), while renter-occupied units make up 64,812 (41.5%).
| Occupancy | # Housing Units | % Housing Units |
| Owner Occupied Housing Units | 91,242 | 58.5% |
| Renter-Occupied Housing Units | 64,812 | 41.5% |
| Total Occupied Housing Units | 156,054 | 100.0% |
Occupancy by Household Size in Wichita
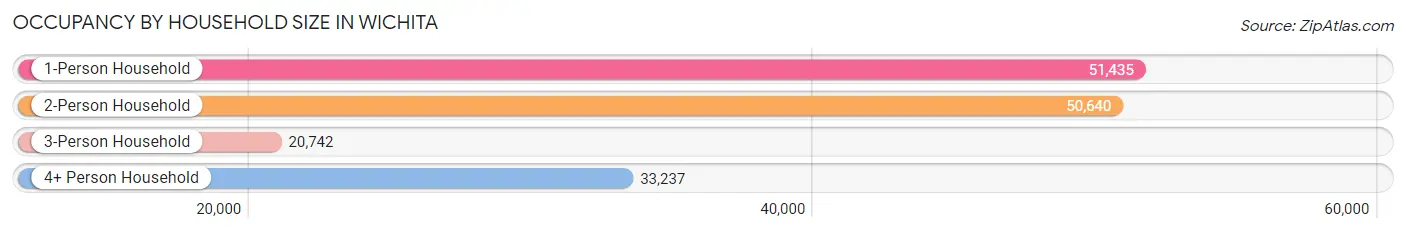
| Household Size | # Housing Units | % Housing Units |
| 1-Person Household | 51,435 | 33.0% |
| 2-Person Household | 50,640 | 32.5% |
| 3-Person Household | 20,742 | 13.3% |
| 4+ Person Household | 33,237 | 21.3% |
| Total Housing Units | 156,054 | 100.0% |
Occupancy by Ownership by Household Size in Wichita
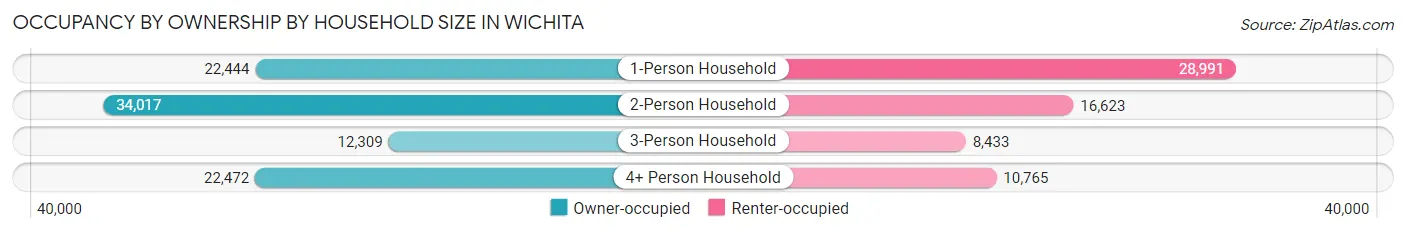
| Household Size | Owner-occupied | Renter-occupied |
| 1-Person Household | 22,444 (43.6%) | 28,991 (56.4%) |
| 2-Person Household | 34,017 (67.2%) | 16,623 (32.8%) |
| 3-Person Household | 12,309 (59.3%) | 8,433 (40.7%) |
| 4+ Person Household | 22,472 (67.6%) | 10,765 (32.4%) |
| Total Housing Units | 91,242 (58.5%) | 64,812 (41.5%) |
Occupancy by Educational Attainment in Wichita
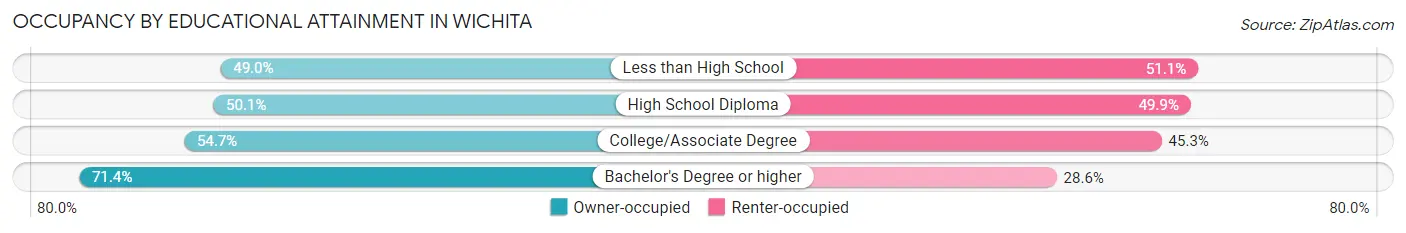
| Household Size | Owner-occupied | Renter-occupied |
| Less than High School | 7,485 (48.9%) | 7,806 (51.0%) |
| High School Diploma | 18,520 (50.1%) | 18,436 (49.9%) |
| College/Associate Degree | 29,078 (54.7%) | 24,062 (45.3%) |
| Bachelor's Degree or higher | 36,159 (71.4%) | 14,508 (28.6%) |
Occupancy by Age of Householder in Wichita
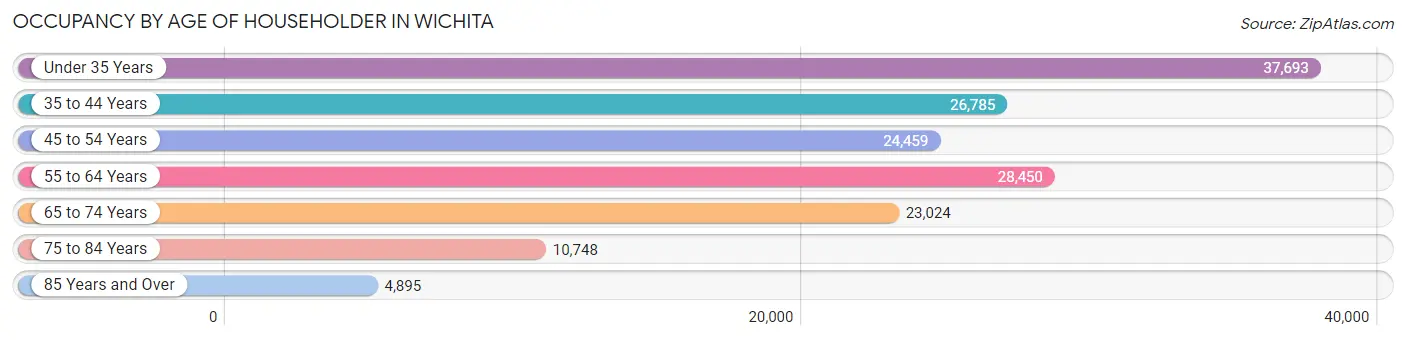
| Age Bracket | # Households | % Households |
| Under 35 Years | 37,693 | 24.1% |
| 35 to 44 Years | 26,785 | 17.2% |
| 45 to 54 Years | 24,459 | 15.7% |
| 55 to 64 Years | 28,450 | 18.2% |
| 65 to 74 Years | 23,024 | 14.7% |
| 75 to 84 Years | 10,748 | 6.9% |
| 85 Years and Over | 4,895 | 3.1% |
| Total | 156,054 | 100.0% |
Housing Finances in Wichita
Median Income by Occupancy in Wichita
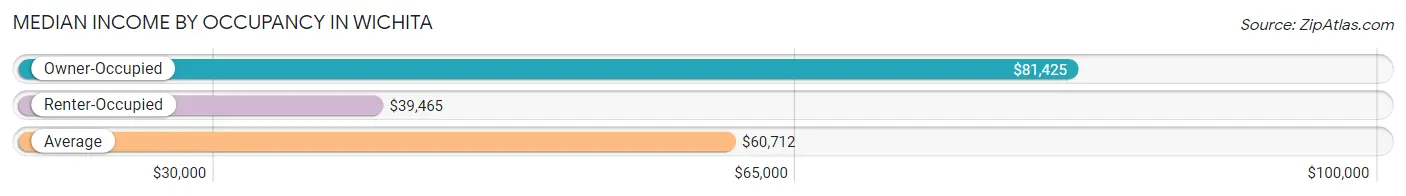
| Occupancy Type | # Households | Median Income |
| Owner-Occupied | 91,242 (58.5%) | $81,425 |
| Renter-Occupied | 64,812 (41.5%) | $39,465 |
| Average | 156,054 (100.0%) | $60,712 |
Occupancy by Householder Income Bracket in Wichita
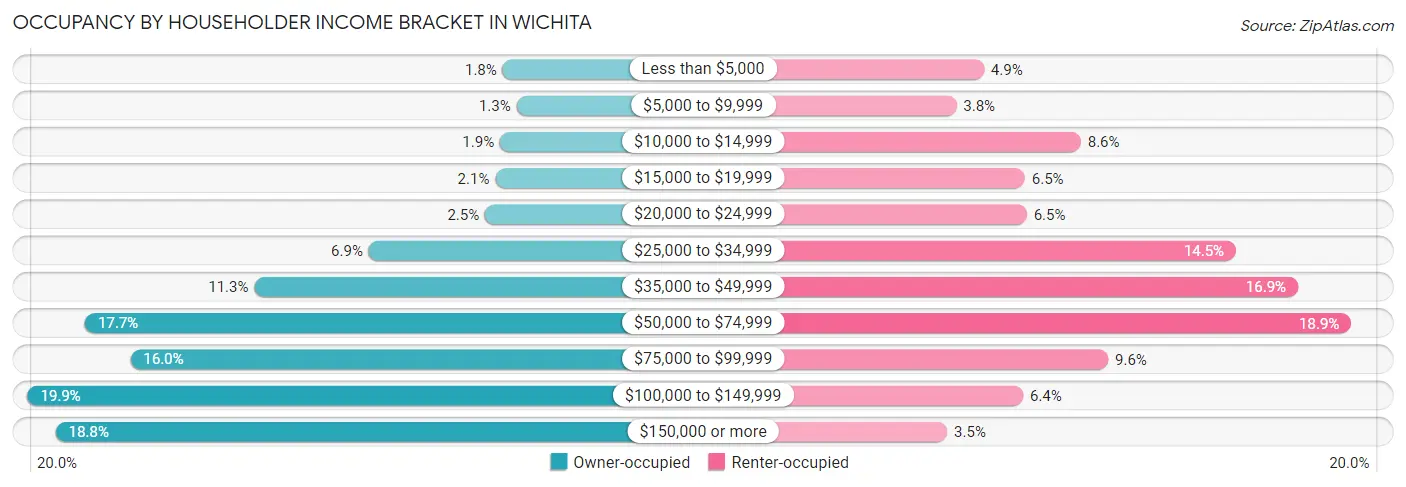
| Income Bracket | Owner-occupied | Renter-occupied |
| Less than $5,000 | 1,633 (1.8%) | 3,172 (4.9%) |
| $5,000 to $9,999 | 1,151 (1.3%) | 2,489 (3.8%) |
| $10,000 to $14,999 | 1,724 (1.9%) | 5,562 (8.6%) |
| $15,000 to $19,999 | 1,886 (2.1%) | 4,183 (6.5%) |
| $20,000 to $24,999 | 2,245 (2.5%) | 4,227 (6.5%) |
| $25,000 to $34,999 | 6,290 (6.9%) | 9,389 (14.5%) |
| $35,000 to $49,999 | 10,265 (11.3%) | 10,920 (16.9%) |
| $50,000 to $74,999 | 16,153 (17.7%) | 12,238 (18.9%) |
| $75,000 to $99,999 | 14,572 (16.0%) | 6,235 (9.6%) |
| $100,000 to $149,999 | 18,147 (19.9%) | 4,134 (6.4%) |
| $150,000 or more | 17,176 (18.8%) | 2,263 (3.5%) |
| Total | 91,242 (100.0%) | 64,812 (100.0%) |
Monthly Housing Cost Tiers in Wichita
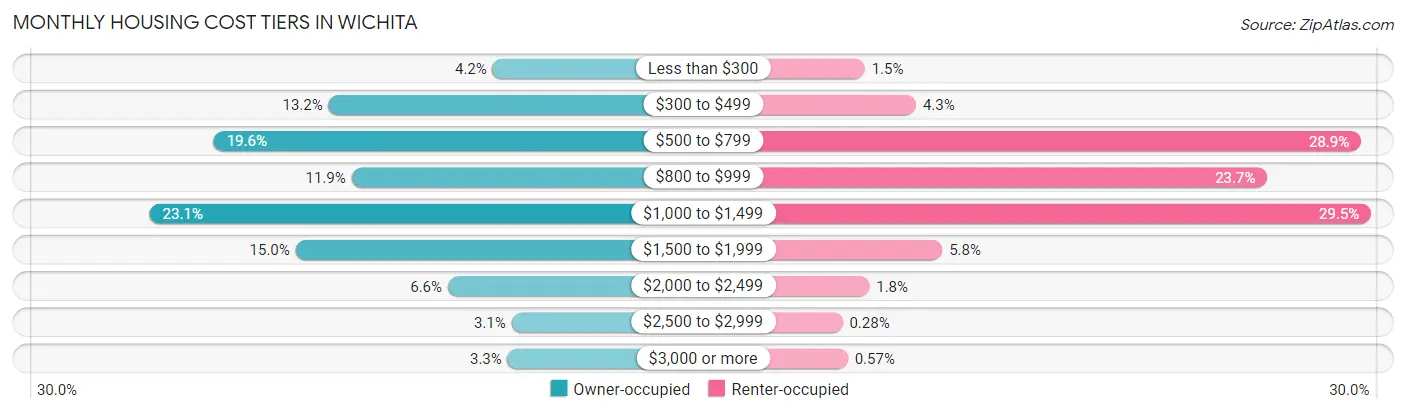
| Monthly Cost | Owner-occupied | Renter-occupied |
| Less than $300 | 3,787 (4.2%) | 977 (1.5%) |
| $300 to $499 | 12,049 (13.2%) | 2,811 (4.3%) |
| $500 to $799 | 17,840 (19.6%) | 18,746 (28.9%) |
| $800 to $999 | 10,892 (11.9%) | 15,384 (23.7%) |
| $1,000 to $1,499 | 21,069 (23.1%) | 19,109 (29.5%) |
| $1,500 to $1,999 | 13,710 (15.0%) | 3,752 (5.8%) |
| $2,000 to $2,499 | 6,044 (6.6%) | 1,141 (1.8%) |
| $2,500 to $2,999 | 2,825 (3.1%) | 181 (0.3%) |
| $3,000 or more | 3,026 (3.3%) | 368 (0.6%) |
| Total | 91,242 (100.0%) | 64,812 (100.0%) |
Physical Housing Characteristics in Wichita
Housing Structures in Wichita
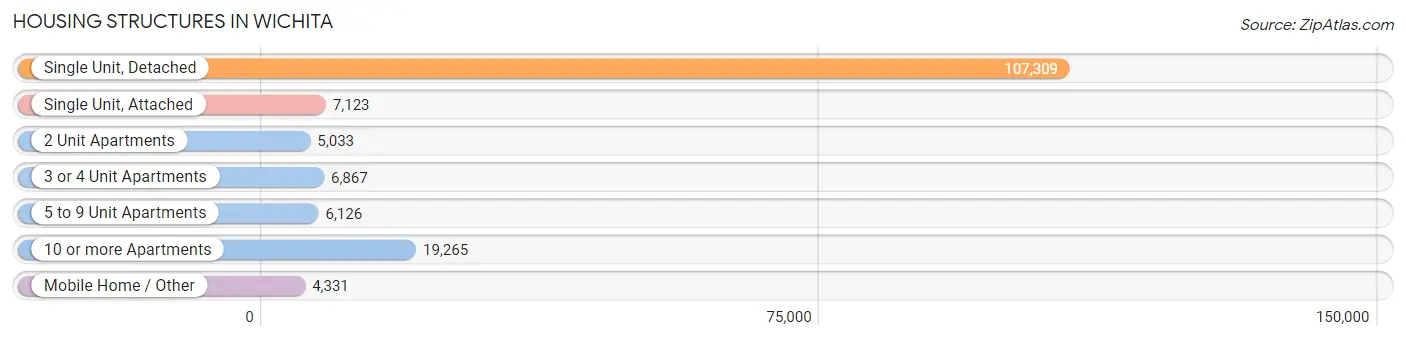
| Structure Type | # Housing Units | % Housing Units |
| Single Unit, Detached | 107,309 | 68.8% |
| Single Unit, Attached | 7,123 | 4.6% |
| 2 Unit Apartments | 5,033 | 3.2% |
| 3 or 4 Unit Apartments | 6,867 | 4.4% |
| 5 to 9 Unit Apartments | 6,126 | 3.9% |
| 10 or more Apartments | 19,265 | 12.3% |
| Mobile Home / Other | 4,331 | 2.8% |
| Total | 156,054 | 100.0% |
Housing Structures by Occupancy in Wichita
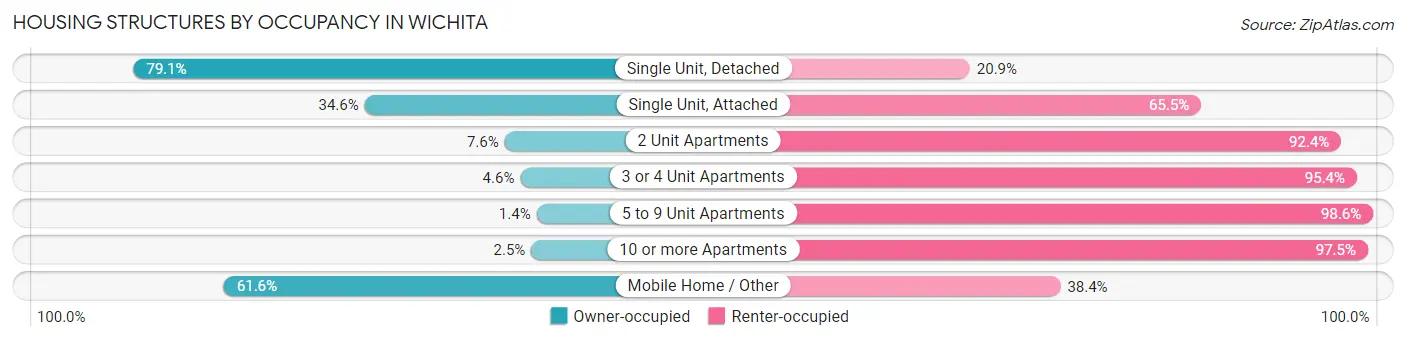
| Structure Type | Owner-occupied | Renter-occupied |
| Single Unit, Detached | 84,854 (79.1%) | 22,455 (20.9%) |
| Single Unit, Attached | 2,461 (34.5%) | 4,662 (65.4%) |
| 2 Unit Apartments | 382 (7.6%) | 4,651 (92.4%) |
| 3 or 4 Unit Apartments | 314 (4.6%) | 6,553 (95.4%) |
| 5 to 9 Unit Apartments | 88 (1.4%) | 6,038 (98.6%) |
| 10 or more Apartments | 474 (2.5%) | 18,791 (97.5%) |
| Mobile Home / Other | 2,669 (61.6%) | 1,662 (38.4%) |
| Total | 91,242 (58.5%) | 64,812 (41.5%) |
Housing Structures by Number of Rooms in Wichita
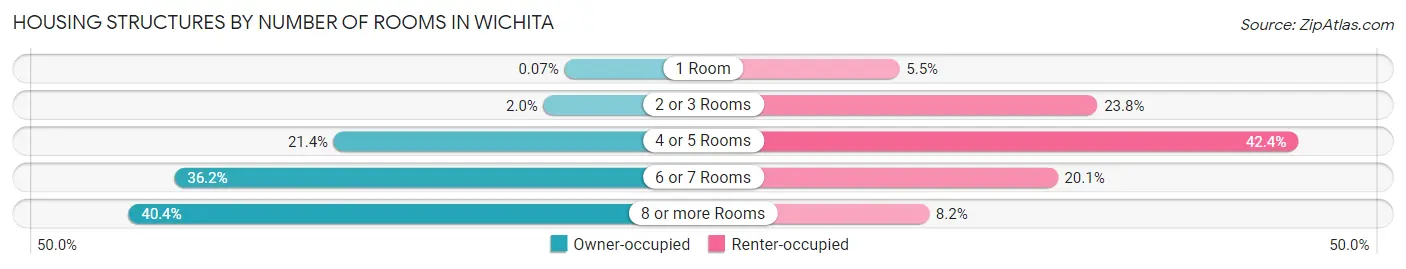
| Number of Rooms | Owner-occupied | Renter-occupied |
| 1 Room | 66 (0.1%) | 3,563 (5.5%) |
| 2 or 3 Rooms | 1,816 (2.0%) | 15,424 (23.8%) |
| 4 or 5 Rooms | 19,517 (21.4%) | 27,452 (42.4%) |
| 6 or 7 Rooms | 32,984 (36.1%) | 13,037 (20.1%) |
| 8 or more Rooms | 36,859 (40.4%) | 5,336 (8.2%) |
| Total | 91,242 (100.0%) | 64,812 (100.0%) |
Housing Structure by Heating Type in Wichita
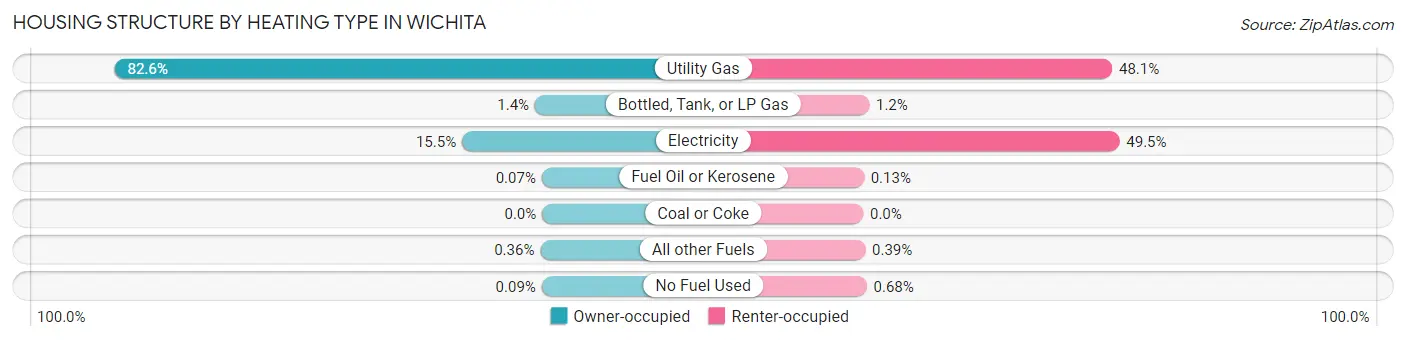
| Heating Type | Owner-occupied | Renter-occupied |
| Utility Gas | 75,379 (82.6%) | 31,183 (48.1%) |
| Bottled, Tank, or LP Gas | 1,266 (1.4%) | 754 (1.2%) |
| Electricity | 14,124 (15.5%) | 32,101 (49.5%) |
| Fuel Oil or Kerosene | 65 (0.1%) | 82 (0.1%) |
| Coal or Coke | 0 (0.0%) | 0 (0.0%) |
| All other Fuels | 324 (0.4%) | 252 (0.4%) |
| No Fuel Used | 84 (0.1%) | 440 (0.7%) |
| Total | 91,242 (100.0%) | 64,812 (100.0%) |
Household Vehicle Usage in Wichita
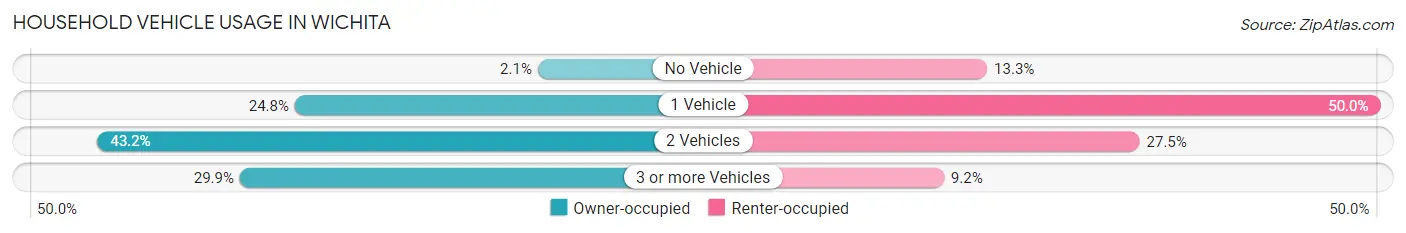
| Vehicles per Household | Owner-occupied | Renter-occupied |
| No Vehicle | 1,913 (2.1%) | 8,609 (13.3%) |
| 1 Vehicle | 22,613 (24.8%) | 32,386 (50.0%) |
| 2 Vehicles | 39,424 (43.2%) | 17,827 (27.5%) |
| 3 or more Vehicles | 27,292 (29.9%) | 5,990 (9.2%) |
| Total | 91,242 (100.0%) | 64,812 (100.0%) |
Real Estate & Mortgages in Wichita
Real Estate and Mortgage Overview in Wichita
| Characteristic | Without Mortgage | With Mortgage |
| Housing Units | 35,084 | 56,158 |
| Median Property Value | $146,400 | $176,200 |
| Median Household Income | $63,122 | $12,637 |
| Monthly Housing Costs | $544 | $2,903 |
| Real Estate Taxes | $1,786 | $1,176 |
Property Value by Mortgage Status in Wichita
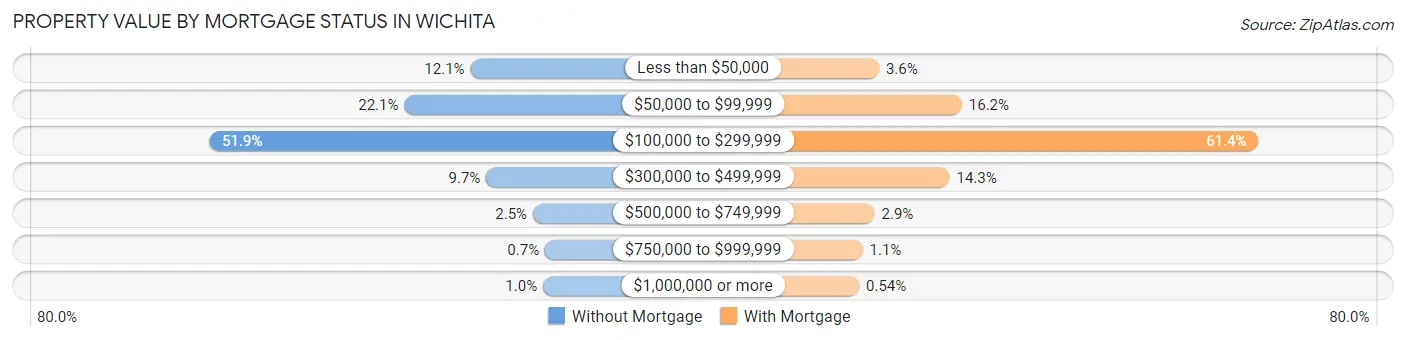
| Property Value | Without Mortgage | With Mortgage |
| Less than $50,000 | 4,233 (12.1%) | 2,004 (3.6%) |
| $50,000 to $99,999 | 7,769 (22.1%) | 9,099 (16.2%) |
| $100,000 to $299,999 | 18,201 (51.9%) | 34,478 (61.4%) |
| $300,000 to $499,999 | 3,388 (9.7%) | 8,040 (14.3%) |
| $500,000 to $749,999 | 890 (2.5%) | 1,630 (2.9%) |
| $750,000 to $999,999 | 247 (0.7%) | 606 (1.1%) |
| $1,000,000 or more | 356 (1.0%) | 301 (0.5%) |
| Total | 35,084 (100.0%) | 56,158 (100.0%) |
Household Income by Mortgage Status in Wichita
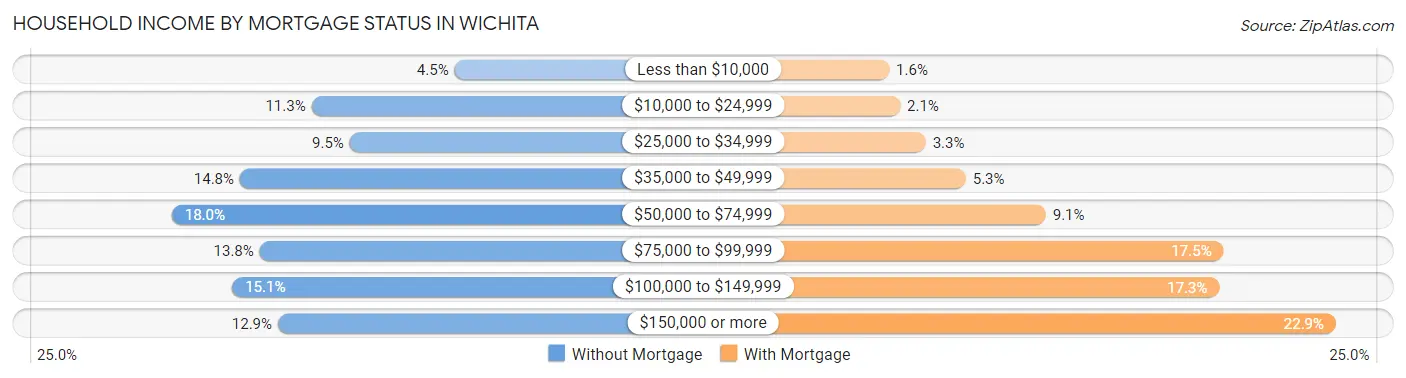
| Household Income | Without Mortgage | With Mortgage |
| Less than $10,000 | 1,591 (4.5%) | 900 (1.6%) |
| $10,000 to $24,999 | 3,978 (11.3%) | 1,193 (2.1%) |
| $25,000 to $34,999 | 3,340 (9.5%) | 1,877 (3.3%) |
| $35,000 to $49,999 | 5,176 (14.7%) | 2,950 (5.2%) |
| $50,000 to $74,999 | 6,313 (18.0%) | 5,089 (9.1%) |
| $75,000 to $99,999 | 4,846 (13.8%) | 9,840 (17.5%) |
| $100,000 to $149,999 | 5,301 (15.1%) | 9,726 (17.3%) |
| $150,000 or more | 4,539 (12.9%) | 12,846 (22.9%) |
| Total | 35,084 (100.0%) | 56,158 (100.0%) |
Property Value to Household Income Ratio in Wichita
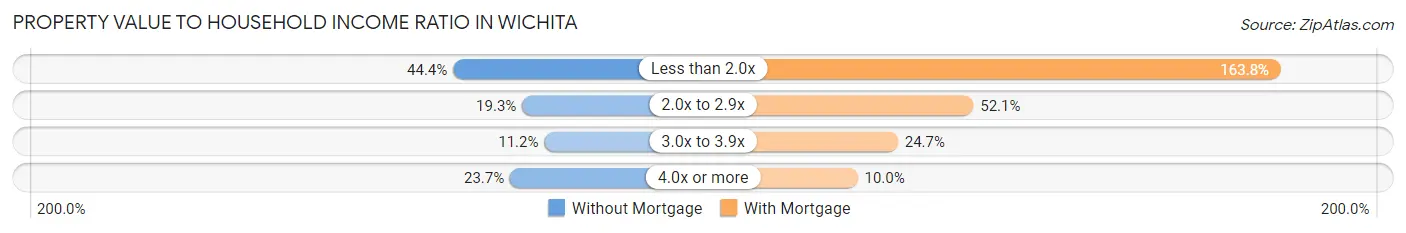
| Value-to-Income Ratio | Without Mortgage | With Mortgage |
| Less than 2.0x | 15,558 (44.4%) | 91,987 (163.8%) |
| 2.0x to 2.9x | 6,760 (19.3%) | 29,247 (52.1%) |
| 3.0x to 3.9x | 3,939 (11.2%) | 13,844 (24.6%) |
| 4.0x or more | 8,304 (23.7%) | 5,632 (10.0%) |
| Total | 35,084 (100.0%) | 56,158 (100.0%) |
Real Estate Taxes by Mortgage Status in Wichita
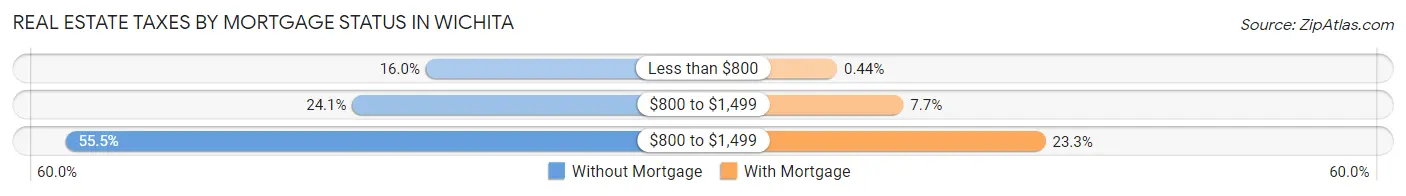
| Property Taxes | Without Mortgage | With Mortgage |
| Less than $800 | 5,629 (16.0%) | 249 (0.4%) |
| $800 to $1,499 | 8,453 (24.1%) | 4,330 (7.7%) |
| $800 to $1,499 | 19,477 (55.5%) | 13,078 (23.3%) |
| Total | 35,084 (100.0%) | 56,158 (100.0%) |
Health & Disability in Wichita
Health Insurance Coverage by Age in Wichita
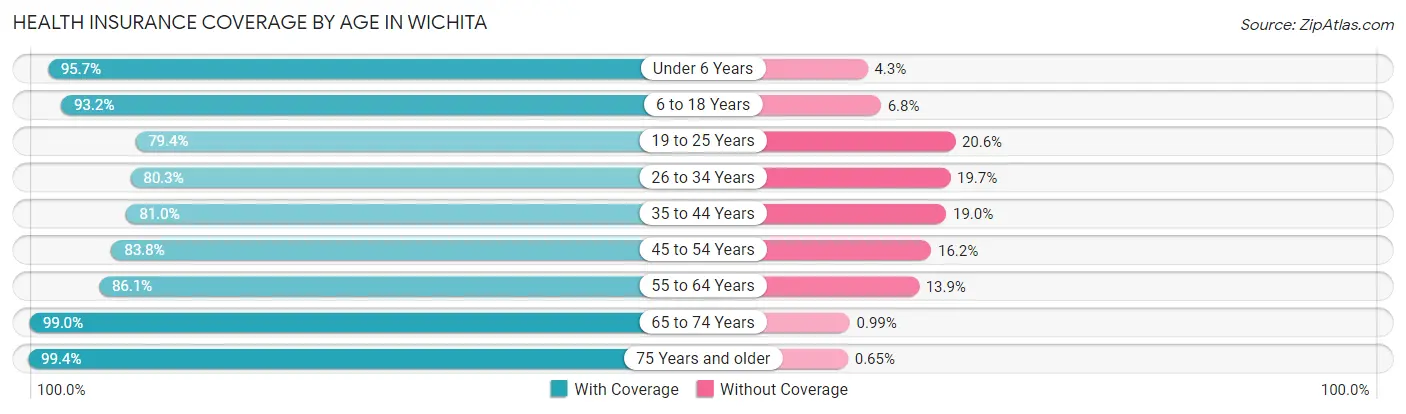
| Age Bracket | With Coverage | Without Coverage |
| Under 6 Years | 28,459 (95.7%) | 1,284 (4.3%) |
| 6 to 18 Years | 67,379 (93.2%) | 4,909 (6.8%) |
| 19 to 25 Years | 32,506 (79.4%) | 8,449 (20.6%) |
| 26 to 34 Years | 40,562 (80.3%) | 9,964 (19.7%) |
| 35 to 44 Years | 39,702 (81.0%) | 9,292 (19.0%) |
| 45 to 54 Years | 36,893 (83.8%) | 7,124 (16.2%) |
| 55 to 64 Years | 39,785 (86.1%) | 6,407 (13.9%) |
| 65 to 74 Years | 35,377 (99.0%) | 353 (1.0%) |
| 75 Years and older | 22,177 (99.4%) | 146 (0.6%) |
| Total | 342,840 (87.7%) | 47,928 (12.3%) |
Health Insurance Coverage by Citizenship Status in Wichita
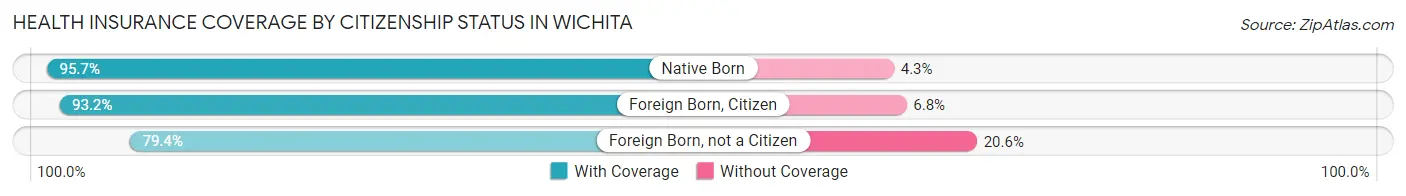
| Citizenship Status | With Coverage | Without Coverage |
| Native Born | 28,459 (95.7%) | 1,284 (4.3%) |
| Foreign Born, Citizen | 67,379 (93.2%) | 4,909 (6.8%) |
| Foreign Born, not a Citizen | 32,506 (79.4%) | 8,449 (20.6%) |
Health Insurance Coverage by Household Income in Wichita
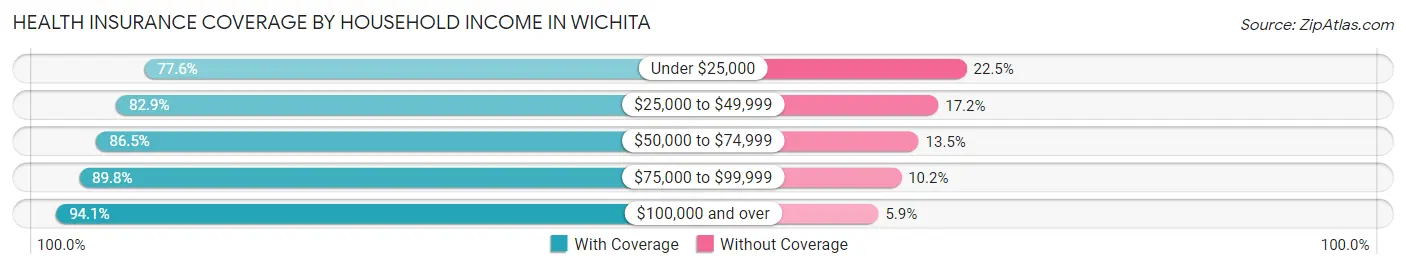
| Household Income | With Coverage | Without Coverage |
| Under $25,000 | 39,339 (77.5%) | 11,390 (22.5%) |
| $25,000 to $49,999 | 63,036 (82.9%) | 13,048 (17.2%) |
| $50,000 to $74,999 | 58,730 (86.5%) | 9,133 (13.5%) |
| $75,000 to $99,999 | 54,486 (89.8%) | 6,186 (10.2%) |
| $100,000 and over | 124,735 (94.1%) | 7,870 (5.9%) |
Public vs Private Health Insurance Coverage by Age in Wichita
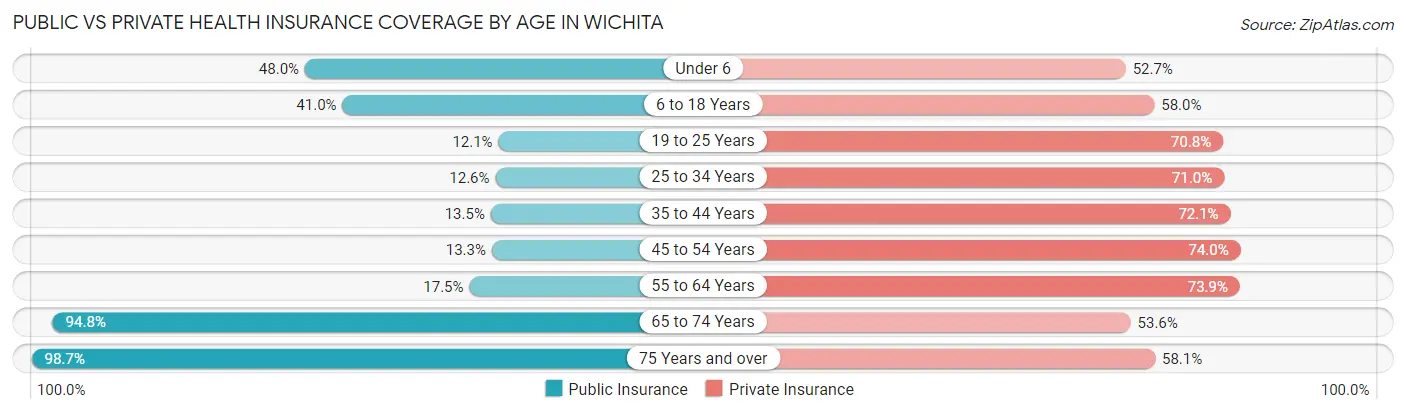
| Age Bracket | Public Insurance | Private Insurance |
| Under 6 | 14,267 (48.0%) | 15,674 (52.7%) |
| 6 to 18 Years | 29,644 (41.0%) | 41,929 (58.0%) |
| 19 to 25 Years | 4,937 (12.0%) | 28,982 (70.8%) |
| 25 to 34 Years | 6,377 (12.6%) | 35,852 (71.0%) |
| 35 to 44 Years | 6,605 (13.5%) | 35,337 (72.1%) |
| 45 to 54 Years | 5,850 (13.3%) | 32,572 (74.0%) |
| 55 to 64 Years | 8,059 (17.4%) | 34,124 (73.9%) |
| 65 to 74 Years | 33,869 (94.8%) | 19,154 (53.6%) |
| 75 Years and over | 22,035 (98.7%) | 12,978 (58.1%) |
| Total | 131,643 (33.7%) | 256,602 (65.7%) |
Disability Status by Sex by Age in Wichita
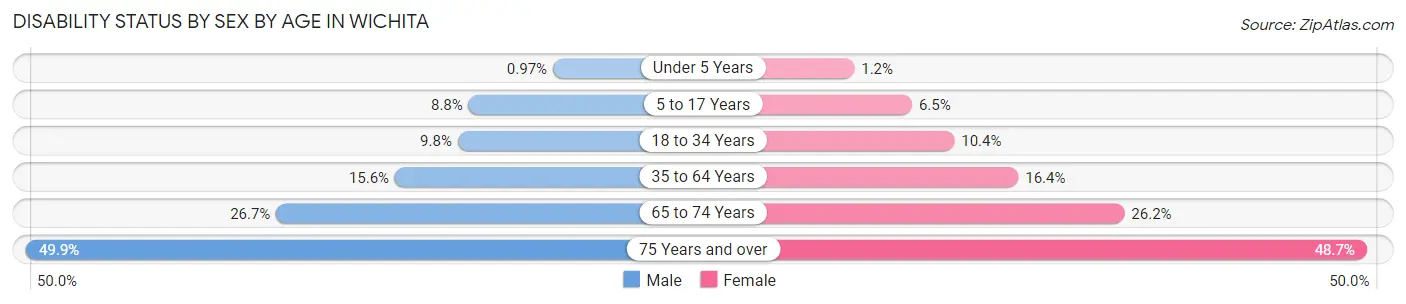
| Age Bracket | Male | Female |
| Under 5 Years | 122 (1.0%) | 146 (1.2%) |
| 5 to 17 Years | 3,261 (8.8%) | 2,265 (6.5%) |
| 18 to 34 Years | 4,728 (9.8%) | 5,022 (10.4%) |
| 35 to 64 Years | 10,834 (15.6%) | 11,448 (16.4%) |
| 65 to 74 Years | 4,505 (26.7%) | 4,938 (26.2%) |
| 75 Years and over | 4,605 (49.9%) | 6,376 (48.7%) |
Disability Class by Sex by Age in Wichita
Disability Class: Hearing Difficulty
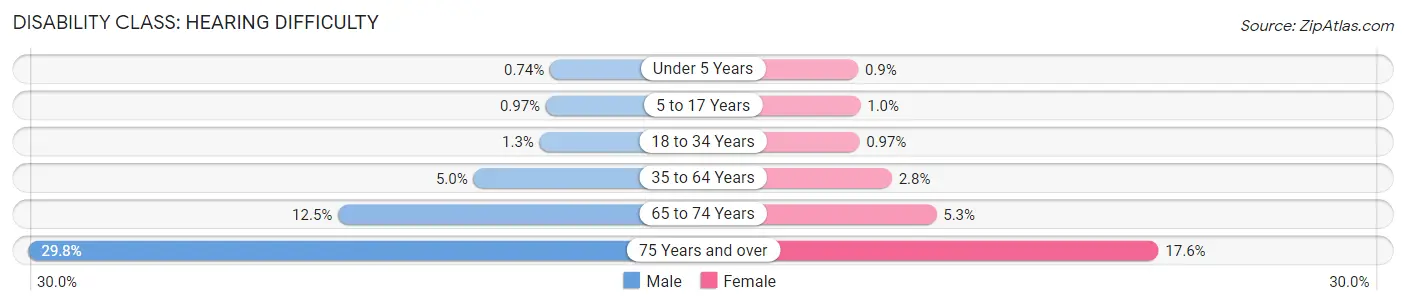
| Age Bracket | Male | Female |
| Under 5 Years | 93 (0.7%) | 113 (0.9%) |
| 5 to 17 Years | 360 (1.0%) | 358 (1.0%) |
| 18 to 34 Years | 639 (1.3%) | 465 (1.0%) |
| 35 to 64 Years | 3,467 (5.0%) | 1,943 (2.8%) |
| 65 to 74 Years | 2,119 (12.5%) | 990 (5.3%) |
| 75 Years and over | 2,751 (29.8%) | 2,308 (17.6%) |
Disability Class: Vision Difficulty
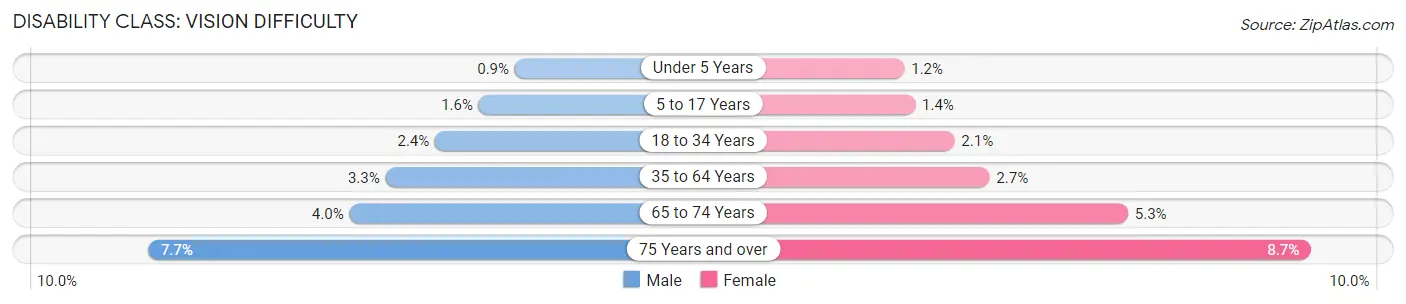
| Age Bracket | Male | Female |
| Under 5 Years | 114 (0.9%) | 146 (1.2%) |
| 5 to 17 Years | 582 (1.6%) | 472 (1.4%) |
| 18 to 34 Years | 1,150 (2.4%) | 1,005 (2.1%) |
| 35 to 64 Years | 2,288 (3.3%) | 1,917 (2.7%) |
| 65 to 74 Years | 671 (4.0%) | 1,000 (5.3%) |
| 75 Years and over | 712 (7.7%) | 1,140 (8.7%) |
Disability Class: Cognitive Difficulty
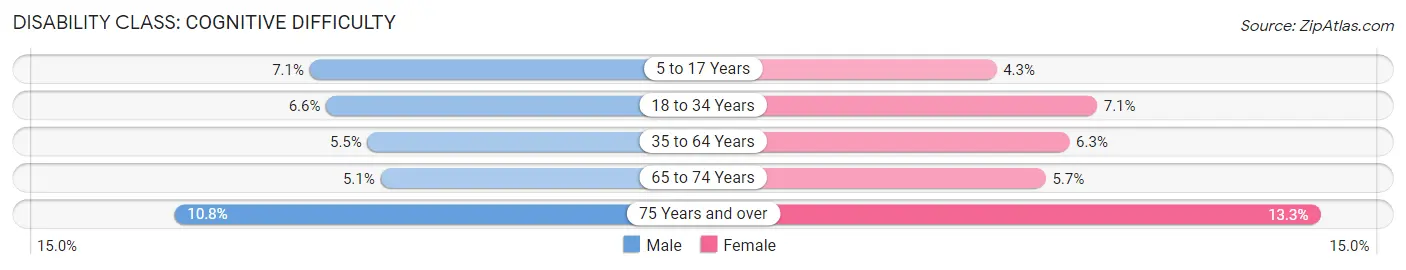
| Age Bracket | Male | Female |
| 5 to 17 Years | 2,617 (7.1%) | 1,498 (4.3%) |
| 18 to 34 Years | 3,185 (6.6%) | 3,415 (7.1%) |
| 35 to 64 Years | 3,775 (5.4%) | 4,425 (6.3%) |
| 65 to 74 Years | 861 (5.1%) | 1,068 (5.7%) |
| 75 Years and over | 1,000 (10.8%) | 1,743 (13.3%) |
Disability Class: Ambulatory Difficulty
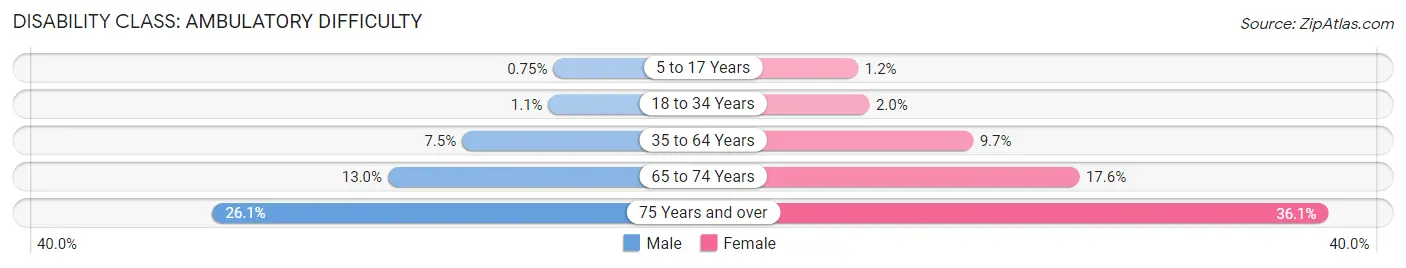
| Age Bracket | Male | Female |
| 5 to 17 Years | 279 (0.7%) | 415 (1.2%) |
| 18 to 34 Years | 534 (1.1%) | 971 (2.0%) |
| 35 to 64 Years | 5,214 (7.5%) | 6,795 (9.7%) |
| 65 to 74 Years | 2,203 (13.0%) | 3,315 (17.6%) |
| 75 Years and over | 2,405 (26.1%) | 4,728 (36.1%) |
Disability Class: Self-Care Difficulty
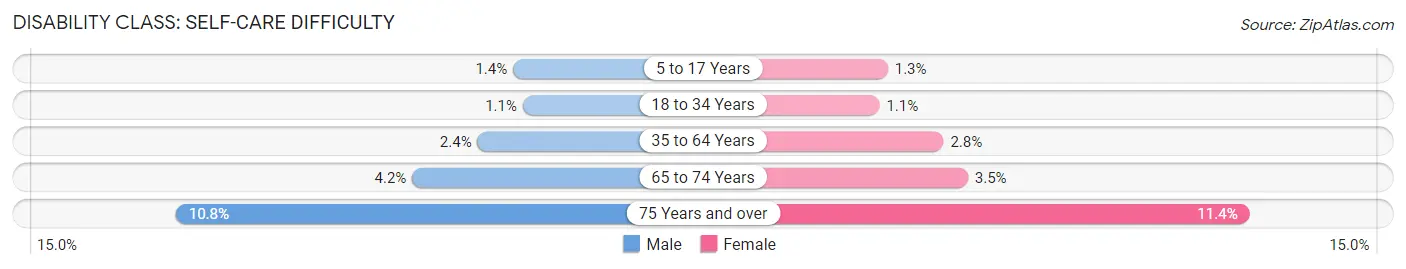
| Age Bracket | Male | Female |
| 5 to 17 Years | 520 (1.4%) | 444 (1.3%) |
| 18 to 34 Years | 547 (1.1%) | 503 (1.1%) |
| 35 to 64 Years | 1,657 (2.4%) | 1,977 (2.8%) |
| 65 to 74 Years | 712 (4.2%) | 660 (3.5%) |
| 75 Years and over | 996 (10.8%) | 1,486 (11.4%) |
Technology Access in Wichita
Computing Device Access in Wichita
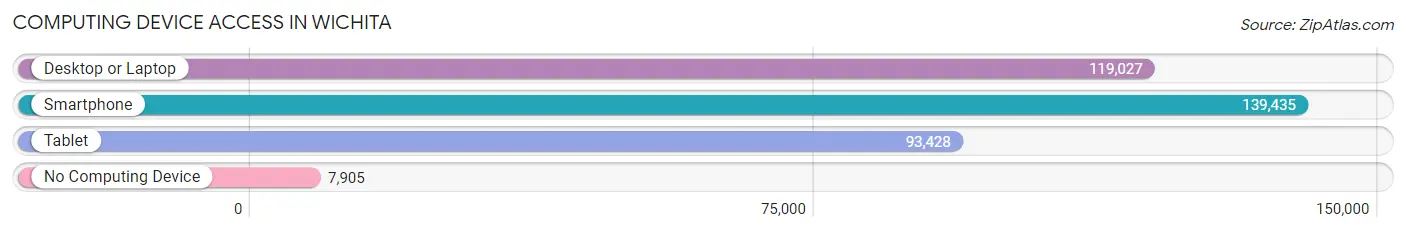
| Device Type | # Households | % Households |
| Desktop or Laptop | 119,027 | 76.3% |
| Smartphone | 139,435 | 89.3% |
| Tablet | 93,428 | 59.9% |
| No Computing Device | 7,905 | 5.1% |
| Total | 156,054 | 100.0% |
Internet Access in Wichita
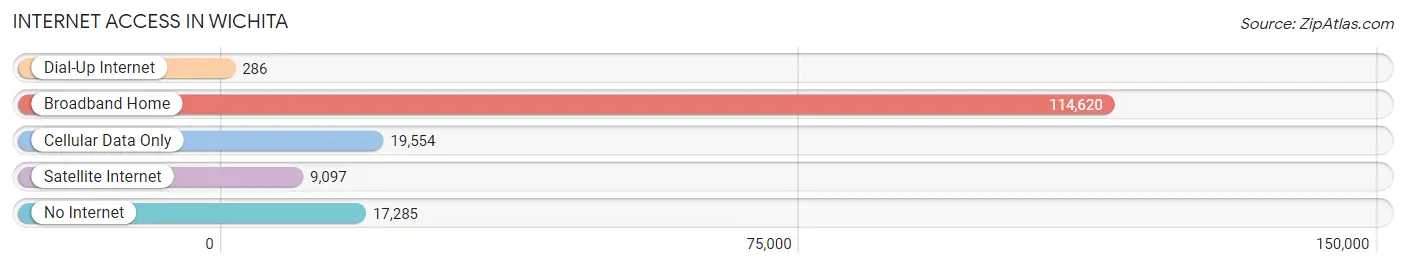
| Internet Type | # Households | % Households |
| Dial-Up Internet | 286 | 0.2% |
| Broadband Home | 114,620 | 73.5% |
| Cellular Data Only | 19,554 | 12.5% |
| Satellite Internet | 9,097 | 5.8% |
| No Internet | 17,285 | 11.1% |
| Total | 156,054 | 100.0% |
Wichita Summary
Wichita, Kansas is the largest city in the state of Kansas and the county seat of Sedgwick County. It is located in south-central Kansas on the Arkansas River. Wichita is the principal city of the Wichita metropolitan area, which had an estimated population of 644,888 in 2018. As of 2019, the estimated population of the city was 389,255, making it the 51st-largest city in the United States.
History
The area that is now Wichita was inhabited by Native American tribes for thousands of years before the arrival of European settlers. The Wichita people, a tribe of the Caddoan language family, were the first to settle the area. The Wichita were a semi-nomadic people who lived in villages along the Arkansas River.
The first Europeans to settle in the area were French fur traders, who established a trading post in the area in 1819. The area was officially opened to settlement in 1854, when the U.S. government signed a treaty with the Wichita people. The city of Wichita was founded in 1870 and incorporated in 1872.
Geography
Wichita is located in south-central Kansas on the Arkansas River. The city is situated in the Great Plains region of the United States, and is surrounded by prairie and grassland. The city has an elevation of 1,189 feet (363 m).
The city covers an area of 96.8 square miles (250.2 km2), of which 95.6 square miles (247.3 km2) is land and 1.2 square miles (3.1 km2) is water. The city is located in the Chisholm Creek Valley, which is part of the Great Plains region.
Economy
Wichita is the economic and cultural center of south-central Kansas. The city is home to a diverse economy, with a mix of manufacturing, services, and technology-based industries.
The city is home to several major employers, including Spirit AeroSystems, Cessna Aircraft Company, Koch Industries, and Textron Aviation. The city is also home to several universities and colleges, including Wichita State University, Newman University, and Friends University.
Demographics
As of the 2019 U.S. Census, the population of Wichita was 389,255. The city has a population density of 4,039 people per square mile (1,561/km2). The racial makeup of the city was 73.2% White, 11.3% African American, 0.7% Native American, 3.2% Asian, 0.1% Pacific Islander, 8.2% from other races, and 3.3% from two or more races. Hispanic or Latino of any race were 16.7% of the population.
The median income for a household in the city was $45,837, and the median income for a family was $54,844. The per capita income for the city was $24,945. About 13.2% of families and 17.2% of the population were below the poverty line, including 25.2% of those under age 18 and 8.7% of those age 65 or over.
Common Questions
What is Per Capita Income in Wichita?
Per Capita income in Wichita is $34,393.
What is the Median Family Income in Wichita?
Median Family Income in Wichita is $77,916.
What is the Median Household income in Wichita?
Median Household Income in Wichita is $60,712.
What is Income or Wage Gap in Wichita?
Income or Wage Gap in Wichita is 29.6%.
Women in Wichita earn 70.4 cents for every dollar earned by a man.
What is Family Income Deficit in Wichita?
Family Income Deficit in Wichita is $11,123.
Families that are below poverty line in Wichita earn $11,123 less on average than the poverty threshold level.
What is Inequality or Gini Index in Wichita?
Inequality or Gini Index in Wichita is 0.47.
What is the Total Population of Wichita?
Total Population of Wichita is 395,951.
What is the Total Male Population of Wichita?
Total Male Population of Wichita is 196,946.
What is the Total Female Population of Wichita?
Total Female Population of Wichita is 199,005.
What is the Ratio of Males per 100 Females in Wichita?
There are 98.97 Males per 100 Females in Wichita.
What is the Ratio of Females per 100 Males in Wichita?
There are 101.05 Females per 100 Males in Wichita.
What is the Median Population Age in Wichita?
Median Population Age in Wichita is 35.4 Years.
What is the Average Family Size in Wichita
Average Family Size in Wichita is 3.2 People.
What is the Average Household Size in Wichita
Average Household Size in Wichita is 2.5 People.
How Large is the Labor Force in Wichita?
There are 204,593 People in the Labor Forcein in Wichita.
What is the Percentage of People in the Labor Force in Wichita?
66.0% of People are in the Labor Force in Wichita.
What is the Unemployment Rate in Wichita?
Unemployment Rate in Wichita is 5.7%.