Santa Rosa, CA Map & Demographics
Santa Rosa Map
Santa Rosa Overview
$46,804
PER CAPITA INCOME
$110,196
AVG FAMILY INCOME
$92,604
AVG HOUSEHOLD INCOME
21.5%
WAGE / INCOME GAP [ % ]
78.5¢/ $1
WAGE / INCOME GAP [ $ ]
$11,996
FAMILY INCOME DEFICIT
0.44
INEQUALITY / GINI INDEX
178,221
TOTAL POPULATION
86,975
MALE POPULATION
91,246
FEMALE POPULATION
95.32
MALES / 100 FEMALES
104.91
FEMALES / 100 MALES
40.4
MEDIAN AGE
3.1
AVG FAMILY SIZE
2.6
AVG HOUSEHOLD SIZE
96,959
LABOR FORCE [ PEOPLE ]
66.4%
PERCENT IN LABOR FORCE
5.6%
UNEMPLOYMENT RATE
Santa Rosa Area Codes
Income in Santa Rosa
Income Overview in Santa Rosa
Per Capita Income in Santa Rosa is $46,804, while median incomes of families and households are $110,196 and $92,604 respectively.
| Characteristic | Number | Measure |
| Per Capita Income | 178,221 | $46,804 |
| Median Family Income | 42,344 | $110,196 |
| Mean Family Income | 42,344 | $138,872 |
| Median Household Income | 68,096 | $92,604 |
| Mean Household Income | 68,096 | $120,336 |
| Income Deficit | 42,344 | $11,996 |
| Wage / Income Gap (%) | 178,221 | 21.54% |
| Wage / Income Gap ($) | 178,221 | 78.46¢ per $1 |
| Gini / Inequality Index | 178,221 | 0.44 |
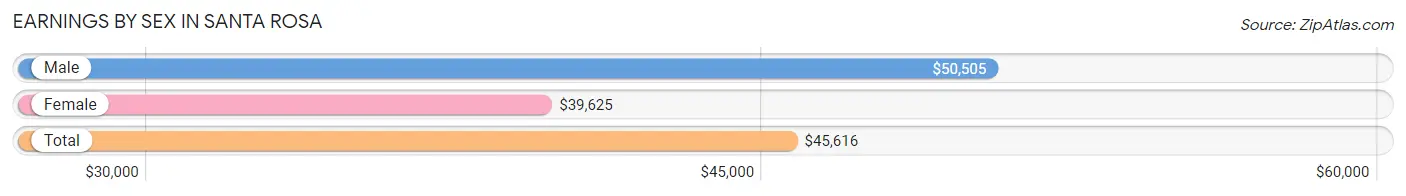
Earnings by Sex in Santa Rosa
Average Earnings in Santa Rosa are $45,616, $50,505 for men and $39,625 for women, a difference of 21.5%.
| Sex | Number | Average Earnings |
| Male | 52,614 (52.6%) | $50,505 |
| Female | 47,364 (47.4%) | $39,625 |
| Total | 99,978 (100.0%) | $45,616 |
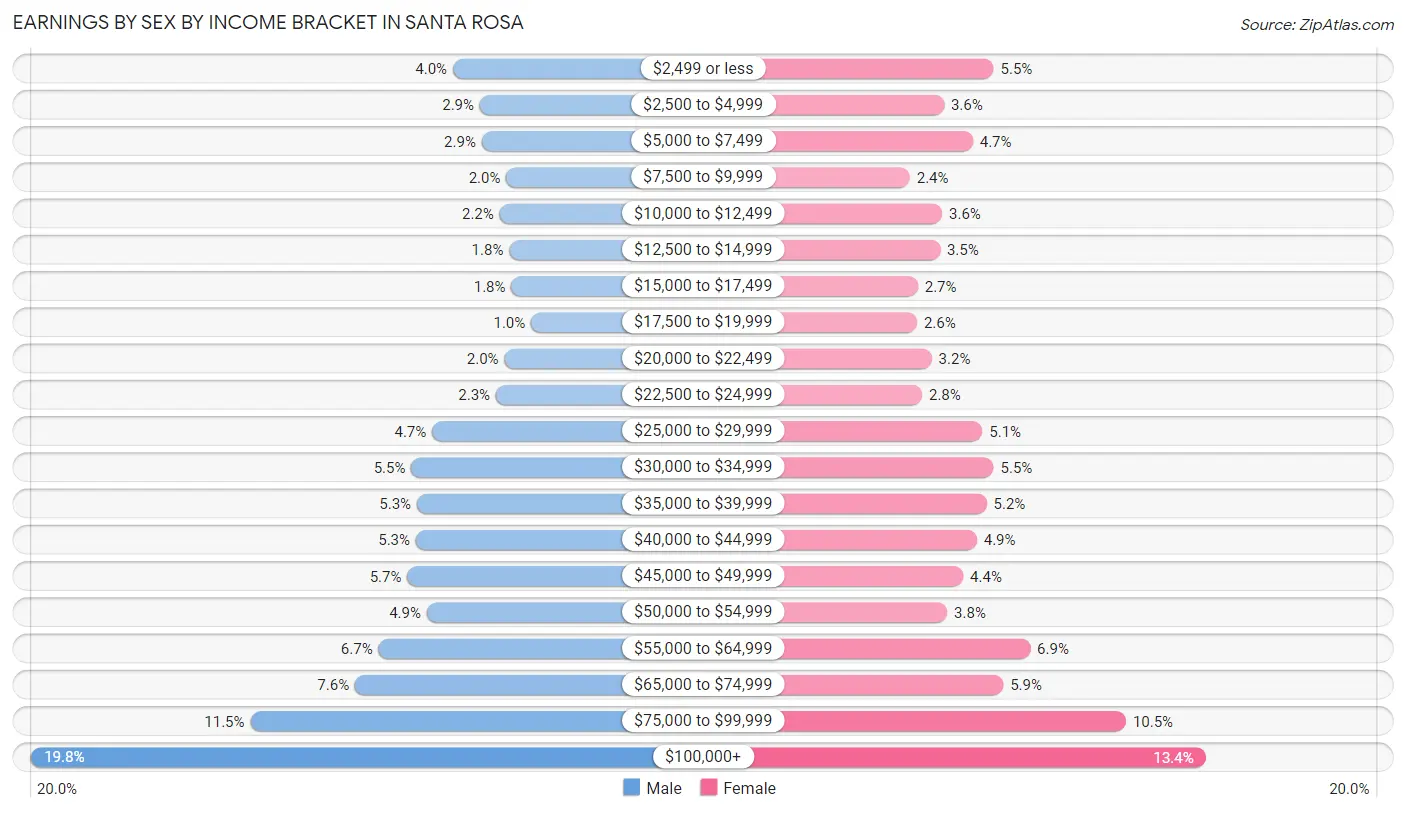
Earnings by Sex by Income Bracket in Santa Rosa
The most common earnings brackets in Santa Rosa are $100,000+ for men (10,390 | 19.8%) and $100,000+ for women (6,365 | 13.4%).
| Income | Male | Female |
| $2,499 or less | 2,079 (4.0%) | 2,605 (5.5%) |
| $2,500 to $4,999 | 1,545 (2.9%) | 1,724 (3.6%) |
| $5,000 to $7,499 | 1,510 (2.9%) | 2,236 (4.7%) |
| $7,500 to $9,999 | 1,026 (1.9%) | 1,119 (2.4%) |
| $10,000 to $12,499 | 1,156 (2.2%) | 1,689 (3.6%) |
| $12,500 to $14,999 | 969 (1.8%) | 1,651 (3.5%) |
| $15,000 to $17,499 | 927 (1.8%) | 1,261 (2.7%) |
| $17,500 to $19,999 | 539 (1.0%) | 1,244 (2.6%) |
| $20,000 to $22,499 | 1,065 (2.0%) | 1,507 (3.2%) |
| $22,500 to $24,999 | 1,229 (2.3%) | 1,336 (2.8%) |
| $25,000 to $29,999 | 2,488 (4.7%) | 2,404 (5.1%) |
| $30,000 to $34,999 | 2,900 (5.5%) | 2,605 (5.5%) |
| $35,000 to $39,999 | 2,786 (5.3%) | 2,482 (5.2%) |
| $40,000 to $44,999 | 2,812 (5.3%) | 2,306 (4.9%) |
| $45,000 to $49,999 | 2,976 (5.7%) | 2,064 (4.4%) |
| $50,000 to $54,999 | 2,594 (4.9%) | 1,780 (3.8%) |
| $55,000 to $64,999 | 3,545 (6.7%) | 3,254 (6.9%) |
| $65,000 to $74,999 | 4,007 (7.6%) | 2,777 (5.9%) |
| $75,000 to $99,999 | 6,071 (11.5%) | 4,955 (10.5%) |
| $100,000+ | 10,390 (19.8%) | 6,365 (13.4%) |
| Total | 52,614 (100.0%) | 47,364 (100.0%) |
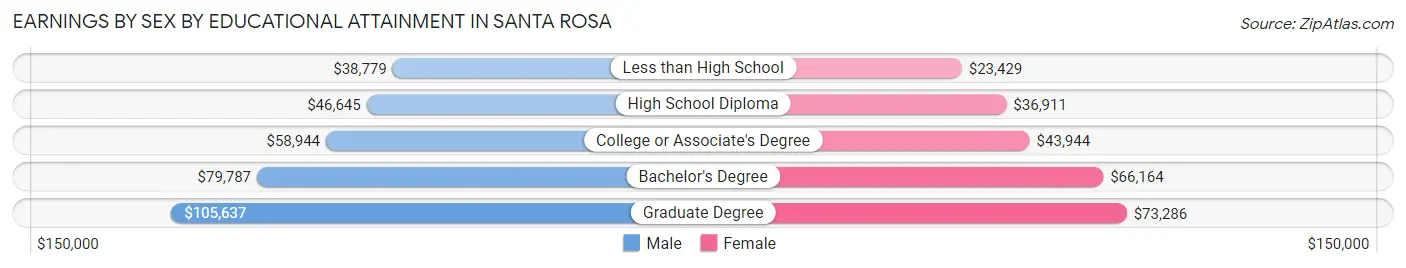
Earnings by Sex by Educational Attainment in Santa Rosa
Average earnings in Santa Rosa are $57,189 for men and $46,001 for women, a difference of 19.6%. Men with an educational attainment of graduate degree enjoy the highest average annual earnings of $105,637, while those with less than high school education earn the least with $38,779. Women with an educational attainment of graduate degree earn the most with the average annual earnings of $73,286, while those with less than high school education have the smallest earnings of $23,429.
| Educational Attainment | Male Income | Female Income |
| Less than High School | $38,779 | $23,429 |
| High School Diploma | $46,645 | $36,911 |
| College or Associate's Degree | $58,944 | $43,944 |
| Bachelor's Degree | $79,787 | $66,164 |
| Graduate Degree | $105,637 | $73,286 |
| Total | $57,189 | $46,001 |
Family Income in Santa Rosa
Family Income Brackets in Santa Rosa
According to the Santa Rosa family income data, there are 9,697 families falling into the $100,000 to $149,999 income range, which is the most common income bracket and makes up 22.9% of all families. Conversely, the $10,000 to $14,999 income bracket is the least frequent group with only 635 families (1.5%) belonging to this category.
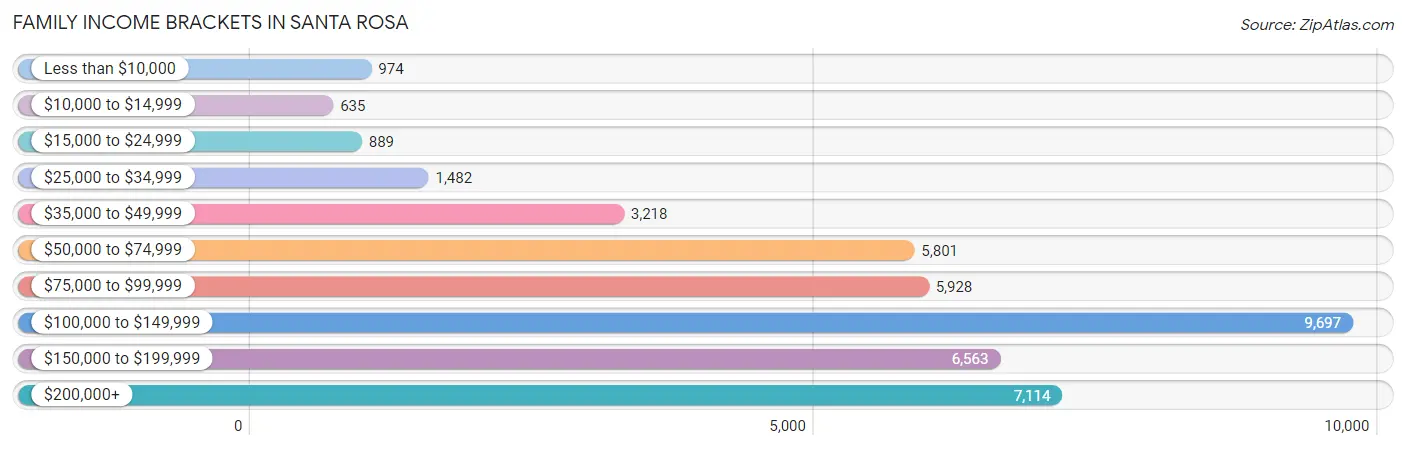
| Income Bracket | # Families | % Families |
| Less than $10,000 | 974 | 2.3% |
| $10,000 to $14,999 | 635 | 1.5% |
| $15,000 to $24,999 | 889 | 2.1% |
| $25,000 to $34,999 | 1,482 | 3.5% |
| $35,000 to $49,999 | 3,218 | 7.6% |
| $50,000 to $74,999 | 5,801 | 13.7% |
| $75,000 to $99,999 | 5,928 | 14.0% |
| $100,000 to $149,999 | 9,697 | 22.9% |
| $150,000 to $199,999 | 6,563 | 15.5% |
| $200,000+ | 7,114 | 16.8% |
Family Income by Famaliy Size in Santa Rosa
5-person families (3,974 | 9.4%) account for the highest median family income in Santa Rosa with $118,120 per family, while 2-person families (19,017 | 44.9%) have the highest median income of $53,698 per family member.
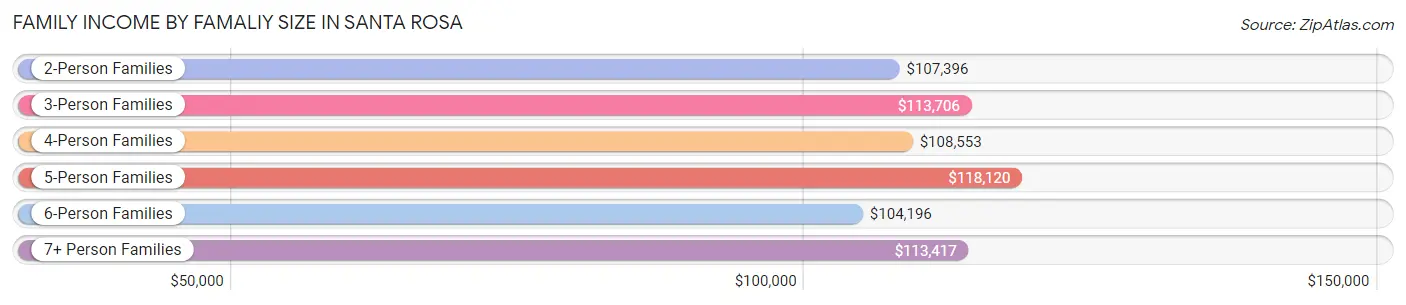
| Income Bracket | # Families | Median Income |
| 2-Person Families | 19,017 (44.9%) | $107,396 |
| 3-Person Families | 9,582 (22.6%) | $113,706 |
| 4-Person Families | 8,144 (19.2%) | $108,553 |
| 5-Person Families | 3,974 (9.4%) | $118,120 |
| 6-Person Families | 1,138 (2.7%) | $104,196 |
| 7+ Person Families | 489 (1.1%) | $113,417 |
| Total | 42,344 (100.0%) | $110,196 |
Family Income by Number of Earners in Santa Rosa
The median family income in Santa Rosa is $110,196, with families comprising 3+ earners (6,082) having the highest median family income of $140,884, while families with no earners (5,193) have the lowest median family income of $78,156, accounting for 14.4% and 12.3% of families, respectively.
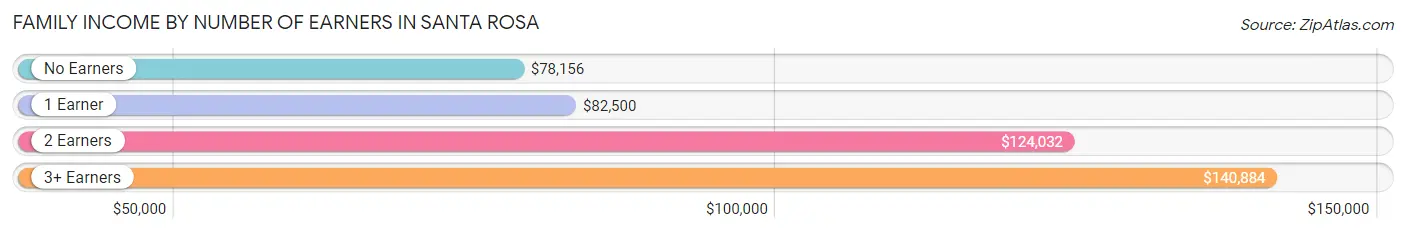
| Number of Earners | # Families | Median Income |
| No Earners | 5,193 (12.3%) | $78,156 |
| 1 Earner | 12,126 (28.6%) | $82,500 |
| 2 Earners | 18,943 (44.7%) | $124,032 |
| 3+ Earners | 6,082 (14.4%) | $140,884 |
| Total | 42,344 (100.0%) | $110,196 |
Household Income in Santa Rosa
Household Income Brackets in Santa Rosa
With 13,892 households falling in the category, the $100,000 to $149,999 income range is the most frequent in Santa Rosa, accounting for 20.4% of all households. In contrast, only 1,907 households (2.8%) fall into the $10,000 to $14,999 income bracket, making it the least populous group.
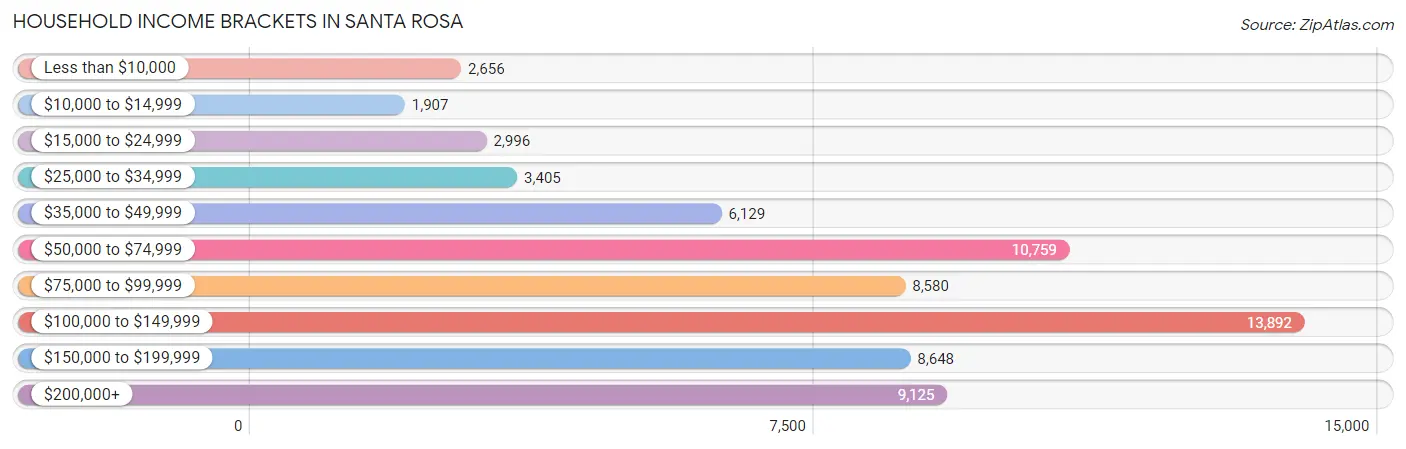
| Income Bracket | # Households | % Households |
| Less than $10,000 | 2,656 | 3.9% |
| $10,000 to $14,999 | 1,907 | 2.8% |
| $15,000 to $24,999 | 2,996 | 4.4% |
| $25,000 to $34,999 | 3,405 | 5.0% |
| $35,000 to $49,999 | 6,129 | 9.0% |
| $50,000 to $74,999 | 10,759 | 15.8% |
| $75,000 to $99,999 | 8,580 | 12.6% |
| $100,000 to $149,999 | 13,892 | 20.4% |
| $150,000 to $199,999 | 8,648 | 12.7% |
| $200,000+ | 9,125 | 13.4% |
Household Income by Householder Age in Santa Rosa
The median household income in Santa Rosa is $92,604, with the highest median household income of $113,893 found in the 45 to 64 years age bracket for the primary householder. A total of 23,945 households (35.2%) fall into this category. Meanwhile, the 15 to 24 years age bracket for the primary householder has the lowest median household income of $52,217, with 1,814 households (2.7%) in this group.
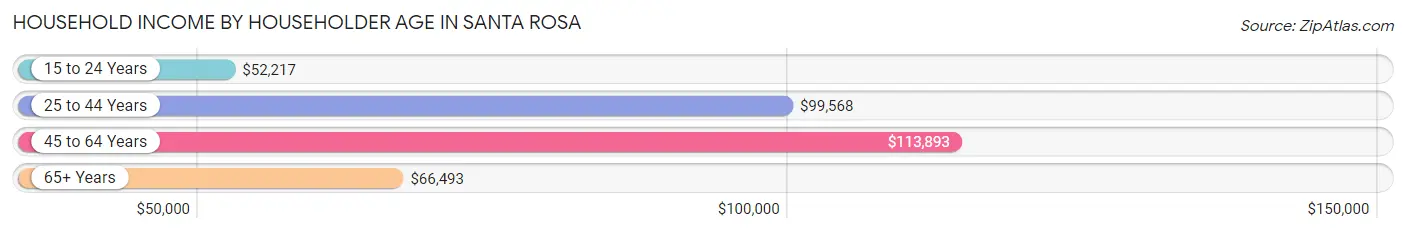
| Income Bracket | # Households | Median Income |
| 15 to 24 Years | 1,814 (2.7%) | $52,217 |
| 25 to 44 Years | 21,910 (32.2%) | $99,568 |
| 45 to 64 Years | 23,945 (35.2%) | $113,893 |
| 65+ Years | 20,427 (30.0%) | $66,493 |
| Total | 68,096 (100.0%) | $92,604 |
Poverty in Santa Rosa
Income Below Poverty by Sex and Age in Santa Rosa
With 9.2% poverty level for males and 10.7% for females among the residents of Santa Rosa, 15 year old males and 15 year old females are the most vulnerable to poverty, with 316 males (28.2%) and 384 females (33.4%) in their respective age groups living below the poverty level.
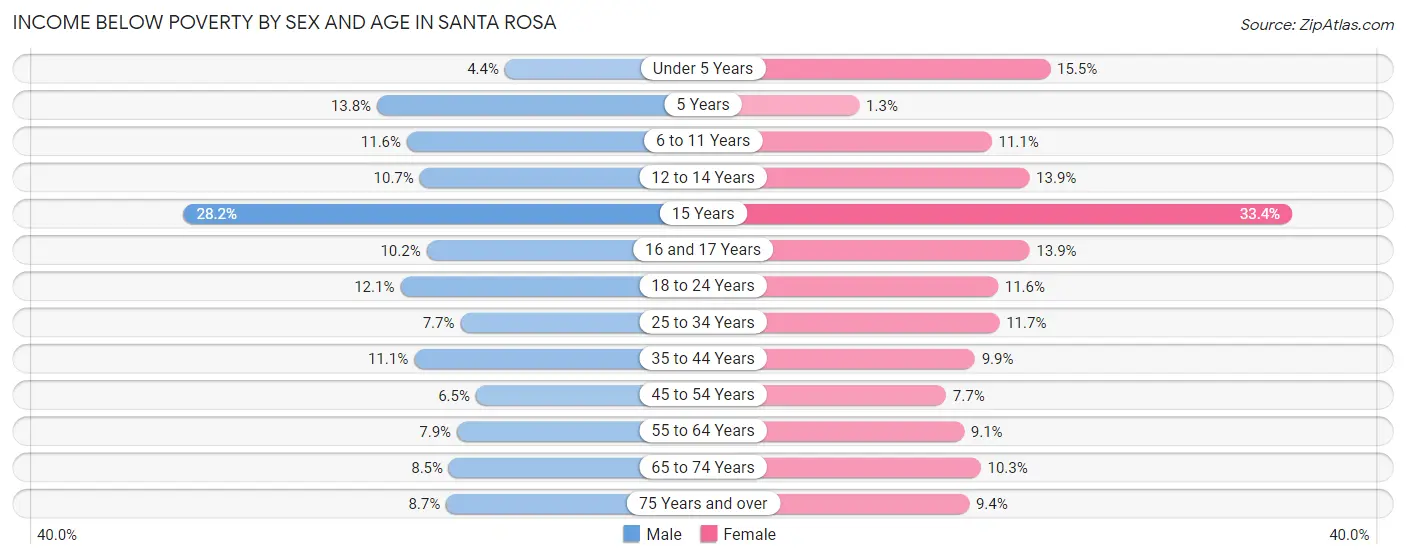
| Age Bracket | Male | Female |
| Under 5 Years | 191 (4.3%) | 671 (15.5%) |
| 5 Years | 156 (13.8%) | 10 (1.3%) |
| 6 to 11 Years | 684 (11.6%) | 621 (11.1%) |
| 12 to 14 Years | 341 (10.7%) | 560 (13.9%) |
| 15 Years | 316 (28.2%) | 384 (33.4%) |
| 16 and 17 Years | 244 (10.2%) | 270 (13.9%) |
| 18 to 24 Years | 925 (12.1%) | 819 (11.6%) |
| 25 to 34 Years | 941 (7.6%) | 1,372 (11.7%) |
| 35 to 44 Years | 1,396 (11.1%) | 1,210 (9.9%) |
| 45 to 54 Years | 733 (6.5%) | 888 (7.7%) |
| 55 to 64 Years | 814 (7.9%) | 1,042 (9.1%) |
| 65 to 74 Years | 718 (8.5%) | 1,095 (10.3%) |
| 75 Years and over | 432 (8.7%) | 750 (9.4%) |
| Total | 7,891 (9.2%) | 9,692 (10.7%) |
Income Above Poverty by Sex and Age in Santa Rosa
According to the poverty statistics in Santa Rosa, males aged under 5 years and females aged 5 years are the age groups that are most secure financially, with 95.7% of males and 98.7% of females in these age groups living above the poverty line.
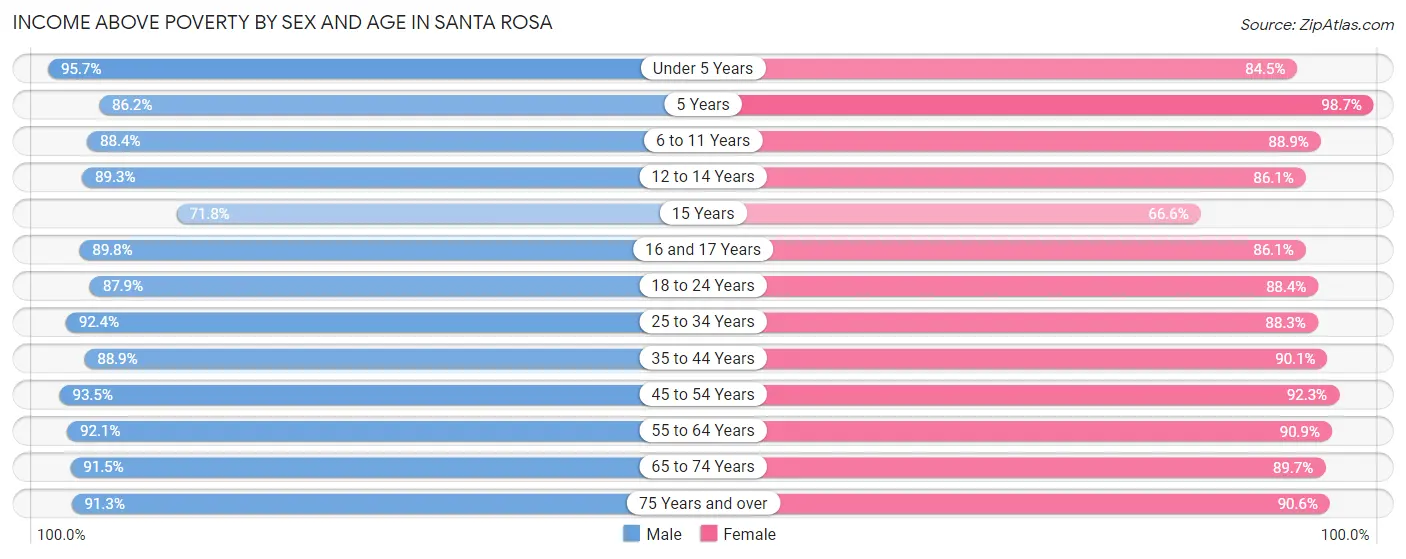
| Age Bracket | Male | Female |
| Under 5 Years | 4,204 (95.7%) | 3,669 (84.5%) |
| 5 Years | 971 (86.2%) | 768 (98.7%) |
| 6 to 11 Years | 5,203 (88.4%) | 4,963 (88.9%) |
| 12 to 14 Years | 2,855 (89.3%) | 3,467 (86.1%) |
| 15 Years | 805 (71.8%) | 765 (66.6%) |
| 16 and 17 Years | 2,157 (89.8%) | 1,668 (86.1%) |
| 18 to 24 Years | 6,715 (87.9%) | 6,251 (88.4%) |
| 25 to 34 Years | 11,367 (92.3%) | 10,360 (88.3%) |
| 35 to 44 Years | 11,197 (88.9%) | 11,047 (90.1%) |
| 45 to 54 Years | 10,537 (93.5%) | 10,603 (92.3%) |
| 55 to 64 Years | 9,489 (92.1%) | 10,460 (90.9%) |
| 65 to 74 Years | 7,731 (91.5%) | 9,533 (89.7%) |
| 75 Years and over | 4,525 (91.3%) | 7,197 (90.6%) |
| Total | 77,756 (90.8%) | 80,751 (89.3%) |
Income Below Poverty Among Married-Couple Families in Santa Rosa
The poverty statistics for married-couple families in Santa Rosa show that 3.3% or 1,028 of the total 31,180 families live below the poverty line. Families with 3 or 4 children have the highest poverty rate of 7.7%, comprising of 181 families. On the other hand, families with 5 or more children have the lowest poverty rate of 0.0%, which includes 0 families.
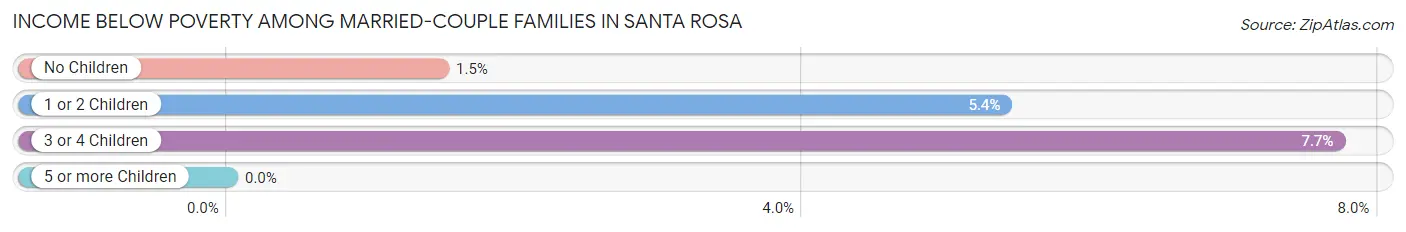
| Children | Above Poverty | Below Poverty |
| No Children | 17,704 (98.5%) | 264 (1.5%) |
| 1 or 2 Children | 10,240 (94.6%) | 583 (5.4%) |
| 3 or 4 Children | 2,168 (92.3%) | 181 (7.7%) |
| 5 or more Children | 40 (100.0%) | 0 (0.0%) |
| Total | 30,152 (96.7%) | 1,028 (3.3%) |
Income Below Poverty Among Single-Parent Households in Santa Rosa
According to the poverty data in Santa Rosa, 9.7% or 388 single-father households and 13.6% or 973 single-mother households are living below the poverty line. Among single-father households, those with 3 or 4 children have the highest poverty rate, with 155 households (44.8%) experiencing poverty. Likewise, among single-mother households, those with 3 or 4 children have the highest poverty rate, with 209 households (34.2%) falling below the poverty line.
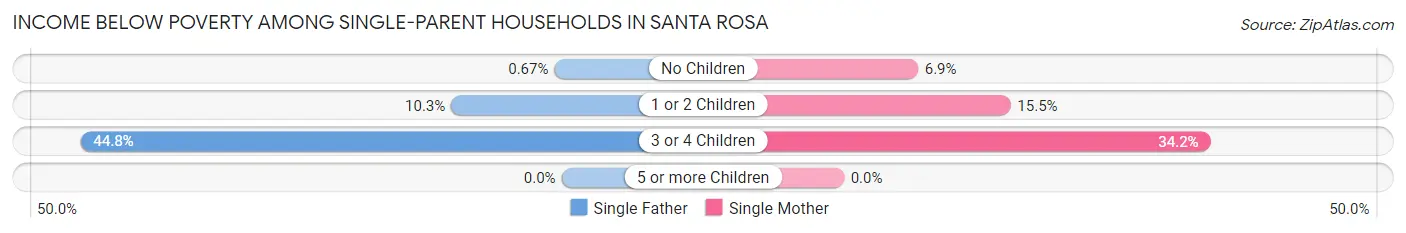
| Children | Single Father | Single Mother |
| No Children | 10 (0.7%) | 201 (6.9%) |
| 1 or 2 Children | 223 (10.3%) | 563 (15.5%) |
| 3 or 4 Children | 155 (44.8%) | 209 (34.2%) |
| 5 or more Children | 0 (0.0%) | 0 (0.0%) |
| Total | 388 (9.7%) | 973 (13.6%) |
Income Below Poverty Among Married-Couple vs Single-Parent Households in Santa Rosa
The poverty data for Santa Rosa shows that 1,028 of the married-couple family households (3.3%) and 1,361 of the single-parent households (12.2%) are living below the poverty level. Within the married-couple family households, those with 3 or 4 children have the highest poverty rate, with 181 households (7.7%) falling below the poverty line. Among the single-parent households, those with 3 or 4 children have the highest poverty rate, with 364 household (38.0%) living below poverty.
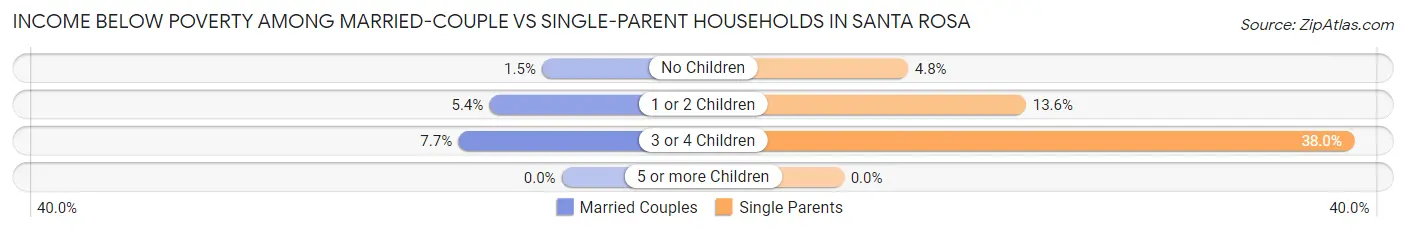
| Children | Married-Couple Families | Single-Parent Households |
| No Children | 264 (1.5%) | 211 (4.8%) |
| 1 or 2 Children | 583 (5.4%) | 786 (13.6%) |
| 3 or 4 Children | 181 (7.7%) | 364 (38.0%) |
| 5 or more Children | 0 (0.0%) | 0 (0.0%) |
| Total | 1,028 (3.3%) | 1,361 (12.2%) |
Race in Santa Rosa
The most populous races in Santa Rosa are White / Caucasian (107,027 | 60.1%), Hispanic or Latino (60,515 | 34.0%), and Some other Race (34,591 | 19.4%).
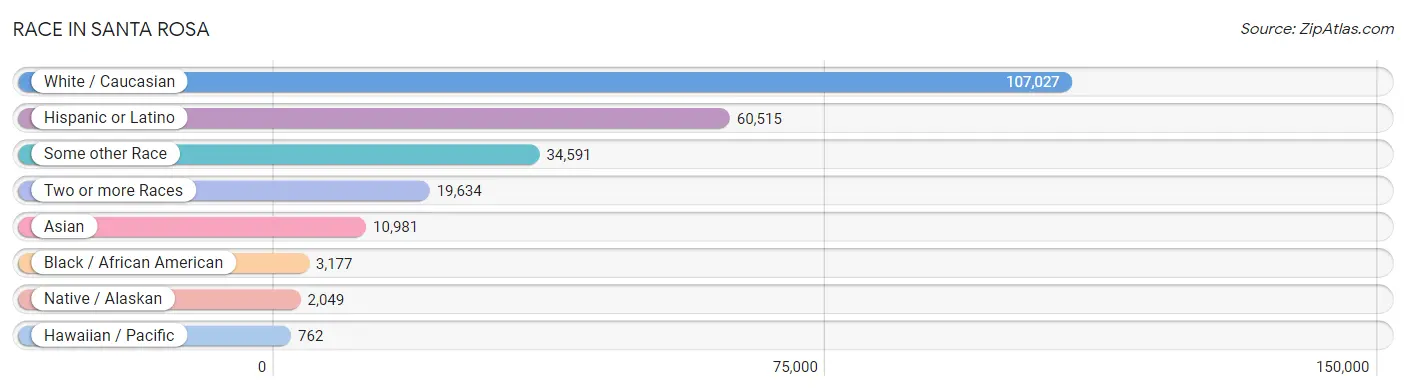
| Race | # Population | % Population |
| Asian | 10,981 | 6.2% |
| Black / African American | 3,177 | 1.8% |
| Hawaiian / Pacific | 762 | 0.4% |
| Hispanic or Latino | 60,515 | 34.0% |
| Native / Alaskan | 2,049 | 1.1% |
| White / Caucasian | 107,027 | 60.1% |
| Two or more Races | 19,634 | 11.0% |
| Some other Race | 34,591 | 19.4% |
| Total | 178,221 | 100.0% |
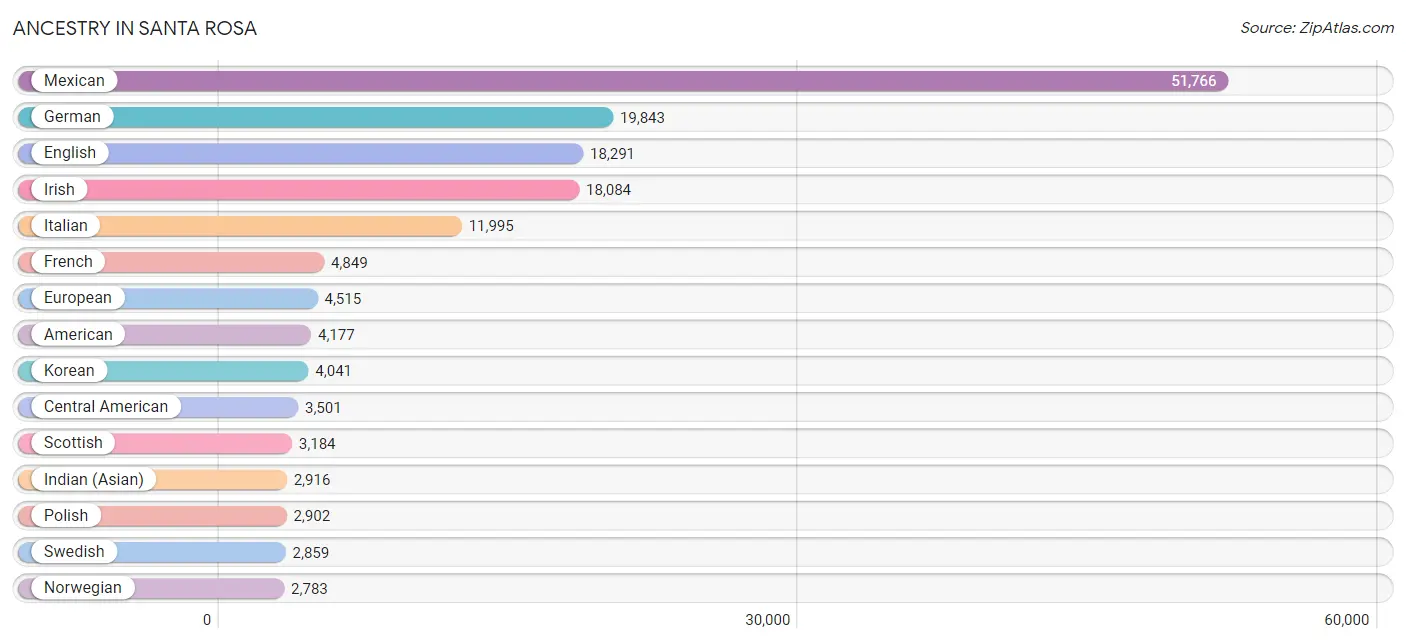
Ancestry in Santa Rosa
The most populous ancestries reported in Santa Rosa are Mexican (51,766 | 29.0%), German (19,843 | 11.1%), English (18,291 | 10.3%), Irish (18,084 | 10.2%), and Italian (11,995 | 6.7%), together accounting for 67.3% of all Santa Rosa residents.
| Ancestry | # Population | % Population |
| Afghan | 28 | 0.0% |
| African | 183 | 0.1% |
| Alaska Native | 88 | 0.1% |
| Aleut | 26 | 0.0% |
| American | 4,177 | 2.3% |
| Apache | 152 | 0.1% |
| Arab | 798 | 0.4% |
| Argentinean | 48 | 0.0% |
| Armenian | 308 | 0.2% |
| Assyrian / Chaldean / Syriac | 71 | 0.0% |
| Australian | 93 | 0.1% |
| Austrian | 646 | 0.4% |
| Bangladeshi | 18 | 0.0% |
| Basque | 323 | 0.2% |
| Belgian | 149 | 0.1% |
| Bhutanese | 1,120 | 0.6% |
| Blackfeet | 212 | 0.1% |
| Bolivian | 7 | 0.0% |
| Brazilian | 104 | 0.1% |
| British | 1,403 | 0.8% |
| Bulgarian | 107 | 0.1% |
| Burmese | 1,010 | 0.6% |
| Cajun | 48 | 0.0% |
| Canadian | 622 | 0.4% |
| Cape Verdean | 12 | 0.0% |
| Celtic | 55 | 0.0% |
| Central American | 3,501 | 2.0% |
| Central American Indian | 476 | 0.3% |
| Cherokee | 428 | 0.2% |
| Cheyenne | 92 | 0.1% |
| Chickasaw | 18 | 0.0% |
| Chilean | 75 | 0.0% |
| Chinese | 86 | 0.1% |
| Chippewa | 112 | 0.1% |
| Choctaw | 186 | 0.1% |
| Colombian | 268 | 0.2% |
| Colville | 9 | 0.0% |
| Costa Rican | 55 | 0.0% |
| Cree | 9 | 0.0% |
| Creek | 19 | 0.0% |
| Croatian | 163 | 0.1% |
| Cuban | 116 | 0.1% |
| Czech | 393 | 0.2% |
| Czechoslovakian | 81 | 0.1% |
| Danish | 1,944 | 1.1% |
| Delaware | 70 | 0.0% |
| Dutch | 1,955 | 1.1% |
| Eastern European | 644 | 0.4% |
| Ecuadorian | 157 | 0.1% |
| Egyptian | 73 | 0.0% |
| English | 18,291 | 10.3% |
| Estonian | 61 | 0.0% |
| Ethiopian | 239 | 0.1% |
| European | 4,515 | 2.5% |
| Filipino | 303 | 0.2% |
| Finnish | 513 | 0.3% |
| French | 4,849 | 2.7% |
| French American Indian | 18 | 0.0% |
| French Canadian | 374 | 0.2% |
| German | 19,843 | 11.1% |
| Greek | 936 | 0.5% |
| Guamanian / Chamorro | 196 | 0.1% |
| Guatemalan | 648 | 0.4% |
| Guyanese | 8 | 0.0% |
| Haitian | 43 | 0.0% |
| Honduran | 164 | 0.1% |
| Hopi | 30 | 0.0% |
| Hungarian | 704 | 0.4% |
| Icelander | 16 | 0.0% |
| Indian (Asian) | 2,916 | 1.6% |
| Indonesian | 53 | 0.0% |
| Iranian | 179 | 0.1% |
| Irish | 18,084 | 10.2% |
| Iroquois | 102 | 0.1% |
| Israeli | 21 | 0.0% |
| Italian | 11,995 | 6.7% |
| Jamaican | 148 | 0.1% |
| Japanese | 706 | 0.4% |
| Jordanian | 257 | 0.1% |
| Kenyan | 237 | 0.1% |
| Korean | 4,041 | 2.3% |
| Laotian | 91 | 0.1% |
| Latvian | 138 | 0.1% |
| Lebanese | 297 | 0.2% |
| Liberian | 17 | 0.0% |
| Lithuanian | 180 | 0.1% |
| Luxembourger | 5 | 0.0% |
| Malaysian | 616 | 0.4% |
| Maltese | 24 | 0.0% |
| Mexican | 51,766 | 29.0% |
| Mexican American Indian | 1,767 | 1.0% |
| Moroccan | 15 | 0.0% |
| Native Hawaiian | 603 | 0.3% |
| Navajo | 132 | 0.1% |
| Nicaraguan | 356 | 0.2% |
| Nigerian | 33 | 0.0% |
| Northern European | 758 | 0.4% |
| Norwegian | 2,783 | 1.6% |
| Osage | 191 | 0.1% |
| Ottawa | 112 | 0.1% |
| Paiute | 10 | 0.0% |
| Pakistani | 107 | 0.1% |
| Palestinian | 205 | 0.1% |
| Panamanian | 133 | 0.1% |
| Pennsylvania German | 27 | 0.0% |
| Peruvian | 217 | 0.1% |
| Pima | 31 | 0.0% |
| Polish | 2,902 | 1.6% |
| Portuguese | 2,393 | 1.3% |
| Pueblo | 29 | 0.0% |
| Puerto Rican | 1,027 | 0.6% |
| Romanian | 202 | 0.1% |
| Russian | 1,939 | 1.1% |
| Salvadoran | 2,128 | 1.2% |
| Samoan | 78 | 0.0% |
| Scandinavian | 1,245 | 0.7% |
| Scotch-Irish | 1,545 | 0.9% |
| Scottish | 3,184 | 1.8% |
| Seminole | 39 | 0.0% |
| Serbian | 82 | 0.1% |
| Shoshone | 269 | 0.2% |
| Sierra Leonean | 41 | 0.0% |
| Sioux | 94 | 0.1% |
| Slavic | 72 | 0.0% |
| Slovak | 22 | 0.0% |
| Slovene | 21 | 0.0% |
| South African | 26 | 0.0% |
| South American | 794 | 0.4% |
| South American Indian | 33 | 0.0% |
| Spaniard | 1,053 | 0.6% |
| Spanish | 1,120 | 0.6% |
| Spanish American Indian | 7 | 0.0% |
| Sri Lankan | 2,181 | 1.2% |
| Subsaharan African | 1,221 | 0.7% |
| Swedish | 2,859 | 1.6% |
| Swiss | 805 | 0.4% |
| Syrian | 20 | 0.0% |
| Thai | 1,657 | 0.9% |
| Trinidadian and Tobagonian | 8 | 0.0% |
| Turkish | 3 | 0.0% |
| Ugandan | 284 | 0.2% |
| Ukrainian | 335 | 0.2% |
| Venezuelan | 22 | 0.0% |
| Welsh | 1,470 | 0.8% |
| Yaqui | 39 | 0.0% |
| Yugoslavian | 199 | 0.1% | View All 146 Rows |
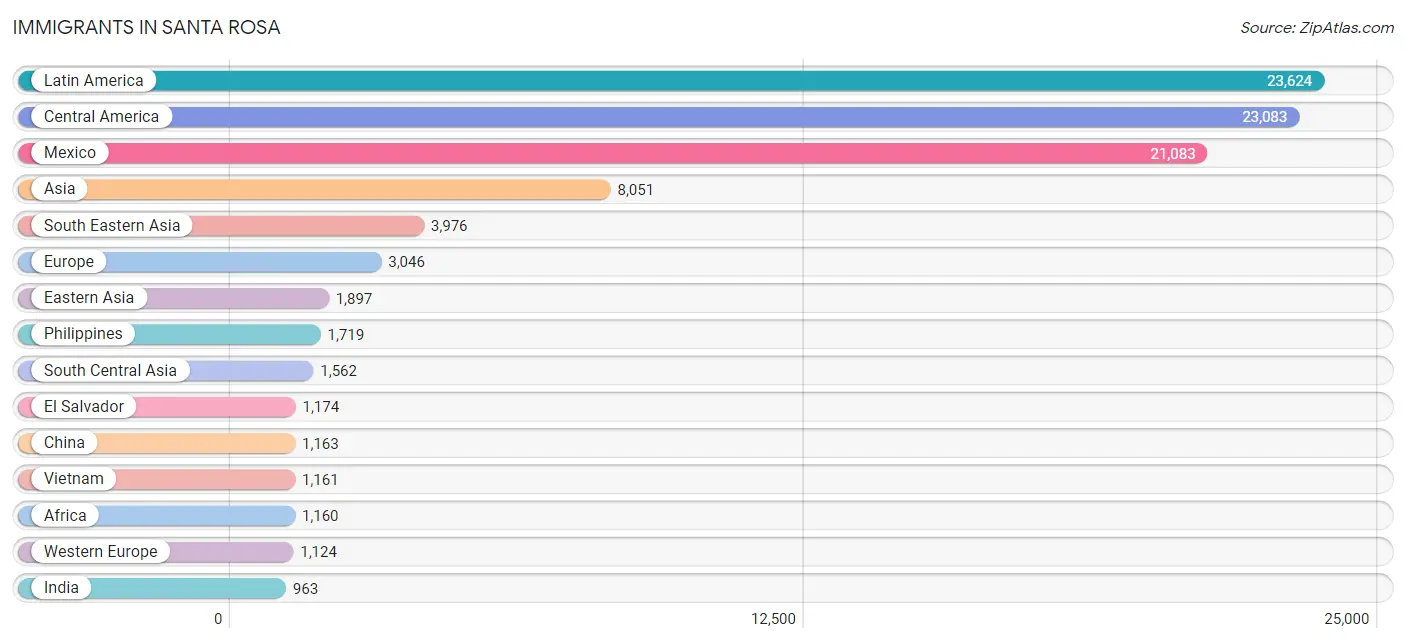
Immigrants in Santa Rosa
The most numerous immigrant groups reported in Santa Rosa came from Latin America (23,624 | 13.3%), Central America (23,083 | 13.0%), Mexico (21,083 | 11.8%), Asia (8,051 | 4.5%), and South Eastern Asia (3,976 | 2.2%), together accounting for 44.8% of all Santa Rosa residents.
| Immigration Origin | # Population | % Population |
| Africa | 1,160 | 0.6% |
| Argentina | 24 | 0.0% |
| Armenia | 14 | 0.0% |
| Asia | 8,051 | 4.5% |
| Australia | 73 | 0.0% |
| Austria | 45 | 0.0% |
| Belgium | 12 | 0.0% |
| Bosnia and Herzegovina | 22 | 0.0% |
| Brazil | 116 | 0.1% |
| Bulgaria | 59 | 0.0% |
| Cambodia | 518 | 0.3% |
| Cameroon | 17 | 0.0% |
| Canada | 597 | 0.3% |
| Caribbean | 37 | 0.0% |
| Central America | 23,083 | 13.0% |
| Chile | 37 | 0.0% |
| China | 1,163 | 0.6% |
| Colombia | 14 | 0.0% |
| Costa Rica | 27 | 0.0% |
| Cuba | 15 | 0.0% |
| Czechoslovakia | 12 | 0.0% |
| Denmark | 84 | 0.1% |
| Eastern Africa | 778 | 0.4% |
| Eastern Asia | 1,897 | 1.1% |
| Eastern Europe | 607 | 0.3% |
| Ecuador | 79 | 0.0% |
| El Salvador | 1,174 | 0.7% |
| England | 271 | 0.2% |
| Eritrea | 180 | 0.1% |
| Ethiopia | 27 | 0.0% |
| Europe | 3,046 | 1.7% |
| Fiji | 484 | 0.3% |
| France | 138 | 0.1% |
| Germany | 609 | 0.3% |
| Guatemala | 522 | 0.3% |
| Guyana | 8 | 0.0% |
| Haiti | 22 | 0.0% |
| Honduras | 45 | 0.0% |
| Hong Kong | 33 | 0.0% |
| Hungary | 28 | 0.0% |
| India | 963 | 0.5% |
| Indonesia | 26 | 0.0% |
| Iran | 178 | 0.1% |
| Iraq | 23 | 0.0% |
| Ireland | 113 | 0.1% |
| Israel | 38 | 0.0% |
| Italy | 93 | 0.1% |
| Japan | 191 | 0.1% |
| Jordan | 333 | 0.2% |
| Kenya | 324 | 0.2% |
| Korea | 543 | 0.3% |
| Kuwait | 72 | 0.0% |
| Laos | 221 | 0.1% |
| Latin America | 23,624 | 13.3% |
| Lebanon | 26 | 0.0% |
| Liberia | 17 | 0.0% |
| Lithuania | 49 | 0.0% |
| Malaysia | 9 | 0.0% |
| Mexico | 21,083 | 11.8% |
| Middle Africa | 109 | 0.1% |
| Moldova | 25 | 0.0% |
| Morocco | 17 | 0.0% |
| Nepal | 387 | 0.2% |
| Netherlands | 240 | 0.1% |
| Nicaragua | 119 | 0.1% |
| Northern Africa | 17 | 0.0% |
| Northern Europe | 896 | 0.5% |
| Norway | 14 | 0.0% |
| Oceania | 623 | 0.4% |
| Pakistan | 22 | 0.0% |
| Panama | 85 | 0.1% |
| Peru | 204 | 0.1% |
| Philippines | 1,719 | 1.0% |
| Poland | 94 | 0.1% |
| Portugal | 106 | 0.1% |
| Romania | 106 | 0.1% |
| Russia | 109 | 0.1% |
| Saudi Arabia | 10 | 0.0% |
| Scotland | 36 | 0.0% |
| Sierra Leone | 20 | 0.0% |
| Somalia | 41 | 0.0% |
| South Africa | 72 | 0.0% |
| South America | 504 | 0.3% |
| South Central Asia | 1,562 | 0.9% |
| South Eastern Asia | 3,976 | 2.2% |
| Southern Europe | 419 | 0.2% |
| Spain | 220 | 0.1% |
| Sweden | 77 | 0.0% |
| Switzerland | 80 | 0.0% |
| Taiwan | 373 | 0.2% |
| Thailand | 250 | 0.1% |
| Turkey | 80 | 0.0% |
| Uganda | 197 | 0.1% |
| Ukraine | 92 | 0.1% |
| Venezuela | 22 | 0.0% |
| Vietnam | 1,161 | 0.6% |
| Western Africa | 184 | 0.1% |
| Western Asia | 603 | 0.3% |
| Western Europe | 1,124 | 0.6% |
| Zimbabwe | 9 | 0.0% | View All 100 Rows |
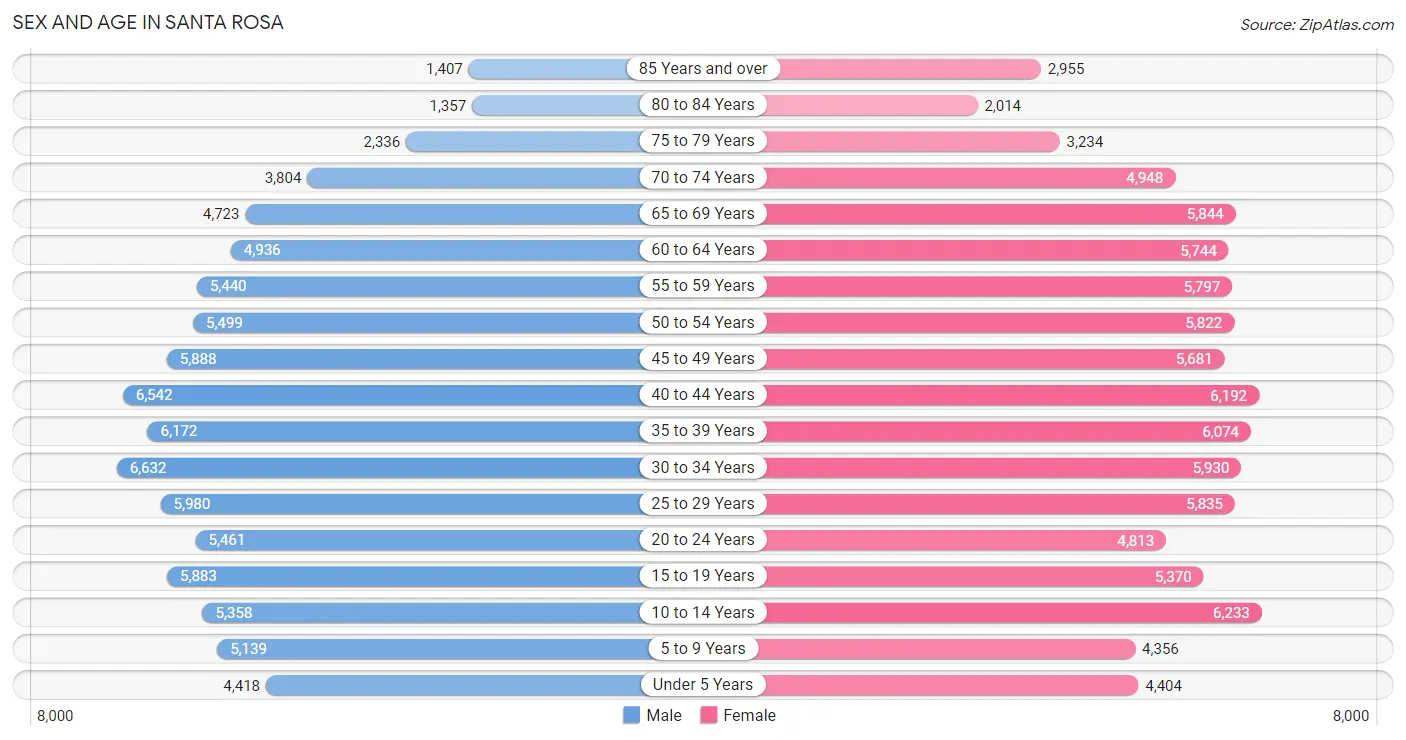
Sex and Age in Santa Rosa
Sex and Age in Santa Rosa
The most populous age groups in Santa Rosa are 30 to 34 Years (6,632 | 7.6%) for men and 10 to 14 Years (6,233 | 6.8%) for women.
| Age Bracket | Male | Female |
| Under 5 Years | 4,418 (5.1%) | 4,404 (4.8%) |
| 5 to 9 Years | 5,139 (5.9%) | 4,356 (4.8%) |
| 10 to 14 Years | 5,358 (6.2%) | 6,233 (6.8%) |
| 15 to 19 Years | 5,883 (6.8%) | 5,370 (5.9%) |
| 20 to 24 Years | 5,461 (6.3%) | 4,813 (5.3%) |
| 25 to 29 Years | 5,980 (6.9%) | 5,835 (6.4%) |
| 30 to 34 Years | 6,632 (7.6%) | 5,930 (6.5%) |
| 35 to 39 Years | 6,172 (7.1%) | 6,074 (6.7%) |
| 40 to 44 Years | 6,542 (7.5%) | 6,192 (6.8%) |
| 45 to 49 Years | 5,888 (6.8%) | 5,681 (6.2%) |
| 50 to 54 Years | 5,499 (6.3%) | 5,822 (6.4%) |
| 55 to 59 Years | 5,440 (6.2%) | 5,797 (6.4%) |
| 60 to 64 Years | 4,936 (5.7%) | 5,744 (6.3%) |
| 65 to 69 Years | 4,723 (5.4%) | 5,844 (6.4%) |
| 70 to 74 Years | 3,804 (4.4%) | 4,948 (5.4%) |
| 75 to 79 Years | 2,336 (2.7%) | 3,234 (3.5%) |
| 80 to 84 Years | 1,357 (1.6%) | 2,014 (2.2%) |
| 85 Years and over | 1,407 (1.6%) | 2,955 (3.2%) |
| Total | 86,975 (100.0%) | 91,246 (100.0%) |
Families and Households in Santa Rosa
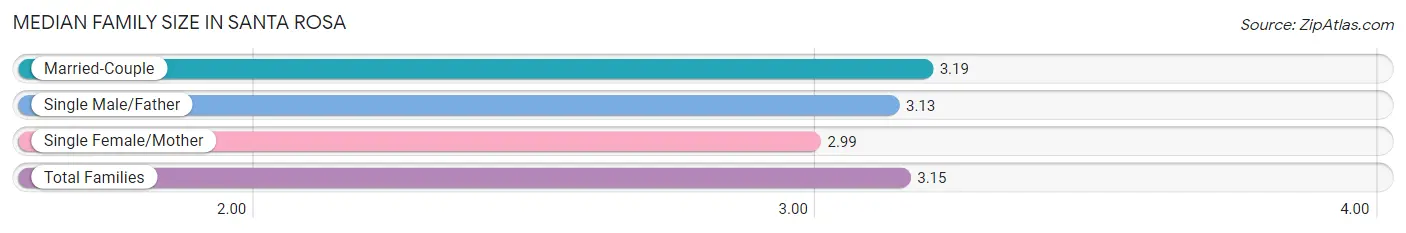
Median Family Size in Santa Rosa
The median family size in Santa Rosa is 3.15 persons per family, with married-couple families (31,180 | 73.6%) accounting for the largest median family size of 3.19 persons per family. On the other hand, single female/mother families (7,152 | 16.9%) represent the smallest median family size with 2.99 persons per family.
| Family Type | # Families | Family Size |
| Married-Couple | 31,180 (73.6%) | 3.19 |
| Single Male/Father | 4,012 (9.5%) | 3.13 |
| Single Female/Mother | 7,152 (16.9%) | 2.99 |
| Total Families | 42,344 (100.0%) | 3.15 |
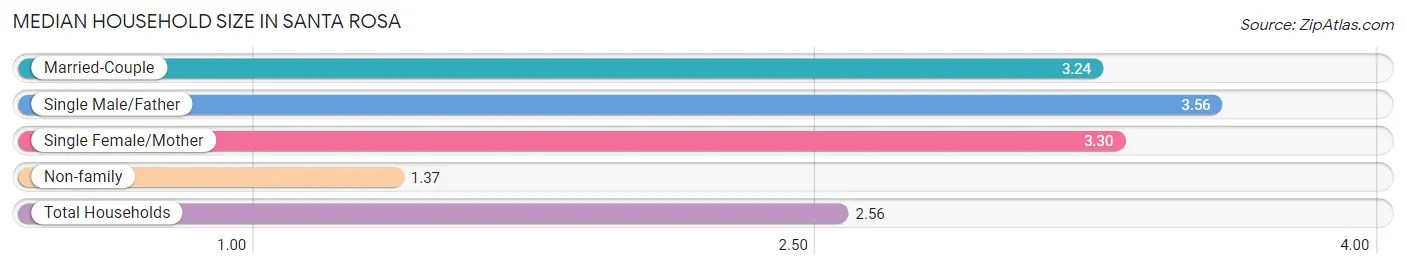
Median Household Size in Santa Rosa
The median household size in Santa Rosa is 2.56 persons per household, with single male/father households (4,012 | 5.9%) accounting for the largest median household size of 3.56 persons per household. non-family households (25,752 | 37.8%) represent the smallest median household size with 1.37 persons per household.
| Household Type | # Households | Household Size |
| Married-Couple | 31,180 (45.8%) | 3.24 |
| Single Male/Father | 4,012 (5.9%) | 3.56 |
| Single Female/Mother | 7,152 (10.5%) | 3.30 |
| Non-family | 25,752 (37.8%) | 1.37 |
| Total Households | 68,096 (100.0%) | 2.56 |
Household Size by Marriage Status in Santa Rosa
Out of a total of 68,096 households in Santa Rosa, 42,344 (62.2%) are family households, while 25,752 (37.8%) are nonfamily households. The most numerous type of family households are 2-person households, comprising 17,066, and the most common type of nonfamily households are 1-person households, comprising 18,878.
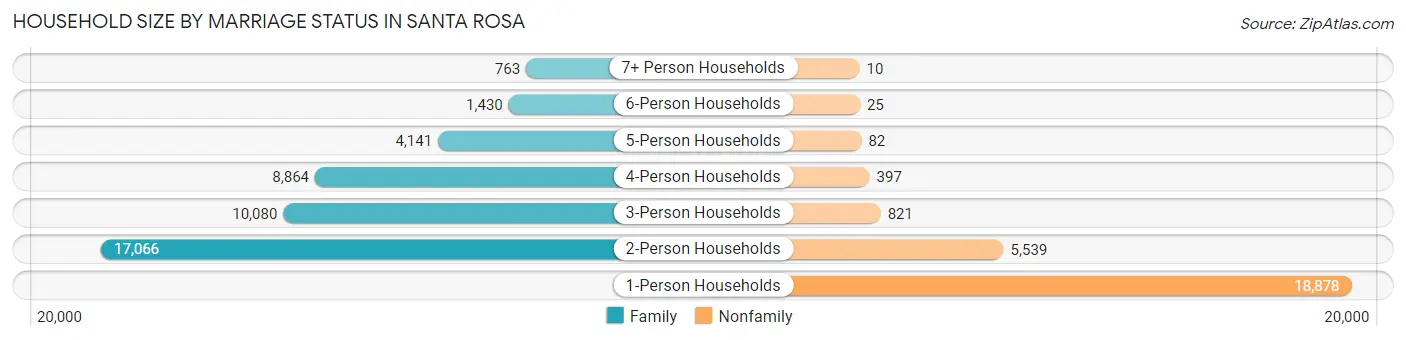
| Household Size | Family Households | Nonfamily Households |
| 1-Person Households | - | 18,878 (27.7%) |
| 2-Person Households | 17,066 (25.1%) | 5,539 (8.1%) |
| 3-Person Households | 10,080 (14.8%) | 821 (1.2%) |
| 4-Person Households | 8,864 (13.0%) | 397 (0.6%) |
| 5-Person Households | 4,141 (6.1%) | 82 (0.1%) |
| 6-Person Households | 1,430 (2.1%) | 25 (0.0%) |
| 7+ Person Households | 763 (1.1%) | 10 (0.0%) |
| Total | 42,344 (62.2%) | 25,752 (37.8%) |
Female Fertility in Santa Rosa
Fertility by Age in Santa Rosa
Average fertility rate in Santa Rosa is 44.0 births per 1,000 women. Women in the age bracket of 20 to 34 years have the highest fertility rate with 68.0 births per 1,000 women. Women in the age bracket of 20 to 34 years acount for 62.2% of all women with births.
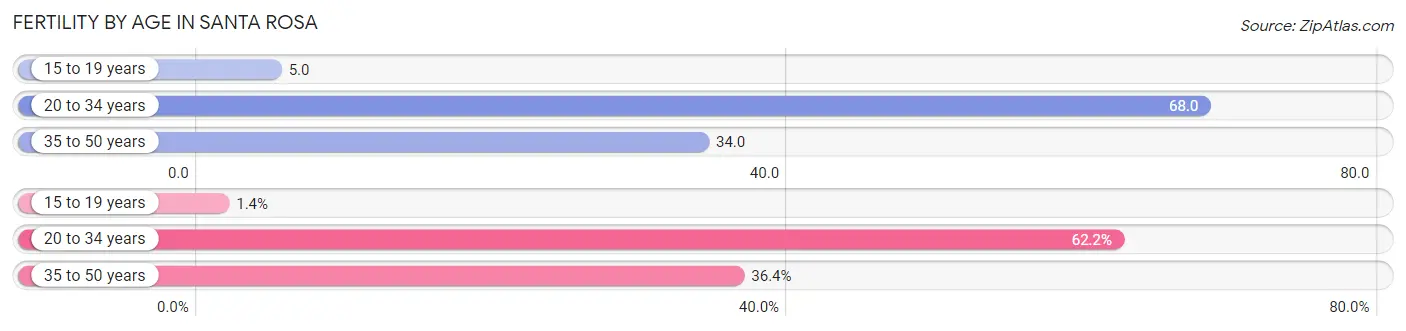
| Age Bracket | Women with Births | Births / 1,000 Women |
| 15 to 19 years | 26 (1.4%) | 5.0 |
| 20 to 34 years | 1,120 (62.2%) | 68.0 |
| 35 to 50 years | 656 (36.4%) | 34.0 |
| Total | 1,802 (100.0%) | 44.0 |
Fertility by Age by Marriage Status in Santa Rosa
66.7% of women with births (1,802) in Santa Rosa are married. The highest percentage of unmarried women with births falls into 15 to 19 years age bracket with 100.0% of them unmarried at the time of birth, while the lowest percentage of unmarried women with births belong to 35 to 50 years age bracket with 16.3% of them unmarried.
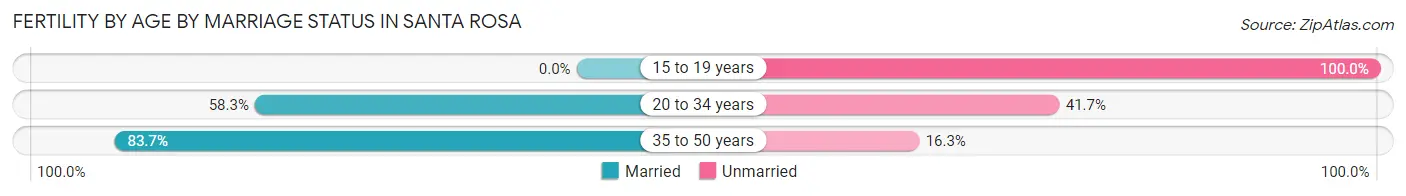
| Age Bracket | Married | Unmarried |
| 15 to 19 years | 0 (0.0%) | 26 (100.0%) |
| 20 to 34 years | 653 (58.3%) | 467 (41.7%) |
| 35 to 50 years | 549 (83.7%) | 107 (16.3%) |
| Total | 1,202 (66.7%) | 600 (33.3%) |
Fertility by Education in Santa Rosa
Average fertility rate in Santa Rosa is 44.0 births per 1,000 women. Women with the education attainment of graduate degree have the highest fertility rate of 61.0 births per 1,000 women, while women with the education attainment of less than high school have the lowest fertility at 13.0 births per 1,000 women. Women with the education attainment of college or associate's degree represent 45.1% of all women with births.
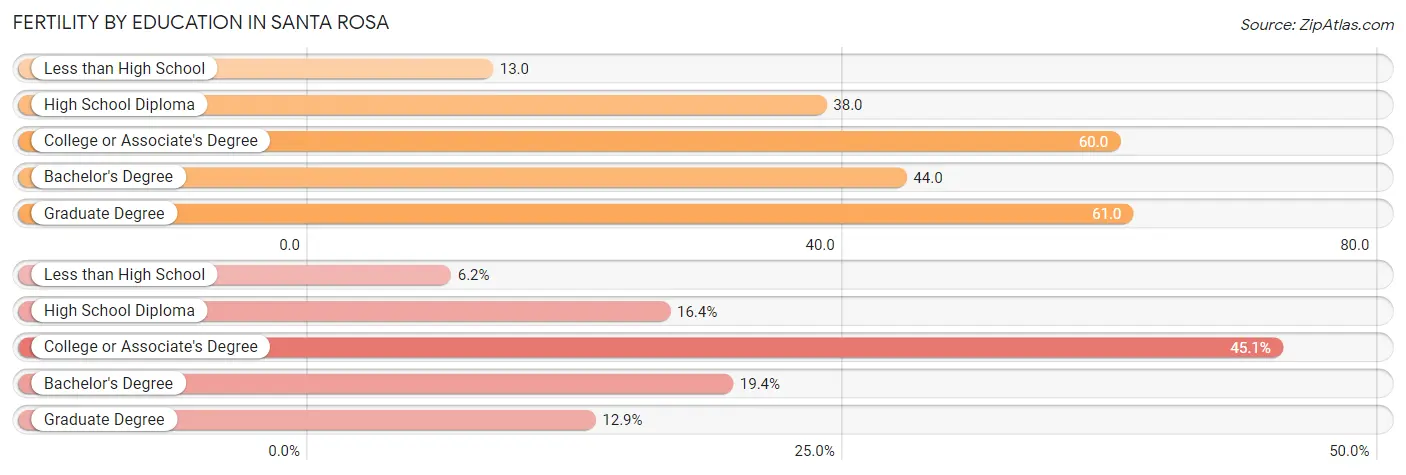
| Educational Attainment | Women with Births | Births / 1,000 Women |
| Less than High School | 111 (6.2%) | 13.0 |
| High School Diploma | 296 (16.4%) | 38.0 |
| College or Associate's Degree | 813 (45.1%) | 60.0 |
| Bachelor's Degree | 349 (19.4%) | 44.0 |
| Graduate Degree | 233 (12.9%) | 61.0 |
| Total | 1,802 (100.0%) | 44.0 |
Fertility by Education by Marriage Status in Santa Rosa
33.3% of women with births in Santa Rosa are unmarried. Women with the educational attainment of graduate degree are most likely to be married with 81.1% of them married at childbirth, while women with the educational attainment of less than high school are least likely to be married with 50.4% of them unmarried at childbirth.
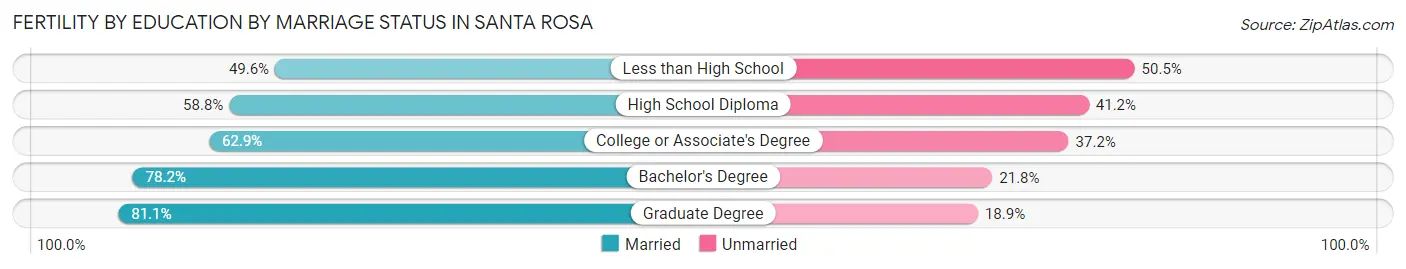
| Educational Attainment | Married | Unmarried |
| Less than High School | 55 (49.5%) | 56 (50.4%) |
| High School Diploma | 174 (58.8%) | 122 (41.2%) |
| College or Associate's Degree | 511 (62.8%) | 302 (37.1%) |
| Bachelor's Degree | 273 (78.2%) | 76 (21.8%) |
| Graduate Degree | 189 (81.1%) | 44 (18.9%) |
| Total | 1,202 (66.7%) | 600 (33.3%) |
Employment Characteristics in Santa Rosa
Employment by Class of Employer in Santa Rosa
Among the 89,060 employed individuals in Santa Rosa, private company employees (57,999 | 65.1%), not-for-profit organizations (8,777 | 9.9%), and local government employees (7,701 | 8.6%) make up the most common classes of employment.
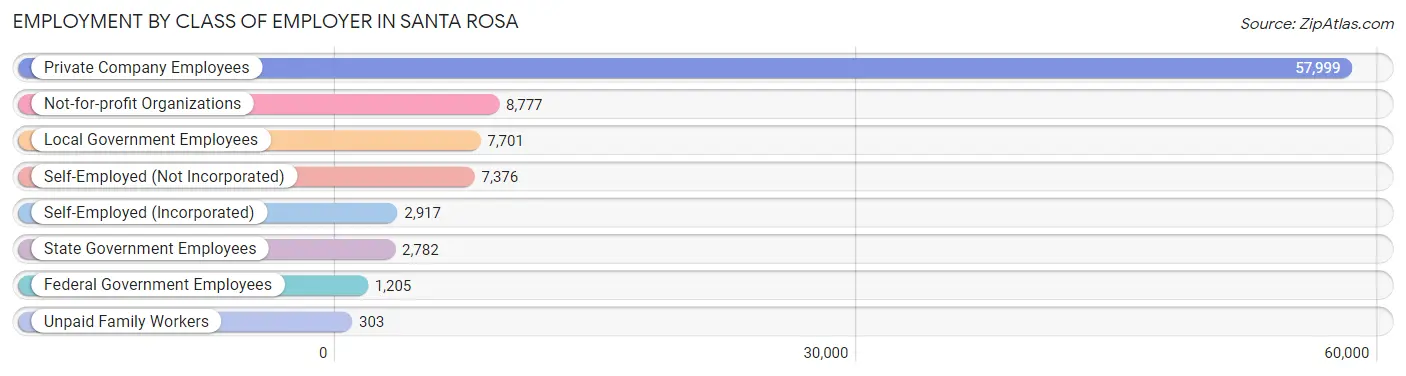
| Employer Class | # Employees | % Employees |
| Private Company Employees | 57,999 | 65.1% |
| Self-Employed (Incorporated) | 2,917 | 3.3% |
| Self-Employed (Not Incorporated) | 7,376 | 8.3% |
| Not-for-profit Organizations | 8,777 | 9.9% |
| Local Government Employees | 7,701 | 8.6% |
| State Government Employees | 2,782 | 3.1% |
| Federal Government Employees | 1,205 | 1.3% |
| Unpaid Family Workers | 303 | 0.3% |
| Total | 89,060 | 100.0% |
Employment Status by Age in Santa Rosa
According to the labor force statistics for Santa Rosa, out of the total population over 16 years of age (146,022), 66.4% or 96,959 individuals are in the labor force, with 5.6% or 5,430 of them unemployed. The age group with the highest labor force participation rate is 30 to 34 years, with 87.5% or 10,992 individuals in the labor force. Within the labor force, the 20 to 24 years age range has the highest percentage of unemployed individuals, with 10.2% or 859 of them being unemployed.
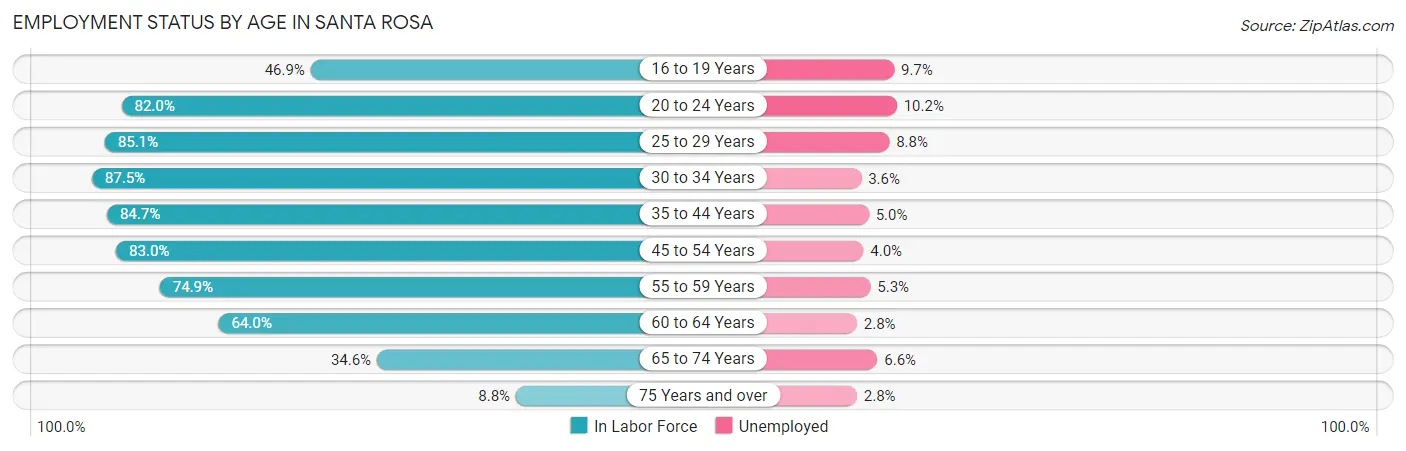
| Age Bracket | In Labor Force | Unemployed |
| 16 to 19 Years | 4,203 (46.9%) | 408 (9.7%) |
| 20 to 24 Years | 8,425 (82.0%) | 859 (10.2%) |
| 25 to 29 Years | 10,055 (85.1%) | 885 (8.8%) |
| 30 to 34 Years | 10,992 (87.5%) | 396 (3.6%) |
| 35 to 44 Years | 21,158 (84.7%) | 1,058 (5.0%) |
| 45 to 54 Years | 18,999 (83.0%) | 760 (4.0%) |
| 55 to 59 Years | 8,417 (74.9%) | 446 (5.3%) |
| 60 to 64 Years | 6,835 (64.0%) | 191 (2.8%) |
| 65 to 74 Years | 6,684 (34.6%) | 441 (6.6%) |
| 75 Years and over | 1,171 (8.8%) | 33 (2.8%) |
| Total | 96,959 (66.4%) | 5,430 (5.6%) |
Employment Status by Educational Attainment in Santa Rosa
According to labor force statistics for Santa Rosa, 81.2% of individuals (76,461) out of the total population between 25 and 64 years of age (94,164) are in the labor force, with 4.9% or 3,747 of them being unemployed. The group with the highest labor force participation rate are those with the educational attainment of bachelor's degree or higher, with 89.0% or 26,857 individuals in the labor force. Within the labor force, individuals with less than high school education have the highest percentage of unemployment, with 6.9% or 727 of them being unemployed.
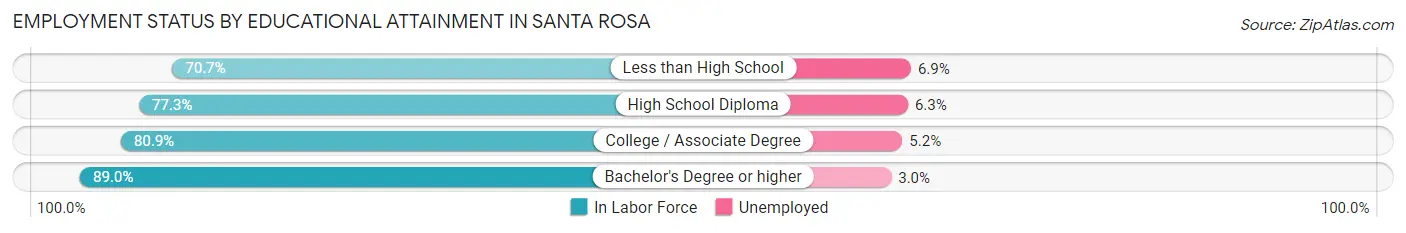
| Educational Attainment | In Labor Force | Unemployed |
| Less than High School | 10,539 (70.7%) | 1,029 (6.9%) |
| High School Diploma | 14,050 (77.3%) | 1,145 (6.3%) |
| College / Associate Degree | 25,002 (80.9%) | 1,607 (5.2%) |
| Bachelor's Degree or higher | 26,857 (89.0%) | 905 (3.0%) |
| Total | 76,461 (81.2%) | 4,614 (4.9%) |
Employment Occupations by Sex in Santa Rosa
Management, Business, Science and Arts Occupations
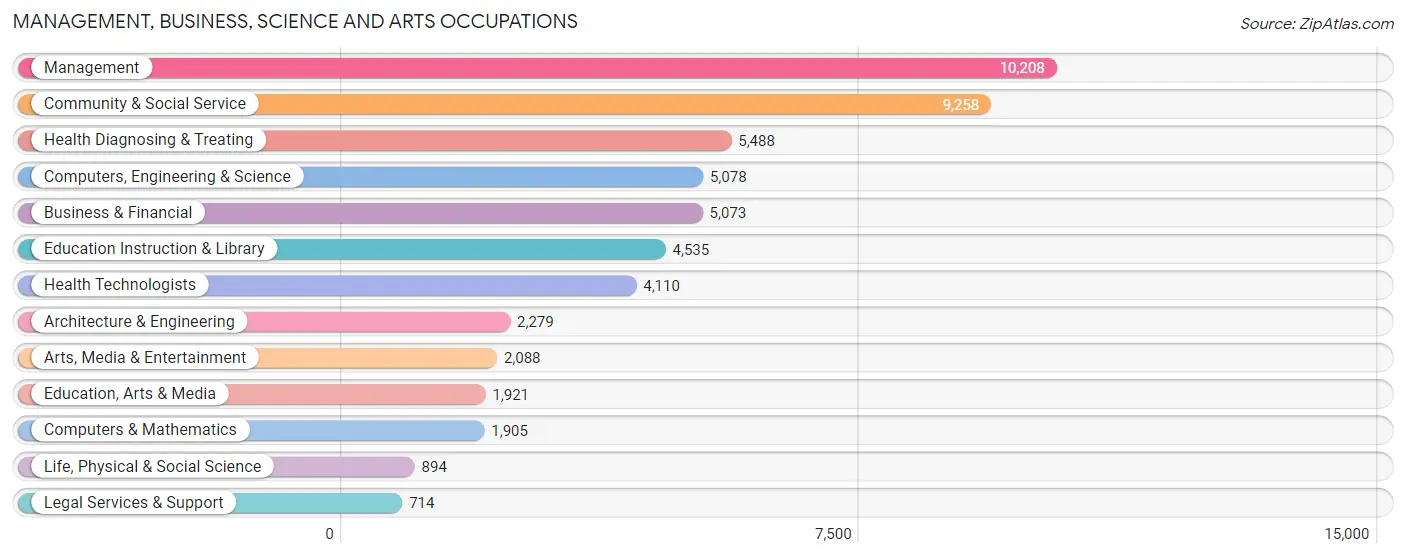
The most common Management, Business, Science and Arts occupations in Santa Rosa are Management (10,208 | 11.2%), Community & Social Service (9,258 | 10.2%), Health Diagnosing & Treating (5,488 | 6.0%), Computers, Engineering & Science (5,078 | 5.6%), and Business & Financial (5,073 | 5.6%).
Management, Business, Science and Arts Occupations by Sex
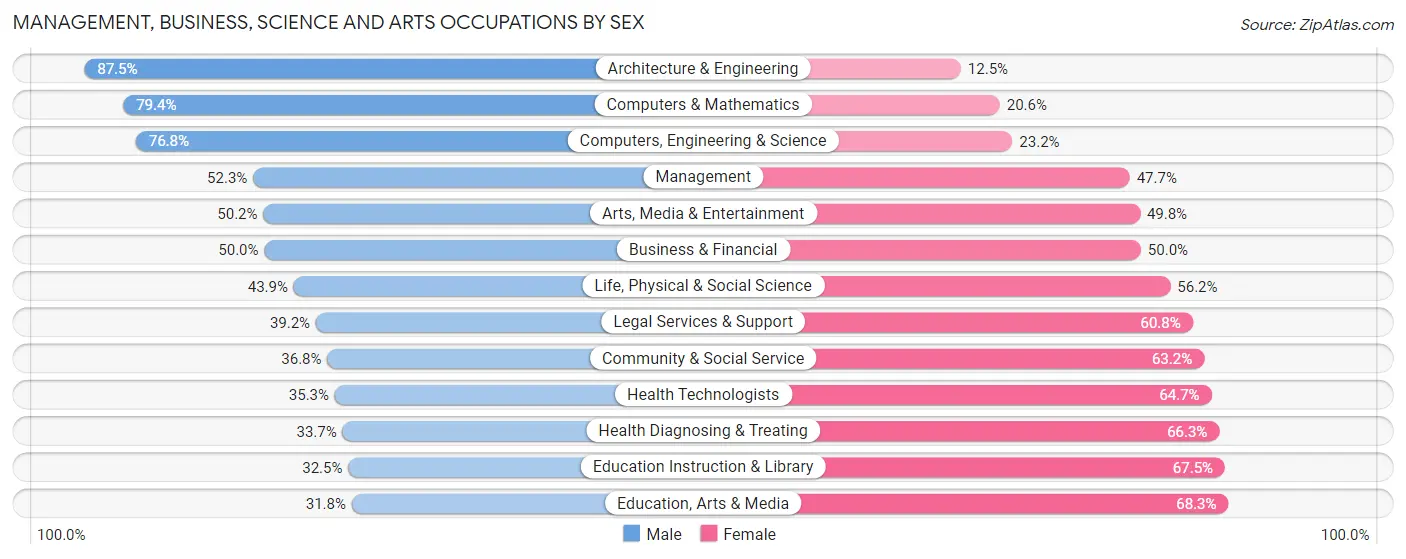
Within the Management, Business, Science and Arts occupations in Santa Rosa, the most male-oriented occupations are Architecture & Engineering (87.5%), Computers & Mathematics (79.4%), and Computers, Engineering & Science (76.8%), while the most female-oriented occupations are Education, Arts & Media (68.2%), Education Instruction & Library (67.5%), and Health Diagnosing & Treating (66.3%).
| Occupation | Male | Female |
| Management | 5,341 (52.3%) | 4,867 (47.7%) |
| Business & Financial | 2,536 (50.0%) | 2,537 (50.0%) |
| Computers, Engineering & Science | 3,900 (76.8%) | 1,178 (23.2%) |
| Computers & Mathematics | 1,513 (79.4%) | 392 (20.6%) |
| Architecture & Engineering | 1,995 (87.5%) | 284 (12.5%) |
| Life, Physical & Social Science | 392 (43.9%) | 502 (56.1%) |
| Community & Social Service | 3,411 (36.8%) | 5,847 (63.2%) |
| Education, Arts & Media | 610 (31.8%) | 1,311 (68.2%) |
| Legal Services & Support | 280 (39.2%) | 434 (60.8%) |
| Education Instruction & Library | 1,473 (32.5%) | 3,062 (67.5%) |
| Arts, Media & Entertainment | 1,048 (50.2%) | 1,040 (49.8%) |
| Health Diagnosing & Treating | 1,848 (33.7%) | 3,640 (66.3%) |
| Health Technologists | 1,450 (35.3%) | 2,660 (64.7%) |
| Total (Category) | 17,036 (48.5%) | 18,069 (51.5%) |
| Total (Overall) | 48,275 (52.9%) | 42,929 (47.1%) |
Services Occupations
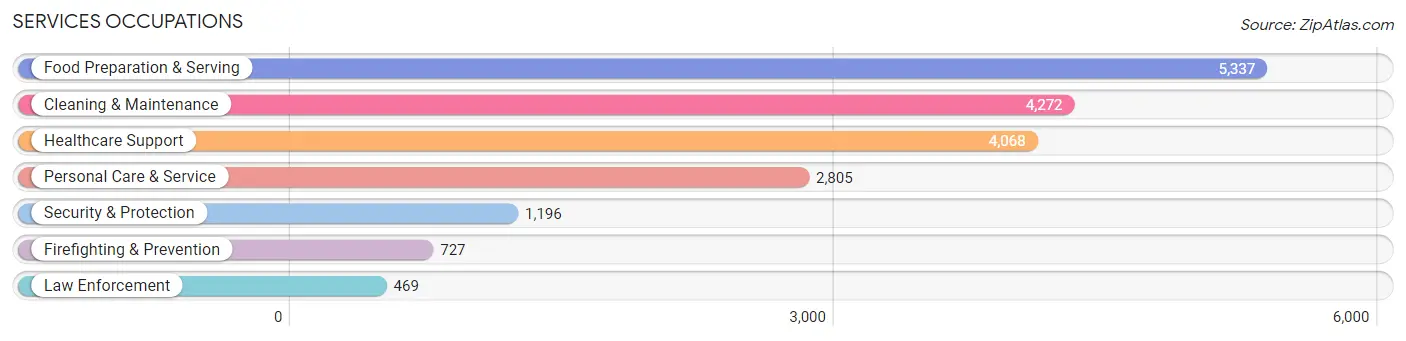
The most common Services occupations in Santa Rosa are Food Preparation & Serving (5,337 | 5.9%), Cleaning & Maintenance (4,272 | 4.7%), Healthcare Support (4,068 | 4.5%), Personal Care & Service (2,805 | 3.1%), and Security & Protection (1,196 | 1.3%).
Services Occupations by Sex
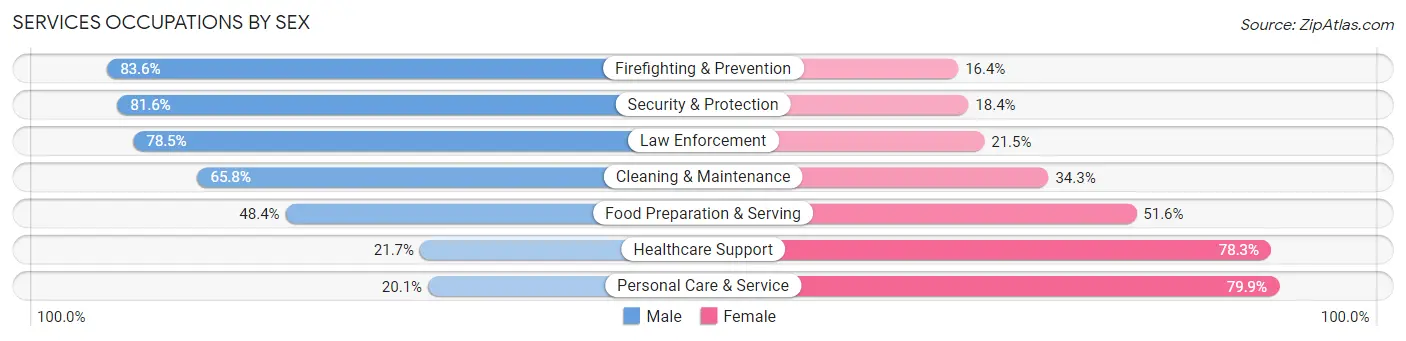
Within the Services occupations in Santa Rosa, the most male-oriented occupations are Firefighting & Prevention (83.6%), Security & Protection (81.6%), and Law Enforcement (78.5%), while the most female-oriented occupations are Personal Care & Service (79.9%), Healthcare Support (78.3%), and Food Preparation & Serving (51.6%).
| Occupation | Male | Female |
| Healthcare Support | 884 (21.7%) | 3,184 (78.3%) |
| Security & Protection | 976 (81.6%) | 220 (18.4%) |
| Firefighting & Prevention | 608 (83.6%) | 119 (16.4%) |
| Law Enforcement | 368 (78.5%) | 101 (21.5%) |
| Food Preparation & Serving | 2,581 (48.4%) | 2,756 (51.6%) |
| Cleaning & Maintenance | 2,809 (65.7%) | 1,463 (34.3%) |
| Personal Care & Service | 565 (20.1%) | 2,240 (79.9%) |
| Total (Category) | 7,815 (44.2%) | 9,863 (55.8%) |
| Total (Overall) | 48,275 (52.9%) | 42,929 (47.1%) |
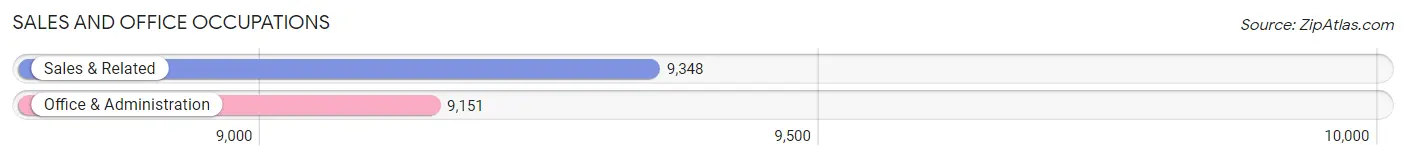
Sales and Office Occupations
The most common Sales and Office occupations in Santa Rosa are Sales & Related (9,348 | 10.2%), and Office & Administration (9,151 | 10.0%).
Sales and Office Occupations by Sex
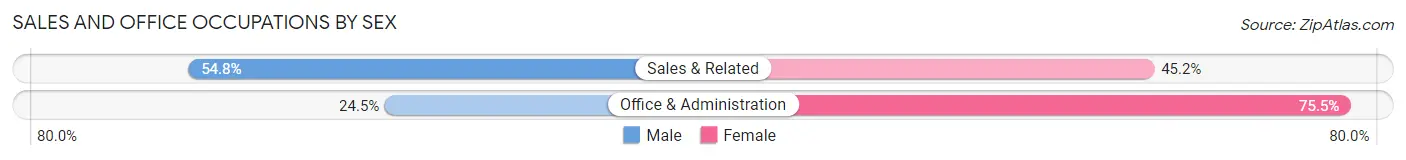
| Occupation | Male | Female |
| Sales & Related | 5,125 (54.8%) | 4,223 (45.2%) |
| Office & Administration | 2,245 (24.5%) | 6,906 (75.5%) |
| Total (Category) | 7,370 (39.8%) | 11,129 (60.2%) |
| Total (Overall) | 48,275 (52.9%) | 42,929 (47.1%) |
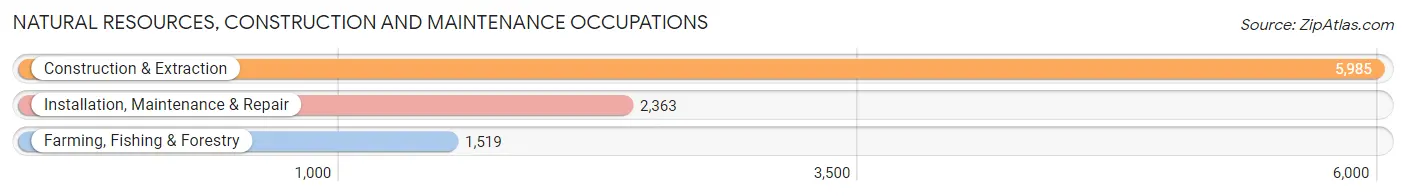
Natural Resources, Construction and Maintenance Occupations
The most common Natural Resources, Construction and Maintenance occupations in Santa Rosa are Construction & Extraction (5,985 | 6.6%), Installation, Maintenance & Repair (2,363 | 2.6%), and Farming, Fishing & Forestry (1,519 | 1.7%).
Natural Resources, Construction and Maintenance Occupations by Sex
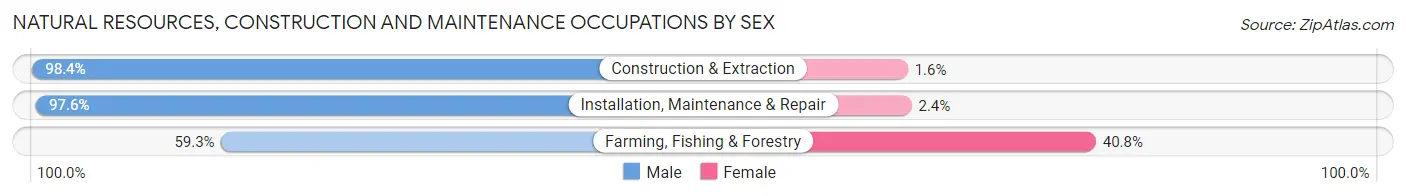
| Occupation | Male | Female |
| Farming, Fishing & Forestry | 900 (59.3%) | 619 (40.7%) |
| Construction & Extraction | 5,888 (98.4%) | 97 (1.6%) |
| Installation, Maintenance & Repair | 2,306 (97.6%) | 57 (2.4%) |
| Total (Category) | 9,094 (92.2%) | 773 (7.8%) |
| Total (Overall) | 48,275 (52.9%) | 42,929 (47.1%) |
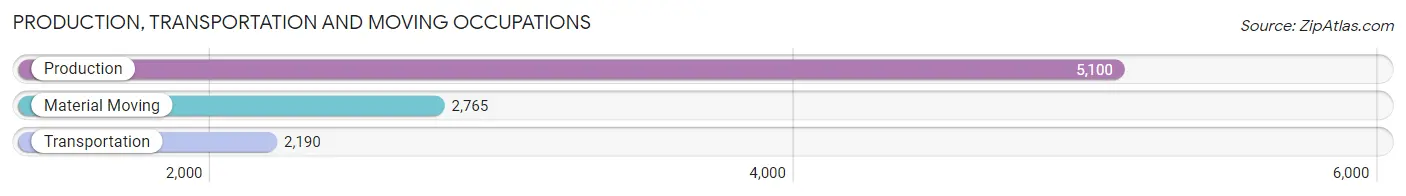
Production, Transportation and Moving Occupations
The most common Production, Transportation and Moving occupations in Santa Rosa are Production (5,100 | 5.6%), Material Moving (2,765 | 3.0%), and Transportation (2,190 | 2.4%).
Production, Transportation and Moving Occupations by Sex
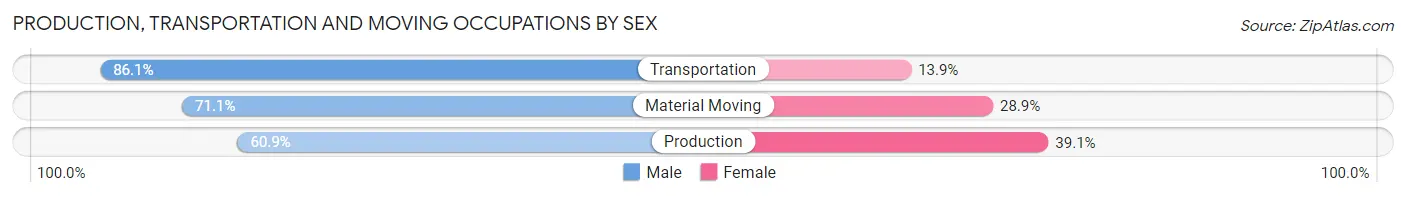
| Occupation | Male | Female |
| Production | 3,108 (60.9%) | 1,992 (39.1%) |
| Transportation | 1,886 (86.1%) | 304 (13.9%) |
| Material Moving | 1,966 (71.1%) | 799 (28.9%) |
| Total (Category) | 6,960 (69.2%) | 3,095 (30.8%) |
| Total (Overall) | 48,275 (52.9%) | 42,929 (47.1%) |
Employment Industries by Sex in Santa Rosa
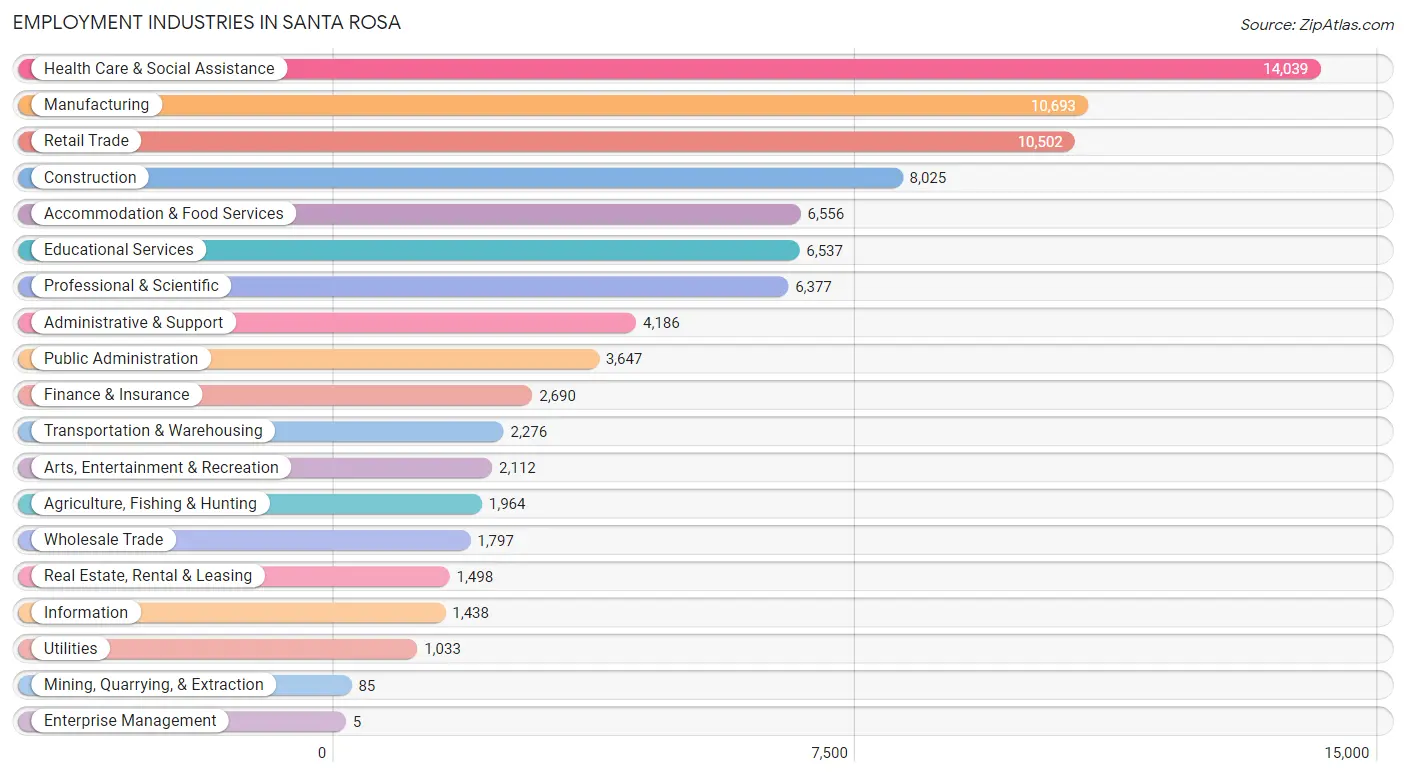
Employment Industries in Santa Rosa
The major employment industries in Santa Rosa include Health Care & Social Assistance (14,039 | 15.4%), Manufacturing (10,693 | 11.7%), Retail Trade (10,502 | 11.5%), Construction (8,025 | 8.8%), and Accommodation & Food Services (6,556 | 7.2%).
Employment Industries by Sex in Santa Rosa
The Santa Rosa industries that see more men than women are Mining, Quarrying, & Extraction (100.0%), Construction (87.7%), and Wholesale Trade (84.1%), whereas the industries that tend to have a higher number of women are Enterprise Management (100.0%), Health Care & Social Assistance (73.5%), and Educational Services (69.2%).

| Industry | Male | Female |
| Agriculture, Fishing & Hunting | 1,235 (62.9%) | 729 (37.1%) |
| Mining, Quarrying, & Extraction | 85 (100.0%) | 0 (0.0%) |
| Construction | 7,041 (87.7%) | 984 (12.3%) |
| Manufacturing | 6,758 (63.2%) | 3,935 (36.8%) |
| Wholesale Trade | 1,511 (84.1%) | 286 (15.9%) |
| Retail Trade | 5,790 (55.1%) | 4,712 (44.9%) |
| Transportation & Warehousing | 1,824 (80.1%) | 452 (19.9%) |
| Utilities | 861 (83.4%) | 172 (16.7%) |
| Information | 1,040 (72.3%) | 398 (27.7%) |
| Finance & Insurance | 1,211 (45.0%) | 1,479 (55.0%) |
| Real Estate, Rental & Leasing | 646 (43.1%) | 852 (56.9%) |
| Professional & Scientific | 3,118 (48.9%) | 3,259 (51.1%) |
| Enterprise Management | 0 (0.0%) | 5 (100.0%) |
| Administrative & Support | 2,850 (68.1%) | 1,336 (31.9%) |
| Educational Services | 2,016 (30.8%) | 4,521 (69.2%) |
| Health Care & Social Assistance | 3,717 (26.5%) | 10,322 (73.5%) |
| Arts, Entertainment & Recreation | 1,096 (51.9%) | 1,016 (48.1%) |
| Accommodation & Food Services | 3,250 (49.6%) | 3,306 (50.4%) |
| Public Administration | 1,839 (50.4%) | 1,808 (49.6%) |
| Total | 48,275 (52.9%) | 42,929 (47.1%) |
Education in Santa Rosa
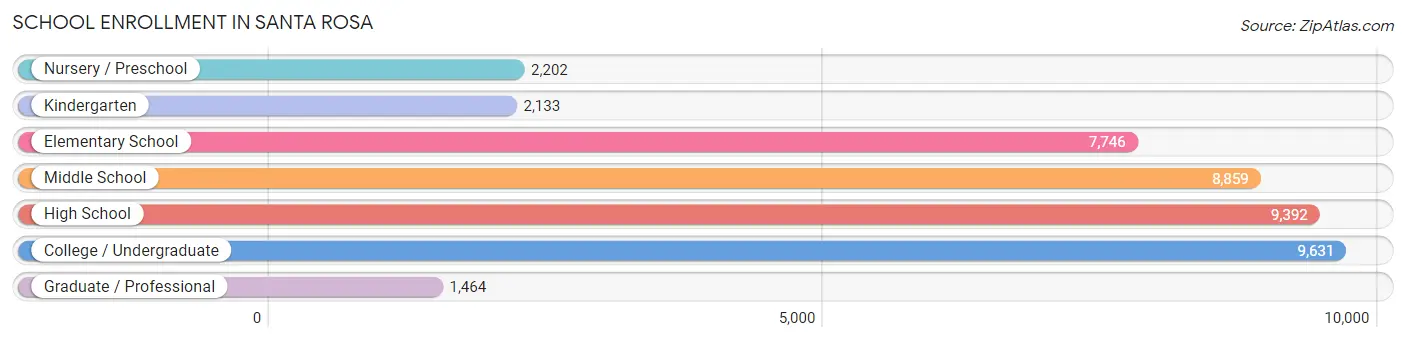
School Enrollment in Santa Rosa
The most common levels of schooling among the 41,427 students in Santa Rosa are college / undergraduate (9,631 | 23.3%), high school (9,392 | 22.7%), and middle school (8,859 | 21.4%).
| School Level | # Students | % Students |
| Nursery / Preschool | 2,202 | 5.3% |
| Kindergarten | 2,133 | 5.1% |
| Elementary School | 7,746 | 18.7% |
| Middle School | 8,859 | 21.4% |
| High School | 9,392 | 22.7% |
| College / Undergraduate | 9,631 | 23.3% |
| Graduate / Professional | 1,464 | 3.5% |
| Total | 41,427 | 100.0% |
School Enrollment by Age by Funding Source in Santa Rosa
Out of a total of 41,427 students who are enrolled in schools in Santa Rosa, 4,391 (10.6%) attend a private institution, while the remaining 37,036 (89.4%) are enrolled in public schools. The age group of 3 to 4 year olds has the highest likelihood of being enrolled in private schools, with 1,060 (58.1% in the age bracket) enrolled. Conversely, the age group of 20 to 24 year olds has the lowest likelihood of being enrolled in a private school, with 3,795 (96.0% in the age bracket) attending a public institution.
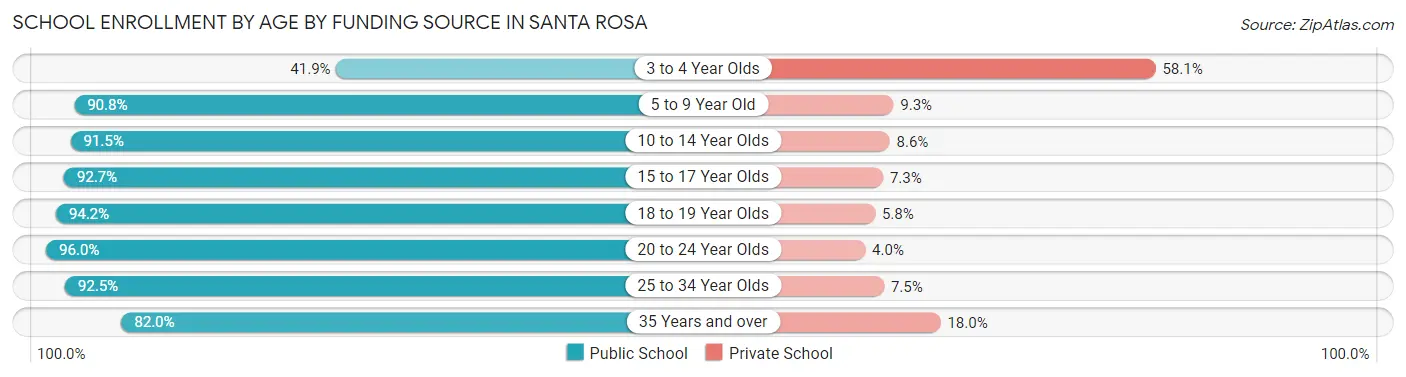
| Age Bracket | Public School | Private School |
| 3 to 4 Year Olds | 765 (41.9%) | 1,060 (58.1%) |
| 5 to 9 Year Old | 8,316 (90.7%) | 848 (9.2%) |
| 10 to 14 Year Olds | 10,342 (91.4%) | 967 (8.6%) |
| 15 to 17 Year Olds | 6,005 (92.7%) | 474 (7.3%) |
| 18 to 19 Year Olds | 2,970 (94.2%) | 184 (5.8%) |
| 20 to 24 Year Olds | 3,795 (96.0%) | 158 (4.0%) |
| 25 to 34 Year Olds | 2,757 (92.5%) | 224 (7.5%) |
| 35 Years and over | 2,100 (82.0%) | 462 (18.0%) |
| Total | 37,036 (89.4%) | 4,391 (10.6%) |
Educational Attainment by Field of Study in Santa Rosa
Business (6,882 | 14.4%), social sciences (5,243 | 11.0%), science & technology (4,421 | 9.2%), bio, nature & agricultural (4,332 | 9.1%), and psychology (3,486 | 7.3%) are the most common fields of study among 47,788 individuals in Santa Rosa who have obtained a bachelor's degree or higher.
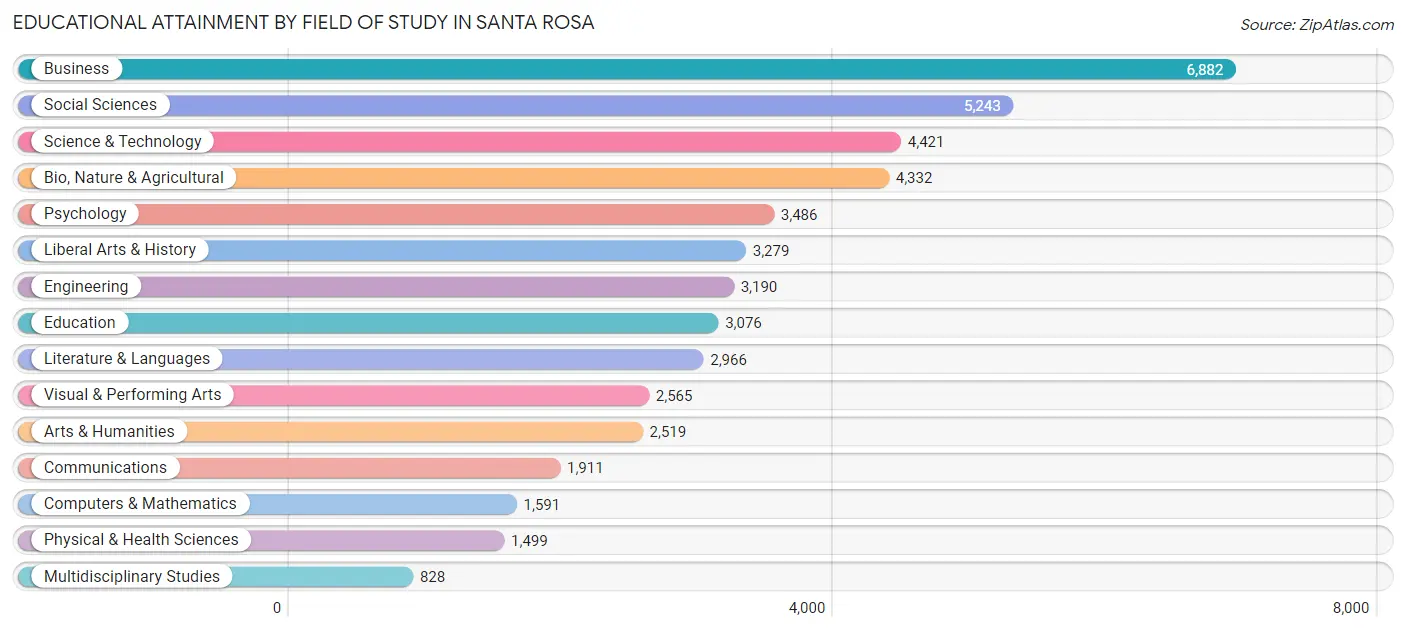
| Field of Study | # Graduates | % Graduates |
| Computers & Mathematics | 1,591 | 3.3% |
| Bio, Nature & Agricultural | 4,332 | 9.1% |
| Physical & Health Sciences | 1,499 | 3.1% |
| Psychology | 3,486 | 7.3% |
| Social Sciences | 5,243 | 11.0% |
| Engineering | 3,190 | 6.7% |
| Multidisciplinary Studies | 828 | 1.7% |
| Science & Technology | 4,421 | 9.2% |
| Business | 6,882 | 14.4% |
| Education | 3,076 | 6.4% |
| Literature & Languages | 2,966 | 6.2% |
| Liberal Arts & History | 3,279 | 6.9% |
| Visual & Performing Arts | 2,565 | 5.4% |
| Communications | 1,911 | 4.0% |
| Arts & Humanities | 2,519 | 5.3% |
| Total | 47,788 | 100.0% |
Transportation & Commute in Santa Rosa
Vehicle Availability by Sex in Santa Rosa
The most prevalent vehicle ownership categories in Santa Rosa are males with 2 vehicles (19,609, accounting for 41.7%) and females with 2 vehicles (16,521, making up 47.1%).
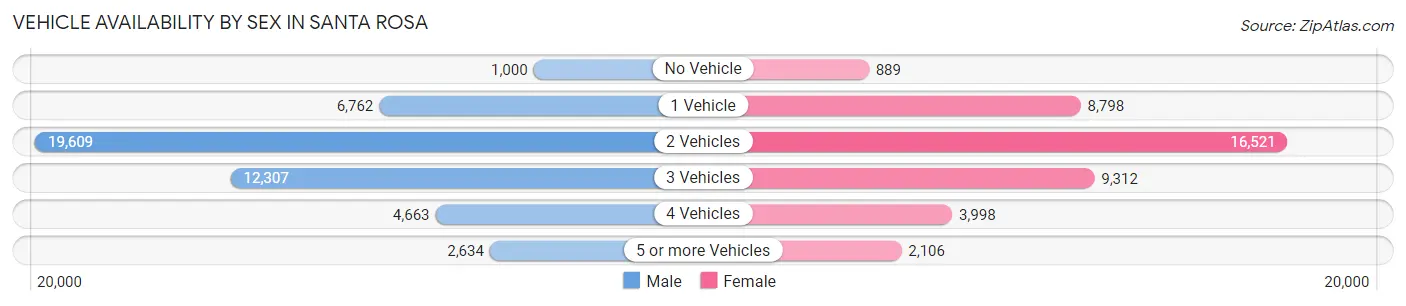
| Vehicles Available | Male | Female |
| No Vehicle | 1,000 (2.1%) | 889 (2.1%) |
| 1 Vehicle | 6,762 (14.4%) | 8,798 (21.1%) |
| 2 Vehicles | 19,609 (41.7%) | 16,521 (39.7%) |
| 3 Vehicles | 12,307 (26.2%) | 9,312 (22.4%) |
| 4 Vehicles | 4,663 (9.9%) | 3,998 (9.6%) |
| 5 or more Vehicles | 2,634 (5.6%) | 2,106 (5.1%) |
| Total | 46,975 (100.0%) | 41,624 (100.0%) |
Commute Time in Santa Rosa
The most frequently occuring commute durations in Santa Rosa are 10 to 14 minutes (16,847 commuters, 20.8%), 15 to 19 minutes (16,794 commuters, 20.7%), and 20 to 24 minutes (11,788 commuters, 14.5%).
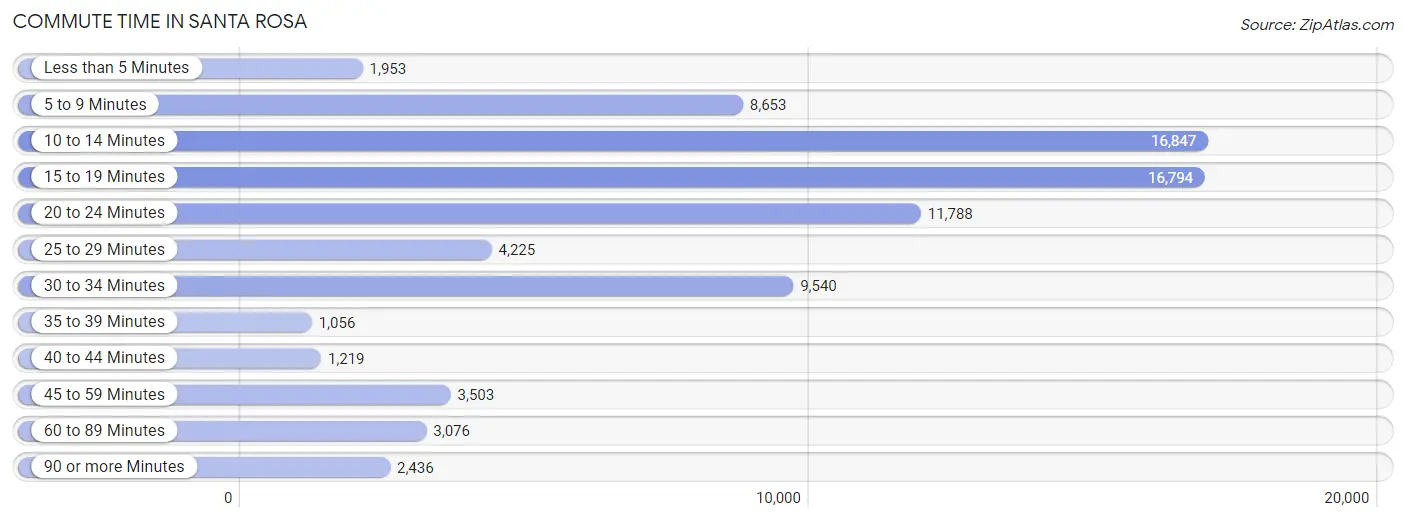
| Commute Time | # Commuters | % Commuters |
| Less than 5 Minutes | 1,953 | 2.4% |
| 5 to 9 Minutes | 8,653 | 10.7% |
| 10 to 14 Minutes | 16,847 | 20.8% |
| 15 to 19 Minutes | 16,794 | 20.7% |
| 20 to 24 Minutes | 11,788 | 14.5% |
| 25 to 29 Minutes | 4,225 | 5.2% |
| 30 to 34 Minutes | 9,540 | 11.8% |
| 35 to 39 Minutes | 1,056 | 1.3% |
| 40 to 44 Minutes | 1,219 | 1.5% |
| 45 to 59 Minutes | 3,503 | 4.3% |
| 60 to 89 Minutes | 3,076 | 3.8% |
| 90 or more Minutes | 2,436 | 3.0% |
Commute Time by Sex in Santa Rosa
The most common commute times in Santa Rosa are 15 to 19 minutes (9,047 commuters, 20.8%) for males and 10 to 14 minutes (8,441 commuters, 22.4%) for females.
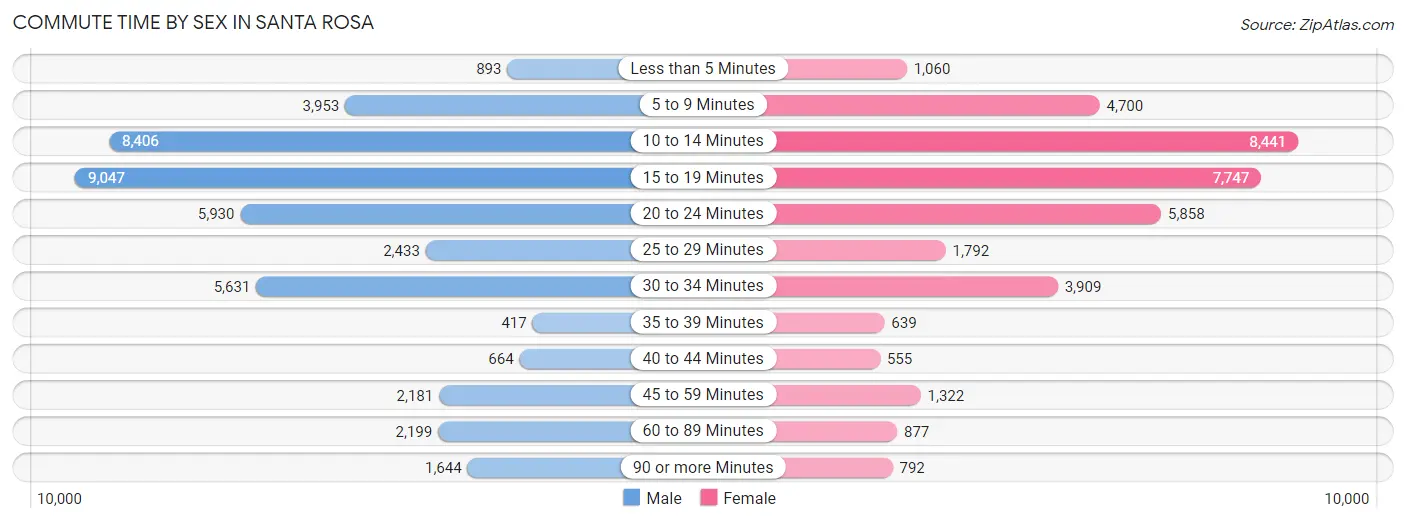
| Commute Time | Male | Female |
| Less than 5 Minutes | 893 (2.1%) | 1,060 (2.8%) |
| 5 to 9 Minutes | 3,953 (9.1%) | 4,700 (12.5%) |
| 10 to 14 Minutes | 8,406 (19.4%) | 8,441 (22.4%) |
| 15 to 19 Minutes | 9,047 (20.8%) | 7,747 (20.5%) |
| 20 to 24 Minutes | 5,930 (13.7%) | 5,858 (15.5%) |
| 25 to 29 Minutes | 2,433 (5.6%) | 1,792 (4.8%) |
| 30 to 34 Minutes | 5,631 (13.0%) | 3,909 (10.4%) |
| 35 to 39 Minutes | 417 (1.0%) | 639 (1.7%) |
| 40 to 44 Minutes | 664 (1.5%) | 555 (1.5%) |
| 45 to 59 Minutes | 2,181 (5.0%) | 1,322 (3.5%) |
| 60 to 89 Minutes | 2,199 (5.1%) | 877 (2.3%) |
| 90 or more Minutes | 1,644 (3.8%) | 792 (2.1%) |
Time of Departure to Work by Sex in Santa Rosa
The most frequent times of departure to work in Santa Rosa are 6:30 AM to 6:59 AM (5,065, 11.7%) for males and 7:30 AM to 7:59 AM (6,306, 16.7%) for females.
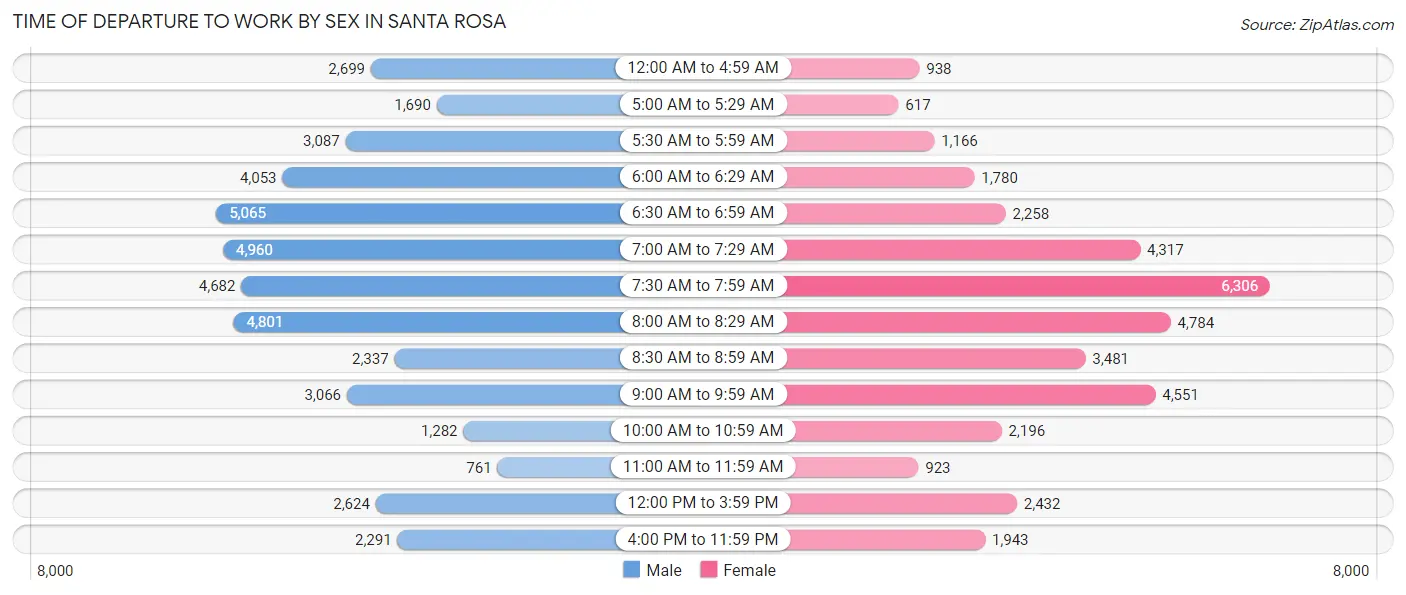
| Time of Departure | Male | Female |
| 12:00 AM to 4:59 AM | 2,699 (6.2%) | 938 (2.5%) |
| 5:00 AM to 5:29 AM | 1,690 (3.9%) | 617 (1.6%) |
| 5:30 AM to 5:59 AM | 3,087 (7.1%) | 1,166 (3.1%) |
| 6:00 AM to 6:29 AM | 4,053 (9.3%) | 1,780 (4.7%) |
| 6:30 AM to 6:59 AM | 5,065 (11.7%) | 2,258 (6.0%) |
| 7:00 AM to 7:29 AM | 4,960 (11.4%) | 4,317 (11.5%) |
| 7:30 AM to 7:59 AM | 4,682 (10.8%) | 6,306 (16.7%) |
| 8:00 AM to 8:29 AM | 4,801 (11.1%) | 4,784 (12.7%) |
| 8:30 AM to 8:59 AM | 2,337 (5.4%) | 3,481 (9.2%) |
| 9:00 AM to 9:59 AM | 3,066 (7.1%) | 4,551 (12.1%) |
| 10:00 AM to 10:59 AM | 1,282 (2.9%) | 2,196 (5.8%) |
| 11:00 AM to 11:59 AM | 761 (1.8%) | 923 (2.5%) |
| 12:00 PM to 3:59 PM | 2,624 (6.0%) | 2,432 (6.5%) |
| 4:00 PM to 11:59 PM | 2,291 (5.3%) | 1,943 (5.1%) |
| Total | 43,398 (100.0%) | 37,692 (100.0%) |
Housing Occupancy in Santa Rosa
Occupancy by Ownership in Santa Rosa
Of the total 68,096 dwellings in Santa Rosa, owner-occupied units account for 37,933 (55.7%), while renter-occupied units make up 30,163 (44.3%).
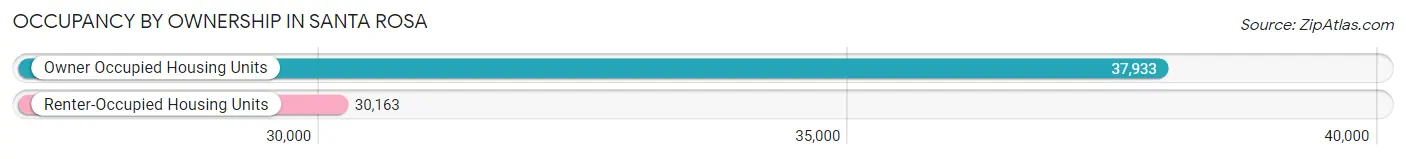
| Occupancy | # Housing Units | % Housing Units |
| Owner Occupied Housing Units | 37,933 | 55.7% |
| Renter-Occupied Housing Units | 30,163 | 44.3% |
| Total Occupied Housing Units | 68,096 | 100.0% |
Occupancy by Household Size in Santa Rosa
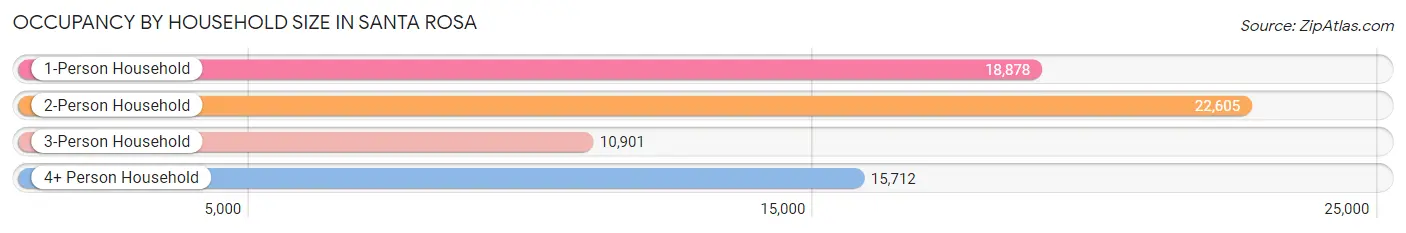
| Household Size | # Housing Units | % Housing Units |
| 1-Person Household | 18,878 | 27.7% |
| 2-Person Household | 22,605 | 33.2% |
| 3-Person Household | 10,901 | 16.0% |
| 4+ Person Household | 15,712 | 23.1% |
| Total Housing Units | 68,096 | 100.0% |
Occupancy by Ownership by Household Size in Santa Rosa
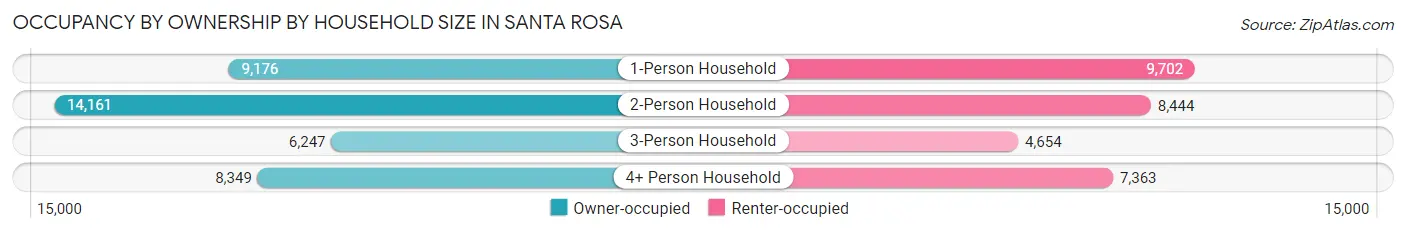
| Household Size | Owner-occupied | Renter-occupied |
| 1-Person Household | 9,176 (48.6%) | 9,702 (51.4%) |
| 2-Person Household | 14,161 (62.6%) | 8,444 (37.3%) |
| 3-Person Household | 6,247 (57.3%) | 4,654 (42.7%) |
| 4+ Person Household | 8,349 (53.1%) | 7,363 (46.9%) |
| Total Housing Units | 37,933 (55.7%) | 30,163 (44.3%) |
Occupancy by Educational Attainment in Santa Rosa
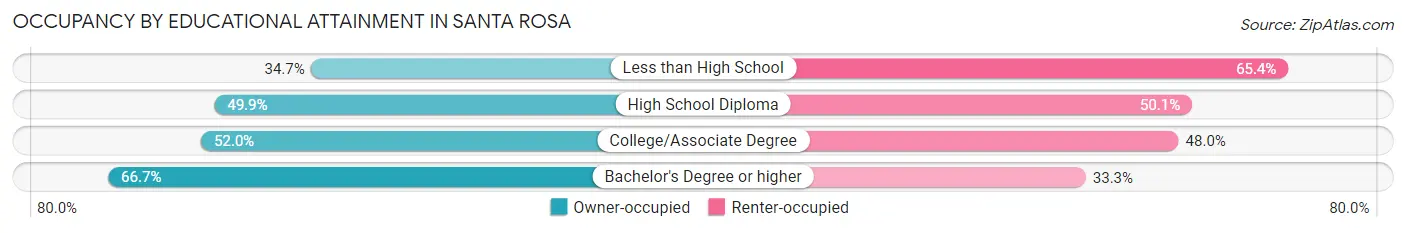
| Household Size | Owner-occupied | Renter-occupied |
| Less than High School | 2,536 (34.6%) | 4,782 (65.3%) |
| High School Diploma | 4,972 (49.9%) | 4,990 (50.1%) |
| College/Associate Degree | 12,329 (52.0%) | 11,373 (48.0%) |
| Bachelor's Degree or higher | 18,096 (66.7%) | 9,018 (33.3%) |
Occupancy by Age of Householder in Santa Rosa
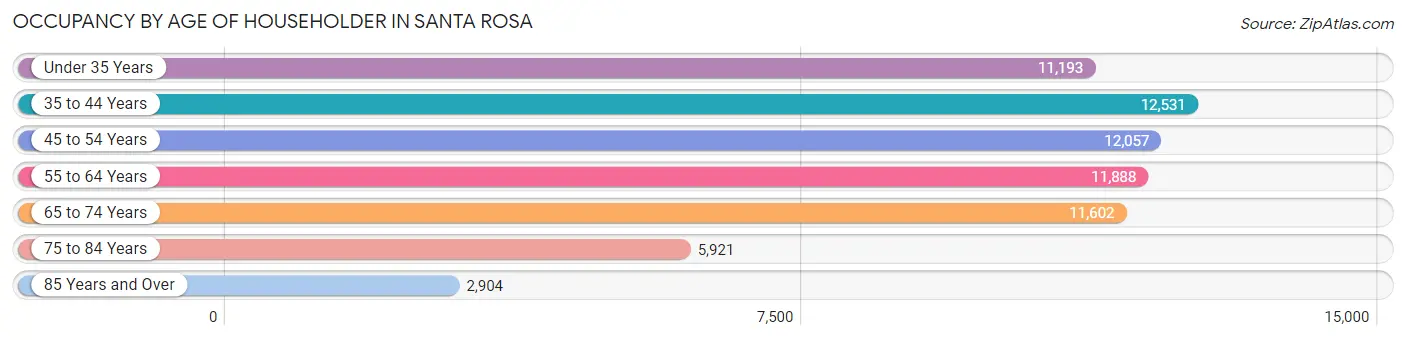
| Age Bracket | # Households | % Households |
| Under 35 Years | 11,193 | 16.4% |
| 35 to 44 Years | 12,531 | 18.4% |
| 45 to 54 Years | 12,057 | 17.7% |
| 55 to 64 Years | 11,888 | 17.5% |
| 65 to 74 Years | 11,602 | 17.0% |
| 75 to 84 Years | 5,921 | 8.7% |
| 85 Years and Over | 2,904 | 4.3% |
| Total | 68,096 | 100.0% |
Housing Finances in Santa Rosa
Median Income by Occupancy in Santa Rosa
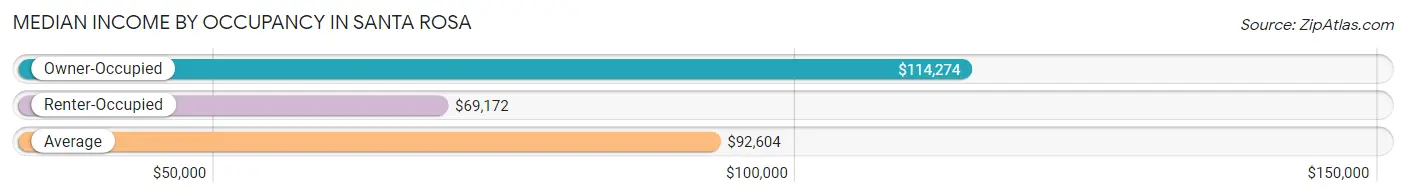
| Occupancy Type | # Households | Median Income |
| Owner-Occupied | 37,933 (55.7%) | $114,274 |
| Renter-Occupied | 30,163 (44.3%) | $69,172 |
| Average | 68,096 (100.0%) | $92,604 |
Occupancy by Householder Income Bracket in Santa Rosa
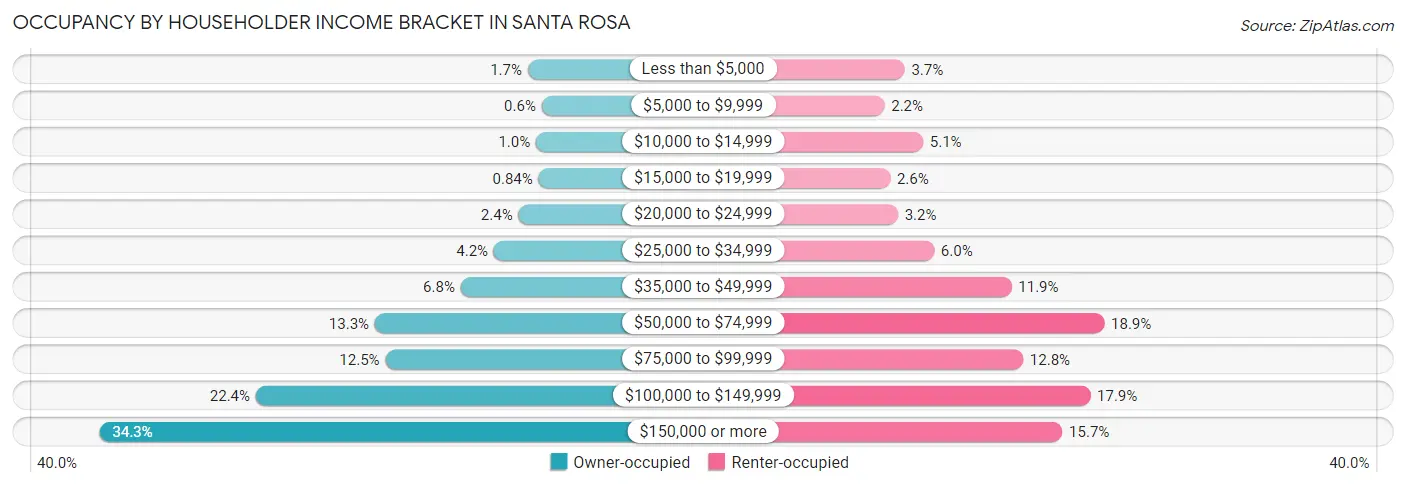
| Income Bracket | Owner-occupied | Renter-occupied |
| Less than $5,000 | 628 (1.7%) | 1,124 (3.7%) |
| $5,000 to $9,999 | 228 (0.6%) | 660 (2.2%) |
| $10,000 to $14,999 | 391 (1.0%) | 1,546 (5.1%) |
| $15,000 to $19,999 | 317 (0.8%) | 790 (2.6%) |
| $20,000 to $24,999 | 900 (2.4%) | 968 (3.2%) |
| $25,000 to $34,999 | 1,609 (4.2%) | 1,802 (6.0%) |
| $35,000 to $49,999 | 2,569 (6.8%) | 3,579 (11.9%) |
| $50,000 to $74,999 | 5,049 (13.3%) | 5,712 (18.9%) |
| $75,000 to $99,999 | 4,744 (12.5%) | 3,845 (12.8%) |
| $100,000 to $149,999 | 8,488 (22.4%) | 5,389 (17.9%) |
| $150,000 or more | 13,010 (34.3%) | 4,748 (15.7%) |
| Total | 37,933 (100.0%) | 30,163 (100.0%) |
Monthly Housing Cost Tiers in Santa Rosa
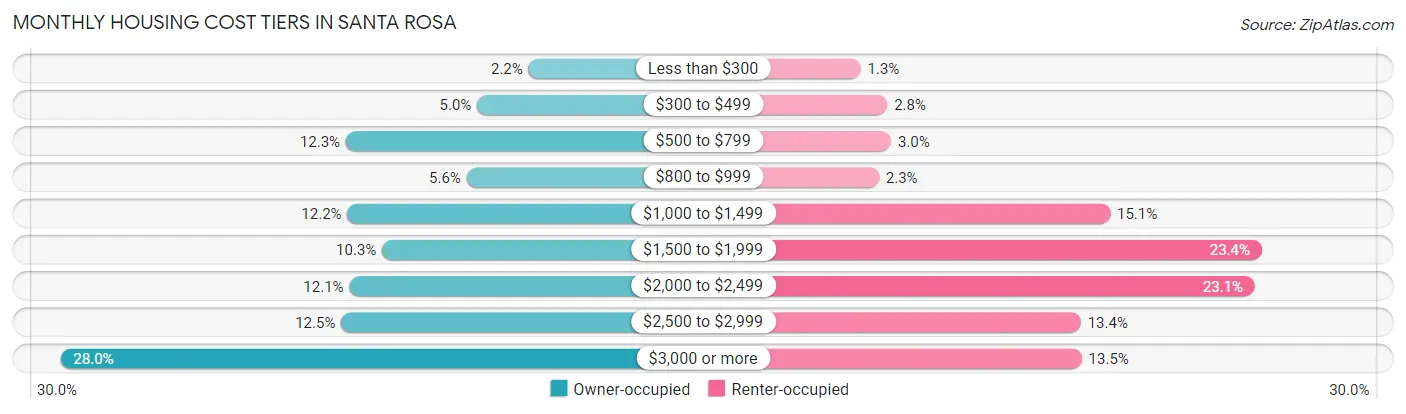
| Monthly Cost | Owner-occupied | Renter-occupied |
| Less than $300 | 821 (2.2%) | 387 (1.3%) |
| $300 to $499 | 1,895 (5.0%) | 829 (2.8%) |
| $500 to $799 | 4,645 (12.2%) | 892 (3.0%) |
| $800 to $999 | 2,117 (5.6%) | 692 (2.3%) |
| $1,000 to $1,499 | 4,617 (12.2%) | 4,543 (15.1%) |
| $1,500 to $1,999 | 3,890 (10.2%) | 7,070 (23.4%) |
| $2,000 to $2,499 | 4,573 (12.1%) | 6,955 (23.1%) |
| $2,500 to $2,999 | 4,747 (12.5%) | 4,053 (13.4%) |
| $3,000 or more | 10,628 (28.0%) | 4,069 (13.5%) |
| Total | 37,933 (100.0%) | 30,163 (100.0%) |
Physical Housing Characteristics in Santa Rosa
Housing Structures in Santa Rosa
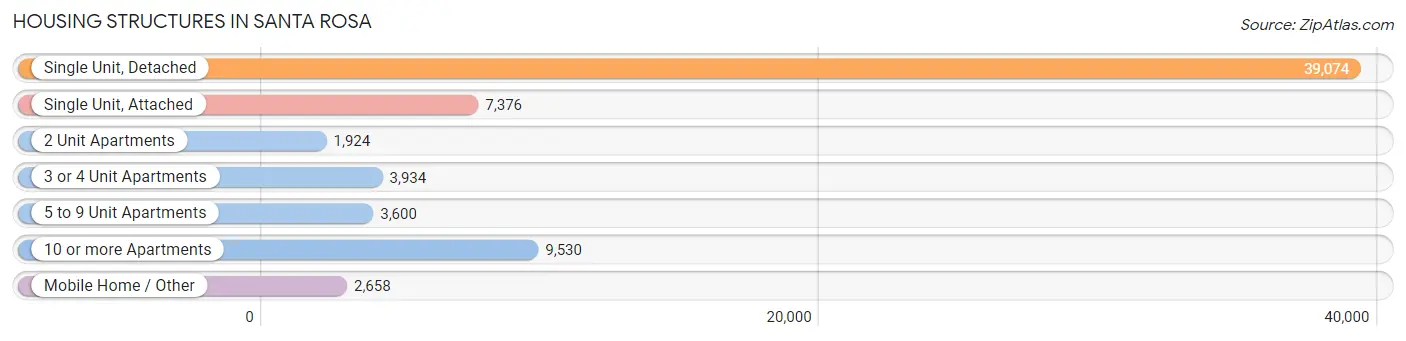
| Structure Type | # Housing Units | % Housing Units |
| Single Unit, Detached | 39,074 | 57.4% |
| Single Unit, Attached | 7,376 | 10.8% |
| 2 Unit Apartments | 1,924 | 2.8% |
| 3 or 4 Unit Apartments | 3,934 | 5.8% |
| 5 to 9 Unit Apartments | 3,600 | 5.3% |
| 10 or more Apartments | 9,530 | 14.0% |
| Mobile Home / Other | 2,658 | 3.9% |
| Total | 68,096 | 100.0% |
Housing Structures by Occupancy in Santa Rosa
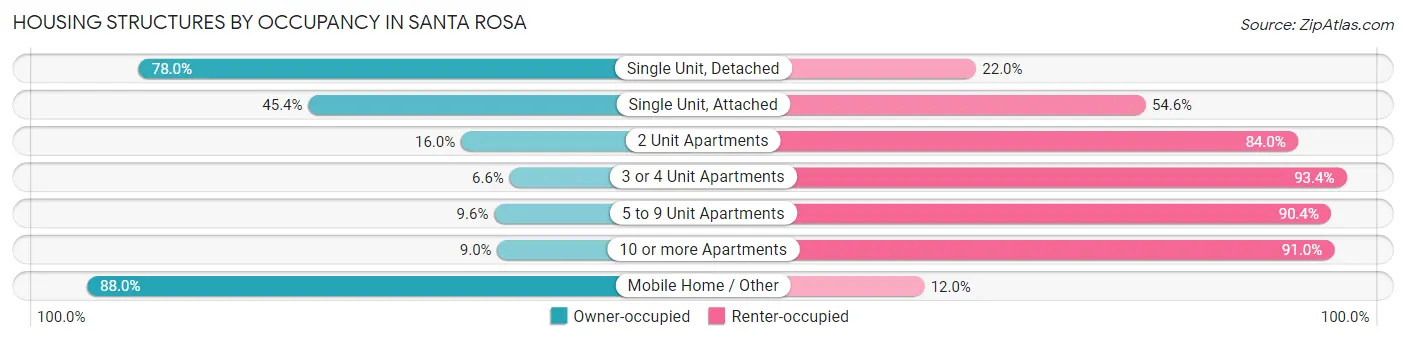
| Structure Type | Owner-occupied | Renter-occupied |
| Single Unit, Detached | 30,483 (78.0%) | 8,591 (22.0%) |
| Single Unit, Attached | 3,346 (45.4%) | 4,030 (54.6%) |
| 2 Unit Apartments | 307 (16.0%) | 1,617 (84.0%) |
| 3 or 4 Unit Apartments | 260 (6.6%) | 3,674 (93.4%) |
| 5 to 9 Unit Apartments | 345 (9.6%) | 3,255 (90.4%) |
| 10 or more Apartments | 854 (9.0%) | 8,676 (91.0%) |
| Mobile Home / Other | 2,338 (88.0%) | 320 (12.0%) |
| Total | 37,933 (55.7%) | 30,163 (44.3%) |
Housing Structures by Number of Rooms in Santa Rosa
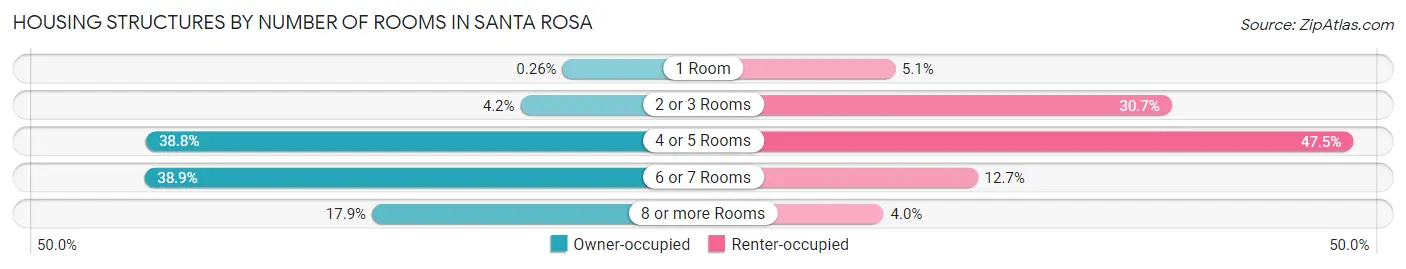
| Number of Rooms | Owner-occupied | Renter-occupied |
| 1 Room | 100 (0.3%) | 1,535 (5.1%) |
| 2 or 3 Rooms | 1,574 (4.2%) | 9,251 (30.7%) |
| 4 or 5 Rooms | 14,707 (38.8%) | 14,315 (47.5%) |
| 6 or 7 Rooms | 14,769 (38.9%) | 3,842 (12.7%) |
| 8 or more Rooms | 6,783 (17.9%) | 1,220 (4.0%) |
| Total | 37,933 (100.0%) | 30,163 (100.0%) |
Housing Structure by Heating Type in Santa Rosa
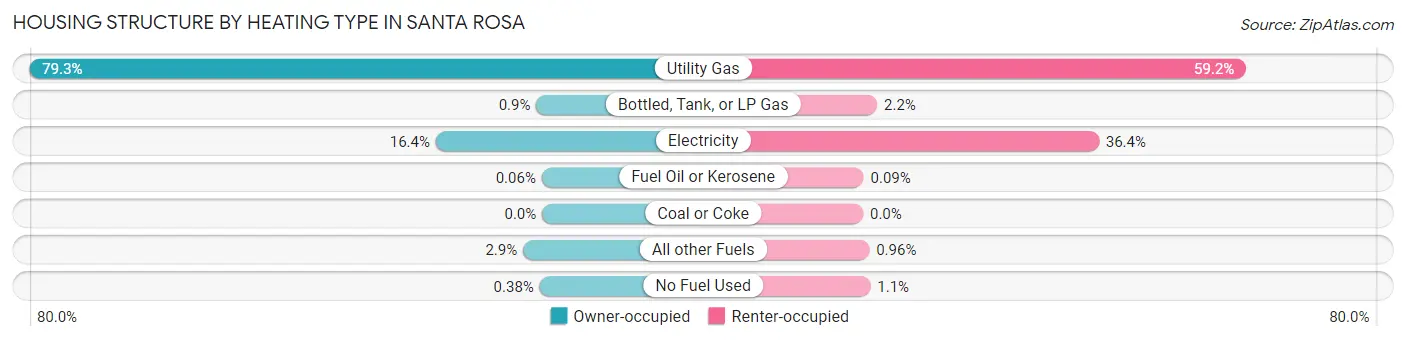
| Heating Type | Owner-occupied | Renter-occupied |
| Utility Gas | 30,076 (79.3%) | 17,862 (59.2%) |
| Bottled, Tank, or LP Gas | 342 (0.9%) | 654 (2.2%) |
| Electricity | 6,232 (16.4%) | 10,991 (36.4%) |
| Fuel Oil or Kerosene | 24 (0.1%) | 26 (0.1%) |
| Coal or Coke | 0 (0.0%) | 0 (0.0%) |
| All other Fuels | 1,116 (2.9%) | 290 (1.0%) |
| No Fuel Used | 143 (0.4%) | 340 (1.1%) |
| Total | 37,933 (100.0%) | 30,163 (100.0%) |
Household Vehicle Usage in Santa Rosa
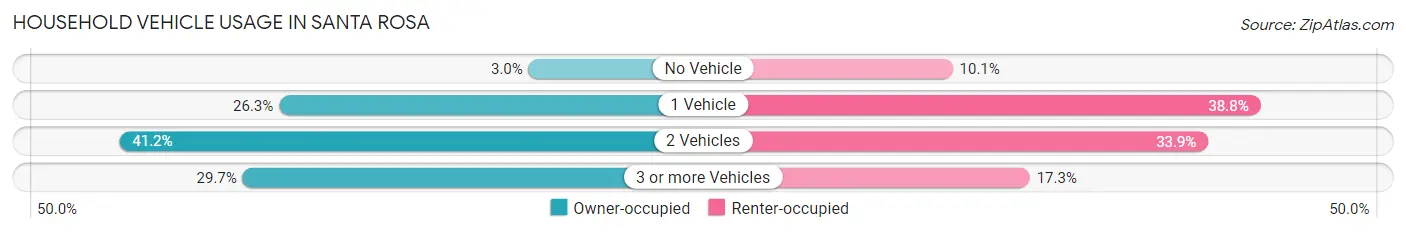
| Vehicles per Household | Owner-occupied | Renter-occupied |
| No Vehicle | 1,119 (2.9%) | 3,032 (10.1%) |
| 1 Vehicle | 9,956 (26.3%) | 11,700 (38.8%) |
| 2 Vehicles | 15,609 (41.1%) | 10,227 (33.9%) |
| 3 or more Vehicles | 11,249 (29.6%) | 5,204 (17.2%) |
| Total | 37,933 (100.0%) | 30,163 (100.0%) |
Real Estate & Mortgages in Santa Rosa
Real Estate and Mortgage Overview in Santa Rosa
| Characteristic | Without Mortgage | With Mortgage |
| Housing Units | 12,359 | 25,574 |
| Median Property Value | $645,500 | $667,100 |
| Median Household Income | $73,011 | $10,087 |
| Monthly Housing Costs | $746 | $10,568 |
| Real Estate Taxes | $3,766 | $555 |
Property Value by Mortgage Status in Santa Rosa
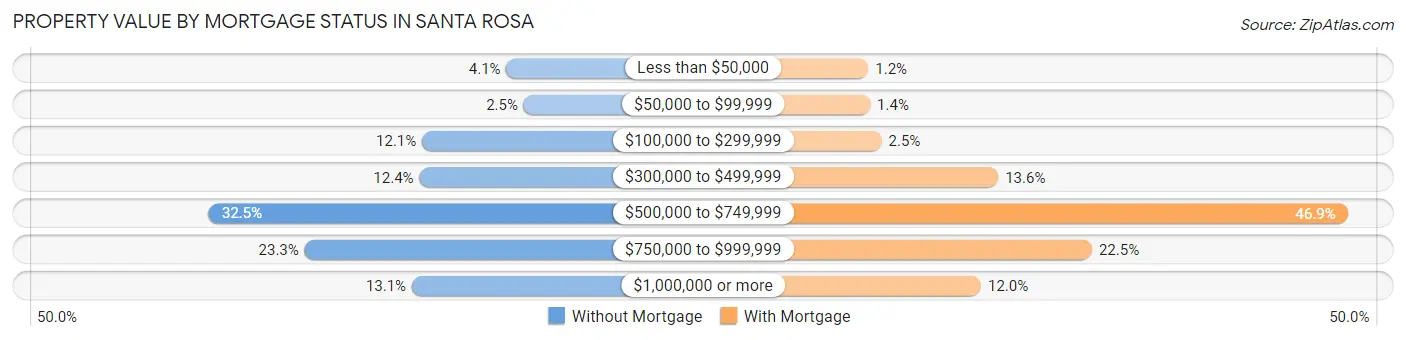
| Property Value | Without Mortgage | With Mortgage |
| Less than $50,000 | 508 (4.1%) | 312 (1.2%) |
| $50,000 to $99,999 | 304 (2.5%) | 355 (1.4%) |
| $100,000 to $299,999 | 1,500 (12.1%) | 633 (2.5%) |
| $300,000 to $499,999 | 1,533 (12.4%) | 3,476 (13.6%) |
| $500,000 to $749,999 | 4,011 (32.5%) | 11,984 (46.9%) |
| $750,000 to $999,999 | 2,883 (23.3%) | 5,759 (22.5%) |
| $1,000,000 or more | 1,620 (13.1%) | 3,055 (11.9%) |
| Total | 12,359 (100.0%) | 25,574 (100.0%) |
Household Income by Mortgage Status in Santa Rosa
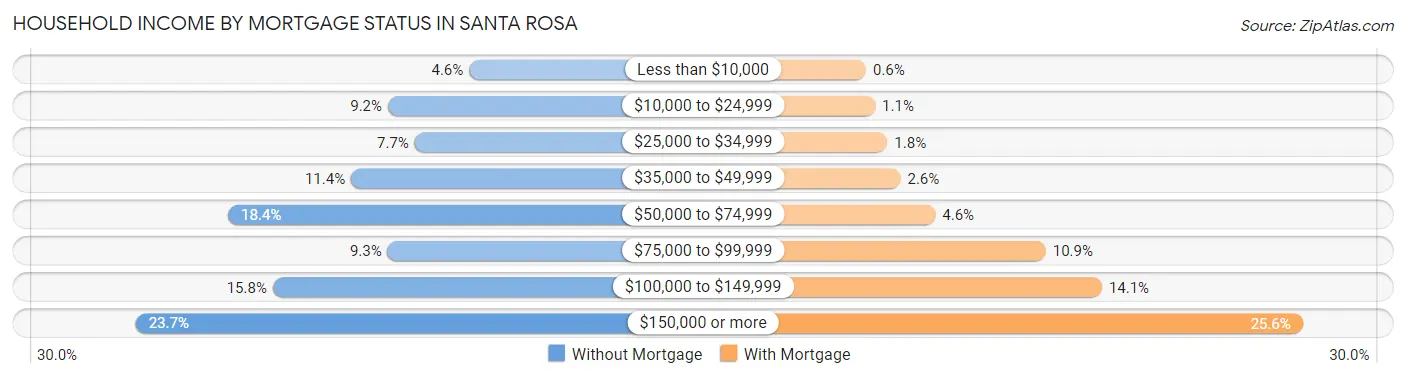
| Household Income | Without Mortgage | With Mortgage |
| Less than $10,000 | 569 (4.6%) | 154 (0.6%) |
| $10,000 to $24,999 | 1,142 (9.2%) | 287 (1.1%) |
| $25,000 to $34,999 | 953 (7.7%) | 466 (1.8%) |
| $35,000 to $49,999 | 1,403 (11.4%) | 656 (2.6%) |
| $50,000 to $74,999 | 2,270 (18.4%) | 1,166 (4.6%) |
| $75,000 to $99,999 | 1,144 (9.3%) | 2,779 (10.9%) |
| $100,000 to $149,999 | 1,955 (15.8%) | 3,600 (14.1%) |
| $150,000 or more | 2,923 (23.6%) | 6,533 (25.6%) |
| Total | 12,359 (100.0%) | 25,574 (100.0%) |
Property Value to Household Income Ratio in Santa Rosa
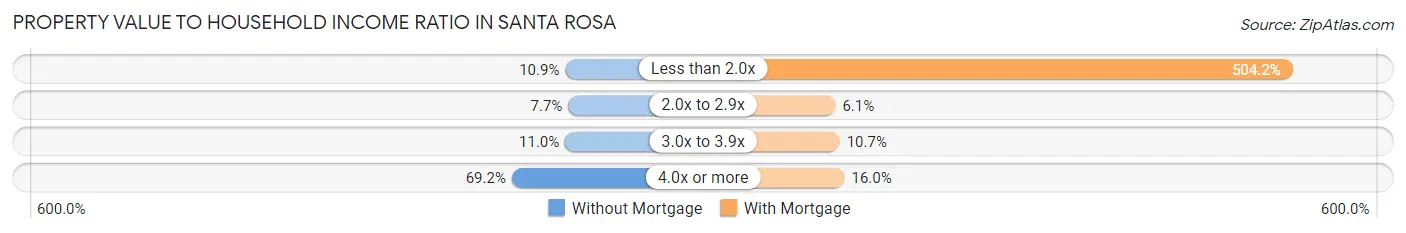
| Value-to-Income Ratio | Without Mortgage | With Mortgage |
| Less than 2.0x | 1,347 (10.9%) | 128,944 (504.2%) |
| 2.0x to 2.9x | 954 (7.7%) | 1,549 (6.1%) |
| 3.0x to 3.9x | 1,363 (11.0%) | 2,742 (10.7%) |
| 4.0x or more | 8,554 (69.2%) | 4,086 (16.0%) |
| Total | 12,359 (100.0%) | 25,574 (100.0%) |
Real Estate Taxes by Mortgage Status in Santa Rosa
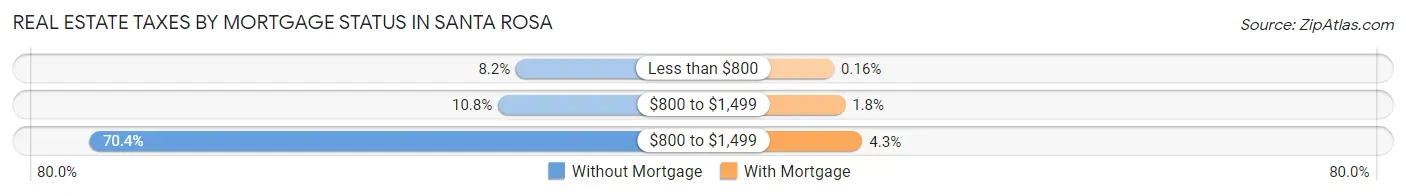
| Property Taxes | Without Mortgage | With Mortgage |
| Less than $800 | 1,012 (8.2%) | 42 (0.2%) |
| $800 to $1,499 | 1,337 (10.8%) | 456 (1.8%) |
| $800 to $1,499 | 8,706 (70.4%) | 1,097 (4.3%) |
| Total | 12,359 (100.0%) | 25,574 (100.0%) |
Health & Disability in Santa Rosa
Health Insurance Coverage by Age in Santa Rosa
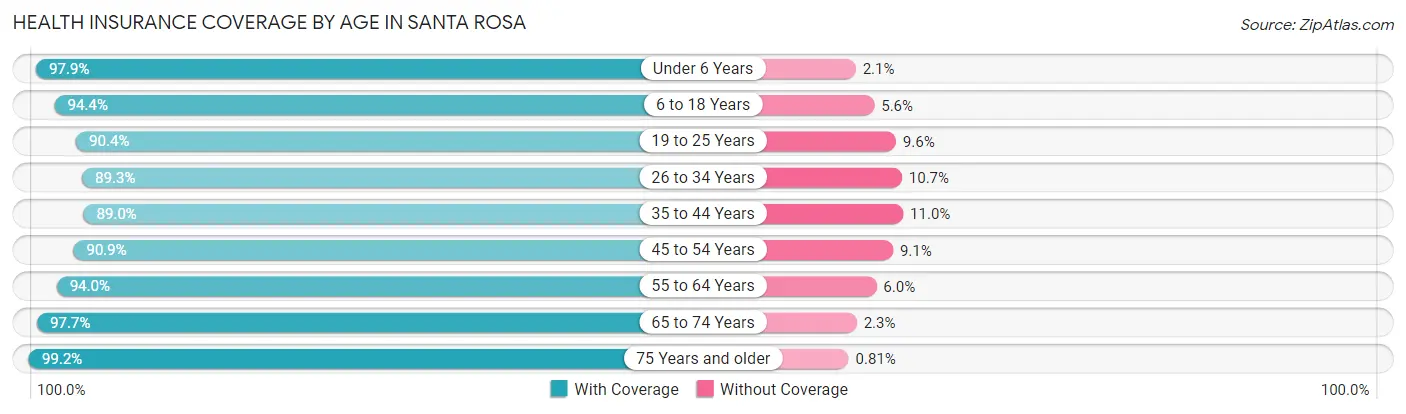
| Age Bracket | With Coverage | Without Coverage |
| Under 6 Years | 10,498 (97.9%) | 229 (2.1%) |
| 6 to 18 Years | 26,689 (94.4%) | 1,580 (5.6%) |
| 19 to 25 Years | 13,338 (90.4%) | 1,420 (9.6%) |
| 26 to 34 Years | 19,006 (89.3%) | 2,284 (10.7%) |
| 35 to 44 Years | 22,078 (89.0%) | 2,722 (11.0%) |
| 45 to 54 Years | 20,685 (90.9%) | 2,067 (9.1%) |
| 55 to 64 Years | 20,499 (94.0%) | 1,306 (6.0%) |
| 65 to 74 Years | 18,634 (97.7%) | 443 (2.3%) |
| 75 Years and older | 12,799 (99.2%) | 105 (0.8%) |
| Total | 164,226 (93.1%) | 12,156 (6.9%) |
Health Insurance Coverage by Citizenship Status in Santa Rosa
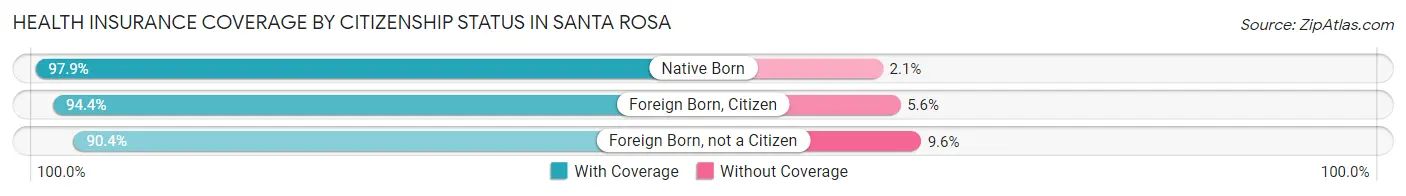
| Citizenship Status | With Coverage | Without Coverage |
| Native Born | 10,498 (97.9%) | 229 (2.1%) |
| Foreign Born, Citizen | 26,689 (94.4%) | 1,580 (5.6%) |
| Foreign Born, not a Citizen | 13,338 (90.4%) | 1,420 (9.6%) |
Health Insurance Coverage by Household Income in Santa Rosa
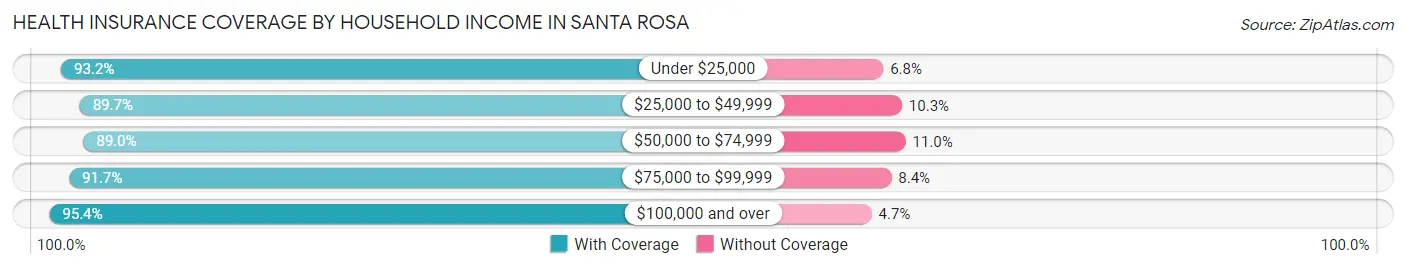
| Household Income | With Coverage | Without Coverage |
| Under $25,000 | 11,523 (93.2%) | 845 (6.8%) |
| $25,000 to $49,999 | 18,084 (89.7%) | 2,083 (10.3%) |
| $50,000 to $74,999 | 22,177 (89.0%) | 2,744 (11.0%) |
| $75,000 to $99,999 | 21,567 (91.6%) | 1,964 (8.4%) |
| $100,000 and over | 88,696 (95.4%) | 4,329 (4.6%) |
Public vs Private Health Insurance Coverage by Age in Santa Rosa
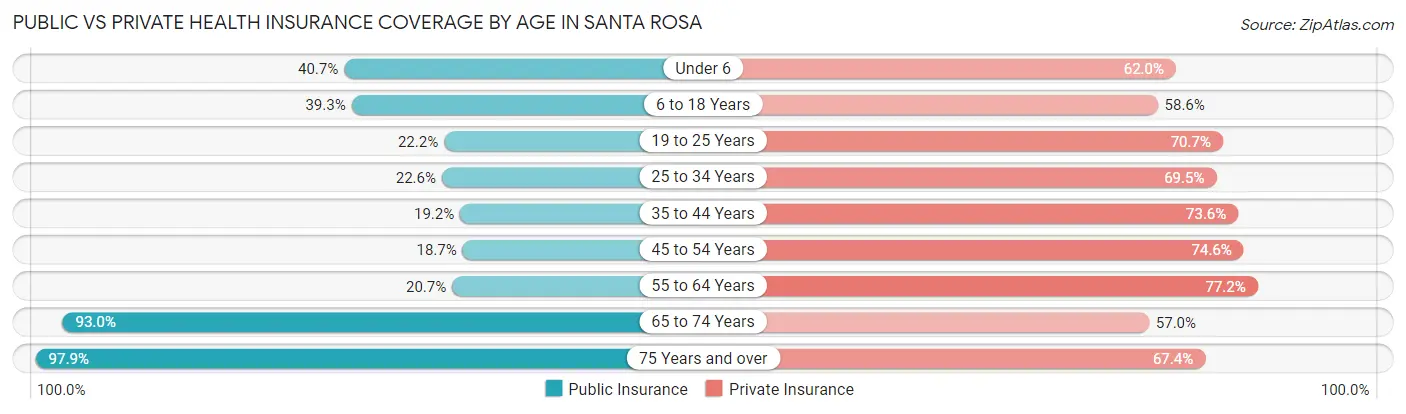
| Age Bracket | Public Insurance | Private Insurance |
| Under 6 | 4,367 (40.7%) | 6,650 (62.0%) |
| 6 to 18 Years | 11,117 (39.3%) | 16,570 (58.6%) |
| 19 to 25 Years | 3,271 (22.2%) | 10,434 (70.7%) |
| 25 to 34 Years | 4,804 (22.6%) | 14,794 (69.5%) |
| 35 to 44 Years | 4,754 (19.2%) | 18,240 (73.6%) |
| 45 to 54 Years | 4,258 (18.7%) | 16,971 (74.6%) |
| 55 to 64 Years | 4,506 (20.7%) | 16,828 (77.2%) |
| 65 to 74 Years | 17,732 (92.9%) | 10,872 (57.0%) |
| 75 Years and over | 12,638 (97.9%) | 8,698 (67.4%) |
| Total | 67,447 (38.2%) | 120,057 (68.1%) |
Disability Status by Sex by Age in Santa Rosa
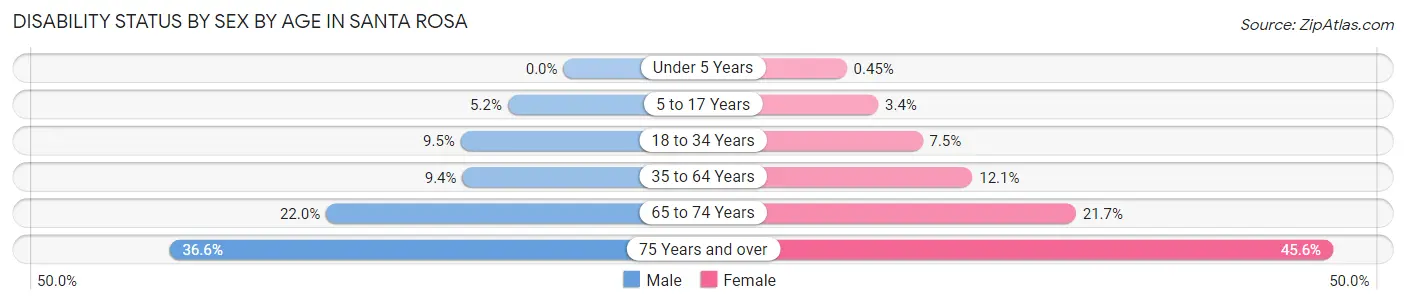
| Age Bracket | Male | Female |
| Under 5 Years | 0 (0.0%) | 20 (0.4%) |
| 5 to 17 Years | 723 (5.2%) | 461 (3.4%) |
| 18 to 34 Years | 1,884 (9.5%) | 1,406 (7.5%) |
| 35 to 64 Years | 3,197 (9.4%) | 4,267 (12.1%) |
| 65 to 74 Years | 1,861 (22.0%) | 2,308 (21.7%) |
| 75 Years and over | 1,812 (36.5%) | 3,622 (45.6%) |
Disability Class by Sex by Age in Santa Rosa
Disability Class: Hearing Difficulty
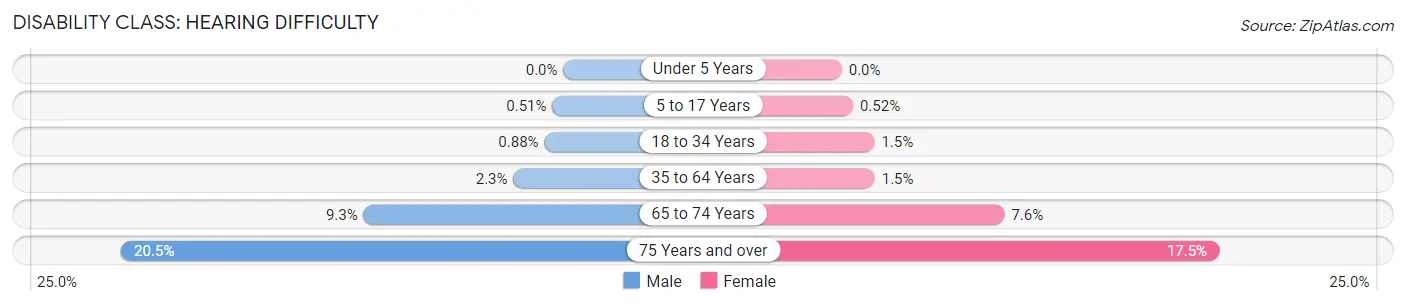
| Age Bracket | Male | Female |
| Under 5 Years | 0 (0.0%) | 0 (0.0%) |
| 5 to 17 Years | 71 (0.5%) | 71 (0.5%) |
| 18 to 34 Years | 173 (0.9%) | 286 (1.5%) |
| 35 to 64 Years | 790 (2.3%) | 538 (1.5%) |
| 65 to 74 Years | 783 (9.3%) | 802 (7.5%) |
| 75 Years and over | 1,017 (20.5%) | 1,391 (17.5%) |
Disability Class: Vision Difficulty
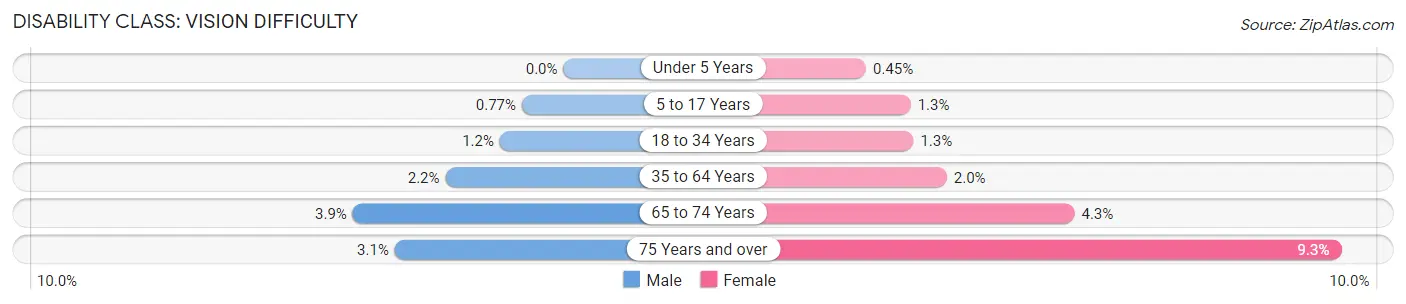
| Age Bracket | Male | Female |
| Under 5 Years | 0 (0.0%) | 20 (0.4%) |
| 5 to 17 Years | 108 (0.8%) | 175 (1.3%) |
| 18 to 34 Years | 234 (1.2%) | 250 (1.3%) |
| 35 to 64 Years | 746 (2.2%) | 688 (1.9%) |
| 65 to 74 Years | 330 (3.9%) | 459 (4.3%) |
| 75 Years and over | 155 (3.1%) | 737 (9.3%) |
Disability Class: Cognitive Difficulty
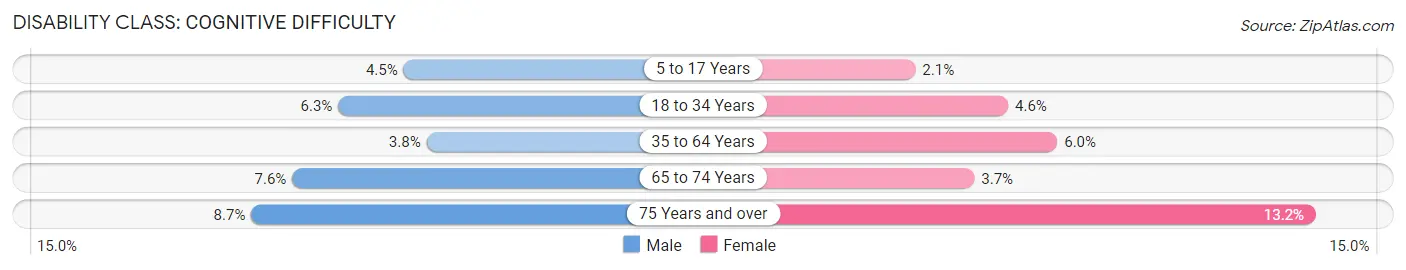
| Age Bracket | Male | Female |
| 5 to 17 Years | 623 (4.4%) | 281 (2.1%) |
| 18 to 34 Years | 1,240 (6.3%) | 870 (4.6%) |
| 35 to 64 Years | 1,300 (3.8%) | 2,115 (6.0%) |
| 65 to 74 Years | 638 (7.5%) | 392 (3.7%) |
| 75 Years and over | 431 (8.7%) | 1,049 (13.2%) |
Disability Class: Ambulatory Difficulty
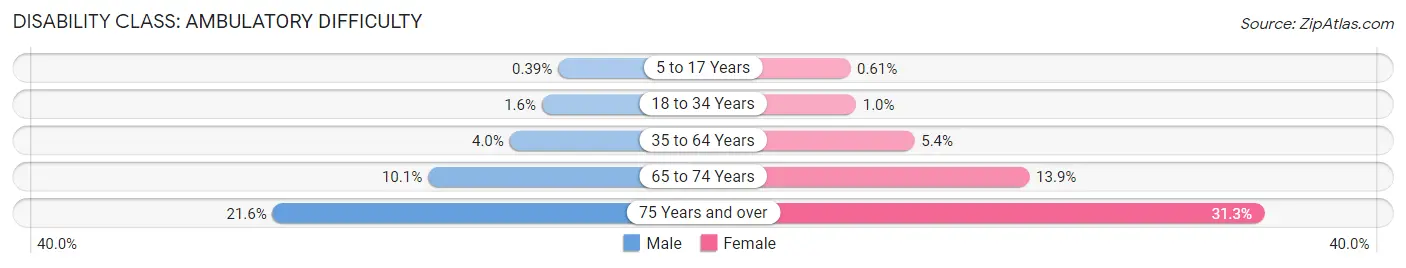
| Age Bracket | Male | Female |
| 5 to 17 Years | 54 (0.4%) | 83 (0.6%) |
| 18 to 34 Years | 316 (1.6%) | 195 (1.0%) |
| 35 to 64 Years | 1,363 (4.0%) | 1,897 (5.4%) |
| 65 to 74 Years | 849 (10.1%) | 1,478 (13.9%) |
| 75 Years and over | 1,070 (21.6%) | 2,490 (31.3%) |
Disability Class: Self-Care Difficulty
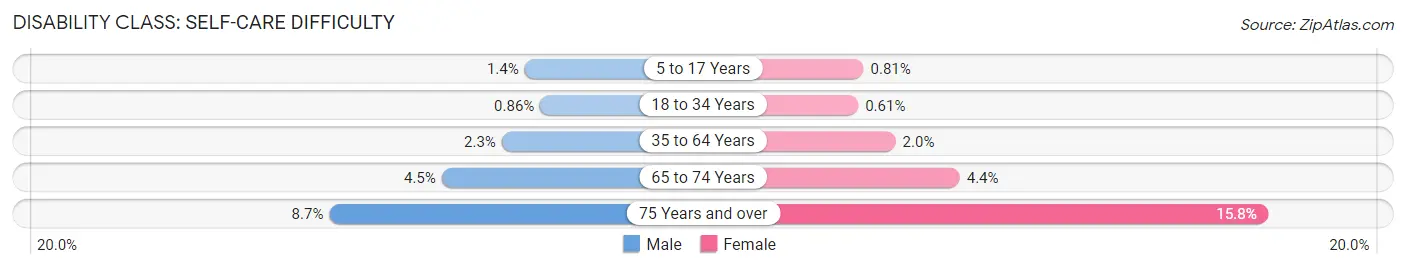
| Age Bracket | Male | Female |
| 5 to 17 Years | 202 (1.4%) | 111 (0.8%) |
| 18 to 34 Years | 171 (0.9%) | 114 (0.6%) |
| 35 to 64 Years | 781 (2.3%) | 704 (2.0%) |
| 65 to 74 Years | 382 (4.5%) | 465 (4.4%) |
| 75 Years and over | 431 (8.7%) | 1,259 (15.8%) |
Technology Access in Santa Rosa
Computing Device Access in Santa Rosa
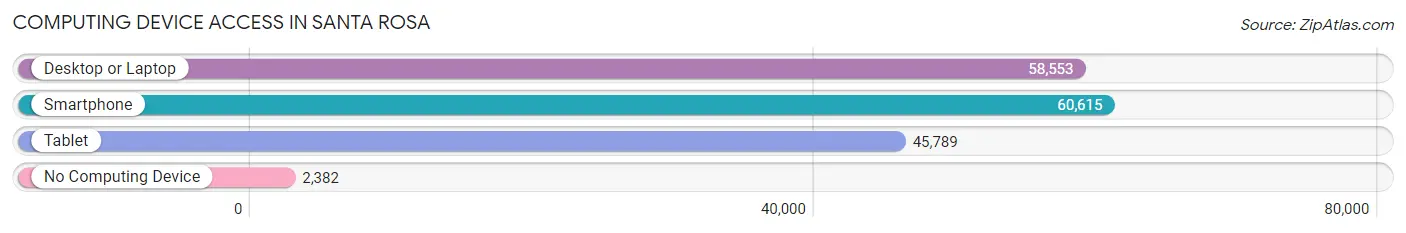
| Device Type | # Households | % Households |
| Desktop or Laptop | 58,553 | 86.0% |
| Smartphone | 60,615 | 89.0% |
| Tablet | 45,789 | 67.2% |
| No Computing Device | 2,382 | 3.5% |
| Total | 68,096 | 100.0% |
Internet Access in Santa Rosa
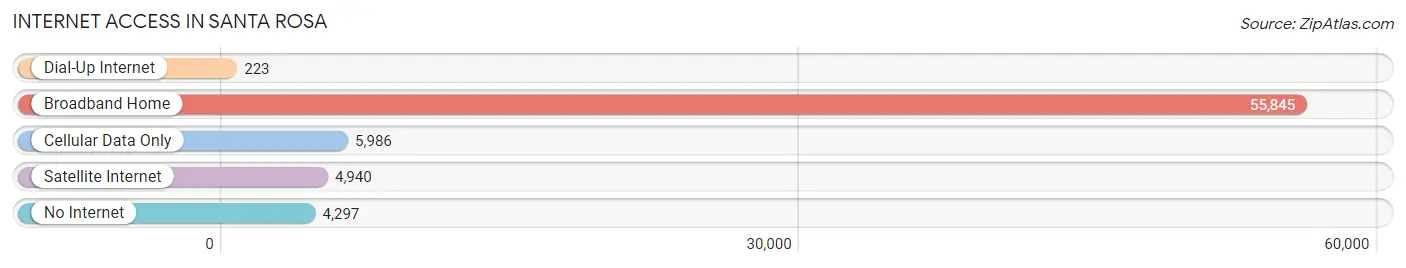
| Internet Type | # Households | % Households |
| Dial-Up Internet | 223 | 0.3% |
| Broadband Home | 55,845 | 82.0% |
| Cellular Data Only | 5,986 | 8.8% |
| Satellite Internet | 4,940 | 7.2% |
| No Internet | 4,297 | 6.3% |
| Total | 68,096 | 100.0% |
Santa Rosa Summary
History
The city of Santa Rosa, California is located in Sonoma County, approximately 55 miles north of San Francisco. It is the largest city in the county and the fifth largest city in the San Francisco Bay Area. The city was founded in 1833 by the Mexican government and was named after Saint Rose of Lima. The city was originally a small agricultural community, but it has grown significantly over the years.
The city of Santa Rosa has a rich history that dates back to the early 1800s. The first settlers in the area were the Pomo Indians, who lived in the area for thousands of years before the arrival of Europeans. The first Europeans to settle in the area were the Spanish, who established a mission in the area in 1823. The mission was named after Saint Rose of Lima, and the city was named after her as well.
In the mid-1800s, the city began to grow as a center for agriculture and industry. The city was home to a number of wineries, and it was also a major center for the lumber industry. The city was also home to a number of other industries, including tanneries, brickyards, and a number of other businesses.
In the late 1800s, the city began to experience a period of rapid growth. The population of the city grew from just over 1,000 in 1880 to over 10,000 by 1900. This growth was largely due to the arrival of the railroad, which connected the city to the rest of the country.
The city continued to grow throughout the 20th century, and by the year 2000, the population had grown to over 120,000. The city has continued to grow since then, and it is now home to over 175,000 people.
Geography
Santa Rosa is located in the northern part of Sonoma County, in the North Bay region of the San Francisco Bay Area. The city is situated on the Santa Rosa Plain, which is a flat, fertile area that is surrounded by hills and mountains. The city is located at the intersection of two major highways, US Highway 101 and State Route 12.
The city is located in a Mediterranean climate zone, which means that it experiences mild, wet winters and hot, dry summers. The average temperature in the city is around 60 degrees Fahrenheit, and the average annual rainfall is around 20 inches.
Economy
The economy of Santa Rosa is largely based on the service industry, with a number of major employers in the area. The largest employer in the city is the Santa Rosa Memorial Hospital, which employs over 4,000 people. Other major employers in the city include the Sonoma County government, the Santa Rosa City Schools, and the Santa Rosa Junior College.
The city is also home to a number of technology companies, including Adobe Systems, Autodesk, and Hewlett-Packard. The city is also home to a number of wineries, and it is a major center for the wine industry in the region.
Demographics
As of the 2010 census, the population of Santa Rosa was 175,155. The population is made up of a diverse mix of people, with the largest ethnic group being White (63.2%), followed by Hispanic or Latino (20.2%), Asian (7.2%), and African American (3.2%). The median household income in the city is $63,837, and the median home value is $521,000. The city has a high rate of homeownership, with over 70% of the population owning their own homes.
Common Questions
What is Per Capita Income in Santa Rosa?
Per Capita income in Santa Rosa is $46,804.
What is the Median Family Income in Santa Rosa?
Median Family Income in Santa Rosa is $110,196.
What is the Median Household income in Santa Rosa?
Median Household Income in Santa Rosa is $92,604.
What is Income or Wage Gap in Santa Rosa?
Income or Wage Gap in Santa Rosa is 21.5%.
Women in Santa Rosa earn 78.5 cents for every dollar earned by a man.
What is Family Income Deficit in Santa Rosa?
Family Income Deficit in Santa Rosa is $11,996.
Families that are below poverty line in Santa Rosa earn $11,996 less on average than the poverty threshold level.
What is Inequality or Gini Index in Santa Rosa?
Inequality or Gini Index in Santa Rosa is 0.44.
What is the Total Population of Santa Rosa?
Total Population of Santa Rosa is 178,221.
What is the Total Male Population of Santa Rosa?
Total Male Population of Santa Rosa is 86,975.
What is the Total Female Population of Santa Rosa?
Total Female Population of Santa Rosa is 91,246.
What is the Ratio of Males per 100 Females in Santa Rosa?
There are 95.32 Males per 100 Females in Santa Rosa.
What is the Ratio of Females per 100 Males in Santa Rosa?
There are 104.91 Females per 100 Males in Santa Rosa.
What is the Median Population Age in Santa Rosa?
Median Population Age in Santa Rosa is 40.4 Years.
What is the Average Family Size in Santa Rosa
Average Family Size in Santa Rosa is 3.1 People.
What is the Average Household Size in Santa Rosa
Average Household Size in Santa Rosa is 2.6 People.
How Large is the Labor Force in Santa Rosa?
There are 96,959 People in the Labor Forcein in Santa Rosa.
What is the Percentage of People in the Labor Force in Santa Rosa?
66.4% of People are in the Labor Force in Santa Rosa.
What is the Unemployment Rate in Santa Rosa?
Unemployment Rate in Santa Rosa is 5.6%.