Stockton, CA Map & Demographics
Stockton Map
Stockton Overview
$29,095
PER CAPITA INCOME
$78,345
AVG FAMILY INCOME
$71,612
AVG HOUSEHOLD INCOME
23.3%
WAGE / INCOME GAP [ % ]
76.7¢/ $1
WAGE / INCOME GAP [ $ ]
$11,521
FAMILY INCOME DEFICIT
0.45
INEQUALITY / GINI INDEX
320,030
TOTAL POPULATION
155,805
MALE POPULATION
164,225
FEMALE POPULATION
94.87
MALES / 100 FEMALES
105.40
FEMALES / 100 MALES
33.2
MEDIAN AGE
3.8
AVG FAMILY SIZE
3.2
AVG HOUSEHOLD SIZE
146,408
LABOR FORCE [ PEOPLE ]
60.3%
PERCENT IN LABOR FORCE
7.7%
UNEMPLOYMENT RATE
Stockton Zip Codes
Stockton Area Codes
Income in Stockton
Income Overview in Stockton
Per Capita Income in Stockton is $29,095, while median incomes of families and households are $78,345 and $71,612 respectively.
| Characteristic | Number | Measure |
| Per Capita Income | 320,030 | $29,095 |
| Median Family Income | 70,384 | $78,345 |
| Mean Family Income | 70,384 | $99,179 |
| Median Household Income | 96,975 | $71,612 |
| Mean Household Income | 96,975 | $91,983 |
| Income Deficit | 70,384 | $11,521 |
| Wage / Income Gap (%) | 320,030 | 23.35% |
| Wage / Income Gap ($) | 320,030 | 76.65¢ per $1 |
| Gini / Inequality Index | 320,030 | 0.45 |
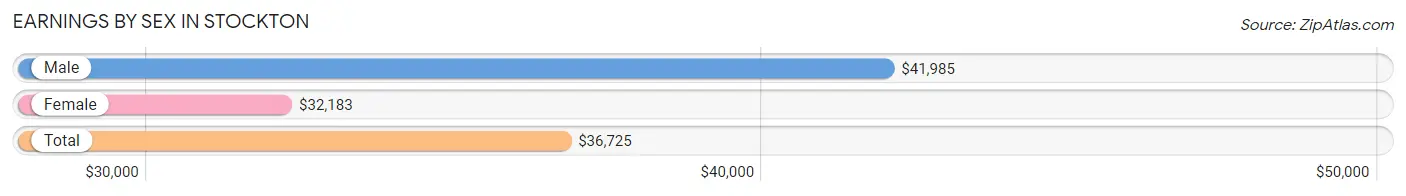
Earnings by Sex in Stockton
Average Earnings in Stockton are $36,725, $41,985 for men and $32,183 for women, a difference of 23.4%.
| Sex | Number | Average Earnings |
| Male | 78,778 (53.1%) | $41,985 |
| Female | 69,520 (46.9%) | $32,183 |
| Total | 148,298 (100.0%) | $36,725 |
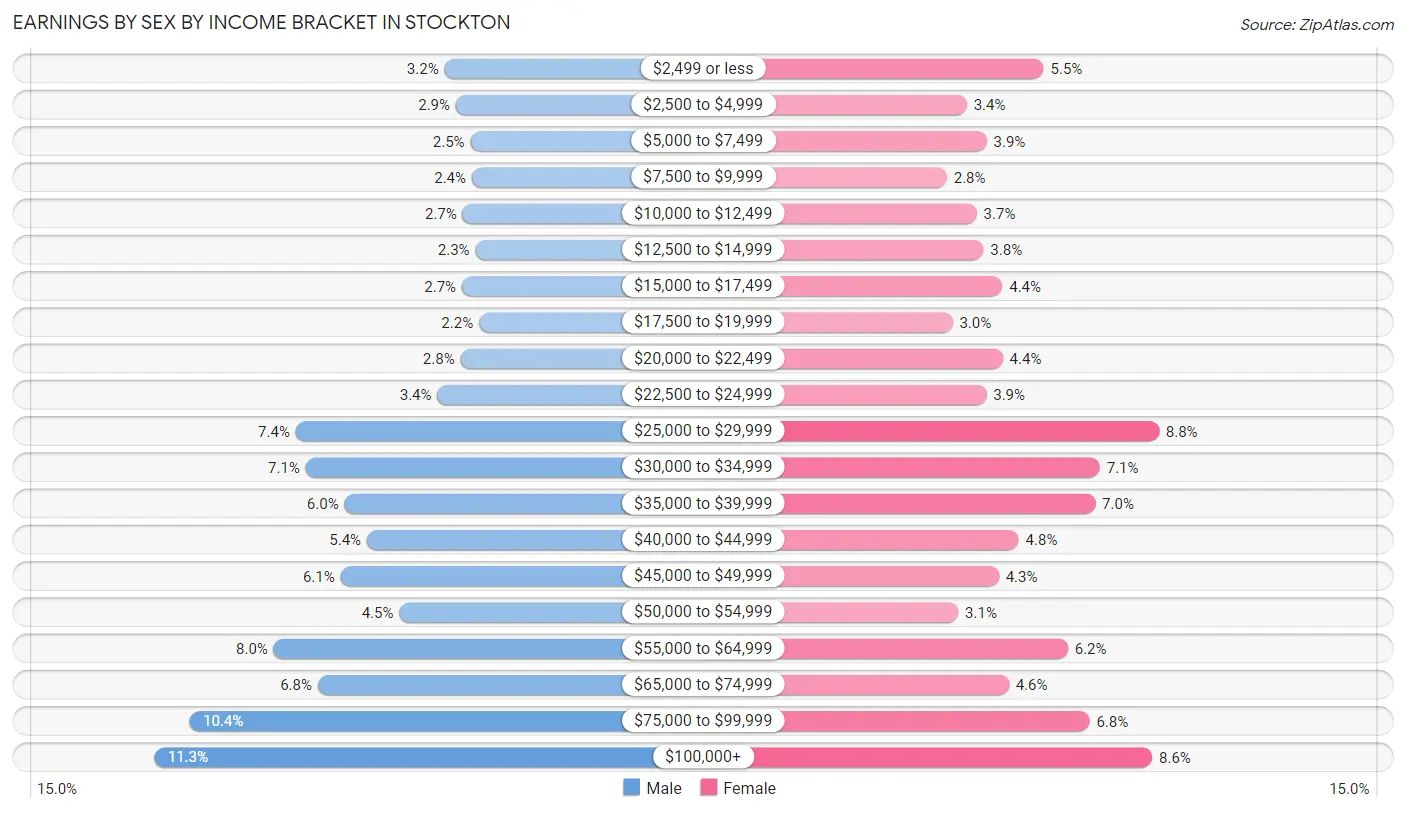
Earnings by Sex by Income Bracket in Stockton
The most common earnings brackets in Stockton are $100,000+ for men (8,937 | 11.3%) and $25,000 to $29,999 for women (6,100 | 8.8%).
| Income | Male | Female |
| $2,499 or less | 2,522 (3.2%) | 3,844 (5.5%) |
| $2,500 to $4,999 | 2,269 (2.9%) | 2,341 (3.4%) |
| $5,000 to $7,499 | 1,942 (2.5%) | 2,731 (3.9%) |
| $7,500 to $9,999 | 1,917 (2.4%) | 1,951 (2.8%) |
| $10,000 to $12,499 | 2,122 (2.7%) | 2,536 (3.6%) |
| $12,500 to $14,999 | 1,834 (2.3%) | 2,671 (3.8%) |
| $15,000 to $17,499 | 2,138 (2.7%) | 3,035 (4.4%) |
| $17,500 to $19,999 | 1,755 (2.2%) | 2,063 (3.0%) |
| $20,000 to $22,499 | 2,163 (2.8%) | 3,042 (4.4%) |
| $22,500 to $24,999 | 2,678 (3.4%) | 2,724 (3.9%) |
| $25,000 to $29,999 | 5,814 (7.4%) | 6,100 (8.8%) |
| $30,000 to $34,999 | 5,592 (7.1%) | 4,944 (7.1%) |
| $35,000 to $39,999 | 4,733 (6.0%) | 4,854 (7.0%) |
| $40,000 to $44,999 | 4,239 (5.4%) | 3,357 (4.8%) |
| $45,000 to $49,999 | 4,818 (6.1%) | 2,971 (4.3%) |
| $50,000 to $54,999 | 3,524 (4.5%) | 2,178 (3.1%) |
| $55,000 to $64,999 | 6,303 (8.0%) | 4,315 (6.2%) |
| $65,000 to $74,999 | 5,327 (6.8%) | 3,161 (4.5%) |
| $75,000 to $99,999 | 8,151 (10.3%) | 4,740 (6.8%) |
| $100,000+ | 8,937 (11.3%) | 5,962 (8.6%) |
| Total | 78,778 (100.0%) | 69,520 (100.0%) |
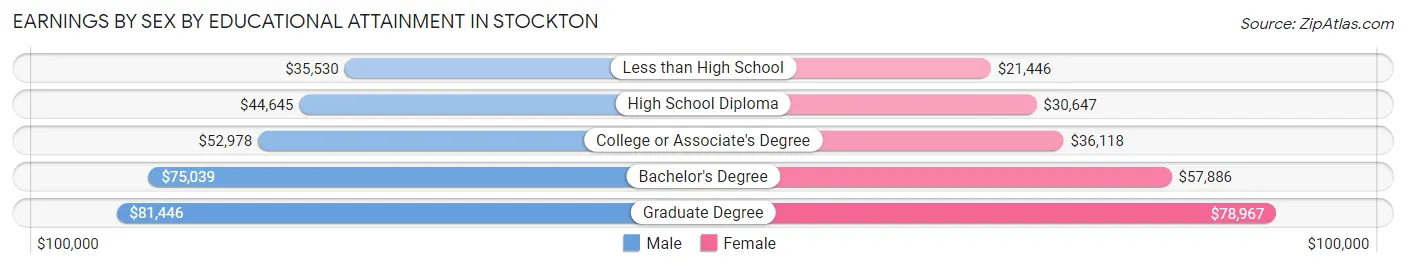
Earnings by Sex by Educational Attainment in Stockton
Average earnings in Stockton are $46,746 for men and $35,507 for women, a difference of 24.0%. Men with an educational attainment of graduate degree enjoy the highest average annual earnings of $81,446, while those with less than high school education earn the least with $35,530. Women with an educational attainment of graduate degree earn the most with the average annual earnings of $78,967, while those with less than high school education have the smallest earnings of $21,446.
| Educational Attainment | Male Income | Female Income |
| Less than High School | $35,530 | $21,446 |
| High School Diploma | $44,645 | $30,647 |
| College or Associate's Degree | $52,978 | $36,118 |
| Bachelor's Degree | $75,039 | $57,886 |
| Graduate Degree | $81,446 | $78,967 |
| Total | $46,746 | $35,507 |
Family Income in Stockton
Family Income Brackets in Stockton
According to the Stockton family income data, there are 13,795 families falling into the $100,000 to $149,999 income range, which is the most common income bracket and makes up 19.6% of all families. Conversely, the $10,000 to $14,999 income bracket is the least frequent group with only 1,619 families (2.3%) belonging to this category.
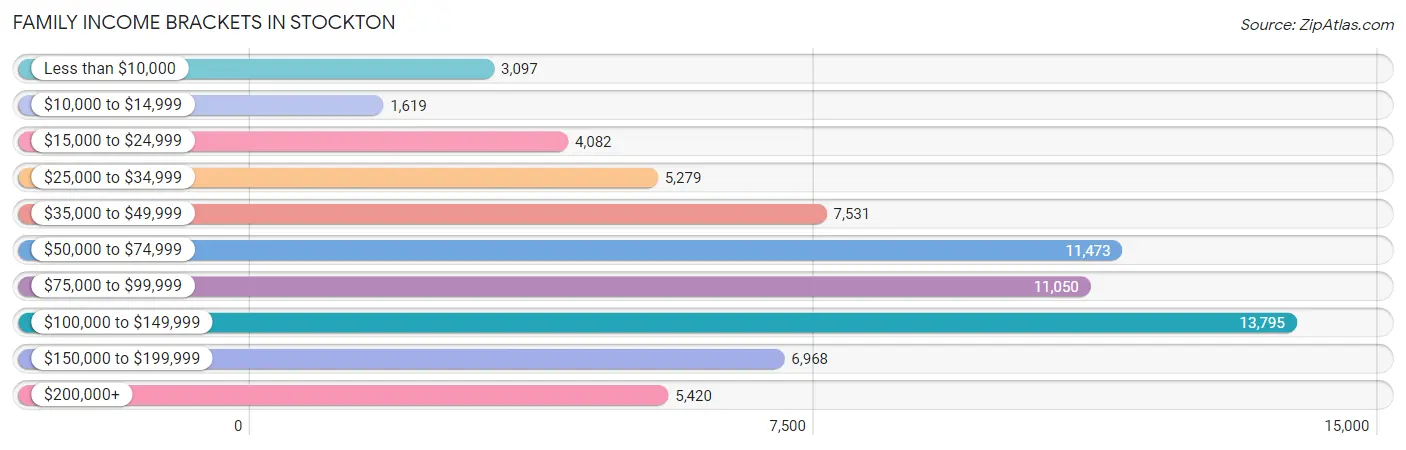
| Income Bracket | # Families | % Families |
| Less than $10,000 | 3,097 | 4.4% |
| $10,000 to $14,999 | 1,619 | 2.3% |
| $15,000 to $24,999 | 4,082 | 5.8% |
| $25,000 to $34,999 | 5,279 | 7.5% |
| $35,000 to $49,999 | 7,531 | 10.7% |
| $50,000 to $74,999 | 11,473 | 16.3% |
| $75,000 to $99,999 | 11,050 | 15.7% |
| $100,000 to $149,999 | 13,795 | 19.6% |
| $150,000 to $199,999 | 6,968 | 9.9% |
| $200,000+ | 5,420 | 7.7% |
Family Income by Famaliy Size in Stockton
7+ person families (3,824 | 5.4%) account for the highest median family income in Stockton with $104,761 per family, while 2-person families (23,290 | 33.1%) have the highest median income of $33,334 per family member.
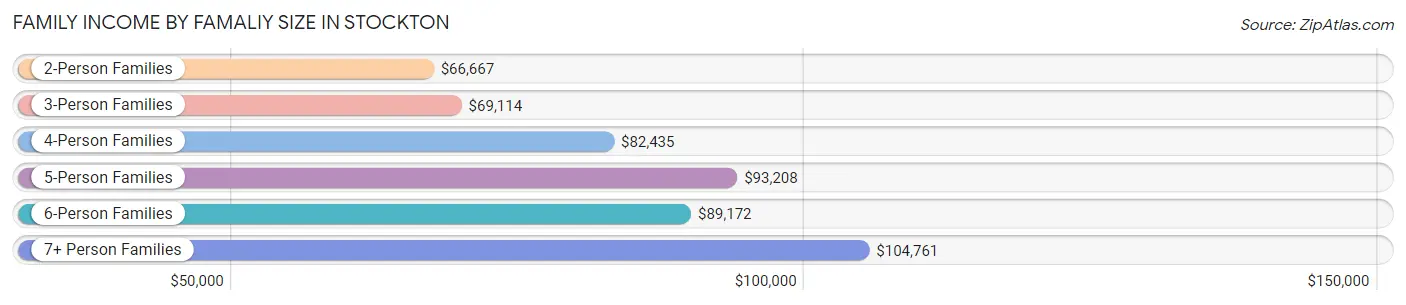
| Income Bracket | # Families | Median Income |
| 2-Person Families | 23,290 (33.1%) | $66,667 |
| 3-Person Families | 14,681 (20.9%) | $69,114 |
| 4-Person Families | 14,201 (20.2%) | $82,435 |
| 5-Person Families | 9,967 (14.2%) | $93,208 |
| 6-Person Families | 4,421 (6.3%) | $89,172 |
| 7+ Person Families | 3,824 (5.4%) | $104,761 |
| Total | 70,384 (100.0%) | $78,345 |
Family Income by Number of Earners in Stockton
The median family income in Stockton is $78,345, with families comprising 3+ earners (11,302) having the highest median family income of $135,068, while families with no earners (8,718) have the lowest median family income of $31,031, accounting for 16.1% and 12.4% of families, respectively.
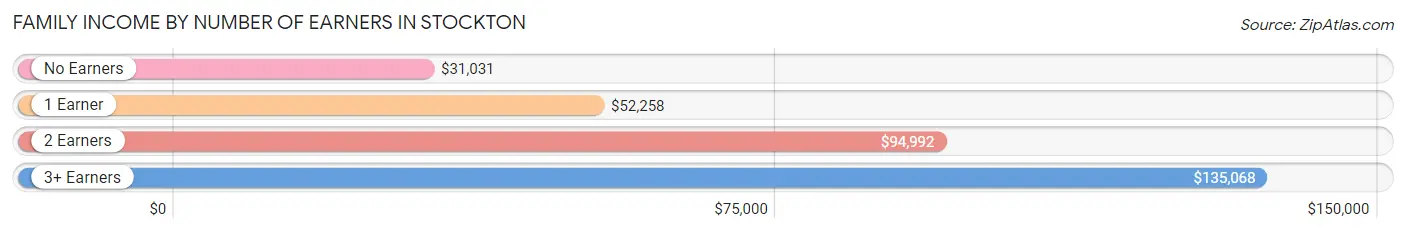
| Number of Earners | # Families | Median Income |
| No Earners | 8,718 (12.4%) | $31,031 |
| 1 Earner | 25,697 (36.5%) | $52,258 |
| 2 Earners | 24,667 (35.0%) | $94,992 |
| 3+ Earners | 11,302 (16.1%) | $135,068 |
| Total | 70,384 (100.0%) | $78,345 |
Household Income in Stockton
Household Income Brackets in Stockton
With 16,874 households falling in the category, the $100,000 to $149,999 income range is the most frequent in Stockton, accounting for 17.4% of all households. In contrast, only 3,879 households (4.0%) fall into the $10,000 to $14,999 income bracket, making it the least populous group.
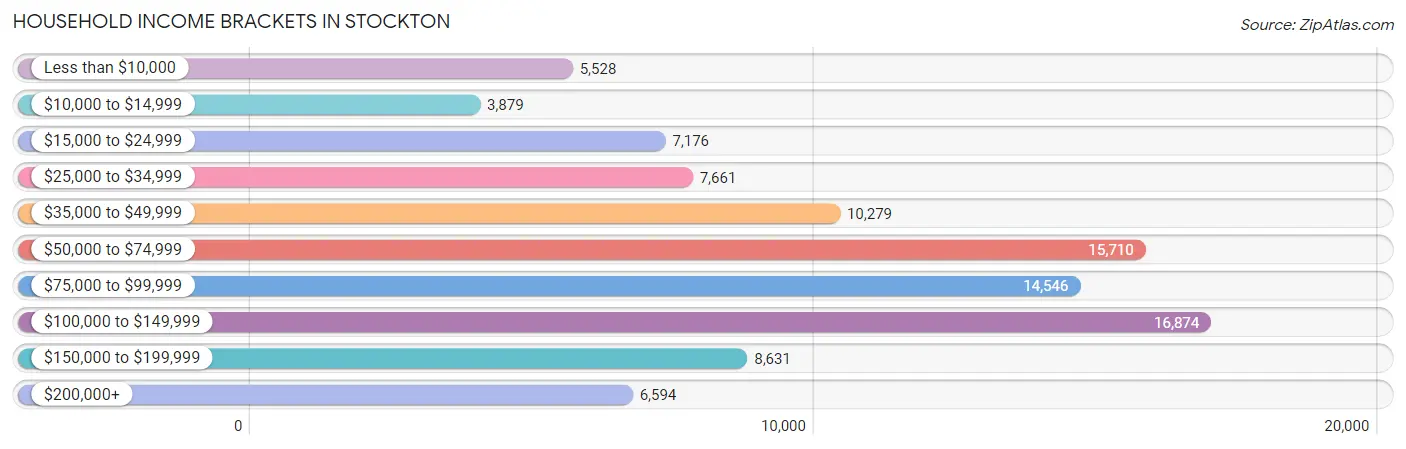
| Income Bracket | # Households | % Households |
| Less than $10,000 | 5,528 | 5.7% |
| $10,000 to $14,999 | 3,879 | 4.0% |
| $15,000 to $24,999 | 7,176 | 7.4% |
| $25,000 to $34,999 | 7,661 | 7.9% |
| $35,000 to $49,999 | 10,279 | 10.6% |
| $50,000 to $74,999 | 15,710 | 16.2% |
| $75,000 to $99,999 | 14,546 | 15.0% |
| $100,000 to $149,999 | 16,874 | 17.4% |
| $150,000 to $199,999 | 8,631 | 8.9% |
| $200,000+ | 6,594 | 6.8% |
Household Income by Householder Age in Stockton
The median household income in Stockton is $71,612, with the highest median household income of $83,769 found in the 45 to 64 years age bracket for the primary householder. A total of 35,096 households (36.2%) fall into this category. Meanwhile, the 15 to 24 years age bracket for the primary householder has the lowest median household income of $38,889, with 3,102 households (3.2%) in this group.
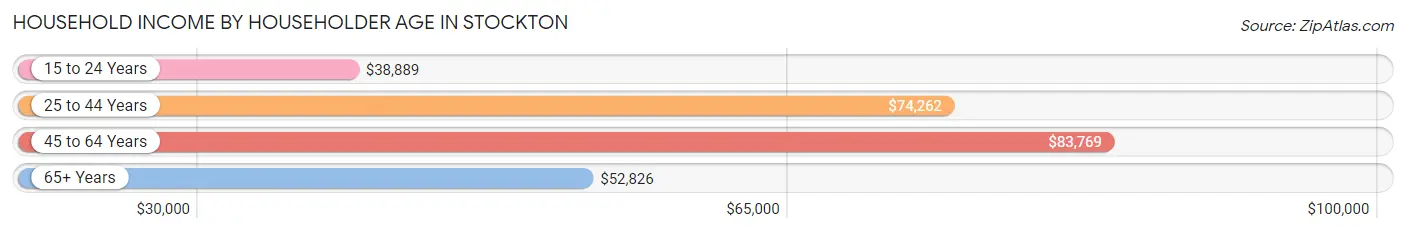
| Income Bracket | # Households | Median Income |
| 15 to 24 Years | 3,102 (3.2%) | $38,889 |
| 25 to 44 Years | 36,501 (37.6%) | $74,262 |
| 45 to 64 Years | 35,096 (36.2%) | $83,769 |
| 65+ Years | 22,276 (23.0%) | $52,826 |
| Total | 96,975 (100.0%) | $71,612 |
Poverty in Stockton
Income Below Poverty by Sex and Age in Stockton
With 14.1% poverty level for males and 17.1% for females among the residents of Stockton, 5 year old males and under 5 year old females are the most vulnerable to poverty, with 614 males (26.5%) and 2,834 females (25.0%) in their respective age groups living below the poverty level.
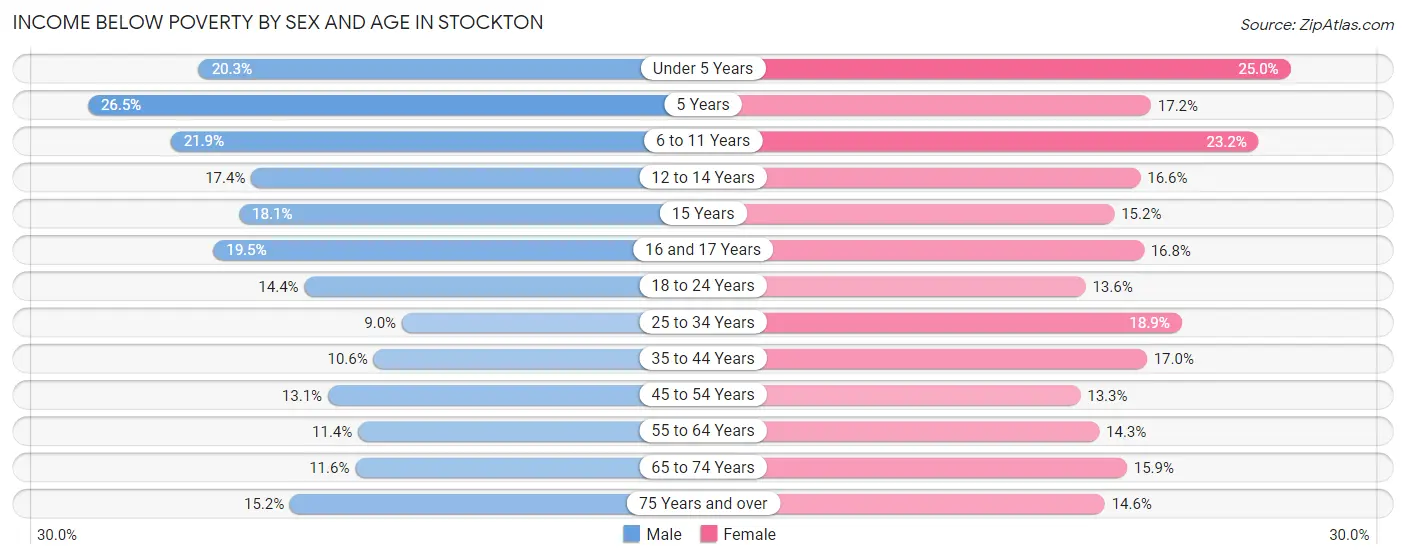
| Age Bracket | Male | Female |
| Under 5 Years | 2,116 (20.3%) | 2,834 (25.0%) |
| 5 Years | 614 (26.5%) | 322 (17.2%) |
| 6 to 11 Years | 3,076 (21.9%) | 3,347 (23.2%) |
| 12 to 14 Years | 1,289 (17.4%) | 1,334 (16.6%) |
| 15 Years | 510 (18.0%) | 401 (15.2%) |
| 16 and 17 Years | 1,111 (19.5%) | 823 (16.8%) |
| 18 to 24 Years | 2,328 (14.4%) | 2,212 (13.6%) |
| 25 to 34 Years | 2,130 (9.0%) | 4,179 (18.9%) |
| 35 to 44 Years | 2,228 (10.6%) | 3,668 (17.0%) |
| 45 to 54 Years | 2,343 (13.1%) | 2,417 (13.3%) |
| 55 to 64 Years | 1,746 (11.4%) | 2,388 (14.3%) |
| 65 to 74 Years | 1,168 (11.6%) | 2,148 (15.9%) |
| 75 Years and over | 1,007 (15.2%) | 1,371 (14.6%) |
| Total | 21,666 (14.1%) | 27,444 (17.1%) |
Income Above Poverty by Sex and Age in Stockton
According to the poverty statistics in Stockton, males aged 25 to 34 years and females aged 45 to 54 years are the age groups that are most secure financially, with 91.0% of males and 86.7% of females in these age groups living above the poverty line.
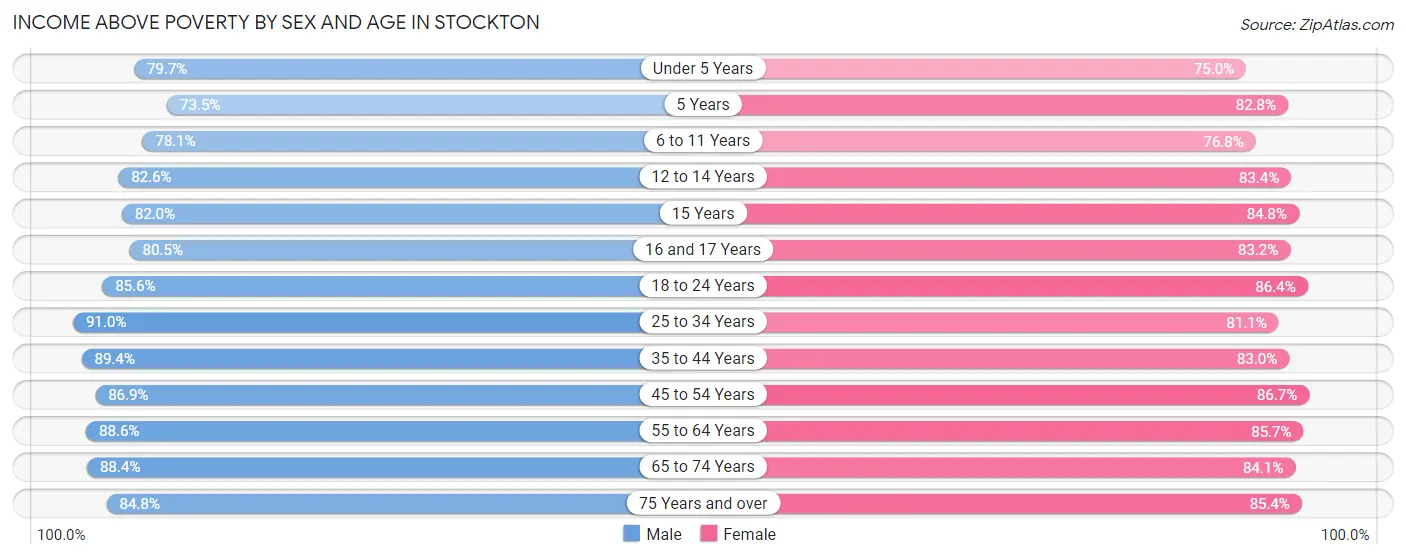
| Age Bracket | Male | Female |
| Under 5 Years | 8,308 (79.7%) | 8,512 (75.0%) |
| 5 Years | 1,706 (73.5%) | 1,549 (82.8%) |
| 6 to 11 Years | 10,996 (78.1%) | 11,074 (76.8%) |
| 12 to 14 Years | 6,128 (82.6%) | 6,693 (83.4%) |
| 15 Years | 2,315 (82.0%) | 2,242 (84.8%) |
| 16 and 17 Years | 4,588 (80.5%) | 4,072 (83.2%) |
| 18 to 24 Years | 13,813 (85.6%) | 14,094 (86.4%) |
| 25 to 34 Years | 21,554 (91.0%) | 17,913 (81.1%) |
| 35 to 44 Years | 18,842 (89.4%) | 17,930 (83.0%) |
| 45 to 54 Years | 15,526 (86.9%) | 15,786 (86.7%) |
| 55 to 64 Years | 13,523 (88.6%) | 14,271 (85.7%) |
| 65 to 74 Years | 8,911 (88.4%) | 11,389 (84.1%) |
| 75 Years and over | 5,611 (84.8%) | 7,991 (85.4%) |
| Total | 131,821 (85.9%) | 133,516 (83.0%) |
Income Below Poverty Among Married-Couple Families in Stockton
The poverty statistics for married-couple families in Stockton show that 7.4% or 3,164 of the total 42,706 families live below the poverty line. Families with 5 or more children have the highest poverty rate of 29.6%, comprising of 167 families. On the other hand, families with no children have the lowest poverty rate of 5.3%, which includes 1,039 families.
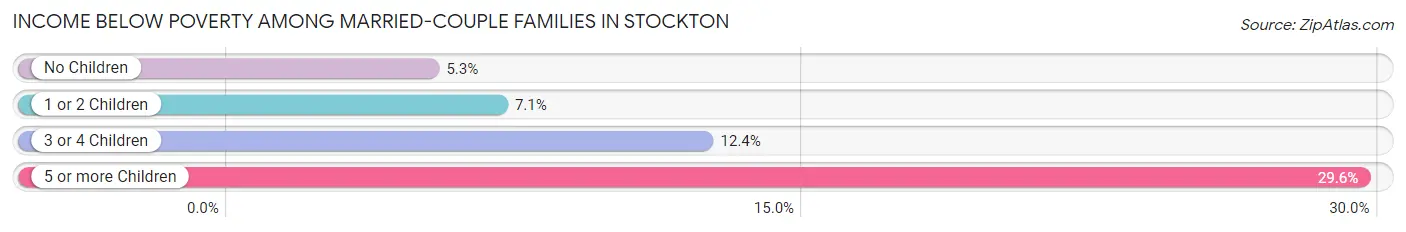
| Children | Above Poverty | Below Poverty |
| No Children | 18,727 (94.7%) | 1,039 (5.3%) |
| 1 or 2 Children | 14,212 (92.9%) | 1,078 (7.0%) |
| 3 or 4 Children | 6,205 (87.6%) | 880 (12.4%) |
| 5 or more Children | 398 (70.4%) | 167 (29.6%) |
| Total | 39,542 (92.6%) | 3,164 (7.4%) |
Income Below Poverty Among Single-Parent Households in Stockton
According to the poverty data in Stockton, 13.3% or 1,157 single-father households and 25.1% or 4,753 single-mother households are living below the poverty line. Among single-father households, those with 1 or 2 children have the highest poverty rate, with 634 households (15.7%) experiencing poverty. Likewise, among single-mother households, those with 5 or more children have the highest poverty rate, with 309 households (65.9%) falling below the poverty line.
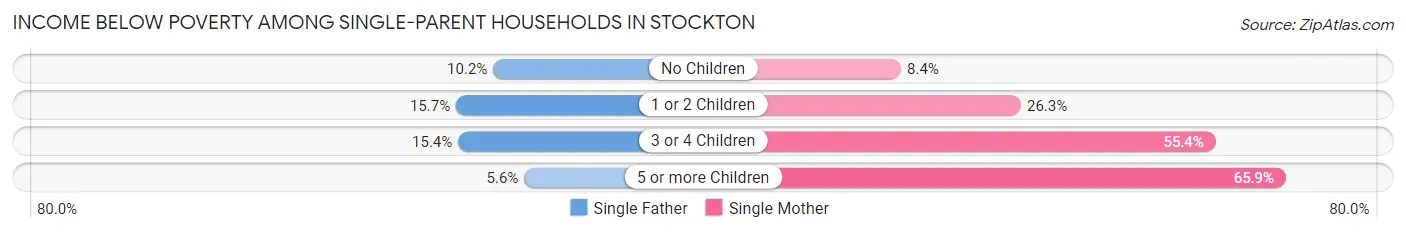
| Children | Single Father | Single Mother |
| No Children | 364 (10.2%) | 518 (8.4%) |
| 1 or 2 Children | 634 (15.7%) | 2,622 (26.3%) |
| 3 or 4 Children | 152 (15.4%) | 1,304 (55.4%) |
| 5 or more Children | 7 (5.6%) | 309 (65.9%) |
| Total | 1,157 (13.3%) | 4,753 (25.1%) |
Income Below Poverty Among Married-Couple vs Single-Parent Households in Stockton
The poverty data for Stockton shows that 3,164 of the married-couple family households (7.4%) and 5,910 of the single-parent households (21.3%) are living below the poverty level. Within the married-couple family households, those with 5 or more children have the highest poverty rate, with 167 households (29.6%) falling below the poverty line. Among the single-parent households, those with 5 or more children have the highest poverty rate, with 316 household (53.1%) living below poverty.
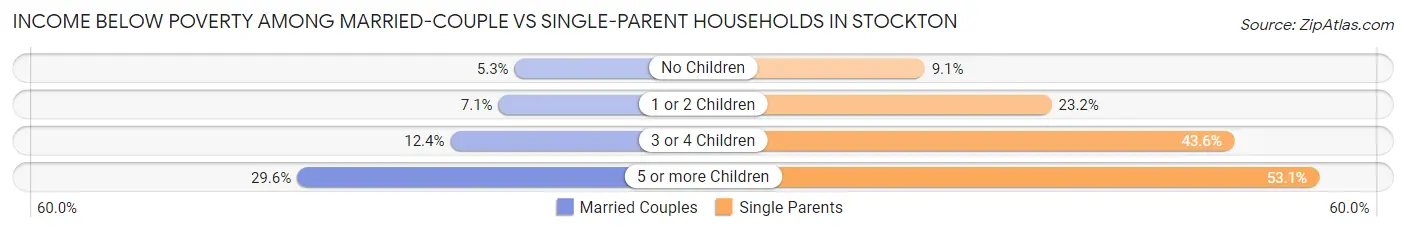
| Children | Married-Couple Families | Single-Parent Households |
| No Children | 1,039 (5.3%) | 882 (9.1%) |
| 1 or 2 Children | 1,078 (7.0%) | 3,256 (23.2%) |
| 3 or 4 Children | 880 (12.4%) | 1,456 (43.6%) |
| 5 or more Children | 167 (29.6%) | 316 (53.1%) |
| Total | 3,164 (7.4%) | 5,910 (21.3%) |
Race in Stockton
The most populous races in Stockton are Hispanic or Latino (144,731 | 45.2%), White / Caucasian (100,313 | 31.3%), and Asian (66,792 | 20.9%).
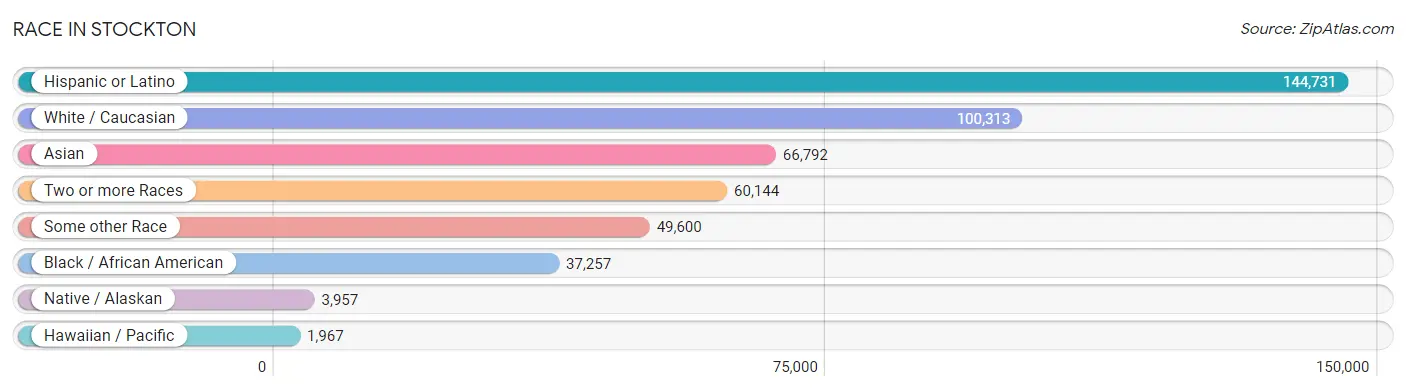
| Race | # Population | % Population |
| Asian | 66,792 | 20.9% |
| Black / African American | 37,257 | 11.6% |
| Hawaiian / Pacific | 1,967 | 0.6% |
| Hispanic or Latino | 144,731 | 45.2% |
| Native / Alaskan | 3,957 | 1.2% |
| White / Caucasian | 100,313 | 31.3% |
| Two or more Races | 60,144 | 18.8% |
| Some other Race | 49,600 | 15.5% |
| Total | 320,030 | 100.0% |
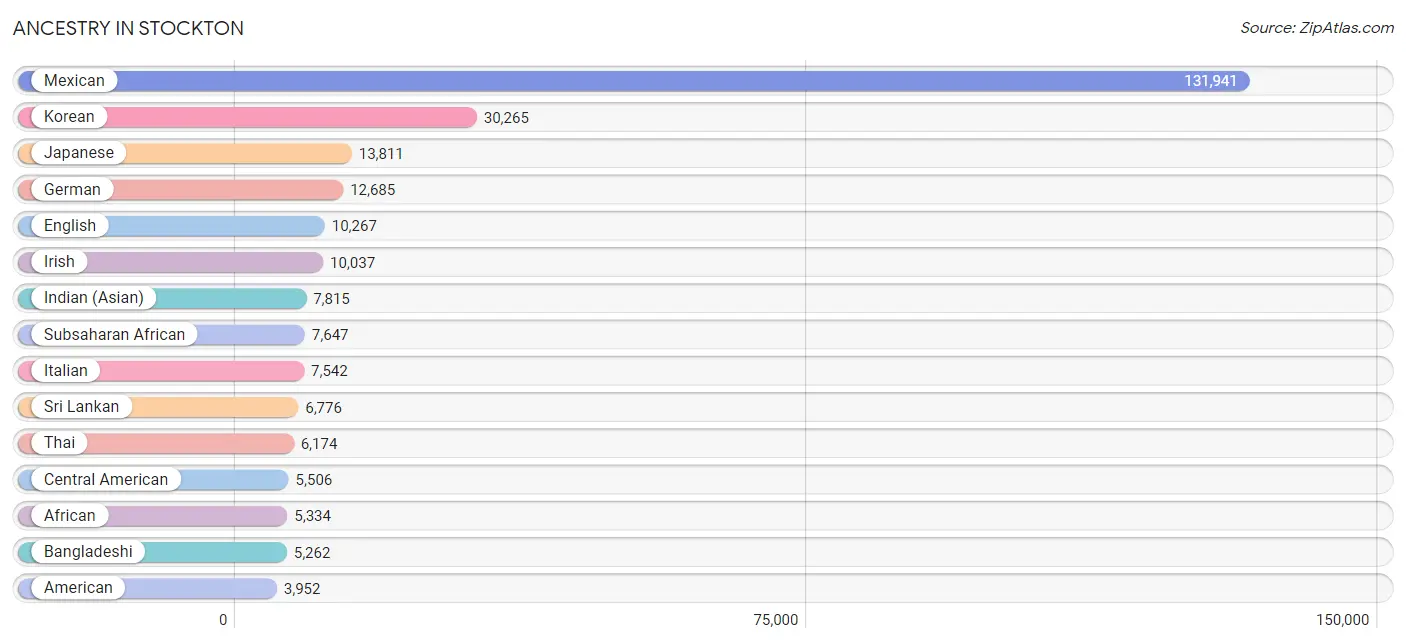
Ancestry in Stockton
The most populous ancestries reported in Stockton are Mexican (131,941 | 41.2%), Korean (30,265 | 9.5%), Japanese (13,811 | 4.3%), German (12,685 | 4.0%), and English (10,267 | 3.2%), together accounting for 62.2% of all Stockton residents.
| Ancestry | # Population | % Population |
| Afghan | 143 | 0.0% |
| African | 5,334 | 1.7% |
| Alaska Native | 15 | 0.0% |
| Alaskan Athabascan | 18 | 0.0% |
| Albanian | 90 | 0.0% |
| Aleut | 7 | 0.0% |
| Alsatian | 27 | 0.0% |
| American | 3,952 | 1.2% |
| Apache | 387 | 0.1% |
| Arab | 1,529 | 0.5% |
| Argentinean | 74 | 0.0% |
| Armenian | 237 | 0.1% |
| Assyrian / Chaldean / Syriac | 31 | 0.0% |
| Austrian | 272 | 0.1% |
| Bangladeshi | 5,262 | 1.6% |
| Basque | 39 | 0.0% |
| Belgian | 104 | 0.0% |
| Bhutanese | 1,902 | 0.6% |
| Blackfeet | 623 | 0.2% |
| Bolivian | 14 | 0.0% |
| Brazilian | 309 | 0.1% |
| British | 582 | 0.2% |
| British West Indian | 31 | 0.0% |
| Bulgarian | 1 | 0.0% |
| Burmese | 986 | 0.3% |
| Cambodian | 39 | 0.0% |
| Canadian | 148 | 0.1% |
| Cape Verdean | 51 | 0.0% |
| Central American | 5,506 | 1.7% |
| Central American Indian | 701 | 0.2% |
| Cherokee | 1,443 | 0.4% |
| Cheyenne | 11 | 0.0% |
| Chickasaw | 62 | 0.0% |
| Chilean | 98 | 0.0% |
| Chippewa | 222 | 0.1% |
| Choctaw | 504 | 0.2% |
| Colombian | 216 | 0.1% |
| Costa Rican | 7 | 0.0% |
| Cree | 10 | 0.0% |
| Creek | 7 | 0.0% |
| Croatian | 295 | 0.1% |
| Cuban | 69 | 0.0% |
| Czech | 283 | 0.1% |
| Czechoslovakian | 136 | 0.0% |
| Danish | 675 | 0.2% |
| Delaware | 7 | 0.0% |
| Dominican | 83 | 0.0% |
| Dutch | 1,083 | 0.3% |
| Eastern European | 72 | 0.0% |
| Ecuadorian | 10 | 0.0% |
| Egyptian | 108 | 0.0% |
| English | 10,267 | 3.2% |
| Estonian | 27 | 0.0% |
| Ethiopian | 23 | 0.0% |
| European | 3,054 | 0.9% |
| Filipino | 292 | 0.1% |
| Finnish | 80 | 0.0% |
| French | 1,938 | 0.6% |
| French American Indian | 35 | 0.0% |
| French Canadian | 222 | 0.1% |
| German | 12,685 | 4.0% |
| German Russian | 15 | 0.0% |
| Ghanaian | 342 | 0.1% |
| Greek | 662 | 0.2% |
| Guamanian / Chamorro | 733 | 0.2% |
| Guatemalan | 1,913 | 0.6% |
| Haitian | 78 | 0.0% |
| Honduran | 429 | 0.1% |
| Hopi | 101 | 0.0% |
| Hungarian | 214 | 0.1% |
| Icelander | 16 | 0.0% |
| Indian (Asian) | 7,815 | 2.4% |
| Indonesian | 210 | 0.1% |
| Iranian | 466 | 0.2% |
| Iraqi | 11 | 0.0% |
| Irish | 10,037 | 3.1% |
| Iroquois | 28 | 0.0% |
| Israeli | 86 | 0.0% |
| Italian | 7,542 | 2.4% |
| Jamaican | 202 | 0.1% |
| Japanese | 13,811 | 4.3% |
| Jordanian | 56 | 0.0% |
| Kenyan | 173 | 0.1% |
| Korean | 30,265 | 9.5% |
| Laotian | 116 | 0.0% |
| Latvian | 21 | 0.0% |
| Lebanese | 307 | 0.1% |
| Liberian | 546 | 0.2% |
| Lithuanian | 82 | 0.0% |
| Lumbee | 1 | 0.0% |
| Malaysian | 3,100 | 1.0% |
| Maltese | 4 | 0.0% |
| Mexican | 131,941 | 41.2% |
| Mexican American Indian | 1,307 | 0.4% |
| Native Hawaiian | 683 | 0.2% |
| Navajo | 243 | 0.1% |
| Nepalese | 142 | 0.0% |
| Nicaraguan | 424 | 0.1% |
| Nigerian | 923 | 0.3% |
| Northern European | 92 | 0.0% |
| Norwegian | 1,154 | 0.4% |
| Osage | 51 | 0.0% |
| Ottawa | 30 | 0.0% |
| Paiute | 8 | 0.0% |
| Pakistani | 598 | 0.2% |
| Palestinian | 245 | 0.1% |
| Panamanian | 122 | 0.0% |
| Pennsylvania German | 12 | 0.0% |
| Peruvian | 185 | 0.1% |
| Polish | 1,216 | 0.4% |
| Portuguese | 2,866 | 0.9% |
| Potawatomi | 43 | 0.0% |
| Pueblo | 13 | 0.0% |
| Puerto Rican | 2,083 | 0.6% |
| Romanian | 139 | 0.0% |
| Russian | 450 | 0.1% |
| Salvadoran | 2,540 | 0.8% |
| Samoan | 1,226 | 0.4% |
| Scandinavian | 268 | 0.1% |
| Scotch-Irish | 801 | 0.3% |
| Scottish | 1,537 | 0.5% |
| Seminole | 36 | 0.0% |
| Serbian | 13 | 0.0% |
| Shoshone | 11 | 0.0% |
| Sioux | 306 | 0.1% |
| Slavic | 155 | 0.1% |
| Slovak | 11 | 0.0% |
| Slovene | 16 | 0.0% |
| South American | 645 | 0.2% |
| South American Indian | 90 | 0.0% |
| Spaniard | 1,043 | 0.3% |
| Spanish | 1,587 | 0.5% |
| Spanish American | 68 | 0.0% |
| Spanish American Indian | 6 | 0.0% |
| Sri Lankan | 6,776 | 2.1% |
| Subsaharan African | 7,647 | 2.4% |
| Swedish | 793 | 0.3% |
| Swiss | 256 | 0.1% |
| Syrian | 237 | 0.1% |
| Thai | 6,174 | 1.9% |
| Tlingit-Haida | 72 | 0.0% |
| Tohono O'Odham | 6 | 0.0% |
| Tongan | 333 | 0.1% |
| Trinidadian and Tobagonian | 3 | 0.0% |
| Turkish | 9 | 0.0% |
| Ukrainian | 250 | 0.1% |
| Ute | 7 | 0.0% |
| Venezuelan | 48 | 0.0% |
| Vietnamese | 30 | 0.0% |
| Welsh | 467 | 0.2% |
| West Indian | 114 | 0.0% |
| Yakama | 6 | 0.0% |
| Yaqui | 157 | 0.1% |
| Yugoslavian | 22 | 0.0% |
| Yuman | 1 | 0.0% | View All 155 Rows |
Immigrants in Stockton
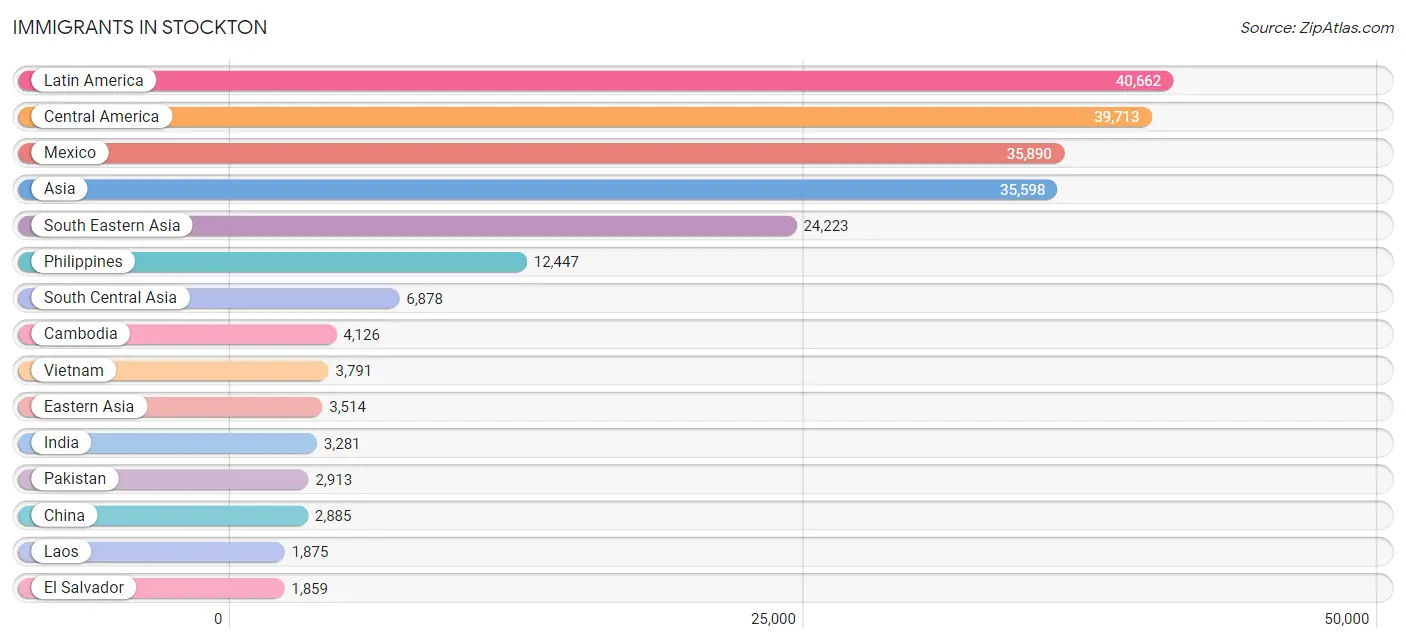
The most numerous immigrant groups reported in Stockton came from Latin America (40,662 | 12.7%), Central America (39,713 | 12.4%), Mexico (35,890 | 11.2%), Asia (35,598 | 11.1%), and South Eastern Asia (24,223 | 7.6%), together accounting for 55.0% of all Stockton residents.
| Immigration Origin | # Population | % Population |
| Afghanistan | 100 | 0.0% |
| Africa | 1,554 | 0.5% |
| Argentina | 68 | 0.0% |
| Asia | 35,598 | 11.1% |
| Australia | 119 | 0.0% |
| Bangladesh | 46 | 0.0% |
| Belarus | 27 | 0.0% |
| Bolivia | 9 | 0.0% |
| Brazil | 307 | 0.1% |
| Bulgaria | 1 | 0.0% |
| Cambodia | 4,126 | 1.3% |
| Cameroon | 68 | 0.0% |
| Canada | 252 | 0.1% |
| Caribbean | 183 | 0.1% |
| Central America | 39,713 | 12.4% |
| Chile | 96 | 0.0% |
| China | 2,885 | 0.9% |
| Colombia | 99 | 0.0% |
| Costa Rica | 7 | 0.0% |
| Croatia | 13 | 0.0% |
| Cuba | 22 | 0.0% |
| Czechoslovakia | 15 | 0.0% |
| Dominica | 19 | 0.0% |
| Eastern Africa | 134 | 0.0% |
| Eastern Asia | 3,514 | 1.1% |
| Eastern Europe | 397 | 0.1% |
| Ecuador | 9 | 0.0% |
| Egypt | 70 | 0.0% |
| El Salvador | 1,859 | 0.6% |
| England | 69 | 0.0% |
| Ethiopia | 5 | 0.0% |
| Europe | 1,334 | 0.4% |
| Fiji | 619 | 0.2% |
| France | 104 | 0.0% |
| Germany | 165 | 0.1% |
| Ghana | 330 | 0.1% |
| Greece | 6 | 0.0% |
| Guatemala | 1,313 | 0.4% |
| Haiti | 17 | 0.0% |
| Honduras | 238 | 0.1% |
| Hong Kong | 395 | 0.1% |
| Hungary | 19 | 0.0% |
| India | 3,281 | 1.0% |
| Indonesia | 103 | 0.0% |
| Iran | 338 | 0.1% |
| Ireland | 91 | 0.0% |
| Israel | 36 | 0.0% |
| Italy | 109 | 0.0% |
| Jamaica | 52 | 0.0% |
| Japan | 284 | 0.1% |
| Jordan | 84 | 0.0% |
| Kenya | 121 | 0.0% |
| Korea | 345 | 0.1% |
| Laos | 1,875 | 0.6% |
| Latin America | 40,662 | 12.7% |
| Lebanon | 98 | 0.0% |
| Liberia | 370 | 0.1% |
| Mexico | 35,890 | 11.2% |
| Middle Africa | 68 | 0.0% |
| Netherlands | 14 | 0.0% |
| Nicaragua | 250 | 0.1% |
| Nigeria | 383 | 0.1% |
| Northern Africa | 95 | 0.0% |
| Northern Europe | 243 | 0.1% |
| Norway | 25 | 0.0% |
| Oceania | 1,039 | 0.3% |
| Pakistan | 2,913 | 0.9% |
| Panama | 115 | 0.0% |
| Peru | 170 | 0.1% |
| Philippines | 12,447 | 3.9% |
| Poland | 131 | 0.0% |
| Portugal | 277 | 0.1% |
| Romania | 48 | 0.0% |
| Russia | 30 | 0.0% |
| Saudi Arabia | 40 | 0.0% |
| Sierra Leone | 69 | 0.0% |
| Singapore | 13 | 0.0% |
| South Africa | 39 | 0.0% |
| South America | 766 | 0.2% |
| South Central Asia | 6,878 | 2.1% |
| South Eastern Asia | 24,223 | 7.6% |
| Southern Europe | 407 | 0.1% |
| Spain | 15 | 0.0% |
| Sri Lanka | 200 | 0.1% |
| Switzerland | 4 | 0.0% |
| Syria | 344 | 0.1% |
| Taiwan | 368 | 0.1% |
| Thailand | 1,633 | 0.5% |
| Trinidad and Tobago | 11 | 0.0% |
| Ukraine | 33 | 0.0% |
| Venezuela | 8 | 0.0% |
| Vietnam | 3,791 | 1.2% |
| West Indies | 31 | 0.0% |
| Western Africa | 1,184 | 0.4% |
| Western Asia | 941 | 0.3% |
| Western Europe | 287 | 0.1% |
| Yemen | 320 | 0.1% | View All 97 Rows |
Sex and Age in Stockton
Sex and Age in Stockton
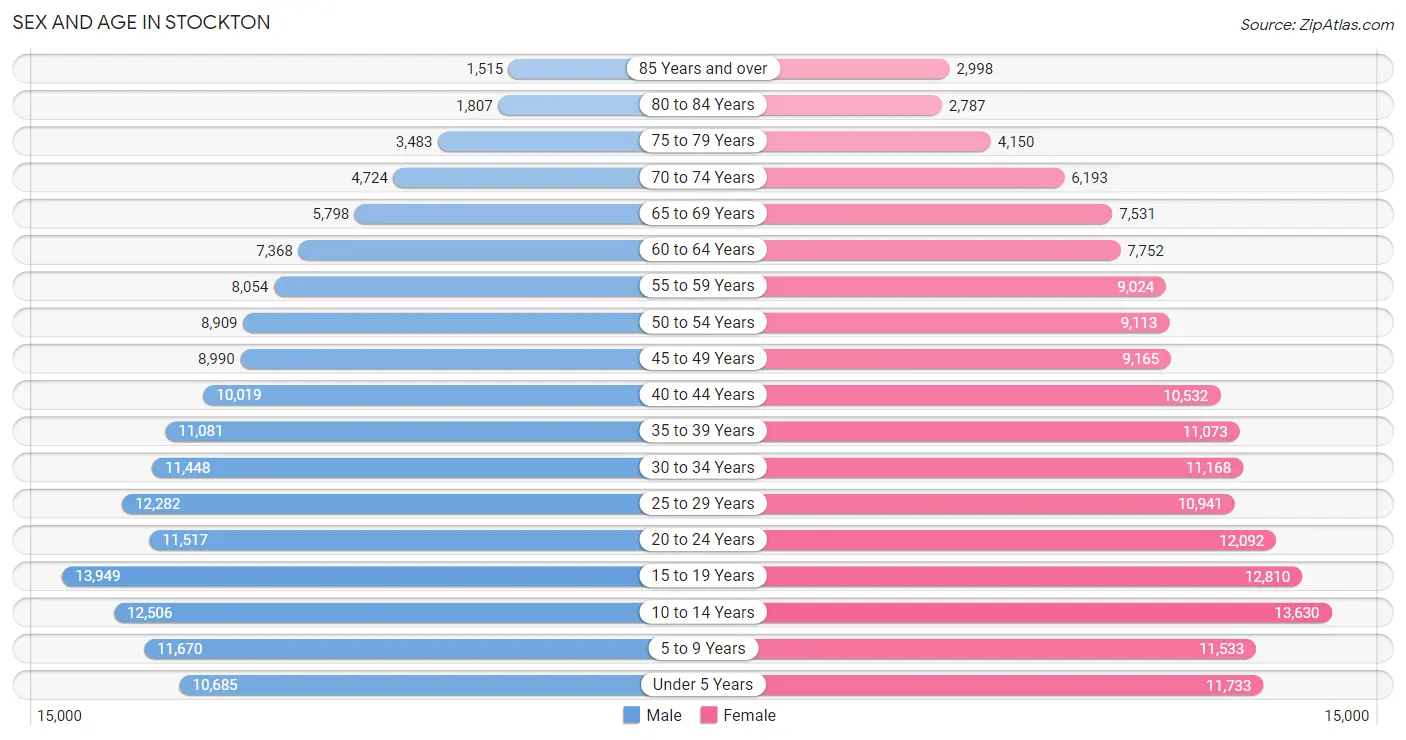
The most populous age groups in Stockton are 15 to 19 Years (13,949 | 8.9%) for men and 10 to 14 Years (13,630 | 8.3%) for women.
| Age Bracket | Male | Female |
| Under 5 Years | 10,685 (6.9%) | 11,733 (7.1%) |
| 5 to 9 Years | 11,670 (7.5%) | 11,533 (7.0%) |
| 10 to 14 Years | 12,506 (8.0%) | 13,630 (8.3%) |
| 15 to 19 Years | 13,949 (8.9%) | 12,810 (7.8%) |
| 20 to 24 Years | 11,517 (7.4%) | 12,092 (7.4%) |
| 25 to 29 Years | 12,282 (7.9%) | 10,941 (6.7%) |
| 30 to 34 Years | 11,448 (7.3%) | 11,168 (6.8%) |
| 35 to 39 Years | 11,081 (7.1%) | 11,073 (6.7%) |
| 40 to 44 Years | 10,019 (6.4%) | 10,532 (6.4%) |
| 45 to 49 Years | 8,990 (5.8%) | 9,165 (5.6%) |
| 50 to 54 Years | 8,909 (5.7%) | 9,113 (5.6%) |
| 55 to 59 Years | 8,054 (5.2%) | 9,024 (5.5%) |
| 60 to 64 Years | 7,368 (4.7%) | 7,752 (4.7%) |
| 65 to 69 Years | 5,798 (3.7%) | 7,531 (4.6%) |
| 70 to 74 Years | 4,724 (3.0%) | 6,193 (3.8%) |
| 75 to 79 Years | 3,483 (2.2%) | 4,150 (2.5%) |
| 80 to 84 Years | 1,807 (1.2%) | 2,787 (1.7%) |
| 85 Years and over | 1,515 (1.0%) | 2,998 (1.8%) |
| Total | 155,805 (100.0%) | 164,225 (100.0%) |
Families and Households in Stockton
Median Family Size in Stockton
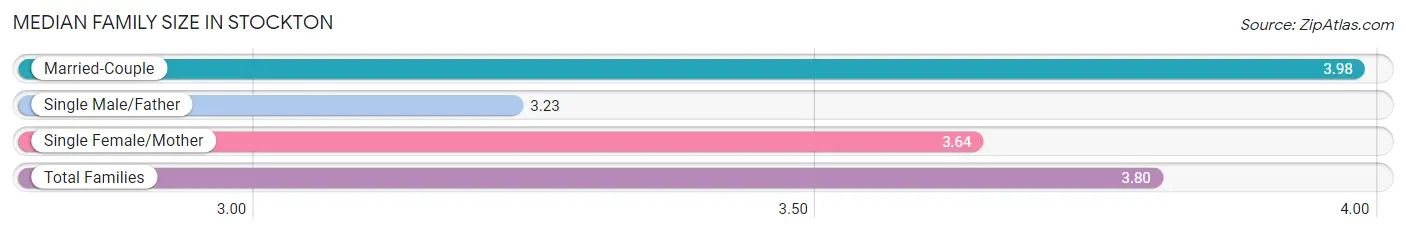
The median family size in Stockton is 3.80 persons per family, with married-couple families (42,706 | 60.7%) accounting for the largest median family size of 3.98 persons per family. On the other hand, single male/father families (8,721 | 12.4%) represent the smallest median family size with 3.23 persons per family.
| Family Type | # Families | Family Size |
| Married-Couple | 42,706 (60.7%) | 3.98 |
| Single Male/Father | 8,721 (12.4%) | 3.23 |
| Single Female/Mother | 18,957 (26.9%) | 3.64 |
| Total Families | 70,384 (100.0%) | 3.80 |
Median Household Size in Stockton
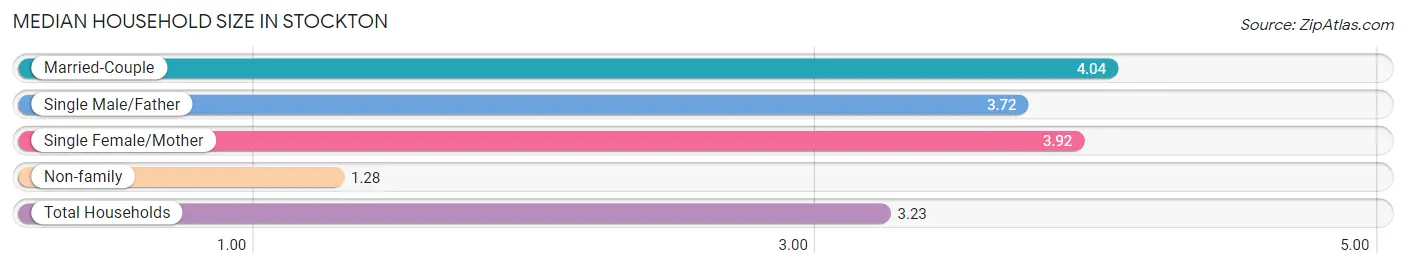
The median household size in Stockton is 3.23 persons per household, with married-couple households (42,706 | 44.0%) accounting for the largest median household size of 4.04 persons per household. non-family households (26,591 | 27.4%) represent the smallest median household size with 1.28 persons per household.
| Household Type | # Households | Household Size |
| Married-Couple | 42,706 (44.0%) | 4.04 |
| Single Male/Father | 8,721 (9.0%) | 3.72 |
| Single Female/Mother | 18,957 (19.6%) | 3.92 |
| Non-family | 26,591 (27.4%) | 1.28 |
| Total Households | 96,975 (100.0%) | 3.23 |
Household Size by Marriage Status in Stockton
Out of a total of 96,975 households in Stockton, 70,384 (72.6%) are family households, while 26,591 (27.4%) are nonfamily households. The most numerous type of family households are 2-person households, comprising 20,211, and the most common type of nonfamily households are 1-person households, comprising 21,379.
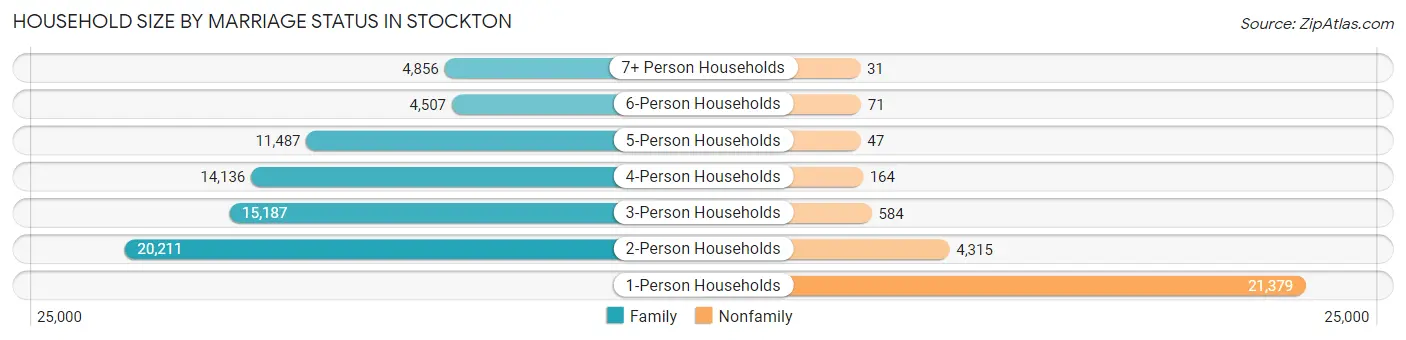
| Household Size | Family Households | Nonfamily Households |
| 1-Person Households | - | 21,379 (22.1%) |
| 2-Person Households | 20,211 (20.8%) | 4,315 (4.4%) |
| 3-Person Households | 15,187 (15.7%) | 584 (0.6%) |
| 4-Person Households | 14,136 (14.6%) | 164 (0.2%) |
| 5-Person Households | 11,487 (11.8%) | 47 (0.1%) |
| 6-Person Households | 4,507 (4.6%) | 71 (0.1%) |
| 7+ Person Households | 4,856 (5.0%) | 31 (0.0%) |
| Total | 70,384 (72.6%) | 26,591 (27.4%) |
Female Fertility in Stockton
Fertility by Age in Stockton
Average fertility rate in Stockton is 58.0 births per 1,000 women. Women in the age bracket of 20 to 34 years have the highest fertility rate with 101.0 births per 1,000 women. Women in the age bracket of 20 to 34 years acount for 75.3% of all women with births.
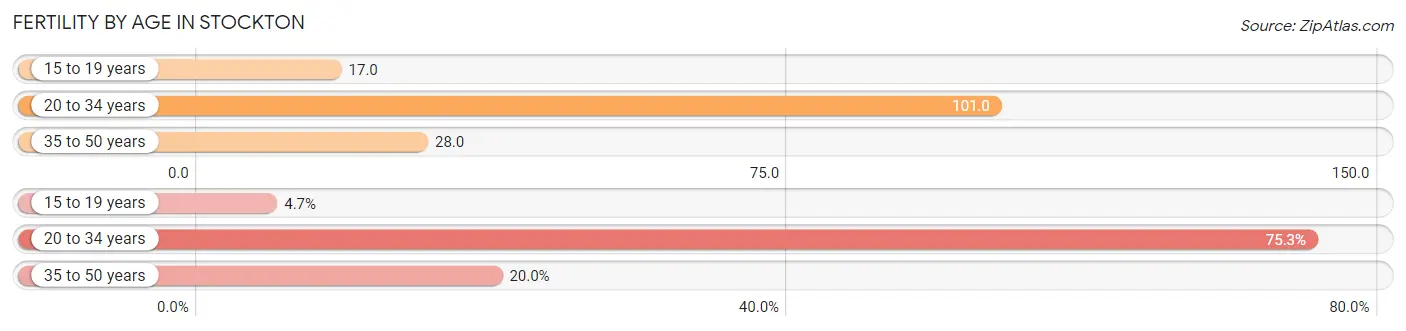
| Age Bracket | Women with Births | Births / 1,000 Women |
| 15 to 19 years | 216 (4.7%) | 17.0 |
| 20 to 34 years | 3,464 (75.3%) | 101.0 |
| 35 to 50 years | 919 (20.0%) | 28.0 |
| Total | 4,599 (100.0%) | 58.0 |
Fertility by Age by Marriage Status in Stockton
53.8% of women with births (4,599) in Stockton are married. The highest percentage of unmarried women with births falls into 15 to 19 years age bracket with 80.1% of them unmarried at the time of birth, while the lowest percentage of unmarried women with births belong to 35 to 50 years age bracket with 29.7% of them unmarried.
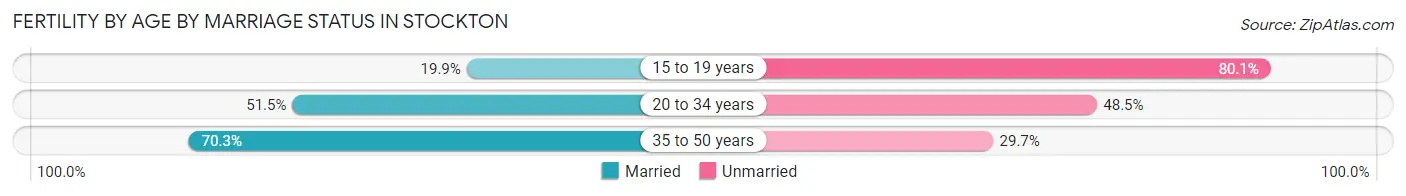
| Age Bracket | Married | Unmarried |
| 15 to 19 years | 43 (19.9%) | 173 (80.1%) |
| 20 to 34 years | 1,784 (51.5%) | 1,680 (48.5%) |
| 35 to 50 years | 646 (70.3%) | 273 (29.7%) |
| Total | 2,474 (53.8%) | 2,125 (46.2%) |
Fertility by Education in Stockton
Average fertility rate in Stockton is 58.0 births per 1,000 women. Women with the education attainment of graduate degree have the highest fertility rate of 78.0 births per 1,000 women, while women with the education attainment of less than high school have the lowest fertility at 43.0 births per 1,000 women. Women with the education attainment of high school diploma represent 36.5% of all women with births.
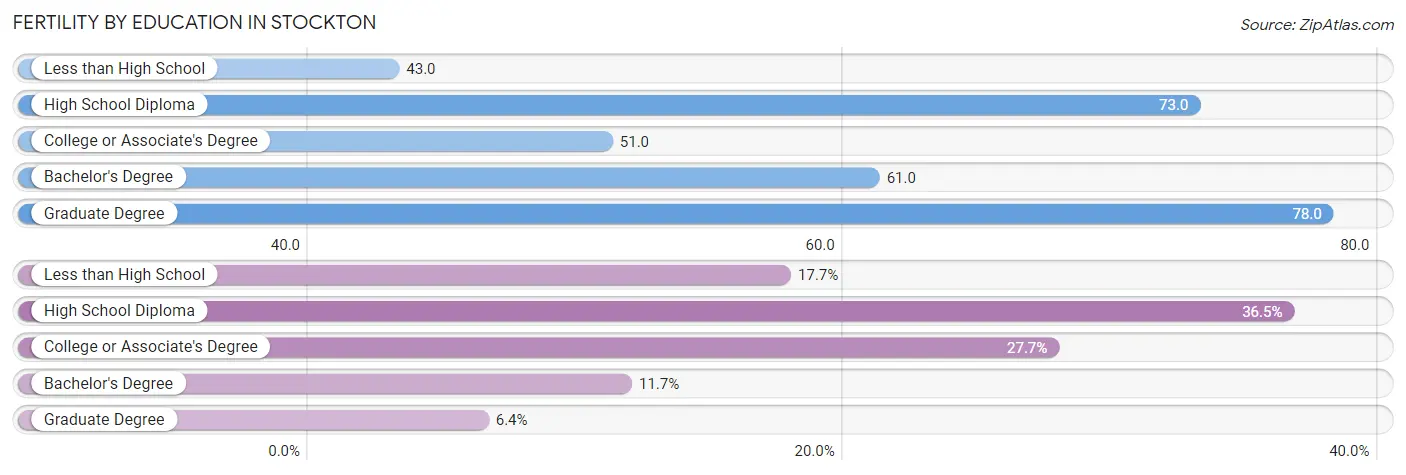
| Educational Attainment | Women with Births | Births / 1,000 Women |
| Less than High School | 813 (17.7%) | 43.0 |
| High School Diploma | 1,680 (36.5%) | 73.0 |
| College or Associate's Degree | 1,275 (27.7%) | 51.0 |
| Bachelor's Degree | 539 (11.7%) | 61.0 |
| Graduate Degree | 292 (6.4%) | 78.0 |
| Total | 4,599 (100.0%) | 58.0 |
Fertility by Education by Marriage Status in Stockton
46.2% of women with births in Stockton are unmarried. Women with the educational attainment of bachelor's degree are most likely to be married with 75.0% of them married at childbirth, while women with the educational attainment of high school diploma are least likely to be married with 57.2% of them unmarried at childbirth.
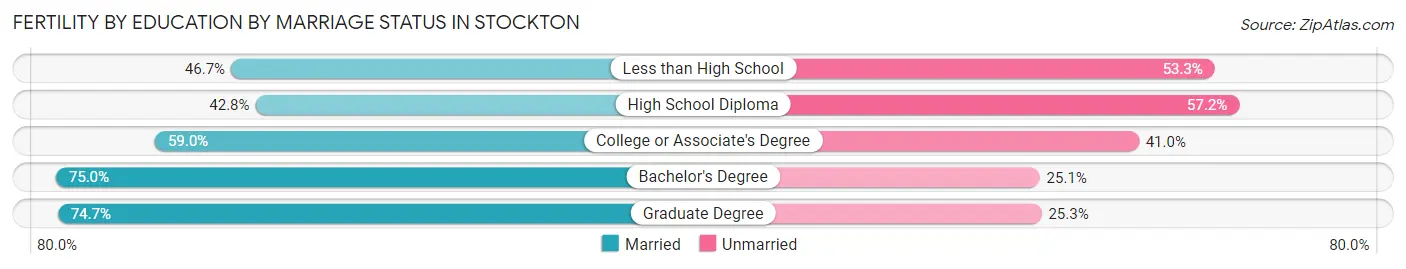
| Educational Attainment | Married | Unmarried |
| Less than High School | 380 (46.7%) | 433 (53.3%) |
| High School Diploma | 719 (42.8%) | 961 (57.2%) |
| College or Associate's Degree | 752 (59.0%) | 523 (41.0%) |
| Bachelor's Degree | 404 (75.0%) | 135 (25.1%) |
| Graduate Degree | 218 (74.7%) | 74 (25.3%) |
| Total | 2,474 (53.8%) | 2,125 (46.2%) |
Employment Characteristics in Stockton
Employment by Class of Employer in Stockton
Among the 129,635 employed individuals in Stockton, private company employees (92,423 | 71.3%), local government employees (10,284 | 7.9%), and not-for-profit organizations (9,358 | 7.2%) make up the most common classes of employment.
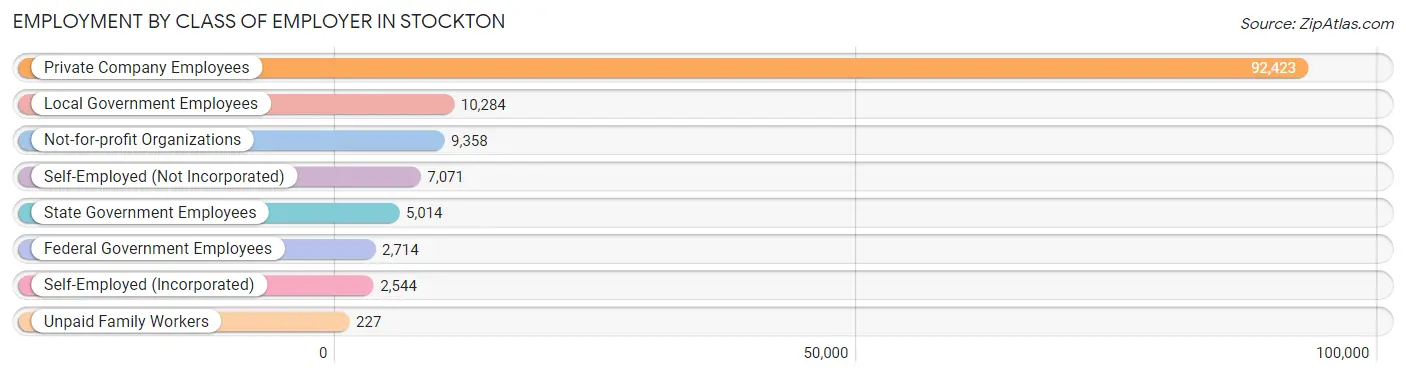
| Employer Class | # Employees | % Employees |
| Private Company Employees | 92,423 | 71.3% |
| Self-Employed (Incorporated) | 2,544 | 2.0% |
| Self-Employed (Not Incorporated) | 7,071 | 5.4% |
| Not-for-profit Organizations | 9,358 | 7.2% |
| Local Government Employees | 10,284 | 7.9% |
| State Government Employees | 5,014 | 3.9% |
| Federal Government Employees | 2,714 | 2.1% |
| Unpaid Family Workers | 227 | 0.2% |
| Total | 129,635 | 100.0% |
Employment Status by Age in Stockton
According to the labor force statistics for Stockton, out of the total population over 16 years of age (242,799), 60.3% or 146,408 individuals are in the labor force, with 7.7% or 11,273 of them unemployed. The age group with the highest labor force participation rate is 25 to 29 years, with 82.5% or 19,159 individuals in the labor force. Within the labor force, the 16 to 19 years age range has the highest percentage of unemployed individuals, with 23.8% or 1,428 of them being unemployed.
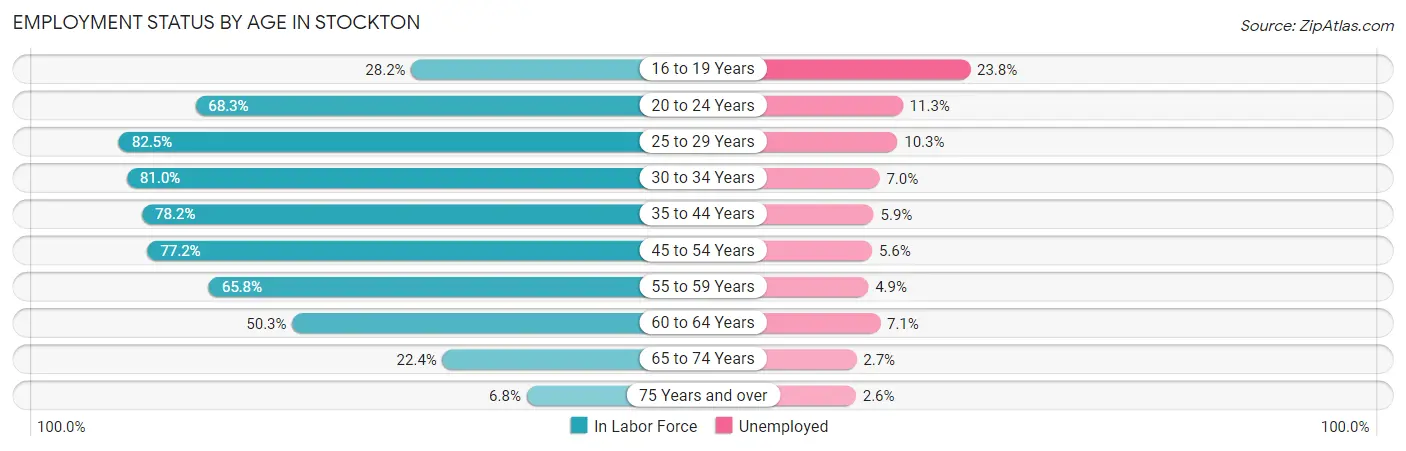
| Age Bracket | In Labor Force | Unemployed |
| 16 to 19 Years | 6,002 (28.2%) | 1,428 (23.8%) |
| 20 to 24 Years | 16,125 (68.3%) | 1,822 (11.3%) |
| 25 to 29 Years | 19,159 (82.5%) | 1,973 (10.3%) |
| 30 to 34 Years | 18,319 (81.0%) | 1,282 (7.0%) |
| 35 to 44 Years | 33,395 (78.2%) | 1,970 (5.9%) |
| 45 to 54 Years | 27,929 (77.2%) | 1,564 (5.6%) |
| 55 to 59 Years | 11,237 (65.8%) | 551 (4.9%) |
| 60 to 64 Years | 7,605 (50.3%) | 540 (7.1%) |
| 65 to 74 Years | 5,431 (22.4%) | 147 (2.7%) |
| 75 Years and over | 1,138 (6.8%) | 30 (2.6%) |
| Total | 146,408 (60.3%) | 11,273 (7.7%) |
Employment Status by Educational Attainment in Stockton
According to labor force statistics for Stockton, 75.0% of individuals (117,689) out of the total population between 25 and 64 years of age (156,919) are in the labor force, with 6.7% or 7,885 of them being unemployed. The group with the highest labor force participation rate are those with the educational attainment of bachelor's degree or higher, with 83.6% or 23,158 individuals in the labor force. Within the labor force, individuals with high school diploma education have the highest percentage of unemployment, with 7.6% or 2,733 of them being unemployed.
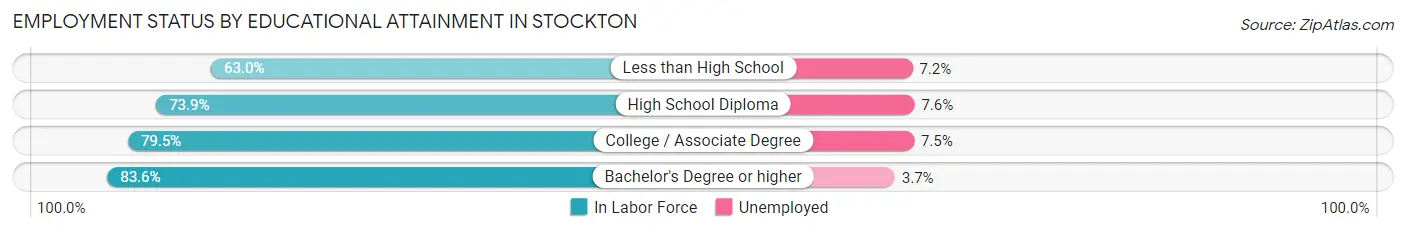
| Educational Attainment | In Labor Force | Unemployed |
| Less than High School | 21,116 (63.0%) | 2,413 (7.2%) |
| High School Diploma | 35,959 (73.9%) | 3,698 (7.6%) |
| College / Associate Degree | 37,398 (79.5%) | 3,528 (7.5%) |
| Bachelor's Degree or higher | 23,158 (83.6%) | 1,025 (3.7%) |
| Total | 117,689 (75.0%) | 10,514 (6.7%) |
Employment Occupations by Sex in Stockton
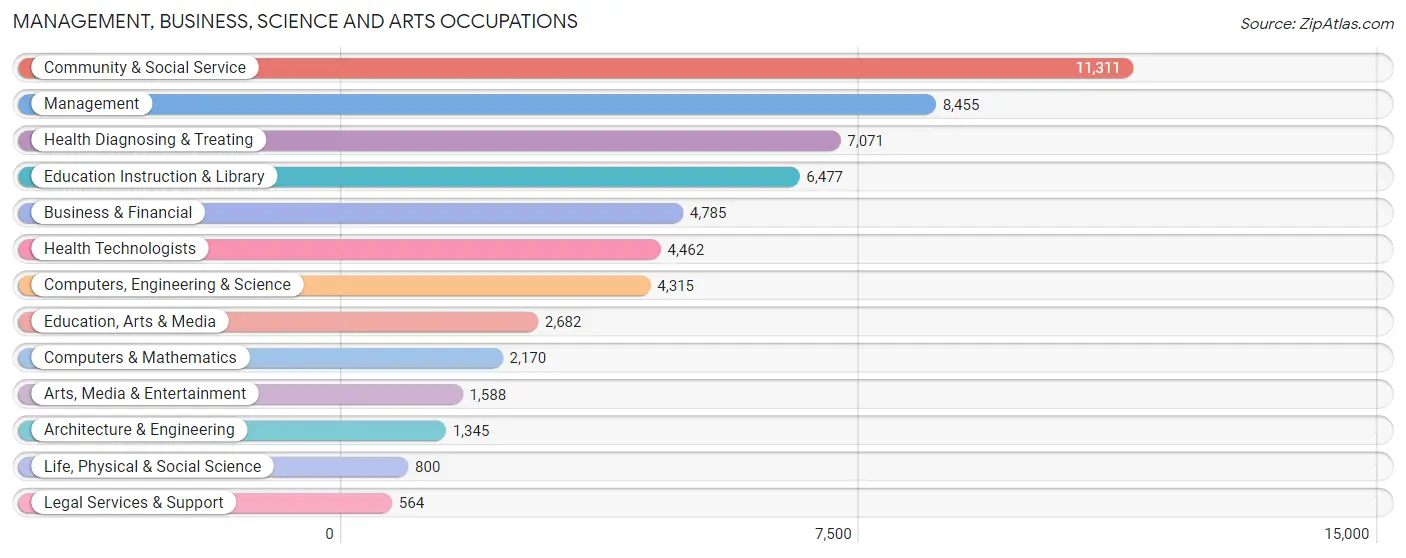
Management, Business, Science and Arts Occupations
The most common Management, Business, Science and Arts occupations in Stockton are Community & Social Service (11,311 | 8.4%), Management (8,455 | 6.3%), Health Diagnosing & Treating (7,071 | 5.2%), Education Instruction & Library (6,477 | 4.8%), and Business & Financial (4,785 | 3.5%).
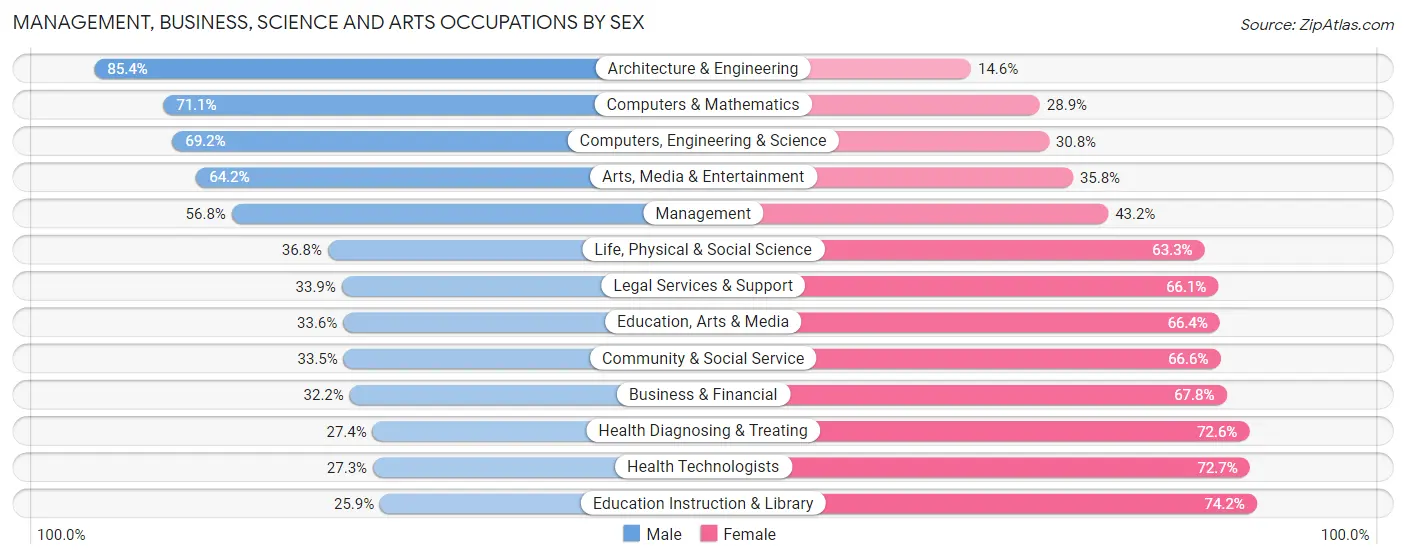
Management, Business, Science and Arts Occupations by Sex
Within the Management, Business, Science and Arts occupations in Stockton, the most male-oriented occupations are Architecture & Engineering (85.4%), Computers & Mathematics (71.1%), and Computers, Engineering & Science (69.2%), while the most female-oriented occupations are Education Instruction & Library (74.2%), Health Technologists (72.7%), and Health Diagnosing & Treating (72.6%).
| Occupation | Male | Female |
| Management | 4,803 (56.8%) | 3,652 (43.2%) |
| Business & Financial | 1,541 (32.2%) | 3,244 (67.8%) |
| Computers, Engineering & Science | 2,985 (69.2%) | 1,330 (30.8%) |
| Computers & Mathematics | 1,542 (71.1%) | 628 (28.9%) |
| Architecture & Engineering | 1,149 (85.4%) | 196 (14.6%) |
| Life, Physical & Social Science | 294 (36.7%) | 506 (63.2%) |
| Community & Social Service | 3,784 (33.5%) | 7,527 (66.5%) |
| Education, Arts & Media | 900 (33.6%) | 1,782 (66.4%) |
| Legal Services & Support | 191 (33.9%) | 373 (66.1%) |
| Education Instruction & Library | 1,674 (25.9%) | 4,803 (74.2%) |
| Arts, Media & Entertainment | 1,019 (64.2%) | 569 (35.8%) |
| Health Diagnosing & Treating | 1,938 (27.4%) | 5,133 (72.6%) |
| Health Technologists | 1,220 (27.3%) | 3,242 (72.7%) |
| Total (Category) | 15,051 (41.9%) | 20,886 (58.1%) |
| Total (Overall) | 73,095 (54.2%) | 61,836 (45.8%) |
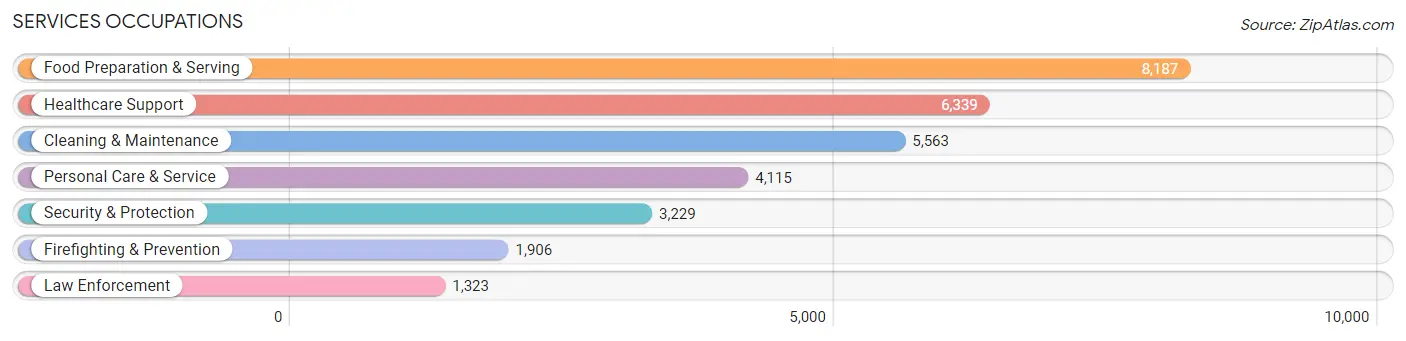
Services Occupations
The most common Services occupations in Stockton are Food Preparation & Serving (8,187 | 6.1%), Healthcare Support (6,339 | 4.7%), Cleaning & Maintenance (5,563 | 4.1%), Personal Care & Service (4,115 | 3.0%), and Security & Protection (3,229 | 2.4%).
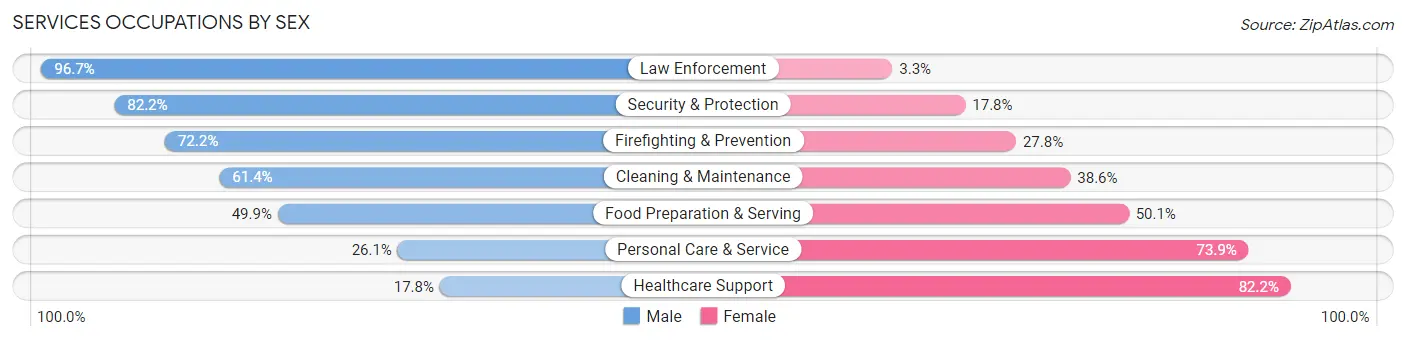
Services Occupations by Sex
Within the Services occupations in Stockton, the most male-oriented occupations are Law Enforcement (96.7%), Security & Protection (82.2%), and Firefighting & Prevention (72.2%), while the most female-oriented occupations are Healthcare Support (82.2%), Personal Care & Service (73.9%), and Food Preparation & Serving (50.1%).
| Occupation | Male | Female |
| Healthcare Support | 1,128 (17.8%) | 5,211 (82.2%) |
| Security & Protection | 2,655 (82.2%) | 574 (17.8%) |
| Firefighting & Prevention | 1,376 (72.2%) | 530 (27.8%) |
| Law Enforcement | 1,279 (96.7%) | 44 (3.3%) |
| Food Preparation & Serving | 4,083 (49.9%) | 4,104 (50.1%) |
| Cleaning & Maintenance | 3,417 (61.4%) | 2,146 (38.6%) |
| Personal Care & Service | 1,075 (26.1%) | 3,040 (73.9%) |
| Total (Category) | 12,358 (45.1%) | 15,075 (54.9%) |
| Total (Overall) | 73,095 (54.2%) | 61,836 (45.8%) |
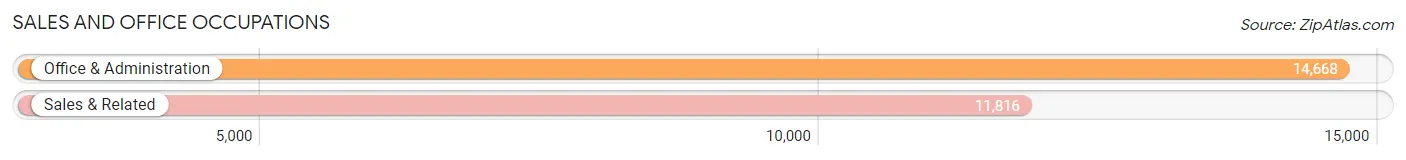
Sales and Office Occupations
The most common Sales and Office occupations in Stockton are Office & Administration (14,668 | 10.9%), and Sales & Related (11,816 | 8.8%).
Sales and Office Occupations by Sex
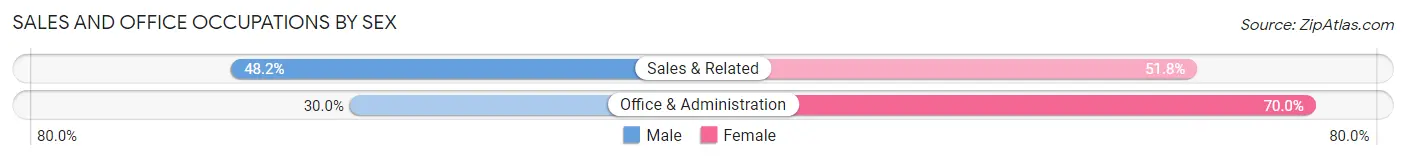
| Occupation | Male | Female |
| Sales & Related | 5,697 (48.2%) | 6,119 (51.8%) |
| Office & Administration | 4,398 (30.0%) | 10,270 (70.0%) |
| Total (Category) | 10,095 (38.1%) | 16,389 (61.9%) |
| Total (Overall) | 73,095 (54.2%) | 61,836 (45.8%) |
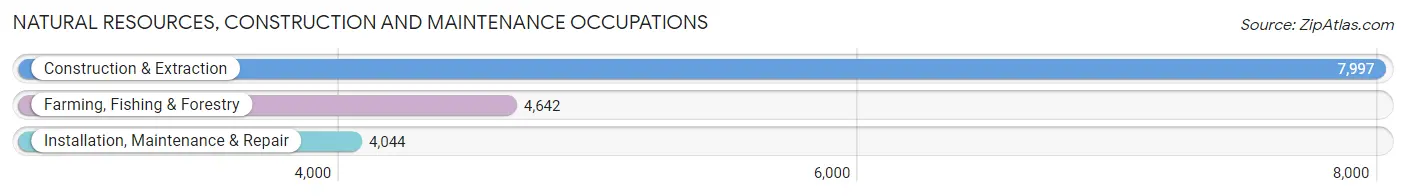
Natural Resources, Construction and Maintenance Occupations
The most common Natural Resources, Construction and Maintenance occupations in Stockton are Construction & Extraction (7,997 | 5.9%), Farming, Fishing & Forestry (4,642 | 3.4%), and Installation, Maintenance & Repair (4,044 | 3.0%).
Natural Resources, Construction and Maintenance Occupations by Sex
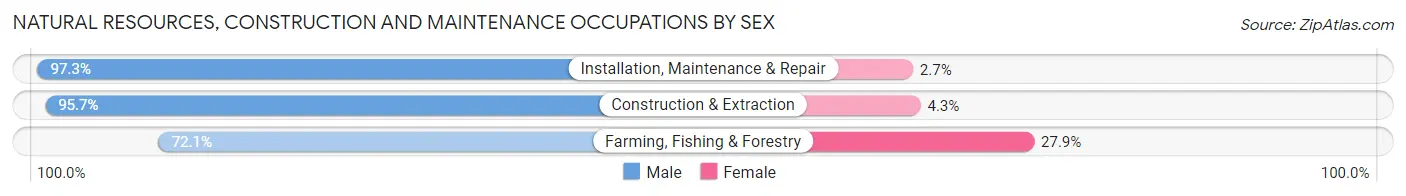
| Occupation | Male | Female |
| Farming, Fishing & Forestry | 3,346 (72.1%) | 1,296 (27.9%) |
| Construction & Extraction | 7,654 (95.7%) | 343 (4.3%) |
| Installation, Maintenance & Repair | 3,935 (97.3%) | 109 (2.7%) |
| Total (Category) | 14,935 (89.5%) | 1,748 (10.5%) |
| Total (Overall) | 73,095 (54.2%) | 61,836 (45.8%) |
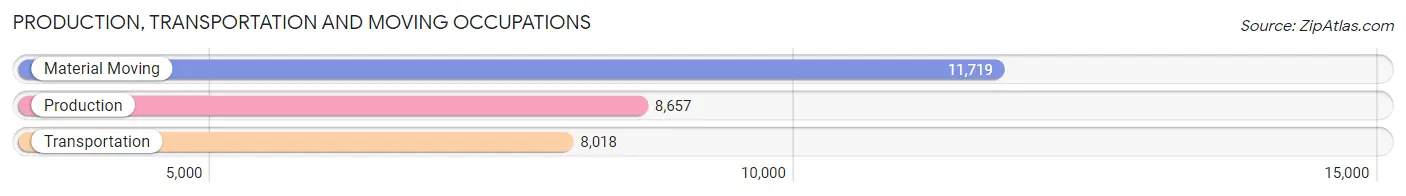
Production, Transportation and Moving Occupations
The most common Production, Transportation and Moving occupations in Stockton are Material Moving (11,719 | 8.7%), Production (8,657 | 6.4%), and Transportation (8,018 | 5.9%).
Production, Transportation and Moving Occupations by Sex
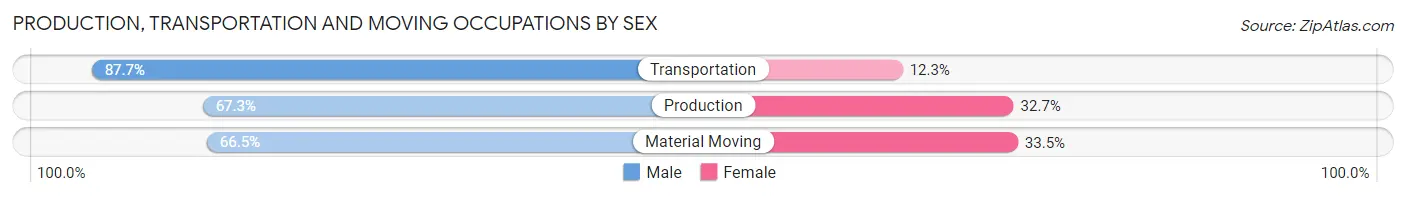
| Occupation | Male | Female |
| Production | 5,828 (67.3%) | 2,829 (32.7%) |
| Transportation | 7,030 (87.7%) | 988 (12.3%) |
| Material Moving | 7,798 (66.5%) | 3,921 (33.5%) |
| Total (Category) | 20,656 (72.8%) | 7,738 (27.3%) |
| Total (Overall) | 73,095 (54.2%) | 61,836 (45.8%) |
Employment Industries by Sex in Stockton
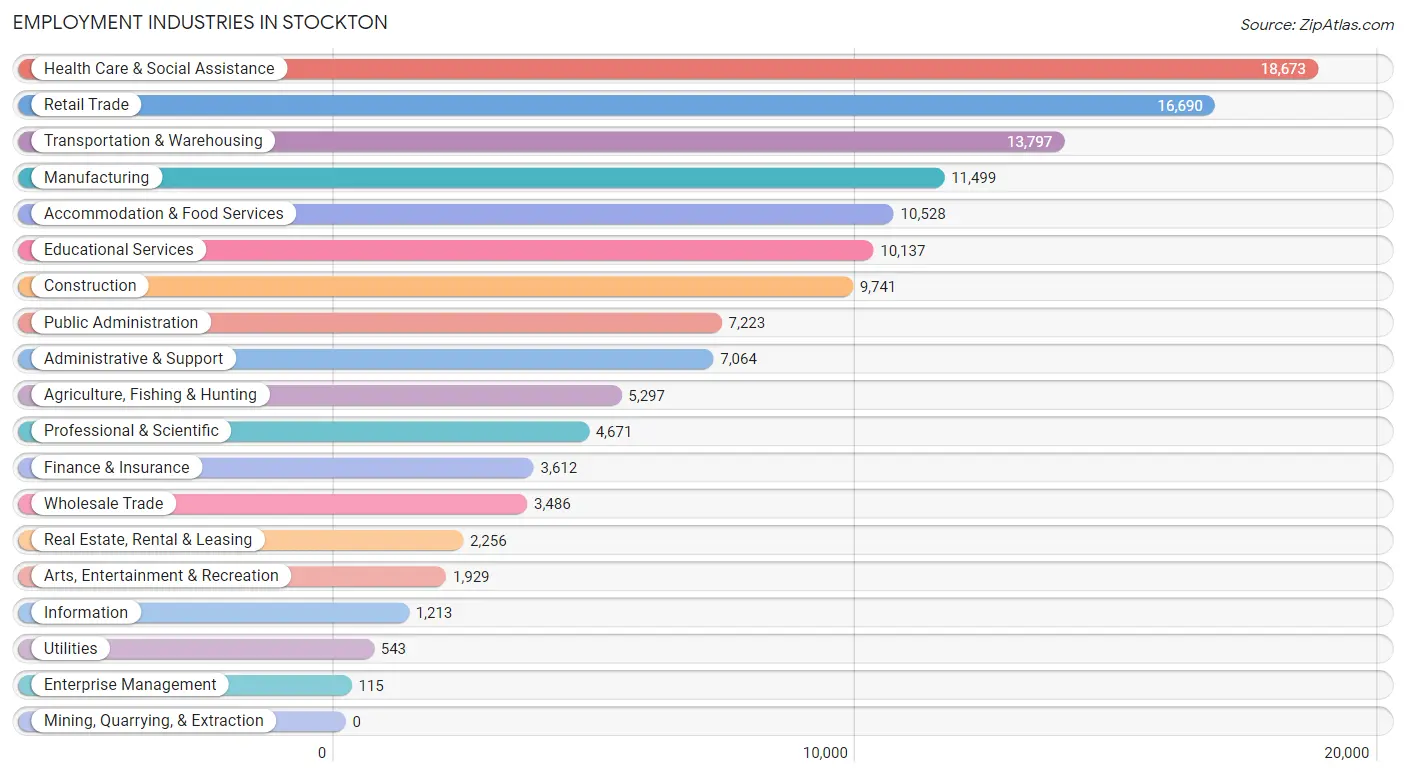
Employment Industries in Stockton
The major employment industries in Stockton include Health Care & Social Assistance (18,673 | 13.8%), Retail Trade (16,690 | 12.4%), Transportation & Warehousing (13,797 | 10.2%), Manufacturing (11,499 | 8.5%), and Accommodation & Food Services (10,528 | 7.8%).
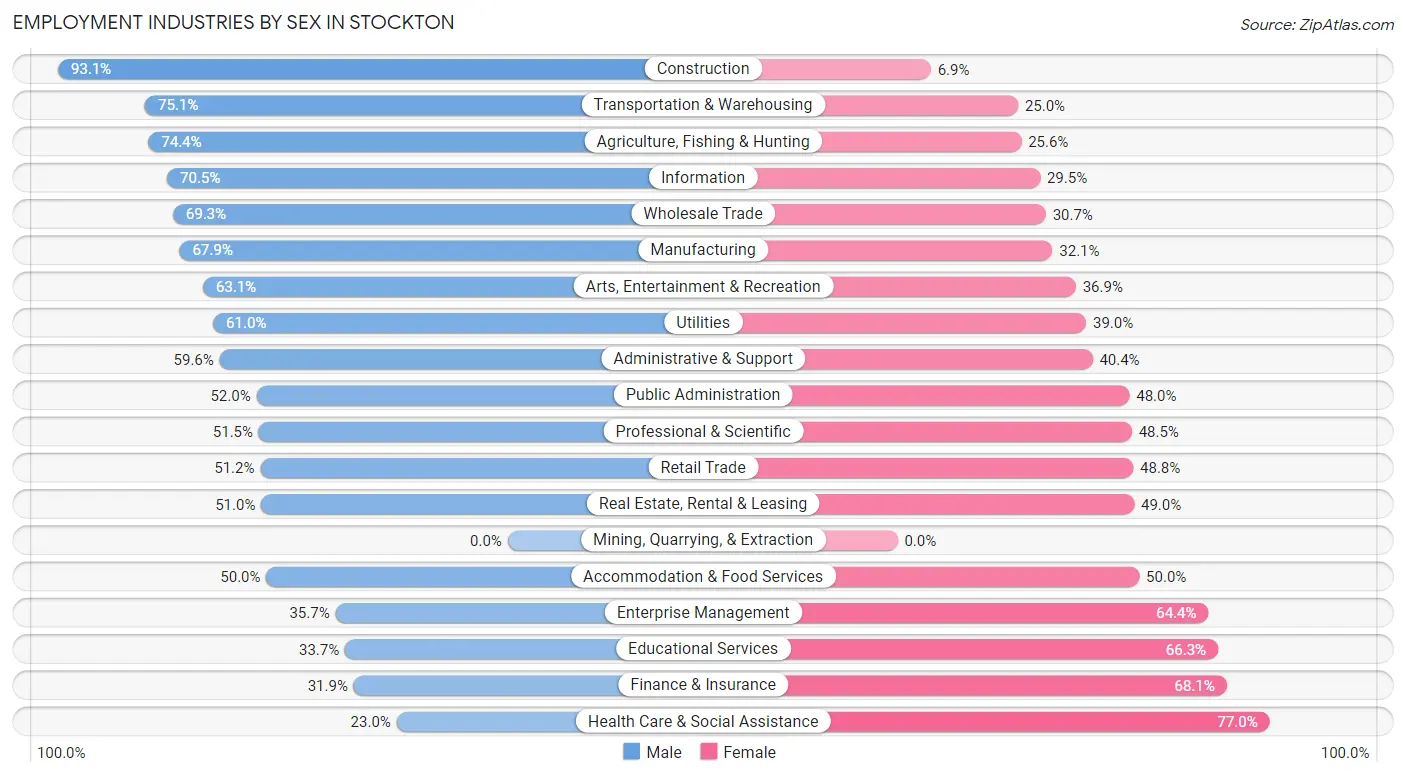
Employment Industries by Sex in Stockton
The Stockton industries that see more men than women are Construction (93.1%), Transportation & Warehousing (75.0%), and Agriculture, Fishing & Hunting (74.4%), whereas the industries that tend to have a higher number of women are Health Care & Social Assistance (77.0%), Finance & Insurance (68.1%), and Educational Services (66.3%).
| Industry | Male | Female |
| Agriculture, Fishing & Hunting | 3,940 (74.4%) | 1,357 (25.6%) |
| Mining, Quarrying, & Extraction | 0 (0.0%) | 0 (0.0%) |
| Construction | 9,069 (93.1%) | 672 (6.9%) |
| Manufacturing | 7,811 (67.9%) | 3,688 (32.1%) |
| Wholesale Trade | 2,416 (69.3%) | 1,070 (30.7%) |
| Retail Trade | 8,547 (51.2%) | 8,143 (48.8%) |
| Transportation & Warehousing | 10,355 (75.0%) | 3,442 (24.9%) |
| Utilities | 331 (61.0%) | 212 (39.0%) |
| Information | 855 (70.5%) | 358 (29.5%) |
| Finance & Insurance | 1,151 (31.9%) | 2,461 (68.1%) |
| Real Estate, Rental & Leasing | 1,151 (51.0%) | 1,105 (49.0%) |
| Professional & Scientific | 2,406 (51.5%) | 2,265 (48.5%) |
| Enterprise Management | 41 (35.6%) | 74 (64.3%) |
| Administrative & Support | 4,212 (59.6%) | 2,852 (40.4%) |
| Educational Services | 3,413 (33.7%) | 6,724 (66.3%) |
| Health Care & Social Assistance | 4,293 (23.0%) | 14,380 (77.0%) |
| Arts, Entertainment & Recreation | 1,217 (63.1%) | 712 (36.9%) |
| Accommodation & Food Services | 5,260 (50.0%) | 5,268 (50.0%) |
| Public Administration | 3,756 (52.0%) | 3,467 (48.0%) |
| Total | 73,095 (54.2%) | 61,836 (45.8%) |
Education in Stockton
School Enrollment in Stockton
The most common levels of schooling among the 92,989 students in Stockton are high school (21,516 | 23.1%), middle school (20,617 | 22.2%), and college / undergraduate (19,679 | 21.2%).
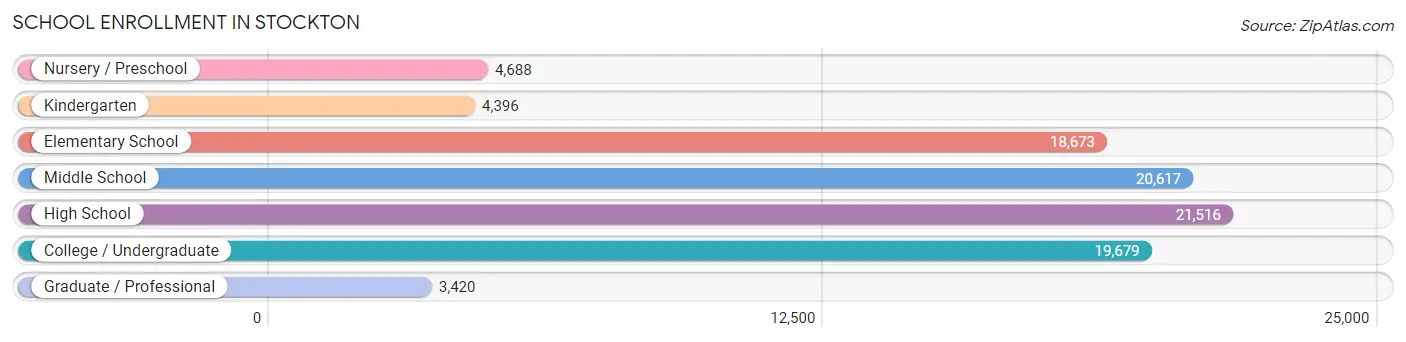
| School Level | # Students | % Students |
| Nursery / Preschool | 4,688 | 5.0% |
| Kindergarten | 4,396 | 4.7% |
| Elementary School | 18,673 | 20.1% |
| Middle School | 20,617 | 22.2% |
| High School | 21,516 | 23.1% |
| College / Undergraduate | 19,679 | 21.2% |
| Graduate / Professional | 3,420 | 3.7% |
| Total | 92,989 | 100.0% |
School Enrollment by Age by Funding Source in Stockton
Out of a total of 92,989 students who are enrolled in schools in Stockton, 10,136 (10.9%) attend a private institution, while the remaining 82,853 (89.1%) are enrolled in public schools. The age group of 35 years and over has the highest likelihood of being enrolled in private schools, with 1,419 (33.0% in the age bracket) enrolled. Conversely, the age group of 15 to 17 year olds has the lowest likelihood of being enrolled in a private school, with 14,964 (95.9% in the age bracket) attending a public institution.
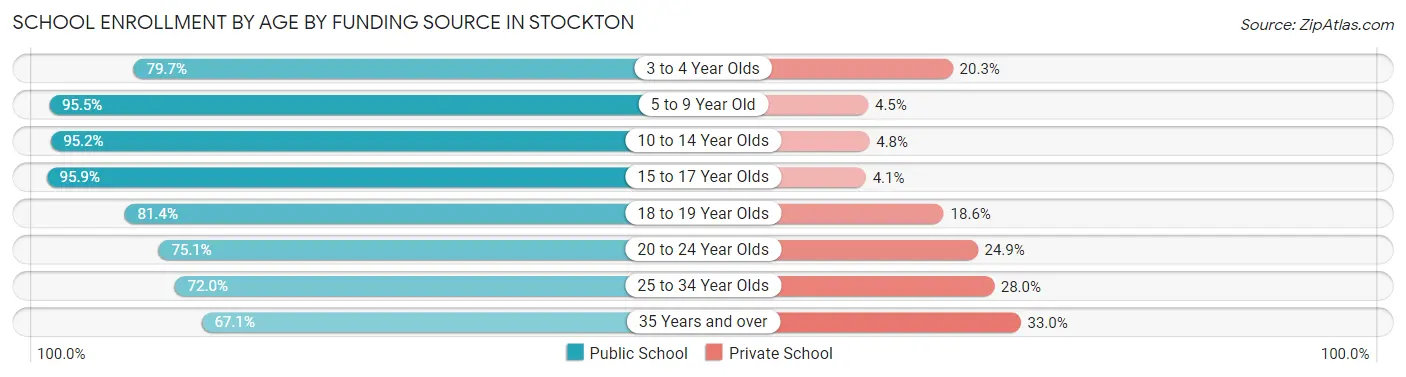
| Age Bracket | Public School | Private School |
| 3 to 4 Year Olds | 2,976 (79.7%) | 758 (20.3%) |
| 5 to 9 Year Old | 21,194 (95.5%) | 1,009 (4.5%) |
| 10 to 14 Year Olds | 24,520 (95.2%) | 1,227 (4.8%) |
| 15 to 17 Year Olds | 14,964 (95.9%) | 640 (4.1%) |
| 18 to 19 Year Olds | 5,620 (81.4%) | 1,286 (18.6%) |
| 20 to 24 Year Olds | 7,038 (75.1%) | 2,339 (24.9%) |
| 25 to 34 Year Olds | 3,682 (72.0%) | 1,429 (28.0%) |
| 35 Years and over | 2,888 (67.0%) | 1,419 (33.0%) |
| Total | 82,853 (89.1%) | 10,136 (10.9%) |
Educational Attainment by Field of Study in Stockton
Business (7,306 | 18.7%), science & technology (4,560 | 11.7%), education (3,908 | 10.0%), social sciences (3,486 | 8.9%), and arts & humanities (3,097 | 7.9%) are the most common fields of study among 39,040 individuals in Stockton who have obtained a bachelor's degree or higher.
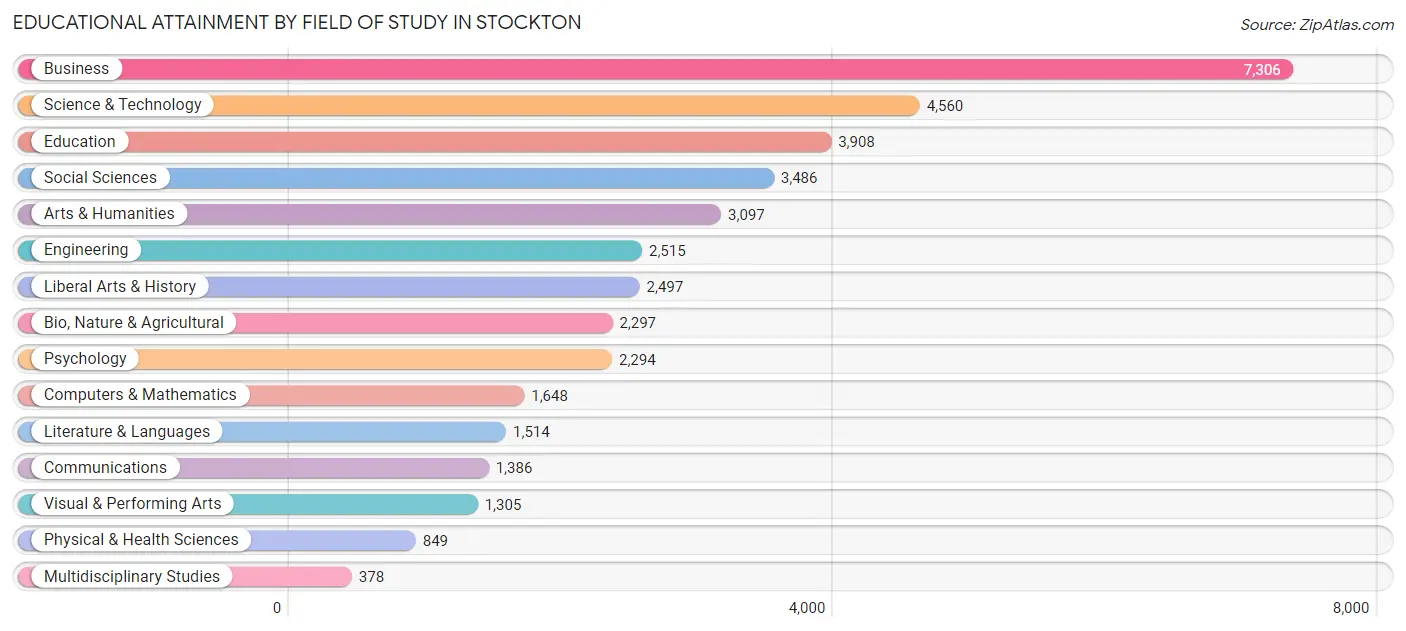
| Field of Study | # Graduates | % Graduates |
| Computers & Mathematics | 1,648 | 4.2% |
| Bio, Nature & Agricultural | 2,297 | 5.9% |
| Physical & Health Sciences | 849 | 2.2% |
| Psychology | 2,294 | 5.9% |
| Social Sciences | 3,486 | 8.9% |
| Engineering | 2,515 | 6.4% |
| Multidisciplinary Studies | 378 | 1.0% |
| Science & Technology | 4,560 | 11.7% |
| Business | 7,306 | 18.7% |
| Education | 3,908 | 10.0% |
| Literature & Languages | 1,514 | 3.9% |
| Liberal Arts & History | 2,497 | 6.4% |
| Visual & Performing Arts | 1,305 | 3.3% |
| Communications | 1,386 | 3.5% |
| Arts & Humanities | 3,097 | 7.9% |
| Total | 39,040 | 100.0% |
Transportation & Commute in Stockton
Vehicle Availability by Sex in Stockton
The most prevalent vehicle ownership categories in Stockton are males with 2 vehicles (23,982, accounting for 34.1%) and females with 2 vehicles (19,983, making up 41.0%).
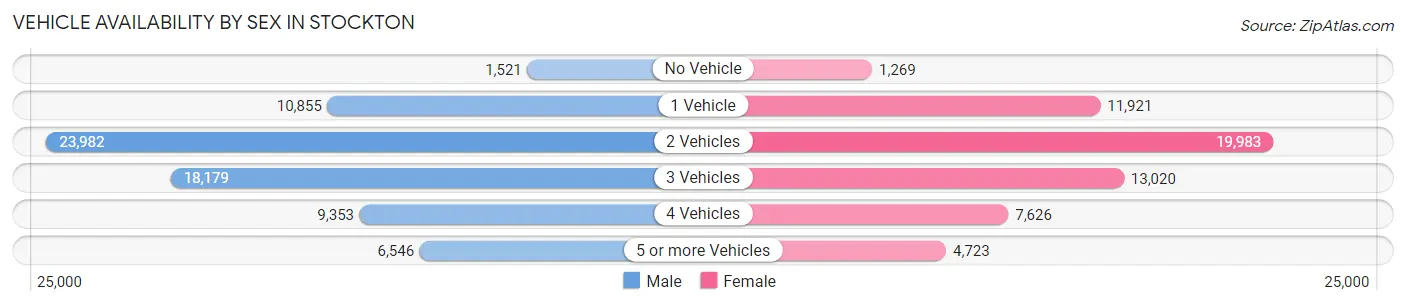
| Vehicles Available | Male | Female |
| No Vehicle | 1,521 (2.2%) | 1,269 (2.2%) |
| 1 Vehicle | 10,855 (15.4%) | 11,921 (20.4%) |
| 2 Vehicles | 23,982 (34.1%) | 19,983 (34.1%) |
| 3 Vehicles | 18,179 (25.8%) | 13,020 (22.2%) |
| 4 Vehicles | 9,353 (13.3%) | 7,626 (13.0%) |
| 5 or more Vehicles | 6,546 (9.3%) | 4,723 (8.1%) |
| Total | 70,436 (100.0%) | 58,542 (100.0%) |
Commute Time in Stockton
The most frequently occuring commute durations in Stockton are 15 to 19 minutes (23,231 commuters, 19.0%), 20 to 24 minutes (18,938 commuters, 15.5%), and 10 to 14 minutes (18,722 commuters, 15.3%).
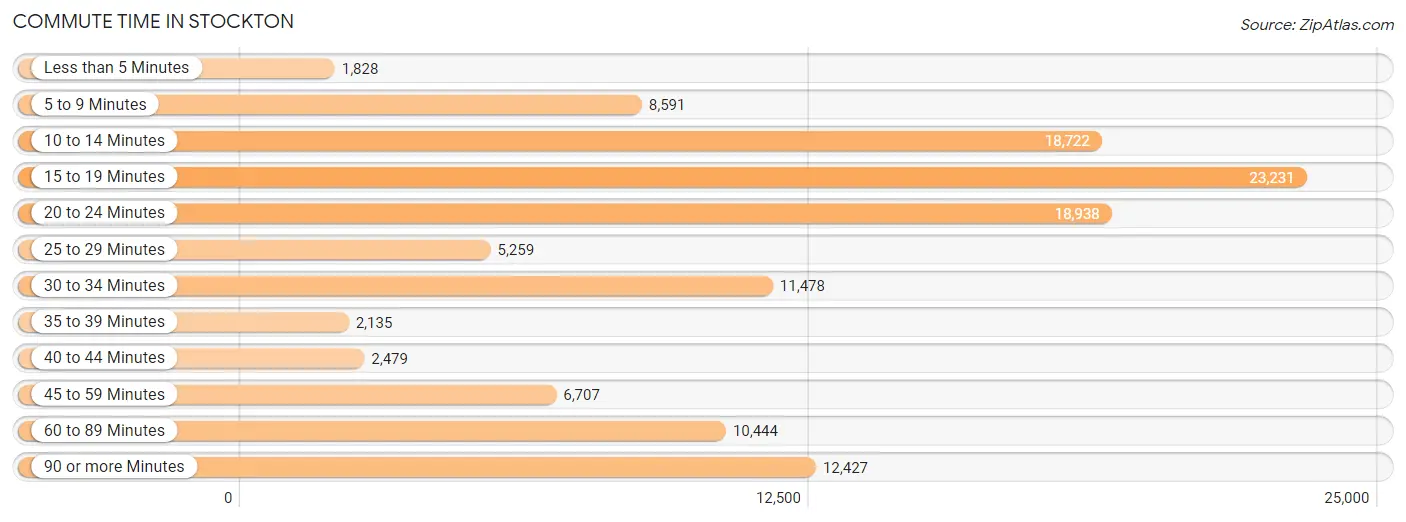
| Commute Time | # Commuters | % Commuters |
| Less than 5 Minutes | 1,828 | 1.5% |
| 5 to 9 Minutes | 8,591 | 7.0% |
| 10 to 14 Minutes | 18,722 | 15.3% |
| 15 to 19 Minutes | 23,231 | 19.0% |
| 20 to 24 Minutes | 18,938 | 15.5% |
| 25 to 29 Minutes | 5,259 | 4.3% |
| 30 to 34 Minutes | 11,478 | 9.4% |
| 35 to 39 Minutes | 2,135 | 1.8% |
| 40 to 44 Minutes | 2,479 | 2.0% |
| 45 to 59 Minutes | 6,707 | 5.5% |
| 60 to 89 Minutes | 10,444 | 8.5% |
| 90 or more Minutes | 12,427 | 10.2% |
Commute Time by Sex in Stockton
The most common commute times in Stockton are 15 to 19 minutes (11,905 commuters, 17.5%) for males and 15 to 19 minutes (11,326 commuters, 20.8%) for females.
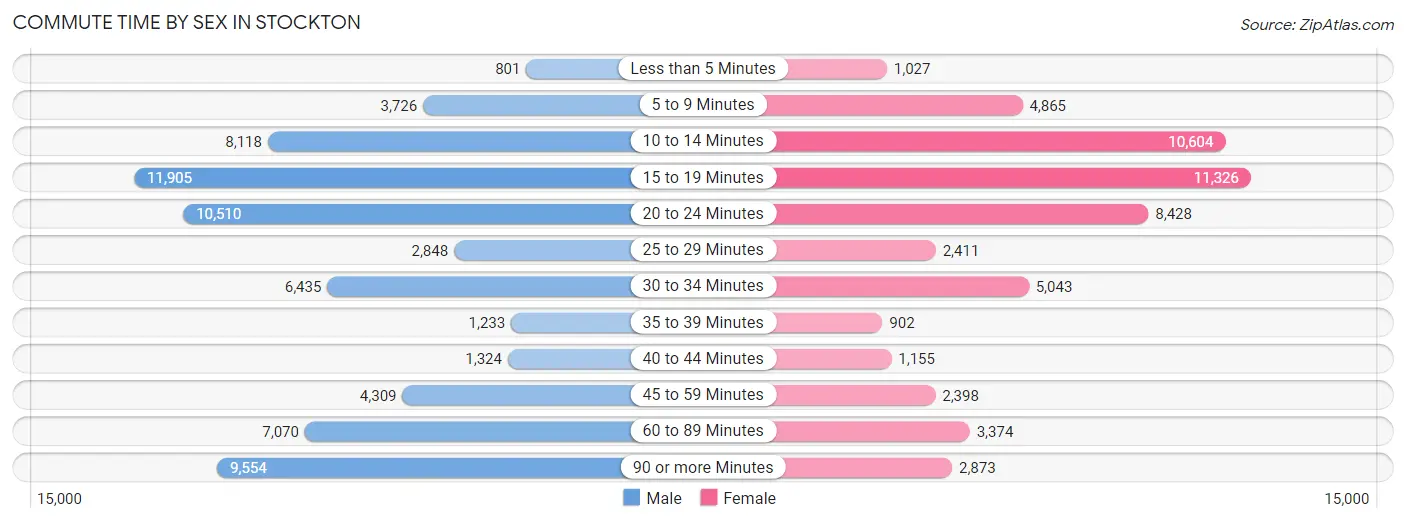
| Commute Time | Male | Female |
| Less than 5 Minutes | 801 (1.2%) | 1,027 (1.9%) |
| 5 to 9 Minutes | 3,726 (5.5%) | 4,865 (8.9%) |
| 10 to 14 Minutes | 8,118 (12.0%) | 10,604 (19.5%) |
| 15 to 19 Minutes | 11,905 (17.5%) | 11,326 (20.8%) |
| 20 to 24 Minutes | 10,510 (15.5%) | 8,428 (15.5%) |
| 25 to 29 Minutes | 2,848 (4.2%) | 2,411 (4.4%) |
| 30 to 34 Minutes | 6,435 (9.5%) | 5,043 (9.3%) |
| 35 to 39 Minutes | 1,233 (1.8%) | 902 (1.7%) |
| 40 to 44 Minutes | 1,324 (1.9%) | 1,155 (2.1%) |
| 45 to 59 Minutes | 4,309 (6.4%) | 2,398 (4.4%) |
| 60 to 89 Minutes | 7,070 (10.4%) | 3,374 (6.2%) |
| 90 or more Minutes | 9,554 (14.1%) | 2,873 (5.3%) |
Time of Departure to Work by Sex in Stockton
The most frequent times of departure to work in Stockton are 12:00 AM to 4:59 AM (9,676, 14.3%) for males and 7:00 AM to 7:29 AM (8,608, 15.8%) for females.
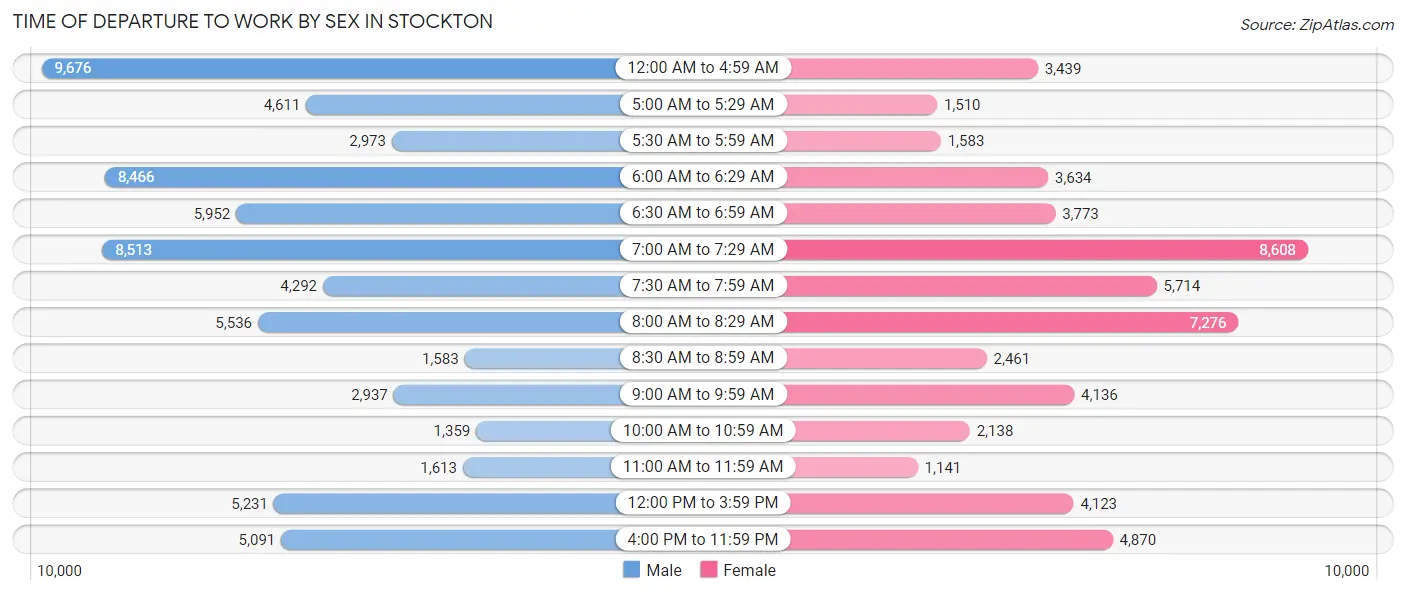
| Time of Departure | Male | Female |
| 12:00 AM to 4:59 AM | 9,676 (14.3%) | 3,439 (6.3%) |
| 5:00 AM to 5:29 AM | 4,611 (6.8%) | 1,510 (2.8%) |
| 5:30 AM to 5:59 AM | 2,973 (4.4%) | 1,583 (2.9%) |
| 6:00 AM to 6:29 AM | 8,466 (12.5%) | 3,634 (6.7%) |
| 6:30 AM to 6:59 AM | 5,952 (8.8%) | 3,773 (6.9%) |
| 7:00 AM to 7:29 AM | 8,513 (12.6%) | 8,608 (15.8%) |
| 7:30 AM to 7:59 AM | 4,292 (6.3%) | 5,714 (10.5%) |
| 8:00 AM to 8:29 AM | 5,536 (8.2%) | 7,276 (13.4%) |
| 8:30 AM to 8:59 AM | 1,583 (2.3%) | 2,461 (4.5%) |
| 9:00 AM to 9:59 AM | 2,937 (4.3%) | 4,136 (7.6%) |
| 10:00 AM to 10:59 AM | 1,359 (2.0%) | 2,138 (3.9%) |
| 11:00 AM to 11:59 AM | 1,613 (2.4%) | 1,141 (2.1%) |
| 12:00 PM to 3:59 PM | 5,231 (7.7%) | 4,123 (7.6%) |
| 4:00 PM to 11:59 PM | 5,091 (7.5%) | 4,870 (8.9%) |
| Total | 67,833 (100.0%) | 54,406 (100.0%) |
Housing Occupancy in Stockton
Occupancy by Ownership in Stockton
Of the total 96,975 dwellings in Stockton, owner-occupied units account for 50,125 (51.7%), while renter-occupied units make up 46,850 (48.3%).
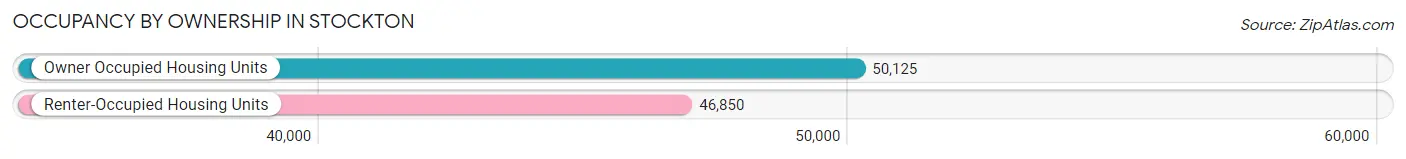
| Occupancy | # Housing Units | % Housing Units |
| Owner Occupied Housing Units | 50,125 | 51.7% |
| Renter-Occupied Housing Units | 46,850 | 48.3% |
| Total Occupied Housing Units | 96,975 | 100.0% |
Occupancy by Household Size in Stockton
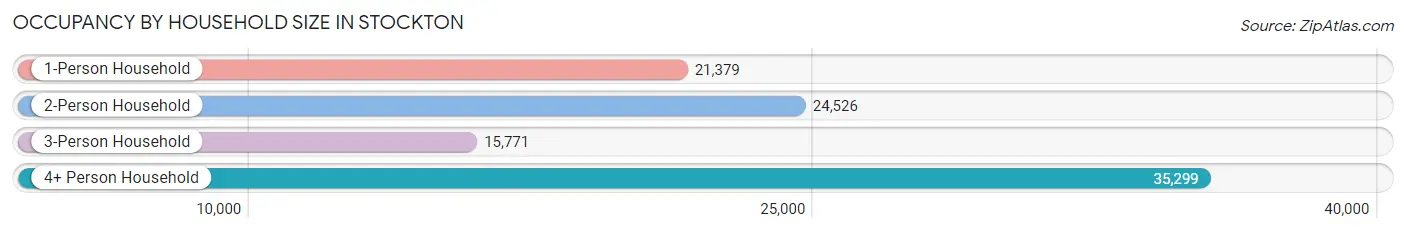
| Household Size | # Housing Units | % Housing Units |
| 1-Person Household | 21,379 | 22.1% |
| 2-Person Household | 24,526 | 25.3% |
| 3-Person Household | 15,771 | 16.3% |
| 4+ Person Household | 35,299 | 36.4% |
| Total Housing Units | 96,975 | 100.0% |
Occupancy by Ownership by Household Size in Stockton
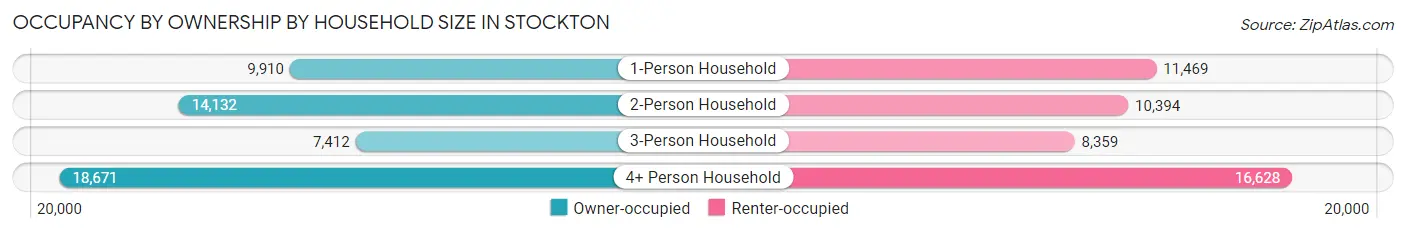
| Household Size | Owner-occupied | Renter-occupied |
| 1-Person Household | 9,910 (46.4%) | 11,469 (53.6%) |
| 2-Person Household | 14,132 (57.6%) | 10,394 (42.4%) |
| 3-Person Household | 7,412 (47.0%) | 8,359 (53.0%) |
| 4+ Person Household | 18,671 (52.9%) | 16,628 (47.1%) |
| Total Housing Units | 50,125 (51.7%) | 46,850 (48.3%) |
Occupancy by Educational Attainment in Stockton
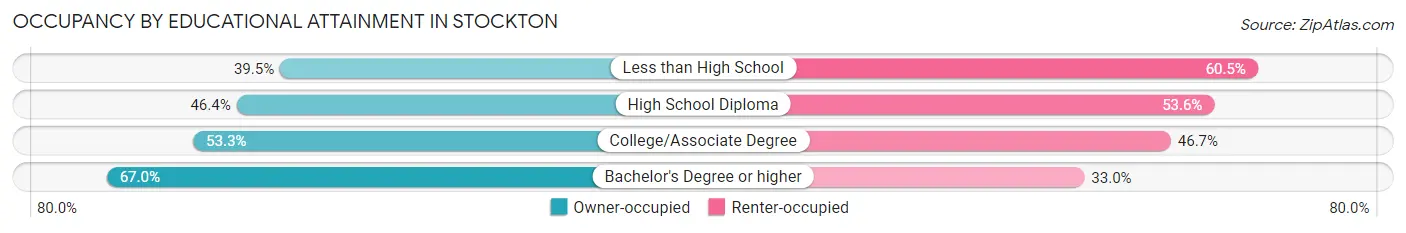
| Household Size | Owner-occupied | Renter-occupied |
| Less than High School | 7,348 (39.5%) | 11,261 (60.5%) |
| High School Diploma | 11,870 (46.4%) | 13,720 (53.6%) |
| College/Associate Degree | 17,244 (53.3%) | 15,131 (46.7%) |
| Bachelor's Degree or higher | 13,663 (67.0%) | 6,738 (33.0%) |
Occupancy by Age of Householder in Stockton
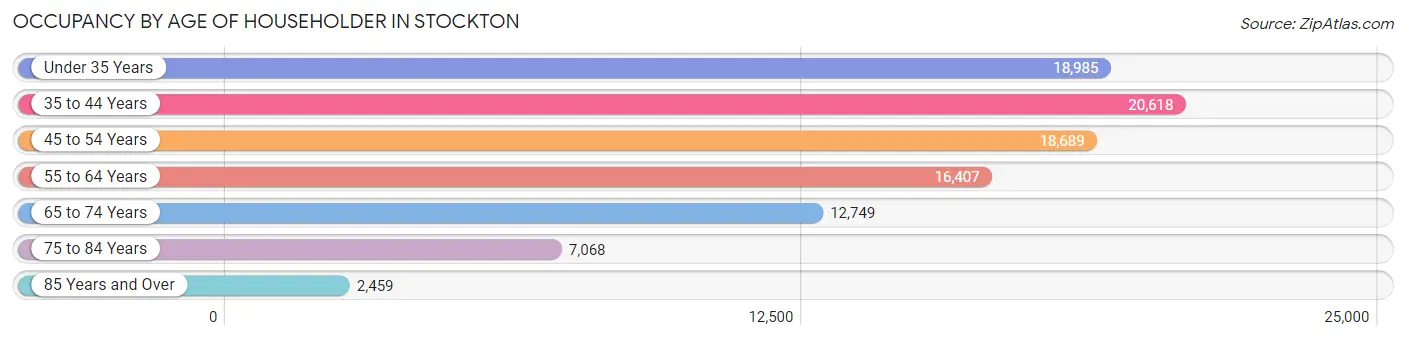
| Age Bracket | # Households | % Households |
| Under 35 Years | 18,985 | 19.6% |
| 35 to 44 Years | 20,618 | 21.3% |
| 45 to 54 Years | 18,689 | 19.3% |
| 55 to 64 Years | 16,407 | 16.9% |
| 65 to 74 Years | 12,749 | 13.2% |
| 75 to 84 Years | 7,068 | 7.3% |
| 85 Years and Over | 2,459 | 2.5% |
| Total | 96,975 | 100.0% |
Housing Finances in Stockton
Median Income by Occupancy in Stockton
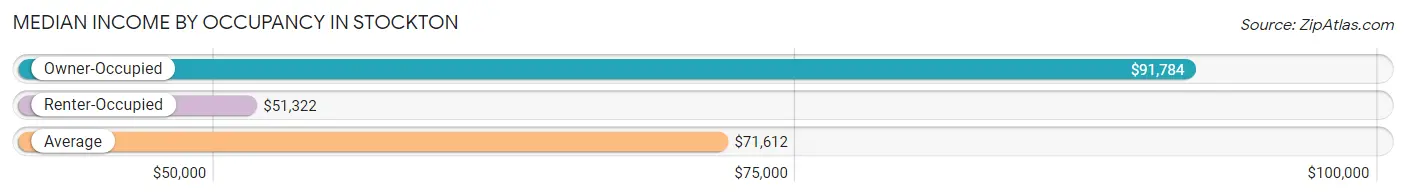
| Occupancy Type | # Households | Median Income |
| Owner-Occupied | 50,125 (51.7%) | $91,784 |
| Renter-Occupied | 46,850 (48.3%) | $51,322 |
| Average | 96,975 (100.0%) | $71,612 |
Occupancy by Householder Income Bracket in Stockton
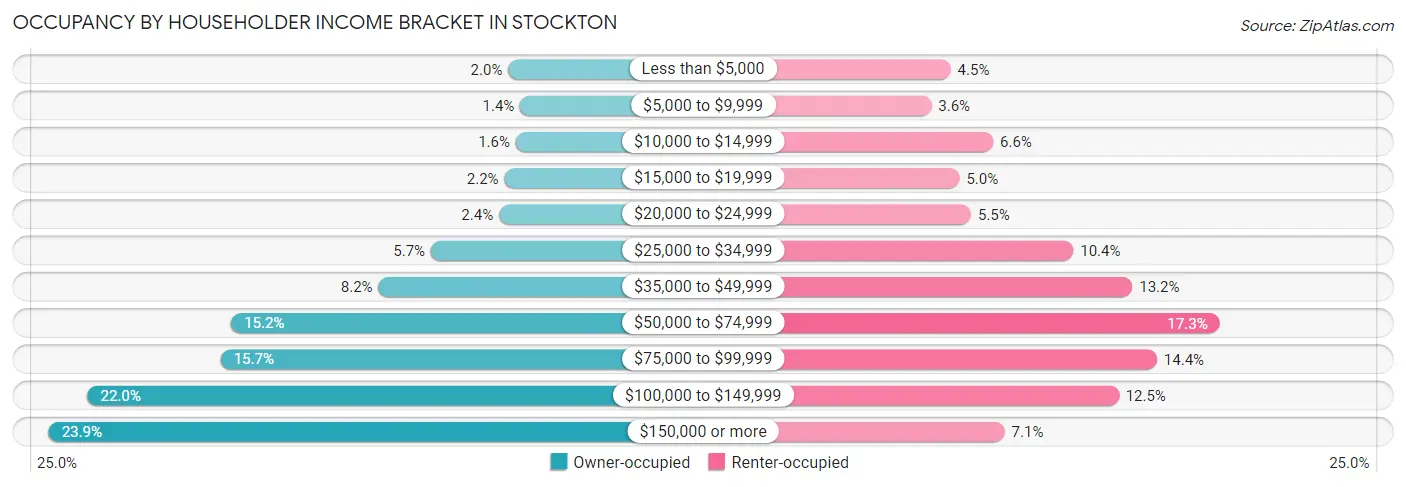
| Income Bracket | Owner-occupied | Renter-occupied |
| Less than $5,000 | 988 (2.0%) | 2,121 (4.5%) |
| $5,000 to $9,999 | 701 (1.4%) | 1,689 (3.6%) |
| $10,000 to $14,999 | 806 (1.6%) | 3,067 (6.6%) |
| $15,000 to $19,999 | 1,077 (2.1%) | 2,320 (5.0%) |
| $20,000 to $24,999 | 1,208 (2.4%) | 2,578 (5.5%) |
| $25,000 to $34,999 | 2,830 (5.7%) | 4,860 (10.4%) |
| $35,000 to $49,999 | 4,083 (8.2%) | 6,176 (13.2%) |
| $50,000 to $74,999 | 7,599 (15.2%) | 8,118 (17.3%) |
| $75,000 to $99,999 | 7,848 (15.7%) | 6,722 (14.3%) |
| $100,000 to $149,999 | 11,029 (22.0%) | 5,871 (12.5%) |
| $150,000 or more | 11,956 (23.8%) | 3,328 (7.1%) |
| Total | 50,125 (100.0%) | 46,850 (100.0%) |
Monthly Housing Cost Tiers in Stockton
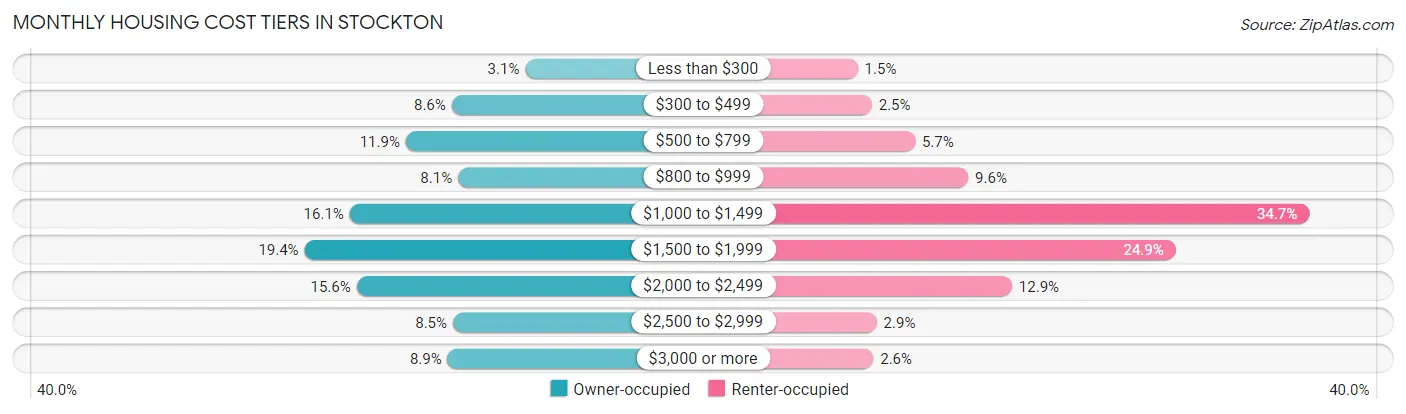
| Monthly Cost | Owner-occupied | Renter-occupied |
| Less than $300 | 1,567 (3.1%) | 698 (1.5%) |
| $300 to $499 | 4,286 (8.6%) | 1,183 (2.5%) |
| $500 to $799 | 5,980 (11.9%) | 2,674 (5.7%) |
| $800 to $999 | 4,051 (8.1%) | 4,510 (9.6%) |
| $1,000 to $1,499 | 8,050 (16.1%) | 16,273 (34.7%) |
| $1,500 to $1,999 | 9,721 (19.4%) | 11,667 (24.9%) |
| $2,000 to $2,499 | 7,795 (15.5%) | 6,019 (12.9%) |
| $2,500 to $2,999 | 4,241 (8.5%) | 1,356 (2.9%) |
| $3,000 or more | 4,434 (8.8%) | 1,235 (2.6%) |
| Total | 50,125 (100.0%) | 46,850 (100.0%) |
Physical Housing Characteristics in Stockton
Housing Structures in Stockton
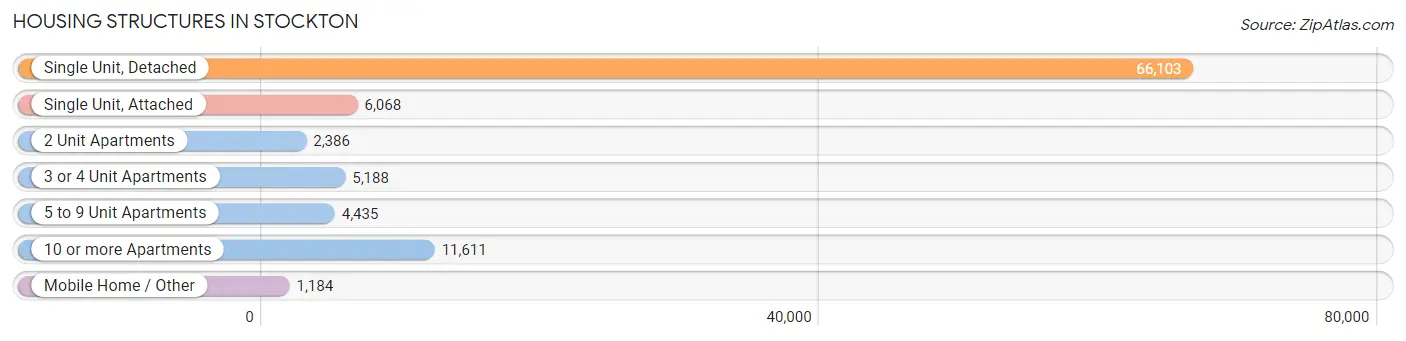
| Structure Type | # Housing Units | % Housing Units |
| Single Unit, Detached | 66,103 | 68.2% |
| Single Unit, Attached | 6,068 | 6.3% |
| 2 Unit Apartments | 2,386 | 2.5% |
| 3 or 4 Unit Apartments | 5,188 | 5.3% |
| 5 to 9 Unit Apartments | 4,435 | 4.6% |
| 10 or more Apartments | 11,611 | 12.0% |
| Mobile Home / Other | 1,184 | 1.2% |
| Total | 96,975 | 100.0% |
Housing Structures by Occupancy in Stockton
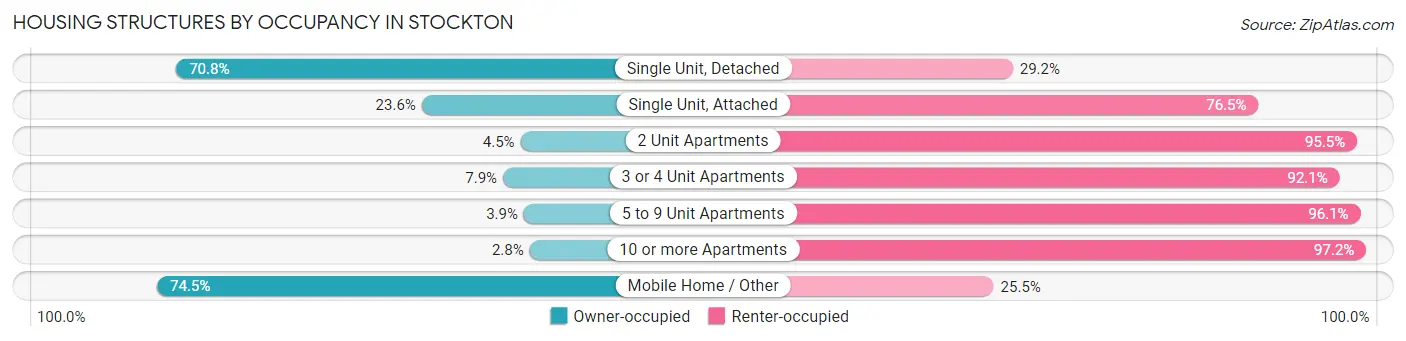
| Structure Type | Owner-occupied | Renter-occupied |
| Single Unit, Detached | 46,801 (70.8%) | 19,302 (29.2%) |
| Single Unit, Attached | 1,429 (23.5%) | 4,639 (76.4%) |
| 2 Unit Apartments | 108 (4.5%) | 2,278 (95.5%) |
| 3 or 4 Unit Apartments | 410 (7.9%) | 4,778 (92.1%) |
| 5 to 9 Unit Apartments | 172 (3.9%) | 4,263 (96.1%) |
| 10 or more Apartments | 323 (2.8%) | 11,288 (97.2%) |
| Mobile Home / Other | 882 (74.5%) | 302 (25.5%) |
| Total | 50,125 (51.7%) | 46,850 (48.3%) |
Housing Structures by Number of Rooms in Stockton
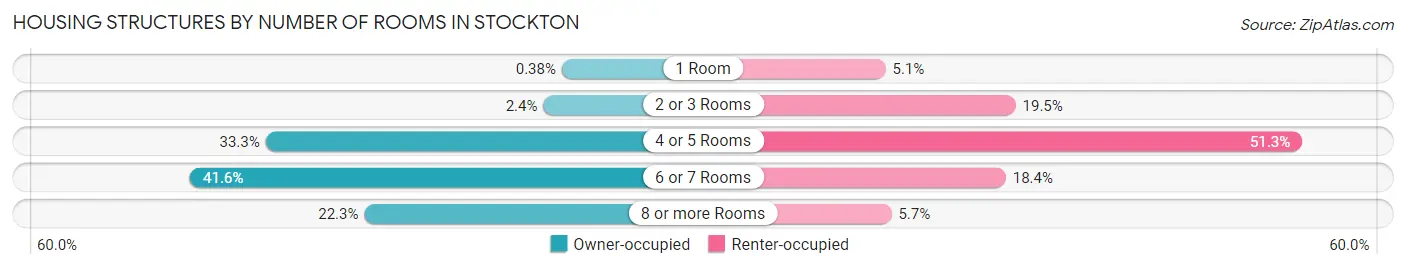
| Number of Rooms | Owner-occupied | Renter-occupied |
| 1 Room | 188 (0.4%) | 2,377 (5.1%) |
| 2 or 3 Rooms | 1,218 (2.4%) | 9,138 (19.5%) |
| 4 or 5 Rooms | 16,674 (33.3%) | 24,029 (51.3%) |
| 6 or 7 Rooms | 20,869 (41.6%) | 8,627 (18.4%) |
| 8 or more Rooms | 11,176 (22.3%) | 2,679 (5.7%) |
| Total | 50,125 (100.0%) | 46,850 (100.0%) |
Housing Structure by Heating Type in Stockton
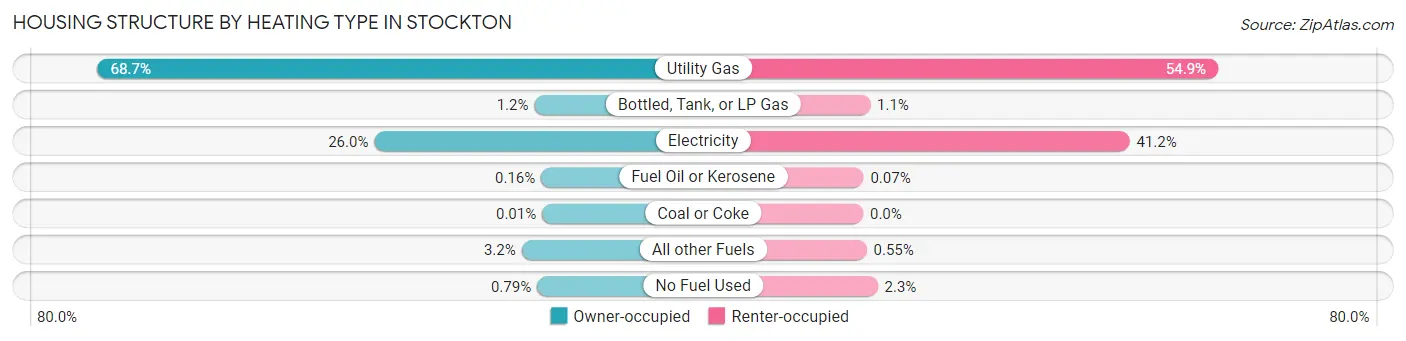
| Heating Type | Owner-occupied | Renter-occupied |
| Utility Gas | 34,448 (68.7%) | 25,696 (54.8%) |
| Bottled, Tank, or LP Gas | 600 (1.2%) | 509 (1.1%) |
| Electricity | 13,005 (26.0%) | 19,303 (41.2%) |
| Fuel Oil or Kerosene | 80 (0.2%) | 31 (0.1%) |
| Coal or Coke | 3 (0.0%) | 0 (0.0%) |
| All other Fuels | 1,592 (3.2%) | 258 (0.5%) |
| No Fuel Used | 397 (0.8%) | 1,053 (2.2%) |
| Total | 50,125 (100.0%) | 46,850 (100.0%) |
Household Vehicle Usage in Stockton
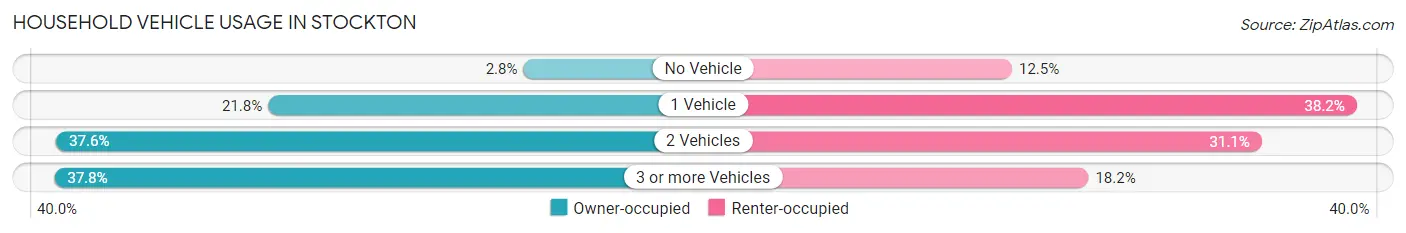
| Vehicles per Household | Owner-occupied | Renter-occupied |
| No Vehicle | 1,383 (2.8%) | 5,845 (12.5%) |
| 1 Vehicle | 10,937 (21.8%) | 17,903 (38.2%) |
| 2 Vehicles | 18,868 (37.6%) | 14,581 (31.1%) |
| 3 or more Vehicles | 18,937 (37.8%) | 8,521 (18.2%) |
| Total | 50,125 (100.0%) | 46,850 (100.0%) |
Real Estate & Mortgages in Stockton
Real Estate and Mortgage Overview in Stockton
| Characteristic | Without Mortgage | With Mortgage |
| Housing Units | 15,811 | 34,314 |
| Median Property Value | $350,900 | $397,300 |
| Median Household Income | $72,870 | $9,184 |
| Monthly Housing Costs | $617 | $4,434 |
| Real Estate Taxes | $2,327 | $730 |
Property Value by Mortgage Status in Stockton
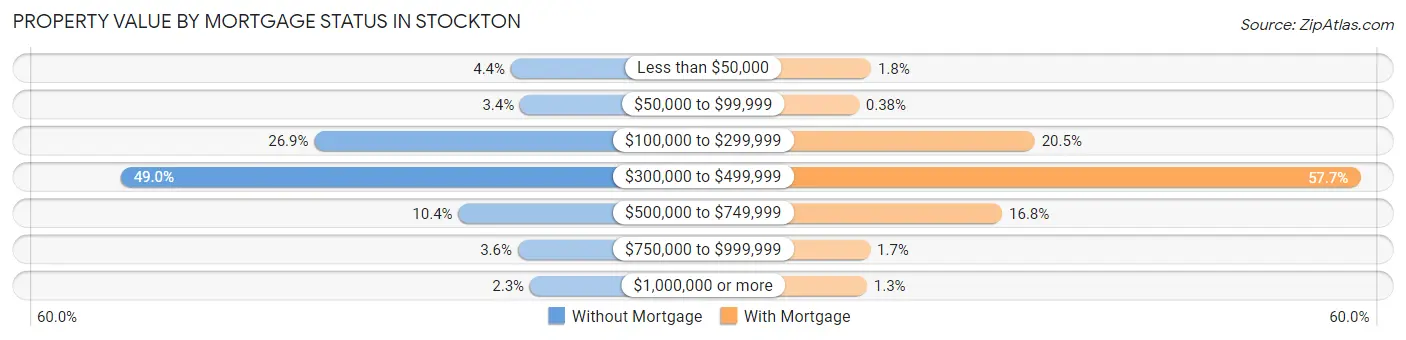
| Property Value | Without Mortgage | With Mortgage |
| Less than $50,000 | 700 (4.4%) | 604 (1.8%) |
| $50,000 to $99,999 | 534 (3.4%) | 132 (0.4%) |
| $100,000 to $299,999 | 4,251 (26.9%) | 7,028 (20.5%) |
| $300,000 to $499,999 | 7,749 (49.0%) | 19,789 (57.7%) |
| $500,000 to $749,999 | 1,647 (10.4%) | 5,749 (16.8%) |
| $750,000 to $999,999 | 574 (3.6%) | 568 (1.7%) |
| $1,000,000 or more | 356 (2.2%) | 444 (1.3%) |
| Total | 15,811 (100.0%) | 34,314 (100.0%) |
Household Income by Mortgage Status in Stockton
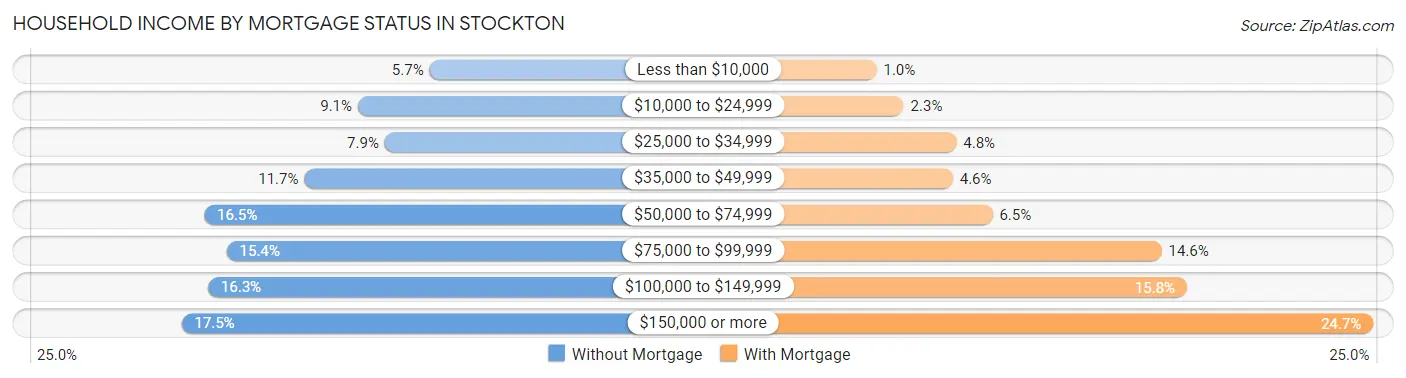
| Household Income | Without Mortgage | With Mortgage |
| Less than $10,000 | 904 (5.7%) | 344 (1.0%) |
| $10,000 to $24,999 | 1,443 (9.1%) | 785 (2.3%) |
| $25,000 to $34,999 | 1,241 (7.9%) | 1,648 (4.8%) |
| $35,000 to $49,999 | 1,846 (11.7%) | 1,589 (4.6%) |
| $50,000 to $74,999 | 2,601 (16.5%) | 2,237 (6.5%) |
| $75,000 to $99,999 | 2,432 (15.4%) | 4,998 (14.6%) |
| $100,000 to $149,999 | 2,572 (16.3%) | 5,416 (15.8%) |
| $150,000 or more | 2,772 (17.5%) | 8,457 (24.6%) |
| Total | 15,811 (100.0%) | 34,314 (100.0%) |
Property Value to Household Income Ratio in Stockton
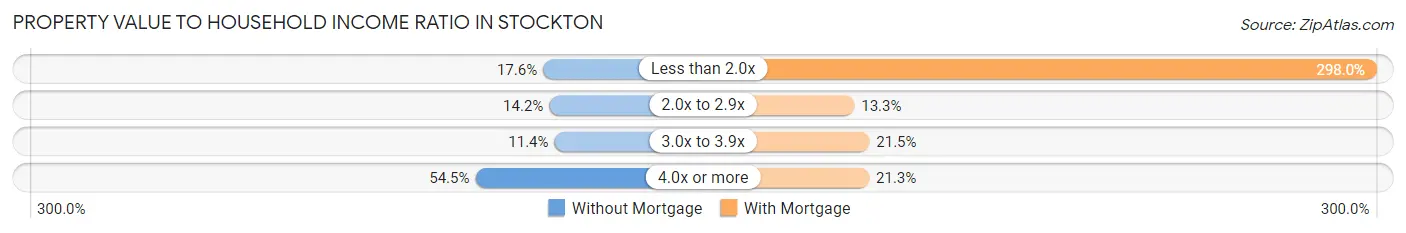
| Value-to-Income Ratio | Without Mortgage | With Mortgage |
| Less than 2.0x | 2,777 (17.6%) | 102,266 (298.0%) |
| 2.0x to 2.9x | 2,246 (14.2%) | 4,560 (13.3%) |
| 3.0x to 3.9x | 1,796 (11.4%) | 7,375 (21.5%) |
| 4.0x or more | 8,610 (54.5%) | 7,323 (21.3%) |
| Total | 15,811 (100.0%) | 34,314 (100.0%) |
Real Estate Taxes by Mortgage Status in Stockton
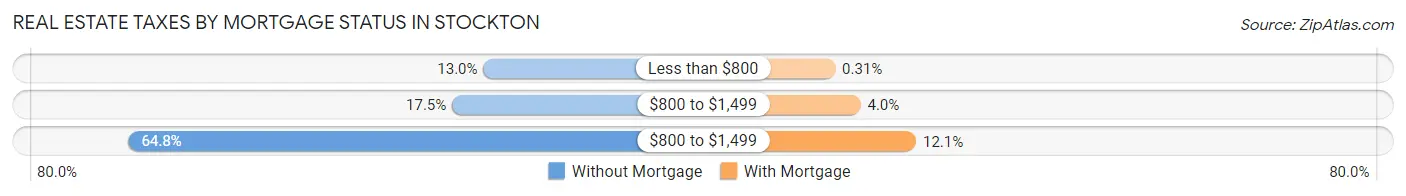
| Property Taxes | Without Mortgage | With Mortgage |
| Less than $800 | 2,050 (13.0%) | 106 (0.3%) |
| $800 to $1,499 | 2,771 (17.5%) | 1,380 (4.0%) |
| $800 to $1,499 | 10,248 (64.8%) | 4,161 (12.1%) |
| Total | 15,811 (100.0%) | 34,314 (100.0%) |
Health & Disability in Stockton
Health Insurance Coverage by Age in Stockton
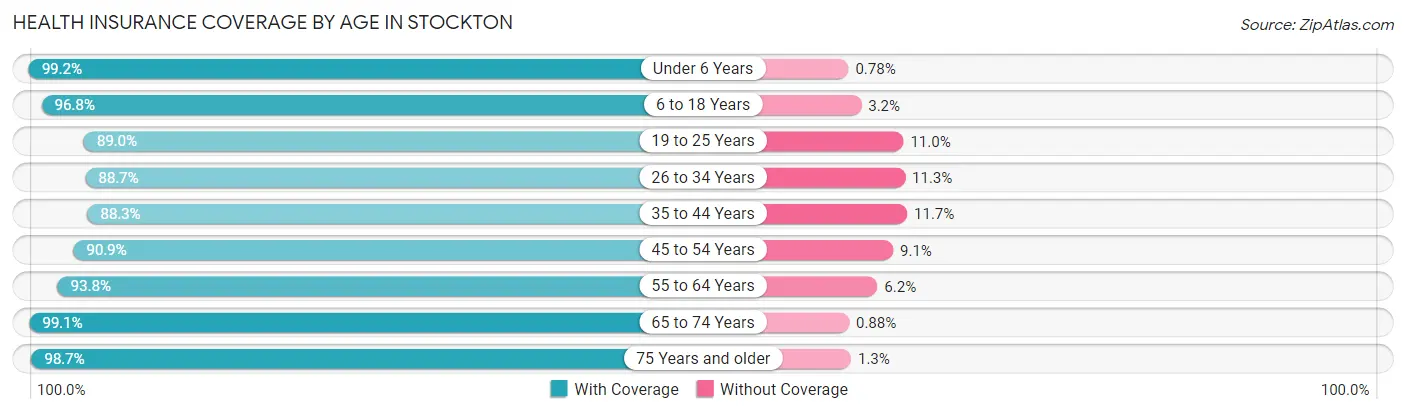
| Age Bracket | With Coverage | Without Coverage |
| Under 6 Years | 26,424 (99.2%) | 208 (0.8%) |
| 6 to 18 Years | 64,558 (96.8%) | 2,112 (3.2%) |
| 19 to 25 Years | 30,020 (89.0%) | 3,724 (11.0%) |
| 26 to 34 Years | 36,140 (88.7%) | 4,623 (11.3%) |
| 35 to 44 Years | 37,644 (88.3%) | 4,995 (11.7%) |
| 45 to 54 Years | 32,788 (90.9%) | 3,284 (9.1%) |
| 55 to 64 Years | 29,959 (93.8%) | 1,969 (6.2%) |
| 65 to 74 Years | 23,407 (99.1%) | 209 (0.9%) |
| 75 Years and older | 15,779 (98.7%) | 201 (1.3%) |
| Total | 296,719 (93.3%) | 21,325 (6.7%) |
Health Insurance Coverage by Citizenship Status in Stockton
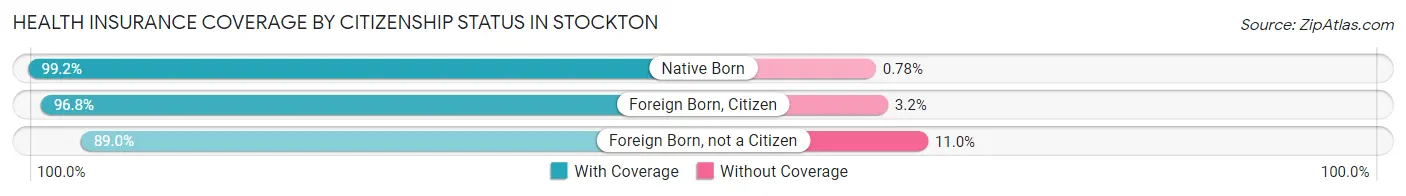
| Citizenship Status | With Coverage | Without Coverage |
| Native Born | 26,424 (99.2%) | 208 (0.8%) |
| Foreign Born, Citizen | 64,558 (96.8%) | 2,112 (3.2%) |
| Foreign Born, not a Citizen | 30,020 (89.0%) | 3,724 (11.0%) |
Health Insurance Coverage by Household Income in Stockton
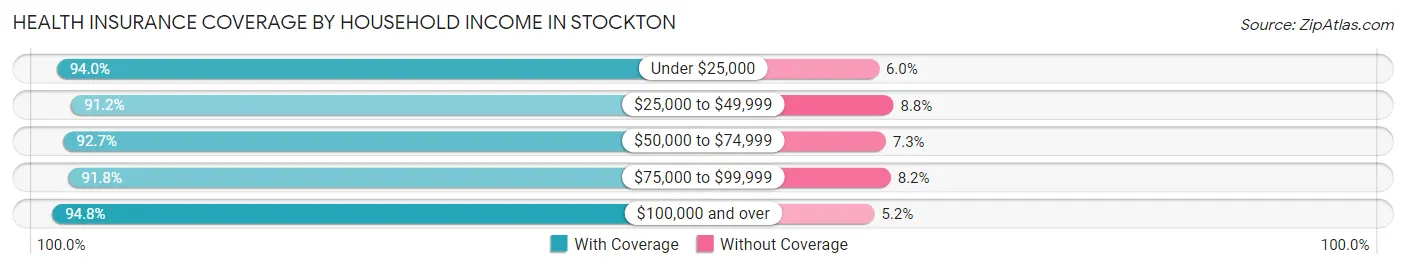
| Household Income | With Coverage | Without Coverage |
| Under $25,000 | 31,515 (94.0%) | 2,018 (6.0%) |
| $25,000 to $49,999 | 47,012 (91.2%) | 4,514 (8.8%) |
| $50,000 to $74,999 | 45,735 (92.7%) | 3,614 (7.3%) |
| $75,000 to $99,999 | 45,941 (91.8%) | 4,126 (8.2%) |
| $100,000 and over | 122,014 (94.8%) | 6,659 (5.2%) |
Public vs Private Health Insurance Coverage by Age in Stockton
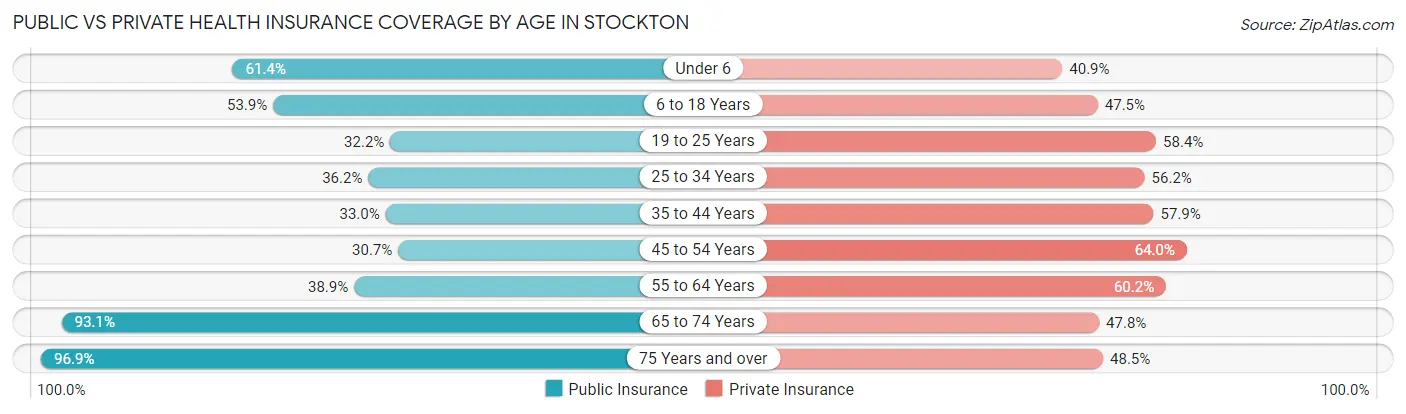
| Age Bracket | Public Insurance | Private Insurance |
| Under 6 | 16,350 (61.4%) | 10,904 (40.9%) |
| 6 to 18 Years | 35,930 (53.9%) | 31,688 (47.5%) |
| 19 to 25 Years | 10,850 (32.2%) | 19,691 (58.4%) |
| 25 to 34 Years | 14,763 (36.2%) | 22,917 (56.2%) |
| 35 to 44 Years | 14,069 (33.0%) | 24,681 (57.9%) |
| 45 to 54 Years | 11,063 (30.7%) | 23,097 (64.0%) |
| 55 to 64 Years | 12,403 (38.9%) | 19,211 (60.2%) |
| 65 to 74 Years | 21,996 (93.1%) | 11,281 (47.8%) |
| 75 Years and over | 15,490 (96.9%) | 7,752 (48.5%) |
| Total | 152,914 (48.1%) | 171,222 (53.8%) |
Disability Status by Sex by Age in Stockton
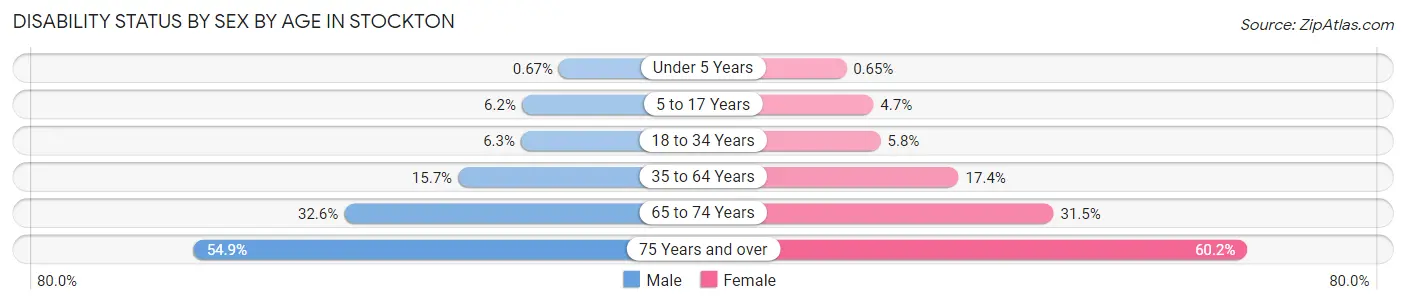
| Age Bracket | Male | Female |
| Under 5 Years | 72 (0.7%) | 76 (0.6%) |
| 5 to 17 Years | 2,022 (6.2%) | 1,535 (4.7%) |
| 18 to 34 Years | 2,563 (6.3%) | 2,269 (5.8%) |
| 35 to 64 Years | 8,491 (15.7%) | 9,791 (17.3%) |
| 65 to 74 Years | 3,282 (32.6%) | 4,258 (31.5%) |
| 75 Years and over | 3,632 (54.9%) | 5,636 (60.2%) |
Disability Class by Sex by Age in Stockton
Disability Class: Hearing Difficulty
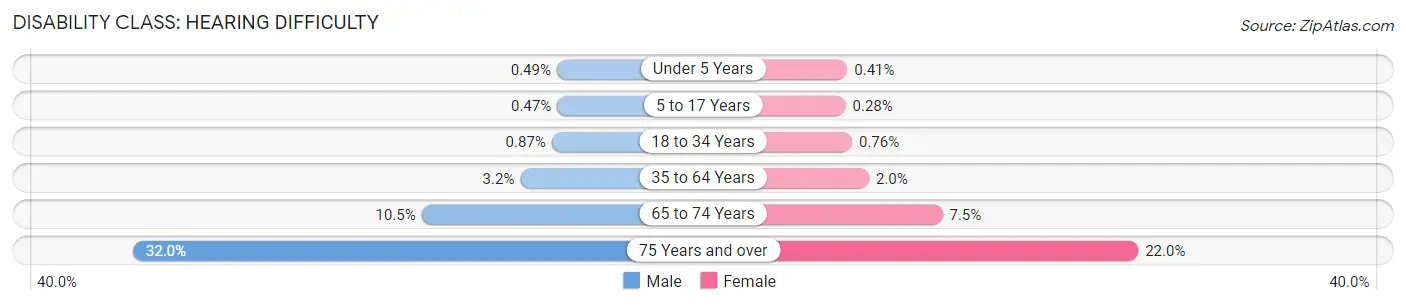
| Age Bracket | Male | Female |
| Under 5 Years | 52 (0.5%) | 48 (0.4%) |
| 5 to 17 Years | 155 (0.5%) | 90 (0.3%) |
| 18 to 34 Years | 352 (0.9%) | 299 (0.8%) |
| 35 to 64 Years | 1,735 (3.2%) | 1,139 (2.0%) |
| 65 to 74 Years | 1,061 (10.5%) | 1,013 (7.5%) |
| 75 Years and over | 2,115 (32.0%) | 2,061 (22.0%) |
Disability Class: Vision Difficulty
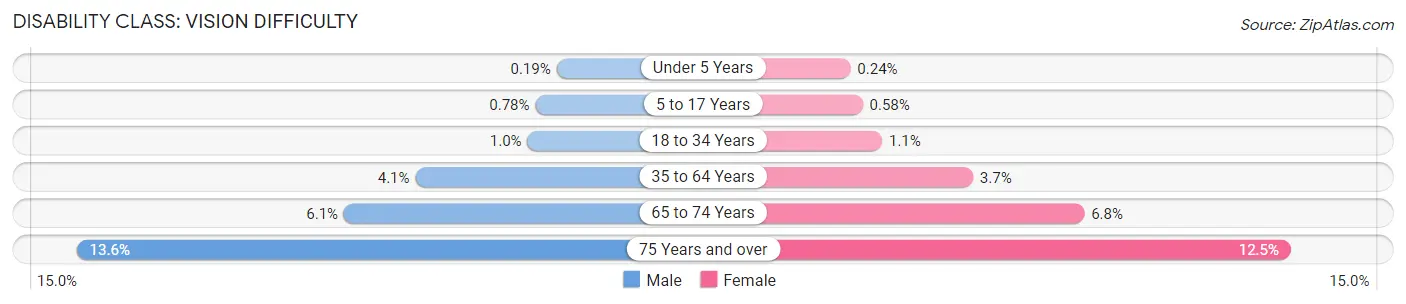
| Age Bracket | Male | Female |
| Under 5 Years | 20 (0.2%) | 28 (0.2%) |
| 5 to 17 Years | 255 (0.8%) | 191 (0.6%) |
| 18 to 34 Years | 406 (1.0%) | 440 (1.1%) |
| 35 to 64 Years | 2,236 (4.1%) | 2,060 (3.6%) |
| 65 to 74 Years | 616 (6.1%) | 914 (6.8%) |
| 75 Years and over | 897 (13.6%) | 1,170 (12.5%) |
Disability Class: Cognitive Difficulty
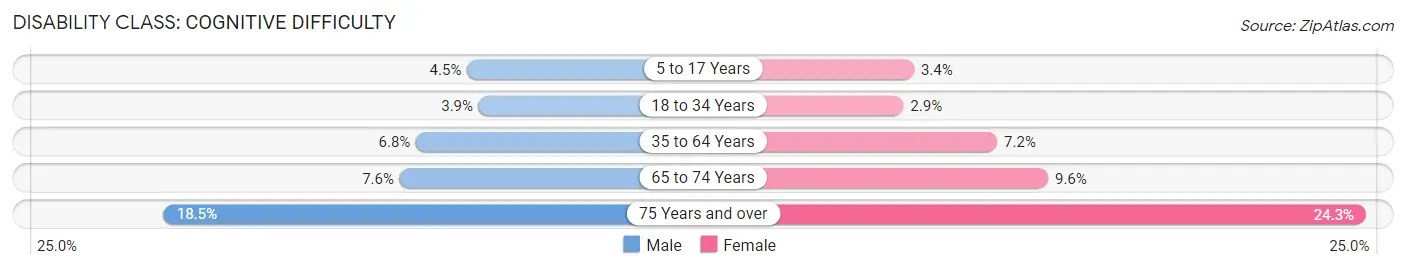
| Age Bracket | Male | Female |
| 5 to 17 Years | 1,457 (4.5%) | 1,095 (3.4%) |
| 18 to 34 Years | 1,592 (3.9%) | 1,127 (2.9%) |
| 35 to 64 Years | 3,701 (6.8%) | 4,069 (7.2%) |
| 65 to 74 Years | 765 (7.6%) | 1,296 (9.6%) |
| 75 Years and over | 1,227 (18.5%) | 2,277 (24.3%) |
Disability Class: Ambulatory Difficulty
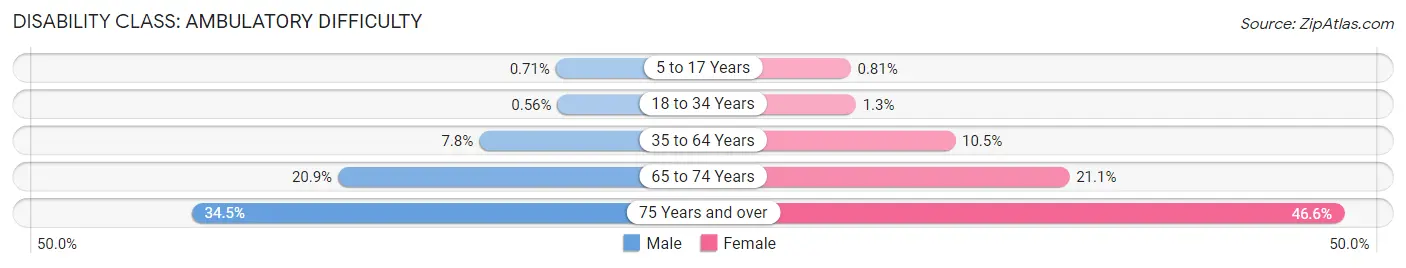
| Age Bracket | Male | Female |
| 5 to 17 Years | 233 (0.7%) | 264 (0.8%) |
| 18 to 34 Years | 227 (0.6%) | 508 (1.3%) |
| 35 to 64 Years | 4,238 (7.8%) | 5,933 (10.5%) |
| 65 to 74 Years | 2,109 (20.9%) | 2,857 (21.1%) |
| 75 Years and over | 2,283 (34.5%) | 4,362 (46.6%) |
Disability Class: Self-Care Difficulty
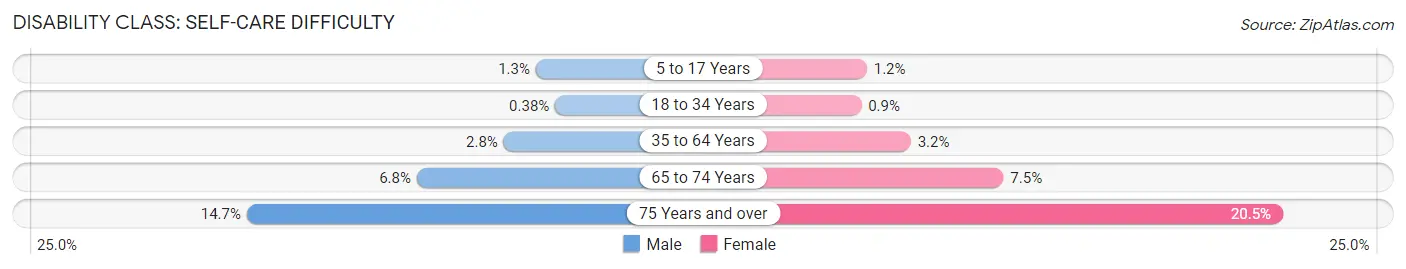
| Age Bracket | Male | Female |
| 5 to 17 Years | 420 (1.3%) | 381 (1.2%) |
| 18 to 34 Years | 154 (0.4%) | 354 (0.9%) |
| 35 to 64 Years | 1,504 (2.8%) | 1,807 (3.2%) |
| 65 to 74 Years | 685 (6.8%) | 1,015 (7.5%) |
| 75 Years and over | 972 (14.7%) | 1,916 (20.5%) |
Technology Access in Stockton
Computing Device Access in Stockton
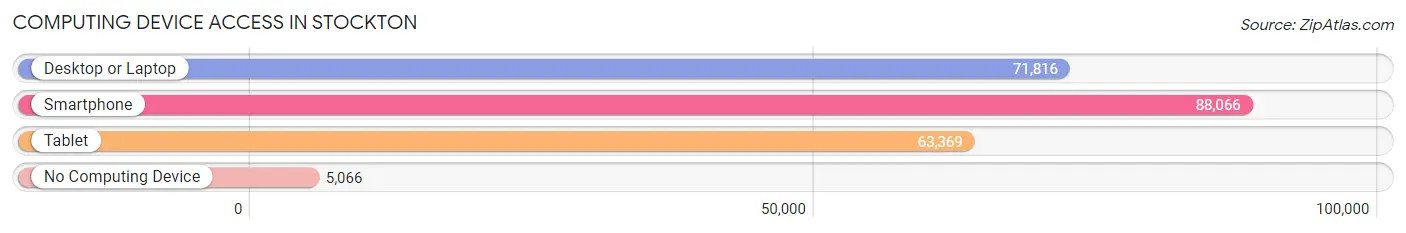
| Device Type | # Households | % Households |
| Desktop or Laptop | 71,816 | 74.1% |
| Smartphone | 88,066 | 90.8% |
| Tablet | 63,369 | 65.3% |
| No Computing Device | 5,066 | 5.2% |
| Total | 96,975 | 100.0% |
Internet Access in Stockton
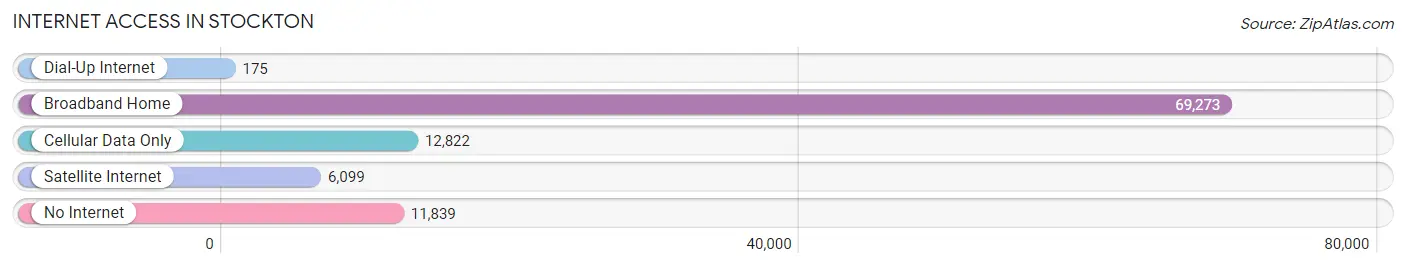
| Internet Type | # Households | % Households |
| Dial-Up Internet | 175 | 0.2% |
| Broadband Home | 69,273 | 71.4% |
| Cellular Data Only | 12,822 | 13.2% |
| Satellite Internet | 6,099 | 6.3% |
| No Internet | 11,839 | 12.2% |
| Total | 96,975 | 100.0% |
Stockton Summary
Stockton, California is a city located in San Joaquin County in the Central Valley of California. It is the 13th largest city in the state and the county seat of San Joaquin County. The city is situated along the San Joaquin River, and is the largest inland port in California. Stockton is known for its rich history, diverse geography, vibrant economy, and diverse demographics.
History
Stockton was founded in 1849 by Captain Charles Maria Weber, a German-born settler who was the first to establish a permanent settlement in the area. Weber named the settlement after his hometown of Stockton-on-Tees in England. The city quickly grew and became an important port and trading center for the region. In 1851, Stockton was incorporated as a city and became the county seat of San Joaquin County.
During the California Gold Rush, Stockton became a major supply center for miners and was the site of the first California State Fair in 1854. The city also became a major transportation hub, with the completion of the Stockton and Copperopolis Railroad in 1869.
In the late 19th century, Stockton was a major center for agriculture and was home to several large canneries. The city also became a major center for manufacturing, with the establishment of several large factories.
Geography
Stockton is located in the Central Valley of California, approximately 80 miles east of San Francisco. The city is situated along the San Joaquin River, and is the largest inland port in California. The city is surrounded by several smaller cities, including Lodi, Manteca, and Tracy.
The city has a total area of 64.8 square miles, of which 62.2 square miles is land and 2.6 square miles is water. The city is located at an elevation of 38 feet above sea level.
Economy
Stockton has a diverse economy, with a variety of industries including agriculture, manufacturing, healthcare, education, and transportation. The city is home to several large companies, including the University of the Pacific, San Joaquin Delta College, and the Stockton Ports baseball team.
The city is also home to several major employers, including the Port of Stockton, San Joaquin County, and the Stockton Unified School District. The city is also home to several large healthcare providers, including St. Joseph's Medical Center and Dameron Hospital.
Demographics
As of the 2010 census, Stockton had a population of 291,707. The city has a population density of 4,521 people per square mile. The racial makeup of the city was 57.2% White, 8.3% African American, 1.2% Native American, 11.2% Asian, 0.4% Pacific Islander, 17.3% from other races, and 5.4% from two or more races. Hispanic or Latino of any race were 33.2% of the population.
The median income for a household in the city was $41,919, and the median income for a family was $50,945. The per capita income for the city was $20,945. About 17.2% of families and 21.3% of the population were below the poverty line, including 28.3% of those under age 18 and 10.2% of those age 65 or over.
Common Questions
What is Per Capita Income in Stockton?
Per Capita income in Stockton is $29,095.
What is the Median Family Income in Stockton?
Median Family Income in Stockton is $78,345.
What is the Median Household income in Stockton?
Median Household Income in Stockton is $71,612.
What is Income or Wage Gap in Stockton?
Income or Wage Gap in Stockton is 23.3%.
Women in Stockton earn 76.7 cents for every dollar earned by a man.
What is Family Income Deficit in Stockton?
Family Income Deficit in Stockton is $11,521.
Families that are below poverty line in Stockton earn $11,521 less on average than the poverty threshold level.
What is Inequality or Gini Index in Stockton?
Inequality or Gini Index in Stockton is 0.45.
What is the Total Population of Stockton?
Total Population of Stockton is 320,030.
What is the Total Male Population of Stockton?
Total Male Population of Stockton is 155,805.
What is the Total Female Population of Stockton?
Total Female Population of Stockton is 164,225.
What is the Ratio of Males per 100 Females in Stockton?
There are 94.87 Males per 100 Females in Stockton.
What is the Ratio of Females per 100 Males in Stockton?
There are 105.40 Females per 100 Males in Stockton.
What is the Median Population Age in Stockton?
Median Population Age in Stockton is 33.2 Years.
What is the Average Family Size in Stockton
Average Family Size in Stockton is 3.8 People.
What is the Average Household Size in Stockton
Average Household Size in Stockton is 3.2 People.
How Large is the Labor Force in Stockton?
There are 146,408 People in the Labor Forcein in Stockton.
What is the Percentage of People in the Labor Force in Stockton?
60.3% of People are in the Labor Force in Stockton.
What is the Unemployment Rate in Stockton?
Unemployment Rate in Stockton is 7.7%.