Salinas, CA Map & Demographics
Salinas Map
Salinas Overview
$27,344
PER CAPITA INCOME
$84,338
AVG FAMILY INCOME
$84,250
AVG HOUSEHOLD INCOME
18.2%
WAGE / INCOME GAP [ % ]
81.8¢/ $1
WAGE / INCOME GAP [ $ ]
$10,478
FAMILY INCOME DEFICIT
0.41
INEQUALITY / GINI INDEX
162,783
TOTAL POPULATION
83,175
MALE POPULATION
79,608
FEMALE POPULATION
104.48
MALES / 100 FEMALES
95.71
FEMALES / 100 MALES
31.7
MEDIAN AGE
4.1
AVG FAMILY SIZE
3.7
AVG HOUSEHOLD SIZE
74,174
LABOR FORCE [ PEOPLE ]
62.2%
PERCENT IN LABOR FORCE
5.0%
UNEMPLOYMENT RATE
Income in Salinas
Income Overview in Salinas
Per Capita Income in Salinas is $27,344, while median incomes of families and households are $84,338 and $84,250 respectively.
| Characteristic | Number | Measure |
| Per Capita Income | 162,783 | $27,344 |
| Median Family Income | 34,038 | $84,338 |
| Mean Family Income | 34,038 | $103,535 |
| Median Household Income | 43,073 | $84,250 |
| Mean Household Income | 43,073 | $102,219 |
| Income Deficit | 34,038 | $10,478 |
| Wage / Income Gap (%) | 162,783 | 18.20% |
| Wage / Income Gap ($) | 162,783 | 81.80¢ per $1 |
| Gini / Inequality Index | 162,783 | 0.41 |
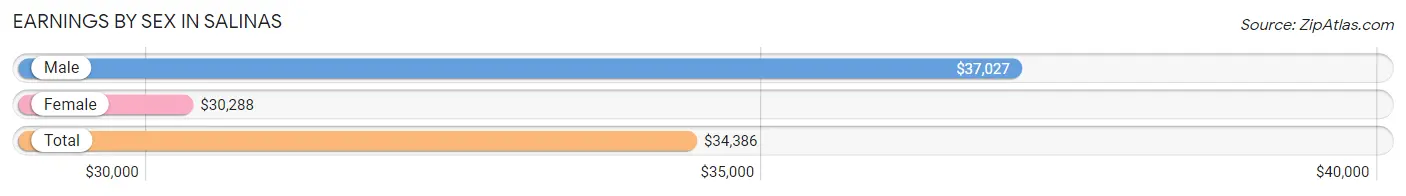
Earnings by Sex in Salinas
Average Earnings in Salinas are $34,386, $37,027 for men and $30,288 for women, a difference of 18.2%.
| Sex | Number | Average Earnings |
| Male | 44,026 (54.8%) | $37,027 |
| Female | 36,301 (45.2%) | $30,288 |
| Total | 80,327 (100.0%) | $34,386 |
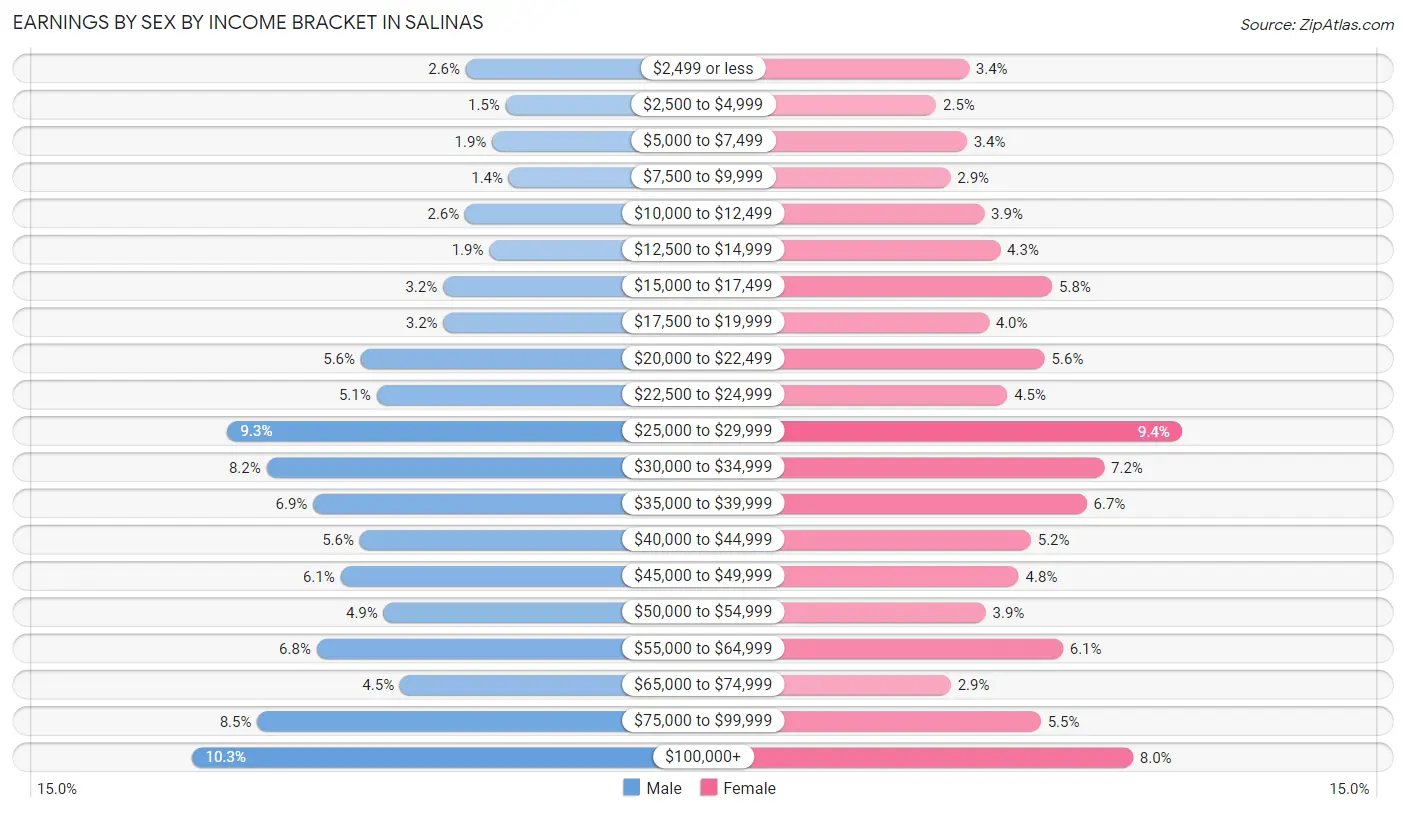
Earnings by Sex by Income Bracket in Salinas
The most common earnings brackets in Salinas are $100,000+ for men (4,527 | 10.3%) and $25,000 to $29,999 for women (3,415 | 9.4%).
| Income | Male | Female |
| $2,499 or less | 1,145 (2.6%) | 1,244 (3.4%) |
| $2,500 to $4,999 | 652 (1.5%) | 912 (2.5%) |
| $5,000 to $7,499 | 820 (1.9%) | 1,223 (3.4%) |
| $7,500 to $9,999 | 611 (1.4%) | 1,058 (2.9%) |
| $10,000 to $12,499 | 1,152 (2.6%) | 1,402 (3.9%) |
| $12,500 to $14,999 | 853 (1.9%) | 1,566 (4.3%) |
| $15,000 to $17,499 | 1,427 (3.2%) | 2,095 (5.8%) |
| $17,500 to $19,999 | 1,424 (3.2%) | 1,449 (4.0%) |
| $20,000 to $22,499 | 2,443 (5.6%) | 2,019 (5.6%) |
| $22,500 to $24,999 | 2,248 (5.1%) | 1,638 (4.5%) |
| $25,000 to $29,999 | 4,094 (9.3%) | 3,415 (9.4%) |
| $30,000 to $34,999 | 3,608 (8.2%) | 2,625 (7.2%) |
| $35,000 to $39,999 | 3,033 (6.9%) | 2,447 (6.7%) |
| $40,000 to $44,999 | 2,458 (5.6%) | 1,878 (5.2%) |
| $45,000 to $49,999 | 2,695 (6.1%) | 1,753 (4.8%) |
| $50,000 to $54,999 | 2,163 (4.9%) | 1,416 (3.9%) |
| $55,000 to $64,999 | 2,991 (6.8%) | 2,202 (6.1%) |
| $65,000 to $74,999 | 1,957 (4.4%) | 1,061 (2.9%) |
| $75,000 to $99,999 | 3,725 (8.5%) | 1,979 (5.4%) |
| $100,000+ | 4,527 (10.3%) | 2,919 (8.0%) |
| Total | 44,026 (100.0%) | 36,301 (100.0%) |
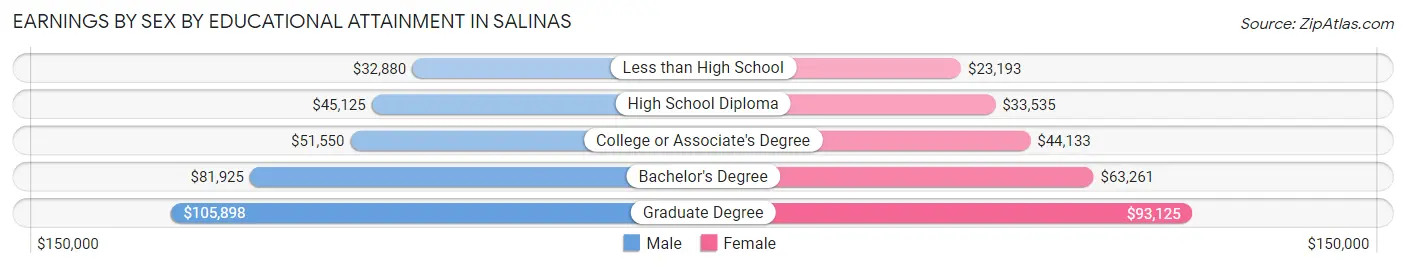
Earnings by Sex by Educational Attainment in Salinas
Average earnings in Salinas are $41,576 for men and $34,652 for women, a difference of 16.7%. Men with an educational attainment of graduate degree enjoy the highest average annual earnings of $105,898, while those with less than high school education earn the least with $32,880. Women with an educational attainment of graduate degree earn the most with the average annual earnings of $93,125, while those with less than high school education have the smallest earnings of $23,193.
| Educational Attainment | Male Income | Female Income |
| Less than High School | $32,880 | $23,193 |
| High School Diploma | $45,125 | $33,535 |
| College or Associate's Degree | $51,550 | $44,133 |
| Bachelor's Degree | $81,925 | $63,261 |
| Graduate Degree | $105,898 | $93,125 |
| Total | $41,576 | $34,652 |
Family Income in Salinas
Family Income Brackets in Salinas
According to the Salinas family income data, there are 6,740 families falling into the $100,000 to $149,999 income range, which is the most common income bracket and makes up 19.8% of all families. Conversely, the $10,000 to $14,999 income bracket is the least frequent group with only 579 families (1.7%) belonging to this category.
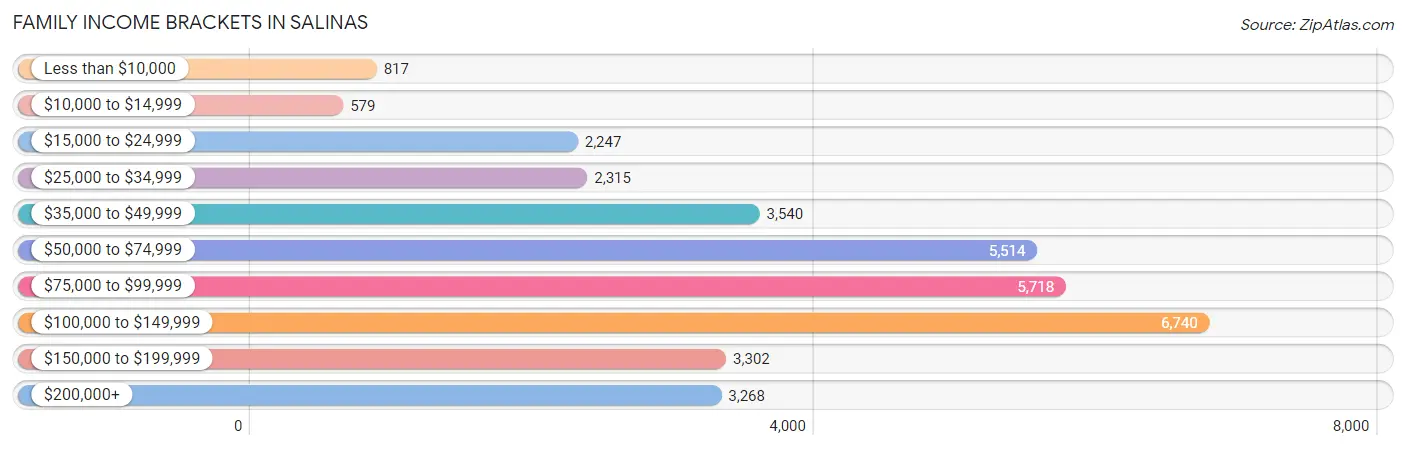
| Income Bracket | # Families | % Families |
| Less than $10,000 | 817 | 2.4% |
| $10,000 to $14,999 | 579 | 1.7% |
| $15,000 to $24,999 | 2,247 | 6.6% |
| $25,000 to $34,999 | 2,315 | 6.8% |
| $35,000 to $49,999 | 3,540 | 10.4% |
| $50,000 to $74,999 | 5,514 | 16.2% |
| $75,000 to $99,999 | 5,718 | 16.8% |
| $100,000 to $149,999 | 6,740 | 19.8% |
| $150,000 to $199,999 | 3,302 | 9.7% |
| $200,000+ | 3,268 | 9.6% |
Family Income by Famaliy Size in Salinas
7+ person families (2,477 | 7.3%) account for the highest median family income in Salinas with $121,016 per family, while 2-person families (8,392 | 24.6%) have the highest median income of $36,239 per family member.
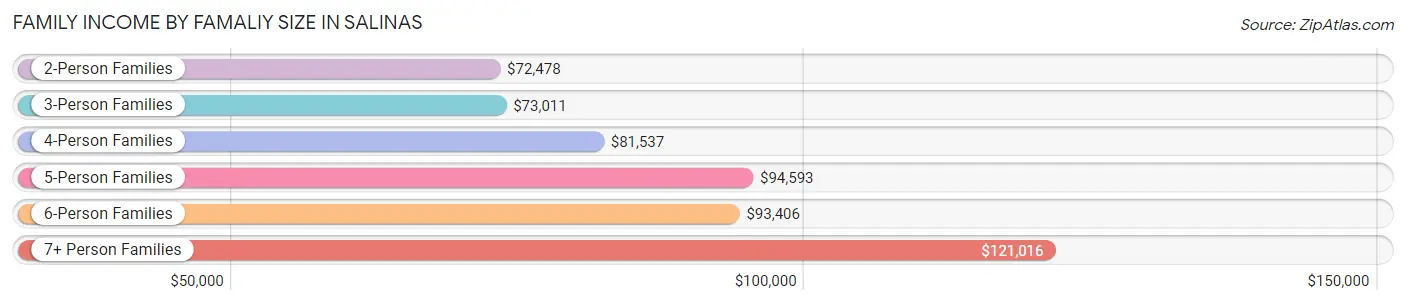
| Income Bracket | # Families | Median Income |
| 2-Person Families | 8,392 (24.6%) | $72,478 |
| 3-Person Families | 6,647 (19.5%) | $73,011 |
| 4-Person Families | 8,152 (23.9%) | $81,537 |
| 5-Person Families | 5,433 (16.0%) | $94,593 |
| 6-Person Families | 2,937 (8.6%) | $93,406 |
| 7+ Person Families | 2,477 (7.3%) | $121,016 |
| Total | 34,038 (100.0%) | $84,338 |
Family Income by Number of Earners in Salinas
The median family income in Salinas is $84,338, with families comprising 3+ earners (9,185) having the highest median family income of $127,430, while families with no earners (3,105) have the lowest median family income of $26,008, accounting for 27.0% and 9.1% of families, respectively.
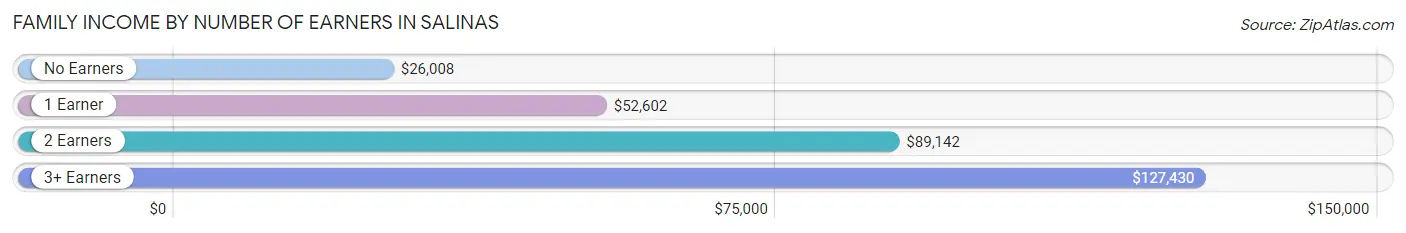
| Number of Earners | # Families | Median Income |
| No Earners | 3,105 (9.1%) | $26,008 |
| 1 Earner | 10,066 (29.6%) | $52,602 |
| 2 Earners | 11,682 (34.3%) | $89,142 |
| 3+ Earners | 9,185 (27.0%) | $127,430 |
| Total | 34,038 (100.0%) | $84,338 |
Household Income in Salinas
Household Income Brackets in Salinas
With 8,959 households falling in the category, the $100,000 to $149,999 income range is the most frequent in Salinas, accounting for 20.8% of all households. In contrast, only 1,206 households (2.8%) fall into the less than $10,000 income bracket, making it the least populous group.
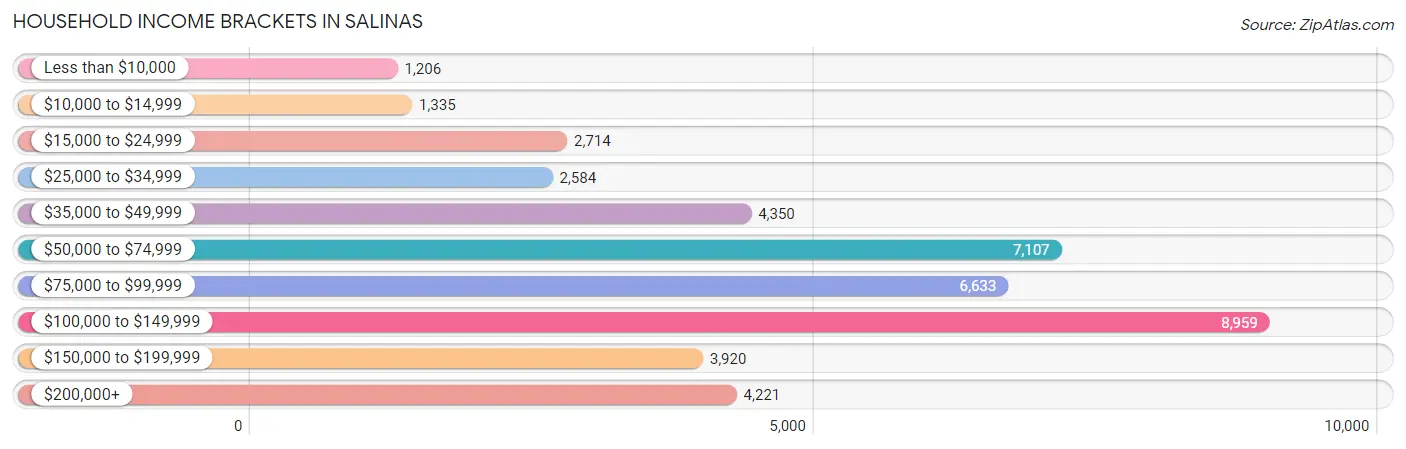
| Income Bracket | # Households | % Households |
| Less than $10,000 | 1,206 | 2.8% |
| $10,000 to $14,999 | 1,335 | 3.1% |
| $15,000 to $24,999 | 2,714 | 6.3% |
| $25,000 to $34,999 | 2,584 | 6.0% |
| $35,000 to $49,999 | 4,350 | 10.1% |
| $50,000 to $74,999 | 7,107 | 16.5% |
| $75,000 to $99,999 | 6,633 | 15.4% |
| $100,000 to $149,999 | 8,959 | 20.8% |
| $150,000 to $199,999 | 3,920 | 9.1% |
| $200,000+ | 4,221 | 9.8% |
Household Income by Householder Age in Salinas
The median household income in Salinas is $84,250, with the highest median household income of $103,070 found in the 45 to 64 years age bracket for the primary householder. A total of 16,353 households (38.0%) fall into this category. Meanwhile, the 65+ years age bracket for the primary householder has the lowest median household income of $57,596, with 8,540 households (19.8%) in this group.
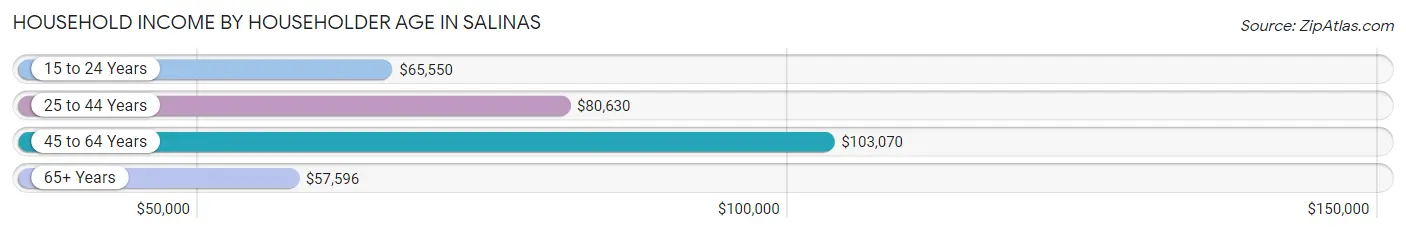
| Income Bracket | # Households | Median Income |
| 15 to 24 Years | 1,035 (2.4%) | $65,550 |
| 25 to 44 Years | 17,145 (39.8%) | $80,630 |
| 45 to 64 Years | 16,353 (38.0%) | $103,070 |
| 65+ Years | 8,540 (19.8%) | $57,596 |
| Total | 43,073 (100.0%) | $84,250 |
Poverty in Salinas
Income Below Poverty by Sex and Age in Salinas
With 12.8% poverty level for males and 15.7% for females among the residents of Salinas, 5 year old males and 5 year old females are the most vulnerable to poverty, with 316 males (25.0%) and 329 females (31.7%) in their respective age groups living below the poverty level.
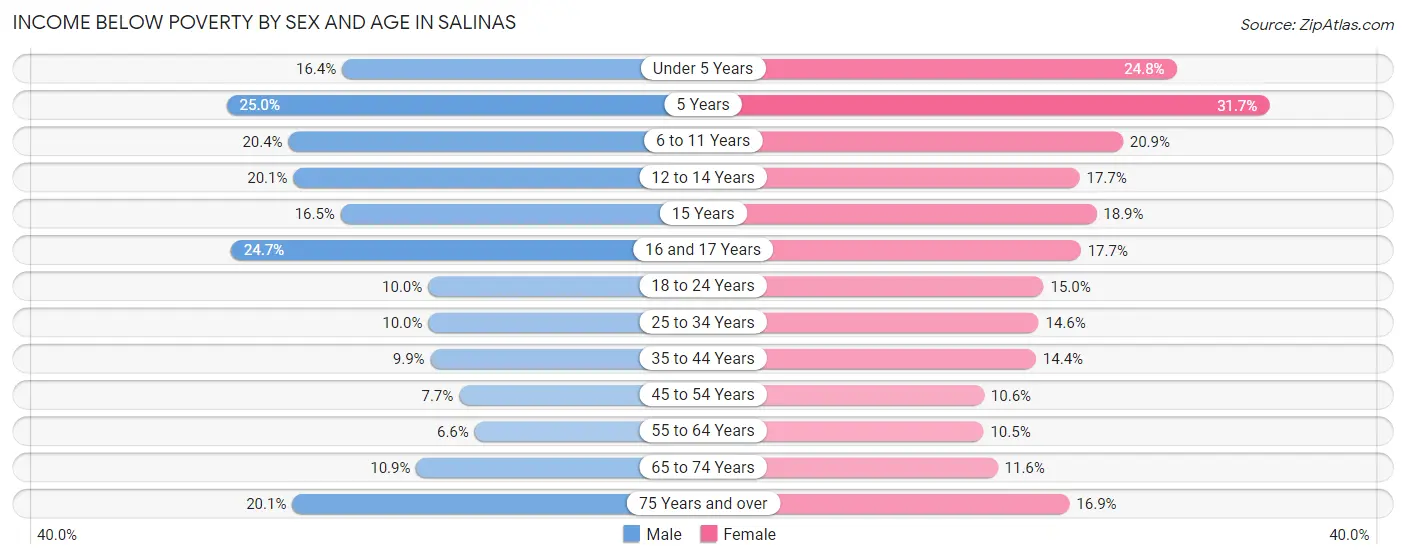
| Age Bracket | Male | Female |
| Under 5 Years | 1,070 (16.4%) | 1,602 (24.8%) |
| 5 Years | 316 (25.0%) | 329 (31.7%) |
| 6 to 11 Years | 1,711 (20.4%) | 1,544 (20.9%) |
| 12 to 14 Years | 977 (20.1%) | 731 (17.6%) |
| 15 Years | 237 (16.5%) | 236 (18.9%) |
| 16 and 17 Years | 705 (24.7%) | 393 (17.7%) |
| 18 to 24 Years | 887 (10.0%) | 1,252 (15.0%) |
| 25 to 34 Years | 1,233 (10.0%) | 1,690 (14.6%) |
| 35 to 44 Years | 1,129 (9.9%) | 1,592 (14.4%) |
| 45 to 54 Years | 751 (7.7%) | 957 (10.5%) |
| 55 to 64 Years | 497 (6.6%) | 815 (10.5%) |
| 65 to 74 Years | 467 (10.9%) | 540 (11.6%) |
| 75 Years and over | 552 (20.1%) | 685 (16.9%) |
| Total | 10,532 (12.8%) | 12,366 (15.7%) |
Income Above Poverty by Sex and Age in Salinas
According to the poverty statistics in Salinas, males aged 55 to 64 years and females aged 55 to 64 years are the age groups that are most secure financially, with 93.4% of males and 89.5% of females in these age groups living above the poverty line.
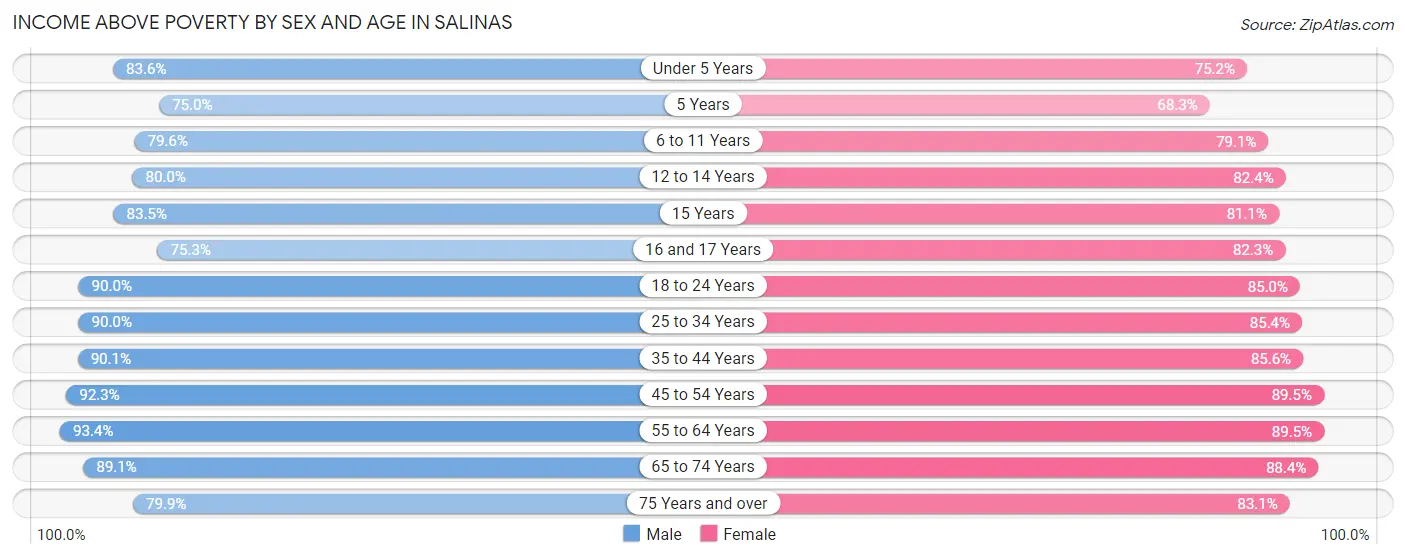
| Age Bracket | Male | Female |
| Under 5 Years | 5,442 (83.6%) | 4,848 (75.2%) |
| 5 Years | 948 (75.0%) | 708 (68.3%) |
| 6 to 11 Years | 6,672 (79.6%) | 5,859 (79.1%) |
| 12 to 14 Years | 3,896 (79.9%) | 3,410 (82.4%) |
| 15 Years | 1,197 (83.5%) | 1,013 (81.1%) |
| 16 and 17 Years | 2,152 (75.3%) | 1,822 (82.3%) |
| 18 to 24 Years | 7,950 (90.0%) | 7,107 (85.0%) |
| 25 to 34 Years | 11,062 (90.0%) | 9,875 (85.4%) |
| 35 to 44 Years | 10,306 (90.1%) | 9,457 (85.6%) |
| 45 to 54 Years | 8,946 (92.3%) | 8,116 (89.4%) |
| 55 to 64 Years | 7,047 (93.4%) | 6,929 (89.5%) |
| 65 to 74 Years | 3,810 (89.1%) | 4,127 (88.4%) |
| 75 Years and over | 2,190 (79.9%) | 3,368 (83.1%) |
| Total | 71,618 (87.2%) | 66,639 (84.4%) |
Income Below Poverty Among Married-Couple Families in Salinas
The poverty statistics for married-couple families in Salinas show that 7.1% or 1,575 of the total 22,129 families live below the poverty line. Families with 5 or more children have the highest poverty rate of 30.3%, comprising of 137 families. On the other hand, families with no children have the lowest poverty rate of 5.0%, which includes 463 families.
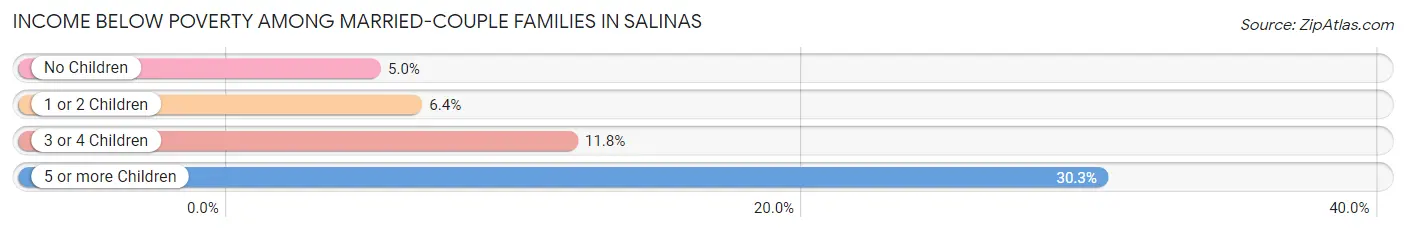
| Children | Above Poverty | Below Poverty |
| No Children | 8,842 (95.0%) | 463 (5.0%) |
| 1 or 2 Children | 8,464 (93.6%) | 581 (6.4%) |
| 3 or 4 Children | 2,933 (88.2%) | 394 (11.8%) |
| 5 or more Children | 315 (69.7%) | 137 (30.3%) |
| Total | 20,554 (92.9%) | 1,575 (7.1%) |
Income Below Poverty Among Single-Parent Households in Salinas
According to the poverty data in Salinas, 12.4% or 497 single-father households and 25.6% or 2,026 single-mother households are living below the poverty line. Among single-father households, those with 3 or 4 children have the highest poverty rate, with 180 households (35.2%) experiencing poverty. Likewise, among single-mother households, those with 5 or more children have the highest poverty rate, with 117 households (65.7%) falling below the poverty line.
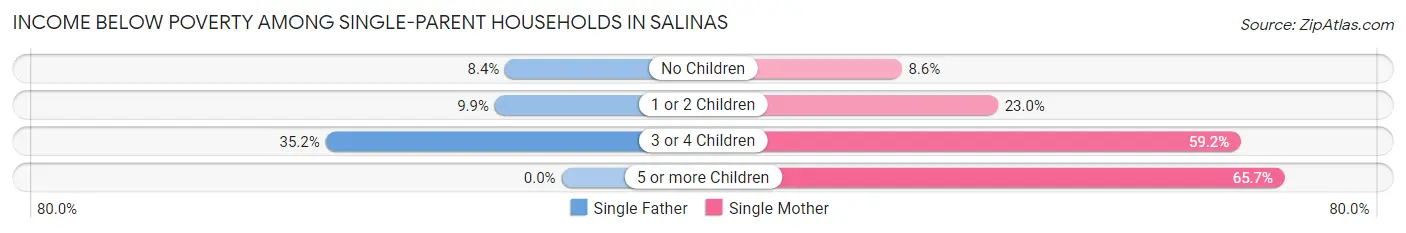
| Children | Single Father | Single Mother |
| No Children | 130 (8.4%) | 238 (8.6%) |
| 1 or 2 Children | 187 (9.9%) | 807 (23.0%) |
| 3 or 4 Children | 180 (35.2%) | 864 (59.2%) |
| 5 or more Children | 0 (0.0%) | 117 (65.7%) |
| Total | 497 (12.4%) | 2,026 (25.6%) |
Income Below Poverty Among Married-Couple vs Single-Parent Households in Salinas
The poverty data for Salinas shows that 1,575 of the married-couple family households (7.1%) and 2,523 of the single-parent households (21.2%) are living below the poverty level. Within the married-couple family households, those with 5 or more children have the highest poverty rate, with 137 households (30.3%) falling below the poverty line. Among the single-parent households, those with 3 or 4 children have the highest poverty rate, with 1,044 household (53.0%) living below poverty.
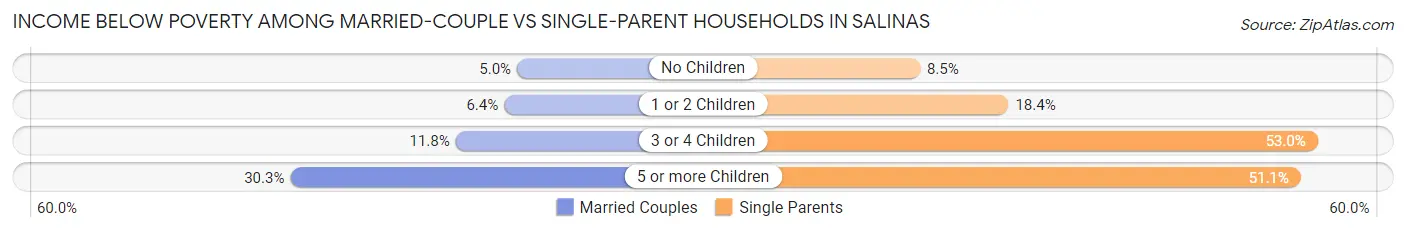
| Children | Married-Couple Families | Single-Parent Households |
| No Children | 463 (5.0%) | 368 (8.5%) |
| 1 or 2 Children | 581 (6.4%) | 994 (18.4%) |
| 3 or 4 Children | 394 (11.8%) | 1,044 (53.0%) |
| 5 or more Children | 137 (30.3%) | 117 (51.1%) |
| Total | 1,575 (7.1%) | 2,523 (21.2%) |
Race in Salinas
The most populous races in Salinas are Hispanic or Latino (130,548 | 80.2%), Some other Race (92,686 | 56.9%), and White / Caucasian (40,901 | 25.1%).
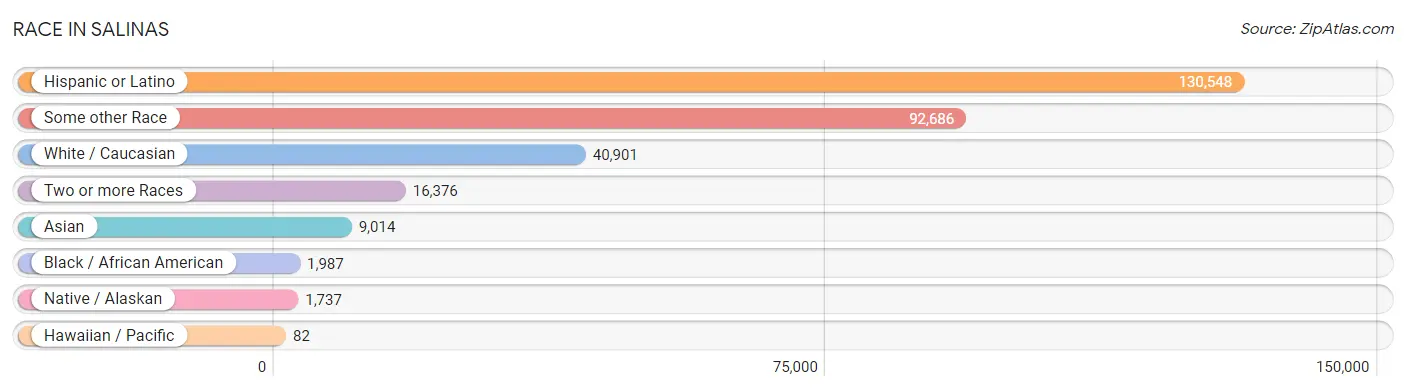
| Race | # Population | % Population |
| Asian | 9,014 | 5.5% |
| Black / African American | 1,987 | 1.2% |
| Hawaiian / Pacific | 82 | 0.1% |
| Hispanic or Latino | 130,548 | 80.2% |
| Native / Alaskan | 1,737 | 1.1% |
| White / Caucasian | 40,901 | 25.1% |
| Two or more Races | 16,376 | 10.1% |
| Some other Race | 92,686 | 56.9% |
| Total | 162,783 | 100.0% |
Ancestry in Salinas
The most populous ancestries reported in Salinas are Mexican (120,904 | 74.3%), Korean (6,935 | 4.3%), Central American (5,064 | 3.1%), Salvadoran (3,983 | 2.5%), and German (3,669 | 2.2%), together accounting for 86.3% of all Salinas residents.
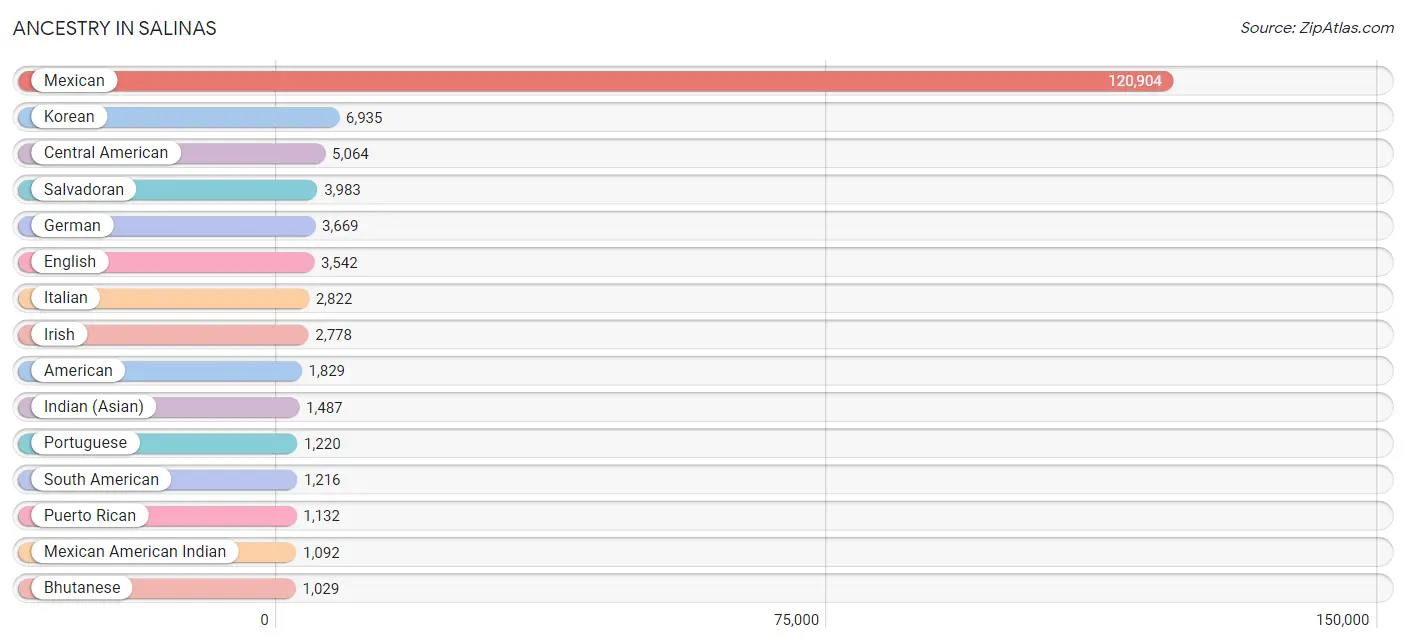
| Ancestry | # Population | % Population |
| Afghan | 13 | 0.0% |
| African | 155 | 0.1% |
| American | 1,829 | 1.1% |
| Apache | 202 | 0.1% |
| Arab | 372 | 0.2% |
| Argentinean | 822 | 0.5% |
| Armenian | 15 | 0.0% |
| Assyrian / Chaldean / Syriac | 25 | 0.0% |
| Australian | 10 | 0.0% |
| Austrian | 19 | 0.0% |
| Bangladeshi | 75 | 0.1% |
| Basque | 10 | 0.0% |
| Belizean | 22 | 0.0% |
| Bhutanese | 1,029 | 0.6% |
| Blackfeet | 235 | 0.1% |
| Brazilian | 127 | 0.1% |
| British | 120 | 0.1% |
| Bulgarian | 8 | 0.0% |
| Burmese | 494 | 0.3% |
| Canadian | 35 | 0.0% |
| Celtic | 7 | 0.0% |
| Central American | 5,064 | 3.1% |
| Central American Indian | 116 | 0.1% |
| Cherokee | 171 | 0.1% |
| Chippewa | 4 | 0.0% |
| Choctaw | 136 | 0.1% |
| Colombian | 84 | 0.1% |
| Comanche | 22 | 0.0% |
| Cree | 12 | 0.0% |
| Croatian | 60 | 0.0% |
| Cuban | 212 | 0.1% |
| Czech | 192 | 0.1% |
| Czechoslovakian | 37 | 0.0% |
| Danish | 481 | 0.3% |
| Dominican | 44 | 0.0% |
| Dutch | 372 | 0.2% |
| Eastern European | 136 | 0.1% |
| Ecuadorian | 76 | 0.1% |
| Egyptian | 7 | 0.0% |
| English | 3,542 | 2.2% |
| European | 557 | 0.3% |
| Finnish | 31 | 0.0% |
| French | 539 | 0.3% |
| French Canadian | 113 | 0.1% |
| German | 3,669 | 2.2% |
| Greek | 35 | 0.0% |
| Guamanian / Chamorro | 92 | 0.1% |
| Guatemalan | 473 | 0.3% |
| Haitian | 118 | 0.1% |
| Honduran | 358 | 0.2% |
| Hungarian | 78 | 0.1% |
| Icelander | 6 | 0.0% |
| Indian (Asian) | 1,487 | 0.9% |
| Indonesian | 90 | 0.1% |
| Inupiat | 26 | 0.0% |
| Iranian | 93 | 0.1% |
| Irish | 2,778 | 1.7% |
| Italian | 2,822 | 1.7% |
| Kiowa | 20 | 0.0% |
| Korean | 6,935 | 4.3% |
| Lithuanian | 11 | 0.0% |
| Luxembourger | 13 | 0.0% |
| Malaysian | 34 | 0.0% |
| Mexican | 120,904 | 74.3% |
| Mexican American Indian | 1,092 | 0.7% |
| Moroccan | 8 | 0.0% |
| Native Hawaiian | 133 | 0.1% |
| Navajo | 14 | 0.0% |
| Nicaraguan | 201 | 0.1% |
| Nigerian | 7 | 0.0% |
| Northern European | 51 | 0.0% |
| Norwegian | 515 | 0.3% |
| Osage | 4 | 0.0% |
| Paiute | 74 | 0.1% |
| Pakistani | 134 | 0.1% |
| Panamanian | 49 | 0.0% |
| Peruvian | 78 | 0.1% |
| Polish | 694 | 0.4% |
| Portuguese | 1,220 | 0.7% |
| Potawatomi | 34 | 0.0% |
| Puerto Rican | 1,132 | 0.7% |
| Romanian | 41 | 0.0% |
| Russian | 446 | 0.3% |
| Salvadoran | 3,983 | 2.5% |
| Samoan | 118 | 0.1% |
| Scandinavian | 128 | 0.1% |
| Scotch-Irish | 206 | 0.1% |
| Scottish | 527 | 0.3% |
| Shoshone | 3 | 0.0% |
| Sioux | 9 | 0.0% |
| Slovak | 29 | 0.0% |
| Slovene | 8 | 0.0% |
| Somali | 11 | 0.0% |
| South African | 12 | 0.0% |
| South American | 1,216 | 0.7% |
| Spaniard | 540 | 0.3% |
| Spanish | 353 | 0.2% |
| Sri Lankan | 526 | 0.3% |
| Subsaharan African | 185 | 0.1% |
| Swedish | 475 | 0.3% |
| Swiss | 430 | 0.3% |
| Syrian | 28 | 0.0% |
| Thai | 467 | 0.3% |
| Tohono O'Odham | 10 | 0.0% |
| Uruguayan | 156 | 0.1% |
| Ute | 50 | 0.0% |
| Welsh | 98 | 0.1% |
| Yaqui | 171 | 0.1% |
| Yugoslavian | 33 | 0.0% | View All 109 Rows |
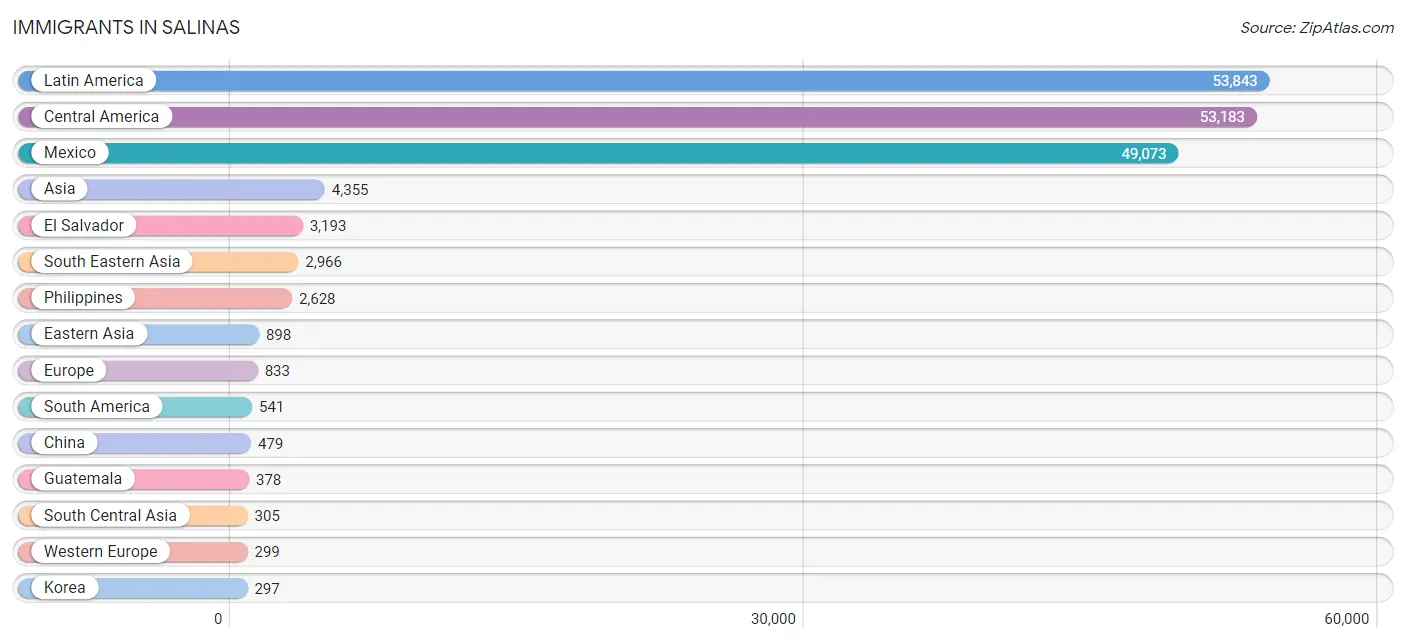
Immigrants in Salinas
The most numerous immigrant groups reported in Salinas came from Latin America (53,843 | 33.1%), Central America (53,183 | 32.7%), Mexico (49,073 | 30.1%), Asia (4,355 | 2.7%), and El Salvador (3,193 | 2.0%), together accounting for 100.5% of all Salinas residents.
| Immigration Origin | # Population | % Population |
| Africa | 186 | 0.1% |
| Argentina | 140 | 0.1% |
| Asia | 4,355 | 2.7% |
| Australia | 38 | 0.0% |
| Bangladesh | 13 | 0.0% |
| Belize | 22 | 0.0% |
| Brazil | 138 | 0.1% |
| Bulgaria | 8 | 0.0% |
| Canada | 87 | 0.1% |
| Caribbean | 119 | 0.1% |
| Central America | 53,183 | 32.7% |
| China | 479 | 0.3% |
| Colombia | 76 | 0.1% |
| Cuba | 61 | 0.0% |
| Dominica | 8 | 0.0% |
| Dominican Republic | 27 | 0.0% |
| Eastern Africa | 33 | 0.0% |
| Eastern Asia | 898 | 0.5% |
| Eastern Europe | 250 | 0.2% |
| Ecuador | 76 | 0.1% |
| Egypt | 7 | 0.0% |
| El Salvador | 3,193 | 2.0% |
| England | 45 | 0.0% |
| Ethiopia | 11 | 0.0% |
| Europe | 833 | 0.5% |
| Fiji | 10 | 0.0% |
| France | 70 | 0.0% |
| Germany | 176 | 0.1% |
| Greece | 8 | 0.0% |
| Guatemala | 378 | 0.2% |
| Honduras | 272 | 0.2% |
| India | 183 | 0.1% |
| Indonesia | 12 | 0.0% |
| Iran | 99 | 0.1% |
| Iraq | 11 | 0.0% |
| Ireland | 15 | 0.0% |
| Israel | 11 | 0.0% |
| Italy | 18 | 0.0% |
| Jamaica | 23 | 0.0% |
| Japan | 96 | 0.1% |
| Korea | 297 | 0.2% |
| Latin America | 53,843 | 33.1% |
| Mexico | 49,073 | 30.1% |
| Moldova | 9 | 0.0% |
| Morocco | 8 | 0.0% |
| Netherlands | 53 | 0.0% |
| Nicaragua | 222 | 0.1% |
| Nigeria | 25 | 0.0% |
| Northern Africa | 59 | 0.0% |
| Northern Europe | 119 | 0.1% |
| Norway | 7 | 0.0% |
| Oceania | 48 | 0.0% |
| Pakistan | 10 | 0.0% |
| Panama | 23 | 0.0% |
| Peru | 111 | 0.1% |
| Philippines | 2,628 | 1.6% |
| Poland | 23 | 0.0% |
| Portugal | 84 | 0.1% |
| Romania | 41 | 0.0% |
| Russia | 62 | 0.0% |
| Scotland | 18 | 0.0% |
| Singapore | 9 | 0.0% |
| South America | 541 | 0.3% |
| South Central Asia | 305 | 0.2% |
| South Eastern Asia | 2,966 | 1.8% |
| Southern Europe | 165 | 0.1% |
| Spain | 55 | 0.0% |
| Syria | 19 | 0.0% |
| Taiwan | 16 | 0.0% |
| Thailand | 87 | 0.1% |
| Uganda | 10 | 0.0% |
| Vietnam | 221 | 0.1% |
| Western Africa | 49 | 0.0% |
| Western Asia | 177 | 0.1% |
| Western Europe | 299 | 0.2% |
| Yemen | 136 | 0.1% |
| Zimbabwe | 12 | 0.0% | View All 77 Rows |
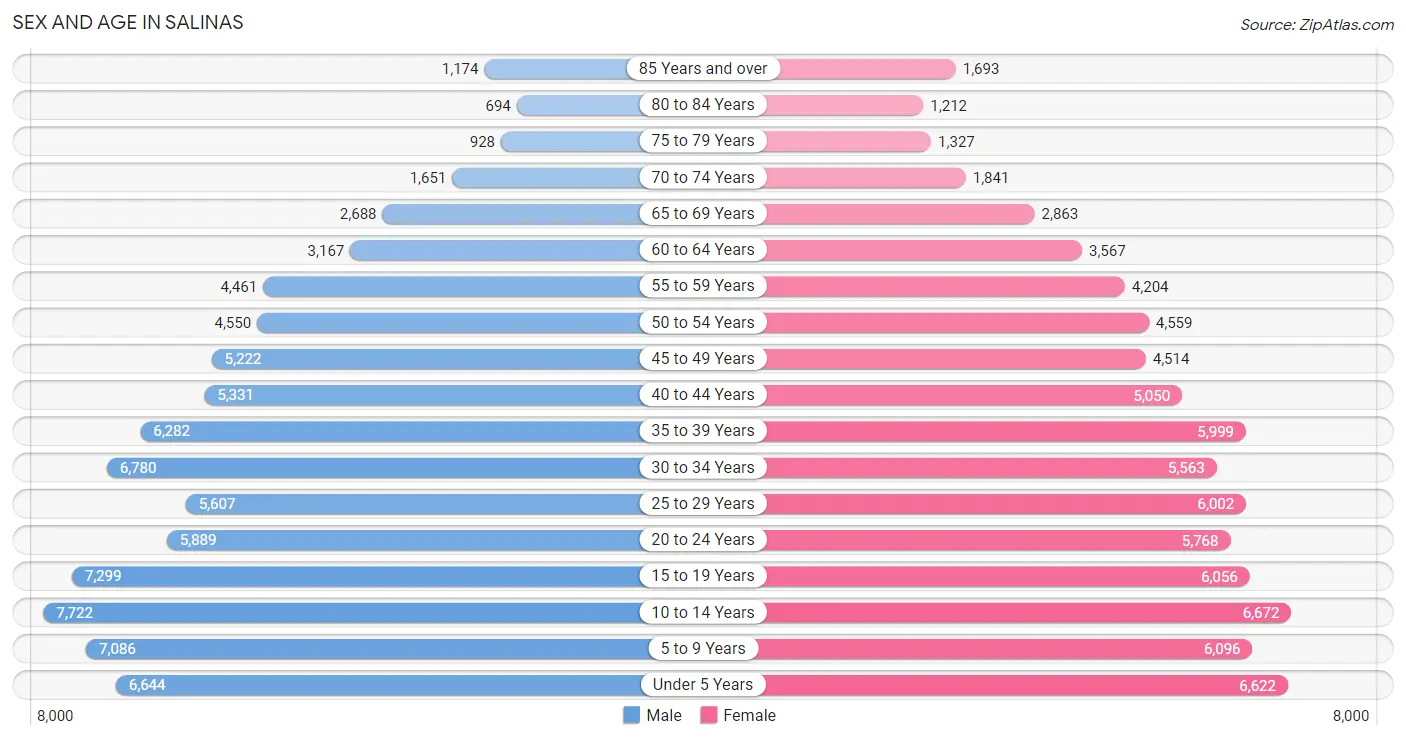
Sex and Age in Salinas
Sex and Age in Salinas
The most populous age groups in Salinas are 10 to 14 Years (7,722 | 9.3%) for men and 10 to 14 Years (6,672 | 8.4%) for women.
| Age Bracket | Male | Female |
| Under 5 Years | 6,644 (8.0%) | 6,622 (8.3%) |
| 5 to 9 Years | 7,086 (8.5%) | 6,096 (7.7%) |
| 10 to 14 Years | 7,722 (9.3%) | 6,672 (8.4%) |
| 15 to 19 Years | 7,299 (8.8%) | 6,056 (7.6%) |
| 20 to 24 Years | 5,889 (7.1%) | 5,768 (7.2%) |
| 25 to 29 Years | 5,607 (6.7%) | 6,002 (7.5%) |
| 30 to 34 Years | 6,780 (8.2%) | 5,563 (7.0%) |
| 35 to 39 Years | 6,282 (7.5%) | 5,999 (7.5%) |
| 40 to 44 Years | 5,331 (6.4%) | 5,050 (6.3%) |
| 45 to 49 Years | 5,222 (6.3%) | 4,514 (5.7%) |
| 50 to 54 Years | 4,550 (5.5%) | 4,559 (5.7%) |
| 55 to 59 Years | 4,461 (5.4%) | 4,204 (5.3%) |
| 60 to 64 Years | 3,167 (3.8%) | 3,567 (4.5%) |
| 65 to 69 Years | 2,688 (3.2%) | 2,863 (3.6%) |
| 70 to 74 Years | 1,651 (2.0%) | 1,841 (2.3%) |
| 75 to 79 Years | 928 (1.1%) | 1,327 (1.7%) |
| 80 to 84 Years | 694 (0.8%) | 1,212 (1.5%) |
| 85 Years and over | 1,174 (1.4%) | 1,693 (2.1%) |
| Total | 83,175 (100.0%) | 79,608 (100.0%) |
Families and Households in Salinas
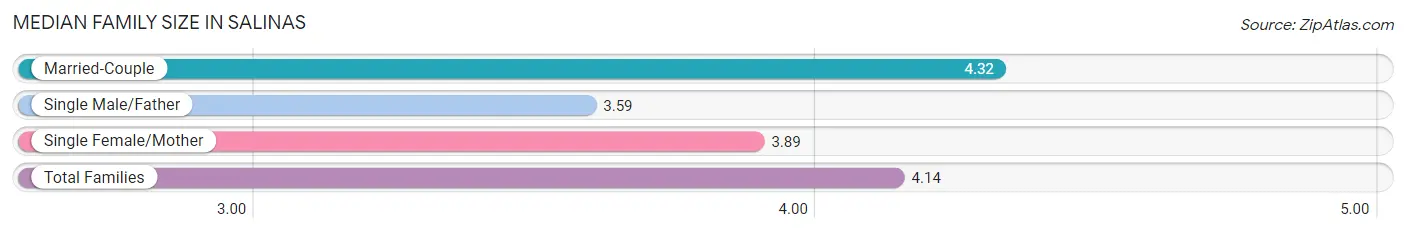
Median Family Size in Salinas
The median family size in Salinas is 4.14 persons per family, with married-couple families (22,129 | 65.0%) accounting for the largest median family size of 4.32 persons per family. On the other hand, single male/father families (3,993 | 11.7%) represent the smallest median family size with 3.59 persons per family.
| Family Type | # Families | Family Size |
| Married-Couple | 22,129 (65.0%) | 4.32 |
| Single Male/Father | 3,993 (11.7%) | 3.59 |
| Single Female/Mother | 7,916 (23.3%) | 3.89 |
| Total Families | 34,038 (100.0%) | 4.14 |
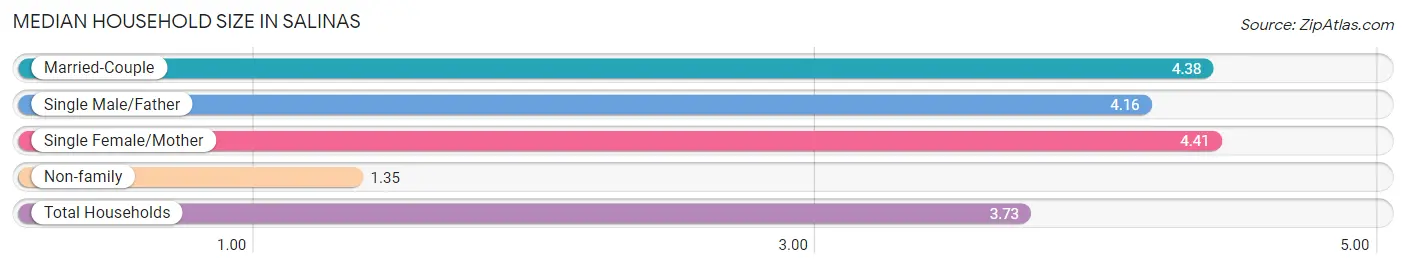
Median Household Size in Salinas
The median household size in Salinas is 3.73 persons per household, with single female/mother households (7,916 | 18.4%) accounting for the largest median household size of 4.41 persons per household. non-family households (9,035 | 21.0%) represent the smallest median household size with 1.35 persons per household.
| Household Type | # Households | Household Size |
| Married-Couple | 22,129 (51.4%) | 4.38 |
| Single Male/Father | 3,993 (9.3%) | 4.16 |
| Single Female/Mother | 7,916 (18.4%) | 4.41 |
| Non-family | 9,035 (21.0%) | 1.35 |
| Total Households | 43,073 (100.0%) | 3.73 |
Household Size by Marriage Status in Salinas
Out of a total of 43,073 households in Salinas, 34,038 (79.0%) are family households, while 9,035 (21.0%) are nonfamily households. The most numerous type of family households are 4-person households, comprising 8,204, and the most common type of nonfamily households are 1-person households, comprising 6,903.
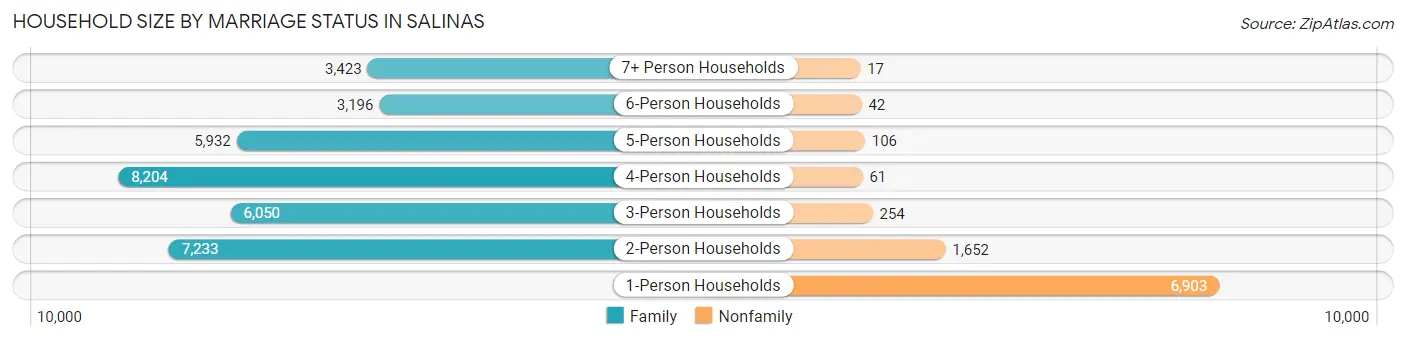
| Household Size | Family Households | Nonfamily Households |
| 1-Person Households | - | 6,903 (16.0%) |
| 2-Person Households | 7,233 (16.8%) | 1,652 (3.8%) |
| 3-Person Households | 6,050 (14.1%) | 254 (0.6%) |
| 4-Person Households | 8,204 (19.1%) | 61 (0.1%) |
| 5-Person Households | 5,932 (13.8%) | 106 (0.3%) |
| 6-Person Households | 3,196 (7.4%) | 42 (0.1%) |
| 7+ Person Households | 3,423 (8.0%) | 17 (0.0%) |
| Total | 34,038 (79.0%) | 9,035 (21.0%) |
Female Fertility in Salinas
Fertility by Age in Salinas
Average fertility rate in Salinas is 44.0 births per 1,000 women. Women in the age bracket of 20 to 34 years have the highest fertility rate with 65.0 births per 1,000 women. Women in the age bracket of 20 to 34 years acount for 65.0% of all women with births.
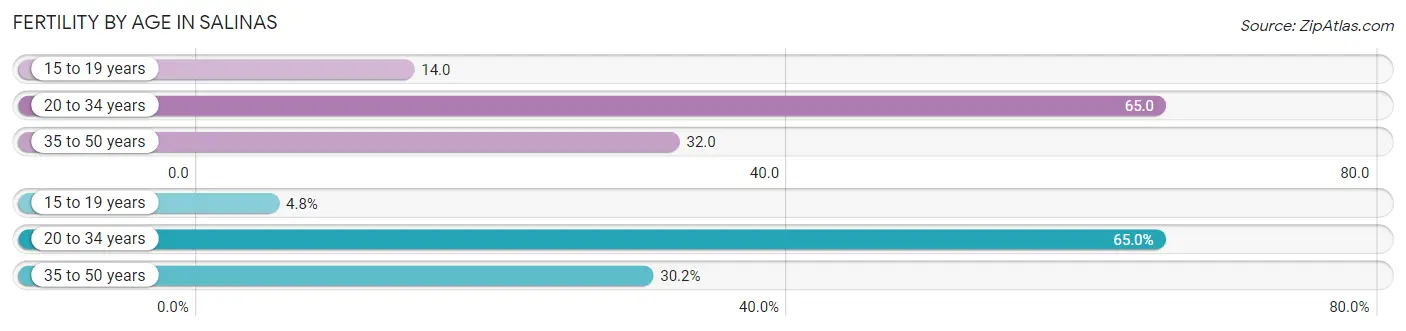
| Age Bracket | Women with Births | Births / 1,000 Women |
| 15 to 19 years | 84 (4.8%) | 14.0 |
| 20 to 34 years | 1,133 (65.0%) | 65.0 |
| 35 to 50 years | 527 (30.2%) | 32.0 |
| Total | 1,744 (100.0%) | 44.0 |
Fertility by Age by Marriage Status in Salinas
57.9% of women with births (1,744) in Salinas are married. The highest percentage of unmarried women with births falls into 15 to 19 years age bracket with 100.0% of them unmarried at the time of birth, while the lowest percentage of unmarried women with births belong to 35 to 50 years age bracket with 28.1% of them unmarried.
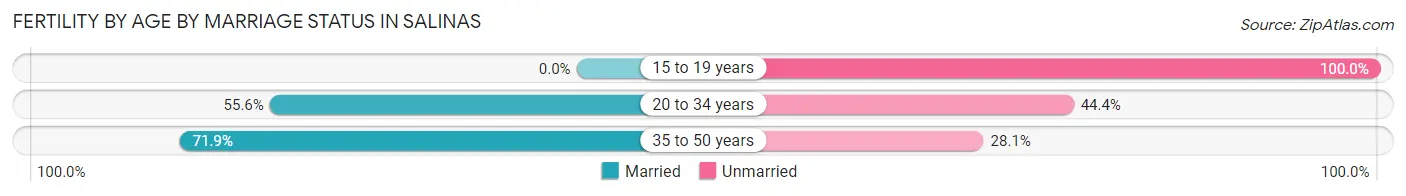
| Age Bracket | Married | Unmarried |
| 15 to 19 years | 0 (0.0%) | 84 (100.0%) |
| 20 to 34 years | 630 (55.6%) | 503 (44.4%) |
| 35 to 50 years | 379 (71.9%) | 148 (28.1%) |
| Total | 1,010 (57.9%) | 734 (42.1%) |
Fertility by Education in Salinas
Average fertility rate in Salinas is 44.0 births per 1,000 women. Women with the education attainment of graduate degree have the highest fertility rate of 57.0 births per 1,000 women, while women with the education attainment of bachelor's degree have the lowest fertility at 41.0 births per 1,000 women. Women with the education attainment of less than high school represent 32.4% of all women with births.
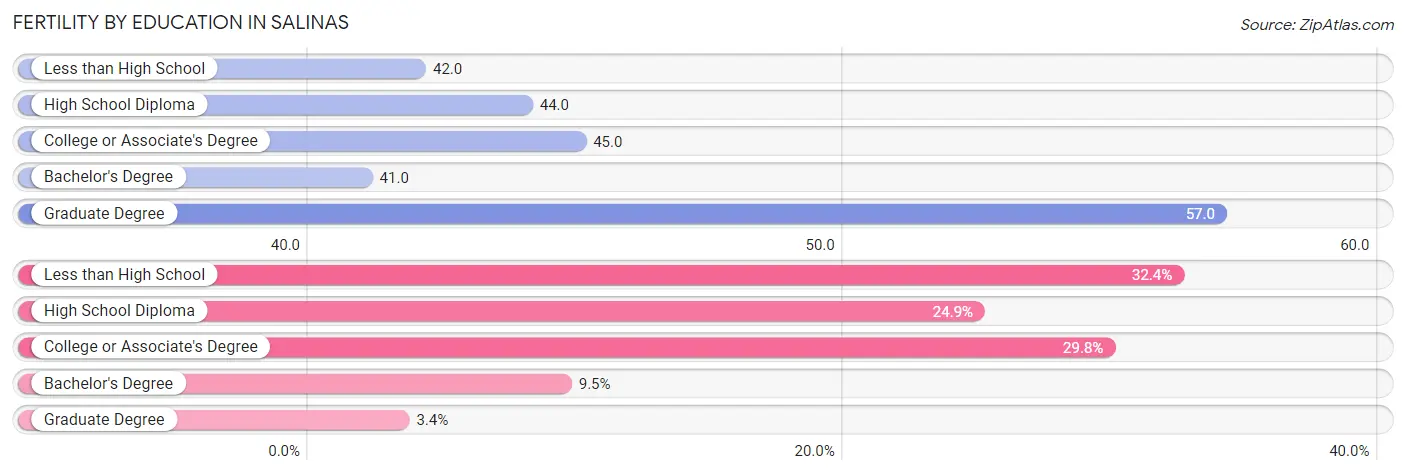
| Educational Attainment | Women with Births | Births / 1,000 Women |
| Less than High School | 565 (32.4%) | 42.0 |
| High School Diploma | 435 (24.9%) | 44.0 |
| College or Associate's Degree | 520 (29.8%) | 45.0 |
| Bachelor's Degree | 165 (9.5%) | 41.0 |
| Graduate Degree | 59 (3.4%) | 57.0 |
| Total | 1,744 (100.0%) | 44.0 |
Fertility by Education by Marriage Status in Salinas
42.1% of women with births in Salinas are unmarried. Women with the educational attainment of college or associate's degree are most likely to be married with 64.4% of them married at childbirth, while women with the educational attainment of high school diploma are least likely to be married with 51.3% of them unmarried at childbirth.
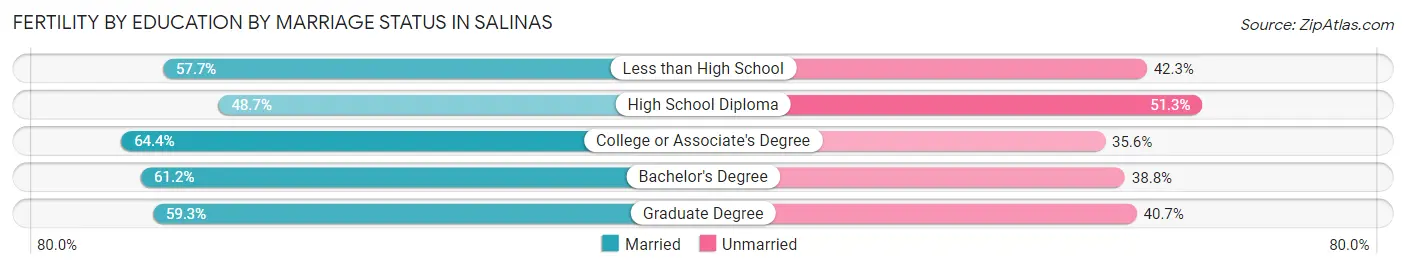
| Educational Attainment | Married | Unmarried |
| Less than High School | 326 (57.7%) | 239 (42.3%) |
| High School Diploma | 212 (48.7%) | 223 (51.3%) |
| College or Associate's Degree | 335 (64.4%) | 185 (35.6%) |
| Bachelor's Degree | 101 (61.2%) | 64 (38.8%) |
| Graduate Degree | 35 (59.3%) | 24 (40.7%) |
| Total | 1,010 (57.9%) | 734 (42.1%) |
Employment Characteristics in Salinas
Employment by Class of Employer in Salinas
Among the 68,787 employed individuals in Salinas, private company employees (51,317 | 74.6%), local government employees (5,276 | 7.7%), and self-employed (not incorporated) (3,643 | 5.3%) make up the most common classes of employment.
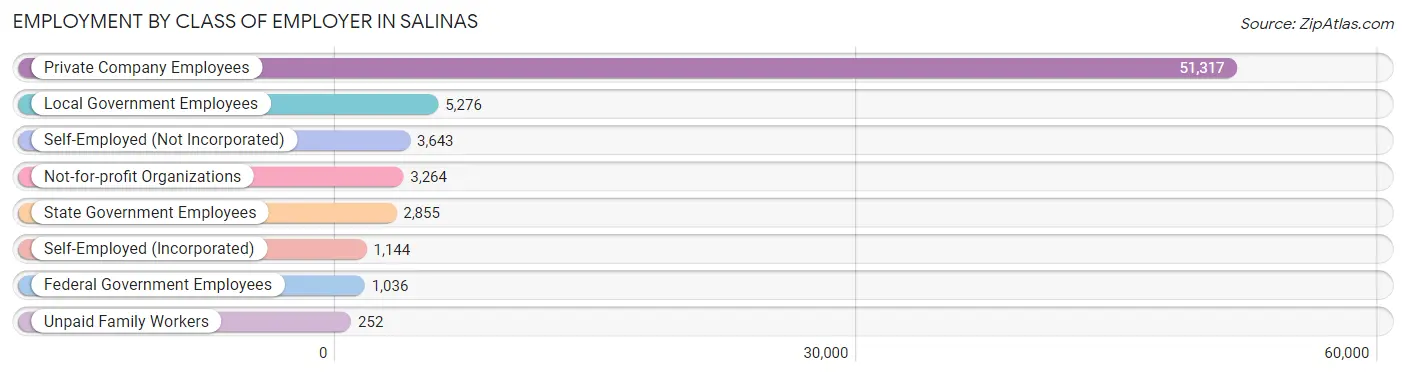
| Employer Class | # Employees | % Employees |
| Private Company Employees | 51,317 | 74.6% |
| Self-Employed (Incorporated) | 1,144 | 1.7% |
| Self-Employed (Not Incorporated) | 3,643 | 5.3% |
| Not-for-profit Organizations | 3,264 | 4.8% |
| Local Government Employees | 5,276 | 7.7% |
| State Government Employees | 2,855 | 4.2% |
| Federal Government Employees | 1,036 | 1.5% |
| Unpaid Family Workers | 252 | 0.4% |
| Total | 68,787 | 100.0% |
Employment Status by Age in Salinas
According to the labor force statistics for Salinas, out of the total population over 16 years of age (119,251), 62.2% or 74,174 individuals are in the labor force, with 5.0% or 3,709 of them unemployed. The age group with the highest labor force participation rate is 25 to 29 years, with 77.7% or 9,020 individuals in the labor force. Within the labor force, the 16 to 19 years age range has the highest percentage of unemployed individuals, with 7.0% or 202 of them being unemployed.
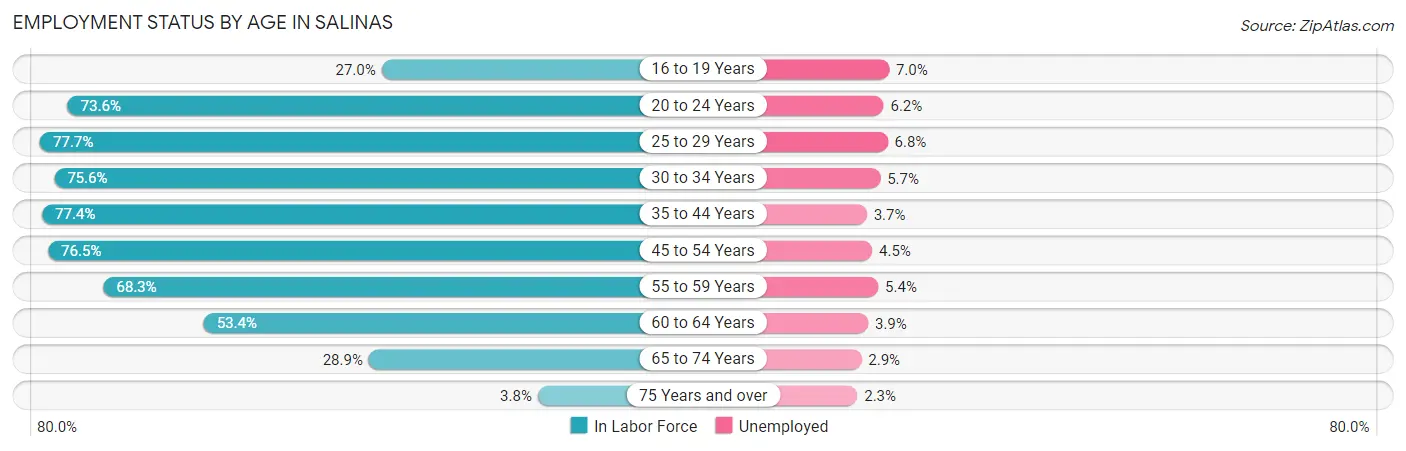
| Age Bracket | In Labor Force | Unemployed |
| 16 to 19 Years | 2,880 (27.0%) | 202 (7.0%) |
| 20 to 24 Years | 8,580 (73.6%) | 532 (6.2%) |
| 25 to 29 Years | 9,020 (77.7%) | 613 (6.8%) |
| 30 to 34 Years | 9,331 (75.6%) | 532 (5.7%) |
| 35 to 44 Years | 17,540 (77.4%) | 649 (3.7%) |
| 45 to 54 Years | 14,416 (76.5%) | 649 (4.5%) |
| 55 to 59 Years | 5,918 (68.3%) | 320 (5.4%) |
| 60 to 64 Years | 3,596 (53.4%) | 140 (3.9%) |
| 65 to 74 Years | 2,613 (28.9%) | 76 (2.9%) |
| 75 Years and over | 267 (3.8%) | 6 (2.3%) |
| Total | 74,174 (62.2%) | 3,709 (5.0%) |
Employment Status by Educational Attainment in Salinas
According to labor force statistics for Salinas, 74.0% of individuals (59,835) out of the total population between 25 and 64 years of age (80,858) are in the labor force, with 4.8% or 2,872 of them being unemployed. The group with the highest labor force participation rate are those with the educational attainment of bachelor's degree or higher, with 85.3% or 9,993 individuals in the labor force. Within the labor force, individuals with less than high school education have the highest percentage of unemployment, with 5.7% or 1,145 of them being unemployed.
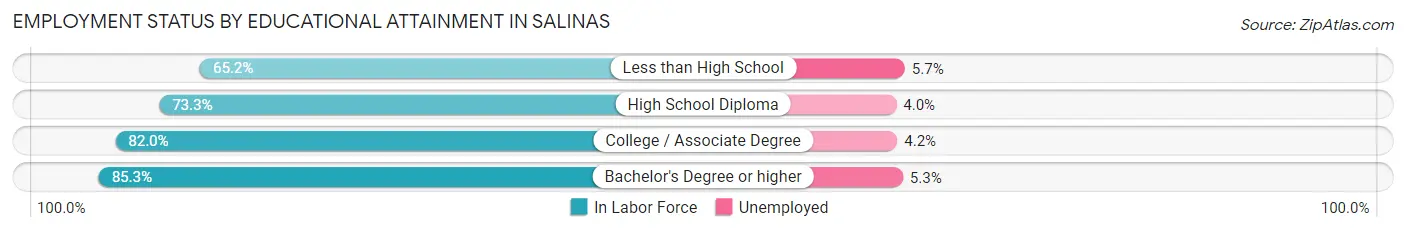
| Educational Attainment | In Labor Force | Unemployed |
| Less than High School | 20,081 (65.2%) | 1,756 (5.7%) |
| High School Diploma | 14,071 (73.3%) | 768 (4.0%) |
| College / Associate Degree | 15,701 (82.0%) | 804 (4.2%) |
| Bachelor's Degree or higher | 9,993 (85.3%) | 621 (5.3%) |
| Total | 59,835 (74.0%) | 3,881 (4.8%) |
Employment Occupations by Sex in Salinas
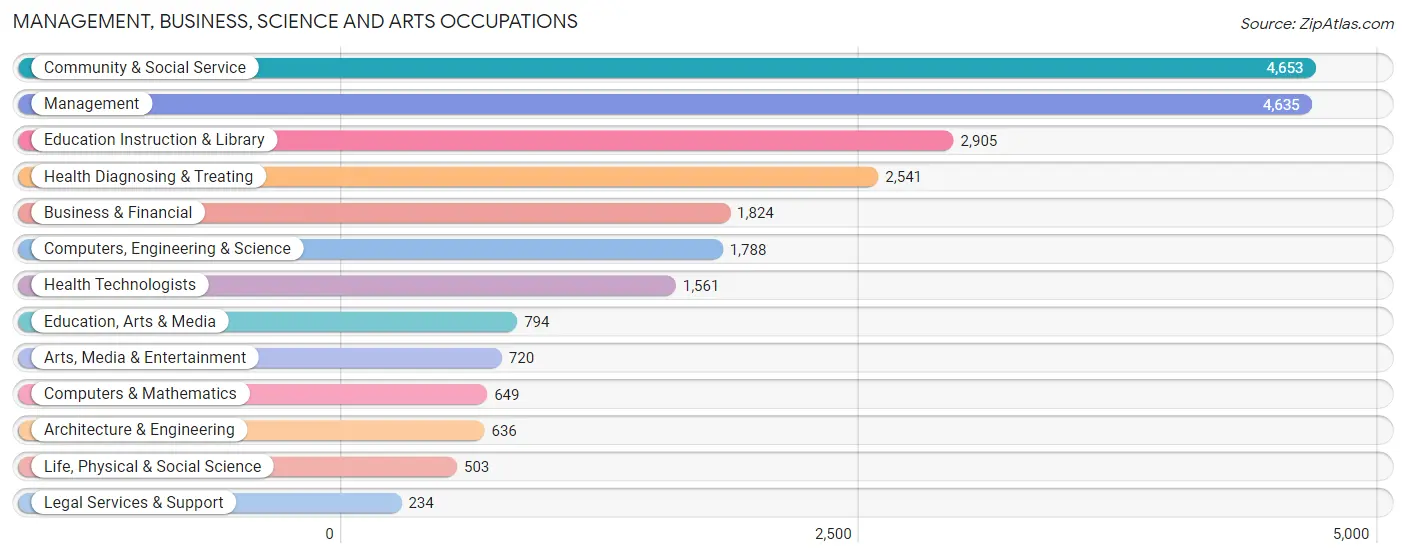
Management, Business, Science and Arts Occupations
The most common Management, Business, Science and Arts occupations in Salinas are Community & Social Service (4,653 | 6.6%), Management (4,635 | 6.6%), Education Instruction & Library (2,905 | 4.1%), Health Diagnosing & Treating (2,541 | 3.6%), and Business & Financial (1,824 | 2.6%).
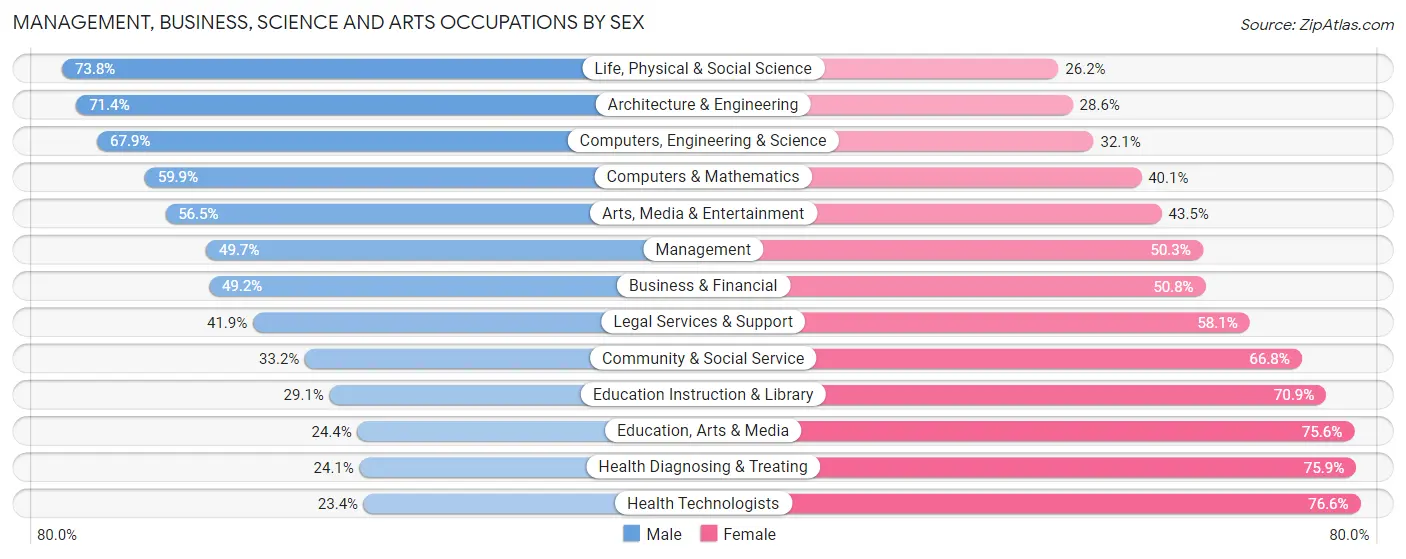
Management, Business, Science and Arts Occupations by Sex
Within the Management, Business, Science and Arts occupations in Salinas, the most male-oriented occupations are Life, Physical & Social Science (73.8%), Architecture & Engineering (71.4%), and Computers, Engineering & Science (67.9%), while the most female-oriented occupations are Health Technologists (76.6%), Health Diagnosing & Treating (75.9%), and Education, Arts & Media (75.6%).
| Occupation | Male | Female |
| Management | 2,304 (49.7%) | 2,331 (50.3%) |
| Business & Financial | 898 (49.2%) | 926 (50.8%) |
| Computers, Engineering & Science | 1,214 (67.9%) | 574 (32.1%) |
| Computers & Mathematics | 389 (59.9%) | 260 (40.1%) |
| Architecture & Engineering | 454 (71.4%) | 182 (28.6%) |
| Life, Physical & Social Science | 371 (73.8%) | 132 (26.2%) |
| Community & Social Service | 1,544 (33.2%) | 3,109 (66.8%) |
| Education, Arts & Media | 194 (24.4%) | 600 (75.6%) |
| Legal Services & Support | 98 (41.9%) | 136 (58.1%) |
| Education Instruction & Library | 845 (29.1%) | 2,060 (70.9%) |
| Arts, Media & Entertainment | 407 (56.5%) | 313 (43.5%) |
| Health Diagnosing & Treating | 612 (24.1%) | 1,929 (75.9%) |
| Health Technologists | 365 (23.4%) | 1,196 (76.6%) |
| Total (Category) | 6,572 (42.6%) | 8,869 (57.4%) |
| Total (Overall) | 39,155 (55.6%) | 31,234 (44.4%) |
Services Occupations
The most common Services occupations in Salinas are Food Preparation & Serving (3,717 | 5.3%), Cleaning & Maintenance (3,499 | 5.0%), Healthcare Support (3,334 | 4.7%), Security & Protection (1,822 | 2.6%), and Personal Care & Service (1,355 | 1.9%).

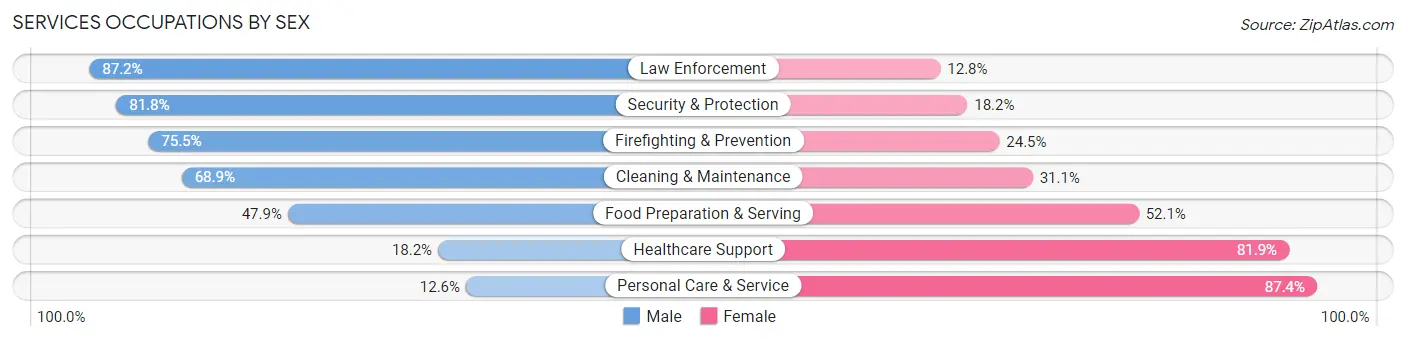
Services Occupations by Sex
Within the Services occupations in Salinas, the most male-oriented occupations are Law Enforcement (87.2%), Security & Protection (81.8%), and Firefighting & Prevention (75.5%), while the most female-oriented occupations are Personal Care & Service (87.4%), Healthcare Support (81.9%), and Food Preparation & Serving (52.1%).
| Occupation | Male | Female |
| Healthcare Support | 605 (18.1%) | 2,729 (81.9%) |
| Security & Protection | 1,491 (81.8%) | 331 (18.2%) |
| Firefighting & Prevention | 628 (75.5%) | 204 (24.5%) |
| Law Enforcement | 863 (87.2%) | 127 (12.8%) |
| Food Preparation & Serving | 1,780 (47.9%) | 1,937 (52.1%) |
| Cleaning & Maintenance | 2,410 (68.9%) | 1,089 (31.1%) |
| Personal Care & Service | 171 (12.6%) | 1,184 (87.4%) |
| Total (Category) | 6,457 (47.0%) | 7,270 (53.0%) |
| Total (Overall) | 39,155 (55.6%) | 31,234 (44.4%) |
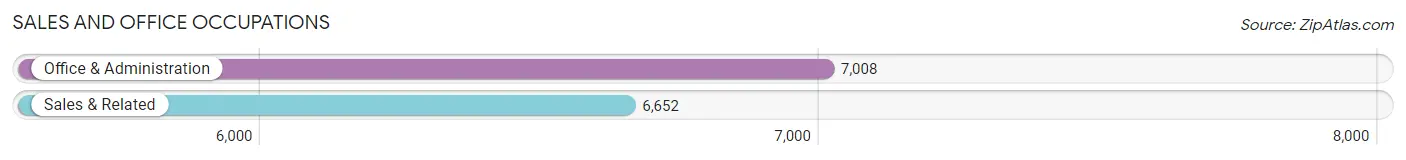
Sales and Office Occupations
The most common Sales and Office occupations in Salinas are Office & Administration (7,008 | 10.0%), and Sales & Related (6,652 | 9.5%).
Sales and Office Occupations by Sex
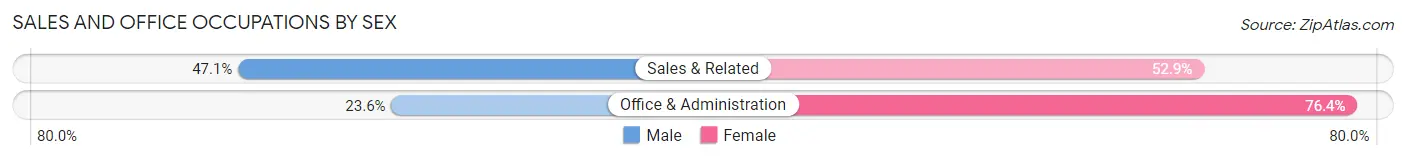
| Occupation | Male | Female |
| Sales & Related | 3,136 (47.1%) | 3,516 (52.9%) |
| Office & Administration | 1,652 (23.6%) | 5,356 (76.4%) |
| Total (Category) | 4,788 (35.0%) | 8,872 (64.9%) |
| Total (Overall) | 39,155 (55.6%) | 31,234 (44.4%) |
Natural Resources, Construction and Maintenance Occupations
The most common Natural Resources, Construction and Maintenance occupations in Salinas are Farming, Fishing & Forestry (9,427 | 13.4%), Construction & Extraction (4,592 | 6.5%), and Installation, Maintenance & Repair (2,258 | 3.2%).

Natural Resources, Construction and Maintenance Occupations by Sex
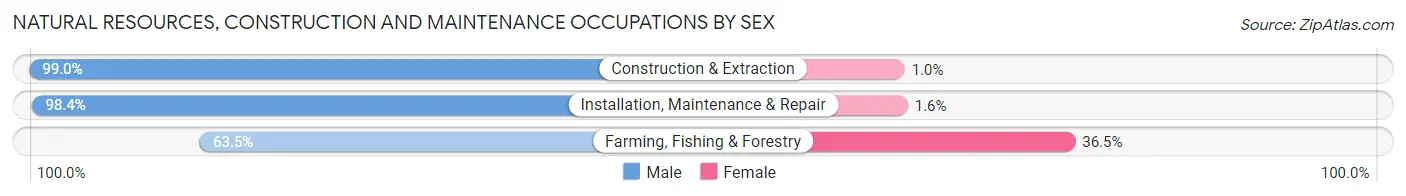
| Occupation | Male | Female |
| Farming, Fishing & Forestry | 5,987 (63.5%) | 3,440 (36.5%) |
| Construction & Extraction | 4,546 (99.0%) | 46 (1.0%) |
| Installation, Maintenance & Repair | 2,221 (98.4%) | 37 (1.6%) |
| Total (Category) | 12,754 (78.4%) | 3,523 (21.6%) |
| Total (Overall) | 39,155 (55.6%) | 31,234 (44.4%) |
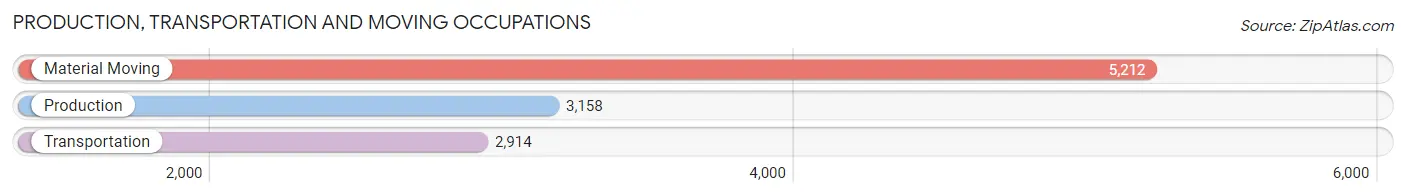
Production, Transportation and Moving Occupations
The most common Production, Transportation and Moving occupations in Salinas are Material Moving (5,212 | 7.4%), Production (3,158 | 4.5%), and Transportation (2,914 | 4.1%).
Production, Transportation and Moving Occupations by Sex
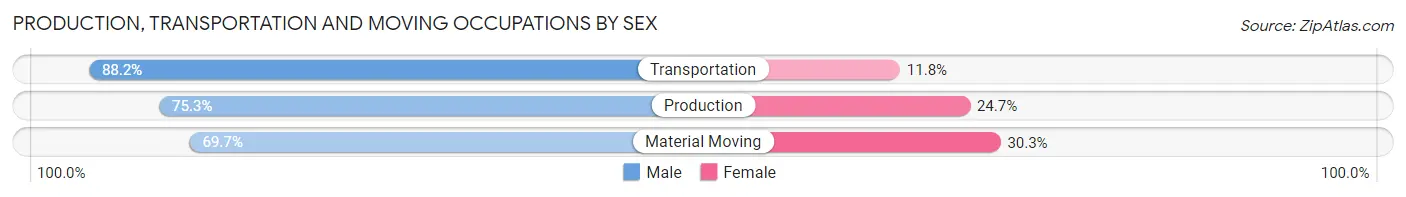
| Occupation | Male | Female |
| Production | 2,379 (75.3%) | 779 (24.7%) |
| Transportation | 2,570 (88.2%) | 344 (11.8%) |
| Material Moving | 3,635 (69.7%) | 1,577 (30.3%) |
| Total (Category) | 8,584 (76.1%) | 2,700 (23.9%) |
| Total (Overall) | 39,155 (55.6%) | 31,234 (44.4%) |
Employment Industries by Sex in Salinas
Employment Industries in Salinas
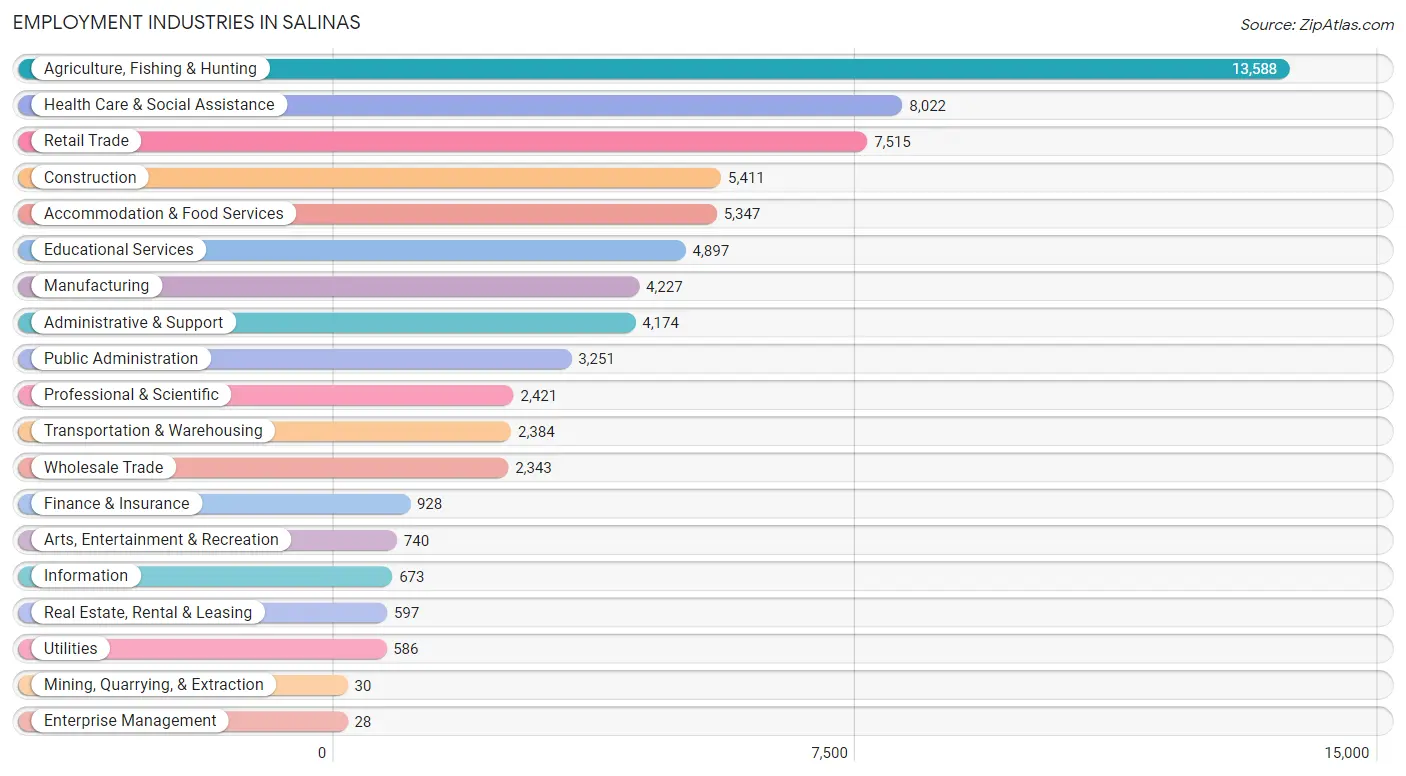
The major employment industries in Salinas include Agriculture, Fishing & Hunting (13,588 | 19.3%), Health Care & Social Assistance (8,022 | 11.4%), Retail Trade (7,515 | 10.7%), Construction (5,411 | 7.7%), and Accommodation & Food Services (5,347 | 7.6%).
Employment Industries by Sex in Salinas
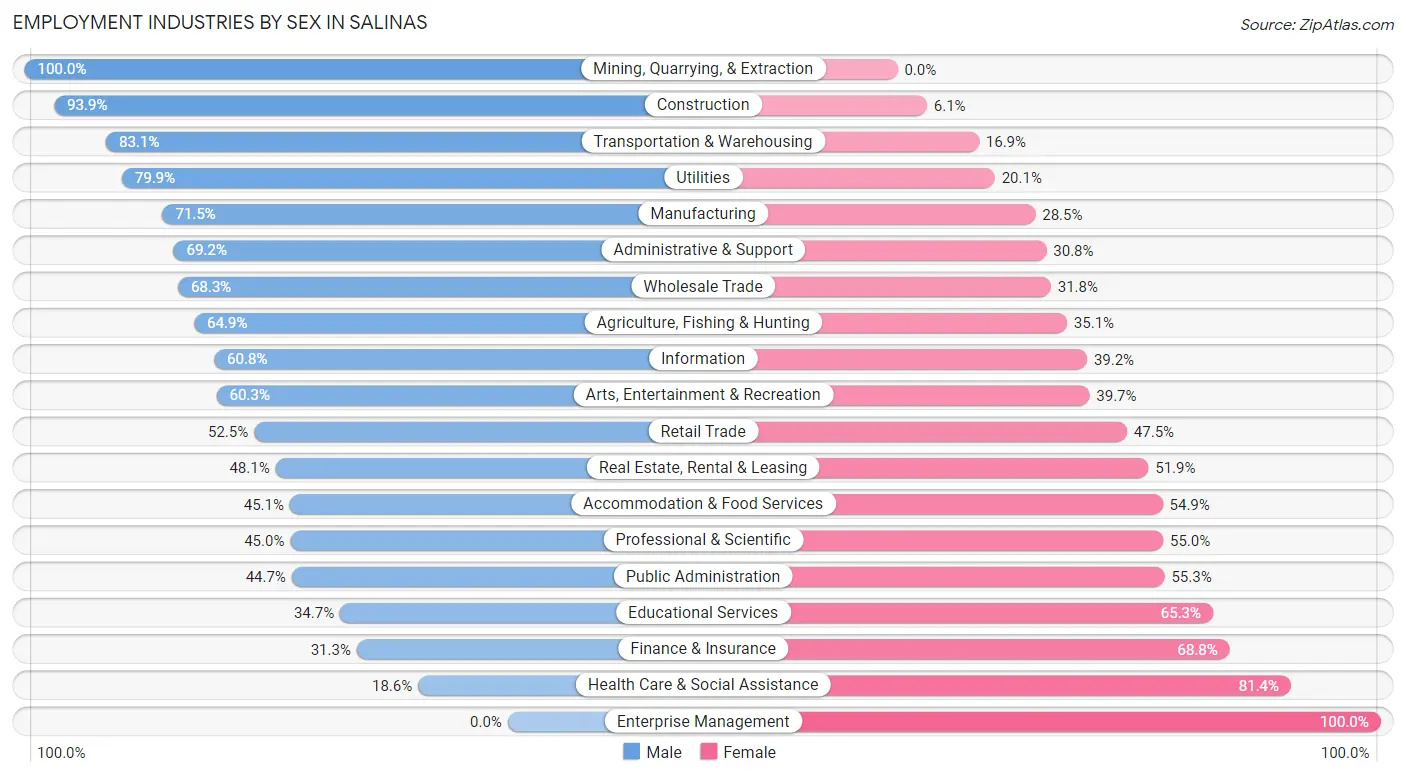
The Salinas industries that see more men than women are Mining, Quarrying, & Extraction (100.0%), Construction (93.9%), and Transportation & Warehousing (83.1%), whereas the industries that tend to have a higher number of women are Enterprise Management (100.0%), Health Care & Social Assistance (81.4%), and Finance & Insurance (68.8%).
| Industry | Male | Female |
| Agriculture, Fishing & Hunting | 8,821 (64.9%) | 4,767 (35.1%) |
| Mining, Quarrying, & Extraction | 30 (100.0%) | 0 (0.0%) |
| Construction | 5,081 (93.9%) | 330 (6.1%) |
| Manufacturing | 3,021 (71.5%) | 1,206 (28.5%) |
| Wholesale Trade | 1,599 (68.2%) | 744 (31.8%) |
| Retail Trade | 3,945 (52.5%) | 3,570 (47.5%) |
| Transportation & Warehousing | 1,982 (83.1%) | 402 (16.9%) |
| Utilities | 468 (79.9%) | 118 (20.1%) |
| Information | 409 (60.8%) | 264 (39.2%) |
| Finance & Insurance | 290 (31.2%) | 638 (68.8%) |
| Real Estate, Rental & Leasing | 287 (48.1%) | 310 (51.9%) |
| Professional & Scientific | 1,090 (45.0%) | 1,331 (55.0%) |
| Enterprise Management | 0 (0.0%) | 28 (100.0%) |
| Administrative & Support | 2,887 (69.2%) | 1,287 (30.8%) |
| Educational Services | 1,700 (34.7%) | 3,197 (65.3%) |
| Health Care & Social Assistance | 1,490 (18.6%) | 6,532 (81.4%) |
| Arts, Entertainment & Recreation | 446 (60.3%) | 294 (39.7%) |
| Accommodation & Food Services | 2,412 (45.1%) | 2,935 (54.9%) |
| Public Administration | 1,454 (44.7%) | 1,797 (55.3%) |
| Total | 39,155 (55.6%) | 31,234 (44.4%) |
Education in Salinas
School Enrollment in Salinas
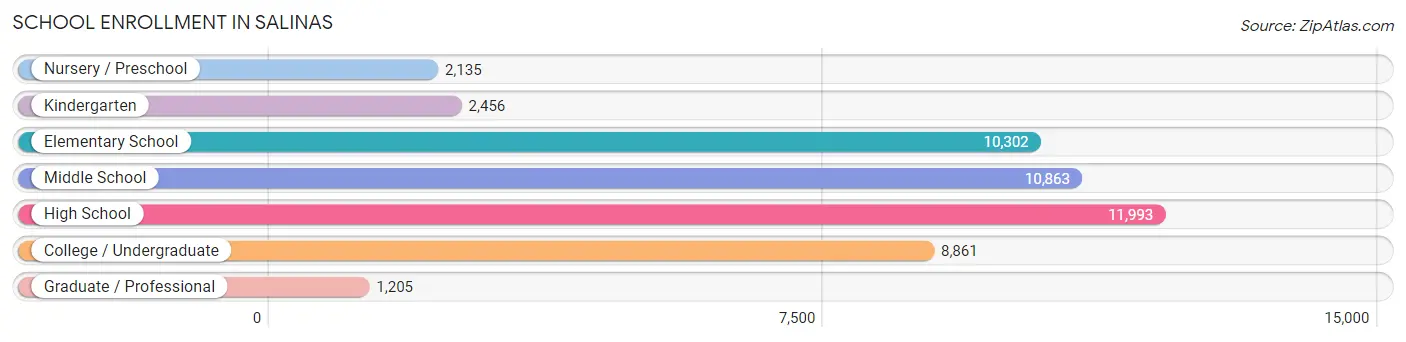
The most common levels of schooling among the 47,815 students in Salinas are high school (11,993 | 25.1%), middle school (10,863 | 22.7%), and elementary school (10,302 | 21.5%).
| School Level | # Students | % Students |
| Nursery / Preschool | 2,135 | 4.5% |
| Kindergarten | 2,456 | 5.1% |
| Elementary School | 10,302 | 21.5% |
| Middle School | 10,863 | 22.7% |
| High School | 11,993 | 25.1% |
| College / Undergraduate | 8,861 | 18.5% |
| Graduate / Professional | 1,205 | 2.5% |
| Total | 47,815 | 100.0% |
School Enrollment by Age by Funding Source in Salinas
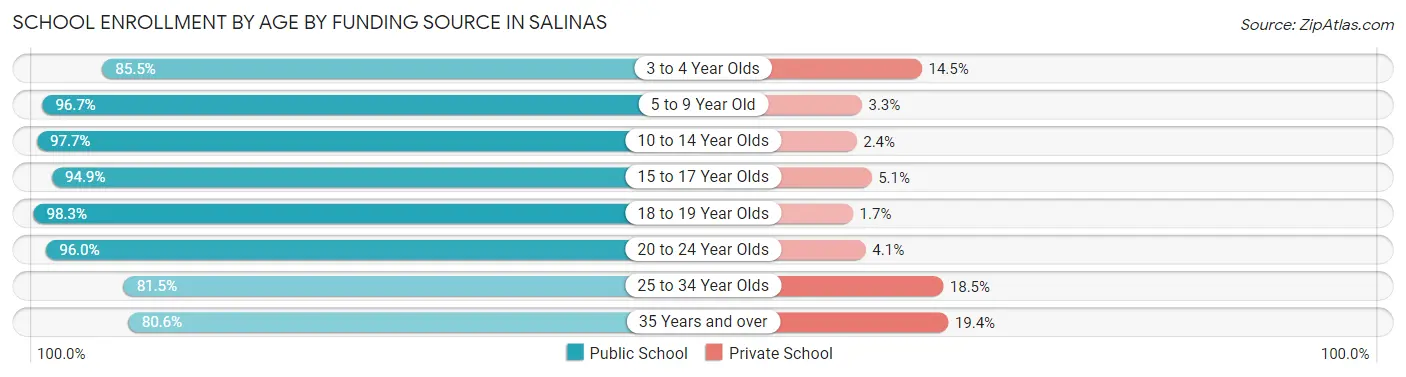
Out of a total of 47,815 students who are enrolled in schools in Salinas, 2,295 (4.8%) attend a private institution, while the remaining 45,520 (95.2%) are enrolled in public schools. The age group of 35 years and over has the highest likelihood of being enrolled in private schools, with 243 (19.4% in the age bracket) enrolled. Conversely, the age group of 18 to 19 year olds has the lowest likelihood of being enrolled in a private school, with 3,762 (98.3% in the age bracket) attending a public institution.
| Age Bracket | Public School | Private School |
| 3 to 4 Year Olds | 1,568 (85.5%) | 266 (14.5%) |
| 5 to 9 Year Old | 11,993 (96.7%) | 413 (3.3%) |
| 10 to 14 Year Olds | 13,957 (97.7%) | 336 (2.4%) |
| 15 to 17 Year Olds | 7,229 (94.9%) | 391 (5.1%) |
| 18 to 19 Year Olds | 3,762 (98.3%) | 64 (1.7%) |
| 20 to 24 Year Olds | 4,168 (96.0%) | 176 (4.1%) |
| 25 to 34 Year Olds | 1,827 (81.5%) | 414 (18.5%) |
| 35 Years and over | 1,008 (80.6%) | 243 (19.4%) |
| Total | 45,520 (95.2%) | 2,295 (4.8%) |
Educational Attainment by Field of Study in Salinas
Business (2,436 | 15.7%), science & technology (1,701 | 11.0%), bio, nature & agricultural (1,463 | 9.5%), social sciences (1,459 | 9.4%), and education (1,392 | 9.0%) are the most common fields of study among 15,477 individuals in Salinas who have obtained a bachelor's degree or higher.
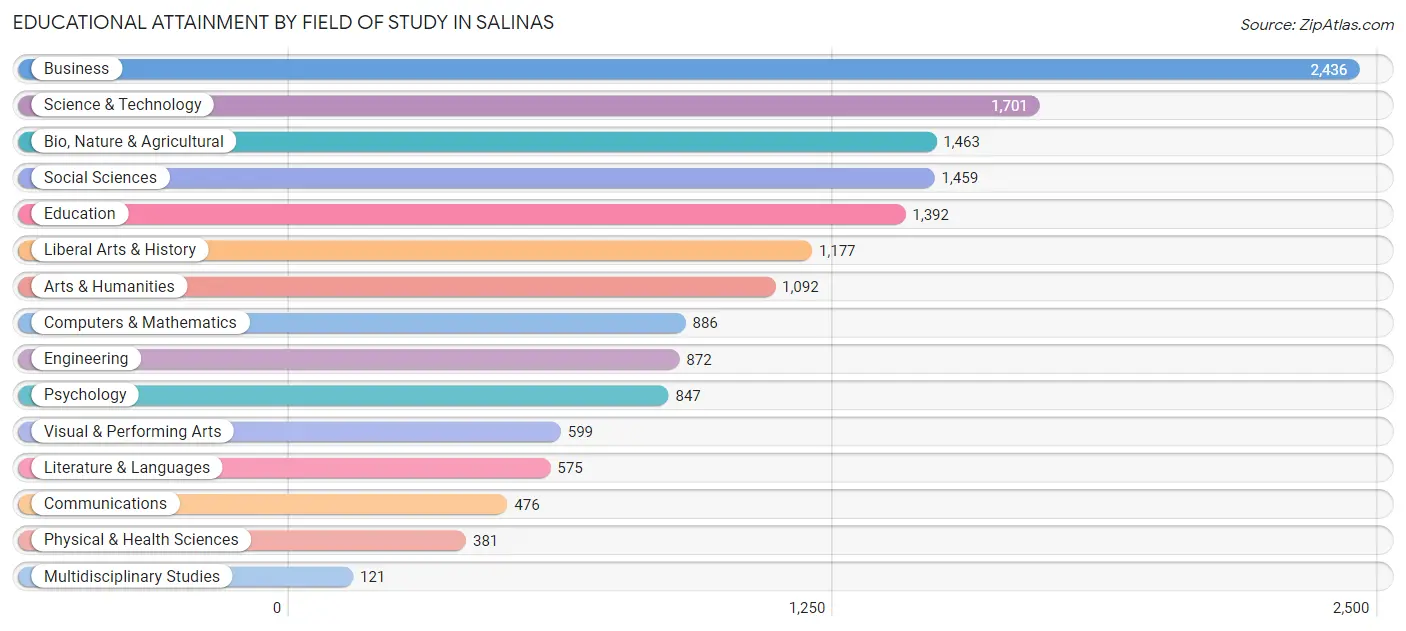
| Field of Study | # Graduates | % Graduates |
| Computers & Mathematics | 886 | 5.7% |
| Bio, Nature & Agricultural | 1,463 | 9.5% |
| Physical & Health Sciences | 381 | 2.5% |
| Psychology | 847 | 5.5% |
| Social Sciences | 1,459 | 9.4% |
| Engineering | 872 | 5.6% |
| Multidisciplinary Studies | 121 | 0.8% |
| Science & Technology | 1,701 | 11.0% |
| Business | 2,436 | 15.7% |
| Education | 1,392 | 9.0% |
| Literature & Languages | 575 | 3.7% |
| Liberal Arts & History | 1,177 | 7.6% |
| Visual & Performing Arts | 599 | 3.9% |
| Communications | 476 | 3.1% |
| Arts & Humanities | 1,092 | 7.1% |
| Total | 15,477 | 100.0% |
Transportation & Commute in Salinas
Vehicle Availability by Sex in Salinas
The most prevalent vehicle ownership categories in Salinas are males with 2 vehicles (13,011, accounting for 33.7%) and females with 2 vehicles (9,593, making up 43.2%).
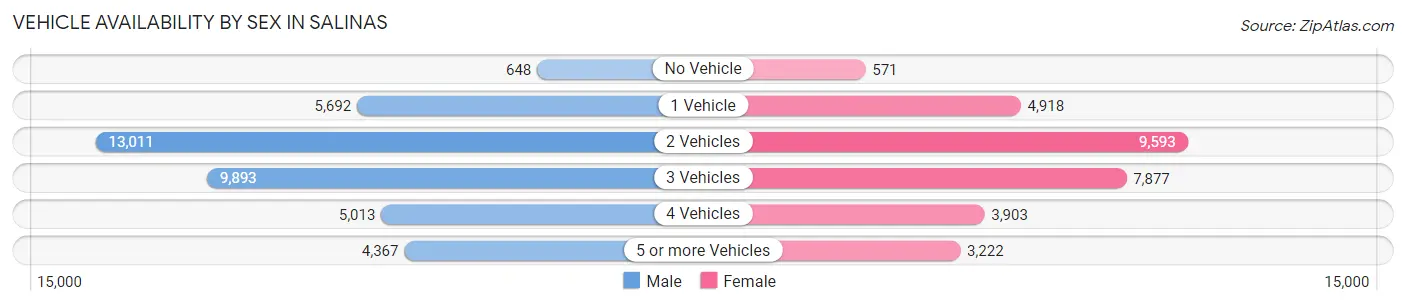
| Vehicles Available | Male | Female |
| No Vehicle | 648 (1.7%) | 571 (1.9%) |
| 1 Vehicle | 5,692 (14.7%) | 4,918 (16.4%) |
| 2 Vehicles | 13,011 (33.7%) | 9,593 (31.9%) |
| 3 Vehicles | 9,893 (25.6%) | 7,877 (26.2%) |
| 4 Vehicles | 5,013 (13.0%) | 3,903 (13.0%) |
| 5 or more Vehicles | 4,367 (11.3%) | 3,222 (10.7%) |
| Total | 38,624 (100.0%) | 30,084 (100.0%) |
Commute Time in Salinas
The most frequently occuring commute durations in Salinas are 20 to 24 minutes (18,275 commuters, 27.6%), 15 to 19 minutes (11,264 commuters, 17.0%), and 10 to 14 minutes (7,053 commuters, 10.6%).
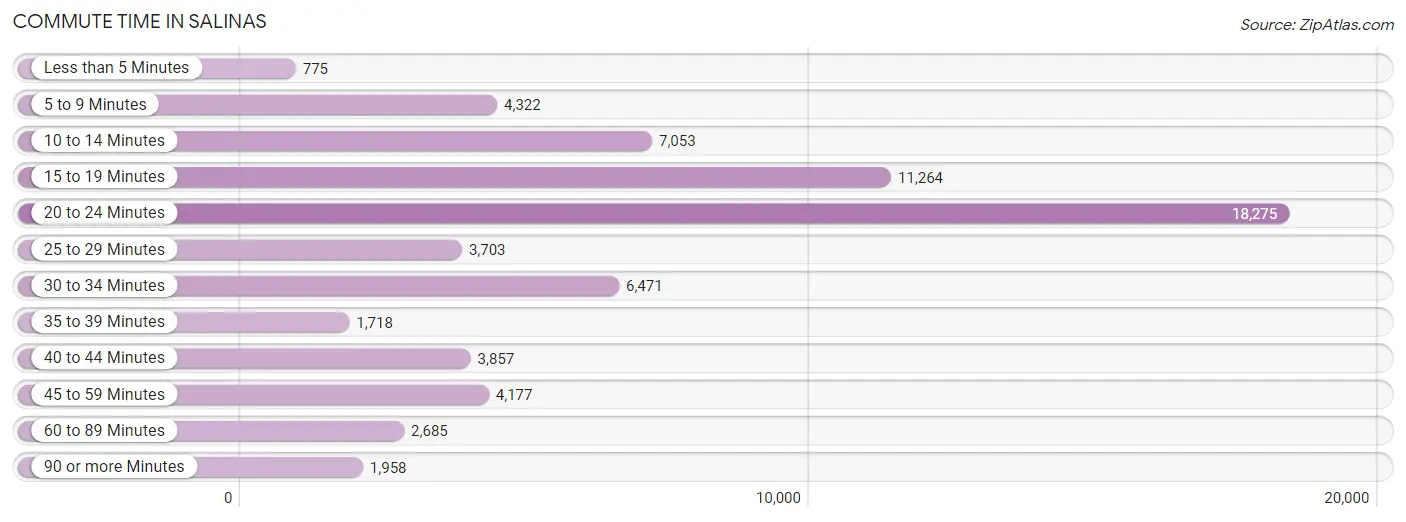
| Commute Time | # Commuters | % Commuters |
| Less than 5 Minutes | 775 | 1.2% |
| 5 to 9 Minutes | 4,322 | 6.5% |
| 10 to 14 Minutes | 7,053 | 10.6% |
| 15 to 19 Minutes | 11,264 | 17.0% |
| 20 to 24 Minutes | 18,275 | 27.6% |
| 25 to 29 Minutes | 3,703 | 5.6% |
| 30 to 34 Minutes | 6,471 | 9.8% |
| 35 to 39 Minutes | 1,718 | 2.6% |
| 40 to 44 Minutes | 3,857 | 5.8% |
| 45 to 59 Minutes | 4,177 | 6.3% |
| 60 to 89 Minutes | 2,685 | 4.1% |
| 90 or more Minutes | 1,958 | 3.0% |
Commute Time by Sex in Salinas
The most common commute times in Salinas are 20 to 24 minutes (10,682 commuters, 28.4%) for males and 20 to 24 minutes (7,593 commuters, 26.5%) for females.
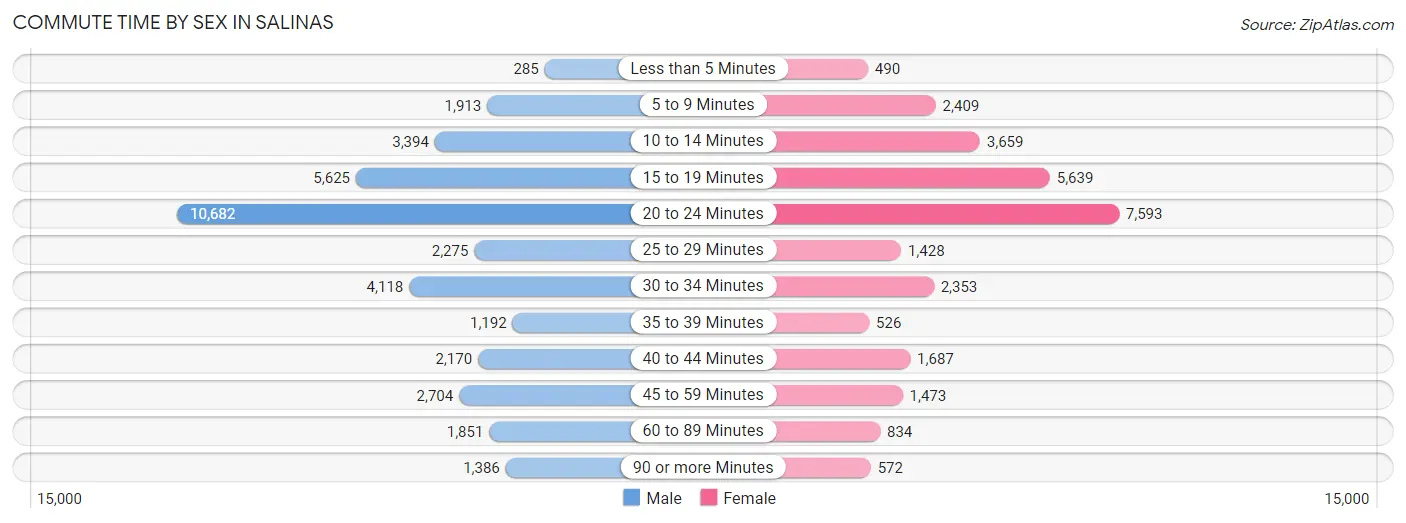
| Commute Time | Male | Female |
| Less than 5 Minutes | 285 (0.8%) | 490 (1.7%) |
| 5 to 9 Minutes | 1,913 (5.1%) | 2,409 (8.4%) |
| 10 to 14 Minutes | 3,394 (9.0%) | 3,659 (12.8%) |
| 15 to 19 Minutes | 5,625 (15.0%) | 5,639 (19.7%) |
| 20 to 24 Minutes | 10,682 (28.4%) | 7,593 (26.5%) |
| 25 to 29 Minutes | 2,275 (6.0%) | 1,428 (5.0%) |
| 30 to 34 Minutes | 4,118 (11.0%) | 2,353 (8.2%) |
| 35 to 39 Minutes | 1,192 (3.2%) | 526 (1.8%) |
| 40 to 44 Minutes | 2,170 (5.8%) | 1,687 (5.9%) |
| 45 to 59 Minutes | 2,704 (7.2%) | 1,473 (5.1%) |
| 60 to 89 Minutes | 1,851 (4.9%) | 834 (2.9%) |
| 90 or more Minutes | 1,386 (3.7%) | 572 (2.0%) |
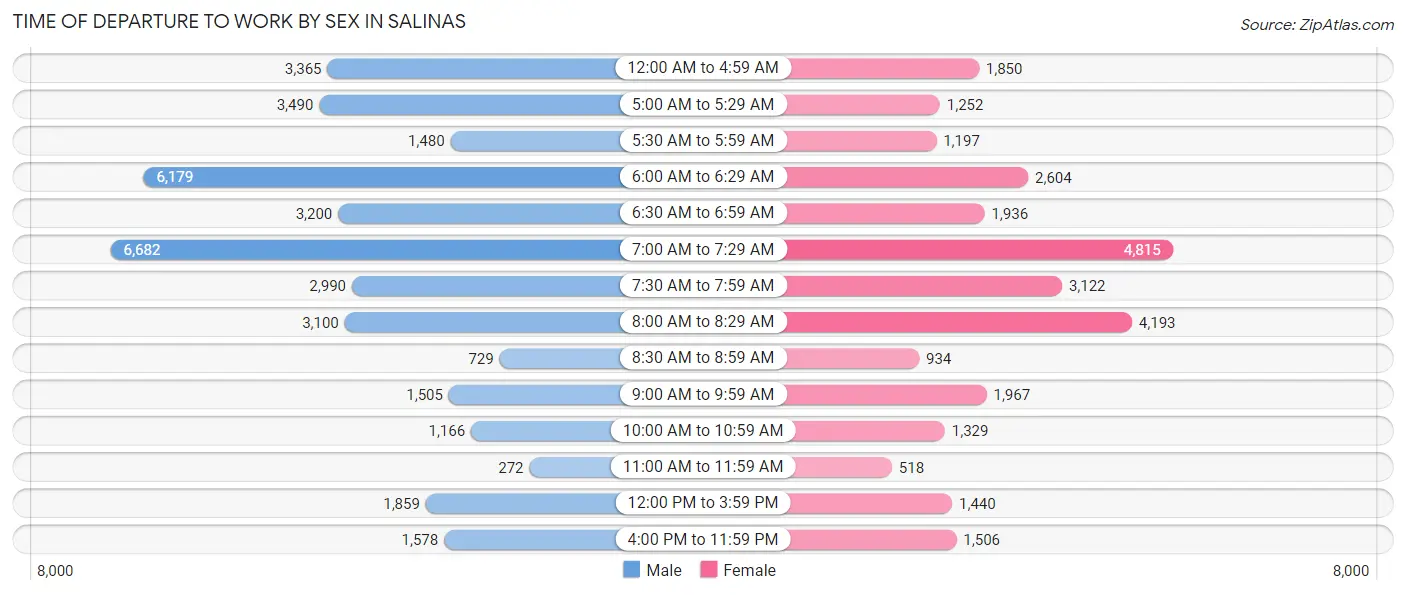
Time of Departure to Work by Sex in Salinas
The most frequent times of departure to work in Salinas are 7:00 AM to 7:29 AM (6,682, 17.8%) for males and 7:00 AM to 7:29 AM (4,815, 16.8%) for females.
| Time of Departure | Male | Female |
| 12:00 AM to 4:59 AM | 3,365 (8.9%) | 1,850 (6.5%) |
| 5:00 AM to 5:29 AM | 3,490 (9.3%) | 1,252 (4.4%) |
| 5:30 AM to 5:59 AM | 1,480 (3.9%) | 1,197 (4.2%) |
| 6:00 AM to 6:29 AM | 6,179 (16.4%) | 2,604 (9.1%) |
| 6:30 AM to 6:59 AM | 3,200 (8.5%) | 1,936 (6.8%) |
| 7:00 AM to 7:29 AM | 6,682 (17.8%) | 4,815 (16.8%) |
| 7:30 AM to 7:59 AM | 2,990 (8.0%) | 3,122 (10.9%) |
| 8:00 AM to 8:29 AM | 3,100 (8.3%) | 4,193 (14.6%) |
| 8:30 AM to 8:59 AM | 729 (1.9%) | 934 (3.3%) |
| 9:00 AM to 9:59 AM | 1,505 (4.0%) | 1,967 (6.9%) |
| 10:00 AM to 10:59 AM | 1,166 (3.1%) | 1,329 (4.6%) |
| 11:00 AM to 11:59 AM | 272 (0.7%) | 518 (1.8%) |
| 12:00 PM to 3:59 PM | 1,859 (4.9%) | 1,440 (5.0%) |
| 4:00 PM to 11:59 PM | 1,578 (4.2%) | 1,506 (5.2%) |
| Total | 37,595 (100.0%) | 28,663 (100.0%) |
Housing Occupancy in Salinas
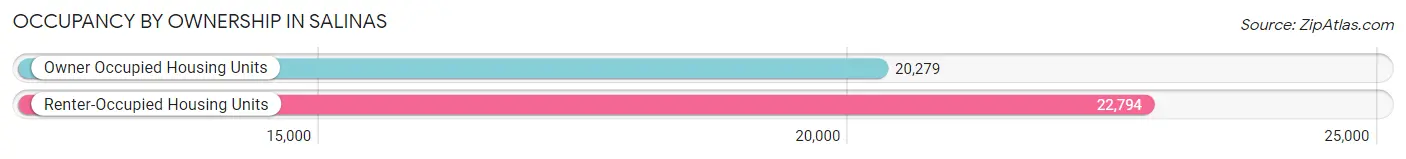
Occupancy by Ownership in Salinas
Of the total 43,073 dwellings in Salinas, owner-occupied units account for 20,279 (47.1%), while renter-occupied units make up 22,794 (52.9%).
| Occupancy | # Housing Units | % Housing Units |
| Owner Occupied Housing Units | 20,279 | 47.1% |
| Renter-Occupied Housing Units | 22,794 | 52.9% |
| Total Occupied Housing Units | 43,073 | 100.0% |
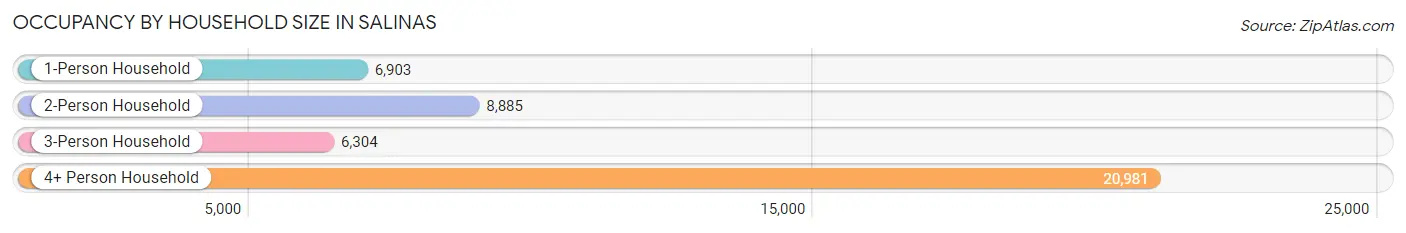
Occupancy by Household Size in Salinas
| Household Size | # Housing Units | % Housing Units |
| 1-Person Household | 6,903 | 16.0% |
| 2-Person Household | 8,885 | 20.6% |
| 3-Person Household | 6,304 | 14.6% |
| 4+ Person Household | 20,981 | 48.7% |
| Total Housing Units | 43,073 | 100.0% |
Occupancy by Ownership by Household Size in Salinas
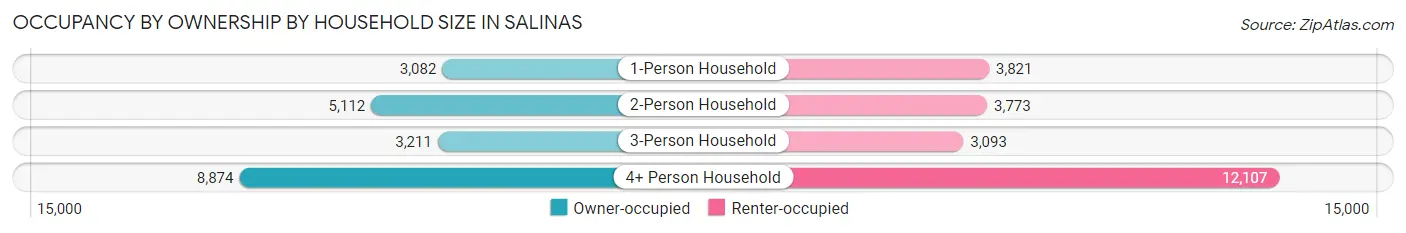
| Household Size | Owner-occupied | Renter-occupied |
| 1-Person Household | 3,082 (44.7%) | 3,821 (55.3%) |
| 2-Person Household | 5,112 (57.5%) | 3,773 (42.5%) |
| 3-Person Household | 3,211 (50.9%) | 3,093 (49.1%) |
| 4+ Person Household | 8,874 (42.3%) | 12,107 (57.7%) |
| Total Housing Units | 20,279 (47.1%) | 22,794 (52.9%) |
Occupancy by Educational Attainment in Salinas
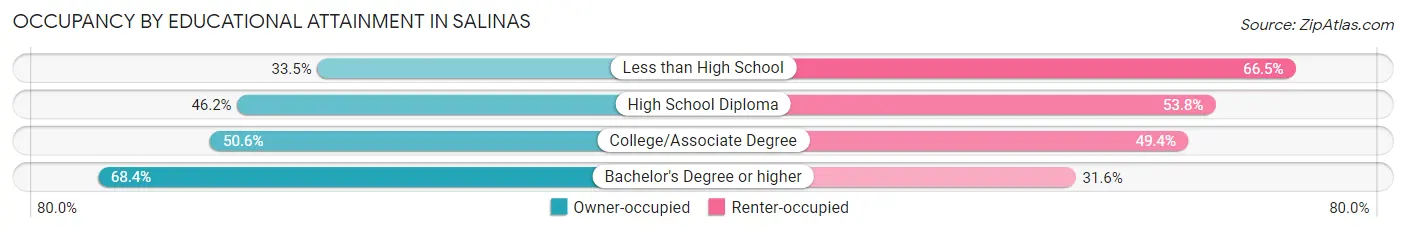
| Household Size | Owner-occupied | Renter-occupied |
| Less than High School | 4,936 (33.5%) | 9,784 (66.5%) |
| High School Diploma | 4,055 (46.2%) | 4,714 (53.8%) |
| College/Associate Degree | 5,973 (50.6%) | 5,837 (49.4%) |
| Bachelor's Degree or higher | 5,315 (68.4%) | 2,459 (31.6%) |
Occupancy by Age of Householder in Salinas
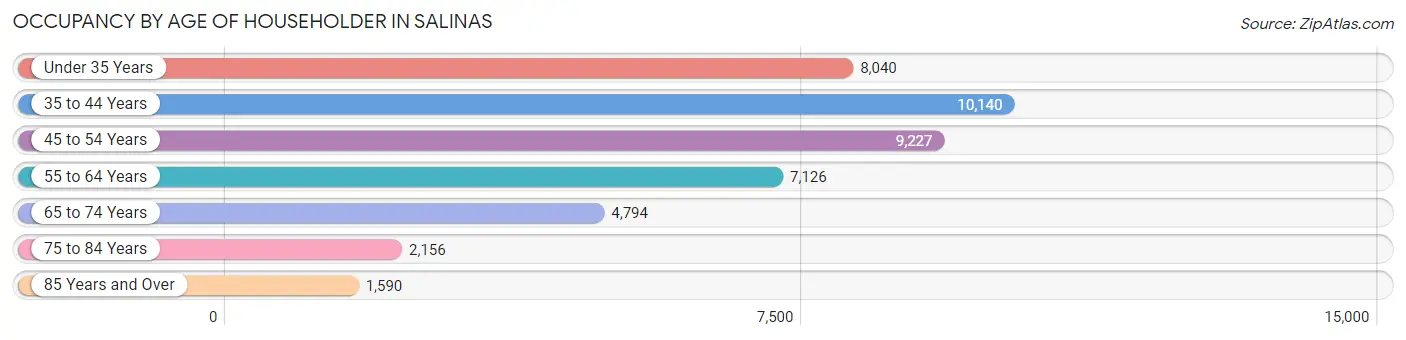
| Age Bracket | # Households | % Households |
| Under 35 Years | 8,040 | 18.7% |
| 35 to 44 Years | 10,140 | 23.5% |
| 45 to 54 Years | 9,227 | 21.4% |
| 55 to 64 Years | 7,126 | 16.5% |
| 65 to 74 Years | 4,794 | 11.1% |
| 75 to 84 Years | 2,156 | 5.0% |
| 85 Years and Over | 1,590 | 3.7% |
| Total | 43,073 | 100.0% |
Housing Finances in Salinas
Median Income by Occupancy in Salinas
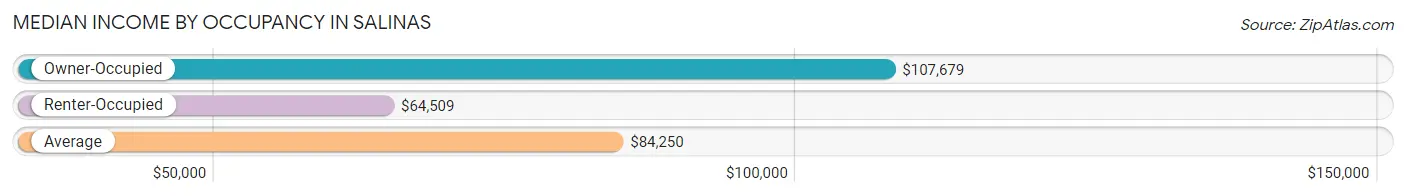
| Occupancy Type | # Households | Median Income |
| Owner-Occupied | 20,279 (47.1%) | $107,679 |
| Renter-Occupied | 22,794 (52.9%) | $64,509 |
| Average | 43,073 (100.0%) | $84,250 |
Occupancy by Householder Income Bracket in Salinas
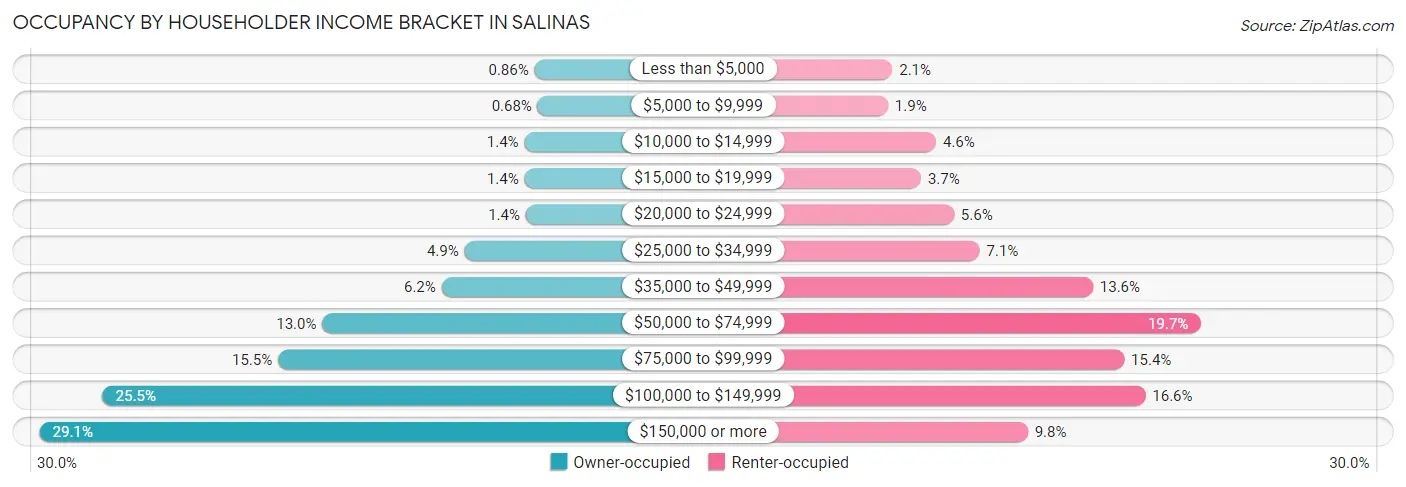
| Income Bracket | Owner-occupied | Renter-occupied |
| Less than $5,000 | 175 (0.9%) | 478 (2.1%) |
| $5,000 to $9,999 | 137 (0.7%) | 421 (1.8%) |
| $10,000 to $14,999 | 292 (1.4%) | 1,049 (4.6%) |
| $15,000 to $19,999 | 291 (1.4%) | 852 (3.7%) |
| $20,000 to $24,999 | 275 (1.4%) | 1,281 (5.6%) |
| $25,000 to $34,999 | 985 (4.9%) | 1,617 (7.1%) |
| $35,000 to $49,999 | 1,251 (6.2%) | 3,091 (13.6%) |
| $50,000 to $74,999 | 2,635 (13.0%) | 4,489 (19.7%) |
| $75,000 to $99,999 | 3,148 (15.5%) | 3,498 (15.3%) |
| $100,000 to $149,999 | 5,180 (25.5%) | 3,775 (16.6%) |
| $150,000 or more | 5,910 (29.1%) | 2,243 (9.8%) |
| Total | 20,279 (100.0%) | 22,794 (100.0%) |
Monthly Housing Cost Tiers in Salinas
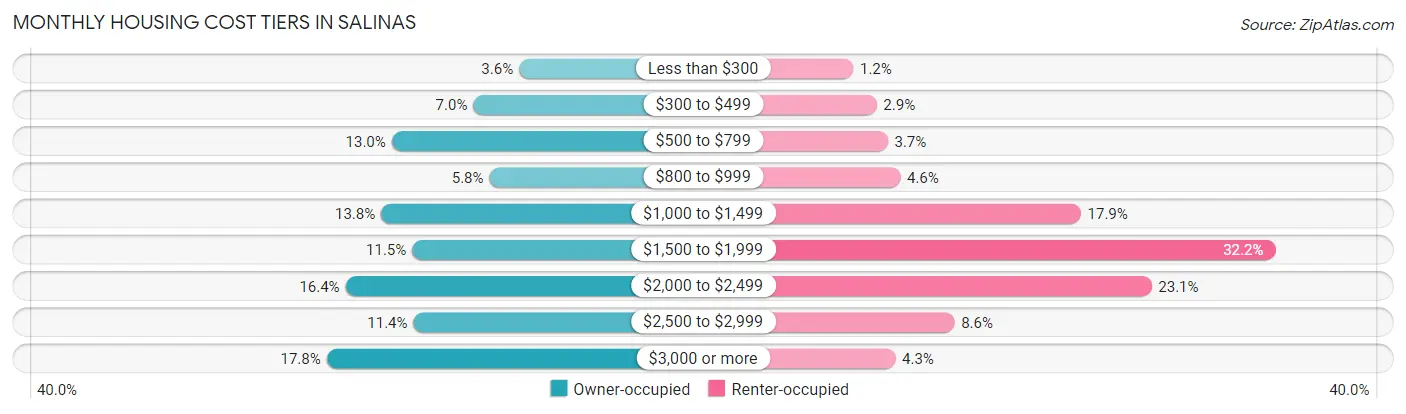
| Monthly Cost | Owner-occupied | Renter-occupied |
| Less than $300 | 728 (3.6%) | 262 (1.1%) |
| $300 to $499 | 1,411 (7.0%) | 654 (2.9%) |
| $500 to $799 | 2,631 (13.0%) | 841 (3.7%) |
| $800 to $999 | 1,171 (5.8%) | 1,050 (4.6%) |
| $1,000 to $1,499 | 2,788 (13.8%) | 4,082 (17.9%) |
| $1,500 to $1,999 | 2,324 (11.5%) | 7,348 (32.2%) |
| $2,000 to $2,499 | 3,320 (16.4%) | 5,271 (23.1%) |
| $2,500 to $2,999 | 2,305 (11.4%) | 1,961 (8.6%) |
| $3,000 or more | 3,601 (17.8%) | 968 (4.3%) |
| Total | 20,279 (100.0%) | 22,794 (100.0%) |
Physical Housing Characteristics in Salinas
Housing Structures in Salinas
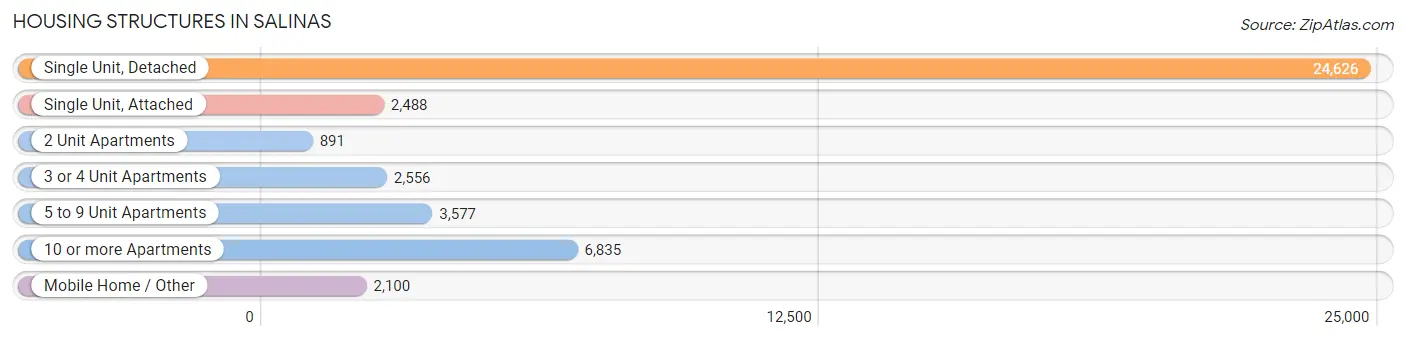
| Structure Type | # Housing Units | % Housing Units |
| Single Unit, Detached | 24,626 | 57.2% |
| Single Unit, Attached | 2,488 | 5.8% |
| 2 Unit Apartments | 891 | 2.1% |
| 3 or 4 Unit Apartments | 2,556 | 5.9% |
| 5 to 9 Unit Apartments | 3,577 | 8.3% |
| 10 or more Apartments | 6,835 | 15.9% |
| Mobile Home / Other | 2,100 | 4.9% |
| Total | 43,073 | 100.0% |
Housing Structures by Occupancy in Salinas
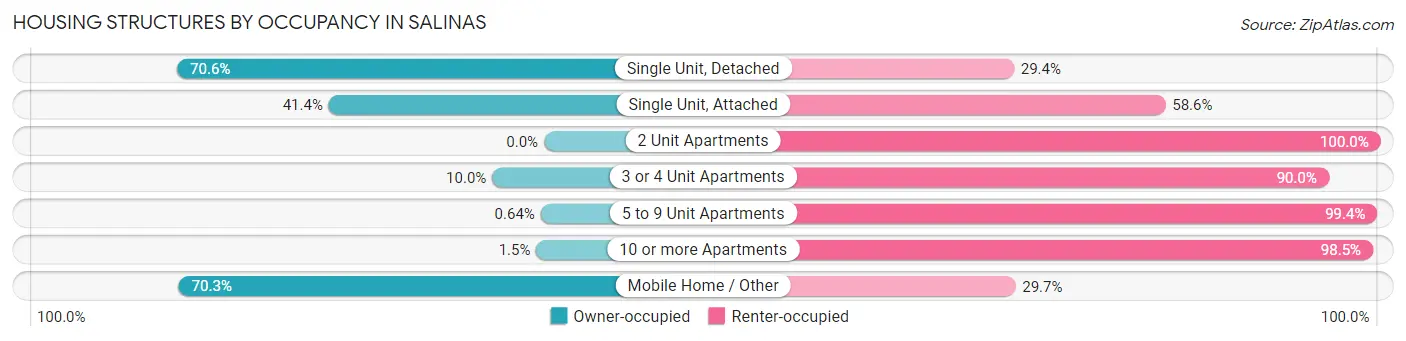
| Structure Type | Owner-occupied | Renter-occupied |
| Single Unit, Detached | 17,392 (70.6%) | 7,234 (29.4%) |
| Single Unit, Attached | 1,031 (41.4%) | 1,457 (58.6%) |
| 2 Unit Apartments | 0 (0.0%) | 891 (100.0%) |
| 3 or 4 Unit Apartments | 255 (10.0%) | 2,301 (90.0%) |
| 5 to 9 Unit Apartments | 23 (0.6%) | 3,554 (99.4%) |
| 10 or more Apartments | 101 (1.5%) | 6,734 (98.5%) |
| Mobile Home / Other | 1,477 (70.3%) | 623 (29.7%) |
| Total | 20,279 (47.1%) | 22,794 (52.9%) |
Housing Structures by Number of Rooms in Salinas
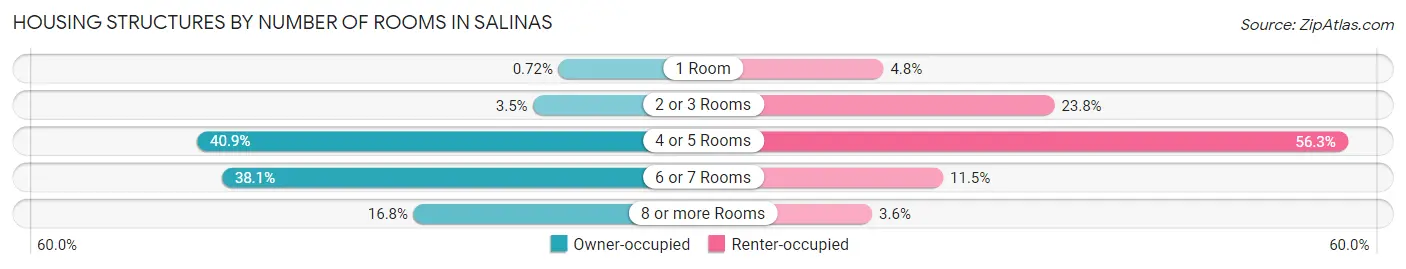
| Number of Rooms | Owner-occupied | Renter-occupied |
| 1 Room | 146 (0.7%) | 1,100 (4.8%) |
| 2 or 3 Rooms | 715 (3.5%) | 5,428 (23.8%) |
| 4 or 5 Rooms | 8,283 (40.8%) | 12,841 (56.3%) |
| 6 or 7 Rooms | 7,729 (38.1%) | 2,609 (11.5%) |
| 8 or more Rooms | 3,406 (16.8%) | 816 (3.6%) |
| Total | 20,279 (100.0%) | 22,794 (100.0%) |
Housing Structure by Heating Type in Salinas
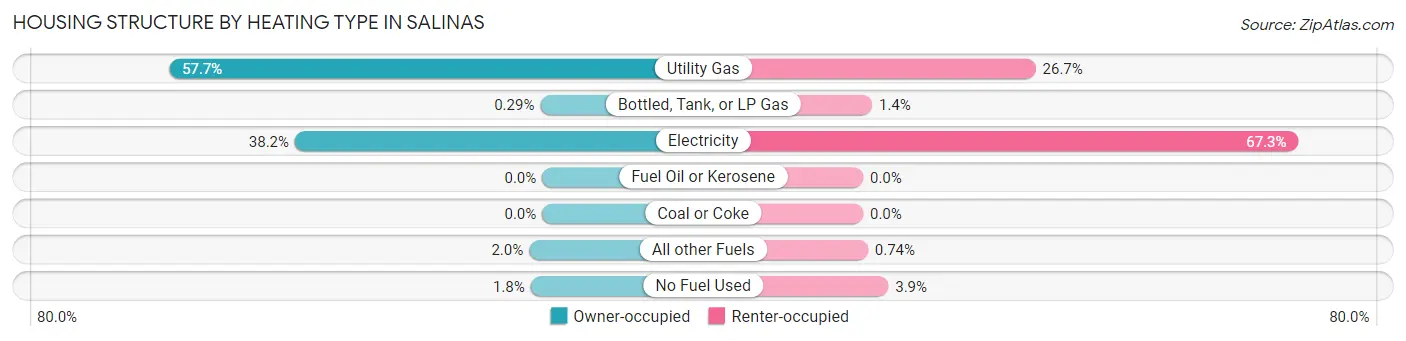
| Heating Type | Owner-occupied | Renter-occupied |
| Utility Gas | 11,697 (57.7%) | 6,082 (26.7%) |
| Bottled, Tank, or LP Gas | 58 (0.3%) | 316 (1.4%) |
| Electricity | 7,750 (38.2%) | 15,339 (67.3%) |
| Fuel Oil or Kerosene | 0 (0.0%) | 0 (0.0%) |
| Coal or Coke | 0 (0.0%) | 0 (0.0%) |
| All other Fuels | 410 (2.0%) | 169 (0.7%) |
| No Fuel Used | 364 (1.8%) | 888 (3.9%) |
| Total | 20,279 (100.0%) | 22,794 (100.0%) |
Household Vehicle Usage in Salinas
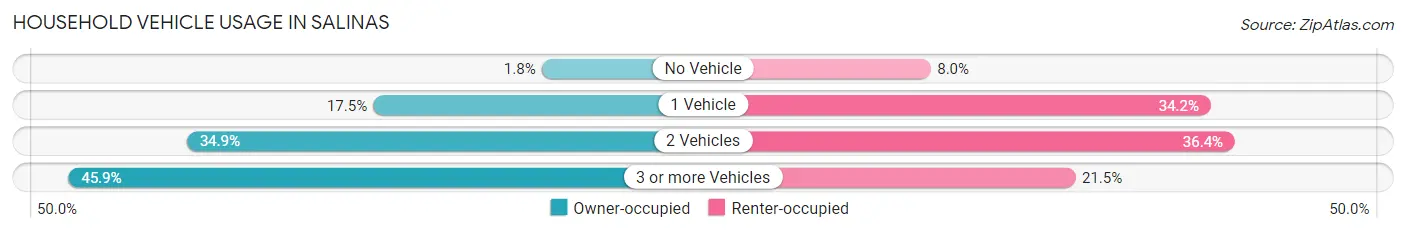
| Vehicles per Household | Owner-occupied | Renter-occupied |
| No Vehicle | 354 (1.8%) | 1,816 (8.0%) |
| 1 Vehicle | 3,544 (17.5%) | 7,784 (34.2%) |
| 2 Vehicles | 7,069 (34.9%) | 8,297 (36.4%) |
| 3 or more Vehicles | 9,312 (45.9%) | 4,897 (21.5%) |
| Total | 20,279 (100.0%) | 22,794 (100.0%) |
Real Estate & Mortgages in Salinas
Real Estate and Mortgage Overview in Salinas
| Characteristic | Without Mortgage | With Mortgage |
| Housing Units | 6,614 | 13,665 |
| Median Property Value | $513,600 | $593,800 |
| Median Household Income | $82,025 | $4,666 |
| Monthly Housing Costs | $622 | $3,582 |
| Real Estate Taxes | $2,629 | $146 |
Property Value by Mortgage Status in Salinas
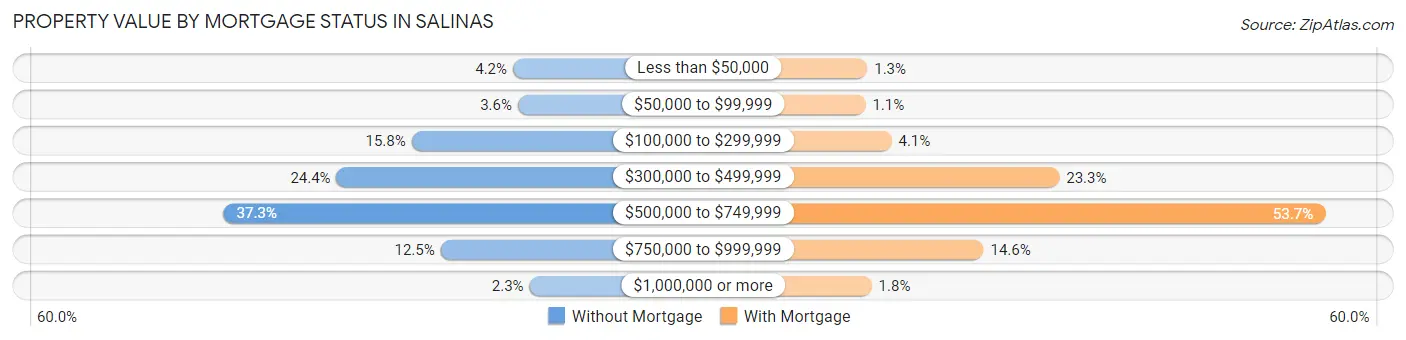
| Property Value | Without Mortgage | With Mortgage |
| Less than $50,000 | 278 (4.2%) | 183 (1.3%) |
| $50,000 to $99,999 | 240 (3.6%) | 154 (1.1%) |
| $100,000 to $299,999 | 1,044 (15.8%) | 562 (4.1%) |
| $300,000 to $499,999 | 1,611 (24.4%) | 3,183 (23.3%) |
| $500,000 to $749,999 | 2,464 (37.2%) | 7,333 (53.7%) |
| $750,000 to $999,999 | 824 (12.5%) | 1,999 (14.6%) |
| $1,000,000 or more | 153 (2.3%) | 251 (1.8%) |
| Total | 6,614 (100.0%) | 13,665 (100.0%) |
Household Income by Mortgage Status in Salinas
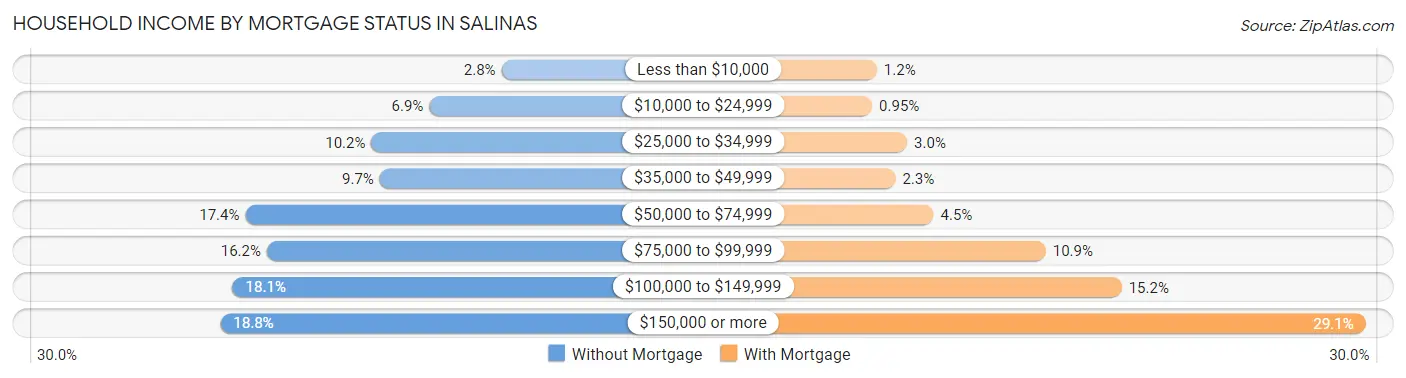
| Household Income | Without Mortgage | With Mortgage |
| Less than $10,000 | 182 (2.8%) | 167 (1.2%) |
| $10,000 to $24,999 | 455 (6.9%) | 130 (0.9%) |
| $25,000 to $34,999 | 674 (10.2%) | 403 (2.9%) |
| $35,000 to $49,999 | 642 (9.7%) | 311 (2.3%) |
| $50,000 to $74,999 | 1,150 (17.4%) | 609 (4.5%) |
| $75,000 to $99,999 | 1,069 (16.2%) | 1,485 (10.9%) |
| $100,000 to $149,999 | 1,198 (18.1%) | 2,079 (15.2%) |
| $150,000 or more | 1,244 (18.8%) | 3,982 (29.1%) |
| Total | 6,614 (100.0%) | 13,665 (100.0%) |
Property Value to Household Income Ratio in Salinas
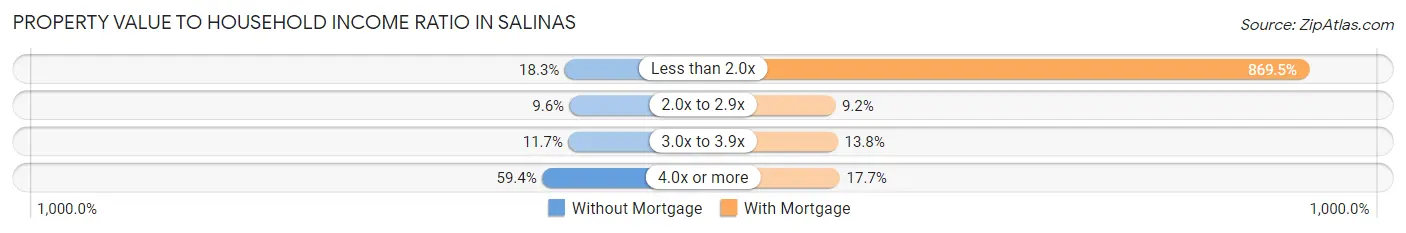
| Value-to-Income Ratio | Without Mortgage | With Mortgage |
| Less than 2.0x | 1,212 (18.3%) | 118,823 (869.5%) |
| 2.0x to 2.9x | 633 (9.6%) | 1,256 (9.2%) |
| 3.0x to 3.9x | 774 (11.7%) | 1,889 (13.8%) |
| 4.0x or more | 3,928 (59.4%) | 2,415 (17.7%) |
| Total | 6,614 (100.0%) | 13,665 (100.0%) |
Real Estate Taxes by Mortgage Status in Salinas
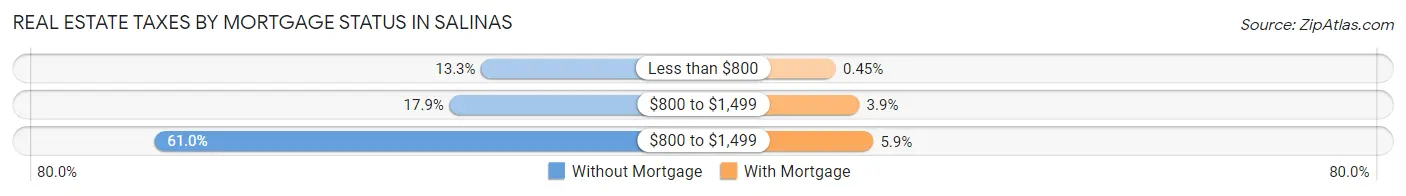
| Property Taxes | Without Mortgage | With Mortgage |
| Less than $800 | 877 (13.3%) | 62 (0.4%) |
| $800 to $1,499 | 1,183 (17.9%) | 532 (3.9%) |
| $800 to $1,499 | 4,037 (61.0%) | 807 (5.9%) |
| Total | 6,614 (100.0%) | 13,665 (100.0%) |
Health & Disability in Salinas
Health Insurance Coverage by Age in Salinas
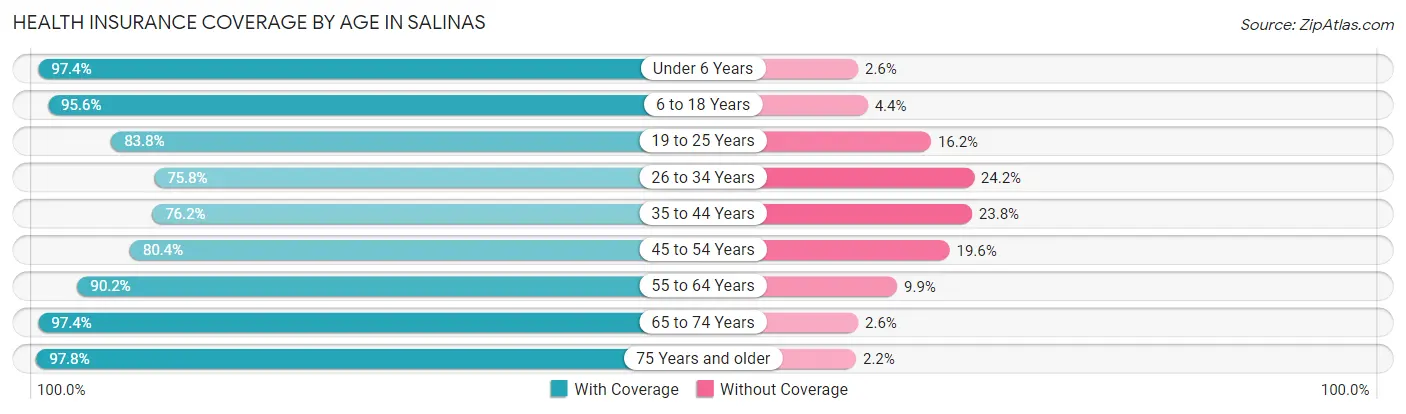
| Age Bracket | With Coverage | Without Coverage |
| Under 6 Years | 15,201 (97.4%) | 400 (2.6%) |
| 6 to 18 Years | 34,196 (95.6%) | 1,564 (4.4%) |
| 19 to 25 Years | 13,563 (83.8%) | 2,615 (16.2%) |
| 26 to 34 Years | 16,729 (75.8%) | 5,332 (24.2%) |
| 35 to 44 Years | 17,122 (76.2%) | 5,349 (23.8%) |
| 45 to 54 Years | 15,086 (80.4%) | 3,684 (19.6%) |
| 55 to 64 Years | 13,782 (90.1%) | 1,506 (9.9%) |
| 65 to 74 Years | 8,713 (97.4%) | 231 (2.6%) |
| 75 Years and older | 6,646 (97.8%) | 149 (2.2%) |
| Total | 141,038 (87.1%) | 20,830 (12.9%) |
Health Insurance Coverage by Citizenship Status in Salinas
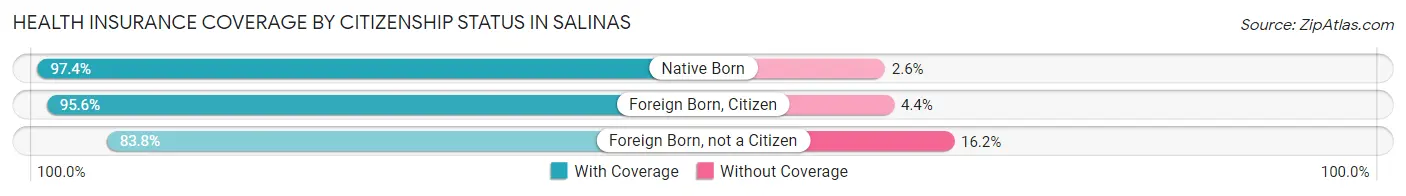
| Citizenship Status | With Coverage | Without Coverage |
| Native Born | 15,201 (97.4%) | 400 (2.6%) |
| Foreign Born, Citizen | 34,196 (95.6%) | 1,564 (4.4%) |
| Foreign Born, not a Citizen | 13,563 (83.8%) | 2,615 (16.2%) |
Health Insurance Coverage by Household Income in Salinas
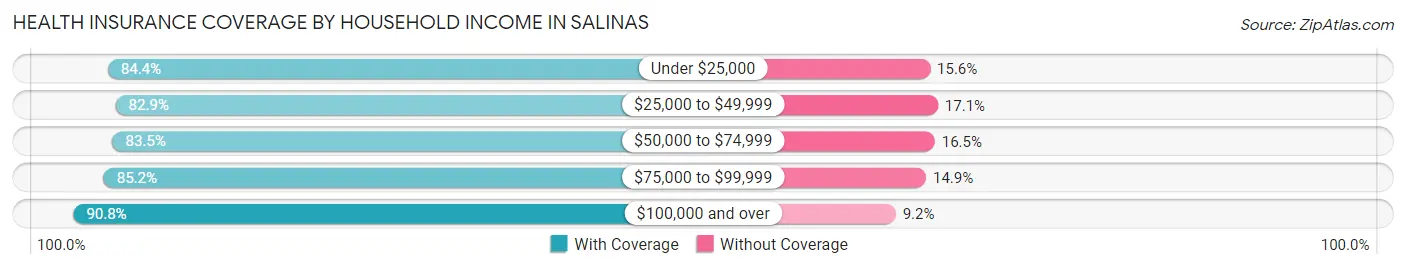
| Household Income | With Coverage | Without Coverage |
| Under $25,000 | 10,875 (84.4%) | 2,011 (15.6%) |
| $25,000 to $49,999 | 18,880 (82.9%) | 3,886 (17.1%) |
| $50,000 to $74,999 | 22,291 (83.5%) | 4,402 (16.5%) |
| $75,000 to $99,999 | 21,901 (85.2%) | 3,820 (14.8%) |
| $100,000 and over | 65,954 (90.8%) | 6,652 (9.2%) |
Public vs Private Health Insurance Coverage by Age in Salinas
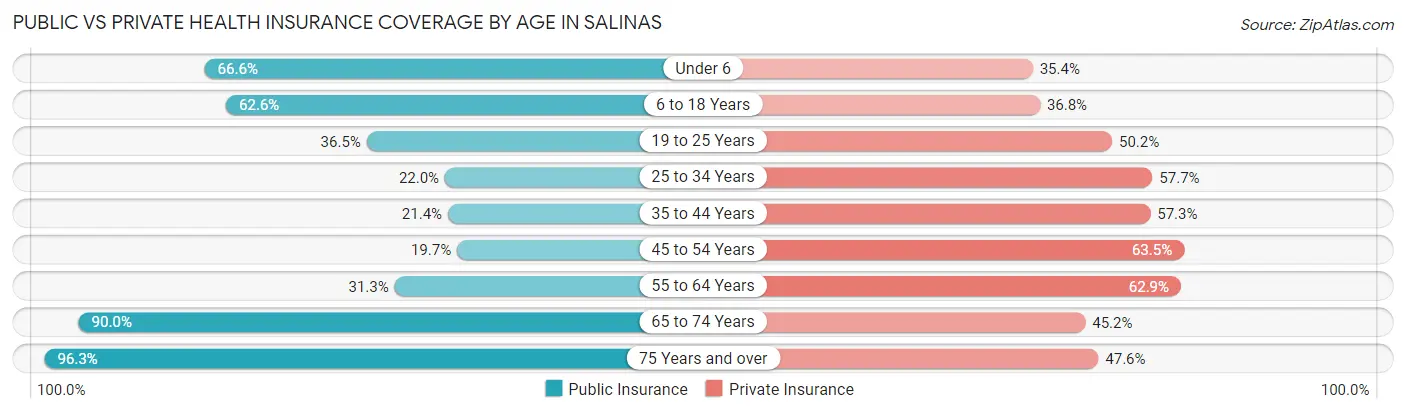
| Age Bracket | Public Insurance | Private Insurance |
| Under 6 | 10,386 (66.6%) | 5,529 (35.4%) |
| 6 to 18 Years | 22,392 (62.6%) | 13,153 (36.8%) |
| 19 to 25 Years | 5,907 (36.5%) | 8,117 (50.2%) |
| 25 to 34 Years | 4,849 (22.0%) | 12,719 (57.7%) |
| 35 to 44 Years | 4,815 (21.4%) | 12,868 (57.3%) |
| 45 to 54 Years | 3,706 (19.7%) | 11,921 (63.5%) |
| 55 to 64 Years | 4,789 (31.3%) | 9,621 (62.9%) |
| 65 to 74 Years | 8,047 (90.0%) | 4,043 (45.2%) |
| 75 Years and over | 6,544 (96.3%) | 3,236 (47.6%) |
| Total | 71,435 (44.1%) | 81,207 (50.2%) |
Disability Status by Sex by Age in Salinas
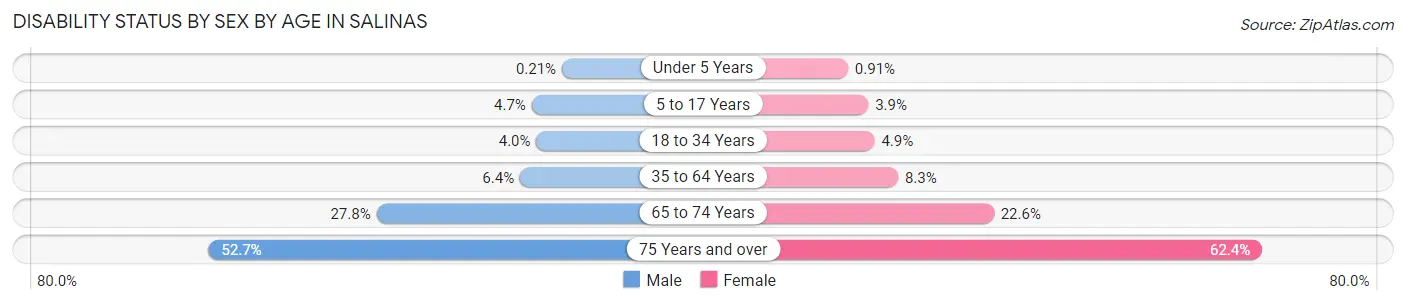
| Age Bracket | Male | Female |
| Under 5 Years | 14 (0.2%) | 60 (0.9%) |
| 5 to 17 Years | 898 (4.7%) | 636 (3.9%) |
| 18 to 34 Years | 847 (4.0%) | 966 (4.9%) |
| 35 to 64 Years | 1,846 (6.4%) | 2,325 (8.3%) |
| 65 to 74 Years | 1,187 (27.8%) | 1,053 (22.6%) |
| 75 Years and over | 1,445 (52.7%) | 2,529 (62.4%) |
Disability Class by Sex by Age in Salinas
Disability Class: Hearing Difficulty
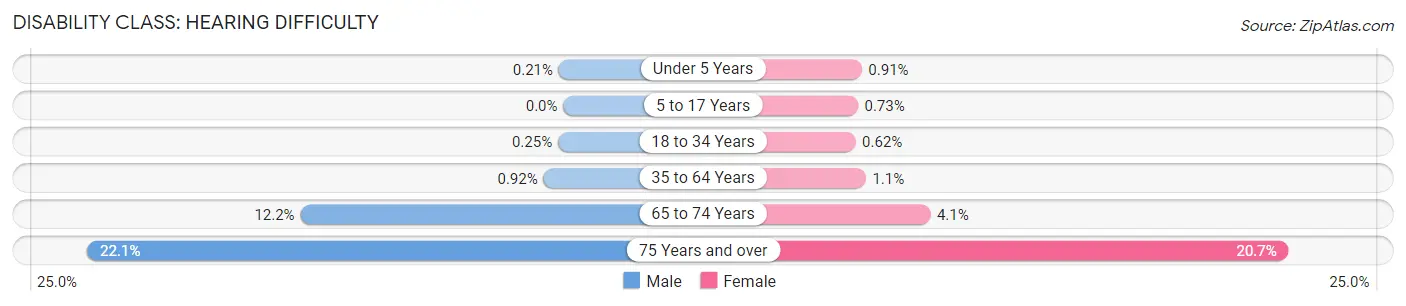
| Age Bracket | Male | Female |
| Under 5 Years | 14 (0.2%) | 60 (0.9%) |
| 5 to 17 Years | 0 (0.0%) | 119 (0.7%) |
| 18 to 34 Years | 52 (0.3%) | 123 (0.6%) |
| 35 to 64 Years | 263 (0.9%) | 307 (1.1%) |
| 65 to 74 Years | 522 (12.2%) | 191 (4.1%) |
| 75 Years and over | 606 (22.1%) | 840 (20.7%) |
Disability Class: Vision Difficulty
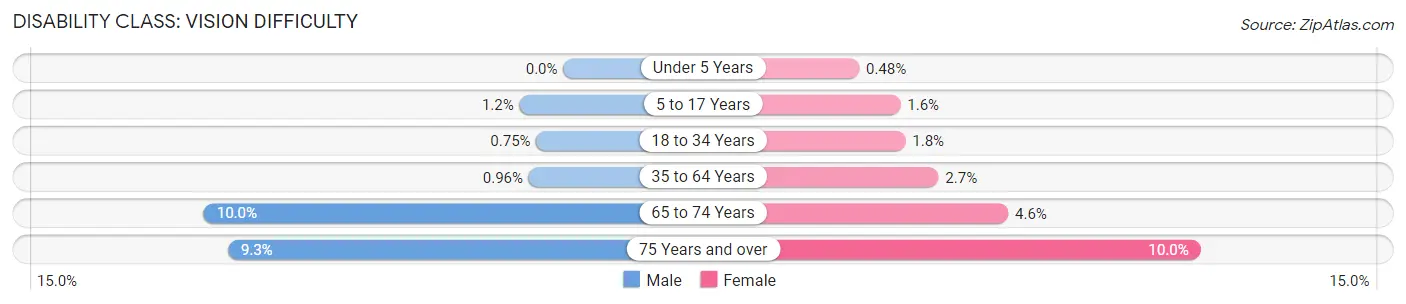
| Age Bracket | Male | Female |
| Under 5 Years | 0 (0.0%) | 32 (0.5%) |
| 5 to 17 Years | 232 (1.2%) | 265 (1.6%) |
| 18 to 34 Years | 158 (0.7%) | 352 (1.8%) |
| 35 to 64 Years | 274 (1.0%) | 749 (2.7%) |
| 65 to 74 Years | 428 (10.0%) | 216 (4.6%) |
| 75 Years and over | 256 (9.3%) | 405 (10.0%) |
Disability Class: Cognitive Difficulty
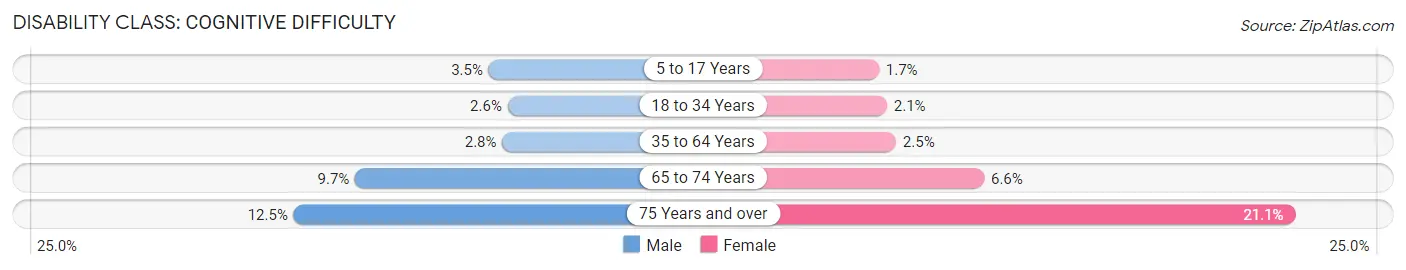
| Age Bracket | Male | Female |
| 5 to 17 Years | 661 (3.5%) | 279 (1.7%) |
| 18 to 34 Years | 544 (2.6%) | 416 (2.1%) |
| 35 to 64 Years | 811 (2.8%) | 700 (2.5%) |
| 65 to 74 Years | 413 (9.7%) | 308 (6.6%) |
| 75 Years and over | 343 (12.5%) | 853 (21.0%) |
Disability Class: Ambulatory Difficulty
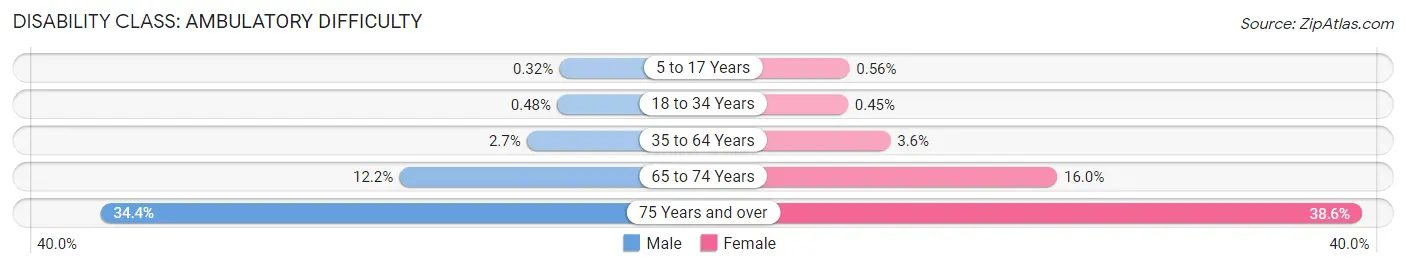
| Age Bracket | Male | Female |
| 5 to 17 Years | 61 (0.3%) | 91 (0.6%) |
| 18 to 34 Years | 101 (0.5%) | 89 (0.4%) |
| 35 to 64 Years | 783 (2.7%) | 1,004 (3.6%) |
| 65 to 74 Years | 522 (12.2%) | 746 (16.0%) |
| 75 Years and over | 942 (34.4%) | 1,565 (38.6%) |
Disability Class: Self-Care Difficulty
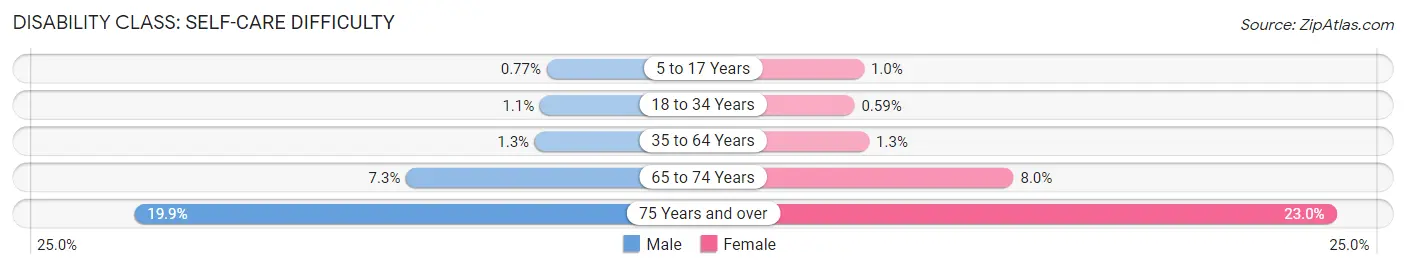
| Age Bracket | Male | Female |
| 5 to 17 Years | 147 (0.8%) | 167 (1.0%) |
| 18 to 34 Years | 229 (1.1%) | 117 (0.6%) |
| 35 to 64 Years | 377 (1.3%) | 353 (1.3%) |
| 65 to 74 Years | 312 (7.3%) | 372 (8.0%) |
| 75 Years and over | 546 (19.9%) | 930 (23.0%) |
Technology Access in Salinas
Computing Device Access in Salinas
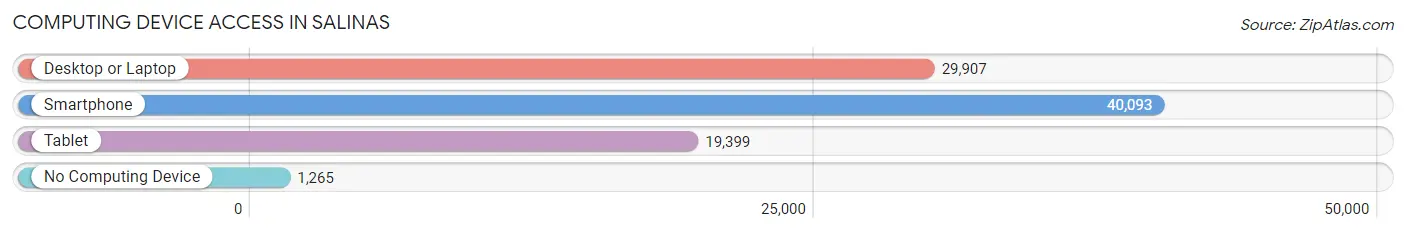
| Device Type | # Households | % Households |
| Desktop or Laptop | 29,907 | 69.4% |
| Smartphone | 40,093 | 93.1% |
| Tablet | 19,399 | 45.0% |
| No Computing Device | 1,265 | 2.9% |
| Total | 43,073 | 100.0% |
Internet Access in Salinas
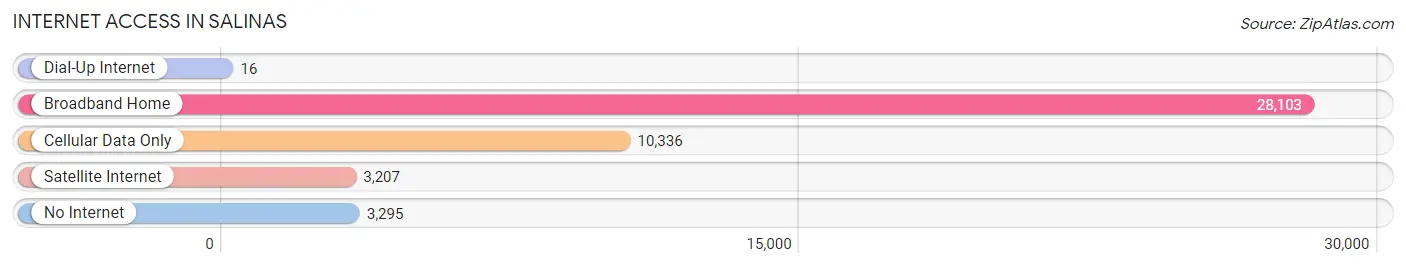
| Internet Type | # Households | % Households |
| Dial-Up Internet | 16 | 0.0% |
| Broadband Home | 28,103 | 65.2% |
| Cellular Data Only | 10,336 | 24.0% |
| Satellite Internet | 3,207 | 7.4% |
| No Internet | 3,295 | 7.6% |
| Total | 43,073 | 100.0% |
Salinas Summary
Salinas is a city located in Monterey County, California, United States. It is the county seat and largest municipality of Monterey County. The population was 150,441 at the 2010 census. Salinas is an urban area located in the Salinas Valley, roughly eight miles from the Pacific Ocean and is known as the “Salad Bowl of the World” due to its large agricultural industry.
History
The area of Salinas was originally inhabited by the Ohlone people, who lived in the area for thousands of years. The first European to explore the area was Juan Bautista de Anza in 1774. The area was later settled by Spanish missionaries in 1791, who established the Mission San Antonio de Padua. The mission was abandoned in 1835 and the area was later settled by Mexican ranchers.
In 1848, the area was ceded to the United States after the Mexican-American War. The area was then divided into large land grants, which were given to prominent Californians. The area was then incorporated as the City of Salinas in 1874.
Geography
Salinas is located in the Salinas Valley, which is part of the Central Coast region of California. The city is located at an elevation of about 82 feet (25 m) above sea level. The city is located about 8 miles (13 km) from the Pacific Ocean and is surrounded by agricultural land. The Salinas River runs through the city and is the main source of water for the area.
The climate in Salinas is Mediterranean, with mild, wet winters and hot, dry summers. The average annual temperature is about 60°F (15°C).
Economy
Salinas is the largest city in Monterey County and is the economic center of the region. The city is home to a large agricultural industry, which is the main source of employment in the area. The city is also home to a number of manufacturing and technology companies.
The city is home to a number of shopping centers, restaurants, and other businesses. The city is also home to a number of educational institutions, including California State University Monterey Bay, Hartnell College, and the Salinas Valley Memorial Hospital.
Demographics
As of the 2010 census, the population of Salinas was 150,441. The racial makeup of the city was 57.2% White, 3.2% African American, 1.2% Native American, 5.3% Asian, 0.2% Pacific Islander, 30.3% from other races, and 3.0% from two or more races. Hispanic or Latino of any race were 57.2% of the population.
The median income for a household in the city was $45,837, and the median income for a family was $51,817. The per capita income for the city was $20,845. About 17.2% of families and 21.3% of the population were below the poverty line, including 28.3% of those under age 18 and 8.7% of those age 65 or over.
Salinas is a diverse city with a rich history and a vibrant economy. The city is home to a large agricultural industry, as well as a number of manufacturing and technology companies. The city is also home to a number of educational institutions and is a popular destination for tourists.
Common Questions
What is Per Capita Income in Salinas?
Per Capita income in Salinas is $27,344.
What is the Median Family Income in Salinas?
Median Family Income in Salinas is $84,338.
What is the Median Household income in Salinas?
Median Household Income in Salinas is $84,250.
What is Income or Wage Gap in Salinas?
Income or Wage Gap in Salinas is 18.2%.
Women in Salinas earn 81.8 cents for every dollar earned by a man.
What is Family Income Deficit in Salinas?
Family Income Deficit in Salinas is $10,478.
Families that are below poverty line in Salinas earn $10,478 less on average than the poverty threshold level.
What is Inequality or Gini Index in Salinas?
Inequality or Gini Index in Salinas is 0.41.
What is the Total Population of Salinas?
Total Population of Salinas is 162,783.
What is the Total Male Population of Salinas?
Total Male Population of Salinas is 83,175.
What is the Total Female Population of Salinas?
Total Female Population of Salinas is 79,608.
What is the Ratio of Males per 100 Females in Salinas?
There are 104.48 Males per 100 Females in Salinas.
What is the Ratio of Females per 100 Males in Salinas?
There are 95.71 Females per 100 Males in Salinas.
What is the Median Population Age in Salinas?
Median Population Age in Salinas is 31.7 Years.
What is the Average Family Size in Salinas
Average Family Size in Salinas is 4.1 People.
What is the Average Household Size in Salinas
Average Household Size in Salinas is 3.7 People.
How Large is the Labor Force in Salinas?
There are 74,174 People in the Labor Forcein in Salinas.
What is the Percentage of People in the Labor Force in Salinas?
62.2% of People are in the Labor Force in Salinas.
What is the Unemployment Rate in Salinas?
Unemployment Rate in Salinas is 5.0%.