Albuquerque, NM Map & Demographics
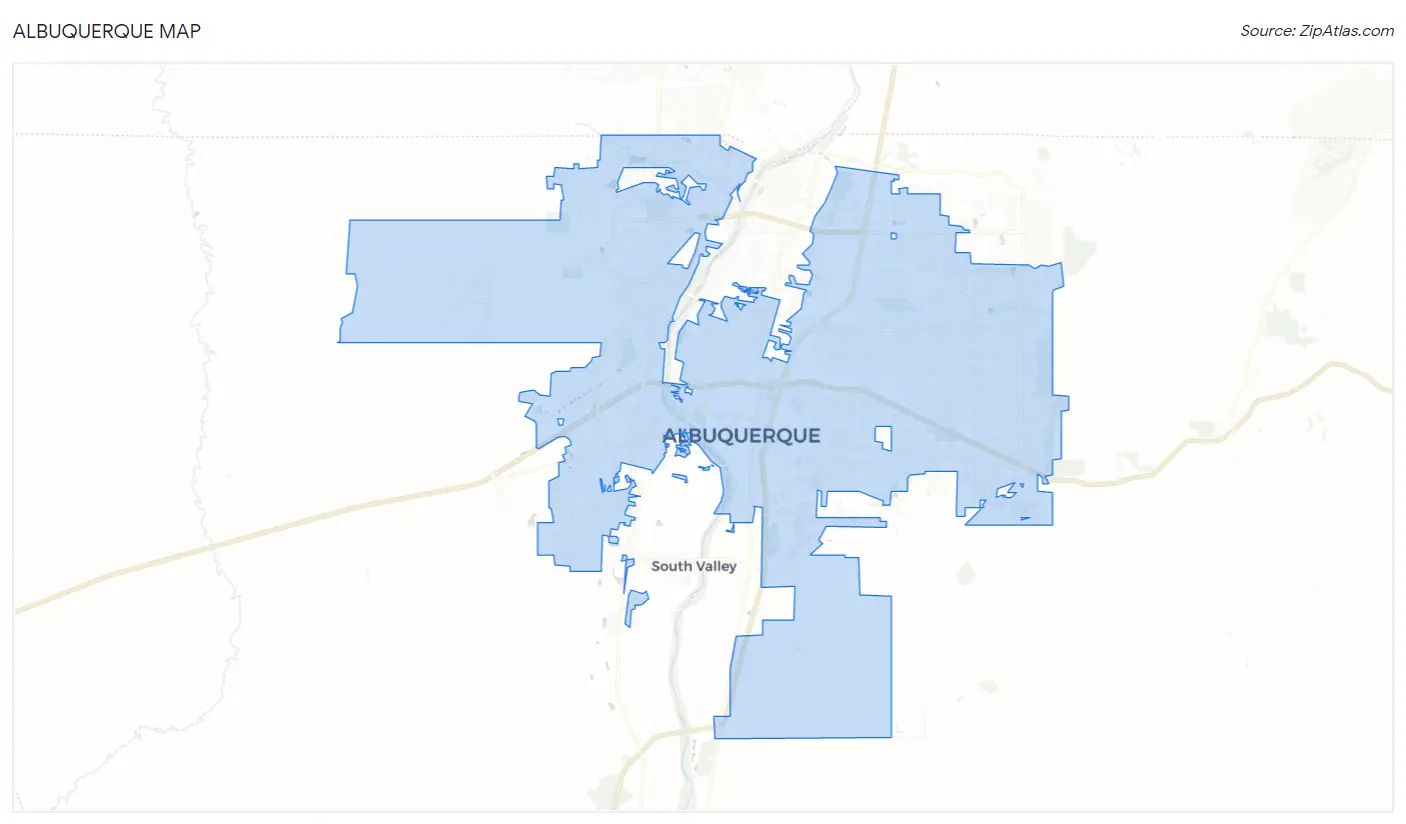
Albuquerque Map
Albuquerque Overview
$36,879
PER CAPITA INCOME
$78,926
AVG FAMILY INCOME
$61,503
AVG HOUSEHOLD INCOME
18.7%
WAGE / INCOME GAP [ % ]
81.3¢/ $1
WAGE / INCOME GAP [ $ ]
$10,827
FAMILY INCOME DEFICIT
0.47
INEQUALITY / GINI INDEX
562,551
TOTAL POPULATION
276,027
MALE POPULATION
286,524
FEMALE POPULATION
96.34
MALES / 100 FEMALES
103.80
FEMALES / 100 MALES
38.0
MEDIAN AGE
3.1
AVG FAMILY SIZE
2.3
AVG HOUSEHOLD SIZE
294,709
LABOR FORCE [ PEOPLE ]
64.2%
PERCENT IN LABOR FORCE
5.5%
UNEMPLOYMENT RATE
Albuquerque Zip Codes
Albuquerque Area Codes
Income in Albuquerque
Income Overview in Albuquerque
Per Capita Income in Albuquerque is $36,879, while median incomes of families and households are $78,926 and $61,503 respectively.
| Characteristic | Number | Measure |
| Per Capita Income | 562,551 | $36,879 |
| Median Family Income | 133,051 | $78,926 |
| Mean Family Income | 133,051 | $100,596 |
| Median Household Income | 239,800 | $61,503 |
| Mean Household Income | 239,800 | $83,679 |
| Income Deficit | 133,051 | $10,827 |
| Wage / Income Gap (%) | 562,551 | 18.71% |
| Wage / Income Gap ($) | 562,551 | 81.29¢ per $1 |
| Gini / Inequality Index | 562,551 | 0.47 |
Earnings by Sex in Albuquerque
Average Earnings in Albuquerque are $38,235, $42,210 for men and $34,312 for women, a difference of 18.7%.
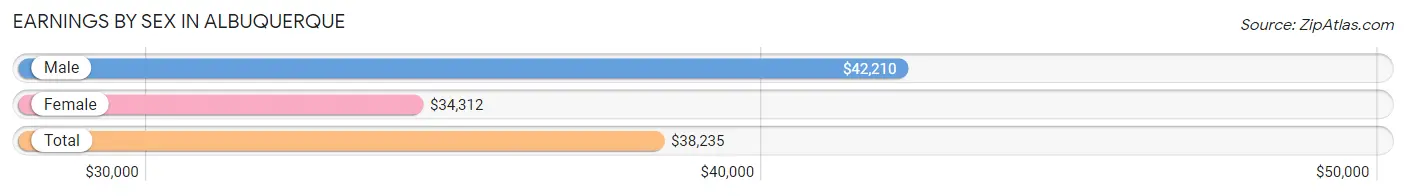
| Sex | Number | Average Earnings |
| Male | 156,488 (51.4%) | $42,210 |
| Female | 147,800 (48.6%) | $34,312 |
| Total | 304,288 (100.0%) | $38,235 |
Earnings by Sex by Income Bracket in Albuquerque
The most common earnings brackets in Albuquerque are $100,000+ for men (23,659 | 15.1%) and $75,000 to $99,999 for women (13,379 | 9.0%).
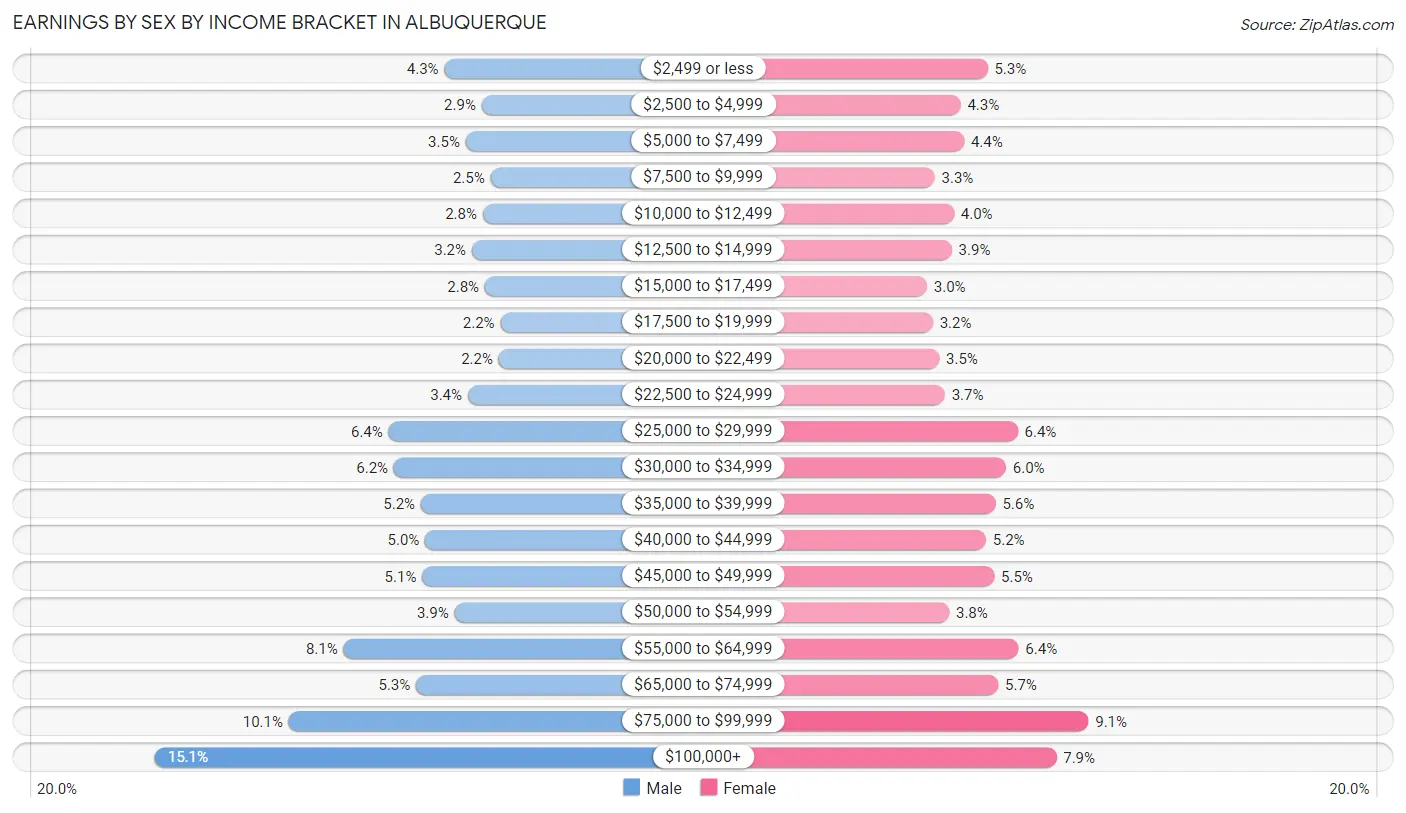
| Income | Male | Female |
| $2,499 or less | 6,686 (4.3%) | 7,788 (5.3%) |
| $2,500 to $4,999 | 4,484 (2.9%) | 6,294 (4.3%) |
| $5,000 to $7,499 | 5,433 (3.5%) | 6,489 (4.4%) |
| $7,500 to $9,999 | 3,969 (2.5%) | 4,870 (3.3%) |
| $10,000 to $12,499 | 4,421 (2.8%) | 5,925 (4.0%) |
| $12,500 to $14,999 | 5,067 (3.2%) | 5,805 (3.9%) |
| $15,000 to $17,499 | 4,296 (2.8%) | 4,440 (3.0%) |
| $17,500 to $19,999 | 3,400 (2.2%) | 4,766 (3.2%) |
| $20,000 to $22,499 | 3,485 (2.2%) | 5,107 (3.5%) |
| $22,500 to $24,999 | 5,308 (3.4%) | 5,425 (3.7%) |
| $25,000 to $29,999 | 9,953 (6.4%) | 9,462 (6.4%) |
| $30,000 to $34,999 | 9,632 (6.2%) | 8,805 (6.0%) |
| $35,000 to $39,999 | 8,054 (5.1%) | 8,233 (5.6%) |
| $40,000 to $44,999 | 7,808 (5.0%) | 7,707 (5.2%) |
| $45,000 to $49,999 | 7,982 (5.1%) | 8,163 (5.5%) |
| $50,000 to $54,999 | 6,093 (3.9%) | 5,664 (3.8%) |
| $55,000 to $64,999 | 12,602 (8.1%) | 9,503 (6.4%) |
| $65,000 to $74,999 | 8,345 (5.3%) | 8,374 (5.7%) |
| $75,000 to $99,999 | 15,811 (10.1%) | 13,379 (9.0%) |
| $100,000+ | 23,659 (15.1%) | 11,601 (7.9%) |
| Total | 156,488 (100.0%) | 147,800 (100.0%) |
Earnings by Sex by Educational Attainment in Albuquerque
Average earnings in Albuquerque are $48,226 for men and $40,448 for women, a difference of 16.1%. Men with an educational attainment of graduate degree enjoy the highest average annual earnings of $92,008, while those with less than high school education earn the least with $30,993. Women with an educational attainment of graduate degree earn the most with the average annual earnings of $68,876, while those with less than high school education have the smallest earnings of $20,411.
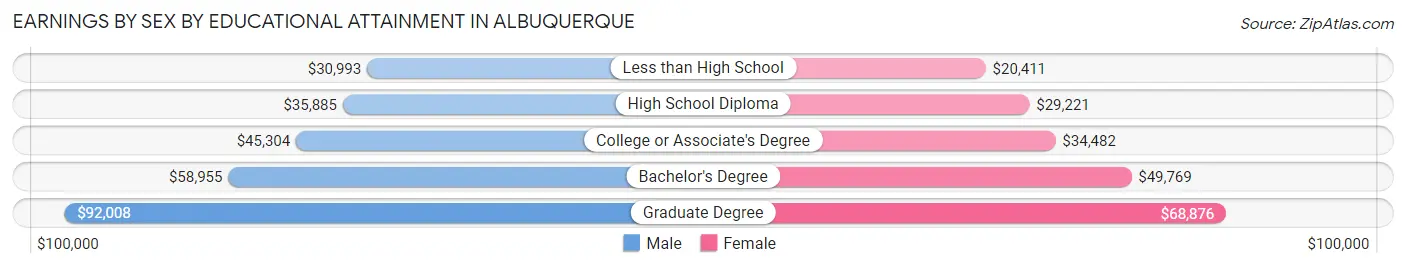
| Educational Attainment | Male Income | Female Income |
| Less than High School | $30,993 | $20,411 |
| High School Diploma | $35,885 | $29,221 |
| College or Associate's Degree | $45,304 | $34,482 |
| Bachelor's Degree | $58,955 | $49,769 |
| Graduate Degree | $92,008 | $68,876 |
| Total | $48,226 | $40,448 |
Family Income in Albuquerque
Family Income Brackets in Albuquerque
According to the Albuquerque family income data, there are 25,679 families falling into the $100,000 to $149,999 income range, which is the most common income bracket and makes up 19.3% of all families. Conversely, the $10,000 to $14,999 income bracket is the least frequent group with only 3,459 families (2.6%) belonging to this category.
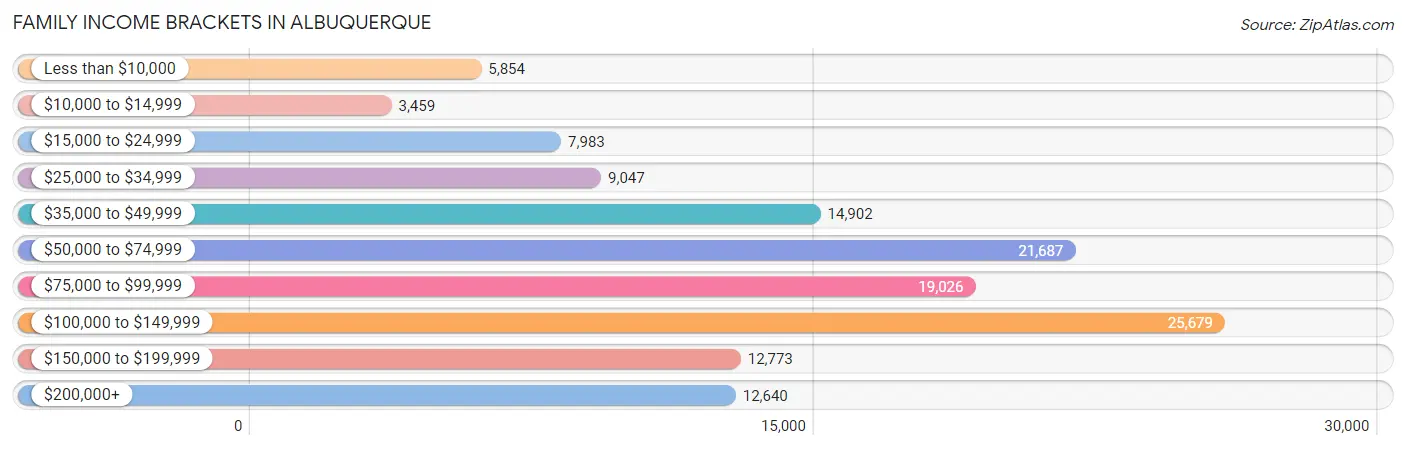
| Income Bracket | # Families | % Families |
| Less than $10,000 | 5,854 | 4.4% |
| $10,000 to $14,999 | 3,459 | 2.6% |
| $15,000 to $24,999 | 7,983 | 6.0% |
| $25,000 to $34,999 | 9,047 | 6.8% |
| $35,000 to $49,999 | 14,902 | 11.2% |
| $50,000 to $74,999 | 21,687 | 16.3% |
| $75,000 to $99,999 | 19,026 | 14.3% |
| $100,000 to $149,999 | 25,679 | 19.3% |
| $150,000 to $199,999 | 12,773 | 9.6% |
| $200,000+ | 12,640 | 9.5% |
Family Income by Famaliy Size in Albuquerque
4-person families (20,888 | 15.7%) account for the highest median family income in Albuquerque with $101,706 per family, while 2-person families (67,970 | 51.1%) have the highest median income of $36,600 per family member.
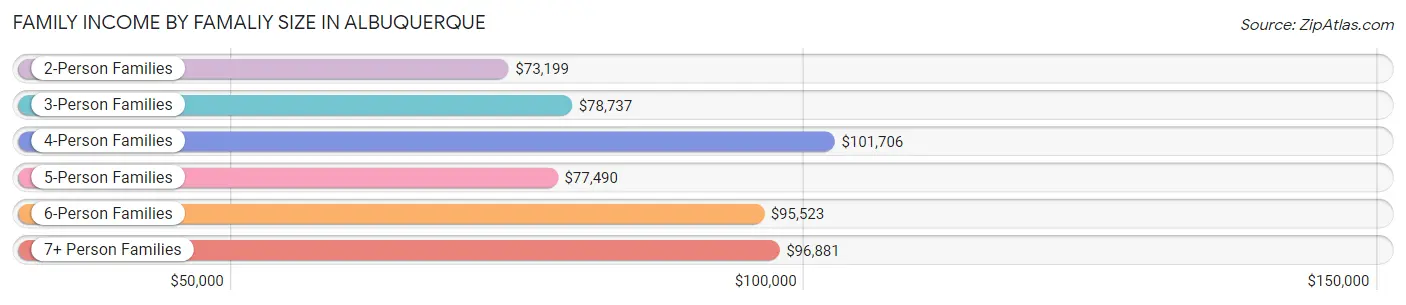
| Income Bracket | # Families | Median Income |
| 2-Person Families | 67,970 (51.1%) | $73,199 |
| 3-Person Families | 29,742 (22.4%) | $78,737 |
| 4-Person Families | 20,888 (15.7%) | $101,706 |
| 5-Person Families | 10,580 (8.0%) | $77,490 |
| 6-Person Families | 2,549 (1.9%) | $95,523 |
| 7+ Person Families | 1,322 (1.0%) | $96,881 |
| Total | 133,051 (100.0%) | $78,926 |
Family Income by Number of Earners in Albuquerque
The median family income in Albuquerque is $78,926, with families comprising 3+ earners (11,701) having the highest median family income of $124,139, while families with no earners (20,062) have the lowest median family income of $48,225, accounting for 8.8% and 15.1% of families, respectively.
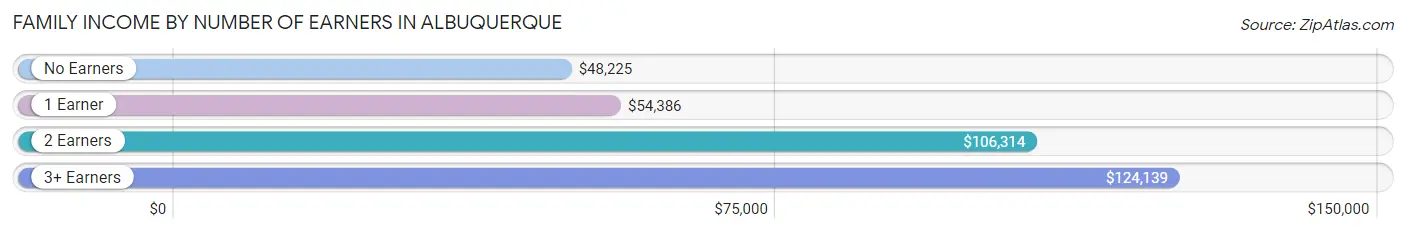
| Number of Earners | # Families | Median Income |
| No Earners | 20,062 (15.1%) | $48,225 |
| 1 Earner | 47,978 (36.1%) | $54,386 |
| 2 Earners | 53,310 (40.1%) | $106,314 |
| 3+ Earners | 11,701 (8.8%) | $124,139 |
| Total | 133,051 (100.0%) | $78,926 |
Household Income in Albuquerque
Household Income Brackets in Albuquerque
With 41,725 households falling in the category, the $50,000 to $74,999 income range is the most frequent in Albuquerque, accounting for 17.4% of all households. In contrast, only 11,510 households (4.8%) fall into the $10,000 to $14,999 income bracket, making it the least populous group.
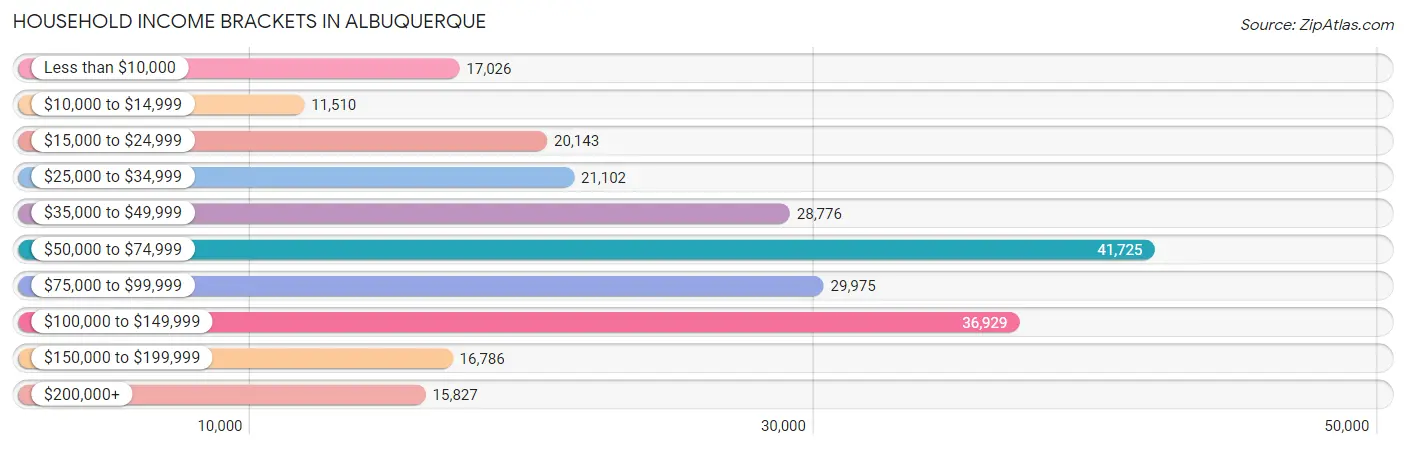
| Income Bracket | # Households | % Households |
| Less than $10,000 | 17,026 | 7.1% |
| $10,000 to $14,999 | 11,510 | 4.8% |
| $15,000 to $24,999 | 20,143 | 8.4% |
| $25,000 to $34,999 | 21,102 | 8.8% |
| $35,000 to $49,999 | 28,776 | 12.0% |
| $50,000 to $74,999 | 41,725 | 17.4% |
| $75,000 to $99,999 | 29,975 | 12.5% |
| $100,000 to $149,999 | 36,929 | 15.4% |
| $150,000 to $199,999 | 16,786 | 7.0% |
| $200,000+ | 15,827 | 6.6% |
Household Income by Householder Age in Albuquerque
The median household income in Albuquerque is $61,503, with the highest median household income of $71,010 found in the 45 to 64 years age bracket for the primary householder. A total of 83,109 households (34.7%) fall into this category. Meanwhile, the 15 to 24 years age bracket for the primary householder has the lowest median household income of $33,288, with 11,787 households (4.9%) in this group.
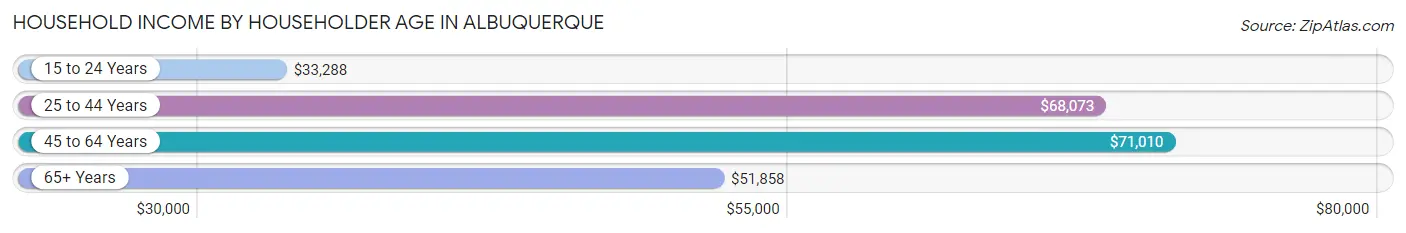
| Income Bracket | # Households | Median Income |
| 15 to 24 Years | 11,787 (4.9%) | $33,288 |
| 25 to 44 Years | 83,096 (34.6%) | $68,073 |
| 45 to 64 Years | 83,109 (34.7%) | $71,010 |
| 65+ Years | 61,808 (25.8%) | $51,858 |
| Total | 239,800 (100.0%) | $61,503 |
Poverty in Albuquerque
Income Below Poverty by Sex and Age in Albuquerque
With 15.6% poverty level for males and 17.3% for females among the residents of Albuquerque, 5 year old males and 18 to 24 year old females are the most vulnerable to poverty, with 886 males (27.8%) and 7,077 females (28.1%) in their respective age groups living below the poverty level.
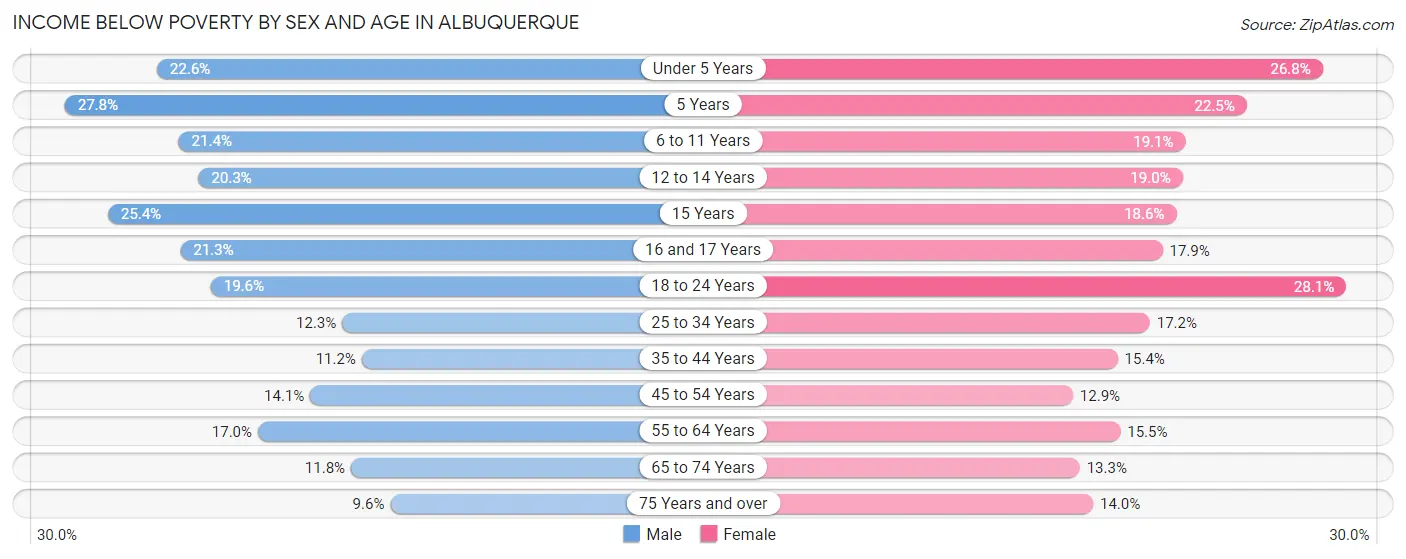
| Age Bracket | Male | Female |
| Under 5 Years | 3,329 (22.6%) | 3,811 (26.8%) |
| 5 Years | 886 (27.8%) | 622 (22.5%) |
| 6 to 11 Years | 4,219 (21.4%) | 3,655 (19.1%) |
| 12 to 14 Years | 2,249 (20.3%) | 1,899 (19.0%) |
| 15 Years | 918 (25.4%) | 647 (18.6%) |
| 16 and 17 Years | 1,608 (21.3%) | 1,237 (17.9%) |
| 18 to 24 Years | 5,190 (19.6%) | 7,077 (28.1%) |
| 25 to 34 Years | 5,323 (12.3%) | 7,199 (17.2%) |
| 35 to 44 Years | 4,265 (11.2%) | 5,865 (15.4%) |
| 45 to 54 Years | 4,581 (14.1%) | 4,321 (12.9%) |
| 55 to 64 Years | 5,611 (17.0%) | 5,678 (15.5%) |
| 65 to 74 Years | 2,990 (11.8%) | 3,975 (13.3%) |
| 75 Years and over | 1,435 (9.6%) | 3,031 (14.0%) |
| Total | 42,604 (15.6%) | 49,017 (17.3%) |
Income Above Poverty by Sex and Age in Albuquerque
According to the poverty statistics in Albuquerque, males aged 75 years and over and females aged 45 to 54 years are the age groups that are most secure financially, with 90.4% of males and 87.1% of females in these age groups living above the poverty line.
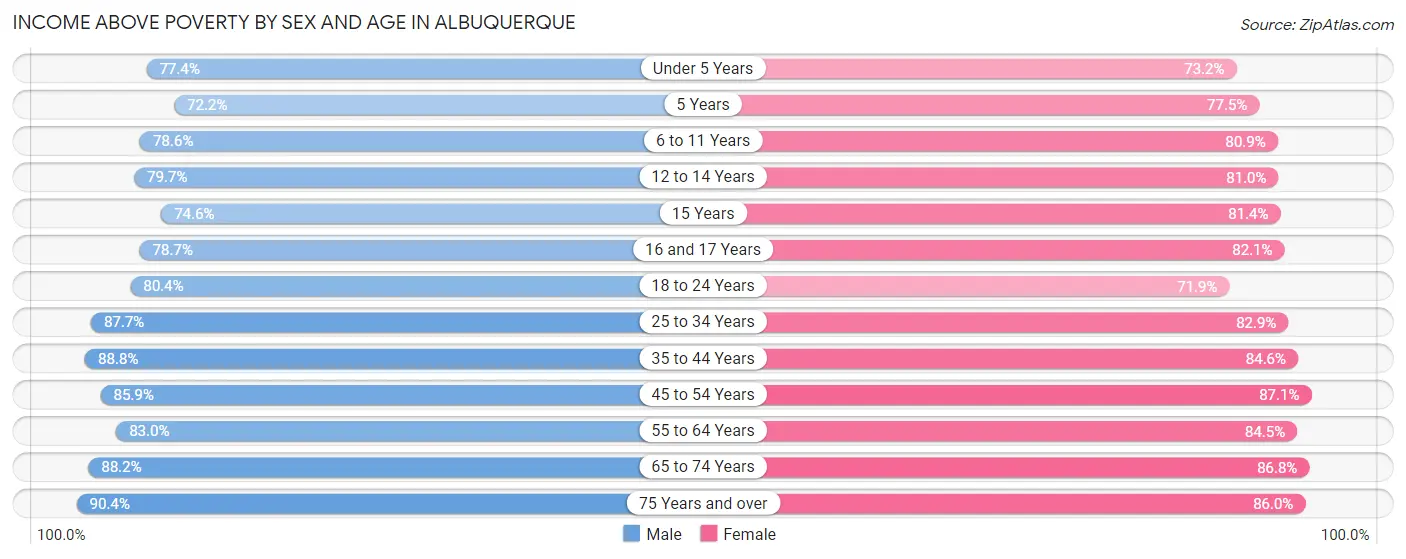
| Age Bracket | Male | Female |
| Under 5 Years | 11,383 (77.4%) | 10,426 (73.2%) |
| 5 Years | 2,306 (72.2%) | 2,137 (77.5%) |
| 6 to 11 Years | 15,474 (78.6%) | 15,447 (80.9%) |
| 12 to 14 Years | 8,820 (79.7%) | 8,111 (81.0%) |
| 15 Years | 2,702 (74.6%) | 2,827 (81.4%) |
| 16 and 17 Years | 5,930 (78.7%) | 5,688 (82.1%) |
| 18 to 24 Years | 21,252 (80.4%) | 18,129 (71.9%) |
| 25 to 34 Years | 37,896 (87.7%) | 34,770 (82.9%) |
| 35 to 44 Years | 33,697 (88.8%) | 32,308 (84.6%) |
| 45 to 54 Years | 27,900 (85.9%) | 29,263 (87.1%) |
| 55 to 64 Years | 27,381 (83.0%) | 30,935 (84.5%) |
| 65 to 74 Years | 22,283 (88.2%) | 26,024 (86.8%) |
| 75 Years and over | 13,447 (90.4%) | 18,637 (86.0%) |
| Total | 230,471 (84.4%) | 234,702 (82.7%) |
Income Below Poverty Among Married-Couple Families in Albuquerque
The poverty statistics for married-couple families in Albuquerque show that 6.6% or 5,584 of the total 84,883 families live below the poverty line. Families with 5 or more children have the highest poverty rate of 27.5%, comprising of 137 families. On the other hand, families with no children have the lowest poverty rate of 5.4%, which includes 2,795 families.
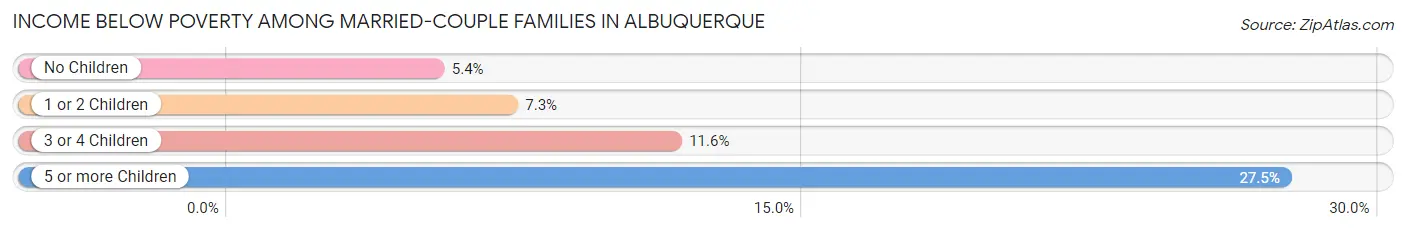
| Children | Above Poverty | Below Poverty |
| No Children | 48,944 (94.6%) | 2,795 (5.4%) |
| 1 or 2 Children | 24,589 (92.7%) | 1,943 (7.3%) |
| 3 or 4 Children | 5,405 (88.4%) | 709 (11.6%) |
| 5 or more Children | 361 (72.5%) | 137 (27.5%) |
| Total | 79,299 (93.4%) | 5,584 (6.6%) |
Income Below Poverty Among Single-Parent Households in Albuquerque
According to the poverty data in Albuquerque, 16.6% or 2,366 single-father households and 23.2% or 7,848 single-mother households are living below the poverty line. Among single-father households, those with 5 or more children have the highest poverty rate, with 15 households (100.0%) experiencing poverty. Likewise, among single-mother households, those with 5 or more children have the highest poverty rate, with 164 households (82.8%) falling below the poverty line.
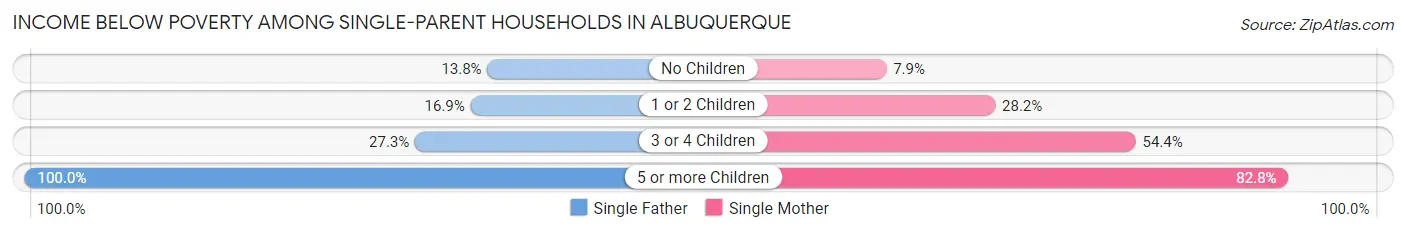
| Children | Single Father | Single Mother |
| No Children | 789 (13.8%) | 1,004 (7.9%) |
| 1 or 2 Children | 1,264 (16.9%) | 5,110 (28.2%) |
| 3 or 4 Children | 298 (27.3%) | 1,570 (54.4%) |
| 5 or more Children | 15 (100.0%) | 164 (82.8%) |
| Total | 2,366 (16.6%) | 7,848 (23.2%) |
Income Below Poverty Among Married-Couple vs Single-Parent Households in Albuquerque
The poverty data for Albuquerque shows that 5,584 of the married-couple family households (6.6%) and 10,214 of the single-parent households (21.2%) are living below the poverty level. Within the married-couple family households, those with 5 or more children have the highest poverty rate, with 137 households (27.5%) falling below the poverty line. Among the single-parent households, those with 5 or more children have the highest poverty rate, with 179 household (84.0%) living below poverty.
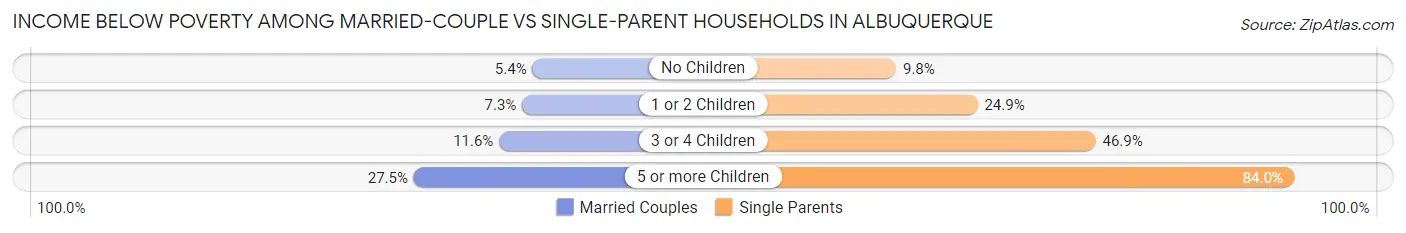
| Children | Married-Couple Families | Single-Parent Households |
| No Children | 2,795 (5.4%) | 1,793 (9.8%) |
| 1 or 2 Children | 1,943 (7.3%) | 6,374 (24.9%) |
| 3 or 4 Children | 709 (11.6%) | 1,868 (46.9%) |
| 5 or more Children | 137 (27.5%) | 179 (84.0%) |
| Total | 5,584 (6.6%) | 10,214 (21.2%) |
Race in Albuquerque
The most populous races in Albuquerque are White / Caucasian (341,186 | 60.7%), Hispanic or Latino (279,981 | 49.8%), and Two or more Races (102,071 | 18.1%).
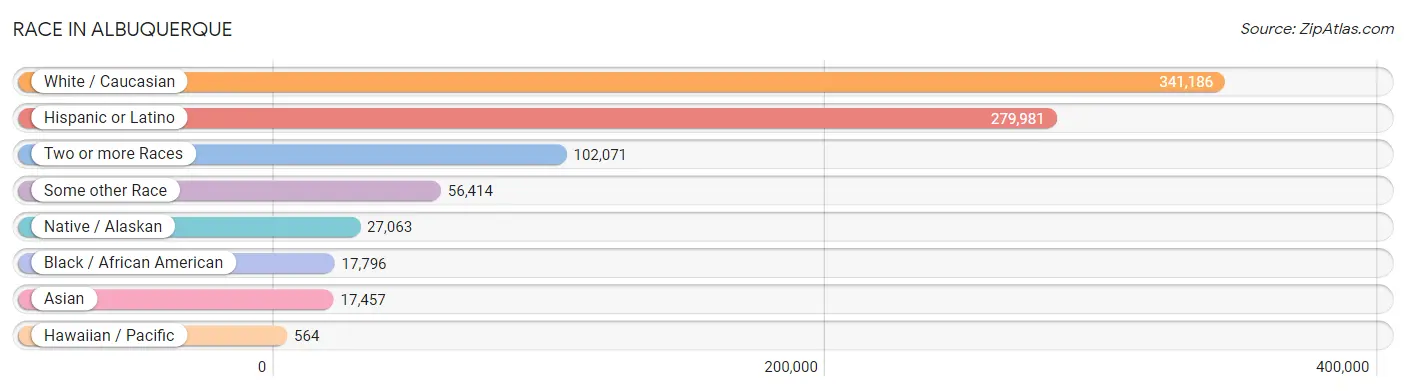
| Race | # Population | % Population |
| Asian | 17,457 | 3.1% |
| Black / African American | 17,796 | 3.2% |
| Hawaiian / Pacific | 564 | 0.1% |
| Hispanic or Latino | 279,981 | 49.8% |
| Native / Alaskan | 27,063 | 4.8% |
| White / Caucasian | 341,186 | 60.7% |
| Two or more Races | 102,071 | 18.1% |
| Some other Race | 56,414 | 10.0% |
| Total | 562,551 | 100.0% |
Ancestry in Albuquerque
The most populous ancestries reported in Albuquerque are Mexican (165,207 | 29.4%), German (51,787 | 9.2%), English (46,904 | 8.3%), Irish (43,304 | 7.7%), and Spaniard (26,665 | 4.7%), together accounting for 59.4% of all Albuquerque residents.
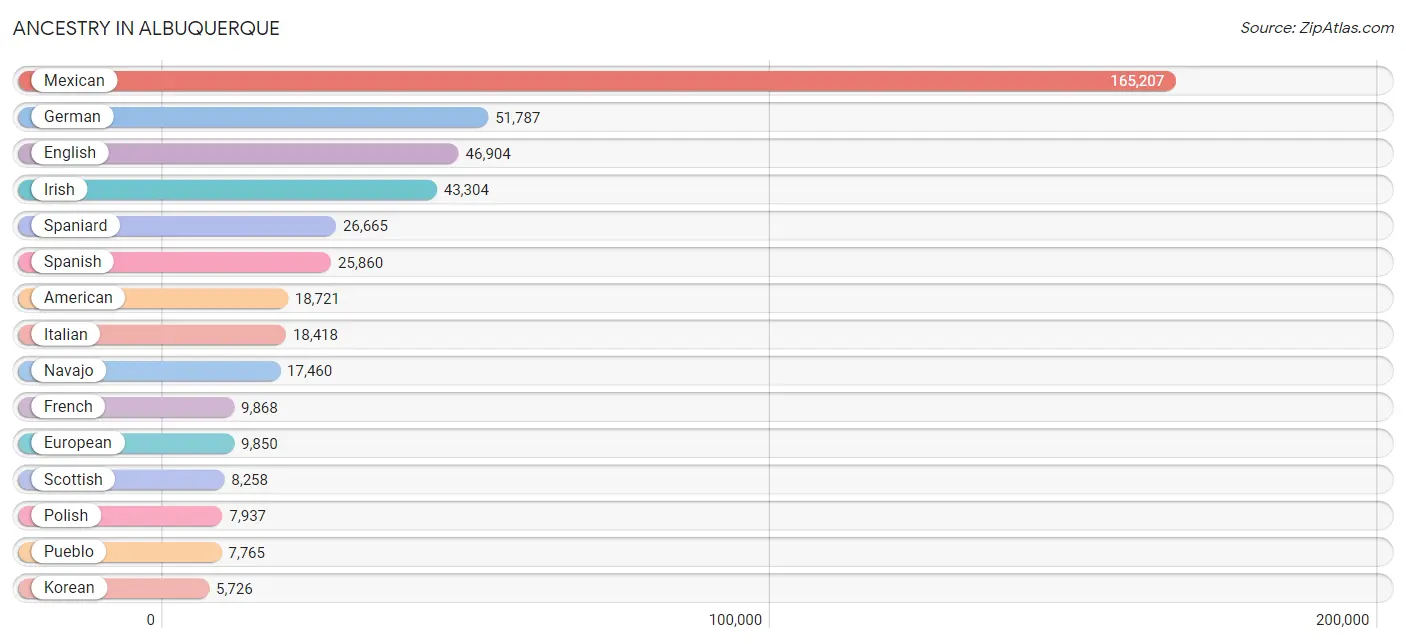
| Ancestry | # Population | % Population |
| Afghan | 227 | 0.0% |
| African | 1,790 | 0.3% |
| Alaska Native | 8 | 0.0% |
| Alaskan Athabascan | 210 | 0.0% |
| Albanian | 15 | 0.0% |
| American | 18,721 | 3.3% |
| Apache | 1,511 | 0.3% |
| Arab | 3,017 | 0.5% |
| Argentinean | 316 | 0.1% |
| Armenian | 150 | 0.0% |
| Australian | 88 | 0.0% |
| Austrian | 990 | 0.2% |
| Basque | 309 | 0.1% |
| Belgian | 572 | 0.1% |
| Belizean | 43 | 0.0% |
| Bhutanese | 2,395 | 0.4% |
| Blackfeet | 116 | 0.0% |
| Bolivian | 380 | 0.1% |
| Brazilian | 274 | 0.1% |
| British | 4,188 | 0.7% |
| British West Indian | 54 | 0.0% |
| Bulgarian | 97 | 0.0% |
| Burmese | 1,913 | 0.3% |
| Cajun | 139 | 0.0% |
| Cambodian | 54 | 0.0% |
| Canadian | 726 | 0.1% |
| Celtic | 239 | 0.0% |
| Central American | 2,538 | 0.4% |
| Central American Indian | 496 | 0.1% |
| Cherokee | 1,362 | 0.2% |
| Cheyenne | 112 | 0.0% |
| Chickasaw | 219 | 0.0% |
| Chilean | 218 | 0.0% |
| Chinese | 6 | 0.0% |
| Chippewa | 261 | 0.1% |
| Choctaw | 414 | 0.1% |
| Colombian | 1,707 | 0.3% |
| Comanche | 461 | 0.1% |
| Costa Rican | 77 | 0.0% |
| Cree | 19 | 0.0% |
| Creek | 114 | 0.0% |
| Croatian | 320 | 0.1% |
| Crow | 23 | 0.0% |
| Cuban | 2,612 | 0.5% |
| Cypriot | 11 | 0.0% |
| Czech | 1,518 | 0.3% |
| Czechoslovakian | 347 | 0.1% |
| Danish | 2,166 | 0.4% |
| Delaware | 8 | 0.0% |
| Dominican | 739 | 0.1% |
| Dutch | 5,115 | 0.9% |
| Dutch West Indian | 23 | 0.0% |
| Eastern European | 1,229 | 0.2% |
| Ecuadorian | 622 | 0.1% |
| Egyptian | 85 | 0.0% |
| English | 46,904 | 8.3% |
| Estonian | 24 | 0.0% |
| Ethiopian | 263 | 0.1% |
| European | 9,850 | 1.8% |
| Filipino | 200 | 0.0% |
| Finnish | 611 | 0.1% |
| French | 9,868 | 1.8% |
| French Canadian | 1,378 | 0.2% |
| German | 51,787 | 9.2% |
| German Russian | 20 | 0.0% |
| Ghanaian | 82 | 0.0% |
| Greek | 1,672 | 0.3% |
| Guamanian / Chamorro | 153 | 0.0% |
| Guatemalan | 684 | 0.1% |
| Guyanese | 122 | 0.0% |
| Haitian | 169 | 0.0% |
| Honduran | 218 | 0.0% |
| Hopi | 222 | 0.0% |
| Houma | 4 | 0.0% |
| Hungarian | 1,281 | 0.2% |
| Icelander | 46 | 0.0% |
| Indian (Asian) | 4,223 | 0.7% |
| Inupiat | 22 | 0.0% |
| Iranian | 733 | 0.1% |
| Iraqi | 394 | 0.1% |
| Irish | 43,304 | 7.7% |
| Iroquois | 174 | 0.0% |
| Israeli | 54 | 0.0% |
| Italian | 18,418 | 3.3% |
| Jamaican | 343 | 0.1% |
| Japanese | 158 | 0.0% |
| Jordanian | 124 | 0.0% |
| Kenyan | 54 | 0.0% |
| Kiowa | 246 | 0.0% |
| Korean | 5,726 | 1.0% |
| Laotian | 195 | 0.0% |
| Latvian | 95 | 0.0% |
| Lebanese | 881 | 0.2% |
| Liberian | 129 | 0.0% |
| Lithuanian | 480 | 0.1% |
| Lumbee | 22 | 0.0% |
| Luxembourger | 14 | 0.0% |
| Malaysian | 237 | 0.0% |
| Maltese | 1 | 0.0% |
| Mexican | 165,207 | 29.4% |
| Mexican American Indian | 1,865 | 0.3% |
| Mongolian | 4 | 0.0% |
| Moroccan | 85 | 0.0% |
| Native Hawaiian | 1,165 | 0.2% |
| Navajo | 17,460 | 3.1% |
| New Zealander | 67 | 0.0% |
| Nicaraguan | 341 | 0.1% |
| Nigerian | 608 | 0.1% |
| Northern European | 2,224 | 0.4% |
| Norwegian | 4,270 | 0.8% |
| Osage | 102 | 0.0% |
| Paiute | 6 | 0.0% |
| Pakistani | 569 | 0.1% |
| Palestinian | 357 | 0.1% |
| Panamanian | 170 | 0.0% |
| Pennsylvania German | 118 | 0.0% |
| Peruvian | 717 | 0.1% |
| Pima | 176 | 0.0% |
| Polish | 7,937 | 1.4% |
| Portuguese | 1,826 | 0.3% |
| Potawatomi | 162 | 0.0% |
| Pueblo | 7,765 | 1.4% |
| Puerto Rican | 3,726 | 0.7% |
| Romanian | 433 | 0.1% |
| Russian | 3,271 | 0.6% |
| Salvadoran | 1,042 | 0.2% |
| Samoan | 181 | 0.0% |
| Scandinavian | 2,443 | 0.4% |
| Scotch-Irish | 4,891 | 0.9% |
| Scottish | 8,258 | 1.5% |
| Seminole | 22 | 0.0% |
| Serbian | 145 | 0.0% |
| Shoshone | 10 | 0.0% |
| Sioux | 329 | 0.1% |
| Slavic | 225 | 0.0% |
| Slovak | 573 | 0.1% |
| Slovene | 219 | 0.0% |
| South African | 69 | 0.0% |
| South American | 4,428 | 0.8% |
| South American Indian | 153 | 0.0% |
| Spaniard | 26,665 | 4.7% |
| Spanish | 25,860 | 4.6% |
| Spanish American | 2,392 | 0.4% |
| Spanish American Indian | 154 | 0.0% |
| Sri Lankan | 4,588 | 0.8% |
| Subsaharan African | 3,782 | 0.7% |
| Sudanese | 29 | 0.0% |
| Swedish | 5,150 | 0.9% |
| Swiss | 1,142 | 0.2% |
| Syrian | 120 | 0.0% |
| Thai | 3,495 | 0.6% |
| Tlingit-Haida | 58 | 0.0% |
| Tohono O'Odham | 60 | 0.0% |
| Trinidadian and Tobagonian | 16 | 0.0% |
| Tsimshian | 30 | 0.0% |
| Turkish | 305 | 0.1% |
| U.S. Virgin Islander | 16 | 0.0% |
| Ugandan | 31 | 0.0% |
| Ukrainian | 1,074 | 0.2% |
| Ute | 36 | 0.0% |
| Venezuelan | 438 | 0.1% |
| Vietnamese | 581 | 0.1% |
| Welsh | 3,282 | 0.6% |
| West Indian | 106 | 0.0% |
| Yaqui | 49 | 0.0% |
| Yugoslavian | 166 | 0.0% |
| Yuman | 4 | 0.0% |
| Zimbabwean | 75 | 0.0% | View All 168 Rows |
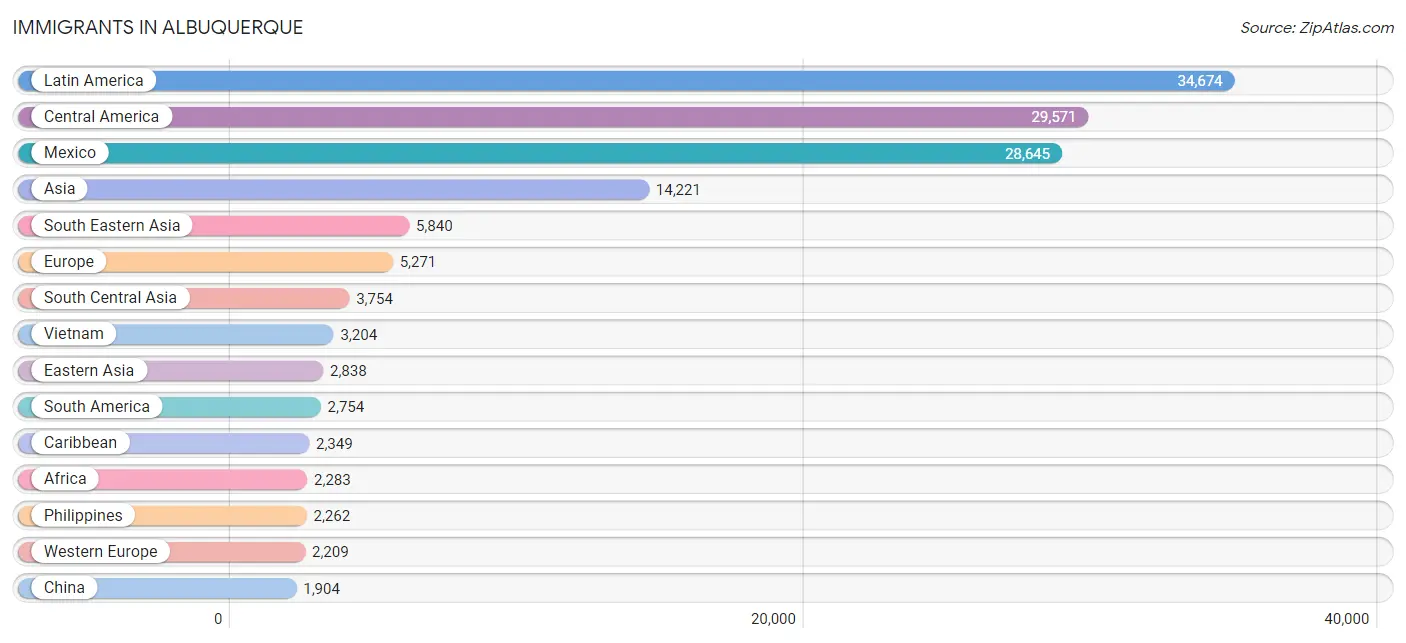
Immigrants in Albuquerque
The most numerous immigrant groups reported in Albuquerque came from Latin America (34,674 | 6.2%), Central America (29,571 | 5.3%), Mexico (28,645 | 5.1%), Asia (14,221 | 2.5%), and South Eastern Asia (5,840 | 1.0%), together accounting for 20.1% of all Albuquerque residents.
| Immigration Origin | # Population | % Population |
| Afghanistan | 299 | 0.1% |
| Africa | 2,283 | 0.4% |
| Argentina | 187 | 0.0% |
| Armenia | 18 | 0.0% |
| Asia | 14,221 | 2.5% |
| Australia | 137 | 0.0% |
| Austria | 72 | 0.0% |
| Bangladesh | 247 | 0.0% |
| Belarus | 2 | 0.0% |
| Belgium | 79 | 0.0% |
| Bolivia | 188 | 0.0% |
| Bosnia and Herzegovina | 11 | 0.0% |
| Brazil | 243 | 0.0% |
| Bulgaria | 51 | 0.0% |
| Cambodia | 33 | 0.0% |
| Cameroon | 34 | 0.0% |
| Canada | 674 | 0.1% |
| Caribbean | 2,349 | 0.4% |
| Central America | 29,571 | 5.3% |
| Chile | 31 | 0.0% |
| China | 1,904 | 0.3% |
| Colombia | 846 | 0.2% |
| Congo | 51 | 0.0% |
| Costa Rica | 41 | 0.0% |
| Cuba | 1,761 | 0.3% |
| Czechoslovakia | 20 | 0.0% |
| Dominica | 40 | 0.0% |
| Dominican Republic | 221 | 0.0% |
| Eastern Africa | 889 | 0.2% |
| Eastern Asia | 2,838 | 0.5% |
| Eastern Europe | 1,028 | 0.2% |
| Ecuador | 343 | 0.1% |
| Egypt | 38 | 0.0% |
| El Salvador | 275 | 0.1% |
| England | 419 | 0.1% |
| Eritrea | 15 | 0.0% |
| Ethiopia | 147 | 0.0% |
| Europe | 5,271 | 0.9% |
| Fiji | 14 | 0.0% |
| France | 367 | 0.1% |
| Germany | 1,546 | 0.3% |
| Ghana | 78 | 0.0% |
| Greece | 290 | 0.1% |
| Guatemala | 370 | 0.1% |
| Guyana | 114 | 0.0% |
| Haiti | 55 | 0.0% |
| Honduras | 104 | 0.0% |
| Hong Kong | 85 | 0.0% |
| Hungary | 8 | 0.0% |
| India | 1,668 | 0.3% |
| Indonesia | 71 | 0.0% |
| Iran | 602 | 0.1% |
| Iraq | 532 | 0.1% |
| Ireland | 40 | 0.0% |
| Israel | 200 | 0.0% |
| Italy | 233 | 0.0% |
| Jamaica | 49 | 0.0% |
| Japan | 398 | 0.1% |
| Jordan | 319 | 0.1% |
| Kazakhstan | 48 | 0.0% |
| Kenya | 153 | 0.0% |
| Korea | 536 | 0.1% |
| Kuwait | 22 | 0.0% |
| Laos | 68 | 0.0% |
| Latin America | 34,674 | 6.2% |
| Lebanon | 190 | 0.0% |
| Liberia | 110 | 0.0% |
| Malaysia | 53 | 0.0% |
| Mexico | 28,645 | 5.1% |
| Micronesia | 141 | 0.0% |
| Middle Africa | 343 | 0.1% |
| Moldova | 22 | 0.0% |
| Morocco | 93 | 0.0% |
| Nepal | 301 | 0.1% |
| Netherlands | 83 | 0.0% |
| Nicaragua | 73 | 0.0% |
| Nigeria | 522 | 0.1% |
| Northern Africa | 185 | 0.0% |
| Northern Europe | 1,198 | 0.2% |
| Norway | 28 | 0.0% |
| Oceania | 349 | 0.1% |
| Pakistan | 378 | 0.1% |
| Panama | 63 | 0.0% |
| Peru | 517 | 0.1% |
| Philippines | 2,262 | 0.4% |
| Poland | 60 | 0.0% |
| Portugal | 32 | 0.0% |
| Romania | 221 | 0.0% |
| Russia | 392 | 0.1% |
| Saudi Arabia | 67 | 0.0% |
| Scotland | 79 | 0.0% |
| Serbia | 13 | 0.0% |
| Singapore | 4 | 0.0% |
| South Africa | 145 | 0.0% |
| South America | 2,754 | 0.5% |
| South Central Asia | 3,754 | 0.7% |
| South Eastern Asia | 5,840 | 1.0% |
| Southern Europe | 836 | 0.2% |
| Spain | 281 | 0.1% |
| Sri Lanka | 39 | 0.0% |
| St. Vincent and the Grenadines | 9 | 0.0% |
| Sudan | 29 | 0.0% |
| Sweden | 41 | 0.0% |
| Switzerland | 62 | 0.0% |
| Syria | 122 | 0.0% |
| Taiwan | 355 | 0.1% |
| Thailand | 145 | 0.0% |
| Trinidad and Tobago | 43 | 0.0% |
| Turkey | 209 | 0.0% |
| Uganda | 23 | 0.0% |
| Ukraine | 176 | 0.0% |
| Uruguay | 8 | 0.0% |
| Uzbekistan | 121 | 0.0% |
| Venezuela | 263 | 0.1% |
| Vietnam | 3,204 | 0.6% |
| West Indies | 100 | 0.0% |
| Western Africa | 713 | 0.1% |
| Western Asia | 1,702 | 0.3% |
| Western Europe | 2,209 | 0.4% |
| Zaire | 238 | 0.0% |
| Zimbabwe | 35 | 0.0% | View All 121 Rows |
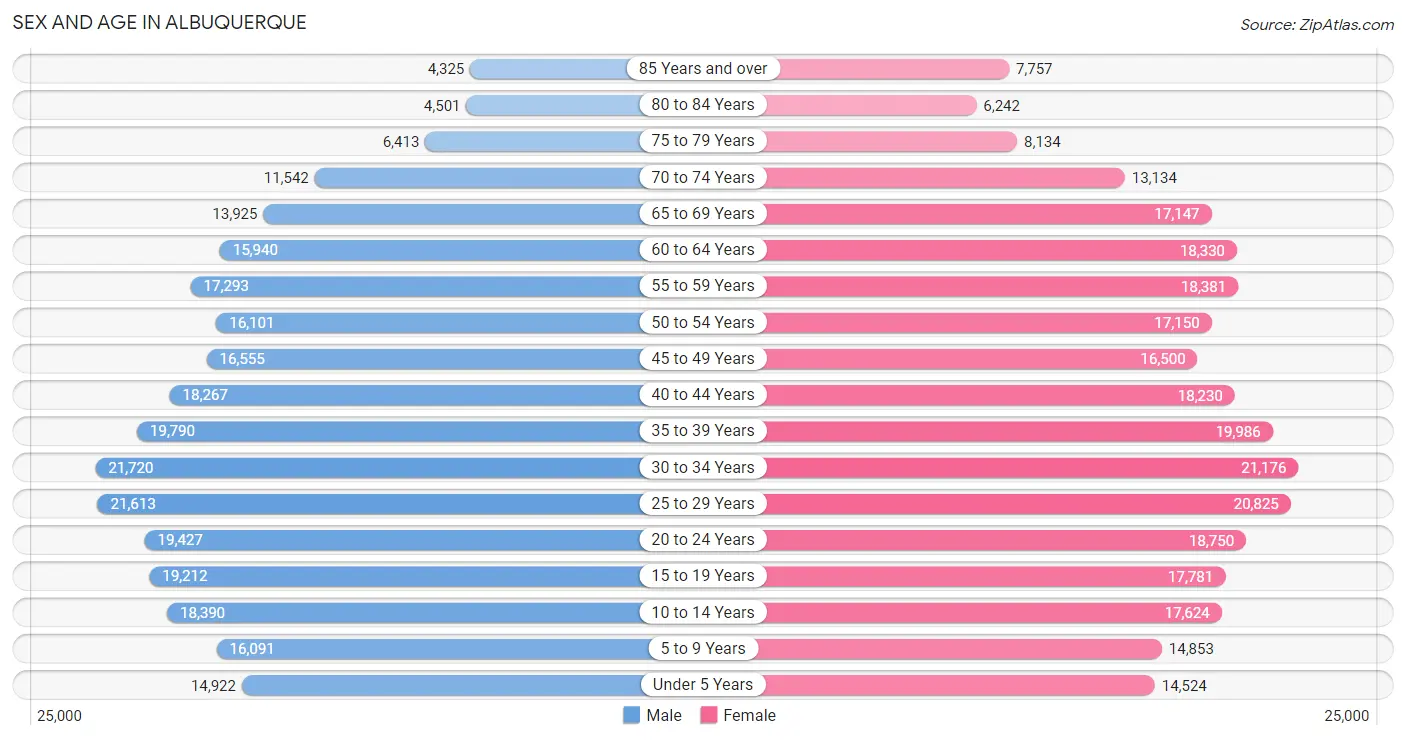
Sex and Age in Albuquerque
Sex and Age in Albuquerque
The most populous age groups in Albuquerque are 30 to 34 Years (21,720 | 7.9%) for men and 30 to 34 Years (21,176 | 7.4%) for women.
| Age Bracket | Male | Female |
| Under 5 Years | 14,922 (5.4%) | 14,524 (5.1%) |
| 5 to 9 Years | 16,091 (5.8%) | 14,853 (5.2%) |
| 10 to 14 Years | 18,390 (6.7%) | 17,624 (6.1%) |
| 15 to 19 Years | 19,212 (7.0%) | 17,781 (6.2%) |
| 20 to 24 Years | 19,427 (7.0%) | 18,750 (6.5%) |
| 25 to 29 Years | 21,613 (7.8%) | 20,825 (7.3%) |
| 30 to 34 Years | 21,720 (7.9%) | 21,176 (7.4%) |
| 35 to 39 Years | 19,790 (7.2%) | 19,986 (7.0%) |
| 40 to 44 Years | 18,267 (6.6%) | 18,230 (6.4%) |
| 45 to 49 Years | 16,555 (6.0%) | 16,500 (5.8%) |
| 50 to 54 Years | 16,101 (5.8%) | 17,150 (6.0%) |
| 55 to 59 Years | 17,293 (6.3%) | 18,381 (6.4%) |
| 60 to 64 Years | 15,940 (5.8%) | 18,330 (6.4%) |
| 65 to 69 Years | 13,925 (5.0%) | 17,147 (6.0%) |
| 70 to 74 Years | 11,542 (4.2%) | 13,134 (4.6%) |
| 75 to 79 Years | 6,413 (2.3%) | 8,134 (2.8%) |
| 80 to 84 Years | 4,501 (1.6%) | 6,242 (2.2%) |
| 85 Years and over | 4,325 (1.6%) | 7,757 (2.7%) |
| Total | 276,027 (100.0%) | 286,524 (100.0%) |
Families and Households in Albuquerque
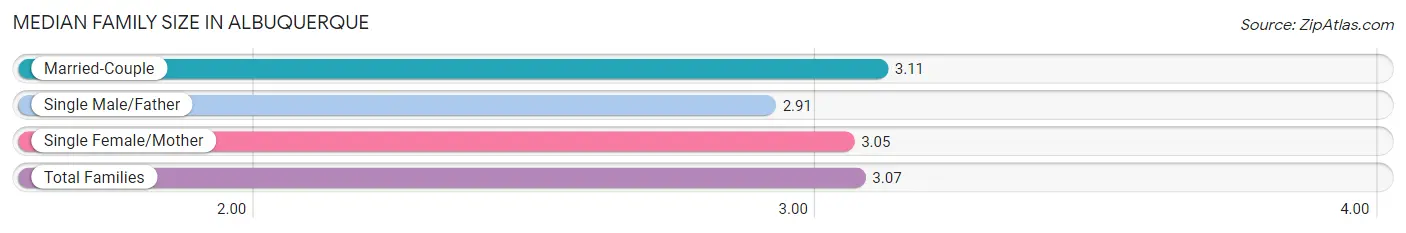
Median Family Size in Albuquerque
The median family size in Albuquerque is 3.07 persons per family, with married-couple families (84,883 | 63.8%) accounting for the largest median family size of 3.11 persons per family. On the other hand, single male/father families (14,298 | 10.7%) represent the smallest median family size with 2.91 persons per family.
| Family Type | # Families | Family Size |
| Married-Couple | 84,883 (63.8%) | 3.11 |
| Single Male/Father | 14,298 (10.7%) | 2.91 |
| Single Female/Mother | 33,870 (25.5%) | 3.05 |
| Total Families | 133,051 (100.0%) | 3.07 |
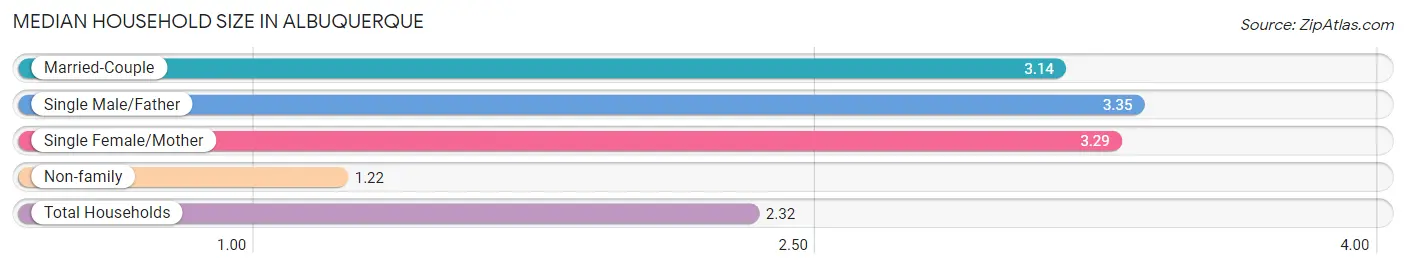
Median Household Size in Albuquerque
The median household size in Albuquerque is 2.32 persons per household, with single male/father households (14,298 | 6.0%) accounting for the largest median household size of 3.35 persons per household. non-family households (106,749 | 44.5%) represent the smallest median household size with 1.22 persons per household.
| Household Type | # Households | Household Size |
| Married-Couple | 84,883 (35.4%) | 3.14 |
| Single Male/Father | 14,298 (6.0%) | 3.35 |
| Single Female/Mother | 33,870 (14.1%) | 3.29 |
| Non-family | 106,749 (44.5%) | 1.22 |
| Total Households | 239,800 (100.0%) | 2.32 |
Household Size by Marriage Status in Albuquerque
Out of a total of 239,800 households in Albuquerque, 133,051 (55.5%) are family households, while 106,749 (44.5%) are nonfamily households. The most numerous type of family households are 2-person households, comprising 61,577, and the most common type of nonfamily households are 1-person households, comprising 88,354.
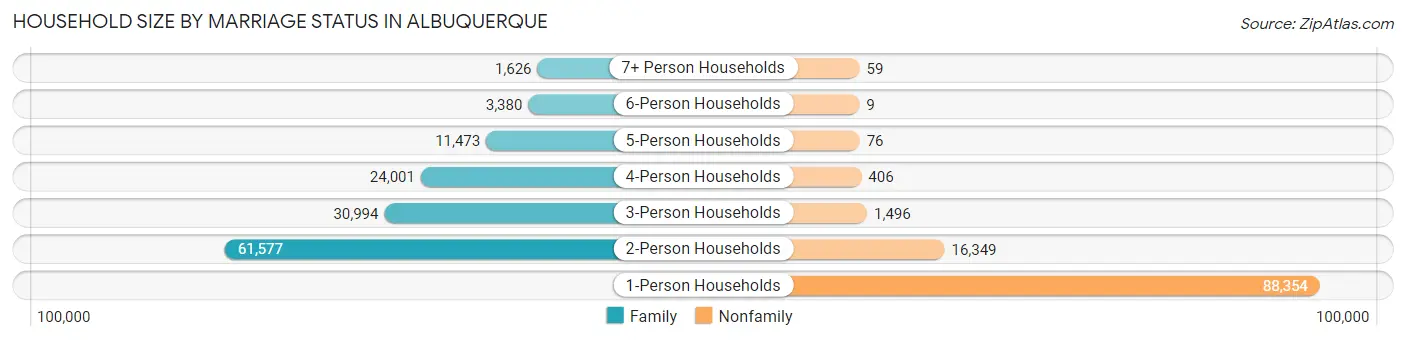
| Household Size | Family Households | Nonfamily Households |
| 1-Person Households | - | 88,354 (36.8%) |
| 2-Person Households | 61,577 (25.7%) | 16,349 (6.8%) |
| 3-Person Households | 30,994 (12.9%) | 1,496 (0.6%) |
| 4-Person Households | 24,001 (10.0%) | 406 (0.2%) |
| 5-Person Households | 11,473 (4.8%) | 76 (0.0%) |
| 6-Person Households | 3,380 (1.4%) | 9 (0.0%) |
| 7+ Person Households | 1,626 (0.7%) | 59 (0.0%) |
| Total | 133,051 (55.5%) | 106,749 (44.5%) |
Female Fertility in Albuquerque
Fertility by Age in Albuquerque
Average fertility rate in Albuquerque is 55.0 births per 1,000 women. Women in the age bracket of 20 to 34 years have the highest fertility rate with 87.0 births per 1,000 women. Women in the age bracket of 20 to 34 years acount for 70.8% of all women with births.
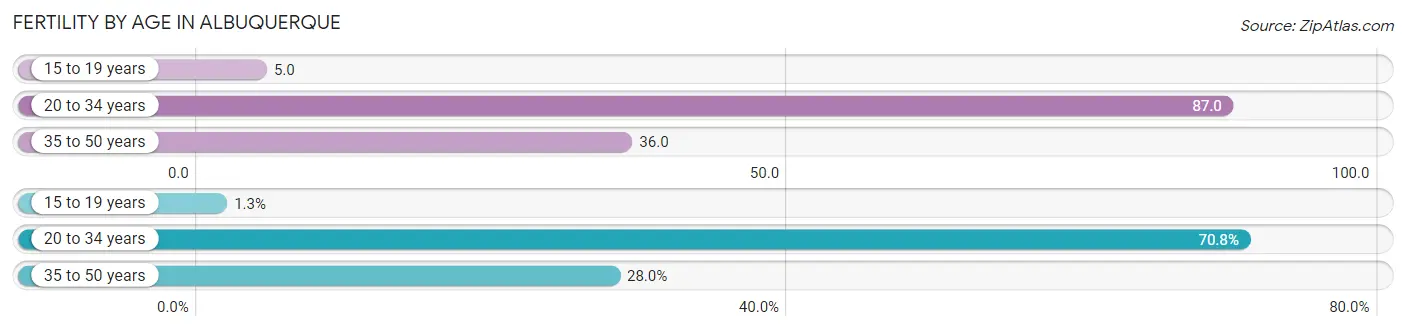
| Age Bracket | Women with Births | Births / 1,000 Women |
| 15 to 19 years | 97 (1.3%) | 5.0 |
| 20 to 34 years | 5,299 (70.8%) | 87.0 |
| 35 to 50 years | 2,094 (28.0%) | 36.0 |
| Total | 7,490 (100.0%) | 55.0 |
Fertility by Age by Marriage Status in Albuquerque
57.3% of women with births (7,490) in Albuquerque are married. The highest percentage of unmarried women with births falls into 15 to 19 years age bracket with 69.1% of them unmarried at the time of birth, while the lowest percentage of unmarried women with births belong to 35 to 50 years age bracket with 26.7% of them unmarried.
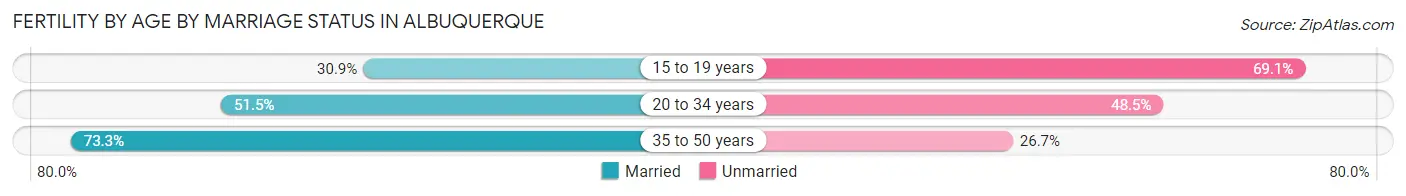
| Age Bracket | Married | Unmarried |
| 15 to 19 years | 30 (30.9%) | 67 (69.1%) |
| 20 to 34 years | 2,729 (51.5%) | 2,570 (48.5%) |
| 35 to 50 years | 1,535 (73.3%) | 559 (26.7%) |
| Total | 4,292 (57.3%) | 3,198 (42.7%) |
Fertility by Education in Albuquerque
Average fertility rate in Albuquerque is 55.0 births per 1,000 women. Women with the education attainment of bachelor's degree have the highest fertility rate of 69.0 births per 1,000 women, while women with the education attainment of less than high school have the lowest fertility at 40.0 births per 1,000 women. Women with the education attainment of college or associate's degree represent 30.1% of all women with births.
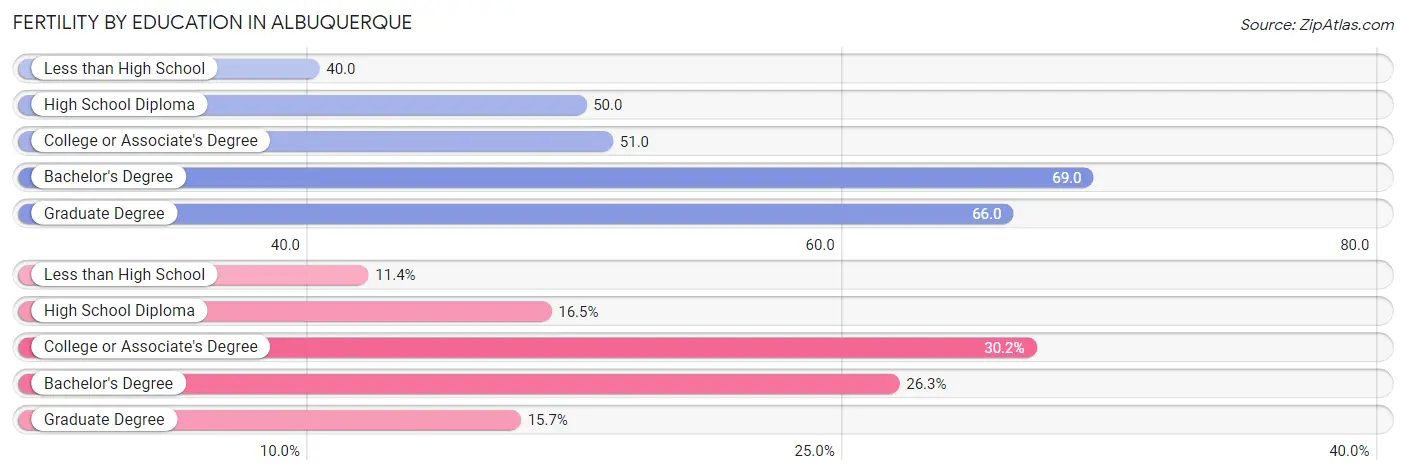
| Educational Attainment | Women with Births | Births / 1,000 Women |
| Less than High School | 852 (11.4%) | 40.0 |
| High School Diploma | 1,237 (16.5%) | 50.0 |
| College or Associate's Degree | 2,258 (30.1%) | 51.0 |
| Bachelor's Degree | 1,970 (26.3%) | 69.0 |
| Graduate Degree | 1,173 (15.7%) | 66.0 |
| Total | 7,490 (100.0%) | 55.0 |
Fertility by Education by Marriage Status in Albuquerque
42.7% of women with births in Albuquerque are unmarried. Women with the educational attainment of graduate degree are most likely to be married with 98.7% of them married at childbirth, while women with the educational attainment of less than high school are least likely to be married with 63.6% of them unmarried at childbirth.
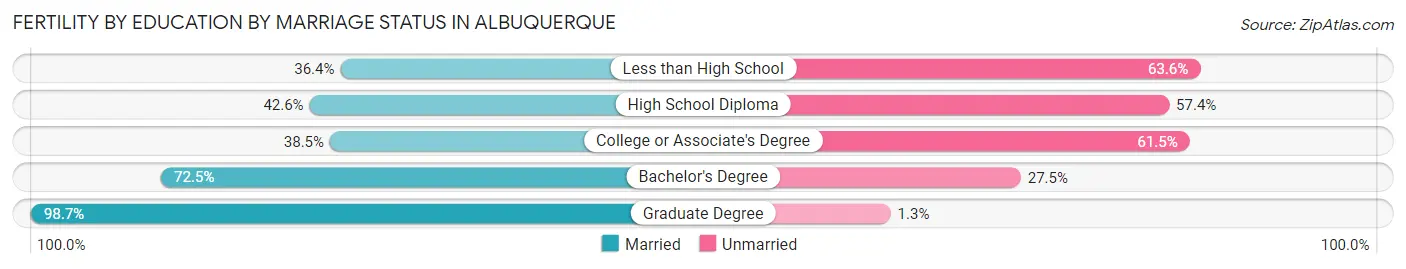
| Educational Attainment | Married | Unmarried |
| Less than High School | 310 (36.4%) | 542 (63.6%) |
| High School Diploma | 527 (42.6%) | 710 (57.4%) |
| College or Associate's Degree | 869 (38.5%) | 1,389 (61.5%) |
| Bachelor's Degree | 1,428 (72.5%) | 542 (27.5%) |
| Graduate Degree | 1,158 (98.7%) | 15 (1.3%) |
| Total | 4,292 (57.3%) | 3,198 (42.7%) |
Employment Characteristics in Albuquerque
Employment by Class of Employer in Albuquerque
Among the 274,404 employed individuals in Albuquerque, private company employees (162,773 | 59.3%), not-for-profit organizations (25,759 | 9.4%), and local government employees (21,480 | 7.8%) make up the most common classes of employment.
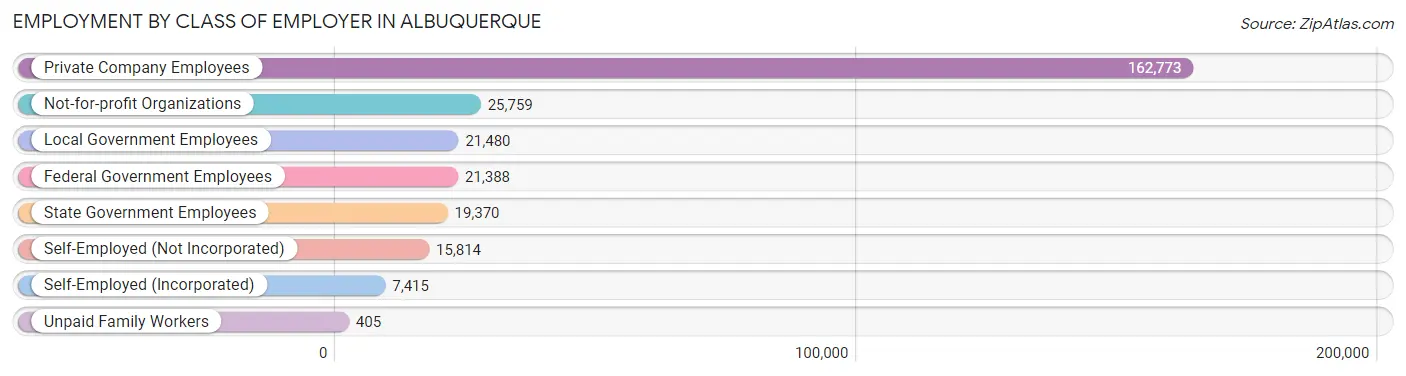
| Employer Class | # Employees | % Employees |
| Private Company Employees | 162,773 | 59.3% |
| Self-Employed (Incorporated) | 7,415 | 2.7% |
| Self-Employed (Not Incorporated) | 15,814 | 5.8% |
| Not-for-profit Organizations | 25,759 | 9.4% |
| Local Government Employees | 21,480 | 7.8% |
| State Government Employees | 19,370 | 7.1% |
| Federal Government Employees | 21,388 | 7.8% |
| Unpaid Family Workers | 405 | 0.2% |
| Total | 274,404 | 100.0% |
Employment Status by Age in Albuquerque
According to the labor force statistics for Albuquerque, out of the total population over 16 years of age (459,049), 64.2% or 294,709 individuals are in the labor force, with 5.5% or 16,209 of them unemployed. The age group with the highest labor force participation rate is 30 to 34 years, with 87.0% or 37,320 individuals in the labor force. Within the labor force, the 16 to 19 years age range has the highest percentage of unemployed individuals, with 12.6% or 1,605 of them being unemployed.
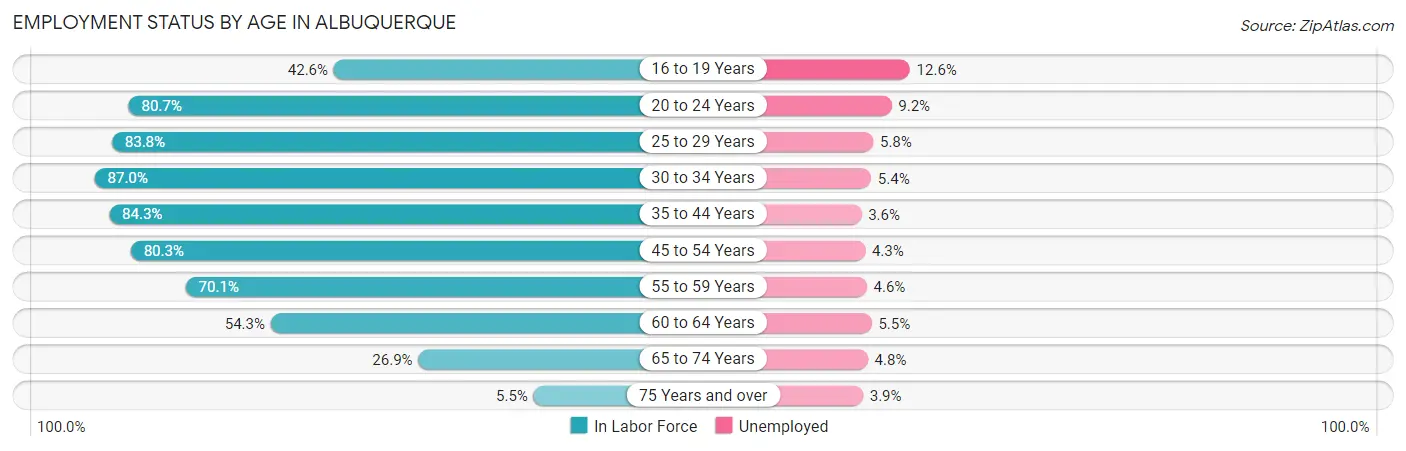
| Age Bracket | In Labor Force | Unemployed |
| 16 to 19 Years | 12,735 (42.6%) | 1,605 (12.6%) |
| 20 to 24 Years | 30,809 (80.7%) | 2,834 (9.2%) |
| 25 to 29 Years | 35,563 (83.8%) | 2,063 (5.8%) |
| 30 to 34 Years | 37,320 (87.0%) | 2,015 (5.4%) |
| 35 to 44 Years | 64,298 (84.3%) | 2,315 (3.6%) |
| 45 to 54 Years | 53,244 (80.3%) | 2,289 (4.3%) |
| 55 to 59 Years | 25,007 (70.1%) | 1,150 (4.6%) |
| 60 to 64 Years | 18,609 (54.3%) | 1,023 (5.5%) |
| 65 to 74 Years | 14,996 (26.9%) | 720 (4.8%) |
| 75 Years and over | 2,055 (5.5%) | 80 (3.9%) |
| Total | 294,709 (64.2%) | 16,209 (5.5%) |
Employment Status by Educational Attainment in Albuquerque
According to labor force statistics for Albuquerque, 78.6% of individuals (234,116) out of the total population between 25 and 64 years of age (297,857) are in the labor force, with 4.6% or 10,769 of them being unemployed. The group with the highest labor force participation rate are those with the educational attainment of bachelor's degree or higher, with 87.1% or 97,222 individuals in the labor force. Within the labor force, individuals with less than high school education have the highest percentage of unemployment, with 8.5% or 1,386 of them being unemployed.
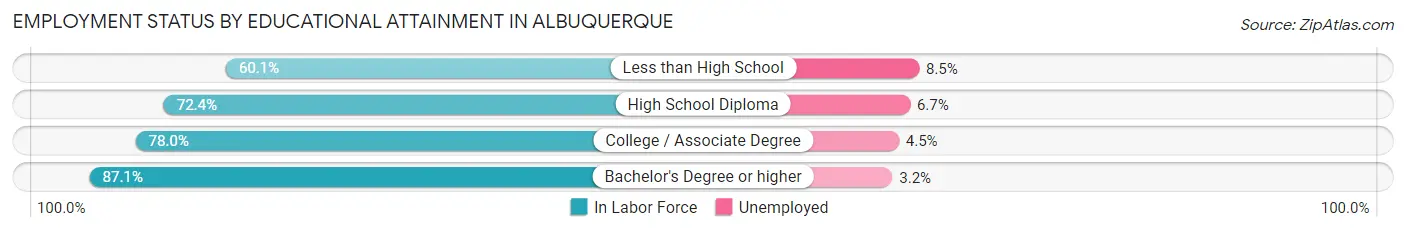
| Educational Attainment | In Labor Force | Unemployed |
| Less than High School | 16,305 (60.1%) | 2,306 (8.5%) |
| High School Diploma | 46,062 (72.4%) | 4,263 (6.7%) |
| College / Associate Degree | 74,478 (78.0%) | 4,297 (4.5%) |
| Bachelor's Degree or higher | 97,222 (87.1%) | 3,572 (3.2%) |
| Total | 234,116 (78.6%) | 13,701 (4.6%) |
Employment Occupations by Sex in Albuquerque
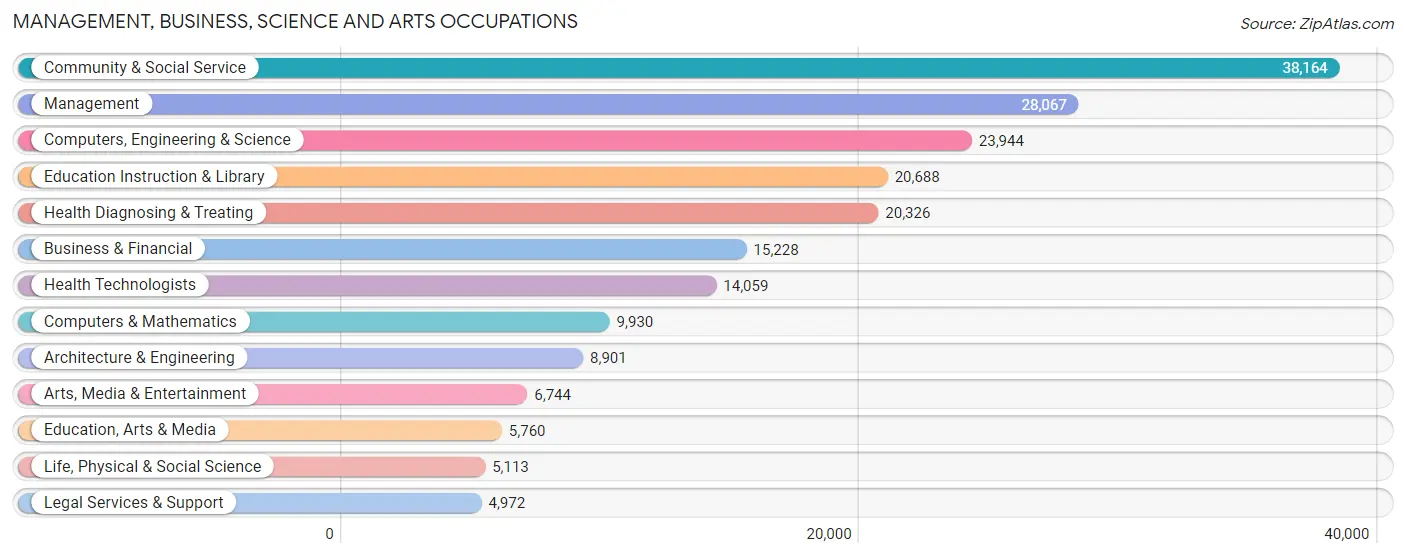
Management, Business, Science and Arts Occupations
The most common Management, Business, Science and Arts occupations in Albuquerque are Community & Social Service (38,164 | 13.8%), Management (28,067 | 10.2%), Computers, Engineering & Science (23,944 | 8.7%), Education Instruction & Library (20,688 | 7.5%), and Health Diagnosing & Treating (20,326 | 7.4%).
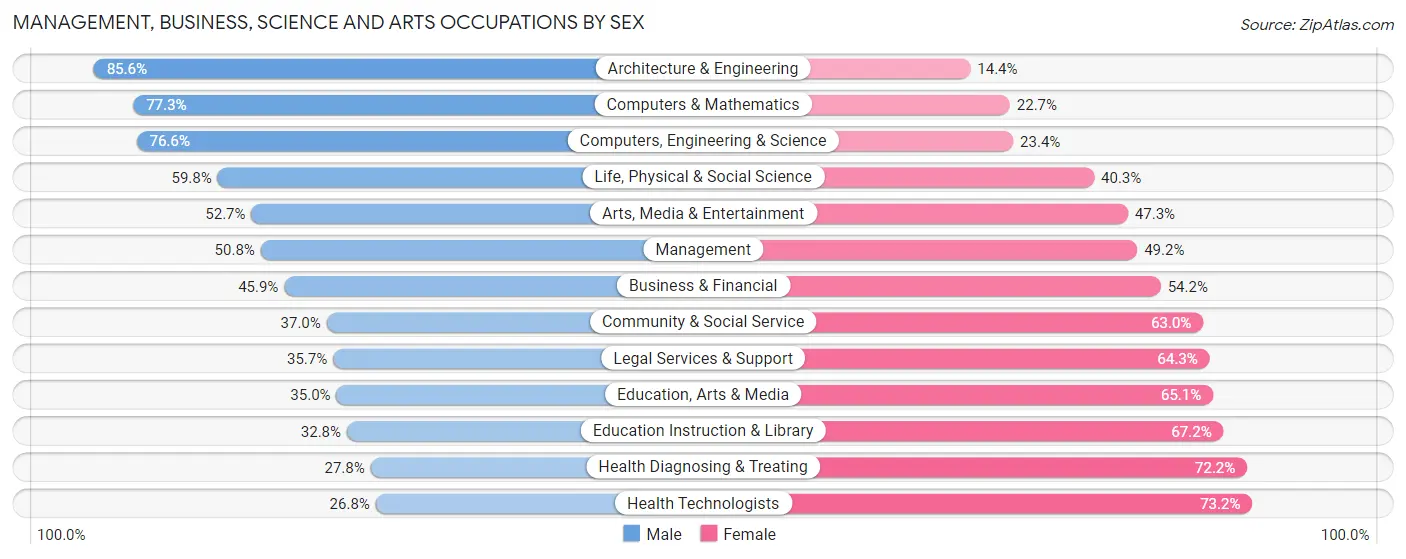
Management, Business, Science and Arts Occupations by Sex
Within the Management, Business, Science and Arts occupations in Albuquerque, the most male-oriented occupations are Architecture & Engineering (85.6%), Computers & Mathematics (77.3%), and Computers, Engineering & Science (76.6%), while the most female-oriented occupations are Health Technologists (73.2%), Health Diagnosing & Treating (72.2%), and Education Instruction & Library (67.2%).
| Occupation | Male | Female |
| Management | 14,248 (50.8%) | 13,819 (49.2%) |
| Business & Financial | 6,982 (45.9%) | 8,246 (54.1%) |
| Computers, Engineering & Science | 18,351 (76.6%) | 5,593 (23.4%) |
| Computers & Mathematics | 7,679 (77.3%) | 2,251 (22.7%) |
| Architecture & Engineering | 7,617 (85.6%) | 1,284 (14.4%) |
| Life, Physical & Social Science | 3,055 (59.8%) | 2,058 (40.3%) |
| Community & Social Service | 14,120 (37.0%) | 24,044 (63.0%) |
| Education, Arts & Media | 2,013 (34.9%) | 3,747 (65.0%) |
| Legal Services & Support | 1,773 (35.7%) | 3,199 (64.3%) |
| Education Instruction & Library | 6,780 (32.8%) | 13,908 (67.2%) |
| Arts, Media & Entertainment | 3,554 (52.7%) | 3,190 (47.3%) |
| Health Diagnosing & Treating | 5,658 (27.8%) | 14,668 (72.2%) |
| Health Technologists | 3,763 (26.8%) | 10,296 (73.2%) |
| Total (Category) | 59,359 (47.2%) | 66,370 (52.8%) |
| Total (Overall) | 141,658 (51.3%) | 134,665 (48.7%) |
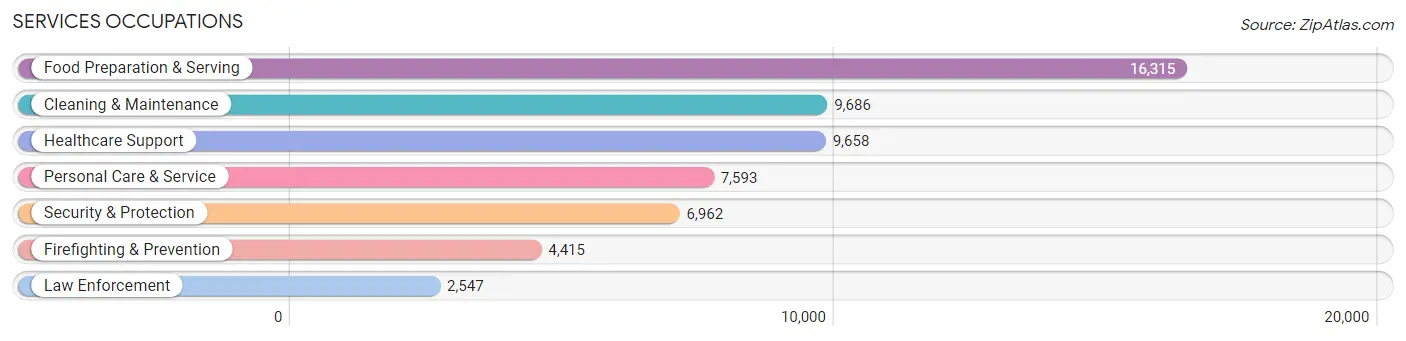
Services Occupations
The most common Services occupations in Albuquerque are Food Preparation & Serving (16,315 | 5.9%), Cleaning & Maintenance (9,686 | 3.5%), Healthcare Support (9,658 | 3.5%), Personal Care & Service (7,593 | 2.8%), and Security & Protection (6,962 | 2.5%).
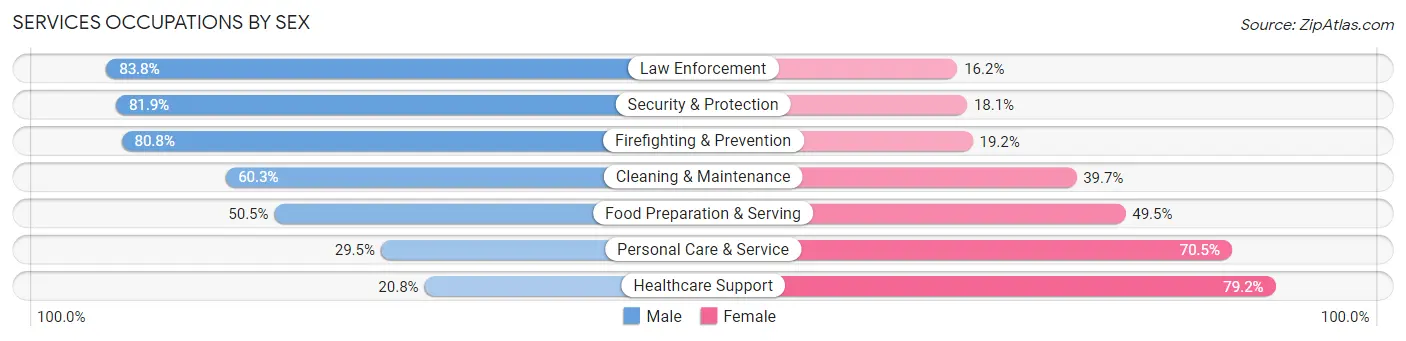
Services Occupations by Sex
Within the Services occupations in Albuquerque, the most male-oriented occupations are Law Enforcement (83.8%), Security & Protection (81.9%), and Firefighting & Prevention (80.8%), while the most female-oriented occupations are Healthcare Support (79.2%), Personal Care & Service (70.5%), and Food Preparation & Serving (49.5%).
| Occupation | Male | Female |
| Healthcare Support | 2,012 (20.8%) | 7,646 (79.2%) |
| Security & Protection | 5,702 (81.9%) | 1,260 (18.1%) |
| Firefighting & Prevention | 3,567 (80.8%) | 848 (19.2%) |
| Law Enforcement | 2,135 (83.8%) | 412 (16.2%) |
| Food Preparation & Serving | 8,246 (50.5%) | 8,069 (49.5%) |
| Cleaning & Maintenance | 5,838 (60.3%) | 3,848 (39.7%) |
| Personal Care & Service | 2,237 (29.5%) | 5,356 (70.5%) |
| Total (Category) | 24,035 (47.9%) | 26,179 (52.1%) |
| Total (Overall) | 141,658 (51.3%) | 134,665 (48.7%) |
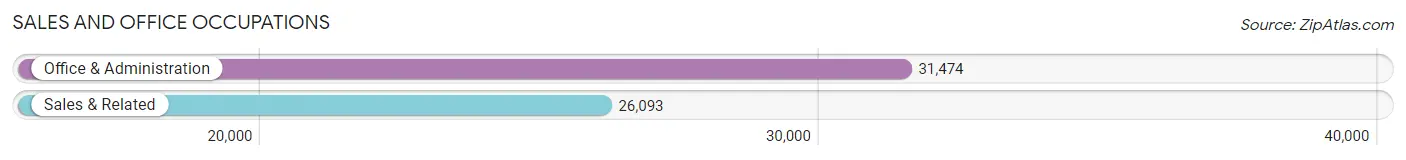
Sales and Office Occupations
The most common Sales and Office occupations in Albuquerque are Office & Administration (31,474 | 11.4%), and Sales & Related (26,093 | 9.4%).
Sales and Office Occupations by Sex
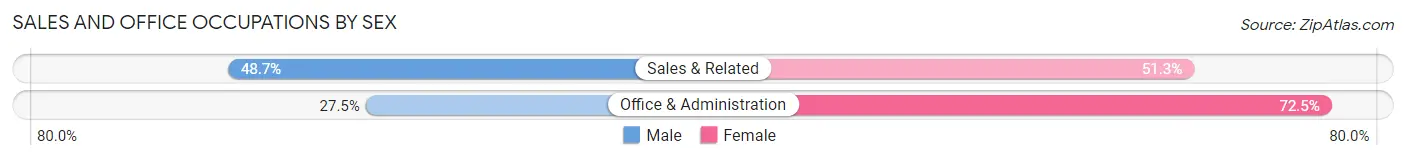
| Occupation | Male | Female |
| Sales & Related | 12,709 (48.7%) | 13,384 (51.3%) |
| Office & Administration | 8,668 (27.5%) | 22,806 (72.5%) |
| Total (Category) | 21,377 (37.1%) | 36,190 (62.9%) |
| Total (Overall) | 141,658 (51.3%) | 134,665 (48.7%) |
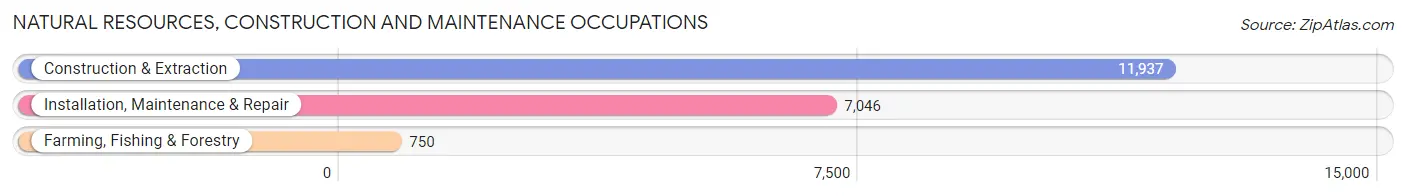
Natural Resources, Construction and Maintenance Occupations
The most common Natural Resources, Construction and Maintenance occupations in Albuquerque are Construction & Extraction (11,937 | 4.3%), Installation, Maintenance & Repair (7,046 | 2.5%), and Farming, Fishing & Forestry (750 | 0.3%).
Natural Resources, Construction and Maintenance Occupations by Sex
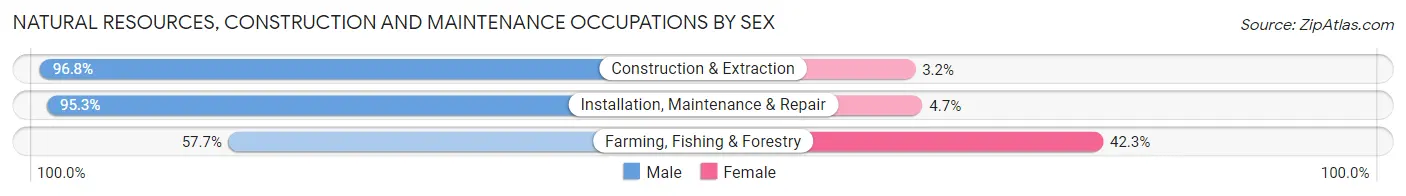
| Occupation | Male | Female |
| Farming, Fishing & Forestry | 433 (57.7%) | 317 (42.3%) |
| Construction & Extraction | 11,558 (96.8%) | 379 (3.2%) |
| Installation, Maintenance & Repair | 6,716 (95.3%) | 330 (4.7%) |
| Total (Category) | 18,707 (94.8%) | 1,026 (5.2%) |
| Total (Overall) | 141,658 (51.3%) | 134,665 (48.7%) |
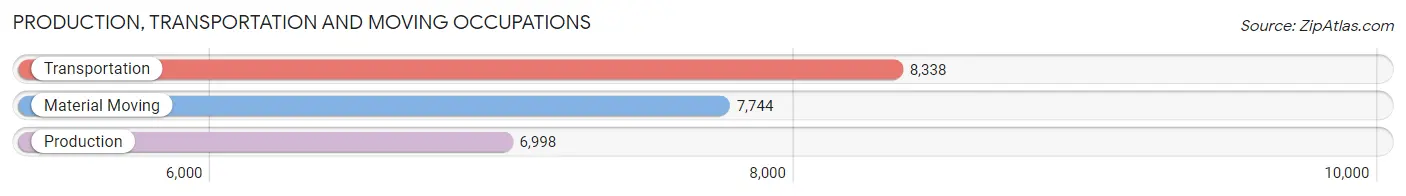
Production, Transportation and Moving Occupations
The most common Production, Transportation and Moving occupations in Albuquerque are Transportation (8,338 | 3.0%), Material Moving (7,744 | 2.8%), and Production (6,998 | 2.5%).
Production, Transportation and Moving Occupations by Sex
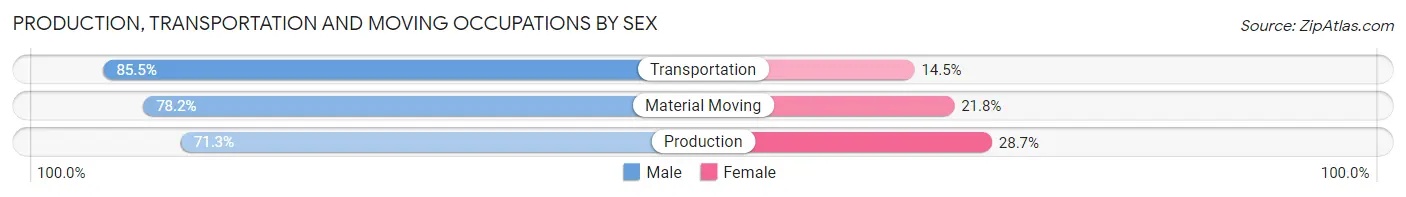
| Occupation | Male | Female |
| Production | 4,991 (71.3%) | 2,007 (28.7%) |
| Transportation | 7,131 (85.5%) | 1,207 (14.5%) |
| Material Moving | 6,058 (78.2%) | 1,686 (21.8%) |
| Total (Category) | 18,180 (78.8%) | 4,900 (21.2%) |
| Total (Overall) | 141,658 (51.3%) | 134,665 (48.7%) |
Employment Industries by Sex in Albuquerque
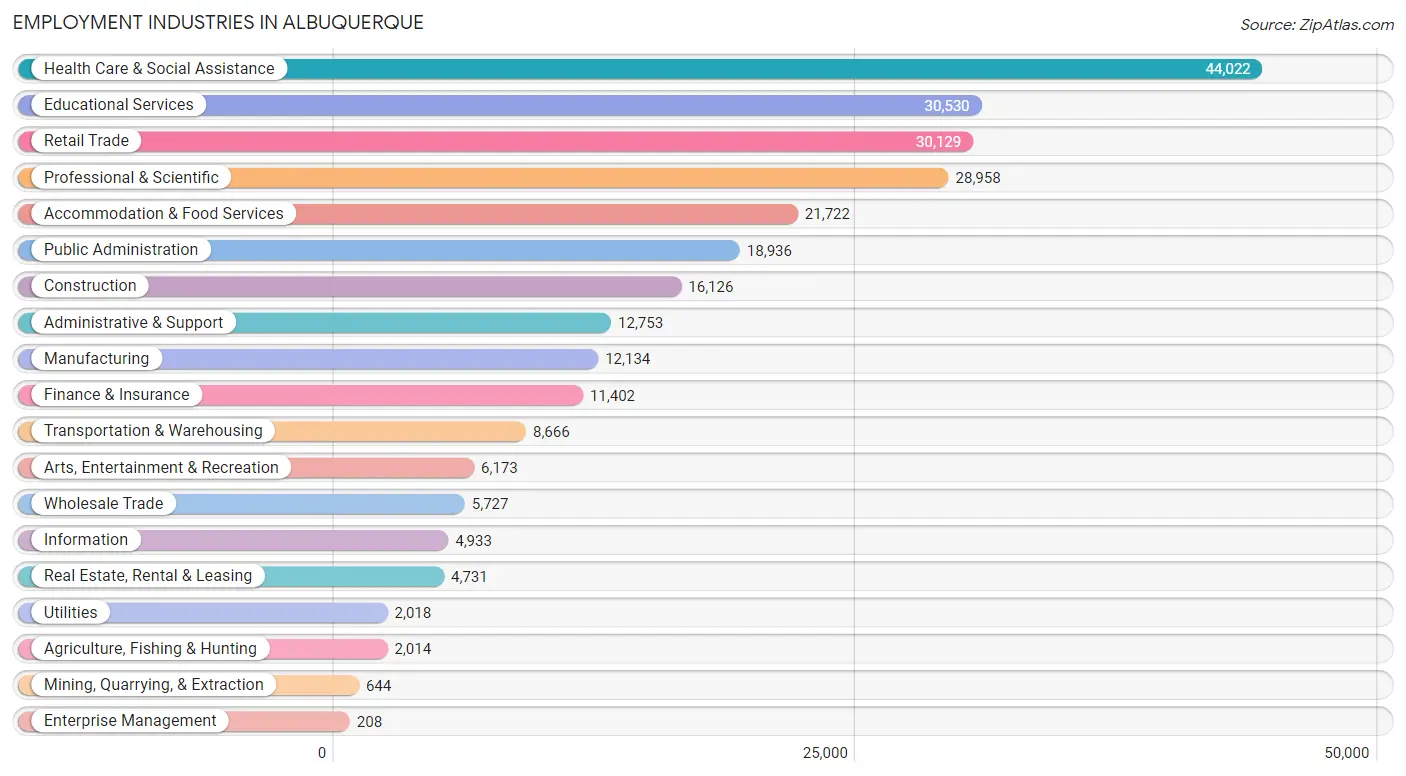
Employment Industries in Albuquerque
The major employment industries in Albuquerque include Health Care & Social Assistance (44,022 | 15.9%), Educational Services (30,530 | 11.1%), Retail Trade (30,129 | 10.9%), Professional & Scientific (28,958 | 10.5%), and Accommodation & Food Services (21,722 | 7.9%).
Employment Industries by Sex in Albuquerque
The Albuquerque industries that see more men than women are Construction (89.1%), Transportation & Warehousing (79.9%), and Utilities (77.9%), whereas the industries that tend to have a higher number of women are Health Care & Social Assistance (75.5%), Finance & Insurance (68.1%), and Educational Services (63.2%).
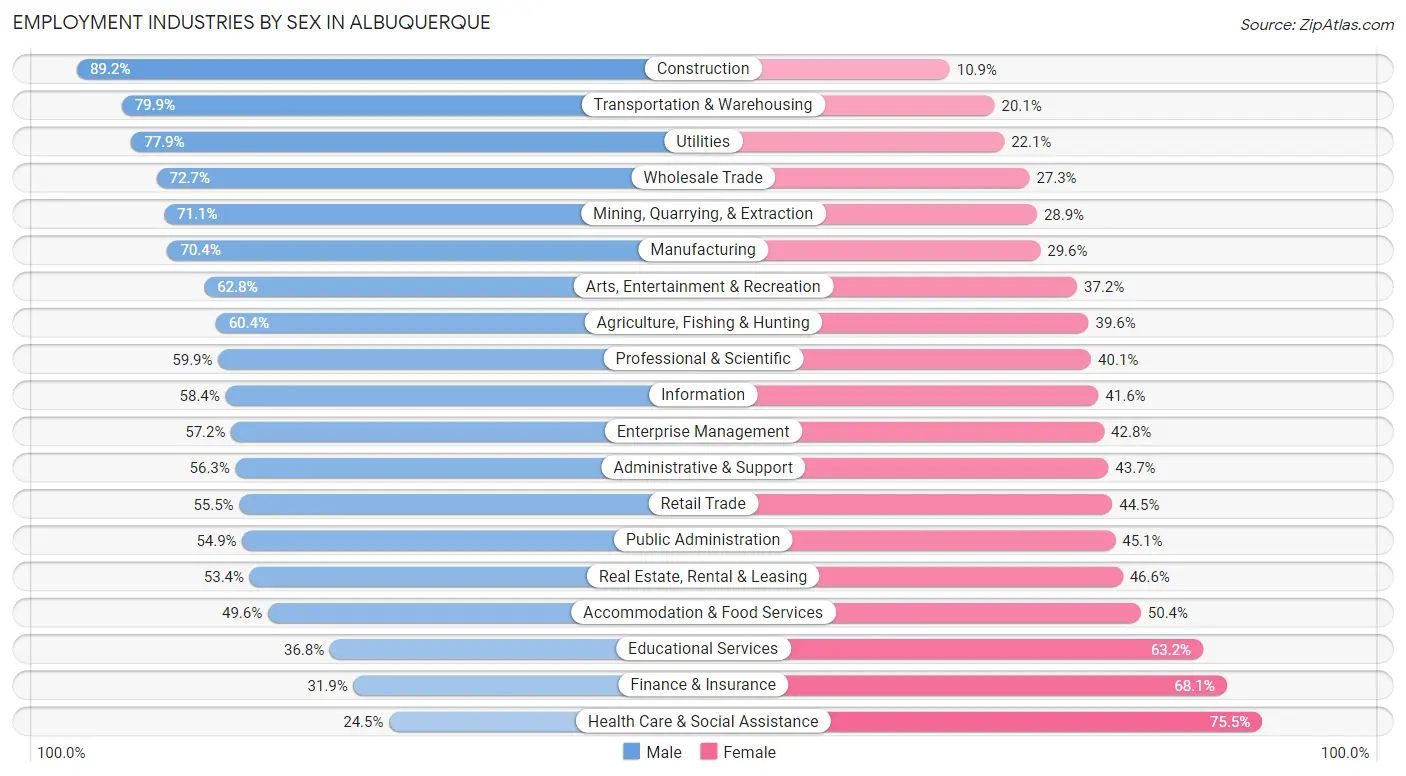
| Industry | Male | Female |
| Agriculture, Fishing & Hunting | 1,217 (60.4%) | 797 (39.6%) |
| Mining, Quarrying, & Extraction | 458 (71.1%) | 186 (28.9%) |
| Construction | 14,376 (89.1%) | 1,750 (10.8%) |
| Manufacturing | 8,545 (70.4%) | 3,589 (29.6%) |
| Wholesale Trade | 4,162 (72.7%) | 1,565 (27.3%) |
| Retail Trade | 16,732 (55.5%) | 13,397 (44.5%) |
| Transportation & Warehousing | 6,923 (79.9%) | 1,743 (20.1%) |
| Utilities | 1,572 (77.9%) | 446 (22.1%) |
| Information | 2,881 (58.4%) | 2,052 (41.6%) |
| Finance & Insurance | 3,637 (31.9%) | 7,765 (68.1%) |
| Real Estate, Rental & Leasing | 2,525 (53.4%) | 2,206 (46.6%) |
| Professional & Scientific | 17,346 (59.9%) | 11,612 (40.1%) |
| Enterprise Management | 119 (57.2%) | 89 (42.8%) |
| Administrative & Support | 7,184 (56.3%) | 5,569 (43.7%) |
| Educational Services | 11,227 (36.8%) | 19,303 (63.2%) |
| Health Care & Social Assistance | 10,788 (24.5%) | 33,234 (75.5%) |
| Arts, Entertainment & Recreation | 3,877 (62.8%) | 2,296 (37.2%) |
| Accommodation & Food Services | 10,777 (49.6%) | 10,945 (50.4%) |
| Public Administration | 10,398 (54.9%) | 8,538 (45.1%) |
| Total | 141,658 (51.3%) | 134,665 (48.7%) |
Education in Albuquerque
School Enrollment in Albuquerque
The most common levels of schooling among the 138,719 students in Albuquerque are college / undergraduate (33,413 | 24.1%), high school (28,320 | 20.4%), and middle school (28,132 | 20.3%).
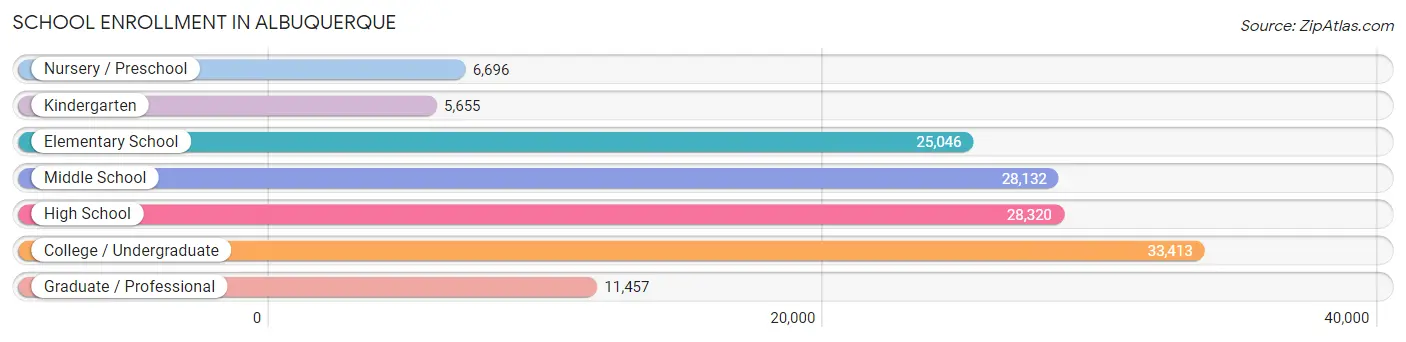
| School Level | # Students | % Students |
| Nursery / Preschool | 6,696 | 4.8% |
| Kindergarten | 5,655 | 4.1% |
| Elementary School | 25,046 | 18.1% |
| Middle School | 28,132 | 20.3% |
| High School | 28,320 | 20.4% |
| College / Undergraduate | 33,413 | 24.1% |
| Graduate / Professional | 11,457 | 8.3% |
| Total | 138,719 | 100.0% |
School Enrollment by Age by Funding Source in Albuquerque
Out of a total of 138,719 students who are enrolled in schools in Albuquerque, 18,311 (13.2%) attend a private institution, while the remaining 120,408 (86.8%) are enrolled in public schools. The age group of 3 to 4 year olds has the highest likelihood of being enrolled in private schools, with 2,344 (46.5% in the age bracket) enrolled. Conversely, the age group of 20 to 24 year olds has the lowest likelihood of being enrolled in a private school, with 12,399 (92.8% in the age bracket) attending a public institution.
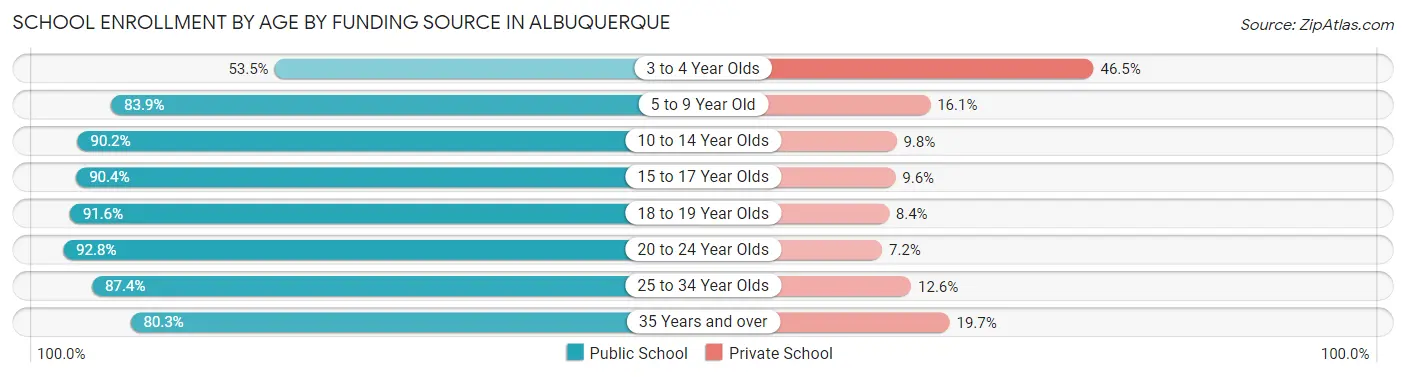
| Age Bracket | Public School | Private School |
| 3 to 4 Year Olds | 2,693 (53.5%) | 2,344 (46.5%) |
| 5 to 9 Year Old | 24,192 (83.9%) | 4,648 (16.1%) |
| 10 to 14 Year Olds | 31,249 (90.2%) | 3,408 (9.8%) |
| 15 to 17 Year Olds | 18,492 (90.4%) | 1,969 (9.6%) |
| 18 to 19 Year Olds | 10,240 (91.6%) | 942 (8.4%) |
| 20 to 24 Year Olds | 12,399 (92.8%) | 956 (7.2%) |
| 25 to 34 Year Olds | 11,575 (87.4%) | 1,663 (12.6%) |
| 35 Years and over | 9,593 (80.3%) | 2,356 (19.7%) |
| Total | 120,408 (86.8%) | 18,311 (13.2%) |
Educational Attainment by Field of Study in Albuquerque
Business (25,152 | 15.4%), education (18,473 | 11.3%), science & technology (15,610 | 9.5%), social sciences (14,657 | 9.0%), and engineering (13,465 | 8.2%) are the most common fields of study among 163,607 individuals in Albuquerque who have obtained a bachelor's degree or higher.
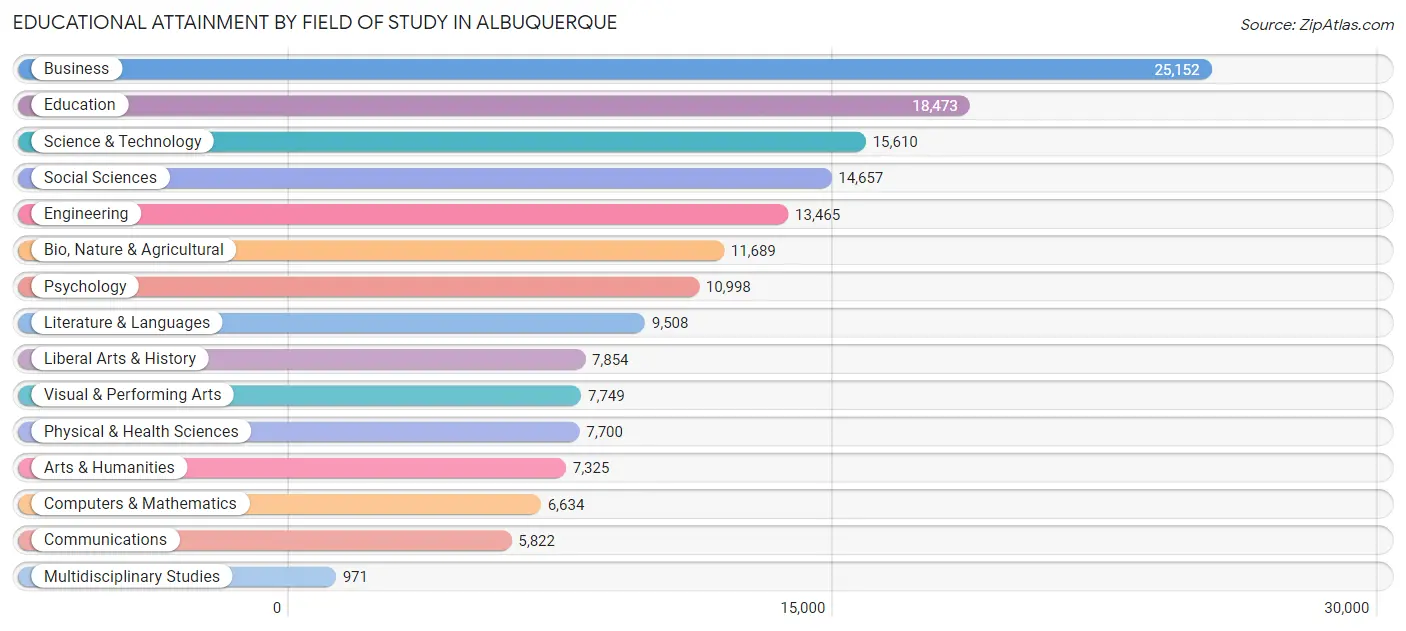
| Field of Study | # Graduates | % Graduates |
| Computers & Mathematics | 6,634 | 4.1% |
| Bio, Nature & Agricultural | 11,689 | 7.1% |
| Physical & Health Sciences | 7,700 | 4.7% |
| Psychology | 10,998 | 6.7% |
| Social Sciences | 14,657 | 9.0% |
| Engineering | 13,465 | 8.2% |
| Multidisciplinary Studies | 971 | 0.6% |
| Science & Technology | 15,610 | 9.5% |
| Business | 25,152 | 15.4% |
| Education | 18,473 | 11.3% |
| Literature & Languages | 9,508 | 5.8% |
| Liberal Arts & History | 7,854 | 4.8% |
| Visual & Performing Arts | 7,749 | 4.7% |
| Communications | 5,822 | 3.6% |
| Arts & Humanities | 7,325 | 4.5% |
| Total | 163,607 | 100.0% |
Transportation & Commute in Albuquerque
Vehicle Availability by Sex in Albuquerque
The most prevalent vehicle ownership categories in Albuquerque are males with 2 vehicles (59,099, accounting for 41.9%) and females with 2 vehicles (54,049, making up 44.8%).
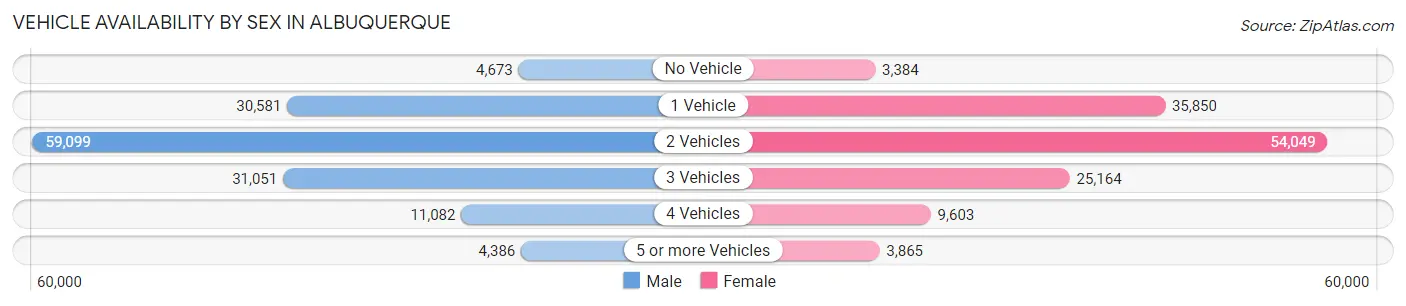
| Vehicles Available | Male | Female |
| No Vehicle | 4,673 (3.3%) | 3,384 (2.6%) |
| 1 Vehicle | 30,581 (21.7%) | 35,850 (27.2%) |
| 2 Vehicles | 59,099 (41.9%) | 54,049 (41.0%) |
| 3 Vehicles | 31,051 (22.0%) | 25,164 (19.1%) |
| 4 Vehicles | 11,082 (7.9%) | 9,603 (7.3%) |
| 5 or more Vehicles | 4,386 (3.1%) | 3,865 (2.9%) |
| Total | 140,872 (100.0%) | 131,915 (100.0%) |
Commute Time in Albuquerque
The most frequently occuring commute durations in Albuquerque are 15 to 19 minutes (51,818 commuters, 21.2%), 20 to 24 minutes (50,222 commuters, 20.6%), and 10 to 14 minutes (36,010 commuters, 14.7%).
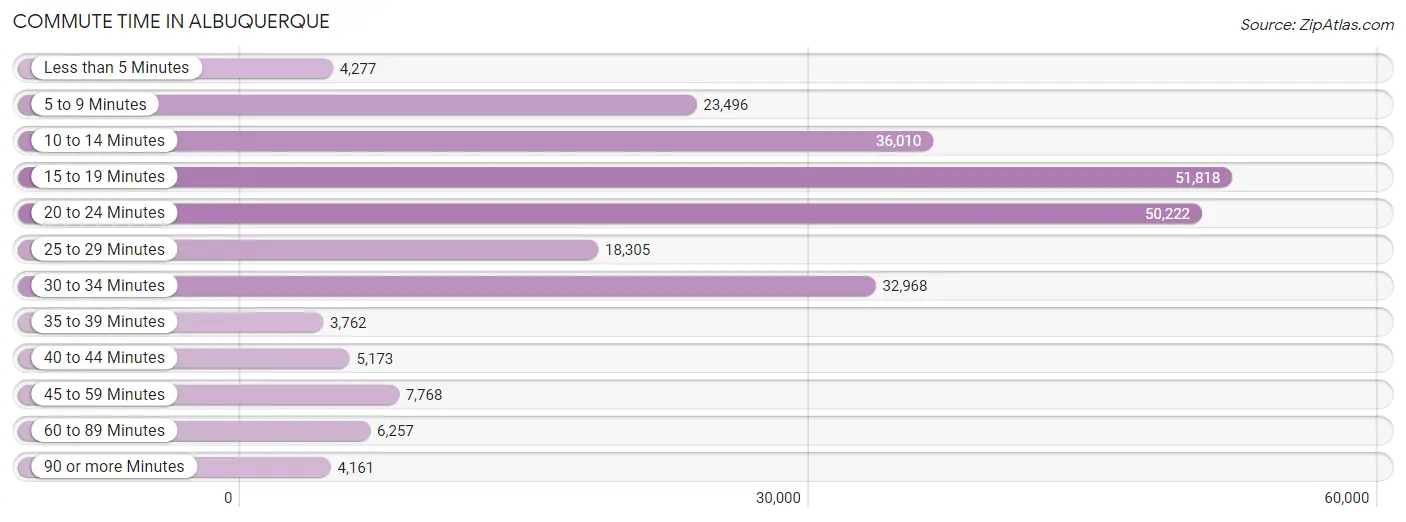
| Commute Time | # Commuters | % Commuters |
| Less than 5 Minutes | 4,277 | 1.8% |
| 5 to 9 Minutes | 23,496 | 9.6% |
| 10 to 14 Minutes | 36,010 | 14.7% |
| 15 to 19 Minutes | 51,818 | 21.2% |
| 20 to 24 Minutes | 50,222 | 20.6% |
| 25 to 29 Minutes | 18,305 | 7.5% |
| 30 to 34 Minutes | 32,968 | 13.5% |
| 35 to 39 Minutes | 3,762 | 1.5% |
| 40 to 44 Minutes | 5,173 | 2.1% |
| 45 to 59 Minutes | 7,768 | 3.2% |
| 60 to 89 Minutes | 6,257 | 2.6% |
| 90 or more Minutes | 4,161 | 1.7% |
Commute Time by Sex in Albuquerque
The most common commute times in Albuquerque are 15 to 19 minutes (27,337 commuters, 21.4%) for males and 15 to 19 minutes (24,481 commuters, 21.0%) for females.
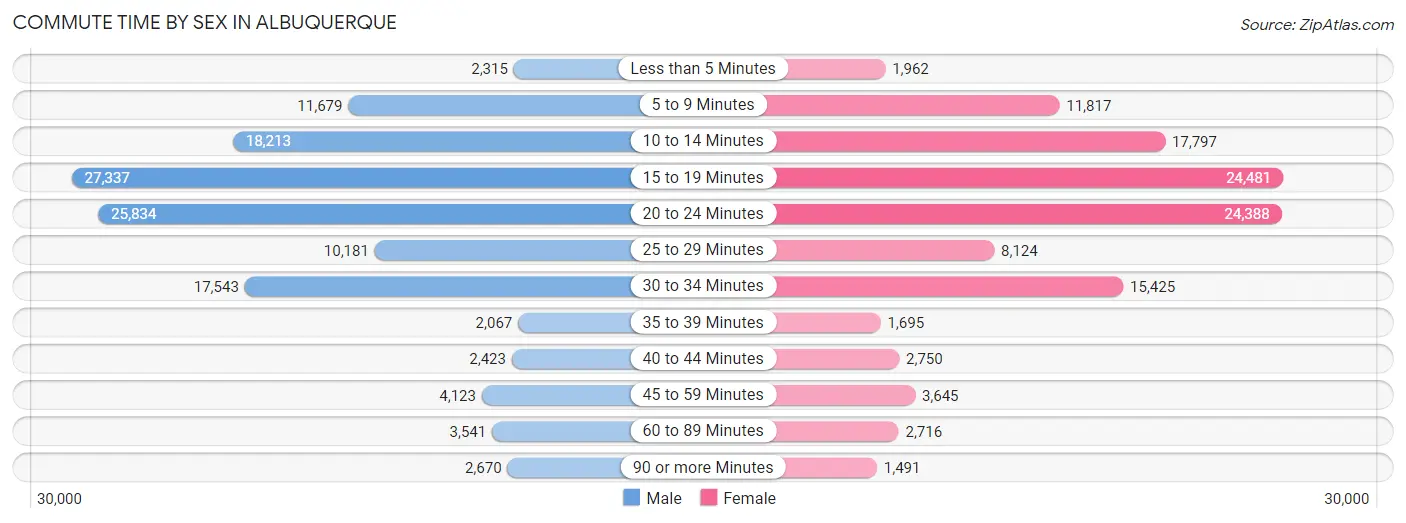
| Commute Time | Male | Female |
| Less than 5 Minutes | 2,315 (1.8%) | 1,962 (1.7%) |
| 5 to 9 Minutes | 11,679 (9.1%) | 11,817 (10.2%) |
| 10 to 14 Minutes | 18,213 (14.2%) | 17,797 (15.3%) |
| 15 to 19 Minutes | 27,337 (21.4%) | 24,481 (21.0%) |
| 20 to 24 Minutes | 25,834 (20.2%) | 24,388 (21.0%) |
| 25 to 29 Minutes | 10,181 (8.0%) | 8,124 (7.0%) |
| 30 to 34 Minutes | 17,543 (13.7%) | 15,425 (13.3%) |
| 35 to 39 Minutes | 2,067 (1.6%) | 1,695 (1.5%) |
| 40 to 44 Minutes | 2,423 (1.9%) | 2,750 (2.4%) |
| 45 to 59 Minutes | 4,123 (3.2%) | 3,645 (3.1%) |
| 60 to 89 Minutes | 3,541 (2.8%) | 2,716 (2.3%) |
| 90 or more Minutes | 2,670 (2.1%) | 1,491 (1.3%) |
Time of Departure to Work by Sex in Albuquerque
The most frequent times of departure to work in Albuquerque are 7:00 AM to 7:29 AM (19,531, 15.3%) for males and 7:00 AM to 7:29 AM (19,151, 16.5%) for females.
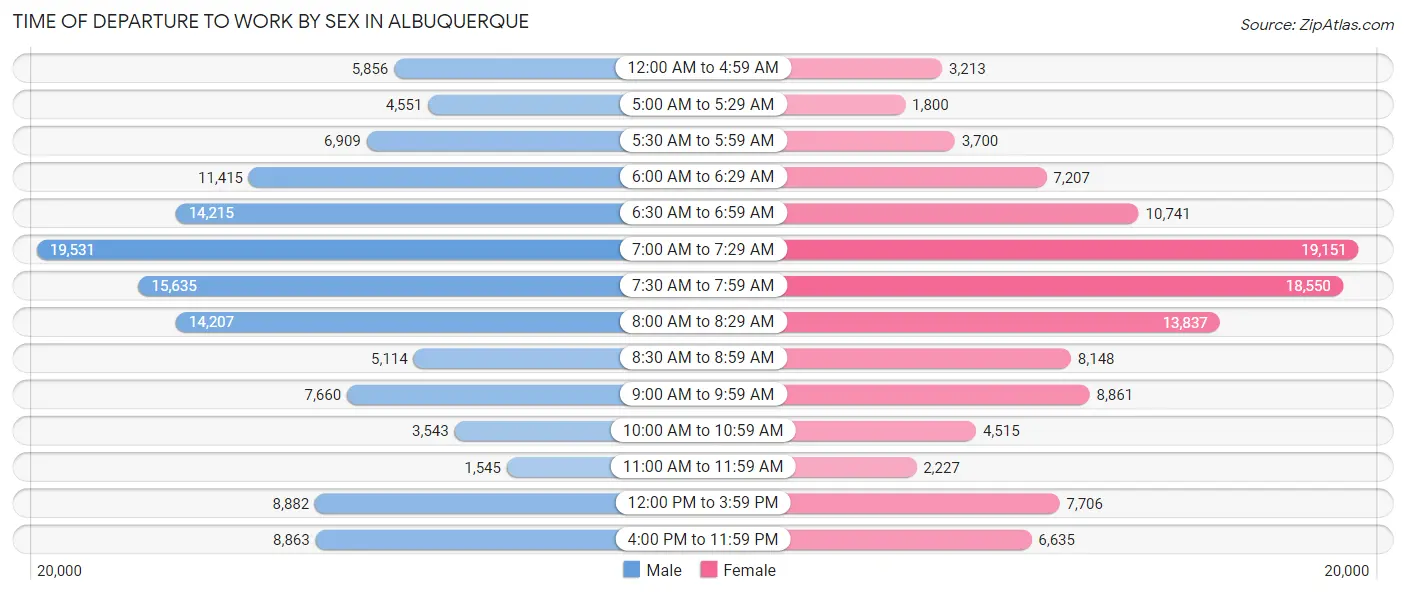
| Time of Departure | Male | Female |
| 12:00 AM to 4:59 AM | 5,856 (4.6%) | 3,213 (2.8%) |
| 5:00 AM to 5:29 AM | 4,551 (3.6%) | 1,800 (1.5%) |
| 5:30 AM to 5:59 AM | 6,909 (5.4%) | 3,700 (3.2%) |
| 6:00 AM to 6:29 AM | 11,415 (8.9%) | 7,207 (6.2%) |
| 6:30 AM to 6:59 AM | 14,215 (11.1%) | 10,741 (9.2%) |
| 7:00 AM to 7:29 AM | 19,531 (15.3%) | 19,151 (16.5%) |
| 7:30 AM to 7:59 AM | 15,635 (12.2%) | 18,550 (16.0%) |
| 8:00 AM to 8:29 AM | 14,207 (11.1%) | 13,837 (11.9%) |
| 8:30 AM to 8:59 AM | 5,114 (4.0%) | 8,148 (7.0%) |
| 9:00 AM to 9:59 AM | 7,660 (6.0%) | 8,861 (7.6%) |
| 10:00 AM to 10:59 AM | 3,543 (2.8%) | 4,515 (3.9%) |
| 11:00 AM to 11:59 AM | 1,545 (1.2%) | 2,227 (1.9%) |
| 12:00 PM to 3:59 PM | 8,882 (6.9%) | 7,706 (6.6%) |
| 4:00 PM to 11:59 PM | 8,863 (6.9%) | 6,635 (5.7%) |
| Total | 127,926 (100.0%) | 116,291 (100.0%) |
Housing Occupancy in Albuquerque
Occupancy by Ownership in Albuquerque
Of the total 239,800 dwellings in Albuquerque, owner-occupied units account for 145,550 (60.7%), while renter-occupied units make up 94,250 (39.3%).
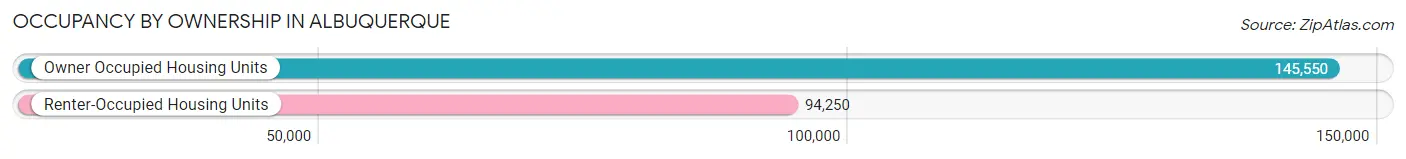
| Occupancy | # Housing Units | % Housing Units |
| Owner Occupied Housing Units | 145,550 | 60.7% |
| Renter-Occupied Housing Units | 94,250 | 39.3% |
| Total Occupied Housing Units | 239,800 | 100.0% |
Occupancy by Household Size in Albuquerque
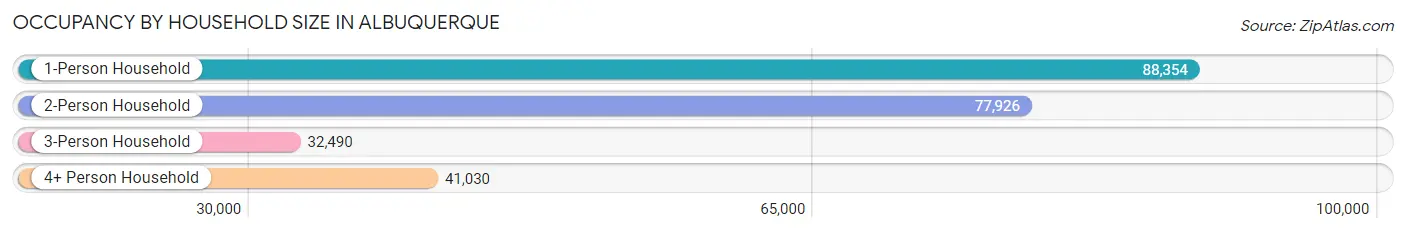
| Household Size | # Housing Units | % Housing Units |
| 1-Person Household | 88,354 | 36.8% |
| 2-Person Household | 77,926 | 32.5% |
| 3-Person Household | 32,490 | 13.6% |
| 4+ Person Household | 41,030 | 17.1% |
| Total Housing Units | 239,800 | 100.0% |
Occupancy by Ownership by Household Size in Albuquerque
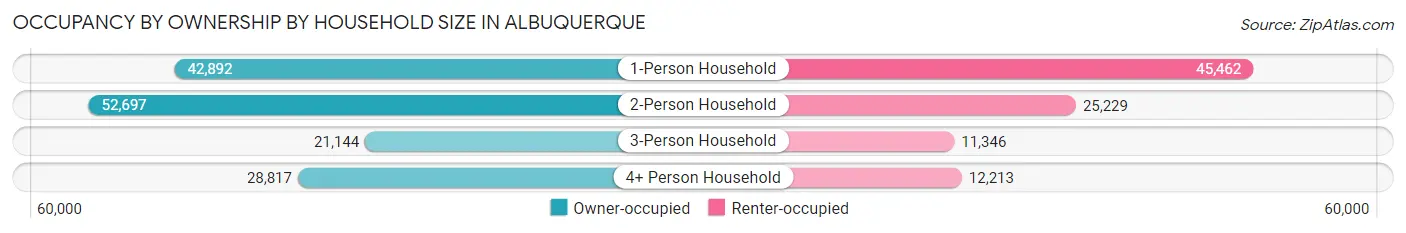
| Household Size | Owner-occupied | Renter-occupied |
| 1-Person Household | 42,892 (48.5%) | 45,462 (51.4%) |
| 2-Person Household | 52,697 (67.6%) | 25,229 (32.4%) |
| 3-Person Household | 21,144 (65.1%) | 11,346 (34.9%) |
| 4+ Person Household | 28,817 (70.2%) | 12,213 (29.8%) |
| Total Housing Units | 145,550 (60.7%) | 94,250 (39.3%) |
Occupancy by Educational Attainment in Albuquerque
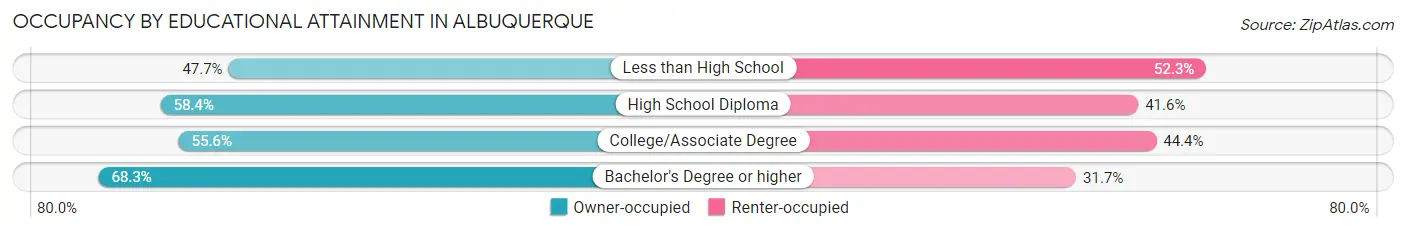
| Household Size | Owner-occupied | Renter-occupied |
| Less than High School | 8,755 (47.7%) | 9,612 (52.3%) |
| High School Diploma | 25,915 (58.4%) | 18,436 (41.6%) |
| College/Associate Degree | 43,852 (55.6%) | 35,065 (44.4%) |
| Bachelor's Degree or higher | 67,028 (68.3%) | 31,137 (31.7%) |
Occupancy by Age of Householder in Albuquerque
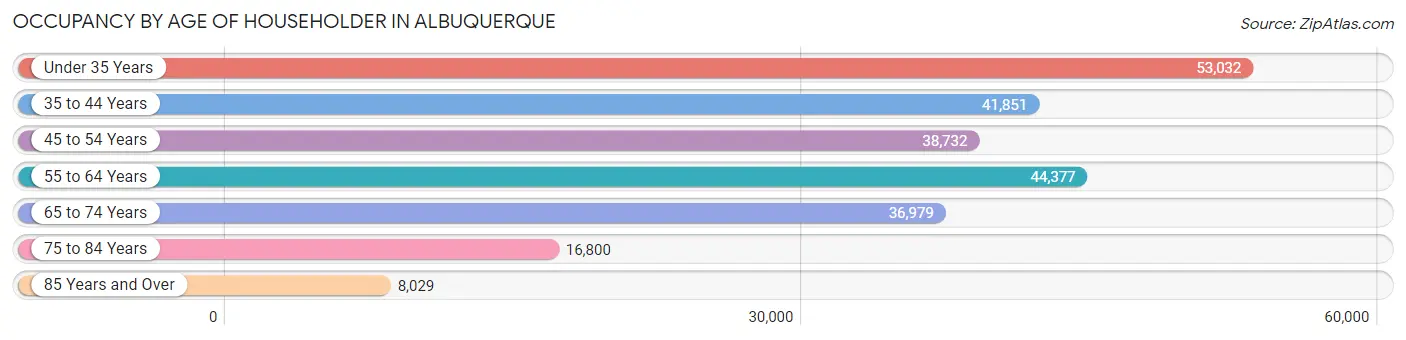
| Age Bracket | # Households | % Households |
| Under 35 Years | 53,032 | 22.1% |
| 35 to 44 Years | 41,851 | 17.4% |
| 45 to 54 Years | 38,732 | 16.2% |
| 55 to 64 Years | 44,377 | 18.5% |
| 65 to 74 Years | 36,979 | 15.4% |
| 75 to 84 Years | 16,800 | 7.0% |
| 85 Years and Over | 8,029 | 3.4% |
| Total | 239,800 | 100.0% |
Housing Finances in Albuquerque
Median Income by Occupancy in Albuquerque
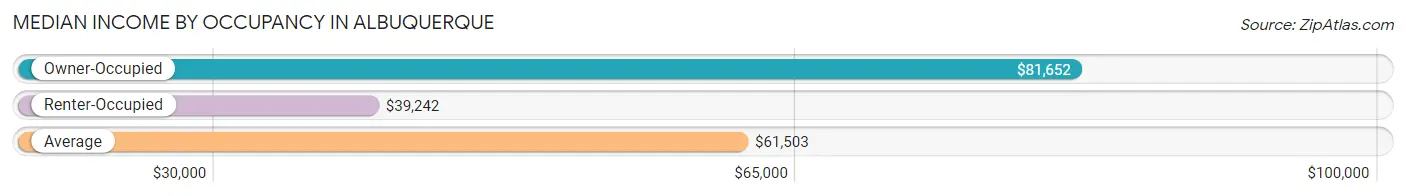
| Occupancy Type | # Households | Median Income |
| Owner-Occupied | 145,550 (60.7%) | $81,652 |
| Renter-Occupied | 94,250 (39.3%) | $39,242 |
| Average | 239,800 (100.0%) | $61,503 |
Occupancy by Householder Income Bracket in Albuquerque
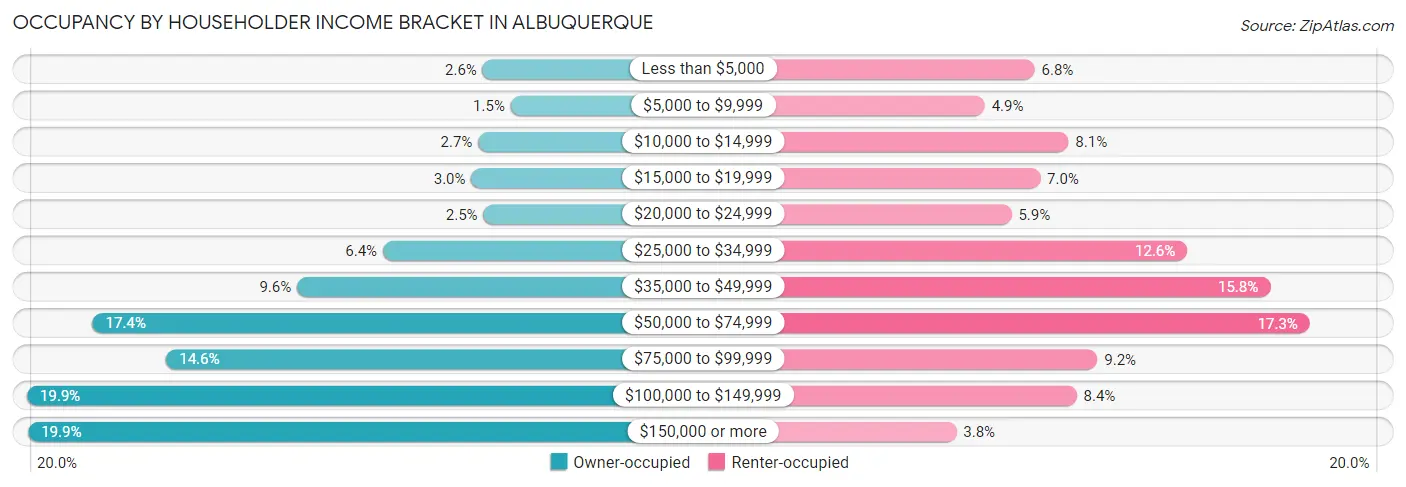
| Income Bracket | Owner-occupied | Renter-occupied |
| Less than $5,000 | 3,713 (2.5%) | 6,432 (6.8%) |
| $5,000 to $9,999 | 2,147 (1.5%) | 4,635 (4.9%) |
| $10,000 to $14,999 | 3,955 (2.7%) | 7,641 (8.1%) |
| $15,000 to $19,999 | 4,334 (3.0%) | 6,624 (7.0%) |
| $20,000 to $24,999 | 3,662 (2.5%) | 5,594 (5.9%) |
| $25,000 to $34,999 | 9,247 (6.4%) | 11,901 (12.6%) |
| $35,000 to $49,999 | 14,001 (9.6%) | 14,885 (15.8%) |
| $50,000 to $74,999 | 25,342 (17.4%) | 16,304 (17.3%) |
| $75,000 to $99,999 | 21,253 (14.6%) | 8,678 (9.2%) |
| $100,000 to $149,999 | 28,985 (19.9%) | 7,939 (8.4%) |
| $150,000 or more | 28,911 (19.9%) | 3,617 (3.8%) |
| Total | 145,550 (100.0%) | 94,250 (100.0%) |
Monthly Housing Cost Tiers in Albuquerque
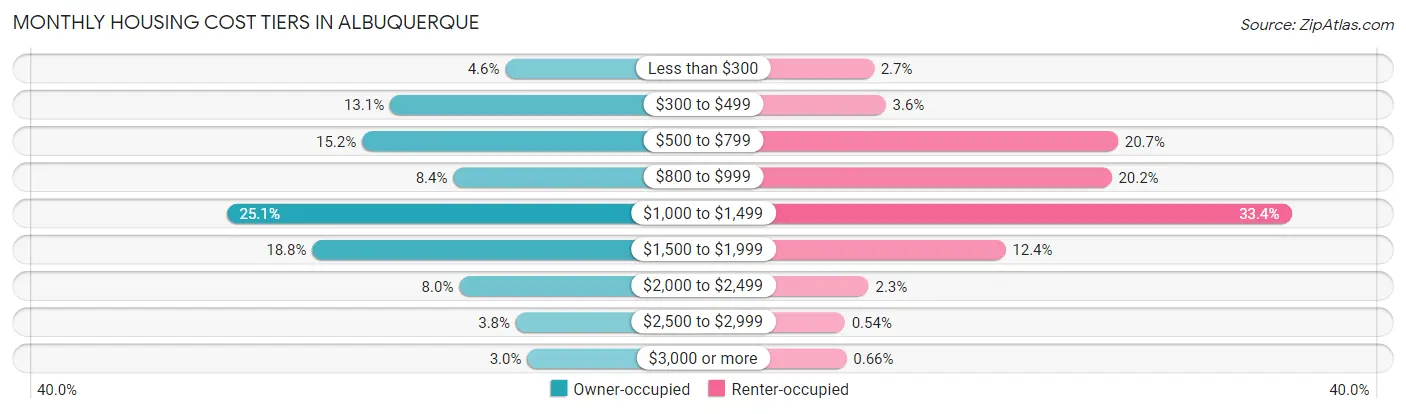
| Monthly Cost | Owner-occupied | Renter-occupied |
| Less than $300 | 6,697 (4.6%) | 2,515 (2.7%) |
| $300 to $499 | 19,049 (13.1%) | 3,347 (3.5%) |
| $500 to $799 | 22,058 (15.1%) | 19,460 (20.6%) |
| $800 to $999 | 12,266 (8.4%) | 19,023 (20.2%) |
| $1,000 to $1,499 | 36,572 (25.1%) | 31,499 (33.4%) |
| $1,500 to $1,999 | 27,374 (18.8%) | 11,656 (12.4%) |
| $2,000 to $2,499 | 11,631 (8.0%) | 2,155 (2.3%) |
| $2,500 to $2,999 | 5,567 (3.8%) | 507 (0.5%) |
| $3,000 or more | 4,336 (3.0%) | 625 (0.7%) |
| Total | 145,550 (100.0%) | 94,250 (100.0%) |
Physical Housing Characteristics in Albuquerque
Housing Structures in Albuquerque
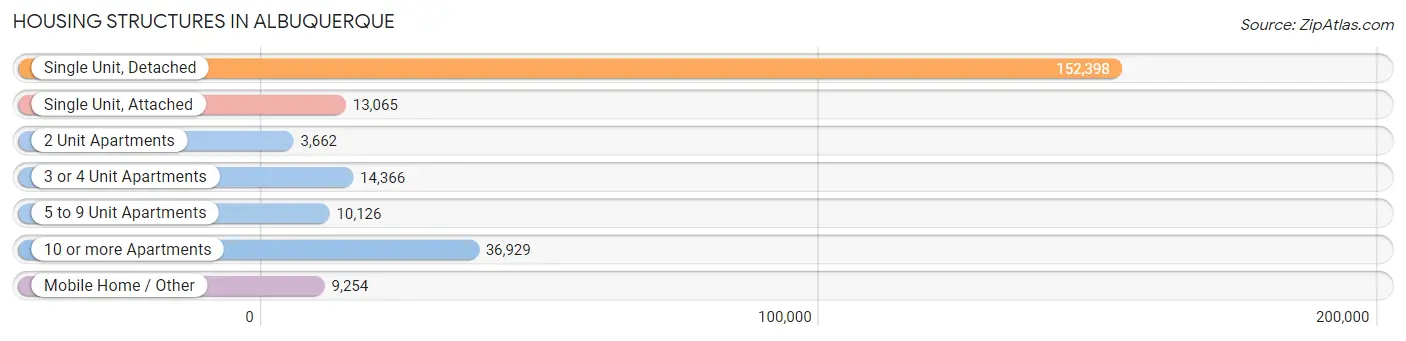
| Structure Type | # Housing Units | % Housing Units |
| Single Unit, Detached | 152,398 | 63.5% |
| Single Unit, Attached | 13,065 | 5.4% |
| 2 Unit Apartments | 3,662 | 1.5% |
| 3 or 4 Unit Apartments | 14,366 | 6.0% |
| 5 to 9 Unit Apartments | 10,126 | 4.2% |
| 10 or more Apartments | 36,929 | 15.4% |
| Mobile Home / Other | 9,254 | 3.9% |
| Total | 239,800 | 100.0% |
Housing Structures by Occupancy in Albuquerque
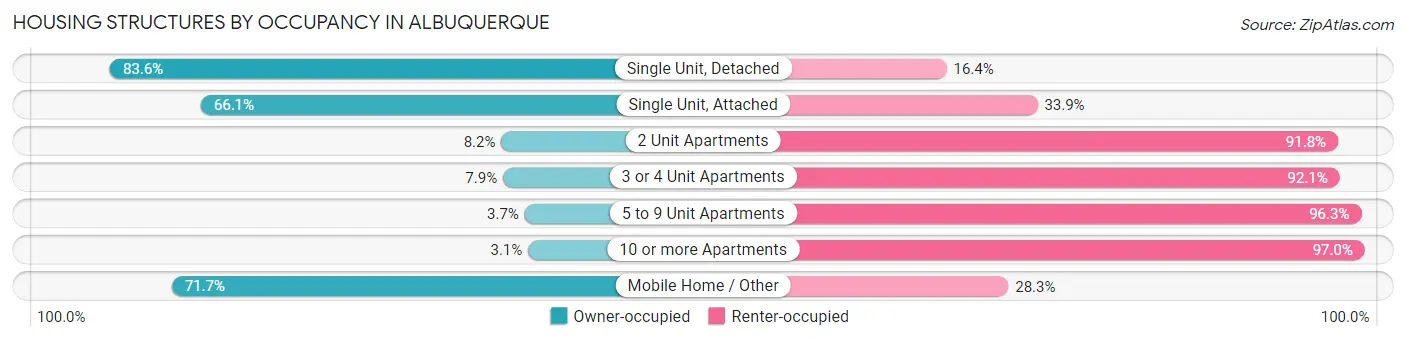
| Structure Type | Owner-occupied | Renter-occupied |
| Single Unit, Detached | 127,350 (83.6%) | 25,048 (16.4%) |
| Single Unit, Attached | 8,631 (66.1%) | 4,434 (33.9%) |
| 2 Unit Apartments | 301 (8.2%) | 3,361 (91.8%) |
| 3 or 4 Unit Apartments | 1,134 (7.9%) | 13,232 (92.1%) |
| 5 to 9 Unit Apartments | 377 (3.7%) | 9,749 (96.3%) |
| 10 or more Apartments | 1,125 (3.0%) | 35,804 (97.0%) |
| Mobile Home / Other | 6,632 (71.7%) | 2,622 (28.3%) |
| Total | 145,550 (60.7%) | 94,250 (39.3%) |
Housing Structures by Number of Rooms in Albuquerque
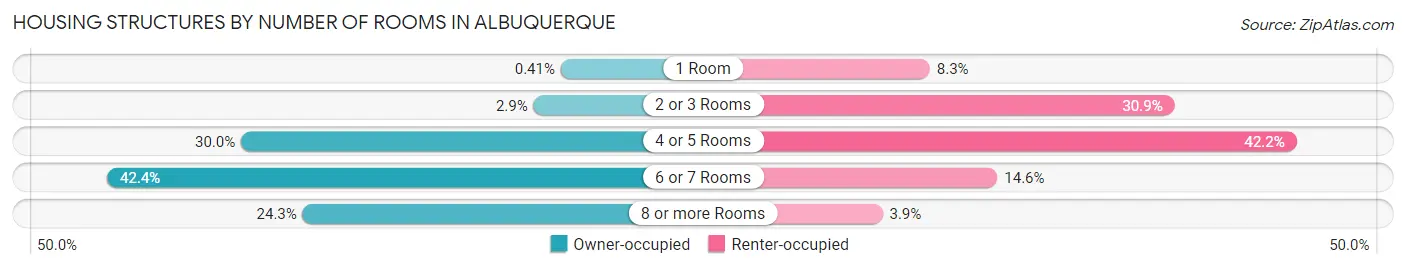
| Number of Rooms | Owner-occupied | Renter-occupied |
| 1 Room | 601 (0.4%) | 7,845 (8.3%) |
| 2 or 3 Rooms | 4,270 (2.9%) | 29,163 (30.9%) |
| 4 or 5 Rooms | 43,642 (30.0%) | 39,804 (42.2%) |
| 6 or 7 Rooms | 61,689 (42.4%) | 13,725 (14.6%) |
| 8 or more Rooms | 35,348 (24.3%) | 3,713 (3.9%) |
| Total | 145,550 (100.0%) | 94,250 (100.0%) |
Housing Structure by Heating Type in Albuquerque
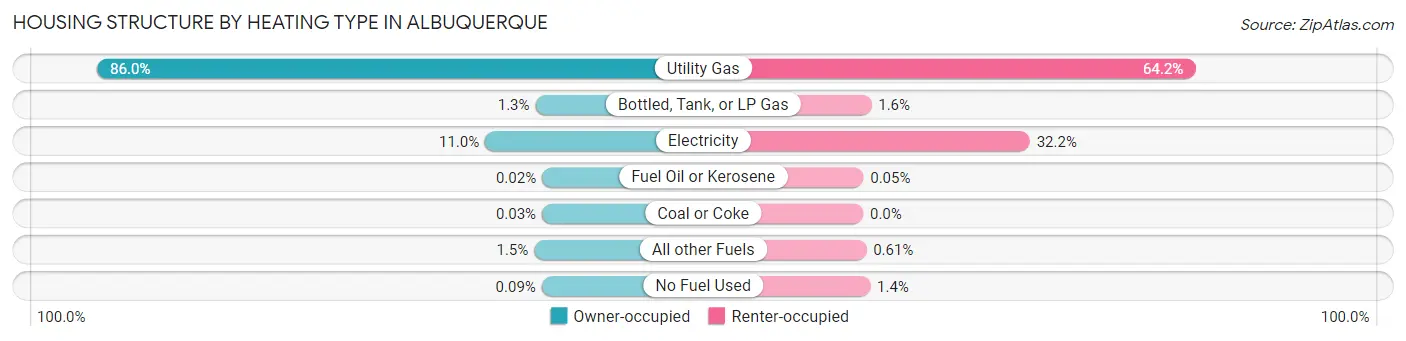
| Heating Type | Owner-occupied | Renter-occupied |
| Utility Gas | 125,171 (86.0%) | 60,483 (64.2%) |
| Bottled, Tank, or LP Gas | 1,887 (1.3%) | 1,497 (1.6%) |
| Electricity | 16,054 (11.0%) | 30,357 (32.2%) |
| Fuel Oil or Kerosene | 23 (0.0%) | 49 (0.1%) |
| Coal or Coke | 41 (0.0%) | 0 (0.0%) |
| All other Fuels | 2,246 (1.5%) | 573 (0.6%) |
| No Fuel Used | 128 (0.1%) | 1,291 (1.4%) |
| Total | 145,550 (100.0%) | 94,250 (100.0%) |
Household Vehicle Usage in Albuquerque
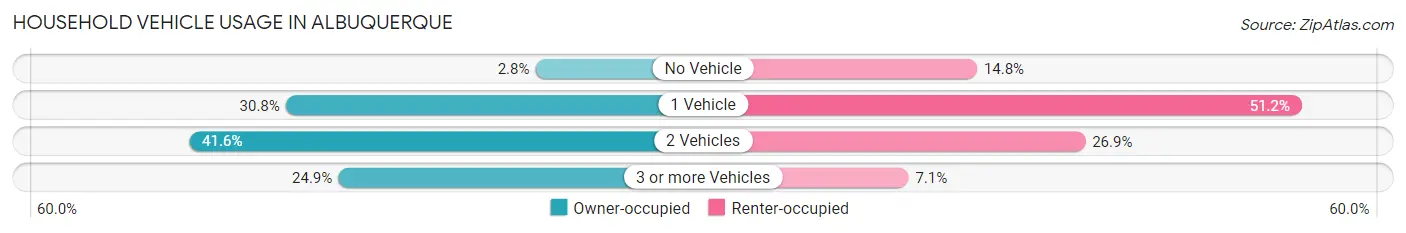
| Vehicles per Household | Owner-occupied | Renter-occupied |
| No Vehicle | 4,057 (2.8%) | 13,938 (14.8%) |
| 1 Vehicle | 44,774 (30.8%) | 48,229 (51.2%) |
| 2 Vehicles | 60,510 (41.6%) | 25,373 (26.9%) |
| 3 or more Vehicles | 36,209 (24.9%) | 6,710 (7.1%) |
| Total | 145,550 (100.0%) | 94,250 (100.0%) |
Real Estate & Mortgages in Albuquerque
Real Estate and Mortgage Overview in Albuquerque
| Characteristic | Without Mortgage | With Mortgage |
| Housing Units | 50,270 | 95,280 |
| Median Property Value | $240,200 | $248,500 |
| Median Household Income | $63,677 | $20,804 |
| Monthly Housing Costs | $504 | $4,293 |
| Real Estate Taxes | $2,439 | $3,250 |
Property Value by Mortgage Status in Albuquerque
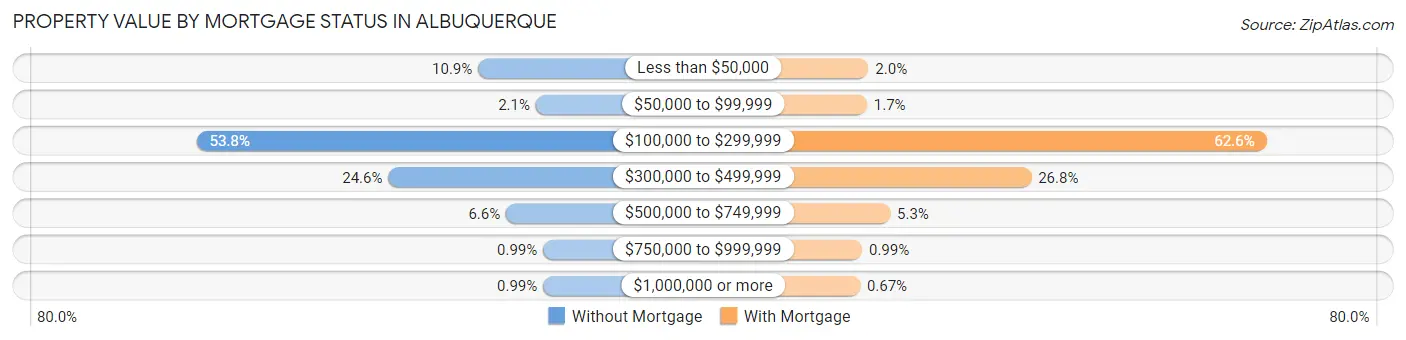
| Property Value | Without Mortgage | With Mortgage |
| Less than $50,000 | 5,473 (10.9%) | 1,863 (2.0%) |
| $50,000 to $99,999 | 1,059 (2.1%) | 1,641 (1.7%) |
| $100,000 to $299,999 | 27,047 (53.8%) | 59,660 (62.6%) |
| $300,000 to $499,999 | 12,355 (24.6%) | 25,511 (26.8%) |
| $500,000 to $749,999 | 3,340 (6.6%) | 5,022 (5.3%) |
| $750,000 to $999,999 | 497 (1.0%) | 947 (1.0%) |
| $1,000,000 or more | 499 (1.0%) | 636 (0.7%) |
| Total | 50,270 (100.0%) | 95,280 (100.0%) |
Household Income by Mortgage Status in Albuquerque
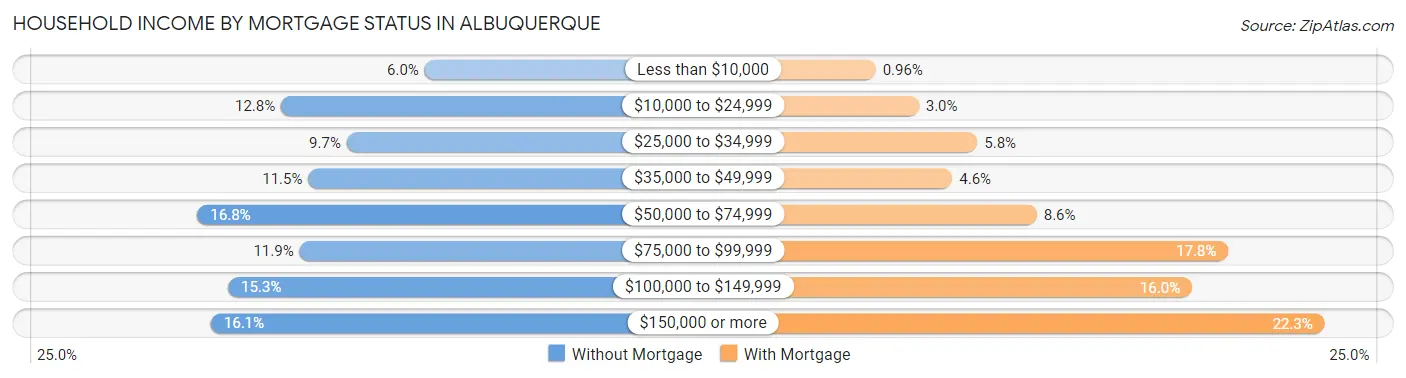
| Household Income | Without Mortgage | With Mortgage |
| Less than $10,000 | 2,990 (5.9%) | 911 (1.0%) |
| $10,000 to $24,999 | 6,429 (12.8%) | 2,870 (3.0%) |
| $25,000 to $34,999 | 4,855 (9.7%) | 5,522 (5.8%) |
| $35,000 to $49,999 | 5,778 (11.5%) | 4,392 (4.6%) |
| $50,000 to $74,999 | 8,430 (16.8%) | 8,223 (8.6%) |
| $75,000 to $99,999 | 5,986 (11.9%) | 16,912 (17.7%) |
| $100,000 to $149,999 | 7,695 (15.3%) | 15,267 (16.0%) |
| $150,000 or more | 8,107 (16.1%) | 21,290 (22.3%) |
| Total | 50,270 (100.0%) | 95,280 (100.0%) |
Property Value to Household Income Ratio in Albuquerque
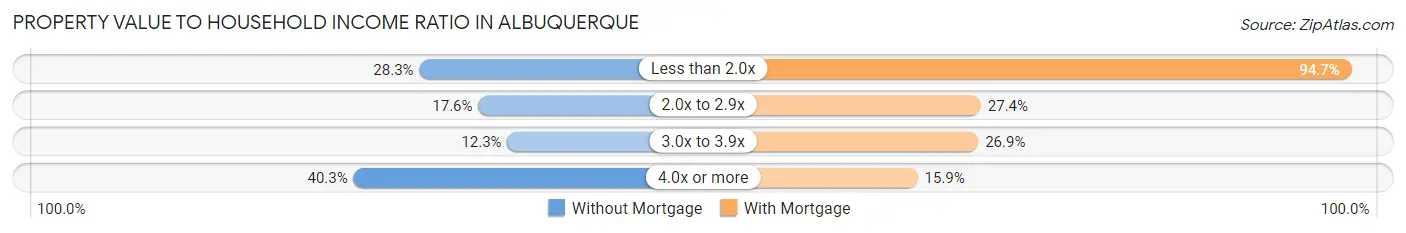
| Value-to-Income Ratio | Without Mortgage | With Mortgage |
| Less than 2.0x | 14,227 (28.3%) | 90,255 (94.7%) |
| 2.0x to 2.9x | 8,845 (17.6%) | 26,121 (27.4%) |
| 3.0x to 3.9x | 6,189 (12.3%) | 25,666 (26.9%) |
| 4.0x or more | 20,239 (40.3%) | 15,158 (15.9%) |
| Total | 50,270 (100.0%) | 95,280 (100.0%) |
Real Estate Taxes by Mortgage Status in Albuquerque
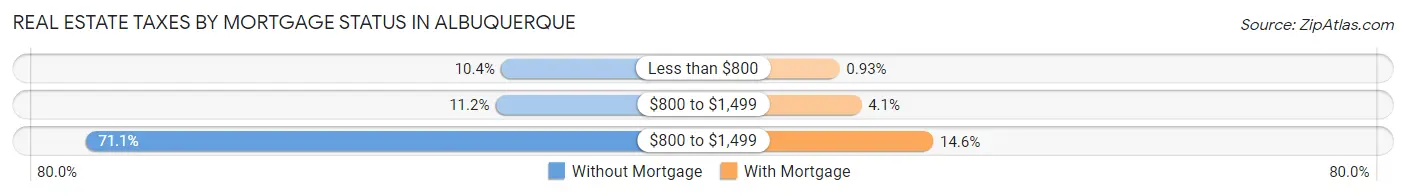
| Property Taxes | Without Mortgage | With Mortgage |
| Less than $800 | 5,243 (10.4%) | 889 (0.9%) |
| $800 to $1,499 | 5,644 (11.2%) | 3,922 (4.1%) |
| $800 to $1,499 | 35,756 (71.1%) | 13,922 (14.6%) |
| Total | 50,270 (100.0%) | 95,280 (100.0%) |
Health & Disability in Albuquerque
Health Insurance Coverage by Age in Albuquerque
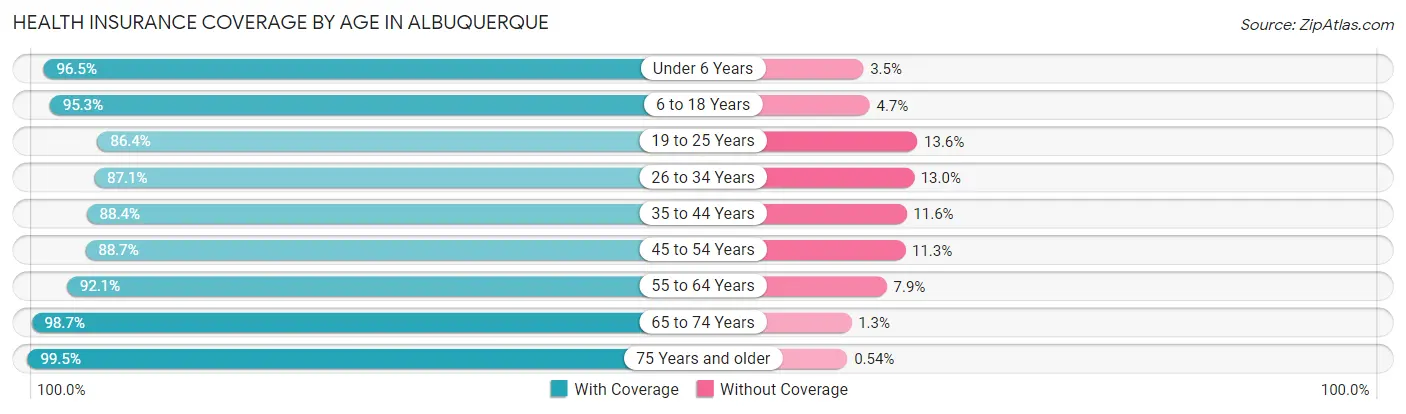
| Age Bracket | With Coverage | Without Coverage |
| Under 6 Years | 34,230 (96.5%) | 1,254 (3.5%) |
| 6 to 18 Years | 86,334 (95.3%) | 4,268 (4.7%) |
| 19 to 25 Years | 45,407 (86.4%) | 7,137 (13.6%) |
| 26 to 34 Years | 66,406 (87.1%) | 9,876 (13.0%) |
| 35 to 44 Years | 66,807 (88.4%) | 8,750 (11.6%) |
| 45 to 54 Years | 58,384 (88.7%) | 7,463 (11.3%) |
| 55 to 64 Years | 64,106 (92.1%) | 5,493 (7.9%) |
| 65 to 74 Years | 54,557 (98.7%) | 715 (1.3%) |
| 75 Years and older | 36,354 (99.5%) | 196 (0.5%) |
| Total | 512,585 (91.9%) | 45,152 (8.1%) |
Health Insurance Coverage by Citizenship Status in Albuquerque
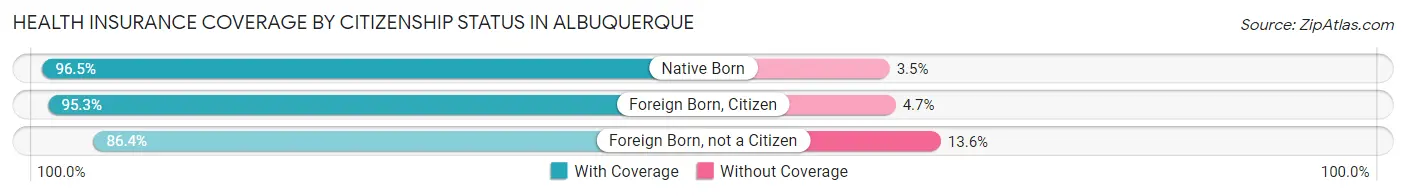
| Citizenship Status | With Coverage | Without Coverage |
| Native Born | 34,230 (96.5%) | 1,254 (3.5%) |
| Foreign Born, Citizen | 86,334 (95.3%) | 4,268 (4.7%) |
| Foreign Born, not a Citizen | 45,407 (86.4%) | 7,137 (13.6%) |
Health Insurance Coverage by Household Income in Albuquerque
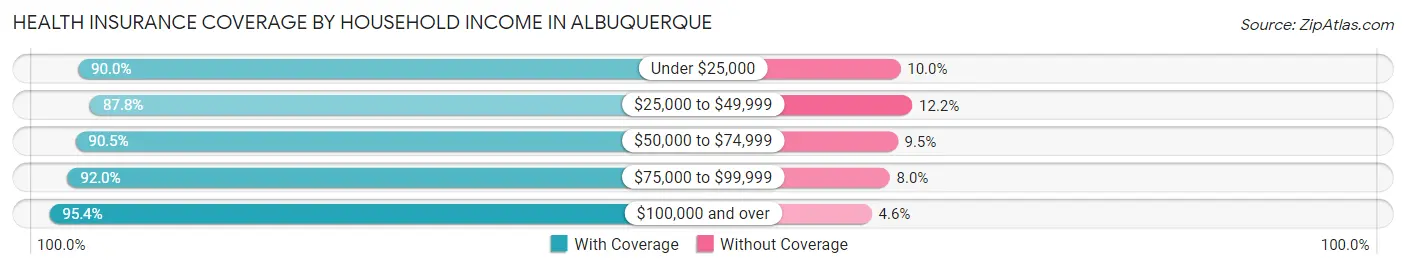
| Household Income | With Coverage | Without Coverage |
| Under $25,000 | 75,248 (90.0%) | 8,377 (10.0%) |
| $25,000 to $49,999 | 89,174 (87.8%) | 12,432 (12.2%) |
| $50,000 to $74,999 | 84,294 (90.5%) | 8,855 (9.5%) |
| $75,000 to $99,999 | 69,911 (92.0%) | 6,099 (8.0%) |
| $100,000 and over | 189,906 (95.4%) | 9,247 (4.6%) |
Public vs Private Health Insurance Coverage by Age in Albuquerque
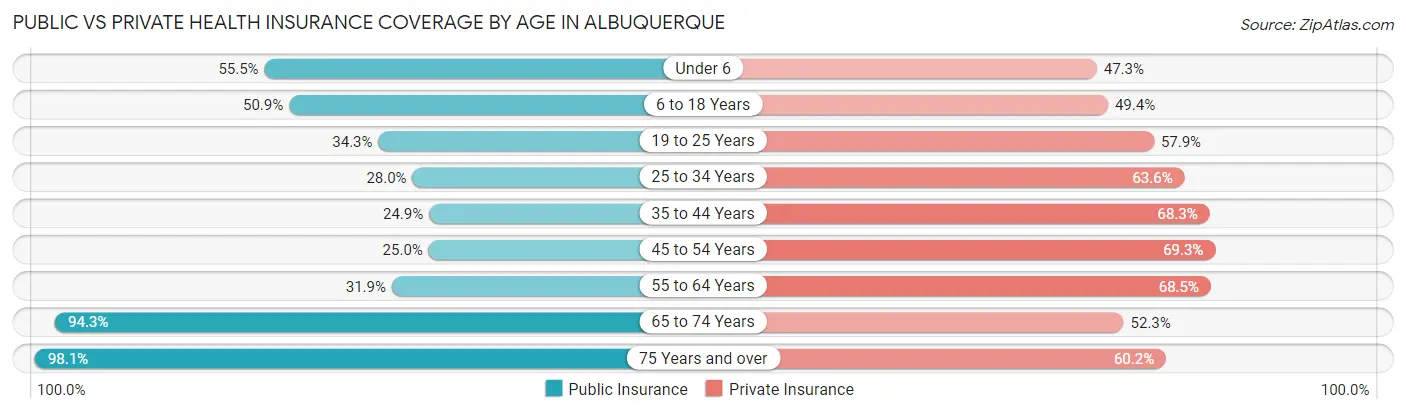
| Age Bracket | Public Insurance | Private Insurance |
| Under 6 | 19,687 (55.5%) | 16,794 (47.3%) |
| 6 to 18 Years | 46,128 (50.9%) | 44,766 (49.4%) |
| 19 to 25 Years | 18,043 (34.3%) | 30,442 (57.9%) |
| 25 to 34 Years | 21,364 (28.0%) | 48,519 (63.6%) |
| 35 to 44 Years | 18,836 (24.9%) | 51,584 (68.3%) |
| 45 to 54 Years | 16,460 (25.0%) | 45,635 (69.3%) |
| 55 to 64 Years | 22,164 (31.9%) | 47,670 (68.5%) |
| 65 to 74 Years | 52,139 (94.3%) | 28,911 (52.3%) |
| 75 Years and over | 35,849 (98.1%) | 21,993 (60.2%) |
| Total | 250,670 (44.9%) | 336,314 (60.3%) |
Disability Status by Sex by Age in Albuquerque
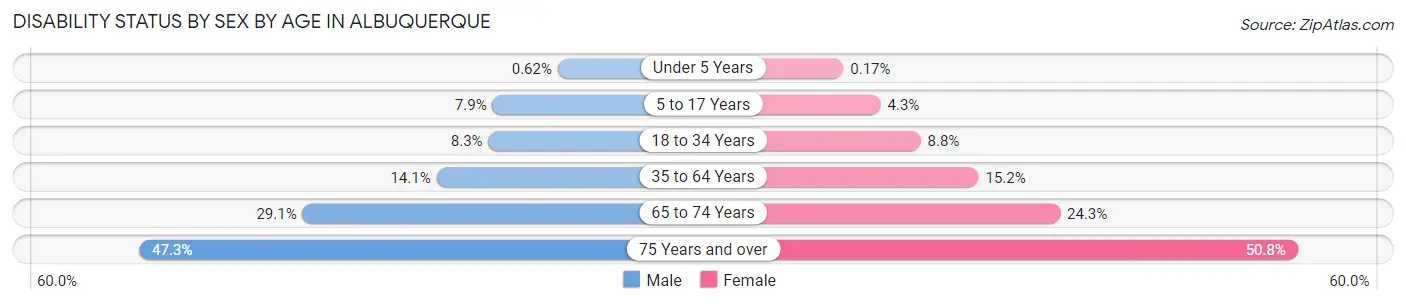
| Age Bracket | Male | Female |
| Under 5 Years | 92 (0.6%) | 24 (0.2%) |
| 5 to 17 Years | 3,597 (7.9%) | 1,852 (4.3%) |
| 18 to 34 Years | 5,776 (8.3%) | 5,943 (8.8%) |
| 35 to 64 Years | 14,537 (14.1%) | 16,470 (15.2%) |
| 65 to 74 Years | 7,342 (29.0%) | 7,293 (24.3%) |
| 75 Years and over | 7,032 (47.2%) | 11,000 (50.8%) |
Disability Class by Sex by Age in Albuquerque
Disability Class: Hearing Difficulty
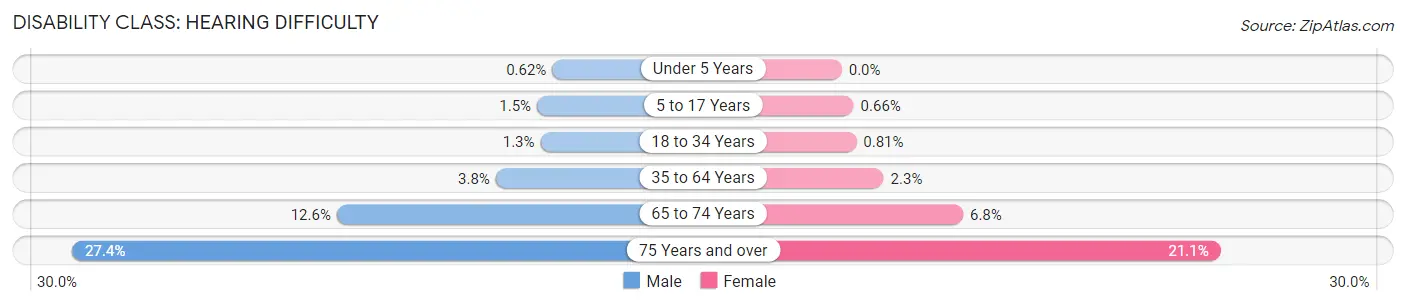
| Age Bracket | Male | Female |
| Under 5 Years | 92 (0.6%) | 0 (0.0%) |
| 5 to 17 Years | 669 (1.5%) | 282 (0.7%) |
| 18 to 34 Years | 889 (1.3%) | 546 (0.8%) |
| 35 to 64 Years | 3,877 (3.8%) | 2,516 (2.3%) |
| 65 to 74 Years | 3,189 (12.6%) | 2,024 (6.8%) |
| 75 Years and over | 4,072 (27.4%) | 4,569 (21.1%) |
Disability Class: Vision Difficulty
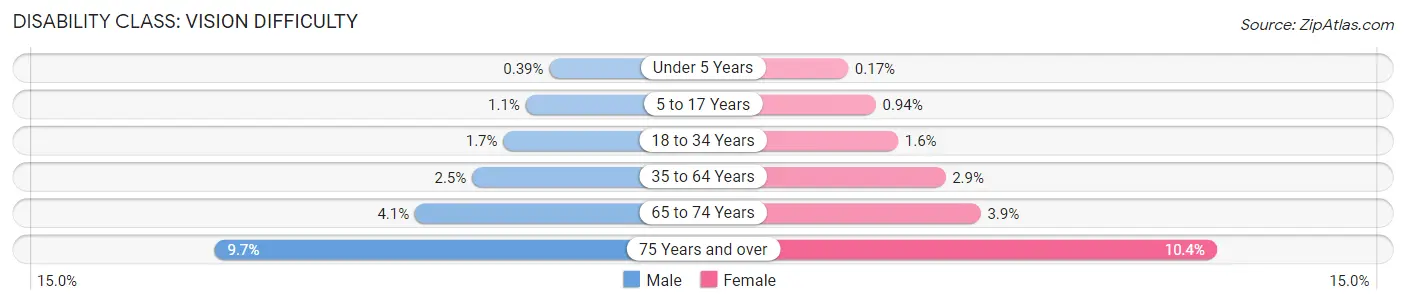
| Age Bracket | Male | Female |
| Under 5 Years | 58 (0.4%) | 24 (0.2%) |
| 5 to 17 Years | 481 (1.1%) | 404 (0.9%) |
| 18 to 34 Years | 1,158 (1.7%) | 1,059 (1.6%) |
| 35 to 64 Years | 2,615 (2.5%) | 3,109 (2.9%) |
| 65 to 74 Years | 1,043 (4.1%) | 1,158 (3.9%) |
| 75 Years and over | 1,445 (9.7%) | 2,263 (10.4%) |
Disability Class: Cognitive Difficulty
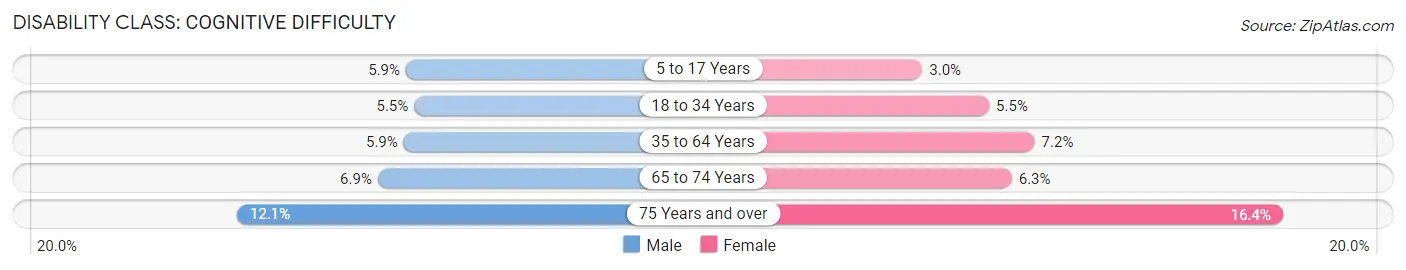
| Age Bracket | Male | Female |
| 5 to 17 Years | 2,668 (5.9%) | 1,280 (3.0%) |
| 18 to 34 Years | 3,838 (5.5%) | 3,700 (5.5%) |
| 35 to 64 Years | 6,096 (5.9%) | 7,744 (7.2%) |
| 65 to 74 Years | 1,742 (6.9%) | 1,894 (6.3%) |
| 75 Years and over | 1,804 (12.1%) | 3,548 (16.4%) |
Disability Class: Ambulatory Difficulty
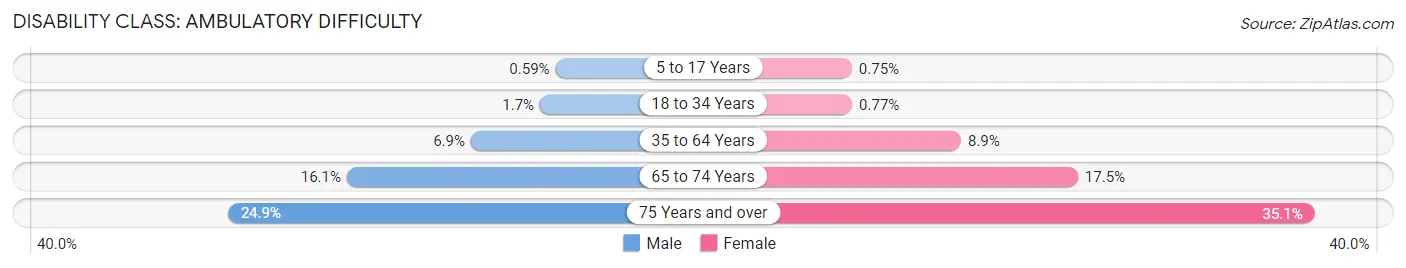
| Age Bracket | Male | Female |
| 5 to 17 Years | 267 (0.6%) | 320 (0.7%) |
| 18 to 34 Years | 1,205 (1.7%) | 522 (0.8%) |
| 35 to 64 Years | 7,067 (6.9%) | 9,571 (8.8%) |
| 65 to 74 Years | 4,063 (16.1%) | 5,258 (17.5%) |
| 75 Years and over | 3,709 (24.9%) | 7,605 (35.1%) |
Disability Class: Self-Care Difficulty
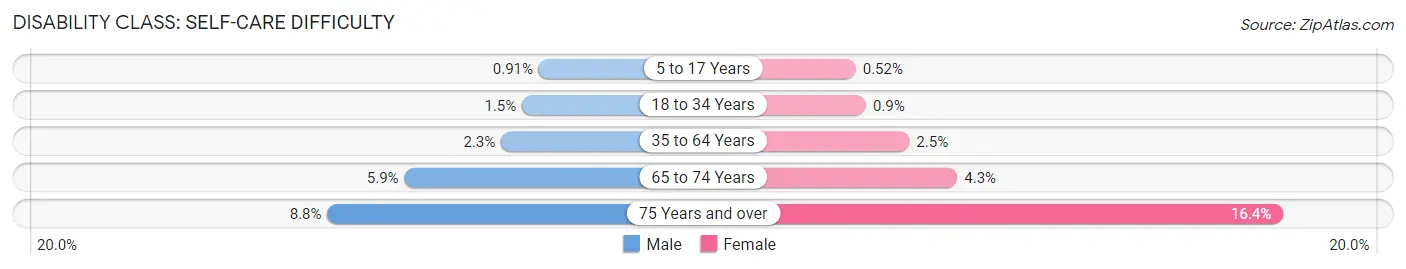
| Age Bracket | Male | Female |
| 5 to 17 Years | 416 (0.9%) | 224 (0.5%) |
| 18 to 34 Years | 1,061 (1.5%) | 609 (0.9%) |
| 35 to 64 Years | 2,379 (2.3%) | 2,711 (2.5%) |
| 65 to 74 Years | 1,490 (5.9%) | 1,286 (4.3%) |
| 75 Years and over | 1,303 (8.8%) | 3,549 (16.4%) |
Technology Access in Albuquerque
Computing Device Access in Albuquerque
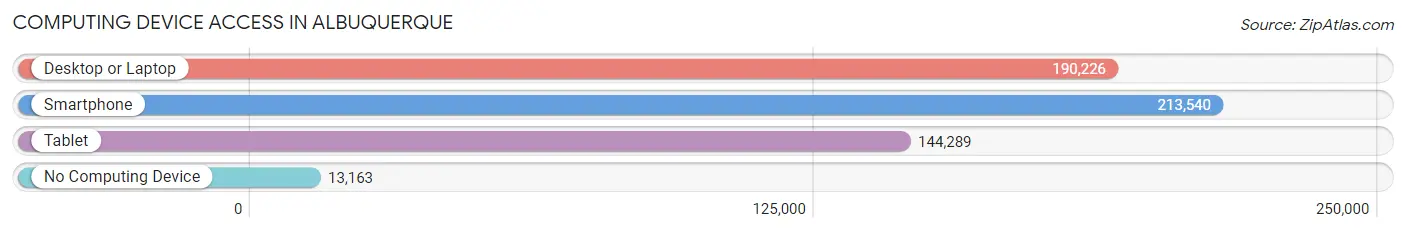
| Device Type | # Households | % Households |
| Desktop or Laptop | 190,226 | 79.3% |
| Smartphone | 213,540 | 89.0% |
| Tablet | 144,289 | 60.2% |
| No Computing Device | 13,163 | 5.5% |
| Total | 239,800 | 100.0% |
Internet Access in Albuquerque
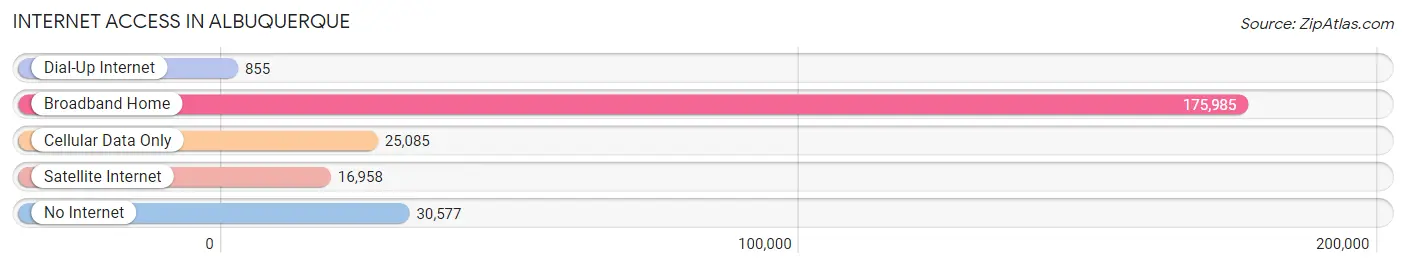
| Internet Type | # Households | % Households |
| Dial-Up Internet | 855 | 0.4% |
| Broadband Home | 175,985 | 73.4% |
| Cellular Data Only | 25,085 | 10.5% |
| Satellite Internet | 16,958 | 7.1% |
| No Internet | 30,577 | 12.8% |
| Total | 239,800 | 100.0% |
Albuquerque Summary
Albuquerque, New Mexico is the largest city in the state and the 32nd most populous city in the United States. It is located in the central part of the state, along the Rio Grande, and is the county seat of Bernalillo County. Albuquerque is home to a diverse population of over 558,000 people, making it the sixth-largest city in the Southwest.
Geography
Albuquerque is located in the central part of New Mexico, along the Rio Grande. The city is situated in the high desert, at an elevation of 5,312 feet. The city is surrounded by the Sandia Mountains to the east, the Manzano Mountains to the south, and the Petroglyph National Monument to the west. The Rio Grande flows through the city, providing a source of water for the area.
Climate
Albuquerque has a semi-arid climate, with hot summers and mild winters. The average high temperature in July is 92°F, and the average low temperature in January is 28°F. The city receives an average of 8.5 inches of precipitation annually, with most of it falling in the summer months.
Economy
Albuquerque’s economy is largely based on the service industry, with the largest employers being the University of New Mexico, Intel, and the Sandia National Laboratories. The city is also home to a number of technology companies, including Microsoft, Hewlett-Packard, and Adobe Systems. Tourism is also an important part of the economy, with the city being home to a number of attractions, including the Albuquerque International Balloon Fiesta, the National Hispanic Cultural Center, and the Indian Pueblo Cultural Center.
Demographics
As of the 2010 census, Albuquerque had a population of 545,852 people. The racial makeup of the city was 48.7% White, 4.3% African American, 3.3% Native American, 2.7% Asian, 0.2% Pacific Islander, and 37.2% from other races. The Hispanic or Latino population of any race was 48.5%.
The median household income in Albuquerque was $45,737, and the median family income was $51,856. The per capita income was $23,837. About 17.2% of the population was below the poverty line.
Albuquerque is home to a diverse population, with a variety of cultures and backgrounds. The city is home to a large Native American population, as well as a large Hispanic population. The city is also home to a number of immigrants from around the world, including Mexico, India, and the Philippines.
Conclusion
Albuquerque, New Mexico is the largest city in the state and the 32nd most populous city in the United States. It is located in the central part of the state, along the Rio Grande, and is the county seat of Bernalillo County. Albuquerque is home to a diverse population of over 558,000 people, making it the sixth-largest city in the Southwest. The city’s economy is largely based on the service industry, with the largest employers being the University of New Mexico, Intel, and the Sandia National Laboratories. The city is also home to a number of technology companies, including Microsoft, Hewlett-Packard, and Adobe Systems. Tourism is also an important part of the economy, with the city being home to a number of attractions, including the Albuquerque International Balloon Fiesta, the National Hispanic Cultural Center, and the Indian Pueblo Cultural Center. Albuquerque is home to a diverse population, with a variety of cultures and backgrounds. The city is home to a large Native American population, as well as a large Hispanic population. The city is also home to a number of immigrants from around the world, including Mexico, India, and the Philippines.
Common Questions
What is Per Capita Income in Albuquerque?
Per Capita income in Albuquerque is $36,879.
What is the Median Family Income in Albuquerque?
Median Family Income in Albuquerque is $78,926.
What is the Median Household income in Albuquerque?
Median Household Income in Albuquerque is $61,503.
What is Income or Wage Gap in Albuquerque?
Income or Wage Gap in Albuquerque is 18.7%.
Women in Albuquerque earn 81.3 cents for every dollar earned by a man.
What is Family Income Deficit in Albuquerque?
Family Income Deficit in Albuquerque is $10,827.
Families that are below poverty line in Albuquerque earn $10,827 less on average than the poverty threshold level.
What is Inequality or Gini Index in Albuquerque?
Inequality or Gini Index in Albuquerque is 0.47.
What is the Total Population of Albuquerque?
Total Population of Albuquerque is 562,551.
What is the Total Male Population of Albuquerque?
Total Male Population of Albuquerque is 276,027.
What is the Total Female Population of Albuquerque?
Total Female Population of Albuquerque is 286,524.
What is the Ratio of Males per 100 Females in Albuquerque?
There are 96.34 Males per 100 Females in Albuquerque.
What is the Ratio of Females per 100 Males in Albuquerque?
There are 103.80 Females per 100 Males in Albuquerque.
What is the Median Population Age in Albuquerque?
Median Population Age in Albuquerque is 38.0 Years.
What is the Average Family Size in Albuquerque
Average Family Size in Albuquerque is 3.1 People.
What is the Average Household Size in Albuquerque
Average Household Size in Albuquerque is 2.3 People.
How Large is the Labor Force in Albuquerque?
There are 294,709 People in the Labor Forcein in Albuquerque.
What is the Percentage of People in the Labor Force in Albuquerque?
64.2% of People are in the Labor Force in Albuquerque.
What is the Unemployment Rate in Albuquerque?
Unemployment Rate in Albuquerque is 5.5%.