Mcallen, TX Map & Demographics
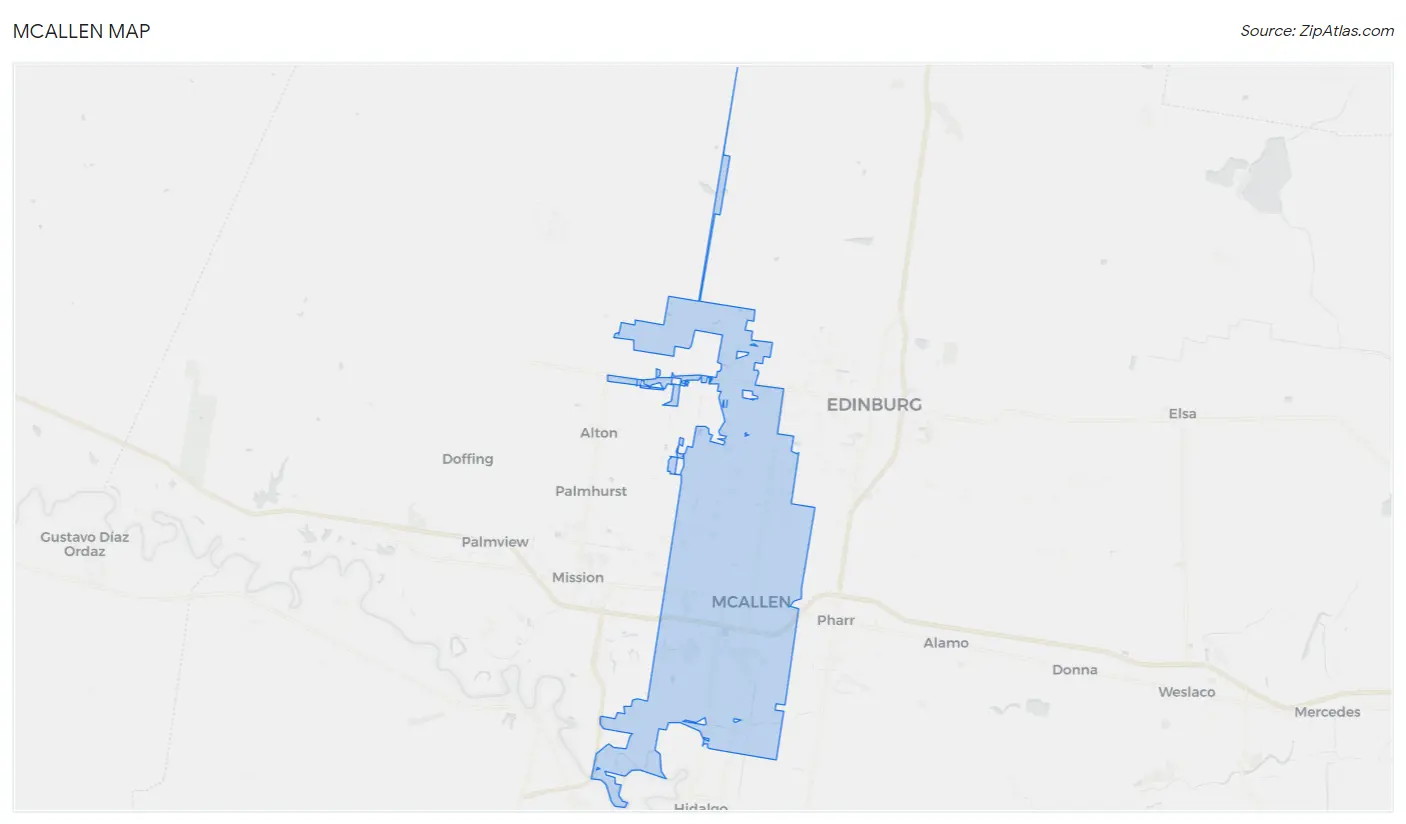
Mcallen Map
Mcallen Overview
$27,533
PER CAPITA INCOME
$63,255
AVG FAMILY INCOME
$56,326
AVG HOUSEHOLD INCOME
26.5%
WAGE / INCOME GAP [ % ]
73.5¢/ $1
WAGE / INCOME GAP [ $ ]
$11,194
FAMILY INCOME DEFICIT
0.50
INEQUALITY / GINI INDEX
142,722
TOTAL POPULATION
70,426
MALE POPULATION
72,296
FEMALE POPULATION
97.41
MALES / 100 FEMALES
102.66
FEMALES / 100 MALES
32.9
MEDIAN AGE
3.6
AVG FAMILY SIZE
3.0
AVG HOUSEHOLD SIZE
66,944
LABOR FORCE [ PEOPLE ]
62.2%
PERCENT IN LABOR FORCE
5.4%
UNEMPLOYMENT RATE
Mcallen Area Codes
Income in Mcallen
Income Overview in Mcallen
Per Capita Income in Mcallen is $27,533, while median incomes of families and households are $63,255 and $56,326 respectively.
| Characteristic | Number | Measure |
| Per Capita Income | 142,722 | $27,533 |
| Median Family Income | 35,176 | $63,255 |
| Mean Family Income | 35,176 | $90,892 |
| Median Household Income | 47,077 | $56,326 |
| Mean Household Income | 47,077 | $81,304 |
| Income Deficit | 35,176 | $11,194 |
| Wage / Income Gap (%) | 142,722 | 26.55% |
| Wage / Income Gap ($) | 142,722 | 73.45¢ per $1 |
| Gini / Inequality Index | 142,722 | 0.50 |
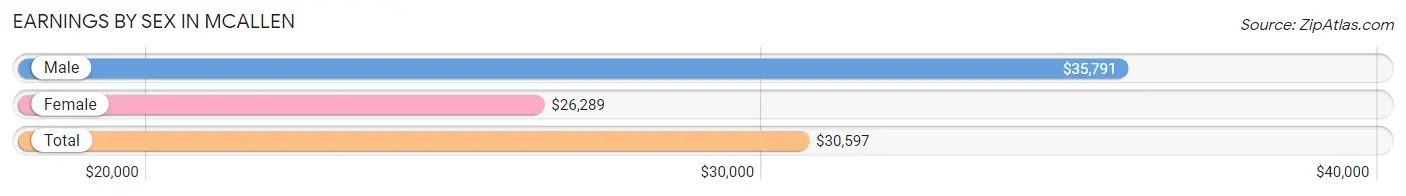
Earnings by Sex in Mcallen
Average Earnings in Mcallen are $30,597, $35,791 for men and $26,289 for women, a difference of 26.6%.
| Sex | Number | Average Earnings |
| Male | 36,382 (53.3%) | $35,791 |
| Female | 31,868 (46.7%) | $26,289 |
| Total | 68,250 (100.0%) | $30,597 |
Earnings by Sex by Income Bracket in Mcallen
The most common earnings brackets in Mcallen are $100,000+ for men (4,690 | 12.9%) and $25,000 to $29,999 for women (2,439 | 7.6%).
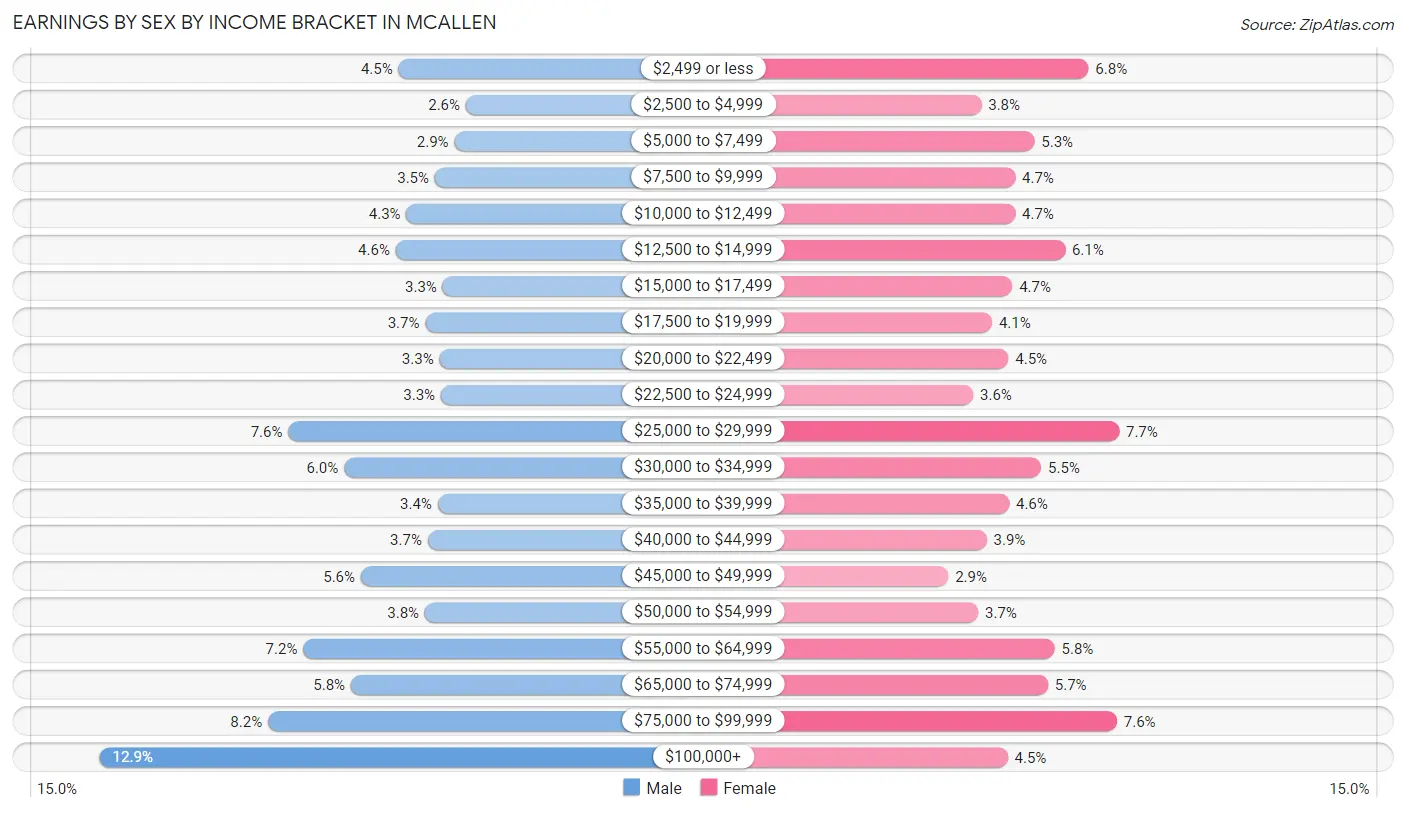
| Income | Male | Female |
| $2,499 or less | 1,635 (4.5%) | 2,163 (6.8%) |
| $2,500 to $4,999 | 946 (2.6%) | 1,204 (3.8%) |
| $5,000 to $7,499 | 1,064 (2.9%) | 1,680 (5.3%) |
| $7,500 to $9,999 | 1,264 (3.5%) | 1,508 (4.7%) |
| $10,000 to $12,499 | 1,552 (4.3%) | 1,507 (4.7%) |
| $12,500 to $14,999 | 1,664 (4.6%) | 1,952 (6.1%) |
| $15,000 to $17,499 | 1,184 (3.3%) | 1,481 (4.6%) |
| $17,500 to $19,999 | 1,359 (3.7%) | 1,299 (4.1%) |
| $20,000 to $22,499 | 1,214 (3.3%) | 1,447 (4.5%) |
| $22,500 to $24,999 | 1,201 (3.3%) | 1,132 (3.5%) |
| $25,000 to $29,999 | 2,762 (7.6%) | 2,439 (7.6%) |
| $30,000 to $34,999 | 2,189 (6.0%) | 1,740 (5.5%) |
| $35,000 to $39,999 | 1,235 (3.4%) | 1,453 (4.6%) |
| $40,000 to $44,999 | 1,337 (3.7%) | 1,254 (3.9%) |
| $45,000 to $49,999 | 2,021 (5.6%) | 908 (2.9%) |
| $50,000 to $54,999 | 1,364 (3.7%) | 1,177 (3.7%) |
| $55,000 to $64,999 | 2,610 (7.2%) | 1,861 (5.8%) |
| $65,000 to $74,999 | 2,121 (5.8%) | 1,802 (5.7%) |
| $75,000 to $99,999 | 2,970 (8.2%) | 2,420 (7.6%) |
| $100,000+ | 4,690 (12.9%) | 1,441 (4.5%) |
| Total | 36,382 (100.0%) | 31,868 (100.0%) |
Earnings by Sex by Educational Attainment in Mcallen
Average earnings in Mcallen are $44,439 for men and $29,832 for women, a difference of 32.9%. Men with an educational attainment of graduate degree enjoy the highest average annual earnings of $74,797, while those with less than high school education earn the least with $20,291. Women with an educational attainment of graduate degree earn the most with the average annual earnings of $68,331, while those with less than high school education have the smallest earnings of $14,321.
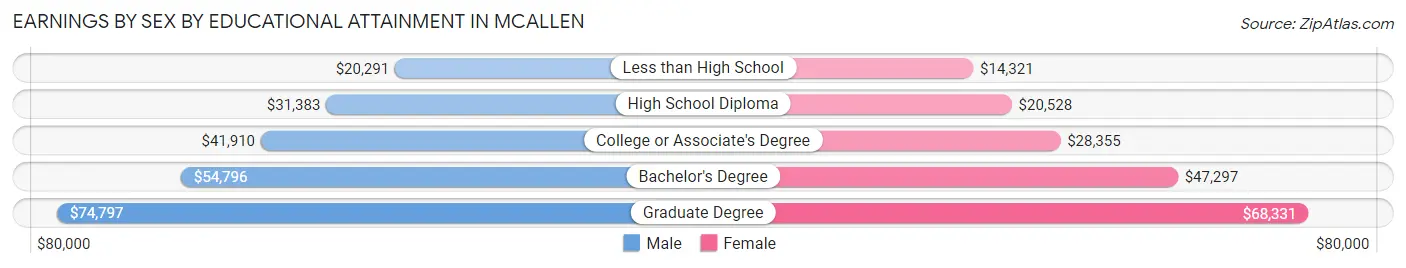
| Educational Attainment | Male Income | Female Income |
| Less than High School | $20,291 | $14,321 |
| High School Diploma | $31,383 | $20,528 |
| College or Associate's Degree | $41,910 | $28,355 |
| Bachelor's Degree | $54,796 | $47,297 |
| Graduate Degree | $74,797 | $68,331 |
| Total | $44,439 | $29,832 |
Family Income in Mcallen
Family Income Brackets in Mcallen
According to the Mcallen family income data, there are 6,402 families falling into the $50,000 to $74,999 income range, which is the most common income bracket and makes up 18.2% of all families. Conversely, the $10,000 to $14,999 income bracket is the least frequent group with only 1,196 families (3.4%) belonging to this category.
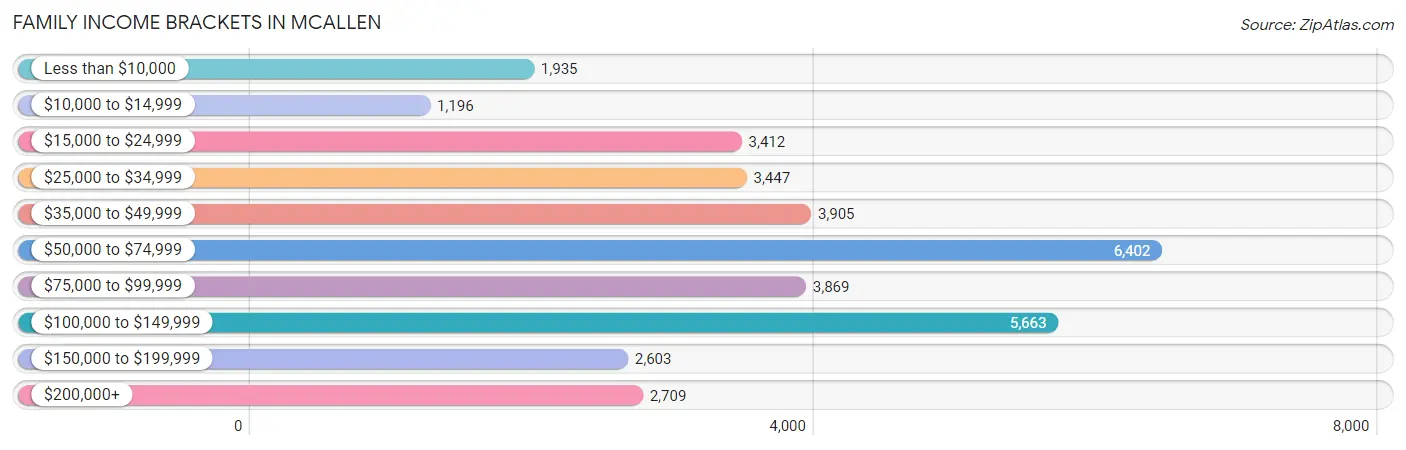
| Income Bracket | # Families | % Families |
| Less than $10,000 | 1,935 | 5.5% |
| $10,000 to $14,999 | 1,196 | 3.4% |
| $15,000 to $24,999 | 3,412 | 9.7% |
| $25,000 to $34,999 | 3,447 | 9.8% |
| $35,000 to $49,999 | 3,905 | 11.1% |
| $50,000 to $74,999 | 6,402 | 18.2% |
| $75,000 to $99,999 | 3,869 | 11.0% |
| $100,000 to $149,999 | 5,663 | 16.1% |
| $150,000 to $199,999 | 2,603 | 7.4% |
| $200,000+ | 2,709 | 7.7% |
Family Income by Famaliy Size in Mcallen
4-person families (7,545 | 21.4%) account for the highest median family income in Mcallen with $88,066 per family, while 2-person families (12,251 | 34.8%) have the highest median income of $27,776 per family member.
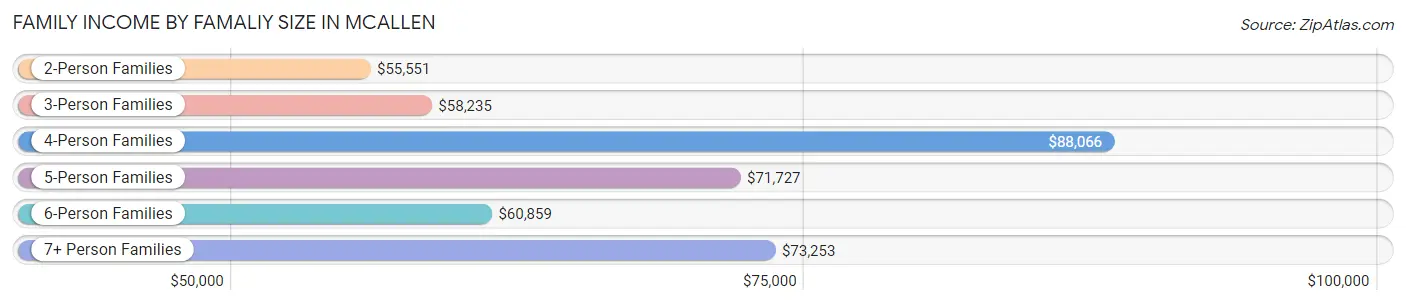
| Income Bracket | # Families | Median Income |
| 2-Person Families | 12,251 (34.8%) | $55,551 |
| 3-Person Families | 8,345 (23.7%) | $58,235 |
| 4-Person Families | 7,545 (21.4%) | $88,066 |
| 5-Person Families | 4,586 (13.0%) | $71,727 |
| 6-Person Families | 1,131 (3.2%) | $60,859 |
| 7+ Person Families | 1,318 (3.7%) | $73,253 |
| Total | 35,176 (100.0%) | $63,255 |
Family Income by Number of Earners in Mcallen
The median family income in Mcallen is $63,255, with families comprising 3+ earners (4,788) having the highest median family income of $111,991, while families with no earners (4,448) have the lowest median family income of $22,880, accounting for 13.6% and 12.6% of families, respectively.
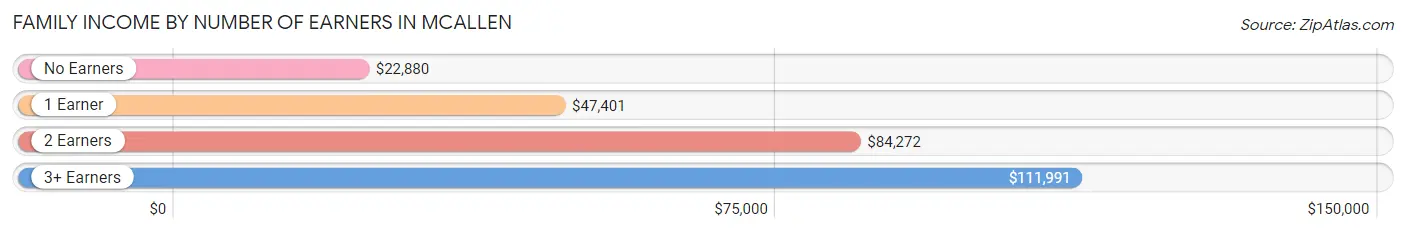
| Number of Earners | # Families | Median Income |
| No Earners | 4,448 (12.6%) | $22,880 |
| 1 Earner | 12,939 (36.8%) | $47,401 |
| 2 Earners | 13,001 (37.0%) | $84,272 |
| 3+ Earners | 4,788 (13.6%) | $111,991 |
| Total | 35,176 (100.0%) | $63,255 |
Household Income in Mcallen
Household Income Brackets in Mcallen
With 8,050 households falling in the category, the $50,000 to $74,999 income range is the most frequent in Mcallen, accounting for 17.1% of all households. In contrast, only 2,260 households (4.8%) fall into the $10,000 to $14,999 income bracket, making it the least populous group.
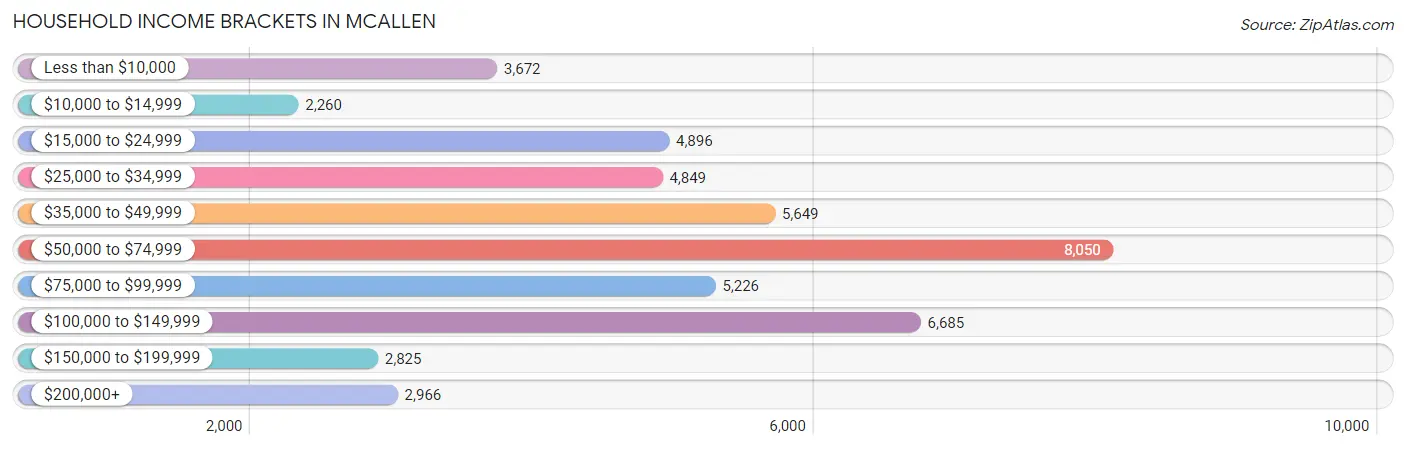
| Income Bracket | # Households | % Households |
| Less than $10,000 | 3,672 | 7.8% |
| $10,000 to $14,999 | 2,260 | 4.8% |
| $15,000 to $24,999 | 4,896 | 10.4% |
| $25,000 to $34,999 | 4,849 | 10.3% |
| $35,000 to $49,999 | 5,649 | 12.0% |
| $50,000 to $74,999 | 8,050 | 17.1% |
| $75,000 to $99,999 | 5,226 | 11.1% |
| $100,000 to $149,999 | 6,685 | 14.2% |
| $150,000 to $199,999 | 2,825 | 6.0% |
| $200,000+ | 2,966 | 6.3% |
Household Income by Householder Age in Mcallen
The median household income in Mcallen is $56,326, with the highest median household income of $68,766 found in the 45 to 64 years age bracket for the primary householder. A total of 16,792 households (35.7%) fall into this category. Meanwhile, the 15 to 24 years age bracket for the primary householder has the lowest median household income of $24,712, with 1,318 households (2.8%) in this group.
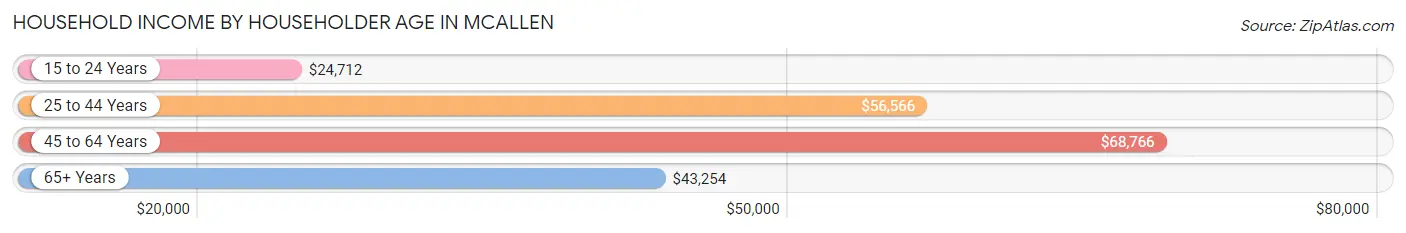
| Income Bracket | # Households | Median Income |
| 15 to 24 Years | 1,318 (2.8%) | $24,712 |
| 25 to 44 Years | 18,063 (38.4%) | $56,566 |
| 45 to 64 Years | 16,792 (35.7%) | $68,766 |
| 65+ Years | 10,904 (23.2%) | $43,254 |
| Total | 47,077 (100.0%) | $56,326 |
Poverty in Mcallen
Income Below Poverty by Sex and Age in Mcallen
With 18.7% poverty level for males and 23.2% for females among the residents of Mcallen, 5 year old males and 6 to 11 year old females are the most vulnerable to poverty, with 665 males (44.8%) and 2,085 females (33.8%) in their respective age groups living below the poverty level.
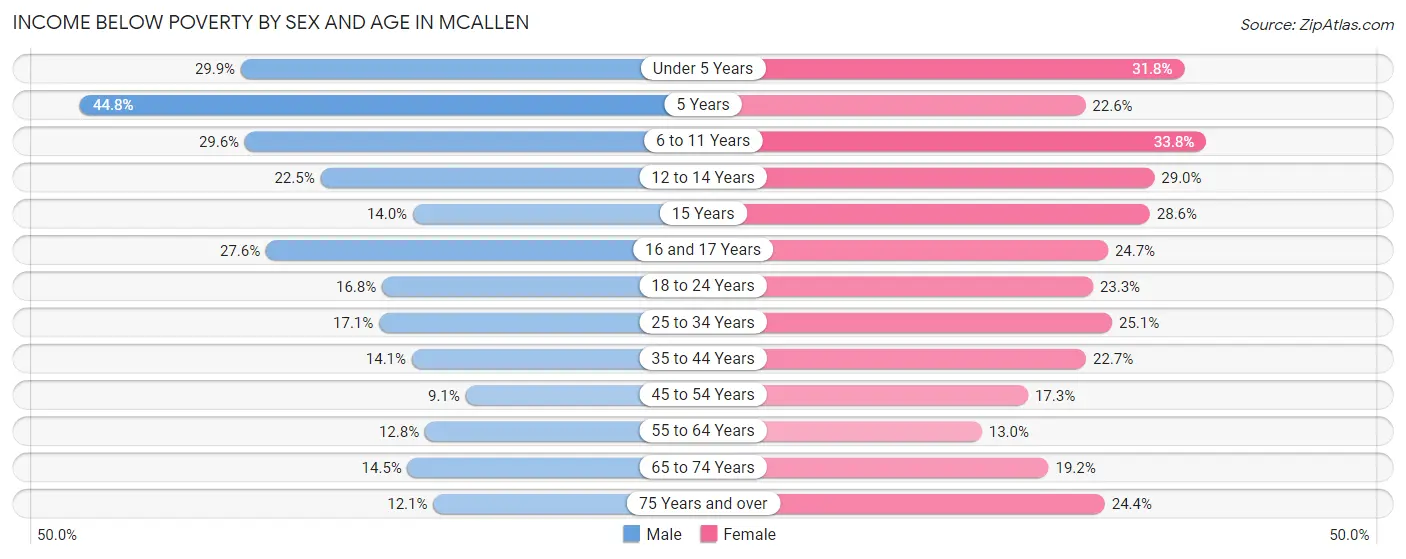
| Age Bracket | Male | Female |
| Under 5 Years | 1,654 (29.9%) | 1,390 (31.8%) |
| 5 Years | 665 (44.8%) | 168 (22.6%) |
| 6 to 11 Years | 2,161 (29.5%) | 2,085 (33.8%) |
| 12 to 14 Years | 826 (22.5%) | 936 (29.0%) |
| 15 Years | 139 (14.0%) | 356 (28.6%) |
| 16 and 17 Years | 844 (27.6%) | 562 (24.7%) |
| 18 to 24 Years | 1,212 (16.8%) | 1,683 (23.3%) |
| 25 to 34 Years | 1,824 (17.1%) | 2,540 (25.1%) |
| 35 to 44 Years | 1,300 (14.1%) | 2,151 (22.7%) |
| 45 to 54 Years | 714 (9.1%) | 1,576 (17.3%) |
| 55 to 64 Years | 691 (12.8%) | 928 (13.0%) |
| 65 to 74 Years | 711 (14.4%) | 1,129 (19.2%) |
| 75 Years and over | 299 (12.1%) | 1,141 (24.4%) |
| Total | 13,040 (18.7%) | 16,645 (23.2%) |
Income Above Poverty by Sex and Age in Mcallen
According to the poverty statistics in Mcallen, males aged 45 to 54 years and females aged 55 to 64 years are the age groups that are most secure financially, with 90.9% of males and 87.0% of females in these age groups living above the poverty line.
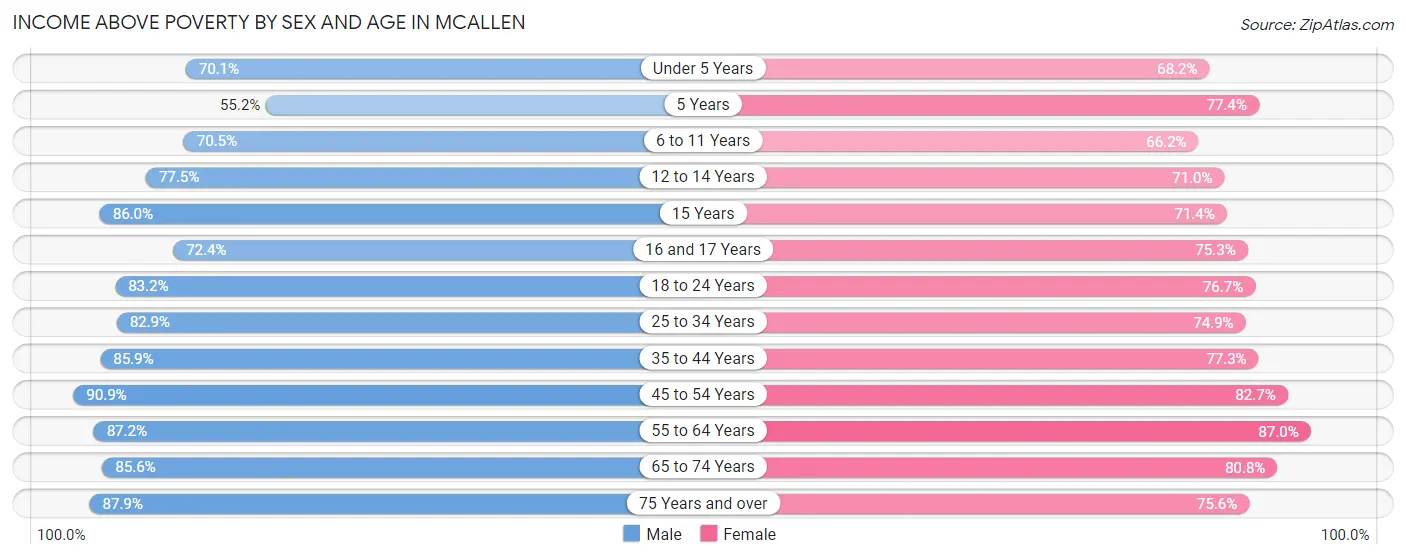
| Age Bracket | Male | Female |
| Under 5 Years | 3,874 (70.1%) | 2,984 (68.2%) |
| 5 Years | 818 (55.2%) | 575 (77.4%) |
| 6 to 11 Years | 5,152 (70.5%) | 4,081 (66.2%) |
| 12 to 14 Years | 2,838 (77.5%) | 2,290 (71.0%) |
| 15 Years | 857 (86.0%) | 889 (71.4%) |
| 16 and 17 Years | 2,215 (72.4%) | 1,713 (75.3%) |
| 18 to 24 Years | 5,989 (83.2%) | 5,538 (76.7%) |
| 25 to 34 Years | 8,842 (82.9%) | 7,589 (74.9%) |
| 35 to 44 Years | 7,945 (85.9%) | 7,338 (77.3%) |
| 45 to 54 Years | 7,155 (90.9%) | 7,545 (82.7%) |
| 55 to 64 Years | 4,689 (87.2%) | 6,215 (87.0%) |
| 65 to 74 Years | 4,211 (85.6%) | 4,753 (80.8%) |
| 75 Years and over | 2,179 (87.9%) | 3,534 (75.6%) |
| Total | 56,764 (81.3%) | 55,044 (76.8%) |
Income Below Poverty Among Married-Couple Families in Mcallen
The poverty statistics for married-couple families in Mcallen show that 11.6% or 2,656 of the total 22,899 families live below the poverty line. Families with 5 or more children have the highest poverty rate of 56.9%, comprising of 128 families. On the other hand, families with no children have the lowest poverty rate of 6.8%, which includes 761 families.
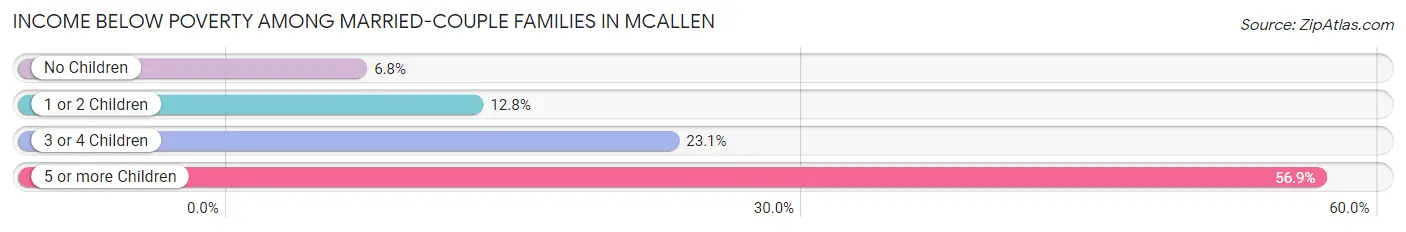
| Children | Above Poverty | Below Poverty |
| No Children | 10,518 (93.2%) | 761 (6.8%) |
| 1 or 2 Children | 7,328 (87.2%) | 1,078 (12.8%) |
| 3 or 4 Children | 2,300 (76.9%) | 689 (23.1%) |
| 5 or more Children | 97 (43.1%) | 128 (56.9%) |
| Total | 20,243 (88.4%) | 2,656 (11.6%) |
Income Below Poverty Among Single-Parent Households in Mcallen
According to the poverty data in Mcallen, 17.7% or 470 single-father households and 35.1% or 3,371 single-mother households are living below the poverty line. Among single-father households, those with 3 or 4 children have the highest poverty rate, with 47 households (24.2%) experiencing poverty. Likewise, among single-mother households, those with 5 or more children have the highest poverty rate, with 112 households (81.8%) falling below the poverty line.
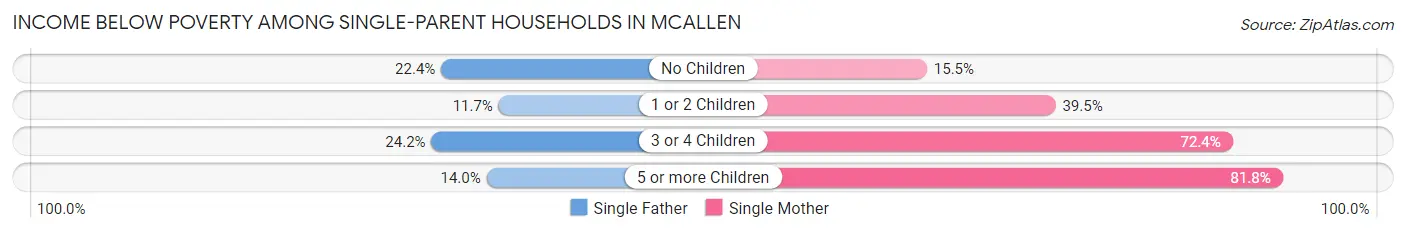
| Children | Single Father | Single Mother |
| No Children | 275 (22.4%) | 565 (15.5%) |
| 1 or 2 Children | 130 (11.7%) | 1,832 (39.5%) |
| 3 or 4 Children | 47 (24.2%) | 862 (72.4%) |
| 5 or more Children | 18 (14.0%) | 112 (81.8%) |
| Total | 470 (17.7%) | 3,371 (35.1%) |
Income Below Poverty Among Married-Couple vs Single-Parent Households in Mcallen
The poverty data for Mcallen shows that 2,656 of the married-couple family households (11.6%) and 3,841 of the single-parent households (31.3%) are living below the poverty level. Within the married-couple family households, those with 5 or more children have the highest poverty rate, with 128 households (56.9%) falling below the poverty line. Among the single-parent households, those with 3 or 4 children have the highest poverty rate, with 909 household (65.7%) living below poverty.
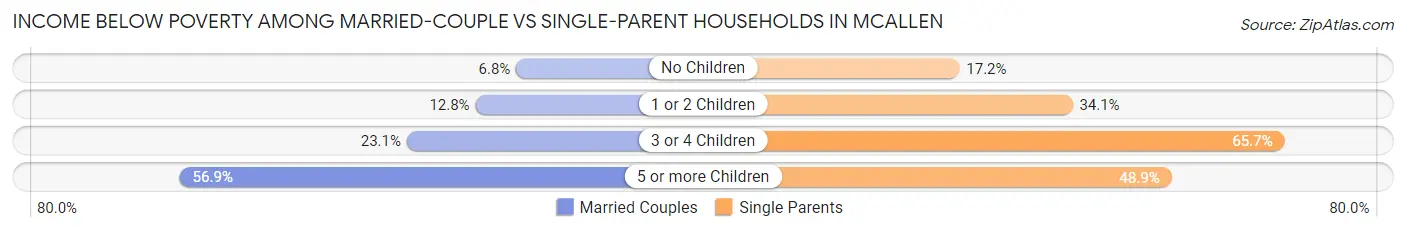
| Children | Married-Couple Families | Single-Parent Households |
| No Children | 761 (6.8%) | 840 (17.2%) |
| 1 or 2 Children | 1,078 (12.8%) | 1,962 (34.1%) |
| 3 or 4 Children | 689 (23.1%) | 909 (65.7%) |
| 5 or more Children | 128 (56.9%) | 130 (48.9%) |
| Total | 2,656 (11.6%) | 3,841 (31.3%) |
Race in Mcallen
The most populous races in Mcallen are Hispanic or Latino (124,216 | 87.0%), White / Caucasian (74,441 | 52.2%), and Two or more Races (37,156 | 26.0%).
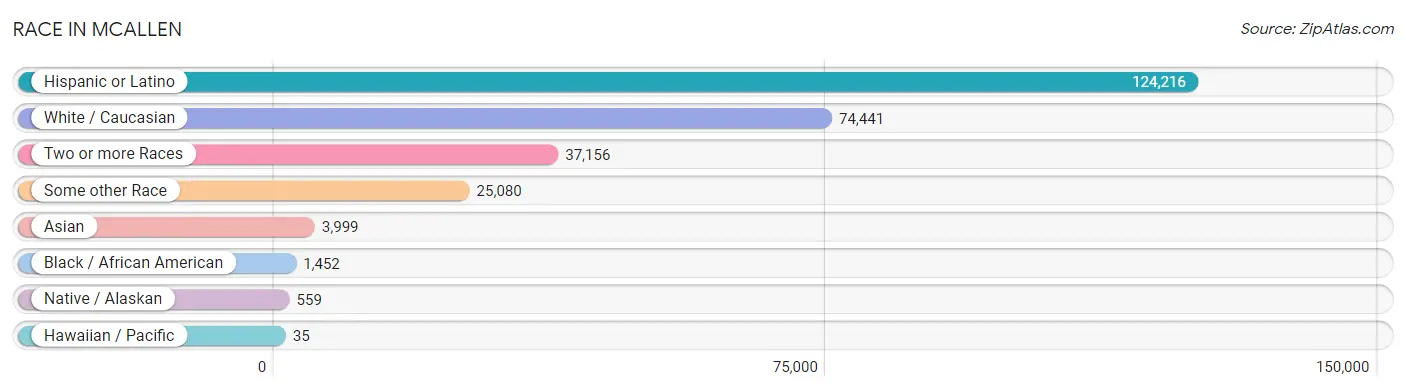
| Race | # Population | % Population |
| Asian | 3,999 | 2.8% |
| Black / African American | 1,452 | 1.0% |
| Hawaiian / Pacific | 35 | 0.0% |
| Hispanic or Latino | 124,216 | 87.0% |
| Native / Alaskan | 559 | 0.4% |
| White / Caucasian | 74,441 | 52.2% |
| Two or more Races | 37,156 | 26.0% |
| Some other Race | 25,080 | 17.6% |
| Total | 142,722 | 100.0% |
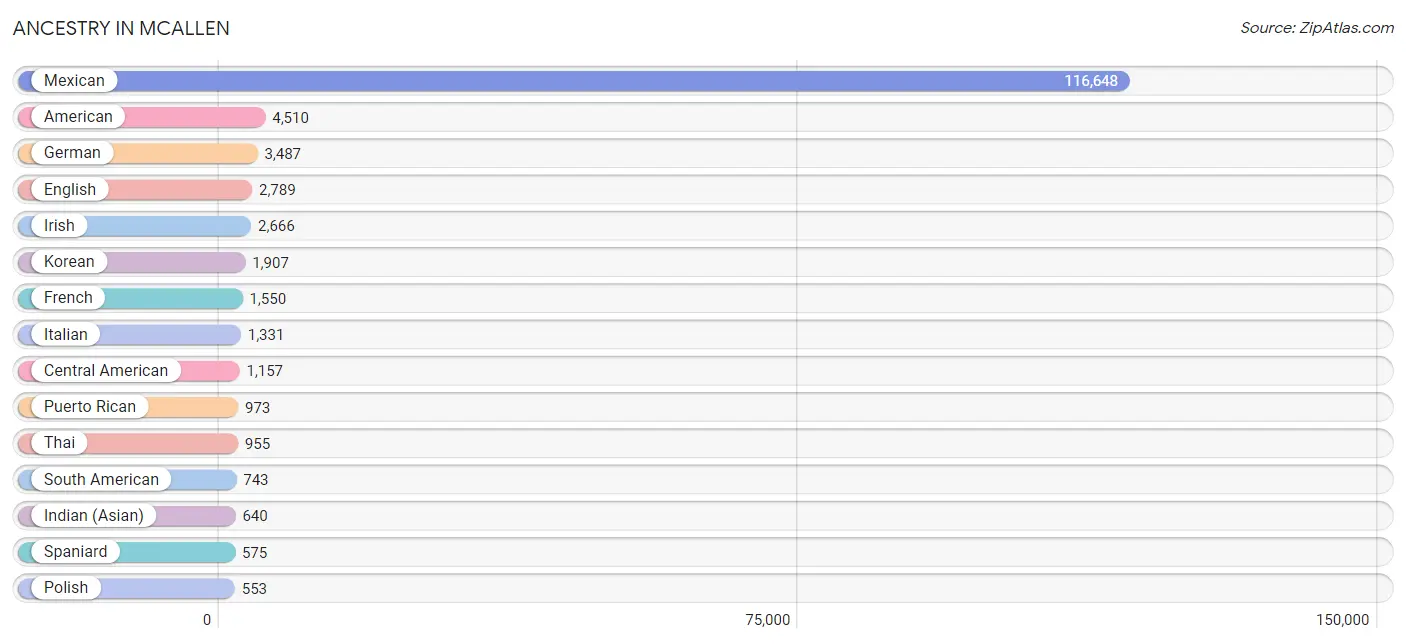
Ancestry in Mcallen
The most populous ancestries reported in Mcallen are Mexican (116,648 | 81.7%), American (4,510 | 3.2%), German (3,487 | 2.4%), English (2,789 | 1.9%), and Irish (2,666 | 1.9%), together accounting for 91.1% of all Mcallen residents.
| Ancestry | # Population | % Population |
| African | 39 | 0.0% |
| Alsatian | 1 | 0.0% |
| American | 4,510 | 3.2% |
| Apache | 9 | 0.0% |
| Arab | 241 | 0.2% |
| Argentinean | 114 | 0.1% |
| Armenian | 5 | 0.0% |
| Australian | 67 | 0.1% |
| Austrian | 20 | 0.0% |
| Bahamian | 32 | 0.0% |
| Bangladeshi | 10 | 0.0% |
| Belgian | 35 | 0.0% |
| Bhutanese | 115 | 0.1% |
| Bolivian | 31 | 0.0% |
| Brazilian | 27 | 0.0% |
| British | 104 | 0.1% |
| Bulgarian | 9 | 0.0% |
| Burmese | 331 | 0.2% |
| Canadian | 88 | 0.1% |
| Carpatho Rusyn | 27 | 0.0% |
| Celtic | 9 | 0.0% |
| Central American | 1,157 | 0.8% |
| Central American Indian | 396 | 0.3% |
| Cherokee | 92 | 0.1% |
| Chickasaw | 73 | 0.1% |
| Chilean | 25 | 0.0% |
| Choctaw | 6 | 0.0% |
| Colombian | 133 | 0.1% |
| Comanche | 24 | 0.0% |
| Croatian | 9 | 0.0% |
| Cuban | 76 | 0.1% |
| Czech | 124 | 0.1% |
| Czechoslovakian | 25 | 0.0% |
| Danish | 65 | 0.1% |
| Dominican | 155 | 0.1% |
| Dutch | 331 | 0.2% |
| Eastern European | 45 | 0.0% |
| Egyptian | 2 | 0.0% |
| English | 2,789 | 1.9% |
| European | 337 | 0.2% |
| Filipino | 36 | 0.0% |
| Finnish | 15 | 0.0% |
| French | 1,550 | 1.1% |
| French Canadian | 122 | 0.1% |
| German | 3,487 | 2.4% |
| Greek | 32 | 0.0% |
| Guamanian / Chamorro | 11 | 0.0% |
| Guatemalan | 284 | 0.2% |
| Honduran | 251 | 0.2% |
| Hungarian | 48 | 0.0% |
| Indian (Asian) | 640 | 0.4% |
| Indonesian | 41 | 0.0% |
| Iranian | 68 | 0.1% |
| Irish | 2,666 | 1.9% |
| Iroquois | 7 | 0.0% |
| Israeli | 25 | 0.0% |
| Italian | 1,331 | 0.9% |
| Jamaican | 7 | 0.0% |
| Korean | 1,907 | 1.3% |
| Laotian | 93 | 0.1% |
| Lebanese | 130 | 0.1% |
| Lithuanian | 10 | 0.0% |
| Mexican | 116,648 | 81.7% |
| Mexican American Indian | 155 | 0.1% |
| Native Hawaiian | 31 | 0.0% |
| Navajo | 59 | 0.0% |
| Nicaraguan | 32 | 0.0% |
| Nigerian | 103 | 0.1% |
| Northern European | 71 | 0.1% |
| Norwegian | 216 | 0.2% |
| Panamanian | 81 | 0.1% |
| Pennsylvania German | 5 | 0.0% |
| Peruvian | 236 | 0.2% |
| Polish | 553 | 0.4% |
| Portuguese | 166 | 0.1% |
| Pueblo | 18 | 0.0% |
| Puerto Rican | 973 | 0.7% |
| Romanian | 29 | 0.0% |
| Russian | 65 | 0.1% |
| Salvadoran | 509 | 0.4% |
| Scandinavian | 55 | 0.0% |
| Scotch-Irish | 153 | 0.1% |
| Scottish | 317 | 0.2% |
| Slovak | 18 | 0.0% |
| South American | 743 | 0.5% |
| Spaniard | 575 | 0.4% |
| Spanish | 486 | 0.3% |
| Sri Lankan | 316 | 0.2% |
| Subsaharan African | 142 | 0.1% |
| Swedish | 216 | 0.2% |
| Swiss | 79 | 0.1% |
| Syrian | 39 | 0.0% |
| Thai | 955 | 0.7% |
| Ukrainian | 35 | 0.0% |
| Uruguayan | 7 | 0.0% |
| Venezuelan | 164 | 0.1% |
| Welsh | 93 | 0.1% |
| Yaqui | 7 | 0.0% |
| Yugoslavian | 19 | 0.0% | View All 99 Rows |
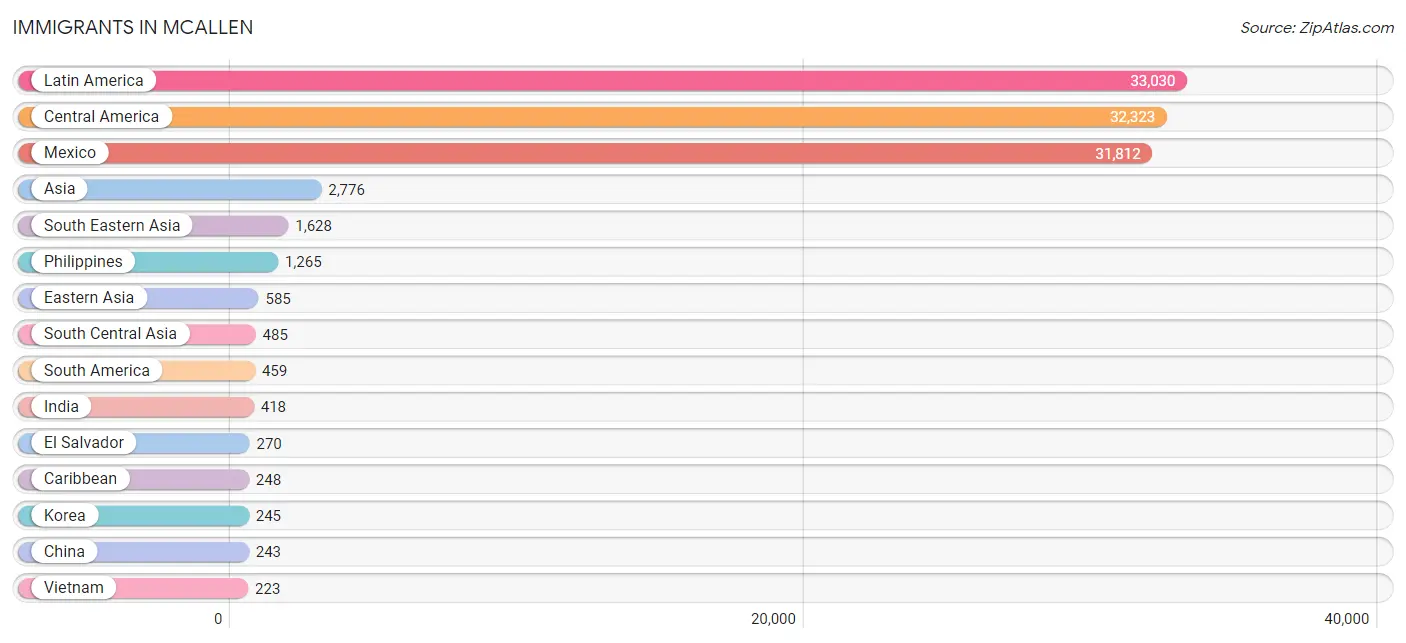
Immigrants in Mcallen
The most numerous immigrant groups reported in Mcallen came from Latin America (33,030 | 23.1%), Central America (32,323 | 22.7%), Mexico (31,812 | 22.3%), Asia (2,776 | 1.9%), and South Eastern Asia (1,628 | 1.1%), together accounting for 71.2% of all Mcallen residents.
| Immigration Origin | # Population | % Population |
| Africa | 100 | 0.1% |
| Argentina | 47 | 0.0% |
| Asia | 2,776 | 1.9% |
| Australia | 25 | 0.0% |
| Bangladesh | 20 | 0.0% |
| Belgium | 2 | 0.0% |
| Bolivia | 8 | 0.0% |
| Brazil | 15 | 0.0% |
| Canada | 33 | 0.0% |
| Caribbean | 248 | 0.2% |
| Central America | 32,323 | 22.7% |
| Chile | 12 | 0.0% |
| China | 243 | 0.2% |
| Colombia | 61 | 0.0% |
| Cuba | 9 | 0.0% |
| Dominican Republic | 154 | 0.1% |
| Eastern Asia | 585 | 0.4% |
| Eastern Europe | 77 | 0.1% |
| Egypt | 2 | 0.0% |
| El Salvador | 270 | 0.2% |
| England | 20 | 0.0% |
| Europe | 171 | 0.1% |
| France | 10 | 0.0% |
| Germany | 23 | 0.0% |
| Guatemala | 139 | 0.1% |
| Honduras | 76 | 0.1% |
| Hong Kong | 34 | 0.0% |
| Hungary | 4 | 0.0% |
| India | 418 | 0.3% |
| Indonesia | 82 | 0.1% |
| Iran | 39 | 0.0% |
| Iraq | 46 | 0.0% |
| Japan | 97 | 0.1% |
| Korea | 245 | 0.2% |
| Latin America | 33,030 | 23.1% |
| Malaysia | 23 | 0.0% |
| Mexico | 31,812 | 22.3% |
| Nepal | 8 | 0.0% |
| Nigeria | 98 | 0.1% |
| Northern Africa | 2 | 0.0% |
| Northern Europe | 28 | 0.0% |
| Oceania | 25 | 0.0% |
| Panama | 26 | 0.0% |
| Peru | 114 | 0.1% |
| Philippines | 1,265 | 0.9% |
| Poland | 19 | 0.0% |
| Romania | 29 | 0.0% |
| Russia | 18 | 0.0% |
| South America | 459 | 0.3% |
| South Central Asia | 485 | 0.3% |
| South Eastern Asia | 1,628 | 1.1% |
| Southern Europe | 31 | 0.0% |
| Spain | 31 | 0.0% |
| Taiwan | 189 | 0.1% |
| Thailand | 14 | 0.0% |
| Trinidad and Tobago | 85 | 0.1% |
| Ukraine | 7 | 0.0% |
| Uruguay | 7 | 0.0% |
| Venezuela | 195 | 0.1% |
| Vietnam | 223 | 0.2% |
| Western Africa | 98 | 0.1% |
| Western Asia | 58 | 0.0% |
| Western Europe | 35 | 0.0% | View All 63 Rows |
Sex and Age in Mcallen
Sex and Age in Mcallen
The most populous age groups in Mcallen are 10 to 14 Years (6,478 | 9.2%) for men and 20 to 24 Years (5,491 | 7.6%) for women.
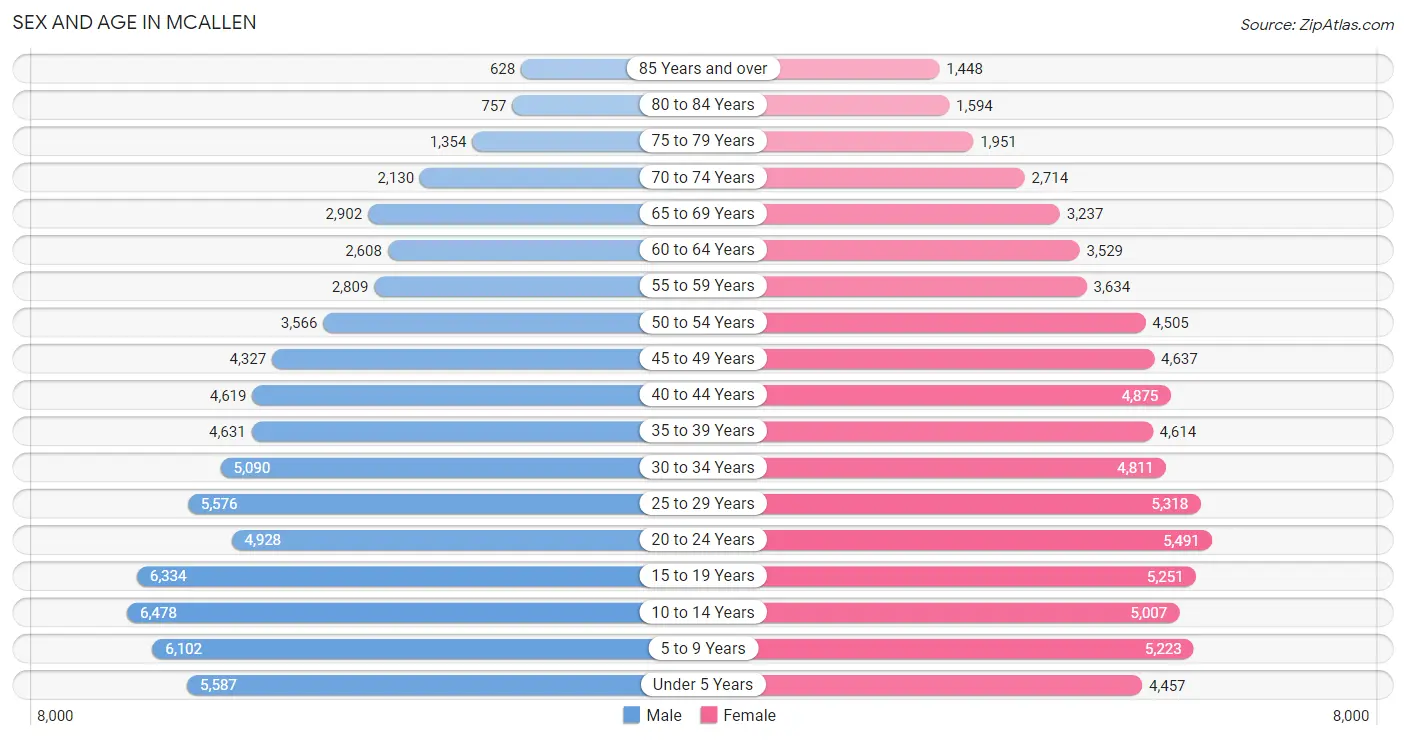
| Age Bracket | Male | Female |
| Under 5 Years | 5,587 (7.9%) | 4,457 (6.2%) |
| 5 to 9 Years | 6,102 (8.7%) | 5,223 (7.2%) |
| 10 to 14 Years | 6,478 (9.2%) | 5,007 (6.9%) |
| 15 to 19 Years | 6,334 (9.0%) | 5,251 (7.3%) |
| 20 to 24 Years | 4,928 (7.0%) | 5,491 (7.6%) |
| 25 to 29 Years | 5,576 (7.9%) | 5,318 (7.4%) |
| 30 to 34 Years | 5,090 (7.2%) | 4,811 (6.7%) |
| 35 to 39 Years | 4,631 (6.6%) | 4,614 (6.4%) |
| 40 to 44 Years | 4,619 (6.6%) | 4,875 (6.7%) |
| 45 to 49 Years | 4,327 (6.1%) | 4,637 (6.4%) |
| 50 to 54 Years | 3,566 (5.1%) | 4,505 (6.2%) |
| 55 to 59 Years | 2,809 (4.0%) | 3,634 (5.0%) |
| 60 to 64 Years | 2,608 (3.7%) | 3,529 (4.9%) |
| 65 to 69 Years | 2,902 (4.1%) | 3,237 (4.5%) |
| 70 to 74 Years | 2,130 (3.0%) | 2,714 (3.7%) |
| 75 to 79 Years | 1,354 (1.9%) | 1,951 (2.7%) |
| 80 to 84 Years | 757 (1.1%) | 1,594 (2.2%) |
| 85 Years and over | 628 (0.9%) | 1,448 (2.0%) |
| Total | 70,426 (100.0%) | 72,296 (100.0%) |
Families and Households in Mcallen
Median Family Size in Mcallen
The median family size in Mcallen is 3.56 persons per family, with married-couple families (22,899 | 65.1%) accounting for the largest median family size of 3.72 persons per family. On the other hand, single male/father families (2,662 | 7.6%) represent the smallest median family size with 3.09 persons per family.
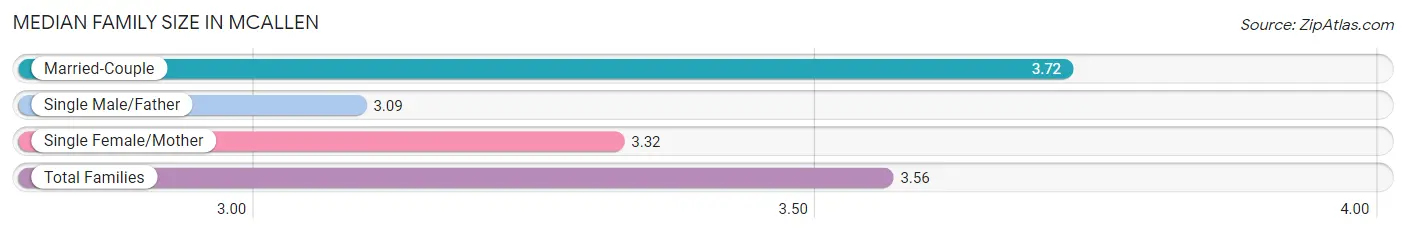
| Family Type | # Families | Family Size |
| Married-Couple | 22,899 (65.1%) | 3.72 |
| Single Male/Father | 2,662 (7.6%) | 3.09 |
| Single Female/Mother | 9,615 (27.3%) | 3.32 |
| Total Families | 35,176 (100.0%) | 3.56 |
Median Household Size in Mcallen
The median household size in Mcallen is 3.01 persons per household, with married-couple households (22,899 | 48.6%) accounting for the largest median household size of 3.73 persons per household. non-family households (11,901 | 25.3%) represent the smallest median household size with 1.20 persons per household.
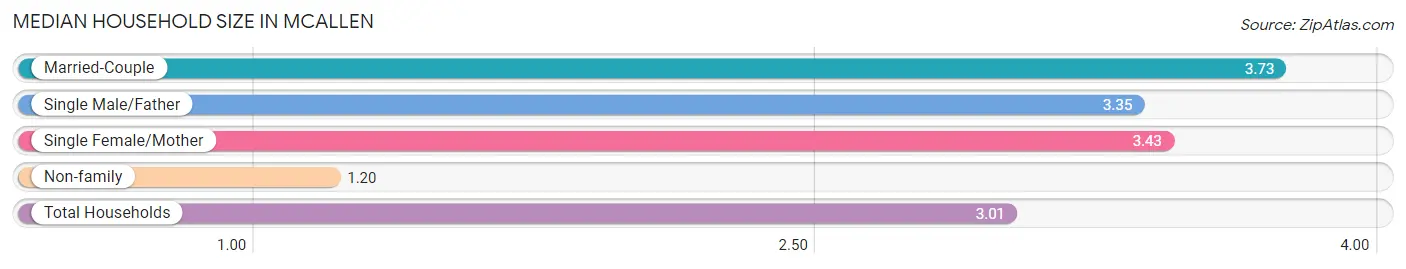
| Household Type | # Households | Household Size |
| Married-Couple | 22,899 (48.6%) | 3.73 |
| Single Male/Father | 2,662 (5.7%) | 3.35 |
| Single Female/Mother | 9,615 (20.4%) | 3.43 |
| Non-family | 11,901 (25.3%) | 1.20 |
| Total Households | 47,077 (100.0%) | 3.01 |
Household Size by Marriage Status in Mcallen
Out of a total of 47,077 households in Mcallen, 35,176 (74.7%) are family households, while 11,901 (25.3%) are nonfamily households. The most numerous type of family households are 2-person households, comprising 11,475, and the most common type of nonfamily households are 1-person households, comprising 9,965.
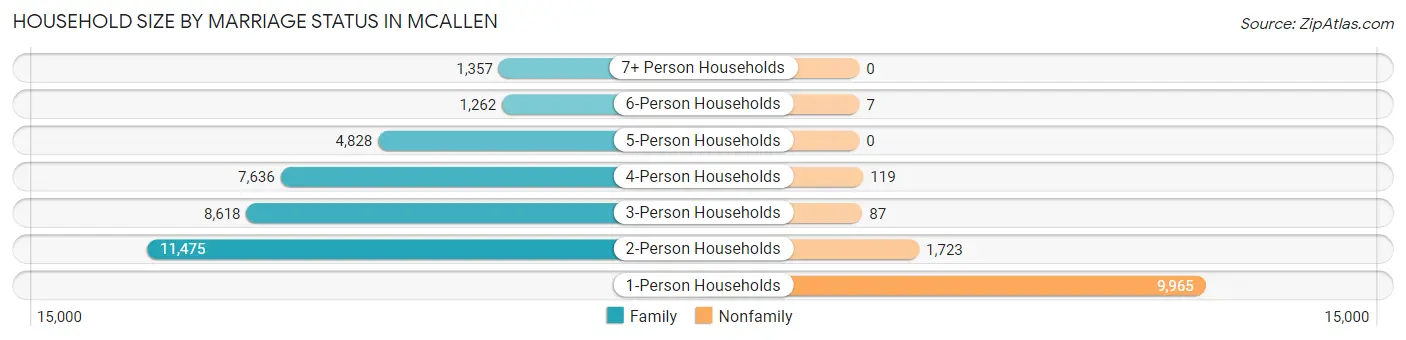
| Household Size | Family Households | Nonfamily Households |
| 1-Person Households | - | 9,965 (21.2%) |
| 2-Person Households | 11,475 (24.4%) | 1,723 (3.7%) |
| 3-Person Households | 8,618 (18.3%) | 87 (0.2%) |
| 4-Person Households | 7,636 (16.2%) | 119 (0.3%) |
| 5-Person Households | 4,828 (10.3%) | 0 (0.0%) |
| 6-Person Households | 1,262 (2.7%) | 7 (0.0%) |
| 7+ Person Households | 1,357 (2.9%) | 0 (0.0%) |
| Total | 35,176 (74.7%) | 11,901 (25.3%) |
Female Fertility in Mcallen
Fertility by Age in Mcallen
Average fertility rate in Mcallen is 64.0 births per 1,000 women. Women in the age bracket of 20 to 34 years have the highest fertility rate with 110.0 births per 1,000 women. Women in the age bracket of 20 to 34 years acount for 74.7% of all women with births.
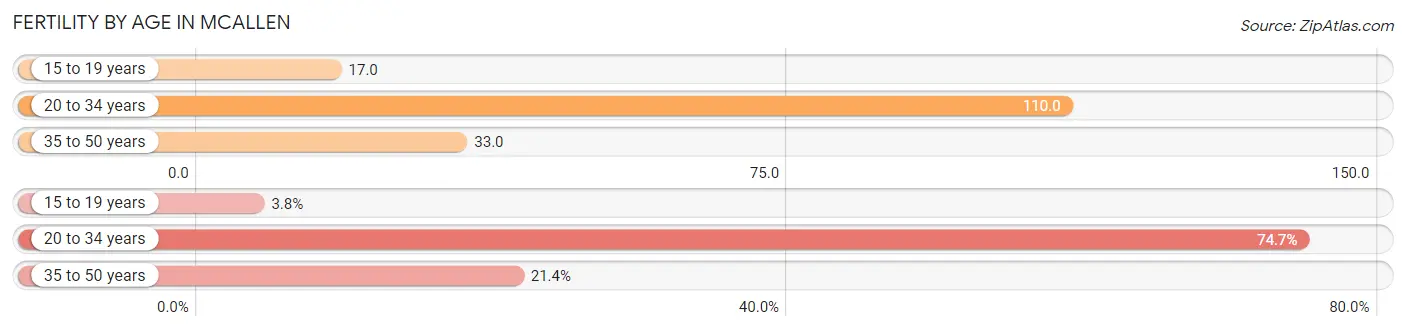
| Age Bracket | Women with Births | Births / 1,000 Women |
| 15 to 19 years | 88 (3.8%) | 17.0 |
| 20 to 34 years | 1,719 (74.7%) | 110.0 |
| 35 to 50 years | 493 (21.4%) | 33.0 |
| Total | 2,300 (100.0%) | 64.0 |
Fertility by Age by Marriage Status in Mcallen
82.4% of women with births (2,300) in Mcallen are married. The highest percentage of unmarried women with births falls into 15 to 19 years age bracket with 100.0% of them unmarried at the time of birth, while the lowest percentage of unmarried women with births belong to 35 to 50 years age bracket with 9.1% of them unmarried.
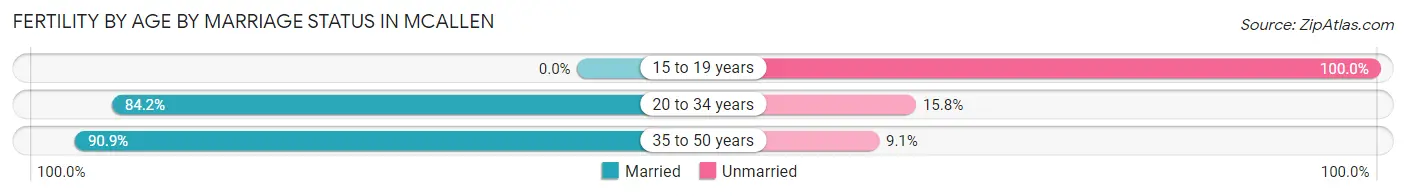
| Age Bracket | Married | Unmarried |
| 15 to 19 years | 0 (0.0%) | 88 (100.0%) |
| 20 to 34 years | 1,447 (84.2%) | 272 (15.8%) |
| 35 to 50 years | 448 (90.9%) | 45 (9.1%) |
| Total | 1,895 (82.4%) | 405 (17.6%) |
Fertility by Education in Mcallen
Average fertility rate in Mcallen is 64.0 births per 1,000 women. Women with the education attainment of graduate degree have the highest fertility rate of 80.0 births per 1,000 women, while women with the education attainment of bachelor's degree have the lowest fertility at 44.0 births per 1,000 women. Women with the education attainment of college or associate's degree represent 31.0% of all women with births.
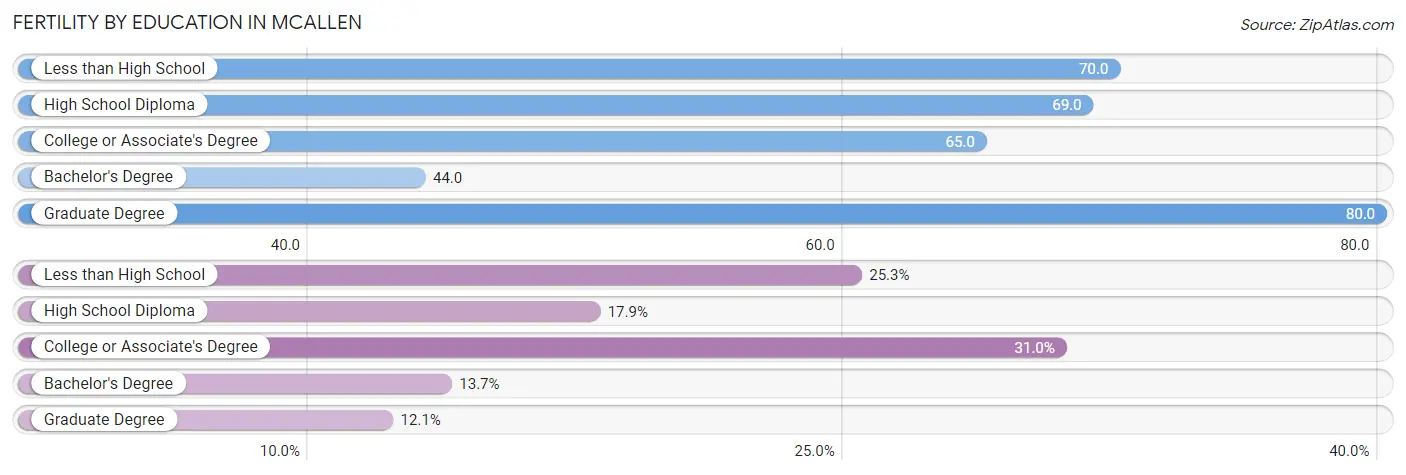
| Educational Attainment | Women with Births | Births / 1,000 Women |
| Less than High School | 581 (25.3%) | 70.0 |
| High School Diploma | 412 (17.9%) | 69.0 |
| College or Associate's Degree | 713 (31.0%) | 65.0 |
| Bachelor's Degree | 316 (13.7%) | 44.0 |
| Graduate Degree | 278 (12.1%) | 80.0 |
| Total | 2,300 (100.0%) | 64.0 |
Fertility by Education by Marriage Status in Mcallen
17.6% of women with births in Mcallen are unmarried. Women with the educational attainment of graduate degree are most likely to be married with 100.0% of them married at childbirth, while women with the educational attainment of college or associate's degree are least likely to be married with 25.5% of them unmarried at childbirth.
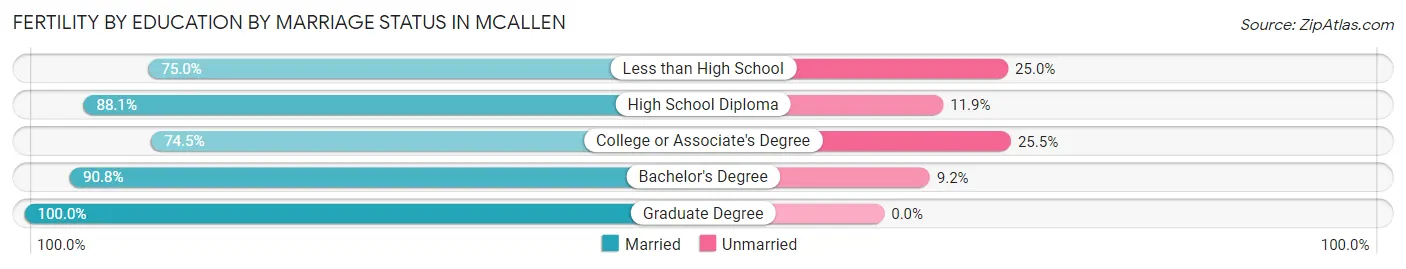
| Educational Attainment | Married | Unmarried |
| Less than High School | 436 (75.0%) | 145 (25.0%) |
| High School Diploma | 363 (88.1%) | 49 (11.9%) |
| College or Associate's Degree | 531 (74.5%) | 182 (25.5%) |
| Bachelor's Degree | 287 (90.8%) | 29 (9.2%) |
| Graduate Degree | 278 (100.0%) | 0 (0.0%) |
| Total | 1,895 (82.4%) | 405 (17.6%) |
Employment Characteristics in Mcallen
Employment by Class of Employer in Mcallen
Among the 62,050 employed individuals in Mcallen, private company employees (39,992 | 64.4%), self-employed (not incorporated) (6,620 | 10.7%), and local government employees (4,799 | 7.7%) make up the most common classes of employment.
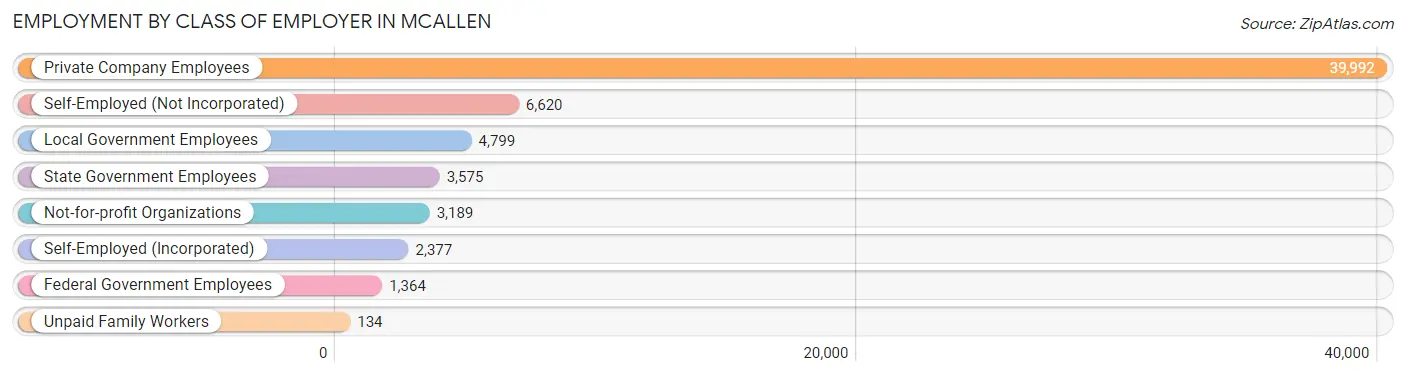
| Employer Class | # Employees | % Employees |
| Private Company Employees | 39,992 | 64.4% |
| Self-Employed (Incorporated) | 2,377 | 3.8% |
| Self-Employed (Not Incorporated) | 6,620 | 10.7% |
| Not-for-profit Organizations | 3,189 | 5.1% |
| Local Government Employees | 4,799 | 7.7% |
| State Government Employees | 3,575 | 5.8% |
| Federal Government Employees | 1,364 | 2.2% |
| Unpaid Family Workers | 134 | 0.2% |
| Total | 62,050 | 100.0% |
Employment Status by Age in Mcallen
According to the labor force statistics for Mcallen, out of the total population over 16 years of age (107,627), 62.2% or 66,944 individuals are in the labor force, with 5.4% or 3,615 of them unemployed. The age group with the highest labor force participation rate is 25 to 29 years, with 82.1% or 8,944 individuals in the labor force. Within the labor force, the 16 to 19 years age range has the highest percentage of unemployed individuals, with 22.4% or 475 of them being unemployed.
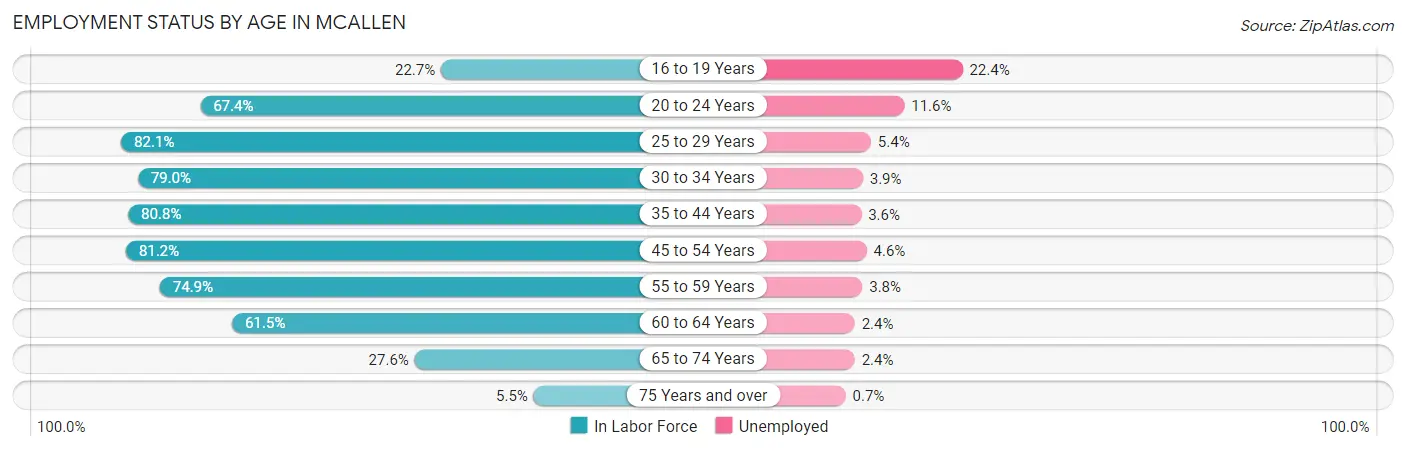
| Age Bracket | In Labor Force | Unemployed |
| 16 to 19 Years | 2,121 (22.7%) | 475 (22.4%) |
| 20 to 24 Years | 7,022 (67.4%) | 815 (11.6%) |
| 25 to 29 Years | 8,944 (82.1%) | 483 (5.4%) |
| 30 to 34 Years | 7,822 (79.0%) | 305 (3.9%) |
| 35 to 44 Years | 15,141 (80.8%) | 545 (3.6%) |
| 45 to 54 Years | 13,832 (81.2%) | 636 (4.6%) |
| 55 to 59 Years | 4,826 (74.9%) | 183 (3.8%) |
| 60 to 64 Years | 3,774 (61.5%) | 91 (2.4%) |
| 65 to 74 Years | 3,031 (27.6%) | 73 (2.4%) |
| 75 Years and over | 425 (5.5%) | 3 (0.7%) |
| Total | 66,944 (62.2%) | 3,615 (5.4%) |
Employment Status by Educational Attainment in Mcallen
According to labor force statistics for Mcallen, 78.6% of individuals (54,351) out of the total population between 25 and 64 years of age (69,149) are in the labor force, with 4.1% or 2,228 of them being unemployed. The group with the highest labor force participation rate are those with the educational attainment of bachelor's degree or higher, with 85.0% or 20,254 individuals in the labor force. Within the labor force, individuals with high school diploma education have the highest percentage of unemployment, with 6.0% or 657 of them being unemployed.
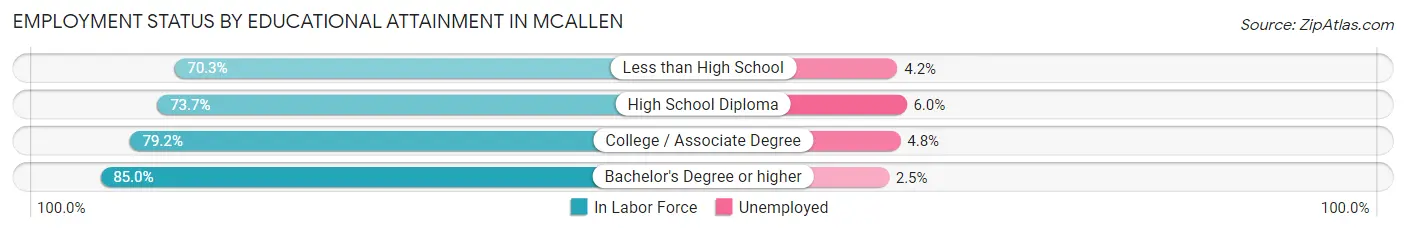
| Educational Attainment | In Labor Force | Unemployed |
| Less than High School | 7,687 (70.3%) | 459 (4.2%) |
| High School Diploma | 10,956 (73.7%) | 892 (6.0%) |
| College / Associate Degree | 15,461 (79.2%) | 937 (4.8%) |
| Bachelor's Degree or higher | 20,254 (85.0%) | 596 (2.5%) |
| Total | 54,351 (78.6%) | 2,835 (4.1%) |
Employment Occupations by Sex in Mcallen
Management, Business, Science and Arts Occupations
The most common Management, Business, Science and Arts occupations in Mcallen are Community & Social Service (8,509 | 13.5%), Management (6,120 | 9.7%), Education Instruction & Library (5,807 | 9.2%), Health Diagnosing & Treating (4,704 | 7.4%), and Health Technologists (3,313 | 5.2%).
Management, Business, Science and Arts Occupations by Sex
Within the Management, Business, Science and Arts occupations in Mcallen, the most male-oriented occupations are Computers & Mathematics (91.7%), Architecture & Engineering (83.8%), and Computers, Engineering & Science (81.3%), while the most female-oriented occupations are Life, Physical & Social Science (76.4%), Education Instruction & Library (70.2%), and Education, Arts & Media (64.0%).
| Occupation | Male | Female |
| Management | 3,671 (60.0%) | 2,449 (40.0%) |
| Business & Financial | 1,277 (52.2%) | 1,167 (47.7%) |
| Computers, Engineering & Science | 1,407 (81.3%) | 323 (18.7%) |
| Computers & Mathematics | 750 (91.7%) | 68 (8.3%) |
| Architecture & Engineering | 615 (83.8%) | 119 (16.2%) |
| Life, Physical & Social Science | 42 (23.6%) | 136 (76.4%) |
| Community & Social Service | 3,170 (37.2%) | 5,339 (62.7%) |
| Education, Arts & Media | 348 (36.0%) | 618 (64.0%) |
| Legal Services & Support | 534 (63.8%) | 303 (36.2%) |
| Education Instruction & Library | 1,730 (29.8%) | 4,077 (70.2%) |
| Arts, Media & Entertainment | 558 (62.1%) | 341 (37.9%) |
| Health Diagnosing & Treating | 1,818 (38.7%) | 2,886 (61.4%) |
| Health Technologists | 1,262 (38.1%) | 2,051 (61.9%) |
| Total (Category) | 11,343 (48.2%) | 12,164 (51.7%) |
| Total (Overall) | 34,005 (53.8%) | 29,251 (46.2%) |
Services Occupations
The most common Services occupations in Mcallen are Food Preparation & Serving (4,109 | 6.5%), Healthcare Support (2,849 | 4.5%), Cleaning & Maintenance (2,658 | 4.2%), Security & Protection (1,621 | 2.6%), and Personal Care & Service (1,352 | 2.1%).
Services Occupations by Sex
Within the Services occupations in Mcallen, the most male-oriented occupations are Firefighting & Prevention (90.5%), Security & Protection (85.6%), and Law Enforcement (81.5%), while the most female-oriented occupations are Healthcare Support (88.2%), Personal Care & Service (76.8%), and Cleaning & Maintenance (52.6%).
| Occupation | Male | Female |
| Healthcare Support | 337 (11.8%) | 2,512 (88.2%) |
| Security & Protection | 1,387 (85.6%) | 234 (14.4%) |
| Firefighting & Prevention | 666 (90.5%) | 70 (9.5%) |
| Law Enforcement | 721 (81.5%) | 164 (18.5%) |
| Food Preparation & Serving | 2,437 (59.3%) | 1,672 (40.7%) |
| Cleaning & Maintenance | 1,261 (47.4%) | 1,397 (52.6%) |
| Personal Care & Service | 313 (23.2%) | 1,039 (76.8%) |
| Total (Category) | 5,735 (45.6%) | 6,854 (54.4%) |
| Total (Overall) | 34,005 (53.8%) | 29,251 (46.2%) |
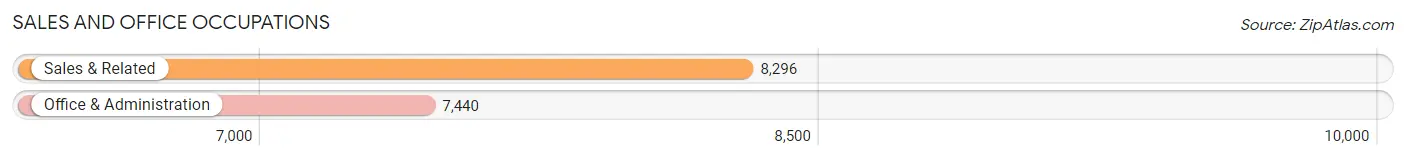
Sales and Office Occupations
The most common Sales and Office occupations in Mcallen are Sales & Related (8,296 | 13.1%), and Office & Administration (7,440 | 11.8%).
Sales and Office Occupations by Sex
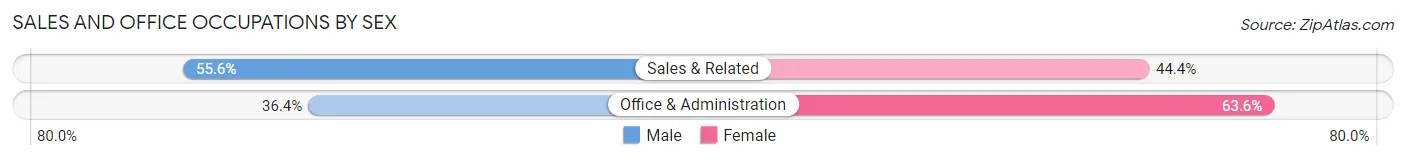
| Occupation | Male | Female |
| Sales & Related | 4,614 (55.6%) | 3,682 (44.4%) |
| Office & Administration | 2,707 (36.4%) | 4,733 (63.6%) |
| Total (Category) | 7,321 (46.5%) | 8,415 (53.5%) |
| Total (Overall) | 34,005 (53.8%) | 29,251 (46.2%) |
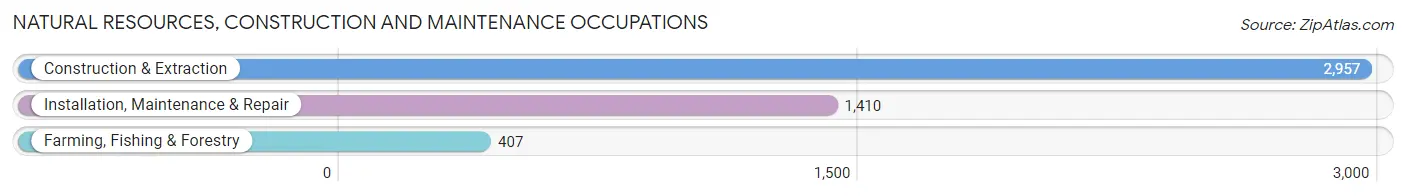
Natural Resources, Construction and Maintenance Occupations
The most common Natural Resources, Construction and Maintenance occupations in Mcallen are Construction & Extraction (2,957 | 4.7%), Installation, Maintenance & Repair (1,410 | 2.2%), and Farming, Fishing & Forestry (407 | 0.6%).
Natural Resources, Construction and Maintenance Occupations by Sex
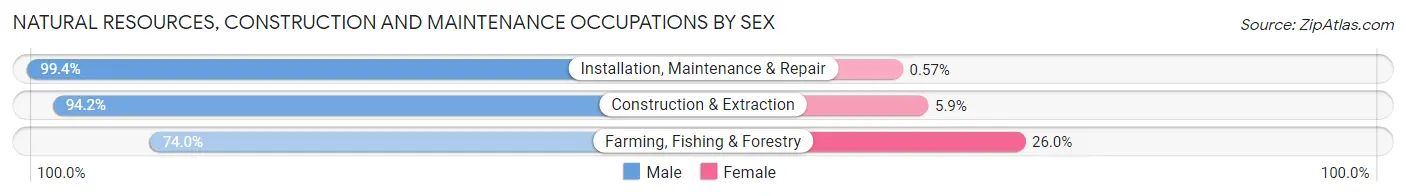
| Occupation | Male | Female |
| Farming, Fishing & Forestry | 301 (74.0%) | 106 (26.0%) |
| Construction & Extraction | 2,784 (94.2%) | 173 (5.9%) |
| Installation, Maintenance & Repair | 1,402 (99.4%) | 8 (0.6%) |
| Total (Category) | 4,487 (94.0%) | 287 (6.0%) |
| Total (Overall) | 34,005 (53.8%) | 29,251 (46.2%) |
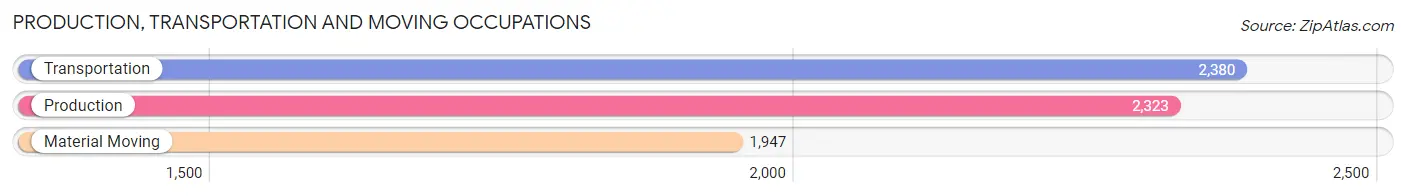
Production, Transportation and Moving Occupations
The most common Production, Transportation and Moving occupations in Mcallen are Transportation (2,380 | 3.8%), Production (2,323 | 3.7%), and Material Moving (1,947 | 3.1%).
Production, Transportation and Moving Occupations by Sex
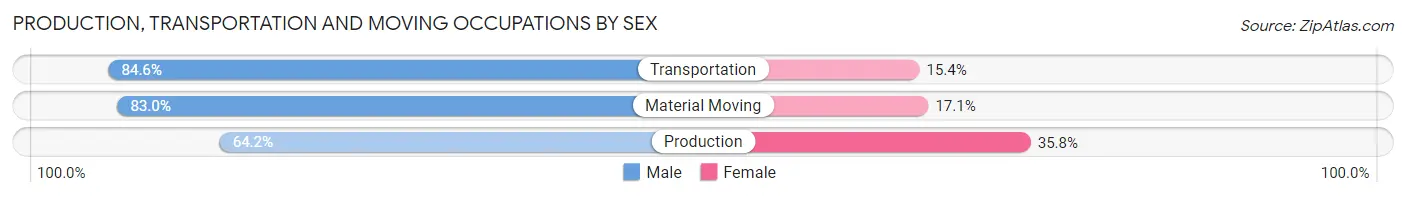
| Occupation | Male | Female |
| Production | 1,491 (64.2%) | 832 (35.8%) |
| Transportation | 2,013 (84.6%) | 367 (15.4%) |
| Material Moving | 1,615 (83.0%) | 332 (17.1%) |
| Total (Category) | 5,119 (77.0%) | 1,531 (23.0%) |
| Total (Overall) | 34,005 (53.8%) | 29,251 (46.2%) |
Employment Industries by Sex in Mcallen
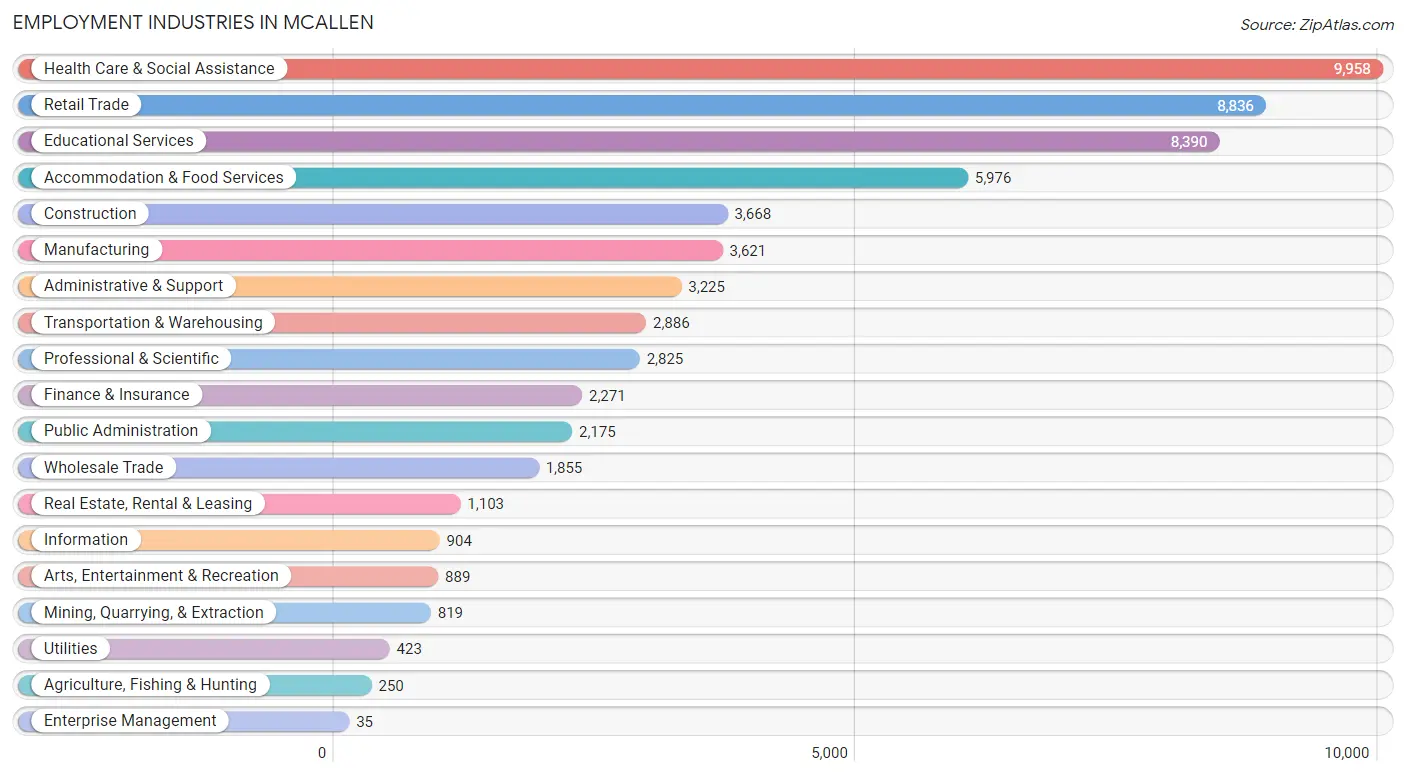
Employment Industries in Mcallen
The major employment industries in Mcallen include Health Care & Social Assistance (9,958 | 15.7%), Retail Trade (8,836 | 14.0%), Educational Services (8,390 | 13.3%), Accommodation & Food Services (5,976 | 9.5%), and Construction (3,668 | 5.8%).
Employment Industries by Sex in Mcallen
The Mcallen industries that see more men than women are Mining, Quarrying, & Extraction (91.6%), Agriculture, Fishing & Hunting (90.8%), and Construction (79.8%), whereas the industries that tend to have a higher number of women are Enterprise Management (100.0%), Health Care & Social Assistance (72.9%), and Educational Services (67.1%).
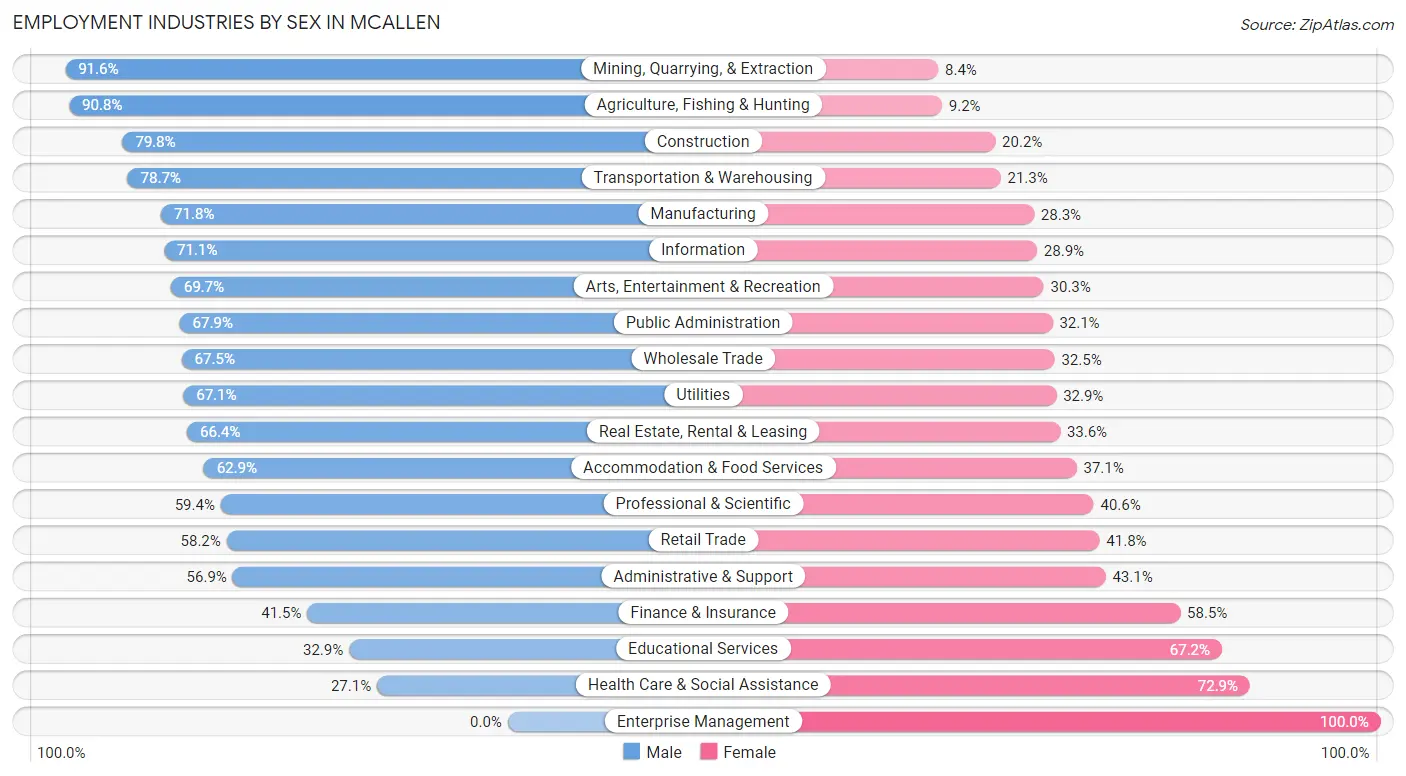
| Industry | Male | Female |
| Agriculture, Fishing & Hunting | 227 (90.8%) | 23 (9.2%) |
| Mining, Quarrying, & Extraction | 750 (91.6%) | 69 (8.4%) |
| Construction | 2,926 (79.8%) | 742 (20.2%) |
| Manufacturing | 2,598 (71.8%) | 1,023 (28.2%) |
| Wholesale Trade | 1,252 (67.5%) | 603 (32.5%) |
| Retail Trade | 5,142 (58.2%) | 3,694 (41.8%) |
| Transportation & Warehousing | 2,270 (78.7%) | 616 (21.3%) |
| Utilities | 284 (67.1%) | 139 (32.9%) |
| Information | 643 (71.1%) | 261 (28.9%) |
| Finance & Insurance | 942 (41.5%) | 1,329 (58.5%) |
| Real Estate, Rental & Leasing | 732 (66.4%) | 371 (33.6%) |
| Professional & Scientific | 1,678 (59.4%) | 1,147 (40.6%) |
| Enterprise Management | 0 (0.0%) | 35 (100.0%) |
| Administrative & Support | 1,836 (56.9%) | 1,389 (43.1%) |
| Educational Services | 2,756 (32.9%) | 5,634 (67.1%) |
| Health Care & Social Assistance | 2,695 (27.1%) | 7,263 (72.9%) |
| Arts, Entertainment & Recreation | 620 (69.7%) | 269 (30.3%) |
| Accommodation & Food Services | 3,760 (62.9%) | 2,216 (37.1%) |
| Public Administration | 1,477 (67.9%) | 698 (32.1%) |
| Total | 34,005 (53.8%) | 29,251 (46.2%) |
Education in Mcallen
School Enrollment in Mcallen
The most common levels of schooling among the 42,602 students in Mcallen are high school (10,105 | 23.7%), elementary school (9,181 | 21.5%), and middle school (8,866 | 20.8%).
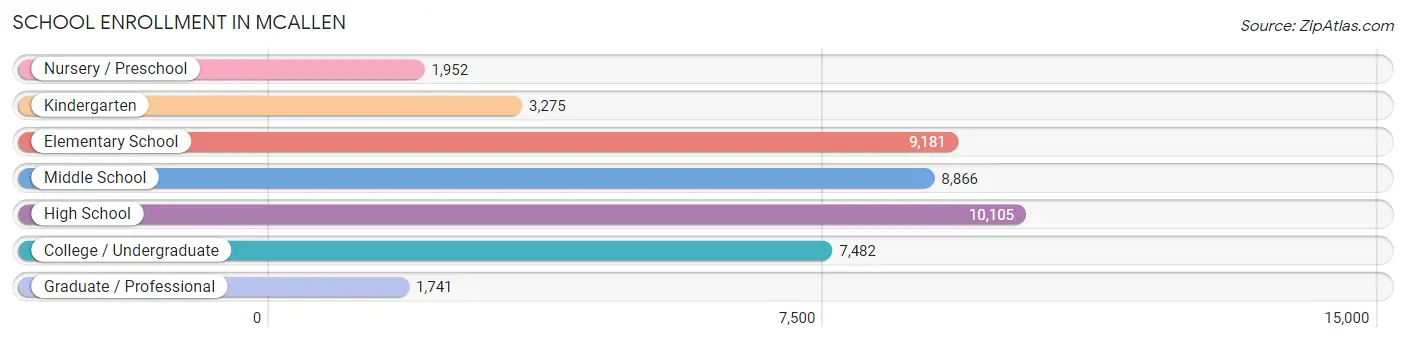
| School Level | # Students | % Students |
| Nursery / Preschool | 1,952 | 4.6% |
| Kindergarten | 3,275 | 7.7% |
| Elementary School | 9,181 | 21.5% |
| Middle School | 8,866 | 20.8% |
| High School | 10,105 | 23.7% |
| College / Undergraduate | 7,482 | 17.6% |
| Graduate / Professional | 1,741 | 4.1% |
| Total | 42,602 | 100.0% |
School Enrollment by Age by Funding Source in Mcallen
Out of a total of 42,602 students who are enrolled in schools in Mcallen, 3,323 (7.8%) attend a private institution, while the remaining 39,279 (92.2%) are enrolled in public schools. The age group of 35 years and over has the highest likelihood of being enrolled in private schools, with 435 (30.0% in the age bracket) enrolled. Conversely, the age group of 15 to 17 year olds has the lowest likelihood of being enrolled in a private school, with 7,284 (98.4% in the age bracket) attending a public institution.
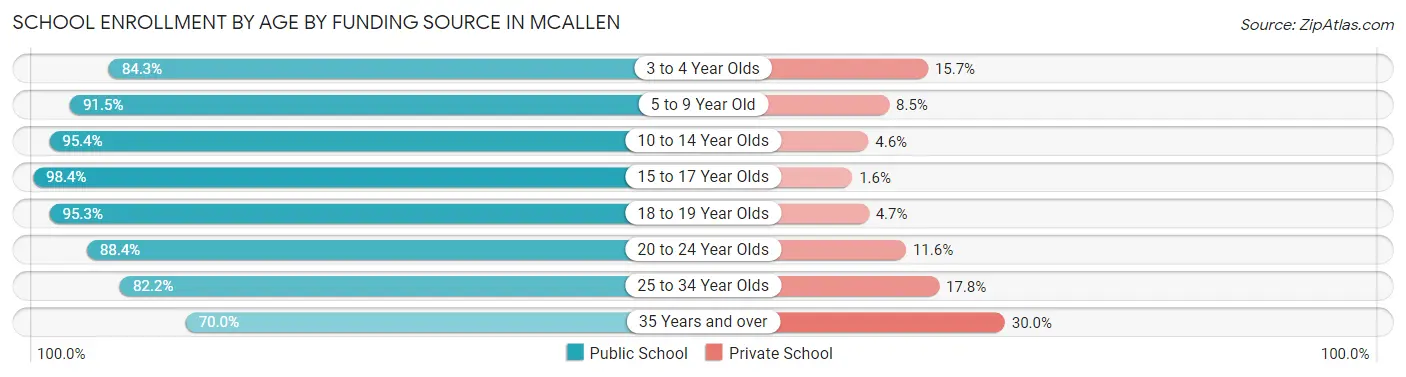
| Age Bracket | Public School | Private School |
| 3 to 4 Year Olds | 1,498 (84.3%) | 279 (15.7%) |
| 5 to 9 Year Old | 10,166 (91.5%) | 939 (8.5%) |
| 10 to 14 Year Olds | 10,692 (95.4%) | 516 (4.6%) |
| 15 to 17 Year Olds | 7,284 (98.4%) | 118 (1.6%) |
| 18 to 19 Year Olds | 3,068 (95.3%) | 150 (4.7%) |
| 20 to 24 Year Olds | 3,914 (88.4%) | 514 (11.6%) |
| 25 to 34 Year Olds | 1,657 (82.2%) | 358 (17.8%) |
| 35 Years and over | 1,014 (70.0%) | 435 (30.0%) |
| Total | 39,279 (92.2%) | 3,323 (7.8%) |
Educational Attainment by Field of Study in Mcallen
Business (5,795 | 19.4%), education (4,853 | 16.3%), science & technology (3,421 | 11.5%), arts & humanities (2,200 | 7.4%), and engineering (1,906 | 6.4%) are the most common fields of study among 29,854 individuals in Mcallen who have obtained a bachelor's degree or higher.
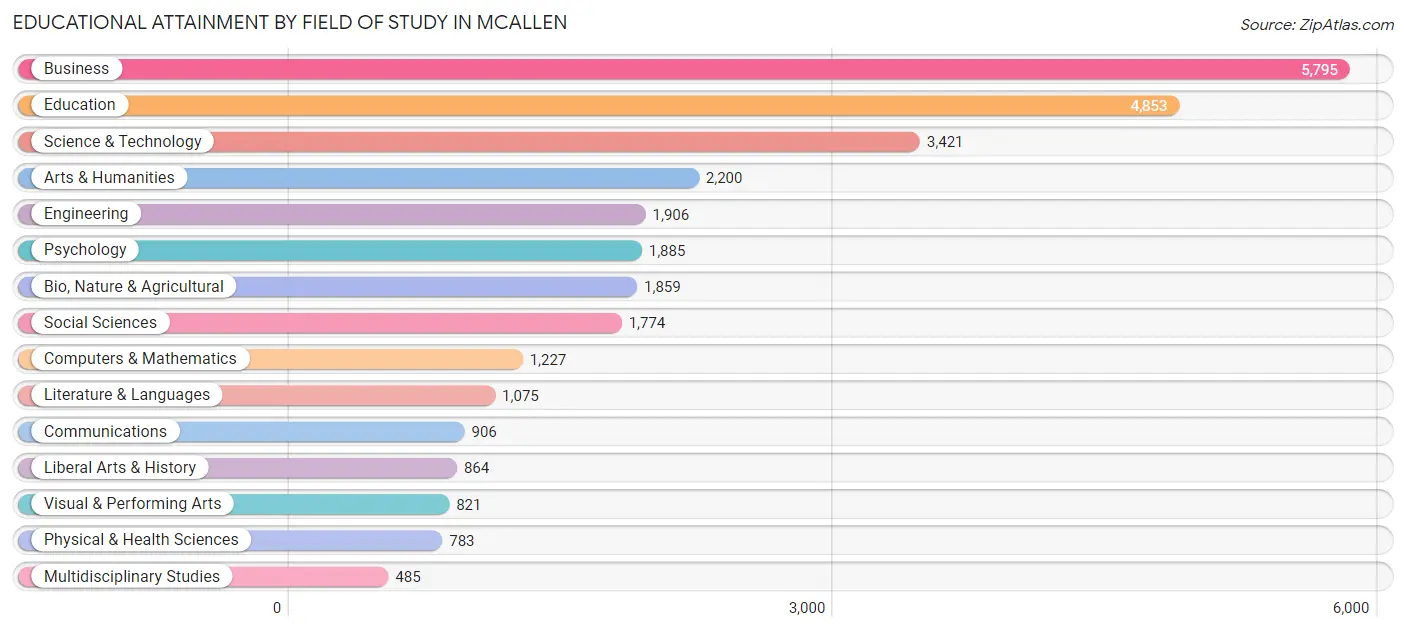
| Field of Study | # Graduates | % Graduates |
| Computers & Mathematics | 1,227 | 4.1% |
| Bio, Nature & Agricultural | 1,859 | 6.2% |
| Physical & Health Sciences | 783 | 2.6% |
| Psychology | 1,885 | 6.3% |
| Social Sciences | 1,774 | 5.9% |
| Engineering | 1,906 | 6.4% |
| Multidisciplinary Studies | 485 | 1.6% |
| Science & Technology | 3,421 | 11.5% |
| Business | 5,795 | 19.4% |
| Education | 4,853 | 16.3% |
| Literature & Languages | 1,075 | 3.6% |
| Liberal Arts & History | 864 | 2.9% |
| Visual & Performing Arts | 821 | 2.8% |
| Communications | 906 | 3.0% |
| Arts & Humanities | 2,200 | 7.4% |
| Total | 29,854 | 100.0% |
Transportation & Commute in Mcallen
Vehicle Availability by Sex in Mcallen
The most prevalent vehicle ownership categories in Mcallen are males with 2 vehicles (14,487, accounting for 43.4%) and females with 2 vehicles (12,276, making up 50.6%).
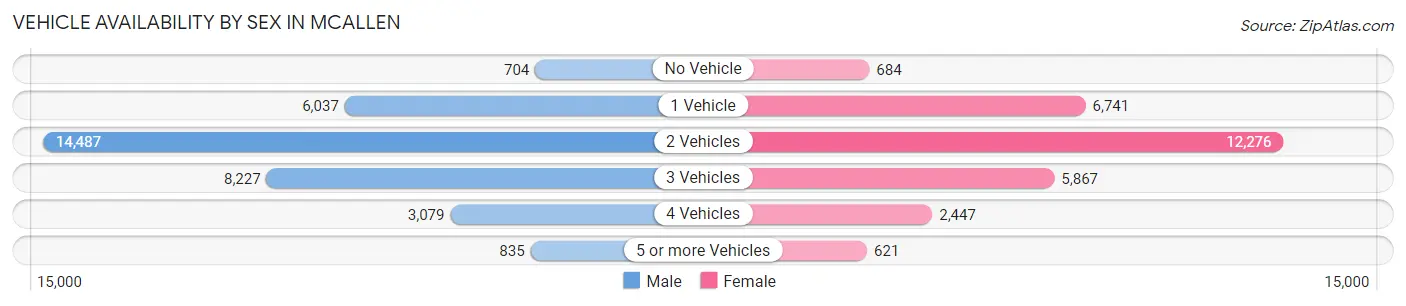
| Vehicles Available | Male | Female |
| No Vehicle | 704 (2.1%) | 684 (2.4%) |
| 1 Vehicle | 6,037 (18.1%) | 6,741 (23.5%) |
| 2 Vehicles | 14,487 (43.4%) | 12,276 (42.9%) |
| 3 Vehicles | 8,227 (24.6%) | 5,867 (20.5%) |
| 4 Vehicles | 3,079 (9.2%) | 2,447 (8.6%) |
| 5 or more Vehicles | 835 (2.5%) | 621 (2.2%) |
| Total | 33,369 (100.0%) | 28,636 (100.0%) |
Commute Time in Mcallen
The most frequently occuring commute durations in Mcallen are 15 to 19 minutes (11,841 commuters, 21.1%), 20 to 24 minutes (10,832 commuters, 19.3%), and 10 to 14 minutes (9,871 commuters, 17.6%).
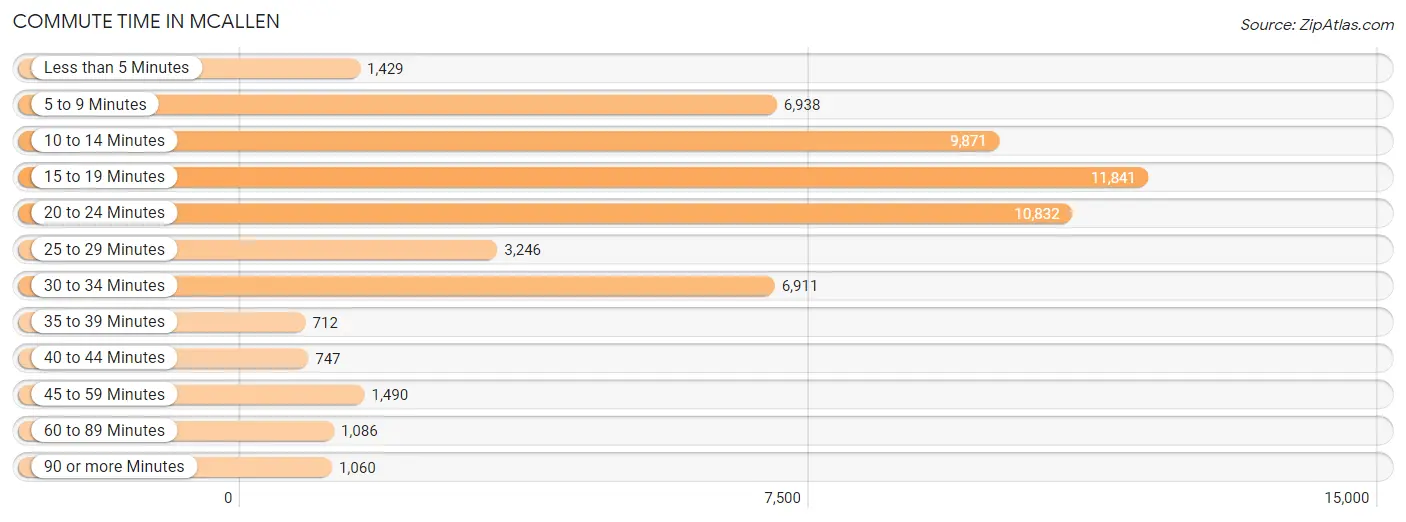
| Commute Time | # Commuters | % Commuters |
| Less than 5 Minutes | 1,429 | 2.5% |
| 5 to 9 Minutes | 6,938 | 12.3% |
| 10 to 14 Minutes | 9,871 | 17.6% |
| 15 to 19 Minutes | 11,841 | 21.1% |
| 20 to 24 Minutes | 10,832 | 19.3% |
| 25 to 29 Minutes | 3,246 | 5.8% |
| 30 to 34 Minutes | 6,911 | 12.3% |
| 35 to 39 Minutes | 712 | 1.3% |
| 40 to 44 Minutes | 747 | 1.3% |
| 45 to 59 Minutes | 1,490 | 2.6% |
| 60 to 89 Minutes | 1,086 | 1.9% |
| 90 or more Minutes | 1,060 | 1.9% |
Commute Time by Sex in Mcallen
The most common commute times in Mcallen are 20 to 24 minutes (6,048 commuters, 19.9%) for males and 15 to 19 minutes (5,805 commuters, 22.5%) for females.
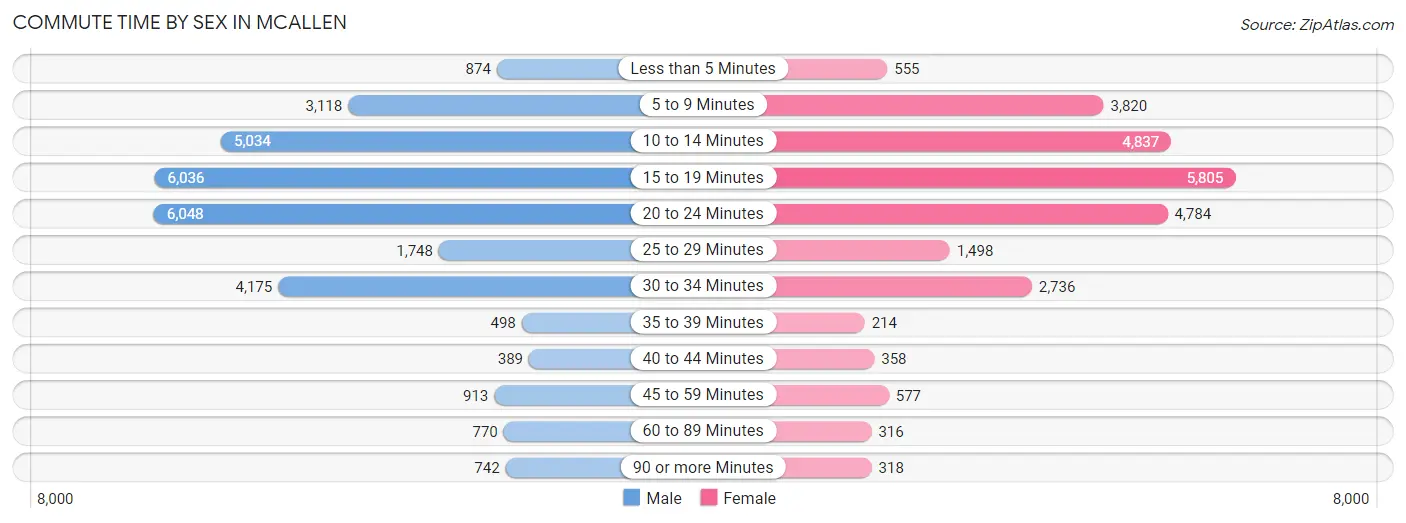
| Commute Time | Male | Female |
| Less than 5 Minutes | 874 (2.9%) | 555 (2.1%) |
| 5 to 9 Minutes | 3,118 (10.3%) | 3,820 (14.8%) |
| 10 to 14 Minutes | 5,034 (16.6%) | 4,837 (18.7%) |
| 15 to 19 Minutes | 6,036 (19.9%) | 5,805 (22.5%) |
| 20 to 24 Minutes | 6,048 (19.9%) | 4,784 (18.5%) |
| 25 to 29 Minutes | 1,748 (5.8%) | 1,498 (5.8%) |
| 30 to 34 Minutes | 4,175 (13.8%) | 2,736 (10.6%) |
| 35 to 39 Minutes | 498 (1.6%) | 214 (0.8%) |
| 40 to 44 Minutes | 389 (1.3%) | 358 (1.4%) |
| 45 to 59 Minutes | 913 (3.0%) | 577 (2.2%) |
| 60 to 89 Minutes | 770 (2.5%) | 316 (1.2%) |
| 90 or more Minutes | 742 (2.5%) | 318 (1.2%) |
Time of Departure to Work by Sex in Mcallen
The most frequent times of departure to work in Mcallen are 7:30 AM to 7:59 AM (4,850, 16.0%) for males and 7:30 AM to 7:59 AM (5,125, 19.9%) for females.
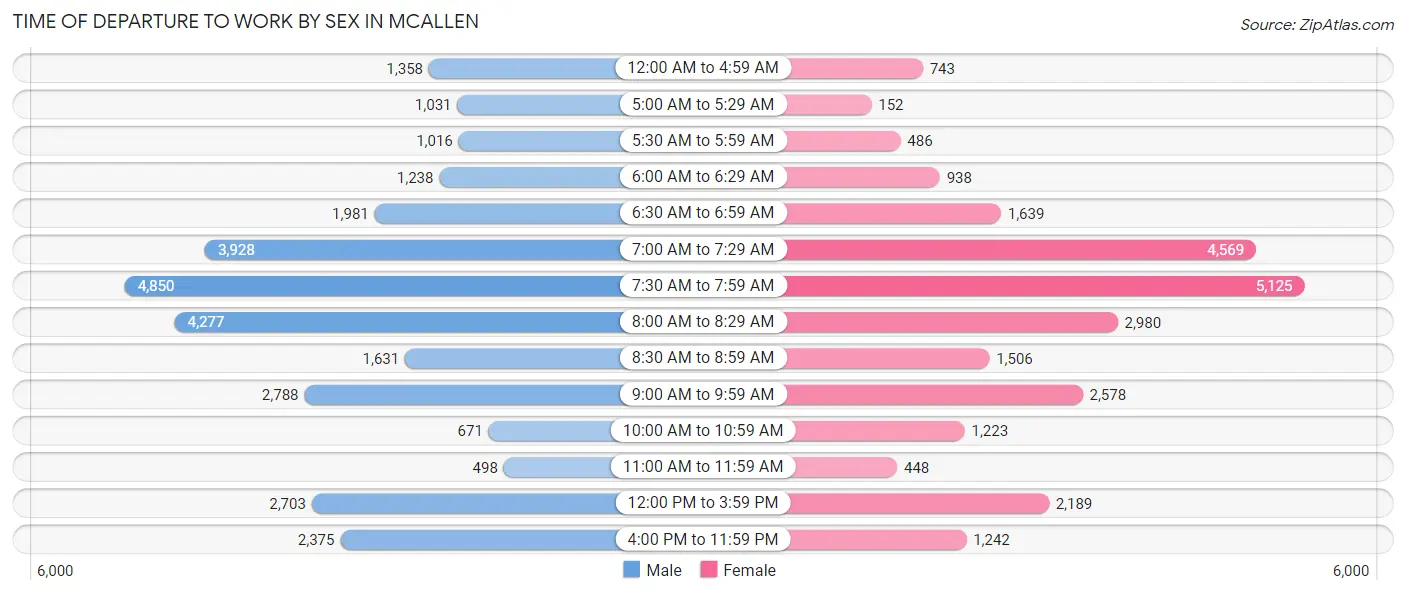
| Time of Departure | Male | Female |
| 12:00 AM to 4:59 AM | 1,358 (4.5%) | 743 (2.9%) |
| 5:00 AM to 5:29 AM | 1,031 (3.4%) | 152 (0.6%) |
| 5:30 AM to 5:59 AM | 1,016 (3.4%) | 486 (1.9%) |
| 6:00 AM to 6:29 AM | 1,238 (4.1%) | 938 (3.6%) |
| 6:30 AM to 6:59 AM | 1,981 (6.5%) | 1,639 (6.4%) |
| 7:00 AM to 7:29 AM | 3,928 (12.9%) | 4,569 (17.7%) |
| 7:30 AM to 7:59 AM | 4,850 (16.0%) | 5,125 (19.9%) |
| 8:00 AM to 8:29 AM | 4,277 (14.1%) | 2,980 (11.5%) |
| 8:30 AM to 8:59 AM | 1,631 (5.4%) | 1,506 (5.8%) |
| 9:00 AM to 9:59 AM | 2,788 (9.2%) | 2,578 (10.0%) |
| 10:00 AM to 10:59 AM | 671 (2.2%) | 1,223 (4.7%) |
| 11:00 AM to 11:59 AM | 498 (1.6%) | 448 (1.7%) |
| 12:00 PM to 3:59 PM | 2,703 (8.9%) | 2,189 (8.5%) |
| 4:00 PM to 11:59 PM | 2,375 (7.8%) | 1,242 (4.8%) |
| Total | 30,345 (100.0%) | 25,818 (100.0%) |
Housing Occupancy in Mcallen
Occupancy by Ownership in Mcallen
Of the total 47,077 dwellings in Mcallen, owner-occupied units account for 27,960 (59.4%), while renter-occupied units make up 19,117 (40.6%).
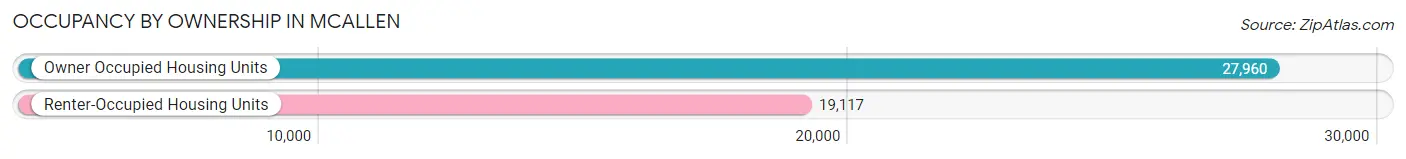
| Occupancy | # Housing Units | % Housing Units |
| Owner Occupied Housing Units | 27,960 | 59.4% |
| Renter-Occupied Housing Units | 19,117 | 40.6% |
| Total Occupied Housing Units | 47,077 | 100.0% |
Occupancy by Household Size in Mcallen
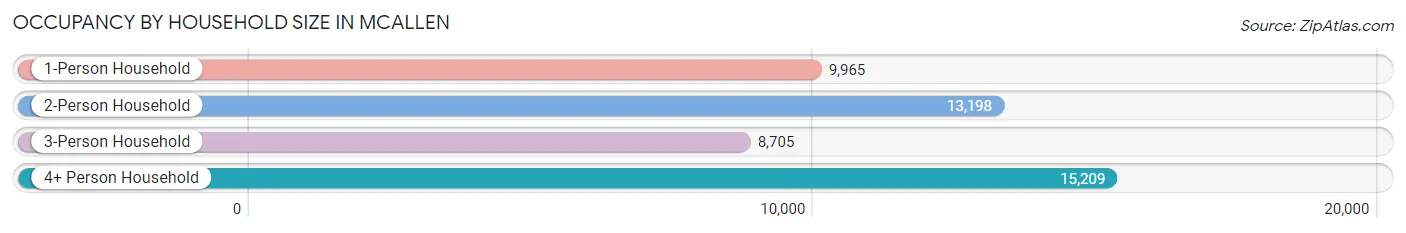
| Household Size | # Housing Units | % Housing Units |
| 1-Person Household | 9,965 | 21.2% |
| 2-Person Household | 13,198 | 28.0% |
| 3-Person Household | 8,705 | 18.5% |
| 4+ Person Household | 15,209 | 32.3% |
| Total Housing Units | 47,077 | 100.0% |
Occupancy by Ownership by Household Size in Mcallen
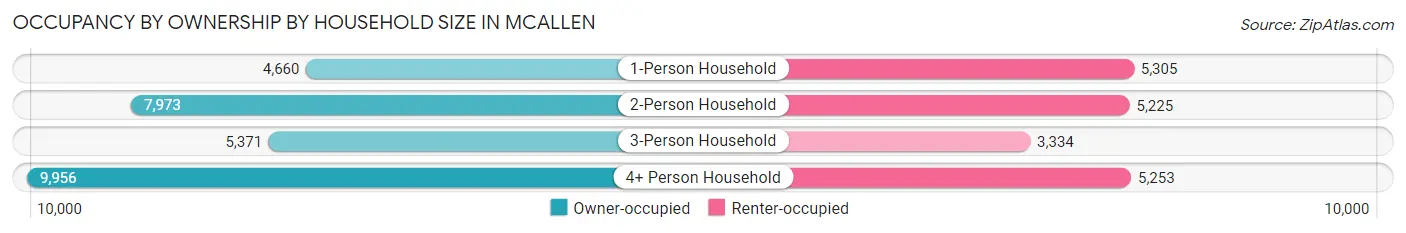
| Household Size | Owner-occupied | Renter-occupied |
| 1-Person Household | 4,660 (46.8%) | 5,305 (53.2%) |
| 2-Person Household | 7,973 (60.4%) | 5,225 (39.6%) |
| 3-Person Household | 5,371 (61.7%) | 3,334 (38.3%) |
| 4+ Person Household | 9,956 (65.5%) | 5,253 (34.5%) |
| Total Housing Units | 27,960 (59.4%) | 19,117 (40.6%) |
Occupancy by Educational Attainment in Mcallen
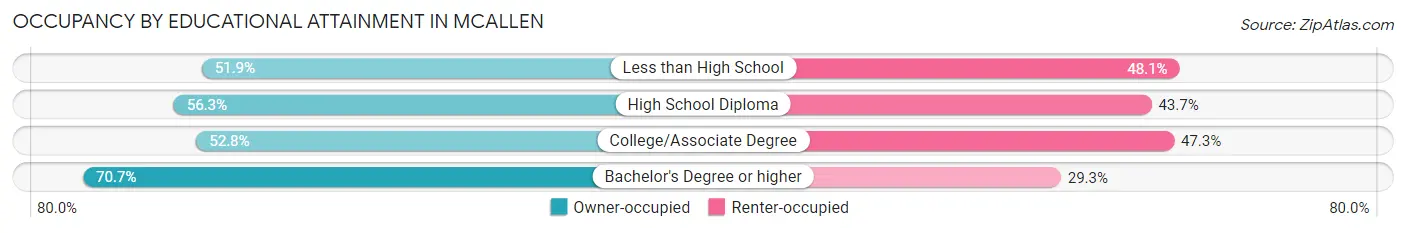
| Household Size | Owner-occupied | Renter-occupied |
| Less than High School | 4,771 (51.9%) | 4,421 (48.1%) |
| High School Diploma | 4,995 (56.3%) | 3,872 (43.7%) |
| College/Associate Degree | 6,829 (52.7%) | 6,118 (47.2%) |
| Bachelor's Degree or higher | 11,365 (70.7%) | 4,706 (29.3%) |
Occupancy by Age of Householder in Mcallen
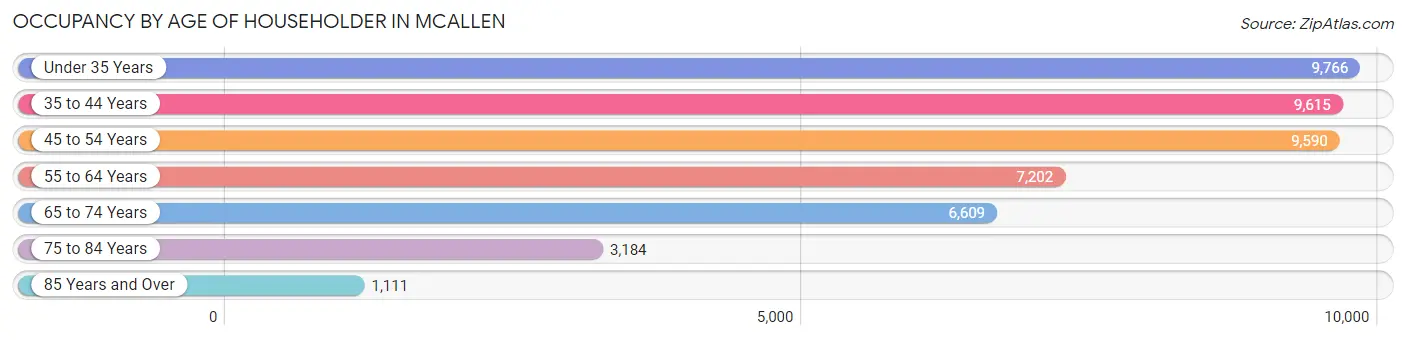
| Age Bracket | # Households | % Households |
| Under 35 Years | 9,766 | 20.7% |
| 35 to 44 Years | 9,615 | 20.4% |
| 45 to 54 Years | 9,590 | 20.4% |
| 55 to 64 Years | 7,202 | 15.3% |
| 65 to 74 Years | 6,609 | 14.0% |
| 75 to 84 Years | 3,184 | 6.8% |
| 85 Years and Over | 1,111 | 2.4% |
| Total | 47,077 | 100.0% |
Housing Finances in Mcallen
Median Income by Occupancy in Mcallen
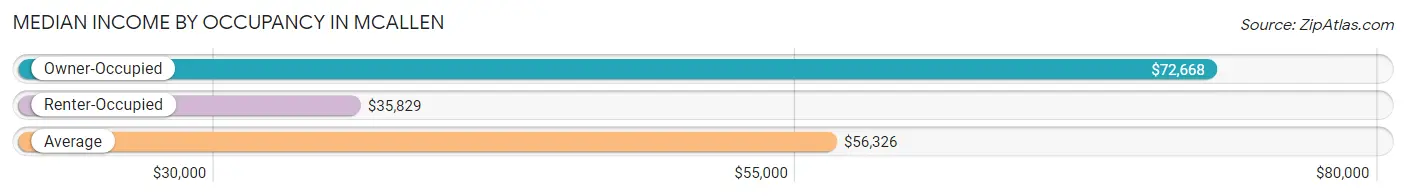
| Occupancy Type | # Households | Median Income |
| Owner-Occupied | 27,960 (59.4%) | $72,668 |
| Renter-Occupied | 19,117 (40.6%) | $35,829 |
| Average | 47,077 (100.0%) | $56,326 |
Occupancy by Householder Income Bracket in Mcallen
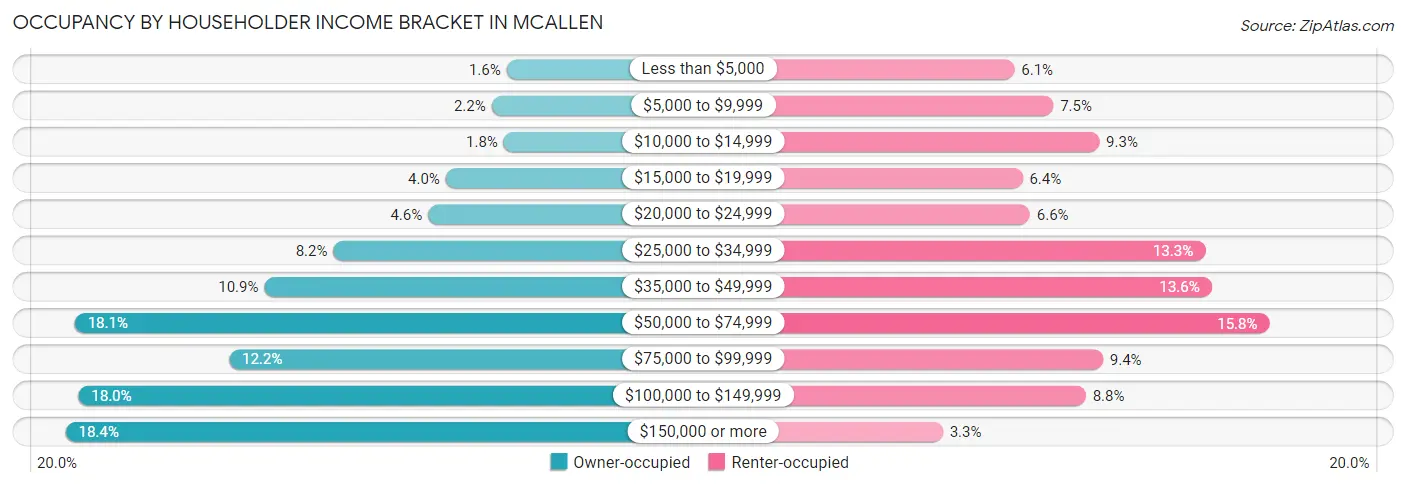
| Income Bracket | Owner-occupied | Renter-occupied |
| Less than $5,000 | 458 (1.6%) | 1,156 (6.0%) |
| $5,000 to $9,999 | 619 (2.2%) | 1,440 (7.5%) |
| $10,000 to $14,999 | 489 (1.8%) | 1,775 (9.3%) |
| $15,000 to $19,999 | 1,107 (4.0%) | 1,216 (6.4%) |
| $20,000 to $24,999 | 1,295 (4.6%) | 1,270 (6.6%) |
| $25,000 to $34,999 | 2,305 (8.2%) | 2,544 (13.3%) |
| $35,000 to $49,999 | 3,038 (10.9%) | 2,593 (13.6%) |
| $50,000 to $74,999 | 5,058 (18.1%) | 3,012 (15.8%) |
| $75,000 to $99,999 | 3,415 (12.2%) | 1,800 (9.4%) |
| $100,000 to $149,999 | 5,020 (17.9%) | 1,677 (8.8%) |
| $150,000 or more | 5,156 (18.4%) | 634 (3.3%) |
| Total | 27,960 (100.0%) | 19,117 (100.0%) |
Monthly Housing Cost Tiers in Mcallen
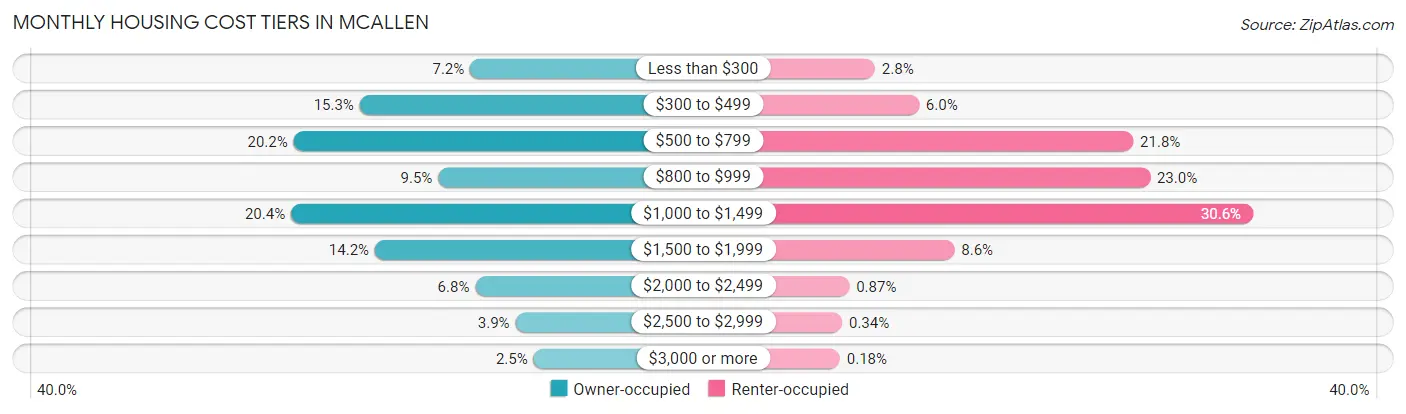
| Monthly Cost | Owner-occupied | Renter-occupied |
| Less than $300 | 2,009 (7.2%) | 528 (2.8%) |
| $300 to $499 | 4,283 (15.3%) | 1,147 (6.0%) |
| $500 to $799 | 5,646 (20.2%) | 4,163 (21.8%) |
| $800 to $999 | 2,668 (9.5%) | 4,401 (23.0%) |
| $1,000 to $1,499 | 5,698 (20.4%) | 5,849 (30.6%) |
| $1,500 to $1,999 | 3,971 (14.2%) | 1,646 (8.6%) |
| $2,000 to $2,499 | 1,905 (6.8%) | 167 (0.9%) |
| $2,500 to $2,999 | 1,076 (3.8%) | 65 (0.3%) |
| $3,000 or more | 704 (2.5%) | 35 (0.2%) |
| Total | 27,960 (100.0%) | 19,117 (100.0%) |
Physical Housing Characteristics in Mcallen
Housing Structures in Mcallen
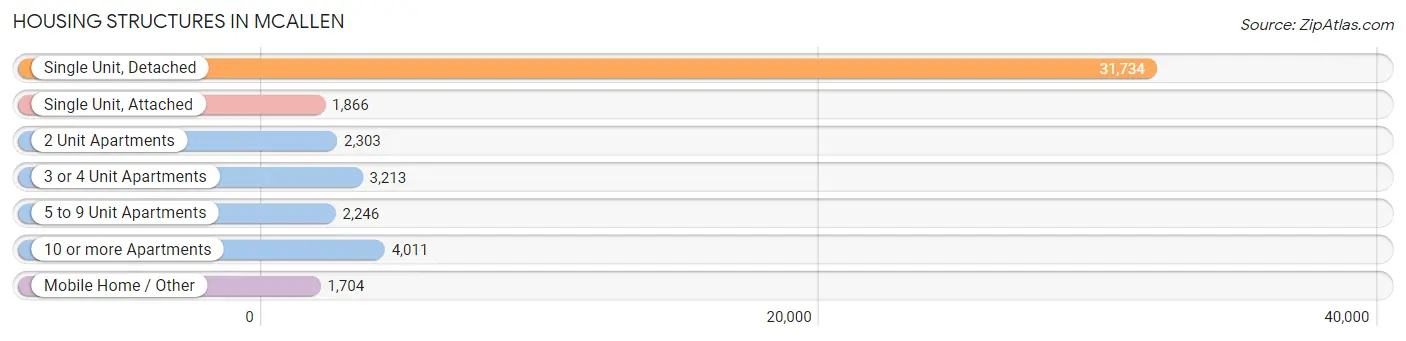
| Structure Type | # Housing Units | % Housing Units |
| Single Unit, Detached | 31,734 | 67.4% |
| Single Unit, Attached | 1,866 | 4.0% |
| 2 Unit Apartments | 2,303 | 4.9% |
| 3 or 4 Unit Apartments | 3,213 | 6.8% |
| 5 to 9 Unit Apartments | 2,246 | 4.8% |
| 10 or more Apartments | 4,011 | 8.5% |
| Mobile Home / Other | 1,704 | 3.6% |
| Total | 47,077 | 100.0% |
Housing Structures by Occupancy in Mcallen
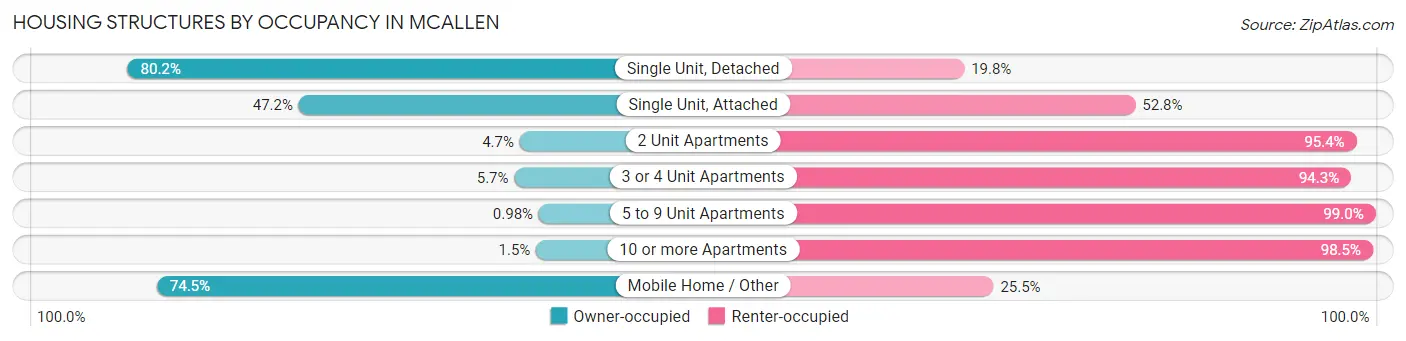
| Structure Type | Owner-occupied | Renter-occupied |
| Single Unit, Detached | 25,437 (80.2%) | 6,297 (19.8%) |
| Single Unit, Attached | 881 (47.2%) | 985 (52.8%) |
| 2 Unit Apartments | 107 (4.6%) | 2,196 (95.4%) |
| 3 or 4 Unit Apartments | 183 (5.7%) | 3,030 (94.3%) |
| 5 to 9 Unit Apartments | 22 (1.0%) | 2,224 (99.0%) |
| 10 or more Apartments | 60 (1.5%) | 3,951 (98.5%) |
| Mobile Home / Other | 1,270 (74.5%) | 434 (25.5%) |
| Total | 27,960 (59.4%) | 19,117 (40.6%) |
Housing Structures by Number of Rooms in Mcallen
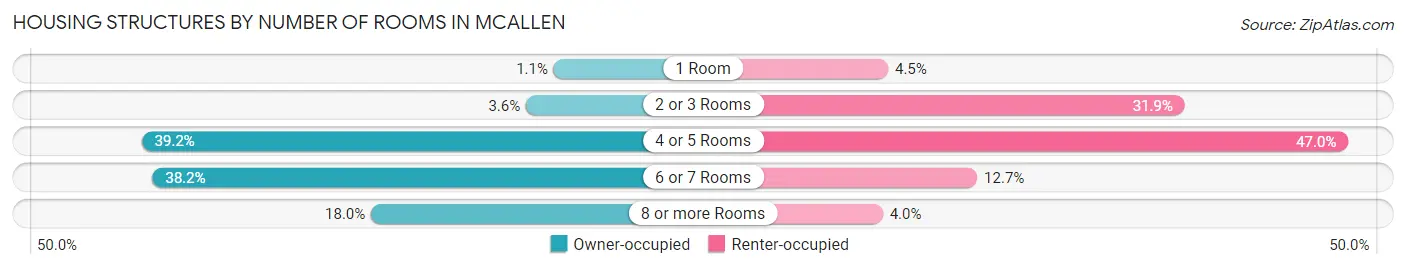
| Number of Rooms | Owner-occupied | Renter-occupied |
| 1 Room | 296 (1.1%) | 851 (4.4%) |
| 2 or 3 Rooms | 1,011 (3.6%) | 6,096 (31.9%) |
| 4 or 5 Rooms | 10,957 (39.2%) | 8,987 (47.0%) |
| 6 or 7 Rooms | 10,678 (38.2%) | 2,426 (12.7%) |
| 8 or more Rooms | 5,018 (17.9%) | 757 (4.0%) |
| Total | 27,960 (100.0%) | 19,117 (100.0%) |
Housing Structure by Heating Type in Mcallen
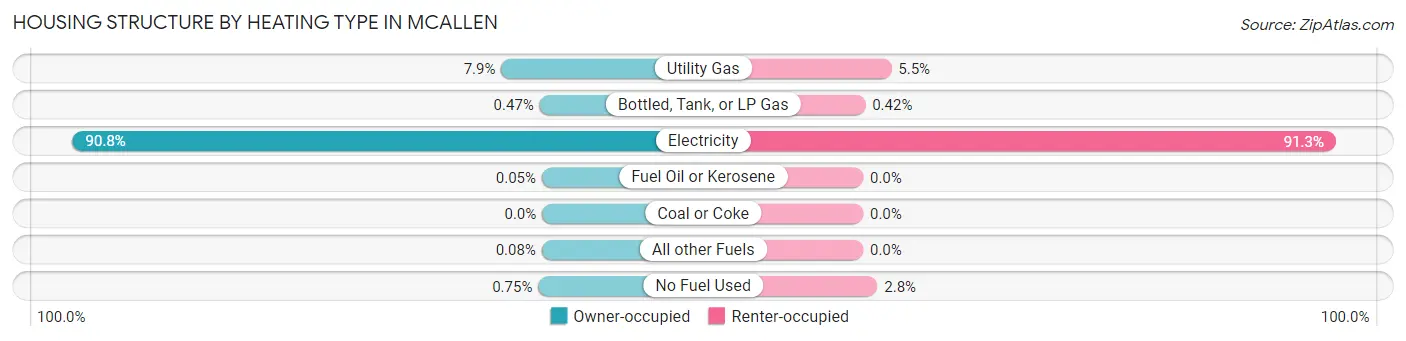
| Heating Type | Owner-occupied | Renter-occupied |
| Utility Gas | 2,207 (7.9%) | 1,045 (5.5%) |
| Bottled, Tank, or LP Gas | 132 (0.5%) | 80 (0.4%) |
| Electricity | 25,377 (90.8%) | 17,462 (91.3%) |
| Fuel Oil or Kerosene | 13 (0.1%) | 0 (0.0%) |
| Coal or Coke | 0 (0.0%) | 0 (0.0%) |
| All other Fuels | 21 (0.1%) | 0 (0.0%) |
| No Fuel Used | 210 (0.7%) | 530 (2.8%) |
| Total | 27,960 (100.0%) | 19,117 (100.0%) |
Household Vehicle Usage in Mcallen
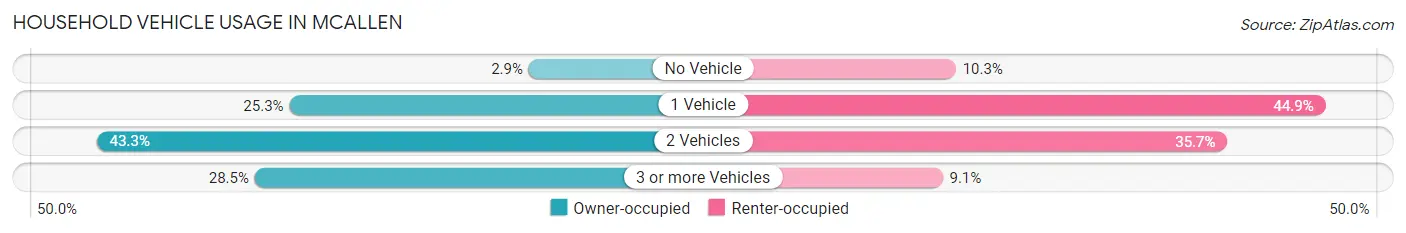
| Vehicles per Household | Owner-occupied | Renter-occupied |
| No Vehicle | 820 (2.9%) | 1,977 (10.3%) |
| 1 Vehicle | 7,069 (25.3%) | 8,576 (44.9%) |
| 2 Vehicles | 12,101 (43.3%) | 6,823 (35.7%) |
| 3 or more Vehicles | 7,970 (28.5%) | 1,741 (9.1%) |
| Total | 27,960 (100.0%) | 19,117 (100.0%) |
Real Estate & Mortgages in Mcallen
Real Estate and Mortgage Overview in Mcallen
| Characteristic | Without Mortgage | With Mortgage |
| Housing Units | 13,818 | 14,142 |
| Median Property Value | $129,800 | $181,700 |
| Median Household Income | $56,123 | $3,189 |
| Monthly Housing Costs | $532 | $677 |
| Real Estate Taxes | $2,370 | $462 |
Property Value by Mortgage Status in Mcallen
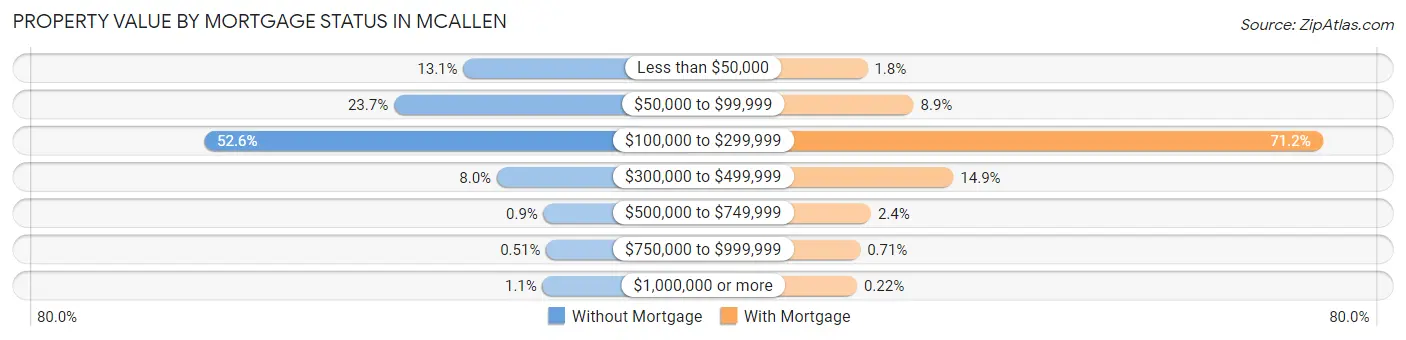
| Property Value | Without Mortgage | With Mortgage |
| Less than $50,000 | 1,815 (13.1%) | 256 (1.8%) |
| $50,000 to $99,999 | 3,276 (23.7%) | 1,252 (8.8%) |
| $100,000 to $299,999 | 7,274 (52.6%) | 10,062 (71.2%) |
| $300,000 to $499,999 | 1,110 (8.0%) | 2,108 (14.9%) |
| $500,000 to $749,999 | 125 (0.9%) | 332 (2.4%) |
| $750,000 to $999,999 | 71 (0.5%) | 101 (0.7%) |
| $1,000,000 or more | 147 (1.1%) | 31 (0.2%) |
| Total | 13,818 (100.0%) | 14,142 (100.0%) |
Household Income by Mortgage Status in Mcallen
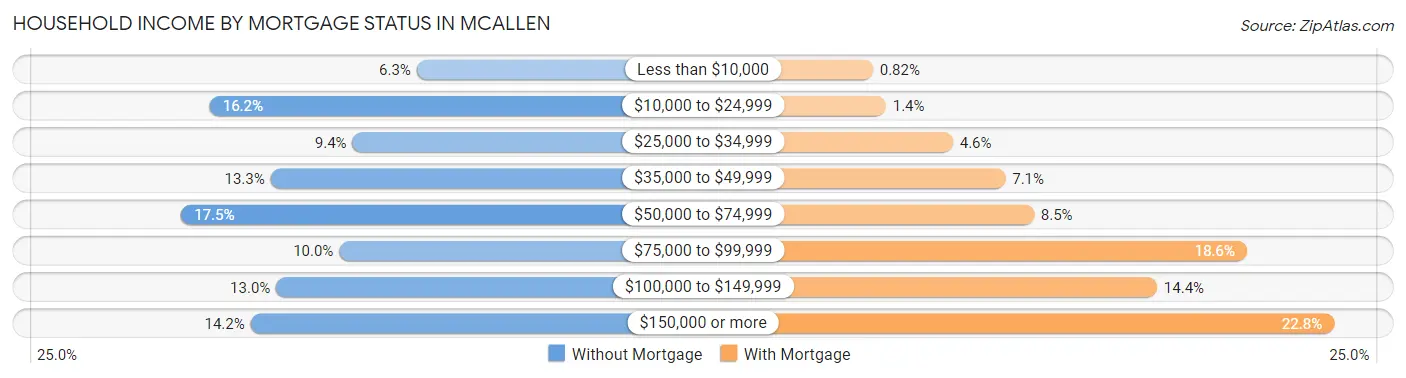
| Household Income | Without Mortgage | With Mortgage |
| Less than $10,000 | 874 (6.3%) | 116 (0.8%) |
| $10,000 to $24,999 | 2,236 (16.2%) | 203 (1.4%) |
| $25,000 to $34,999 | 1,297 (9.4%) | 655 (4.6%) |
| $35,000 to $49,999 | 1,837 (13.3%) | 1,008 (7.1%) |
| $50,000 to $74,999 | 2,423 (17.5%) | 1,201 (8.5%) |
| $75,000 to $99,999 | 1,385 (10.0%) | 2,635 (18.6%) |
| $100,000 to $149,999 | 1,799 (13.0%) | 2,030 (14.3%) |
| $150,000 or more | 1,967 (14.2%) | 3,221 (22.8%) |
| Total | 13,818 (100.0%) | 14,142 (100.0%) |
Property Value to Household Income Ratio in Mcallen
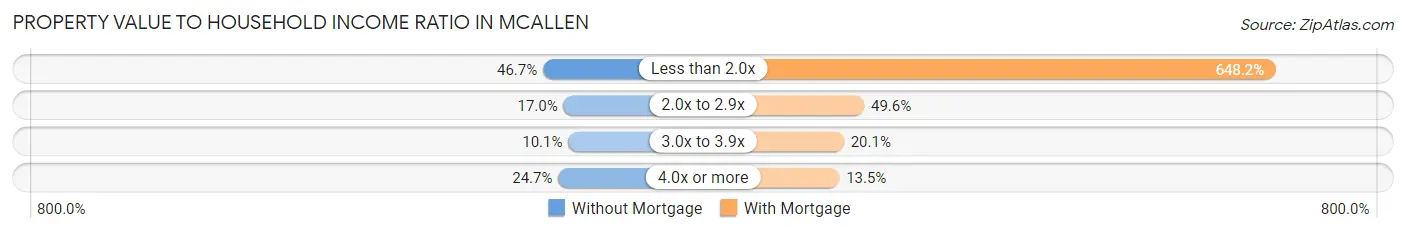
| Value-to-Income Ratio | Without Mortgage | With Mortgage |
| Less than 2.0x | 6,454 (46.7%) | 91,667 (648.2%) |
| 2.0x to 2.9x | 2,350 (17.0%) | 7,013 (49.6%) |
| 3.0x to 3.9x | 1,398 (10.1%) | 2,839 (20.1%) |
| 4.0x or more | 3,406 (24.6%) | 1,907 (13.5%) |
| Total | 13,818 (100.0%) | 14,142 (100.0%) |
Real Estate Taxes by Mortgage Status in Mcallen
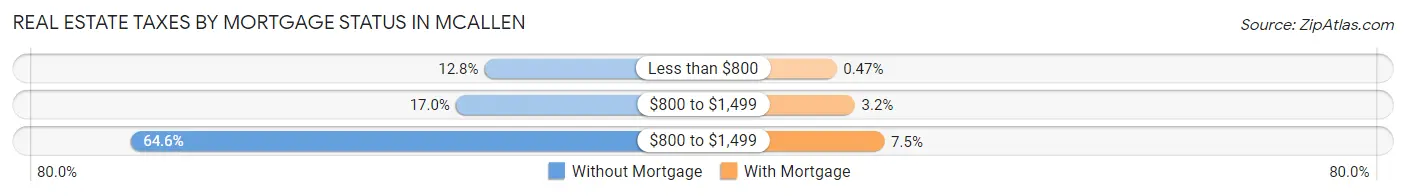
| Property Taxes | Without Mortgage | With Mortgage |
| Less than $800 | 1,773 (12.8%) | 67 (0.5%) |
| $800 to $1,499 | 2,350 (17.0%) | 445 (3.2%) |
| $800 to $1,499 | 8,920 (64.5%) | 1,056 (7.5%) |
| Total | 13,818 (100.0%) | 14,142 (100.0%) |
Health & Disability in Mcallen
Health Insurance Coverage by Age in Mcallen
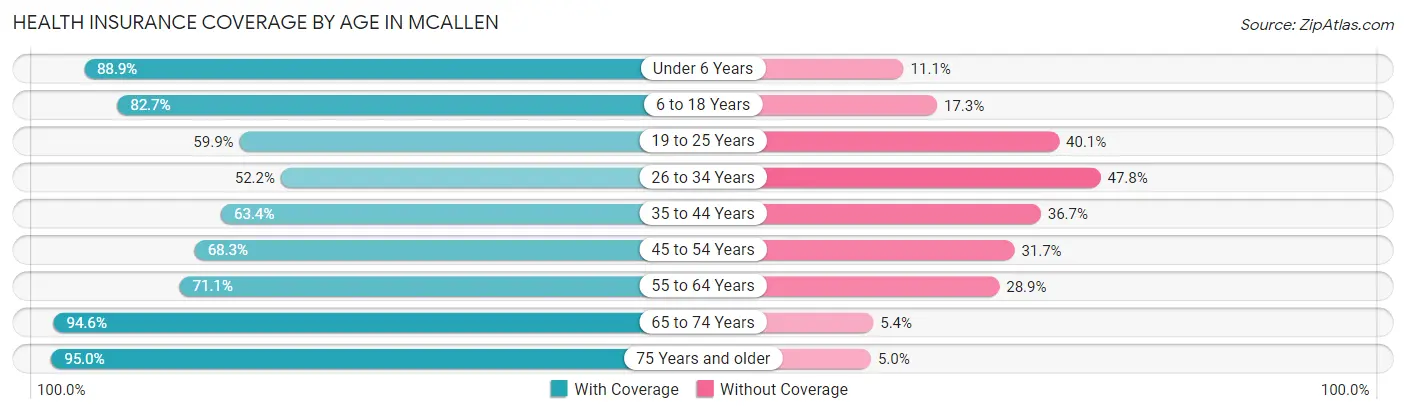
| Age Bracket | With Coverage | Without Coverage |
| Under 6 Years | 10,962 (88.9%) | 1,365 (11.1%) |
| 6 to 18 Years | 25,161 (82.7%) | 5,264 (17.3%) |
| 19 to 25 Years | 8,179 (59.9%) | 5,466 (40.1%) |
| 26 to 34 Years | 10,045 (52.2%) | 9,192 (47.8%) |
| 35 to 44 Years | 11,818 (63.3%) | 6,837 (36.6%) |
| 45 to 54 Years | 11,592 (68.3%) | 5,387 (31.7%) |
| 55 to 64 Years | 8,904 (71.1%) | 3,619 (28.9%) |
| 65 to 74 Years | 10,219 (94.6%) | 585 (5.4%) |
| 75 Years and older | 6,797 (95.0%) | 356 (5.0%) |
| Total | 103,677 (73.1%) | 38,071 (26.9%) |
Health Insurance Coverage by Citizenship Status in Mcallen
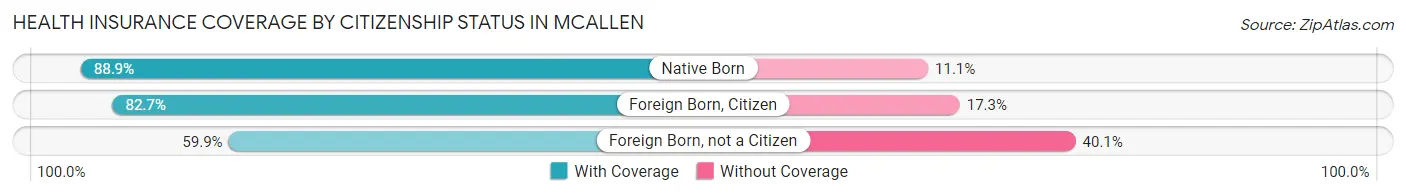
| Citizenship Status | With Coverage | Without Coverage |
| Native Born | 10,962 (88.9%) | 1,365 (11.1%) |
| Foreign Born, Citizen | 25,161 (82.7%) | 5,264 (17.3%) |
| Foreign Born, not a Citizen | 8,179 (59.9%) | 5,466 (40.1%) |
Health Insurance Coverage by Household Income in Mcallen
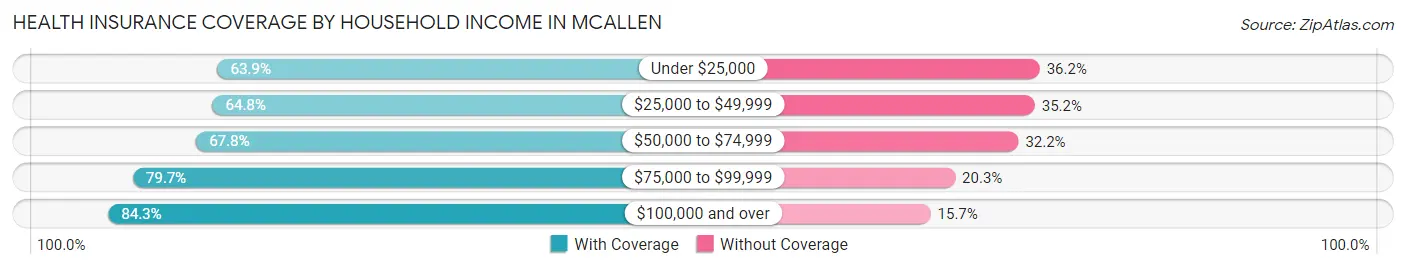
| Household Income | With Coverage | Without Coverage |
| Under $25,000 | 15,563 (63.8%) | 8,812 (36.1%) |
| $25,000 to $49,999 | 19,561 (64.8%) | 10,639 (35.2%) |
| $50,000 to $74,999 | 17,140 (67.8%) | 8,127 (32.2%) |
| $75,000 to $99,999 | 13,752 (79.7%) | 3,502 (20.3%) |
| $100,000 and over | 37,478 (84.3%) | 6,979 (15.7%) |
Public vs Private Health Insurance Coverage by Age in Mcallen
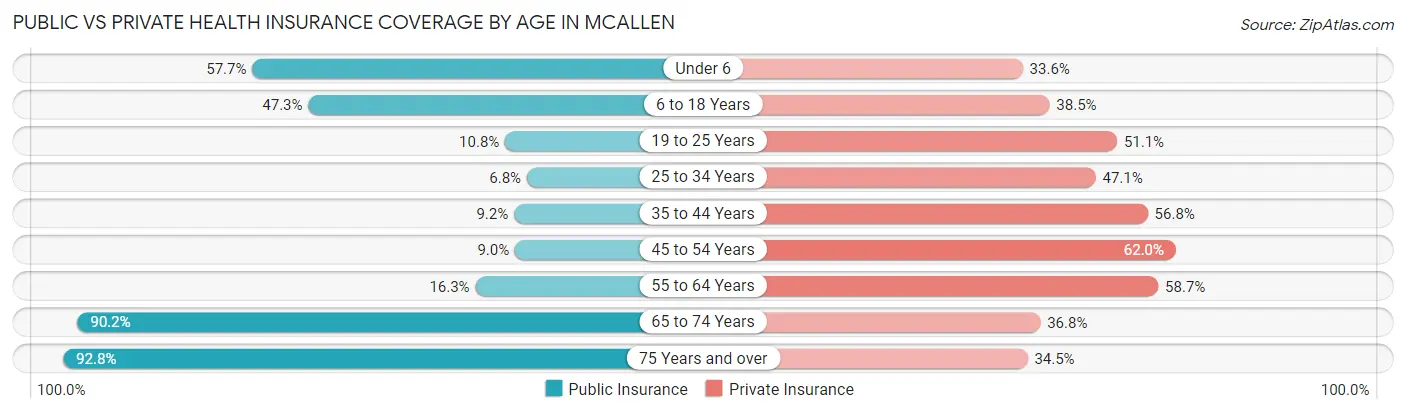
| Age Bracket | Public Insurance | Private Insurance |
| Under 6 | 7,118 (57.7%) | 4,138 (33.6%) |
| 6 to 18 Years | 14,400 (47.3%) | 11,725 (38.5%) |
| 19 to 25 Years | 1,473 (10.8%) | 6,969 (51.1%) |
| 25 to 34 Years | 1,301 (6.8%) | 9,061 (47.1%) |
| 35 to 44 Years | 1,706 (9.1%) | 10,590 (56.8%) |
| 45 to 54 Years | 1,523 (9.0%) | 10,527 (62.0%) |
| 55 to 64 Years | 2,044 (16.3%) | 7,354 (58.7%) |
| 65 to 74 Years | 9,746 (90.2%) | 3,979 (36.8%) |
| 75 Years and over | 6,641 (92.8%) | 2,465 (34.5%) |
| Total | 45,952 (32.4%) | 66,808 (47.1%) |
Disability Status by Sex by Age in Mcallen
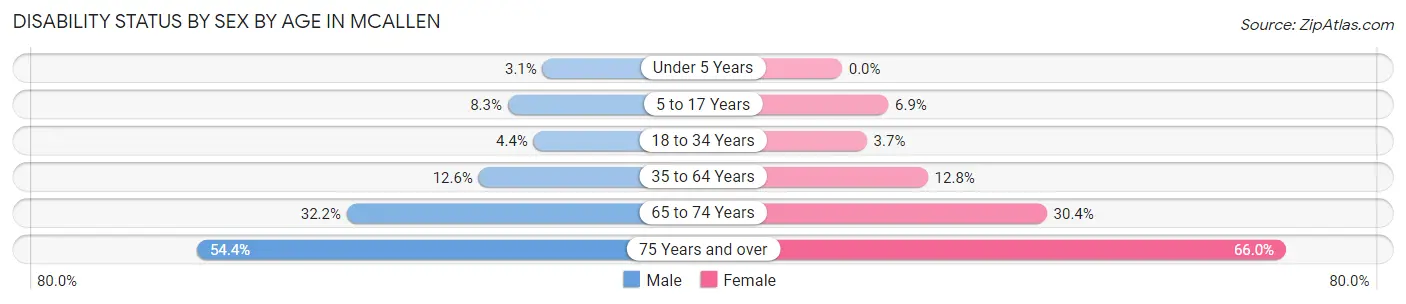
| Age Bracket | Male | Female |
| Under 5 Years | 172 (3.1%) | 0 (0.0%) |
| 5 to 17 Years | 1,373 (8.3%) | 946 (6.9%) |
| 18 to 34 Years | 787 (4.4%) | 640 (3.7%) |
| 35 to 64 Years | 2,816 (12.6%) | 3,284 (12.8%) |
| 65 to 74 Years | 1,583 (32.2%) | 1,789 (30.4%) |
| 75 Years and over | 1,348 (54.4%) | 3,083 (65.9%) |
Disability Class by Sex by Age in Mcallen
Disability Class: Hearing Difficulty
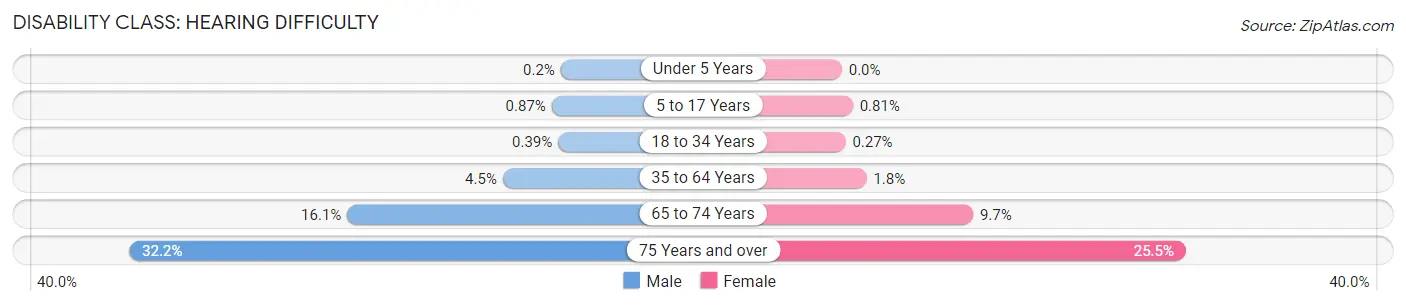
| Age Bracket | Male | Female |
| Under 5 Years | 11 (0.2%) | 0 (0.0%) |
| 5 to 17 Years | 144 (0.9%) | 112 (0.8%) |
| 18 to 34 Years | 70 (0.4%) | 47 (0.3%) |
| 35 to 64 Years | 1,008 (4.5%) | 471 (1.8%) |
| 65 to 74 Years | 790 (16.1%) | 573 (9.7%) |
| 75 Years and over | 799 (32.2%) | 1,194 (25.5%) |
Disability Class: Vision Difficulty
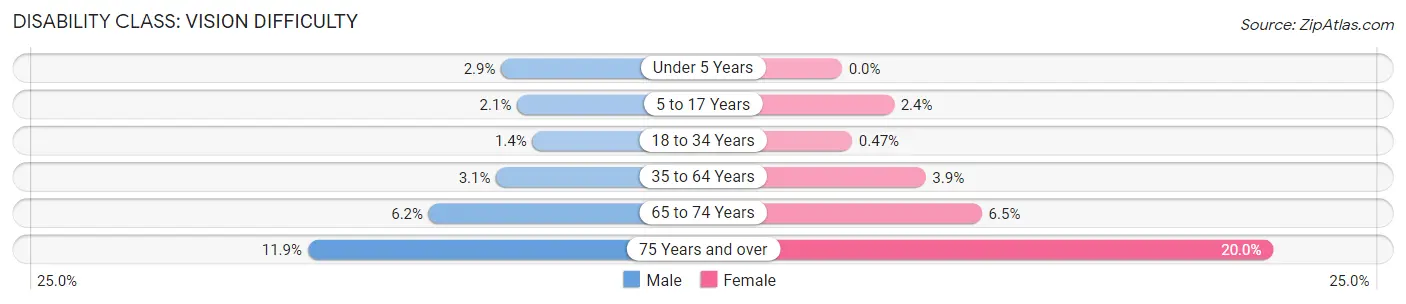
| Age Bracket | Male | Female |
| Under 5 Years | 161 (2.9%) | 0 (0.0%) |
| 5 to 17 Years | 356 (2.1%) | 332 (2.4%) |
| 18 to 34 Years | 256 (1.4%) | 81 (0.5%) |
| 35 to 64 Years | 697 (3.1%) | 998 (3.9%) |
| 65 to 74 Years | 307 (6.2%) | 382 (6.5%) |
| 75 Years and over | 294 (11.9%) | 936 (20.0%) |
Disability Class: Cognitive Difficulty
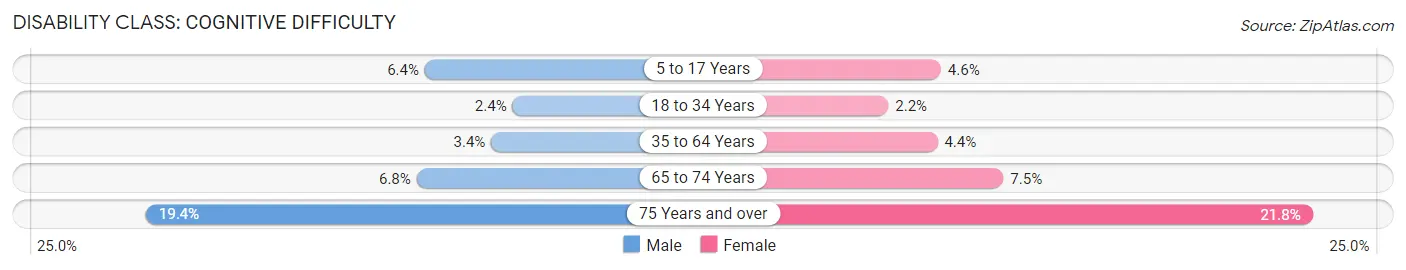
| Age Bracket | Male | Female |
| 5 to 17 Years | 1,070 (6.4%) | 632 (4.6%) |
| 18 to 34 Years | 421 (2.4%) | 374 (2.2%) |
| 35 to 64 Years | 750 (3.4%) | 1,144 (4.4%) |
| 65 to 74 Years | 335 (6.8%) | 441 (7.5%) |
| 75 Years and over | 480 (19.4%) | 1,021 (21.8%) |
Disability Class: Ambulatory Difficulty
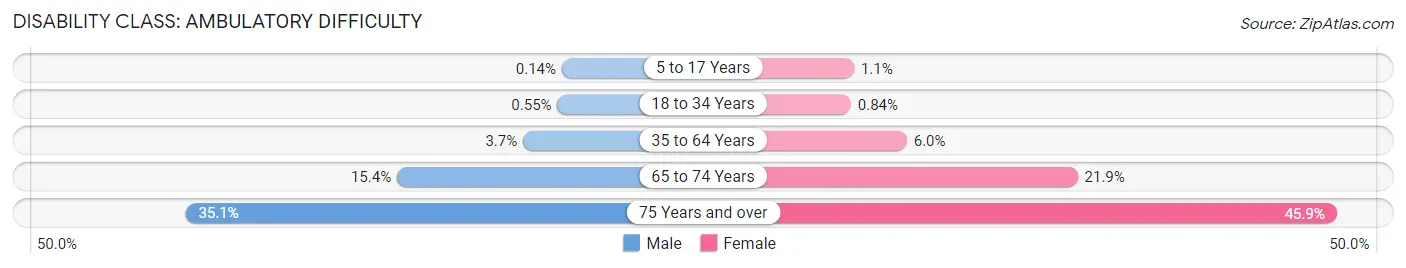
| Age Bracket | Male | Female |
| 5 to 17 Years | 24 (0.1%) | 155 (1.1%) |
| 18 to 34 Years | 99 (0.5%) | 145 (0.8%) |
| 35 to 64 Years | 839 (3.7%) | 1,554 (6.0%) |
| 65 to 74 Years | 760 (15.4%) | 1,287 (21.9%) |
| 75 Years and over | 869 (35.1%) | 2,147 (45.9%) |
Disability Class: Self-Care Difficulty
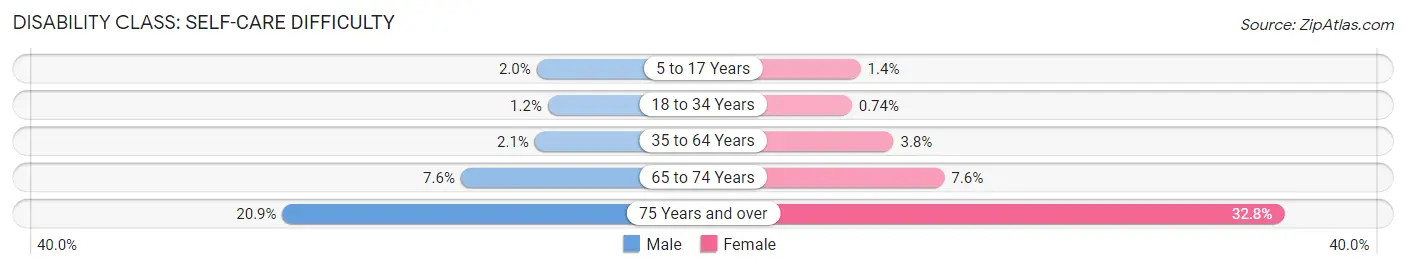
| Age Bracket | Male | Female |
| 5 to 17 Years | 331 (2.0%) | 192 (1.4%) |
| 18 to 34 Years | 207 (1.2%) | 129 (0.7%) |
| 35 to 64 Years | 477 (2.1%) | 990 (3.8%) |
| 65 to 74 Years | 375 (7.6%) | 448 (7.6%) |
| 75 Years and over | 517 (20.9%) | 1,535 (32.8%) |
Technology Access in Mcallen
Computing Device Access in Mcallen
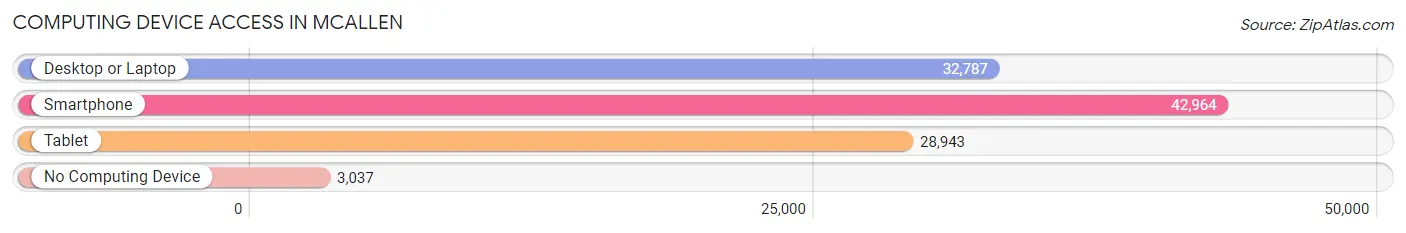
| Device Type | # Households | % Households |
| Desktop or Laptop | 32,787 | 69.7% |
| Smartphone | 42,964 | 91.3% |
| Tablet | 28,943 | 61.5% |
| No Computing Device | 3,037 | 6.5% |
| Total | 47,077 | 100.0% |
Internet Access in Mcallen
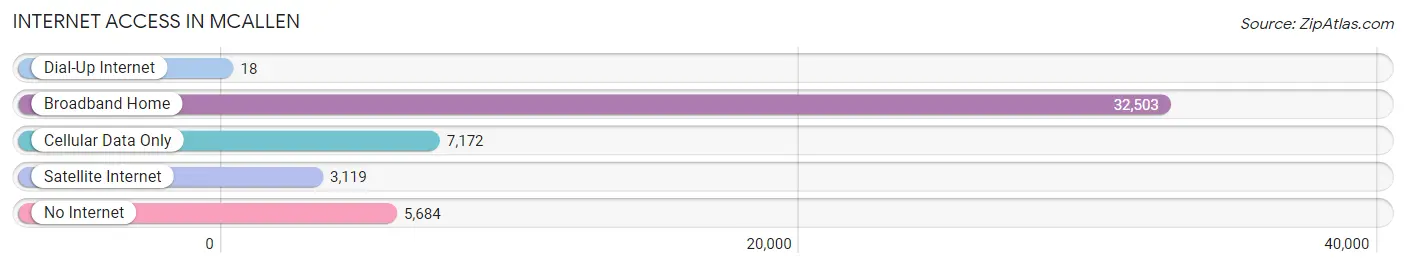
| Internet Type | # Households | % Households |
| Dial-Up Internet | 18 | 0.0% |
| Broadband Home | 32,503 | 69.0% |
| Cellular Data Only | 7,172 | 15.2% |
| Satellite Internet | 3,119 | 6.6% |
| No Internet | 5,684 | 12.1% |
| Total | 47,077 | 100.0% |
Mcallen Summary
Mcallen, Texas is a city located in Hidalgo County in the Rio Grande Valley of South Texas. It is the largest city in the county and the 22nd most populous city in the state of Texas. The city is situated along the Rio Grande River, which forms the border between the United States and Mexico. The city is known for its vibrant culture, diverse population, and strong economy.
History
Mcallen was founded in 1904 by John McAllen, a rancher from Scotland. He purchased land in the area and began to develop it into a town. The city was named after him and was incorporated in 1907. The city grew rapidly in the early 20th century, and by the 1920s, it had become a major agricultural center. The city was also a major hub for the oil and gas industry.
In the 1950s, the city began to experience a population boom as people from Mexico and other parts of Latin America began to move to the area. This influx of people helped to diversify the city’s culture and economy. The city also experienced a surge in tourism as people from all over the world began to visit the area.
Geography
Mcallen is located in the Rio Grande Valley of South Texas. The city is situated along the Rio Grande River, which forms the border between the United States and Mexico. The city is surrounded by a number of smaller towns and cities, including Mission, Edinburg, and Pharr. The city is located about 30 miles from the Gulf of Mexico.
The city has a subtropical climate, with hot summers and mild winters. The average temperature in the summer is around 90 degrees Fahrenheit, and the average temperature in the winter is around 60 degrees Fahrenheit.
Economy
Mcallen’s economy is largely based on agriculture, tourism, and the oil and gas industry. The city is home to a number of large agricultural companies, including Valley Citrus, Valley Cotton, and Valley Produce. The city is also a major hub for the oil and gas industry, with a number of large companies operating in the area.
The city is also a major tourist destination, with a number of attractions, including the McAllen Convention Center, the International Museum of Art and Science, and the McAllen Botanical Gardens. The city is also home to a number of festivals and events, including the McAllen International Festival and the McAllen Marathon.
Demographics
As of the 2010 census, the population of Mcallen was 129,877. The city has a diverse population, with people from a variety of backgrounds and ethnicities. The largest ethnic group in the city is Hispanic or Latino, which makes up about 87.5% of the population. The other major ethnic groups in the city are White (7.2%), African American (2.2%), and Asian (1.3%).
The median household income in the city is $37,845, and the median home value is $117,400. The city has a poverty rate of 28.2%, which is higher than the national average.
Mcallen is a vibrant and diverse city with a strong economy and a rich cultural heritage. The city is home to a number of attractions and events, and it is a popular tourist destination. The city is also a major hub for the oil and gas industry, and it is home to a number of large agricultural companies. The city has a diverse population, with people from a variety of backgrounds and ethnicities.
Common Questions
What is Per Capita Income in Mcallen?
Per Capita income in Mcallen is $27,533.
What is the Median Family Income in Mcallen?
Median Family Income in Mcallen is $63,255.
What is the Median Household income in Mcallen?
Median Household Income in Mcallen is $56,326.
What is Income or Wage Gap in Mcallen?
Income or Wage Gap in Mcallen is 26.5%.
Women in Mcallen earn 73.5 cents for every dollar earned by a man.
What is Family Income Deficit in Mcallen?
Family Income Deficit in Mcallen is $11,194.
Families that are below poverty line in Mcallen earn $11,194 less on average than the poverty threshold level.
What is Inequality or Gini Index in Mcallen?
Inequality or Gini Index in Mcallen is 0.50.
What is the Total Population of Mcallen?
Total Population of Mcallen is 142,722.
What is the Total Male Population of Mcallen?
Total Male Population of Mcallen is 70,426.
What is the Total Female Population of Mcallen?
Total Female Population of Mcallen is 72,296.
What is the Ratio of Males per 100 Females in Mcallen?
There are 97.41 Males per 100 Females in Mcallen.
What is the Ratio of Females per 100 Males in Mcallen?
There are 102.66 Females per 100 Males in Mcallen.
What is the Median Population Age in Mcallen?
Median Population Age in Mcallen is 32.9 Years.
What is the Average Family Size in Mcallen
Average Family Size in Mcallen is 3.6 People.
What is the Average Household Size in Mcallen
Average Household Size in Mcallen is 3.0 People.
How Large is the Labor Force in Mcallen?
There are 66,944 People in the Labor Forcein in Mcallen.
What is the Percentage of People in the Labor Force in Mcallen?
62.2% of People are in the Labor Force in Mcallen.
What is the Unemployment Rate in Mcallen?
Unemployment Rate in Mcallen is 5.4%.