Vista, CA Map & Demographics
Vista Map
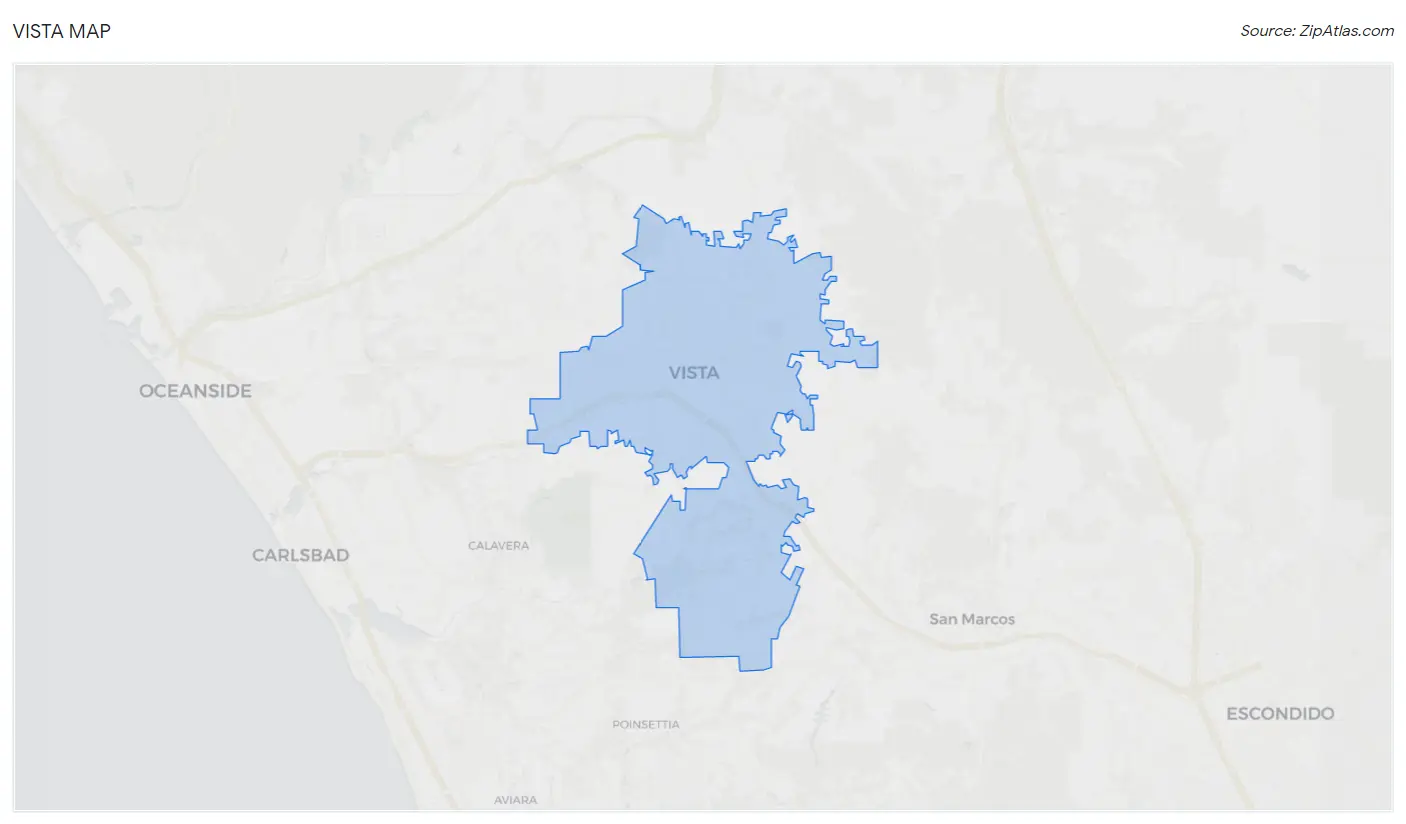
Vista Overview
$37,194
PER CAPITA INCOME
$97,575
AVG FAMILY INCOME
$88,715
AVG HOUSEHOLD INCOME
27.3%
WAGE / INCOME GAP [ % ]
72.7¢/ $1
WAGE / INCOME GAP [ $ ]
$10,517
FAMILY INCOME DEFICIT
0.43
INEQUALITY / GINI INDEX
98,392
TOTAL POPULATION
49,750
MALE POPULATION
48,642
FEMALE POPULATION
102.28
MALES / 100 FEMALES
97.77
FEMALES / 100 MALES
34.9
MEDIAN AGE
3.6
AVG FAMILY SIZE
3.1
AVG HOUSEHOLD SIZE
53,225
LABOR FORCE [ PEOPLE ]
68.4%
PERCENT IN LABOR FORCE
6.3%
UNEMPLOYMENT RATE
Income in Vista
Income Overview in Vista
Per Capita Income in Vista is $37,194, while median incomes of families and households are $97,575 and $88,715 respectively.
| Characteristic | Number | Measure |
| Per Capita Income | 98,392 | $37,194 |
| Median Family Income | 22,047 | $97,575 |
| Mean Family Income | 22,047 | $123,307 |
| Median Household Income | 30,836 | $88,715 |
| Mean Household Income | 30,836 | $114,064 |
| Income Deficit | 22,047 | $10,517 |
| Wage / Income Gap (%) | 98,392 | 27.31% |
| Wage / Income Gap ($) | 98,392 | 72.69¢ per $1 |
| Gini / Inequality Index | 98,392 | 0.43 |
Earnings by Sex in Vista
Average Earnings in Vista are $40,414, $46,026 for men and $33,457 for women, a difference of 27.3%.
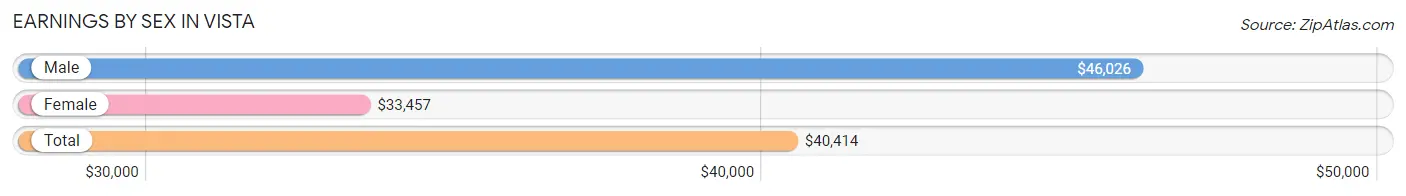
| Sex | Number | Average Earnings |
| Male | 28,535 (53.4%) | $46,026 |
| Female | 24,919 (46.6%) | $33,457 |
| Total | 53,454 (100.0%) | $40,414 |
Earnings by Sex by Income Bracket in Vista
The most common earnings brackets in Vista are $100,000+ for men (4,840 | 17.0%) and $100,000+ for women (2,520 | 10.1%).
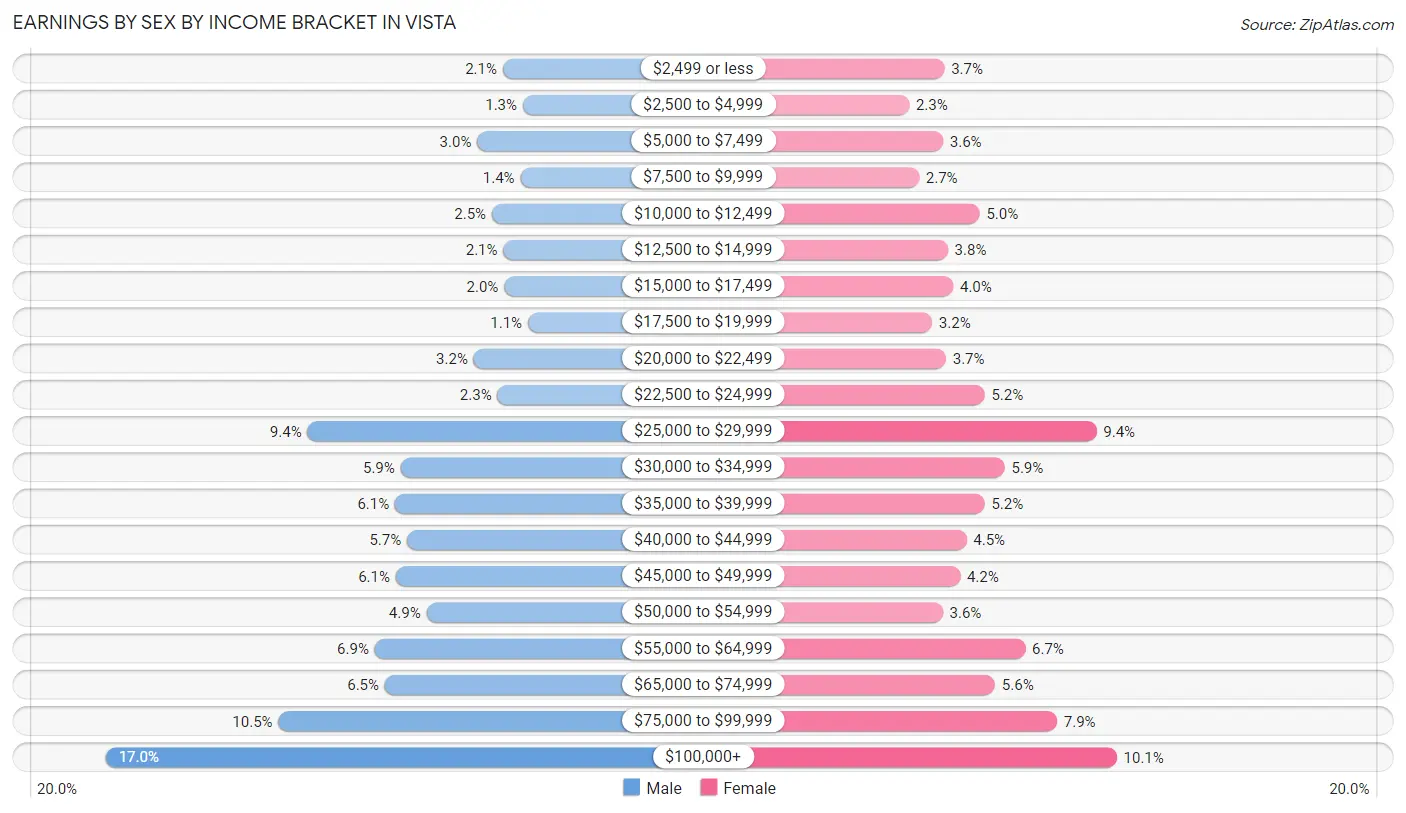
| Income | Male | Female |
| $2,499 or less | 593 (2.1%) | 909 (3.6%) |
| $2,500 to $4,999 | 380 (1.3%) | 581 (2.3%) |
| $5,000 to $7,499 | 868 (3.0%) | 897 (3.6%) |
| $7,500 to $9,999 | 405 (1.4%) | 674 (2.7%) |
| $10,000 to $12,499 | 711 (2.5%) | 1,238 (5.0%) |
| $12,500 to $14,999 | 587 (2.1%) | 941 (3.8%) |
| $15,000 to $17,499 | 580 (2.0%) | 993 (4.0%) |
| $17,500 to $19,999 | 325 (1.1%) | 795 (3.2%) |
| $20,000 to $22,499 | 904 (3.2%) | 925 (3.7%) |
| $22,500 to $24,999 | 651 (2.3%) | 1,285 (5.2%) |
| $25,000 to $29,999 | 2,681 (9.4%) | 2,329 (9.3%) |
| $30,000 to $34,999 | 1,687 (5.9%) | 1,472 (5.9%) |
| $35,000 to $39,999 | 1,746 (6.1%) | 1,285 (5.2%) |
| $40,000 to $44,999 | 1,617 (5.7%) | 1,116 (4.5%) |
| $45,000 to $49,999 | 1,739 (6.1%) | 1,056 (4.2%) |
| $50,000 to $54,999 | 1,409 (4.9%) | 895 (3.6%) |
| $55,000 to $64,999 | 1,964 (6.9%) | 1,665 (6.7%) |
| $65,000 to $74,999 | 1,854 (6.5%) | 1,383 (5.6%) |
| $75,000 to $99,999 | 2,994 (10.5%) | 1,960 (7.9%) |
| $100,000+ | 4,840 (17.0%) | 2,520 (10.1%) |
| Total | 28,535 (100.0%) | 24,919 (100.0%) |
Earnings by Sex by Educational Attainment in Vista
Average earnings in Vista are $50,908 for men and $39,515 for women, a difference of 22.4%. Men with an educational attainment of graduate degree enjoy the highest average annual earnings of $97,188, while those with less than high school education earn the least with $37,932. Women with an educational attainment of graduate degree earn the most with the average annual earnings of $81,544, while those with less than high school education have the smallest earnings of $27,542.
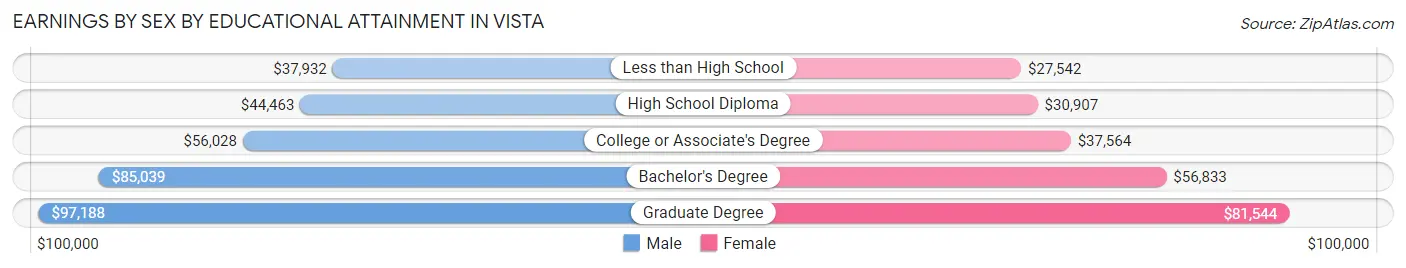
| Educational Attainment | Male Income | Female Income |
| Less than High School | $37,932 | $27,542 |
| High School Diploma | $44,463 | $30,907 |
| College or Associate's Degree | $56,028 | $37,564 |
| Bachelor's Degree | $85,039 | $56,833 |
| Graduate Degree | $97,188 | $81,544 |
| Total | $50,908 | $39,515 |
Family Income in Vista
Family Income Brackets in Vista
According to the Vista family income data, there are 4,983 families falling into the $100,000 to $149,999 income range, which is the most common income bracket and makes up 22.6% of all families. Conversely, the $10,000 to $14,999 income bracket is the least frequent group with only 154 families (0.7%) belonging to this category.
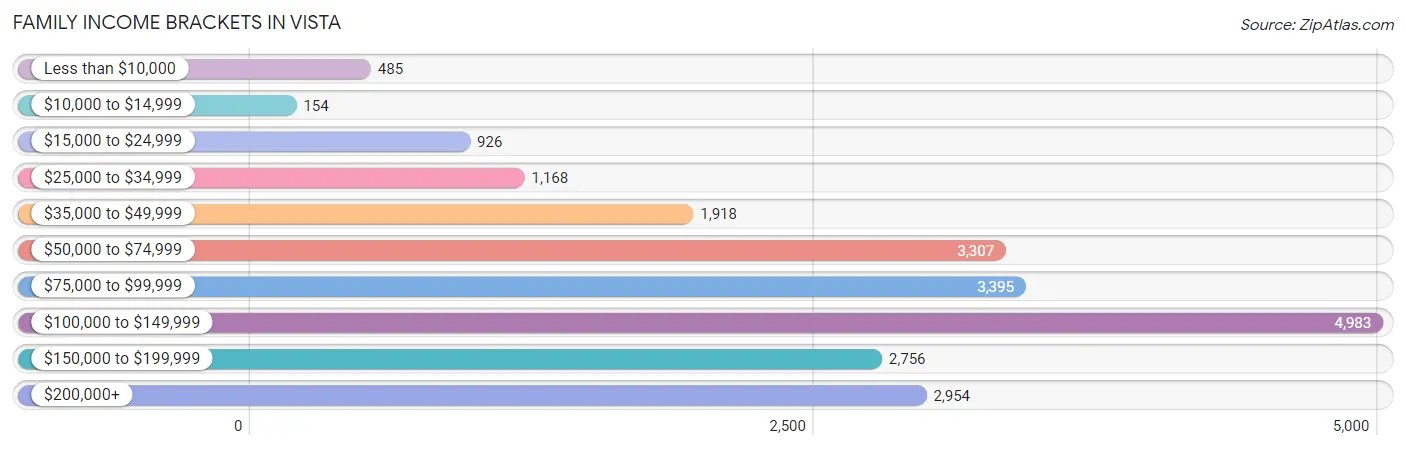
| Income Bracket | # Families | % Families |
| Less than $10,000 | 485 | 2.2% |
| $10,000 to $14,999 | 154 | 0.7% |
| $15,000 to $24,999 | 926 | 4.2% |
| $25,000 to $34,999 | 1,168 | 5.3% |
| $35,000 to $49,999 | 1,918 | 8.7% |
| $50,000 to $74,999 | 3,307 | 15.0% |
| $75,000 to $99,999 | 3,395 | 15.4% |
| $100,000 to $149,999 | 4,983 | 22.6% |
| $150,000 to $199,999 | 2,756 | 12.5% |
| $200,000+ | 2,954 | 13.4% |
Family Income by Famaliy Size in Vista
7+ person families (958 | 4.3%) account for the highest median family income in Vista with $136,818 per family, while 2-person families (8,378 | 38.0%) have the highest median income of $44,038 per family member.
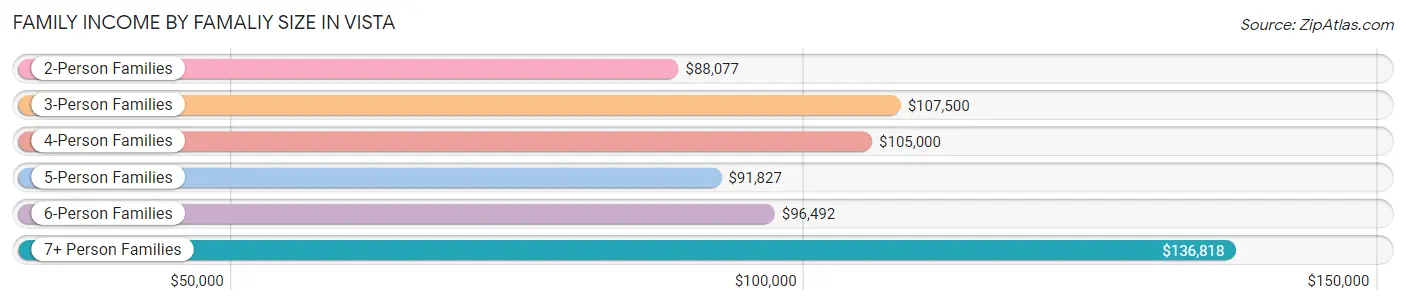
| Income Bracket | # Families | Median Income |
| 2-Person Families | 8,378 (38.0%) | $88,077 |
| 3-Person Families | 4,782 (21.7%) | $107,500 |
| 4-Person Families | 4,506 (20.4%) | $105,000 |
| 5-Person Families | 2,112 (9.6%) | $91,827 |
| 6-Person Families | 1,311 (5.9%) | $96,492 |
| 7+ Person Families | 958 (4.3%) | $136,818 |
| Total | 22,047 (100.0%) | $97,575 |
Family Income by Number of Earners in Vista
The median family income in Vista is $97,575, with families comprising 3+ earners (3,861) having the highest median family income of $133,722, while families with 1 earner (6,480) have the lowest median family income of $61,791, accounting for 17.5% and 29.4% of families, respectively.
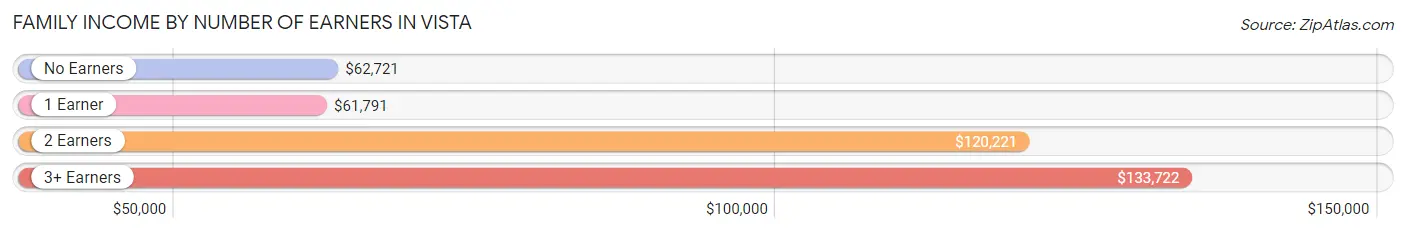
| Number of Earners | # Families | Median Income |
| No Earners | 2,111 (9.6%) | $62,721 |
| 1 Earner | 6,480 (29.4%) | $61,791 |
| 2 Earners | 9,595 (43.5%) | $120,221 |
| 3+ Earners | 3,861 (17.5%) | $133,722 |
| Total | 22,047 (100.0%) | $97,575 |
Household Income in Vista
Household Income Brackets in Vista
With 6,414 households falling in the category, the $100,000 to $149,999 income range is the most frequent in Vista, accounting for 20.8% of all households. In contrast, only 648 households (2.1%) fall into the $10,000 to $14,999 income bracket, making it the least populous group.
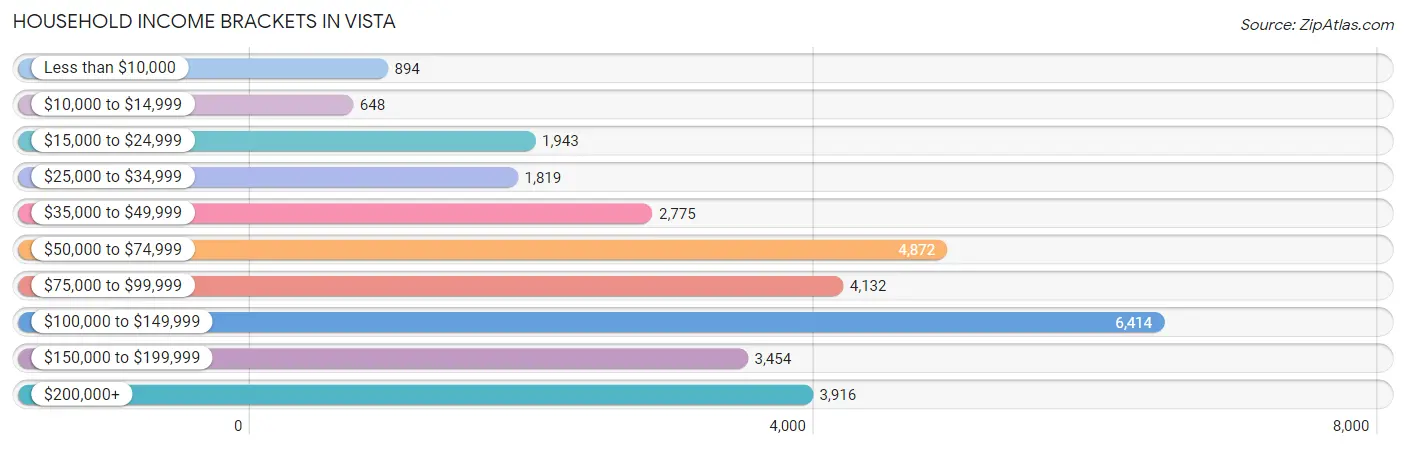
| Income Bracket | # Households | % Households |
| Less than $10,000 | 894 | 2.9% |
| $10,000 to $14,999 | 648 | 2.1% |
| $15,000 to $24,999 | 1,943 | 6.3% |
| $25,000 to $34,999 | 1,819 | 5.9% |
| $35,000 to $49,999 | 2,775 | 9.0% |
| $50,000 to $74,999 | 4,872 | 15.8% |
| $75,000 to $99,999 | 4,132 | 13.4% |
| $100,000 to $149,999 | 6,414 | 20.8% |
| $150,000 to $199,999 | 3,454 | 11.2% |
| $200,000+ | 3,916 | 12.7% |
Household Income by Householder Age in Vista
The median household income in Vista is $88,715, with the highest median household income of $104,128 found in the 45 to 64 years age bracket for the primary householder. A total of 11,001 households (35.7%) fall into this category. Meanwhile, the 65+ years age bracket for the primary householder has the lowest median household income of $63,929, with 6,290 households (20.4%) in this group.
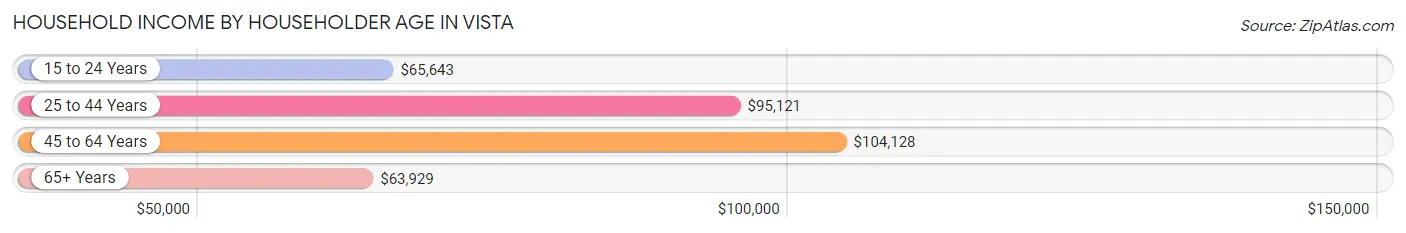
| Income Bracket | # Households | Median Income |
| 15 to 24 Years | 1,160 (3.8%) | $65,643 |
| 25 to 44 Years | 12,385 (40.2%) | $95,121 |
| 45 to 64 Years | 11,001 (35.7%) | $104,128 |
| 65+ Years | 6,290 (20.4%) | $63,929 |
| Total | 30,836 (100.0%) | $88,715 |
Poverty in Vista
Income Below Poverty by Sex and Age in Vista
With 9.5% poverty level for males and 12.5% for females among the residents of Vista, 5 year old males and 6 to 11 year old females are the most vulnerable to poverty, with 170 males (38.5%) and 777 females (22.3%) in their respective age groups living below the poverty level.
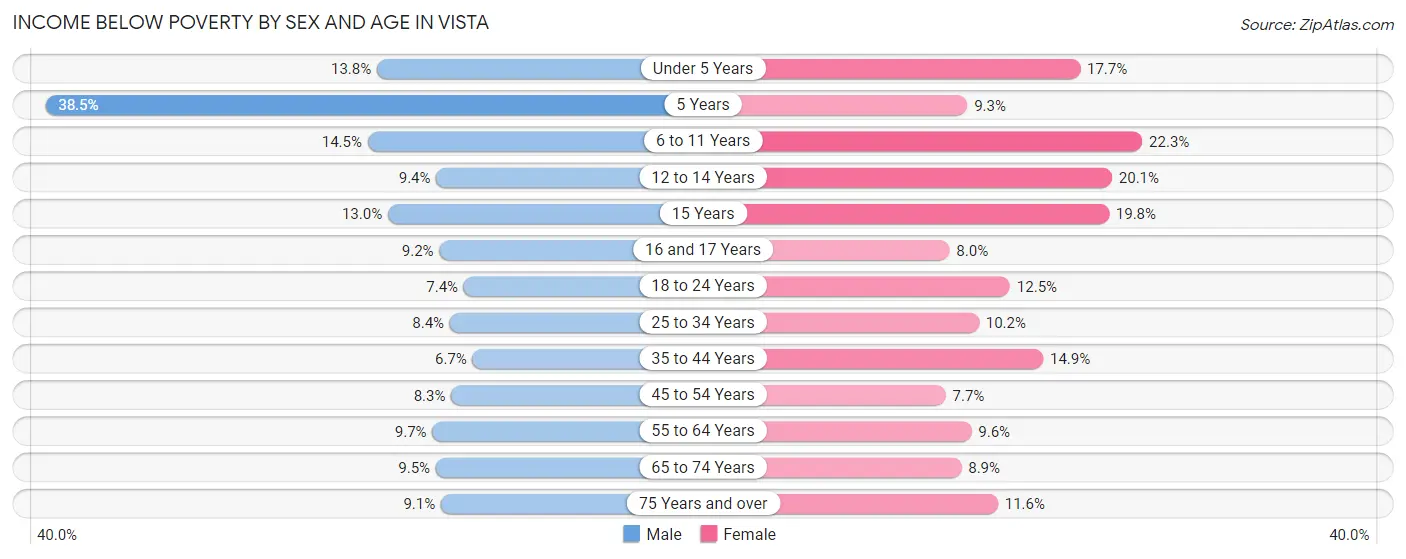
| Age Bracket | Male | Female |
| Under 5 Years | 430 (13.8%) | 613 (17.7%) |
| 5 Years | 170 (38.5%) | 61 (9.3%) |
| 6 to 11 Years | 510 (14.5%) | 777 (22.3%) |
| 12 to 14 Years | 238 (9.4%) | 330 (20.1%) |
| 15 Years | 84 (13.0%) | 139 (19.8%) |
| 16 and 17 Years | 160 (9.2%) | 98 (8.0%) |
| 18 to 24 Years | 367 (7.4%) | 643 (12.5%) |
| 25 to 34 Years | 681 (8.4%) | 751 (10.2%) |
| 35 to 44 Years | 485 (6.7%) | 1,014 (14.9%) |
| 45 to 54 Years | 512 (8.3%) | 510 (7.7%) |
| 55 to 64 Years | 497 (9.7%) | 467 (9.6%) |
| 65 to 74 Years | 312 (9.5%) | 325 (8.9%) |
| 75 Years and over | 163 (9.1%) | 297 (11.6%) |
| Total | 4,609 (9.5%) | 6,025 (12.5%) |
Income Above Poverty by Sex and Age in Vista
According to the poverty statistics in Vista, males aged 35 to 44 years and females aged 45 to 54 years are the age groups that are most secure financially, with 93.3% of males and 92.3% of females in these age groups living above the poverty line.
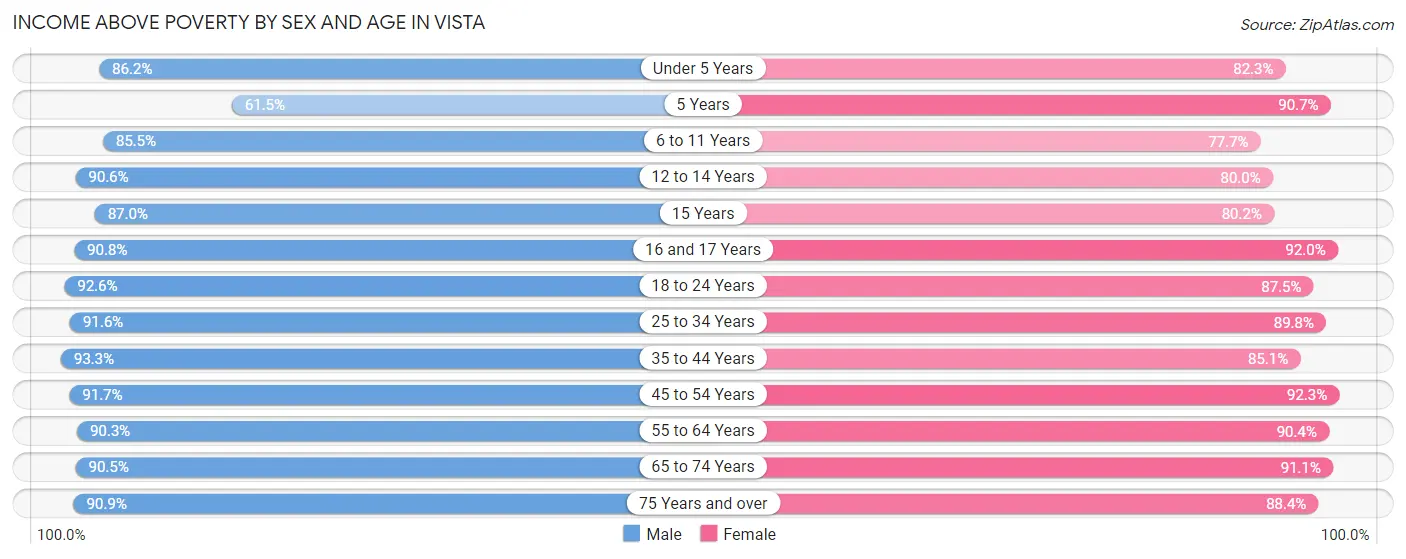
| Age Bracket | Male | Female |
| Under 5 Years | 2,680 (86.2%) | 2,852 (82.3%) |
| 5 Years | 272 (61.5%) | 594 (90.7%) |
| 6 to 11 Years | 3,002 (85.5%) | 2,707 (77.7%) |
| 12 to 14 Years | 2,285 (90.6%) | 1,316 (79.9%) |
| 15 Years | 561 (87.0%) | 562 (80.2%) |
| 16 and 17 Years | 1,580 (90.8%) | 1,128 (92.0%) |
| 18 to 24 Years | 4,608 (92.6%) | 4,508 (87.5%) |
| 25 to 34 Years | 7,405 (91.6%) | 6,634 (89.8%) |
| 35 to 44 Years | 6,717 (93.3%) | 5,771 (85.1%) |
| 45 to 54 Years | 5,645 (91.7%) | 6,105 (92.3%) |
| 55 to 64 Years | 4,616 (90.3%) | 4,385 (90.4%) |
| 65 to 74 Years | 2,987 (90.5%) | 3,337 (91.1%) |
| 75 Years and over | 1,633 (90.9%) | 2,267 (88.4%) |
| Total | 43,991 (90.5%) | 42,166 (87.5%) |
Income Below Poverty Among Married-Couple Families in Vista
The poverty statistics for married-couple families in Vista show that 4.1% or 632 of the total 15,305 families live below the poverty line. Families with 5 or more children have the highest poverty rate of 32.3%, comprising of 42 families. On the other hand, families with no children have the lowest poverty rate of 2.2%, which includes 181 families.
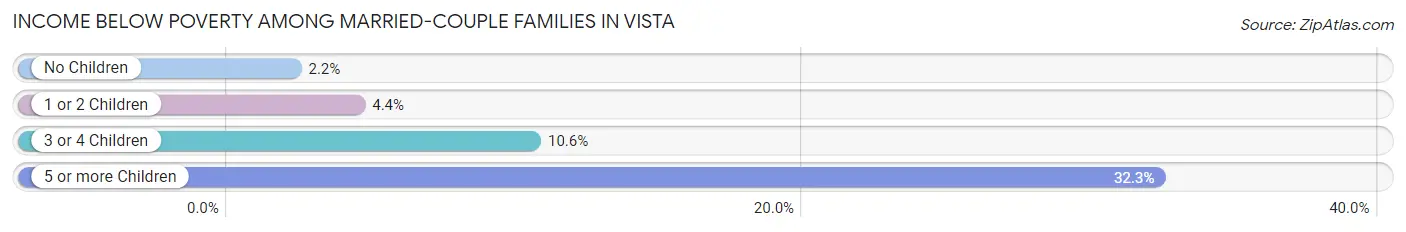
| Children | Above Poverty | Below Poverty |
| No Children | 8,003 (97.8%) | 181 (2.2%) |
| 1 or 2 Children | 5,132 (95.6%) | 238 (4.4%) |
| 3 or 4 Children | 1,450 (89.4%) | 171 (10.5%) |
| 5 or more Children | 88 (67.7%) | 42 (32.3%) |
| Total | 14,673 (95.9%) | 632 (4.1%) |
Income Below Poverty Among Single-Parent Households in Vista
According to the poverty data in Vista, 5.7% or 127 single-father households and 20.3% or 921 single-mother households are living below the poverty line. Among single-father households, those with 1 or 2 children have the highest poverty rate, with 69 households (6.1%) experiencing poverty. Likewise, among single-mother households, those with 5 or more children have the highest poverty rate, with 164 households (90.1%) falling below the poverty line.
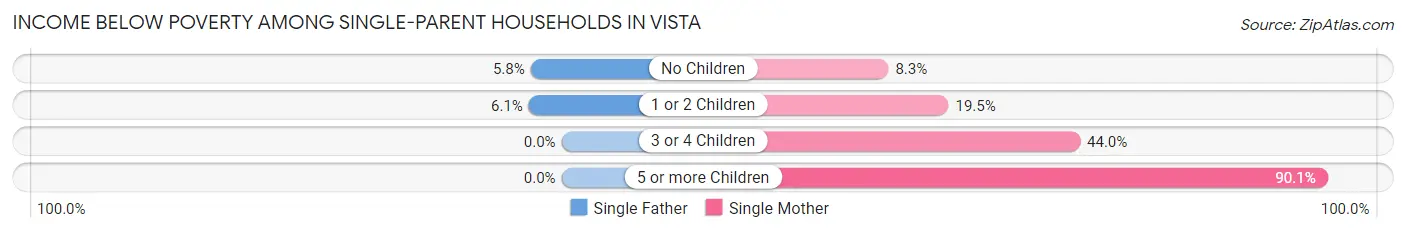
| Children | Single Father | Single Mother |
| No Children | 58 (5.8%) | 139 (8.3%) |
| 1 or 2 Children | 69 (6.1%) | 448 (19.5%) |
| 3 or 4 Children | 0 (0.0%) | 170 (44.0%) |
| 5 or more Children | 0 (0.0%) | 164 (90.1%) |
| Total | 127 (5.7%) | 921 (20.3%) |
Income Below Poverty Among Married-Couple vs Single-Parent Households in Vista
The poverty data for Vista shows that 632 of the married-couple family households (4.1%) and 1,048 of the single-parent households (15.5%) are living below the poverty level. Within the married-couple family households, those with 5 or more children have the highest poverty rate, with 42 households (32.3%) falling below the poverty line. Among the single-parent households, those with 5 or more children have the highest poverty rate, with 164 household (90.1%) living below poverty.
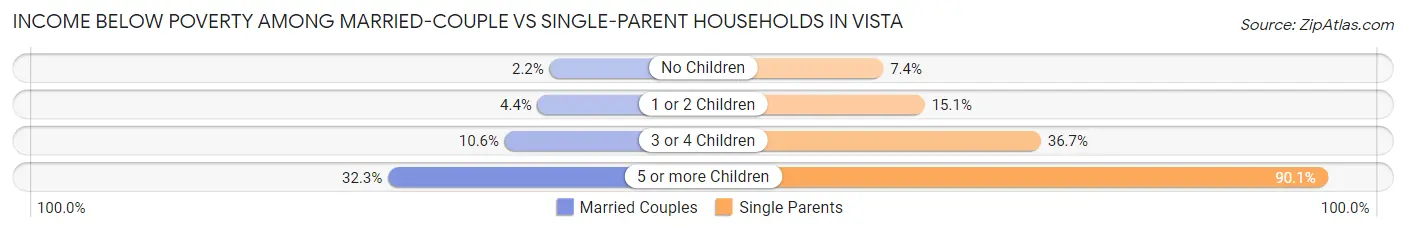
| Children | Married-Couple Families | Single-Parent Households |
| No Children | 181 (2.2%) | 197 (7.4%) |
| 1 or 2 Children | 238 (4.4%) | 517 (15.1%) |
| 3 or 4 Children | 171 (10.5%) | 170 (36.7%) |
| 5 or more Children | 42 (32.3%) | 164 (90.1%) |
| Total | 632 (4.1%) | 1,048 (15.5%) |
Race in Vista
The most populous races in Vista are White / Caucasian (56,174 | 57.1%), Hispanic or Latino (48,408 | 49.2%), and Two or more Races (22,539 | 22.9%).
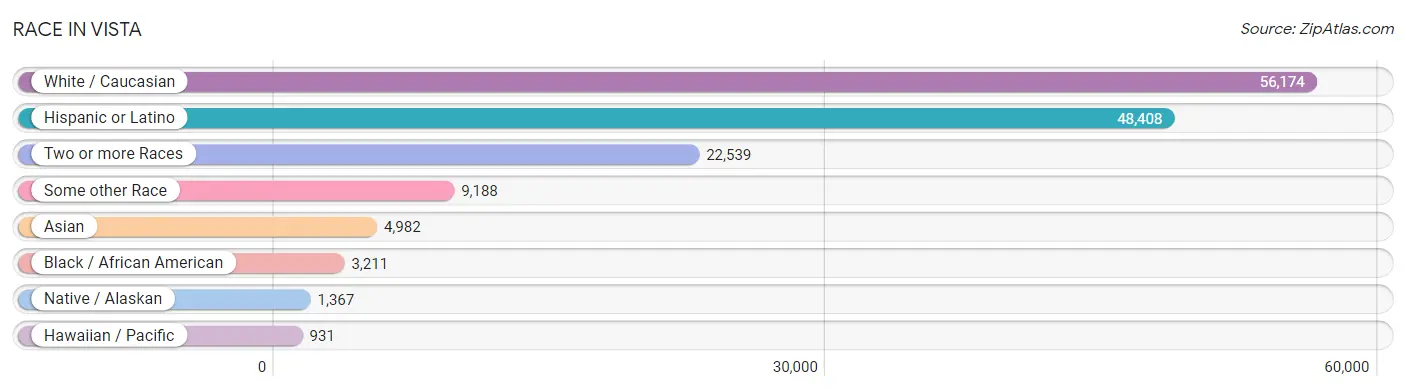
| Race | # Population | % Population |
| Asian | 4,982 | 5.1% |
| Black / African American | 3,211 | 3.3% |
| Hawaiian / Pacific | 931 | 0.9% |
| Hispanic or Latino | 48,408 | 49.2% |
| Native / Alaskan | 1,367 | 1.4% |
| White / Caucasian | 56,174 | 57.1% |
| Two or more Races | 22,539 | 22.9% |
| Some other Race | 9,188 | 9.3% |
| Total | 98,392 | 100.0% |
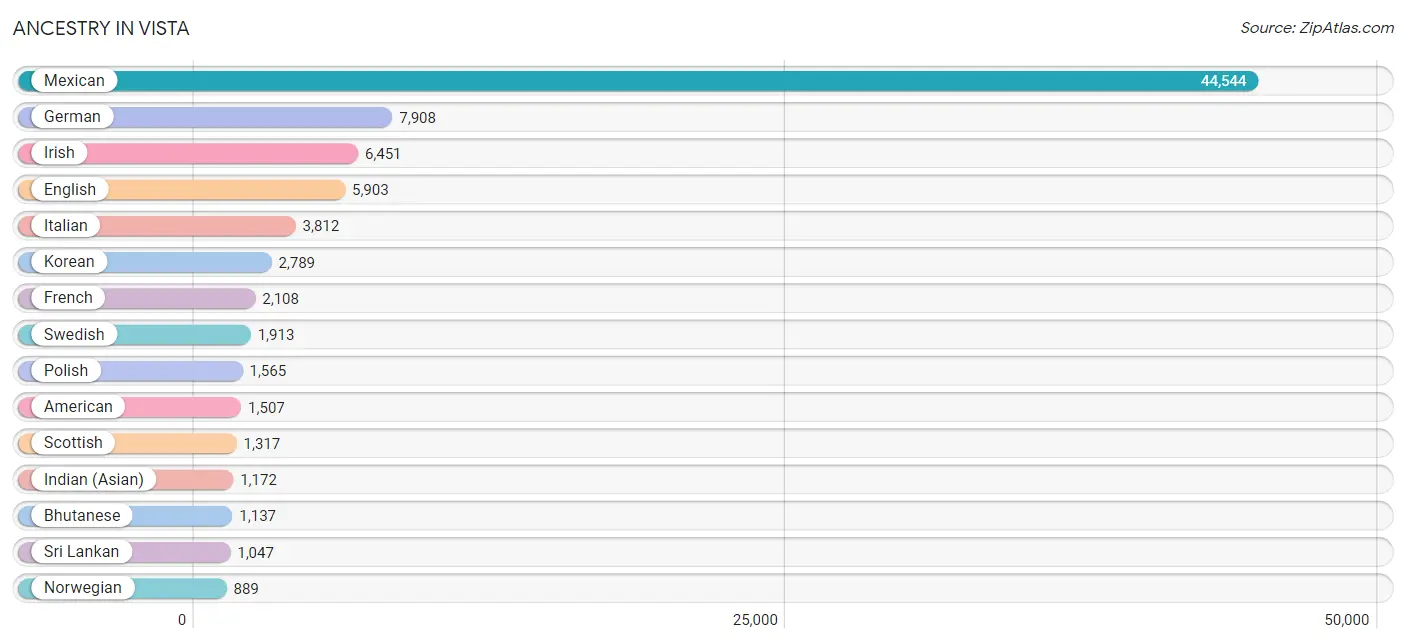
Ancestry in Vista
The most populous ancestries reported in Vista are Mexican (44,544 | 45.3%), German (7,908 | 8.0%), Irish (6,451 | 6.6%), English (5,903 | 6.0%), and Italian (3,812 | 3.9%), together accounting for 69.7% of all Vista residents.
| Ancestry | # Population | % Population |
| Afghan | 16 | 0.0% |
| African | 353 | 0.4% |
| Albanian | 60 | 0.1% |
| American | 1,507 | 1.5% |
| Apache | 46 | 0.1% |
| Arab | 542 | 0.5% |
| Argentinean | 148 | 0.2% |
| Assyrian / Chaldean / Syriac | 41 | 0.0% |
| Austrian | 217 | 0.2% |
| Bangladeshi | 30 | 0.0% |
| Basque | 93 | 0.1% |
| Belgian | 106 | 0.1% |
| Bhutanese | 1,137 | 1.2% |
| Blackfeet | 72 | 0.1% |
| Bolivian | 55 | 0.1% |
| Brazilian | 207 | 0.2% |
| British | 373 | 0.4% |
| British West Indian | 16 | 0.0% |
| Burmese | 326 | 0.3% |
| Canadian | 152 | 0.2% |
| Central American | 759 | 0.8% |
| Central American Indian | 187 | 0.2% |
| Cherokee | 175 | 0.2% |
| Chickasaw | 4 | 0.0% |
| Chilean | 14 | 0.0% |
| Chinese | 19 | 0.0% |
| Chippewa | 12 | 0.0% |
| Choctaw | 182 | 0.2% |
| Colombian | 187 | 0.2% |
| Costa Rican | 42 | 0.0% |
| Croatian | 132 | 0.1% |
| Cuban | 313 | 0.3% |
| Cypriot | 91 | 0.1% |
| Czech | 156 | 0.2% |
| Czechoslovakian | 12 | 0.0% |
| Danish | 688 | 0.7% |
| Delaware | 12 | 0.0% |
| Dominican | 33 | 0.0% |
| Dutch | 723 | 0.7% |
| Dutch West Indian | 10 | 0.0% |
| Eastern European | 93 | 0.1% |
| Ecuadorian | 34 | 0.0% |
| Egyptian | 52 | 0.1% |
| English | 5,903 | 6.0% |
| European | 787 | 0.8% |
| Filipino | 86 | 0.1% |
| Finnish | 121 | 0.1% |
| French | 2,108 | 2.1% |
| French Canadian | 303 | 0.3% |
| German | 7,908 | 8.0% |
| Ghanaian | 34 | 0.0% |
| Greek | 328 | 0.3% |
| Guamanian / Chamorro | 86 | 0.1% |
| Guatemalan | 231 | 0.2% |
| Guyanese | 4 | 0.0% |
| Haitian | 14 | 0.0% |
| Honduran | 120 | 0.1% |
| Hungarian | 134 | 0.1% |
| Icelander | 63 | 0.1% |
| Indian (Asian) | 1,172 | 1.2% |
| Indonesian | 36 | 0.0% |
| Iranian | 138 | 0.1% |
| Iraqi | 18 | 0.0% |
| Irish | 6,451 | 6.6% |
| Israeli | 9 | 0.0% |
| Italian | 3,812 | 3.9% |
| Jamaican | 68 | 0.1% |
| Japanese | 25 | 0.0% |
| Jordanian | 8 | 0.0% |
| Korean | 2,789 | 2.8% |
| Laotian | 62 | 0.1% |
| Latvian | 16 | 0.0% |
| Lebanese | 206 | 0.2% |
| Lithuanian | 71 | 0.1% |
| Malaysian | 254 | 0.3% |
| Mexican | 44,544 | 45.3% |
| Mexican American Indian | 477 | 0.5% |
| Moroccan | 55 | 0.1% |
| Native Hawaiian | 657 | 0.7% |
| Navajo | 243 | 0.3% |
| Nicaraguan | 52 | 0.1% |
| Nigerian | 17 | 0.0% |
| Northern European | 184 | 0.2% |
| Norwegian | 889 | 0.9% |
| Pakistani | 160 | 0.2% |
| Panamanian | 125 | 0.1% |
| Pennsylvania German | 19 | 0.0% |
| Peruvian | 129 | 0.1% |
| Polish | 1,565 | 1.6% |
| Portuguese | 292 | 0.3% |
| Pueblo | 21 | 0.0% |
| Puerto Rican | 810 | 0.8% |
| Puget Sound Salish | 10 | 0.0% |
| Romanian | 127 | 0.1% |
| Russian | 579 | 0.6% |
| Salvadoran | 189 | 0.2% |
| Samoan | 792 | 0.8% |
| Scandinavian | 313 | 0.3% |
| Scotch-Irish | 477 | 0.5% |
| Scottish | 1,317 | 1.3% |
| Serbian | 105 | 0.1% |
| Sioux | 53 | 0.1% |
| Slavic | 5 | 0.0% |
| Slovak | 63 | 0.1% |
| Somali | 103 | 0.1% |
| South African | 98 | 0.1% |
| South American | 679 | 0.7% |
| South American Indian | 9 | 0.0% |
| Spaniard | 397 | 0.4% |
| Spanish | 339 | 0.3% |
| Sri Lankan | 1,047 | 1.1% |
| Subsaharan African | 755 | 0.8% |
| Swedish | 1,913 | 1.9% |
| Swiss | 115 | 0.1% |
| Syrian | 39 | 0.0% |
| Thai | 425 | 0.4% |
| Trinidadian and Tobagonian | 28 | 0.0% |
| Turkish | 33 | 0.0% |
| Ukrainian | 116 | 0.1% |
| Venezuelan | 12 | 0.0% |
| Welsh | 545 | 0.5% |
| West Indian | 11 | 0.0% |
| Yaqui | 42 | 0.0% |
| Yugoslavian | 65 | 0.1% |
| Yuman | 24 | 0.0% | View All 125 Rows |
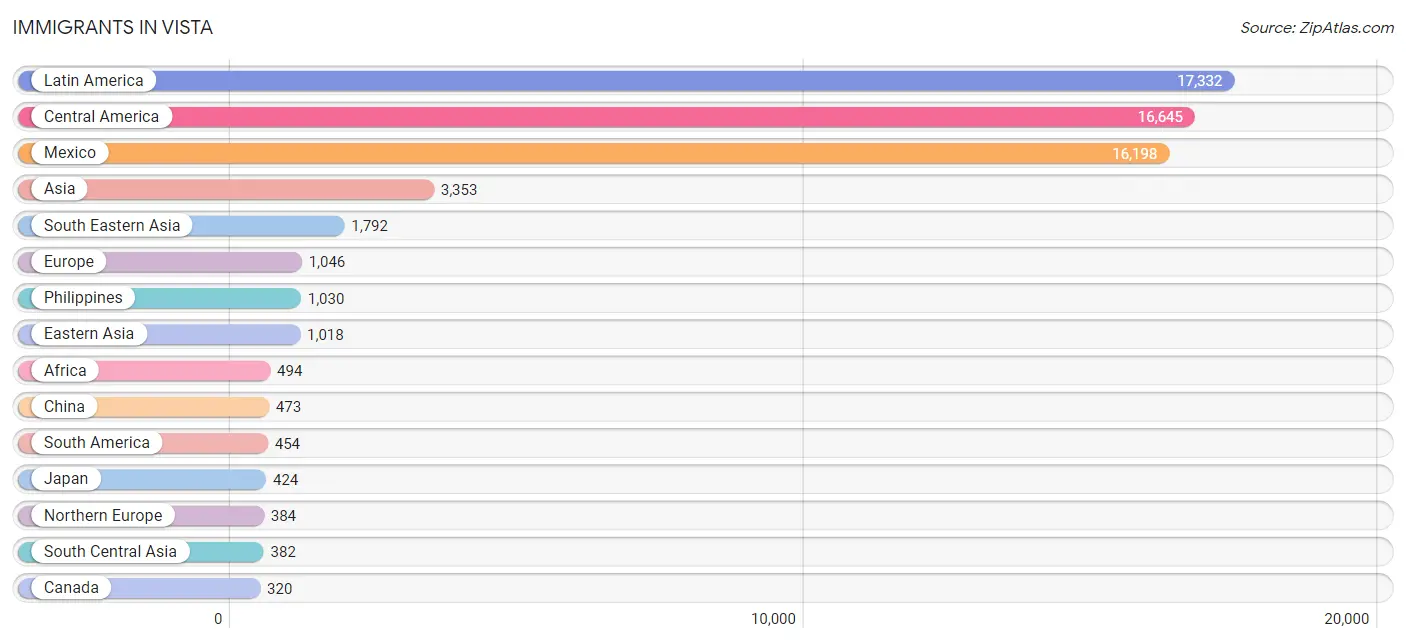
Immigrants in Vista
The most numerous immigrant groups reported in Vista came from Latin America (17,332 | 17.6%), Central America (16,645 | 16.9%), Mexico (16,198 | 16.5%), Asia (3,353 | 3.4%), and South Eastern Asia (1,792 | 1.8%), together accounting for 56.2% of all Vista residents.
| Immigration Origin | # Population | % Population |
| Afghanistan | 16 | 0.0% |
| Africa | 494 | 0.5% |
| Albania | 32 | 0.0% |
| Argentina | 32 | 0.0% |
| Asia | 3,353 | 3.4% |
| Australia | 13 | 0.0% |
| Bahamas | 10 | 0.0% |
| Belgium | 34 | 0.0% |
| Bolivia | 16 | 0.0% |
| Brazil | 146 | 0.2% |
| Cambodia | 22 | 0.0% |
| Canada | 320 | 0.3% |
| Caribbean | 233 | 0.2% |
| Central America | 16,645 | 16.9% |
| China | 473 | 0.5% |
| Colombia | 126 | 0.1% |
| Congo | 50 | 0.1% |
| Croatia | 39 | 0.0% |
| Cuba | 34 | 0.0% |
| Denmark | 39 | 0.0% |
| Dominican Republic | 79 | 0.1% |
| Eastern Africa | 15 | 0.0% |
| Eastern Asia | 1,018 | 1.0% |
| Eastern Europe | 275 | 0.3% |
| Ecuador | 19 | 0.0% |
| Egypt | 70 | 0.1% |
| El Salvador | 156 | 0.2% |
| England | 108 | 0.1% |
| Europe | 1,046 | 1.1% |
| France | 179 | 0.2% |
| Germany | 50 | 0.1% |
| Ghana | 66 | 0.1% |
| Guatemala | 134 | 0.1% |
| Honduras | 51 | 0.1% |
| Hong Kong | 49 | 0.1% |
| India | 290 | 0.3% |
| Indonesia | 76 | 0.1% |
| Iran | 59 | 0.1% |
| Iraq | 30 | 0.0% |
| Ireland | 24 | 0.0% |
| Israel | 11 | 0.0% |
| Italy | 78 | 0.1% |
| Jamaica | 68 | 0.1% |
| Japan | 424 | 0.4% |
| Jordan | 8 | 0.0% |
| Kenya | 8 | 0.0% |
| Korea | 121 | 0.1% |
| Laos | 202 | 0.2% |
| Latin America | 17,332 | 17.6% |
| Lebanon | 61 | 0.1% |
| Malaysia | 15 | 0.0% |
| Mexico | 16,198 | 16.5% |
| Middle Africa | 50 | 0.1% |
| Morocco | 19 | 0.0% |
| Nepal | 17 | 0.0% |
| Netherlands | 27 | 0.0% |
| Nicaragua | 50 | 0.1% |
| Nigeria | 17 | 0.0% |
| Northern Africa | 110 | 0.1% |
| Northern Europe | 384 | 0.4% |
| Oceania | 299 | 0.3% |
| Panama | 56 | 0.1% |
| Peru | 98 | 0.1% |
| Philippines | 1,030 | 1.1% |
| Poland | 3 | 0.0% |
| Romania | 17 | 0.0% |
| Russia | 61 | 0.1% |
| Serbia | 42 | 0.0% |
| South Africa | 138 | 0.1% |
| South America | 454 | 0.5% |
| South Central Asia | 382 | 0.4% |
| South Eastern Asia | 1,792 | 1.8% |
| Southern Europe | 78 | 0.1% |
| Sweden | 144 | 0.2% |
| Switzerland | 19 | 0.0% |
| Syria | 6 | 0.0% |
| Taiwan | 52 | 0.1% |
| Thailand | 174 | 0.2% |
| Trinidad and Tobago | 28 | 0.0% |
| Ukraine | 81 | 0.1% |
| Uruguay | 5 | 0.0% |
| Venezuela | 12 | 0.0% |
| Vietnam | 273 | 0.3% |
| West Indies | 14 | 0.0% |
| Western Africa | 83 | 0.1% |
| Western Asia | 161 | 0.2% |
| Western Europe | 309 | 0.3% | View All 87 Rows |
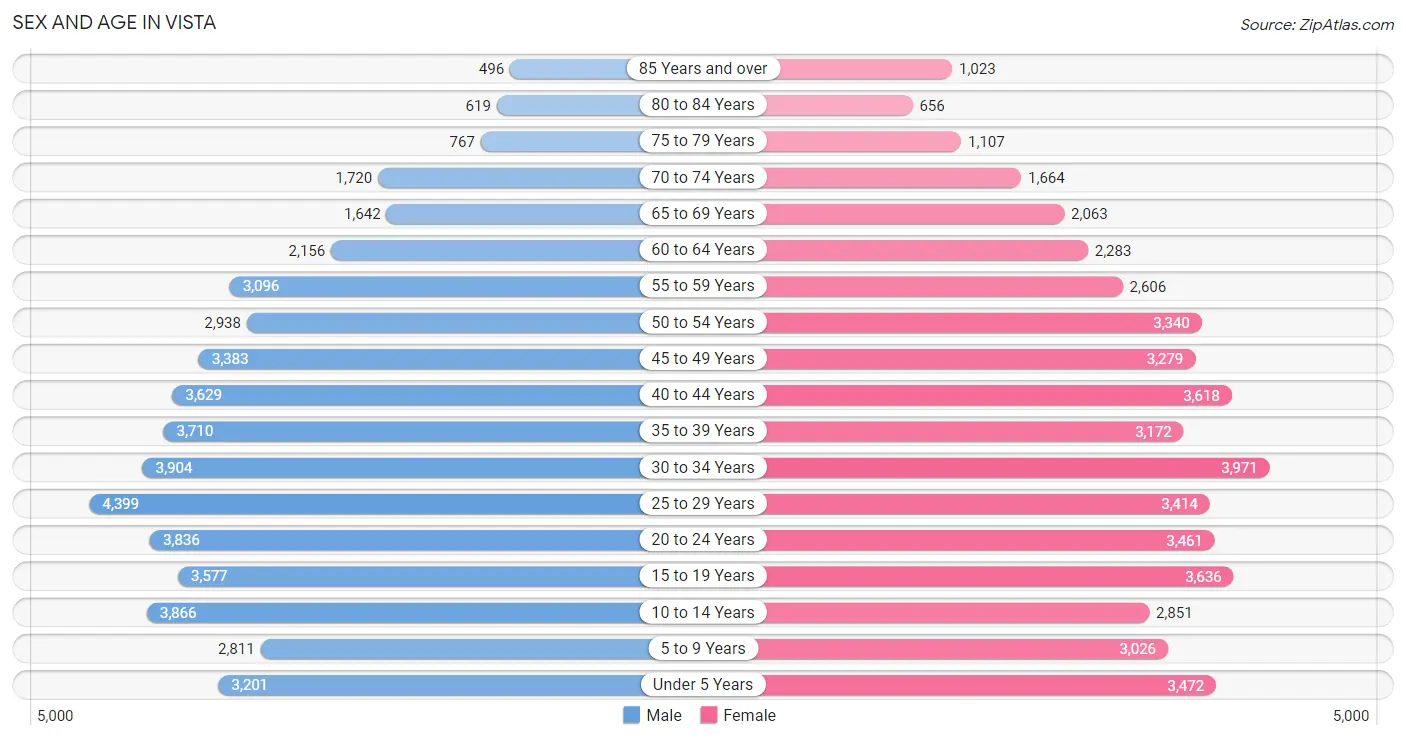
Sex and Age in Vista
Sex and Age in Vista
The most populous age groups in Vista are 25 to 29 Years (4,399 | 8.8%) for men and 30 to 34 Years (3,971 | 8.2%) for women.
| Age Bracket | Male | Female |
| Under 5 Years | 3,201 (6.4%) | 3,472 (7.1%) |
| 5 to 9 Years | 2,811 (5.7%) | 3,026 (6.2%) |
| 10 to 14 Years | 3,866 (7.8%) | 2,851 (5.9%) |
| 15 to 19 Years | 3,577 (7.2%) | 3,636 (7.5%) |
| 20 to 24 Years | 3,836 (7.7%) | 3,461 (7.1%) |
| 25 to 29 Years | 4,399 (8.8%) | 3,414 (7.0%) |
| 30 to 34 Years | 3,904 (7.9%) | 3,971 (8.2%) |
| 35 to 39 Years | 3,710 (7.5%) | 3,172 (6.5%) |
| 40 to 44 Years | 3,629 (7.3%) | 3,618 (7.4%) |
| 45 to 49 Years | 3,383 (6.8%) | 3,279 (6.7%) |
| 50 to 54 Years | 2,938 (5.9%) | 3,340 (6.9%) |
| 55 to 59 Years | 3,096 (6.2%) | 2,606 (5.4%) |
| 60 to 64 Years | 2,156 (4.3%) | 2,283 (4.7%) |
| 65 to 69 Years | 1,642 (3.3%) | 2,063 (4.2%) |
| 70 to 74 Years | 1,720 (3.5%) | 1,664 (3.4%) |
| 75 to 79 Years | 767 (1.5%) | 1,107 (2.3%) |
| 80 to 84 Years | 619 (1.2%) | 656 (1.3%) |
| 85 Years and over | 496 (1.0%) | 1,023 (2.1%) |
| Total | 49,750 (100.0%) | 48,642 (100.0%) |
Families and Households in Vista
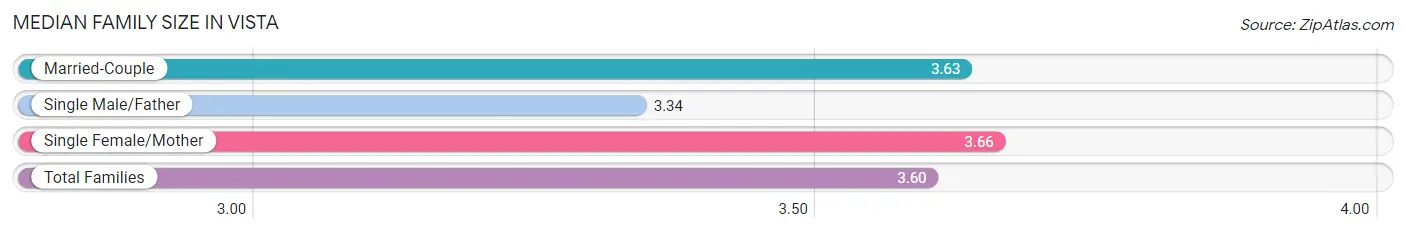
Median Family Size in Vista
The median family size in Vista is 3.60 persons per family, with single female/mother families (4,528 | 20.5%) accounting for the largest median family size of 3.66 persons per family. On the other hand, single male/father families (2,214 | 10.0%) represent the smallest median family size with 3.34 persons per family.
| Family Type | # Families | Family Size |
| Married-Couple | 15,305 (69.4%) | 3.63 |
| Single Male/Father | 2,214 (10.0%) | 3.34 |
| Single Female/Mother | 4,528 (20.5%) | 3.66 |
| Total Families | 22,047 (100.0%) | 3.60 |
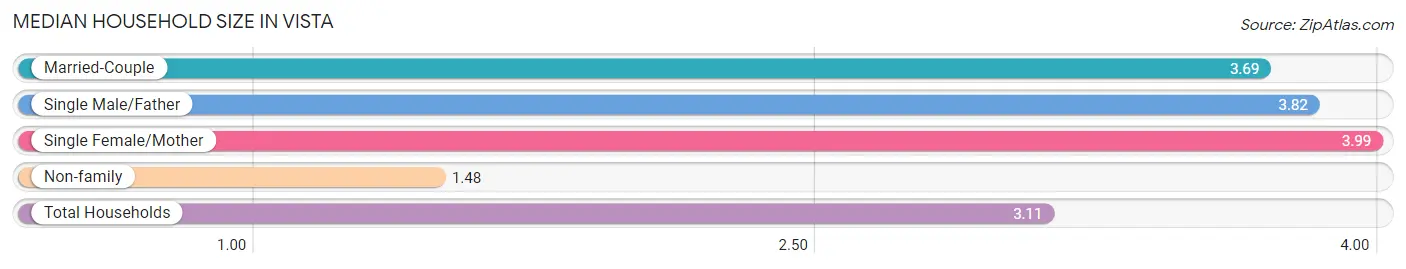
Median Household Size in Vista
The median household size in Vista is 3.11 persons per household, with single female/mother households (4,528 | 14.7%) accounting for the largest median household size of 3.99 persons per household. non-family households (8,789 | 28.5%) represent the smallest median household size with 1.48 persons per household.
| Household Type | # Households | Household Size |
| Married-Couple | 15,305 (49.6%) | 3.69 |
| Single Male/Father | 2,214 (7.2%) | 3.82 |
| Single Female/Mother | 4,528 (14.7%) | 3.99 |
| Non-family | 8,789 (28.5%) | 1.48 |
| Total Households | 30,836 (100.0%) | 3.11 |
Household Size by Marriage Status in Vista
Out of a total of 30,836 households in Vista, 22,047 (71.5%) are family households, while 8,789 (28.5%) are nonfamily households. The most numerous type of family households are 2-person households, comprising 7,486, and the most common type of nonfamily households are 1-person households, comprising 6,197.
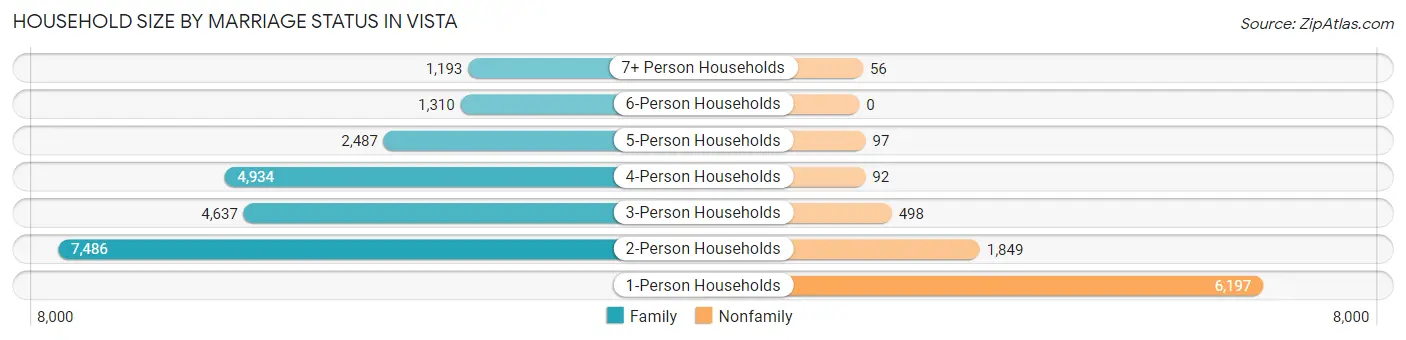
| Household Size | Family Households | Nonfamily Households |
| 1-Person Households | - | 6,197 (20.1%) |
| 2-Person Households | 7,486 (24.3%) | 1,849 (6.0%) |
| 3-Person Households | 4,637 (15.0%) | 498 (1.6%) |
| 4-Person Households | 4,934 (16.0%) | 92 (0.3%) |
| 5-Person Households | 2,487 (8.1%) | 97 (0.3%) |
| 6-Person Households | 1,310 (4.3%) | 0 (0.0%) |
| 7+ Person Households | 1,193 (3.9%) | 56 (0.2%) |
| Total | 22,047 (71.5%) | 8,789 (28.5%) |
Female Fertility in Vista
Fertility by Age in Vista
Average fertility rate in Vista is 56.0 births per 1,000 women. Women in the age bracket of 20 to 34 years have the highest fertility rate with 81.0 births per 1,000 women. Women in the age bracket of 20 to 34 years acount for 61.9% of all women with births.
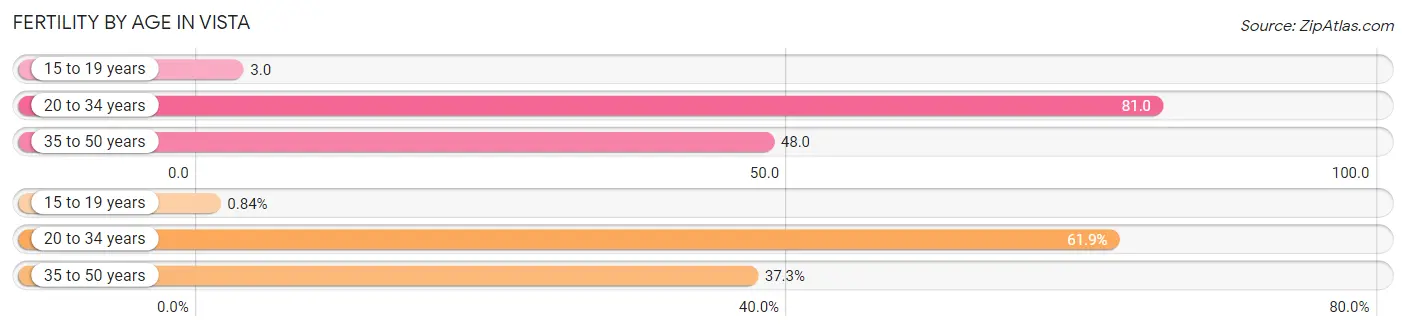
| Age Bracket | Women with Births | Births / 1,000 Women |
| 15 to 19 years | 12 (0.8%) | 3.0 |
| 20 to 34 years | 882 (61.9%) | 81.0 |
| 35 to 50 years | 532 (37.3%) | 48.0 |
| Total | 1,426 (100.0%) | 56.0 |
Fertility by Age by Marriage Status in Vista
69.2% of women with births (1,426) in Vista are married. The highest percentage of unmarried women with births falls into 20 to 34 years age bracket with 35.3% of them unmarried at the time of birth, while the lowest percentage of unmarried women with births belong to 15 to 19 years age bracket with 0.0% of them unmarried.
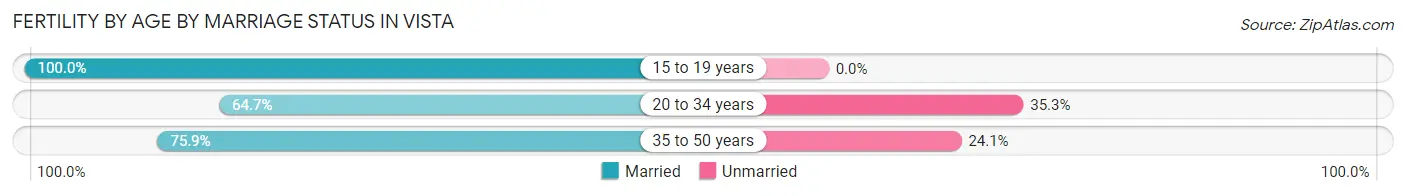
| Age Bracket | Married | Unmarried |
| 15 to 19 years | 12 (100.0%) | 0 (0.0%) |
| 20 to 34 years | 571 (64.7%) | 311 (35.3%) |
| 35 to 50 years | 404 (75.9%) | 128 (24.1%) |
| Total | 987 (69.2%) | 439 (30.8%) |
Fertility by Education in Vista
Average fertility rate in Vista is 56.0 births per 1,000 women. Women with the education attainment of graduate degree have the highest fertility rate of 148.0 births per 1,000 women, while women with the education attainment of college or associate's degree have the lowest fertility at 35.0 births per 1,000 women. Women with the education attainment of high school diploma represent 23.6% of all women with births.
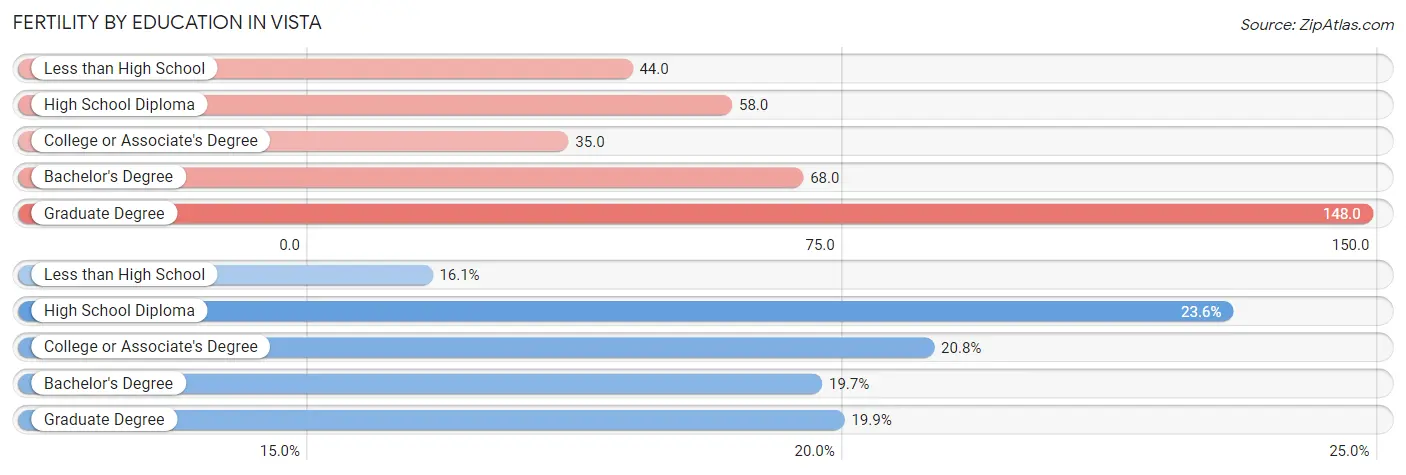
| Educational Attainment | Women with Births | Births / 1,000 Women |
| Less than High School | 229 (16.1%) | 44.0 |
| High School Diploma | 336 (23.6%) | 58.0 |
| College or Associate's Degree | 296 (20.8%) | 35.0 |
| Bachelor's Degree | 281 (19.7%) | 68.0 |
| Graduate Degree | 284 (19.9%) | 148.0 |
| Total | 1,426 (100.0%) | 56.0 |
Fertility by Education by Marriage Status in Vista
30.8% of women with births in Vista are unmarried. Women with the educational attainment of graduate degree are most likely to be married with 96.5% of them married at childbirth, while women with the educational attainment of high school diploma are least likely to be married with 59.5% of them unmarried at childbirth.
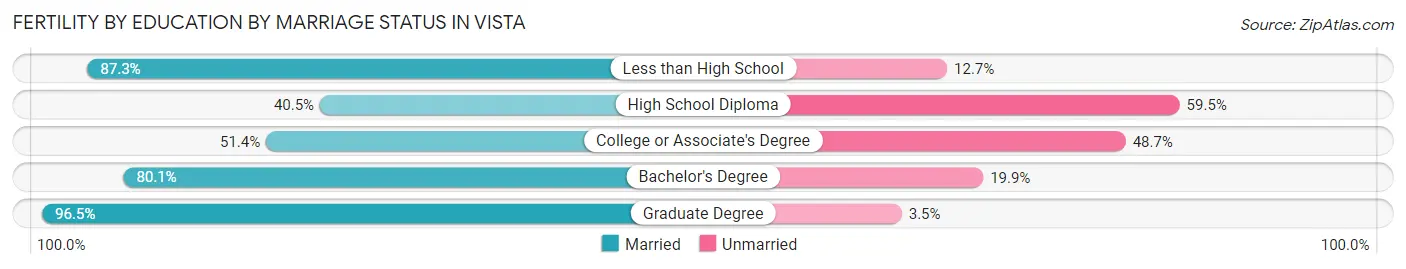
| Educational Attainment | Married | Unmarried |
| Less than High School | 200 (87.3%) | 29 (12.7%) |
| High School Diploma | 136 (40.5%) | 200 (59.5%) |
| College or Associate's Degree | 152 (51.3%) | 144 (48.6%) |
| Bachelor's Degree | 225 (80.1%) | 56 (19.9%) |
| Graduate Degree | 274 (96.5%) | 10 (3.5%) |
| Total | 987 (69.2%) | 439 (30.8%) |
Employment Characteristics in Vista
Employment by Class of Employer in Vista
Among the 49,074 employed individuals in Vista, private company employees (36,003 | 73.4%), self-employed (not incorporated) (3,857 | 7.9%), and local government employees (2,819 | 5.7%) make up the most common classes of employment.
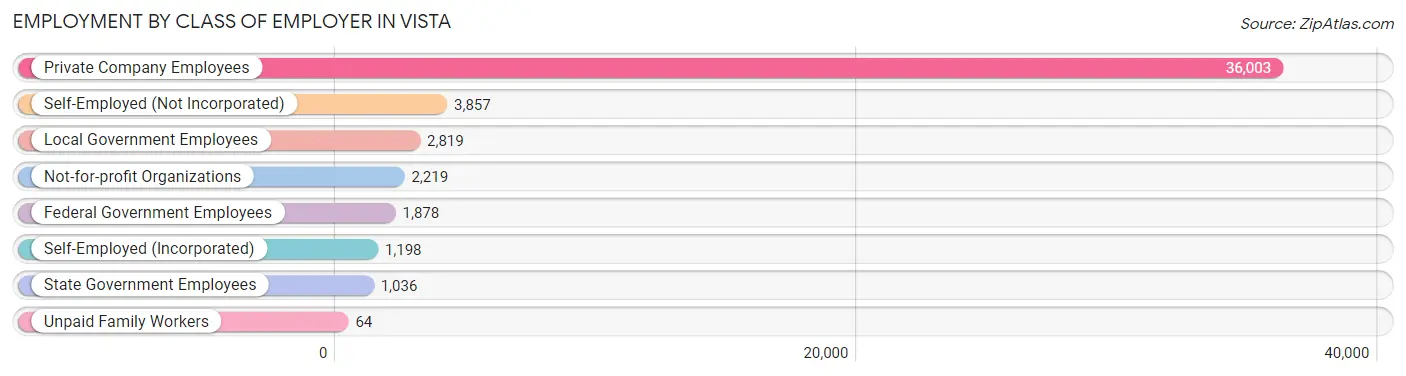
| Employer Class | # Employees | % Employees |
| Private Company Employees | 36,003 | 73.4% |
| Self-Employed (Incorporated) | 1,198 | 2.4% |
| Self-Employed (Not Incorporated) | 3,857 | 7.9% |
| Not-for-profit Organizations | 2,219 | 4.5% |
| Local Government Employees | 2,819 | 5.7% |
| State Government Employees | 1,036 | 2.1% |
| Federal Government Employees | 1,878 | 3.8% |
| Unpaid Family Workers | 64 | 0.1% |
| Total | 49,074 | 100.0% |
Employment Status by Age in Vista
According to the labor force statistics for Vista, out of the total population over 16 years of age (77,815), 68.4% or 53,225 individuals are in the labor force, with 6.3% or 3,353 of them unemployed. The age group with the highest labor force participation rate is 30 to 34 years, with 86.9% or 6,843 individuals in the labor force. Within the labor force, the 16 to 19 years age range has the highest percentage of unemployed individuals, with 19.3% or 385 of them being unemployed.
| Age Bracket | In Labor Force | Unemployed |
| 16 to 19 Years | 1,993 (34.0%) | 385 (19.3%) |
| 20 to 24 Years | 6,013 (82.4%) | 601 (10.0%) |
| 25 to 29 Years | 6,696 (85.7%) | 475 (7.1%) |
| 30 to 34 Years | 6,843 (86.9%) | 588 (8.6%) |
| 35 to 44 Years | 11,784 (83.4%) | 577 (4.9%) |
| 45 to 54 Years | 10,637 (82.2%) | 255 (2.4%) |
| 55 to 59 Years | 4,373 (76.7%) | 162 (3.7%) |
| 60 to 64 Years | 2,730 (61.5%) | 169 (6.2%) |
| 65 to 74 Years | 1,928 (27.2%) | 166 (8.6%) |
| 75 Years and over | 224 (4.8%) | 0 (0.0%) |
| Total | 53,225 (68.4%) | 3,353 (6.3%) |
Employment Status by Educational Attainment in Vista
According to labor force statistics for Vista, 81.4% of individuals (43,059) out of the total population between 25 and 64 years of age (52,898) are in the labor force, with 5.1% or 2,196 of them being unemployed. The group with the highest labor force participation rate are those with the educational attainment of bachelor's degree or higher, with 87.9% or 12,488 individuals in the labor force. Within the labor force, individuals with less than high school education have the highest percentage of unemployment, with 6.4% or 442 of them being unemployed.
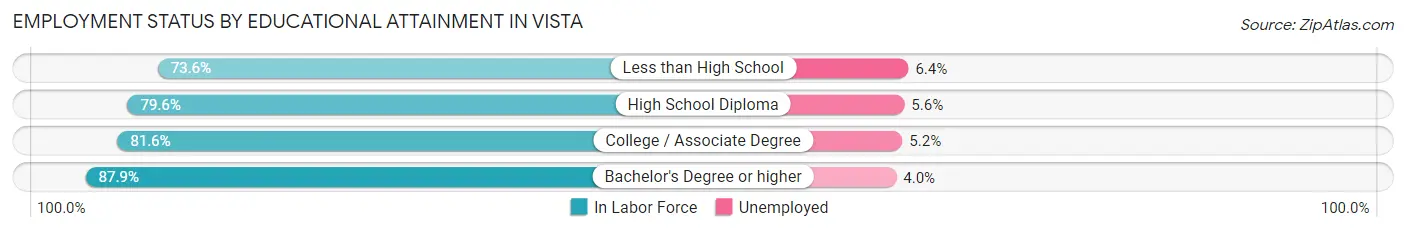
| Educational Attainment | In Labor Force | Unemployed |
| Less than High School | 6,912 (73.6%) | 601 (6.4%) |
| High School Diploma | 9,705 (79.6%) | 683 (5.6%) |
| College / Associate Degree | 13,960 (81.6%) | 890 (5.2%) |
| Bachelor's Degree or higher | 12,488 (87.9%) | 568 (4.0%) |
| Total | 43,059 (81.4%) | 2,698 (5.1%) |
Employment Occupations by Sex in Vista
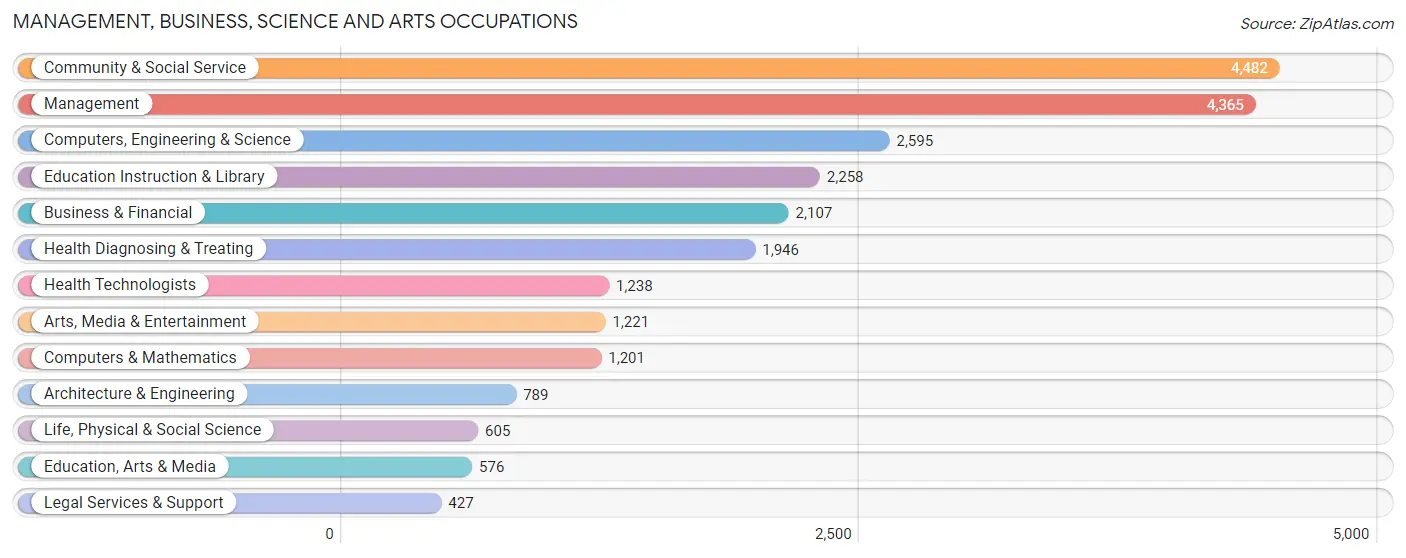
Management, Business, Science and Arts Occupations
The most common Management, Business, Science and Arts occupations in Vista are Community & Social Service (4,482 | 9.1%), Management (4,365 | 8.9%), Computers, Engineering & Science (2,595 | 5.3%), Education Instruction & Library (2,258 | 4.6%), and Business & Financial (2,107 | 4.3%).
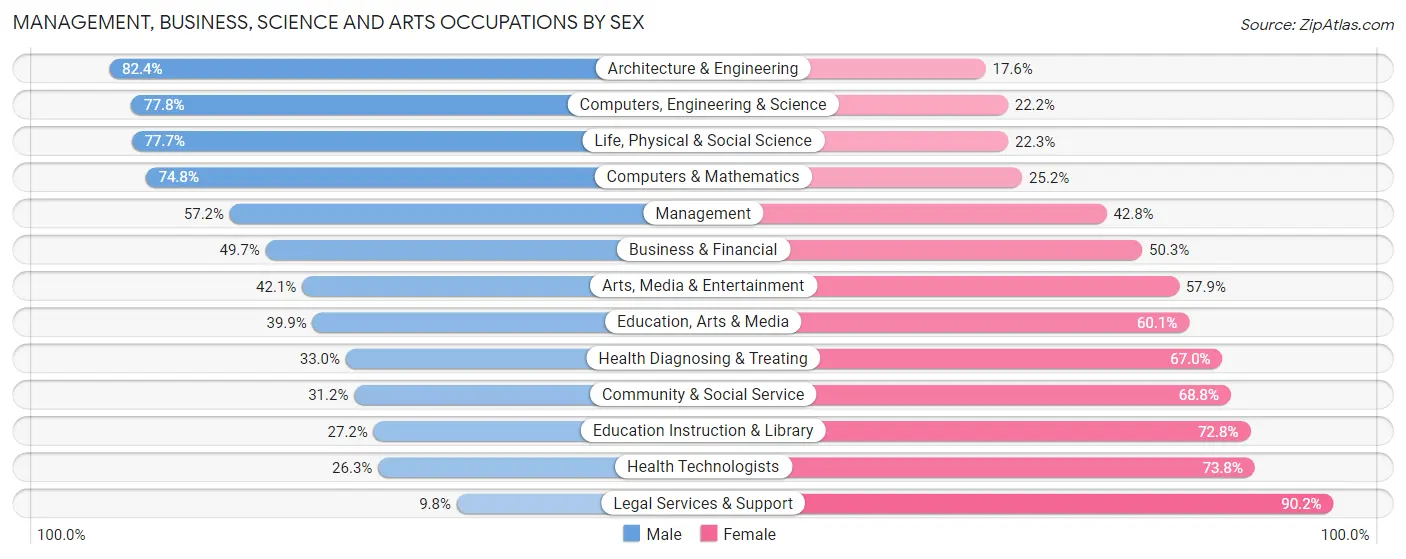
Management, Business, Science and Arts Occupations by Sex
Within the Management, Business, Science and Arts occupations in Vista, the most male-oriented occupations are Architecture & Engineering (82.4%), Computers, Engineering & Science (77.8%), and Life, Physical & Social Science (77.7%), while the most female-oriented occupations are Legal Services & Support (90.2%), Health Technologists (73.8%), and Education Instruction & Library (72.8%).
| Occupation | Male | Female |
| Management | 2,496 (57.2%) | 1,869 (42.8%) |
| Business & Financial | 1,048 (49.7%) | 1,059 (50.3%) |
| Computers, Engineering & Science | 2,018 (77.8%) | 577 (22.2%) |
| Computers & Mathematics | 898 (74.8%) | 303 (25.2%) |
| Architecture & Engineering | 650 (82.4%) | 139 (17.6%) |
| Life, Physical & Social Science | 470 (77.7%) | 135 (22.3%) |
| Community & Social Service | 1,400 (31.2%) | 3,082 (68.8%) |
| Education, Arts & Media | 230 (39.9%) | 346 (60.1%) |
| Legal Services & Support | 42 (9.8%) | 385 (90.2%) |
| Education Instruction & Library | 614 (27.2%) | 1,644 (72.8%) |
| Arts, Media & Entertainment | 514 (42.1%) | 707 (57.9%) |
| Health Diagnosing & Treating | 642 (33.0%) | 1,304 (67.0%) |
| Health Technologists | 325 (26.3%) | 913 (73.8%) |
| Total (Category) | 7,604 (49.1%) | 7,891 (50.9%) |
| Total (Overall) | 26,003 (52.9%) | 23,116 (47.1%) |
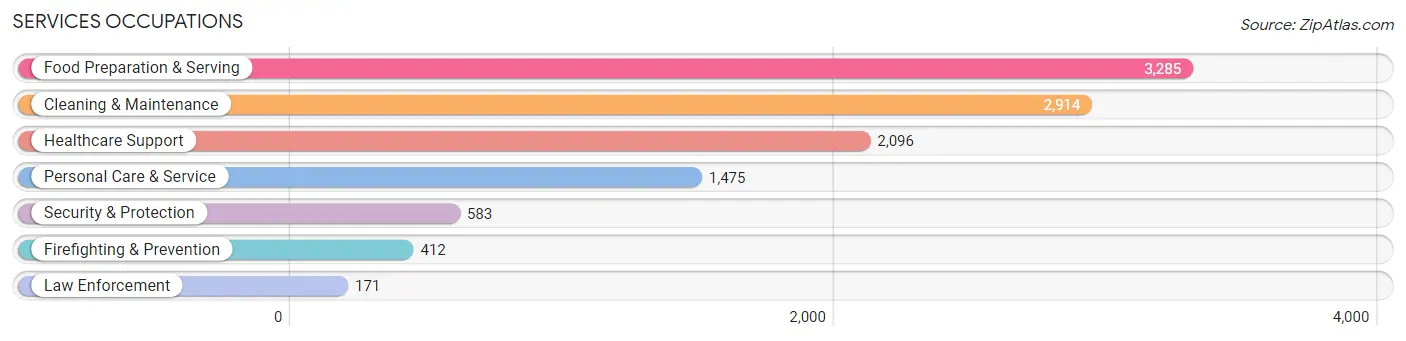
Services Occupations
The most common Services occupations in Vista are Food Preparation & Serving (3,285 | 6.7%), Cleaning & Maintenance (2,914 | 5.9%), Healthcare Support (2,096 | 4.3%), Personal Care & Service (1,475 | 3.0%), and Security & Protection (583 | 1.2%).
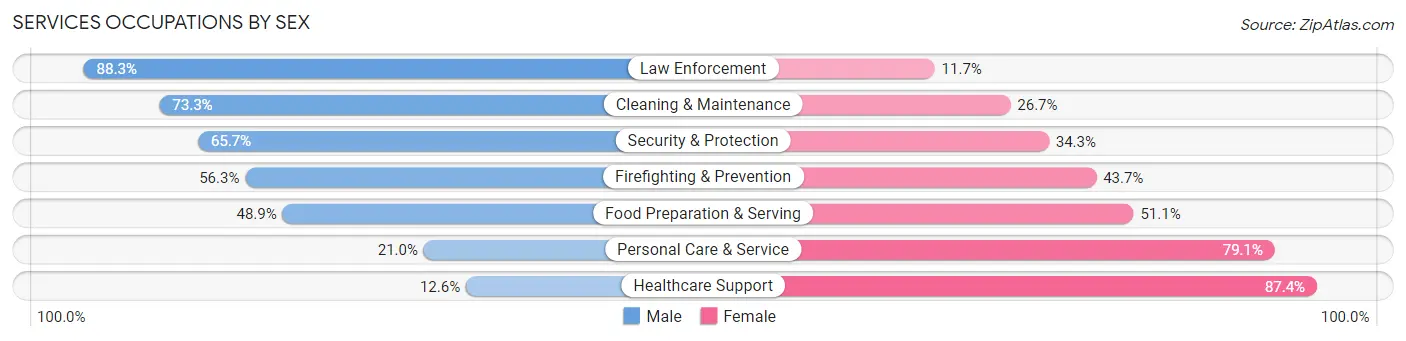
Services Occupations by Sex
Within the Services occupations in Vista, the most male-oriented occupations are Law Enforcement (88.3%), Cleaning & Maintenance (73.3%), and Security & Protection (65.7%), while the most female-oriented occupations are Healthcare Support (87.4%), Personal Care & Service (79.0%), and Food Preparation & Serving (51.1%).
| Occupation | Male | Female |
| Healthcare Support | 264 (12.6%) | 1,832 (87.4%) |
| Security & Protection | 383 (65.7%) | 200 (34.3%) |
| Firefighting & Prevention | 232 (56.3%) | 180 (43.7%) |
| Law Enforcement | 151 (88.3%) | 20 (11.7%) |
| Food Preparation & Serving | 1,607 (48.9%) | 1,678 (51.1%) |
| Cleaning & Maintenance | 2,136 (73.3%) | 778 (26.7%) |
| Personal Care & Service | 309 (20.9%) | 1,166 (79.0%) |
| Total (Category) | 4,699 (45.4%) | 5,654 (54.6%) |
| Total (Overall) | 26,003 (52.9%) | 23,116 (47.1%) |
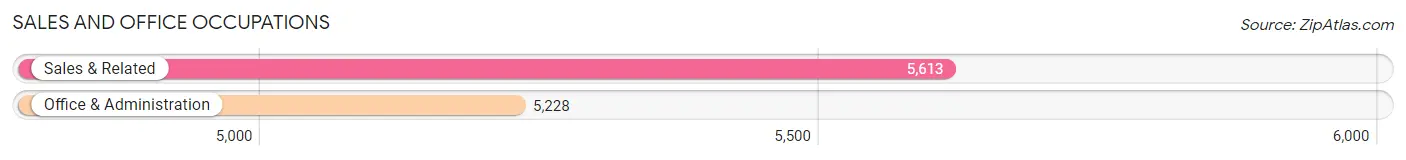
Sales and Office Occupations
The most common Sales and Office occupations in Vista are Sales & Related (5,613 | 11.4%), and Office & Administration (5,228 | 10.6%).
Sales and Office Occupations by Sex
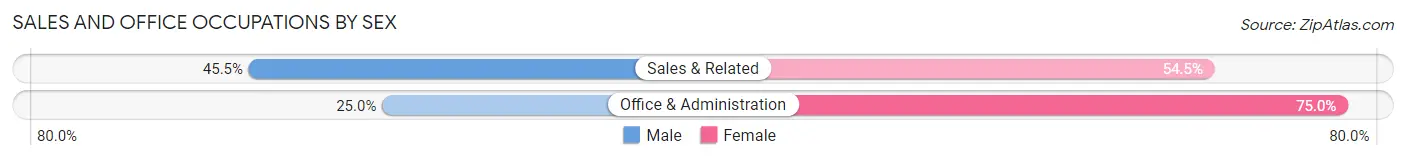
| Occupation | Male | Female |
| Sales & Related | 2,554 (45.5%) | 3,059 (54.5%) |
| Office & Administration | 1,306 (25.0%) | 3,922 (75.0%) |
| Total (Category) | 3,860 (35.6%) | 6,981 (64.4%) |
| Total (Overall) | 26,003 (52.9%) | 23,116 (47.1%) |
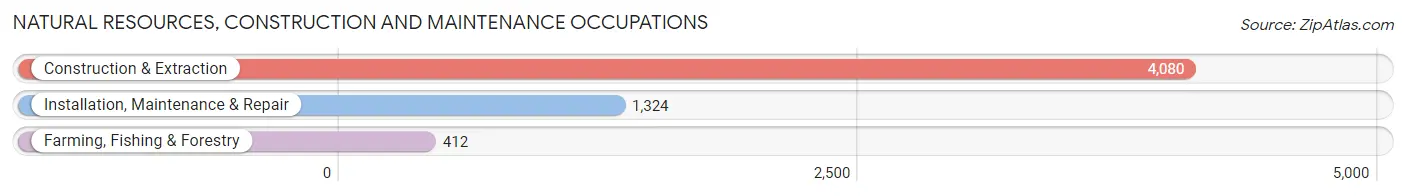
Natural Resources, Construction and Maintenance Occupations
The most common Natural Resources, Construction and Maintenance occupations in Vista are Construction & Extraction (4,080 | 8.3%), Installation, Maintenance & Repair (1,324 | 2.7%), and Farming, Fishing & Forestry (412 | 0.8%).
Natural Resources, Construction and Maintenance Occupations by Sex
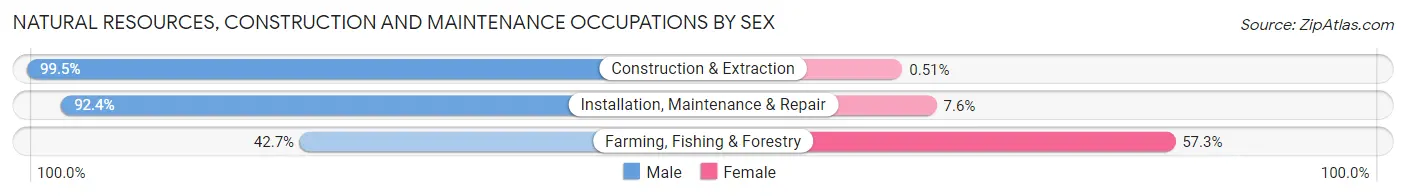
| Occupation | Male | Female |
| Farming, Fishing & Forestry | 176 (42.7%) | 236 (57.3%) |
| Construction & Extraction | 4,059 (99.5%) | 21 (0.5%) |
| Installation, Maintenance & Repair | 1,223 (92.4%) | 101 (7.6%) |
| Total (Category) | 5,458 (93.8%) | 358 (6.2%) |
| Total (Overall) | 26,003 (52.9%) | 23,116 (47.1%) |
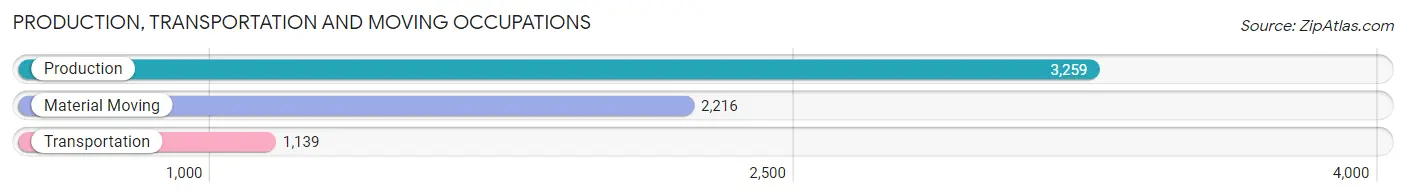
Production, Transportation and Moving Occupations
The most common Production, Transportation and Moving occupations in Vista are Production (3,259 | 6.6%), Material Moving (2,216 | 4.5%), and Transportation (1,139 | 2.3%).
Production, Transportation and Moving Occupations by Sex
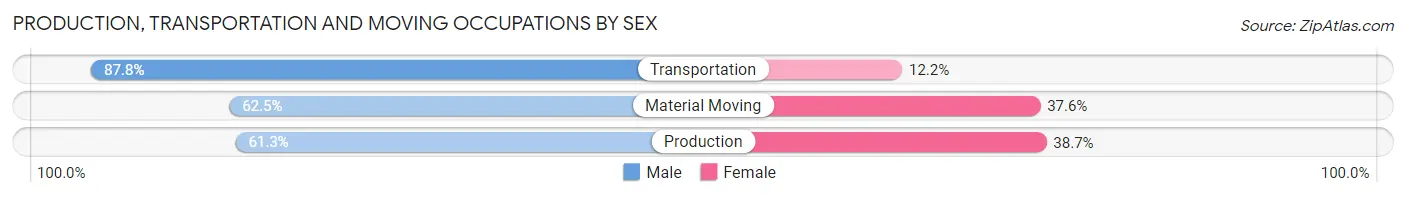
| Occupation | Male | Female |
| Production | 1,998 (61.3%) | 1,261 (38.7%) |
| Transportation | 1,000 (87.8%) | 139 (12.2%) |
| Material Moving | 1,384 (62.5%) | 832 (37.6%) |
| Total (Category) | 4,382 (66.2%) | 2,232 (33.8%) |
| Total (Overall) | 26,003 (52.9%) | 23,116 (47.1%) |
Employment Industries by Sex in Vista
Employment Industries in Vista
The major employment industries in Vista include Retail Trade (6,054 | 12.3%), Manufacturing (5,586 | 11.4%), Health Care & Social Assistance (5,323 | 10.8%), Construction (5,138 | 10.5%), and Accommodation & Food Services (3,786 | 7.7%).
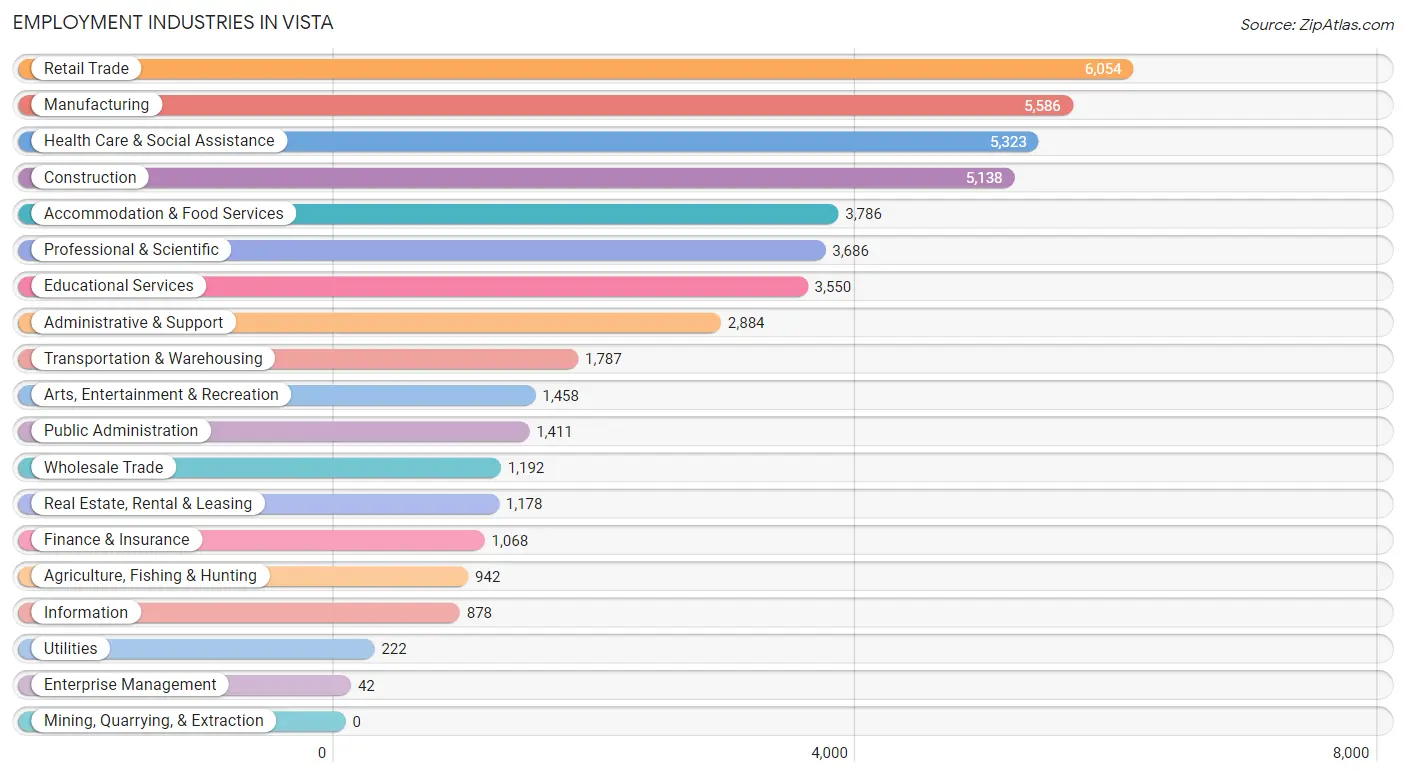
Employment Industries by Sex in Vista
The Vista industries that see more men than women are Construction (92.6%), Utilities (83.8%), and Transportation & Warehousing (73.3%), whereas the industries that tend to have a higher number of women are Health Care & Social Assistance (76.4%), Educational Services (69.4%), and Finance & Insurance (61.3%).
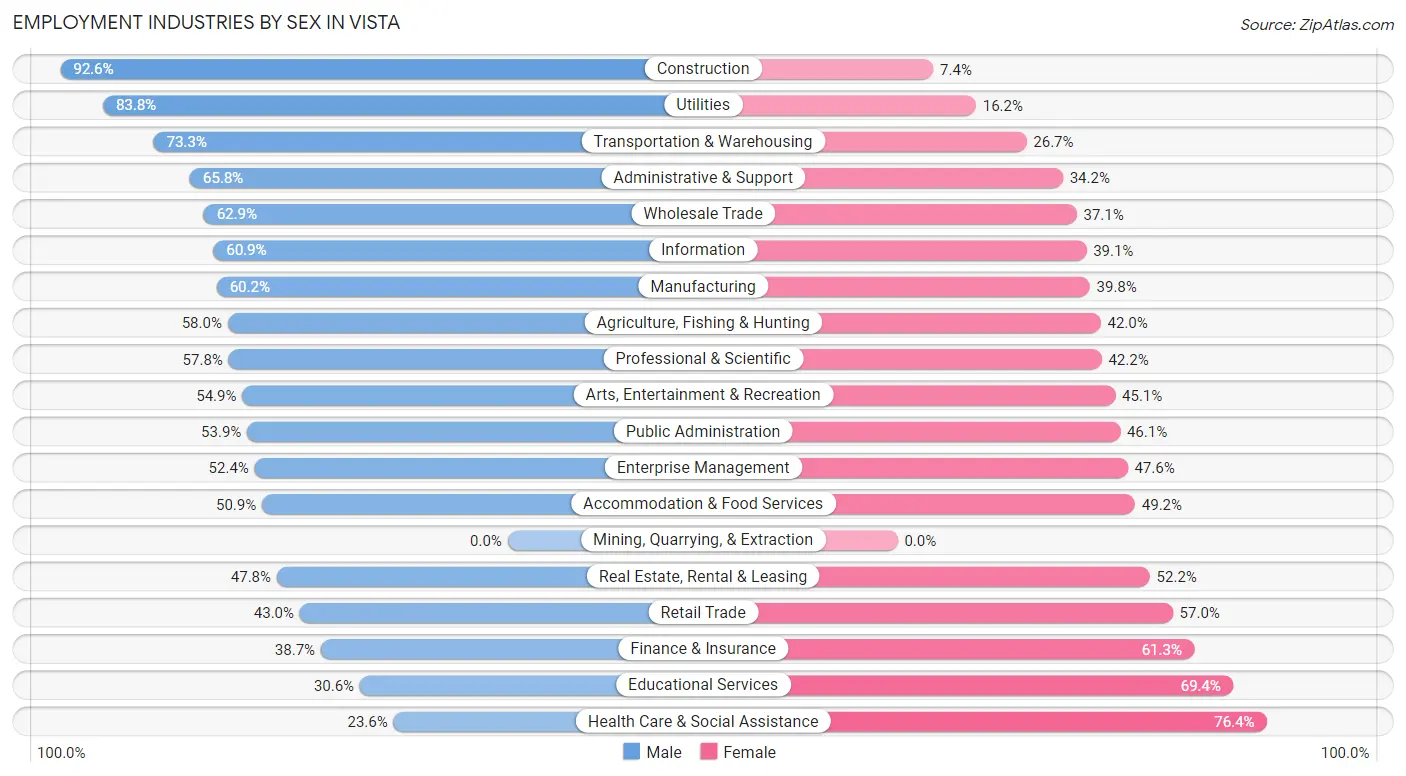
| Industry | Male | Female |
| Agriculture, Fishing & Hunting | 546 (58.0%) | 396 (42.0%) |
| Mining, Quarrying, & Extraction | 0 (0.0%) | 0 (0.0%) |
| Construction | 4,758 (92.6%) | 380 (7.4%) |
| Manufacturing | 3,364 (60.2%) | 2,222 (39.8%) |
| Wholesale Trade | 750 (62.9%) | 442 (37.1%) |
| Retail Trade | 2,605 (43.0%) | 3,449 (57.0%) |
| Transportation & Warehousing | 1,310 (73.3%) | 477 (26.7%) |
| Utilities | 186 (83.8%) | 36 (16.2%) |
| Information | 535 (60.9%) | 343 (39.1%) |
| Finance & Insurance | 413 (38.7%) | 655 (61.3%) |
| Real Estate, Rental & Leasing | 563 (47.8%) | 615 (52.2%) |
| Professional & Scientific | 2,129 (57.8%) | 1,557 (42.2%) |
| Enterprise Management | 22 (52.4%) | 20 (47.6%) |
| Administrative & Support | 1,897 (65.8%) | 987 (34.2%) |
| Educational Services | 1,086 (30.6%) | 2,464 (69.4%) |
| Health Care & Social Assistance | 1,258 (23.6%) | 4,065 (76.4%) |
| Arts, Entertainment & Recreation | 801 (54.9%) | 657 (45.1%) |
| Accommodation & Food Services | 1,925 (50.8%) | 1,861 (49.1%) |
| Public Administration | 761 (53.9%) | 650 (46.1%) |
| Total | 26,003 (52.9%) | 23,116 (47.1%) |
Education in Vista
School Enrollment in Vista
The most common levels of schooling among the 25,367 students in Vista are high school (6,187 | 24.4%), college / undergraduate (5,824 | 23.0%), and middle school (5,202 | 20.5%).
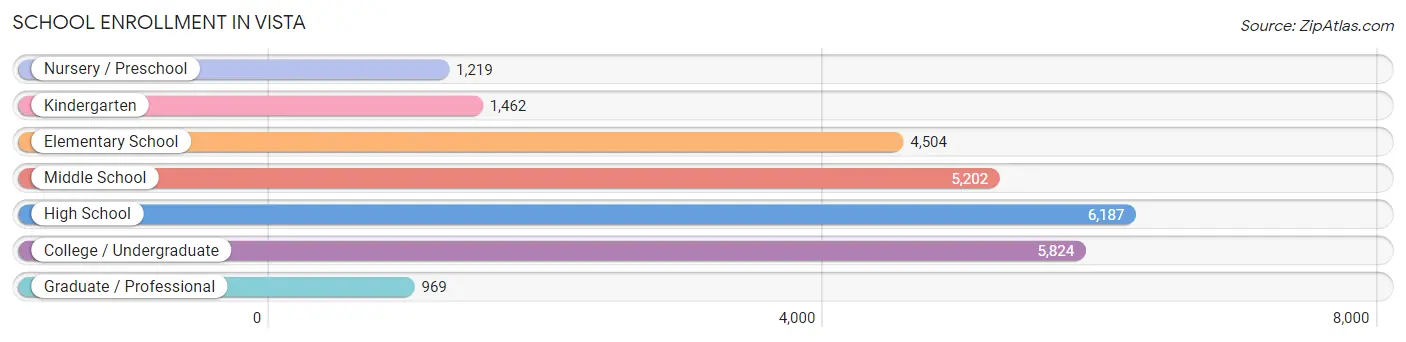
| School Level | # Students | % Students |
| Nursery / Preschool | 1,219 | 4.8% |
| Kindergarten | 1,462 | 5.8% |
| Elementary School | 4,504 | 17.8% |
| Middle School | 5,202 | 20.5% |
| High School | 6,187 | 24.4% |
| College / Undergraduate | 5,824 | 23.0% |
| Graduate / Professional | 969 | 3.8% |
| Total | 25,367 | 100.0% |
School Enrollment by Age by Funding Source in Vista
Out of a total of 25,367 students who are enrolled in schools in Vista, 2,384 (9.4%) attend a private institution, while the remaining 22,983 (90.6%) are enrolled in public schools. The age group of 35 years and over has the highest likelihood of being enrolled in private schools, with 299 (25.5% in the age bracket) enrolled. Conversely, the age group of 18 to 19 year olds has the lowest likelihood of being enrolled in a private school, with 1,699 (97.6% in the age bracket) attending a public institution.
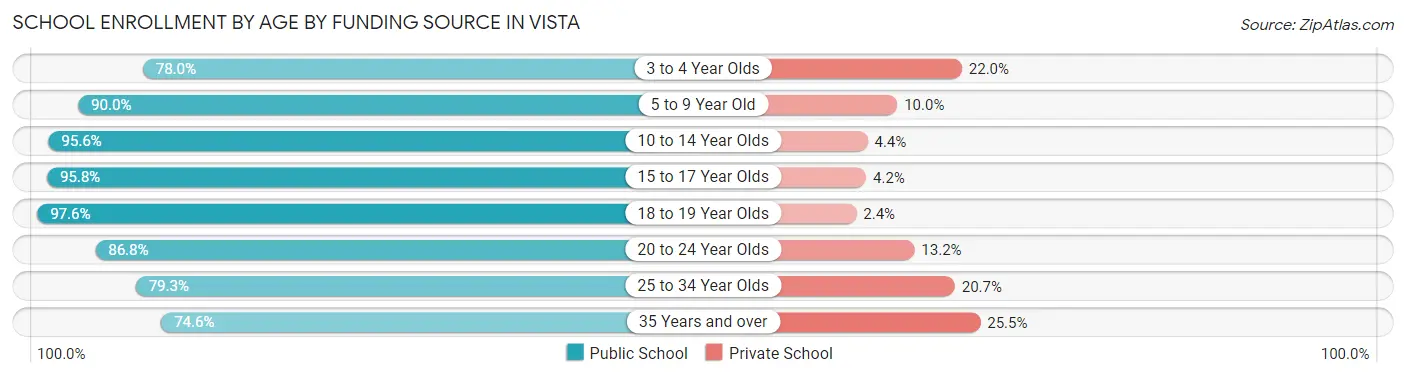
| Age Bracket | Public School | Private School |
| 3 to 4 Year Olds | 889 (78.0%) | 251 (22.0%) |
| 5 to 9 Year Old | 5,122 (90.0%) | 568 (10.0%) |
| 10 to 14 Year Olds | 6,324 (95.6%) | 294 (4.4%) |
| 15 to 17 Year Olds | 4,118 (95.8%) | 179 (4.2%) |
| 18 to 19 Year Olds | 1,699 (97.6%) | 41 (2.4%) |
| 20 to 24 Year Olds | 2,430 (86.8%) | 369 (13.2%) |
| 25 to 34 Year Olds | 1,513 (79.3%) | 395 (20.7%) |
| 35 Years and over | 876 (74.6%) | 299 (25.5%) |
| Total | 22,983 (90.6%) | 2,384 (9.4%) |
Educational Attainment by Field of Study in Vista
Business (3,505 | 18.8%), bio, nature & agricultural (1,754 | 9.4%), social sciences (1,631 | 8.7%), education (1,605 | 8.6%), and visual & performing arts (1,309 | 7.0%) are the most common fields of study among 18,647 individuals in Vista who have obtained a bachelor's degree or higher.
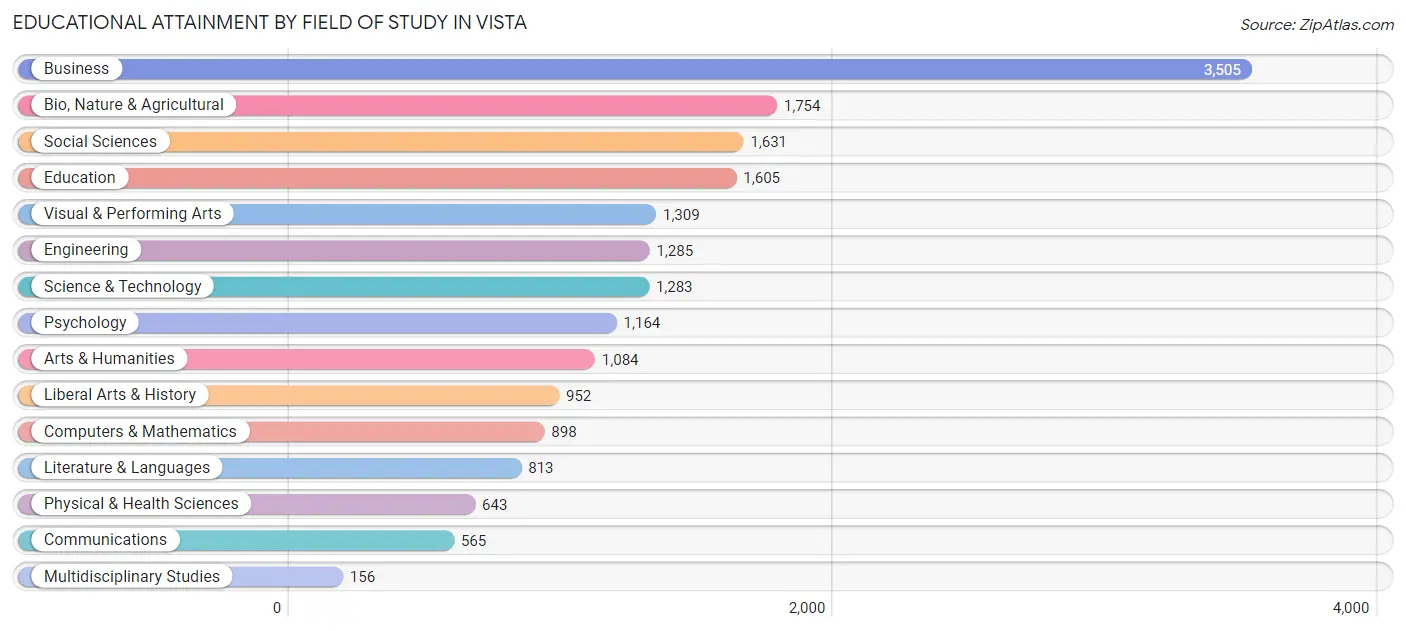
| Field of Study | # Graduates | % Graduates |
| Computers & Mathematics | 898 | 4.8% |
| Bio, Nature & Agricultural | 1,754 | 9.4% |
| Physical & Health Sciences | 643 | 3.5% |
| Psychology | 1,164 | 6.2% |
| Social Sciences | 1,631 | 8.7% |
| Engineering | 1,285 | 6.9% |
| Multidisciplinary Studies | 156 | 0.8% |
| Science & Technology | 1,283 | 6.9% |
| Business | 3,505 | 18.8% |
| Education | 1,605 | 8.6% |
| Literature & Languages | 813 | 4.4% |
| Liberal Arts & History | 952 | 5.1% |
| Visual & Performing Arts | 1,309 | 7.0% |
| Communications | 565 | 3.0% |
| Arts & Humanities | 1,084 | 5.8% |
| Total | 18,647 | 100.0% |
Transportation & Commute in Vista
Vehicle Availability by Sex in Vista
The most prevalent vehicle ownership categories in Vista are males with 2 vehicles (11,060, accounting for 41.8%) and females with 2 vehicles (9,102, making up 49.1%).
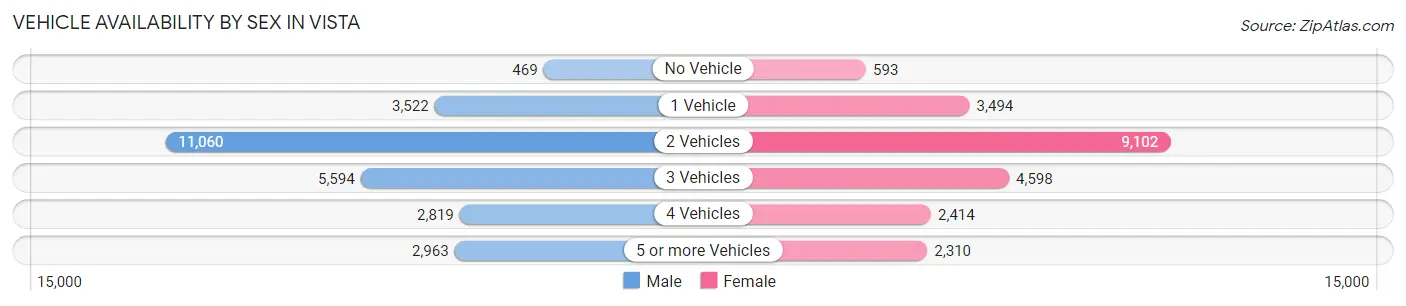
| Vehicles Available | Male | Female |
| No Vehicle | 469 (1.8%) | 593 (2.6%) |
| 1 Vehicle | 3,522 (13.3%) | 3,494 (15.5%) |
| 2 Vehicles | 11,060 (41.8%) | 9,102 (40.4%) |
| 3 Vehicles | 5,594 (21.2%) | 4,598 (20.4%) |
| 4 Vehicles | 2,819 (10.7%) | 2,414 (10.7%) |
| 5 or more Vehicles | 2,963 (11.2%) | 2,310 (10.3%) |
| Total | 26,427 (100.0%) | 22,511 (100.0%) |
Commute Time in Vista
The most frequently occuring commute durations in Vista are 20 to 24 minutes (8,568 commuters, 19.8%), 15 to 19 minutes (8,425 commuters, 19.5%), and 30 to 34 minutes (8,130 commuters, 18.8%).
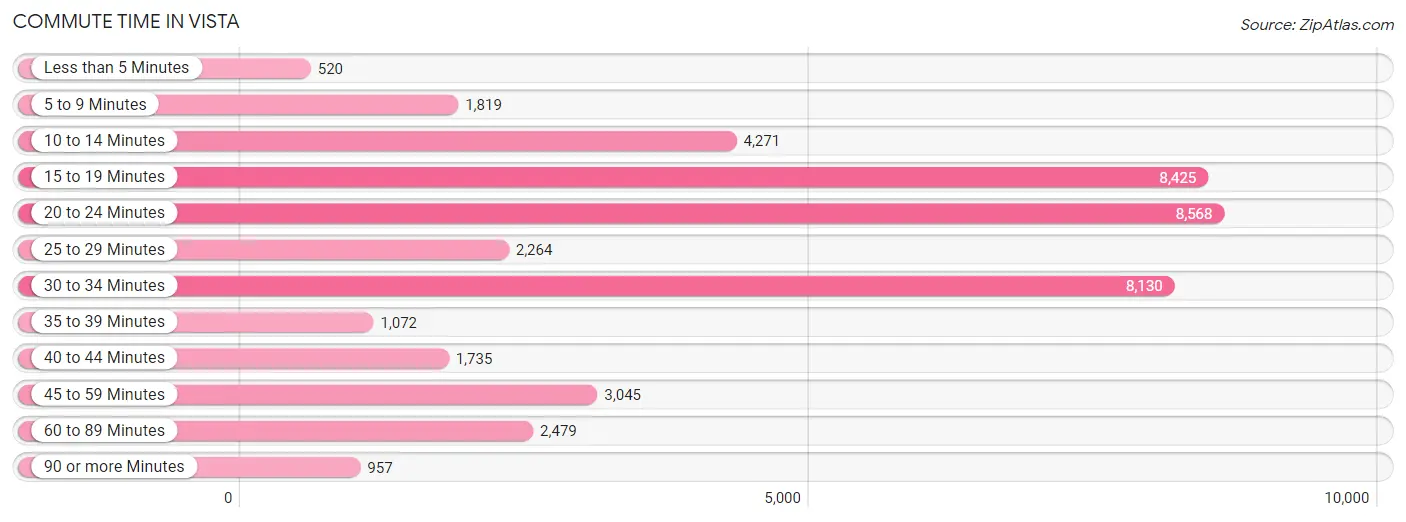
| Commute Time | # Commuters | % Commuters |
| Less than 5 Minutes | 520 | 1.2% |
| 5 to 9 Minutes | 1,819 | 4.2% |
| 10 to 14 Minutes | 4,271 | 9.9% |
| 15 to 19 Minutes | 8,425 | 19.5% |
| 20 to 24 Minutes | 8,568 | 19.8% |
| 25 to 29 Minutes | 2,264 | 5.2% |
| 30 to 34 Minutes | 8,130 | 18.8% |
| 35 to 39 Minutes | 1,072 | 2.5% |
| 40 to 44 Minutes | 1,735 | 4.0% |
| 45 to 59 Minutes | 3,045 | 7.0% |
| 60 to 89 Minutes | 2,479 | 5.7% |
| 90 or more Minutes | 957 | 2.2% |
Commute Time by Sex in Vista
The most common commute times in Vista are 30 to 34 minutes (5,083 commuters, 21.2%) for males and 20 to 24 minutes (4,163 commuters, 21.5%) for females.
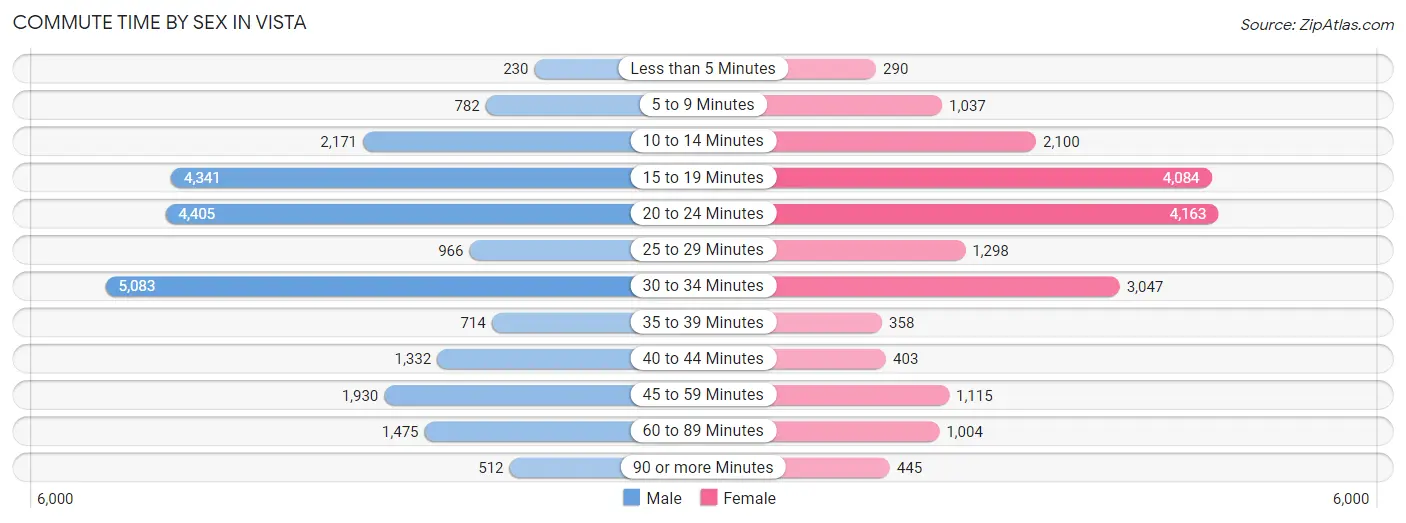
| Commute Time | Male | Female |
| Less than 5 Minutes | 230 (1.0%) | 290 (1.5%) |
| 5 to 9 Minutes | 782 (3.3%) | 1,037 (5.4%) |
| 10 to 14 Minutes | 2,171 (9.1%) | 2,100 (10.9%) |
| 15 to 19 Minutes | 4,341 (18.1%) | 4,084 (21.1%) |
| 20 to 24 Minutes | 4,405 (18.4%) | 4,163 (21.5%) |
| 25 to 29 Minutes | 966 (4.0%) | 1,298 (6.7%) |
| 30 to 34 Minutes | 5,083 (21.2%) | 3,047 (15.8%) |
| 35 to 39 Minutes | 714 (3.0%) | 358 (1.8%) |
| 40 to 44 Minutes | 1,332 (5.6%) | 403 (2.1%) |
| 45 to 59 Minutes | 1,930 (8.1%) | 1,115 (5.8%) |
| 60 to 89 Minutes | 1,475 (6.2%) | 1,004 (5.2%) |
| 90 or more Minutes | 512 (2.1%) | 445 (2.3%) |
Time of Departure to Work by Sex in Vista
The most frequent times of departure to work in Vista are 7:00 AM to 7:29 AM (3,714, 15.5%) for males and 7:00 AM to 7:29 AM (3,054, 15.8%) for females.
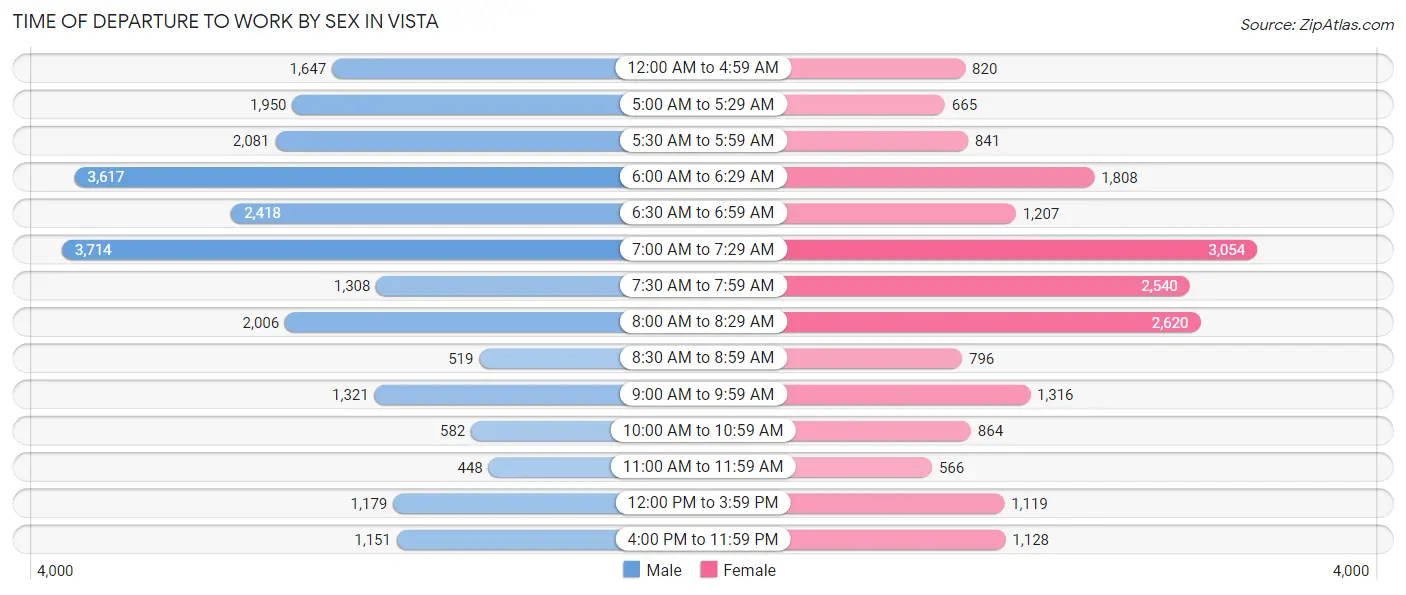
| Time of Departure | Male | Female |
| 12:00 AM to 4:59 AM | 1,647 (6.9%) | 820 (4.2%) |
| 5:00 AM to 5:29 AM | 1,950 (8.2%) | 665 (3.4%) |
| 5:30 AM to 5:59 AM | 2,081 (8.7%) | 841 (4.3%) |
| 6:00 AM to 6:29 AM | 3,617 (15.1%) | 1,808 (9.3%) |
| 6:30 AM to 6:59 AM | 2,418 (10.1%) | 1,207 (6.2%) |
| 7:00 AM to 7:29 AM | 3,714 (15.5%) | 3,054 (15.8%) |
| 7:30 AM to 7:59 AM | 1,308 (5.5%) | 2,540 (13.1%) |
| 8:00 AM to 8:29 AM | 2,006 (8.4%) | 2,620 (13.5%) |
| 8:30 AM to 8:59 AM | 519 (2.2%) | 796 (4.1%) |
| 9:00 AM to 9:59 AM | 1,321 (5.5%) | 1,316 (6.8%) |
| 10:00 AM to 10:59 AM | 582 (2.4%) | 864 (4.5%) |
| 11:00 AM to 11:59 AM | 448 (1.9%) | 566 (2.9%) |
| 12:00 PM to 3:59 PM | 1,179 (4.9%) | 1,119 (5.8%) |
| 4:00 PM to 11:59 PM | 1,151 (4.8%) | 1,128 (5.8%) |
| Total | 23,941 (100.0%) | 19,344 (100.0%) |
Housing Occupancy in Vista
Occupancy by Ownership in Vista
Of the total 30,836 dwellings in Vista, owner-occupied units account for 15,227 (49.4%), while renter-occupied units make up 15,609 (50.6%).
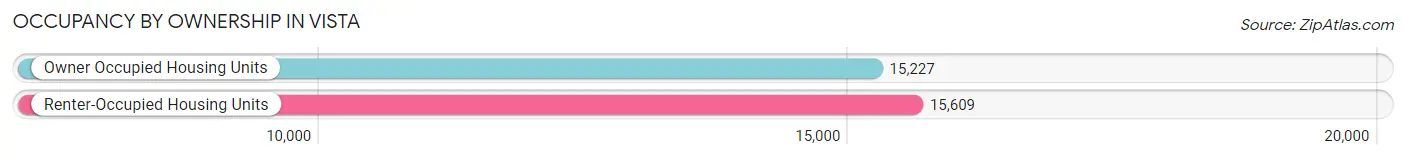
| Occupancy | # Housing Units | % Housing Units |
| Owner Occupied Housing Units | 15,227 | 49.4% |
| Renter-Occupied Housing Units | 15,609 | 50.6% |
| Total Occupied Housing Units | 30,836 | 100.0% |
Occupancy by Household Size in Vista
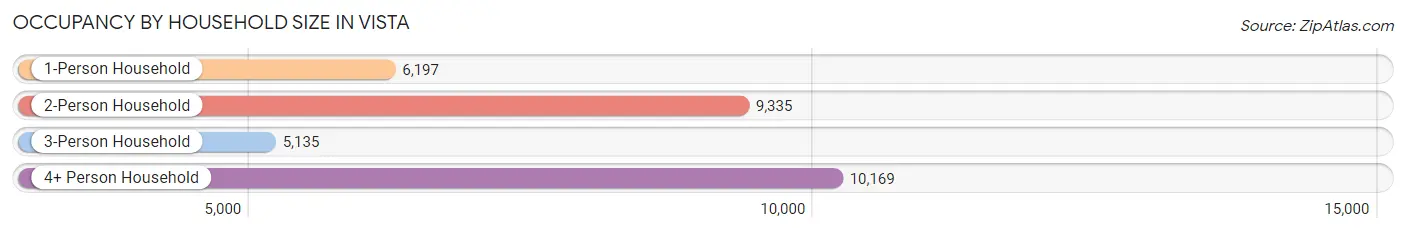
| Household Size | # Housing Units | % Housing Units |
| 1-Person Household | 6,197 | 20.1% |
| 2-Person Household | 9,335 | 30.3% |
| 3-Person Household | 5,135 | 16.7% |
| 4+ Person Household | 10,169 | 33.0% |
| Total Housing Units | 30,836 | 100.0% |
Occupancy by Ownership by Household Size in Vista
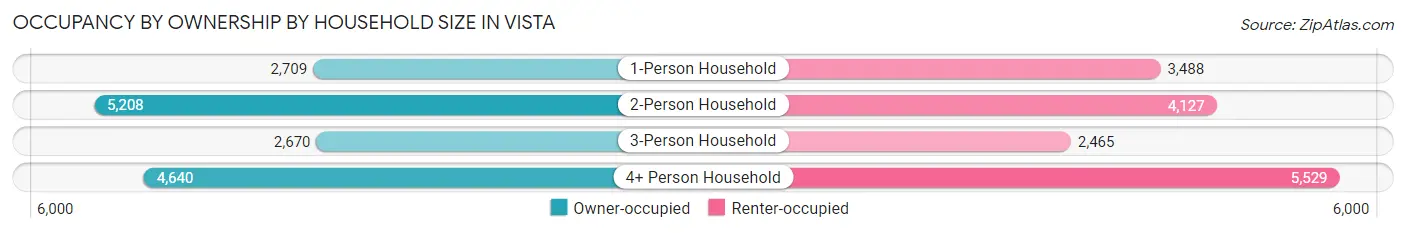
| Household Size | Owner-occupied | Renter-occupied |
| 1-Person Household | 2,709 (43.7%) | 3,488 (56.3%) |
| 2-Person Household | 5,208 (55.8%) | 4,127 (44.2%) |
| 3-Person Household | 2,670 (52.0%) | 2,465 (48.0%) |
| 4+ Person Household | 4,640 (45.6%) | 5,529 (54.4%) |
| Total Housing Units | 15,227 (49.4%) | 15,609 (50.6%) |
Occupancy by Educational Attainment in Vista
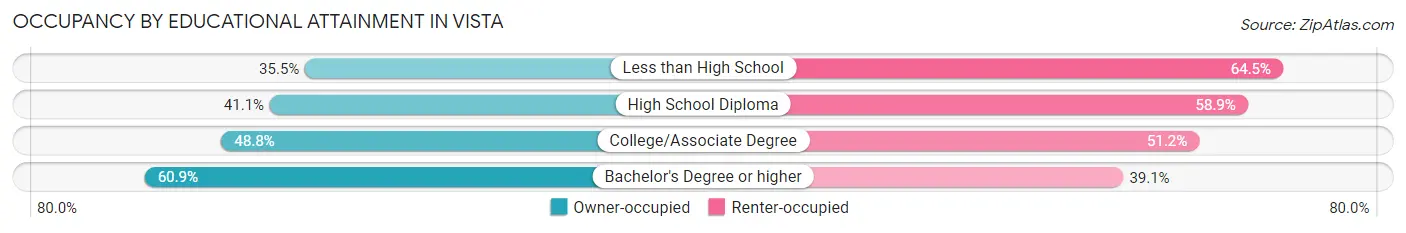
| Household Size | Owner-occupied | Renter-occupied |
| Less than High School | 1,467 (35.5%) | 2,665 (64.5%) |
| High School Diploma | 2,479 (41.1%) | 3,554 (58.9%) |
| College/Associate Degree | 5,277 (48.8%) | 5,541 (51.2%) |
| Bachelor's Degree or higher | 6,004 (60.9%) | 3,849 (39.1%) |
Occupancy by Age of Householder in Vista
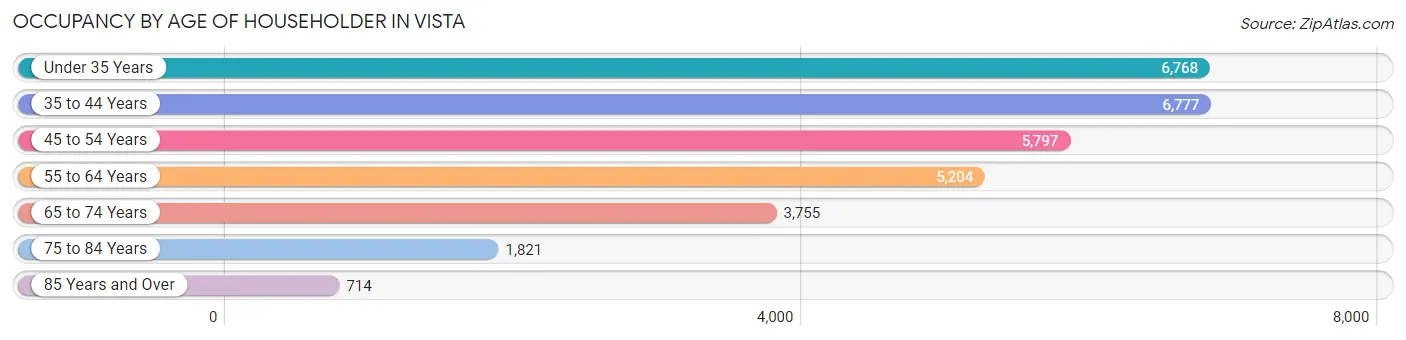
| Age Bracket | # Households | % Households |
| Under 35 Years | 6,768 | 22.0% |
| 35 to 44 Years | 6,777 | 22.0% |
| 45 to 54 Years | 5,797 | 18.8% |
| 55 to 64 Years | 5,204 | 16.9% |
| 65 to 74 Years | 3,755 | 12.2% |
| 75 to 84 Years | 1,821 | 5.9% |
| 85 Years and Over | 714 | 2.3% |
| Total | 30,836 | 100.0% |
Housing Finances in Vista
Median Income by Occupancy in Vista
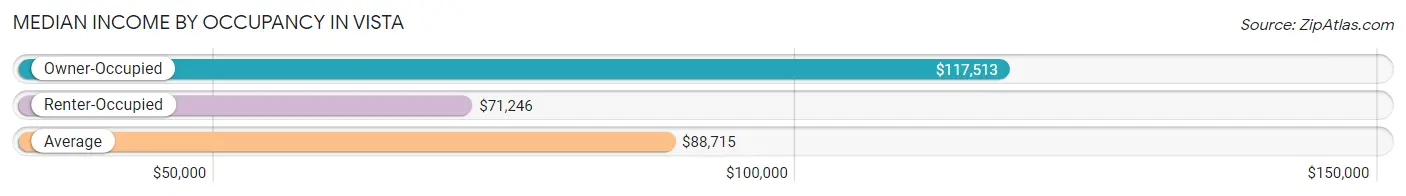
| Occupancy Type | # Households | Median Income |
| Owner-Occupied | 15,227 (49.4%) | $117,513 |
| Renter-Occupied | 15,609 (50.6%) | $71,246 |
| Average | 30,836 (100.0%) | $88,715 |
Occupancy by Householder Income Bracket in Vista
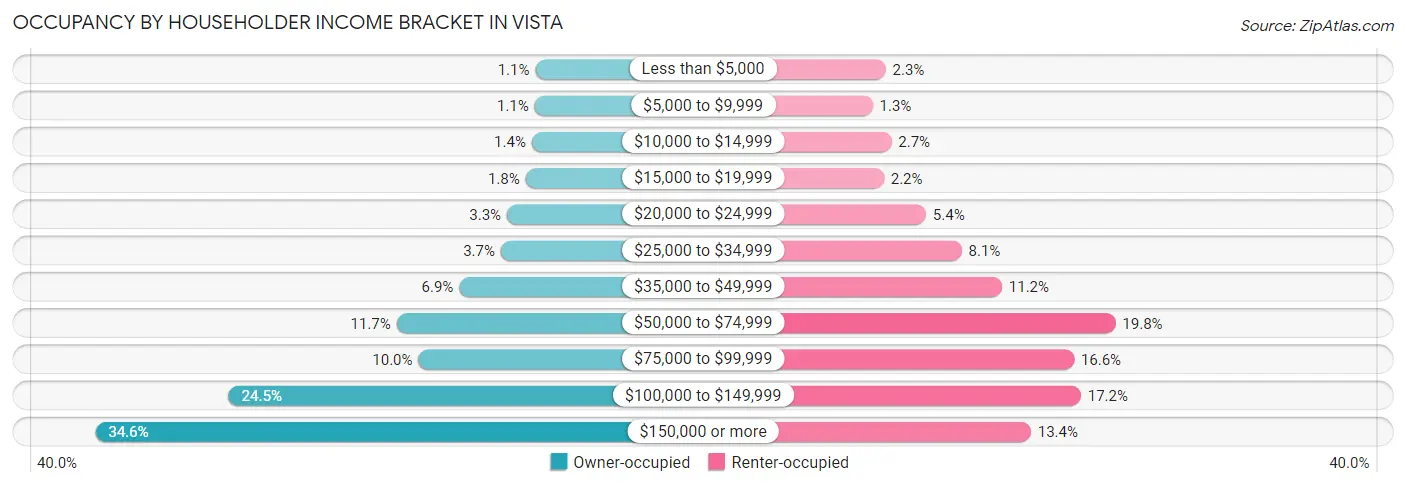
| Income Bracket | Owner-occupied | Renter-occupied |
| Less than $5,000 | 166 (1.1%) | 357 (2.3%) |
| $5,000 to $9,999 | 174 (1.1%) | 203 (1.3%) |
| $10,000 to $14,999 | 207 (1.4%) | 426 (2.7%) |
| $15,000 to $19,999 | 279 (1.8%) | 335 (2.1%) |
| $20,000 to $24,999 | 495 (3.3%) | 837 (5.4%) |
| $25,000 to $34,999 | 566 (3.7%) | 1,261 (8.1%) |
| $35,000 to $49,999 | 1,049 (6.9%) | 1,741 (11.2%) |
| $50,000 to $74,999 | 1,776 (11.7%) | 3,090 (19.8%) |
| $75,000 to $99,999 | 1,522 (10.0%) | 2,597 (16.6%) |
| $100,000 to $149,999 | 3,723 (24.4%) | 2,678 (17.2%) |
| $150,000 or more | 5,270 (34.6%) | 2,084 (13.4%) |
| Total | 15,227 (100.0%) | 15,609 (100.0%) |
Monthly Housing Cost Tiers in Vista
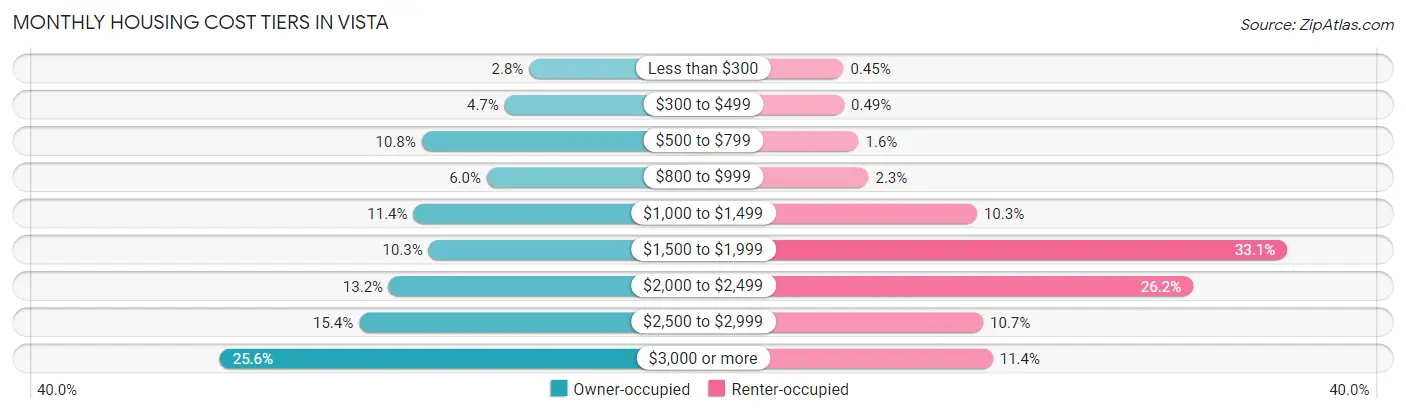
| Monthly Cost | Owner-occupied | Renter-occupied |
| Less than $300 | 432 (2.8%) | 70 (0.4%) |
| $300 to $499 | 708 (4.6%) | 77 (0.5%) |
| $500 to $799 | 1,639 (10.8%) | 244 (1.6%) |
| $800 to $999 | 908 (6.0%) | 357 (2.3%) |
| $1,000 to $1,499 | 1,732 (11.4%) | 1,604 (10.3%) |
| $1,500 to $1,999 | 1,561 (10.2%) | 5,169 (33.1%) |
| $2,000 to $2,499 | 2,006 (13.2%) | 4,088 (26.2%) |
| $2,500 to $2,999 | 2,340 (15.4%) | 1,675 (10.7%) |
| $3,000 or more | 3,901 (25.6%) | 1,786 (11.4%) |
| Total | 15,227 (100.0%) | 15,609 (100.0%) |
Physical Housing Characteristics in Vista
Housing Structures in Vista
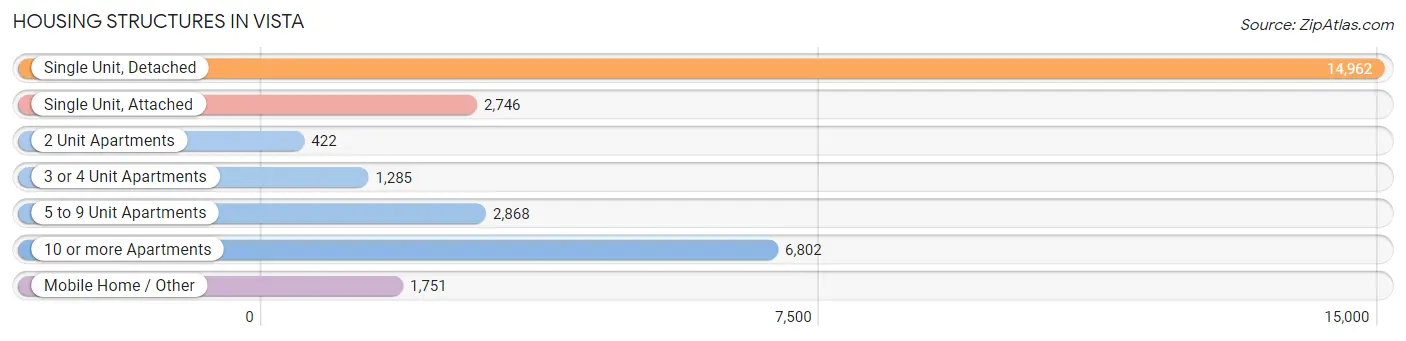
| Structure Type | # Housing Units | % Housing Units |
| Single Unit, Detached | 14,962 | 48.5% |
| Single Unit, Attached | 2,746 | 8.9% |
| 2 Unit Apartments | 422 | 1.4% |
| 3 or 4 Unit Apartments | 1,285 | 4.2% |
| 5 to 9 Unit Apartments | 2,868 | 9.3% |
| 10 or more Apartments | 6,802 | 22.1% |
| Mobile Home / Other | 1,751 | 5.7% |
| Total | 30,836 | 100.0% |
Housing Structures by Occupancy in Vista
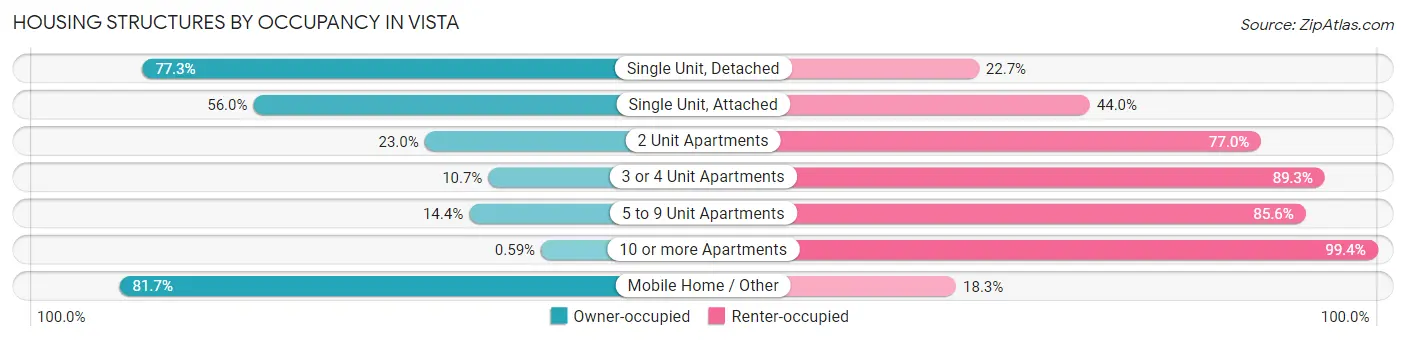
| Structure Type | Owner-occupied | Renter-occupied |
| Single Unit, Detached | 11,570 (77.3%) | 3,392 (22.7%) |
| Single Unit, Attached | 1,537 (56.0%) | 1,209 (44.0%) |
| 2 Unit Apartments | 97 (23.0%) | 325 (77.0%) |
| 3 or 4 Unit Apartments | 138 (10.7%) | 1,147 (89.3%) |
| 5 to 9 Unit Apartments | 414 (14.4%) | 2,454 (85.6%) |
| 10 or more Apartments | 40 (0.6%) | 6,762 (99.4%) |
| Mobile Home / Other | 1,431 (81.7%) | 320 (18.3%) |
| Total | 15,227 (49.4%) | 15,609 (50.6%) |
Housing Structures by Number of Rooms in Vista
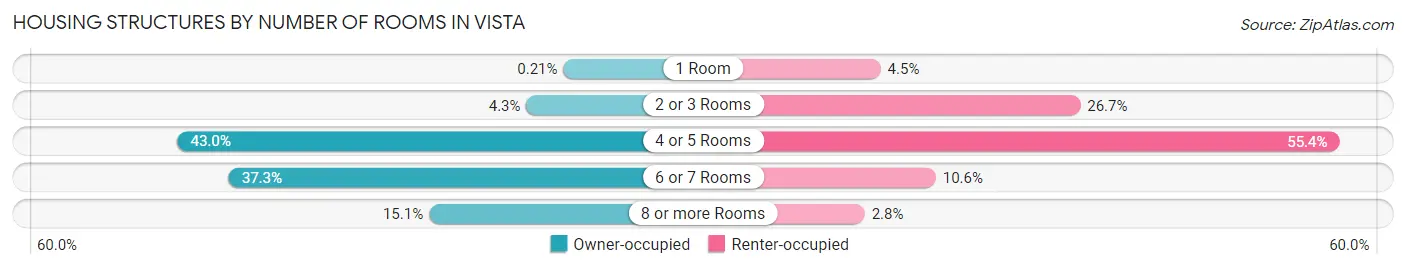
| Number of Rooms | Owner-occupied | Renter-occupied |
| 1 Room | 32 (0.2%) | 705 (4.5%) |
| 2 or 3 Rooms | 657 (4.3%) | 4,164 (26.7%) |
| 4 or 5 Rooms | 6,550 (43.0%) | 8,650 (55.4%) |
| 6 or 7 Rooms | 5,685 (37.3%) | 1,661 (10.6%) |
| 8 or more Rooms | 2,303 (15.1%) | 429 (2.8%) |
| Total | 15,227 (100.0%) | 15,609 (100.0%) |
Housing Structure by Heating Type in Vista
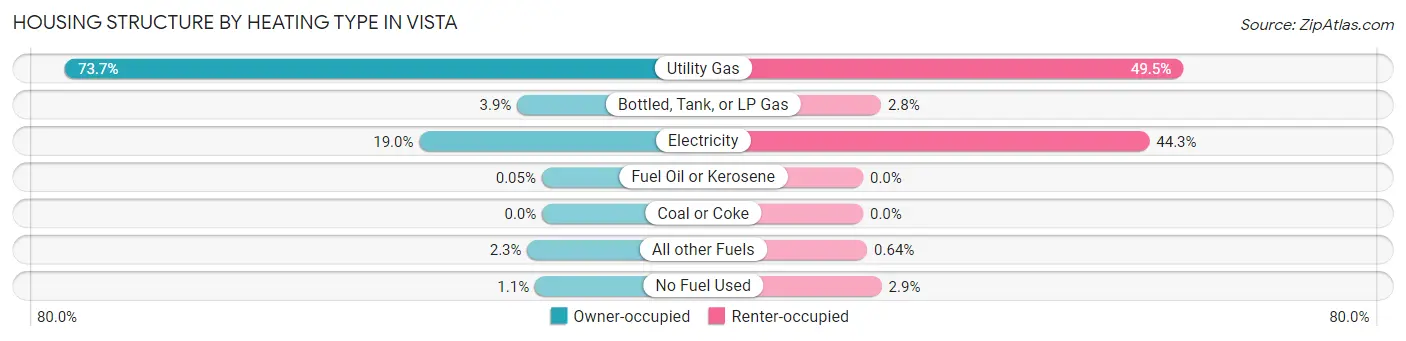
| Heating Type | Owner-occupied | Renter-occupied |
| Utility Gas | 11,228 (73.7%) | 7,720 (49.5%) |
| Bottled, Tank, or LP Gas | 586 (3.8%) | 432 (2.8%) |
| Electricity | 2,891 (19.0%) | 6,908 (44.3%) |
| Fuel Oil or Kerosene | 7 (0.1%) | 0 (0.0%) |
| Coal or Coke | 0 (0.0%) | 0 (0.0%) |
| All other Fuels | 347 (2.3%) | 100 (0.6%) |
| No Fuel Used | 168 (1.1%) | 449 (2.9%) |
| Total | 15,227 (100.0%) | 15,609 (100.0%) |
Household Vehicle Usage in Vista
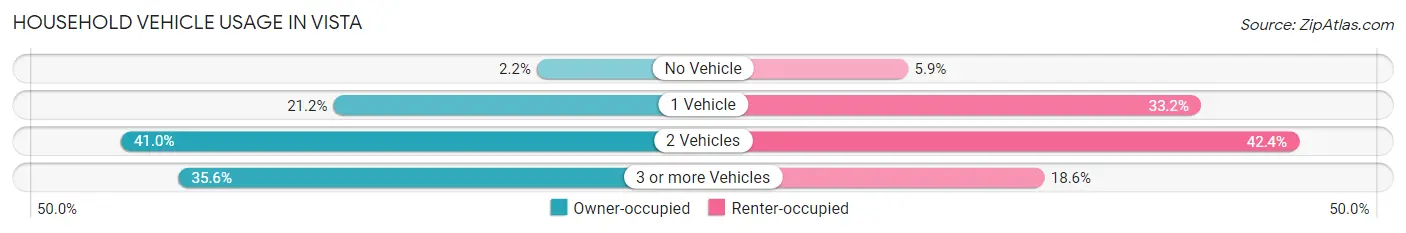
| Vehicles per Household | Owner-occupied | Renter-occupied |
| No Vehicle | 333 (2.2%) | 913 (5.9%) |
| 1 Vehicle | 3,227 (21.2%) | 5,185 (33.2%) |
| 2 Vehicles | 6,243 (41.0%) | 6,613 (42.4%) |
| 3 or more Vehicles | 5,424 (35.6%) | 2,898 (18.6%) |
| Total | 15,227 (100.0%) | 15,609 (100.0%) |
Real Estate & Mortgages in Vista
Real Estate and Mortgage Overview in Vista
| Characteristic | Without Mortgage | With Mortgage |
| Housing Units | 4,291 | 10,936 |
| Median Property Value | $536,600 | $642,500 |
| Median Household Income | $72,361 | $4,463 |
| Monthly Housing Costs | $714 | $3,848 |
| Real Estate Taxes | $3,392 | $291 |
Property Value by Mortgage Status in Vista
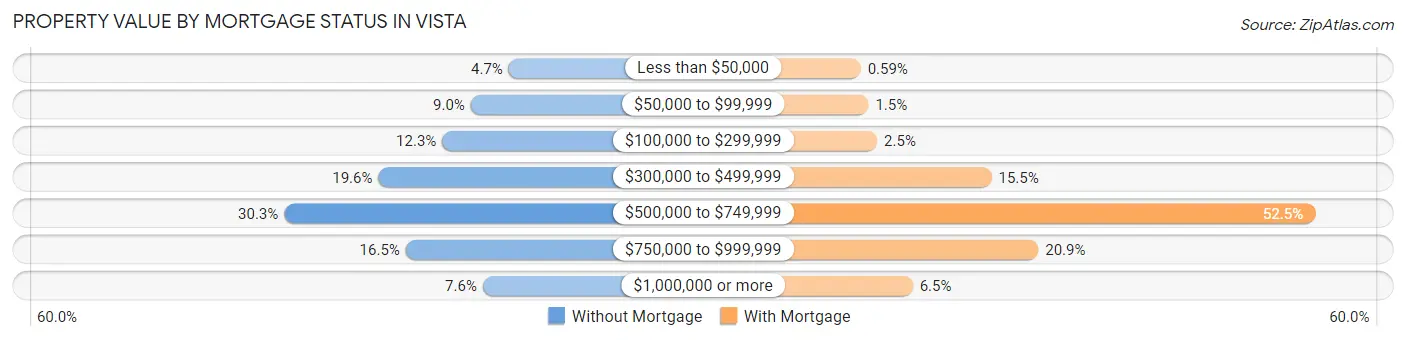
| Property Value | Without Mortgage | With Mortgage |
| Less than $50,000 | 201 (4.7%) | 65 (0.6%) |
| $50,000 to $99,999 | 387 (9.0%) | 162 (1.5%) |
| $100,000 to $299,999 | 527 (12.3%) | 270 (2.5%) |
| $300,000 to $499,999 | 840 (19.6%) | 1,699 (15.5%) |
| $500,000 to $749,999 | 1,302 (30.3%) | 5,742 (52.5%) |
| $750,000 to $999,999 | 706 (16.5%) | 2,284 (20.9%) |
| $1,000,000 or more | 328 (7.6%) | 714 (6.5%) |
| Total | 4,291 (100.0%) | 10,936 (100.0%) |
Household Income by Mortgage Status in Vista
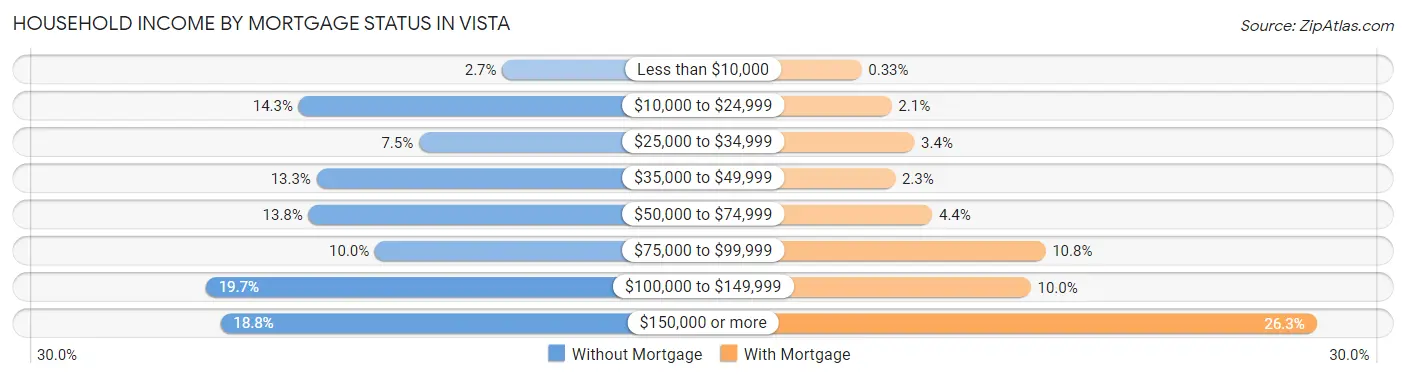
| Household Income | Without Mortgage | With Mortgage |
| Less than $10,000 | 116 (2.7%) | 36 (0.3%) |
| $10,000 to $24,999 | 615 (14.3%) | 224 (2.1%) |
| $25,000 to $34,999 | 320 (7.5%) | 366 (3.4%) |
| $35,000 to $49,999 | 571 (13.3%) | 246 (2.2%) |
| $50,000 to $74,999 | 591 (13.8%) | 478 (4.4%) |
| $75,000 to $99,999 | 428 (10.0%) | 1,185 (10.8%) |
| $100,000 to $149,999 | 843 (19.7%) | 1,094 (10.0%) |
| $150,000 or more | 807 (18.8%) | 2,880 (26.3%) |
| Total | 4,291 (100.0%) | 10,936 (100.0%) |
Property Value to Household Income Ratio in Vista
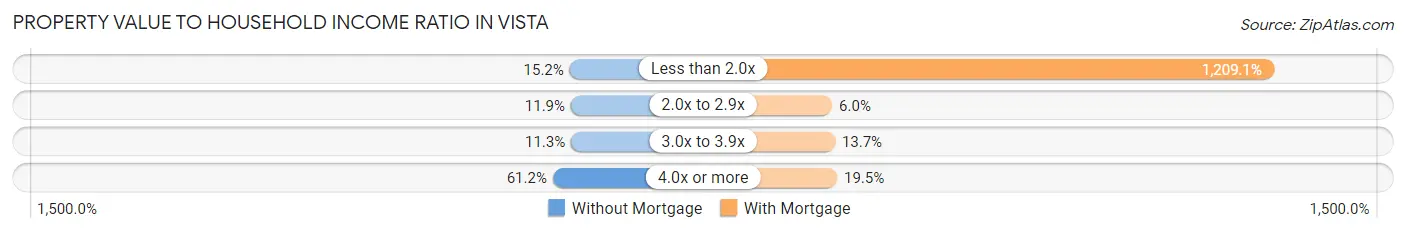
| Value-to-Income Ratio | Without Mortgage | With Mortgage |
| Less than 2.0x | 653 (15.2%) | 132,232 (1,209.1%) |
| 2.0x to 2.9x | 510 (11.9%) | 659 (6.0%) |
| 3.0x to 3.9x | 485 (11.3%) | 1,498 (13.7%) |
| 4.0x or more | 2,627 (61.2%) | 2,129 (19.5%) |
| Total | 4,291 (100.0%) | 10,936 (100.0%) |
Real Estate Taxes by Mortgage Status in Vista
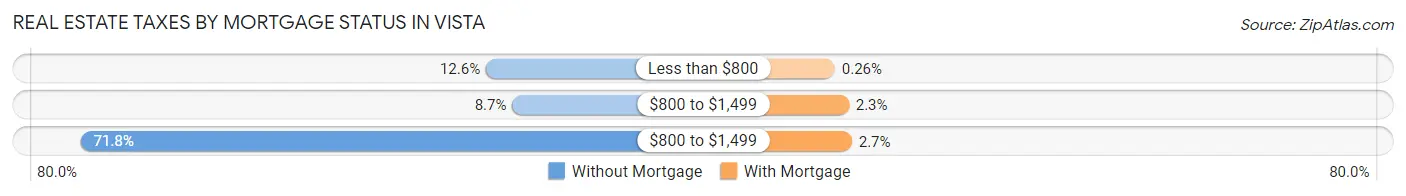
| Property Taxes | Without Mortgage | With Mortgage |
| Less than $800 | 540 (12.6%) | 28 (0.3%) |
| $800 to $1,499 | 375 (8.7%) | 252 (2.3%) |
| $800 to $1,499 | 3,082 (71.8%) | 300 (2.7%) |
| Total | 4,291 (100.0%) | 10,936 (100.0%) |
Health & Disability in Vista
Health Insurance Coverage by Age in Vista
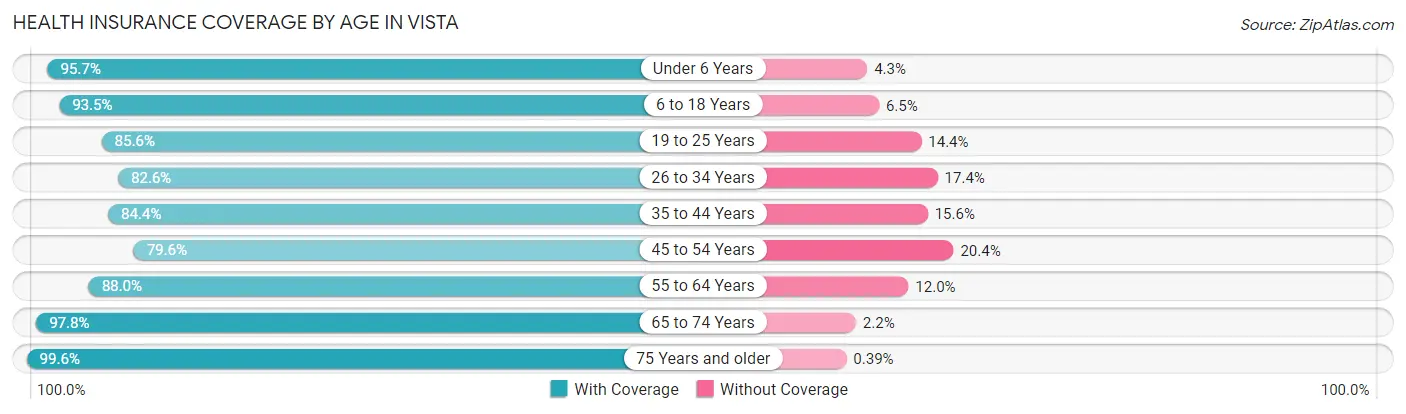
| Age Bracket | With Coverage | Without Coverage |
| Under 6 Years | 7,470 (95.7%) | 333 (4.3%) |
| 6 to 18 Years | 16,559 (93.5%) | 1,143 (6.5%) |
| 19 to 25 Years | 8,141 (85.6%) | 1,366 (14.4%) |
| 26 to 34 Years | 11,220 (82.6%) | 2,365 (17.4%) |
| 35 to 44 Years | 11,656 (84.4%) | 2,148 (15.6%) |
| 45 to 54 Years | 10,125 (79.6%) | 2,588 (20.4%) |
| 55 to 64 Years | 8,764 (88.0%) | 1,191 (12.0%) |
| 65 to 74 Years | 6,810 (97.8%) | 151 (2.2%) |
| 75 Years and older | 4,343 (99.6%) | 17 (0.4%) |
| Total | 85,088 (88.3%) | 11,302 (11.7%) |
Health Insurance Coverage by Citizenship Status in Vista

| Citizenship Status | With Coverage | Without Coverage |
| Native Born | 7,470 (95.7%) | 333 (4.3%) |
| Foreign Born, Citizen | 16,559 (93.5%) | 1,143 (6.5%) |
| Foreign Born, not a Citizen | 8,141 (85.6%) | 1,366 (14.4%) |
Health Insurance Coverage by Household Income in Vista
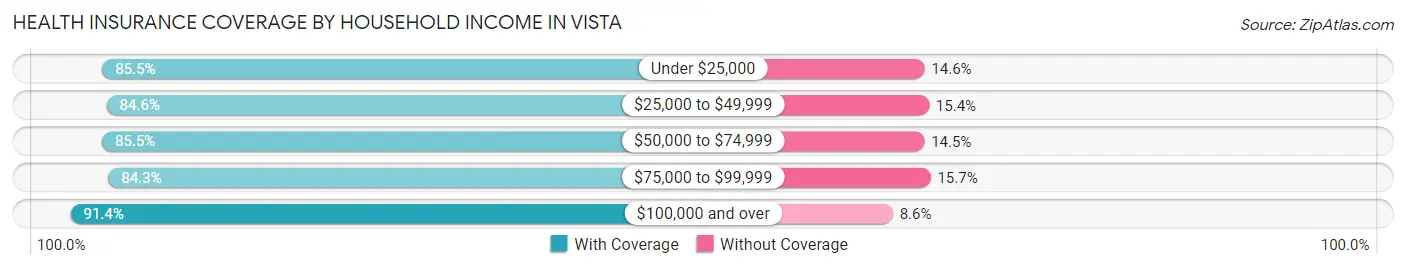
| Household Income | With Coverage | Without Coverage |
| Under $25,000 | 5,751 (85.5%) | 979 (14.5%) |
| $25,000 to $49,999 | 9,986 (84.6%) | 1,815 (15.4%) |
| $50,000 to $74,999 | 11,202 (85.5%) | 1,899 (14.5%) |
| $75,000 to $99,999 | 11,678 (84.3%) | 2,171 (15.7%) |
| $100,000 and over | 45,473 (91.4%) | 4,283 (8.6%) |
Public vs Private Health Insurance Coverage by Age in Vista
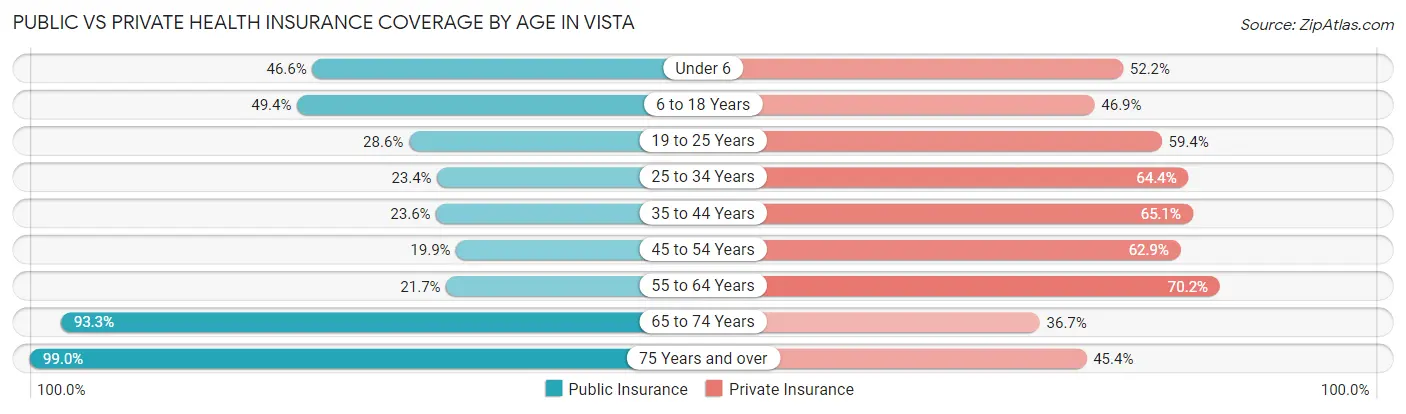
| Age Bracket | Public Insurance | Private Insurance |
| Under 6 | 3,632 (46.6%) | 4,071 (52.2%) |
| 6 to 18 Years | 8,742 (49.4%) | 8,299 (46.9%) |
| 19 to 25 Years | 2,721 (28.6%) | 5,643 (59.4%) |
| 25 to 34 Years | 3,175 (23.4%) | 8,745 (64.4%) |
| 35 to 44 Years | 3,252 (23.6%) | 8,992 (65.1%) |
| 45 to 54 Years | 2,524 (19.9%) | 7,997 (62.9%) |
| 55 to 64 Years | 2,161 (21.7%) | 6,986 (70.2%) |
| 65 to 74 Years | 6,493 (93.3%) | 2,556 (36.7%) |
| 75 Years and over | 4,317 (99.0%) | 1,978 (45.4%) |
| Total | 37,017 (38.4%) | 55,267 (57.3%) |
Disability Status by Sex by Age in Vista
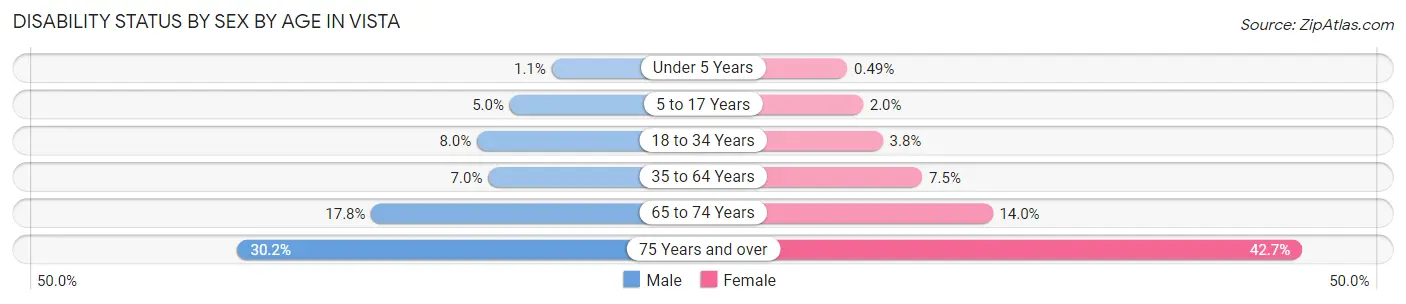
| Age Bracket | Male | Female |
| Under 5 Years | 35 (1.1%) | 17 (0.5%) |
| 5 to 17 Years | 450 (5.0%) | 152 (1.9%) |
| 18 to 34 Years | 1,007 (8.0%) | 473 (3.8%) |
| 35 to 64 Years | 1,272 (7.0%) | 1,359 (7.5%) |
| 65 to 74 Years | 588 (17.8%) | 512 (14.0%) |
| 75 Years and over | 543 (30.2%) | 1,095 (42.7%) |
Disability Class by Sex by Age in Vista
Disability Class: Hearing Difficulty
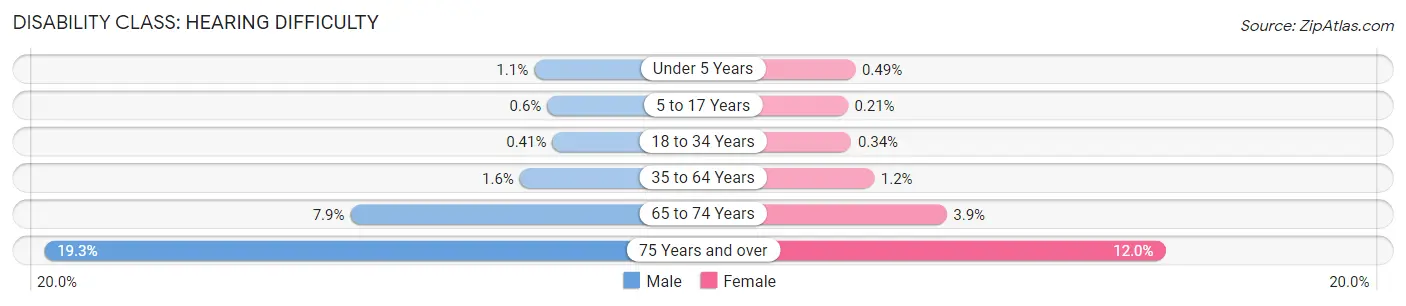
| Age Bracket | Male | Female |
| Under 5 Years | 35 (1.1%) | 17 (0.5%) |
| 5 to 17 Years | 54 (0.6%) | 16 (0.2%) |
| 18 to 34 Years | 51 (0.4%) | 42 (0.3%) |
| 35 to 64 Years | 295 (1.6%) | 217 (1.2%) |
| 65 to 74 Years | 261 (7.9%) | 142 (3.9%) |
| 75 Years and over | 346 (19.3%) | 308 (12.0%) |
Disability Class: Vision Difficulty
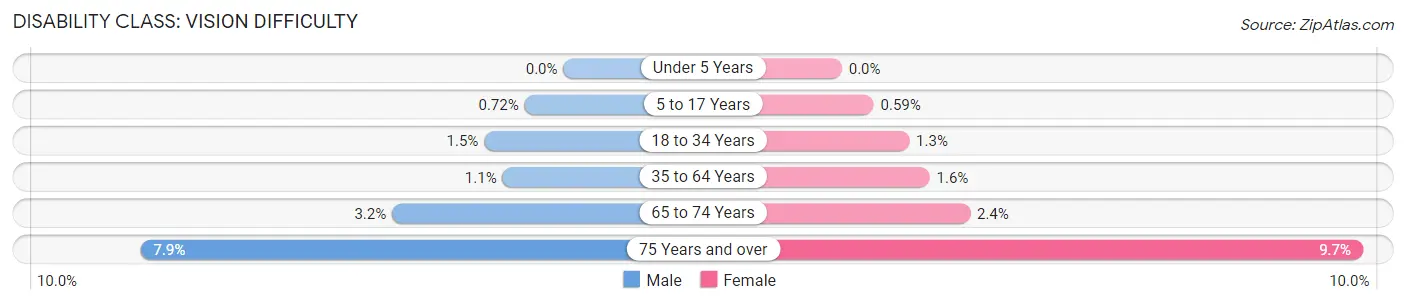
| Age Bracket | Male | Female |
| Under 5 Years | 0 (0.0%) | 0 (0.0%) |
| 5 to 17 Years | 65 (0.7%) | 46 (0.6%) |
| 18 to 34 Years | 185 (1.5%) | 156 (1.3%) |
| 35 to 64 Years | 206 (1.1%) | 297 (1.6%) |
| 65 to 74 Years | 105 (3.2%) | 87 (2.4%) |
| 75 Years and over | 141 (7.9%) | 248 (9.7%) |
Disability Class: Cognitive Difficulty
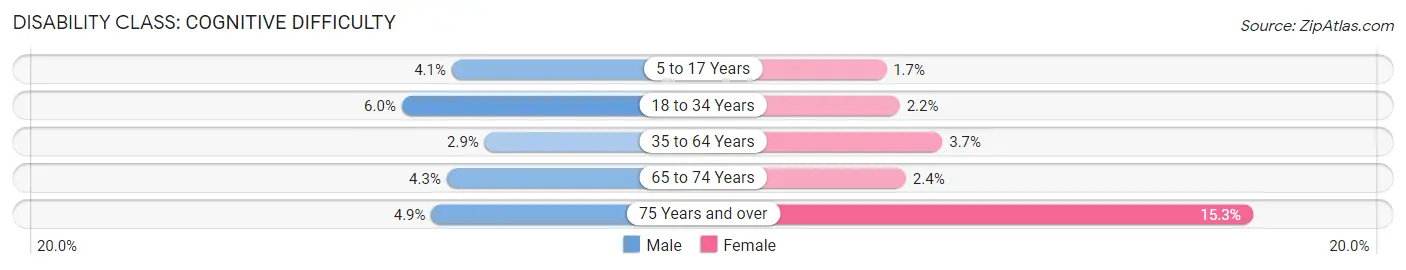
| Age Bracket | Male | Female |
| 5 to 17 Years | 375 (4.1%) | 129 (1.7%) |
| 18 to 34 Years | 755 (6.0%) | 269 (2.1%) |
| 35 to 64 Years | 533 (2.9%) | 679 (3.7%) |
| 65 to 74 Years | 143 (4.3%) | 87 (2.4%) |
| 75 Years and over | 88 (4.9%) | 391 (15.2%) |
Disability Class: Ambulatory Difficulty
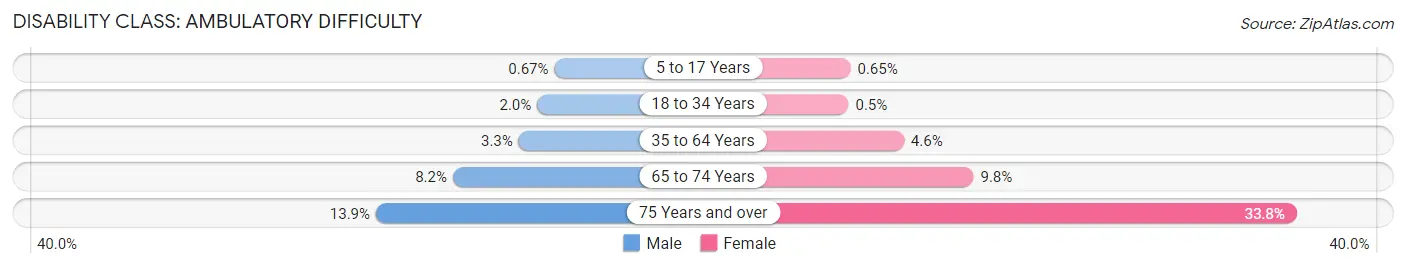
| Age Bracket | Male | Female |
| 5 to 17 Years | 61 (0.7%) | 51 (0.6%) |
| 18 to 34 Years | 245 (1.9%) | 63 (0.5%) |
| 35 to 64 Years | 606 (3.3%) | 841 (4.6%) |
| 65 to 74 Years | 271 (8.2%) | 358 (9.8%) |
| 75 Years and over | 250 (13.9%) | 866 (33.8%) |
Disability Class: Self-Care Difficulty
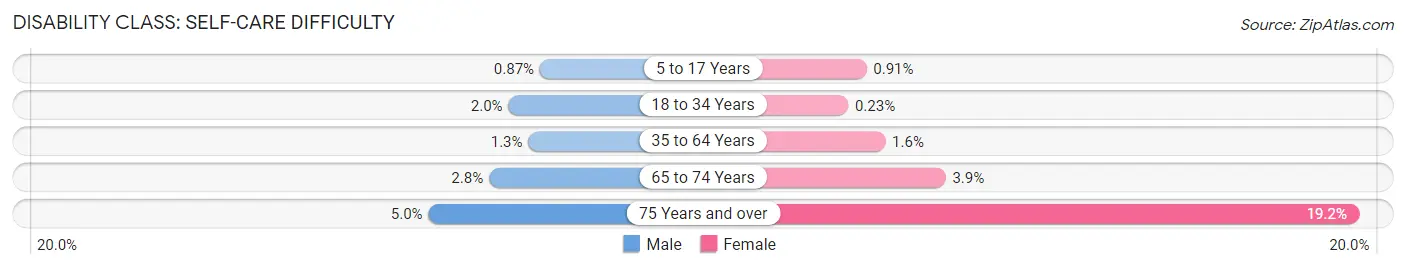
| Age Bracket | Male | Female |
| 5 to 17 Years | 79 (0.9%) | 71 (0.9%) |
| 18 to 34 Years | 257 (2.0%) | 29 (0.2%) |
| 35 to 64 Years | 237 (1.3%) | 293 (1.6%) |
| 65 to 74 Years | 91 (2.8%) | 141 (3.8%) |
| 75 Years and over | 90 (5.0%) | 492 (19.2%) |
Technology Access in Vista
Computing Device Access in Vista
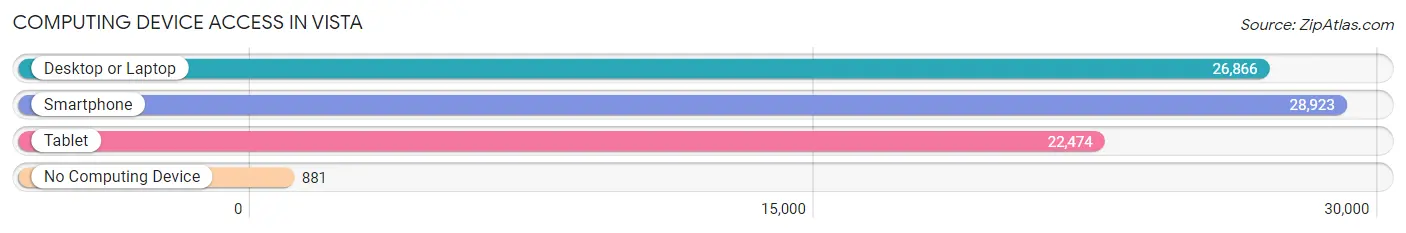
| Device Type | # Households | % Households |
| Desktop or Laptop | 26,866 | 87.1% |
| Smartphone | 28,923 | 93.8% |
| Tablet | 22,474 | 72.9% |
| No Computing Device | 881 | 2.9% |
| Total | 30,836 | 100.0% |
Internet Access in Vista
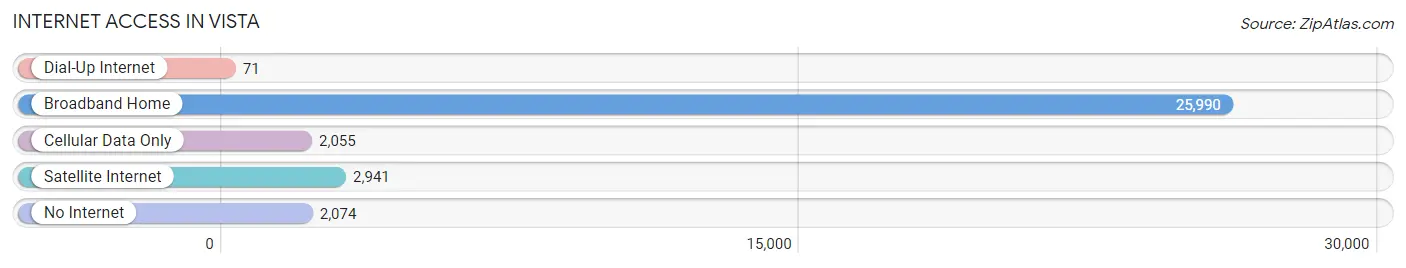
| Internet Type | # Households | % Households |
| Dial-Up Internet | 71 | 0.2% |
| Broadband Home | 25,990 | 84.3% |
| Cellular Data Only | 2,055 | 6.7% |
| Satellite Internet | 2,941 | 9.5% |
| No Internet | 2,074 | 6.7% |
| Total | 30,836 | 100.0% |
Vista Summary
Vista, California is a city located in San Diego County, California, United States. It is situated in the northern part of the county, just south of the city of Oceanside. The city has a population of approximately 95,000 people, making it the third-largest city in the county.
Geography
Vista is located in the northern part of San Diego County, just south of the city of Oceanside. It is situated on the northern edge of the San Diego-Imperial Valley, and is bordered by the cities of Carlsbad to the south, San Marcos to the east, and Escondido to the west. The city is situated on a plateau, with an elevation of approximately 500 feet above sea level. The city is surrounded by rolling hills and valleys, and is home to several parks and open spaces.
Economy
Vista is home to a diverse economy, with a variety of industries represented. The city is home to several large employers, including the Vista Unified School District, Tri-City Medical Center, and the Vista Community College District. The city is also home to a number of small businesses, including retail stores, restaurants, and professional services.
Demographics
As of the 2010 census, the population of Vista was 95,000. The racial makeup of the city was 68.3% White, 4.2% African American, 0.7% Native American, 11.2% Asian, 0.4% Pacific Islander, and 14.4% from other races. The median household income was $60,000, and the median family income was $68,000.
History
Vista was founded in 1882 by a group of settlers from San Diego. The city was originally known as “Frisco,” but was later renamed “Vista” in 1887. The city was incorporated in 1963, and has since grown to become the third-largest city in San Diego County.
Vista has a long history of agriculture, with the city’s first crops being wheat and barley. The city was also home to a number of dairy farms, and was known for its production of avocados and citrus fruits. In the 1950s, the city began to experience rapid growth, as the population increased and new businesses and industries moved into the area. Today, Vista is a vibrant and diverse city, with a strong economy and a variety of cultural attractions.
Common Questions
What is Per Capita Income in Vista?
Per Capita income in Vista is $37,194.
What is the Median Family Income in Vista?
Median Family Income in Vista is $97,575.
What is the Median Household income in Vista?
Median Household Income in Vista is $88,715.
What is Income or Wage Gap in Vista?
Income or Wage Gap in Vista is 27.3%.
Women in Vista earn 72.7 cents for every dollar earned by a man.
What is Family Income Deficit in Vista?
Family Income Deficit in Vista is $10,517.
Families that are below poverty line in Vista earn $10,517 less on average than the poverty threshold level.
What is Inequality or Gini Index in Vista?
Inequality or Gini Index in Vista is 0.43.
What is the Total Population of Vista?
Total Population of Vista is 98,392.
What is the Total Male Population of Vista?
Total Male Population of Vista is 49,750.
What is the Total Female Population of Vista?
Total Female Population of Vista is 48,642.
What is the Ratio of Males per 100 Females in Vista?
There are 102.28 Males per 100 Females in Vista.
What is the Ratio of Females per 100 Males in Vista?
There are 97.77 Females per 100 Males in Vista.
What is the Median Population Age in Vista?
Median Population Age in Vista is 34.9 Years.
What is the Average Family Size in Vista
Average Family Size in Vista is 3.6 People.
What is the Average Household Size in Vista
Average Household Size in Vista is 3.1 People.
How Large is the Labor Force in Vista?
There are 53,225 People in the Labor Forcein in Vista.
What is the Percentage of People in the Labor Force in Vista?
68.4% of People are in the Labor Force in Vista.
What is the Unemployment Rate in Vista?
Unemployment Rate in Vista is 6.3%.