Irving, TX Map & Demographics
Irving Map
Irving Overview
$37,211
PER CAPITA INCOME
$86,435
AVG FAMILY INCOME
$76,686
AVG HOUSEHOLD INCOME
29.9%
WAGE / INCOME GAP [ % ]
70.1¢/ $1
WAGE / INCOME GAP [ $ ]
$10,020
FAMILY INCOME DEFICIT
0.43
INEQUALITY / GINI INDEX
254,962
TOTAL POPULATION
129,913
MALE POPULATION
125,049
FEMALE POPULATION
103.89
MALES / 100 FEMALES
96.26
FEMALES / 100 MALES
32.4
MEDIAN AGE
3.4
AVG FAMILY SIZE
2.7
AVG HOUSEHOLD SIZE
141,886
LABOR FORCE [ PEOPLE ]
72.8%
PERCENT IN LABOR FORCE
4.1%
UNEMPLOYMENT RATE
Income in Irving
Income Overview in Irving
Per Capita Income in Irving is $37,211, while median incomes of families and households are $86,435 and $76,686 respectively.
| Characteristic | Number | Measure |
| Per Capita Income | 254,962 | $37,211 |
| Median Family Income | 61,205 | $86,435 |
| Mean Family Income | 61,205 | $110,545 |
| Median Household Income | 92,820 | $76,686 |
| Mean Household Income | 92,820 | $100,921 |
| Income Deficit | 61,205 | $10,020 |
| Wage / Income Gap (%) | 254,962 | 29.93% |
| Wage / Income Gap ($) | 254,962 | 70.07¢ per $1 |
| Gini / Inequality Index | 254,962 | 0.43 |
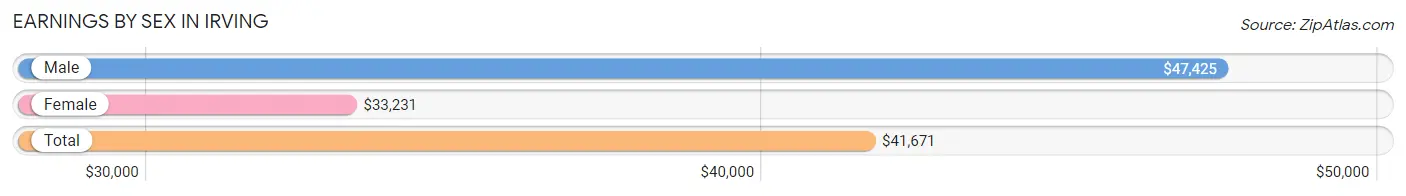
Earnings by Sex in Irving
Average Earnings in Irving are $41,671, $47,425 for men and $33,231 for women, a difference of 29.9%.
| Sex | Number | Average Earnings |
| Male | 82,718 (56.9%) | $47,425 |
| Female | 62,632 (43.1%) | $33,231 |
| Total | 145,350 (100.0%) | $41,671 |
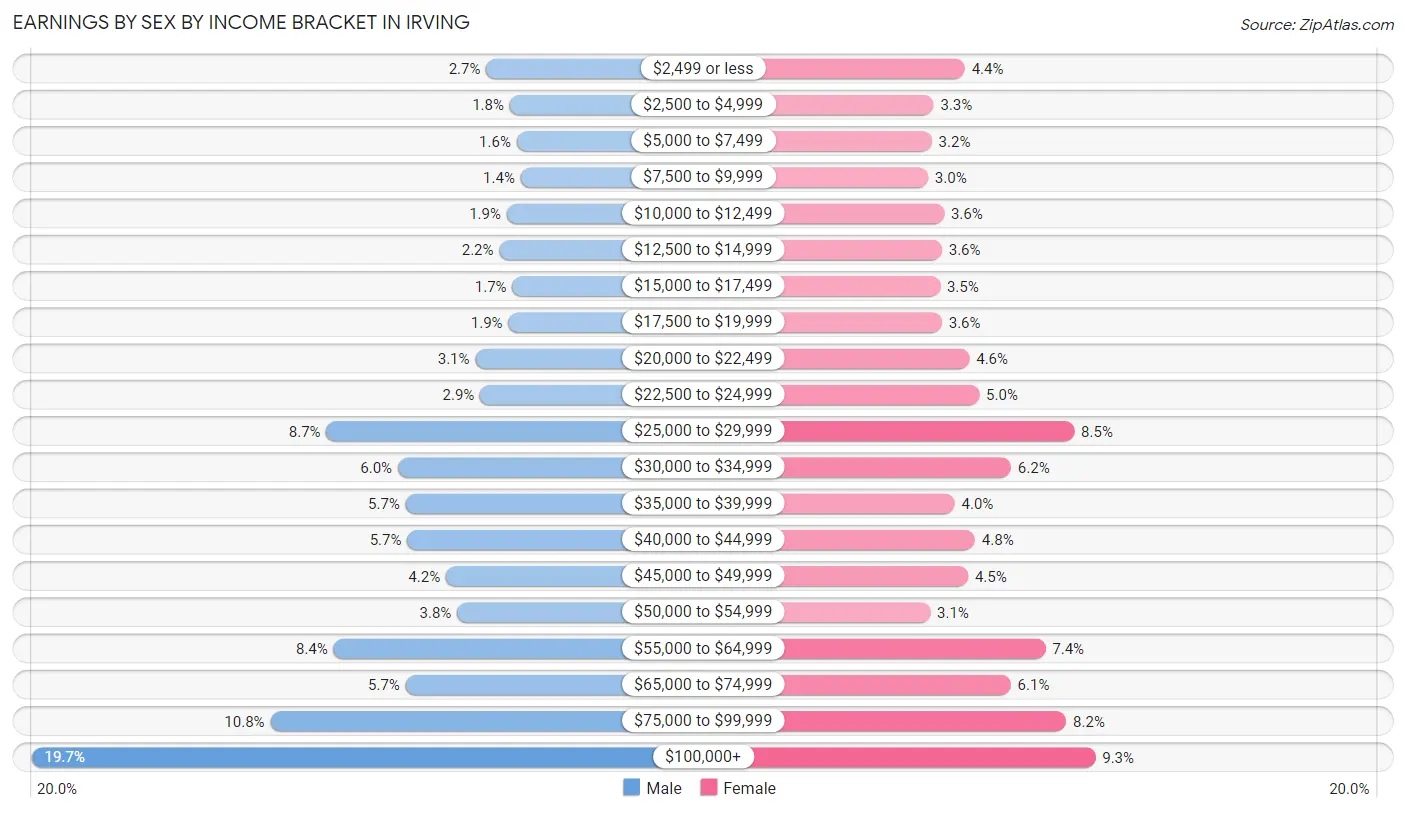
Earnings by Sex by Income Bracket in Irving
The most common earnings brackets in Irving are $100,000+ for men (16,327 | 19.7%) and $100,000+ for women (5,834 | 9.3%).
| Income | Male | Female |
| $2,499 or less | 2,237 (2.7%) | 2,771 (4.4%) |
| $2,500 to $4,999 | 1,506 (1.8%) | 2,034 (3.3%) |
| $5,000 to $7,499 | 1,293 (1.6%) | 1,993 (3.2%) |
| $7,500 to $9,999 | 1,167 (1.4%) | 1,906 (3.0%) |
| $10,000 to $12,499 | 1,593 (1.9%) | 2,279 (3.6%) |
| $12,500 to $14,999 | 1,826 (2.2%) | 2,230 (3.6%) |
| $15,000 to $17,499 | 1,422 (1.7%) | 2,185 (3.5%) |
| $17,500 to $19,999 | 1,547 (1.9%) | 2,227 (3.6%) |
| $20,000 to $22,499 | 2,569 (3.1%) | 2,877 (4.6%) |
| $22,500 to $24,999 | 2,425 (2.9%) | 3,109 (5.0%) |
| $25,000 to $29,999 | 7,190 (8.7%) | 5,339 (8.5%) |
| $30,000 to $34,999 | 4,969 (6.0%) | 3,854 (6.1%) |
| $35,000 to $39,999 | 4,728 (5.7%) | 2,533 (4.0%) |
| $40,000 to $44,999 | 4,683 (5.7%) | 3,009 (4.8%) |
| $45,000 to $49,999 | 3,479 (4.2%) | 2,844 (4.5%) |
| $50,000 to $54,999 | 3,138 (3.8%) | 1,954 (3.1%) |
| $55,000 to $64,999 | 6,964 (8.4%) | 4,659 (7.4%) |
| $65,000 to $74,999 | 4,729 (5.7%) | 3,848 (6.1%) |
| $75,000 to $99,999 | 8,926 (10.8%) | 5,147 (8.2%) |
| $100,000+ | 16,327 (19.7%) | 5,834 (9.3%) |
| Total | 82,718 (100.0%) | 62,632 (100.0%) |
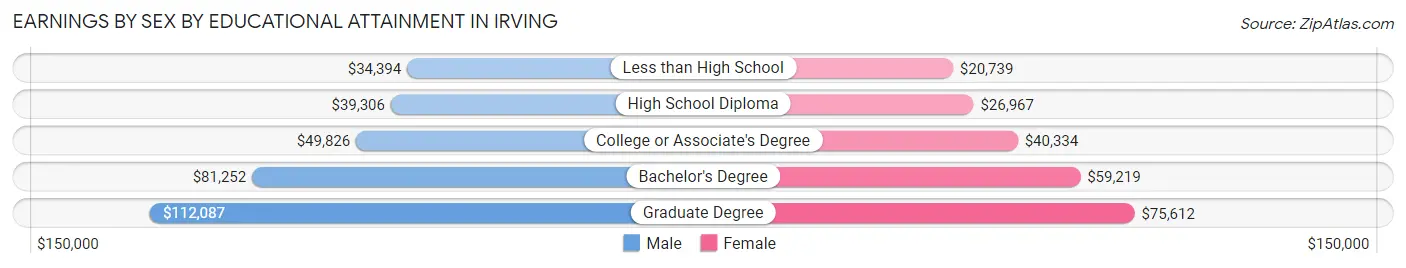
Earnings by Sex by Educational Attainment in Irving
Average earnings in Irving are $55,003 for men and $38,488 for women, a difference of 30.0%. Men with an educational attainment of graduate degree enjoy the highest average annual earnings of $112,087, while those with less than high school education earn the least with $34,394. Women with an educational attainment of graduate degree earn the most with the average annual earnings of $75,612, while those with less than high school education have the smallest earnings of $20,739.
| Educational Attainment | Male Income | Female Income |
| Less than High School | $34,394 | $20,739 |
| High School Diploma | $39,306 | $26,967 |
| College or Associate's Degree | $49,826 | $40,334 |
| Bachelor's Degree | $81,252 | $59,219 |
| Graduate Degree | $112,087 | $75,612 |
| Total | $55,003 | $38,488 |
Family Income in Irving
Family Income Brackets in Irving
According to the Irving family income data, there are 11,996 families falling into the $100,000 to $149,999 income range, which is the most common income bracket and makes up 19.6% of all families. Conversely, the $10,000 to $14,999 income bracket is the least frequent group with only 857 families (1.4%) belonging to this category.
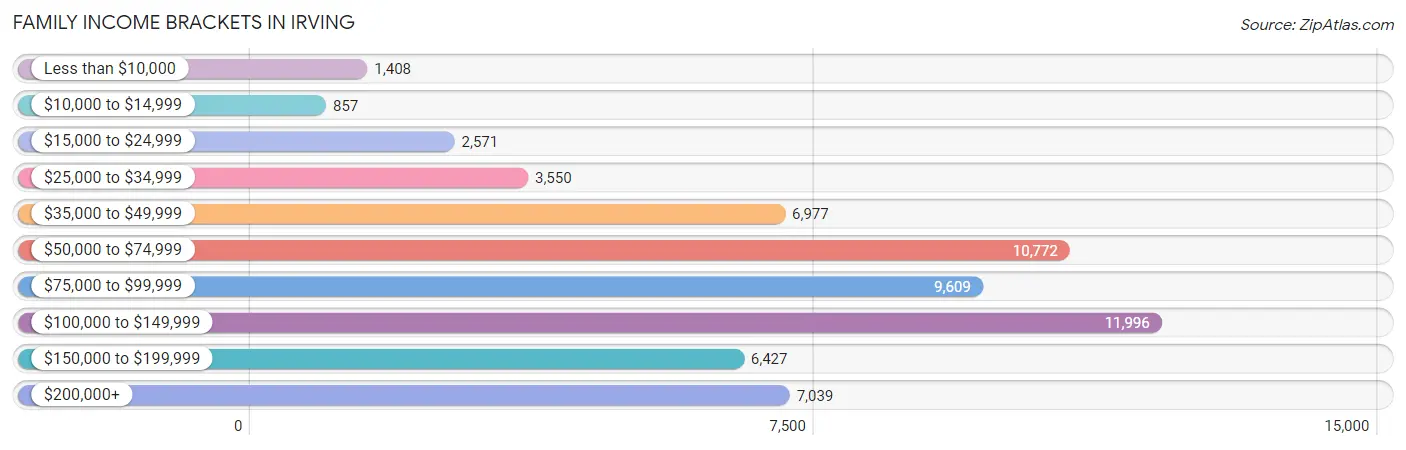
| Income Bracket | # Families | % Families |
| Less than $10,000 | 1,408 | 2.3% |
| $10,000 to $14,999 | 857 | 1.4% |
| $15,000 to $24,999 | 2,571 | 4.2% |
| $25,000 to $34,999 | 3,550 | 5.8% |
| $35,000 to $49,999 | 6,977 | 11.4% |
| $50,000 to $74,999 | 10,772 | 17.6% |
| $75,000 to $99,999 | 9,609 | 15.7% |
| $100,000 to $149,999 | 11,996 | 19.6% |
| $150,000 to $199,999 | 6,427 | 10.5% |
| $200,000+ | 7,039 | 11.5% |
Family Income by Famaliy Size in Irving
7+ person families (1,650 | 2.7%) account for the highest median family income in Irving with $99,250 per family, while 2-person families (22,750 | 37.2%) have the highest median income of $42,016 per family member.
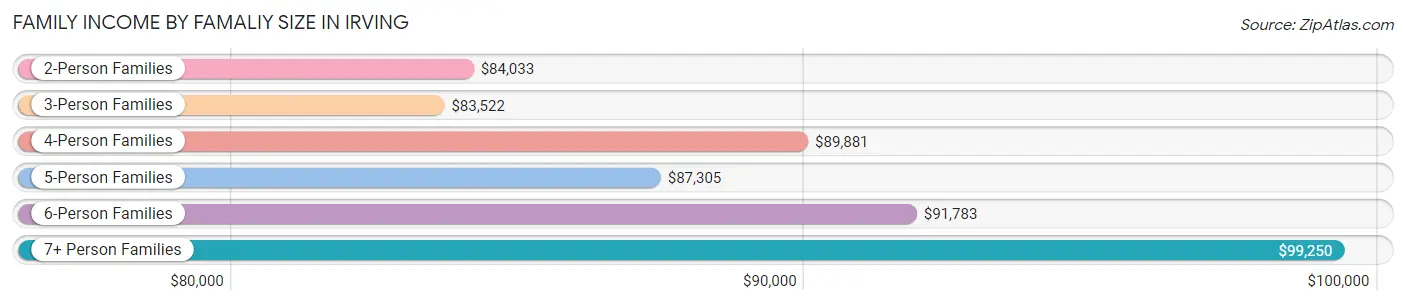
| Income Bracket | # Families | Median Income |
| 2-Person Families | 22,750 (37.2%) | $84,033 |
| 3-Person Families | 14,106 (23.1%) | $83,522 |
| 4-Person Families | 14,283 (23.3%) | $89,881 |
| 5-Person Families | 6,146 (10.0%) | $87,305 |
| 6-Person Families | 2,270 (3.7%) | $91,783 |
| 7+ Person Families | 1,650 (2.7%) | $99,250 |
| Total | 61,205 (100.0%) | $86,435 |
Family Income by Number of Earners in Irving
The median family income in Irving is $86,435, with families comprising 3+ earners (8,337) having the highest median family income of $110,770, while families with no earners (3,362) have the lowest median family income of $38,393, accounting for 13.6% and 5.5% of families, respectively.
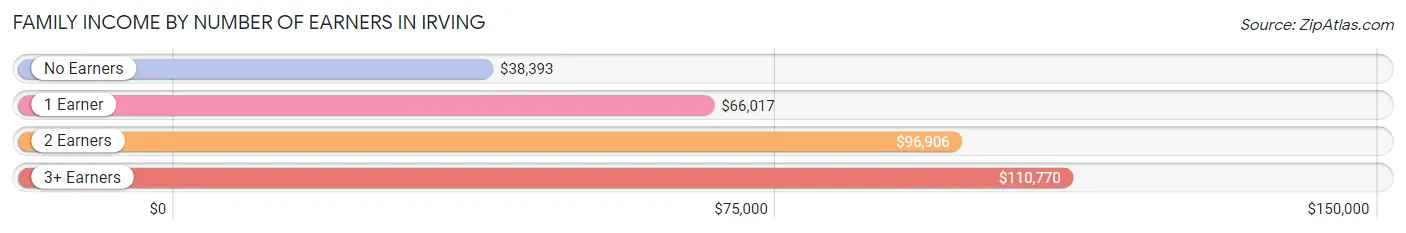
| Number of Earners | # Families | Median Income |
| No Earners | 3,362 (5.5%) | $38,393 |
| 1 Earner | 21,259 (34.7%) | $66,017 |
| 2 Earners | 28,247 (46.2%) | $96,906 |
| 3+ Earners | 8,337 (13.6%) | $110,770 |
| Total | 61,205 (100.0%) | $86,435 |
Household Income in Irving
Household Income Brackets in Irving
With 18,378 households falling in the category, the $50,000 to $74,999 income range is the most frequent in Irving, accounting for 19.8% of all households. In contrast, only 1,949 households (2.1%) fall into the $10,000 to $14,999 income bracket, making it the least populous group.
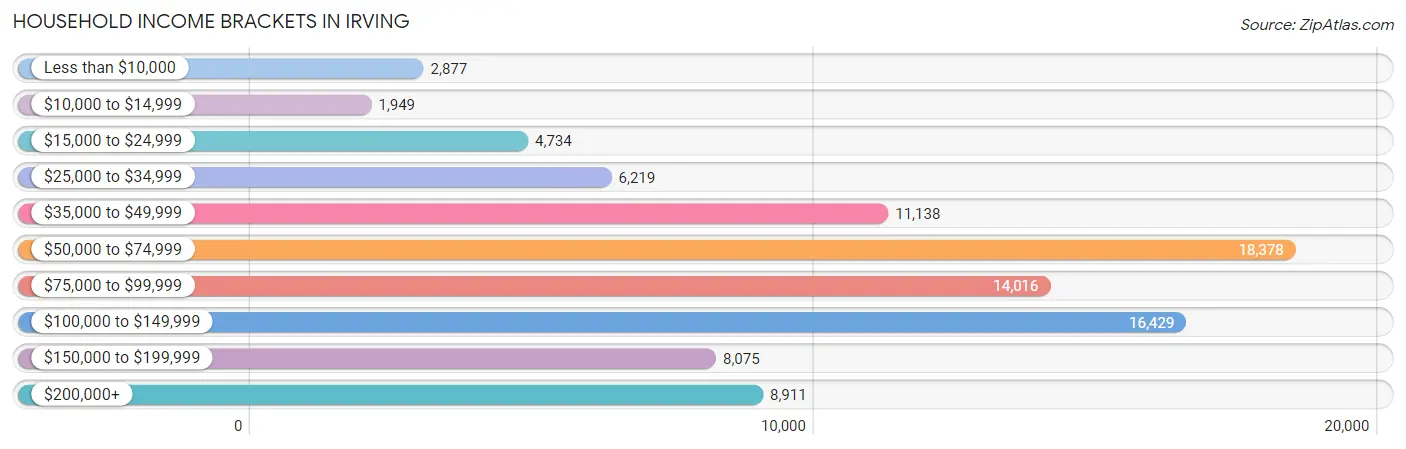
| Income Bracket | # Households | % Households |
| Less than $10,000 | 2,877 | 3.1% |
| $10,000 to $14,999 | 1,949 | 2.1% |
| $15,000 to $24,999 | 4,734 | 5.1% |
| $25,000 to $34,999 | 6,219 | 6.7% |
| $35,000 to $49,999 | 11,138 | 12.0% |
| $50,000 to $74,999 | 18,378 | 19.8% |
| $75,000 to $99,999 | 14,016 | 15.1% |
| $100,000 to $149,999 | 16,429 | 17.7% |
| $150,000 to $199,999 | 8,075 | 8.7% |
| $200,000+ | 8,911 | 9.6% |
Household Income by Householder Age in Irving
The median household income in Irving is $76,686, with the highest median household income of $85,625 found in the 45 to 64 years age bracket for the primary householder. A total of 31,132 households (33.5%) fall into this category. Meanwhile, the 15 to 24 years age bracket for the primary householder has the lowest median household income of $46,177, with 4,801 households (5.2%) in this group.
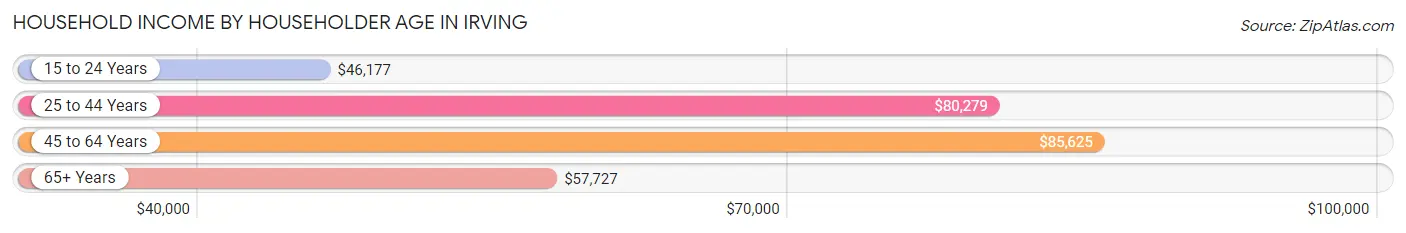
| Income Bracket | # Households | Median Income |
| 15 to 24 Years | 4,801 (5.2%) | $46,177 |
| 25 to 44 Years | 44,903 (48.4%) | $80,279 |
| 45 to 64 Years | 31,132 (33.5%) | $85,625 |
| 65+ Years | 11,984 (12.9%) | $57,727 |
| Total | 92,820 (100.0%) | $76,686 |
Poverty in Irving
Income Below Poverty by Sex and Age in Irving
With 9.3% poverty level for males and 11.8% for females among the residents of Irving, under 5 year old males and 16 and 17 year old females are the most vulnerable to poverty, with 1,742 males (16.0%) and 619 females (18.9%) in their respective age groups living below the poverty level.
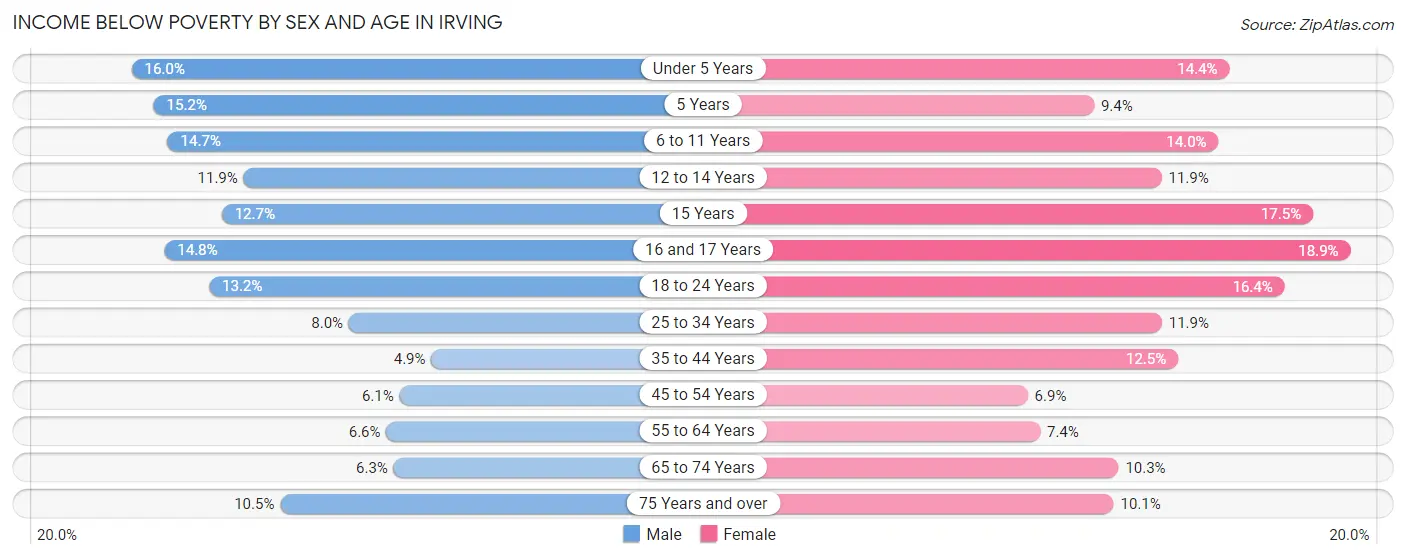
| Age Bracket | Male | Female |
| Under 5 Years | 1,742 (16.0%) | 1,441 (14.4%) |
| 5 Years | 225 (15.2%) | 172 (9.4%) |
| 6 to 11 Years | 1,606 (14.7%) | 1,421 (14.0%) |
| 12 to 14 Years | 655 (11.9%) | 650 (11.9%) |
| 15 Years | 226 (12.7%) | 262 (17.5%) |
| 16 and 17 Years | 571 (14.8%) | 619 (18.9%) |
| 18 to 24 Years | 1,560 (13.2%) | 1,871 (16.4%) |
| 25 to 34 Years | 1,903 (8.0%) | 2,845 (11.9%) |
| 35 to 44 Years | 1,068 (4.9%) | 2,319 (12.5%) |
| 45 to 54 Years | 965 (6.1%) | 1,059 (6.9%) |
| 55 to 64 Years | 761 (6.6%) | 831 (7.4%) |
| 65 to 74 Years | 421 (6.3%) | 721 (10.3%) |
| 75 Years and over | 302 (10.5%) | 435 (10.1%) |
| Total | 12,005 (9.3%) | 14,646 (11.8%) |
Income Above Poverty by Sex and Age in Irving
According to the poverty statistics in Irving, males aged 35 to 44 years and females aged 45 to 54 years are the age groups that are most secure financially, with 95.1% of males and 93.1% of females in these age groups living above the poverty line.
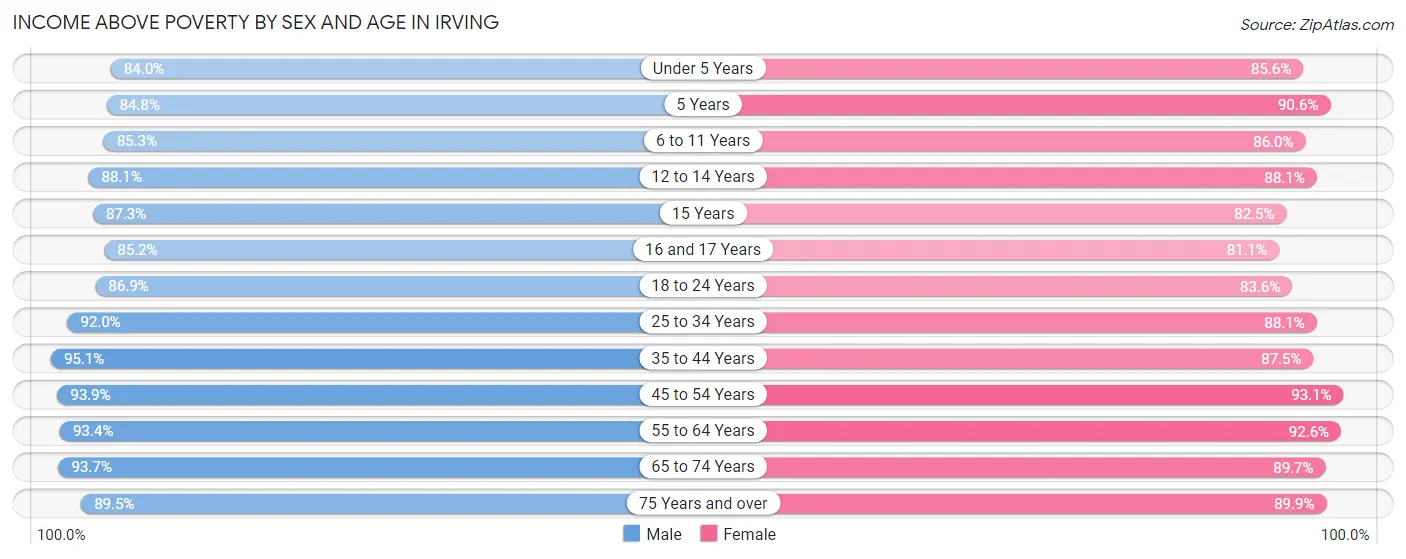
| Age Bracket | Male | Female |
| Under 5 Years | 9,128 (84.0%) | 8,576 (85.6%) |
| 5 Years | 1,254 (84.8%) | 1,665 (90.6%) |
| 6 to 11 Years | 9,324 (85.3%) | 8,746 (86.0%) |
| 12 to 14 Years | 4,862 (88.1%) | 4,824 (88.1%) |
| 15 Years | 1,557 (87.3%) | 1,236 (82.5%) |
| 16 and 17 Years | 3,284 (85.2%) | 2,660 (81.1%) |
| 18 to 24 Years | 10,301 (86.9%) | 9,512 (83.6%) |
| 25 to 34 Years | 22,019 (92.0%) | 21,095 (88.1%) |
| 35 to 44 Years | 20,730 (95.1%) | 16,258 (87.5%) |
| 45 to 54 Years | 14,918 (93.9%) | 14,299 (93.1%) |
| 55 to 64 Years | 10,822 (93.4%) | 10,462 (92.6%) |
| 65 to 74 Years | 6,260 (93.7%) | 6,302 (89.7%) |
| 75 Years and over | 2,571 (89.5%) | 3,875 (89.9%) |
| Total | 117,030 (90.7%) | 109,510 (88.2%) |
Income Below Poverty Among Married-Couple Families in Irving
The poverty statistics for married-couple families in Irving show that 4.9% or 2,171 of the total 44,290 families live below the poverty line. Families with 5 or more children have the highest poverty rate of 19.0%, comprising of 102 families. On the other hand, families with no children have the lowest poverty rate of 2.8%, which includes 573 families.
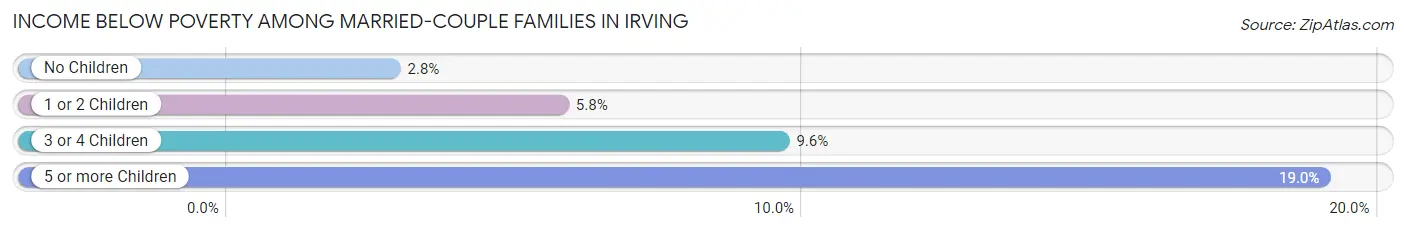
| Children | Above Poverty | Below Poverty |
| No Children | 19,695 (97.2%) | 573 (2.8%) |
| 1 or 2 Children | 18,600 (94.2%) | 1,136 (5.8%) |
| 3 or 4 Children | 3,390 (90.4%) | 360 (9.6%) |
| 5 or more Children | 434 (81.0%) | 102 (19.0%) |
| Total | 42,119 (95.1%) | 2,171 (4.9%) |
Income Below Poverty Among Single-Parent Households in Irving
According to the poverty data in Irving, 6.2% or 371 single-father households and 22.0% or 2,410 single-mother households are living below the poverty line. Among single-father households, those with 3 or 4 children have the highest poverty rate, with 88 households (21.2%) experiencing poverty. Likewise, among single-mother households, those with 5 or more children have the highest poverty rate, with 47 households (100.0%) falling below the poverty line.
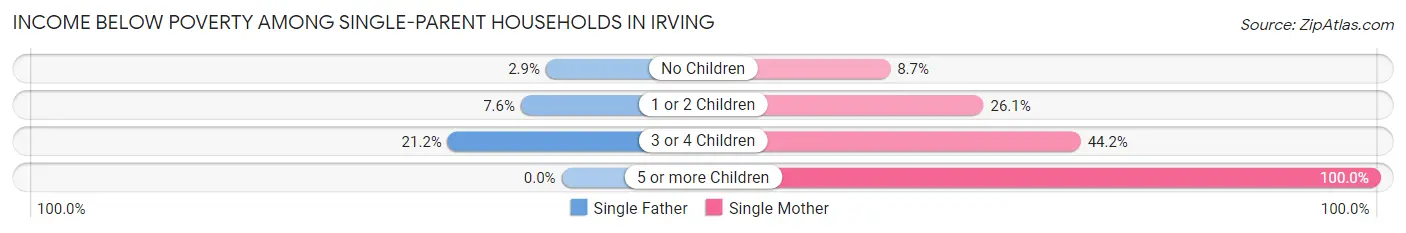
| Children | Single Father | Single Mother |
| No Children | 85 (2.9%) | 360 (8.7%) |
| 1 or 2 Children | 198 (7.6%) | 1,426 (26.1%) |
| 3 or 4 Children | 88 (21.2%) | 577 (44.2%) |
| 5 or more Children | 0 (0.0%) | 47 (100.0%) |
| Total | 371 (6.2%) | 2,410 (22.0%) |
Income Below Poverty Among Married-Couple vs Single-Parent Households in Irving
The poverty data for Irving shows that 2,171 of the married-couple family households (4.9%) and 2,781 of the single-parent households (16.4%) are living below the poverty level. Within the married-couple family households, those with 5 or more children have the highest poverty rate, with 102 households (19.0%) falling below the poverty line. Among the single-parent households, those with 5 or more children have the highest poverty rate, with 47 household (100.0%) living below poverty.
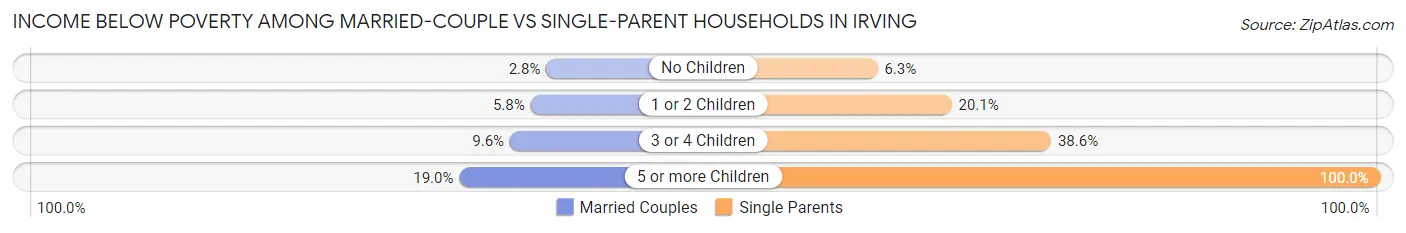
| Children | Married-Couple Families | Single-Parent Households |
| No Children | 573 (2.8%) | 445 (6.3%) |
| 1 or 2 Children | 1,136 (5.8%) | 1,624 (20.1%) |
| 3 or 4 Children | 360 (9.6%) | 665 (38.6%) |
| 5 or more Children | 102 (19.0%) | 47 (100.0%) |
| Total | 2,171 (4.9%) | 2,781 (16.4%) |
Race in Irving
The most populous races in Irving are Hispanic or Latino (110,121 | 43.2%), White / Caucasian (95,737 | 37.6%), and Asian (56,750 | 22.3%).
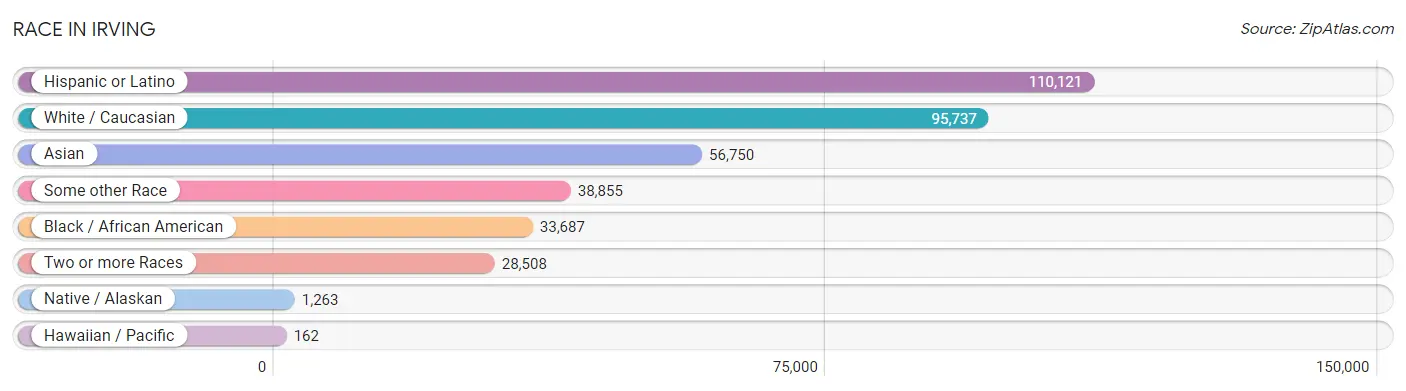
| Race | # Population | % Population |
| Asian | 56,750 | 22.3% |
| Black / African American | 33,687 | 13.2% |
| Hawaiian / Pacific | 162 | 0.1% |
| Hispanic or Latino | 110,121 | 43.2% |
| Native / Alaskan | 1,263 | 0.5% |
| White / Caucasian | 95,737 | 37.6% |
| Two or more Races | 28,508 | 11.2% |
| Some other Race | 38,855 | 15.2% |
| Total | 254,962 | 100.0% |
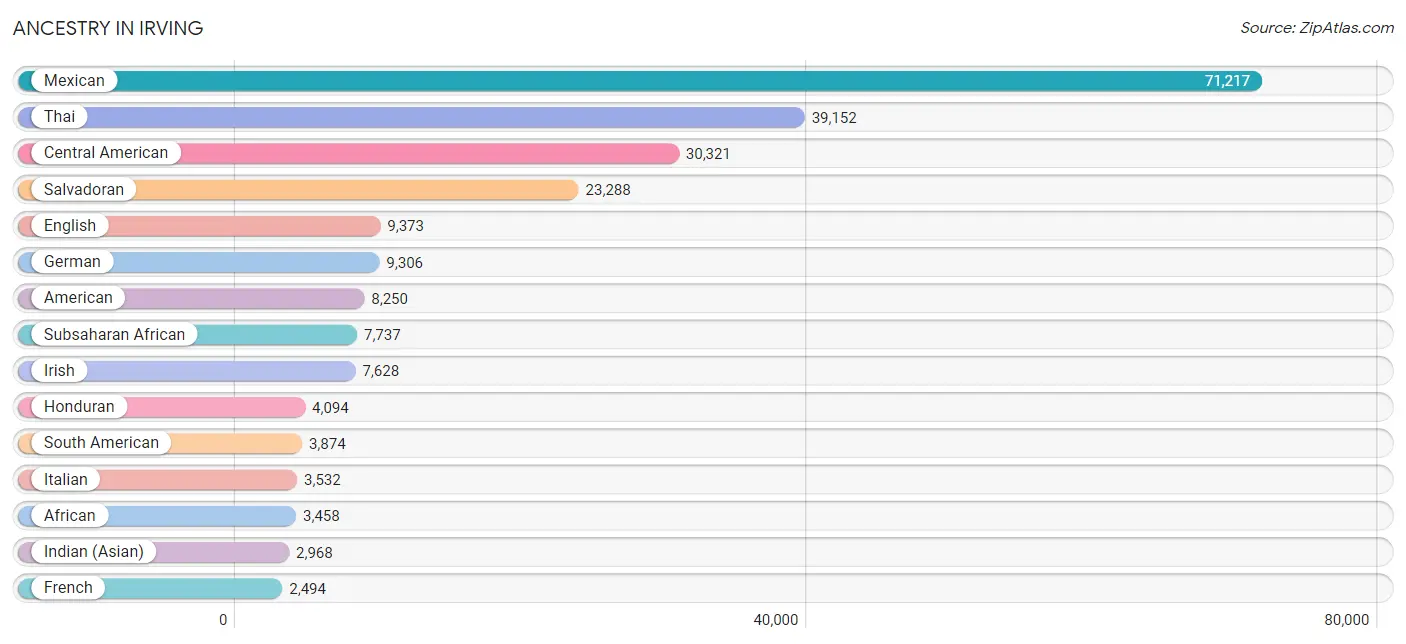
Ancestry in Irving
The most populous ancestries reported in Irving are Mexican (71,217 | 27.9%), Thai (39,152 | 15.4%), Central American (30,321 | 11.9%), Salvadoran (23,288 | 9.1%), and English (9,373 | 3.7%), together accounting for 68.0% of all Irving residents.
| Ancestry | # Population | % Population |
| African | 3,458 | 1.4% |
| Albanian | 11 | 0.0% |
| Alsatian | 4 | 0.0% |
| American | 8,250 | 3.2% |
| Apache | 41 | 0.0% |
| Arab | 1,141 | 0.4% |
| Arapaho | 41 | 0.0% |
| Argentinean | 439 | 0.2% |
| Armenian | 9 | 0.0% |
| Australian | 44 | 0.0% |
| Austrian | 73 | 0.0% |
| Bangladeshi | 6 | 0.0% |
| Barbadian | 12 | 0.0% |
| Basque | 15 | 0.0% |
| Belgian | 224 | 0.1% |
| Belizean | 5 | 0.0% |
| Bhutanese | 803 | 0.3% |
| Blackfeet | 103 | 0.0% |
| Bolivian | 66 | 0.0% |
| Brazilian | 295 | 0.1% |
| British | 650 | 0.3% |
| Bulgarian | 25 | 0.0% |
| Burmese | 1,842 | 0.7% |
| Cajun | 3 | 0.0% |
| Canadian | 217 | 0.1% |
| Celtic | 25 | 0.0% |
| Central American | 30,321 | 11.9% |
| Central American Indian | 252 | 0.1% |
| Cherokee | 425 | 0.2% |
| Chickasaw | 89 | 0.0% |
| Chilean | 18 | 0.0% |
| Chippewa | 6 | 0.0% |
| Choctaw | 419 | 0.2% |
| Colombian | 1,078 | 0.4% |
| Costa Rican | 49 | 0.0% |
| Croatian | 64 | 0.0% |
| Cuban | 870 | 0.3% |
| Cypriot | 13 | 0.0% |
| Czech | 470 | 0.2% |
| Czechoslovakian | 110 | 0.0% |
| Danish | 235 | 0.1% |
| Delaware | 4 | 0.0% |
| Dominican | 365 | 0.1% |
| Dutch | 609 | 0.2% |
| Dutch West Indian | 13 | 0.0% |
| Eastern European | 98 | 0.0% |
| Ecuadorian | 311 | 0.1% |
| Egyptian | 88 | 0.0% |
| English | 9,373 | 3.7% |
| Estonian | 10 | 0.0% |
| Ethiopian | 1,065 | 0.4% |
| European | 1,614 | 0.6% |
| Filipino | 154 | 0.1% |
| Finnish | 266 | 0.1% |
| French | 2,494 | 1.0% |
| French American Indian | 40 | 0.0% |
| French Canadian | 450 | 0.2% |
| German | 9,306 | 3.6% |
| German Russian | 16 | 0.0% |
| Ghanaian | 15 | 0.0% |
| Greek | 325 | 0.1% |
| Guamanian / Chamorro | 92 | 0.0% |
| Guatemalan | 1,669 | 0.6% |
| Guyanese | 31 | 0.0% |
| Haitian | 152 | 0.1% |
| Honduran | 4,094 | 1.6% |
| Houma | 15 | 0.0% |
| Hungarian | 155 | 0.1% |
| Indian (Asian) | 2,968 | 1.2% |
| Indonesian | 253 | 0.1% |
| Inupiat | 38 | 0.0% |
| Iranian | 388 | 0.2% |
| Iraqi | 12 | 0.0% |
| Irish | 7,628 | 3.0% |
| Iroquois | 17 | 0.0% |
| Israeli | 122 | 0.1% |
| Italian | 3,532 | 1.4% |
| Jamaican | 254 | 0.1% |
| Japanese | 328 | 0.1% |
| Jordanian | 98 | 0.0% |
| Kenyan | 469 | 0.2% |
| Korean | 1,568 | 0.6% |
| Laotian | 112 | 0.0% |
| Lebanese | 228 | 0.1% |
| Lithuanian | 64 | 0.0% |
| Lumbee | 19 | 0.0% |
| Macedonian | 24 | 0.0% |
| Malaysian | 231 | 0.1% |
| Mexican | 71,217 | 27.9% |
| Mexican American Indian | 742 | 0.3% |
| Mongolian | 31 | 0.0% |
| Moroccan | 19 | 0.0% |
| Native Hawaiian | 320 | 0.1% |
| Navajo | 18 | 0.0% |
| Nicaraguan | 418 | 0.2% |
| Nigerian | 1,434 | 0.6% |
| Northern European | 144 | 0.1% |
| Norwegian | 627 | 0.3% |
| Okinawan | 51 | 0.0% |
| Osage | 13 | 0.0% |
| Ottawa | 21 | 0.0% |
| Pakistani | 301 | 0.1% |
| Palestinian | 77 | 0.0% |
| Panamanian | 176 | 0.1% |
| Peruvian | 883 | 0.4% |
| Polish | 1,315 | 0.5% |
| Portuguese | 356 | 0.1% |
| Puerto Rican | 1,282 | 0.5% |
| Romanian | 67 | 0.0% |
| Russian | 386 | 0.2% |
| Salvadoran | 23,288 | 9.1% |
| Samoan | 78 | 0.0% |
| Scandinavian | 293 | 0.1% |
| Scotch-Irish | 1,379 | 0.5% |
| Scottish | 2,032 | 0.8% |
| Serbian | 8 | 0.0% |
| Sierra Leonean | 131 | 0.1% |
| Sioux | 83 | 0.0% |
| Slavic | 32 | 0.0% |
| Slovak | 60 | 0.0% |
| Slovene | 3 | 0.0% |
| Somali | 34 | 0.0% |
| South African | 117 | 0.1% |
| South American | 3,874 | 1.5% |
| South American Indian | 13 | 0.0% |
| Spaniard | 773 | 0.3% |
| Spanish | 248 | 0.1% |
| Sri Lankan | 1,788 | 0.7% |
| Subsaharan African | 7,737 | 3.0% |
| Sudanese | 135 | 0.1% |
| Swedish | 379 | 0.2% |
| Swiss | 136 | 0.1% |
| Syrian | 110 | 0.0% |
| Taiwanese | 81 | 0.0% |
| Thai | 39,152 | 15.4% |
| Tohono O'Odham | 9 | 0.0% |
| Trinidadian and Tobagonian | 29 | 0.0% |
| Turkish | 54 | 0.0% |
| U.S. Virgin Islander | 41 | 0.0% |
| Ugandan | 43 | 0.0% |
| Ukrainian | 118 | 0.1% |
| Uruguayan | 33 | 0.0% |
| Venezuelan | 1,012 | 0.4% |
| Vietnamese | 553 | 0.2% |
| Welsh | 395 | 0.2% |
| West Indian | 19 | 0.0% |
| Yugoslavian | 27 | 0.0% |
| Zimbabwean | 35 | 0.0% | View All 148 Rows |
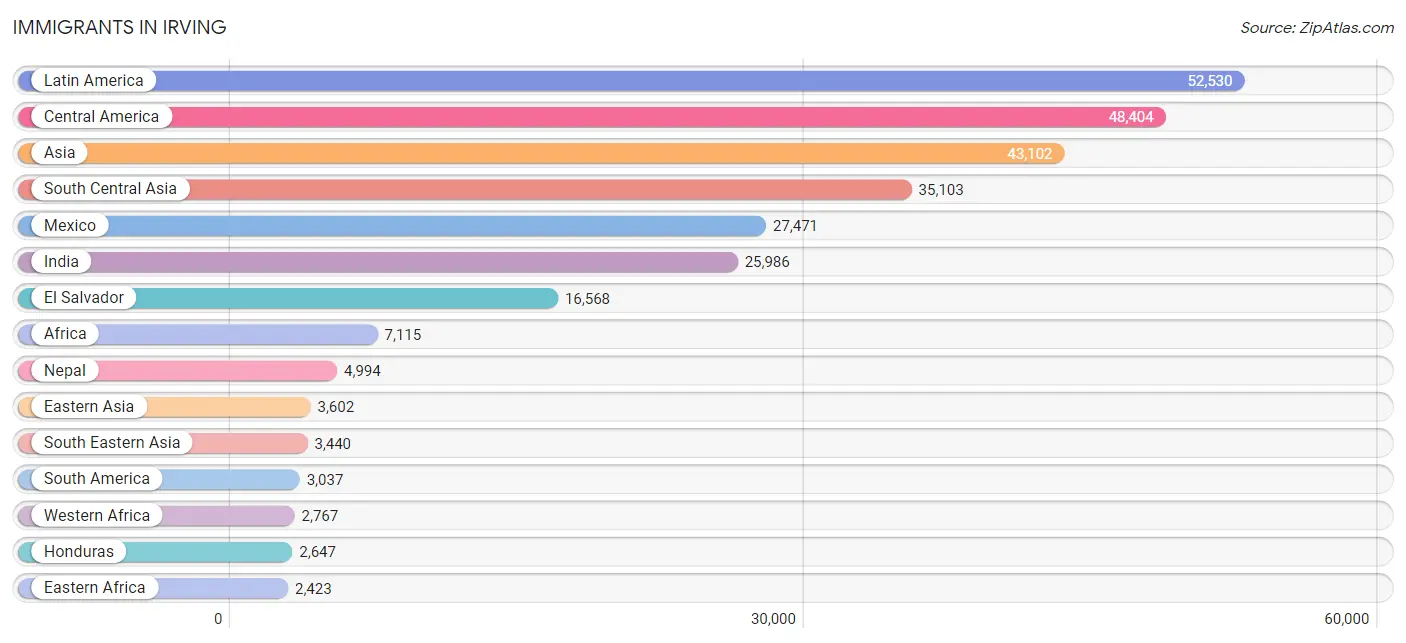
Immigrants in Irving
The most numerous immigrant groups reported in Irving came from Latin America (52,530 | 20.6%), Central America (48,404 | 19.0%), Asia (43,102 | 16.9%), South Central Asia (35,103 | 13.8%), and Mexico (27,471 | 10.8%), together accounting for 81.0% of all Irving residents.
| Immigration Origin | # Population | % Population |
| Afghanistan | 79 | 0.0% |
| Africa | 7,115 | 2.8% |
| Argentina | 247 | 0.1% |
| Asia | 43,102 | 16.9% |
| Australia | 46 | 0.0% |
| Bangladesh | 1,332 | 0.5% |
| Barbados | 25 | 0.0% |
| Belgium | 24 | 0.0% |
| Belize | 5 | 0.0% |
| Bolivia | 66 | 0.0% |
| Brazil | 178 | 0.1% |
| Cambodia | 140 | 0.1% |
| Cameroon | 68 | 0.0% |
| Canada | 317 | 0.1% |
| Caribbean | 1,089 | 0.4% |
| Central America | 48,404 | 19.0% |
| Chile | 18 | 0.0% |
| China | 1,943 | 0.8% |
| Colombia | 737 | 0.3% |
| Congo | 417 | 0.2% |
| Costa Rica | 9 | 0.0% |
| Cuba | 623 | 0.2% |
| Czechoslovakia | 43 | 0.0% |
| Dominican Republic | 160 | 0.1% |
| Eastern Africa | 2,423 | 0.9% |
| Eastern Asia | 3,602 | 1.4% |
| Eastern Europe | 462 | 0.2% |
| Ecuador | 68 | 0.0% |
| Egypt | 204 | 0.1% |
| El Salvador | 16,568 | 6.5% |
| England | 268 | 0.1% |
| Eritrea | 160 | 0.1% |
| Ethiopia | 667 | 0.3% |
| Europe | 1,572 | 0.6% |
| Fiji | 9 | 0.0% |
| France | 70 | 0.0% |
| Germany | 74 | 0.0% |
| Ghana | 731 | 0.3% |
| Greece | 115 | 0.1% |
| Guatemala | 1,062 | 0.4% |
| Guyana | 56 | 0.0% |
| Haiti | 50 | 0.0% |
| Honduras | 2,647 | 1.0% |
| Hong Kong | 37 | 0.0% |
| Hungary | 16 | 0.0% |
| India | 25,986 | 10.2% |
| Indonesia | 83 | 0.0% |
| Iran | 344 | 0.1% |
| Iraq | 28 | 0.0% |
| Ireland | 24 | 0.0% |
| Israel | 140 | 0.1% |
| Italy | 111 | 0.0% |
| Jamaica | 152 | 0.1% |
| Japan | 352 | 0.1% |
| Jordan | 95 | 0.0% |
| Kazakhstan | 7 | 0.0% |
| Kenya | 694 | 0.3% |
| Korea | 1,307 | 0.5% |
| Kuwait | 80 | 0.0% |
| Laos | 126 | 0.1% |
| Latin America | 52,530 | 20.6% |
| Lebanon | 76 | 0.0% |
| Liberia | 24 | 0.0% |
| Lithuania | 19 | 0.0% |
| Malaysia | 61 | 0.0% |
| Mexico | 27,471 | 10.8% |
| Middle Africa | 972 | 0.4% |
| Morocco | 41 | 0.0% |
| Nepal | 4,994 | 2.0% |
| Netherlands | 9 | 0.0% |
| Nicaragua | 515 | 0.2% |
| Nigeria | 1,461 | 0.6% |
| Northern Africa | 619 | 0.2% |
| Northern Europe | 686 | 0.3% |
| Oceania | 65 | 0.0% |
| Pakistan | 2,323 | 0.9% |
| Panama | 127 | 0.1% |
| Peru | 539 | 0.2% |
| Philippines | 1,205 | 0.5% |
| Poland | 66 | 0.0% |
| Portugal | 21 | 0.0% |
| Romania | 19 | 0.0% |
| Russia | 173 | 0.1% |
| Saudi Arabia | 132 | 0.1% |
| Scotland | 23 | 0.0% |
| Senegal | 19 | 0.0% |
| Sierra Leone | 38 | 0.0% |
| Singapore | 127 | 0.1% |
| Somalia | 89 | 0.0% |
| South Africa | 164 | 0.1% |
| South America | 3,037 | 1.2% |
| South Central Asia | 35,103 | 13.8% |
| South Eastern Asia | 3,440 | 1.3% |
| Southern Europe | 247 | 0.1% |
| Sri Lanka | 10 | 0.0% |
| Sudan | 324 | 0.1% |
| Sweden | 15 | 0.0% |
| Syria | 161 | 0.1% |
| Taiwan | 685 | 0.3% |
| Thailand | 418 | 0.2% |
| Trinidad and Tobago | 58 | 0.0% |
| Turkey | 18 | 0.0% |
| Uganda | 105 | 0.0% |
| Ukraine | 70 | 0.0% |
| Uruguay | 33 | 0.0% |
| Venezuela | 1,095 | 0.4% |
| Vietnam | 985 | 0.4% |
| West Indies | 21 | 0.0% |
| Western Africa | 2,767 | 1.1% |
| Western Asia | 848 | 0.3% |
| Western Europe | 177 | 0.1% |
| Yemen | 12 | 0.0% |
| Zaire | 487 | 0.2% |
| Zimbabwe | 91 | 0.0% | View All 114 Rows |
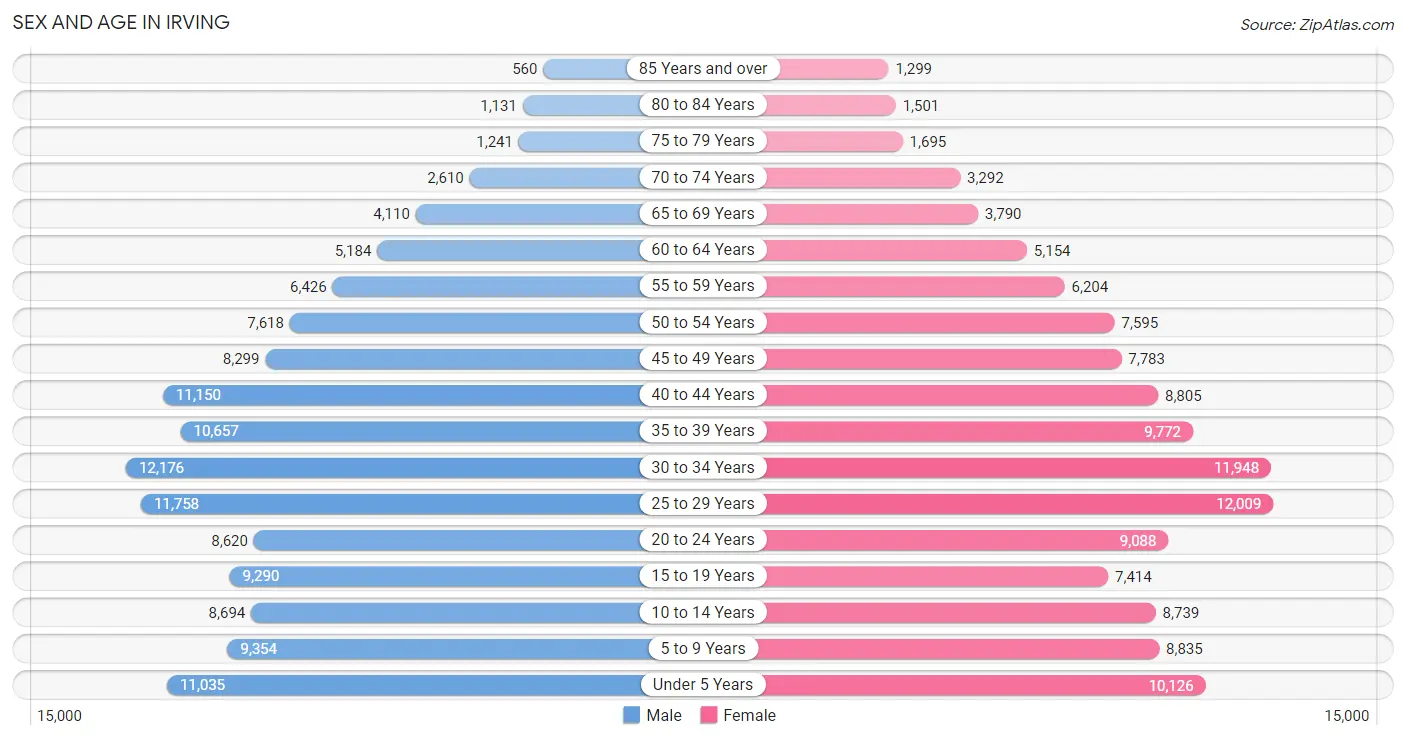
Sex and Age in Irving
Sex and Age in Irving
The most populous age groups in Irving are 30 to 34 Years (12,176 | 9.4%) for men and 25 to 29 Years (12,009 | 9.6%) for women.
| Age Bracket | Male | Female |
| Under 5 Years | 11,035 (8.5%) | 10,126 (8.1%) |
| 5 to 9 Years | 9,354 (7.2%) | 8,835 (7.1%) |
| 10 to 14 Years | 8,694 (6.7%) | 8,739 (7.0%) |
| 15 to 19 Years | 9,290 (7.1%) | 7,414 (5.9%) |
| 20 to 24 Years | 8,620 (6.6%) | 9,088 (7.3%) |
| 25 to 29 Years | 11,758 (9.0%) | 12,009 (9.6%) |
| 30 to 34 Years | 12,176 (9.4%) | 11,948 (9.6%) |
| 35 to 39 Years | 10,657 (8.2%) | 9,772 (7.8%) |
| 40 to 44 Years | 11,150 (8.6%) | 8,805 (7.0%) |
| 45 to 49 Years | 8,299 (6.4%) | 7,783 (6.2%) |
| 50 to 54 Years | 7,618 (5.9%) | 7,595 (6.1%) |
| 55 to 59 Years | 6,426 (5.0%) | 6,204 (5.0%) |
| 60 to 64 Years | 5,184 (4.0%) | 5,154 (4.1%) |
| 65 to 69 Years | 4,110 (3.2%) | 3,790 (3.0%) |
| 70 to 74 Years | 2,610 (2.0%) | 3,292 (2.6%) |
| 75 to 79 Years | 1,241 (1.0%) | 1,695 (1.4%) |
| 80 to 84 Years | 1,131 (0.9%) | 1,501 (1.2%) |
| 85 Years and over | 560 (0.4%) | 1,299 (1.0%) |
| Total | 129,913 (100.0%) | 125,049 (100.0%) |
Families and Households in Irving
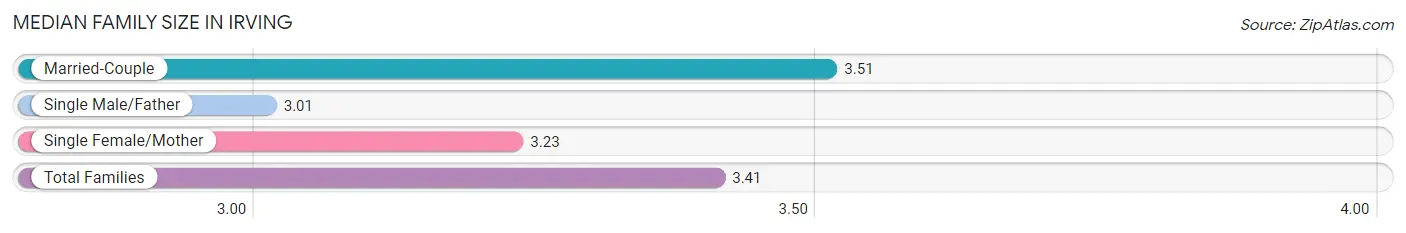
Median Family Size in Irving
The median family size in Irving is 3.41 persons per family, with married-couple families (44,290 | 72.4%) accounting for the largest median family size of 3.51 persons per family. On the other hand, single male/father families (5,937 | 9.7%) represent the smallest median family size with 3.01 persons per family.
| Family Type | # Families | Family Size |
| Married-Couple | 44,290 (72.4%) | 3.51 |
| Single Male/Father | 5,937 (9.7%) | 3.01 |
| Single Female/Mother | 10,978 (17.9%) | 3.23 |
| Total Families | 61,205 (100.0%) | 3.41 |
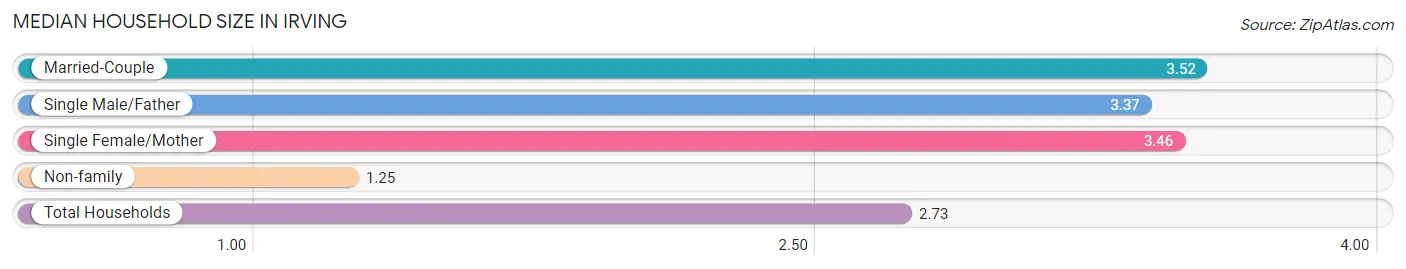
Median Household Size in Irving
The median household size in Irving is 2.73 persons per household, with married-couple households (44,290 | 47.7%) accounting for the largest median household size of 3.52 persons per household. non-family households (31,615 | 34.1%) represent the smallest median household size with 1.25 persons per household.
| Household Type | # Households | Household Size |
| Married-Couple | 44,290 (47.7%) | 3.52 |
| Single Male/Father | 5,937 (6.4%) | 3.37 |
| Single Female/Mother | 10,978 (11.8%) | 3.46 |
| Non-family | 31,615 (34.1%) | 1.25 |
| Total Households | 92,820 (100.0%) | 2.73 |
Household Size by Marriage Status in Irving
Out of a total of 92,820 households in Irving, 61,205 (65.9%) are family households, while 31,615 (34.1%) are nonfamily households. The most numerous type of family households are 2-person households, comprising 20,516, and the most common type of nonfamily households are 1-person households, comprising 26,097.
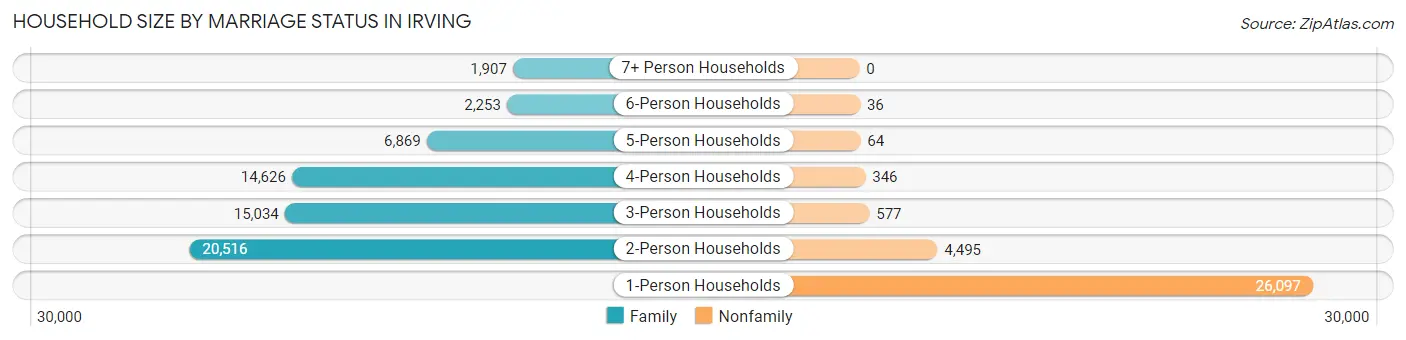
| Household Size | Family Households | Nonfamily Households |
| 1-Person Households | - | 26,097 (28.1%) |
| 2-Person Households | 20,516 (22.1%) | 4,495 (4.8%) |
| 3-Person Households | 15,034 (16.2%) | 577 (0.6%) |
| 4-Person Households | 14,626 (15.8%) | 346 (0.4%) |
| 5-Person Households | 6,869 (7.4%) | 64 (0.1%) |
| 6-Person Households | 2,253 (2.4%) | 36 (0.0%) |
| 7+ Person Households | 1,907 (2.1%) | 0 (0.0%) |
| Total | 61,205 (65.9%) | 31,615 (34.1%) |
Female Fertility in Irving
Fertility by Age in Irving
Average fertility rate in Irving is 61.0 births per 1,000 women. Women in the age bracket of 20 to 34 years have the highest fertility rate with 87.0 births per 1,000 women. Women in the age bracket of 20 to 34 years acount for 69.2% of all women with births.
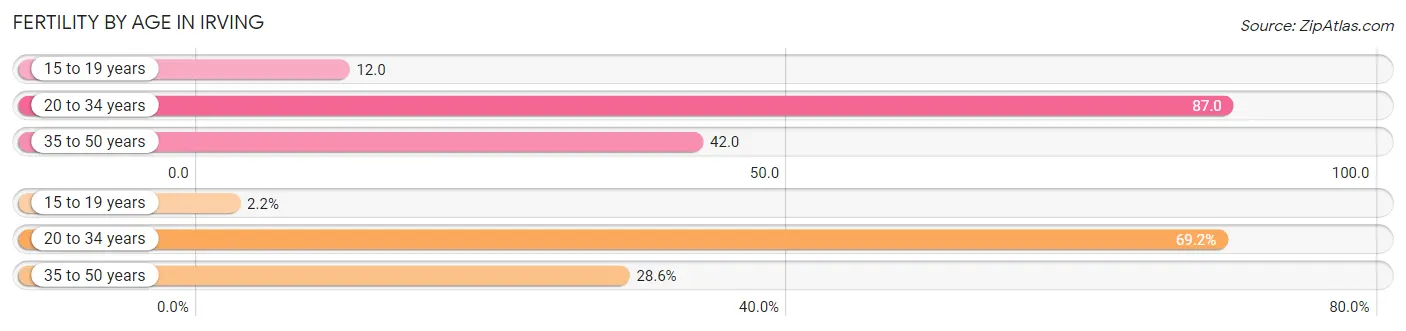
| Age Bracket | Women with Births | Births / 1,000 Women |
| 15 to 19 years | 91 (2.2%) | 12.0 |
| 20 to 34 years | 2,887 (69.2%) | 87.0 |
| 35 to 50 years | 1,193 (28.6%) | 42.0 |
| Total | 4,171 (100.0%) | 61.0 |
Fertility by Age by Marriage Status in Irving
77.4% of women with births (4,171) in Irving are married. The highest percentage of unmarried women with births falls into 15 to 19 years age bracket with 68.1% of them unmarried at the time of birth, while the lowest percentage of unmarried women with births belong to 20 to 34 years age bracket with 19.9% of them unmarried.
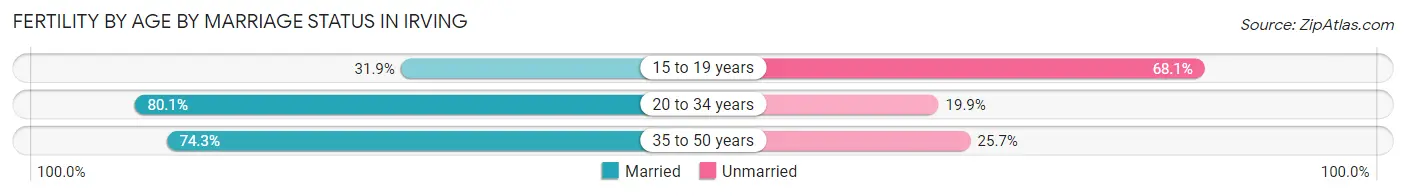
| Age Bracket | Married | Unmarried |
| 15 to 19 years | 29 (31.9%) | 62 (68.1%) |
| 20 to 34 years | 2,312 (80.1%) | 575 (19.9%) |
| 35 to 50 years | 886 (74.3%) | 307 (25.7%) |
| Total | 3,228 (77.4%) | 943 (22.6%) |
Fertility by Education in Irving
Average fertility rate in Irving is 61.0 births per 1,000 women. Women with the education attainment of graduate degree have the highest fertility rate of 70.0 births per 1,000 women, while women with the education attainment of less than high school have the lowest fertility at 43.0 births per 1,000 women. Women with the education attainment of college or associate's degree represent 25.0% of all women with births.
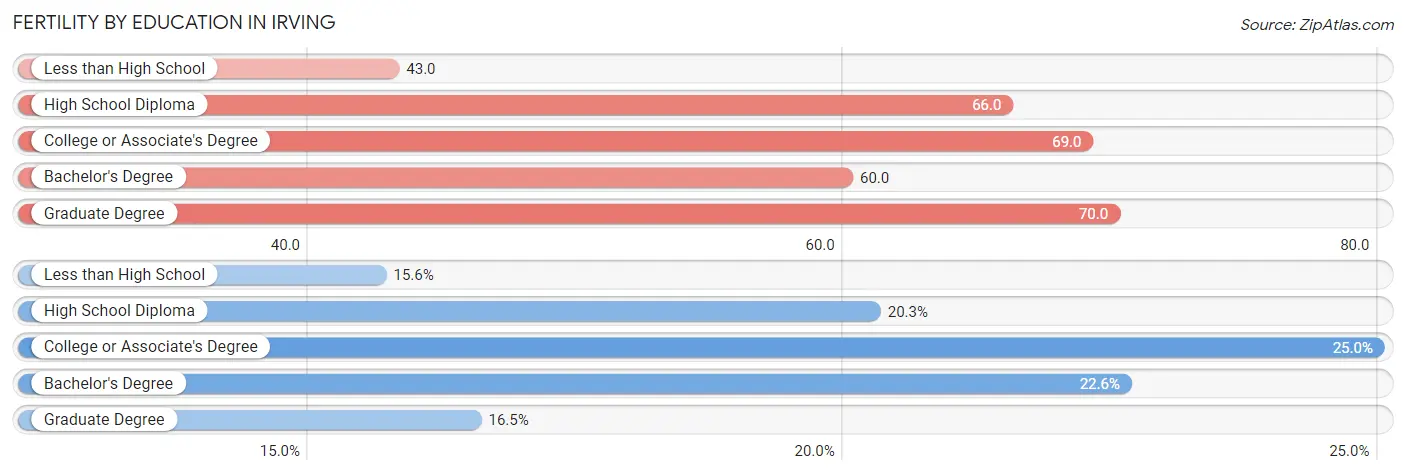
| Educational Attainment | Women with Births | Births / 1,000 Women |
| Less than High School | 652 (15.6%) | 43.0 |
| High School Diploma | 845 (20.3%) | 66.0 |
| College or Associate's Degree | 1,042 (25.0%) | 69.0 |
| Bachelor's Degree | 943 (22.6%) | 60.0 |
| Graduate Degree | 689 (16.5%) | 70.0 |
| Total | 4,171 (100.0%) | 61.0 |
Fertility by Education by Marriage Status in Irving
22.6% of women with births in Irving are unmarried. Women with the educational attainment of graduate degree are most likely to be married with 94.3% of them married at childbirth, while women with the educational attainment of college or associate's degree are least likely to be married with 42.2% of them unmarried at childbirth.
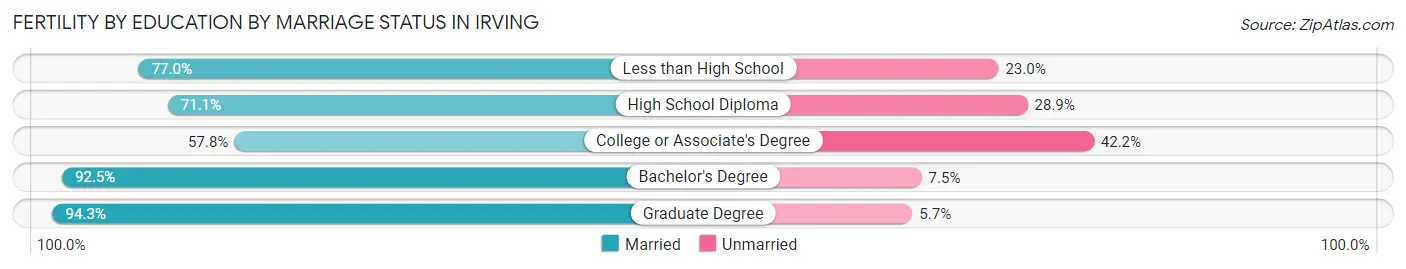
| Educational Attainment | Married | Unmarried |
| Less than High School | 502 (77.0%) | 150 (23.0%) |
| High School Diploma | 601 (71.1%) | 244 (28.9%) |
| College or Associate's Degree | 602 (57.8%) | 440 (42.2%) |
| Bachelor's Degree | 872 (92.5%) | 71 (7.5%) |
| Graduate Degree | 650 (94.3%) | 39 (5.7%) |
| Total | 3,228 (77.4%) | 943 (22.6%) |
Employment Characteristics in Irving
Employment by Class of Employer in Irving
Among the 133,238 employed individuals in Irving, private company employees (107,559 | 80.7%), self-employed (not incorporated) (8,096 | 6.1%), and not-for-profit organizations (5,105 | 3.8%) make up the most common classes of employment.
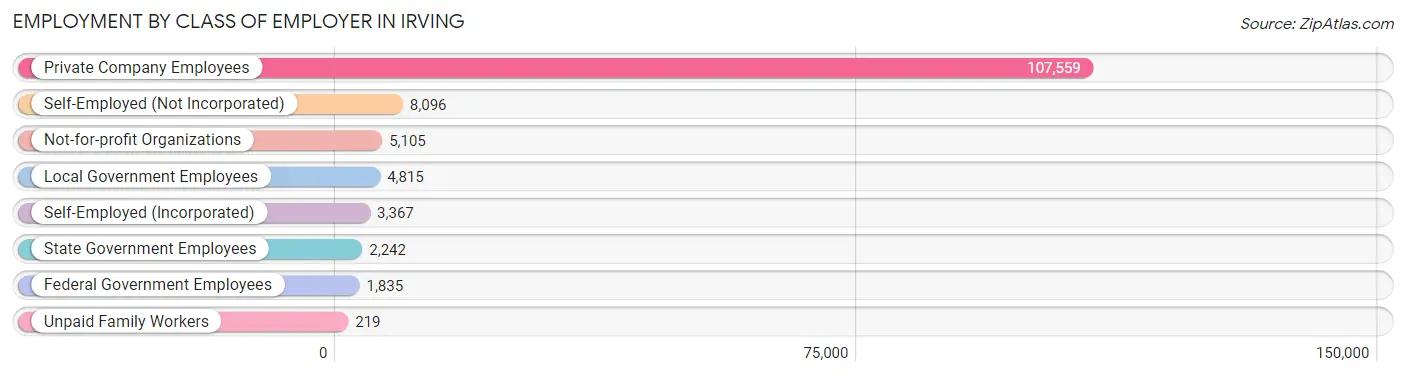
| Employer Class | # Employees | % Employees |
| Private Company Employees | 107,559 | 80.7% |
| Self-Employed (Incorporated) | 3,367 | 2.5% |
| Self-Employed (Not Incorporated) | 8,096 | 6.1% |
| Not-for-profit Organizations | 5,105 | 3.8% |
| Local Government Employees | 4,815 | 3.6% |
| State Government Employees | 2,242 | 1.7% |
| Federal Government Employees | 1,835 | 1.4% |
| Unpaid Family Workers | 219 | 0.2% |
| Total | 133,238 | 100.0% |
Employment Status by Age in Irving
According to the labor force statistics for Irving, out of the total population over 16 years of age (194,898), 72.8% or 141,886 individuals are in the labor force, with 4.1% or 5,817 of them unemployed. The age group with the highest labor force participation rate is 45 to 54 years, with 86.0% or 26,914 individuals in the labor force. Within the labor force, the 16 to 19 years age range has the highest percentage of unemployed individuals, with 9.8% or 438 of them being unemployed.
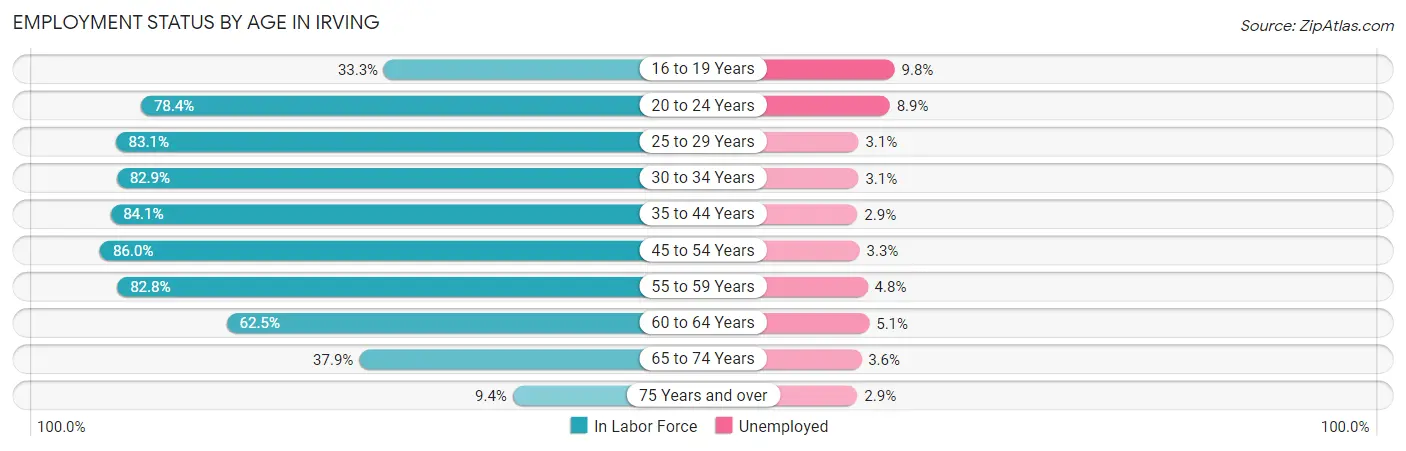
| Age Bracket | In Labor Force | Unemployed |
| 16 to 19 Years | 4,470 (33.3%) | 438 (9.8%) |
| 20 to 24 Years | 13,883 (78.4%) | 1,236 (8.9%) |
| 25 to 29 Years | 19,750 (83.1%) | 612 (3.1%) |
| 30 to 34 Years | 19,999 (82.9%) | 620 (3.1%) |
| 35 to 44 Years | 33,963 (84.1%) | 985 (2.9%) |
| 45 to 54 Years | 26,914 (86.0%) | 888 (3.3%) |
| 55 to 59 Years | 10,458 (82.8%) | 502 (4.8%) |
| 60 to 64 Years | 6,461 (62.5%) | 330 (5.1%) |
| 65 to 74 Years | 5,231 (37.9%) | 188 (3.6%) |
| 75 Years and over | 698 (9.4%) | 20 (2.9%) |
| Total | 141,886 (72.8%) | 5,817 (4.1%) |
Employment Status by Educational Attainment in Irving
According to labor force statistics for Irving, 82.5% of individuals (117,594) out of the total population between 25 and 64 years of age (142,538) are in the labor force, with 3.4% or 3,998 of them being unemployed. The group with the highest labor force participation rate are those with the educational attainment of college / associate degree, with 86.2% or 25,216 individuals in the labor force. Within the labor force, individuals with high school diploma education have the highest percentage of unemployment, with 4.6% or 932 of them being unemployed.
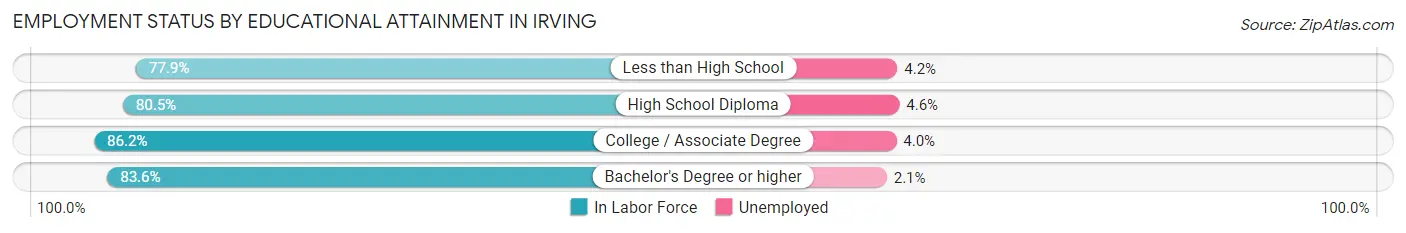
| Educational Attainment | In Labor Force | Unemployed |
| Less than High School | 22,113 (77.9%) | 1,192 (4.2%) |
| High School Diploma | 20,254 (80.5%) | 1,157 (4.6%) |
| College / Associate Degree | 25,216 (86.2%) | 1,170 (4.0%) |
| Bachelor's Degree or higher | 49,942 (83.6%) | 1,255 (2.1%) |
| Total | 117,594 (82.5%) | 4,846 (3.4%) |
Employment Occupations by Sex in Irving
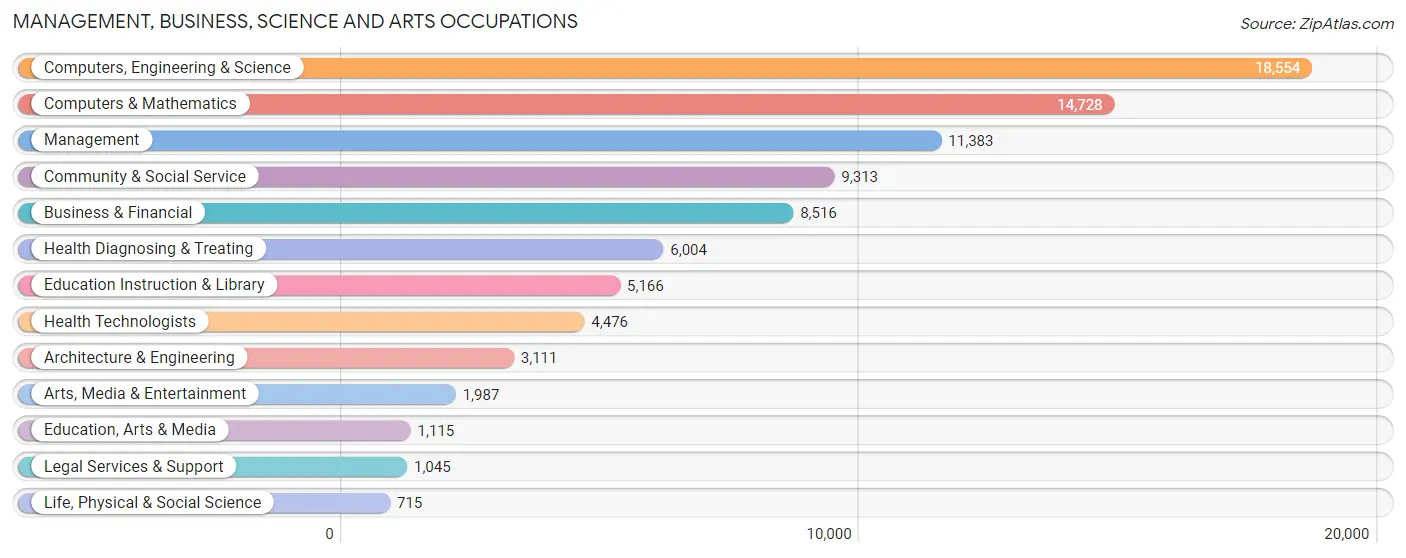
Management, Business, Science and Arts Occupations
The most common Management, Business, Science and Arts occupations in Irving are Computers, Engineering & Science (18,554 | 13.7%), Computers & Mathematics (14,728 | 10.8%), Management (11,383 | 8.4%), Community & Social Service (9,313 | 6.9%), and Business & Financial (8,516 | 6.3%).
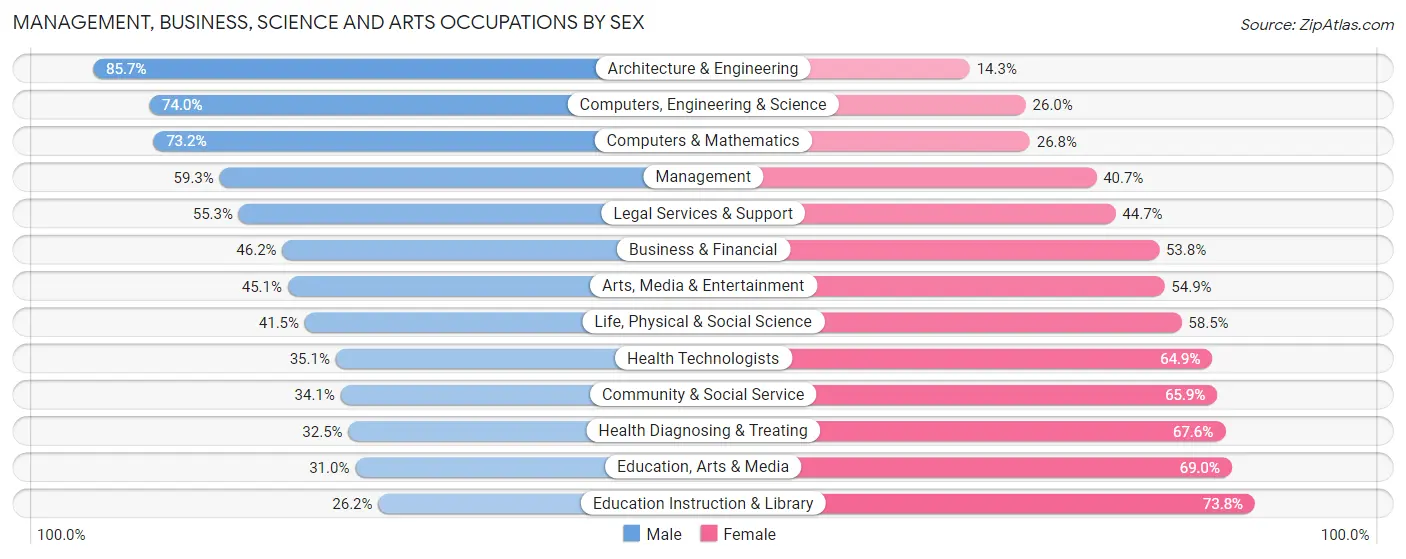
Management, Business, Science and Arts Occupations by Sex
Within the Management, Business, Science and Arts occupations in Irving, the most male-oriented occupations are Architecture & Engineering (85.7%), Computers, Engineering & Science (74.0%), and Computers & Mathematics (73.2%), while the most female-oriented occupations are Education Instruction & Library (73.8%), Education, Arts & Media (69.0%), and Health Diagnosing & Treating (67.5%).
| Occupation | Male | Female |
| Management | 6,752 (59.3%) | 4,631 (40.7%) |
| Business & Financial | 3,936 (46.2%) | 4,580 (53.8%) |
| Computers, Engineering & Science | 13,738 (74.0%) | 4,816 (26.0%) |
| Computers & Mathematics | 10,775 (73.2%) | 3,953 (26.8%) |
| Architecture & Engineering | 2,666 (85.7%) | 445 (14.3%) |
| Life, Physical & Social Science | 297 (41.5%) | 418 (58.5%) |
| Community & Social Service | 3,174 (34.1%) | 6,139 (65.9%) |
| Education, Arts & Media | 346 (31.0%) | 769 (69.0%) |
| Legal Services & Support | 578 (55.3%) | 467 (44.7%) |
| Education Instruction & Library | 1,354 (26.2%) | 3,812 (73.8%) |
| Arts, Media & Entertainment | 896 (45.1%) | 1,091 (54.9%) |
| Health Diagnosing & Treating | 1,948 (32.5%) | 4,056 (67.5%) |
| Health Technologists | 1,571 (35.1%) | 2,905 (64.9%) |
| Total (Category) | 29,548 (54.9%) | 24,222 (45.1%) |
| Total (Overall) | 78,861 (58.1%) | 56,916 (41.9%) |
Services Occupations
The most common Services occupations in Irving are Food Preparation & Serving (6,855 | 5.1%), Cleaning & Maintenance (6,686 | 4.9%), Personal Care & Service (2,346 | 1.7%), Healthcare Support (2,223 | 1.6%), and Security & Protection (1,903 | 1.4%).

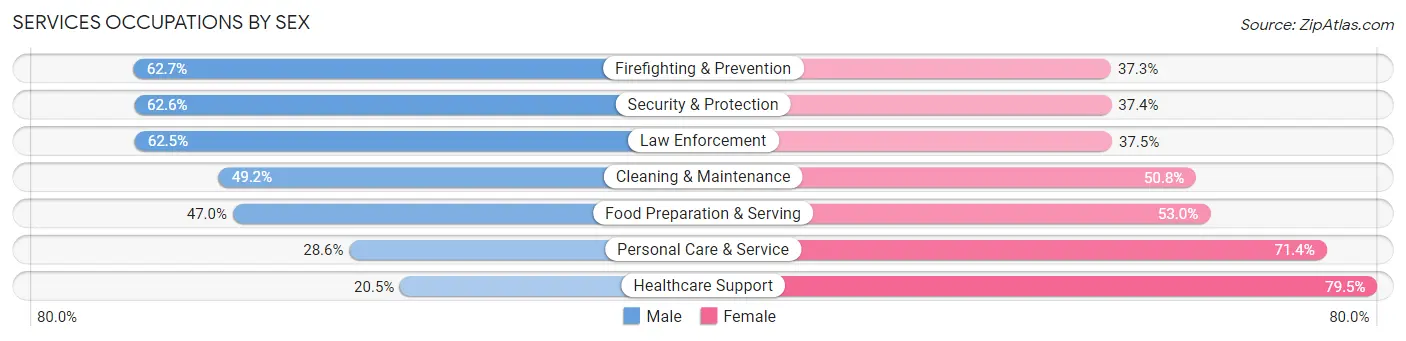
Services Occupations by Sex
Within the Services occupations in Irving, the most male-oriented occupations are Firefighting & Prevention (62.7%), Security & Protection (62.6%), and Law Enforcement (62.5%), while the most female-oriented occupations are Healthcare Support (79.5%), Personal Care & Service (71.4%), and Food Preparation & Serving (53.0%).
| Occupation | Male | Female |
| Healthcare Support | 456 (20.5%) | 1,767 (79.5%) |
| Security & Protection | 1,192 (62.6%) | 711 (37.4%) |
| Firefighting & Prevention | 768 (62.7%) | 457 (37.3%) |
| Law Enforcement | 424 (62.5%) | 254 (37.5%) |
| Food Preparation & Serving | 3,223 (47.0%) | 3,632 (53.0%) |
| Cleaning & Maintenance | 3,291 (49.2%) | 3,395 (50.8%) |
| Personal Care & Service | 670 (28.6%) | 1,676 (71.4%) |
| Total (Category) | 8,832 (44.1%) | 11,181 (55.9%) |
| Total (Overall) | 78,861 (58.1%) | 56,916 (41.9%) |
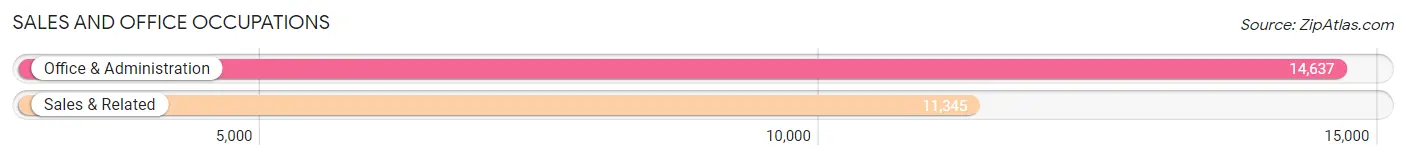
Sales and Office Occupations
The most common Sales and Office occupations in Irving are Office & Administration (14,637 | 10.8%), and Sales & Related (11,345 | 8.4%).
Sales and Office Occupations by Sex
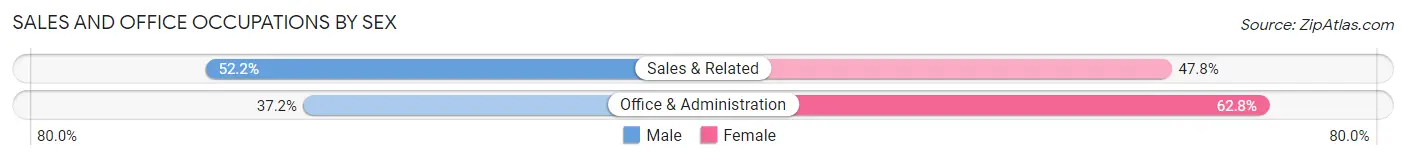
| Occupation | Male | Female |
| Sales & Related | 5,917 (52.2%) | 5,428 (47.8%) |
| Office & Administration | 5,443 (37.2%) | 9,194 (62.8%) |
| Total (Category) | 11,360 (43.7%) | 14,622 (56.3%) |
| Total (Overall) | 78,861 (58.1%) | 56,916 (41.9%) |
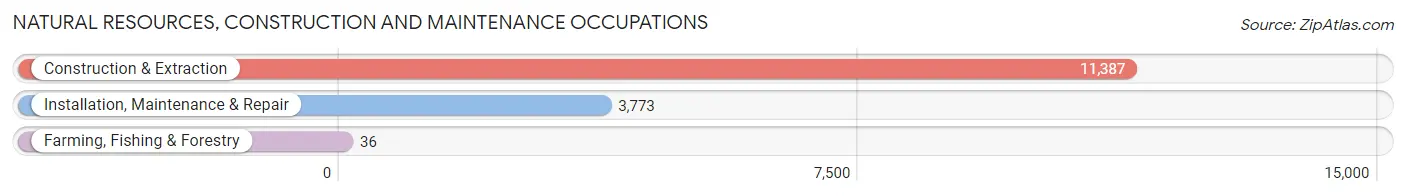
Natural Resources, Construction and Maintenance Occupations
The most common Natural Resources, Construction and Maintenance occupations in Irving are Construction & Extraction (11,387 | 8.4%), Installation, Maintenance & Repair (3,773 | 2.8%), and Farming, Fishing & Forestry (36 | 0.0%).
Natural Resources, Construction and Maintenance Occupations by Sex
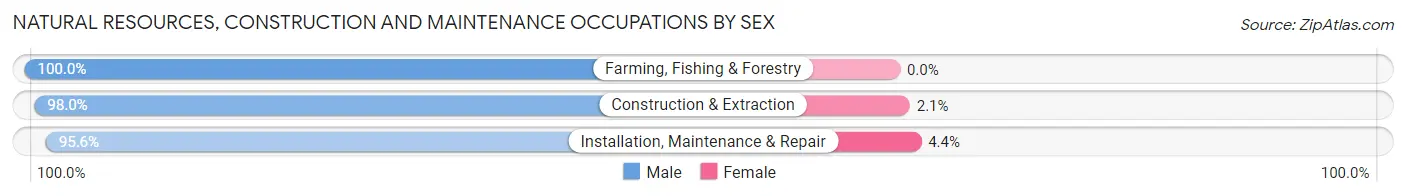
| Occupation | Male | Female |
| Farming, Fishing & Forestry | 36 (100.0%) | 0 (0.0%) |
| Construction & Extraction | 11,153 (98.0%) | 234 (2.1%) |
| Installation, Maintenance & Repair | 3,606 (95.6%) | 167 (4.4%) |
| Total (Category) | 14,795 (97.4%) | 401 (2.6%) |
| Total (Overall) | 78,861 (58.1%) | 56,916 (41.9%) |
Production, Transportation and Moving Occupations
The most common Production, Transportation and Moving occupations in Irving are Production (7,759 | 5.7%), Material Moving (7,474 | 5.5%), and Transportation (5,583 | 4.1%).
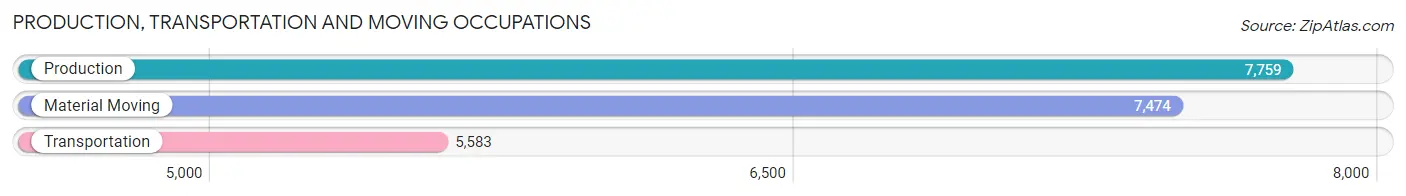
Production, Transportation and Moving Occupations by Sex
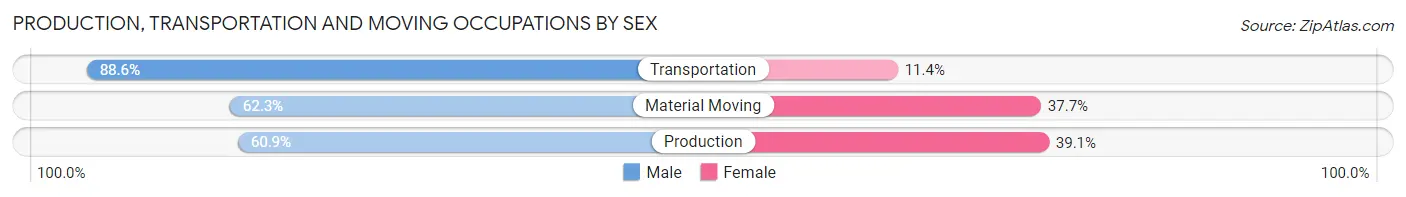
| Occupation | Male | Female |
| Production | 4,722 (60.9%) | 3,037 (39.1%) |
| Transportation | 4,946 (88.6%) | 637 (11.4%) |
| Material Moving | 4,658 (62.3%) | 2,816 (37.7%) |
| Total (Category) | 14,326 (68.8%) | 6,490 (31.2%) |
| Total (Overall) | 78,861 (58.1%) | 56,916 (41.9%) |
Employment Industries by Sex in Irving
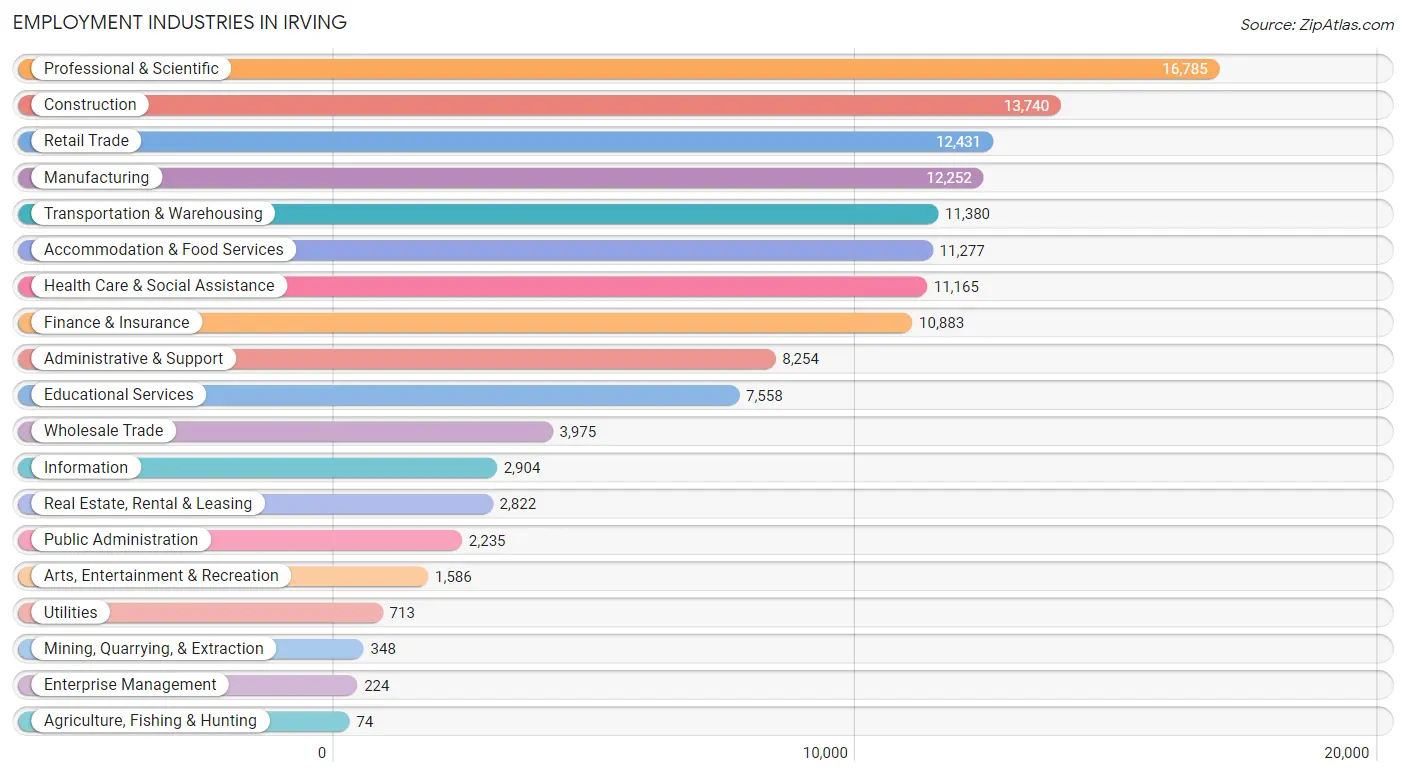
Employment Industries in Irving
The major employment industries in Irving include Professional & Scientific (16,785 | 12.4%), Construction (13,740 | 10.1%), Retail Trade (12,431 | 9.2%), Manufacturing (12,252 | 9.0%), and Transportation & Warehousing (11,380 | 8.4%).
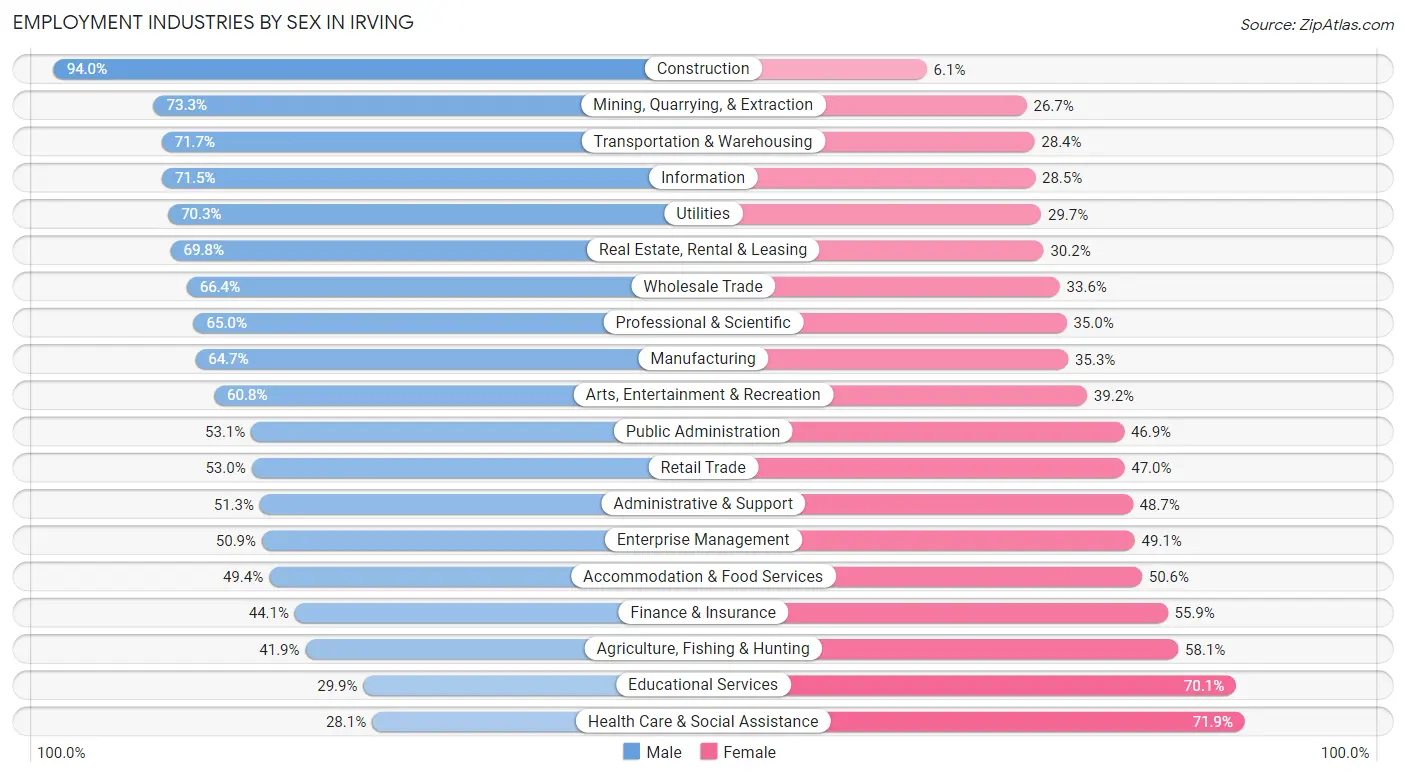
Employment Industries by Sex in Irving
The Irving industries that see more men than women are Construction (94.0%), Mining, Quarrying, & Extraction (73.3%), and Transportation & Warehousing (71.7%), whereas the industries that tend to have a higher number of women are Health Care & Social Assistance (71.9%), Educational Services (70.1%), and Agriculture, Fishing & Hunting (58.1%).
| Industry | Male | Female |
| Agriculture, Fishing & Hunting | 31 (41.9%) | 43 (58.1%) |
| Mining, Quarrying, & Extraction | 255 (73.3%) | 93 (26.7%) |
| Construction | 12,909 (94.0%) | 831 (6.0%) |
| Manufacturing | 7,922 (64.7%) | 4,330 (35.3%) |
| Wholesale Trade | 2,640 (66.4%) | 1,335 (33.6%) |
| Retail Trade | 6,594 (53.0%) | 5,837 (47.0%) |
| Transportation & Warehousing | 8,154 (71.7%) | 3,226 (28.3%) |
| Utilities | 501 (70.3%) | 212 (29.7%) |
| Information | 2,077 (71.5%) | 827 (28.5%) |
| Finance & Insurance | 4,796 (44.1%) | 6,087 (55.9%) |
| Real Estate, Rental & Leasing | 1,969 (69.8%) | 853 (30.2%) |
| Professional & Scientific | 10,912 (65.0%) | 5,873 (35.0%) |
| Enterprise Management | 114 (50.9%) | 110 (49.1%) |
| Administrative & Support | 4,236 (51.3%) | 4,018 (48.7%) |
| Educational Services | 2,260 (29.9%) | 5,298 (70.1%) |
| Health Care & Social Assistance | 3,137 (28.1%) | 8,028 (71.9%) |
| Arts, Entertainment & Recreation | 964 (60.8%) | 622 (39.2%) |
| Accommodation & Food Services | 5,573 (49.4%) | 5,704 (50.6%) |
| Public Administration | 1,187 (53.1%) | 1,048 (46.9%) |
| Total | 78,861 (58.1%) | 56,916 (41.9%) |
Education in Irving
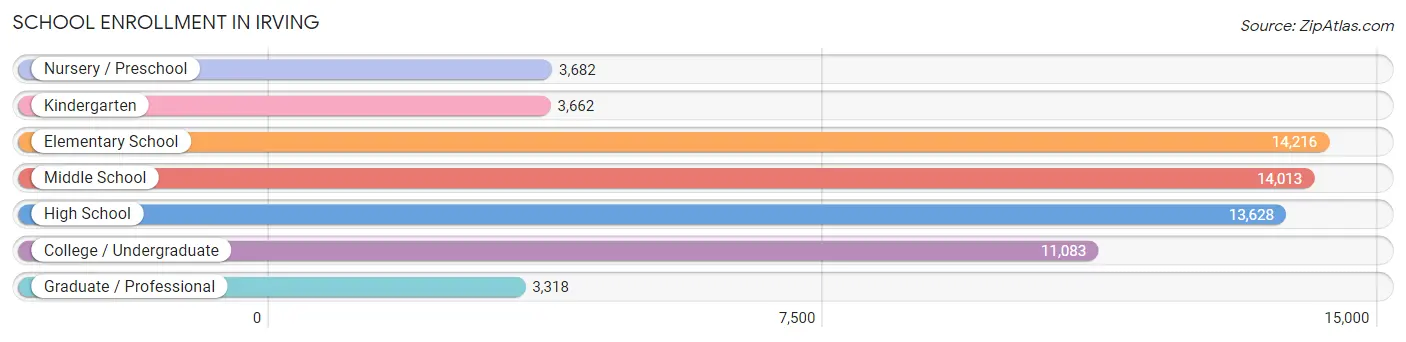
School Enrollment in Irving
The most common levels of schooling among the 63,602 students in Irving are elementary school (14,216 | 22.4%), middle school (14,013 | 22.0%), and high school (13,628 | 21.4%).
| School Level | # Students | % Students |
| Nursery / Preschool | 3,682 | 5.8% |
| Kindergarten | 3,662 | 5.8% |
| Elementary School | 14,216 | 22.4% |
| Middle School | 14,013 | 22.0% |
| High School | 13,628 | 21.4% |
| College / Undergraduate | 11,083 | 17.4% |
| Graduate / Professional | 3,318 | 5.2% |
| Total | 63,602 | 100.0% |
School Enrollment by Age by Funding Source in Irving
Out of a total of 63,602 students who are enrolled in schools in Irving, 7,569 (11.9%) attend a private institution, while the remaining 56,033 (88.1%) are enrolled in public schools. The age group of 3 to 4 year olds has the highest likelihood of being enrolled in private schools, with 891 (32.7% in the age bracket) enrolled. Conversely, the age group of 15 to 17 year olds has the lowest likelihood of being enrolled in a private school, with 9,419 (93.3% in the age bracket) attending a public institution.
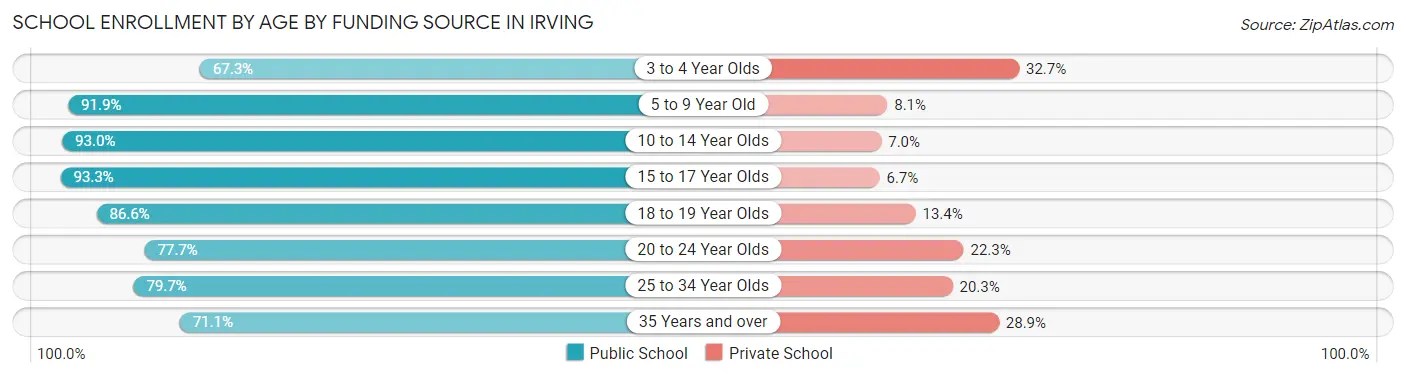
| Age Bracket | Public School | Private School |
| 3 to 4 Year Olds | 1,837 (67.3%) | 891 (32.7%) |
| 5 to 9 Year Old | 16,043 (91.9%) | 1,417 (8.1%) |
| 10 to 14 Year Olds | 15,588 (93.0%) | 1,174 (7.0%) |
| 15 to 17 Year Olds | 9,419 (93.3%) | 674 (6.7%) |
| 18 to 19 Year Olds | 3,654 (86.6%) | 565 (13.4%) |
| 20 to 24 Year Olds | 4,661 (77.7%) | 1,340 (22.3%) |
| 25 to 34 Year Olds | 3,153 (79.7%) | 802 (20.3%) |
| 35 Years and over | 1,695 (71.1%) | 689 (28.9%) |
| Total | 56,033 (88.1%) | 7,569 (11.9%) |
Educational Attainment by Field of Study in Irving
Business (15,074 | 21.6%), engineering (11,473 | 16.4%), computers & mathematics (9,408 | 13.5%), science & technology (6,705 | 9.6%), and social sciences (4,266 | 6.1%) are the most common fields of study among 69,921 individuals in Irving who have obtained a bachelor's degree or higher.
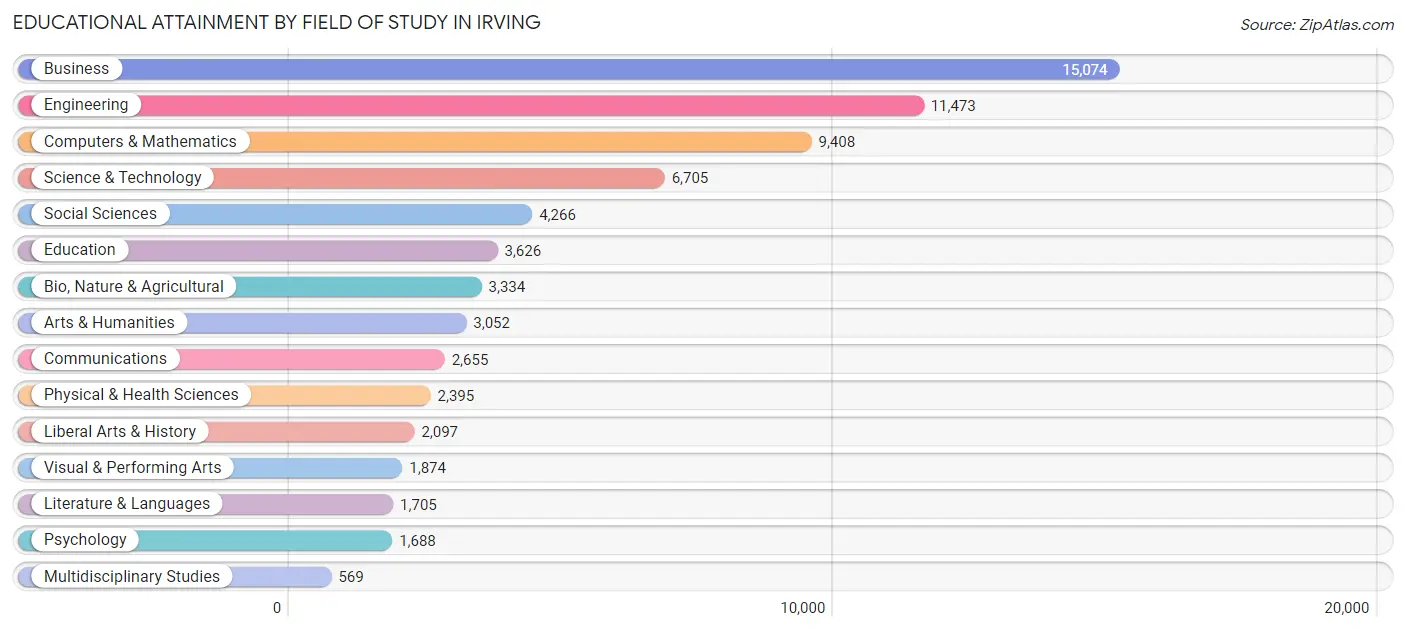
| Field of Study | # Graduates | % Graduates |
| Computers & Mathematics | 9,408 | 13.5% |
| Bio, Nature & Agricultural | 3,334 | 4.8% |
| Physical & Health Sciences | 2,395 | 3.4% |
| Psychology | 1,688 | 2.4% |
| Social Sciences | 4,266 | 6.1% |
| Engineering | 11,473 | 16.4% |
| Multidisciplinary Studies | 569 | 0.8% |
| Science & Technology | 6,705 | 9.6% |
| Business | 15,074 | 21.6% |
| Education | 3,626 | 5.2% |
| Literature & Languages | 1,705 | 2.4% |
| Liberal Arts & History | 2,097 | 3.0% |
| Visual & Performing Arts | 1,874 | 2.7% |
| Communications | 2,655 | 3.8% |
| Arts & Humanities | 3,052 | 4.4% |
| Total | 69,921 | 100.0% |
Transportation & Commute in Irving
Vehicle Availability by Sex in Irving
The most prevalent vehicle ownership categories in Irving are males with 2 vehicles (32,150, accounting for 41.5%) and females with 2 vehicles (22,101, making up 58.1%).
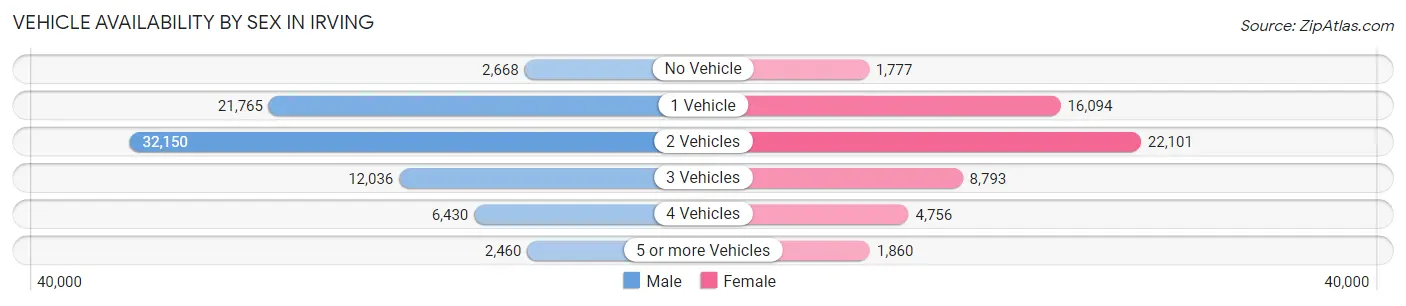
| Vehicles Available | Male | Female |
| No Vehicle | 2,668 (3.4%) | 1,777 (3.2%) |
| 1 Vehicle | 21,765 (28.1%) | 16,094 (29.1%) |
| 2 Vehicles | 32,150 (41.5%) | 22,101 (39.9%) |
| 3 Vehicles | 12,036 (15.5%) | 8,793 (15.9%) |
| 4 Vehicles | 6,430 (8.3%) | 4,756 (8.6%) |
| 5 or more Vehicles | 2,460 (3.2%) | 1,860 (3.4%) |
| Total | 77,509 (100.0%) | 55,381 (100.0%) |
Commute Time in Irving
The most frequently occuring commute durations in Irving are 20 to 24 minutes (20,623 commuters, 18.0%), 15 to 19 minutes (19,928 commuters, 17.4%), and 30 to 34 minutes (18,810 commuters, 16.4%).
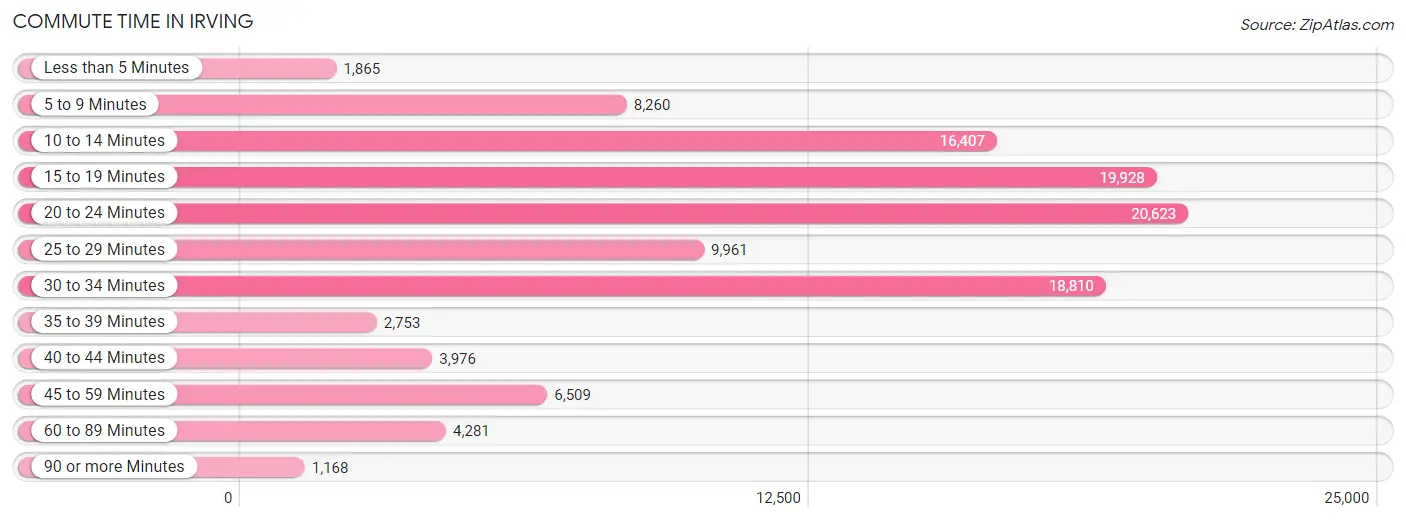
| Commute Time | # Commuters | % Commuters |
| Less than 5 Minutes | 1,865 | 1.6% |
| 5 to 9 Minutes | 8,260 | 7.2% |
| 10 to 14 Minutes | 16,407 | 14.3% |
| 15 to 19 Minutes | 19,928 | 17.4% |
| 20 to 24 Minutes | 20,623 | 18.0% |
| 25 to 29 Minutes | 9,961 | 8.7% |
| 30 to 34 Minutes | 18,810 | 16.4% |
| 35 to 39 Minutes | 2,753 | 2.4% |
| 40 to 44 Minutes | 3,976 | 3.5% |
| 45 to 59 Minutes | 6,509 | 5.7% |
| 60 to 89 Minutes | 4,281 | 3.7% |
| 90 or more Minutes | 1,168 | 1.0% |
Commute Time by Sex in Irving
The most common commute times in Irving are 15 to 19 minutes (12,641 commuters, 18.8%) for males and 20 to 24 minutes (8,907 commuters, 18.9%) for females.
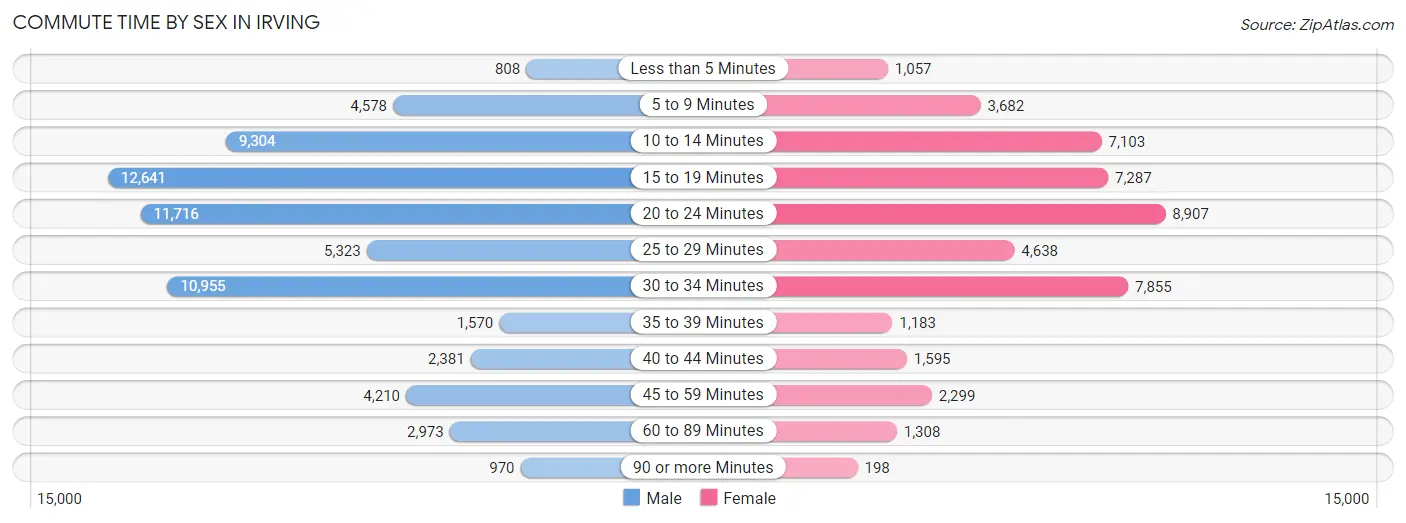
| Commute Time | Male | Female |
| Less than 5 Minutes | 808 (1.2%) | 1,057 (2.2%) |
| 5 to 9 Minutes | 4,578 (6.8%) | 3,682 (7.8%) |
| 10 to 14 Minutes | 9,304 (13.8%) | 7,103 (15.1%) |
| 15 to 19 Minutes | 12,641 (18.8%) | 7,287 (15.5%) |
| 20 to 24 Minutes | 11,716 (17.4%) | 8,907 (18.9%) |
| 25 to 29 Minutes | 5,323 (7.9%) | 4,638 (9.8%) |
| 30 to 34 Minutes | 10,955 (16.3%) | 7,855 (16.7%) |
| 35 to 39 Minutes | 1,570 (2.3%) | 1,183 (2.5%) |
| 40 to 44 Minutes | 2,381 (3.5%) | 1,595 (3.4%) |
| 45 to 59 Minutes | 4,210 (6.2%) | 2,299 (4.9%) |
| 60 to 89 Minutes | 2,973 (4.4%) | 1,308 (2.8%) |
| 90 or more Minutes | 970 (1.4%) | 198 (0.4%) |
Time of Departure to Work by Sex in Irving
The most frequent times of departure to work in Irving are 8:00 AM to 8:29 AM (10,079, 14.9%) for males and 7:00 AM to 7:29 AM (6,647, 14.1%) for females.
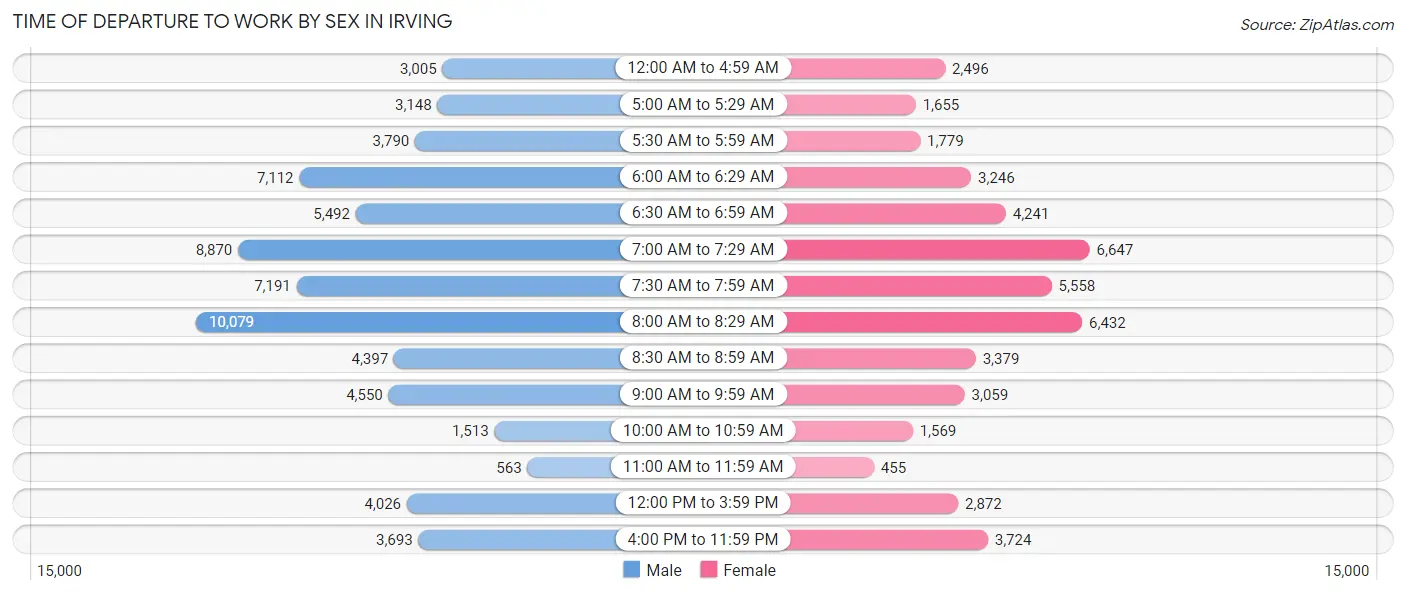
| Time of Departure | Male | Female |
| 12:00 AM to 4:59 AM | 3,005 (4.5%) | 2,496 (5.3%) |
| 5:00 AM to 5:29 AM | 3,148 (4.7%) | 1,655 (3.5%) |
| 5:30 AM to 5:59 AM | 3,790 (5.6%) | 1,779 (3.8%) |
| 6:00 AM to 6:29 AM | 7,112 (10.5%) | 3,246 (6.9%) |
| 6:30 AM to 6:59 AM | 5,492 (8.1%) | 4,241 (9.0%) |
| 7:00 AM to 7:29 AM | 8,870 (13.2%) | 6,647 (14.1%) |
| 7:30 AM to 7:59 AM | 7,191 (10.7%) | 5,558 (11.8%) |
| 8:00 AM to 8:29 AM | 10,079 (14.9%) | 6,432 (13.7%) |
| 8:30 AM to 8:59 AM | 4,397 (6.5%) | 3,379 (7.2%) |
| 9:00 AM to 9:59 AM | 4,550 (6.8%) | 3,059 (6.5%) |
| 10:00 AM to 10:59 AM | 1,513 (2.2%) | 1,569 (3.3%) |
| 11:00 AM to 11:59 AM | 563 (0.8%) | 455 (1.0%) |
| 12:00 PM to 3:59 PM | 4,026 (6.0%) | 2,872 (6.1%) |
| 4:00 PM to 11:59 PM | 3,693 (5.5%) | 3,724 (7.9%) |
| Total | 67,429 (100.0%) | 47,112 (100.0%) |
Housing Occupancy in Irving
Occupancy by Ownership in Irving
Of the total 92,820 dwellings in Irving, owner-occupied units account for 34,488 (37.2%), while renter-occupied units make up 58,332 (62.8%).
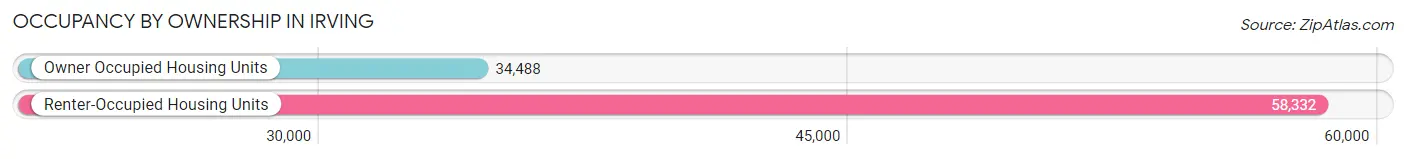
| Occupancy | # Housing Units | % Housing Units |
| Owner Occupied Housing Units | 34,488 | 37.2% |
| Renter-Occupied Housing Units | 58,332 | 62.8% |
| Total Occupied Housing Units | 92,820 | 100.0% |
Occupancy by Household Size in Irving
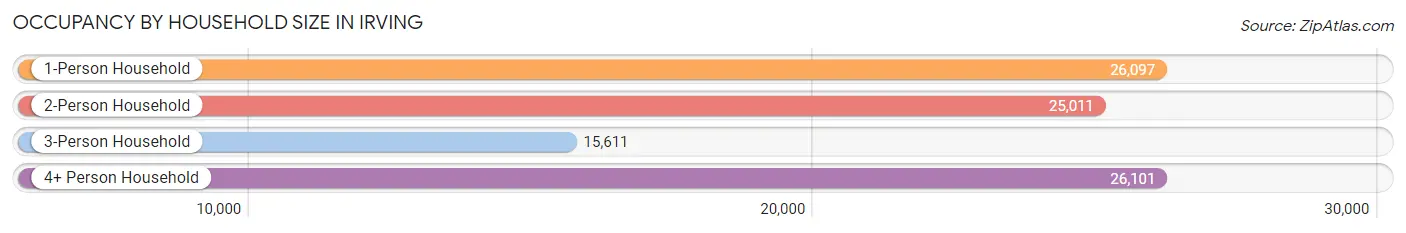
| Household Size | # Housing Units | % Housing Units |
| 1-Person Household | 26,097 | 28.1% |
| 2-Person Household | 25,011 | 27.0% |
| 3-Person Household | 15,611 | 16.8% |
| 4+ Person Household | 26,101 | 28.1% |
| Total Housing Units | 92,820 | 100.0% |
Occupancy by Ownership by Household Size in Irving
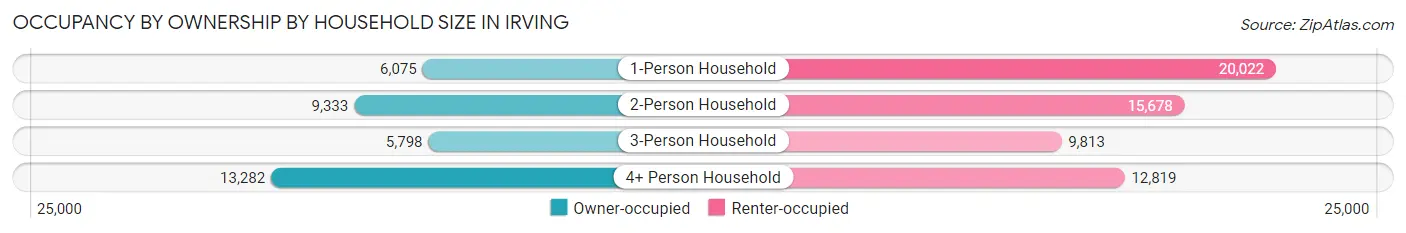
| Household Size | Owner-occupied | Renter-occupied |
| 1-Person Household | 6,075 (23.3%) | 20,022 (76.7%) |
| 2-Person Household | 9,333 (37.3%) | 15,678 (62.7%) |
| 3-Person Household | 5,798 (37.1%) | 9,813 (62.9%) |
| 4+ Person Household | 13,282 (50.9%) | 12,819 (49.1%) |
| Total Housing Units | 34,488 (37.2%) | 58,332 (62.8%) |
Occupancy by Educational Attainment in Irving
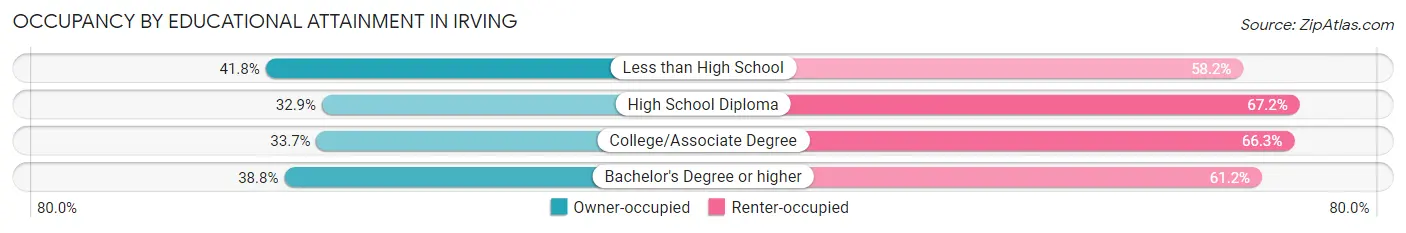
| Household Size | Owner-occupied | Renter-occupied |
| Less than High School | 6,561 (41.8%) | 9,140 (58.2%) |
| High School Diploma | 5,012 (32.9%) | 10,244 (67.1%) |
| College/Associate Degree | 7,285 (33.7%) | 14,317 (66.3%) |
| Bachelor's Degree or higher | 15,630 (38.8%) | 24,631 (61.2%) |
Occupancy by Age of Householder in Irving
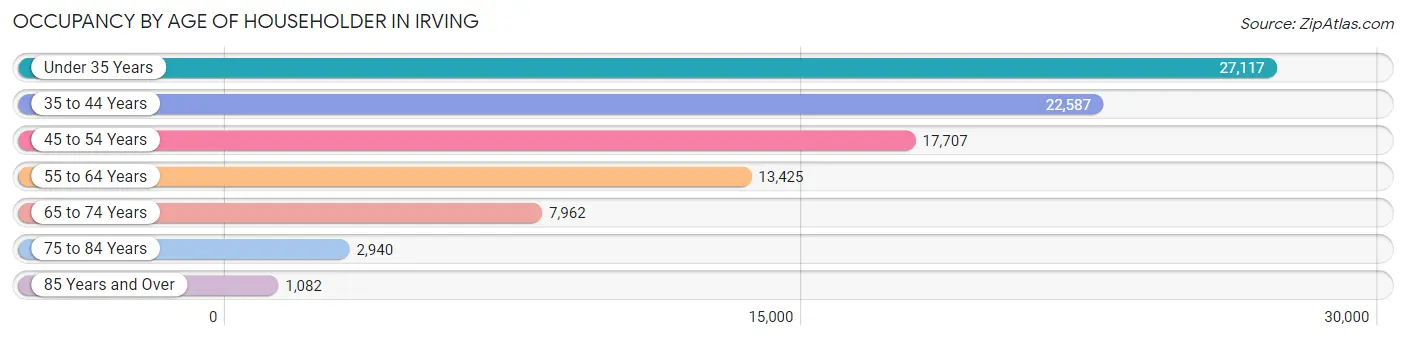
| Age Bracket | # Households | % Households |
| Under 35 Years | 27,117 | 29.2% |
| 35 to 44 Years | 22,587 | 24.3% |
| 45 to 54 Years | 17,707 | 19.1% |
| 55 to 64 Years | 13,425 | 14.5% |
| 65 to 74 Years | 7,962 | 8.6% |
| 75 to 84 Years | 2,940 | 3.2% |
| 85 Years and Over | 1,082 | 1.2% |
| Total | 92,820 | 100.0% |
Housing Finances in Irving
Median Income by Occupancy in Irving
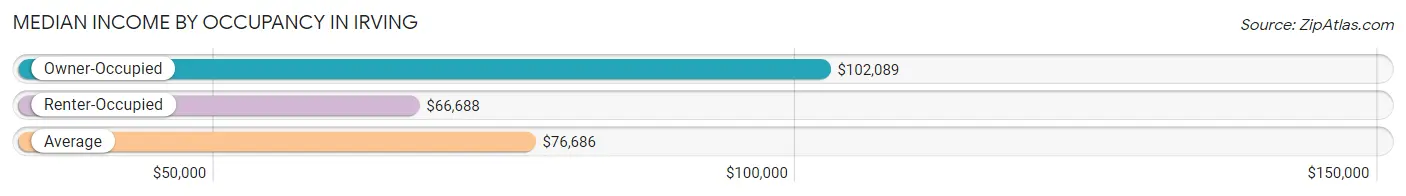
| Occupancy Type | # Households | Median Income |
| Owner-Occupied | 34,488 (37.2%) | $102,089 |
| Renter-Occupied | 58,332 (62.8%) | $66,688 |
| Average | 92,820 (100.0%) | $76,686 |
Occupancy by Householder Income Bracket in Irving
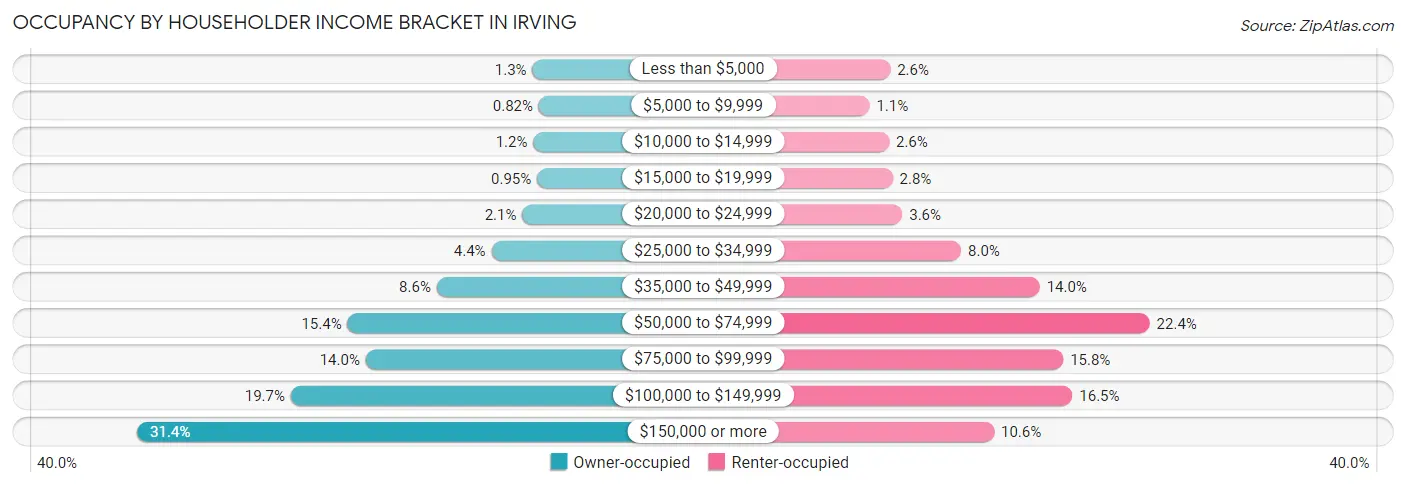
| Income Bracket | Owner-occupied | Renter-occupied |
| Less than $5,000 | 452 (1.3%) | 1,541 (2.6%) |
| $5,000 to $9,999 | 283 (0.8%) | 616 (1.1%) |
| $10,000 to $14,999 | 429 (1.2%) | 1,490 (2.5%) |
| $15,000 to $19,999 | 328 (0.9%) | 1,647 (2.8%) |
| $20,000 to $24,999 | 718 (2.1%) | 2,078 (3.6%) |
| $25,000 to $34,999 | 1,527 (4.4%) | 4,687 (8.0%) |
| $35,000 to $49,999 | 2,965 (8.6%) | 8,186 (14.0%) |
| $50,000 to $74,999 | 5,312 (15.4%) | 13,073 (22.4%) |
| $75,000 to $99,999 | 4,833 (14.0%) | 9,227 (15.8%) |
| $100,000 to $149,999 | 6,802 (19.7%) | 9,635 (16.5%) |
| $150,000 or more | 10,839 (31.4%) | 6,152 (10.5%) |
| Total | 34,488 (100.0%) | 58,332 (100.0%) |
Monthly Housing Cost Tiers in Irving
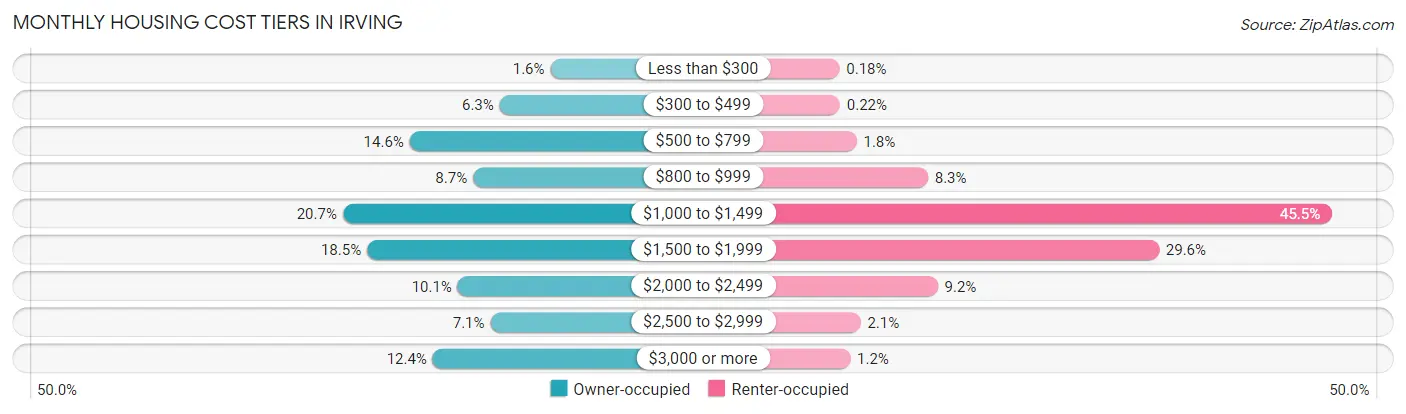
| Monthly Cost | Owner-occupied | Renter-occupied |
| Less than $300 | 551 (1.6%) | 106 (0.2%) |
| $300 to $499 | 2,164 (6.3%) | 129 (0.2%) |
| $500 to $799 | 5,019 (14.5%) | 1,028 (1.8%) |
| $800 to $999 | 3,007 (8.7%) | 4,851 (8.3%) |
| $1,000 to $1,499 | 7,141 (20.7%) | 26,560 (45.5%) |
| $1,500 to $1,999 | 6,372 (18.5%) | 17,260 (29.6%) |
| $2,000 to $2,499 | 3,492 (10.1%) | 5,379 (9.2%) |
| $2,500 to $2,999 | 2,455 (7.1%) | 1,235 (2.1%) |
| $3,000 or more | 4,287 (12.4%) | 680 (1.2%) |
| Total | 34,488 (100.0%) | 58,332 (100.0%) |
Physical Housing Characteristics in Irving
Housing Structures in Irving
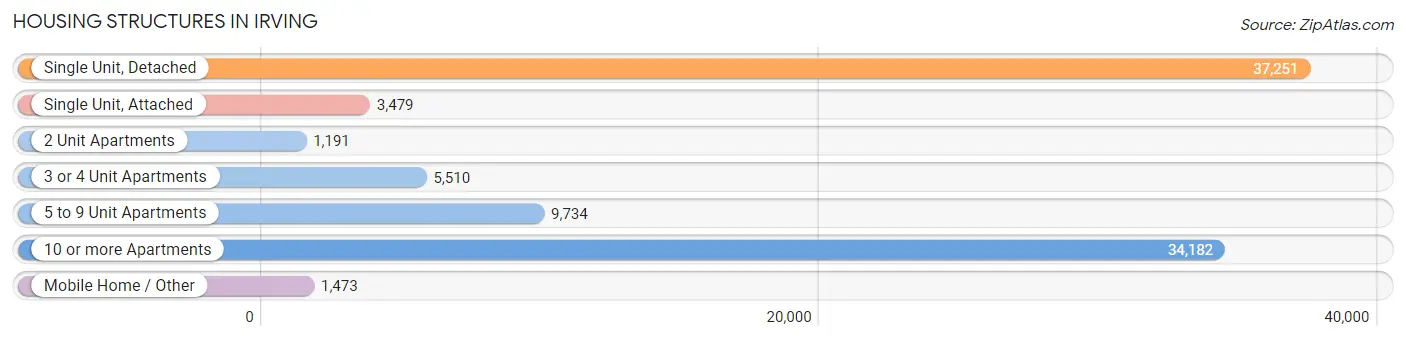
| Structure Type | # Housing Units | % Housing Units |
| Single Unit, Detached | 37,251 | 40.1% |
| Single Unit, Attached | 3,479 | 3.7% |
| 2 Unit Apartments | 1,191 | 1.3% |
| 3 or 4 Unit Apartments | 5,510 | 5.9% |
| 5 to 9 Unit Apartments | 9,734 | 10.5% |
| 10 or more Apartments | 34,182 | 36.8% |
| Mobile Home / Other | 1,473 | 1.6% |
| Total | 92,820 | 100.0% |
Housing Structures by Occupancy in Irving
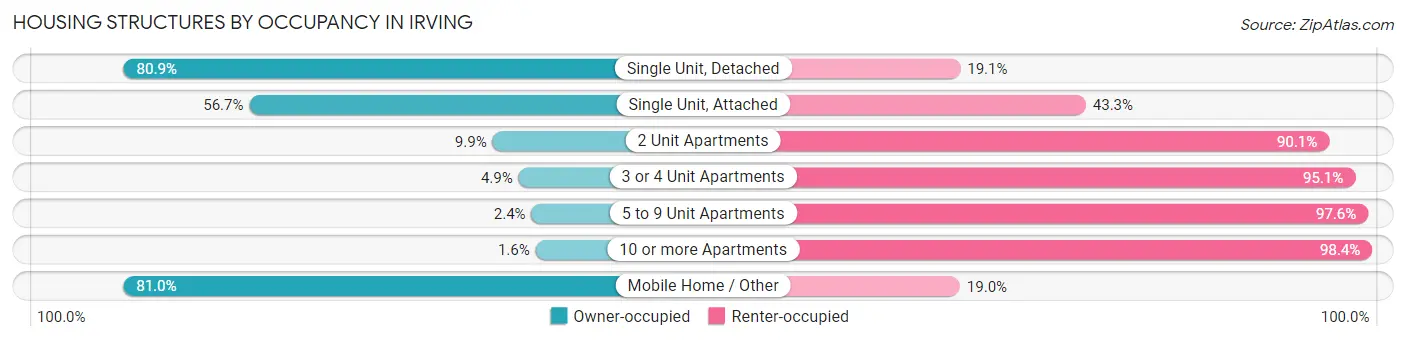
| Structure Type | Owner-occupied | Renter-occupied |
| Single Unit, Detached | 30,144 (80.9%) | 7,107 (19.1%) |
| Single Unit, Attached | 1,974 (56.7%) | 1,505 (43.3%) |
| 2 Unit Apartments | 118 (9.9%) | 1,073 (90.1%) |
| 3 or 4 Unit Apartments | 270 (4.9%) | 5,240 (95.1%) |
| 5 to 9 Unit Apartments | 236 (2.4%) | 9,498 (97.6%) |
| 10 or more Apartments | 553 (1.6%) | 33,629 (98.4%) |
| Mobile Home / Other | 1,193 (81.0%) | 280 (19.0%) |
| Total | 34,488 (37.2%) | 58,332 (62.8%) |
Housing Structures by Number of Rooms in Irving
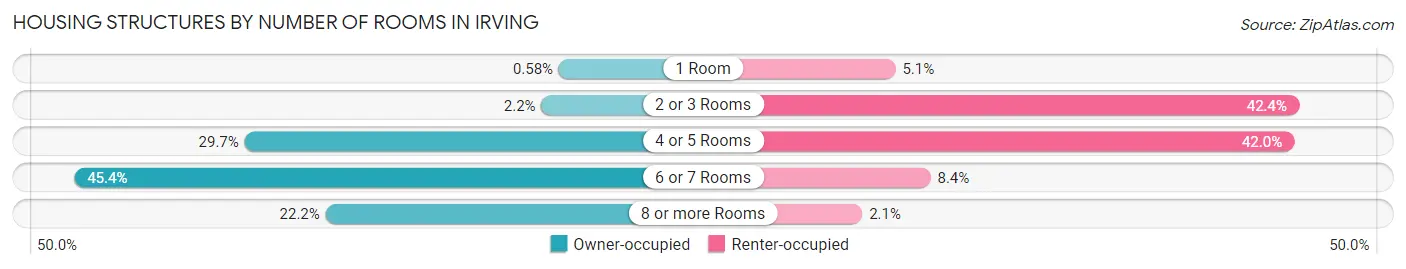
| Number of Rooms | Owner-occupied | Renter-occupied |
| 1 Room | 200 (0.6%) | 2,996 (5.1%) |
| 2 or 3 Rooms | 759 (2.2%) | 24,754 (42.4%) |
| 4 or 5 Rooms | 10,226 (29.6%) | 24,491 (42.0%) |
| 6 or 7 Rooms | 15,660 (45.4%) | 4,888 (8.4%) |
| 8 or more Rooms | 7,643 (22.2%) | 1,203 (2.1%) |
| Total | 34,488 (100.0%) | 58,332 (100.0%) |
Housing Structure by Heating Type in Irving
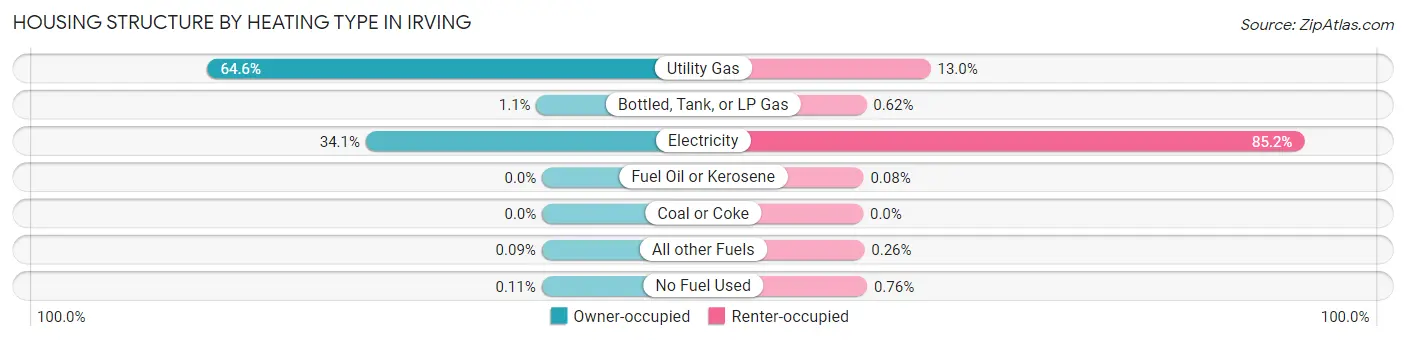
| Heating Type | Owner-occupied | Renter-occupied |
| Utility Gas | 22,288 (64.6%) | 7,607 (13.0%) |
| Bottled, Tank, or LP Gas | 380 (1.1%) | 364 (0.6%) |
| Electricity | 11,751 (34.1%) | 49,719 (85.2%) |
| Fuel Oil or Kerosene | 0 (0.0%) | 47 (0.1%) |
| Coal or Coke | 0 (0.0%) | 0 (0.0%) |
| All other Fuels | 30 (0.1%) | 150 (0.3%) |
| No Fuel Used | 39 (0.1%) | 445 (0.8%) |
| Total | 34,488 (100.0%) | 58,332 (100.0%) |
Household Vehicle Usage in Irving
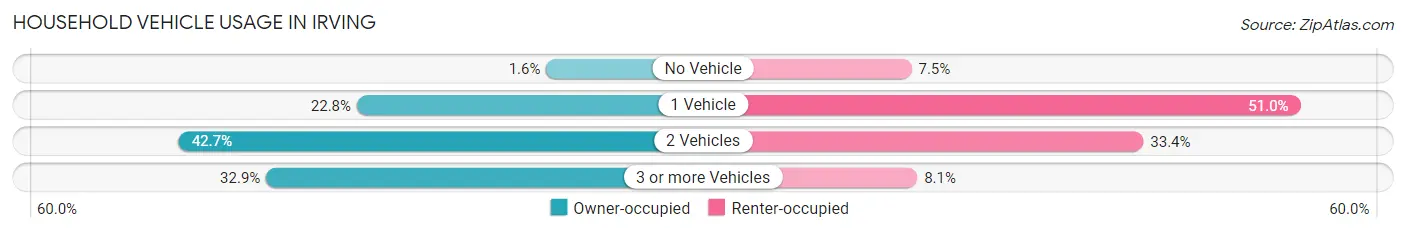
| Vehicles per Household | Owner-occupied | Renter-occupied |
| No Vehicle | 539 (1.6%) | 4,350 (7.5%) |
| 1 Vehicle | 7,855 (22.8%) | 29,762 (51.0%) |
| 2 Vehicles | 14,735 (42.7%) | 19,498 (33.4%) |
| 3 or more Vehicles | 11,359 (32.9%) | 4,722 (8.1%) |
| Total | 34,488 (100.0%) | 58,332 (100.0%) |
Real Estate & Mortgages in Irving
Real Estate and Mortgage Overview in Irving
| Characteristic | Without Mortgage | With Mortgage |
| Housing Units | 14,073 | 20,415 |
| Median Property Value | $233,400 | $278,000 |
| Median Household Income | $91,439 | $7,072 |
| Monthly Housing Costs | $760 | $4,164 |
| Real Estate Taxes | $3,470 | $489 |
Property Value by Mortgage Status in Irving
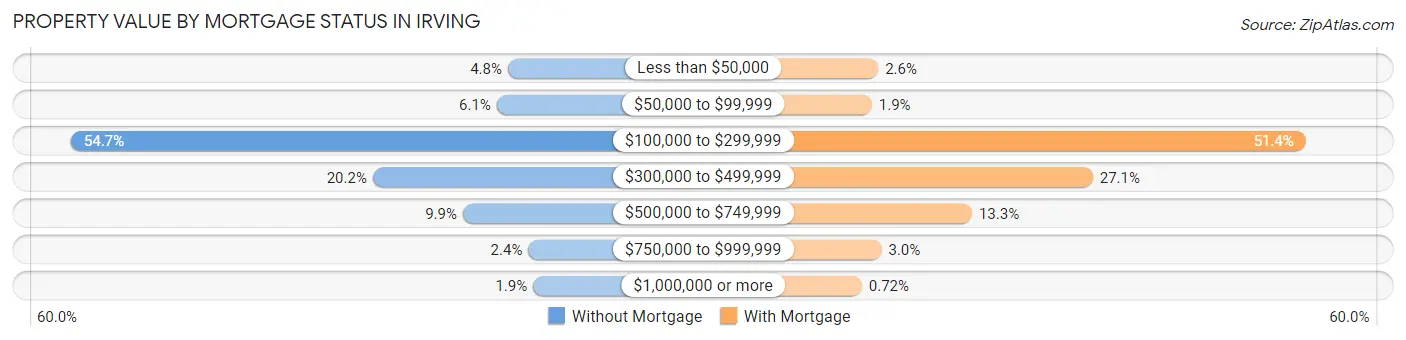
| Property Value | Without Mortgage | With Mortgage |
| Less than $50,000 | 672 (4.8%) | 529 (2.6%) |
| $50,000 to $99,999 | 852 (6.0%) | 379 (1.9%) |
| $100,000 to $299,999 | 7,699 (54.7%) | 10,501 (51.4%) |
| $300,000 to $499,999 | 2,844 (20.2%) | 5,534 (27.1%) |
| $500,000 to $749,999 | 1,396 (9.9%) | 2,717 (13.3%) |
| $750,000 to $999,999 | 344 (2.4%) | 607 (3.0%) |
| $1,000,000 or more | 266 (1.9%) | 148 (0.7%) |
| Total | 14,073 (100.0%) | 20,415 (100.0%) |
Household Income by Mortgage Status in Irving
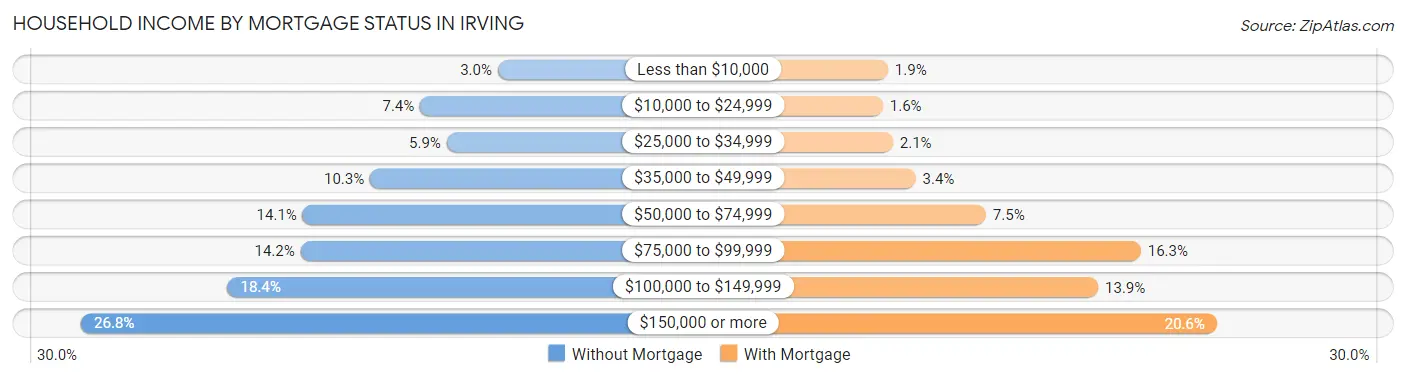
| Household Income | Without Mortgage | With Mortgage |
| Less than $10,000 | 417 (3.0%) | 378 (1.8%) |
| $10,000 to $24,999 | 1,041 (7.4%) | 318 (1.6%) |
| $25,000 to $34,999 | 827 (5.9%) | 434 (2.1%) |
| $35,000 to $49,999 | 1,444 (10.3%) | 700 (3.4%) |
| $50,000 to $74,999 | 1,985 (14.1%) | 1,521 (7.4%) |
| $75,000 to $99,999 | 2,003 (14.2%) | 3,327 (16.3%) |
| $100,000 to $149,999 | 2,589 (18.4%) | 2,830 (13.9%) |
| $150,000 or more | 3,767 (26.8%) | 4,213 (20.6%) |
| Total | 14,073 (100.0%) | 20,415 (100.0%) |
Property Value to Household Income Ratio in Irving
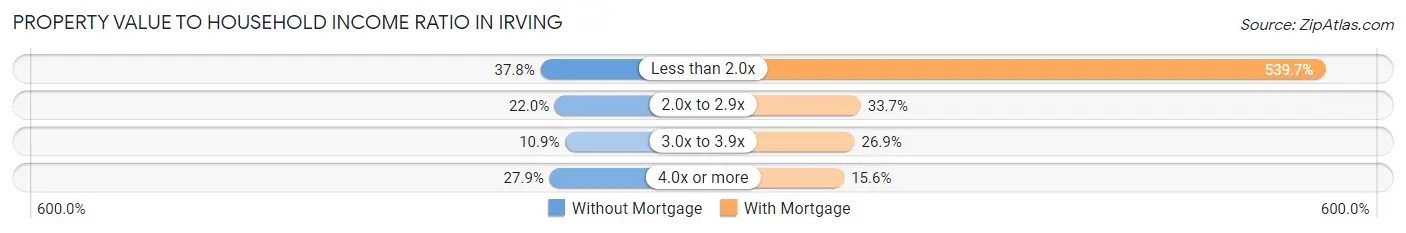
| Value-to-Income Ratio | Without Mortgage | With Mortgage |
| Less than 2.0x | 5,314 (37.8%) | 110,184 (539.7%) |
| 2.0x to 2.9x | 3,097 (22.0%) | 6,872 (33.7%) |
| 3.0x to 3.9x | 1,533 (10.9%) | 5,485 (26.9%) |
| 4.0x or more | 3,922 (27.9%) | 3,186 (15.6%) |
| Total | 14,073 (100.0%) | 20,415 (100.0%) |
Real Estate Taxes by Mortgage Status in Irving
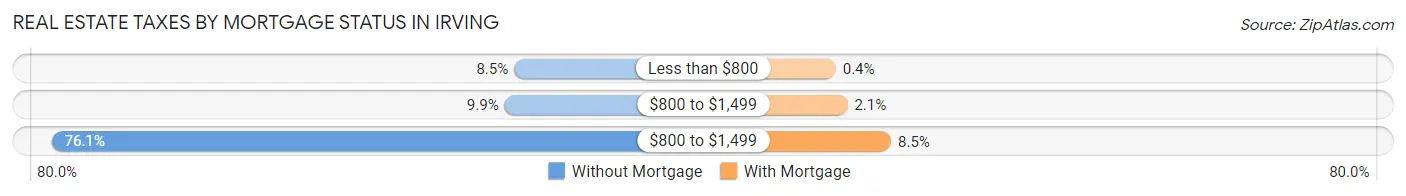
| Property Taxes | Without Mortgage | With Mortgage |
| Less than $800 | 1,194 (8.5%) | 81 (0.4%) |
| $800 to $1,499 | 1,390 (9.9%) | 430 (2.1%) |
| $800 to $1,499 | 10,703 (76.0%) | 1,731 (8.5%) |
| Total | 14,073 (100.0%) | 20,415 (100.0%) |
Health & Disability in Irving
Health Insurance Coverage by Age in Irving
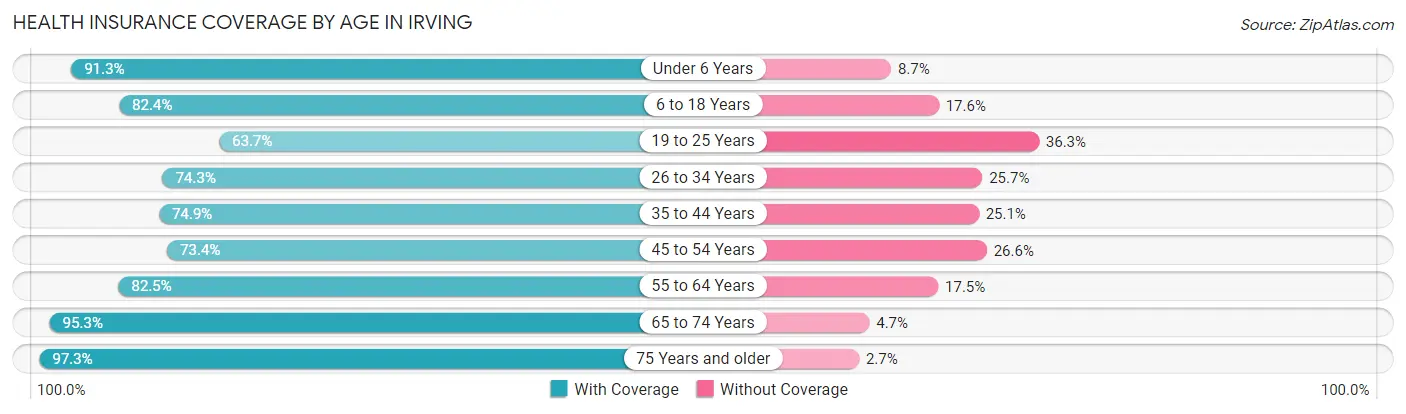
| Age Bracket | With Coverage | Without Coverage |
| Under 6 Years | 22,402 (91.3%) | 2,136 (8.7%) |
| 6 to 18 Years | 37,706 (82.4%) | 8,062 (17.6%) |
| 19 to 25 Years | 15,729 (63.7%) | 8,954 (36.3%) |
| 26 to 34 Years | 32,649 (74.3%) | 11,304 (25.7%) |
| 35 to 44 Years | 30,220 (74.9%) | 10,107 (25.1%) |
| 45 to 54 Years | 22,892 (73.4%) | 8,280 (26.6%) |
| 55 to 64 Years | 18,874 (82.5%) | 4,002 (17.5%) |
| 65 to 74 Years | 13,065 (95.3%) | 639 (4.7%) |
| 75 Years and older | 6,986 (97.3%) | 197 (2.7%) |
| Total | 200,523 (78.9%) | 53,681 (21.1%) |
Health Insurance Coverage by Citizenship Status in Irving
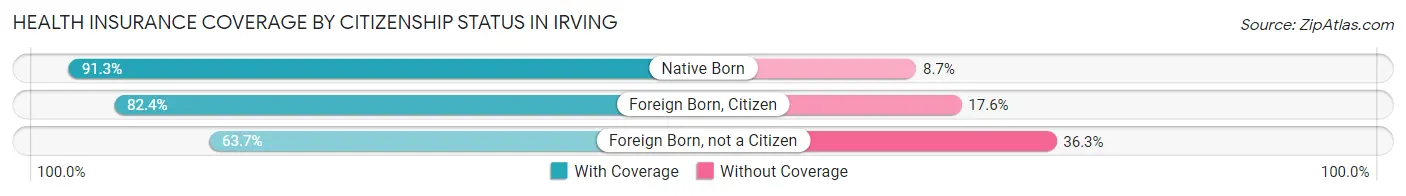
| Citizenship Status | With Coverage | Without Coverage |
| Native Born | 22,402 (91.3%) | 2,136 (8.7%) |
| Foreign Born, Citizen | 37,706 (82.4%) | 8,062 (17.6%) |
| Foreign Born, not a Citizen | 15,729 (63.7%) | 8,954 (36.3%) |
Health Insurance Coverage by Household Income in Irving
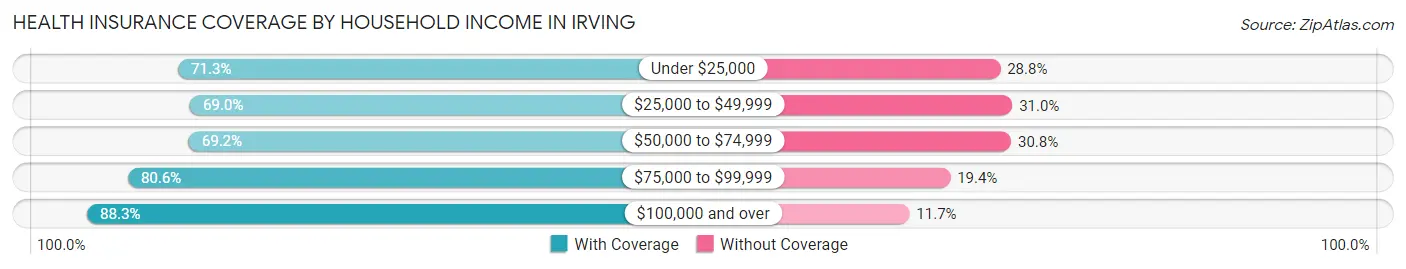
| Household Income | With Coverage | Without Coverage |
| Under $25,000 | 13,770 (71.3%) | 5,556 (28.7%) |
| $25,000 to $49,999 | 30,597 (69.0%) | 13,738 (31.0%) |
| $50,000 to $74,999 | 33,057 (69.2%) | 14,697 (30.8%) |
| $75,000 to $99,999 | 31,839 (80.6%) | 7,649 (19.4%) |
| $100,000 and over | 90,339 (88.3%) | 12,008 (11.7%) |
Public vs Private Health Insurance Coverage by Age in Irving
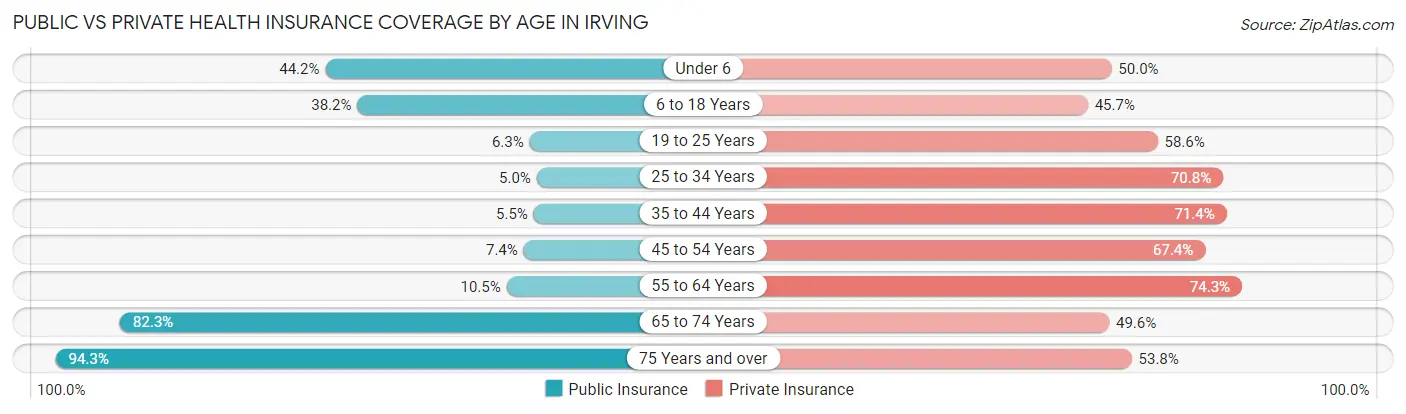
| Age Bracket | Public Insurance | Private Insurance |
| Under 6 | 10,840 (44.2%) | 12,280 (50.0%) |
| 6 to 18 Years | 17,503 (38.2%) | 20,895 (45.7%) |
| 19 to 25 Years | 1,549 (6.3%) | 14,464 (58.6%) |
| 25 to 34 Years | 2,176 (5.0%) | 31,097 (70.8%) |
| 35 to 44 Years | 2,221 (5.5%) | 28,793 (71.4%) |
| 45 to 54 Years | 2,301 (7.4%) | 21,019 (67.4%) |
| 55 to 64 Years | 2,410 (10.5%) | 16,990 (74.3%) |
| 65 to 74 Years | 11,278 (82.3%) | 6,797 (49.6%) |
| 75 Years and over | 6,770 (94.3%) | 3,864 (53.8%) |
| Total | 57,048 (22.4%) | 156,199 (61.5%) |
Disability Status by Sex by Age in Irving
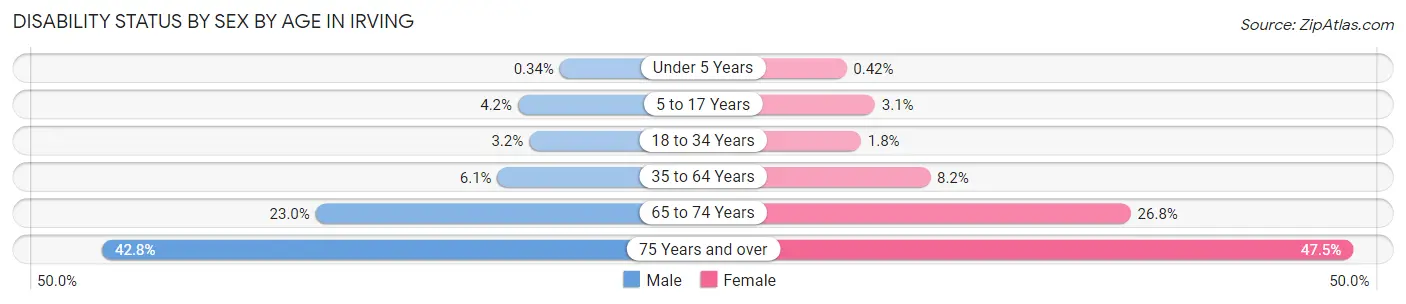
| Age Bracket | Male | Female |
| Under 5 Years | 37 (0.3%) | 43 (0.4%) |
| 5 to 17 Years | 999 (4.2%) | 687 (3.1%) |
| 18 to 34 Years | 1,149 (3.2%) | 631 (1.8%) |
| 35 to 64 Years | 3,010 (6.1%) | 3,702 (8.2%) |
| 65 to 74 Years | 1,536 (23.0%) | 1,883 (26.8%) |
| 75 Years and over | 1,230 (42.8%) | 2,045 (47.4%) |
Disability Class by Sex by Age in Irving
Disability Class: Hearing Difficulty
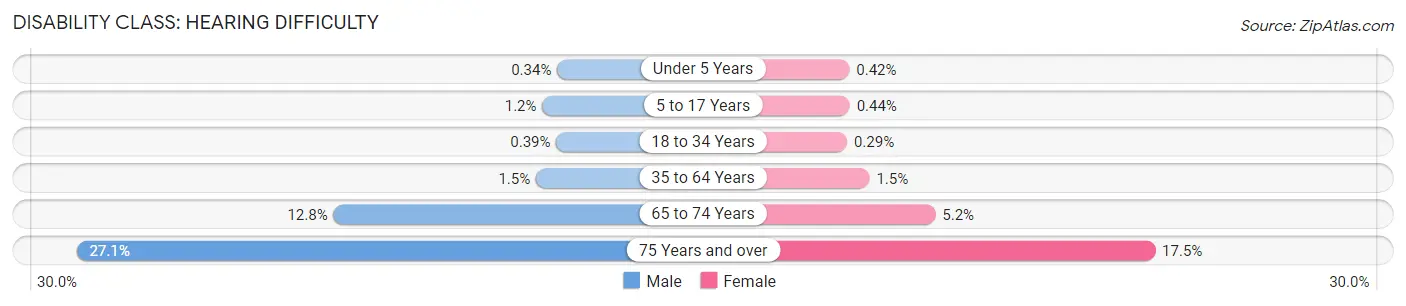
| Age Bracket | Male | Female |
| Under 5 Years | 37 (0.3%) | 43 (0.4%) |
| 5 to 17 Years | 278 (1.2%) | 98 (0.4%) |
| 18 to 34 Years | 139 (0.4%) | 103 (0.3%) |
| 35 to 64 Years | 748 (1.5%) | 698 (1.5%) |
| 65 to 74 Years | 855 (12.8%) | 366 (5.2%) |
| 75 Years and over | 779 (27.1%) | 752 (17.4%) |
Disability Class: Vision Difficulty
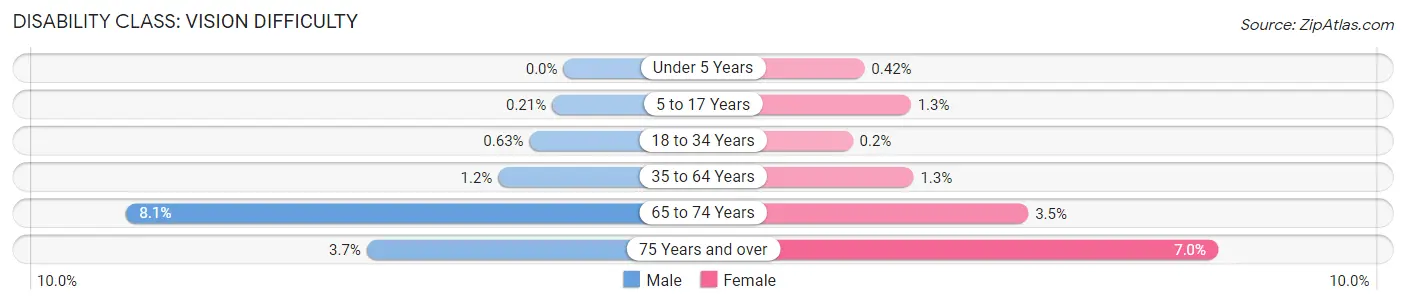
| Age Bracket | Male | Female |
| Under 5 Years | 0 (0.0%) | 43 (0.4%) |
| 5 to 17 Years | 49 (0.2%) | 286 (1.3%) |
| 18 to 34 Years | 226 (0.6%) | 72 (0.2%) |
| 35 to 64 Years | 597 (1.2%) | 601 (1.3%) |
| 65 to 74 Years | 542 (8.1%) | 243 (3.5%) |
| 75 Years and over | 105 (3.6%) | 301 (7.0%) |
Disability Class: Cognitive Difficulty
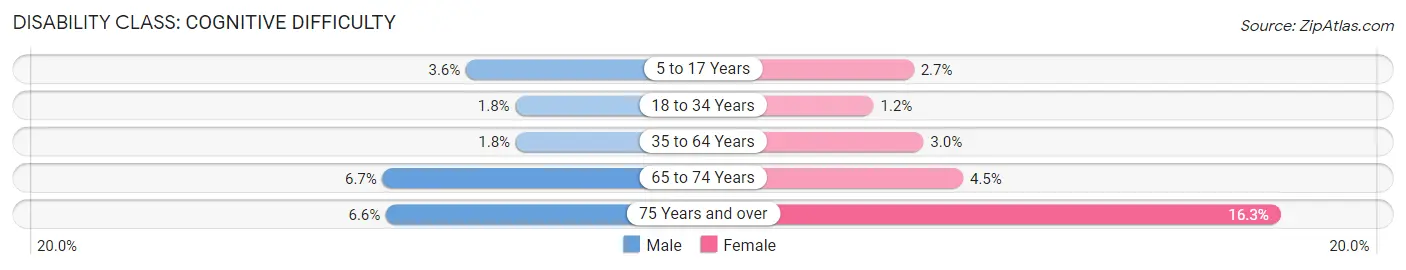
| Age Bracket | Male | Female |
| 5 to 17 Years | 855 (3.6%) | 596 (2.7%) |
| 18 to 34 Years | 641 (1.8%) | 419 (1.2%) |
| 35 to 64 Years | 866 (1.8%) | 1,371 (3.0%) |
| 65 to 74 Years | 448 (6.7%) | 316 (4.5%) |
| 75 Years and over | 189 (6.6%) | 702 (16.3%) |
Disability Class: Ambulatory Difficulty
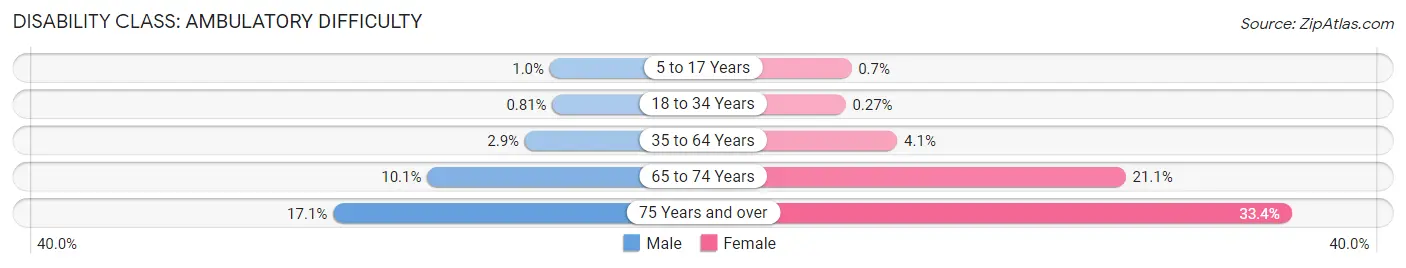
| Age Bracket | Male | Female |
| 5 to 17 Years | 236 (1.0%) | 156 (0.7%) |
| 18 to 34 Years | 293 (0.8%) | 95 (0.3%) |
| 35 to 64 Years | 1,400 (2.9%) | 1,859 (4.1%) |
| 65 to 74 Years | 675 (10.1%) | 1,480 (21.1%) |
| 75 Years and over | 491 (17.1%) | 1,439 (33.4%) |
Disability Class: Self-Care Difficulty
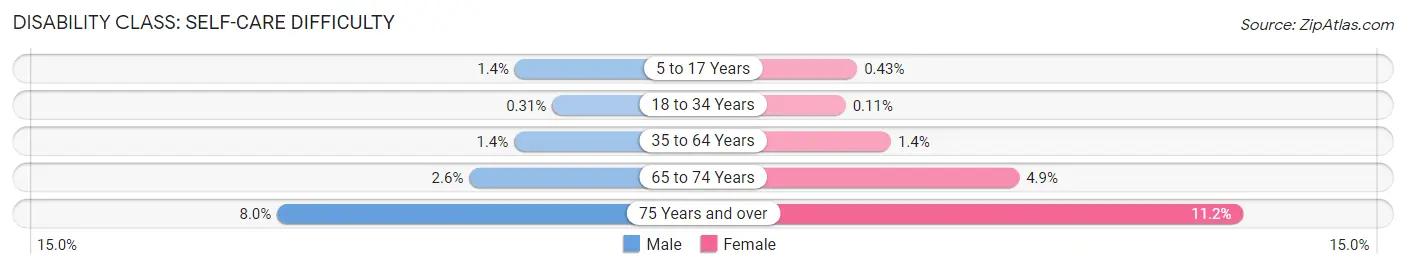
| Age Bracket | Male | Female |
| 5 to 17 Years | 320 (1.3%) | 96 (0.4%) |
| 18 to 34 Years | 111 (0.3%) | 40 (0.1%) |
| 35 to 64 Years | 675 (1.4%) | 621 (1.4%) |
| 65 to 74 Years | 175 (2.6%) | 347 (4.9%) |
| 75 Years and over | 229 (8.0%) | 482 (11.2%) |
Technology Access in Irving
Computing Device Access in Irving
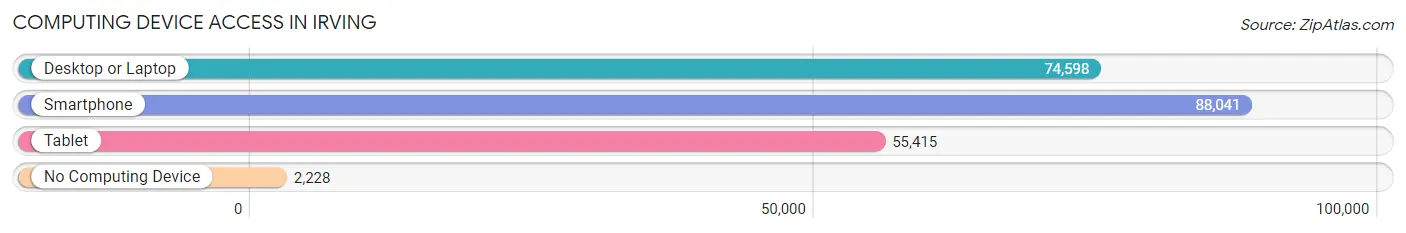
| Device Type | # Households | % Households |
| Desktop or Laptop | 74,598 | 80.4% |
| Smartphone | 88,041 | 94.9% |
| Tablet | 55,415 | 59.7% |
| No Computing Device | 2,228 | 2.4% |
| Total | 92,820 | 100.0% |
Internet Access in Irving
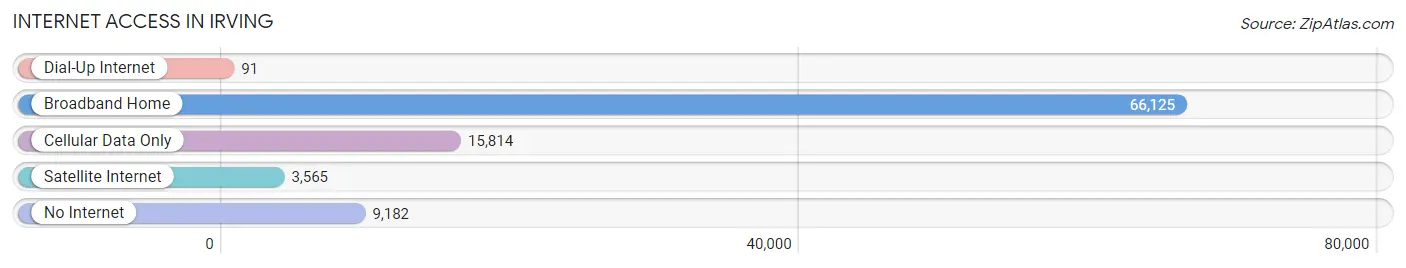
| Internet Type | # Households | % Households |
| Dial-Up Internet | 91 | 0.1% |
| Broadband Home | 66,125 | 71.2% |
| Cellular Data Only | 15,814 | 17.0% |
| Satellite Internet | 3,565 | 3.8% |
| No Internet | 9,182 | 9.9% |
| Total | 92,820 | 100.0% |
Irving Summary
Irving, Texas is a city located in Dallas County, Texas, United States. It is part of the Dallas-Fort Worth-Arlington metropolitan area. The city is situated in the center of the Dallas-Fort Worth Metroplex, and is bordered by the cities of Dallas, Grand Prairie, and Coppell. Irving is home to the University of Dallas, the Dallas Cowboys headquarters, and the Las Colinas business district.
History
The area that is now Irving was originally inhabited by the Caddo Indians. In 1841, the Republic of Texas granted a land patent to John Neely Bryan, who established a trading post near the site of present-day Irving. The area was named after Washington Irving, the author of The Legend of Sleepy Hollow.
In 1903, J.O. Schulze and Otis Brown established the first permanent settlement in the area, which was named Irvington. The town was incorporated in 1914, and the name was changed to Irving.
Geography
Irving is located in Dallas County, Texas, at the intersection of State Highway 183 and Loop 12. The city covers an area of 67.7 square miles, and has an elevation of 590 feet. The city is situated in the center of the Dallas-Fort Worth Metroplex, and is bordered by the cities of Dallas, Grand Prairie, and Coppell.
Climate
Irving has a humid subtropical climate, with hot, humid summers and mild winters. The average annual temperature is 68°F, and the average annual precipitation is 37.5 inches.
Economy
Irving is home to several major corporations, including ExxonMobil, Kimberly-Clark, and Fluor Corporation. The city is also home to the University of Dallas, the Dallas Cowboys headquarters, and the Las Colinas business district.
Demographics
As of the 2010 census, Irving had a population of 216,290. The racial makeup of the city was 57.2% White, 18.2% African American, 0.5% Native American, 11.9% Asian, 0.1% Pacific Islander, 8.9% from other races, and 3.2% from two or more races. Hispanic or Latino of any race were 24.2% of the population.
The median household income in Irving was $50,845, and the median family income was $60,845. The per capita income was $27,845. About 11.2% of families and 14.2% of the population were below the poverty line.
Common Questions
What is Per Capita Income in Irving?
Per Capita income in Irving is $37,211.
What is the Median Family Income in Irving?
Median Family Income in Irving is $86,435.
What is the Median Household income in Irving?
Median Household Income in Irving is $76,686.
What is Income or Wage Gap in Irving?
Income or Wage Gap in Irving is 29.9%.
Women in Irving earn 70.1 cents for every dollar earned by a man.
What is Family Income Deficit in Irving?
Family Income Deficit in Irving is $10,020.
Families that are below poverty line in Irving earn $10,020 less on average than the poverty threshold level.
What is Inequality or Gini Index in Irving?
Inequality or Gini Index in Irving is 0.43.
What is the Total Population of Irving?
Total Population of Irving is 254,962.
What is the Total Male Population of Irving?
Total Male Population of Irving is 129,913.
What is the Total Female Population of Irving?
Total Female Population of Irving is 125,049.
What is the Ratio of Males per 100 Females in Irving?
There are 103.89 Males per 100 Females in Irving.
What is the Ratio of Females per 100 Males in Irving?
There are 96.26 Females per 100 Males in Irving.
What is the Median Population Age in Irving?
Median Population Age in Irving is 32.4 Years.
What is the Average Family Size in Irving
Average Family Size in Irving is 3.4 People.
What is the Average Household Size in Irving
Average Household Size in Irving is 2.7 People.
How Large is the Labor Force in Irving?
There are 141,886 People in the Labor Forcein in Irving.
What is the Percentage of People in the Labor Force in Irving?
72.8% of People are in the Labor Force in Irving.
What is the Unemployment Rate in Irving?
Unemployment Rate in Irving is 4.1%.