Corpus Christi, TX Map & Demographics
Corpus Christi Map
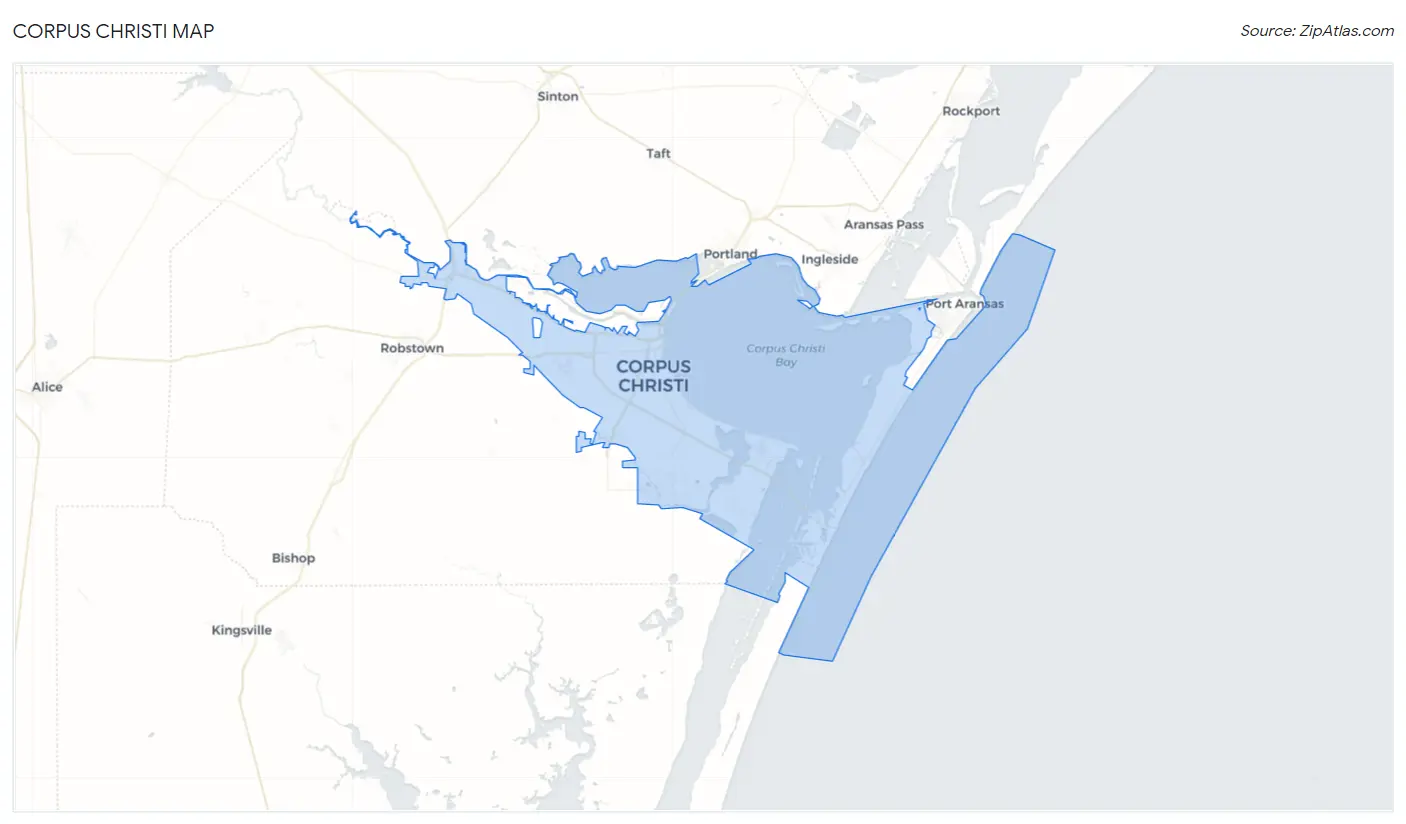
Corpus Christi Overview
$32,395
PER CAPITA INCOME
$78,428
AVG FAMILY INCOME
$64,449
AVG HOUSEHOLD INCOME
31.2%
WAGE / INCOME GAP [ % ]
68.8¢/ $1
WAGE / INCOME GAP [ $ ]
$11,399
FAMILY INCOME DEFICIT
0.46
INEQUALITY / GINI INDEX
317,804
TOTAL POPULATION
158,708
MALE POPULATION
159,096
FEMALE POPULATION
99.76
MALES / 100 FEMALES
100.24
FEMALES / 100 MALES
35.7
MEDIAN AGE
3.2
AVG FAMILY SIZE
2.6
AVG HOUSEHOLD SIZE
157,284
LABOR FORCE [ PEOPLE ]
62.8%
PERCENT IN LABOR FORCE
5.6%
UNEMPLOYMENT RATE
Corpus Christi Zip Codes
Corpus Christi Area Codes
Income in Corpus Christi
Income Overview in Corpus Christi
Per Capita Income in Corpus Christi is $32,395, while median incomes of families and households are $78,428 and $64,449 respectively.
| Characteristic | Number | Measure |
| Per Capita Income | 317,804 | $32,395 |
| Median Family Income | 79,055 | $78,428 |
| Mean Family Income | 79,055 | $98,074 |
| Median Household Income | 117,555 | $64,449 |
| Mean Household Income | 117,555 | $85,356 |
| Income Deficit | 79,055 | $11,399 |
| Wage / Income Gap (%) | 317,804 | 31.21% |
| Wage / Income Gap ($) | 317,804 | 68.79¢ per $1 |
| Gini / Inequality Index | 317,804 | 0.46 |
Earnings by Sex in Corpus Christi
Average Earnings in Corpus Christi are $38,447, $45,556 for men and $31,340 for women, a difference of 31.2%.
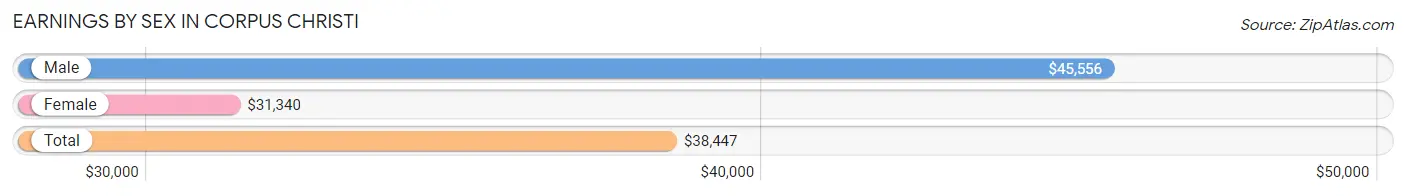
| Sex | Number | Average Earnings |
| Male | 87,603 (54.3%) | $45,556 |
| Female | 73,683 (45.7%) | $31,340 |
| Total | 161,286 (100.0%) | $38,447 |
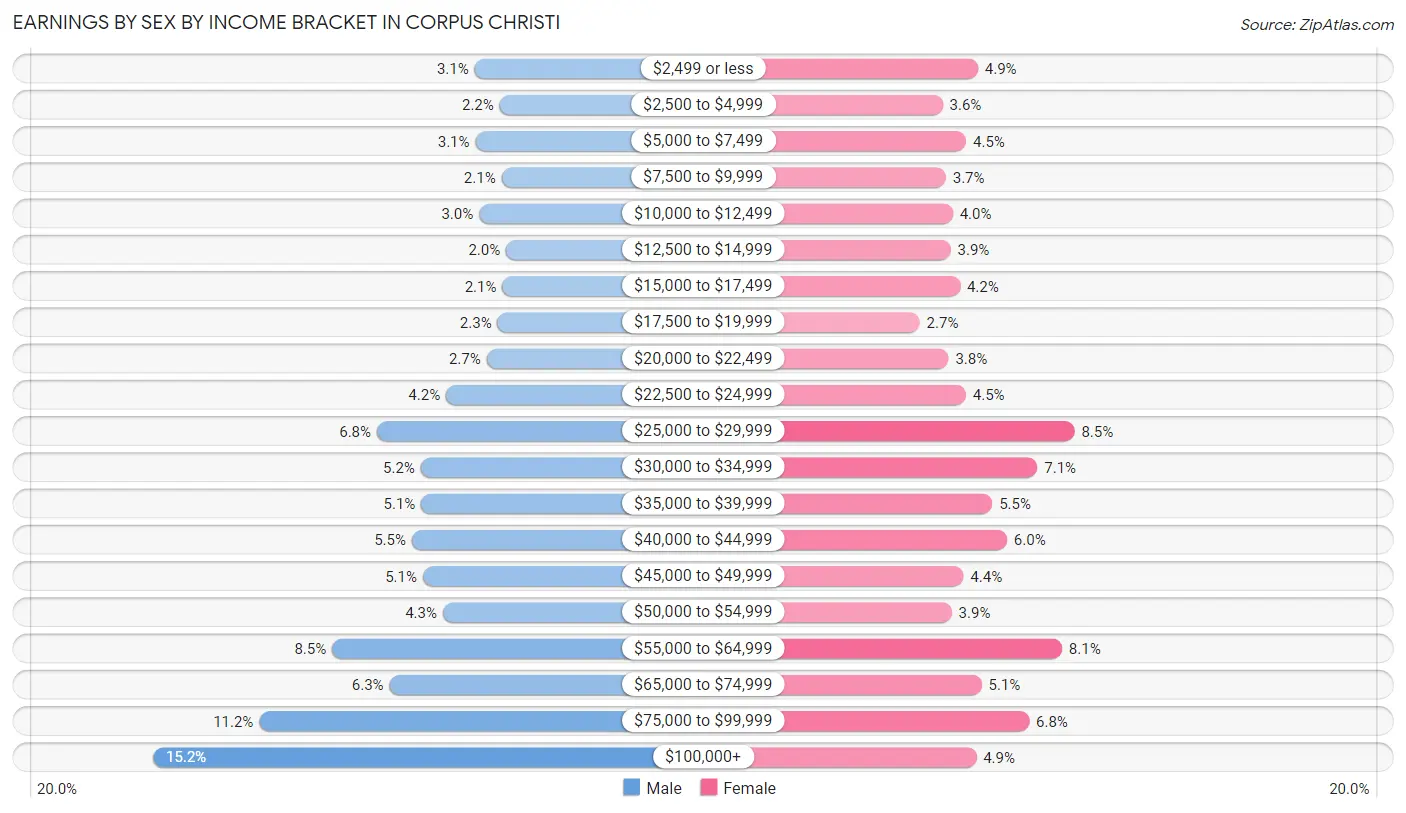
Earnings by Sex by Income Bracket in Corpus Christi
The most common earnings brackets in Corpus Christi are $100,000+ for men (13,310 | 15.2%) and $25,000 to $29,999 for women (6,287 | 8.5%).
| Income | Male | Female |
| $2,499 or less | 2,750 (3.1%) | 3,617 (4.9%) |
| $2,500 to $4,999 | 1,928 (2.2%) | 2,644 (3.6%) |
| $5,000 to $7,499 | 2,722 (3.1%) | 3,295 (4.5%) |
| $7,500 to $9,999 | 1,862 (2.1%) | 2,731 (3.7%) |
| $10,000 to $12,499 | 2,605 (3.0%) | 2,927 (4.0%) |
| $12,500 to $14,999 | 1,718 (2.0%) | 2,869 (3.9%) |
| $15,000 to $17,499 | 1,844 (2.1%) | 3,124 (4.2%) |
| $17,500 to $19,999 | 1,994 (2.3%) | 2,011 (2.7%) |
| $20,000 to $22,499 | 2,354 (2.7%) | 2,808 (3.8%) |
| $22,500 to $24,999 | 3,688 (4.2%) | 3,287 (4.5%) |
| $25,000 to $29,999 | 5,957 (6.8%) | 6,287 (8.5%) |
| $30,000 to $34,999 | 4,518 (5.2%) | 5,260 (7.1%) |
| $35,000 to $39,999 | 4,502 (5.1%) | 4,018 (5.4%) |
| $40,000 to $44,999 | 4,812 (5.5%) | 4,418 (6.0%) |
| $45,000 to $49,999 | 4,451 (5.1%) | 3,220 (4.4%) |
| $50,000 to $54,999 | 3,791 (4.3%) | 2,899 (3.9%) |
| $55,000 to $64,999 | 7,429 (8.5%) | 5,941 (8.1%) |
| $65,000 to $74,999 | 5,546 (6.3%) | 3,719 (5.1%) |
| $75,000 to $99,999 | 9,822 (11.2%) | 5,031 (6.8%) |
| $100,000+ | 13,310 (15.2%) | 3,577 (4.9%) |
| Total | 87,603 (100.0%) | 73,683 (100.0%) |
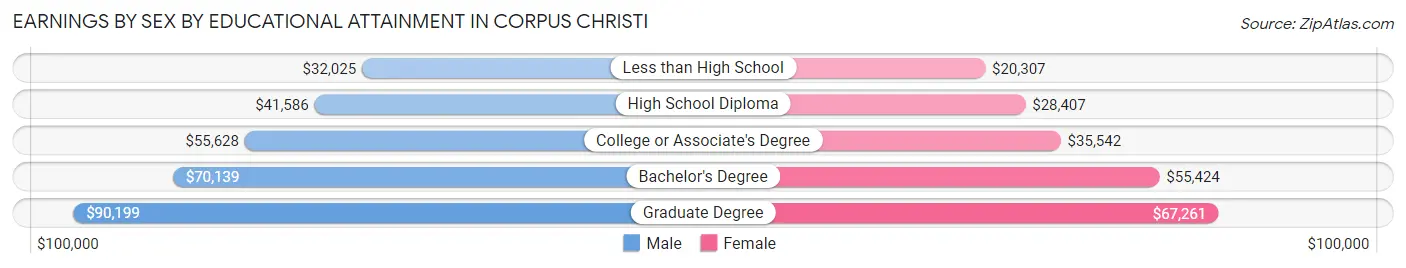
Earnings by Sex by Educational Attainment in Corpus Christi
Average earnings in Corpus Christi are $51,363 for men and $36,126 for women, a difference of 29.7%. Men with an educational attainment of graduate degree enjoy the highest average annual earnings of $90,199, while those with less than high school education earn the least with $32,025. Women with an educational attainment of graduate degree earn the most with the average annual earnings of $67,261, while those with less than high school education have the smallest earnings of $20,307.
| Educational Attainment | Male Income | Female Income |
| Less than High School | $32,025 | $20,307 |
| High School Diploma | $41,586 | $28,407 |
| College or Associate's Degree | $55,628 | $35,542 |
| Bachelor's Degree | $70,139 | $55,424 |
| Graduate Degree | $90,199 | $67,261 |
| Total | $51,363 | $36,126 |
Family Income in Corpus Christi
Family Income Brackets in Corpus Christi
According to the Corpus Christi family income data, there are 16,048 families falling into the $100,000 to $149,999 income range, which is the most common income bracket and makes up 20.3% of all families. Conversely, the $10,000 to $14,999 income bracket is the least frequent group with only 2,055 families (2.6%) belonging to this category.
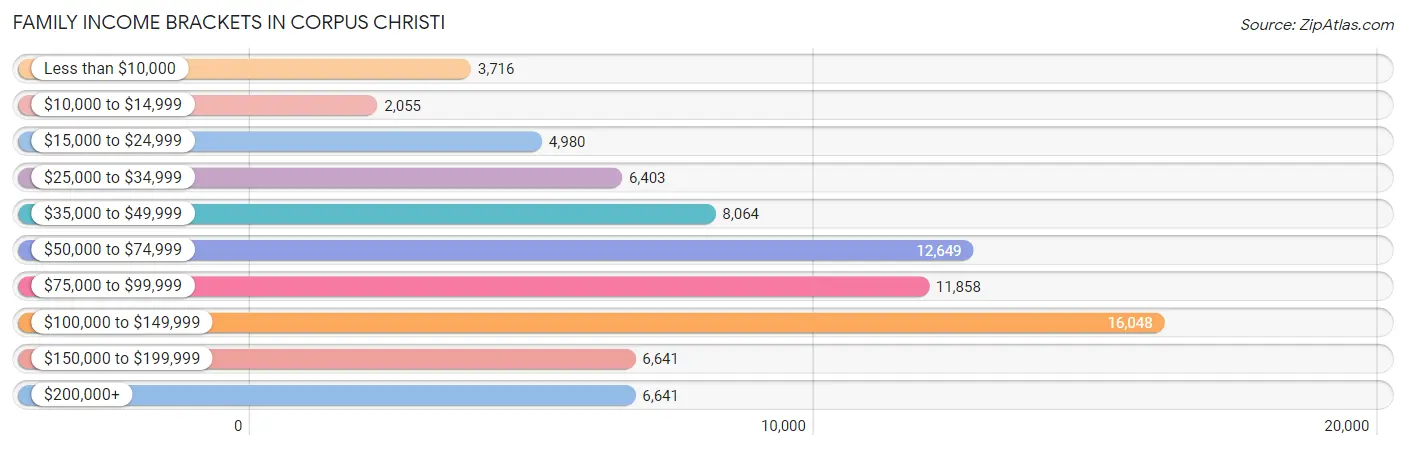
| Income Bracket | # Families | % Families |
| Less than $10,000 | 3,716 | 4.7% |
| $10,000 to $14,999 | 2,055 | 2.6% |
| $15,000 to $24,999 | 4,980 | 6.3% |
| $25,000 to $34,999 | 6,403 | 8.1% |
| $35,000 to $49,999 | 8,064 | 10.2% |
| $50,000 to $74,999 | 12,649 | 16.0% |
| $75,000 to $99,999 | 11,858 | 15.0% |
| $100,000 to $149,999 | 16,048 | 20.3% |
| $150,000 to $199,999 | 6,641 | 8.4% |
| $200,000+ | 6,641 | 8.4% |
Family Income by Famaliy Size in Corpus Christi
7+ person families (1,625 | 2.1%) account for the highest median family income in Corpus Christi with $109,063 per family, while 2-person families (35,468 | 44.9%) have the highest median income of $34,424 per family member.
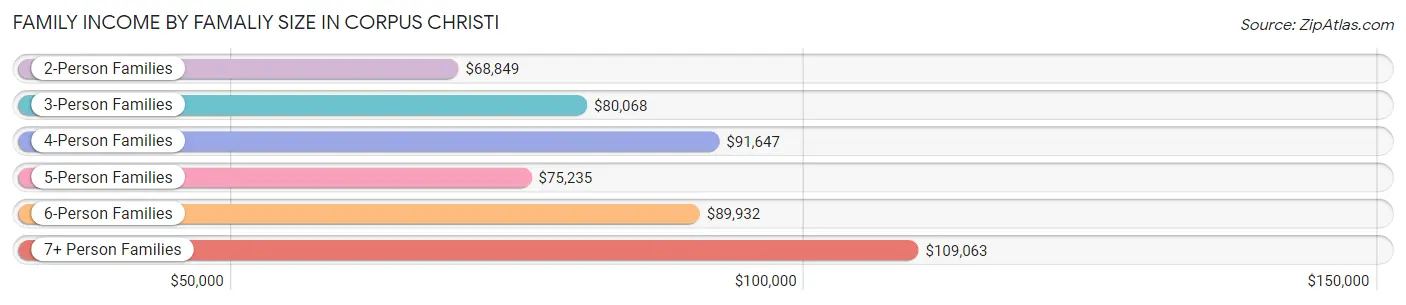
| Income Bracket | # Families | Median Income |
| 2-Person Families | 35,468 (44.9%) | $68,849 |
| 3-Person Families | 18,045 (22.8%) | $80,068 |
| 4-Person Families | 14,900 (18.9%) | $91,647 |
| 5-Person Families | 6,890 (8.7%) | $75,235 |
| 6-Person Families | 2,127 (2.7%) | $89,932 |
| 7+ Person Families | 1,625 (2.1%) | $109,063 |
| Total | 79,055 (100.0%) | $78,428 |
Family Income by Number of Earners in Corpus Christi
The median family income in Corpus Christi is $78,428, with families comprising 3+ earners (6,716) having the highest median family income of $121,193, while families with no earners (11,182) have the lowest median family income of $30,341, accounting for 8.5% and 14.1% of families, respectively.
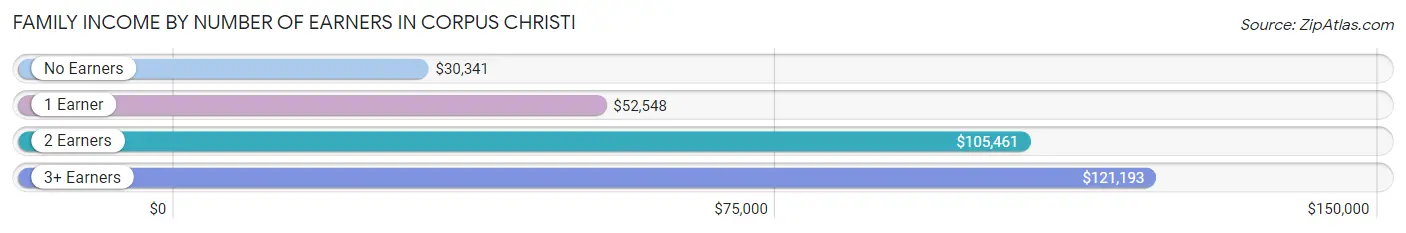
| Number of Earners | # Families | Median Income |
| No Earners | 11,182 (14.1%) | $30,341 |
| 1 Earner | 28,475 (36.0%) | $52,548 |
| 2 Earners | 32,682 (41.3%) | $105,461 |
| 3+ Earners | 6,716 (8.5%) | $121,193 |
| Total | 79,055 (100.0%) | $78,428 |
Household Income in Corpus Christi
Household Income Brackets in Corpus Christi
With 20,337 households falling in the category, the $50,000 to $74,999 income range is the most frequent in Corpus Christi, accounting for 17.3% of all households. In contrast, only 5,878 households (5.0%) fall into the $10,000 to $14,999 income bracket, making it the least populous group.
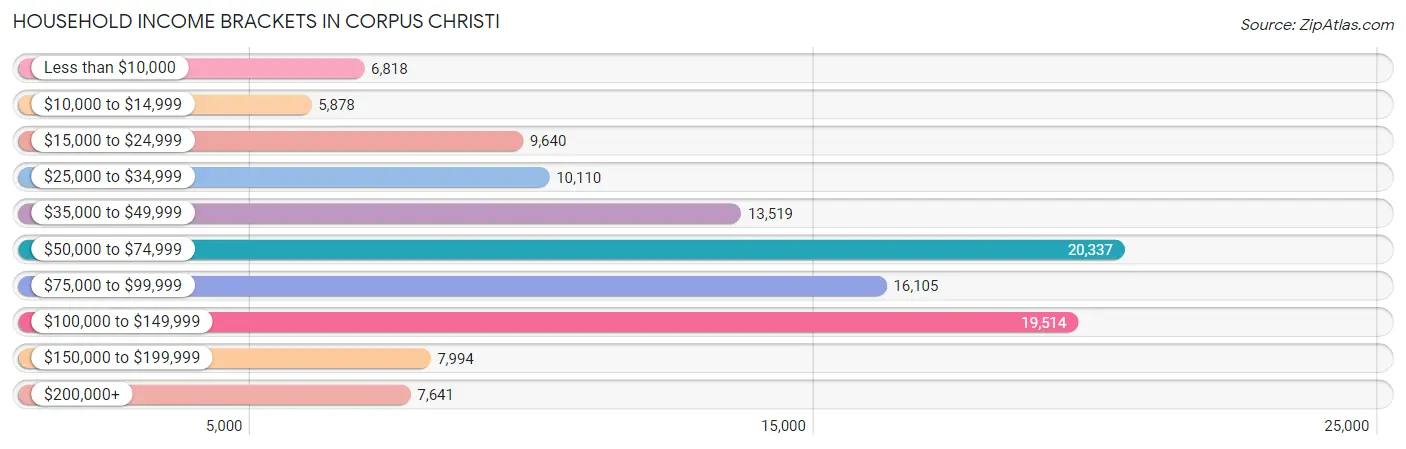
| Income Bracket | # Households | % Households |
| Less than $10,000 | 6,818 | 5.8% |
| $10,000 to $14,999 | 5,878 | 5.0% |
| $15,000 to $24,999 | 9,640 | 8.2% |
| $25,000 to $34,999 | 10,110 | 8.6% |
| $35,000 to $49,999 | 13,519 | 11.5% |
| $50,000 to $74,999 | 20,337 | 17.3% |
| $75,000 to $99,999 | 16,105 | 13.7% |
| $100,000 to $149,999 | 19,514 | 16.6% |
| $150,000 to $199,999 | 7,994 | 6.8% |
| $200,000+ | 7,641 | 6.5% |
Household Income by Householder Age in Corpus Christi
The median household income in Corpus Christi is $64,449, with the highest median household income of $77,914 found in the 45 to 64 years age bracket for the primary householder. A total of 40,463 households (34.4%) fall into this category. Meanwhile, the 15 to 24 years age bracket for the primary householder has the lowest median household income of $43,612, with 6,461 households (5.5%) in this group.
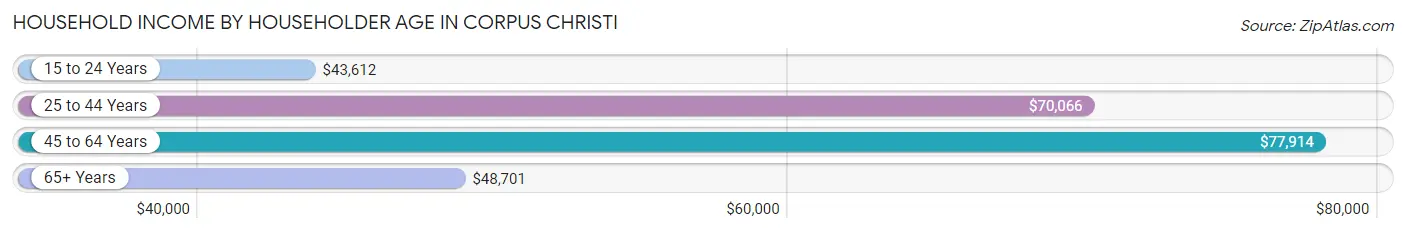
| Income Bracket | # Households | Median Income |
| 15 to 24 Years | 6,461 (5.5%) | $43,612 |
| 25 to 44 Years | 42,379 (36.0%) | $70,066 |
| 45 to 64 Years | 40,463 (34.4%) | $77,914 |
| 65+ Years | 28,252 (24.0%) | $48,701 |
| Total | 117,555 (100.0%) | $64,449 |
Poverty in Corpus Christi
Income Below Poverty by Sex and Age in Corpus Christi
With 15.5% poverty level for males and 19.0% for females among the residents of Corpus Christi, 5 year old males and 5 year old females are the most vulnerable to poverty, with 847 males (30.7%) and 640 females (30.5%) in their respective age groups living below the poverty level.
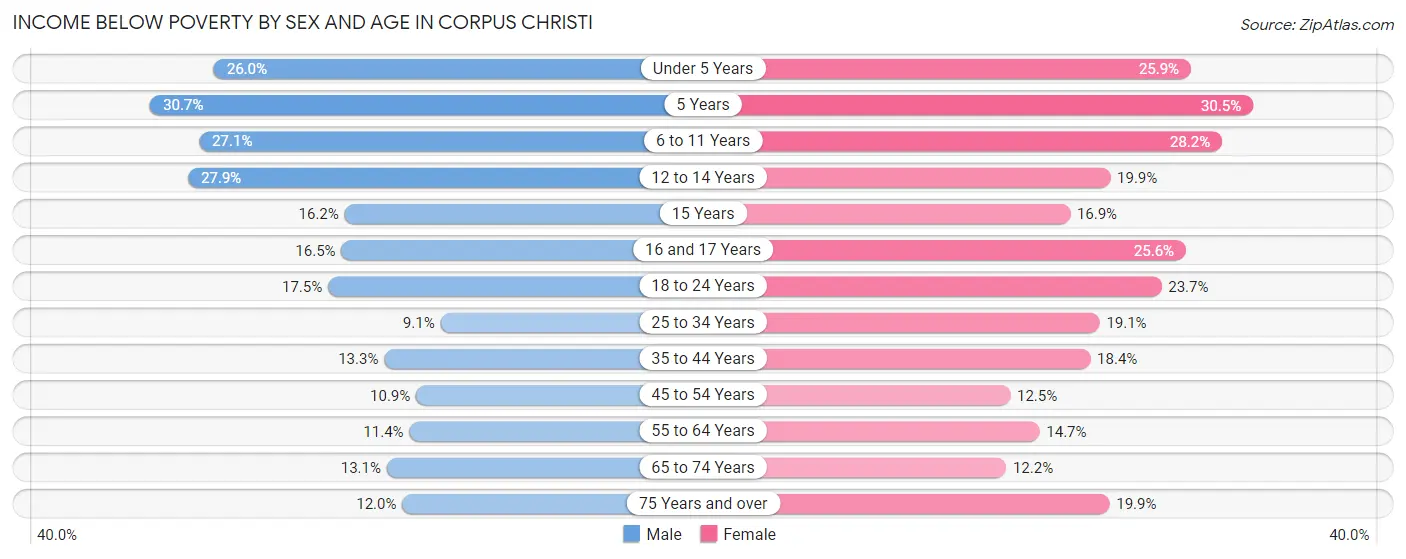
| Age Bracket | Male | Female |
| Under 5 Years | 2,675 (26.0%) | 2,463 (25.9%) |
| 5 Years | 847 (30.7%) | 640 (30.5%) |
| 6 to 11 Years | 3,462 (27.1%) | 3,397 (28.2%) |
| 12 to 14 Years | 1,719 (27.9%) | 1,344 (19.9%) |
| 15 Years | 403 (16.2%) | 313 (16.9%) |
| 16 and 17 Years | 704 (16.5%) | 1,160 (25.6%) |
| 18 to 24 Years | 2,677 (17.5%) | 3,522 (23.7%) |
| 25 to 34 Years | 2,116 (9.1%) | 4,178 (19.1%) |
| 35 to 44 Years | 2,832 (13.3%) | 3,849 (18.4%) |
| 45 to 54 Years | 1,931 (10.9%) | 2,308 (12.5%) |
| 55 to 64 Years | 2,038 (11.4%) | 2,727 (14.7%) |
| 65 to 74 Years | 1,717 (13.1%) | 1,752 (12.2%) |
| 75 Years and over | 867 (12.0%) | 1,982 (19.9%) |
| Total | 23,988 (15.5%) | 29,635 (19.0%) |
Income Above Poverty by Sex and Age in Corpus Christi
According to the poverty statistics in Corpus Christi, males aged 25 to 34 years and females aged 65 to 74 years are the age groups that are most secure financially, with 90.9% of males and 87.8% of females in these age groups living above the poverty line.
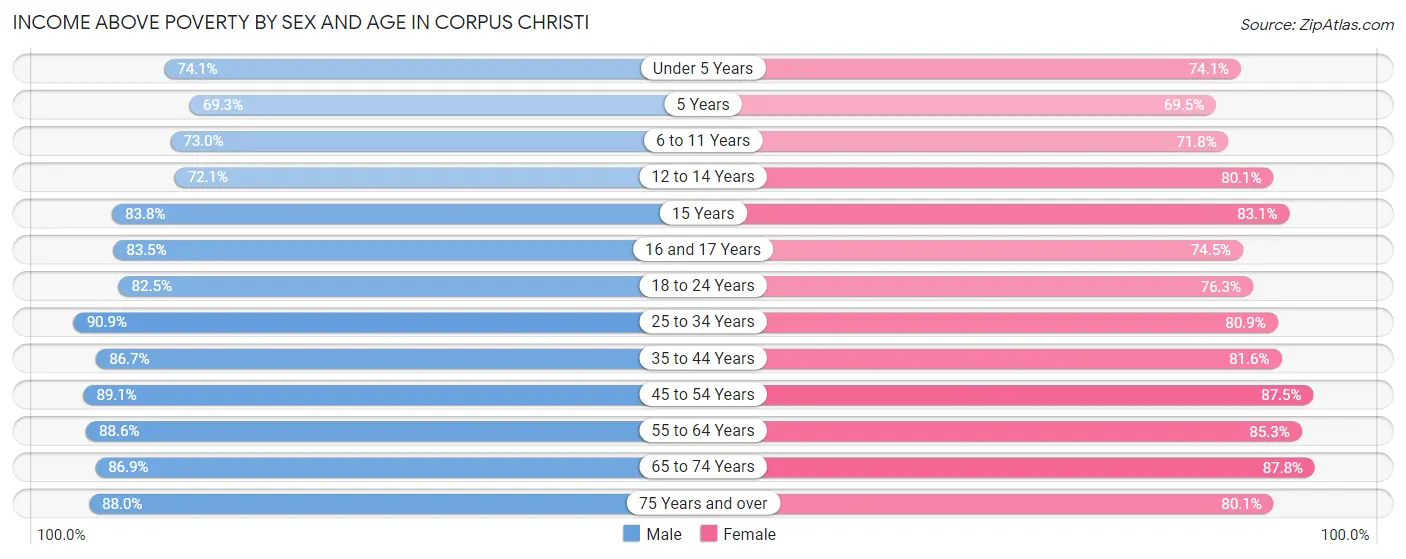
| Age Bracket | Male | Female |
| Under 5 Years | 7,632 (74.1%) | 7,038 (74.1%) |
| 5 Years | 1,914 (69.3%) | 1,456 (69.5%) |
| 6 to 11 Years | 9,337 (73.0%) | 8,635 (71.8%) |
| 12 to 14 Years | 4,448 (72.1%) | 5,404 (80.1%) |
| 15 Years | 2,078 (83.8%) | 1,535 (83.1%) |
| 16 and 17 Years | 3,568 (83.5%) | 3,380 (74.5%) |
| 18 to 24 Years | 12,650 (82.5%) | 11,324 (76.3%) |
| 25 to 34 Years | 21,098 (90.9%) | 17,664 (80.9%) |
| 35 to 44 Years | 18,461 (86.7%) | 17,028 (81.6%) |
| 45 to 54 Years | 15,743 (89.1%) | 16,176 (87.5%) |
| 55 to 64 Years | 15,800 (88.6%) | 15,867 (85.3%) |
| 65 to 74 Years | 11,378 (86.9%) | 12,619 (87.8%) |
| 75 Years and over | 6,382 (88.0%) | 7,997 (80.1%) |
| Total | 130,489 (84.5%) | 126,123 (81.0%) |
Income Below Poverty Among Married-Couple Families in Corpus Christi
The poverty statistics for married-couple families in Corpus Christi show that 5.1% or 2,677 of the total 52,555 families live below the poverty line. Families with 5 or more children have the highest poverty rate of 25.6%, comprising of 97 families. On the other hand, families with no children have the lowest poverty rate of 3.7%, which includes 1,115 families.
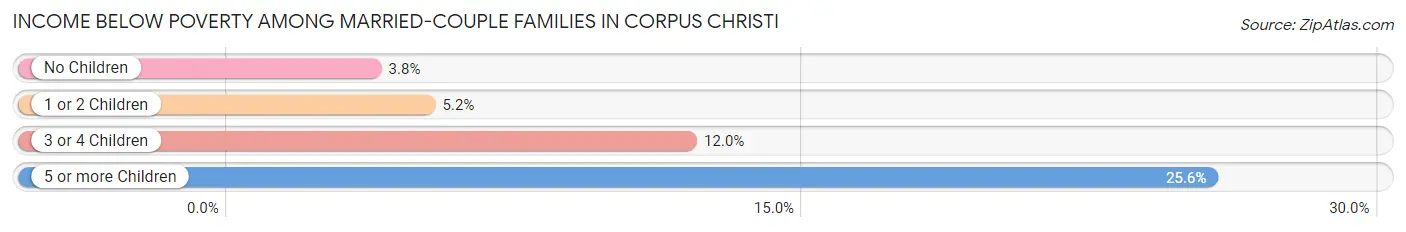
| Children | Above Poverty | Below Poverty |
| No Children | 28,594 (96.3%) | 1,115 (3.7%) |
| 1 or 2 Children | 17,061 (94.8%) | 928 (5.2%) |
| 3 or 4 Children | 3,941 (88.0%) | 537 (12.0%) |
| 5 or more Children | 282 (74.4%) | 97 (25.6%) |
| Total | 49,878 (94.9%) | 2,677 (5.1%) |
Income Below Poverty Among Single-Parent Households in Corpus Christi
According to the poverty data in Corpus Christi, 17.1% or 1,243 single-father households and 34.1% or 6,562 single-mother households are living below the poverty line. Among single-father households, those with 5 or more children have the highest poverty rate, with 9 households (100.0%) experiencing poverty. Likewise, among single-mother households, those with 5 or more children have the highest poverty rate, with 205 households (71.4%) falling below the poverty line.
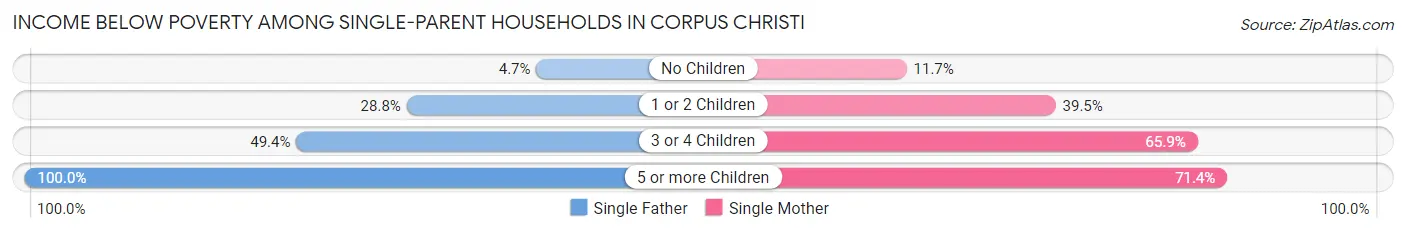
| Children | Single Father | Single Mother |
| No Children | 182 (4.7%) | 788 (11.7%) |
| 1 or 2 Children | 849 (28.8%) | 3,725 (39.5%) |
| 3 or 4 Children | 203 (49.4%) | 1,844 (65.9%) |
| 5 or more Children | 9 (100.0%) | 205 (71.4%) |
| Total | 1,243 (17.1%) | 6,562 (34.1%) |
Income Below Poverty Among Married-Couple vs Single-Parent Households in Corpus Christi
The poverty data for Corpus Christi shows that 2,677 of the married-couple family households (5.1%) and 7,805 of the single-parent households (29.4%) are living below the poverty level. Within the married-couple family households, those with 5 or more children have the highest poverty rate, with 97 households (25.6%) falling below the poverty line. Among the single-parent households, those with 5 or more children have the highest poverty rate, with 214 household (72.3%) living below poverty.
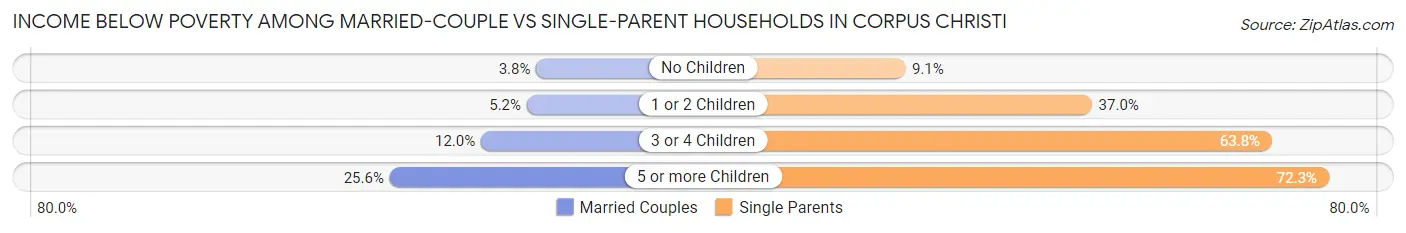
| Children | Married-Couple Families | Single-Parent Households |
| No Children | 1,115 (3.7%) | 970 (9.1%) |
| 1 or 2 Children | 928 (5.2%) | 4,574 (36.9%) |
| 3 or 4 Children | 537 (12.0%) | 2,047 (63.8%) |
| 5 or more Children | 97 (25.6%) | 214 (72.3%) |
| Total | 2,677 (5.1%) | 7,805 (29.4%) |
Race in Corpus Christi
The most populous races in Corpus Christi are Hispanic or Latino (204,417 | 64.3%), White / Caucasian (201,083 | 63.3%), and Two or more Races (81,342 | 25.6%).
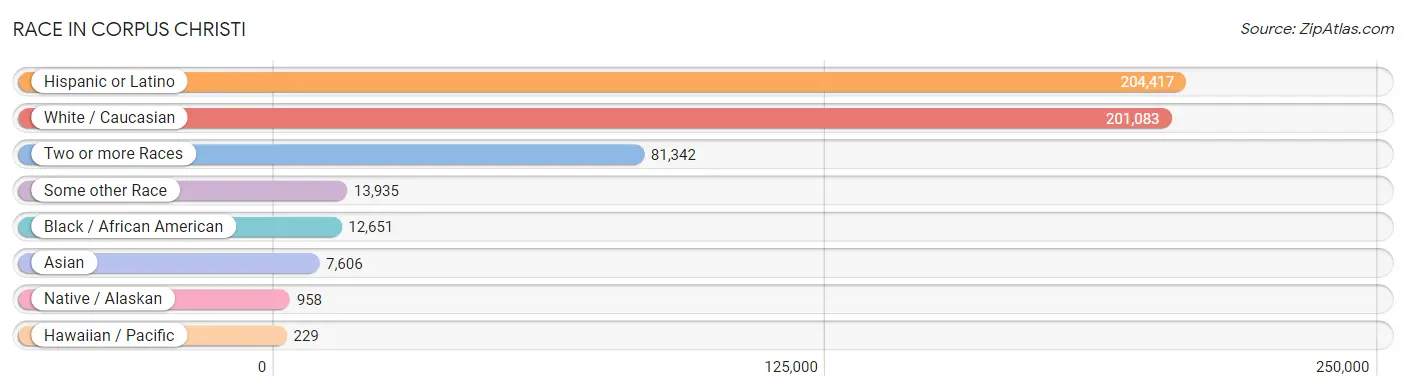
| Race | # Population | % Population |
| Asian | 7,606 | 2.4% |
| Black / African American | 12,651 | 4.0% |
| Hawaiian / Pacific | 229 | 0.1% |
| Hispanic or Latino | 204,417 | 64.3% |
| Native / Alaskan | 958 | 0.3% |
| White / Caucasian | 201,083 | 63.3% |
| Two or more Races | 81,342 | 25.6% |
| Some other Race | 13,935 | 4.4% |
| Total | 317,804 | 100.0% |
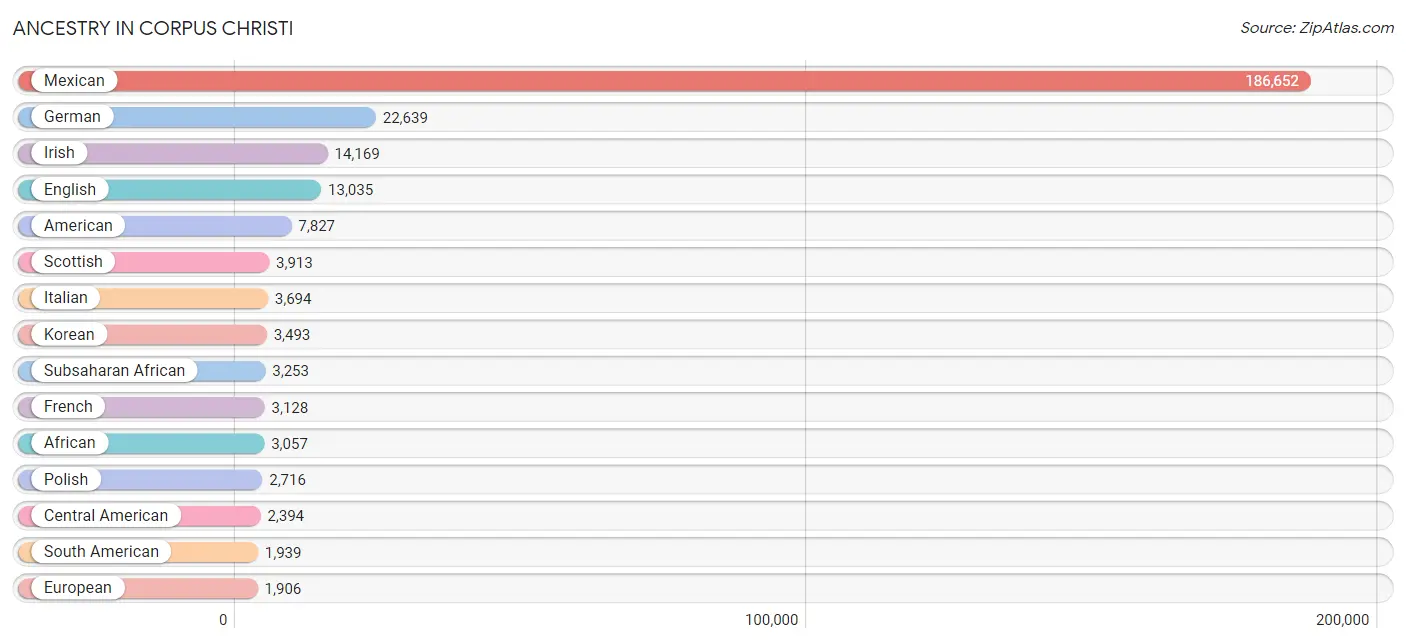
Ancestry in Corpus Christi
The most populous ancestries reported in Corpus Christi are Mexican (186,652 | 58.7%), German (22,639 | 7.1%), Irish (14,169 | 4.5%), English (13,035 | 4.1%), and American (7,827 | 2.5%), together accounting for 76.9% of all Corpus Christi residents.
| Ancestry | # Population | % Population |
| African | 3,057 | 1.0% |
| American | 7,827 | 2.5% |
| Apache | 401 | 0.1% |
| Arab | 589 | 0.2% |
| Argentinean | 35 | 0.0% |
| Armenian | 106 | 0.0% |
| Australian | 17 | 0.0% |
| Austrian | 168 | 0.1% |
| Barbadian | 53 | 0.0% |
| Belgian | 60 | 0.0% |
| Bhutanese | 419 | 0.1% |
| Blackfeet | 30 | 0.0% |
| Bolivian | 57 | 0.0% |
| Brazilian | 103 | 0.0% |
| British | 837 | 0.3% |
| British West Indian | 232 | 0.1% |
| Bulgarian | 26 | 0.0% |
| Burmese | 507 | 0.2% |
| Cajun | 123 | 0.0% |
| Cambodian | 12 | 0.0% |
| Canadian | 196 | 0.1% |
| Celtic | 21 | 0.0% |
| Central American | 2,394 | 0.7% |
| Central American Indian | 219 | 0.1% |
| Cherokee | 1,357 | 0.4% |
| Chickasaw | 19 | 0.0% |
| Chilean | 313 | 0.1% |
| Chippewa | 93 | 0.0% |
| Choctaw | 22 | 0.0% |
| Colombian | 405 | 0.1% |
| Comanche | 35 | 0.0% |
| Creek | 42 | 0.0% |
| Croatian | 44 | 0.0% |
| Cuban | 727 | 0.2% |
| Czech | 1,475 | 0.5% |
| Czechoslovakian | 260 | 0.1% |
| Danish | 366 | 0.1% |
| Dominican | 241 | 0.1% |
| Dutch | 1,589 | 0.5% |
| Eastern European | 183 | 0.1% |
| Ecuadorian | 75 | 0.0% |
| Egyptian | 20 | 0.0% |
| English | 13,035 | 4.1% |
| European | 1,906 | 0.6% |
| Filipino | 195 | 0.1% |
| Finnish | 62 | 0.0% |
| French | 3,128 | 1.0% |
| French Canadian | 404 | 0.1% |
| German | 22,639 | 7.1% |
| Greek | 362 | 0.1% |
| Guamanian / Chamorro | 78 | 0.0% |
| Guatemalan | 904 | 0.3% |
| Haitian | 46 | 0.0% |
| Hmong | 11 | 0.0% |
| Honduran | 795 | 0.3% |
| Hopi | 59 | 0.0% |
| Hungarian | 385 | 0.1% |
| Indian (Asian) | 1,283 | 0.4% |
| Iranian | 140 | 0.0% |
| Iraqi | 9 | 0.0% |
| Irish | 14,169 | 4.5% |
| Iroquois | 6 | 0.0% |
| Israeli | 8 | 0.0% |
| Italian | 3,694 | 1.2% |
| Jamaican | 157 | 0.1% |
| Japanese | 42 | 0.0% |
| Korean | 3,493 | 1.1% |
| Laotian | 29 | 0.0% |
| Latvian | 27 | 0.0% |
| Lebanese | 193 | 0.1% |
| Lithuanian | 114 | 0.0% |
| Malaysian | 33 | 0.0% |
| Mexican | 186,652 | 58.7% |
| Mexican American Indian | 313 | 0.1% |
| Moroccan | 30 | 0.0% |
| Native Hawaiian | 397 | 0.1% |
| Navajo | 55 | 0.0% |
| Nicaraguan | 165 | 0.1% |
| Nigerian | 92 | 0.0% |
| Northern European | 52 | 0.0% |
| Norwegian | 1,011 | 0.3% |
| Osage | 101 | 0.0% |
| Ottawa | 3 | 0.0% |
| Pakistani | 282 | 0.1% |
| Palestinian | 122 | 0.0% |
| Panamanian | 137 | 0.0% |
| Paraguayan | 133 | 0.0% |
| Pennsylvania German | 144 | 0.1% |
| Peruvian | 55 | 0.0% |
| Polish | 2,716 | 0.9% |
| Portuguese | 495 | 0.2% |
| Potawatomi | 106 | 0.0% |
| Puerto Rican | 1,857 | 0.6% |
| Romanian | 132 | 0.0% |
| Russian | 777 | 0.2% |
| Salvadoran | 393 | 0.1% |
| Samoan | 23 | 0.0% |
| Scandinavian | 201 | 0.1% |
| Scotch-Irish | 1,709 | 0.5% |
| Scottish | 3,913 | 1.2% |
| Serbian | 20 | 0.0% |
| Slavic | 73 | 0.0% |
| Slovak | 104 | 0.0% |
| Slovene | 6 | 0.0% |
| South African | 26 | 0.0% |
| South American | 1,939 | 0.6% |
| Soviet Union | 7 | 0.0% |
| Spaniard | 1,458 | 0.5% |
| Spanish | 710 | 0.2% |
| Sri Lankan | 998 | 0.3% |
| Subsaharan African | 3,253 | 1.0% |
| Swedish | 1,088 | 0.3% |
| Swiss | 290 | 0.1% |
| Syrian | 61 | 0.0% |
| Thai | 1,493 | 0.5% |
| Tongan | 10 | 0.0% |
| Trinidadian and Tobagonian | 19 | 0.0% |
| Turkish | 91 | 0.0% |
| Ugandan | 25 | 0.0% |
| Ukrainian | 181 | 0.1% |
| Uruguayan | 19 | 0.0% |
| Venezuelan | 847 | 0.3% |
| Vietnamese | 111 | 0.0% |
| Welsh | 1,025 | 0.3% |
| West Indian | 57 | 0.0% |
| Yugoslavian | 60 | 0.0% |
| Yuman | 4 | 0.0% |
| Zimbabwean | 9 | 0.0% | View All 128 Rows |
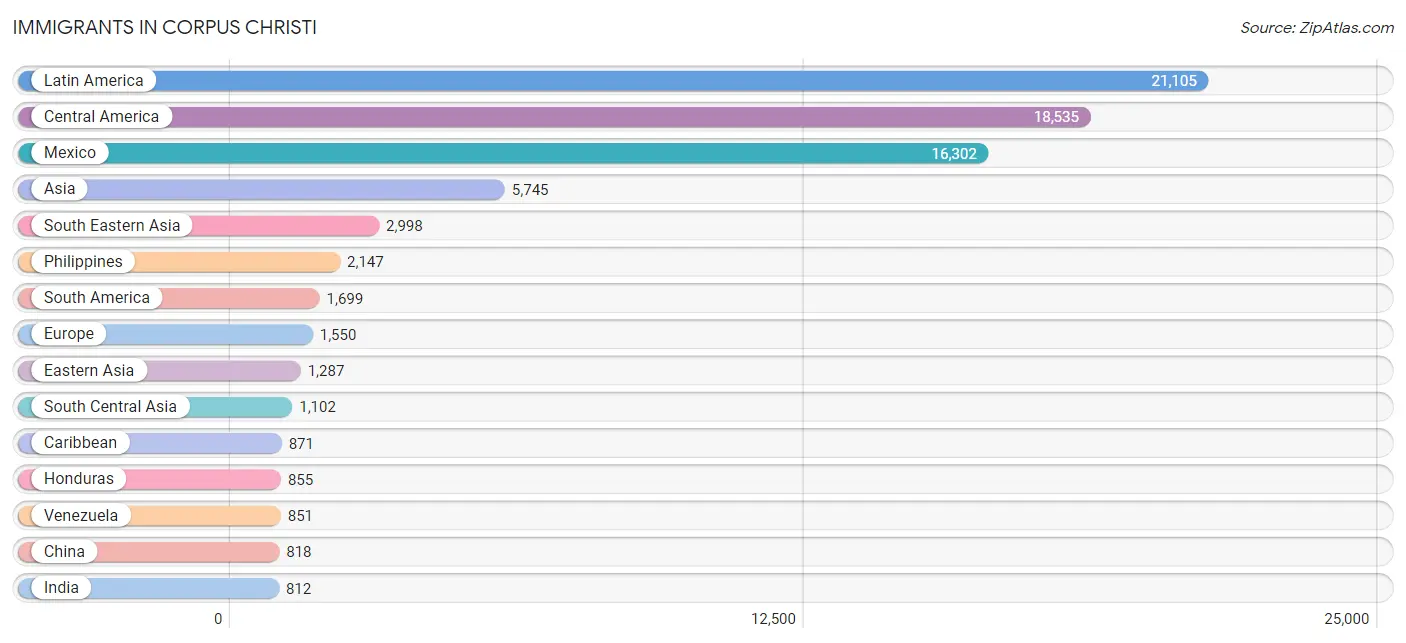
Immigrants in Corpus Christi
The most numerous immigrant groups reported in Corpus Christi came from Latin America (21,105 | 6.6%), Central America (18,535 | 5.8%), Mexico (16,302 | 5.1%), Asia (5,745 | 1.8%), and South Eastern Asia (2,998 | 0.9%), together accounting for 20.3% of all Corpus Christi residents.
| Immigration Origin | # Population | % Population |
| Africa | 386 | 0.1% |
| Argentina | 52 | 0.0% |
| Asia | 5,745 | 1.8% |
| Australia | 16 | 0.0% |
| Austria | 19 | 0.0% |
| Bahamas | 19 | 0.0% |
| Bangladesh | 111 | 0.0% |
| Barbados | 53 | 0.0% |
| Belarus | 9 | 0.0% |
| Belgium | 15 | 0.0% |
| Bolivia | 26 | 0.0% |
| Bosnia and Herzegovina | 46 | 0.0% |
| Brazil | 97 | 0.0% |
| Bulgaria | 28 | 0.0% |
| Cambodia | 23 | 0.0% |
| Cameroon | 14 | 0.0% |
| Canada | 443 | 0.1% |
| Caribbean | 871 | 0.3% |
| Central America | 18,535 | 5.8% |
| Chile | 267 | 0.1% |
| China | 818 | 0.3% |
| Colombia | 234 | 0.1% |
| Cuba | 466 | 0.2% |
| Czechoslovakia | 8 | 0.0% |
| Dominica | 27 | 0.0% |
| Dominican Republic | 113 | 0.0% |
| Eastern Africa | 94 | 0.0% |
| Eastern Asia | 1,287 | 0.4% |
| Eastern Europe | 491 | 0.2% |
| Ecuador | 75 | 0.0% |
| Egypt | 34 | 0.0% |
| El Salvador | 436 | 0.1% |
| England | 120 | 0.0% |
| Europe | 1,550 | 0.5% |
| Fiji | 42 | 0.0% |
| France | 10 | 0.0% |
| Germany | 467 | 0.2% |
| Grenada | 29 | 0.0% |
| Guatemala | 724 | 0.2% |
| Guyana | 20 | 0.0% |
| Honduras | 855 | 0.3% |
| Hong Kong | 37 | 0.0% |
| Hungary | 11 | 0.0% |
| India | 812 | 0.3% |
| Indonesia | 50 | 0.0% |
| Iran | 47 | 0.0% |
| Iraq | 18 | 0.0% |
| Ireland | 53 | 0.0% |
| Israel | 40 | 0.0% |
| Italy | 112 | 0.0% |
| Jamaica | 20 | 0.0% |
| Japan | 87 | 0.0% |
| Kenya | 6 | 0.0% |
| Korea | 382 | 0.1% |
| Kuwait | 8 | 0.0% |
| Laos | 26 | 0.0% |
| Latin America | 21,105 | 6.6% |
| Lebanon | 14 | 0.0% |
| Malaysia | 76 | 0.0% |
| Mexico | 16,302 | 5.1% |
| Middle Africa | 35 | 0.0% |
| Morocco | 30 | 0.0% |
| Netherlands | 23 | 0.0% |
| Nicaragua | 80 | 0.0% |
| Nigeria | 120 | 0.0% |
| Northern Africa | 64 | 0.0% |
| Northern Europe | 218 | 0.1% |
| Oceania | 58 | 0.0% |
| Pakistan | 132 | 0.0% |
| Panama | 111 | 0.0% |
| Peru | 26 | 0.0% |
| Philippines | 2,147 | 0.7% |
| Poland | 80 | 0.0% |
| Portugal | 10 | 0.0% |
| Romania | 22 | 0.0% |
| Russia | 176 | 0.1% |
| Saudi Arabia | 134 | 0.0% |
| Somalia | 33 | 0.0% |
| South America | 1,699 | 0.5% |
| South Central Asia | 1,102 | 0.4% |
| South Eastern Asia | 2,998 | 0.9% |
| Southern Europe | 258 | 0.1% |
| Spain | 136 | 0.0% |
| Switzerland | 49 | 0.0% |
| Syria | 25 | 0.0% |
| Taiwan | 106 | 0.0% |
| Thailand | 160 | 0.1% |
| Trinidad and Tobago | 87 | 0.0% |
| Turkey | 91 | 0.0% |
| Uganda | 25 | 0.0% |
| Ukraine | 95 | 0.0% |
| Uruguay | 19 | 0.0% |
| Venezuela | 851 | 0.3% |
| Vietnam | 516 | 0.2% |
| West Indies | 20 | 0.0% |
| Western Africa | 120 | 0.0% |
| Western Asia | 358 | 0.1% |
| Western Europe | 583 | 0.2% |
| Zaire | 21 | 0.0% |
| Zimbabwe | 21 | 0.0% | View All 100 Rows |
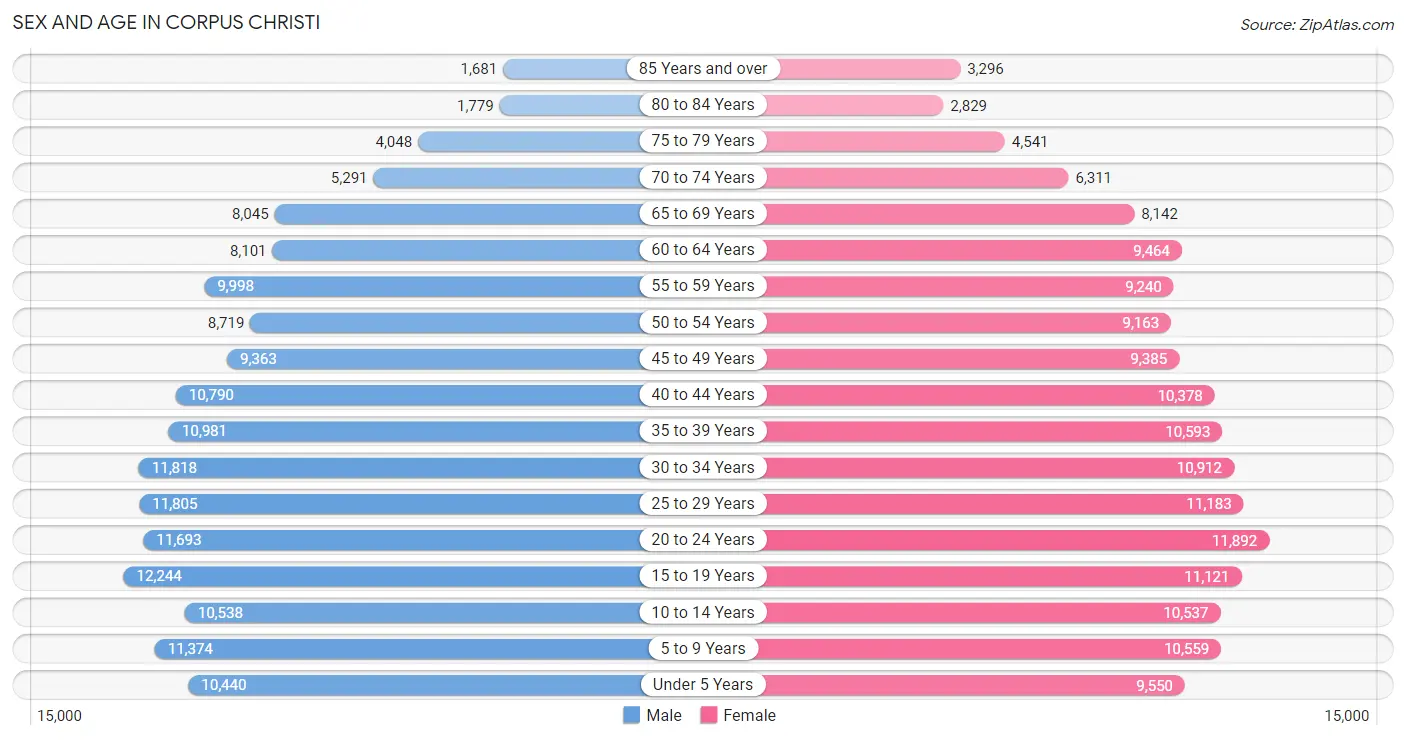
Sex and Age in Corpus Christi
Sex and Age in Corpus Christi
The most populous age groups in Corpus Christi are 15 to 19 Years (12,244 | 7.7%) for men and 20 to 24 Years (11,892 | 7.5%) for women.
| Age Bracket | Male | Female |
| Under 5 Years | 10,440 (6.6%) | 9,550 (6.0%) |
| 5 to 9 Years | 11,374 (7.2%) | 10,559 (6.6%) |
| 10 to 14 Years | 10,538 (6.6%) | 10,537 (6.6%) |
| 15 to 19 Years | 12,244 (7.7%) | 11,121 (7.0%) |
| 20 to 24 Years | 11,693 (7.4%) | 11,892 (7.5%) |
| 25 to 29 Years | 11,805 (7.4%) | 11,183 (7.0%) |
| 30 to 34 Years | 11,818 (7.4%) | 10,912 (6.9%) |
| 35 to 39 Years | 10,981 (6.9%) | 10,593 (6.7%) |
| 40 to 44 Years | 10,790 (6.8%) | 10,378 (6.5%) |
| 45 to 49 Years | 9,363 (5.9%) | 9,385 (5.9%) |
| 50 to 54 Years | 8,719 (5.5%) | 9,163 (5.8%) |
| 55 to 59 Years | 9,998 (6.3%) | 9,240 (5.8%) |
| 60 to 64 Years | 8,101 (5.1%) | 9,464 (5.9%) |
| 65 to 69 Years | 8,045 (5.1%) | 8,142 (5.1%) |
| 70 to 74 Years | 5,291 (3.3%) | 6,311 (4.0%) |
| 75 to 79 Years | 4,048 (2.5%) | 4,541 (2.9%) |
| 80 to 84 Years | 1,779 (1.1%) | 2,829 (1.8%) |
| 85 Years and over | 1,681 (1.1%) | 3,296 (2.1%) |
| Total | 158,708 (100.0%) | 159,096 (100.0%) |
Families and Households in Corpus Christi
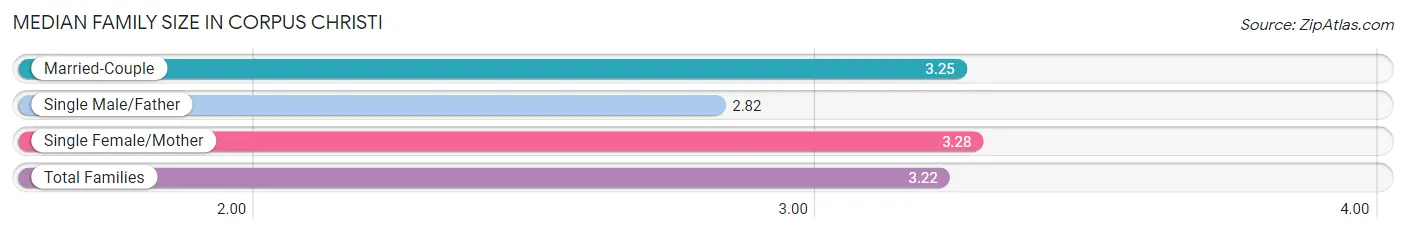
Median Family Size in Corpus Christi
The median family size in Corpus Christi is 3.22 persons per family, with single female/mother families (19,244 | 24.3%) accounting for the largest median family size of 3.28 persons per family. On the other hand, single male/father families (7,256 | 9.2%) represent the smallest median family size with 2.82 persons per family.
| Family Type | # Families | Family Size |
| Married-Couple | 52,555 (66.5%) | 3.25 |
| Single Male/Father | 7,256 (9.2%) | 2.82 |
| Single Female/Mother | 19,244 (24.3%) | 3.28 |
| Total Families | 79,055 (100.0%) | 3.22 |
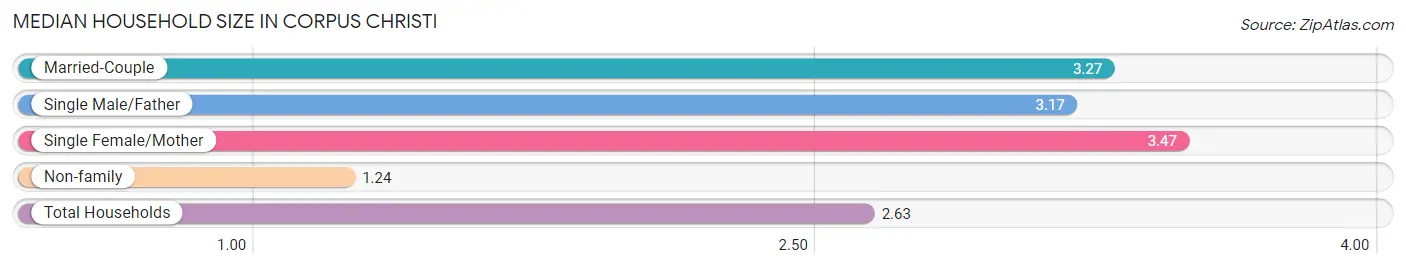
Median Household Size in Corpus Christi
The median household size in Corpus Christi is 2.63 persons per household, with single female/mother households (19,244 | 16.4%) accounting for the largest median household size of 3.47 persons per household. non-family households (38,500 | 32.8%) represent the smallest median household size with 1.24 persons per household.
| Household Type | # Households | Household Size |
| Married-Couple | 52,555 (44.7%) | 3.27 |
| Single Male/Father | 7,256 (6.2%) | 3.17 |
| Single Female/Mother | 19,244 (16.4%) | 3.47 |
| Non-family | 38,500 (32.8%) | 1.24 |
| Total Households | 117,555 (100.0%) | 2.63 |
Household Size by Marriage Status in Corpus Christi
Out of a total of 117,555 households in Corpus Christi, 79,055 (67.2%) are family households, while 38,500 (32.8%) are nonfamily households. The most numerous type of family households are 2-person households, comprising 32,577, and the most common type of nonfamily households are 1-person households, comprising 31,175.
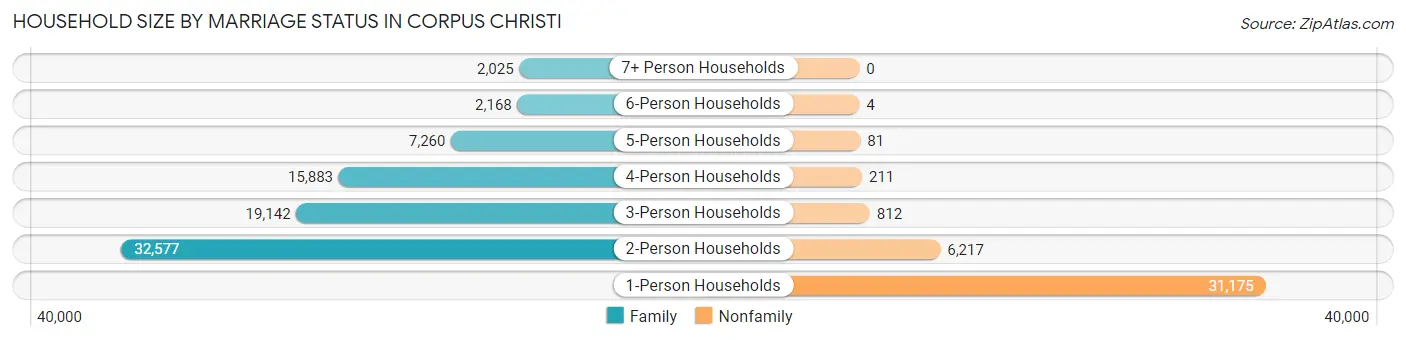
| Household Size | Family Households | Nonfamily Households |
| 1-Person Households | - | 31,175 (26.5%) |
| 2-Person Households | 32,577 (27.7%) | 6,217 (5.3%) |
| 3-Person Households | 19,142 (16.3%) | 812 (0.7%) |
| 4-Person Households | 15,883 (13.5%) | 211 (0.2%) |
| 5-Person Households | 7,260 (6.2%) | 81 (0.1%) |
| 6-Person Households | 2,168 (1.8%) | 4 (0.0%) |
| 7+ Person Households | 2,025 (1.7%) | 0 (0.0%) |
| Total | 79,055 (67.2%) | 38,500 (32.8%) |
Female Fertility in Corpus Christi
Fertility by Age in Corpus Christi
Average fertility rate in Corpus Christi is 53.0 births per 1,000 women. Women in the age bracket of 20 to 34 years have the highest fertility rate with 81.0 births per 1,000 women. Women in the age bracket of 20 to 34 years acount for 66.9% of all women with births.
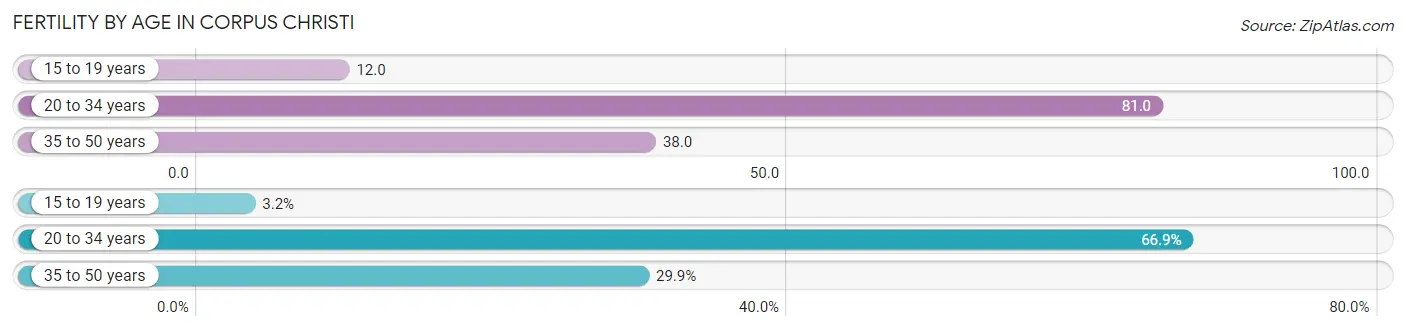
| Age Bracket | Women with Births | Births / 1,000 Women |
| 15 to 19 years | 133 (3.2%) | 12.0 |
| 20 to 34 years | 2,766 (66.9%) | 81.0 |
| 35 to 50 years | 1,238 (29.9%) | 38.0 |
| Total | 4,137 (100.0%) | 53.0 |
Fertility by Age by Marriage Status in Corpus Christi
58.9% of women with births (4,137) in Corpus Christi are married. The highest percentage of unmarried women with births falls into 15 to 19 years age bracket with 72.9% of them unmarried at the time of birth, while the lowest percentage of unmarried women with births belong to 35 to 50 years age bracket with 19.3% of them unmarried.
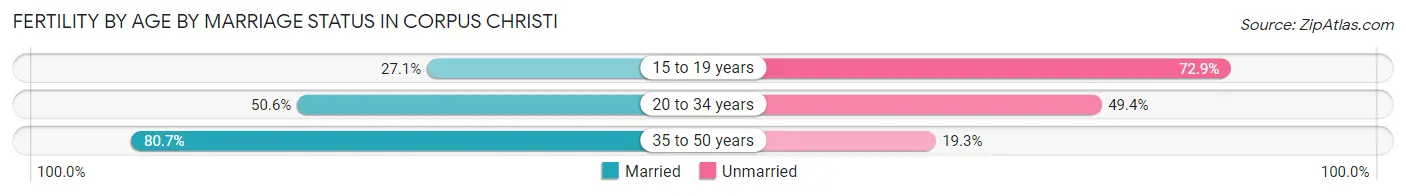
| Age Bracket | Married | Unmarried |
| 15 to 19 years | 36 (27.1%) | 97 (72.9%) |
| 20 to 34 years | 1,400 (50.6%) | 1,366 (49.4%) |
| 35 to 50 years | 999 (80.7%) | 239 (19.3%) |
| Total | 2,437 (58.9%) | 1,700 (41.1%) |
Fertility by Education in Corpus Christi
Average fertility rate in Corpus Christi is 53.0 births per 1,000 women. Women with the education attainment of bachelor's degree have the highest fertility rate of 71.0 births per 1,000 women, while women with the education attainment of high school diploma have the lowest fertility at 41.0 births per 1,000 women. Women with the education attainment of college or associate's degree represent 41.0% of all women with births.
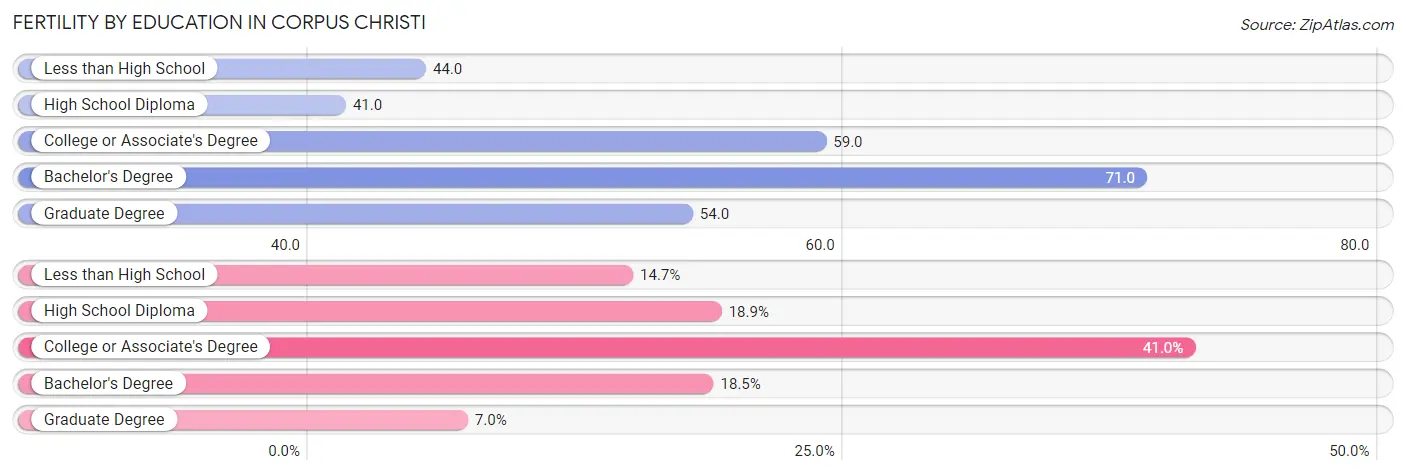
| Educational Attainment | Women with Births | Births / 1,000 Women |
| Less than High School | 608 (14.7%) | 44.0 |
| High School Diploma | 780 (18.9%) | 41.0 |
| College or Associate's Degree | 1,697 (41.0%) | 59.0 |
| Bachelor's Degree | 764 (18.5%) | 71.0 |
| Graduate Degree | 288 (7.0%) | 54.0 |
| Total | 4,137 (100.0%) | 53.0 |
Fertility by Education by Marriage Status in Corpus Christi
41.1% of women with births in Corpus Christi are unmarried. Women with the educational attainment of graduate degree are most likely to be married with 100.0% of them married at childbirth, while women with the educational attainment of less than high school are least likely to be married with 66.9% of them unmarried at childbirth.
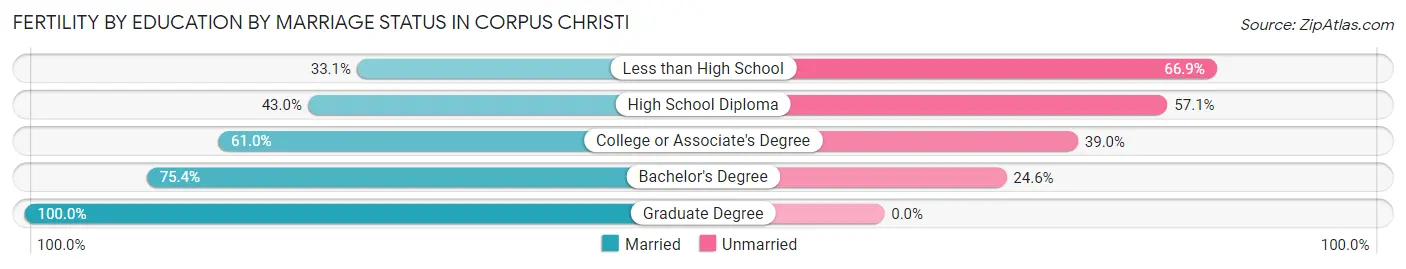
| Educational Attainment | Married | Unmarried |
| Less than High School | 201 (33.1%) | 407 (66.9%) |
| High School Diploma | 335 (42.9%) | 445 (57.1%) |
| College or Associate's Degree | 1,035 (61.0%) | 662 (39.0%) |
| Bachelor's Degree | 576 (75.4%) | 188 (24.6%) |
| Graduate Degree | 288 (100.0%) | 0 (0.0%) |
| Total | 2,437 (58.9%) | 1,700 (41.1%) |
Employment Characteristics in Corpus Christi
Employment by Class of Employer in Corpus Christi
Among the 146,564 employed individuals in Corpus Christi, private company employees (100,147 | 68.3%), local government employees (11,019 | 7.5%), and self-employed (not incorporated) (10,245 | 7.0%) make up the most common classes of employment.
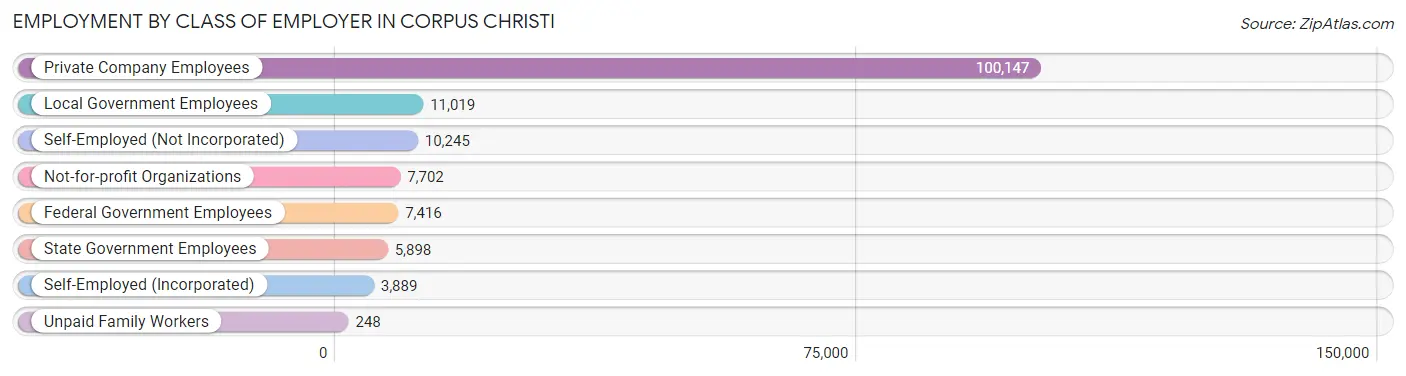
| Employer Class | # Employees | % Employees |
| Private Company Employees | 100,147 | 68.3% |
| Self-Employed (Incorporated) | 3,889 | 2.6% |
| Self-Employed (Not Incorporated) | 10,245 | 7.0% |
| Not-for-profit Organizations | 7,702 | 5.3% |
| Local Government Employees | 11,019 | 7.5% |
| State Government Employees | 5,898 | 4.0% |
| Federal Government Employees | 7,416 | 5.1% |
| Unpaid Family Workers | 248 | 0.2% |
| Total | 146,564 | 100.0% |
Employment Status by Age in Corpus Christi
According to the labor force statistics for Corpus Christi, out of the total population over 16 years of age (250,452), 62.8% or 157,284 individuals are in the labor force, with 5.6% or 8,808 of them unemployed. The age group with the highest labor force participation rate is 25 to 29 years, with 82.3% or 18,919 individuals in the labor force. Within the labor force, the 16 to 19 years age range has the highest percentage of unemployed individuals, with 22.1% or 1,193 of them being unemployed.
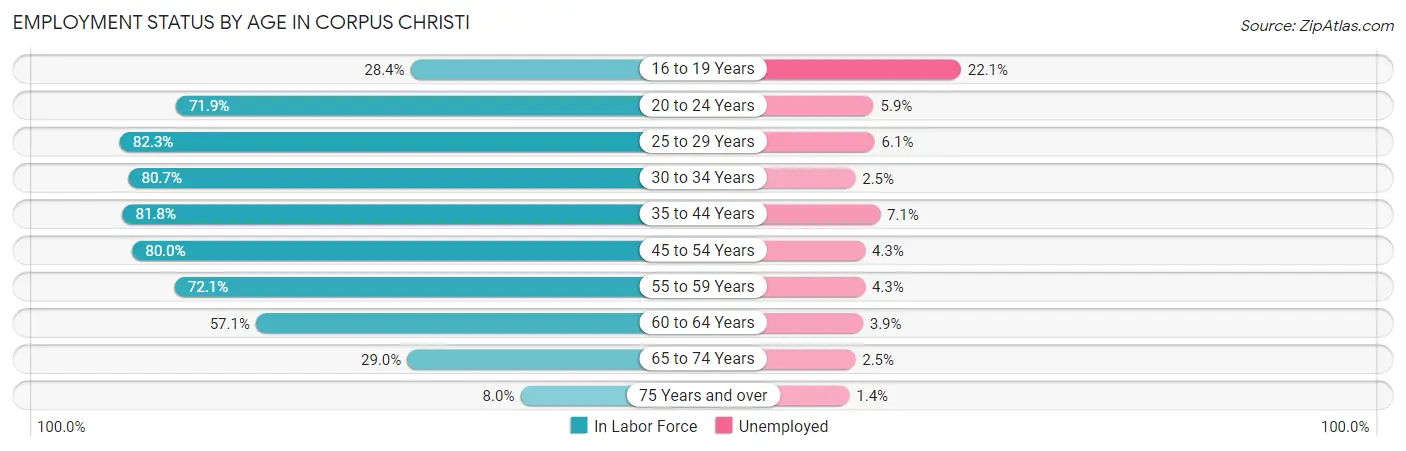
| Age Bracket | In Labor Force | Unemployed |
| 16 to 19 Years | 5,399 (28.4%) | 1,193 (22.1%) |
| 20 to 24 Years | 16,958 (71.9%) | 1,001 (5.9%) |
| 25 to 29 Years | 18,919 (82.3%) | 1,154 (6.1%) |
| 30 to 34 Years | 18,343 (80.7%) | 459 (2.5%) |
| 35 to 44 Years | 34,963 (81.8%) | 2,482 (7.1%) |
| 45 to 54 Years | 29,304 (80.0%) | 1,260 (4.3%) |
| 55 to 59 Years | 13,871 (72.1%) | 596 (4.3%) |
| 60 to 64 Years | 10,030 (57.1%) | 391 (3.9%) |
| 65 to 74 Years | 8,059 (29.0%) | 201 (2.5%) |
| 75 Years and over | 1,454 (8.0%) | 20 (1.4%) |
| Total | 157,284 (62.8%) | 8,808 (5.6%) |
Employment Status by Educational Attainment in Corpus Christi
According to labor force statistics for Corpus Christi, 77.5% of individuals (125,467) out of the total population between 25 and 64 years of age (161,893) are in the labor force, with 5.0% or 6,273 of them being unemployed. The group with the highest labor force participation rate are those with the educational attainment of bachelor's degree or higher, with 86.9% or 32,767 individuals in the labor force. Within the labor force, individuals with less than high school education have the highest percentage of unemployment, with 9.1% or 1,246 of them being unemployed.
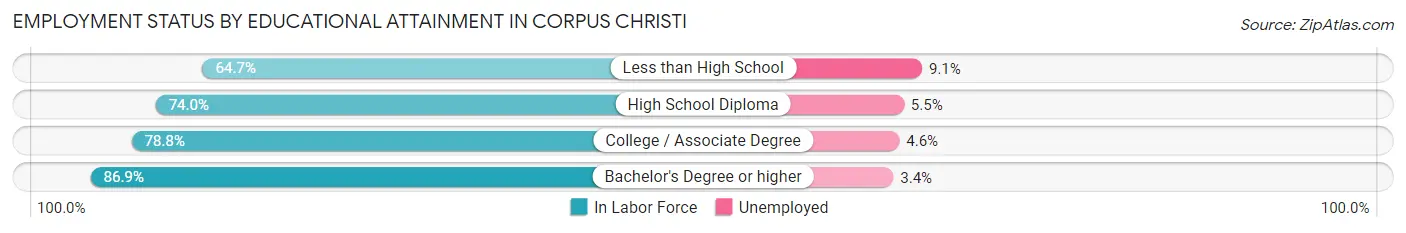
| Educational Attainment | In Labor Force | Unemployed |
| Less than High School | 13,687 (64.7%) | 1,925 (9.1%) |
| High School Diploma | 34,847 (74.0%) | 2,590 (5.5%) |
| College / Associate Degree | 44,081 (78.8%) | 2,573 (4.6%) |
| Bachelor's Degree or higher | 32,767 (86.9%) | 1,282 (3.4%) |
| Total | 125,467 (77.5%) | 8,095 (5.0%) |
Employment Occupations by Sex in Corpus Christi
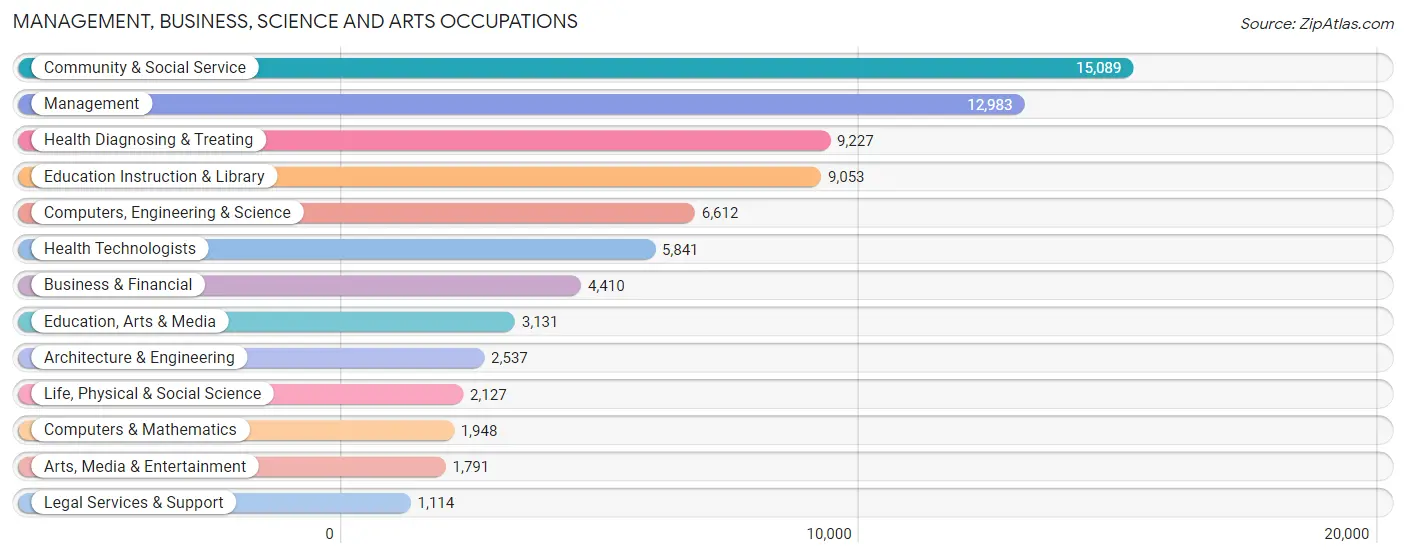
Management, Business, Science and Arts Occupations
The most common Management, Business, Science and Arts occupations in Corpus Christi are Community & Social Service (15,089 | 10.3%), Management (12,983 | 8.9%), Health Diagnosing & Treating (9,227 | 6.3%), Education Instruction & Library (9,053 | 6.2%), and Computers, Engineering & Science (6,612 | 4.5%).
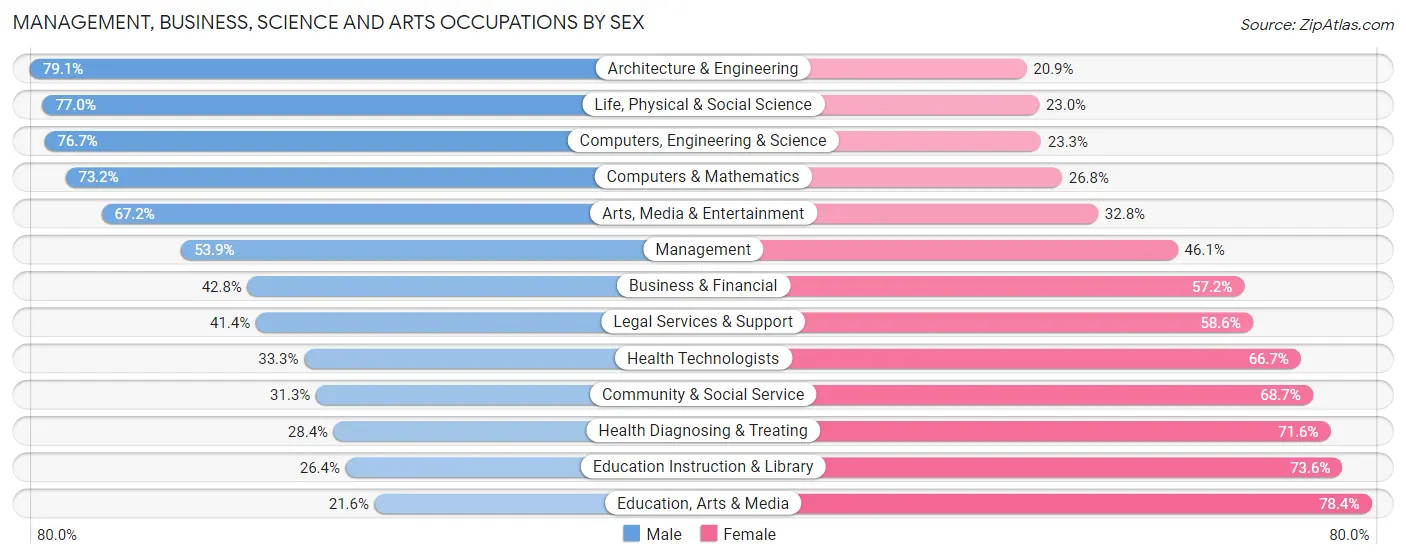
Management, Business, Science and Arts Occupations by Sex
Within the Management, Business, Science and Arts occupations in Corpus Christi, the most male-oriented occupations are Architecture & Engineering (79.1%), Life, Physical & Social Science (77.0%), and Computers, Engineering & Science (76.7%), while the most female-oriented occupations are Education, Arts & Media (78.4%), Education Instruction & Library (73.6%), and Health Diagnosing & Treating (71.6%).
| Occupation | Male | Female |
| Management | 6,992 (53.9%) | 5,991 (46.1%) |
| Business & Financial | 1,886 (42.8%) | 2,524 (57.2%) |
| Computers, Engineering & Science | 5,071 (76.7%) | 1,541 (23.3%) |
| Computers & Mathematics | 1,426 (73.2%) | 522 (26.8%) |
| Architecture & Engineering | 2,007 (79.1%) | 530 (20.9%) |
| Life, Physical & Social Science | 1,638 (77.0%) | 489 (23.0%) |
| Community & Social Service | 4,729 (31.3%) | 10,360 (68.7%) |
| Education, Arts & Media | 675 (21.6%) | 2,456 (78.4%) |
| Legal Services & Support | 461 (41.4%) | 653 (58.6%) |
| Education Instruction & Library | 2,390 (26.4%) | 6,663 (73.6%) |
| Arts, Media & Entertainment | 1,203 (67.2%) | 588 (32.8%) |
| Health Diagnosing & Treating | 2,619 (28.4%) | 6,608 (71.6%) |
| Health Technologists | 1,947 (33.3%) | 3,894 (66.7%) |
| Total (Category) | 21,297 (44.1%) | 27,024 (55.9%) |
| Total (Overall) | 78,974 (53.9%) | 67,528 (46.1%) |
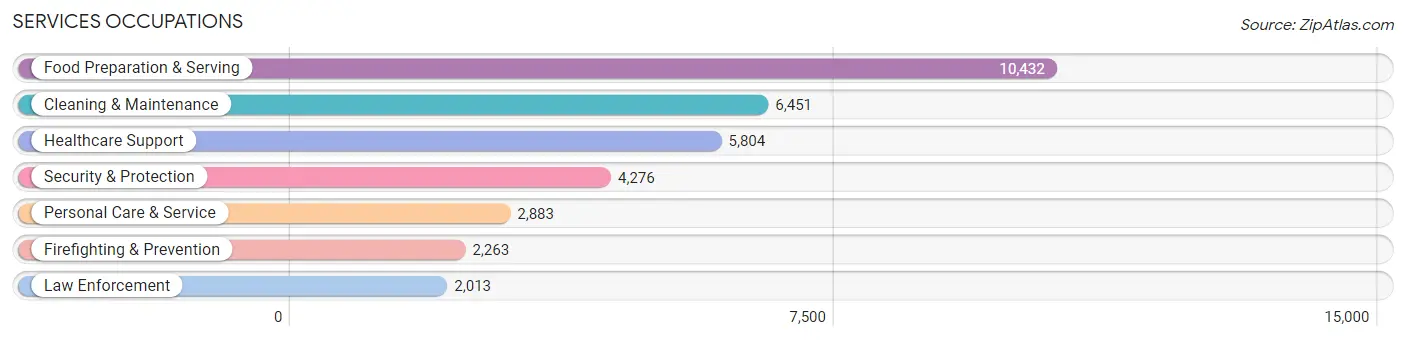
Services Occupations
The most common Services occupations in Corpus Christi are Food Preparation & Serving (10,432 | 7.1%), Cleaning & Maintenance (6,451 | 4.4%), Healthcare Support (5,804 | 4.0%), Security & Protection (4,276 | 2.9%), and Personal Care & Service (2,883 | 2.0%).
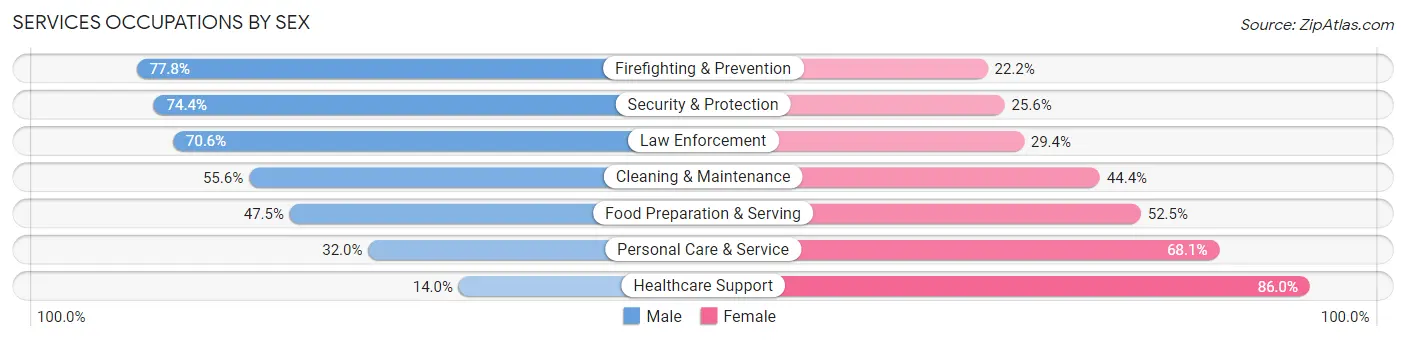
Services Occupations by Sex
Within the Services occupations in Corpus Christi, the most male-oriented occupations are Firefighting & Prevention (77.8%), Security & Protection (74.4%), and Law Enforcement (70.6%), while the most female-oriented occupations are Healthcare Support (86.0%), Personal Care & Service (68.0%), and Food Preparation & Serving (52.5%).
| Occupation | Male | Female |
| Healthcare Support | 814 (14.0%) | 4,990 (86.0%) |
| Security & Protection | 3,183 (74.4%) | 1,093 (25.6%) |
| Firefighting & Prevention | 1,761 (77.8%) | 502 (22.2%) |
| Law Enforcement | 1,422 (70.6%) | 591 (29.4%) |
| Food Preparation & Serving | 4,953 (47.5%) | 5,479 (52.5%) |
| Cleaning & Maintenance | 3,585 (55.6%) | 2,866 (44.4%) |
| Personal Care & Service | 921 (32.0%) | 1,962 (68.0%) |
| Total (Category) | 13,456 (45.1%) | 16,390 (54.9%) |
| Total (Overall) | 78,974 (53.9%) | 67,528 (46.1%) |
Sales and Office Occupations
The most common Sales and Office occupations in Corpus Christi are Office & Administration (15,849 | 10.8%), and Sales & Related (15,425 | 10.5%).

Sales and Office Occupations by Sex
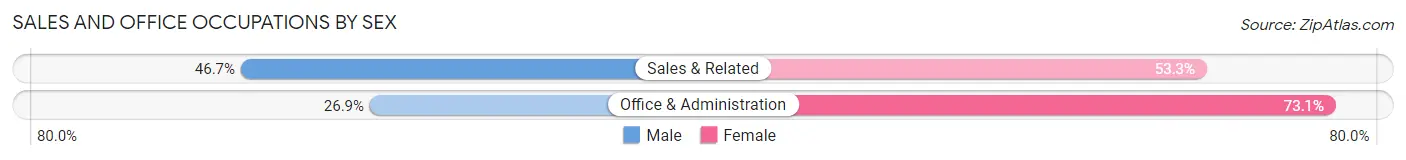
| Occupation | Male | Female |
| Sales & Related | 7,208 (46.7%) | 8,217 (53.3%) |
| Office & Administration | 4,261 (26.9%) | 11,588 (73.1%) |
| Total (Category) | 11,469 (36.7%) | 19,805 (63.3%) |
| Total (Overall) | 78,974 (53.9%) | 67,528 (46.1%) |
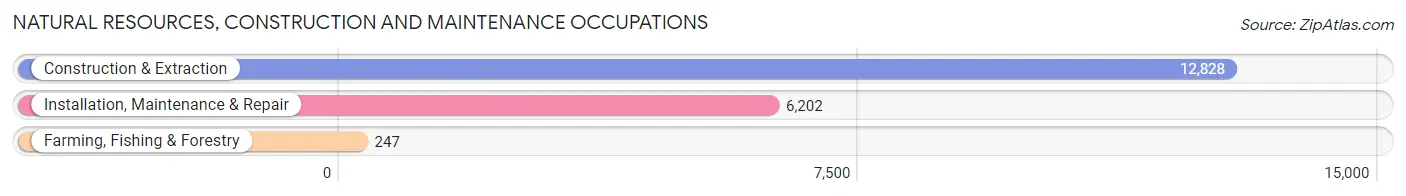
Natural Resources, Construction and Maintenance Occupations
The most common Natural Resources, Construction and Maintenance occupations in Corpus Christi are Construction & Extraction (12,828 | 8.8%), Installation, Maintenance & Repair (6,202 | 4.2%), and Farming, Fishing & Forestry (247 | 0.2%).
Natural Resources, Construction and Maintenance Occupations by Sex
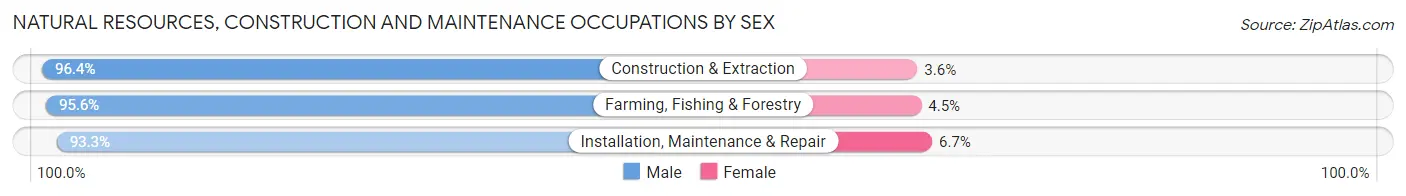
| Occupation | Male | Female |
| Farming, Fishing & Forestry | 236 (95.6%) | 11 (4.4%) |
| Construction & Extraction | 12,361 (96.4%) | 467 (3.6%) |
| Installation, Maintenance & Repair | 5,787 (93.3%) | 415 (6.7%) |
| Total (Category) | 18,384 (95.4%) | 893 (4.6%) |
| Total (Overall) | 78,974 (53.9%) | 67,528 (46.1%) |
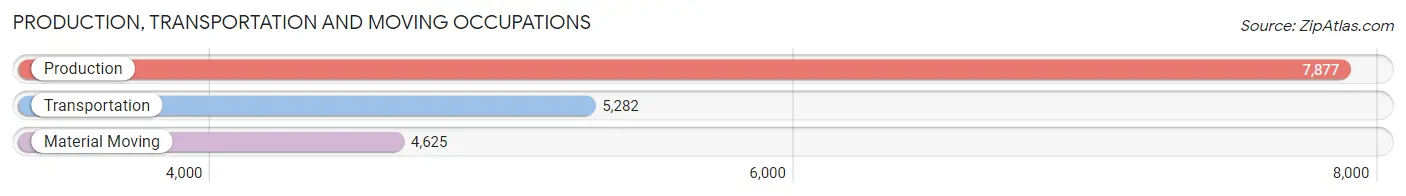
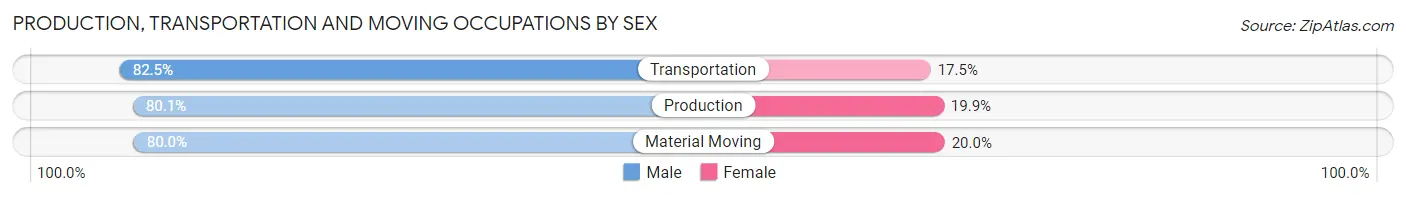
Production, Transportation and Moving Occupations
The most common Production, Transportation and Moving occupations in Corpus Christi are Production (7,877 | 5.4%), Transportation (5,282 | 3.6%), and Material Moving (4,625 | 3.2%).
Production, Transportation and Moving Occupations by Sex
| Occupation | Male | Female |
| Production | 6,311 (80.1%) | 1,566 (19.9%) |
| Transportation | 4,359 (82.5%) | 923 (17.5%) |
| Material Moving | 3,698 (80.0%) | 927 (20.0%) |
| Total (Category) | 14,368 (80.8%) | 3,416 (19.2%) |
| Total (Overall) | 78,974 (53.9%) | 67,528 (46.1%) |
Employment Industries by Sex in Corpus Christi
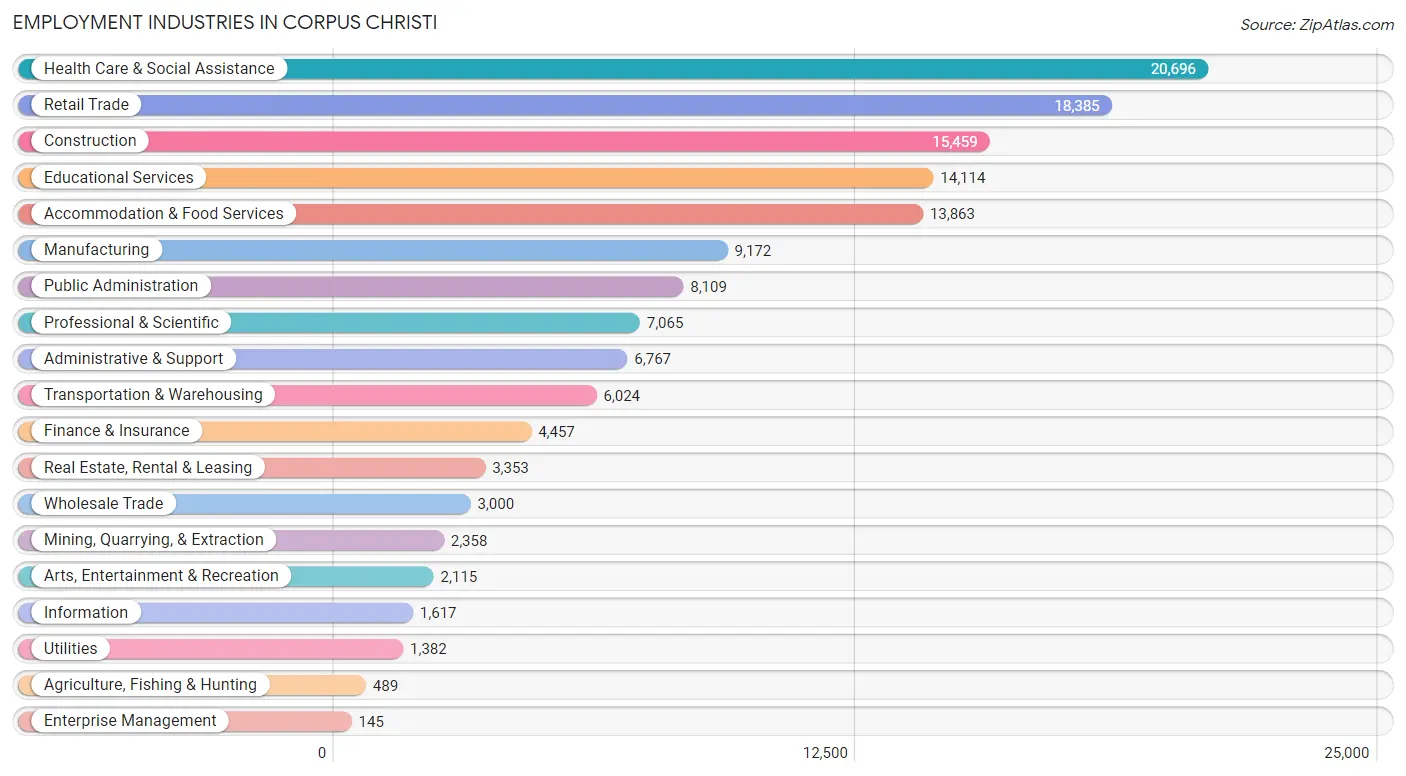
Employment Industries in Corpus Christi
The major employment industries in Corpus Christi include Health Care & Social Assistance (20,696 | 14.1%), Retail Trade (18,385 | 12.6%), Construction (15,459 | 10.5%), Educational Services (14,114 | 9.6%), and Accommodation & Food Services (13,863 | 9.5%).
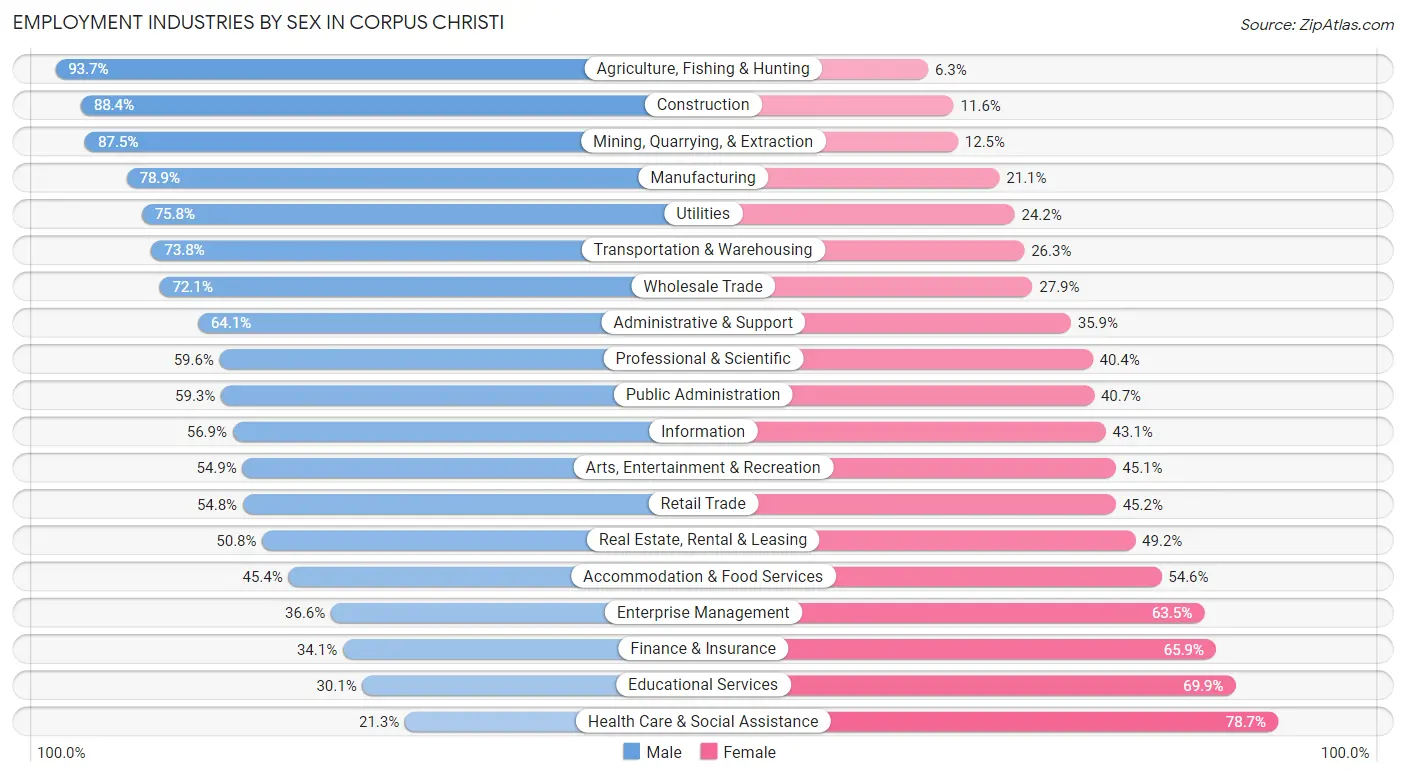
Employment Industries by Sex in Corpus Christi
The Corpus Christi industries that see more men than women are Agriculture, Fishing & Hunting (93.7%), Construction (88.4%), and Mining, Quarrying, & Extraction (87.5%), whereas the industries that tend to have a higher number of women are Health Care & Social Assistance (78.7%), Educational Services (69.9%), and Finance & Insurance (65.9%).
| Industry | Male | Female |
| Agriculture, Fishing & Hunting | 458 (93.7%) | 31 (6.3%) |
| Mining, Quarrying, & Extraction | 2,063 (87.5%) | 295 (12.5%) |
| Construction | 13,659 (88.4%) | 1,800 (11.6%) |
| Manufacturing | 7,237 (78.9%) | 1,935 (21.1%) |
| Wholesale Trade | 2,162 (72.1%) | 838 (27.9%) |
| Retail Trade | 10,076 (54.8%) | 8,309 (45.2%) |
| Transportation & Warehousing | 4,443 (73.8%) | 1,581 (26.3%) |
| Utilities | 1,047 (75.8%) | 335 (24.2%) |
| Information | 920 (56.9%) | 697 (43.1%) |
| Finance & Insurance | 1,520 (34.1%) | 2,937 (65.9%) |
| Real Estate, Rental & Leasing | 1,703 (50.8%) | 1,650 (49.2%) |
| Professional & Scientific | 4,212 (59.6%) | 2,853 (40.4%) |
| Enterprise Management | 53 (36.5%) | 92 (63.4%) |
| Administrative & Support | 4,339 (64.1%) | 2,428 (35.9%) |
| Educational Services | 4,242 (30.1%) | 9,872 (69.9%) |
| Health Care & Social Assistance | 4,399 (21.3%) | 16,297 (78.7%) |
| Arts, Entertainment & Recreation | 1,161 (54.9%) | 954 (45.1%) |
| Accommodation & Food Services | 6,290 (45.4%) | 7,573 (54.6%) |
| Public Administration | 4,810 (59.3%) | 3,299 (40.7%) |
| Total | 78,974 (53.9%) | 67,528 (46.1%) |
Education in Corpus Christi
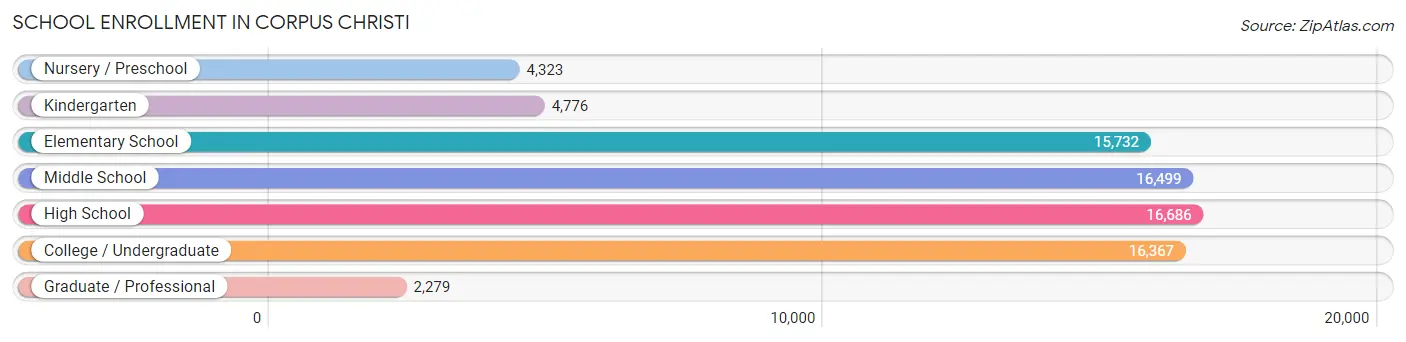
School Enrollment in Corpus Christi
The most common levels of schooling among the 76,662 students in Corpus Christi are high school (16,686 | 21.8%), middle school (16,499 | 21.5%), and college / undergraduate (16,367 | 21.3%).
| School Level | # Students | % Students |
| Nursery / Preschool | 4,323 | 5.6% |
| Kindergarten | 4,776 | 6.2% |
| Elementary School | 15,732 | 20.5% |
| Middle School | 16,499 | 21.5% |
| High School | 16,686 | 21.8% |
| College / Undergraduate | 16,367 | 21.3% |
| Graduate / Professional | 2,279 | 3.0% |
| Total | 76,662 | 100.0% |
School Enrollment by Age by Funding Source in Corpus Christi
Out of a total of 76,662 students who are enrolled in schools in Corpus Christi, 6,286 (8.2%) attend a private institution, while the remaining 70,376 (91.8%) are enrolled in public schools. The age group of 3 to 4 year olds has the highest likelihood of being enrolled in private schools, with 1,089 (31.1% in the age bracket) enrolled. Conversely, the age group of 15 to 17 year olds has the lowest likelihood of being enrolled in a private school, with 11,521 (96.9% in the age bracket) attending a public institution.
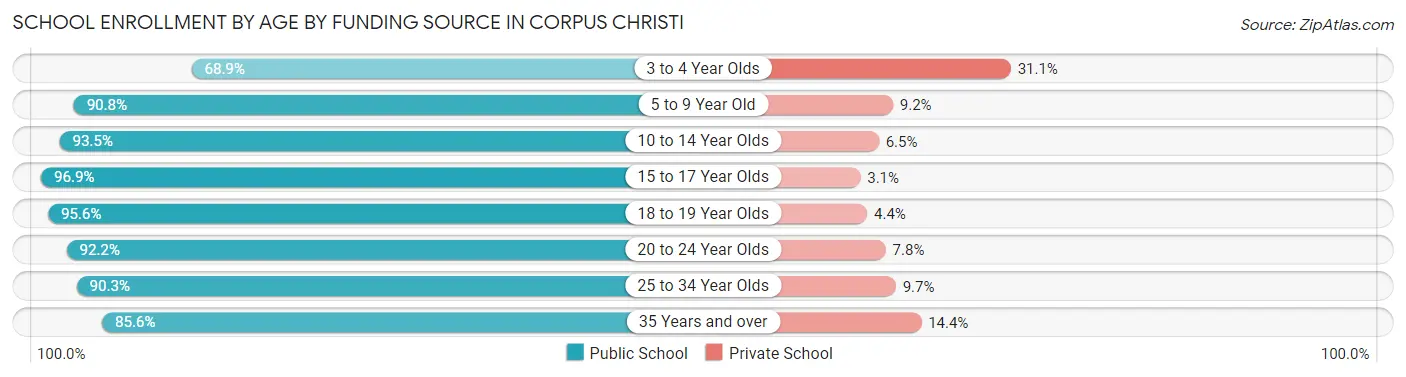
| Age Bracket | Public School | Private School |
| 3 to 4 Year Olds | 2,411 (68.9%) | 1,089 (31.1%) |
| 5 to 9 Year Old | 17,839 (90.8%) | 1,799 (9.2%) |
| 10 to 14 Year Olds | 18,782 (93.5%) | 1,310 (6.5%) |
| 15 to 17 Year Olds | 11,521 (96.9%) | 367 (3.1%) |
| 18 to 19 Year Olds | 6,643 (95.6%) | 303 (4.4%) |
| 20 to 24 Year Olds | 6,385 (92.2%) | 542 (7.8%) |
| 25 to 34 Year Olds | 3,750 (90.3%) | 403 (9.7%) |
| 35 Years and over | 3,010 (85.6%) | 508 (14.4%) |
| Total | 70,376 (91.8%) | 6,286 (8.2%) |
Educational Attainment by Field of Study in Corpus Christi
Business (10,410 | 20.5%), education (7,988 | 15.7%), science & technology (5,179 | 10.2%), arts & humanities (3,816 | 7.5%), and bio, nature & agricultural (3,550 | 7.0%) are the most common fields of study among 50,735 individuals in Corpus Christi who have obtained a bachelor's degree or higher.
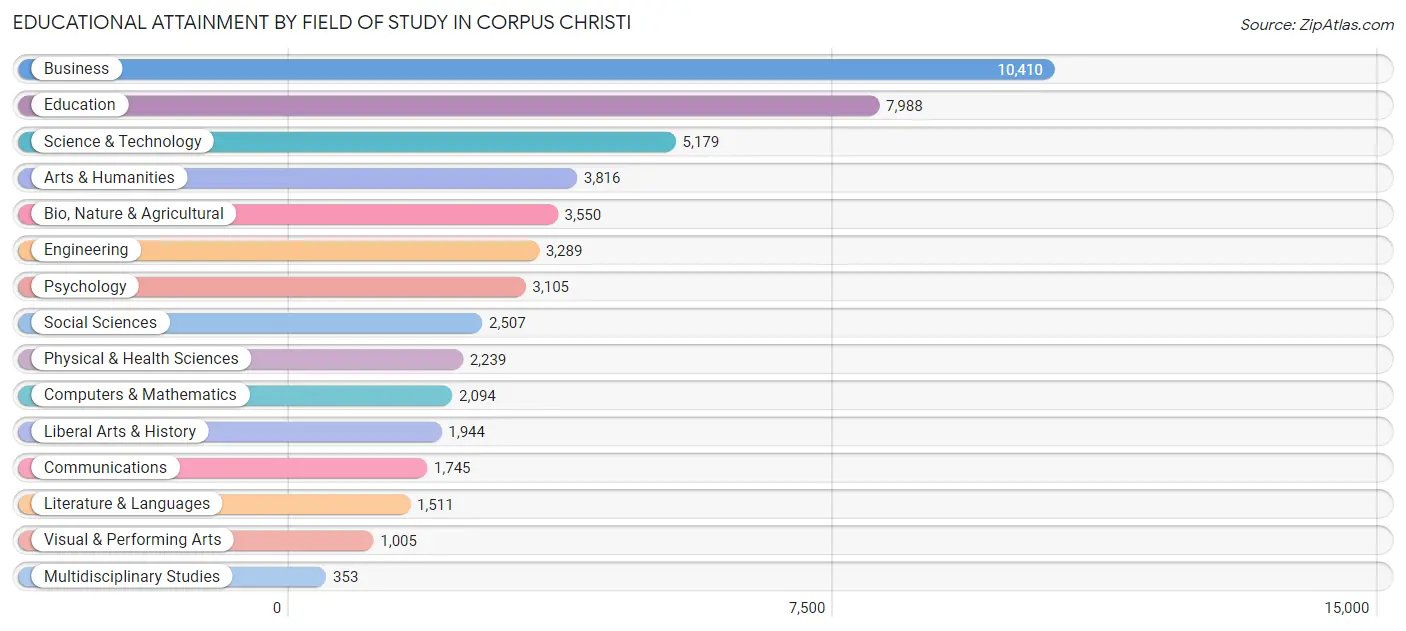
| Field of Study | # Graduates | % Graduates |
| Computers & Mathematics | 2,094 | 4.1% |
| Bio, Nature & Agricultural | 3,550 | 7.0% |
| Physical & Health Sciences | 2,239 | 4.4% |
| Psychology | 3,105 | 6.1% |
| Social Sciences | 2,507 | 4.9% |
| Engineering | 3,289 | 6.5% |
| Multidisciplinary Studies | 353 | 0.7% |
| Science & Technology | 5,179 | 10.2% |
| Business | 10,410 | 20.5% |
| Education | 7,988 | 15.7% |
| Literature & Languages | 1,511 | 3.0% |
| Liberal Arts & History | 1,944 | 3.8% |
| Visual & Performing Arts | 1,005 | 2.0% |
| Communications | 1,745 | 3.4% |
| Arts & Humanities | 3,816 | 7.5% |
| Total | 50,735 | 100.0% |
Transportation & Commute in Corpus Christi
Vehicle Availability by Sex in Corpus Christi
The most prevalent vehicle ownership categories in Corpus Christi are males with 2 vehicles (35,332, accounting for 44.5%) and females with 2 vehicles (26,901, making up 53.5%).
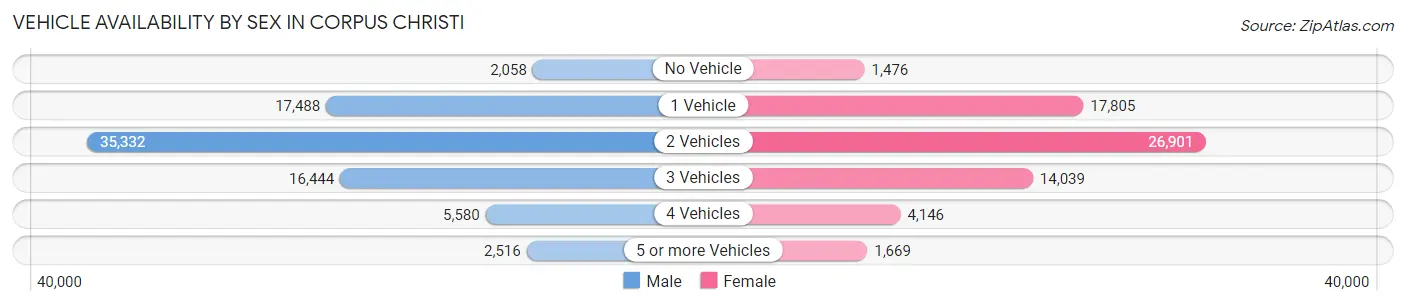
| Vehicles Available | Male | Female |
| No Vehicle | 2,058 (2.6%) | 1,476 (2.2%) |
| 1 Vehicle | 17,488 (22.0%) | 17,805 (27.0%) |
| 2 Vehicles | 35,332 (44.5%) | 26,901 (40.7%) |
| 3 Vehicles | 16,444 (20.7%) | 14,039 (21.3%) |
| 4 Vehicles | 5,580 (7.0%) | 4,146 (6.3%) |
| 5 or more Vehicles | 2,516 (3.2%) | 1,669 (2.5%) |
| Total | 79,418 (100.0%) | 66,036 (100.0%) |
Commute Time in Corpus Christi
The most frequently occuring commute durations in Corpus Christi are 15 to 19 minutes (46,395 commuters, 33.2%), 10 to 14 minutes (24,631 commuters, 17.6%), and 20 to 24 minutes (23,994 commuters, 17.2%).
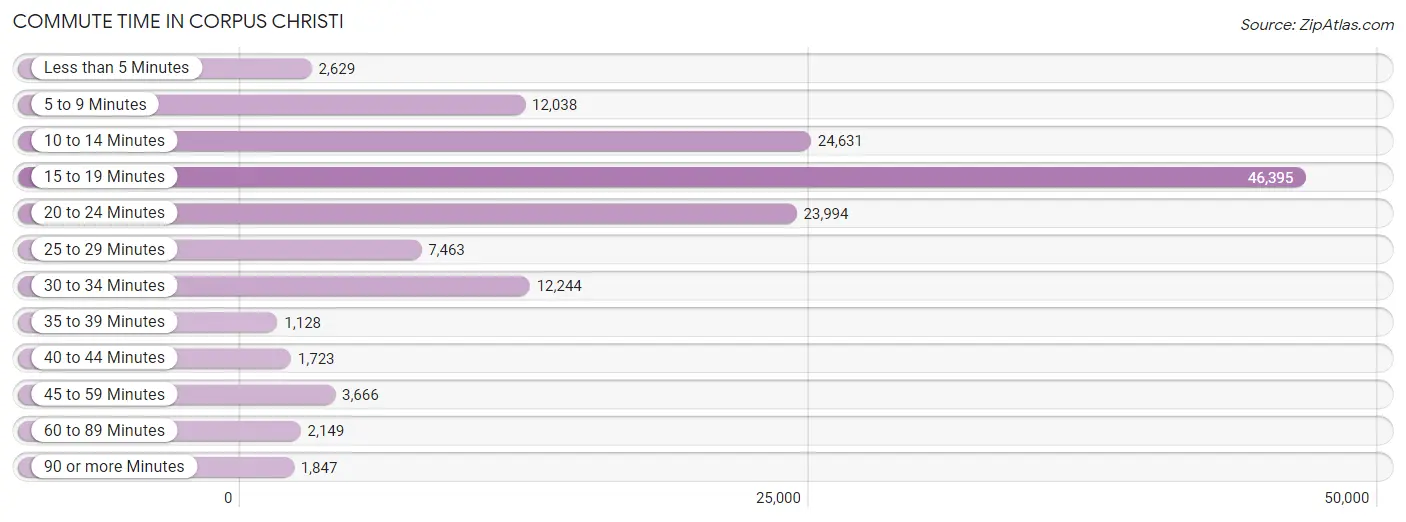
| Commute Time | # Commuters | % Commuters |
| Less than 5 Minutes | 2,629 | 1.9% |
| 5 to 9 Minutes | 12,038 | 8.6% |
| 10 to 14 Minutes | 24,631 | 17.6% |
| 15 to 19 Minutes | 46,395 | 33.2% |
| 20 to 24 Minutes | 23,994 | 17.2% |
| 25 to 29 Minutes | 7,463 | 5.3% |
| 30 to 34 Minutes | 12,244 | 8.7% |
| 35 to 39 Minutes | 1,128 | 0.8% |
| 40 to 44 Minutes | 1,723 | 1.2% |
| 45 to 59 Minutes | 3,666 | 2.6% |
| 60 to 89 Minutes | 2,149 | 1.5% |
| 90 or more Minutes | 1,847 | 1.3% |
Commute Time by Sex in Corpus Christi
The most common commute times in Corpus Christi are 15 to 19 minutes (26,413 commuters, 34.2%) for males and 15 to 19 minutes (19,982 commuters, 31.9%) for females.
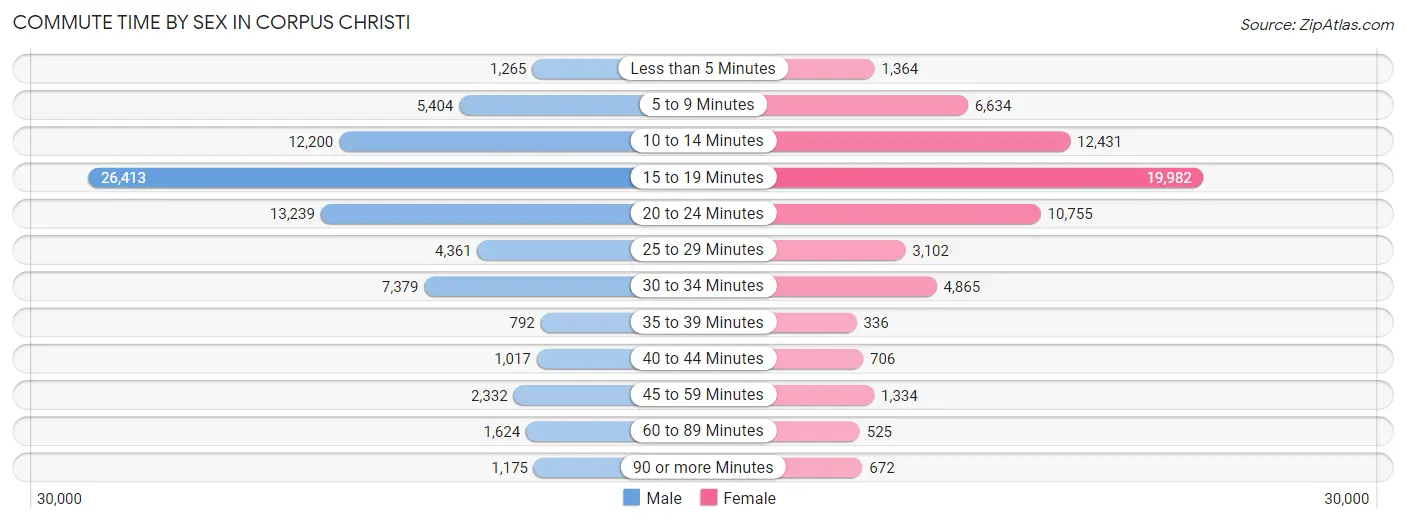
| Commute Time | Male | Female |
| Less than 5 Minutes | 1,265 (1.6%) | 1,364 (2.2%) |
| 5 to 9 Minutes | 5,404 (7.0%) | 6,634 (10.6%) |
| 10 to 14 Minutes | 12,200 (15.8%) | 12,431 (19.8%) |
| 15 to 19 Minutes | 26,413 (34.2%) | 19,982 (31.9%) |
| 20 to 24 Minutes | 13,239 (17.2%) | 10,755 (17.2%) |
| 25 to 29 Minutes | 4,361 (5.7%) | 3,102 (5.0%) |
| 30 to 34 Minutes | 7,379 (9.6%) | 4,865 (7.8%) |
| 35 to 39 Minutes | 792 (1.0%) | 336 (0.5%) |
| 40 to 44 Minutes | 1,017 (1.3%) | 706 (1.1%) |
| 45 to 59 Minutes | 2,332 (3.0%) | 1,334 (2.1%) |
| 60 to 89 Minutes | 1,624 (2.1%) | 525 (0.8%) |
| 90 or more Minutes | 1,175 (1.5%) | 672 (1.1%) |
Time of Departure to Work by Sex in Corpus Christi
The most frequent times of departure to work in Corpus Christi are 7:00 AM to 7:29 AM (12,056, 15.6%) for males and 7:30 AM to 7:59 AM (12,562, 20.0%) for females.
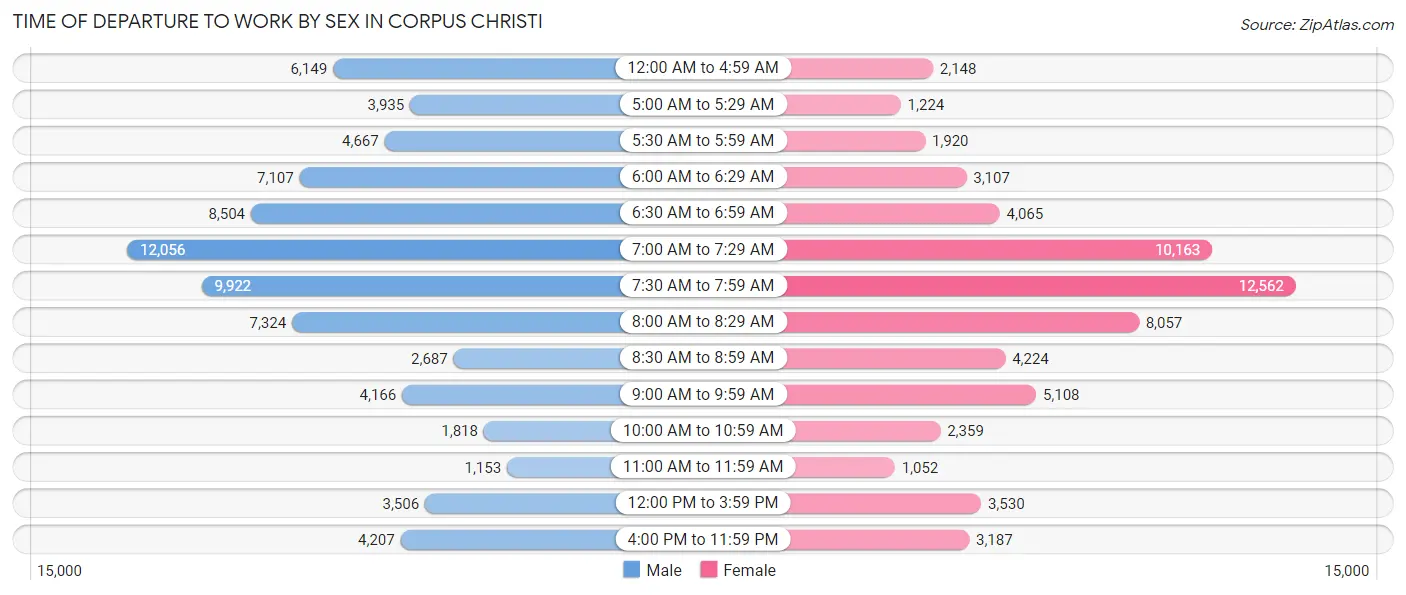
| Time of Departure | Male | Female |
| 12:00 AM to 4:59 AM | 6,149 (8.0%) | 2,148 (3.4%) |
| 5:00 AM to 5:29 AM | 3,935 (5.1%) | 1,224 (1.9%) |
| 5:30 AM to 5:59 AM | 4,667 (6.0%) | 1,920 (3.1%) |
| 6:00 AM to 6:29 AM | 7,107 (9.2%) | 3,107 (5.0%) |
| 6:30 AM to 6:59 AM | 8,504 (11.0%) | 4,065 (6.5%) |
| 7:00 AM to 7:29 AM | 12,056 (15.6%) | 10,163 (16.2%) |
| 7:30 AM to 7:59 AM | 9,922 (12.9%) | 12,562 (20.0%) |
| 8:00 AM to 8:29 AM | 7,324 (9.5%) | 8,057 (12.9%) |
| 8:30 AM to 8:59 AM | 2,687 (3.5%) | 4,224 (6.7%) |
| 9:00 AM to 9:59 AM | 4,166 (5.4%) | 5,108 (8.2%) |
| 10:00 AM to 10:59 AM | 1,818 (2.4%) | 2,359 (3.8%) |
| 11:00 AM to 11:59 AM | 1,153 (1.5%) | 1,052 (1.7%) |
| 12:00 PM to 3:59 PM | 3,506 (4.5%) | 3,530 (5.6%) |
| 4:00 PM to 11:59 PM | 4,207 (5.4%) | 3,187 (5.1%) |
| Total | 77,201 (100.0%) | 62,706 (100.0%) |
Housing Occupancy in Corpus Christi
Occupancy by Ownership in Corpus Christi
Of the total 117,555 dwellings in Corpus Christi, owner-occupied units account for 67,302 (57.3%), while renter-occupied units make up 50,253 (42.7%).
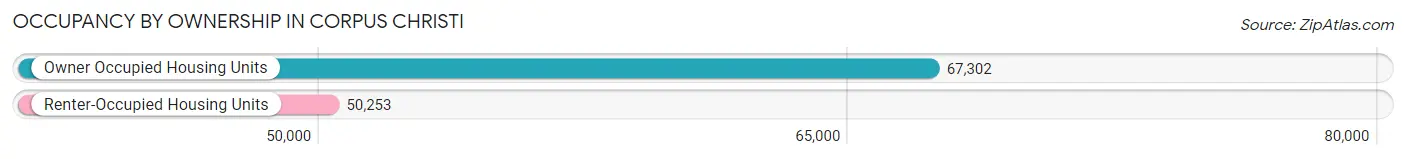
| Occupancy | # Housing Units | % Housing Units |
| Owner Occupied Housing Units | 67,302 | 57.3% |
| Renter-Occupied Housing Units | 50,253 | 42.7% |
| Total Occupied Housing Units | 117,555 | 100.0% |
Occupancy by Household Size in Corpus Christi
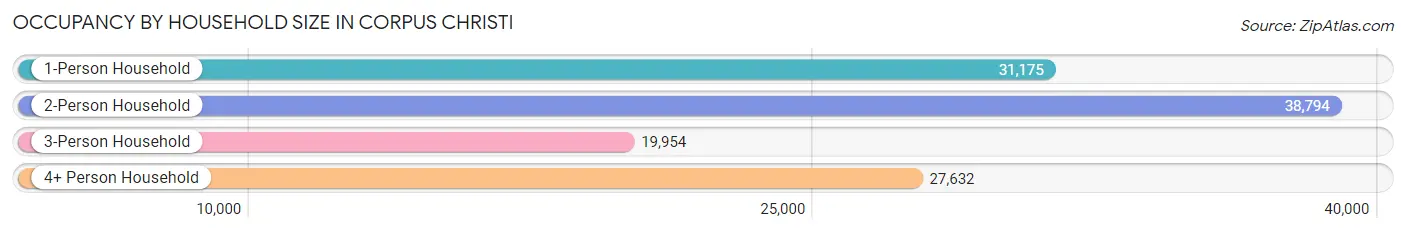
| Household Size | # Housing Units | % Housing Units |
| 1-Person Household | 31,175 | 26.5% |
| 2-Person Household | 38,794 | 33.0% |
| 3-Person Household | 19,954 | 17.0% |
| 4+ Person Household | 27,632 | 23.5% |
| Total Housing Units | 117,555 | 100.0% |
Occupancy by Ownership by Household Size in Corpus Christi
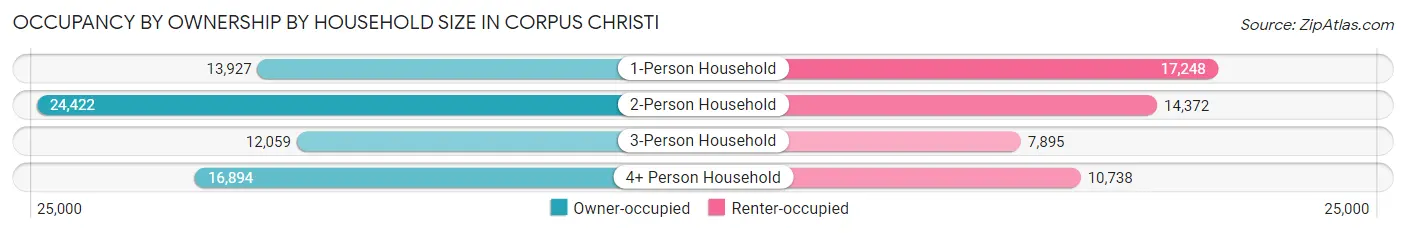
| Household Size | Owner-occupied | Renter-occupied |
| 1-Person Household | 13,927 (44.7%) | 17,248 (55.3%) |
| 2-Person Household | 24,422 (62.9%) | 14,372 (37.0%) |
| 3-Person Household | 12,059 (60.4%) | 7,895 (39.6%) |
| 4+ Person Household | 16,894 (61.1%) | 10,738 (38.9%) |
| Total Housing Units | 67,302 (57.3%) | 50,253 (42.7%) |
Occupancy by Educational Attainment in Corpus Christi
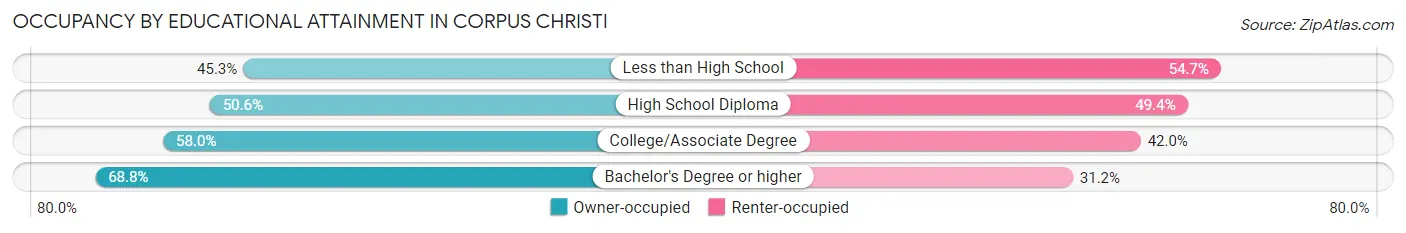
| Household Size | Owner-occupied | Renter-occupied |
| Less than High School | 7,089 (45.3%) | 8,546 (54.7%) |
| High School Diploma | 14,748 (50.6%) | 14,380 (49.4%) |
| College/Associate Degree | 24,910 (58.0%) | 18,005 (42.0%) |
| Bachelor's Degree or higher | 20,555 (68.8%) | 9,322 (31.2%) |
Occupancy by Age of Householder in Corpus Christi
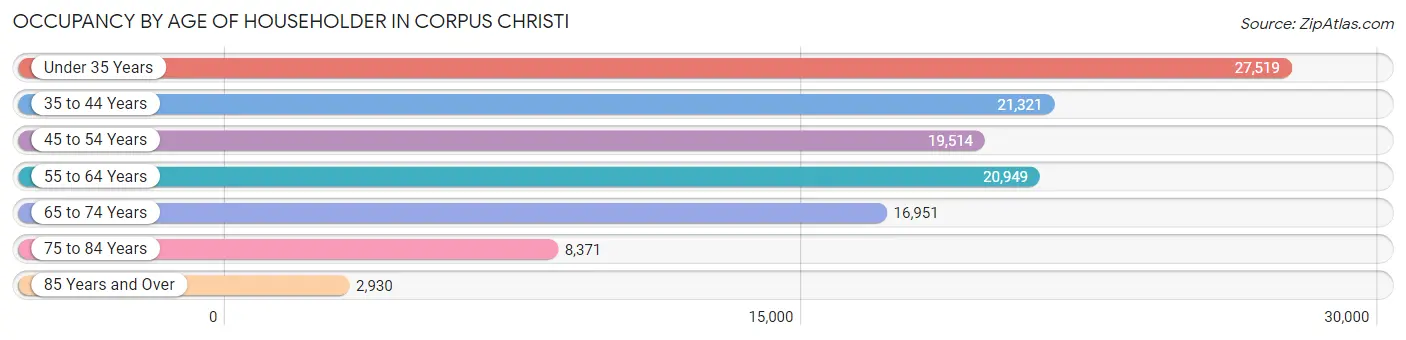
| Age Bracket | # Households | % Households |
| Under 35 Years | 27,519 | 23.4% |
| 35 to 44 Years | 21,321 | 18.1% |
| 45 to 54 Years | 19,514 | 16.6% |
| 55 to 64 Years | 20,949 | 17.8% |
| 65 to 74 Years | 16,951 | 14.4% |
| 75 to 84 Years | 8,371 | 7.1% |
| 85 Years and Over | 2,930 | 2.5% |
| Total | 117,555 | 100.0% |
Housing Finances in Corpus Christi
Median Income by Occupancy in Corpus Christi
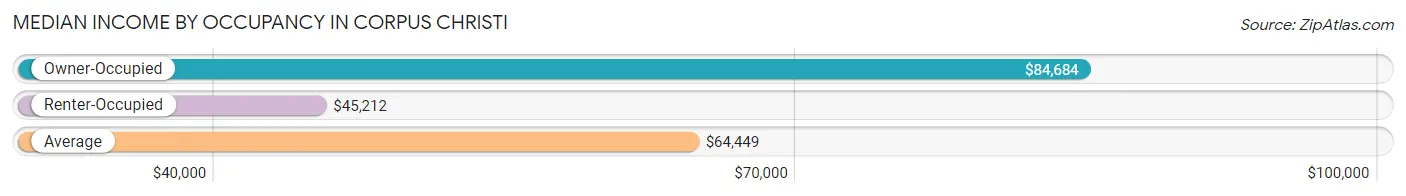
| Occupancy Type | # Households | Median Income |
| Owner-Occupied | 67,302 (57.3%) | $84,684 |
| Renter-Occupied | 50,253 (42.7%) | $45,212 |
| Average | 117,555 (100.0%) | $64,449 |
Occupancy by Householder Income Bracket in Corpus Christi
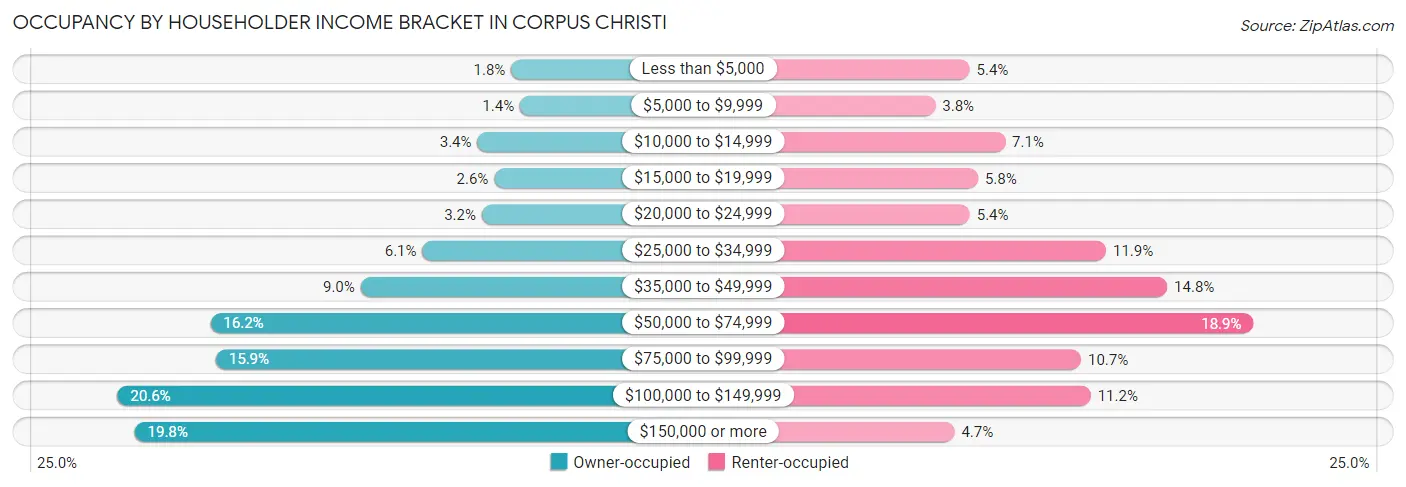
| Income Bracket | Owner-occupied | Renter-occupied |
| Less than $5,000 | 1,234 (1.8%) | 2,731 (5.4%) |
| $5,000 to $9,999 | 951 (1.4%) | 1,912 (3.8%) |
| $10,000 to $14,999 | 2,316 (3.4%) | 3,579 (7.1%) |
| $15,000 to $19,999 | 1,780 (2.6%) | 2,931 (5.8%) |
| $20,000 to $24,999 | 2,176 (3.2%) | 2,735 (5.4%) |
| $25,000 to $34,999 | 4,078 (6.1%) | 5,997 (11.9%) |
| $35,000 to $49,999 | 6,056 (9.0%) | 7,459 (14.8%) |
| $50,000 to $74,999 | 10,866 (16.2%) | 9,520 (18.9%) |
| $75,000 to $99,999 | 10,692 (15.9%) | 5,396 (10.7%) |
| $100,000 to $149,999 | 13,852 (20.6%) | 5,628 (11.2%) |
| $150,000 or more | 13,301 (19.8%) | 2,365 (4.7%) |
| Total | 67,302 (100.0%) | 50,253 (100.0%) |
Monthly Housing Cost Tiers in Corpus Christi
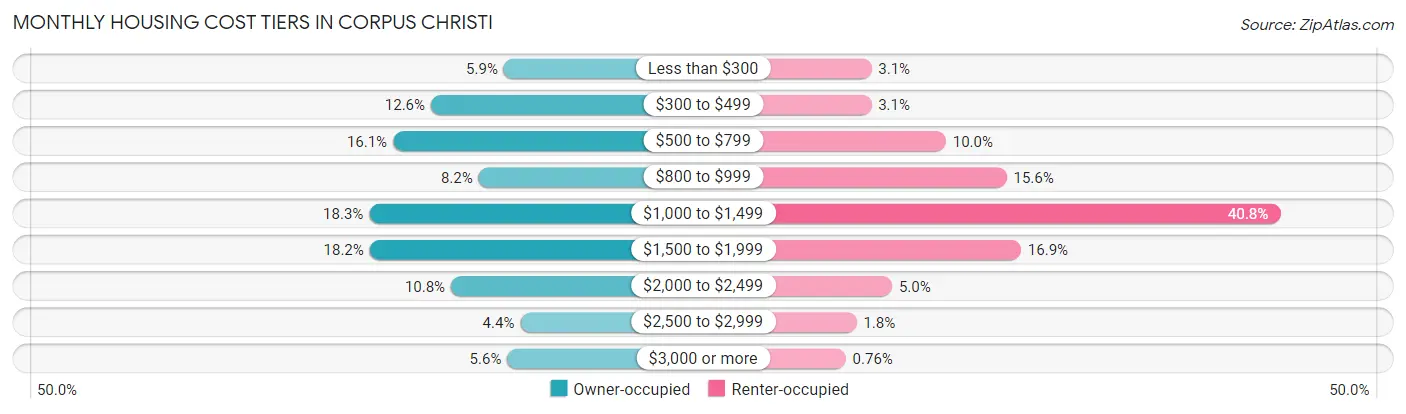
| Monthly Cost | Owner-occupied | Renter-occupied |
| Less than $300 | 3,963 (5.9%) | 1,566 (3.1%) |
| $300 to $499 | 8,479 (12.6%) | 1,562 (3.1%) |
| $500 to $799 | 10,828 (16.1%) | 5,015 (10.0%) |
| $800 to $999 | 5,524 (8.2%) | 7,825 (15.6%) |
| $1,000 to $1,499 | 12,301 (18.3%) | 20,478 (40.7%) |
| $1,500 to $1,999 | 12,278 (18.2%) | 8,487 (16.9%) |
| $2,000 to $2,499 | 7,237 (10.7%) | 2,521 (5.0%) |
| $2,500 to $2,999 | 2,941 (4.4%) | 877 (1.8%) |
| $3,000 or more | 3,751 (5.6%) | 380 (0.8%) |
| Total | 67,302 (100.0%) | 50,253 (100.0%) |
Physical Housing Characteristics in Corpus Christi
Housing Structures in Corpus Christi
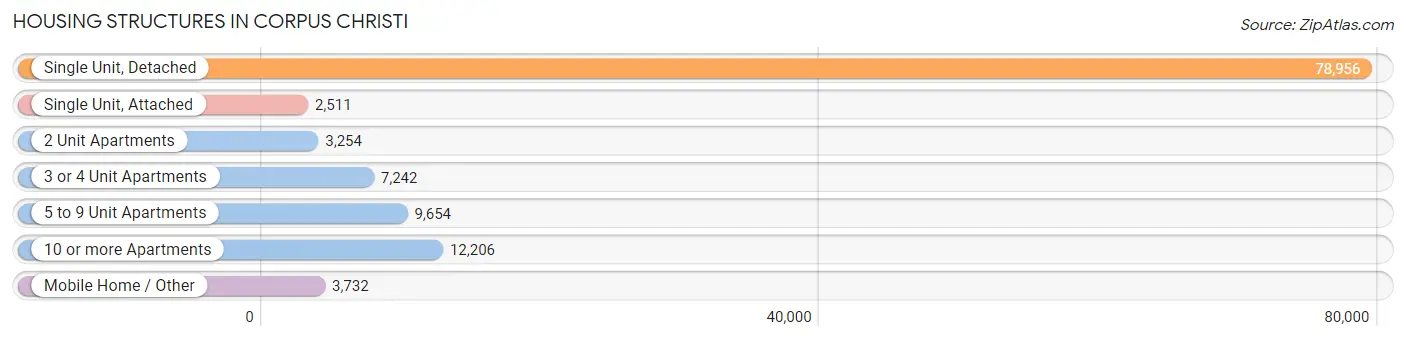
| Structure Type | # Housing Units | % Housing Units |
| Single Unit, Detached | 78,956 | 67.2% |
| Single Unit, Attached | 2,511 | 2.1% |
| 2 Unit Apartments | 3,254 | 2.8% |
| 3 or 4 Unit Apartments | 7,242 | 6.2% |
| 5 to 9 Unit Apartments | 9,654 | 8.2% |
| 10 or more Apartments | 12,206 | 10.4% |
| Mobile Home / Other | 3,732 | 3.2% |
| Total | 117,555 | 100.0% |
Housing Structures by Occupancy in Corpus Christi
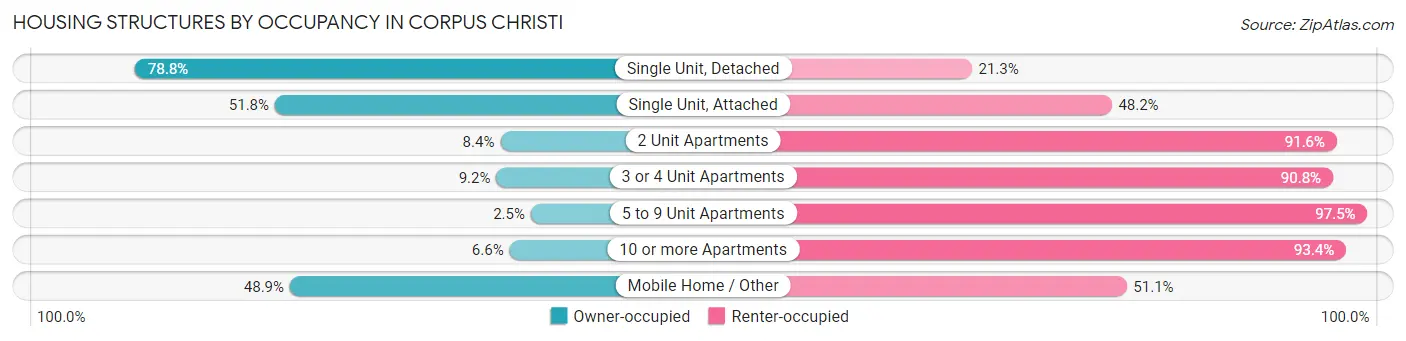
| Structure Type | Owner-occupied | Renter-occupied |
| Single Unit, Detached | 62,180 (78.7%) | 16,776 (21.2%) |
| Single Unit, Attached | 1,301 (51.8%) | 1,210 (48.2%) |
| 2 Unit Apartments | 274 (8.4%) | 2,980 (91.6%) |
| 3 or 4 Unit Apartments | 665 (9.2%) | 6,577 (90.8%) |
| 5 to 9 Unit Apartments | 245 (2.5%) | 9,409 (97.5%) |
| 10 or more Apartments | 811 (6.6%) | 11,395 (93.4%) |
| Mobile Home / Other | 1,826 (48.9%) | 1,906 (51.1%) |
| Total | 67,302 (57.3%) | 50,253 (42.7%) |
Housing Structures by Number of Rooms in Corpus Christi
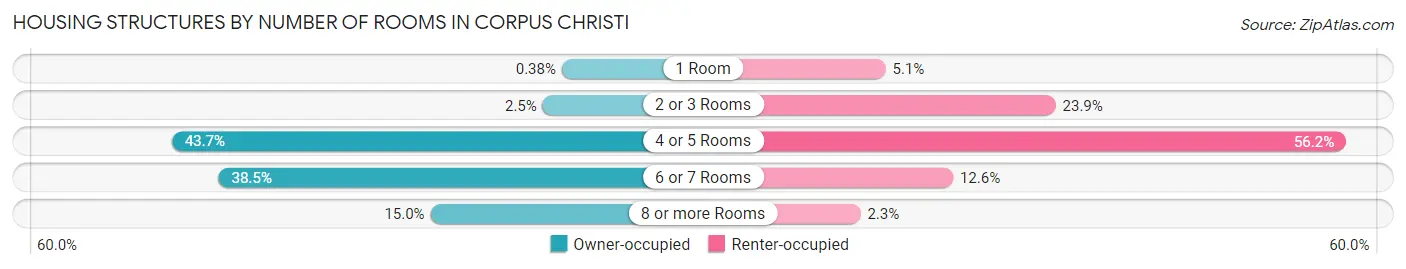
| Number of Rooms | Owner-occupied | Renter-occupied |
| 1 Room | 258 (0.4%) | 2,547 (5.1%) |
| 2 or 3 Rooms | 1,691 (2.5%) | 12,033 (23.9%) |
| 4 or 5 Rooms | 29,389 (43.7%) | 28,221 (56.2%) |
| 6 or 7 Rooms | 25,894 (38.5%) | 6,307 (12.6%) |
| 8 or more Rooms | 10,070 (15.0%) | 1,145 (2.3%) |
| Total | 67,302 (100.0%) | 50,253 (100.0%) |
Housing Structure by Heating Type in Corpus Christi
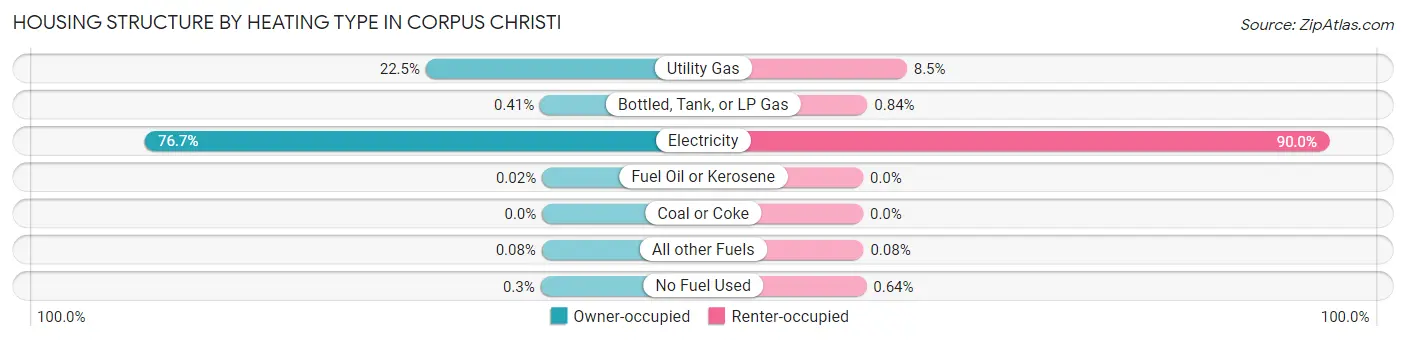
| Heating Type | Owner-occupied | Renter-occupied |
| Utility Gas | 15,128 (22.5%) | 4,245 (8.5%) |
| Bottled, Tank, or LP Gas | 277 (0.4%) | 420 (0.8%) |
| Electricity | 51,633 (76.7%) | 45,225 (90.0%) |
| Fuel Oil or Kerosene | 11 (0.0%) | 0 (0.0%) |
| Coal or Coke | 0 (0.0%) | 0 (0.0%) |
| All other Fuels | 54 (0.1%) | 39 (0.1%) |
| No Fuel Used | 199 (0.3%) | 324 (0.6%) |
| Total | 67,302 (100.0%) | 50,253 (100.0%) |
Household Vehicle Usage in Corpus Christi
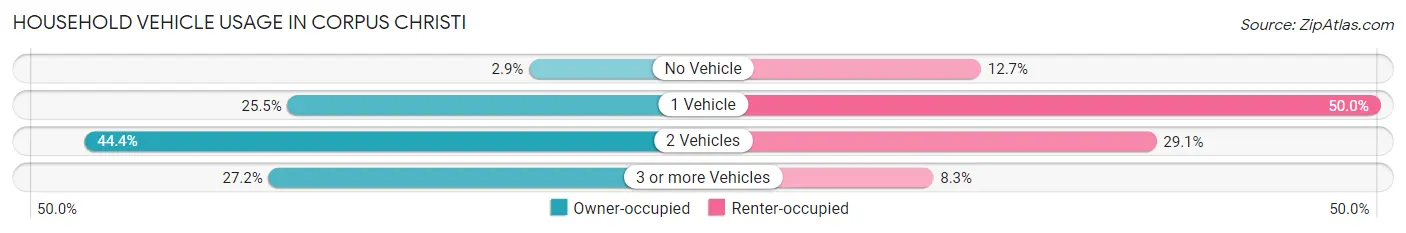
| Vehicles per Household | Owner-occupied | Renter-occupied |
| No Vehicle | 1,953 (2.9%) | 6,377 (12.7%) |
| 1 Vehicle | 17,127 (25.5%) | 25,121 (50.0%) |
| 2 Vehicles | 29,894 (44.4%) | 14,610 (29.1%) |
| 3 or more Vehicles | 18,328 (27.2%) | 4,145 (8.3%) |
| Total | 67,302 (100.0%) | 50,253 (100.0%) |
Real Estate & Mortgages in Corpus Christi
Real Estate and Mortgage Overview in Corpus Christi
| Characteristic | Without Mortgage | With Mortgage |
| Housing Units | 30,187 | 37,115 |
| Median Property Value | $145,800 | $205,500 |
| Median Household Income | $64,048 | $9,039 |
| Monthly Housing Costs | $575 | $3,701 |
| Real Estate Taxes | $2,094 | $2,719 |
Property Value by Mortgage Status in Corpus Christi
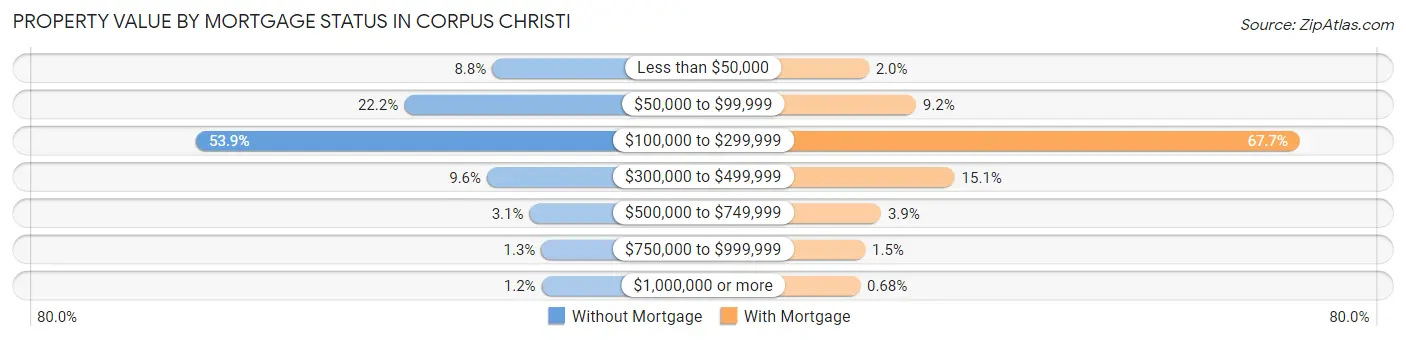
| Property Value | Without Mortgage | With Mortgage |
| Less than $50,000 | 2,648 (8.8%) | 745 (2.0%) |
| $50,000 to $99,999 | 6,700 (22.2%) | 3,416 (9.2%) |
| $100,000 to $299,999 | 16,260 (53.9%) | 25,123 (67.7%) |
| $300,000 to $499,999 | 2,886 (9.6%) | 5,605 (15.1%) |
| $500,000 to $749,999 | 932 (3.1%) | 1,435 (3.9%) |
| $750,000 to $999,999 | 386 (1.3%) | 540 (1.5%) |
| $1,000,000 or more | 375 (1.2%) | 251 (0.7%) |
| Total | 30,187 (100.0%) | 37,115 (100.0%) |
Household Income by Mortgage Status in Corpus Christi
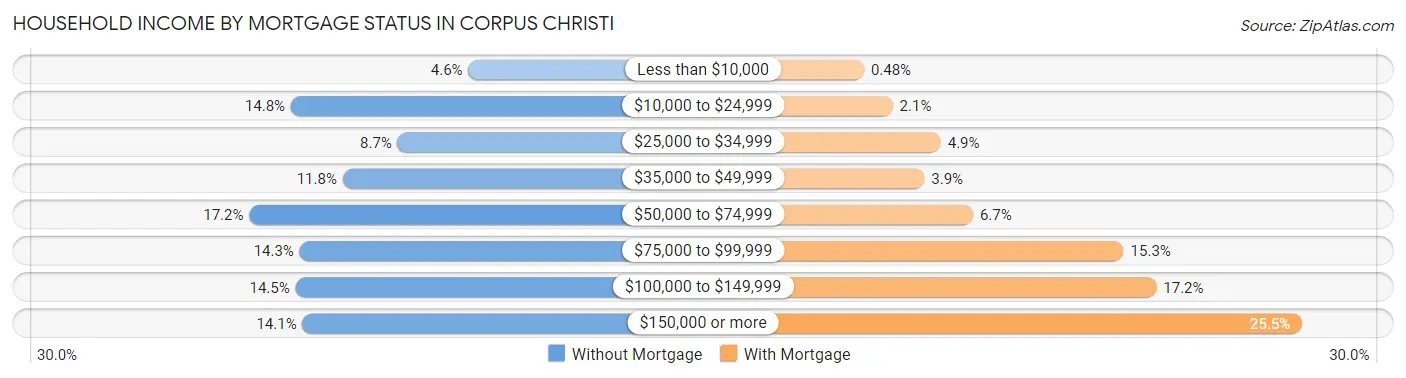
| Household Income | Without Mortgage | With Mortgage |
| Less than $10,000 | 1,400 (4.6%) | 178 (0.5%) |
| $10,000 to $24,999 | 4,463 (14.8%) | 785 (2.1%) |
| $25,000 to $34,999 | 2,620 (8.7%) | 1,809 (4.9%) |
| $35,000 to $49,999 | 3,567 (11.8%) | 1,458 (3.9%) |
| $50,000 to $74,999 | 5,181 (17.2%) | 2,489 (6.7%) |
| $75,000 to $99,999 | 4,312 (14.3%) | 5,685 (15.3%) |
| $100,000 to $149,999 | 4,382 (14.5%) | 6,380 (17.2%) |
| $150,000 or more | 4,262 (14.1%) | 9,470 (25.5%) |
| Total | 30,187 (100.0%) | 37,115 (100.0%) |
Property Value to Household Income Ratio in Corpus Christi
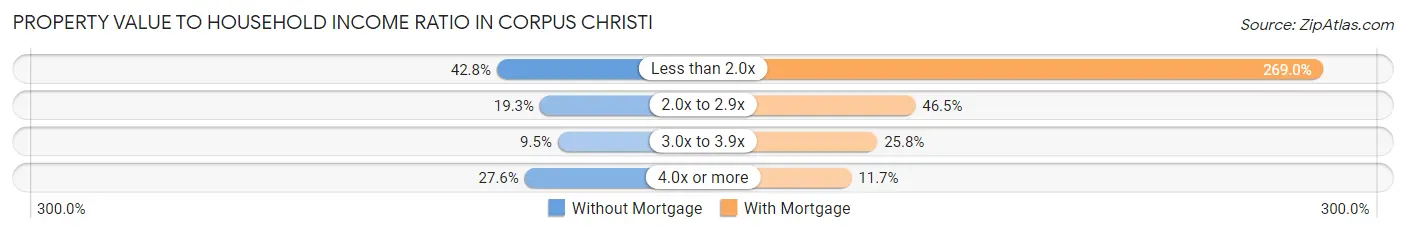
| Value-to-Income Ratio | Without Mortgage | With Mortgage |
| Less than 2.0x | 12,906 (42.7%) | 99,825 (269.0%) |
| 2.0x to 2.9x | 5,813 (19.3%) | 17,264 (46.5%) |
| 3.0x to 3.9x | 2,875 (9.5%) | 9,562 (25.8%) |
| 4.0x or more | 8,322 (27.6%) | 4,331 (11.7%) |
| Total | 30,187 (100.0%) | 37,115 (100.0%) |
Real Estate Taxes by Mortgage Status in Corpus Christi
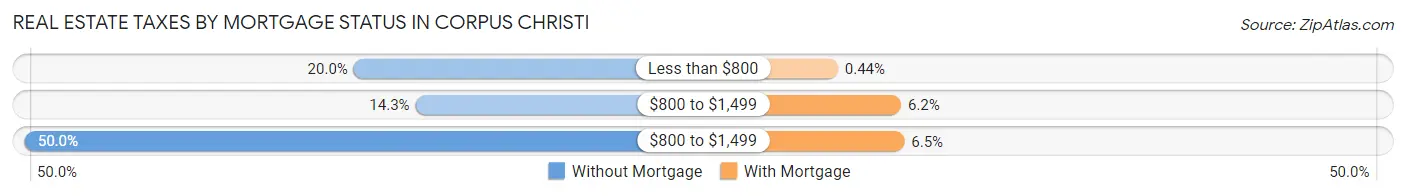
| Property Taxes | Without Mortgage | With Mortgage |
| Less than $800 | 6,023 (20.0%) | 165 (0.4%) |
| $800 to $1,499 | 4,319 (14.3%) | 2,303 (6.2%) |
| $800 to $1,499 | 15,086 (50.0%) | 2,416 (6.5%) |
| Total | 30,187 (100.0%) | 37,115 (100.0%) |
Health & Disability in Corpus Christi
Health Insurance Coverage by Age in Corpus Christi
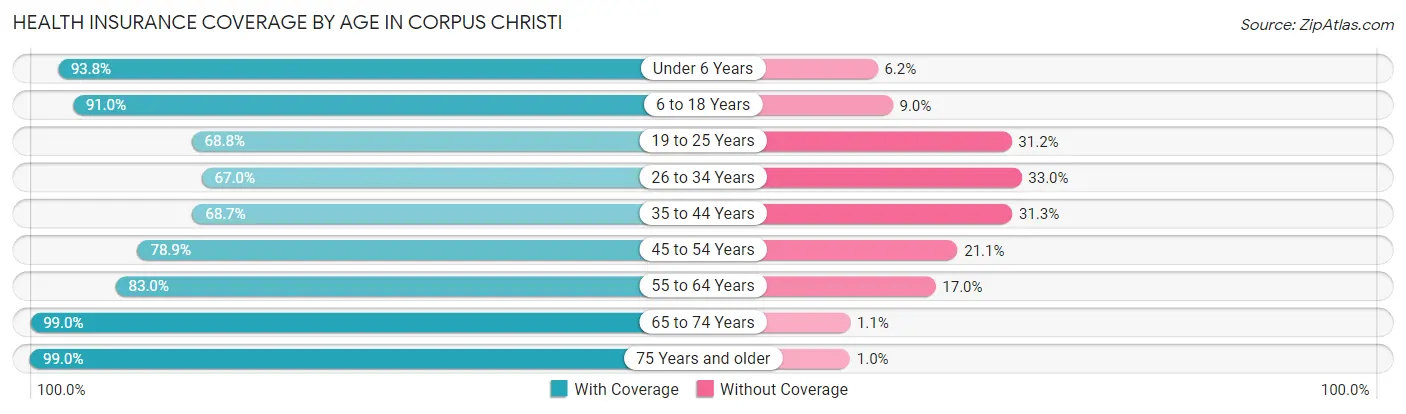
| Age Bracket | With Coverage | Without Coverage |
| Under 6 Years | 23,429 (93.8%) | 1,542 (6.2%) |
| 6 to 18 Years | 51,035 (91.0%) | 5,041 (9.0%) |
| 19 to 25 Years | 22,091 (68.8%) | 10,001 (31.2%) |
| 26 to 34 Years | 26,767 (67.0%) | 13,196 (33.0%) |
| 35 to 44 Years | 28,734 (68.7%) | 13,085 (31.3%) |
| 45 to 54 Years | 28,488 (78.9%) | 7,606 (21.1%) |
| 55 to 64 Years | 30,151 (83.0%) | 6,168 (17.0%) |
| 65 to 74 Years | 27,177 (99.0%) | 289 (1.1%) |
| 75 Years and older | 17,051 (99.0%) | 177 (1.0%) |
| Total | 254,923 (81.7%) | 57,105 (18.3%) |
Health Insurance Coverage by Citizenship Status in Corpus Christi
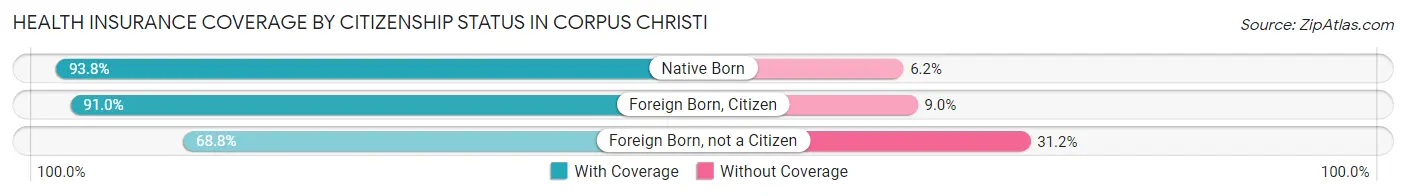
| Citizenship Status | With Coverage | Without Coverage |
| Native Born | 23,429 (93.8%) | 1,542 (6.2%) |
| Foreign Born, Citizen | 51,035 (91.0%) | 5,041 (9.0%) |
| Foreign Born, not a Citizen | 22,091 (68.8%) | 10,001 (31.2%) |
Health Insurance Coverage by Household Income in Corpus Christi
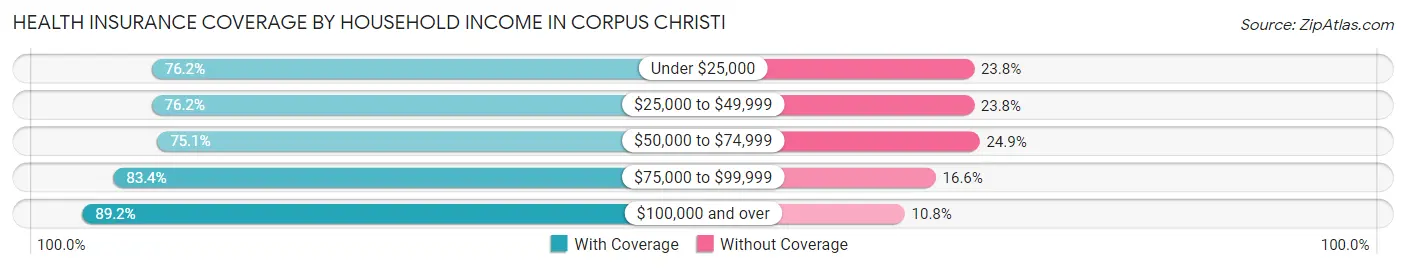
| Household Income | With Coverage | Without Coverage |
| Under $25,000 | 33,606 (76.2%) | 10,516 (23.8%) |
| $25,000 to $49,999 | 41,741 (76.2%) | 13,039 (23.8%) |
| $50,000 to $74,999 | 38,469 (75.1%) | 12,726 (24.9%) |
| $75,000 to $99,999 | 39,028 (83.4%) | 7,789 (16.6%) |
| $100,000 and over | 98,468 (89.2%) | 11,955 (10.8%) |
Public vs Private Health Insurance Coverage by Age in Corpus Christi
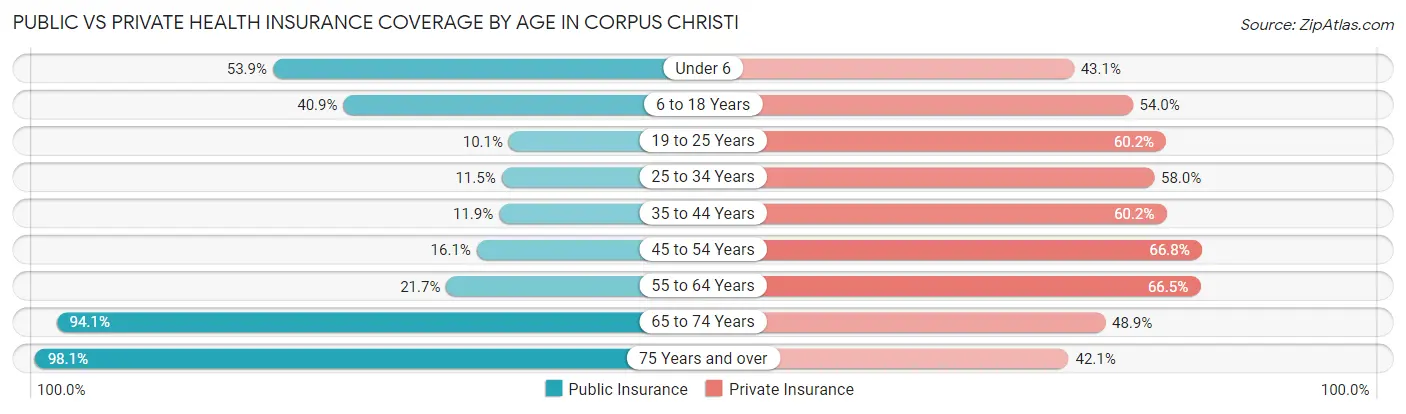
| Age Bracket | Public Insurance | Private Insurance |
| Under 6 | 13,466 (53.9%) | 10,749 (43.0%) |
| 6 to 18 Years | 22,907 (40.8%) | 30,271 (54.0%) |
| 19 to 25 Years | 3,248 (10.1%) | 19,307 (60.2%) |
| 25 to 34 Years | 4,589 (11.5%) | 23,161 (58.0%) |
| 35 to 44 Years | 4,995 (11.9%) | 25,179 (60.2%) |
| 45 to 54 Years | 5,808 (16.1%) | 24,098 (66.8%) |
| 55 to 64 Years | 7,897 (21.7%) | 24,145 (66.5%) |
| 65 to 74 Years | 25,837 (94.1%) | 13,420 (48.9%) |
| 75 Years and over | 16,902 (98.1%) | 7,252 (42.1%) |
| Total | 105,649 (33.9%) | 177,582 (56.9%) |
Disability Status by Sex by Age in Corpus Christi
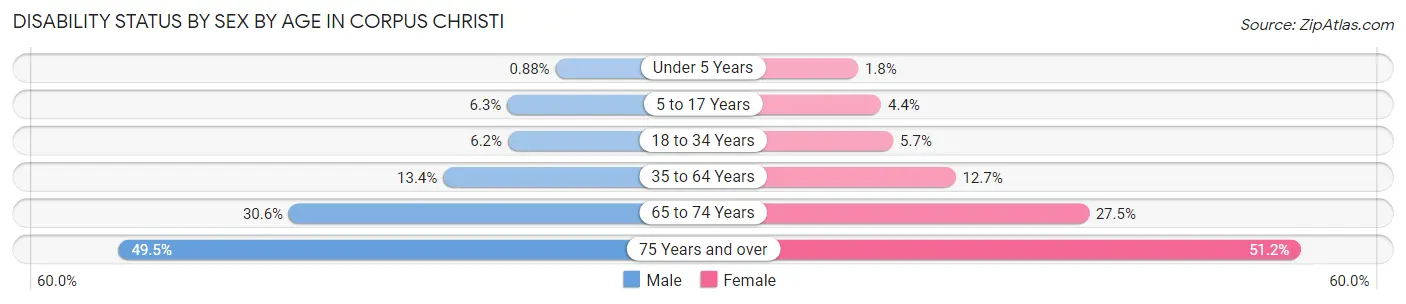
| Age Bracket | Male | Female |
| Under 5 Years | 92 (0.9%) | 172 (1.8%) |
| 5 to 17 Years | 1,794 (6.3%) | 1,205 (4.4%) |
| 18 to 34 Years | 2,389 (6.2%) | 2,192 (5.7%) |
| 35 to 64 Years | 7,540 (13.4%) | 7,330 (12.7%) |
| 65 to 74 Years | 4,002 (30.6%) | 3,952 (27.5%) |
| 75 Years and over | 3,591 (49.5%) | 5,105 (51.2%) |
Disability Class by Sex by Age in Corpus Christi
Disability Class: Hearing Difficulty
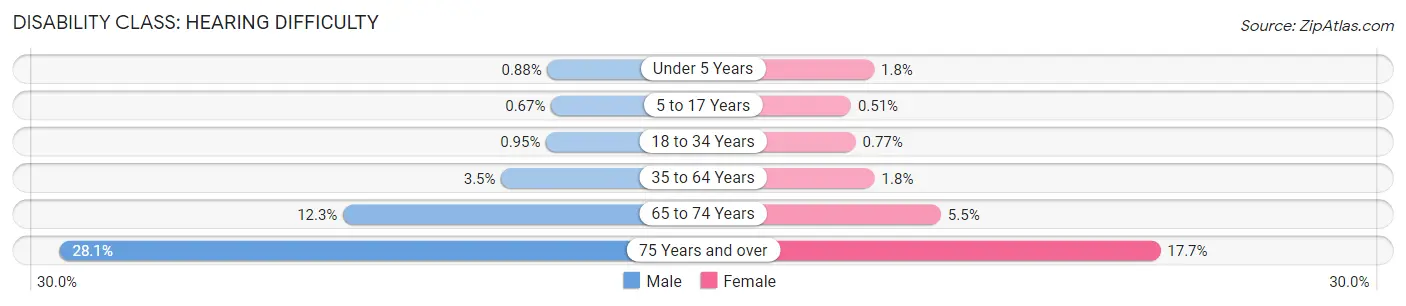
| Age Bracket | Male | Female |
| Under 5 Years | 92 (0.9%) | 172 (1.8%) |
| 5 to 17 Years | 191 (0.7%) | 140 (0.5%) |
| 18 to 34 Years | 367 (0.9%) | 294 (0.8%) |
| 35 to 64 Years | 1,946 (3.5%) | 1,058 (1.8%) |
| 65 to 74 Years | 1,605 (12.3%) | 793 (5.5%) |
| 75 Years and over | 2,033 (28.1%) | 1,770 (17.7%) |
Disability Class: Vision Difficulty
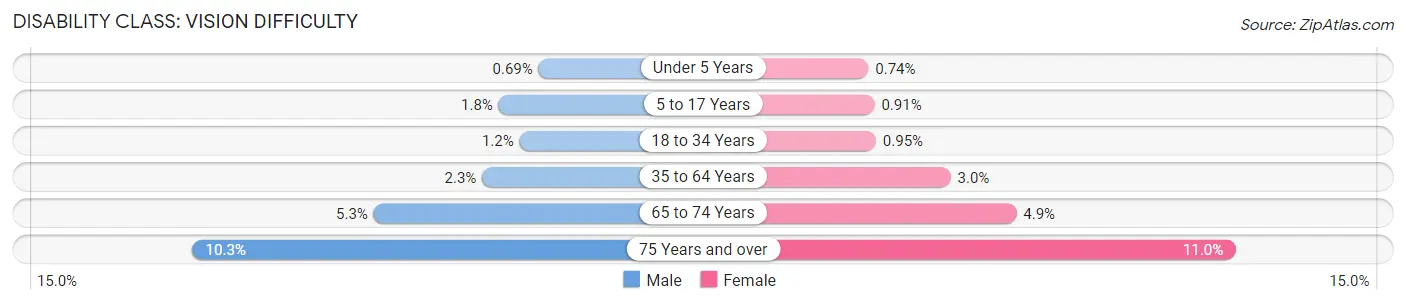
| Age Bracket | Male | Female |
| Under 5 Years | 72 (0.7%) | 71 (0.7%) |
| 5 to 17 Years | 516 (1.8%) | 251 (0.9%) |
| 18 to 34 Years | 470 (1.2%) | 364 (0.9%) |
| 35 to 64 Years | 1,273 (2.3%) | 1,757 (3.0%) |
| 65 to 74 Years | 692 (5.3%) | 698 (4.9%) |
| 75 Years and over | 748 (10.3%) | 1,093 (11.0%) |
Disability Class: Cognitive Difficulty
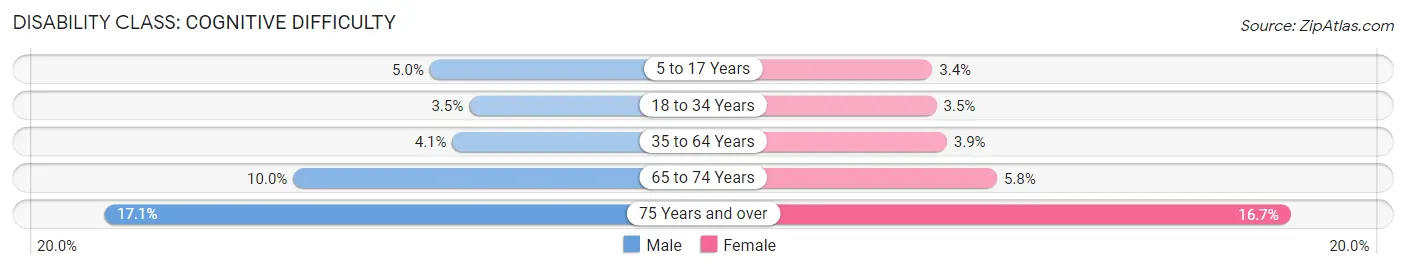
| Age Bracket | Male | Female |
| 5 to 17 Years | 1,421 (5.0%) | 923 (3.4%) |
| 18 to 34 Years | 1,351 (3.5%) | 1,349 (3.5%) |
| 35 to 64 Years | 2,321 (4.1%) | 2,259 (3.9%) |
| 65 to 74 Years | 1,314 (10.0%) | 828 (5.8%) |
| 75 Years and over | 1,236 (17.1%) | 1,663 (16.7%) |
Disability Class: Ambulatory Difficulty
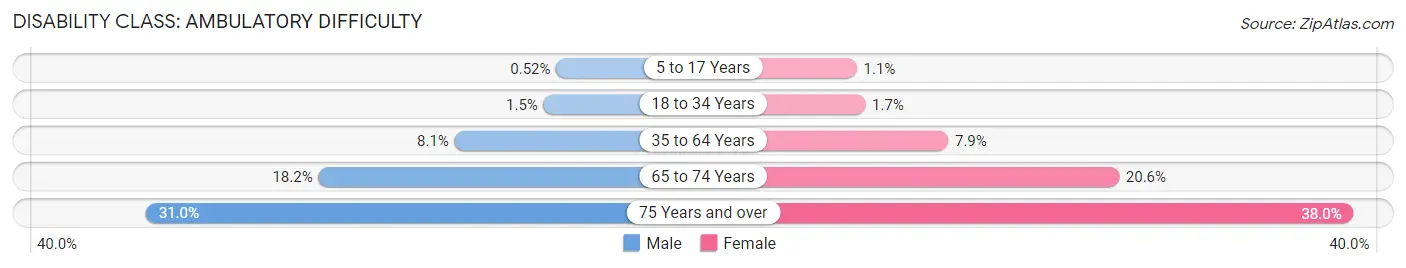
| Age Bracket | Male | Female |
| 5 to 17 Years | 150 (0.5%) | 303 (1.1%) |
| 18 to 34 Years | 565 (1.5%) | 663 (1.7%) |
| 35 to 64 Years | 4,545 (8.1%) | 4,571 (7.9%) |
| 65 to 74 Years | 2,381 (18.2%) | 2,956 (20.6%) |
| 75 Years and over | 2,247 (31.0%) | 3,791 (38.0%) |
Disability Class: Self-Care Difficulty
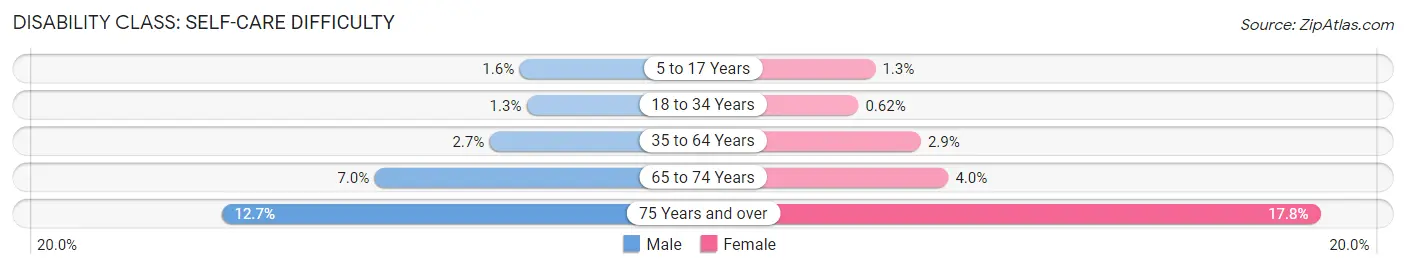
| Age Bracket | Male | Female |
| 5 to 17 Years | 462 (1.6%) | 345 (1.3%) |
| 18 to 34 Years | 516 (1.3%) | 239 (0.6%) |
| 35 to 64 Years | 1,531 (2.7%) | 1,703 (2.9%) |
| 65 to 74 Years | 915 (7.0%) | 569 (4.0%) |
| 75 Years and over | 920 (12.7%) | 1,772 (17.8%) |
Technology Access in Corpus Christi
Computing Device Access in Corpus Christi
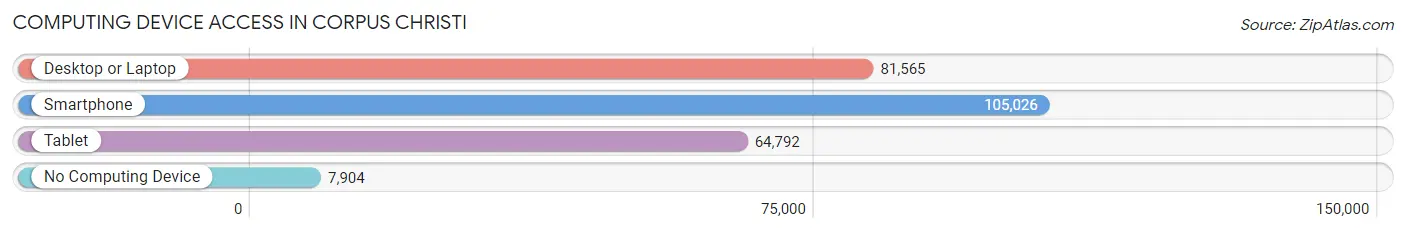
| Device Type | # Households | % Households |
| Desktop or Laptop | 81,565 | 69.4% |
| Smartphone | 105,026 | 89.3% |
| Tablet | 64,792 | 55.1% |
| No Computing Device | 7,904 | 6.7% |
| Total | 117,555 | 100.0% |
Internet Access in Corpus Christi
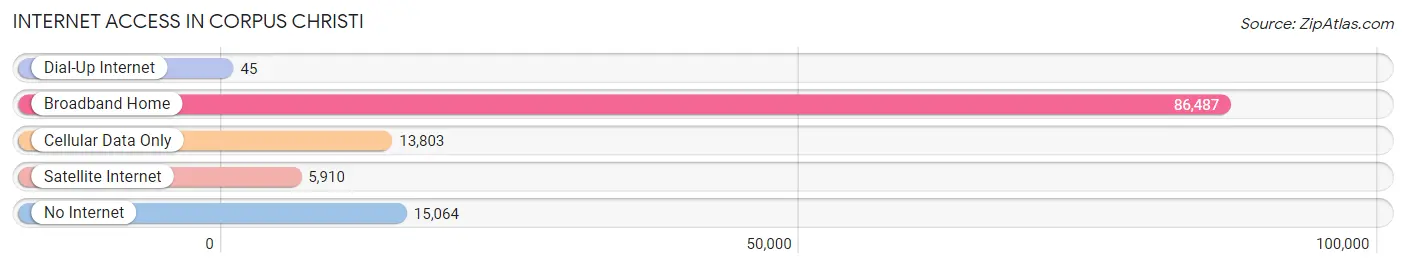
| Internet Type | # Households | % Households |
| Dial-Up Internet | 45 | 0.0% |
| Broadband Home | 86,487 | 73.6% |
| Cellular Data Only | 13,803 | 11.7% |
| Satellite Internet | 5,910 | 5.0% |
| No Internet | 15,064 | 12.8% |
| Total | 117,555 | 100.0% |
Corpus Christi Summary
Corpus Christi, Texas is a coastal city located in the southern part of the state. It is the eighth-largest city in Texas and the county seat of Nueces County. The city is situated on the Gulf of Mexico and is known for its beautiful beaches, warm climate, and vibrant culture.
History
The area that is now Corpus Christi was first inhabited by the Karankawa Indians. The first European to explore the area was Spanish explorer Alonso Alvarez de Pineda in 1519. The area was later explored by Spanish explorer Francisco Vásquez de Coronado in 1540. The area was then settled by Spanish colonists in 1789, and the city was officially founded in 1839.
The city was named after the Catholic feast day of Corpus Christi, which is celebrated in honor of the body of Christ. The city was a major port for the Confederate Army during the Civil War, and it was also the site of a major naval battle in 1845.
Geography
Corpus Christi is located on the Gulf of Mexico in the southern part of Texas. It is situated on the Nueces Bay and is bordered by the cities of Portland, Ingleside, and Aransas Pass. The city has a total area of 441.3 square miles, of which 437.2 square miles is land and 4.1 square miles is water.
The city has a humid subtropical climate, with hot summers and mild winters. The average temperature in the summer is around 90°F, and the average temperature in the winter is around 60°F. The city receives an average of 33 inches of rain per year.
Economy
Corpus Christi has a diverse economy that is driven by the oil and gas industry, tourism, and the military. The city is home to the Port of Corpus Christi, which is the fifth-largest port in the United States. The port is a major hub for the oil and gas industry, and it is also a major shipping center for the region.
The city is also home to several military installations, including Naval Air Station Corpus Christi and the Corpus Christi Army Depot. The military installations provide a significant economic boost to the city, as they employ thousands of people and generate millions of dollars in revenue.
The city is also a major tourist destination, as it is home to several popular attractions, including the USS Lexington Museum, the Texas State Aquarium, and the Corpus Christi Museum of Science and History. The city also has a vibrant nightlife, with several bars, clubs, and restaurants.
Demographics
As of the 2020 census, the population of Corpus Christi was 325,605. The city has a population density of 735.3 people per square mile. The median age of the population is 33.7 years, and the median household income is $45,945.
The city is racially diverse, with the largest racial groups being White (63.2%), Hispanic or Latino (30.2%), and Black or African American (4.3%). The city is also home to a large number of immigrants, with the largest immigrant groups being from Mexico (17.2%), India (2.2%), and Vietnam (1.2%).
The city is also home to a large number of religious groups, with the largest being Catholic (37.2%), Baptist (14.2%), and Methodist (7.2%). The city is also home to a large number of educational institutions, including Texas A&M University-Corpus Christi, Del Mar College, and the University of Texas at Corpus Christi.
Conclusion
Corpus Christi is a vibrant city located on the Gulf of Mexico in the southern part of Texas. The city has a rich history, a diverse economy, and a vibrant culture. The city is home to a large number of immigrants, religious groups, and educational institutions. The city is also a major tourist destination, with several popular attractions and a vibrant nightlife.
Common Questions
What is Per Capita Income in Corpus Christi?
Per Capita income in Corpus Christi is $32,395.
What is the Median Family Income in Corpus Christi?
Median Family Income in Corpus Christi is $78,428.
What is the Median Household income in Corpus Christi?
Median Household Income in Corpus Christi is $64,449.
What is Income or Wage Gap in Corpus Christi?
Income or Wage Gap in Corpus Christi is 31.2%.
Women in Corpus Christi earn 68.8 cents for every dollar earned by a man.
What is Family Income Deficit in Corpus Christi?
Family Income Deficit in Corpus Christi is $11,399.
Families that are below poverty line in Corpus Christi earn $11,399 less on average than the poverty threshold level.
What is Inequality or Gini Index in Corpus Christi?
Inequality or Gini Index in Corpus Christi is 0.46.
What is the Total Population of Corpus Christi?
Total Population of Corpus Christi is 317,804.
What is the Total Male Population of Corpus Christi?
Total Male Population of Corpus Christi is 158,708.
What is the Total Female Population of Corpus Christi?
Total Female Population of Corpus Christi is 159,096.
What is the Ratio of Males per 100 Females in Corpus Christi?
There are 99.76 Males per 100 Females in Corpus Christi.
What is the Ratio of Females per 100 Males in Corpus Christi?
There are 100.24 Females per 100 Males in Corpus Christi.
What is the Median Population Age in Corpus Christi?
Median Population Age in Corpus Christi is 35.7 Years.
What is the Average Family Size in Corpus Christi
Average Family Size in Corpus Christi is 3.2 People.
What is the Average Household Size in Corpus Christi
Average Household Size in Corpus Christi is 2.6 People.
How Large is the Labor Force in Corpus Christi?
There are 157,284 People in the Labor Forcein in Corpus Christi.
What is the Percentage of People in the Labor Force in Corpus Christi?
62.8% of People are in the Labor Force in Corpus Christi.
What is the Unemployment Rate in Corpus Christi?
Unemployment Rate in Corpus Christi is 5.6%.