Santa Maria, CA Map & Demographics
Santa Maria Map
Santa Maria Overview
$25,685
PER CAPITA INCOME
$78,567
AVG FAMILY INCOME
$81,237
AVG HOUSEHOLD INCOME
23.9%
WAGE / INCOME GAP [ % ]
76.1¢/ $1
WAGE / INCOME GAP [ $ ]
$12,477
FAMILY INCOME DEFICIT
0.40
INEQUALITY / GINI INDEX
109,543
TOTAL POPULATION
54,654
MALE POPULATION
54,889
FEMALE POPULATION
99.57
MALES / 100 FEMALES
100.43
FEMALES / 100 MALES
29.3
MEDIAN AGE
4.0
AVG FAMILY SIZE
3.8
AVG HOUSEHOLD SIZE
52,485
LABOR FORCE [ PEOPLE ]
66.1%
PERCENT IN LABOR FORCE
6.3%
UNEMPLOYMENT RATE
Santa Maria Area Codes
Income in Santa Maria
Income Overview in Santa Maria
Per Capita Income in Santa Maria is $25,685, while median incomes of families and households are $78,567 and $81,237 respectively.
| Characteristic | Number | Measure |
| Per Capita Income | 109,543 | $25,685 |
| Median Family Income | 22,868 | $78,567 |
| Mean Family Income | 22,868 | $94,908 |
| Median Household Income | 28,738 | $81,237 |
| Mean Household Income | 28,738 | $96,016 |
| Income Deficit | 22,868 | $12,477 |
| Wage / Income Gap (%) | 109,543 | 23.93% |
| Wage / Income Gap ($) | 109,543 | 76.07¢ per $1 |
| Gini / Inequality Index | 109,543 | 0.40 |
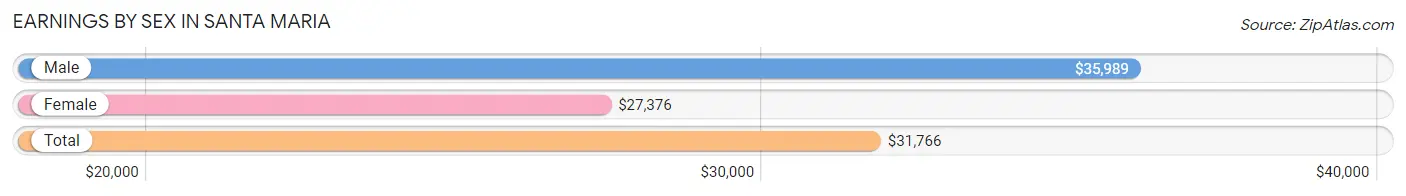
Earnings by Sex in Santa Maria
Average Earnings in Santa Maria are $31,766, $35,989 for men and $27,376 for women, a difference of 23.9%.
| Sex | Number | Average Earnings |
| Male | 29,268 (54.4%) | $35,989 |
| Female | 24,541 (45.6%) | $27,376 |
| Total | 53,809 (100.0%) | $31,766 |
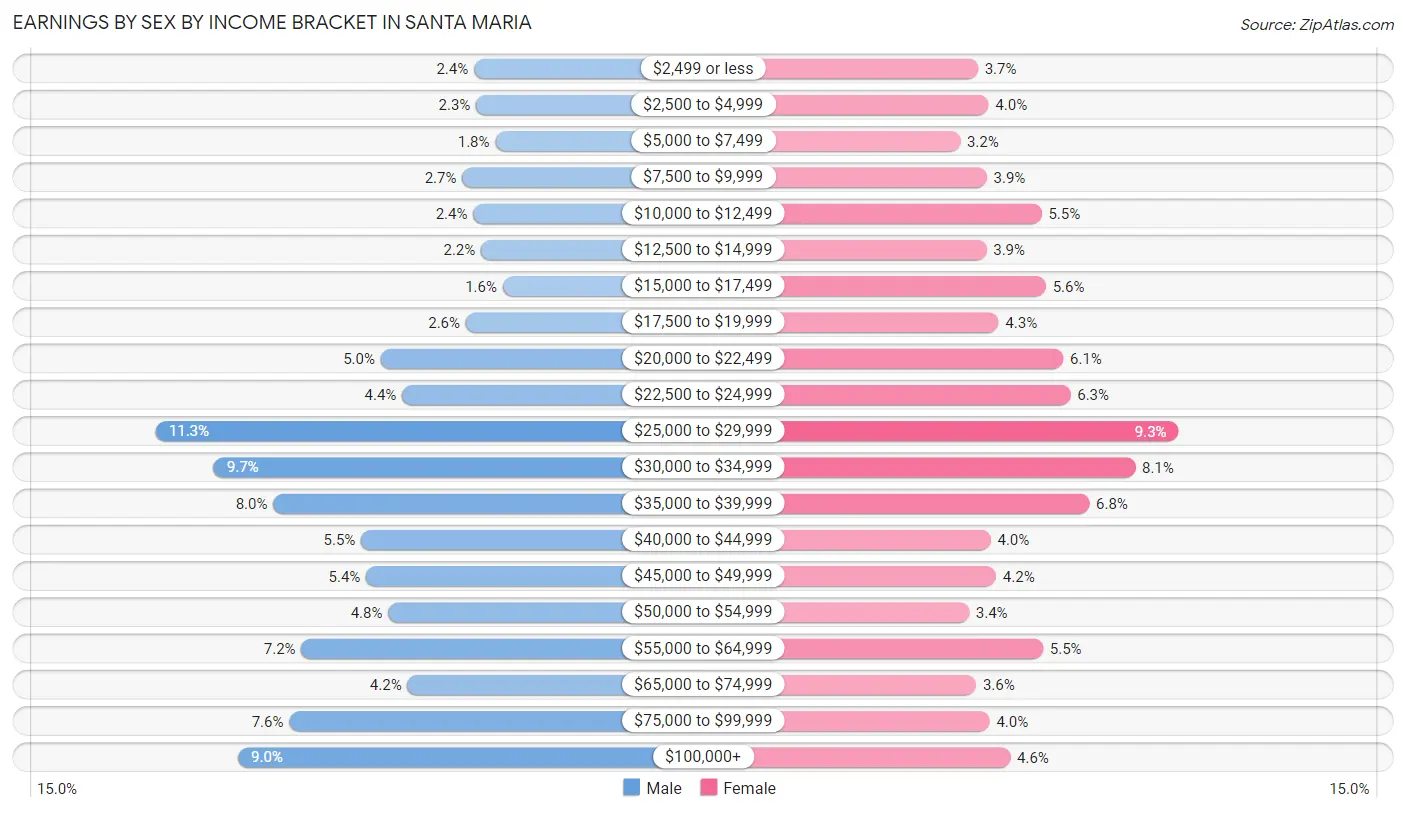
Earnings by Sex by Income Bracket in Santa Maria
The most common earnings brackets in Santa Maria are $25,000 to $29,999 for men (3,309 | 11.3%) and $25,000 to $29,999 for women (2,287 | 9.3%).
| Income | Male | Female |
| $2,499 or less | 695 (2.4%) | 903 (3.7%) |
| $2,500 to $4,999 | 675 (2.3%) | 976 (4.0%) |
| $5,000 to $7,499 | 518 (1.8%) | 781 (3.2%) |
| $7,500 to $9,999 | 790 (2.7%) | 964 (3.9%) |
| $10,000 to $12,499 | 700 (2.4%) | 1,343 (5.5%) |
| $12,500 to $14,999 | 636 (2.2%) | 961 (3.9%) |
| $15,000 to $17,499 | 457 (1.6%) | 1,371 (5.6%) |
| $17,500 to $19,999 | 760 (2.6%) | 1,045 (4.3%) |
| $20,000 to $22,499 | 1,461 (5.0%) | 1,492 (6.1%) |
| $22,500 to $24,999 | 1,285 (4.4%) | 1,542 (6.3%) |
| $25,000 to $29,999 | 3,309 (11.3%) | 2,287 (9.3%) |
| $30,000 to $34,999 | 2,833 (9.7%) | 1,989 (8.1%) |
| $35,000 to $39,999 | 2,345 (8.0%) | 1,671 (6.8%) |
| $40,000 to $44,999 | 1,621 (5.5%) | 991 (4.0%) |
| $45,000 to $49,999 | 1,581 (5.4%) | 1,029 (4.2%) |
| $50,000 to $54,999 | 1,398 (4.8%) | 841 (3.4%) |
| $55,000 to $64,999 | 2,114 (7.2%) | 1,353 (5.5%) |
| $65,000 to $74,999 | 1,242 (4.2%) | 891 (3.6%) |
| $75,000 to $99,999 | 2,213 (7.6%) | 984 (4.0%) |
| $100,000+ | 2,635 (9.0%) | 1,127 (4.6%) |
| Total | 29,268 (100.0%) | 24,541 (100.0%) |
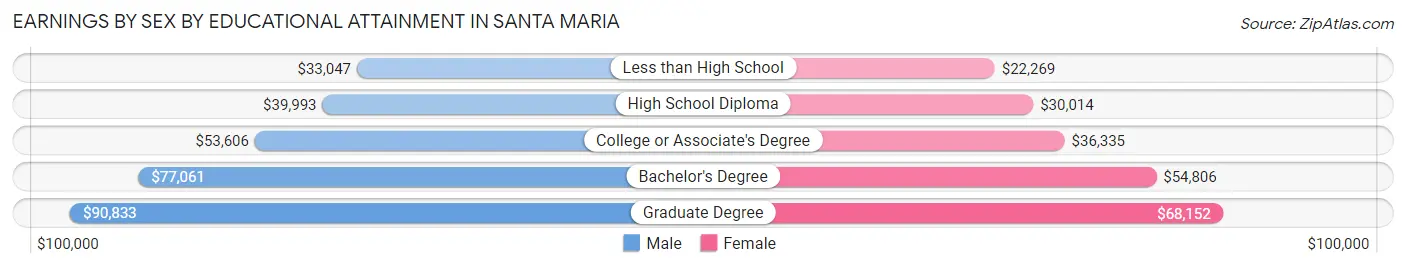
Earnings by Sex by Educational Attainment in Santa Maria
Average earnings in Santa Maria are $40,086 for men and $30,154 for women, a difference of 24.8%. Men with an educational attainment of graduate degree enjoy the highest average annual earnings of $90,833, while those with less than high school education earn the least with $33,047. Women with an educational attainment of graduate degree earn the most with the average annual earnings of $68,152, while those with less than high school education have the smallest earnings of $22,269.
| Educational Attainment | Male Income | Female Income |
| Less than High School | $33,047 | $22,269 |
| High School Diploma | $39,993 | $30,014 |
| College or Associate's Degree | $53,606 | $36,335 |
| Bachelor's Degree | $77,061 | $54,806 |
| Graduate Degree | $90,833 | $68,152 |
| Total | $40,086 | $30,154 |
Family Income in Santa Maria
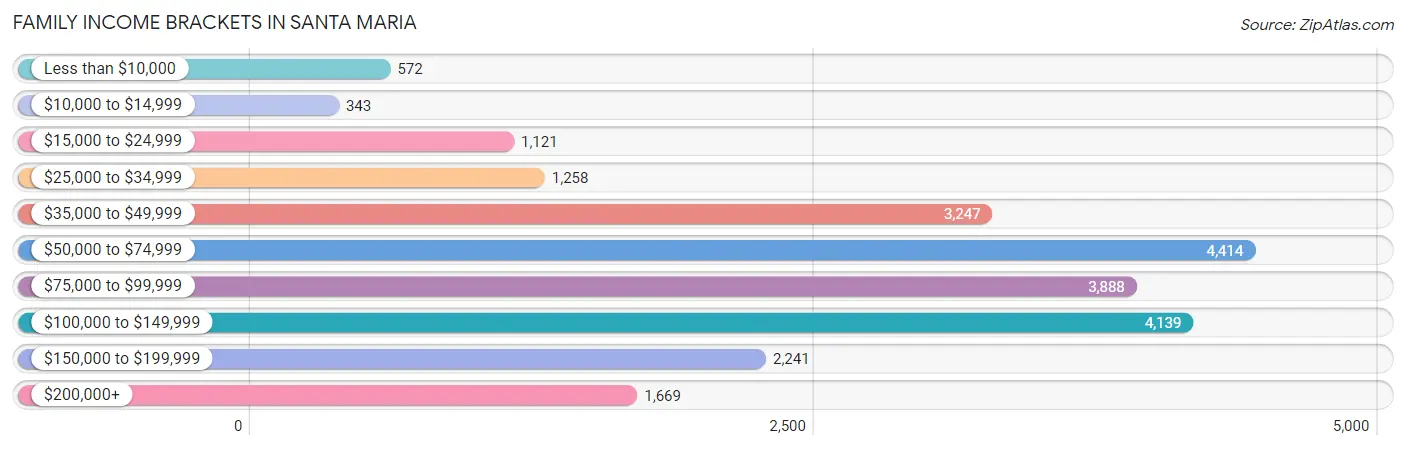
Family Income Brackets in Santa Maria
According to the Santa Maria family income data, there are 4,414 families falling into the $50,000 to $74,999 income range, which is the most common income bracket and makes up 19.3% of all families. Conversely, the $10,000 to $14,999 income bracket is the least frequent group with only 343 families (1.5%) belonging to this category.
| Income Bracket | # Families | % Families |
| Less than $10,000 | 572 | 2.5% |
| $10,000 to $14,999 | 343 | 1.5% |
| $15,000 to $24,999 | 1,121 | 4.9% |
| $25,000 to $34,999 | 1,258 | 5.5% |
| $35,000 to $49,999 | 3,247 | 14.2% |
| $50,000 to $74,999 | 4,414 | 19.3% |
| $75,000 to $99,999 | 3,888 | 17.0% |
| $100,000 to $149,999 | 4,139 | 18.1% |
| $150,000 to $199,999 | 2,241 | 9.8% |
| $200,000+ | 1,669 | 7.3% |
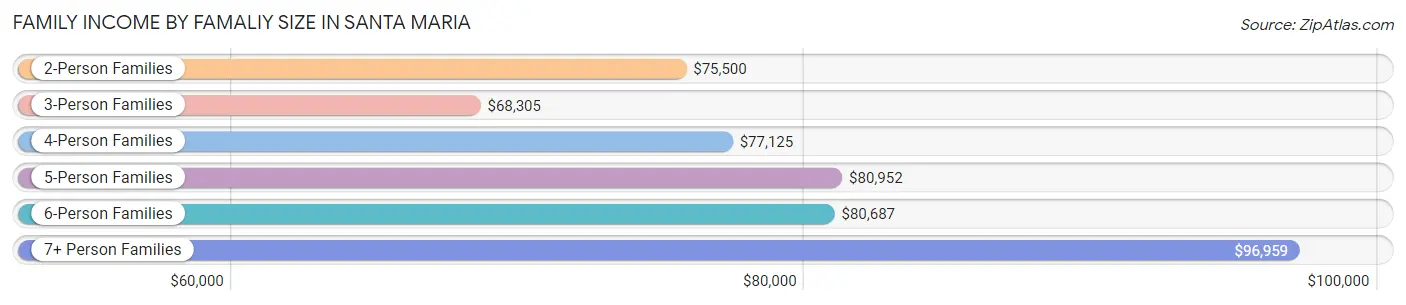
Family Income by Famaliy Size in Santa Maria
7+ person families (1,840 | 8.1%) account for the highest median family income in Santa Maria with $96,959 per family, while 2-person families (6,382 | 27.9%) have the highest median income of $37,750 per family member.
| Income Bracket | # Families | Median Income |
| 2-Person Families | 6,382 (27.9%) | $75,500 |
| 3-Person Families | 4,428 (19.4%) | $68,305 |
| 4-Person Families | 4,962 (21.7%) | $77,125 |
| 5-Person Families | 3,284 (14.4%) | $80,952 |
| 6-Person Families | 1,972 (8.6%) | $80,687 |
| 7+ Person Families | 1,840 (8.1%) | $96,959 |
| Total | 22,868 (100.0%) | $78,567 |
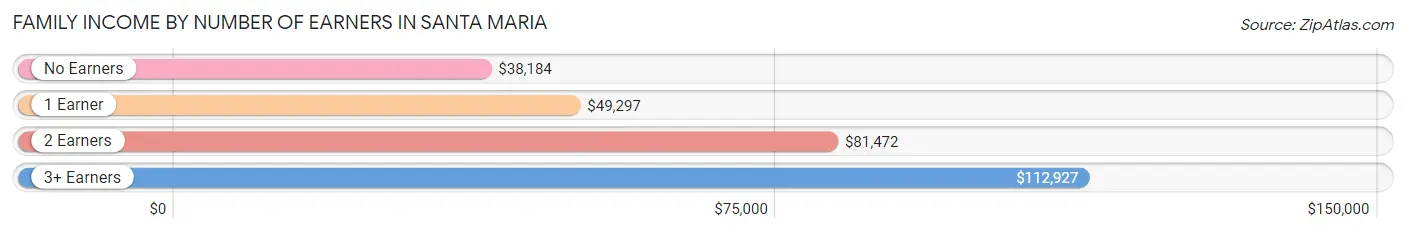
Family Income by Number of Earners in Santa Maria
The median family income in Santa Maria is $78,567, with families comprising 3+ earners (5,162) having the highest median family income of $112,927, while families with no earners (1,978) have the lowest median family income of $38,184, accounting for 22.6% and 8.6% of families, respectively.
| Number of Earners | # Families | Median Income |
| No Earners | 1,978 (8.6%) | $38,184 |
| 1 Earner | 6,926 (30.3%) | $49,297 |
| 2 Earners | 8,802 (38.5%) | $81,472 |
| 3+ Earners | 5,162 (22.6%) | $112,927 |
| Total | 22,868 (100.0%) | $78,567 |
Household Income in Santa Maria
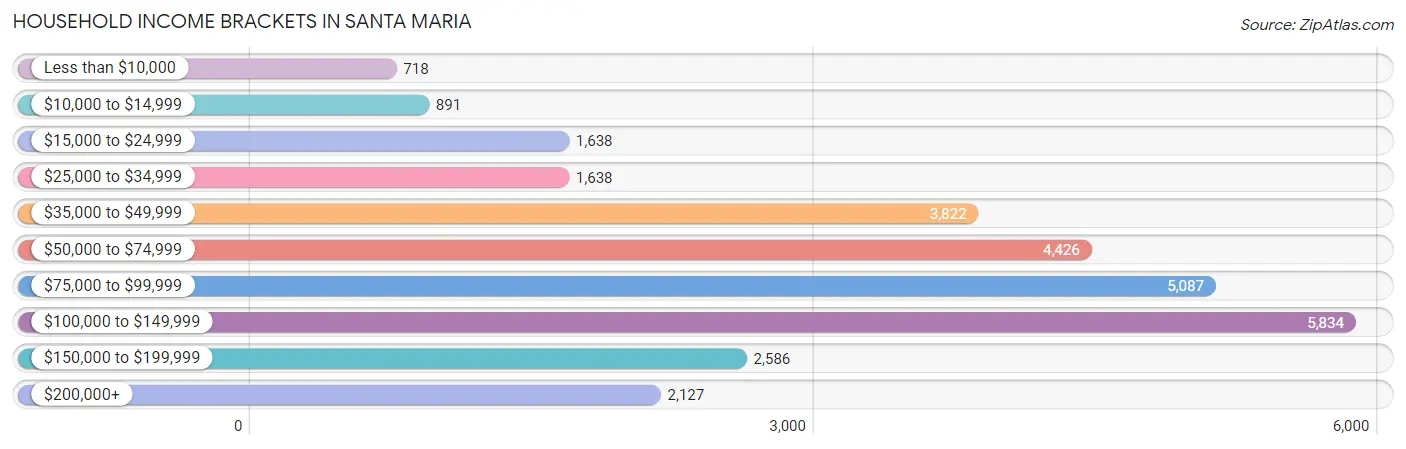
Household Income Brackets in Santa Maria
With 5,834 households falling in the category, the $100,000 to $149,999 income range is the most frequent in Santa Maria, accounting for 20.3% of all households. In contrast, only 718 households (2.5%) fall into the less than $10,000 income bracket, making it the least populous group.
| Income Bracket | # Households | % Households |
| Less than $10,000 | 718 | 2.5% |
| $10,000 to $14,999 | 891 | 3.1% |
| $15,000 to $24,999 | 1,638 | 5.7% |
| $25,000 to $34,999 | 1,638 | 5.7% |
| $35,000 to $49,999 | 3,822 | 13.3% |
| $50,000 to $74,999 | 4,426 | 15.4% |
| $75,000 to $99,999 | 5,087 | 17.7% |
| $100,000 to $149,999 | 5,834 | 20.3% |
| $150,000 to $199,999 | 2,586 | 9.0% |
| $200,000+ | 2,127 | 7.4% |
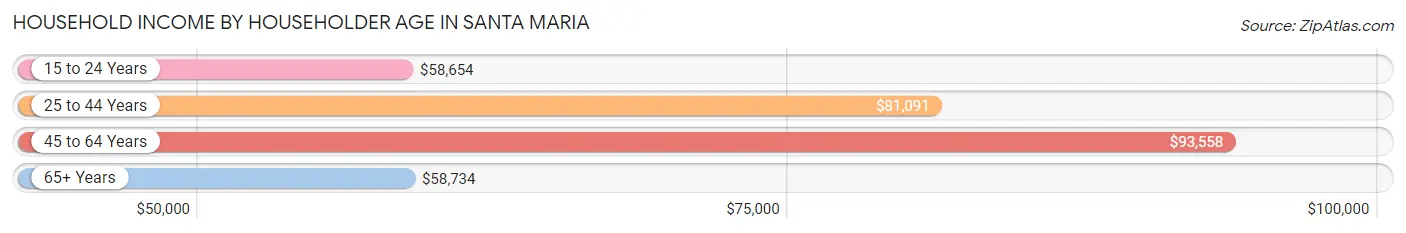
Household Income by Householder Age in Santa Maria
The median household income in Santa Maria is $81,237, with the highest median household income of $93,558 found in the 45 to 64 years age bracket for the primary householder. A total of 10,062 households (35.0%) fall into this category. Meanwhile, the 15 to 24 years age bracket for the primary householder has the lowest median household income of $58,654, with 1,268 households (4.4%) in this group.
| Income Bracket | # Households | Median Income |
| 15 to 24 Years | 1,268 (4.4%) | $58,654 |
| 25 to 44 Years | 11,018 (38.3%) | $81,091 |
| 45 to 64 Years | 10,062 (35.0%) | $93,558 |
| 65+ Years | 6,390 (22.2%) | $58,734 |
| Total | 28,738 (100.0%) | $81,237 |
Poverty in Santa Maria
Income Below Poverty by Sex and Age in Santa Maria
With 11.8% poverty level for males and 15.1% for females among the residents of Santa Maria, under 5 year old males and 15 year old females are the most vulnerable to poverty, with 1,089 males (21.4%) and 231 females (28.0%) in their respective age groups living below the poverty level.
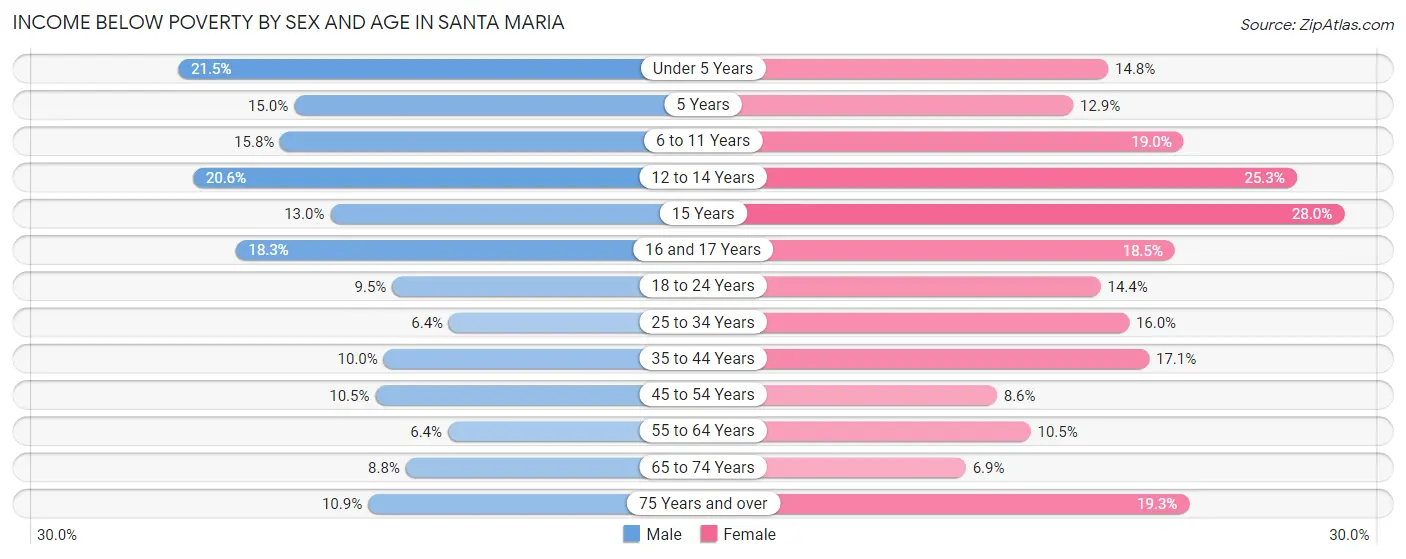
| Age Bracket | Male | Female |
| Under 5 Years | 1,089 (21.4%) | 655 (14.8%) |
| 5 Years | 123 (15.0%) | 126 (12.9%) |
| 6 to 11 Years | 860 (15.8%) | 986 (19.0%) |
| 12 to 14 Years | 573 (20.6%) | 704 (25.3%) |
| 15 Years | 91 (13.0%) | 231 (28.0%) |
| 16 and 17 Years | 404 (18.3%) | 305 (18.5%) |
| 18 to 24 Years | 678 (9.5%) | 994 (14.4%) |
| 25 to 34 Years | 496 (6.4%) | 1,217 (16.0%) |
| 35 to 44 Years | 681 (10.0%) | 1,152 (17.1%) |
| 45 to 54 Years | 587 (10.5%) | 504 (8.6%) |
| 55 to 64 Years | 298 (6.4%) | 493 (10.5%) |
| 65 to 74 Years | 253 (8.8%) | 239 (6.9%) |
| 75 Years and over | 223 (10.9%) | 592 (19.3%) |
| Total | 6,356 (11.8%) | 8,198 (15.1%) |
Income Above Poverty by Sex and Age in Santa Maria
According to the poverty statistics in Santa Maria, males aged 25 to 34 years and females aged 65 to 74 years are the age groups that are most secure financially, with 93.6% of males and 93.1% of females in these age groups living above the poverty line.
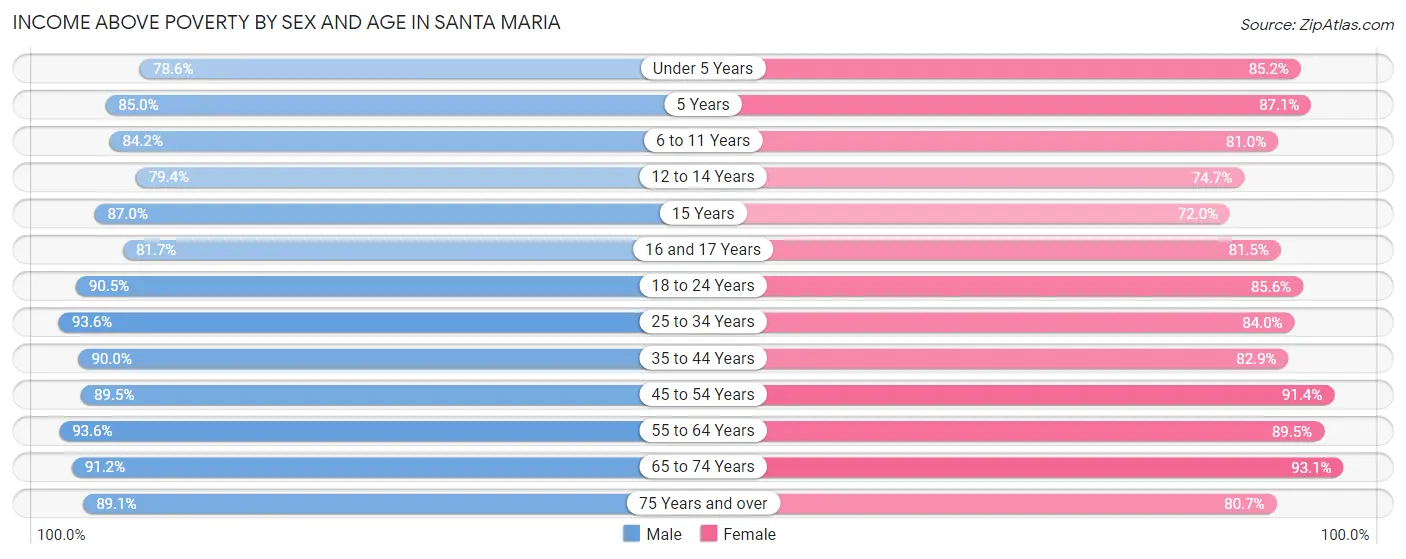
| Age Bracket | Male | Female |
| Under 5 Years | 3,988 (78.5%) | 3,762 (85.2%) |
| 5 Years | 697 (85.0%) | 852 (87.1%) |
| 6 to 11 Years | 4,595 (84.2%) | 4,196 (81.0%) |
| 12 to 14 Years | 2,205 (79.4%) | 2,076 (74.7%) |
| 15 Years | 610 (87.0%) | 595 (72.0%) |
| 16 and 17 Years | 1,808 (81.7%) | 1,340 (81.5%) |
| 18 to 24 Years | 6,439 (90.5%) | 5,903 (85.6%) |
| 25 to 34 Years | 7,293 (93.6%) | 6,396 (84.0%) |
| 35 to 44 Years | 6,125 (90.0%) | 5,581 (82.9%) |
| 45 to 54 Years | 5,018 (89.5%) | 5,336 (91.4%) |
| 55 to 64 Years | 4,340 (93.6%) | 4,198 (89.5%) |
| 65 to 74 Years | 2,629 (91.2%) | 3,223 (93.1%) |
| 75 Years and over | 1,827 (89.1%) | 2,469 (80.7%) |
| Total | 47,574 (88.2%) | 45,927 (84.9%) |
Income Below Poverty Among Married-Couple Families in Santa Maria
The poverty statistics for married-couple families in Santa Maria show that 4.2% or 610 of the total 14,476 families live below the poverty line. Families with 5 or more children have the highest poverty rate of 30.7%, comprising of 90 families. On the other hand, families with no children have the lowest poverty rate of 2.1%, which includes 141 families.
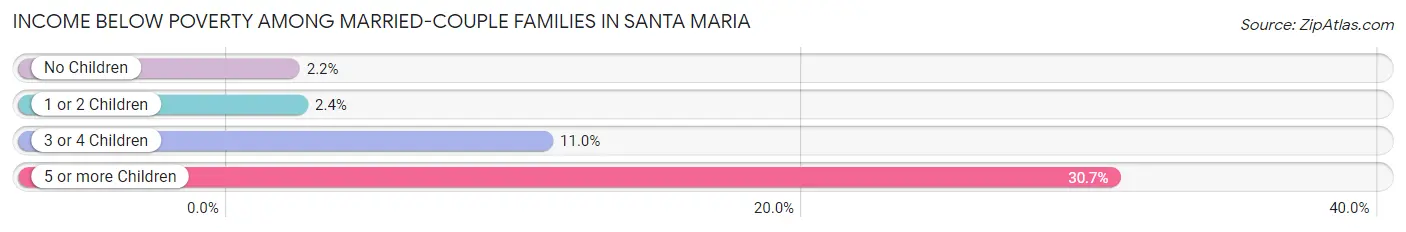
| Children | Above Poverty | Below Poverty |
| No Children | 6,413 (97.9%) | 141 (2.1%) |
| 1 or 2 Children | 5,237 (97.6%) | 131 (2.4%) |
| 3 or 4 Children | 2,013 (89.0%) | 248 (11.0%) |
| 5 or more Children | 203 (69.3%) | 90 (30.7%) |
| Total | 13,866 (95.8%) | 610 (4.2%) |
Income Below Poverty Among Single-Parent Households in Santa Maria
According to the poverty data in Santa Maria, 10.3% or 316 single-father households and 23.5% or 1,253 single-mother households are living below the poverty line. Among single-father households, those with 5 or more children have the highest poverty rate, with 55 households (100.0%) experiencing poverty. Likewise, among single-mother households, those with 5 or more children have the highest poverty rate, with 42 households (67.7%) falling below the poverty line.
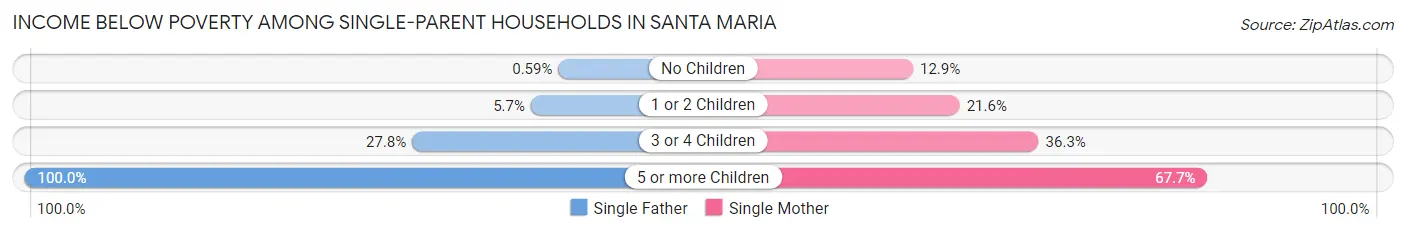
| Children | Single Father | Single Mother |
| No Children | 7 (0.6%) | 168 (12.9%) |
| 1 or 2 Children | 65 (5.7%) | 589 (21.6%) |
| 3 or 4 Children | 189 (27.8%) | 454 (36.3%) |
| 5 or more Children | 55 (100.0%) | 42 (67.7%) |
| Total | 316 (10.3%) | 1,253 (23.5%) |
Income Below Poverty Among Married-Couple vs Single-Parent Households in Santa Maria
The poverty data for Santa Maria shows that 610 of the married-couple family households (4.2%) and 1,569 of the single-parent households (18.7%) are living below the poverty level. Within the married-couple family households, those with 5 or more children have the highest poverty rate, with 90 households (30.7%) falling below the poverty line. Among the single-parent households, those with 5 or more children have the highest poverty rate, with 97 household (82.9%) living below poverty.
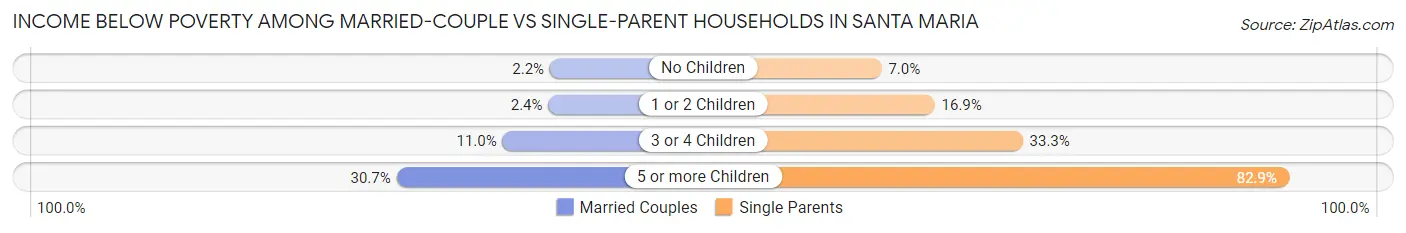
| Children | Married-Couple Families | Single-Parent Households |
| No Children | 141 (2.1%) | 175 (7.0%) |
| 1 or 2 Children | 131 (2.4%) | 654 (16.9%) |
| 3 or 4 Children | 248 (11.0%) | 643 (33.3%) |
| 5 or more Children | 90 (30.7%) | 97 (82.9%) |
| Total | 610 (4.2%) | 1,569 (18.7%) |
Race in Santa Maria
The most populous races in Santa Maria are Hispanic or Latino (85,175 | 77.7%), White / Caucasian (54,912 | 50.1%), and Two or more Races (31,247 | 28.5%).
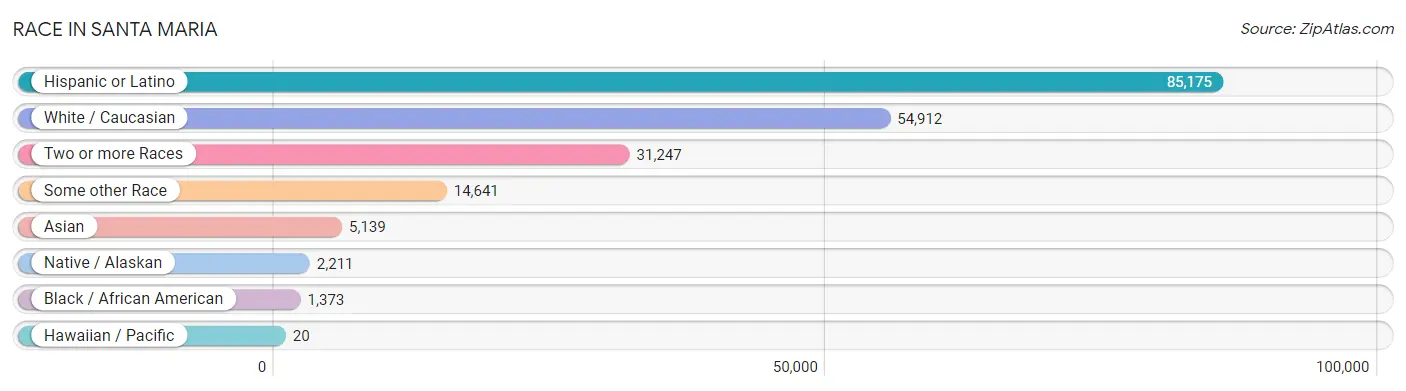
| Race | # Population | % Population |
| Asian | 5,139 | 4.7% |
| Black / African American | 1,373 | 1.3% |
| Hawaiian / Pacific | 20 | 0.0% |
| Hispanic or Latino | 85,175 | 77.7% |
| Native / Alaskan | 2,211 | 2.0% |
| White / Caucasian | 54,912 | 50.1% |
| Two or more Races | 31,247 | 28.5% |
| Some other Race | 14,641 | 13.4% |
| Total | 109,543 | 100.0% |
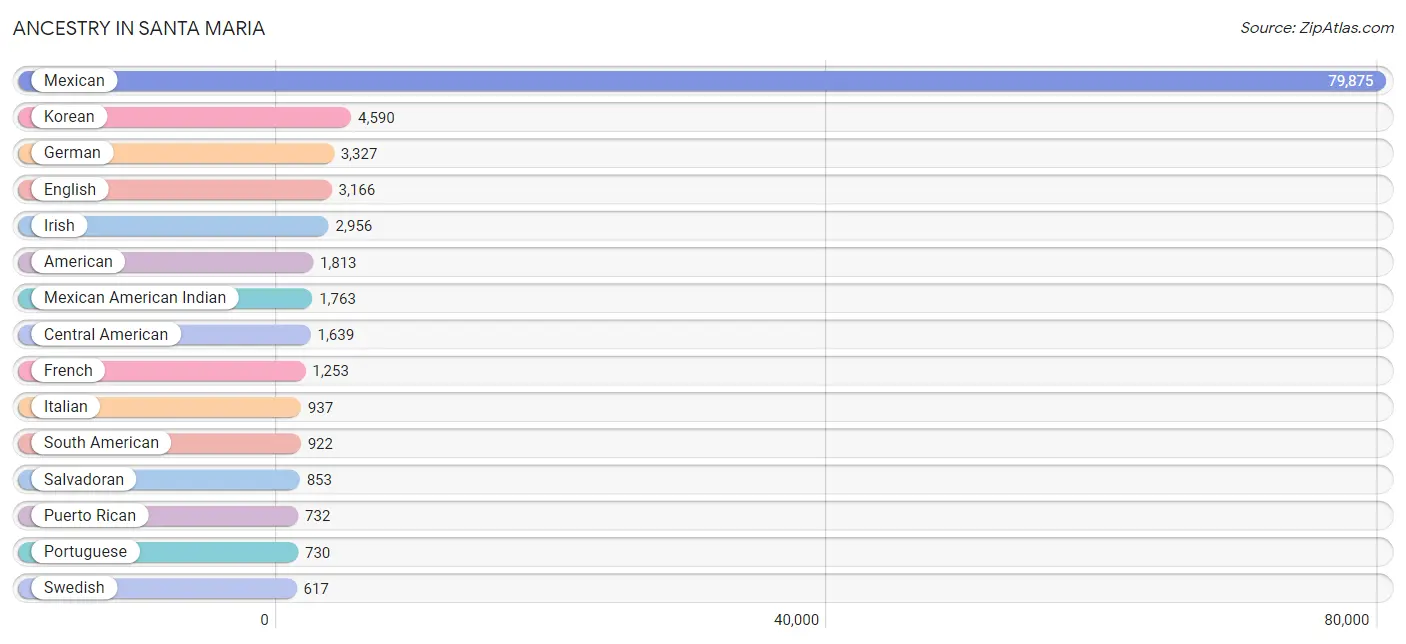
Ancestry in Santa Maria
The most populous ancestries reported in Santa Maria are Mexican (79,875 | 72.9%), Korean (4,590 | 4.2%), German (3,327 | 3.0%), English (3,166 | 2.9%), and Irish (2,956 | 2.7%), together accounting for 85.7% of all Santa Maria residents.
| Ancestry | # Population | % Population |
| Afghan | 17 | 0.0% |
| African | 263 | 0.2% |
| Alaska Native | 6 | 0.0% |
| Alsatian | 17 | 0.0% |
| American | 1,813 | 1.7% |
| Apache | 181 | 0.2% |
| Arab | 591 | 0.5% |
| Argentinean | 25 | 0.0% |
| Austrian | 51 | 0.1% |
| Bangladeshi | 62 | 0.1% |
| Basque | 13 | 0.0% |
| Belgian | 3 | 0.0% |
| Bhutanese | 533 | 0.5% |
| Blackfeet | 36 | 0.0% |
| Brazilian | 48 | 0.0% |
| British | 414 | 0.4% |
| Burmese | 289 | 0.3% |
| Canadian | 143 | 0.1% |
| Central American | 1,639 | 1.5% |
| Central American Indian | 20 | 0.0% |
| Cherokee | 177 | 0.2% |
| Chilean | 140 | 0.1% |
| Chippewa | 48 | 0.0% |
| Choctaw | 59 | 0.1% |
| Colombian | 502 | 0.5% |
| Cuban | 163 | 0.2% |
| Czech | 155 | 0.1% |
| Czechoslovakian | 8 | 0.0% |
| Danish | 182 | 0.2% |
| Dominican | 4 | 0.0% |
| Dutch | 342 | 0.3% |
| Eastern European | 218 | 0.2% |
| Ecuadorian | 10 | 0.0% |
| Egyptian | 45 | 0.0% |
| English | 3,166 | 2.9% |
| Ethiopian | 128 | 0.1% |
| European | 594 | 0.5% |
| Filipino | 28 | 0.0% |
| Finnish | 91 | 0.1% |
| French | 1,253 | 1.1% |
| French Canadian | 135 | 0.1% |
| German | 3,327 | 3.0% |
| Greek | 103 | 0.1% |
| Guatemalan | 440 | 0.4% |
| Haitian | 11 | 0.0% |
| Honduran | 299 | 0.3% |
| Hungarian | 83 | 0.1% |
| Indian (Asian) | 363 | 0.3% |
| Iraqi | 86 | 0.1% |
| Irish | 2,956 | 2.7% |
| Italian | 937 | 0.9% |
| Japanese | 197 | 0.2% |
| Jordanian | 10 | 0.0% |
| Korean | 4,590 | 4.2% |
| Laotian | 27 | 0.0% |
| Latvian | 5 | 0.0% |
| Lebanese | 10 | 0.0% |
| Lithuanian | 12 | 0.0% |
| Malaysian | 153 | 0.1% |
| Mexican | 79,875 | 72.9% |
| Mexican American Indian | 1,763 | 1.6% |
| Native Hawaiian | 64 | 0.1% |
| Navajo | 97 | 0.1% |
| Nicaraguan | 31 | 0.0% |
| Northern European | 8 | 0.0% |
| Norwegian | 561 | 0.5% |
| Pakistani | 107 | 0.1% |
| Pennsylvania German | 3 | 0.0% |
| Peruvian | 88 | 0.1% |
| Polish | 522 | 0.5% |
| Portuguese | 730 | 0.7% |
| Potawatomi | 11 | 0.0% |
| Puerto Rican | 732 | 0.7% |
| Puget Sound Salish | 4 | 0.0% |
| Romanian | 109 | 0.1% |
| Russian | 85 | 0.1% |
| Salvadoran | 853 | 0.8% |
| Samoan | 183 | 0.2% |
| Scandinavian | 172 | 0.2% |
| Scotch-Irish | 293 | 0.3% |
| Scottish | 506 | 0.5% |
| Serbian | 21 | 0.0% |
| Sioux | 119 | 0.1% |
| Slovak | 20 | 0.0% |
| South American | 922 | 0.8% |
| Spaniard | 221 | 0.2% |
| Spanish | 218 | 0.2% |
| Spanish American | 14 | 0.0% |
| Spanish American Indian | 20 | 0.0% |
| Sri Lankan | 233 | 0.2% |
| Subsaharan African | 391 | 0.4% |
| Swedish | 617 | 0.6% |
| Swiss | 138 | 0.1% |
| Syrian | 75 | 0.1% |
| Taiwanese | 43 | 0.0% |
| Thai | 113 | 0.1% |
| Turkish | 18 | 0.0% |
| Ukrainian | 8 | 0.0% |
| Ute | 13 | 0.0% |
| Venezuelan | 157 | 0.1% |
| Welsh | 155 | 0.1% |
| Yaqui | 157 | 0.1% | View All 102 Rows |
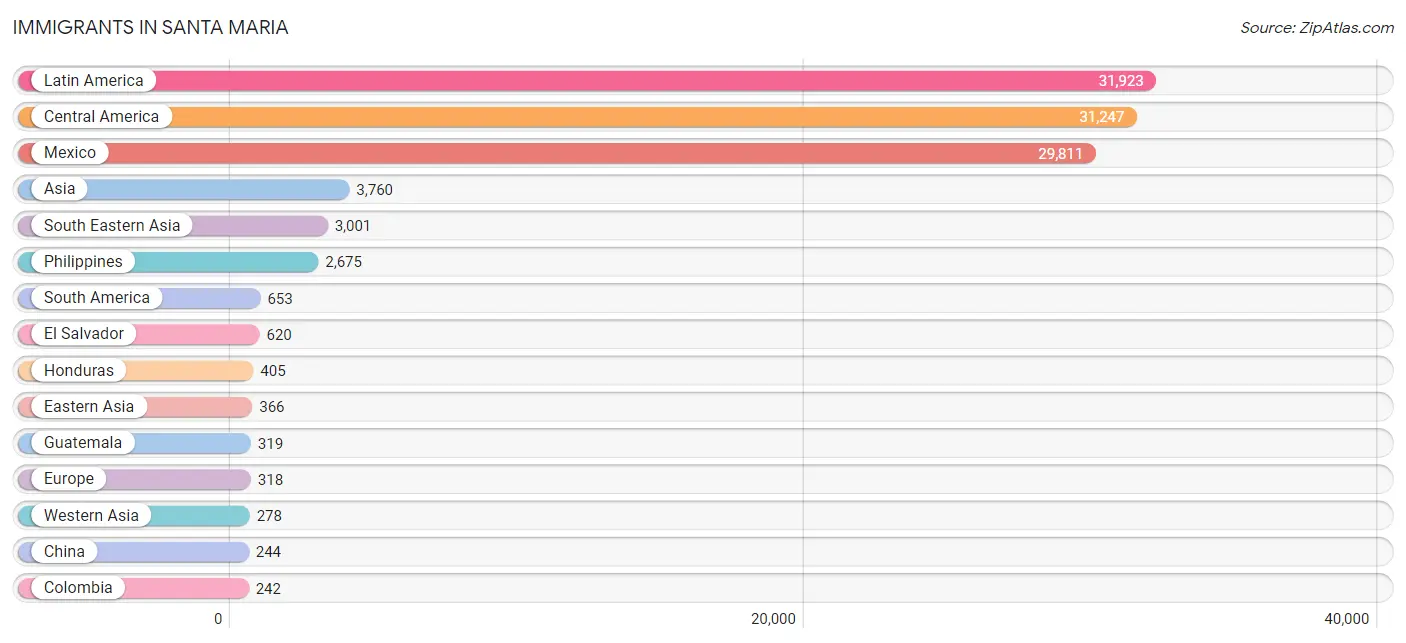
Immigrants in Santa Maria
The most numerous immigrant groups reported in Santa Maria came from Latin America (31,923 | 29.1%), Central America (31,247 | 28.5%), Mexico (29,811 | 27.2%), Asia (3,760 | 3.4%), and South Eastern Asia (3,001 | 2.7%), together accounting for 91.0% of all Santa Maria residents.
| Immigration Origin | # Population | % Population |
| Afghanistan | 17 | 0.0% |
| Africa | 135 | 0.1% |
| Argentina | 11 | 0.0% |
| Asia | 3,760 | 3.4% |
| Azores | 15 | 0.0% |
| Belgium | 3 | 0.0% |
| Brazil | 32 | 0.0% |
| Cambodia | 25 | 0.0% |
| Canada | 140 | 0.1% |
| Caribbean | 23 | 0.0% |
| Central America | 31,247 | 28.5% |
| Chile | 166 | 0.2% |
| China | 244 | 0.2% |
| Colombia | 242 | 0.2% |
| Cuba | 23 | 0.0% |
| Eastern Africa | 89 | 0.1% |
| Eastern Asia | 366 | 0.3% |
| Eastern Europe | 78 | 0.1% |
| Ecuador | 10 | 0.0% |
| Egypt | 28 | 0.0% |
| El Salvador | 620 | 0.6% |
| England | 35 | 0.0% |
| Eritrea | 89 | 0.1% |
| Europe | 318 | 0.3% |
| France | 11 | 0.0% |
| Germany | 22 | 0.0% |
| Guatemala | 319 | 0.3% |
| Honduras | 405 | 0.4% |
| Hong Kong | 76 | 0.1% |
| India | 55 | 0.1% |
| Indonesia | 15 | 0.0% |
| Iraq | 61 | 0.1% |
| Italy | 2 | 0.0% |
| Japan | 54 | 0.1% |
| Korea | 68 | 0.1% |
| Laos | 124 | 0.1% |
| Latin America | 31,923 | 29.1% |
| Latvia | 5 | 0.0% |
| Mexico | 29,811 | 27.2% |
| Netherlands | 23 | 0.0% |
| Nicaragua | 61 | 0.1% |
| Northern Africa | 28 | 0.0% |
| Northern Europe | 152 | 0.1% |
| Peru | 33 | 0.0% |
| Philippines | 2,675 | 2.4% |
| Poland | 29 | 0.0% |
| Portugal | 15 | 0.0% |
| Romania | 36 | 0.0% |
| Saudi Arabia | 60 | 0.1% |
| South America | 653 | 0.6% |
| South Central Asia | 72 | 0.1% |
| South Eastern Asia | 3,001 | 2.7% |
| Southern Europe | 20 | 0.0% |
| Syria | 126 | 0.1% |
| Taiwan | 51 | 0.1% |
| Thailand | 55 | 0.1% |
| Turkey | 12 | 0.0% |
| Venezuela | 149 | 0.1% |
| Vietnam | 107 | 0.1% |
| Western Asia | 278 | 0.3% |
| Western Europe | 59 | 0.1% |
| Yemen | 19 | 0.0% | View All 62 Rows |
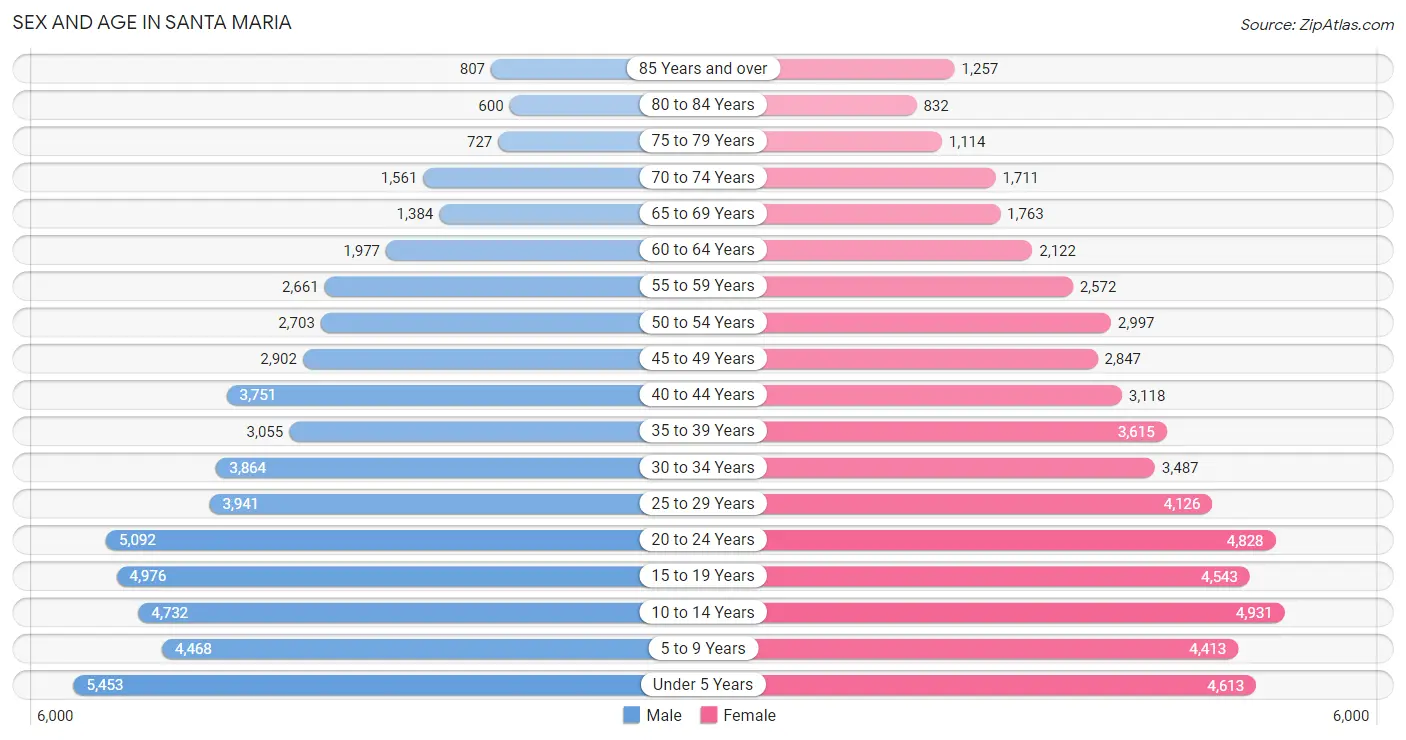
Sex and Age in Santa Maria
Sex and Age in Santa Maria
The most populous age groups in Santa Maria are Under 5 Years (5,453 | 10.0%) for men and 10 to 14 Years (4,931 | 9.0%) for women.
| Age Bracket | Male | Female |
| Under 5 Years | 5,453 (10.0%) | 4,613 (8.4%) |
| 5 to 9 Years | 4,468 (8.2%) | 4,413 (8.0%) |
| 10 to 14 Years | 4,732 (8.7%) | 4,931 (9.0%) |
| 15 to 19 Years | 4,976 (9.1%) | 4,543 (8.3%) |
| 20 to 24 Years | 5,092 (9.3%) | 4,828 (8.8%) |
| 25 to 29 Years | 3,941 (7.2%) | 4,126 (7.5%) |
| 30 to 34 Years | 3,864 (7.1%) | 3,487 (6.4%) |
| 35 to 39 Years | 3,055 (5.6%) | 3,615 (6.6%) |
| 40 to 44 Years | 3,751 (6.9%) | 3,118 (5.7%) |
| 45 to 49 Years | 2,902 (5.3%) | 2,847 (5.2%) |
| 50 to 54 Years | 2,703 (5.0%) | 2,997 (5.5%) |
| 55 to 59 Years | 2,661 (4.9%) | 2,572 (4.7%) |
| 60 to 64 Years | 1,977 (3.6%) | 2,122 (3.9%) |
| 65 to 69 Years | 1,384 (2.5%) | 1,763 (3.2%) |
| 70 to 74 Years | 1,561 (2.9%) | 1,711 (3.1%) |
| 75 to 79 Years | 727 (1.3%) | 1,114 (2.0%) |
| 80 to 84 Years | 600 (1.1%) | 832 (1.5%) |
| 85 Years and over | 807 (1.5%) | 1,257 (2.3%) |
| Total | 54,654 (100.0%) | 54,889 (100.0%) |
Families and Households in Santa Maria
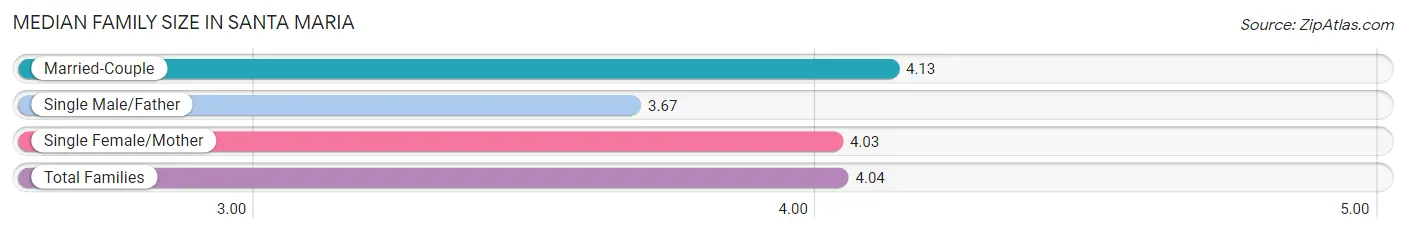
Median Family Size in Santa Maria
The median family size in Santa Maria is 4.04 persons per family, with married-couple families (14,476 | 63.3%) accounting for the largest median family size of 4.13 persons per family. On the other hand, single male/father families (3,056 | 13.4%) represent the smallest median family size with 3.67 persons per family.
| Family Type | # Families | Family Size |
| Married-Couple | 14,476 (63.3%) | 4.13 |
| Single Male/Father | 3,056 (13.4%) | 3.67 |
| Single Female/Mother | 5,336 (23.3%) | 4.03 |
| Total Families | 22,868 (100.0%) | 4.04 |
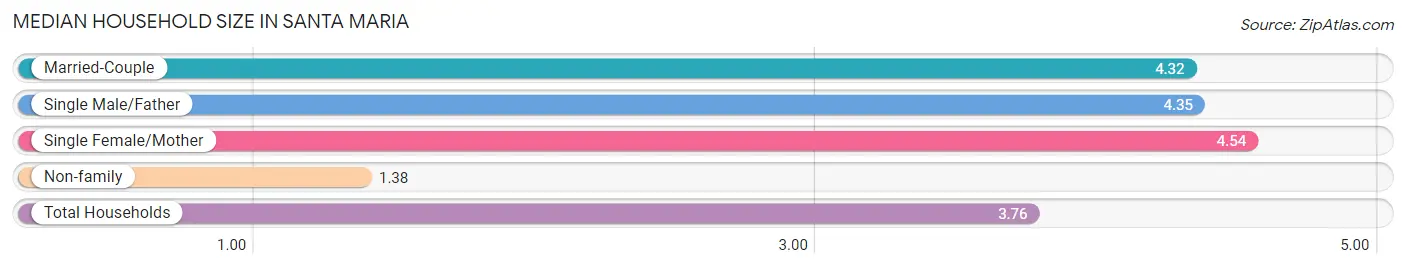
Median Household Size in Santa Maria
The median household size in Santa Maria is 3.76 persons per household, with single female/mother households (5,336 | 18.6%) accounting for the largest median household size of 4.54 persons per household. non-family households (5,870 | 20.4%) represent the smallest median household size with 1.38 persons per household.
| Household Type | # Households | Household Size |
| Married-Couple | 14,476 (50.4%) | 4.32 |
| Single Male/Father | 3,056 (10.6%) | 4.35 |
| Single Female/Mother | 5,336 (18.6%) | 4.54 |
| Non-family | 5,870 (20.4%) | 1.38 |
| Total Households | 28,738 (100.0%) | 3.76 |
Household Size by Marriage Status in Santa Maria
Out of a total of 28,738 households in Santa Maria, 22,868 (79.6%) are family households, while 5,870 (20.4%) are nonfamily households. The most numerous type of family households are 2-person households, comprising 5,429, and the most common type of nonfamily households are 1-person households, comprising 4,686.
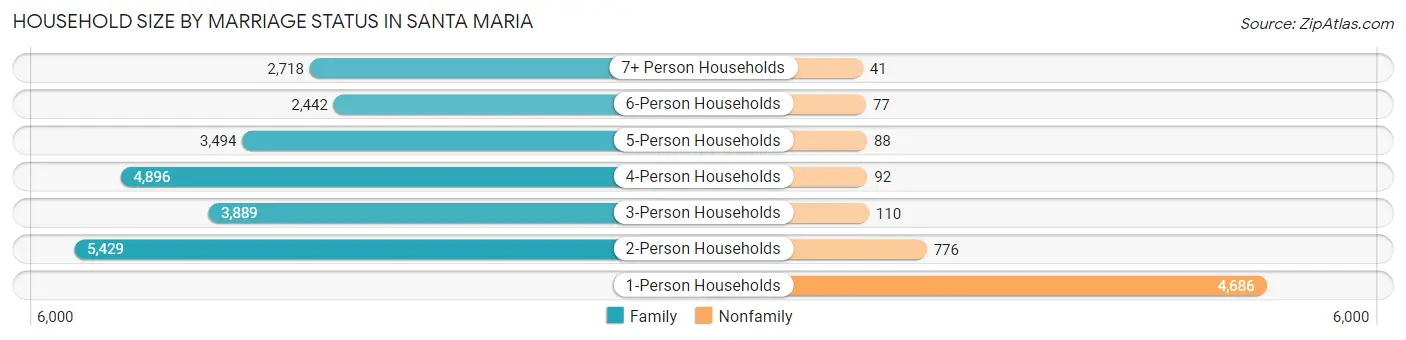
| Household Size | Family Households | Nonfamily Households |
| 1-Person Households | - | 4,686 (16.3%) |
| 2-Person Households | 5,429 (18.9%) | 776 (2.7%) |
| 3-Person Households | 3,889 (13.5%) | 110 (0.4%) |
| 4-Person Households | 4,896 (17.0%) | 92 (0.3%) |
| 5-Person Households | 3,494 (12.2%) | 88 (0.3%) |
| 6-Person Households | 2,442 (8.5%) | 77 (0.3%) |
| 7+ Person Households | 2,718 (9.5%) | 41 (0.1%) |
| Total | 22,868 (79.6%) | 5,870 (20.4%) |
Female Fertility in Santa Maria
Fertility by Age in Santa Maria
Average fertility rate in Santa Maria is 72.0 births per 1,000 women. Women in the age bracket of 20 to 34 years have the highest fertility rate with 118.0 births per 1,000 women. Women in the age bracket of 20 to 34 years acount for 74.9% of all women with births.
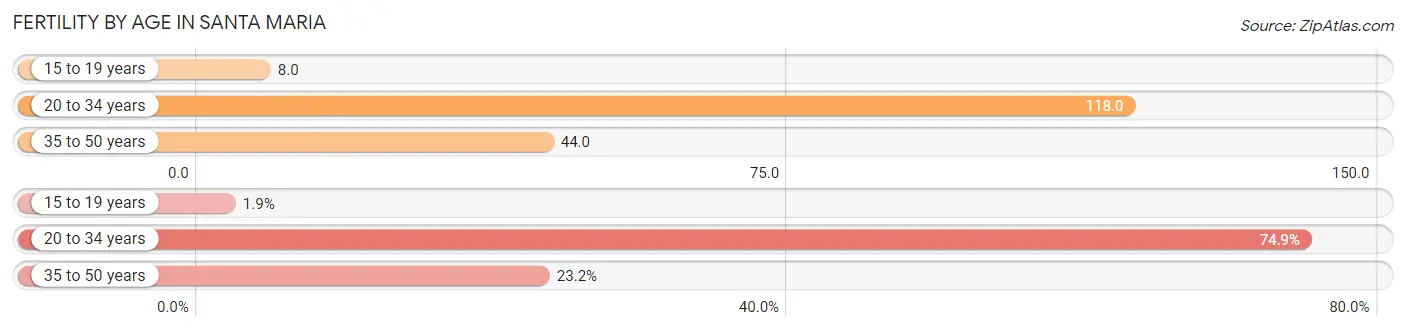
| Age Bracket | Women with Births | Births / 1,000 Women |
| 15 to 19 years | 37 (1.9%) | 8.0 |
| 20 to 34 years | 1,469 (74.9%) | 118.0 |
| 35 to 50 years | 455 (23.2%) | 44.0 |
| Total | 1,961 (100.0%) | 72.0 |
Fertility by Age by Marriage Status in Santa Maria
53.4% of women with births (1,961) in Santa Maria are married. The highest percentage of unmarried women with births falls into 15 to 19 years age bracket with 100.0% of them unmarried at the time of birth, while the lowest percentage of unmarried women with births belong to 35 to 50 years age bracket with 30.8% of them unmarried.
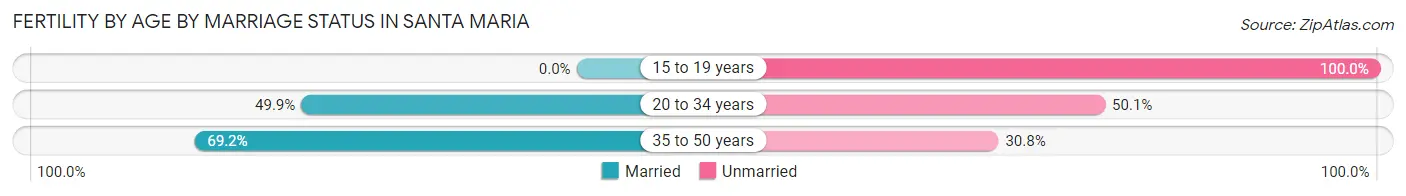
| Age Bracket | Married | Unmarried |
| 15 to 19 years | 0 (0.0%) | 37 (100.0%) |
| 20 to 34 years | 733 (49.9%) | 736 (50.1%) |
| 35 to 50 years | 315 (69.2%) | 140 (30.8%) |
| Total | 1,047 (53.4%) | 914 (46.6%) |
Fertility by Education in Santa Maria
Average fertility rate in Santa Maria is 72.0 births per 1,000 women. Women with the education attainment of graduate degree have the highest fertility rate of 131.0 births per 1,000 women, while women with the education attainment of less than high school have the lowest fertility at 61.0 births per 1,000 women. Women with the education attainment of college or associate's degree represent 33.5% of all women with births.
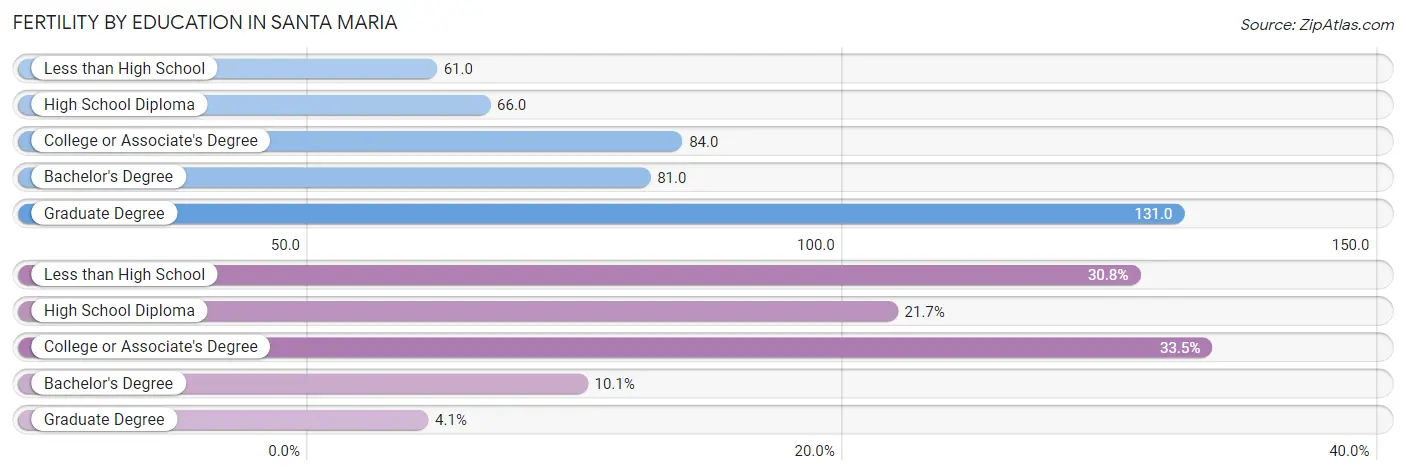
| Educational Attainment | Women with Births | Births / 1,000 Women |
| Less than High School | 603 (30.7%) | 61.0 |
| High School Diploma | 425 (21.7%) | 66.0 |
| College or Associate's Degree | 656 (33.5%) | 84.0 |
| Bachelor's Degree | 197 (10.1%) | 81.0 |
| Graduate Degree | 80 (4.1%) | 131.0 |
| Total | 1,961 (100.0%) | 72.0 |
Fertility by Education by Marriage Status in Santa Maria
46.6% of women with births in Santa Maria are unmarried. Women with the educational attainment of graduate degree are most likely to be married with 100.0% of them married at childbirth, while women with the educational attainment of less than high school are least likely to be married with 60.7% of them unmarried at childbirth.
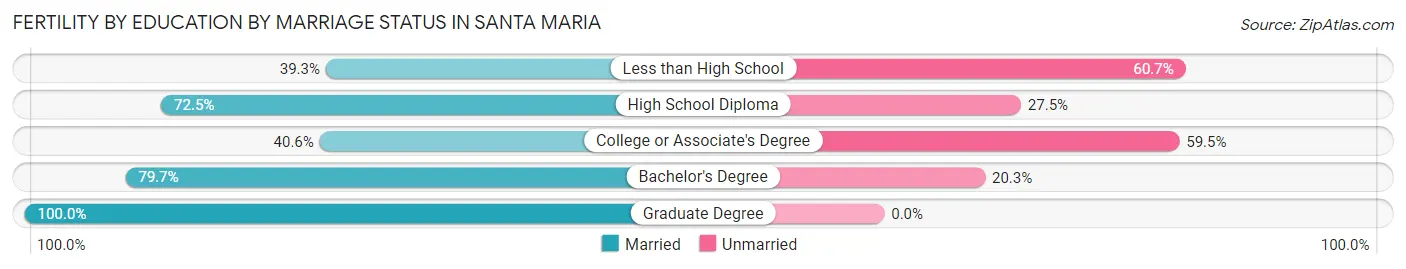
| Educational Attainment | Married | Unmarried |
| Less than High School | 237 (39.3%) | 366 (60.7%) |
| High School Diploma | 308 (72.5%) | 117 (27.5%) |
| College or Associate's Degree | 266 (40.6%) | 390 (59.5%) |
| Bachelor's Degree | 157 (79.7%) | 40 (20.3%) |
| Graduate Degree | 80 (100.0%) | 0 (0.0%) |
| Total | 1,047 (53.4%) | 914 (46.6%) |
Employment Characteristics in Santa Maria
Employment by Class of Employer in Santa Maria
Among the 47,792 employed individuals in Santa Maria, private company employees (35,081 | 73.4%), local government employees (3,513 | 7.3%), and not-for-profit organizations (2,862 | 6.0%) make up the most common classes of employment.
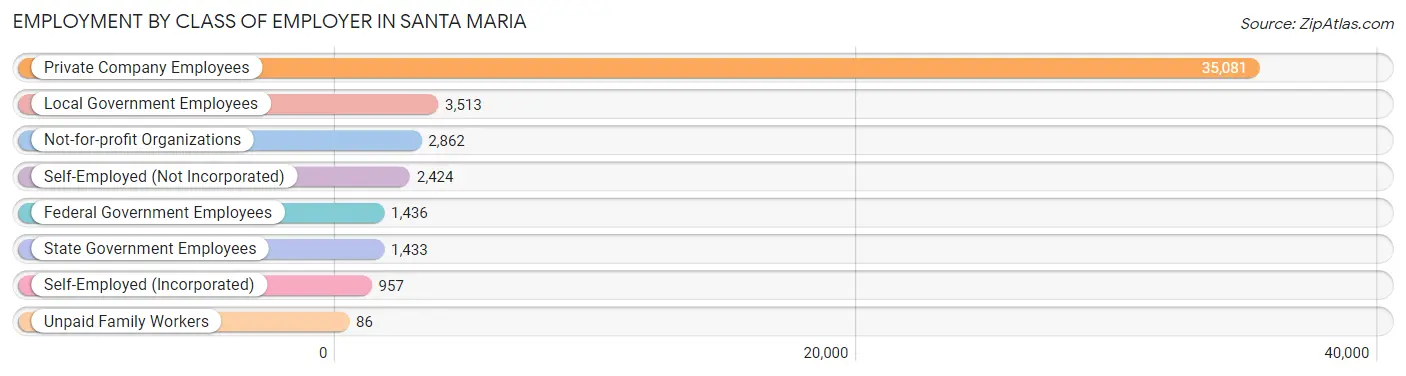
| Employer Class | # Employees | % Employees |
| Private Company Employees | 35,081 | 73.4% |
| Self-Employed (Incorporated) | 957 | 2.0% |
| Self-Employed (Not Incorporated) | 2,424 | 5.1% |
| Not-for-profit Organizations | 2,862 | 6.0% |
| Local Government Employees | 3,513 | 7.3% |
| State Government Employees | 1,433 | 3.0% |
| Federal Government Employees | 1,436 | 3.0% |
| Unpaid Family Workers | 86 | 0.2% |
| Total | 47,792 | 100.0% |
Employment Status by Age in Santa Maria
According to the labor force statistics for Santa Maria, out of the total population over 16 years of age (79,402), 66.1% or 52,485 individuals are in the labor force, with 6.3% or 3,307 of them unemployed. The age group with the highest labor force participation rate is 30 to 34 years, with 86.1% or 6,329 individuals in the labor force. Within the labor force, the 16 to 19 years age range has the highest percentage of unemployed individuals, with 14.7% or 404 of them being unemployed.
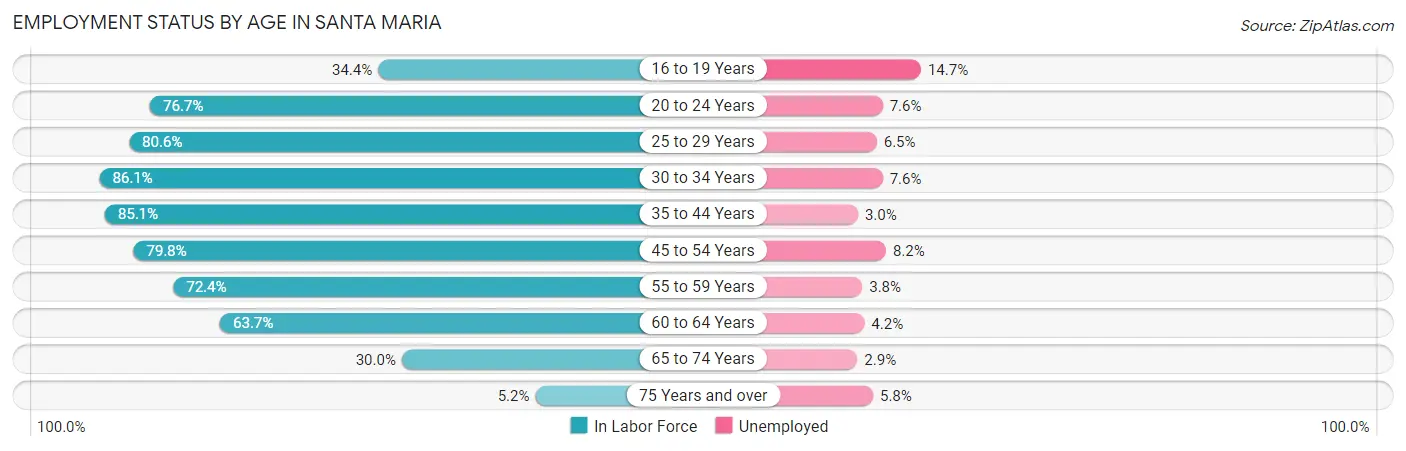
| Age Bracket | In Labor Force | Unemployed |
| 16 to 19 Years | 2,748 (34.4%) | 404 (14.7%) |
| 20 to 24 Years | 7,609 (76.7%) | 578 (7.6%) |
| 25 to 29 Years | 6,502 (80.6%) | 423 (6.5%) |
| 30 to 34 Years | 6,329 (86.1%) | 481 (7.6%) |
| 35 to 44 Years | 11,522 (85.1%) | 346 (3.0%) |
| 45 to 54 Years | 9,136 (79.8%) | 749 (8.2%) |
| 55 to 59 Years | 3,789 (72.4%) | 144 (3.8%) |
| 60 to 64 Years | 2,611 (63.7%) | 110 (4.2%) |
| 65 to 74 Years | 1,926 (30.0%) | 56 (2.9%) |
| 75 Years and over | 278 (5.2%) | 16 (5.8%) |
| Total | 52,485 (66.1%) | 3,307 (6.3%) |
Employment Status by Educational Attainment in Santa Maria
According to labor force statistics for Santa Maria, 80.2% of individuals (39,890) out of the total population between 25 and 64 years of age (49,738) are in the labor force, with 5.6% or 2,234 of them being unemployed. The group with the highest labor force participation rate are those with the educational attainment of bachelor's degree or higher, with 85.8% or 5,668 individuals in the labor force. Within the labor force, individuals with less than high school education have the highest percentage of unemployment, with 7.8% or 1,183 of them being unemployed.
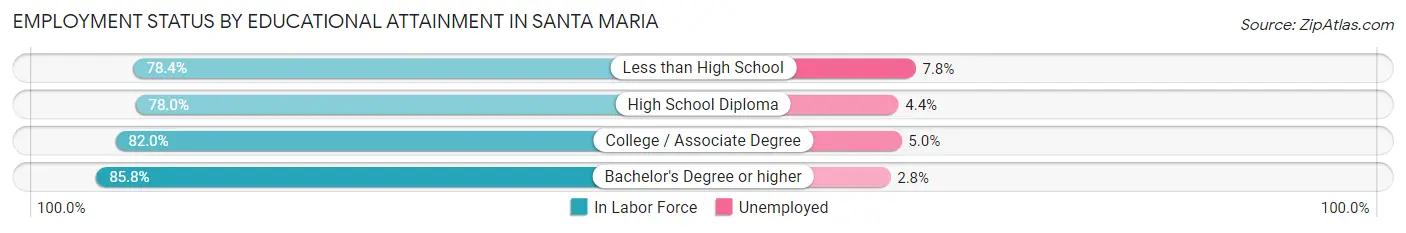
| Educational Attainment | In Labor Force | Unemployed |
| Less than High School | 15,171 (78.4%) | 1,509 (7.8%) |
| High School Diploma | 8,457 (78.0%) | 477 (4.4%) |
| College / Associate Degree | 10,610 (82.0%) | 647 (5.0%) |
| Bachelor's Degree or higher | 5,668 (85.8%) | 185 (2.8%) |
| Total | 39,890 (80.2%) | 2,785 (5.6%) |
Employment Occupations by Sex in Santa Maria
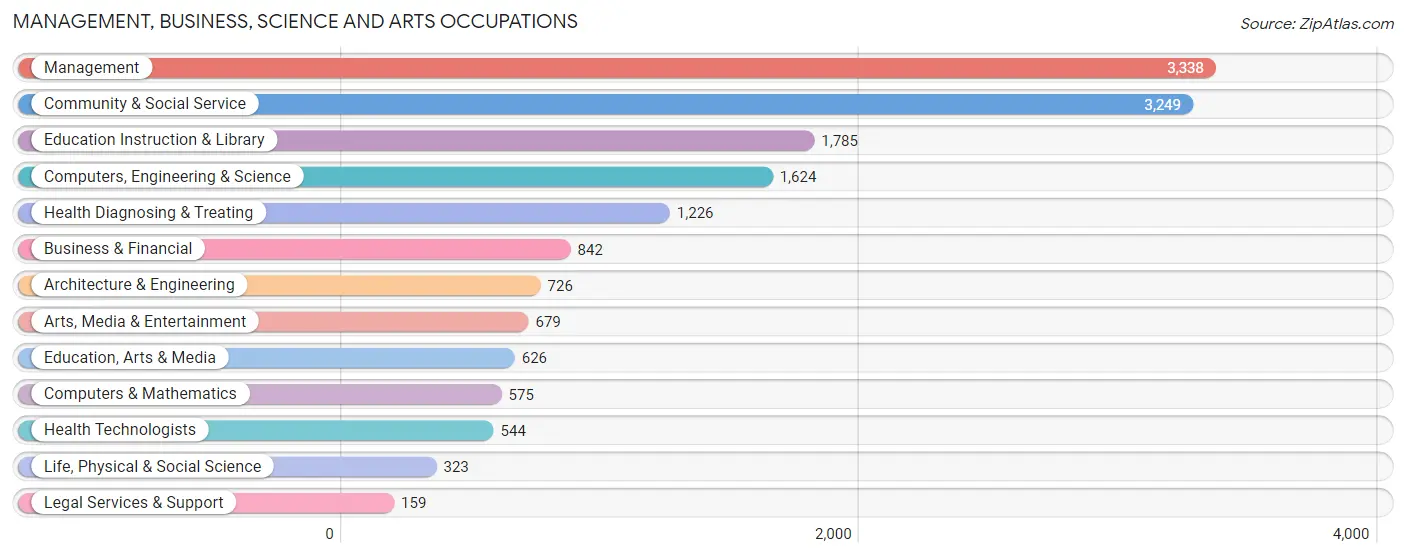
Management, Business, Science and Arts Occupations
The most common Management, Business, Science and Arts occupations in Santa Maria are Management (3,338 | 6.8%), Community & Social Service (3,249 | 6.6%), Education Instruction & Library (1,785 | 3.6%), Computers, Engineering & Science (1,624 | 3.3%), and Health Diagnosing & Treating (1,226 | 2.5%).
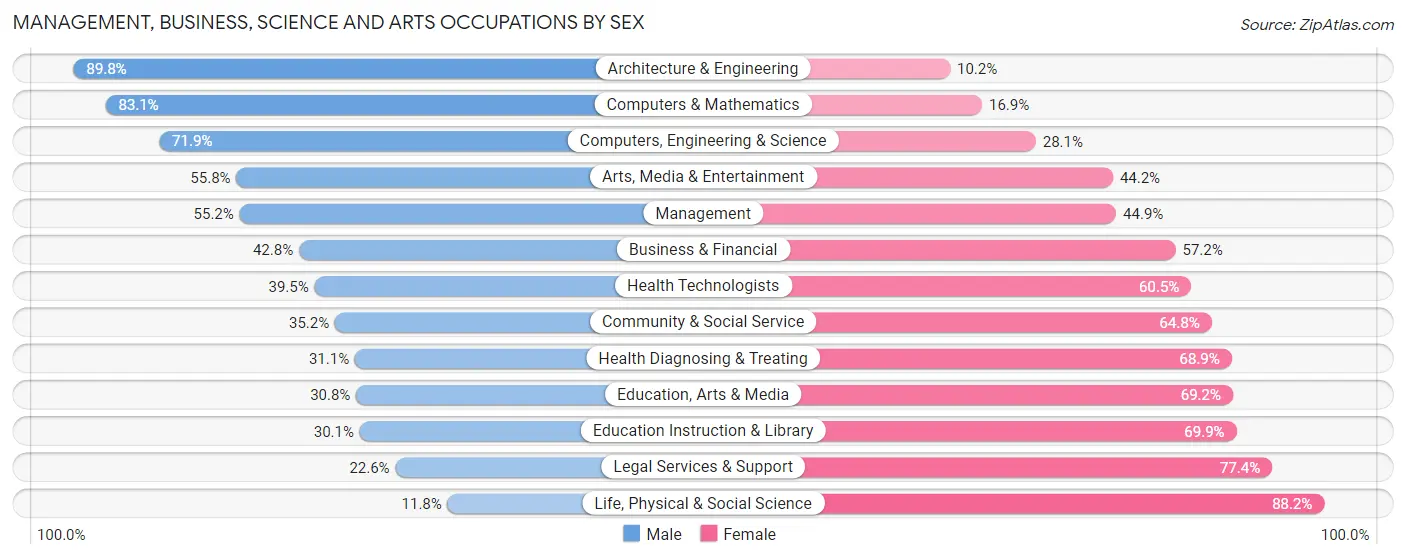
Management, Business, Science and Arts Occupations by Sex
Within the Management, Business, Science and Arts occupations in Santa Maria, the most male-oriented occupations are Architecture & Engineering (89.8%), Computers & Mathematics (83.1%), and Computers, Engineering & Science (71.9%), while the most female-oriented occupations are Life, Physical & Social Science (88.2%), Legal Services & Support (77.4%), and Education Instruction & Library (69.9%).
| Occupation | Male | Female |
| Management | 1,841 (55.1%) | 1,497 (44.9%) |
| Business & Financial | 360 (42.8%) | 482 (57.2%) |
| Computers, Engineering & Science | 1,168 (71.9%) | 456 (28.1%) |
| Computers & Mathematics | 478 (83.1%) | 97 (16.9%) |
| Architecture & Engineering | 652 (89.8%) | 74 (10.2%) |
| Life, Physical & Social Science | 38 (11.8%) | 285 (88.2%) |
| Community & Social Service | 1,145 (35.2%) | 2,104 (64.8%) |
| Education, Arts & Media | 193 (30.8%) | 433 (69.2%) |
| Legal Services & Support | 36 (22.6%) | 123 (77.4%) |
| Education Instruction & Library | 537 (30.1%) | 1,248 (69.9%) |
| Arts, Media & Entertainment | 379 (55.8%) | 300 (44.2%) |
| Health Diagnosing & Treating | 381 (31.1%) | 845 (68.9%) |
| Health Technologists | 215 (39.5%) | 329 (60.5%) |
| Total (Category) | 4,895 (47.6%) | 5,384 (52.4%) |
| Total (Overall) | 27,233 (55.7%) | 21,665 (44.3%) |
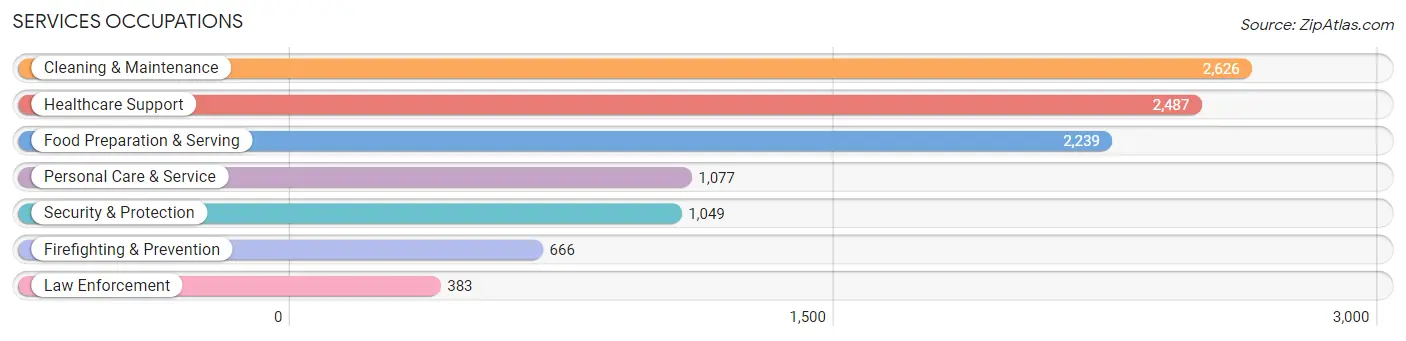
Services Occupations
The most common Services occupations in Santa Maria are Cleaning & Maintenance (2,626 | 5.4%), Healthcare Support (2,487 | 5.1%), Food Preparation & Serving (2,239 | 4.6%), Personal Care & Service (1,077 | 2.2%), and Security & Protection (1,049 | 2.1%).
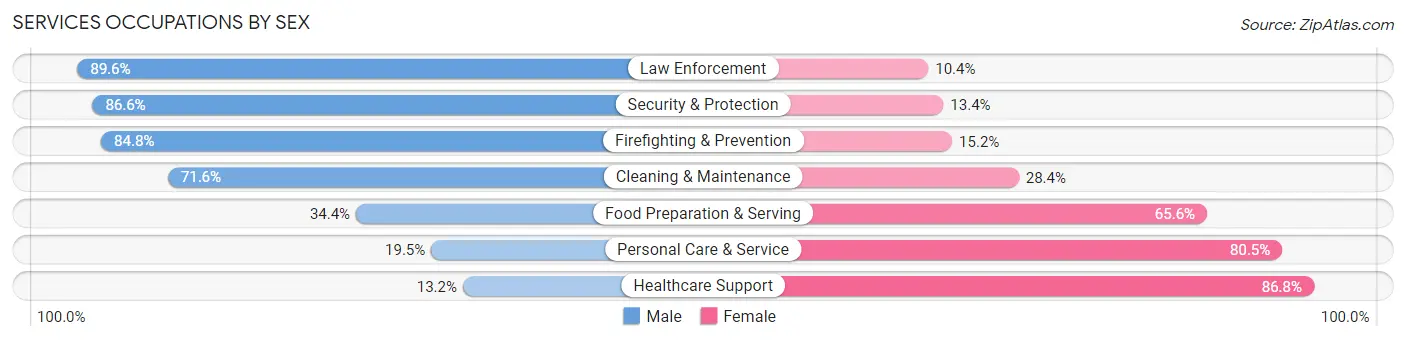
Services Occupations by Sex
Within the Services occupations in Santa Maria, the most male-oriented occupations are Law Enforcement (89.6%), Security & Protection (86.6%), and Firefighting & Prevention (84.8%), while the most female-oriented occupations are Healthcare Support (86.8%), Personal Care & Service (80.5%), and Food Preparation & Serving (65.6%).
| Occupation | Male | Female |
| Healthcare Support | 329 (13.2%) | 2,158 (86.8%) |
| Security & Protection | 908 (86.6%) | 141 (13.4%) |
| Firefighting & Prevention | 565 (84.8%) | 101 (15.2%) |
| Law Enforcement | 343 (89.6%) | 40 (10.4%) |
| Food Preparation & Serving | 770 (34.4%) | 1,469 (65.6%) |
| Cleaning & Maintenance | 1,881 (71.6%) | 745 (28.4%) |
| Personal Care & Service | 210 (19.5%) | 867 (80.5%) |
| Total (Category) | 4,098 (43.2%) | 5,380 (56.8%) |
| Total (Overall) | 27,233 (55.7%) | 21,665 (44.3%) |
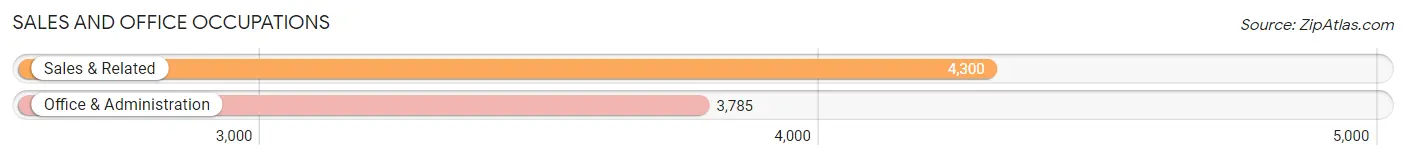
Sales and Office Occupations
The most common Sales and Office occupations in Santa Maria are Sales & Related (4,300 | 8.8%), and Office & Administration (3,785 | 7.7%).
Sales and Office Occupations by Sex
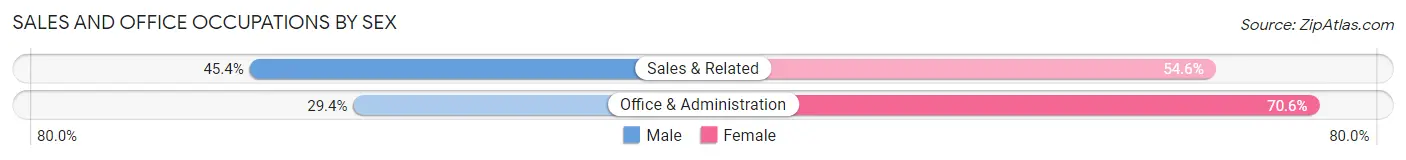
| Occupation | Male | Female |
| Sales & Related | 1,952 (45.4%) | 2,348 (54.6%) |
| Office & Administration | 1,114 (29.4%) | 2,671 (70.6%) |
| Total (Category) | 3,066 (37.9%) | 5,019 (62.1%) |
| Total (Overall) | 27,233 (55.7%) | 21,665 (44.3%) |
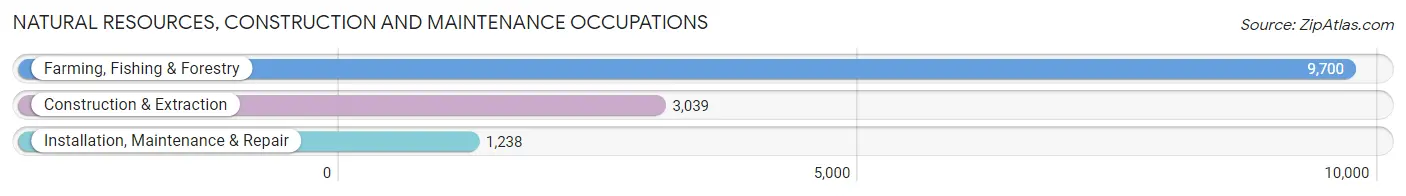
Natural Resources, Construction and Maintenance Occupations
The most common Natural Resources, Construction and Maintenance occupations in Santa Maria are Farming, Fishing & Forestry (9,700 | 19.8%), Construction & Extraction (3,039 | 6.2%), and Installation, Maintenance & Repair (1,238 | 2.5%).
Natural Resources, Construction and Maintenance Occupations by Sex
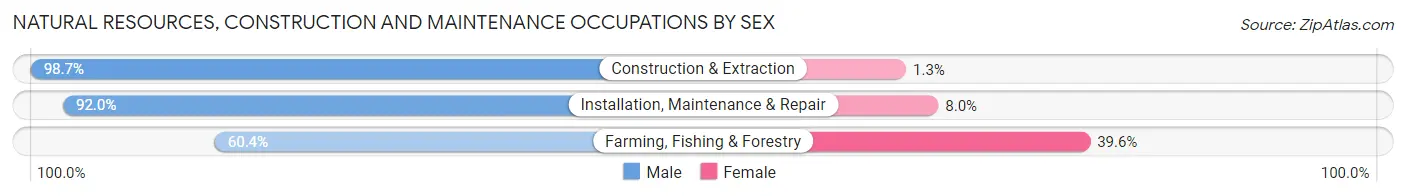
| Occupation | Male | Female |
| Farming, Fishing & Forestry | 5,860 (60.4%) | 3,840 (39.6%) |
| Construction & Extraction | 3,000 (98.7%) | 39 (1.3%) |
| Installation, Maintenance & Repair | 1,139 (92.0%) | 99 (8.0%) |
| Total (Category) | 9,999 (71.5%) | 3,978 (28.5%) |
| Total (Overall) | 27,233 (55.7%) | 21,665 (44.3%) |
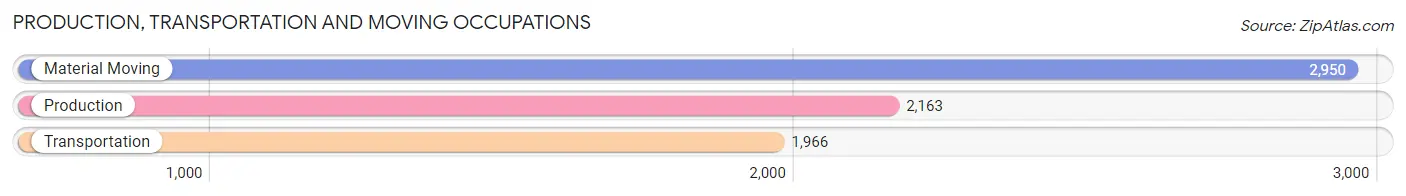
Production, Transportation and Moving Occupations
The most common Production, Transportation and Moving occupations in Santa Maria are Material Moving (2,950 | 6.0%), Production (2,163 | 4.4%), and Transportation (1,966 | 4.0%).
Production, Transportation and Moving Occupations by Sex
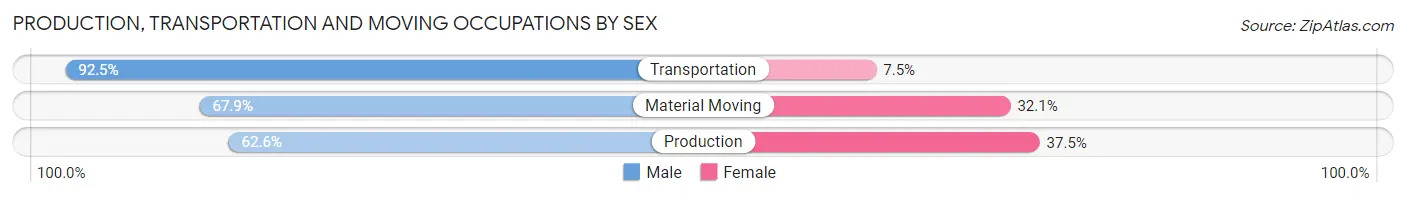
| Occupation | Male | Female |
| Production | 1,353 (62.5%) | 810 (37.4%) |
| Transportation | 1,819 (92.5%) | 147 (7.5%) |
| Material Moving | 2,003 (67.9%) | 947 (32.1%) |
| Total (Category) | 5,175 (73.1%) | 1,904 (26.9%) |
| Total (Overall) | 27,233 (55.7%) | 21,665 (44.3%) |
Employment Industries by Sex in Santa Maria
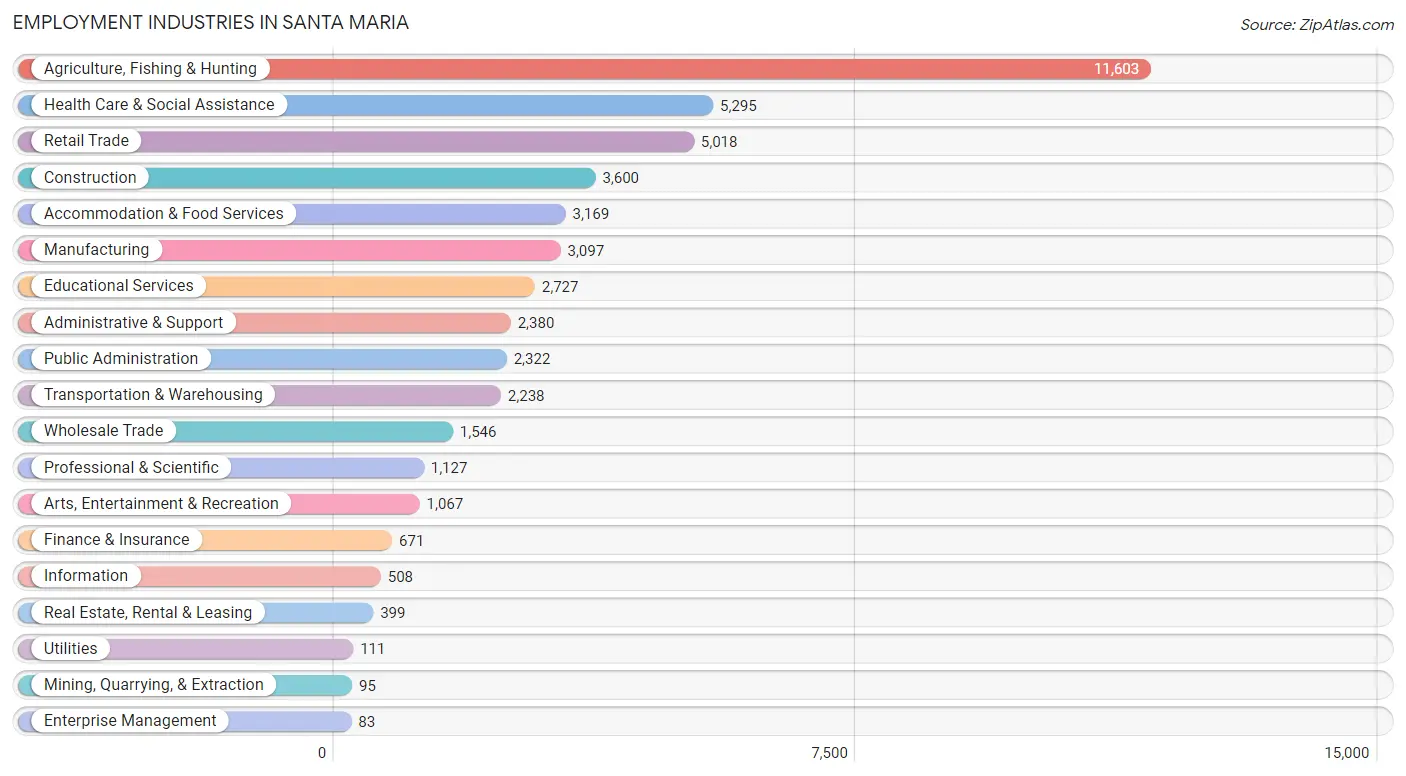
Employment Industries in Santa Maria
The major employment industries in Santa Maria include Agriculture, Fishing & Hunting (11,603 | 23.7%), Health Care & Social Assistance (5,295 | 10.8%), Retail Trade (5,018 | 10.3%), Construction (3,600 | 7.4%), and Accommodation & Food Services (3,169 | 6.5%).
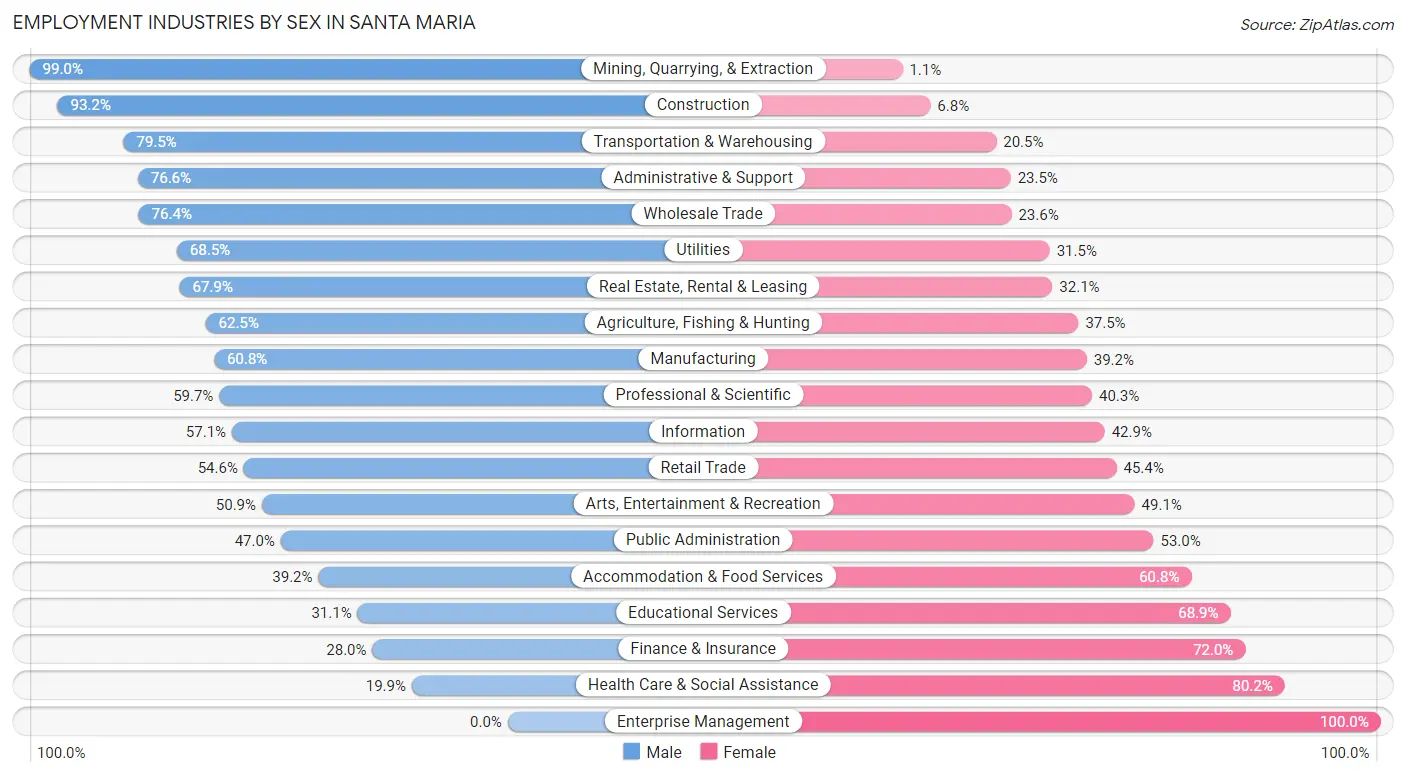
Employment Industries by Sex in Santa Maria
The Santa Maria industries that see more men than women are Mining, Quarrying, & Extraction (99.0%), Construction (93.2%), and Transportation & Warehousing (79.5%), whereas the industries that tend to have a higher number of women are Enterprise Management (100.0%), Health Care & Social Assistance (80.1%), and Finance & Insurance (72.0%).
| Industry | Male | Female |
| Agriculture, Fishing & Hunting | 7,255 (62.5%) | 4,348 (37.5%) |
| Mining, Quarrying, & Extraction | 94 (99.0%) | 1 (1.1%) |
| Construction | 3,354 (93.2%) | 246 (6.8%) |
| Manufacturing | 1,883 (60.8%) | 1,214 (39.2%) |
| Wholesale Trade | 1,181 (76.4%) | 365 (23.6%) |
| Retail Trade | 2,742 (54.6%) | 2,276 (45.4%) |
| Transportation & Warehousing | 1,780 (79.5%) | 458 (20.5%) |
| Utilities | 76 (68.5%) | 35 (31.5%) |
| Information | 290 (57.1%) | 218 (42.9%) |
| Finance & Insurance | 188 (28.0%) | 483 (72.0%) |
| Real Estate, Rental & Leasing | 271 (67.9%) | 128 (32.1%) |
| Professional & Scientific | 673 (59.7%) | 454 (40.3%) |
| Enterprise Management | 0 (0.0%) | 83 (100.0%) |
| Administrative & Support | 1,822 (76.5%) | 558 (23.4%) |
| Educational Services | 848 (31.1%) | 1,879 (68.9%) |
| Health Care & Social Assistance | 1,051 (19.9%) | 4,244 (80.1%) |
| Arts, Entertainment & Recreation | 543 (50.9%) | 524 (49.1%) |
| Accommodation & Food Services | 1,242 (39.2%) | 1,927 (60.8%) |
| Public Administration | 1,091 (47.0%) | 1,231 (53.0%) |
| Total | 27,233 (55.7%) | 21,665 (44.3%) |
Education in Santa Maria
School Enrollment in Santa Maria
The most common levels of schooling among the 32,575 students in Santa Maria are high school (7,486 | 23.0%), college / undergraduate (7,345 | 22.6%), and middle school (7,285 | 22.4%).
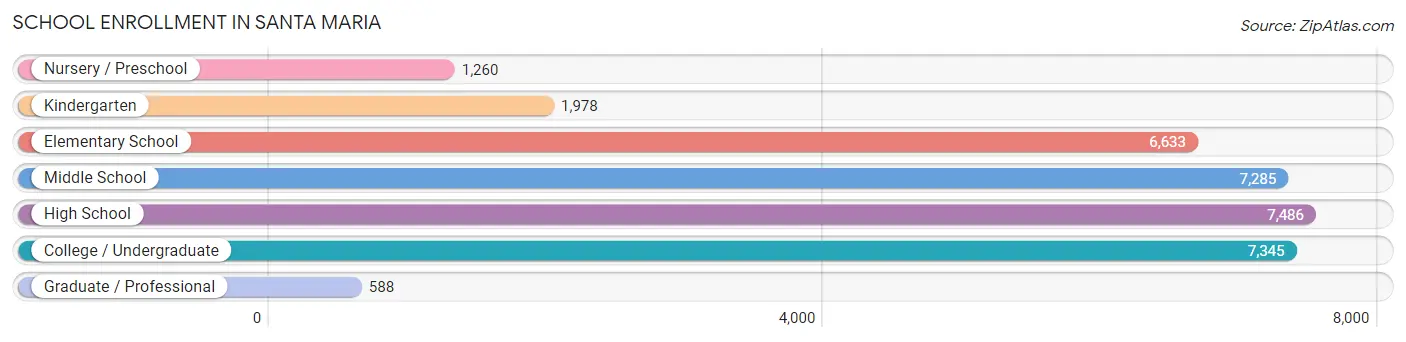
| School Level | # Students | % Students |
| Nursery / Preschool | 1,260 | 3.9% |
| Kindergarten | 1,978 | 6.1% |
| Elementary School | 6,633 | 20.4% |
| Middle School | 7,285 | 22.4% |
| High School | 7,486 | 23.0% |
| College / Undergraduate | 7,345 | 22.6% |
| Graduate / Professional | 588 | 1.8% |
| Total | 32,575 | 100.0% |
School Enrollment by Age by Funding Source in Santa Maria
Out of a total of 32,575 students who are enrolled in schools in Santa Maria, 1,792 (5.5%) attend a private institution, while the remaining 30,783 (94.5%) are enrolled in public schools. The age group of 3 to 4 year olds has the highest likelihood of being enrolled in private schools, with 247 (26.0% in the age bracket) enrolled. Conversely, the age group of 20 to 24 year olds has the lowest likelihood of being enrolled in a private school, with 3,059 (97.4% in the age bracket) attending a public institution.
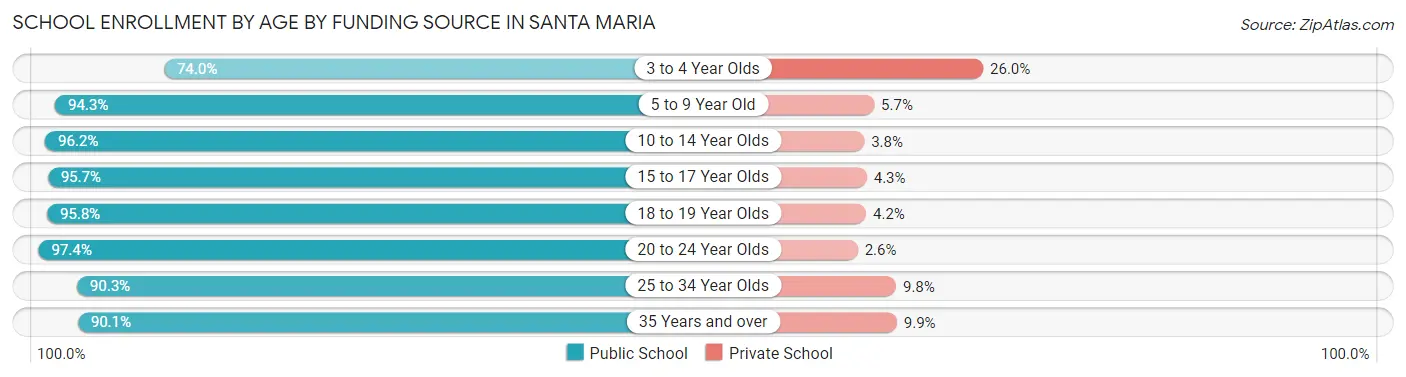
| Age Bracket | Public School | Private School |
| 3 to 4 Year Olds | 704 (74.0%) | 247 (26.0%) |
| 5 to 9 Year Old | 7,649 (94.3%) | 461 (5.7%) |
| 10 to 14 Year Olds | 9,086 (96.2%) | 362 (3.8%) |
| 15 to 17 Year Olds | 4,910 (95.7%) | 221 (4.3%) |
| 18 to 19 Year Olds | 2,553 (95.8%) | 111 (4.2%) |
| 20 to 24 Year Olds | 3,059 (97.4%) | 82 (2.6%) |
| 25 to 34 Year Olds | 1,768 (90.2%) | 191 (9.8%) |
| 35 Years and over | 1,055 (90.1%) | 116 (9.9%) |
| Total | 30,783 (94.5%) | 1,792 (5.5%) |
Educational Attainment by Field of Study in Santa Maria
Business (1,402 | 15.0%), science & technology (1,084 | 11.6%), social sciences (965 | 10.3%), education (942 | 10.1%), and engineering (876 | 9.4%) are the most common fields of study among 9,351 individuals in Santa Maria who have obtained a bachelor's degree or higher.
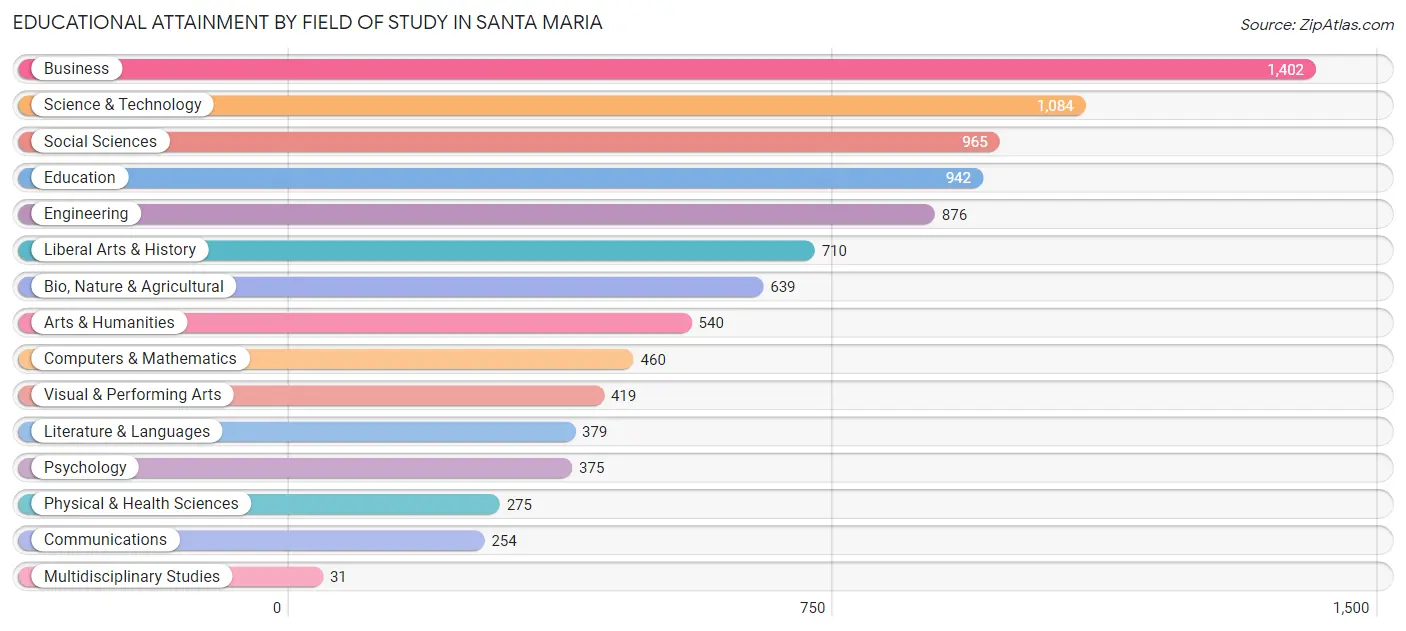
| Field of Study | # Graduates | % Graduates |
| Computers & Mathematics | 460 | 4.9% |
| Bio, Nature & Agricultural | 639 | 6.8% |
| Physical & Health Sciences | 275 | 2.9% |
| Psychology | 375 | 4.0% |
| Social Sciences | 965 | 10.3% |
| Engineering | 876 | 9.4% |
| Multidisciplinary Studies | 31 | 0.3% |
| Science & Technology | 1,084 | 11.6% |
| Business | 1,402 | 15.0% |
| Education | 942 | 10.1% |
| Literature & Languages | 379 | 4.1% |
| Liberal Arts & History | 710 | 7.6% |
| Visual & Performing Arts | 419 | 4.5% |
| Communications | 254 | 2.7% |
| Arts & Humanities | 540 | 5.8% |
| Total | 9,351 | 100.0% |
Transportation & Commute in Santa Maria
Vehicle Availability by Sex in Santa Maria
The most prevalent vehicle ownership categories in Santa Maria are males with 2 vehicles (8,978, accounting for 33.4%) and females with 2 vehicles (7,005, making up 43.3%).
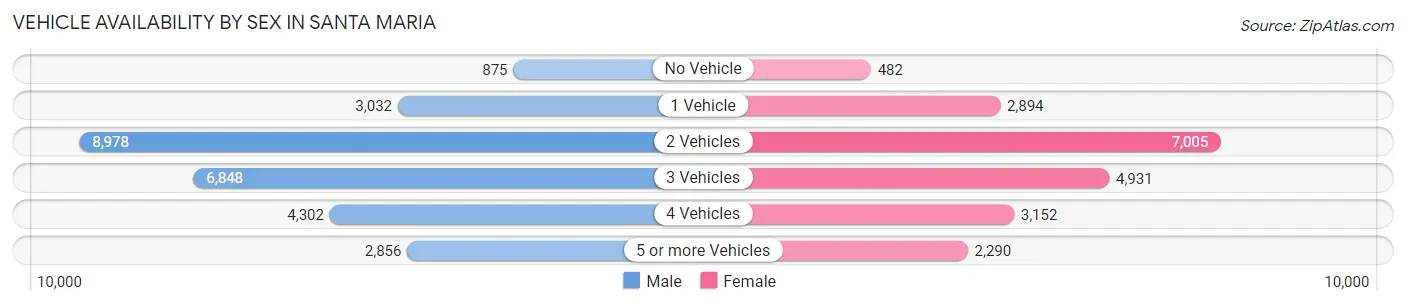
| Vehicles Available | Male | Female |
| No Vehicle | 875 (3.3%) | 482 (2.3%) |
| 1 Vehicle | 3,032 (11.3%) | 2,894 (13.9%) |
| 2 Vehicles | 8,978 (33.4%) | 7,005 (33.8%) |
| 3 Vehicles | 6,848 (25.5%) | 4,931 (23.8%) |
| 4 Vehicles | 4,302 (16.0%) | 3,152 (15.2%) |
| 5 or more Vehicles | 2,856 (10.6%) | 2,290 (11.0%) |
| Total | 26,891 (100.0%) | 20,754 (100.0%) |
Commute Time in Santa Maria
The most frequently occuring commute durations in Santa Maria are 10 to 14 minutes (9,431 commuters, 20.7%), 30 to 34 minutes (6,795 commuters, 14.9%), and 15 to 19 minutes (6,715 commuters, 14.8%).
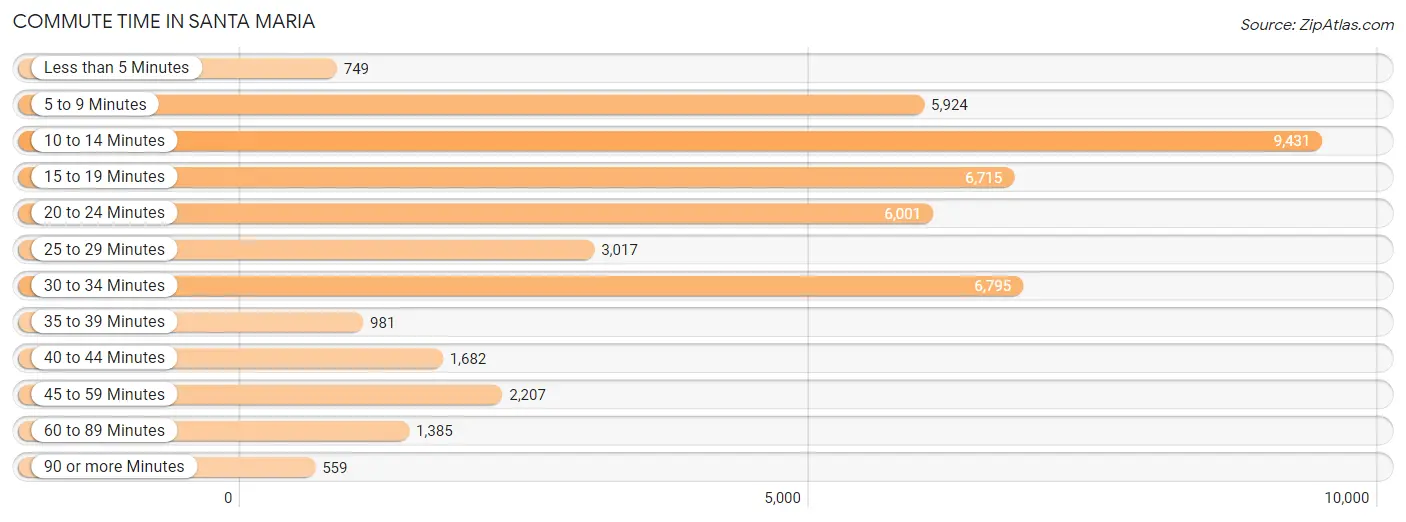
| Commute Time | # Commuters | % Commuters |
| Less than 5 Minutes | 749 | 1.7% |
| 5 to 9 Minutes | 5,924 | 13.0% |
| 10 to 14 Minutes | 9,431 | 20.7% |
| 15 to 19 Minutes | 6,715 | 14.8% |
| 20 to 24 Minutes | 6,001 | 13.2% |
| 25 to 29 Minutes | 3,017 | 6.6% |
| 30 to 34 Minutes | 6,795 | 14.9% |
| 35 to 39 Minutes | 981 | 2.2% |
| 40 to 44 Minutes | 1,682 | 3.7% |
| 45 to 59 Minutes | 2,207 | 4.9% |
| 60 to 89 Minutes | 1,385 | 3.0% |
| 90 or more Minutes | 559 | 1.2% |
Commute Time by Sex in Santa Maria
The most common commute times in Santa Maria are 10 to 14 minutes (4,633 commuters, 17.9%) for males and 10 to 14 minutes (4,798 commuters, 24.6%) for females.
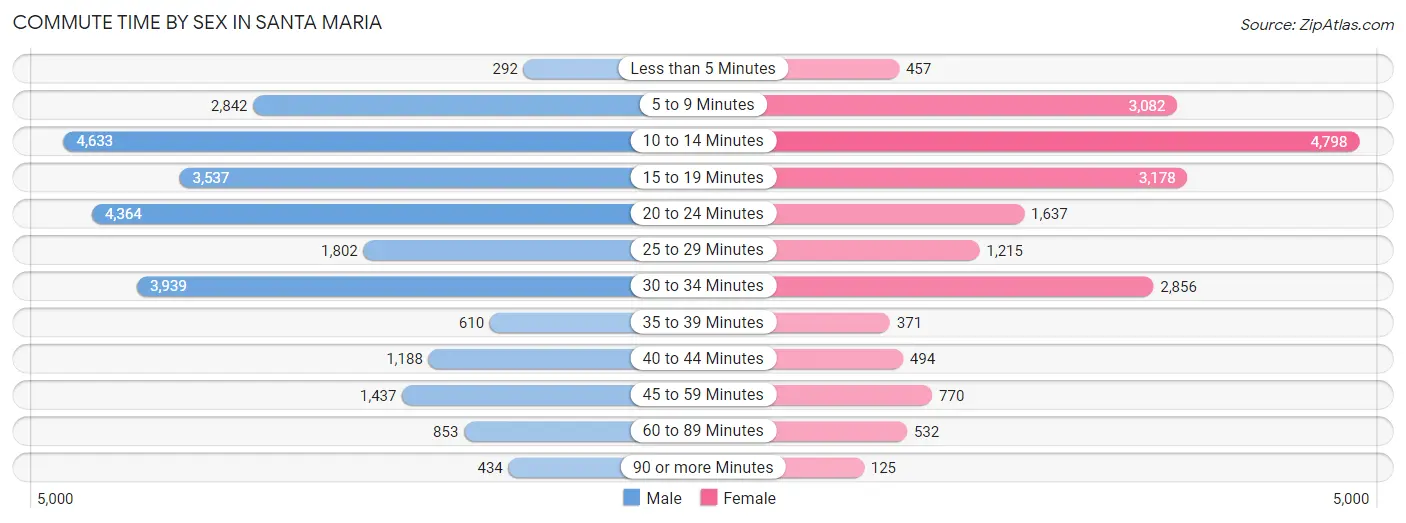
| Commute Time | Male | Female |
| Less than 5 Minutes | 292 (1.1%) | 457 (2.3%) |
| 5 to 9 Minutes | 2,842 (11.0%) | 3,082 (15.8%) |
| 10 to 14 Minutes | 4,633 (17.9%) | 4,798 (24.6%) |
| 15 to 19 Minutes | 3,537 (13.6%) | 3,178 (16.3%) |
| 20 to 24 Minutes | 4,364 (16.8%) | 1,637 (8.4%) |
| 25 to 29 Minutes | 1,802 (7.0%) | 1,215 (6.2%) |
| 30 to 34 Minutes | 3,939 (15.2%) | 2,856 (14.6%) |
| 35 to 39 Minutes | 610 (2.4%) | 371 (1.9%) |
| 40 to 44 Minutes | 1,188 (4.6%) | 494 (2.5%) |
| 45 to 59 Minutes | 1,437 (5.5%) | 770 (4.0%) |
| 60 to 89 Minutes | 853 (3.3%) | 532 (2.7%) |
| 90 or more Minutes | 434 (1.7%) | 125 (0.6%) |
Time of Departure to Work by Sex in Santa Maria
The most frequent times of departure to work in Santa Maria are 6:00 AM to 6:29 AM (4,624, 17.8%) for males and 7:30 AM to 7:59 AM (2,556, 13.1%) for females.
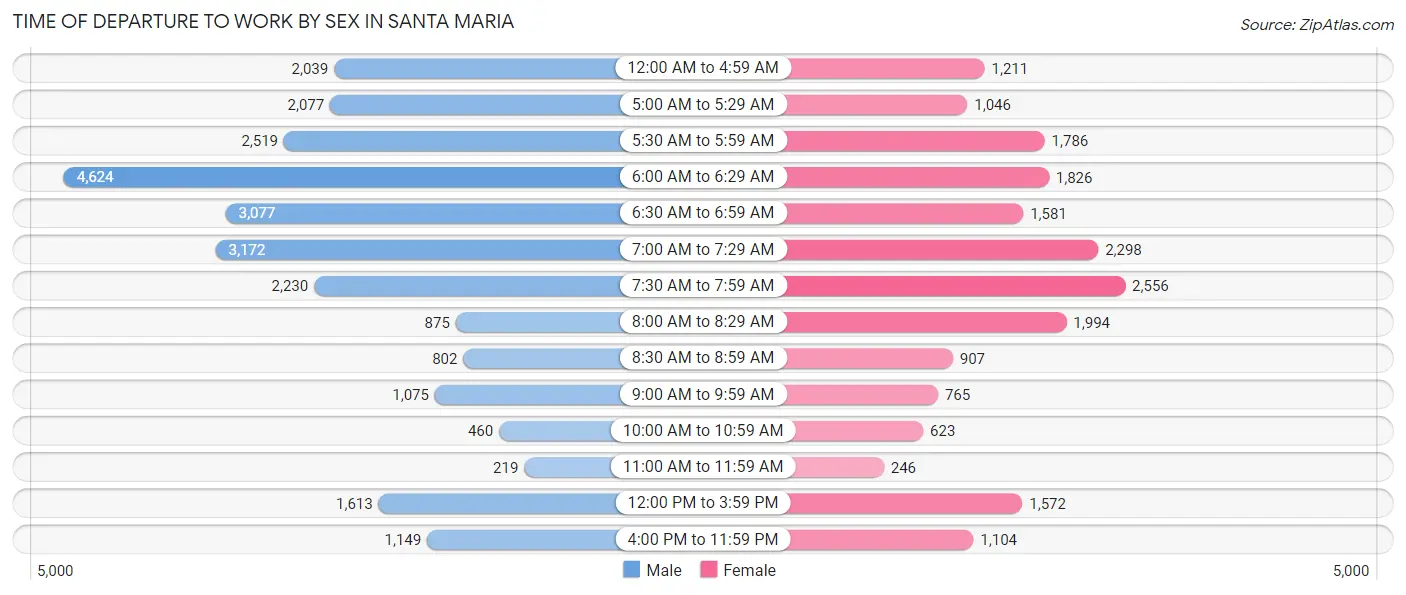
| Time of Departure | Male | Female |
| 12:00 AM to 4:59 AM | 2,039 (7.9%) | 1,211 (6.2%) |
| 5:00 AM to 5:29 AM | 2,077 (8.0%) | 1,046 (5.4%) |
| 5:30 AM to 5:59 AM | 2,519 (9.7%) | 1,786 (9.1%) |
| 6:00 AM to 6:29 AM | 4,624 (17.8%) | 1,826 (9.4%) |
| 6:30 AM to 6:59 AM | 3,077 (11.9%) | 1,581 (8.1%) |
| 7:00 AM to 7:29 AM | 3,172 (12.2%) | 2,298 (11.8%) |
| 7:30 AM to 7:59 AM | 2,230 (8.6%) | 2,556 (13.1%) |
| 8:00 AM to 8:29 AM | 875 (3.4%) | 1,994 (10.2%) |
| 8:30 AM to 8:59 AM | 802 (3.1%) | 907 (4.6%) |
| 9:00 AM to 9:59 AM | 1,075 (4.2%) | 765 (3.9%) |
| 10:00 AM to 10:59 AM | 460 (1.8%) | 623 (3.2%) |
| 11:00 AM to 11:59 AM | 219 (0.8%) | 246 (1.3%) |
| 12:00 PM to 3:59 PM | 1,613 (6.2%) | 1,572 (8.1%) |
| 4:00 PM to 11:59 PM | 1,149 (4.4%) | 1,104 (5.7%) |
| Total | 25,931 (100.0%) | 19,515 (100.0%) |
Housing Occupancy in Santa Maria
Occupancy by Ownership in Santa Maria
Of the total 28,738 dwellings in Santa Maria, owner-occupied units account for 14,710 (51.2%), while renter-occupied units make up 14,028 (48.8%).
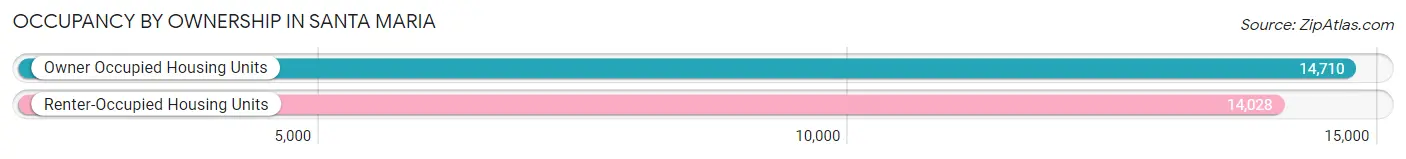
| Occupancy | # Housing Units | % Housing Units |
| Owner Occupied Housing Units | 14,710 | 51.2% |
| Renter-Occupied Housing Units | 14,028 | 48.8% |
| Total Occupied Housing Units | 28,738 | 100.0% |
Occupancy by Household Size in Santa Maria
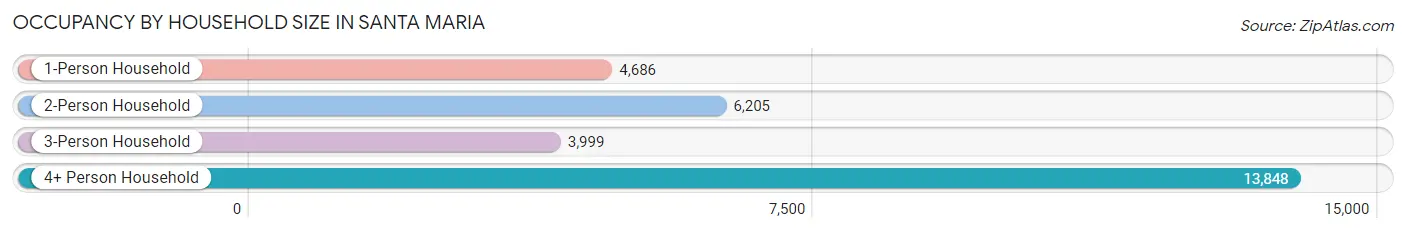
| Household Size | # Housing Units | % Housing Units |
| 1-Person Household | 4,686 | 16.3% |
| 2-Person Household | 6,205 | 21.6% |
| 3-Person Household | 3,999 | 13.9% |
| 4+ Person Household | 13,848 | 48.2% |
| Total Housing Units | 28,738 | 100.0% |
Occupancy by Ownership by Household Size in Santa Maria
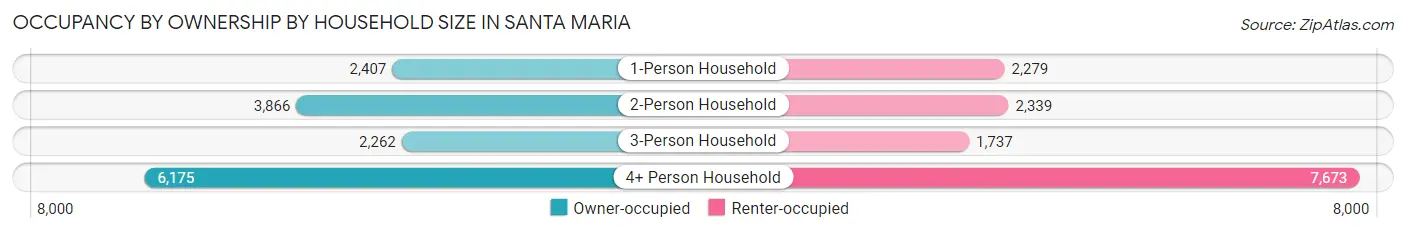
| Household Size | Owner-occupied | Renter-occupied |
| 1-Person Household | 2,407 (51.4%) | 2,279 (48.6%) |
| 2-Person Household | 3,866 (62.3%) | 2,339 (37.7%) |
| 3-Person Household | 2,262 (56.6%) | 1,737 (43.4%) |
| 4+ Person Household | 6,175 (44.6%) | 7,673 (55.4%) |
| Total Housing Units | 14,710 (51.2%) | 14,028 (48.8%) |
Occupancy by Educational Attainment in Santa Maria
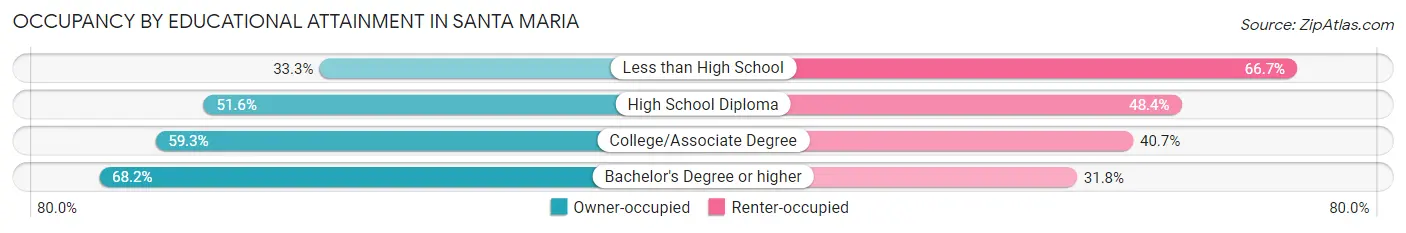
| Household Size | Owner-occupied | Renter-occupied |
| Less than High School | 2,979 (33.3%) | 5,976 (66.7%) |
| High School Diploma | 2,948 (51.6%) | 2,764 (48.4%) |
| College/Associate Degree | 5,380 (59.3%) | 3,699 (40.7%) |
| Bachelor's Degree or higher | 3,403 (68.2%) | 1,589 (31.8%) |
Occupancy by Age of Householder in Santa Maria
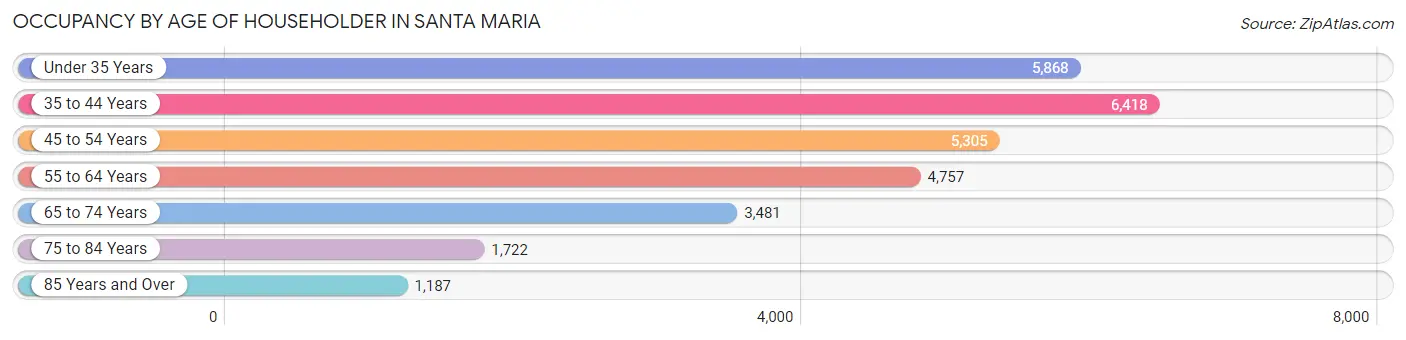
| Age Bracket | # Households | % Households |
| Under 35 Years | 5,868 | 20.4% |
| 35 to 44 Years | 6,418 | 22.3% |
| 45 to 54 Years | 5,305 | 18.5% |
| 55 to 64 Years | 4,757 | 16.6% |
| 65 to 74 Years | 3,481 | 12.1% |
| 75 to 84 Years | 1,722 | 6.0% |
| 85 Years and Over | 1,187 | 4.1% |
| Total | 28,738 | 100.0% |
Housing Finances in Santa Maria
Median Income by Occupancy in Santa Maria
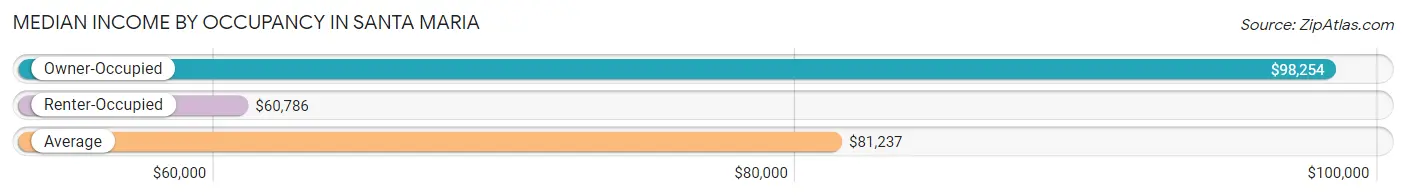
| Occupancy Type | # Households | Median Income |
| Owner-Occupied | 14,710 (51.2%) | $98,254 |
| Renter-Occupied | 14,028 (48.8%) | $60,786 |
| Average | 28,738 (100.0%) | $81,237 |
Occupancy by Householder Income Bracket in Santa Maria
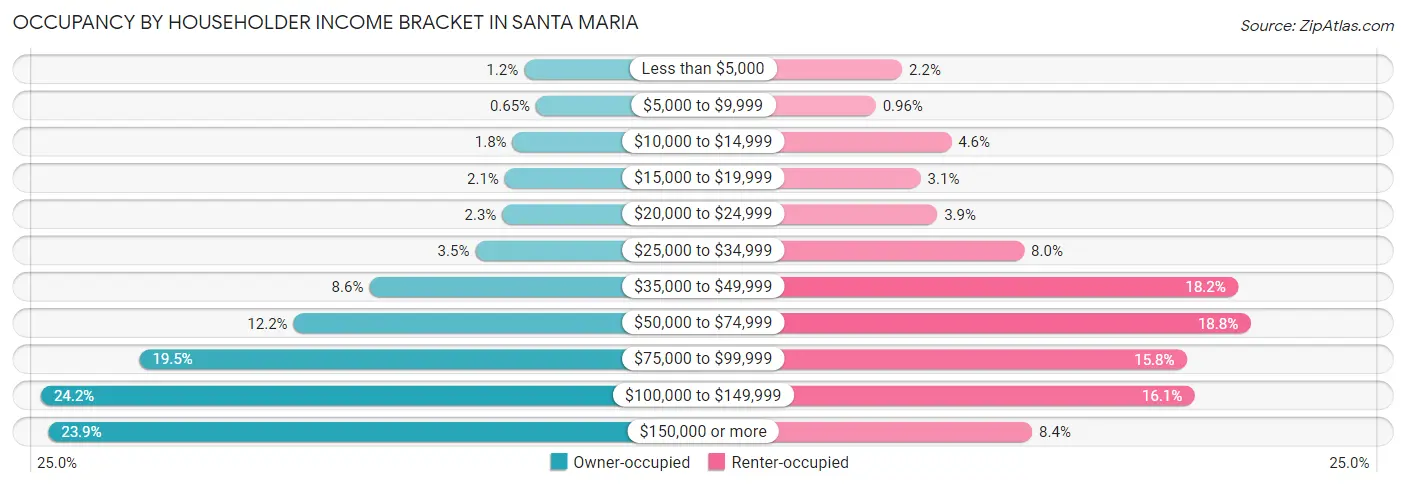
| Income Bracket | Owner-occupied | Renter-occupied |
| Less than $5,000 | 180 (1.2%) | 312 (2.2%) |
| $5,000 to $9,999 | 95 (0.6%) | 134 (1.0%) |
| $10,000 to $14,999 | 260 (1.8%) | 639 (4.6%) |
| $15,000 to $19,999 | 315 (2.1%) | 435 (3.1%) |
| $20,000 to $24,999 | 333 (2.3%) | 545 (3.9%) |
| $25,000 to $34,999 | 521 (3.5%) | 1,127 (8.0%) |
| $35,000 to $49,999 | 1,263 (8.6%) | 2,551 (18.2%) |
| $50,000 to $74,999 | 1,795 (12.2%) | 2,634 (18.8%) |
| $75,000 to $99,999 | 2,873 (19.5%) | 2,210 (15.8%) |
| $100,000 to $149,999 | 3,563 (24.2%) | 2,261 (16.1%) |
| $150,000 or more | 3,512 (23.9%) | 1,180 (8.4%) |
| Total | 14,710 (100.0%) | 14,028 (100.0%) |
Monthly Housing Cost Tiers in Santa Maria
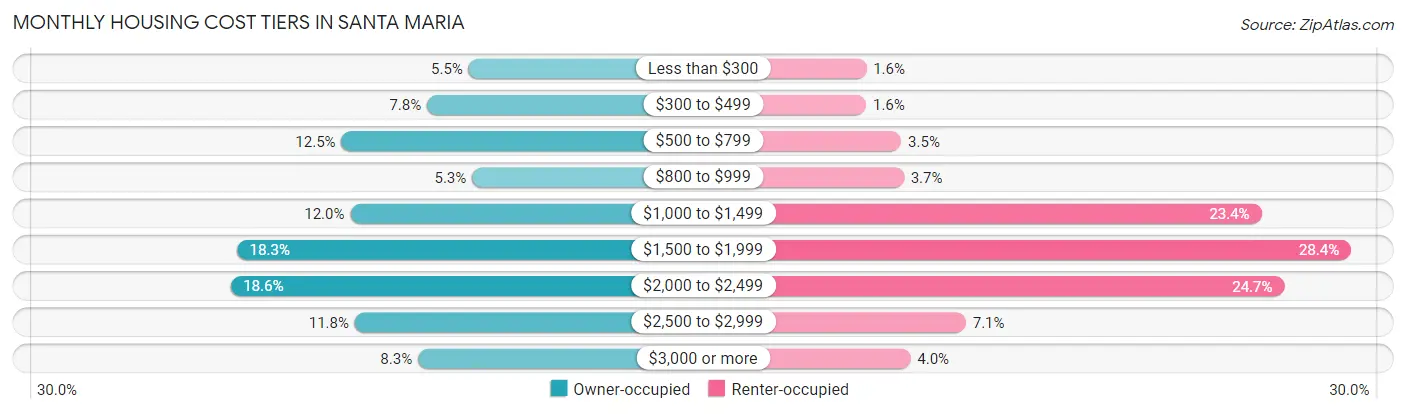
| Monthly Cost | Owner-occupied | Renter-occupied |
| Less than $300 | 805 (5.5%) | 223 (1.6%) |
| $300 to $499 | 1,143 (7.8%) | 222 (1.6%) |
| $500 to $799 | 1,839 (12.5%) | 494 (3.5%) |
| $800 to $999 | 777 (5.3%) | 514 (3.7%) |
| $1,000 to $1,499 | 1,766 (12.0%) | 3,285 (23.4%) |
| $1,500 to $1,999 | 2,691 (18.3%) | 3,980 (28.4%) |
| $2,000 to $2,499 | 2,742 (18.6%) | 3,462 (24.7%) |
| $2,500 to $2,999 | 1,730 (11.8%) | 994 (7.1%) |
| $3,000 or more | 1,217 (8.3%) | 566 (4.0%) |
| Total | 14,710 (100.0%) | 14,028 (100.0%) |
Physical Housing Characteristics in Santa Maria
Housing Structures in Santa Maria
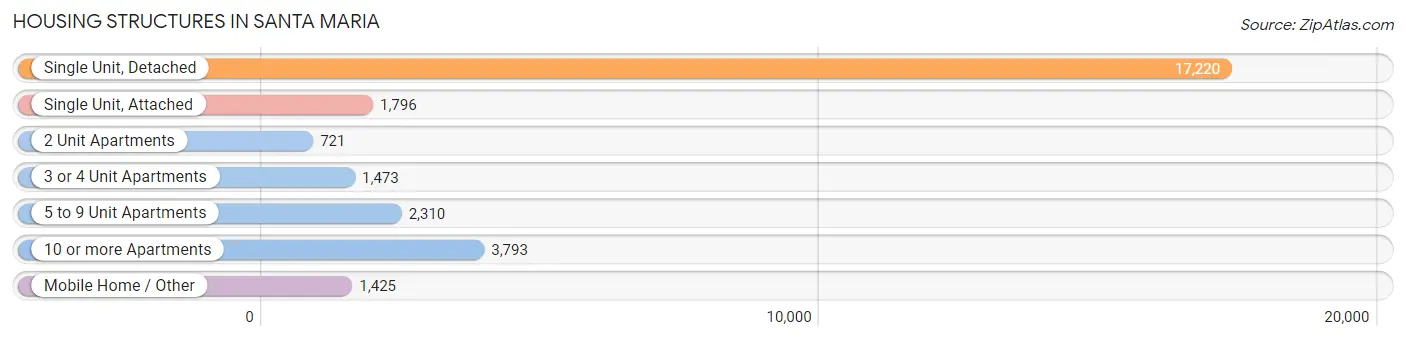
| Structure Type | # Housing Units | % Housing Units |
| Single Unit, Detached | 17,220 | 59.9% |
| Single Unit, Attached | 1,796 | 6.2% |
| 2 Unit Apartments | 721 | 2.5% |
| 3 or 4 Unit Apartments | 1,473 | 5.1% |
| 5 to 9 Unit Apartments | 2,310 | 8.0% |
| 10 or more Apartments | 3,793 | 13.2% |
| Mobile Home / Other | 1,425 | 5.0% |
| Total | 28,738 | 100.0% |
Housing Structures by Occupancy in Santa Maria
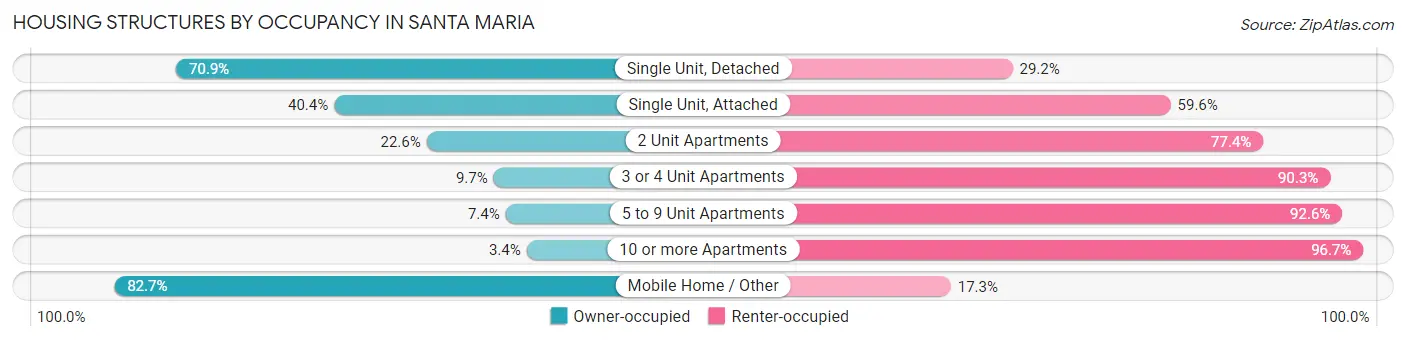
| Structure Type | Owner-occupied | Renter-occupied |
| Single Unit, Detached | 12,201 (70.9%) | 5,019 (29.1%) |
| Single Unit, Attached | 726 (40.4%) | 1,070 (59.6%) |
| 2 Unit Apartments | 163 (22.6%) | 558 (77.4%) |
| 3 or 4 Unit Apartments | 143 (9.7%) | 1,330 (90.3%) |
| 5 to 9 Unit Apartments | 171 (7.4%) | 2,139 (92.6%) |
| 10 or more Apartments | 127 (3.4%) | 3,666 (96.7%) |
| Mobile Home / Other | 1,179 (82.7%) | 246 (17.3%) |
| Total | 14,710 (51.2%) | 14,028 (48.8%) |
Housing Structures by Number of Rooms in Santa Maria
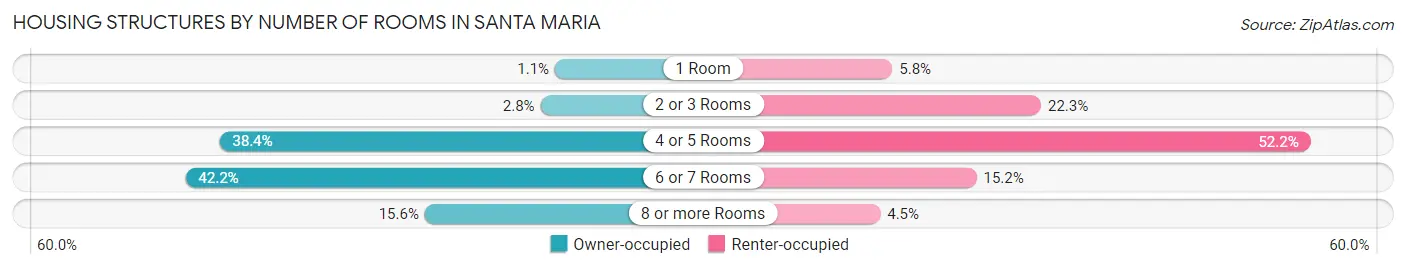
| Number of Rooms | Owner-occupied | Renter-occupied |
| 1 Room | 167 (1.1%) | 816 (5.8%) |
| 2 or 3 Rooms | 404 (2.8%) | 3,131 (22.3%) |
| 4 or 5 Rooms | 5,645 (38.4%) | 7,326 (52.2%) |
| 6 or 7 Rooms | 6,201 (42.1%) | 2,127 (15.2%) |
| 8 or more Rooms | 2,293 (15.6%) | 628 (4.5%) |
| Total | 14,710 (100.0%) | 14,028 (100.0%) |
Housing Structure by Heating Type in Santa Maria
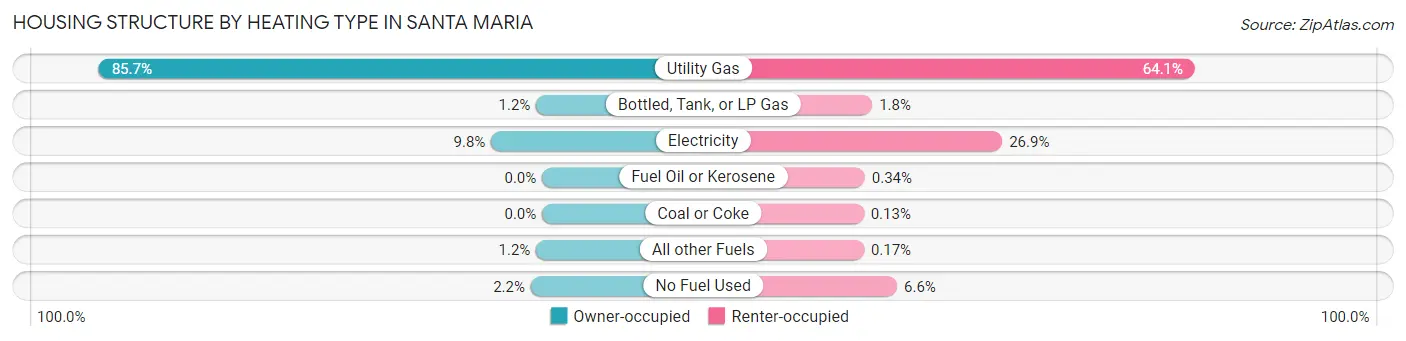
| Heating Type | Owner-occupied | Renter-occupied |
| Utility Gas | 12,602 (85.7%) | 8,993 (64.1%) |
| Bottled, Tank, or LP Gas | 169 (1.1%) | 249 (1.8%) |
| Electricity | 1,448 (9.8%) | 3,774 (26.9%) |
| Fuel Oil or Kerosene | 0 (0.0%) | 47 (0.3%) |
| Coal or Coke | 0 (0.0%) | 18 (0.1%) |
| All other Fuels | 169 (1.1%) | 24 (0.2%) |
| No Fuel Used | 322 (2.2%) | 923 (6.6%) |
| Total | 14,710 (100.0%) | 14,028 (100.0%) |
Household Vehicle Usage in Santa Maria
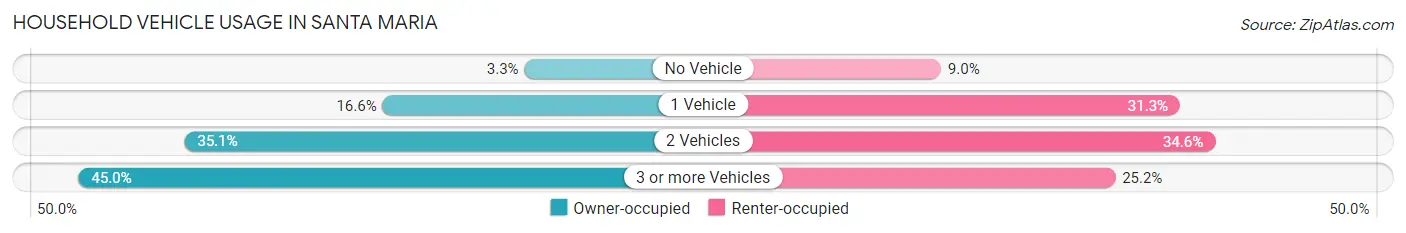
| Vehicles per Household | Owner-occupied | Renter-occupied |
| No Vehicle | 492 (3.3%) | 1,257 (9.0%) |
| 1 Vehicle | 2,440 (16.6%) | 4,386 (31.3%) |
| 2 Vehicles | 5,162 (35.1%) | 4,846 (34.5%) |
| 3 or more Vehicles | 6,616 (45.0%) | 3,539 (25.2%) |
| Total | 14,710 (100.0%) | 14,028 (100.0%) |
Real Estate & Mortgages in Santa Maria
Real Estate and Mortgage Overview in Santa Maria
| Characteristic | Without Mortgage | With Mortgage |
| Housing Units | 4,663 | 10,047 |
| Median Property Value | $410,000 | $447,200 |
| Median Household Income | $69,742 | $2,642 |
| Monthly Housing Costs | $568 | $1,217 |
| Real Estate Taxes | $2,467 | $332 |
Property Value by Mortgage Status in Santa Maria
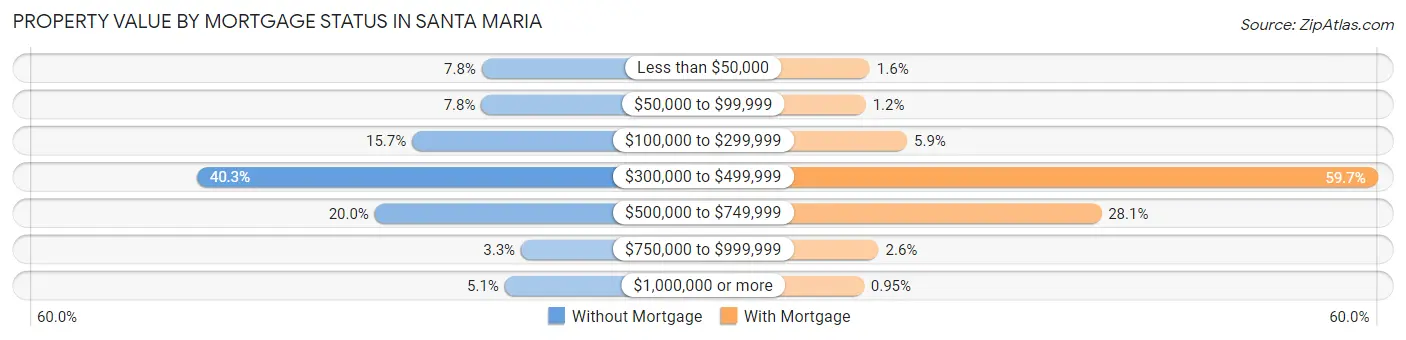
| Property Value | Without Mortgage | With Mortgage |
| Less than $50,000 | 362 (7.8%) | 165 (1.6%) |
| $50,000 to $99,999 | 364 (7.8%) | 117 (1.2%) |
| $100,000 to $299,999 | 733 (15.7%) | 592 (5.9%) |
| $300,000 to $499,999 | 1,880 (40.3%) | 5,993 (59.7%) |
| $500,000 to $749,999 | 932 (20.0%) | 2,821 (28.1%) |
| $750,000 to $999,999 | 153 (3.3%) | 264 (2.6%) |
| $1,000,000 or more | 239 (5.1%) | 95 (0.9%) |
| Total | 4,663 (100.0%) | 10,047 (100.0%) |
Household Income by Mortgage Status in Santa Maria
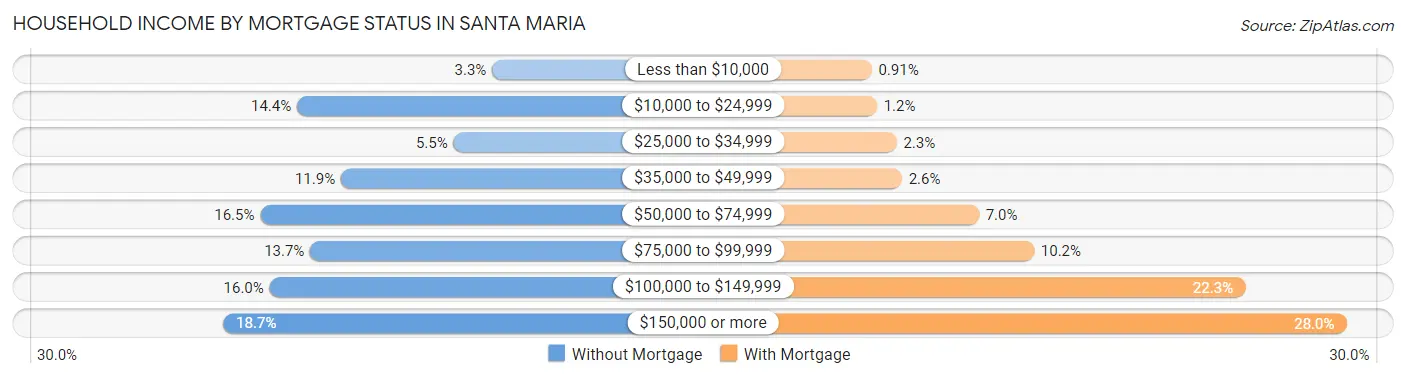
| Household Income | Without Mortgage | With Mortgage |
| Less than $10,000 | 153 (3.3%) | 91 (0.9%) |
| $10,000 to $24,999 | 673 (14.4%) | 122 (1.2%) |
| $25,000 to $34,999 | 256 (5.5%) | 235 (2.3%) |
| $35,000 to $49,999 | 556 (11.9%) | 265 (2.6%) |
| $50,000 to $74,999 | 771 (16.5%) | 707 (7.0%) |
| $75,000 to $99,999 | 638 (13.7%) | 1,024 (10.2%) |
| $100,000 to $149,999 | 746 (16.0%) | 2,235 (22.3%) |
| $150,000 or more | 870 (18.7%) | 2,817 (28.0%) |
| Total | 4,663 (100.0%) | 10,047 (100.0%) |
Property Value to Household Income Ratio in Santa Maria
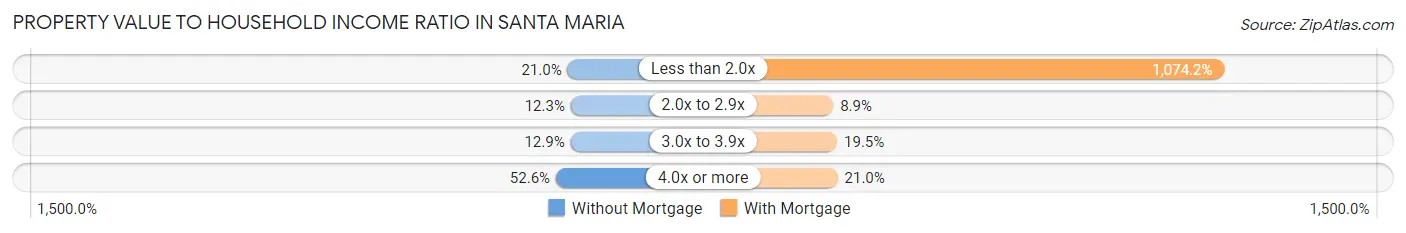
| Value-to-Income Ratio | Without Mortgage | With Mortgage |
| Less than 2.0x | 977 (20.9%) | 107,922 (1,074.2%) |
| 2.0x to 2.9x | 572 (12.3%) | 896 (8.9%) |
| 3.0x to 3.9x | 602 (12.9%) | 1,963 (19.5%) |
| 4.0x or more | 2,452 (52.6%) | 2,105 (20.9%) |
| Total | 4,663 (100.0%) | 10,047 (100.0%) |
Real Estate Taxes by Mortgage Status in Santa Maria
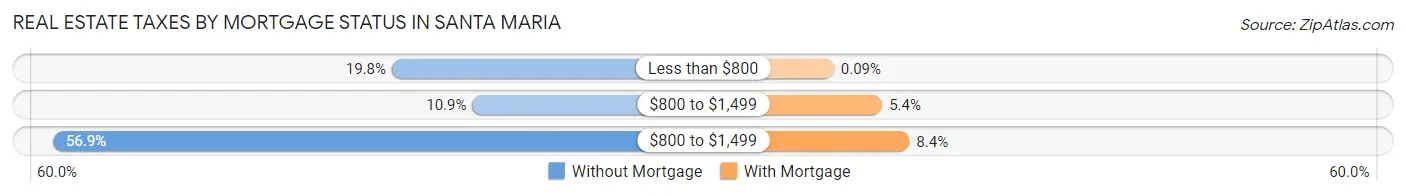
| Property Taxes | Without Mortgage | With Mortgage |
| Less than $800 | 921 (19.8%) | 9 (0.1%) |
| $800 to $1,499 | 510 (10.9%) | 542 (5.4%) |
| $800 to $1,499 | 2,653 (56.9%) | 841 (8.4%) |
| Total | 4,663 (100.0%) | 10,047 (100.0%) |
Health & Disability in Santa Maria
Health Insurance Coverage by Age in Santa Maria
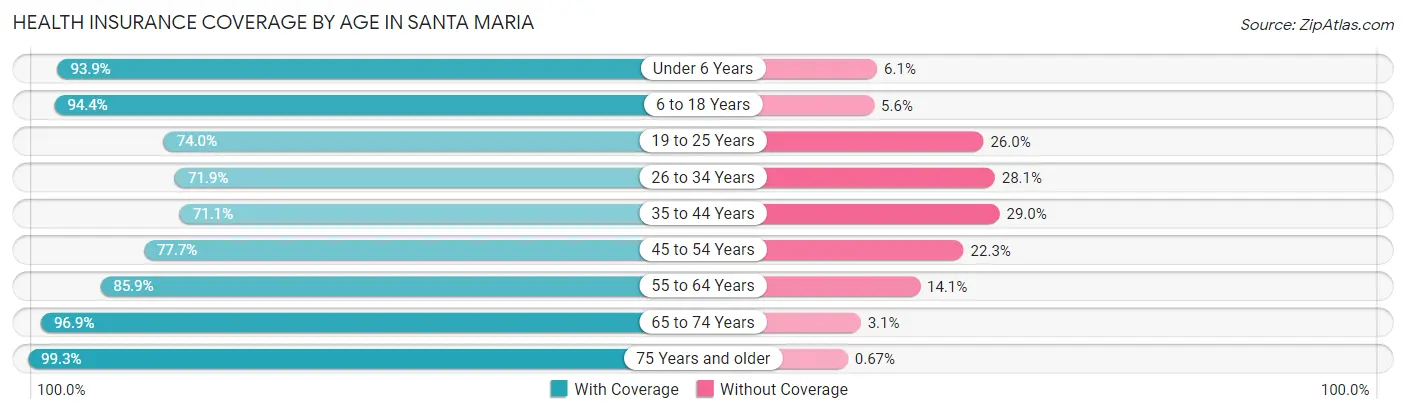
| Age Bracket | With Coverage | Without Coverage |
| Under 6 Years | 11,207 (93.9%) | 732 (6.1%) |
| 6 to 18 Years | 23,141 (94.4%) | 1,364 (5.6%) |
| 19 to 25 Years | 9,521 (74.0%) | 3,339 (26.0%) |
| 26 to 34 Years | 9,983 (71.9%) | 3,893 (28.1%) |
| 35 to 44 Years | 9,584 (71.1%) | 3,906 (28.9%) |
| 45 to 54 Years | 8,897 (77.7%) | 2,548 (22.3%) |
| 55 to 64 Years | 8,012 (85.9%) | 1,317 (14.1%) |
| 65 to 74 Years | 6,150 (96.9%) | 194 (3.1%) |
| 75 Years and older | 5,077 (99.3%) | 34 (0.7%) |
| Total | 91,572 (84.1%) | 17,327 (15.9%) |
Health Insurance Coverage by Citizenship Status in Santa Maria
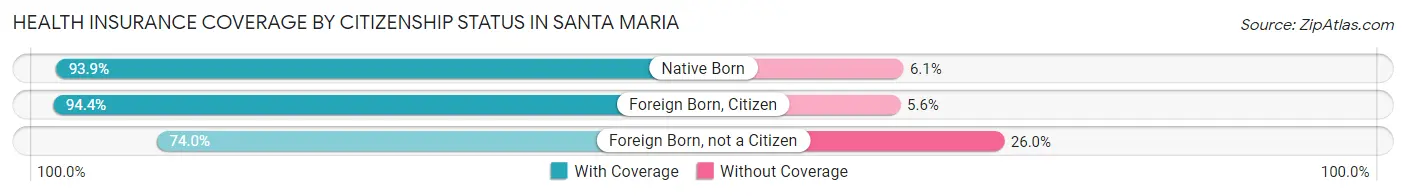
| Citizenship Status | With Coverage | Without Coverage |
| Native Born | 11,207 (93.9%) | 732 (6.1%) |
| Foreign Born, Citizen | 23,141 (94.4%) | 1,364 (5.6%) |
| Foreign Born, not a Citizen | 9,521 (74.0%) | 3,339 (26.0%) |
Health Insurance Coverage by Household Income in Santa Maria
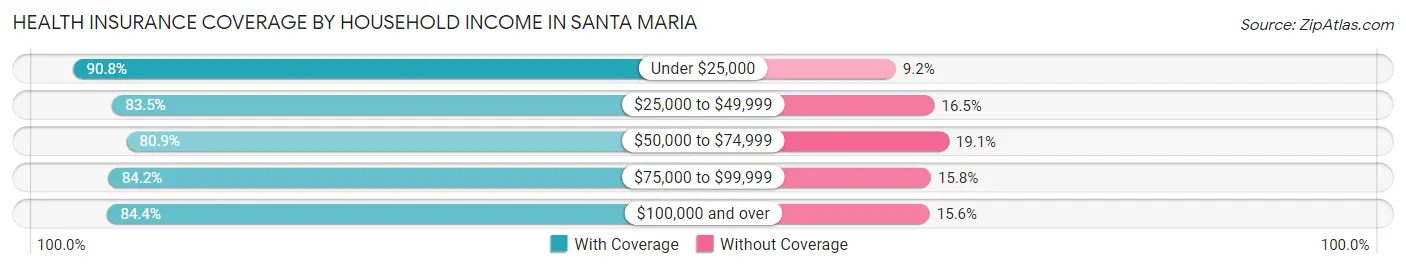
| Household Income | With Coverage | Without Coverage |
| Under $25,000 | 6,257 (90.8%) | 634 (9.2%) |
| $25,000 to $49,999 | 14,863 (83.5%) | 2,928 (16.5%) |
| $50,000 to $74,999 | 14,276 (80.9%) | 3,377 (19.1%) |
| $75,000 to $99,999 | 17,301 (84.2%) | 3,247 (15.8%) |
| $100,000 and over | 37,971 (84.4%) | 6,995 (15.6%) |
Public vs Private Health Insurance Coverage by Age in Santa Maria
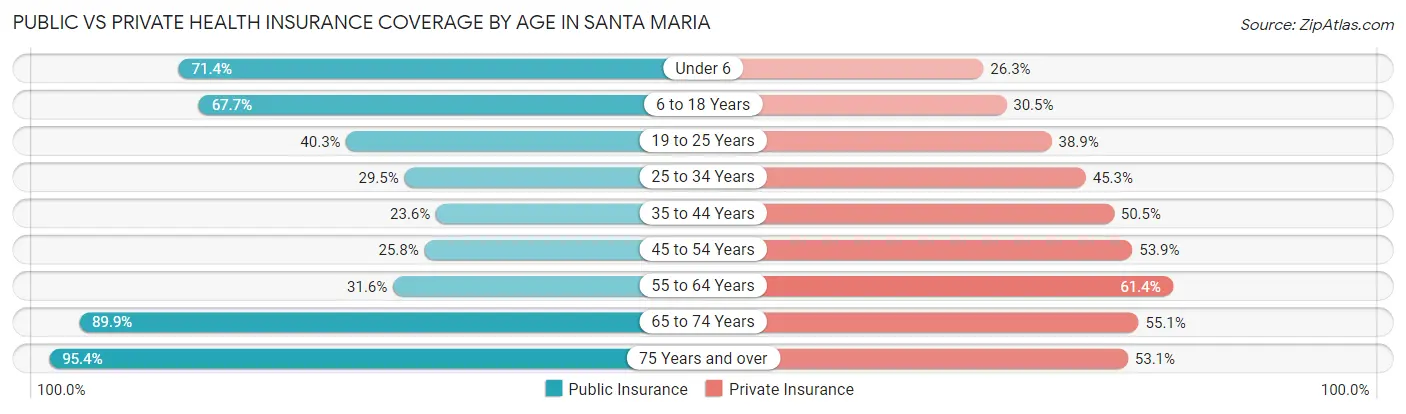
| Age Bracket | Public Insurance | Private Insurance |
| Under 6 | 8,525 (71.4%) | 3,137 (26.3%) |
| 6 to 18 Years | 16,583 (67.7%) | 7,482 (30.5%) |
| 19 to 25 Years | 5,179 (40.3%) | 5,007 (38.9%) |
| 25 to 34 Years | 4,089 (29.5%) | 6,284 (45.3%) |
| 35 to 44 Years | 3,186 (23.6%) | 6,811 (50.5%) |
| 45 to 54 Years | 2,948 (25.8%) | 6,171 (53.9%) |
| 55 to 64 Years | 2,948 (31.6%) | 5,725 (61.4%) |
| 65 to 74 Years | 5,704 (89.9%) | 3,495 (55.1%) |
| 75 Years and over | 4,877 (95.4%) | 2,714 (53.1%) |
| Total | 54,039 (49.6%) | 46,826 (43.0%) |
Disability Status by Sex by Age in Santa Maria
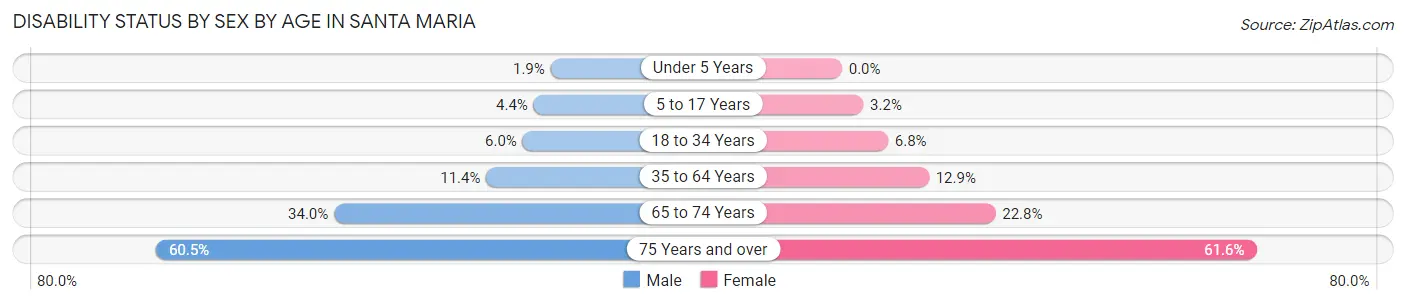
| Age Bracket | Male | Female |
| Under 5 Years | 103 (1.9%) | 0 (0.0%) |
| 5 to 17 Years | 533 (4.4%) | 375 (3.2%) |
| 18 to 34 Years | 891 (6.0%) | 987 (6.8%) |
| 35 to 64 Years | 1,949 (11.4%) | 2,225 (12.9%) |
| 65 to 74 Years | 981 (34.0%) | 789 (22.8%) |
| 75 Years and over | 1,240 (60.5%) | 1,884 (61.6%) |
Disability Class by Sex by Age in Santa Maria
Disability Class: Hearing Difficulty
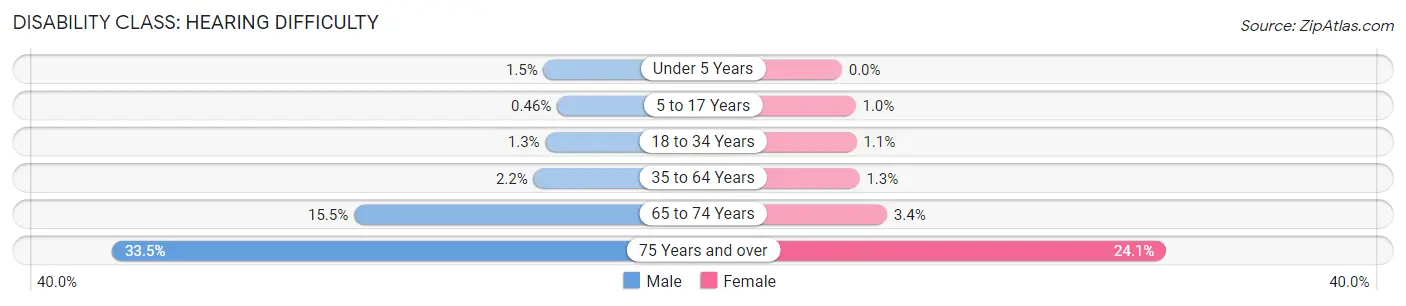
| Age Bracket | Male | Female |
| Under 5 Years | 80 (1.5%) | 0 (0.0%) |
| 5 to 17 Years | 56 (0.5%) | 121 (1.0%) |
| 18 to 34 Years | 197 (1.3%) | 157 (1.1%) |
| 35 to 64 Years | 377 (2.2%) | 225 (1.3%) |
| 65 to 74 Years | 448 (15.5%) | 116 (3.4%) |
| 75 Years and over | 687 (33.5%) | 737 (24.1%) |
Disability Class: Vision Difficulty
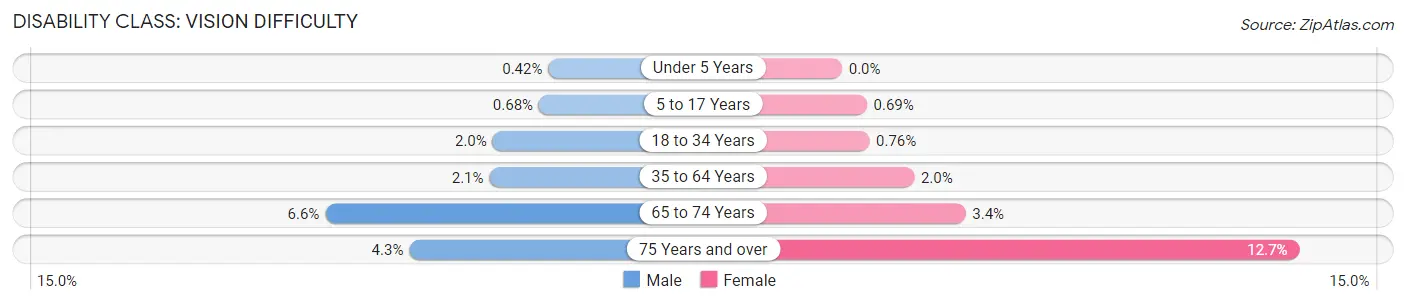
| Age Bracket | Male | Female |
| Under 5 Years | 23 (0.4%) | 0 (0.0%) |
| 5 to 17 Years | 82 (0.7%) | 82 (0.7%) |
| 18 to 34 Years | 290 (2.0%) | 110 (0.8%) |
| 35 to 64 Years | 351 (2.1%) | 347 (2.0%) |
| 65 to 74 Years | 191 (6.6%) | 119 (3.4%) |
| 75 Years and over | 88 (4.3%) | 390 (12.7%) |
Disability Class: Cognitive Difficulty
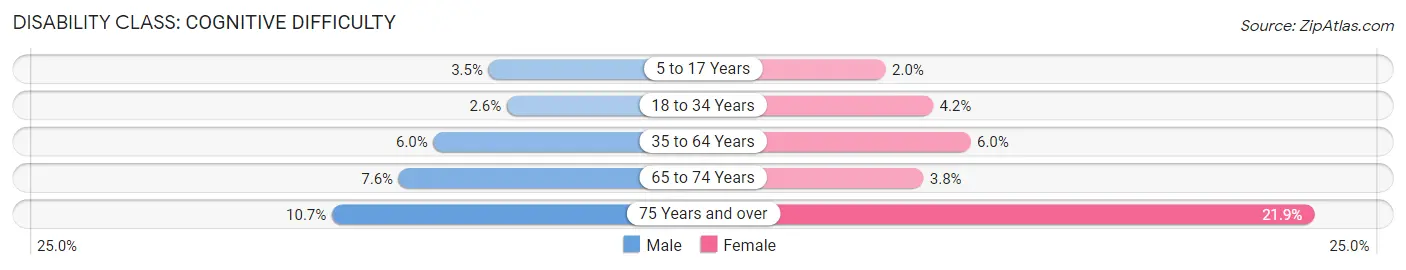
| Age Bracket | Male | Female |
| 5 to 17 Years | 419 (3.5%) | 238 (2.0%) |
| 18 to 34 Years | 385 (2.6%) | 607 (4.2%) |
| 35 to 64 Years | 1,025 (6.0%) | 1,025 (5.9%) |
| 65 to 74 Years | 220 (7.6%) | 130 (3.8%) |
| 75 Years and over | 220 (10.7%) | 671 (21.9%) |
Disability Class: Ambulatory Difficulty
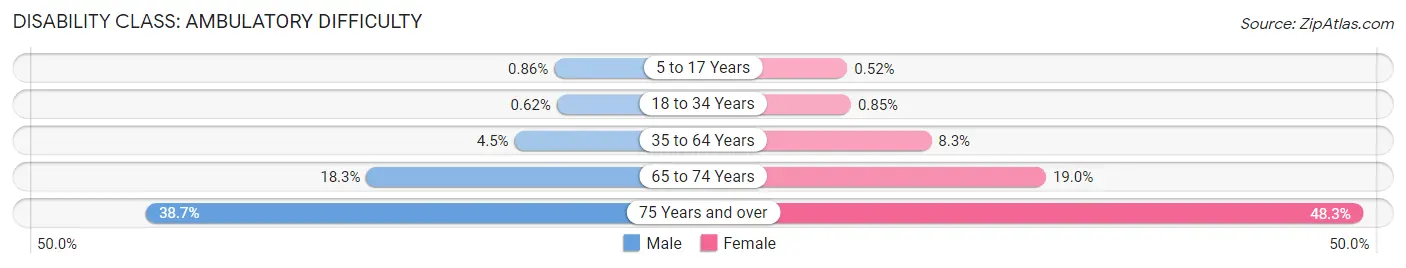
| Age Bracket | Male | Female |
| 5 to 17 Years | 104 (0.9%) | 62 (0.5%) |
| 18 to 34 Years | 91 (0.6%) | 123 (0.9%) |
| 35 to 64 Years | 774 (4.5%) | 1,432 (8.3%) |
| 65 to 74 Years | 527 (18.3%) | 656 (19.0%) |
| 75 Years and over | 794 (38.7%) | 1,479 (48.3%) |
Disability Class: Self-Care Difficulty
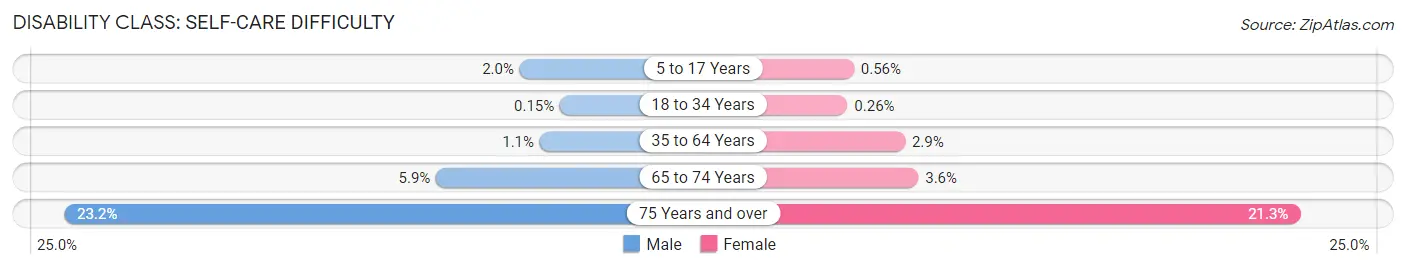
| Age Bracket | Male | Female |
| 5 to 17 Years | 245 (2.0%) | 66 (0.6%) |
| 18 to 34 Years | 22 (0.2%) | 37 (0.3%) |
| 35 to 64 Years | 186 (1.1%) | 505 (2.9%) |
| 65 to 74 Years | 170 (5.9%) | 123 (3.5%) |
| 75 Years and over | 475 (23.2%) | 651 (21.3%) |
Technology Access in Santa Maria
Computing Device Access in Santa Maria
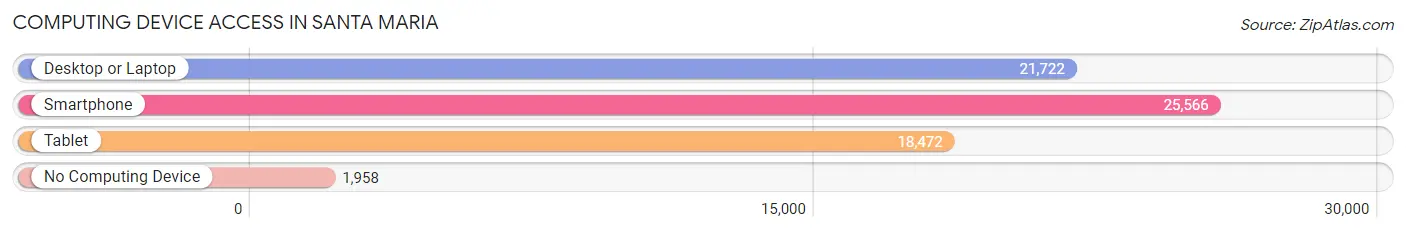
| Device Type | # Households | % Households |
| Desktop or Laptop | 21,722 | 75.6% |
| Smartphone | 25,566 | 89.0% |
| Tablet | 18,472 | 64.3% |
| No Computing Device | 1,958 | 6.8% |
| Total | 28,738 | 100.0% |
Internet Access in Santa Maria
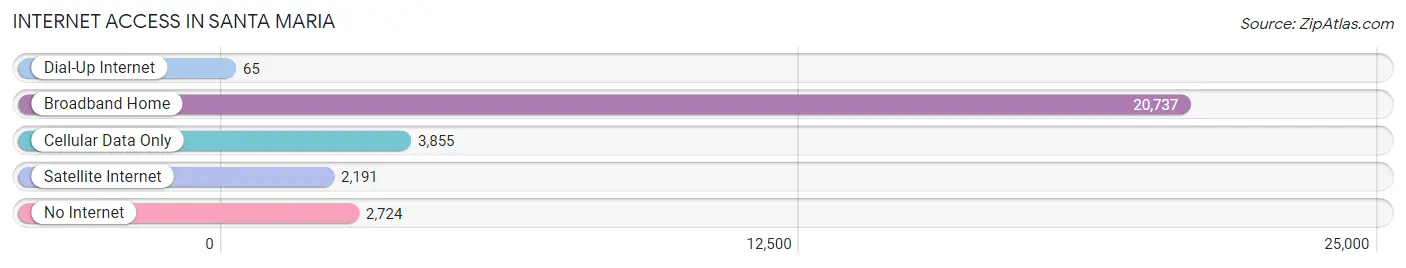
| Internet Type | # Households | % Households |
| Dial-Up Internet | 65 | 0.2% |
| Broadband Home | 20,737 | 72.2% |
| Cellular Data Only | 3,855 | 13.4% |
| Satellite Internet | 2,191 | 7.6% |
| No Internet | 2,724 | 9.5% |
| Total | 28,738 | 100.0% |
Santa Maria Summary
Santa Maria is a city located in the northern part of Santa Barbara County, California. It is the largest city in the county and is located about 120 miles northwest of Los Angeles. The city has a population of approximately 107,000 people and is the largest city in the Santa Maria-Santa Barbara-Lompoc metropolitan area.
History
The area that is now Santa Maria was originally inhabited by the Chumash people, who were hunter-gatherers. The first European to explore the area was Spanish explorer Juan Rodríguez Cabrillo, who sailed up the coast in 1542. The area was later explored by Spanish missionaries, who established the Mission Santa Inés in 1804. The mission was the 19th of the 21 missions established in California.
In 1821, Mexico gained independence from Spain and the area became part of Mexico. In 1848, the area was ceded to the United States as part of the Treaty of Guadalupe Hidalgo. The area was then part of the Rancho San Juan Cajón de Santa Inés, which was granted to John Wilson in 1844. In 1885, the area was incorporated as the City of Santa Maria.
Geography
Santa Maria is located in the northern part of Santa Barbara County, about 120 miles northwest of Los Angeles. The city is situated on the Santa Maria River, which flows through the city. The city is surrounded by the Santa Lucia Mountains to the east and the Santa Ynez Mountains to the west. The city has a total area of about 24 square miles, with about 18 square miles of land and 6 square miles of water.
Climate
Santa Maria has a Mediterranean climate, with mild winters and warm, dry summers. The average high temperature in the summer is around 80°F, while the average low temperature in the winter is around 50°F. The city receives an average of about 15 inches of rain per year.
Economy
Santa Maria has a diverse economy, with a mix of agriculture, manufacturing, and services. The city is home to several large companies, including the Santa Maria Valley Railroad, the Santa Maria Valley Wine Company, and the Santa Maria Valley Cheese Company. The city is also home to several large agricultural companies, including the Santa Maria Valley Fruit Company and the Santa Maria Valley Cattle Company.
The city is also home to several large retail stores, including Walmart, Target, and Home Depot. The city is also home to several large medical centers, including Marian Regional Medical Center and the Santa Maria Valley Medical Center.
Demographics
As of the 2010 census, Santa Maria had a population of 107,000 people. The racial makeup of the city was 68.3% White, 2.2% African American, 0.7% Native American, 1.7% Asian, 0.2% Pacific Islander, 24.2% from other races, and 2.7% from two or more races. Hispanic or Latino of any race were 53.2% of the population.
The median household income in Santa Maria was $50,845, and the median family income was $60,845. The per capita income in the city was $25,845. About 17.2% of the population was below the poverty line.
Common Questions
What is Per Capita Income in Santa Maria?
Per Capita income in Santa Maria is $25,685.
What is the Median Family Income in Santa Maria?
Median Family Income in Santa Maria is $78,567.
What is the Median Household income in Santa Maria?
Median Household Income in Santa Maria is $81,237.
What is Income or Wage Gap in Santa Maria?
Income or Wage Gap in Santa Maria is 23.9%.
Women in Santa Maria earn 76.1 cents for every dollar earned by a man.
What is Family Income Deficit in Santa Maria?
Family Income Deficit in Santa Maria is $12,477.
Families that are below poverty line in Santa Maria earn $12,477 less on average than the poverty threshold level.
What is Inequality or Gini Index in Santa Maria?
Inequality or Gini Index in Santa Maria is 0.40.
What is the Total Population of Santa Maria?
Total Population of Santa Maria is 109,543.
What is the Total Male Population of Santa Maria?
Total Male Population of Santa Maria is 54,654.
What is the Total Female Population of Santa Maria?
Total Female Population of Santa Maria is 54,889.
What is the Ratio of Males per 100 Females in Santa Maria?
There are 99.57 Males per 100 Females in Santa Maria.
What is the Ratio of Females per 100 Males in Santa Maria?
There are 100.43 Females per 100 Males in Santa Maria.
What is the Median Population Age in Santa Maria?
Median Population Age in Santa Maria is 29.3 Years.
What is the Average Family Size in Santa Maria
Average Family Size in Santa Maria is 4.0 People.
What is the Average Household Size in Santa Maria
Average Household Size in Santa Maria is 3.8 People.
How Large is the Labor Force in Santa Maria?
There are 52,485 People in the Labor Forcein in Santa Maria.
What is the Percentage of People in the Labor Force in Santa Maria?
66.1% of People are in the Labor Force in Santa Maria.
What is the Unemployment Rate in Santa Maria?
Unemployment Rate in Santa Maria is 6.3%.