Glendale, AZ Map & Demographics
Glendale Map
Glendale Overview
$30,316
PER CAPITA INCOME
$77,602
AVG FAMILY INCOME
$66,375
AVG HOUSEHOLD INCOME
24.8%
WAGE / INCOME GAP [ % ]
75.2¢/ $1
WAGE / INCOME GAP [ $ ]
$12,025
FAMILY INCOME DEFICIT
0.44
INEQUALITY / GINI INDEX
248,083
TOTAL POPULATION
122,156
MALE POPULATION
125,927
FEMALE POPULATION
97.01
MALES / 100 FEMALES
103.09
FEMALES / 100 MALES
34.1
MEDIAN AGE
3.5
AVG FAMILY SIZE
2.9
AVG HOUSEHOLD SIZE
124,681
LABOR FORCE [ PEOPLE ]
64.7%
PERCENT IN LABOR FORCE
5.7%
UNEMPLOYMENT RATE
Income in Glendale
Income Overview in Glendale
Per Capita Income in Glendale is $30,316, while median incomes of families and households are $77,602 and $66,375 respectively.
| Characteristic | Number | Measure |
| Per Capita Income | 248,083 | $30,316 |
| Median Family Income | 57,023 | $77,602 |
| Mean Family Income | 57,023 | $96,089 |
| Median Household Income | 85,379 | $66,375 |
| Mean Household Income | 85,379 | $85,673 |
| Income Deficit | 57,023 | $12,025 |
| Wage / Income Gap (%) | 248,083 | 24.82% |
| Wage / Income Gap ($) | 248,083 | 75.18¢ per $1 |
| Gini / Inequality Index | 248,083 | 0.44 |
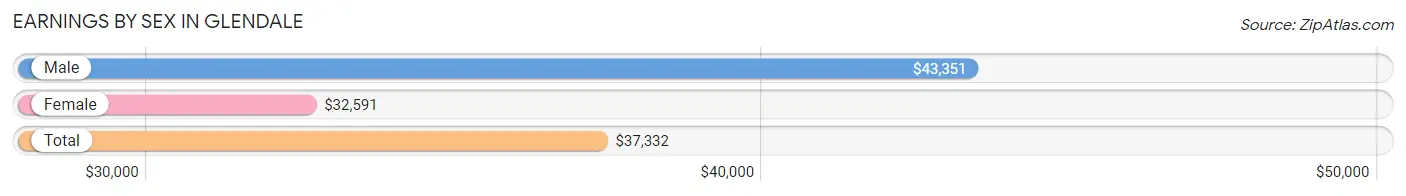
Earnings by Sex in Glendale
Average Earnings in Glendale are $37,332, $43,351 for men and $32,591 for women, a difference of 24.8%.
| Sex | Number | Average Earnings |
| Male | 67,568 (52.9%) | $43,351 |
| Female | 60,184 (47.1%) | $32,591 |
| Total | 127,752 (100.0%) | $37,332 |
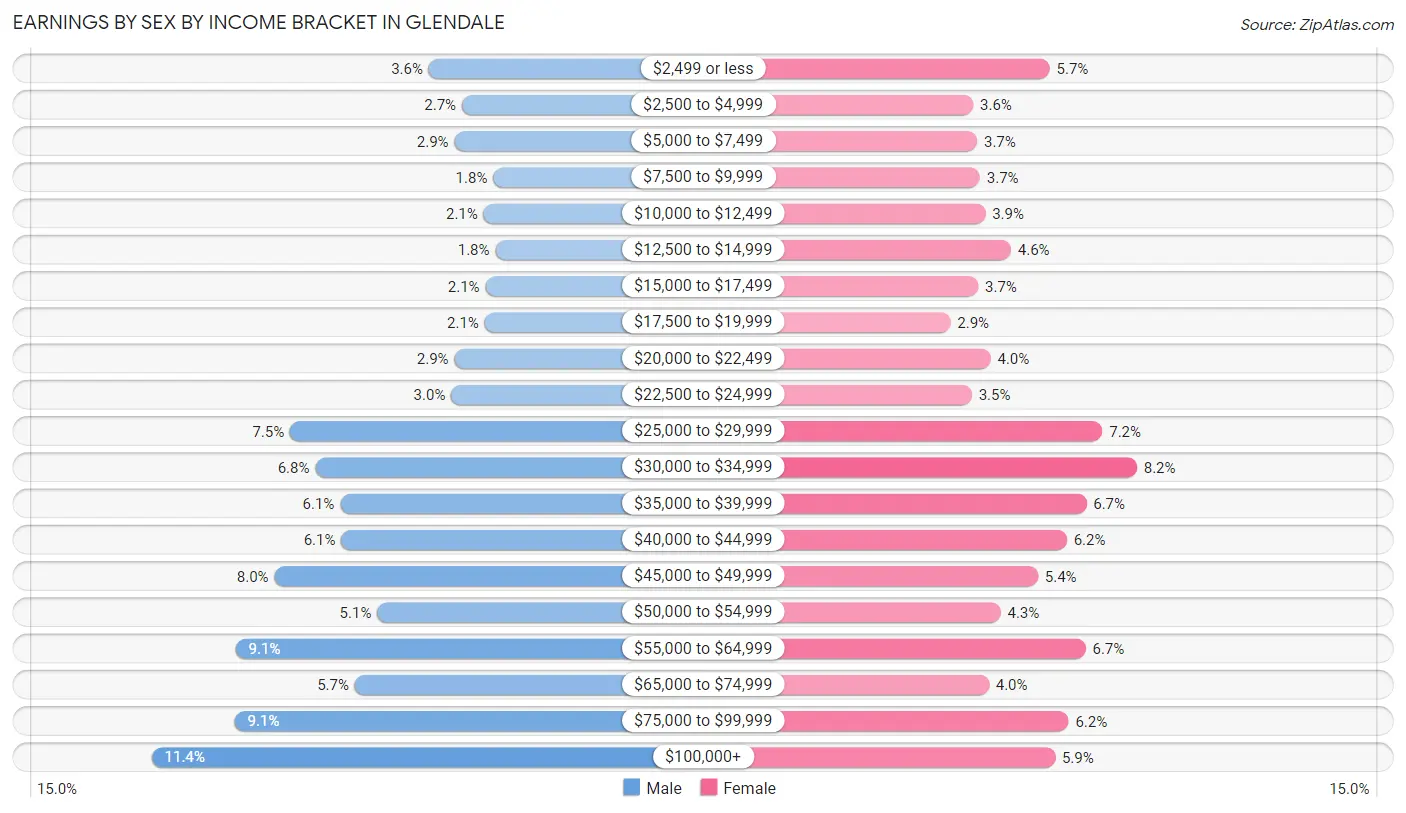
Earnings by Sex by Income Bracket in Glendale
The most common earnings brackets in Glendale are $100,000+ for men (7,723 | 11.4%) and $30,000 to $34,999 for women (4,907 | 8.2%).
| Income | Male | Female |
| $2,499 or less | 2,459 (3.6%) | 3,432 (5.7%) |
| $2,500 to $4,999 | 1,830 (2.7%) | 2,135 (3.5%) |
| $5,000 to $7,499 | 1,974 (2.9%) | 2,203 (3.7%) |
| $7,500 to $9,999 | 1,236 (1.8%) | 2,250 (3.7%) |
| $10,000 to $12,499 | 1,418 (2.1%) | 2,339 (3.9%) |
| $12,500 to $14,999 | 1,195 (1.8%) | 2,772 (4.6%) |
| $15,000 to $17,499 | 1,382 (2.1%) | 2,218 (3.7%) |
| $17,500 to $19,999 | 1,399 (2.1%) | 1,754 (2.9%) |
| $20,000 to $22,499 | 1,970 (2.9%) | 2,432 (4.0%) |
| $22,500 to $24,999 | 2,035 (3.0%) | 2,110 (3.5%) |
| $25,000 to $29,999 | 5,097 (7.5%) | 4,323 (7.2%) |
| $30,000 to $34,999 | 4,615 (6.8%) | 4,907 (8.2%) |
| $35,000 to $39,999 | 4,139 (6.1%) | 4,048 (6.7%) |
| $40,000 to $44,999 | 4,122 (6.1%) | 3,717 (6.2%) |
| $45,000 to $49,999 | 5,391 (8.0%) | 3,231 (5.4%) |
| $50,000 to $54,999 | 3,440 (5.1%) | 2,598 (4.3%) |
| $55,000 to $64,999 | 6,129 (9.1%) | 4,040 (6.7%) |
| $65,000 to $74,999 | 3,867 (5.7%) | 2,402 (4.0%) |
| $75,000 to $99,999 | 6,147 (9.1%) | 3,752 (6.2%) |
| $100,000+ | 7,723 (11.4%) | 3,521 (5.9%) |
| Total | 67,568 (100.0%) | 60,184 (100.0%) |
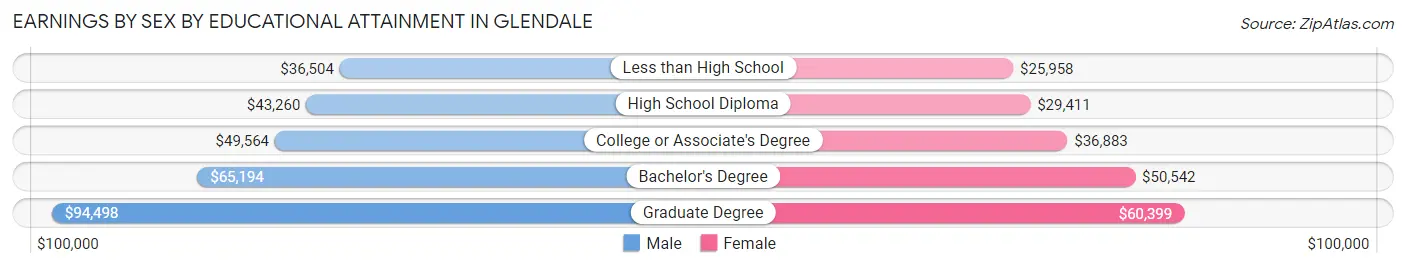
Earnings by Sex by Educational Attainment in Glendale
Average earnings in Glendale are $48,004 for men and $36,670 for women, a difference of 23.6%. Men with an educational attainment of graduate degree enjoy the highest average annual earnings of $94,498, while those with less than high school education earn the least with $36,504. Women with an educational attainment of graduate degree earn the most with the average annual earnings of $60,399, while those with less than high school education have the smallest earnings of $25,958.
| Educational Attainment | Male Income | Female Income |
| Less than High School | $36,504 | $25,958 |
| High School Diploma | $43,260 | $29,411 |
| College or Associate's Degree | $49,564 | $36,883 |
| Bachelor's Degree | $65,194 | $50,542 |
| Graduate Degree | $94,498 | $60,399 |
| Total | $48,004 | $36,670 |
Family Income in Glendale
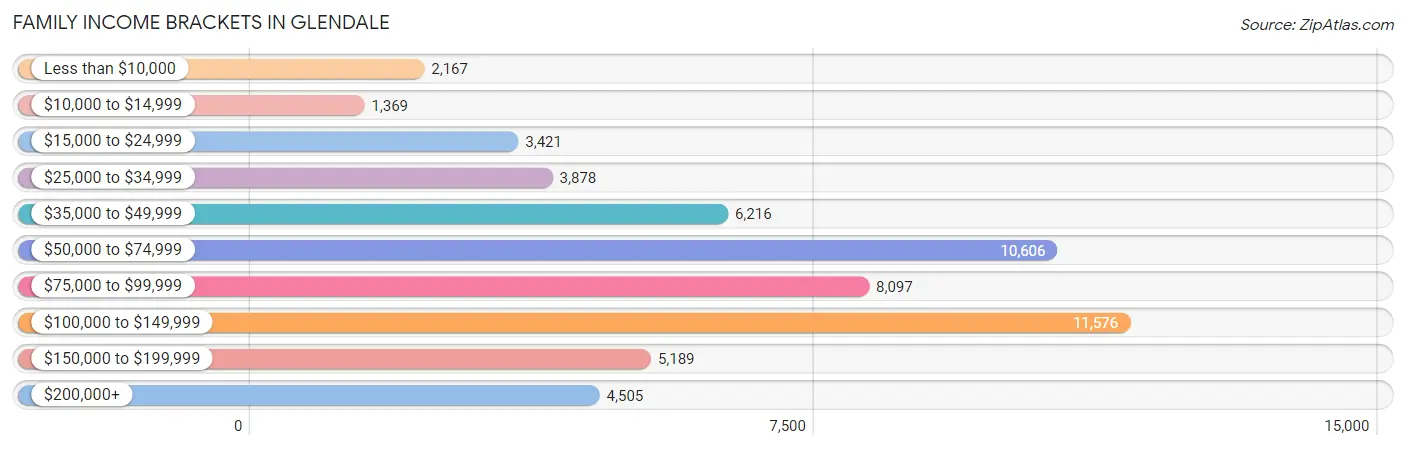
Family Income Brackets in Glendale
According to the Glendale family income data, there are 11,576 families falling into the $100,000 to $149,999 income range, which is the most common income bracket and makes up 20.3% of all families. Conversely, the $10,000 to $14,999 income bracket is the least frequent group with only 1,369 families (2.4%) belonging to this category.
| Income Bracket | # Families | % Families |
| Less than $10,000 | 2,167 | 3.8% |
| $10,000 to $14,999 | 1,369 | 2.4% |
| $15,000 to $24,999 | 3,421 | 6.0% |
| $25,000 to $34,999 | 3,878 | 6.8% |
| $35,000 to $49,999 | 6,216 | 10.9% |
| $50,000 to $74,999 | 10,606 | 18.6% |
| $75,000 to $99,999 | 8,097 | 14.2% |
| $100,000 to $149,999 | 11,576 | 20.3% |
| $150,000 to $199,999 | 5,189 | 9.1% |
| $200,000+ | 4,505 | 7.9% |
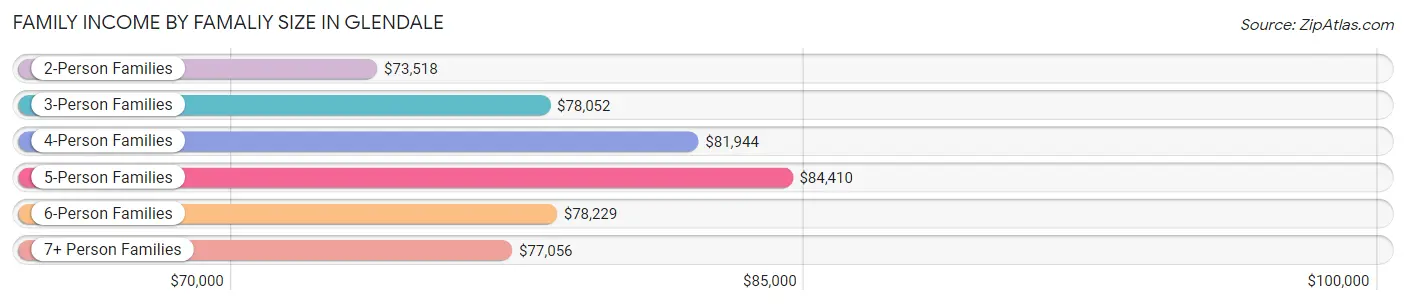
Family Income by Famaliy Size in Glendale
5-person families (5,893 | 10.3%) account for the highest median family income in Glendale with $84,410 per family, while 2-person families (21,097 | 37.0%) have the highest median income of $36,759 per family member.
| Income Bracket | # Families | Median Income |
| 2-Person Families | 21,097 (37.0%) | $73,518 |
| 3-Person Families | 13,288 (23.3%) | $78,052 |
| 4-Person Families | 11,574 (20.3%) | $81,944 |
| 5-Person Families | 5,893 (10.3%) | $84,410 |
| 6-Person Families | 2,748 (4.8%) | $78,229 |
| 7+ Person Families | 2,423 (4.3%) | $77,056 |
| Total | 57,023 (100.0%) | $77,602 |
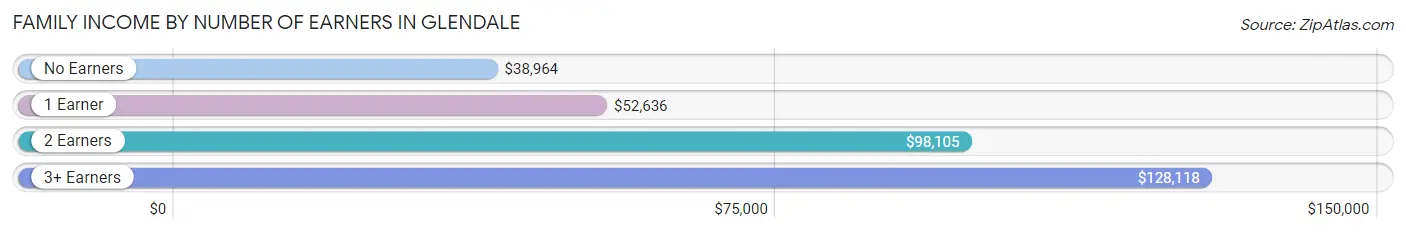
Family Income by Number of Earners in Glendale
The median family income in Glendale is $77,602, with families comprising 3+ earners (8,529) having the highest median family income of $128,118, while families with no earners (6,837) have the lowest median family income of $38,964, accounting for 15.0% and 12.0% of families, respectively.
| Number of Earners | # Families | Median Income |
| No Earners | 6,837 (12.0%) | $38,964 |
| 1 Earner | 19,510 (34.2%) | $52,636 |
| 2 Earners | 22,147 (38.8%) | $98,105 |
| 3+ Earners | 8,529 (15.0%) | $128,118 |
| Total | 57,023 (100.0%) | $77,602 |
Household Income in Glendale
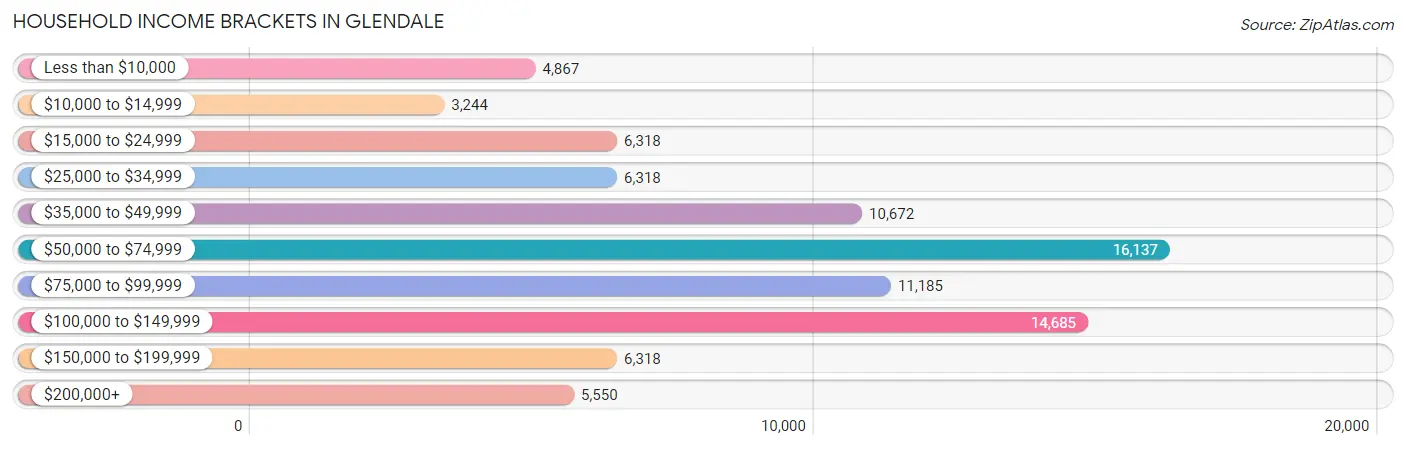
Household Income Brackets in Glendale
With 16,137 households falling in the category, the $50,000 to $74,999 income range is the most frequent in Glendale, accounting for 18.9% of all households. In contrast, only 3,244 households (3.8%) fall into the $10,000 to $14,999 income bracket, making it the least populous group.
| Income Bracket | # Households | % Households |
| Less than $10,000 | 4,867 | 5.7% |
| $10,000 to $14,999 | 3,244 | 3.8% |
| $15,000 to $24,999 | 6,318 | 7.4% |
| $25,000 to $34,999 | 6,318 | 7.4% |
| $35,000 to $49,999 | 10,672 | 12.5% |
| $50,000 to $74,999 | 16,137 | 18.9% |
| $75,000 to $99,999 | 11,185 | 13.1% |
| $100,000 to $149,999 | 14,685 | 17.2% |
| $150,000 to $199,999 | 6,318 | 7.4% |
| $200,000+ | 5,550 | 6.5% |
Household Income by Householder Age in Glendale
The median household income in Glendale is $66,375, with the highest median household income of $83,644 found in the 45 to 64 years age bracket for the primary householder. A total of 32,043 households (37.5%) fall into this category. Meanwhile, the 15 to 24 years age bracket for the primary householder has the lowest median household income of $47,640, with 3,868 households (4.5%) in this group.
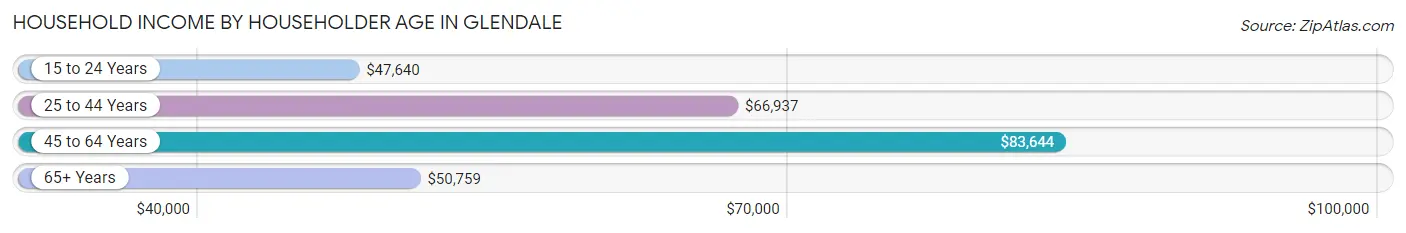
| Income Bracket | # Households | Median Income |
| 15 to 24 Years | 3,868 (4.5%) | $47,640 |
| 25 to 44 Years | 30,952 (36.2%) | $66,937 |
| 45 to 64 Years | 32,043 (37.5%) | $83,644 |
| 65+ Years | 18,516 (21.7%) | $50,759 |
| Total | 85,379 (100.0%) | $66,375 |
Poverty in Glendale
Income Below Poverty by Sex and Age in Glendale
With 15.6% poverty level for males and 18.8% for females among the residents of Glendale, 5 year old males and under 5 year old females are the most vulnerable to poverty, with 478 males (29.7%) and 2,745 females (32.6%) in their respective age groups living below the poverty level.
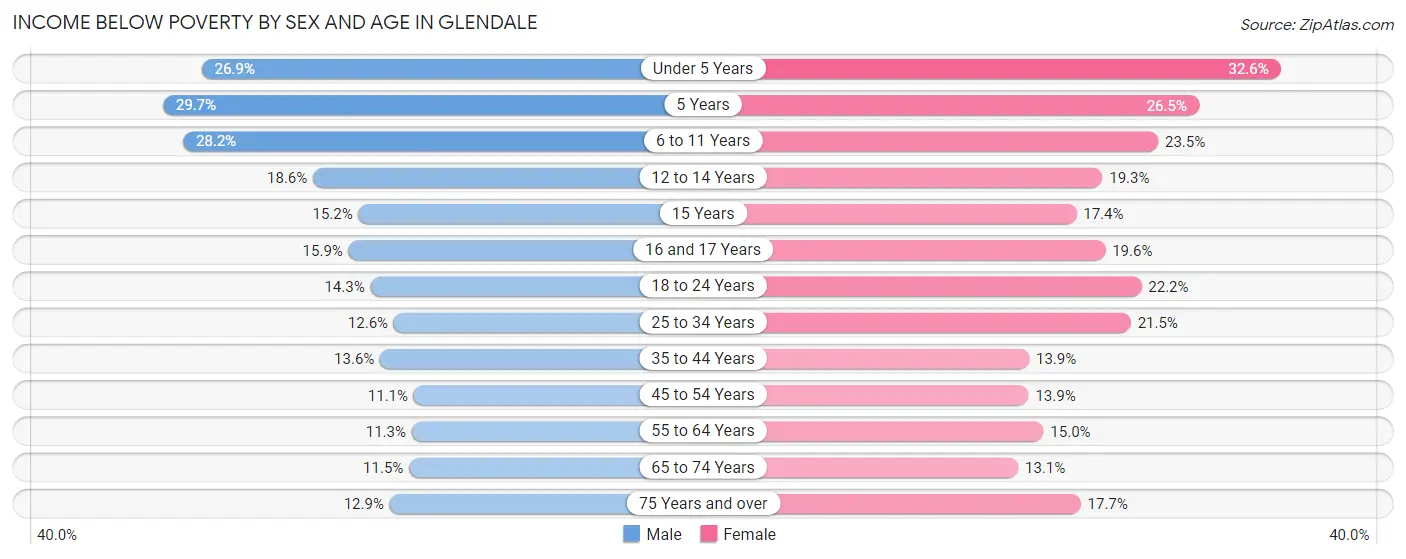
| Age Bracket | Male | Female |
| Under 5 Years | 2,233 (26.9%) | 2,745 (32.6%) |
| 5 Years | 478 (29.7%) | 480 (26.5%) |
| 6 to 11 Years | 3,111 (28.2%) | 2,145 (23.5%) |
| 12 to 14 Years | 974 (18.6%) | 1,021 (19.3%) |
| 15 Years | 284 (15.2%) | 277 (17.4%) |
| 16 and 17 Years | 607 (15.9%) | 678 (19.6%) |
| 18 to 24 Years | 1,706 (14.3%) | 3,007 (22.2%) |
| 25 to 34 Years | 2,397 (12.6%) | 3,839 (21.4%) |
| 35 to 44 Years | 2,105 (13.6%) | 2,115 (13.9%) |
| 45 to 54 Years | 1,663 (11.1%) | 2,215 (13.9%) |
| 55 to 64 Years | 1,508 (11.3%) | 2,107 (15.0%) |
| 65 to 74 Years | 938 (11.5%) | 1,303 (13.1%) |
| 75 Years and over | 623 (12.9%) | 1,398 (17.7%) |
| Total | 18,627 (15.6%) | 23,330 (18.8%) |
Income Above Poverty by Sex and Age in Glendale
According to the poverty statistics in Glendale, males aged 45 to 54 years and females aged 65 to 74 years are the age groups that are most secure financially, with 88.9% of males and 86.9% of females in these age groups living above the poverty line.
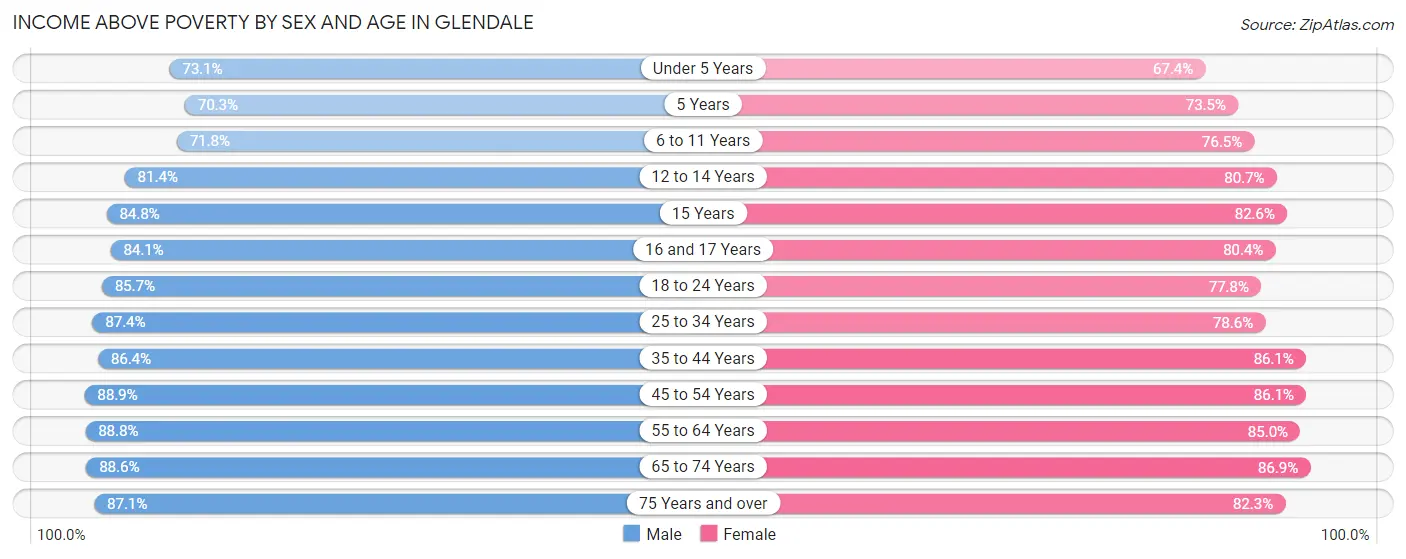
| Age Bracket | Male | Female |
| Under 5 Years | 6,079 (73.1%) | 5,683 (67.4%) |
| 5 Years | 1,129 (70.3%) | 1,331 (73.5%) |
| 6 to 11 Years | 7,904 (71.8%) | 6,989 (76.5%) |
| 12 to 14 Years | 4,269 (81.4%) | 4,258 (80.7%) |
| 15 Years | 1,585 (84.8%) | 1,314 (82.6%) |
| 16 and 17 Years | 3,200 (84.1%) | 2,789 (80.4%) |
| 18 to 24 Years | 10,211 (85.7%) | 10,514 (77.8%) |
| 25 to 34 Years | 16,663 (87.4%) | 14,062 (78.5%) |
| 35 to 44 Years | 13,378 (86.4%) | 13,099 (86.1%) |
| 45 to 54 Years | 13,314 (88.9%) | 13,766 (86.1%) |
| 55 to 64 Years | 11,901 (88.7%) | 11,967 (85.0%) |
| 65 to 74 Years | 7,255 (88.5%) | 8,652 (86.9%) |
| 75 Years and over | 4,212 (87.1%) | 6,489 (82.3%) |
| Total | 101,100 (84.4%) | 100,913 (81.2%) |
Income Below Poverty Among Married-Couple Families in Glendale
The poverty statistics for married-couple families in Glendale show that 8.9% or 3,344 of the total 37,725 families live below the poverty line. Families with 3 or 4 children have the highest poverty rate of 31.7%, comprising of 1,369 families. On the other hand, families with no children have the lowest poverty rate of 4.7%, which includes 930 families.
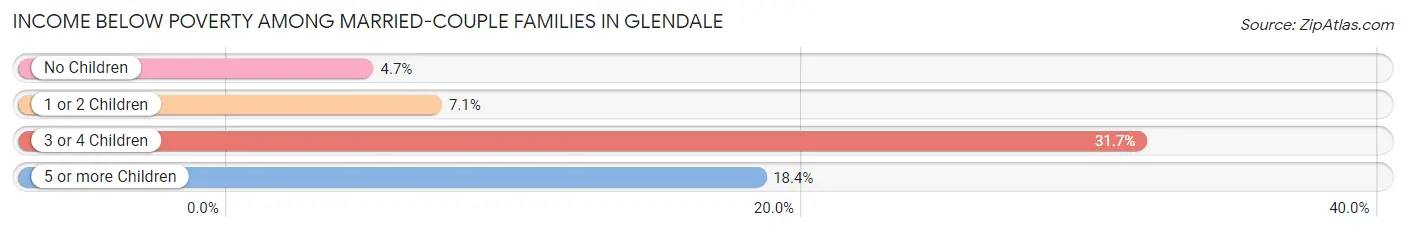
| Children | Above Poverty | Below Poverty |
| No Children | 18,779 (95.3%) | 930 (4.7%) |
| 1 or 2 Children | 12,117 (92.9%) | 926 (7.1%) |
| 3 or 4 Children | 2,957 (68.3%) | 1,369 (31.7%) |
| 5 or more Children | 528 (81.6%) | 119 (18.4%) |
| Total | 34,381 (91.1%) | 3,344 (8.9%) |
Income Below Poverty Among Single-Parent Households in Glendale
According to the poverty data in Glendale, 15.1% or 894 single-father households and 24.6% or 3,287 single-mother households are living below the poverty line. Among single-father households, those with 5 or more children have the highest poverty rate, with 50 households (37.3%) experiencing poverty. Likewise, among single-mother households, those with 5 or more children have the highest poverty rate, with 294 households (67.7%) falling below the poverty line.
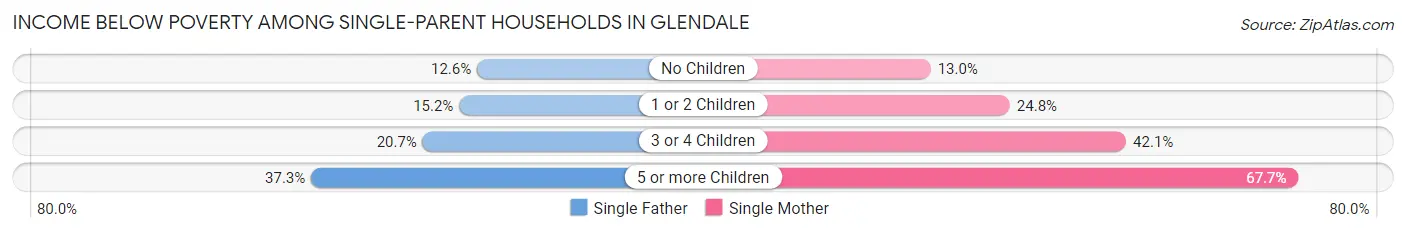
| Children | Single Father | Single Mother |
| No Children | 288 (12.6%) | 579 (13.0%) |
| 1 or 2 Children | 471 (15.2%) | 1,650 (24.8%) |
| 3 or 4 Children | 85 (20.7%) | 764 (42.1%) |
| 5 or more Children | 50 (37.3%) | 294 (67.7%) |
| Total | 894 (15.1%) | 3,287 (24.6%) |
Income Below Poverty Among Married-Couple vs Single-Parent Households in Glendale
The poverty data for Glendale shows that 3,344 of the married-couple family households (8.9%) and 4,181 of the single-parent households (21.7%) are living below the poverty level. Within the married-couple family households, those with 3 or 4 children have the highest poverty rate, with 1,369 households (31.7%) falling below the poverty line. Among the single-parent households, those with 5 or more children have the highest poverty rate, with 344 household (60.6%) living below poverty.
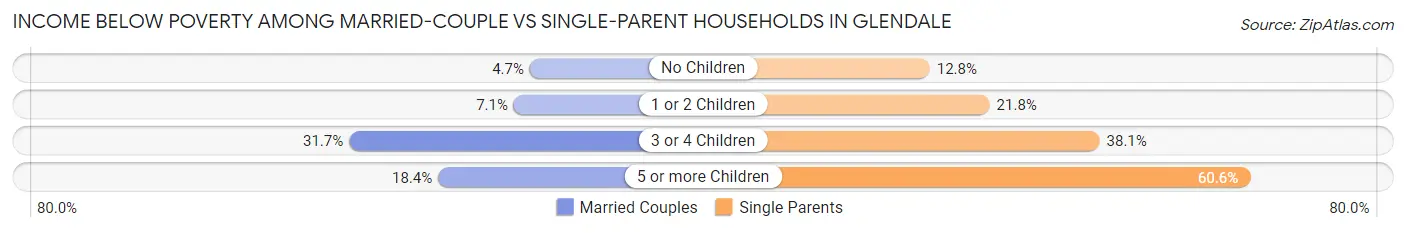
| Children | Married-Couple Families | Single-Parent Households |
| No Children | 930 (4.7%) | 867 (12.8%) |
| 1 or 2 Children | 926 (7.1%) | 2,121 (21.7%) |
| 3 or 4 Children | 1,369 (31.7%) | 849 (38.1%) |
| 5 or more Children | 119 (18.4%) | 344 (60.6%) |
| Total | 3,344 (8.9%) | 4,181 (21.7%) |
Race in Glendale
The most populous races in Glendale are White / Caucasian (145,249 | 58.6%), Hispanic or Latino (100,191 | 40.4%), and Two or more Races (47,888 | 19.3%).
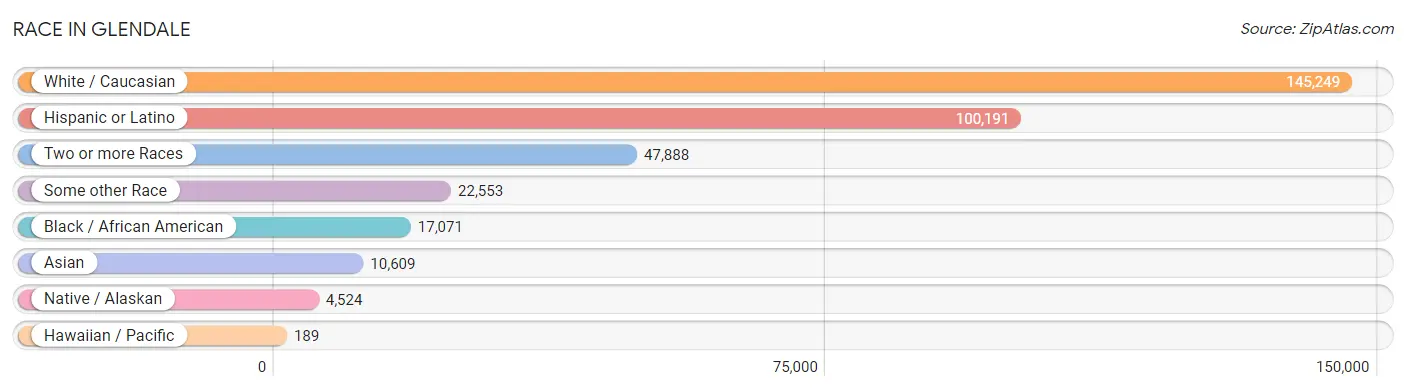
| Race | # Population | % Population |
| Asian | 10,609 | 4.3% |
| Black / African American | 17,071 | 6.9% |
| Hawaiian / Pacific | 189 | 0.1% |
| Hispanic or Latino | 100,191 | 40.4% |
| Native / Alaskan | 4,524 | 1.8% |
| White / Caucasian | 145,249 | 58.6% |
| Two or more Races | 47,888 | 19.3% |
| Some other Race | 22,553 | 9.1% |
| Total | 248,083 | 100.0% |
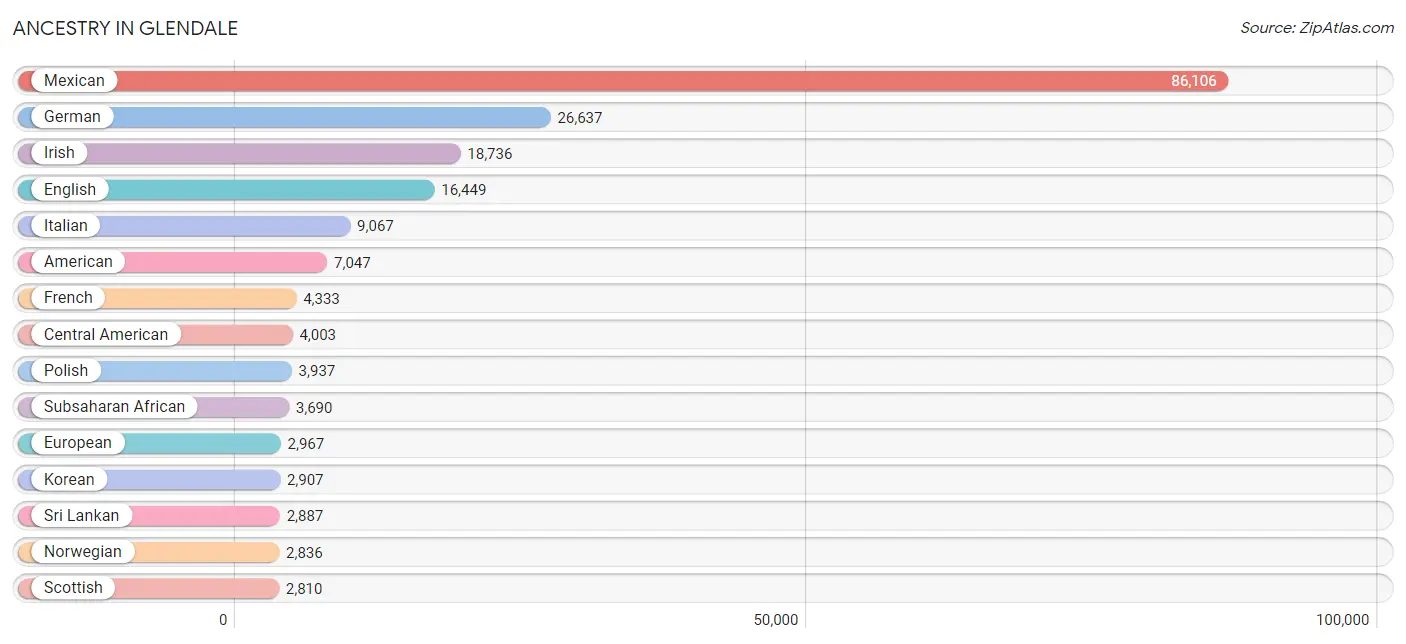
Ancestry in Glendale
The most populous ancestries reported in Glendale are Mexican (86,106 | 34.7%), German (26,637 | 10.7%), Irish (18,736 | 7.5%), English (16,449 | 6.6%), and Italian (9,067 | 3.6%), together accounting for 63.3% of all Glendale residents.
| Ancestry | # Population | % Population |
| Afghan | 266 | 0.1% |
| African | 2,803 | 1.1% |
| Alaska Native | 32 | 0.0% |
| Albanian | 20 | 0.0% |
| American | 7,047 | 2.8% |
| Apache | 233 | 0.1% |
| Arab | 2,472 | 1.0% |
| Argentinean | 60 | 0.0% |
| Armenian | 36 | 0.0% |
| Assyrian / Chaldean / Syriac | 809 | 0.3% |
| Australian | 47 | 0.0% |
| Austrian | 139 | 0.1% |
| Bahamian | 55 | 0.0% |
| Basque | 22 | 0.0% |
| Belgian | 218 | 0.1% |
| Bhutanese | 822 | 0.3% |
| Blackfeet | 1,180 | 0.5% |
| Brazilian | 131 | 0.1% |
| British | 949 | 0.4% |
| Bulgarian | 39 | 0.0% |
| Burmese | 585 | 0.2% |
| Canadian | 747 | 0.3% |
| Celtic | 10 | 0.0% |
| Central American | 4,003 | 1.6% |
| Central American Indian | 464 | 0.2% |
| Cherokee | 1,009 | 0.4% |
| Chickasaw | 4 | 0.0% |
| Chilean | 605 | 0.2% |
| Chippewa | 155 | 0.1% |
| Choctaw | 35 | 0.0% |
| Colombian | 292 | 0.1% |
| Costa Rican | 61 | 0.0% |
| Creek | 66 | 0.0% |
| Croatian | 265 | 0.1% |
| Cuban | 2,272 | 0.9% |
| Czech | 551 | 0.2% |
| Czechoslovakian | 43 | 0.0% |
| Danish | 740 | 0.3% |
| Dominican | 252 | 0.1% |
| Dutch | 2,092 | 0.8% |
| Eastern European | 178 | 0.1% |
| Ecuadorian | 173 | 0.1% |
| Egyptian | 30 | 0.0% |
| English | 16,449 | 6.6% |
| Ethiopian | 69 | 0.0% |
| European | 2,967 | 1.2% |
| Fijian | 6 | 0.0% |
| Finnish | 244 | 0.1% |
| French | 4,333 | 1.8% |
| French Canadian | 661 | 0.3% |
| German | 26,637 | 10.7% |
| Greek | 536 | 0.2% |
| Guamanian / Chamorro | 65 | 0.0% |
| Guatemalan | 506 | 0.2% |
| Honduran | 976 | 0.4% |
| Hopi | 172 | 0.1% |
| Hungarian | 737 | 0.3% |
| Icelander | 128 | 0.1% |
| Indian (Asian) | 2,319 | 0.9% |
| Indonesian | 554 | 0.2% |
| Inupiat | 134 | 0.1% |
| Iranian | 275 | 0.1% |
| Iraqi | 996 | 0.4% |
| Irish | 18,736 | 7.5% |
| Israeli | 75 | 0.0% |
| Italian | 9,067 | 3.6% |
| Jamaican | 435 | 0.2% |
| Japanese | 456 | 0.2% |
| Jordanian | 98 | 0.0% |
| Kenyan | 93 | 0.0% |
| Kiowa | 36 | 0.0% |
| Korean | 2,907 | 1.2% |
| Laotian | 79 | 0.0% |
| Latvian | 6 | 0.0% |
| Lebanese | 268 | 0.1% |
| Liberian | 43 | 0.0% |
| Lithuanian | 246 | 0.1% |
| Lumbee | 60 | 0.0% |
| Luxembourger | 31 | 0.0% |
| Macedonian | 77 | 0.0% |
| Malaysian | 127 | 0.1% |
| Maltese | 40 | 0.0% |
| Mexican | 86,106 | 34.7% |
| Mexican American Indian | 441 | 0.2% |
| Moroccan | 190 | 0.1% |
| Native Hawaiian | 330 | 0.1% |
| Navajo | 2,134 | 0.9% |
| Nicaraguan | 268 | 0.1% |
| Nigerian | 310 | 0.1% |
| Northern European | 210 | 0.1% |
| Norwegian | 2,836 | 1.1% |
| Okinawan | 5 | 0.0% |
| Ottawa | 21 | 0.0% |
| Paiute | 12 | 0.0% |
| Pakistani | 292 | 0.1% |
| Palestinian | 46 | 0.0% |
| Panamanian | 196 | 0.1% |
| Pennsylvania German | 72 | 0.0% |
| Peruvian | 98 | 0.0% |
| Pima | 153 | 0.1% |
| Polish | 3,937 | 1.6% |
| Portuguese | 542 | 0.2% |
| Potawatomi | 10 | 0.0% |
| Pueblo | 210 | 0.1% |
| Puerto Rican | 1,607 | 0.6% |
| Romanian | 1,234 | 0.5% |
| Russian | 796 | 0.3% |
| Salvadoran | 1,960 | 0.8% |
| Samoan | 119 | 0.1% |
| Scandinavian | 588 | 0.2% |
| Scotch-Irish | 1,220 | 0.5% |
| Scottish | 2,810 | 1.1% |
| Seminole | 6 | 0.0% |
| Serbian | 730 | 0.3% |
| Sioux | 169 | 0.1% |
| Slavic | 98 | 0.0% |
| Slovak | 219 | 0.1% |
| Slovene | 63 | 0.0% |
| Somali | 12 | 0.0% |
| South African | 18 | 0.0% |
| South American | 1,440 | 0.6% |
| Spaniard | 560 | 0.2% |
| Spanish | 598 | 0.2% |
| Spanish American | 17 | 0.0% |
| Sri Lankan | 2,887 | 1.2% |
| Subsaharan African | 3,690 | 1.5% |
| Sudanese | 217 | 0.1% |
| Swedish | 2,070 | 0.8% |
| Swiss | 408 | 0.2% |
| Syrian | 145 | 0.1% |
| Thai | 1,621 | 0.6% |
| Tohono O'Odham | 119 | 0.1% |
| Tongan | 13 | 0.0% |
| Trinidadian and Tobagonian | 36 | 0.0% |
| Turkish | 102 | 0.0% |
| U.S. Virgin Islander | 13 | 0.0% |
| Ukrainian | 403 | 0.2% |
| Venezuelan | 212 | 0.1% |
| Vietnamese | 211 | 0.1% |
| Welsh | 1,015 | 0.4% |
| West Indian | 161 | 0.1% |
| Yaqui | 966 | 0.4% |
| Yugoslavian | 232 | 0.1% |
| Yup'ik | 8 | 0.0% | View All 144 Rows |
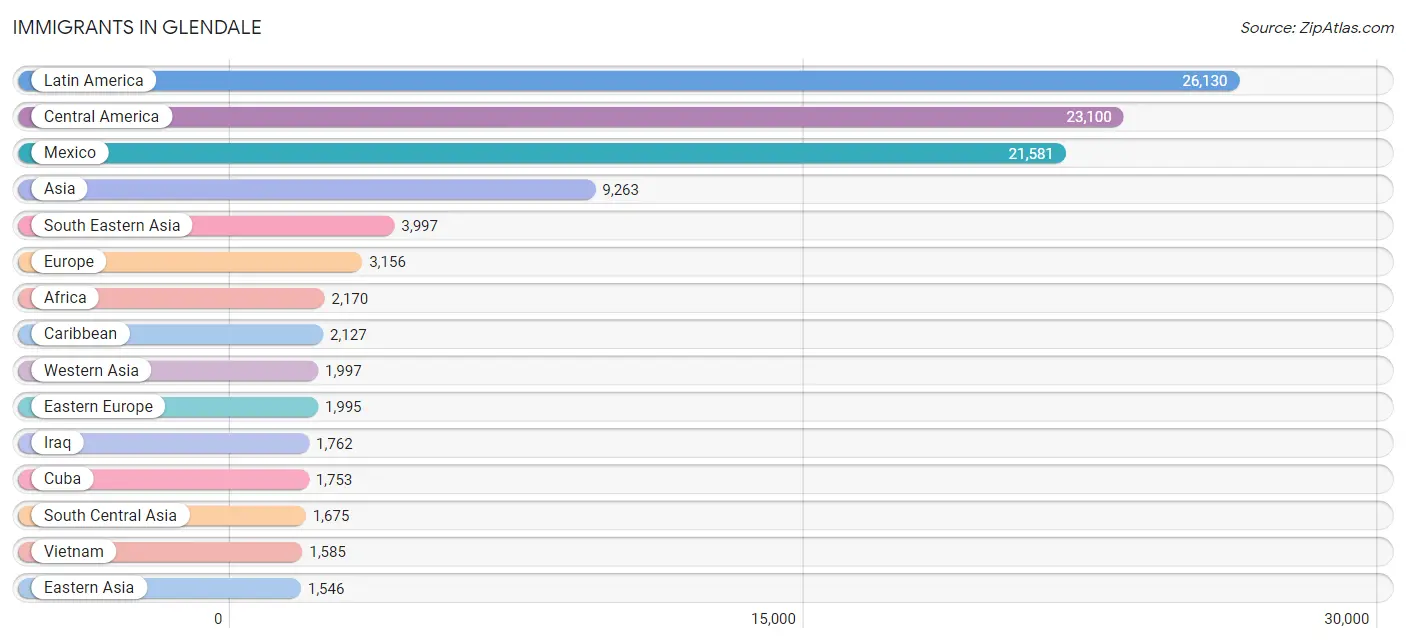
Immigrants in Glendale
The most numerous immigrant groups reported in Glendale came from Latin America (26,130 | 10.5%), Central America (23,100 | 9.3%), Mexico (21,581 | 8.7%), Asia (9,263 | 3.7%), and South Eastern Asia (3,997 | 1.6%), together accounting for 33.9% of all Glendale residents.
| Immigration Origin | # Population | % Population |
| Afghanistan | 301 | 0.1% |
| Africa | 2,170 | 0.9% |
| Albania | 9 | 0.0% |
| Argentina | 99 | 0.0% |
| Asia | 9,263 | 3.7% |
| Australia | 11 | 0.0% |
| Bangladesh | 194 | 0.1% |
| Barbados | 36 | 0.0% |
| Belarus | 24 | 0.0% |
| Belgium | 10 | 0.0% |
| Bosnia and Herzegovina | 293 | 0.1% |
| Brazil | 115 | 0.1% |
| Bulgaria | 39 | 0.0% |
| Cambodia | 178 | 0.1% |
| Cameroon | 20 | 0.0% |
| Canada | 803 | 0.3% |
| Caribbean | 2,127 | 0.9% |
| Central America | 23,100 | 9.3% |
| Chile | 201 | 0.1% |
| China | 1,183 | 0.5% |
| Colombia | 205 | 0.1% |
| Congo | 214 | 0.1% |
| Costa Rica | 4 | 0.0% |
| Croatia | 110 | 0.0% |
| Cuba | 1,753 | 0.7% |
| Denmark | 9 | 0.0% |
| Dominican Republic | 82 | 0.0% |
| Eastern Africa | 535 | 0.2% |
| Eastern Asia | 1,546 | 0.6% |
| Eastern Europe | 1,995 | 0.8% |
| Ecuador | 28 | 0.0% |
| Egypt | 19 | 0.0% |
| El Salvador | 608 | 0.3% |
| England | 417 | 0.2% |
| Eritrea | 39 | 0.0% |
| Ethiopia | 97 | 0.0% |
| Europe | 3,156 | 1.3% |
| Fiji | 5 | 0.0% |
| France | 83 | 0.0% |
| Germany | 214 | 0.1% |
| Guatemala | 364 | 0.2% |
| Guyana | 20 | 0.0% |
| Honduras | 332 | 0.1% |
| Hong Kong | 122 | 0.1% |
| Hungary | 45 | 0.0% |
| India | 703 | 0.3% |
| Indonesia | 42 | 0.0% |
| Iran | 119 | 0.1% |
| Iraq | 1,762 | 0.7% |
| Ireland | 35 | 0.0% |
| Israel | 75 | 0.0% |
| Italy | 110 | 0.0% |
| Jamaica | 200 | 0.1% |
| Japan | 135 | 0.1% |
| Jordan | 35 | 0.0% |
| Kazakhstan | 7 | 0.0% |
| Kenya | 62 | 0.0% |
| Korea | 228 | 0.1% |
| Kuwait | 42 | 0.0% |
| Laos | 99 | 0.0% |
| Latin America | 26,130 | 10.5% |
| Lebanon | 39 | 0.0% |
| Liberia | 69 | 0.0% |
| Mexico | 21,581 | 8.7% |
| Middle Africa | 280 | 0.1% |
| Moldova | 61 | 0.0% |
| Morocco | 96 | 0.0% |
| Nepal | 133 | 0.1% |
| Netherlands | 82 | 0.0% |
| Nicaragua | 174 | 0.1% |
| Nigeria | 131 | 0.1% |
| Northern Africa | 195 | 0.1% |
| Northern Europe | 558 | 0.2% |
| Oceania | 59 | 0.0% |
| Panama | 28 | 0.0% |
| Peru | 68 | 0.0% |
| Philippines | 1,493 | 0.6% |
| Poland | 90 | 0.0% |
| Portugal | 81 | 0.0% |
| Romania | 958 | 0.4% |
| Russia | 79 | 0.0% |
| Scotland | 5 | 0.0% |
| Serbia | 184 | 0.1% |
| Sierra Leone | 132 | 0.1% |
| Singapore | 23 | 0.0% |
| Somalia | 24 | 0.0% |
| South Africa | 117 | 0.1% |
| South America | 903 | 0.4% |
| South Central Asia | 1,675 | 0.7% |
| South Eastern Asia | 3,997 | 1.6% |
| Southern Europe | 214 | 0.1% |
| Sudan | 54 | 0.0% |
| Syria | 35 | 0.0% |
| Taiwan | 80 | 0.0% |
| Thailand | 245 | 0.1% |
| Trinidad and Tobago | 56 | 0.0% |
| Uganda | 11 | 0.0% |
| Ukraine | 87 | 0.0% |
| Uzbekistan | 120 | 0.1% |
| Venezuela | 167 | 0.1% |
| Vietnam | 1,585 | 0.6% |
| Western Africa | 396 | 0.2% |
| Western Asia | 1,997 | 0.8% |
| Western Europe | 389 | 0.2% |
| Yemen | 9 | 0.0% |
| Zaire | 46 | 0.0% | View All 106 Rows |
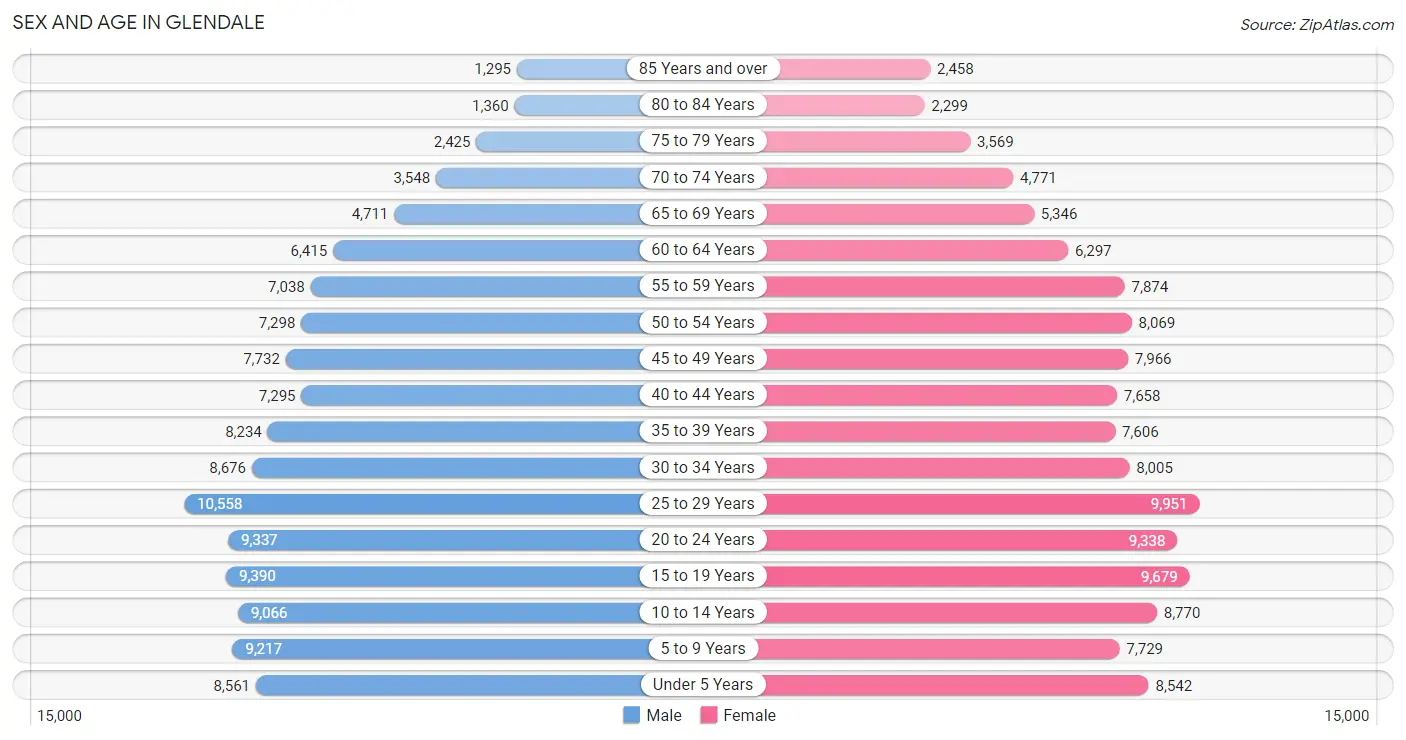
Sex and Age in Glendale
Sex and Age in Glendale
The most populous age groups in Glendale are 25 to 29 Years (10,558 | 8.6%) for men and 25 to 29 Years (9,951 | 7.9%) for women.
| Age Bracket | Male | Female |
| Under 5 Years | 8,561 (7.0%) | 8,542 (6.8%) |
| 5 to 9 Years | 9,217 (7.5%) | 7,729 (6.1%) |
| 10 to 14 Years | 9,066 (7.4%) | 8,770 (7.0%) |
| 15 to 19 Years | 9,390 (7.7%) | 9,679 (7.7%) |
| 20 to 24 Years | 9,337 (7.6%) | 9,338 (7.4%) |
| 25 to 29 Years | 10,558 (8.6%) | 9,951 (7.9%) |
| 30 to 34 Years | 8,676 (7.1%) | 8,005 (6.4%) |
| 35 to 39 Years | 8,234 (6.7%) | 7,606 (6.0%) |
| 40 to 44 Years | 7,295 (6.0%) | 7,658 (6.1%) |
| 45 to 49 Years | 7,732 (6.3%) | 7,966 (6.3%) |
| 50 to 54 Years | 7,298 (6.0%) | 8,069 (6.4%) |
| 55 to 59 Years | 7,038 (5.8%) | 7,874 (6.2%) |
| 60 to 64 Years | 6,415 (5.2%) | 6,297 (5.0%) |
| 65 to 69 Years | 4,711 (3.9%) | 5,346 (4.3%) |
| 70 to 74 Years | 3,548 (2.9%) | 4,771 (3.8%) |
| 75 to 79 Years | 2,425 (2.0%) | 3,569 (2.8%) |
| 80 to 84 Years | 1,360 (1.1%) | 2,299 (1.8%) |
| 85 Years and over | 1,295 (1.1%) | 2,458 (1.9%) |
| Total | 122,156 (100.0%) | 125,927 (100.0%) |
Families and Households in Glendale
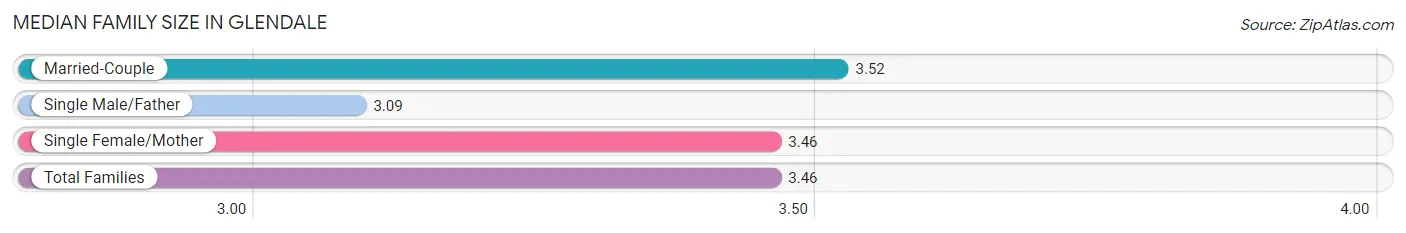
Median Family Size in Glendale
The median family size in Glendale is 3.46 persons per family, with married-couple families (37,725 | 66.2%) accounting for the largest median family size of 3.52 persons per family. On the other hand, single male/father families (5,926 | 10.4%) represent the smallest median family size with 3.09 persons per family.
| Family Type | # Families | Family Size |
| Married-Couple | 37,725 (66.2%) | 3.52 |
| Single Male/Father | 5,926 (10.4%) | 3.09 |
| Single Female/Mother | 13,372 (23.4%) | 3.46 |
| Total Families | 57,023 (100.0%) | 3.46 |
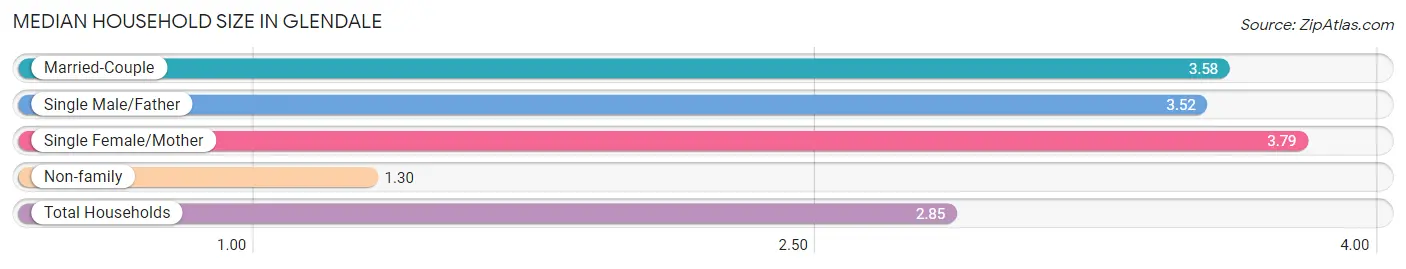
Median Household Size in Glendale
The median household size in Glendale is 2.85 persons per household, with single female/mother households (13,372 | 15.7%) accounting for the largest median household size of 3.79 persons per household. non-family households (28,356 | 33.2%) represent the smallest median household size with 1.30 persons per household.
| Household Type | # Households | Household Size |
| Married-Couple | 37,725 (44.2%) | 3.58 |
| Single Male/Father | 5,926 (6.9%) | 3.52 |
| Single Female/Mother | 13,372 (15.7%) | 3.79 |
| Non-family | 28,356 (33.2%) | 1.30 |
| Total Households | 85,379 (100.0%) | 2.85 |
Household Size by Marriage Status in Glendale
Out of a total of 85,379 households in Glendale, 57,023 (66.8%) are family households, while 28,356 (33.2%) are nonfamily households. The most numerous type of family households are 2-person households, comprising 19,601, and the most common type of nonfamily households are 1-person households, comprising 21,643.
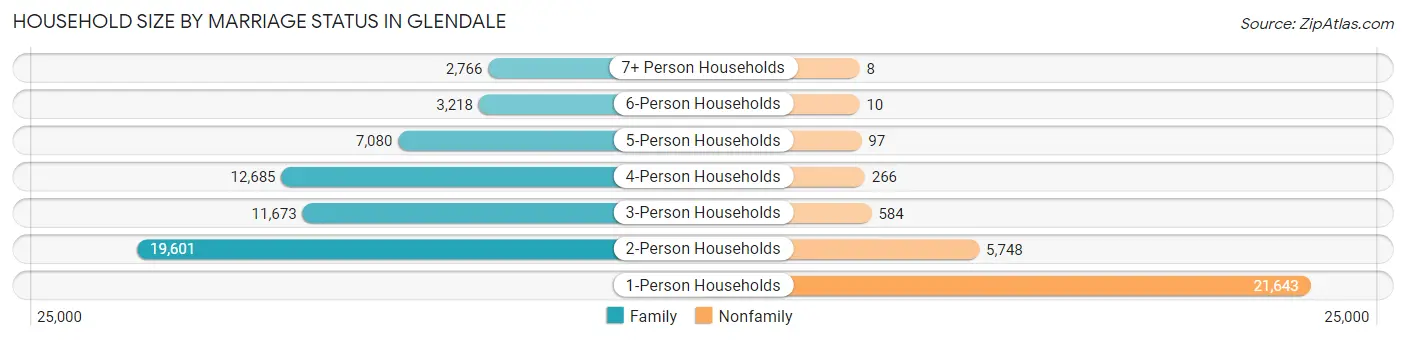
| Household Size | Family Households | Nonfamily Households |
| 1-Person Households | - | 21,643 (25.4%) |
| 2-Person Households | 19,601 (23.0%) | 5,748 (6.7%) |
| 3-Person Households | 11,673 (13.7%) | 584 (0.7%) |
| 4-Person Households | 12,685 (14.9%) | 266 (0.3%) |
| 5-Person Households | 7,080 (8.3%) | 97 (0.1%) |
| 6-Person Households | 3,218 (3.8%) | 10 (0.0%) |
| 7+ Person Households | 2,766 (3.2%) | 8 (0.0%) |
| Total | 57,023 (66.8%) | 28,356 (33.2%) |
Female Fertility in Glendale
Fertility by Age in Glendale
Average fertility rate in Glendale is 63.0 births per 1,000 women. Women in the age bracket of 20 to 34 years have the highest fertility rate with 110.0 births per 1,000 women. Women in the age bracket of 20 to 34 years acount for 76.2% of all women with births.
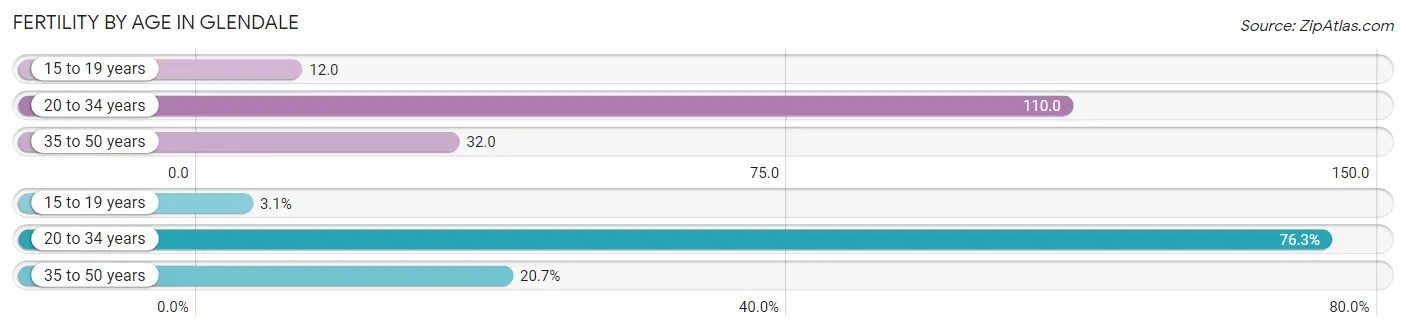
| Age Bracket | Women with Births | Births / 1,000 Women |
| 15 to 19 years | 120 (3.0%) | 12.0 |
| 20 to 34 years | 2,998 (76.2%) | 110.0 |
| 35 to 50 years | 814 (20.7%) | 32.0 |
| Total | 3,932 (100.0%) | 63.0 |
Fertility by Age by Marriage Status in Glendale
56.5% of women with births (3,932) in Glendale are married. The highest percentage of unmarried women with births falls into 15 to 19 years age bracket with 71.7% of them unmarried at the time of birth, while the lowest percentage of unmarried women with births belong to 35 to 50 years age bracket with 18.8% of them unmarried.
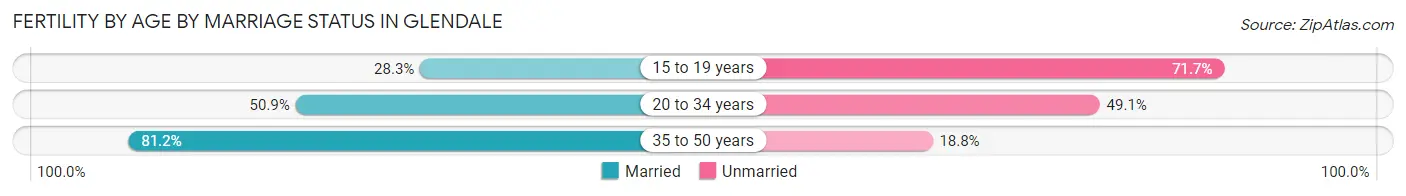
| Age Bracket | Married | Unmarried |
| 15 to 19 years | 34 (28.3%) | 86 (71.7%) |
| 20 to 34 years | 1,526 (50.9%) | 1,472 (49.1%) |
| 35 to 50 years | 661 (81.2%) | 153 (18.8%) |
| Total | 2,222 (56.5%) | 1,710 (43.5%) |
Fertility by Education in Glendale
Average fertility rate in Glendale is 63.0 births per 1,000 women. Women with the education attainment of high school diploma have the highest fertility rate of 78.0 births per 1,000 women, while women with the education attainment of less than high school have the lowest fertility at 45.0 births per 1,000 women. Women with the education attainment of college or associate's degree represent 33.2% of all women with births.
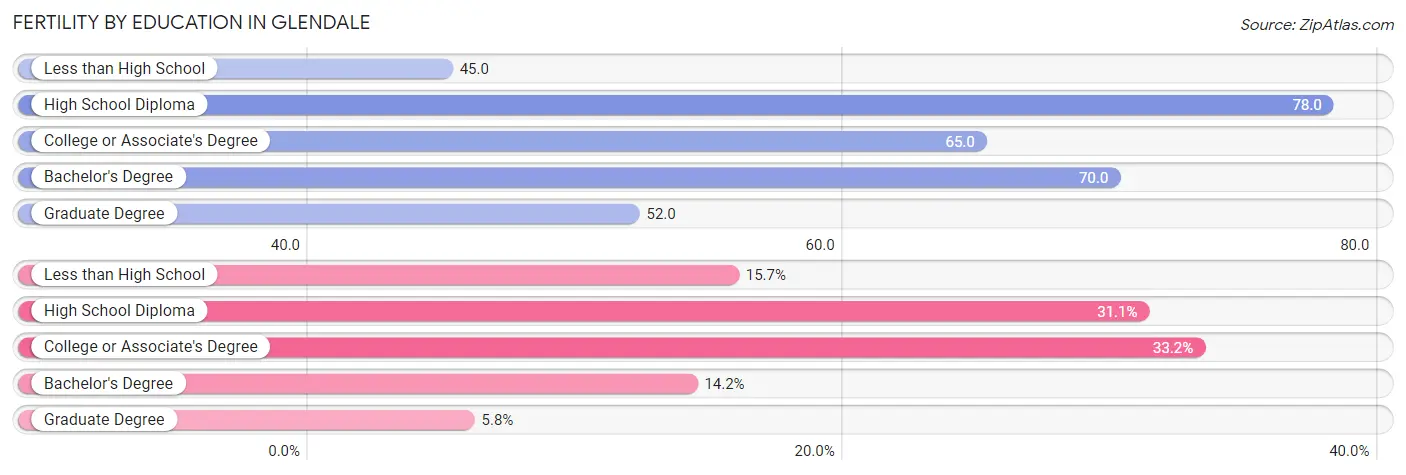
| Educational Attainment | Women with Births | Births / 1,000 Women |
| Less than High School | 618 (15.7%) | 45.0 |
| High School Diploma | 1,223 (31.1%) | 78.0 |
| College or Associate's Degree | 1,305 (33.2%) | 65.0 |
| Bachelor's Degree | 557 (14.2%) | 70.0 |
| Graduate Degree | 229 (5.8%) | 52.0 |
| Total | 3,932 (100.0%) | 63.0 |
Fertility by Education by Marriage Status in Glendale
43.5% of women with births in Glendale are unmarried. Women with the educational attainment of graduate degree are most likely to be married with 94.3% of them married at childbirth, while women with the educational attainment of less than high school are least likely to be married with 61.5% of them unmarried at childbirth.
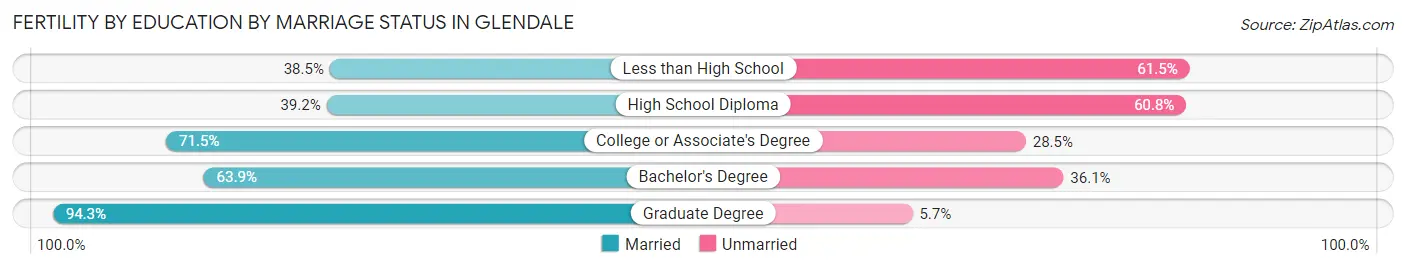
| Educational Attainment | Married | Unmarried |
| Less than High School | 238 (38.5%) | 380 (61.5%) |
| High School Diploma | 479 (39.2%) | 744 (60.8%) |
| College or Associate's Degree | 933 (71.5%) | 372 (28.5%) |
| Bachelor's Degree | 356 (63.9%) | 201 (36.1%) |
| Graduate Degree | 216 (94.3%) | 13 (5.7%) |
| Total | 2,222 (56.5%) | 1,710 (43.5%) |
Employment Characteristics in Glendale
Employment by Class of Employer in Glendale
Among the 115,517 employed individuals in Glendale, private company employees (80,719 | 69.9%), not-for-profit organizations (8,642 | 7.5%), and local government employees (7,800 | 6.8%) make up the most common classes of employment.
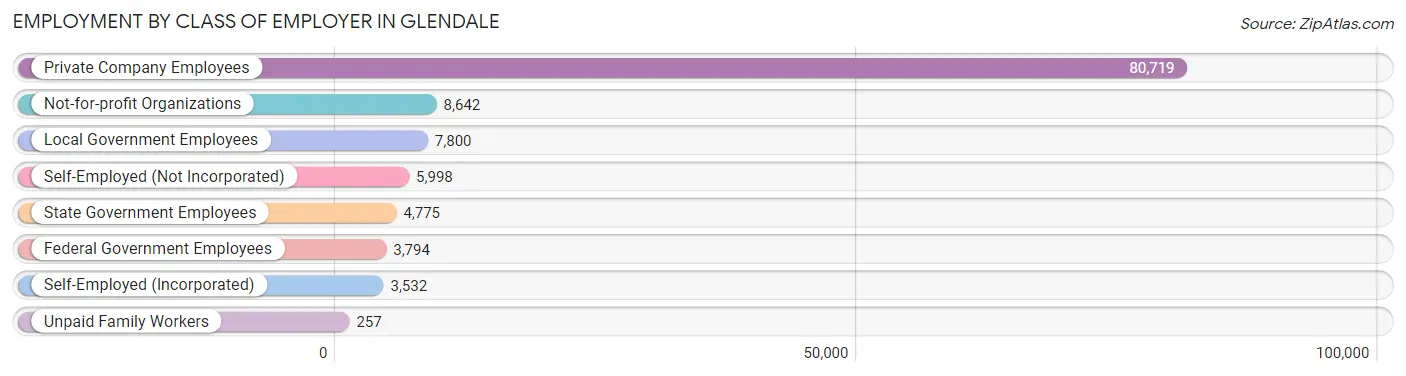
| Employer Class | # Employees | % Employees |
| Private Company Employees | 80,719 | 69.9% |
| Self-Employed (Incorporated) | 3,532 | 3.1% |
| Self-Employed (Not Incorporated) | 5,998 | 5.2% |
| Not-for-profit Organizations | 8,642 | 7.5% |
| Local Government Employees | 7,800 | 6.8% |
| State Government Employees | 4,775 | 4.1% |
| Federal Government Employees | 3,794 | 3.3% |
| Unpaid Family Workers | 257 | 0.2% |
| Total | 115,517 | 100.0% |
Employment Status by Age in Glendale
According to the labor force statistics for Glendale, out of the total population over 16 years of age (192,706), 64.7% or 124,681 individuals are in the labor force, with 5.7% or 7,107 of them unemployed. The age group with the highest labor force participation rate is 35 to 44 years, with 82.6% or 25,435 individuals in the labor force. Within the labor force, the 16 to 19 years age range has the highest percentage of unemployed individuals, with 16.7% or 1,041 of them being unemployed.
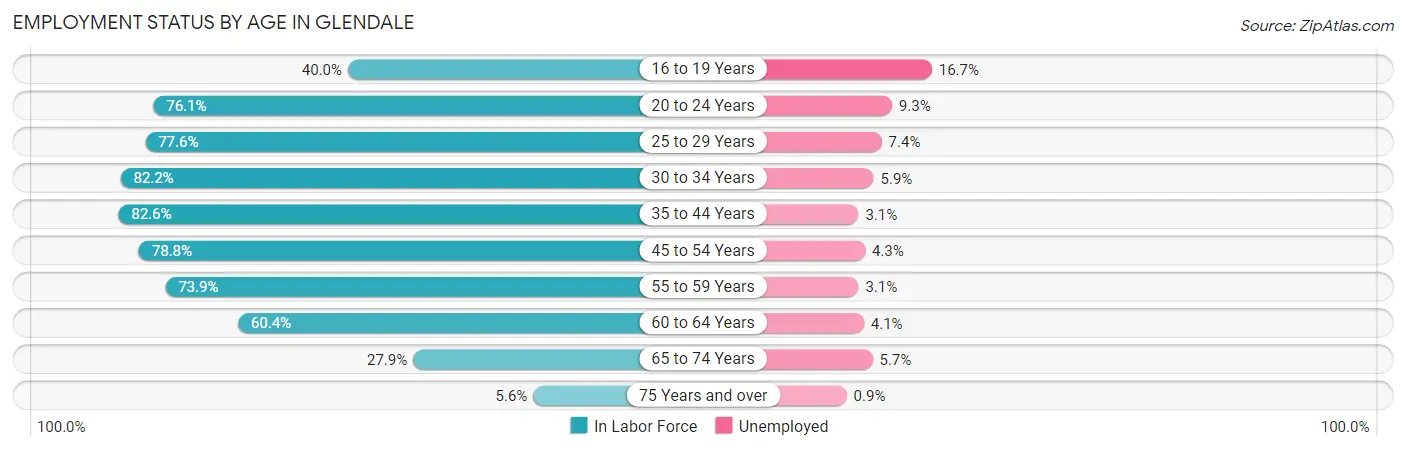
| Age Bracket | In Labor Force | Unemployed |
| 16 to 19 Years | 6,231 (40.0%) | 1,041 (16.7%) |
| 20 to 24 Years | 14,212 (76.1%) | 1,322 (9.3%) |
| 25 to 29 Years | 15,915 (77.6%) | 1,178 (7.4%) |
| 30 to 34 Years | 13,712 (82.2%) | 809 (5.9%) |
| 35 to 44 Years | 25,435 (82.6%) | 788 (3.1%) |
| 45 to 54 Years | 24,479 (78.8%) | 1,053 (4.3%) |
| 55 to 59 Years | 11,020 (73.9%) | 342 (3.1%) |
| 60 to 64 Years | 7,678 (60.4%) | 315 (4.1%) |
| 65 to 74 Years | 5,127 (27.9%) | 292 (5.7%) |
| 75 Years and over | 751 (5.6%) | 7 (0.9%) |
| Total | 124,681 (64.7%) | 7,107 (5.7%) |
Employment Status by Educational Attainment in Glendale
According to labor force statistics for Glendale, 77.6% of individuals (98,297) out of the total population between 25 and 64 years of age (126,672) are in the labor force, with 4.5% or 4,423 of them being unemployed. The group with the highest labor force participation rate are those with the educational attainment of bachelor's degree or higher, with 82.5% or 23,942 individuals in the labor force. Within the labor force, individuals with less than high school education have the highest percentage of unemployment, with 5.8% or 760 of them being unemployed.
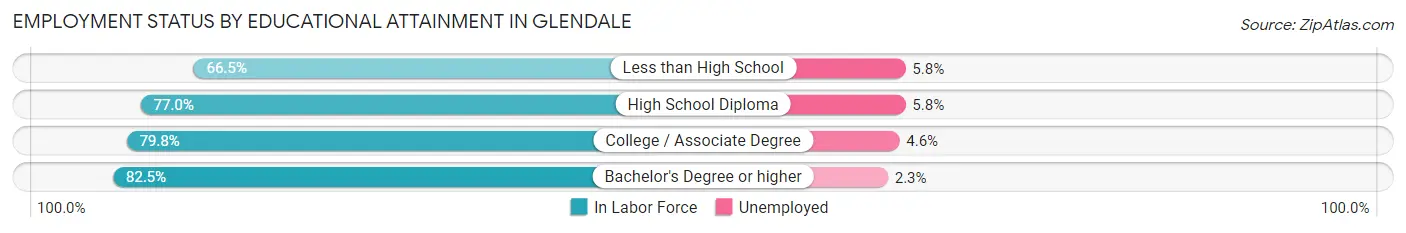
| Educational Attainment | In Labor Force | Unemployed |
| Less than High School | 13,095 (66.5%) | 1,142 (5.8%) |
| High School Diploma | 27,417 (77.0%) | 2,065 (5.8%) |
| College / Associate Degree | 33,798 (79.8%) | 1,948 (4.6%) |
| Bachelor's Degree or higher | 23,942 (82.5%) | 667 (2.3%) |
| Total | 98,297 (77.6%) | 5,700 (4.5%) |
Employment Occupations by Sex in Glendale
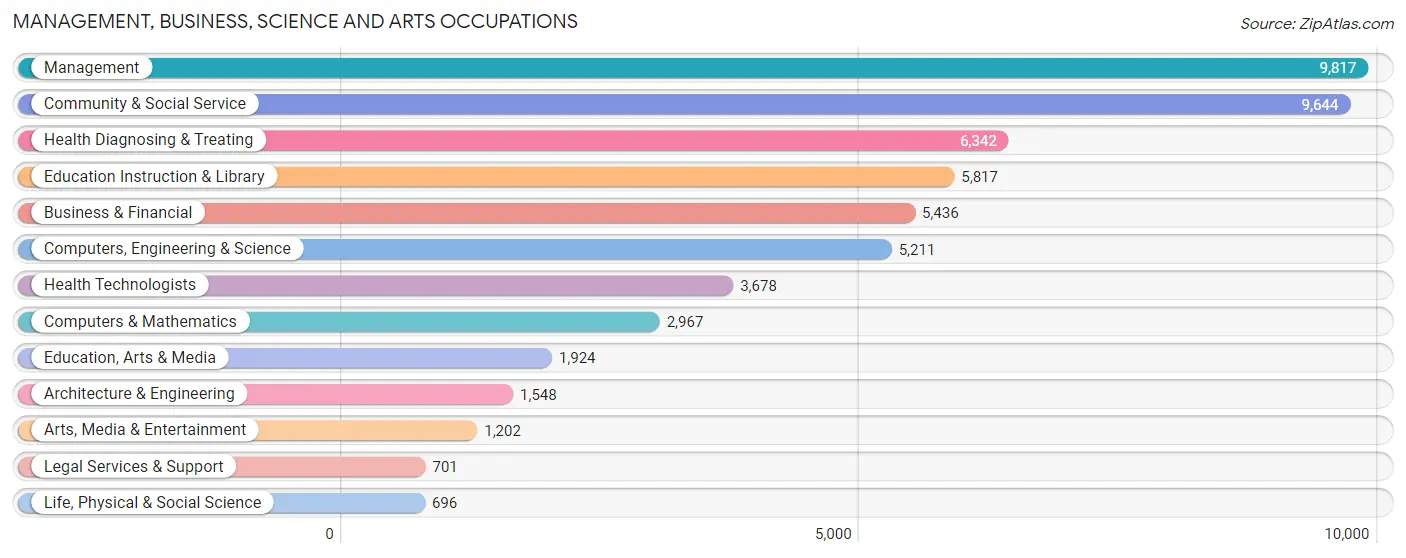
Management, Business, Science and Arts Occupations
The most common Management, Business, Science and Arts occupations in Glendale are Management (9,817 | 8.5%), Community & Social Service (9,644 | 8.3%), Health Diagnosing & Treating (6,342 | 5.5%), Education Instruction & Library (5,817 | 5.0%), and Business & Financial (5,436 | 4.7%).
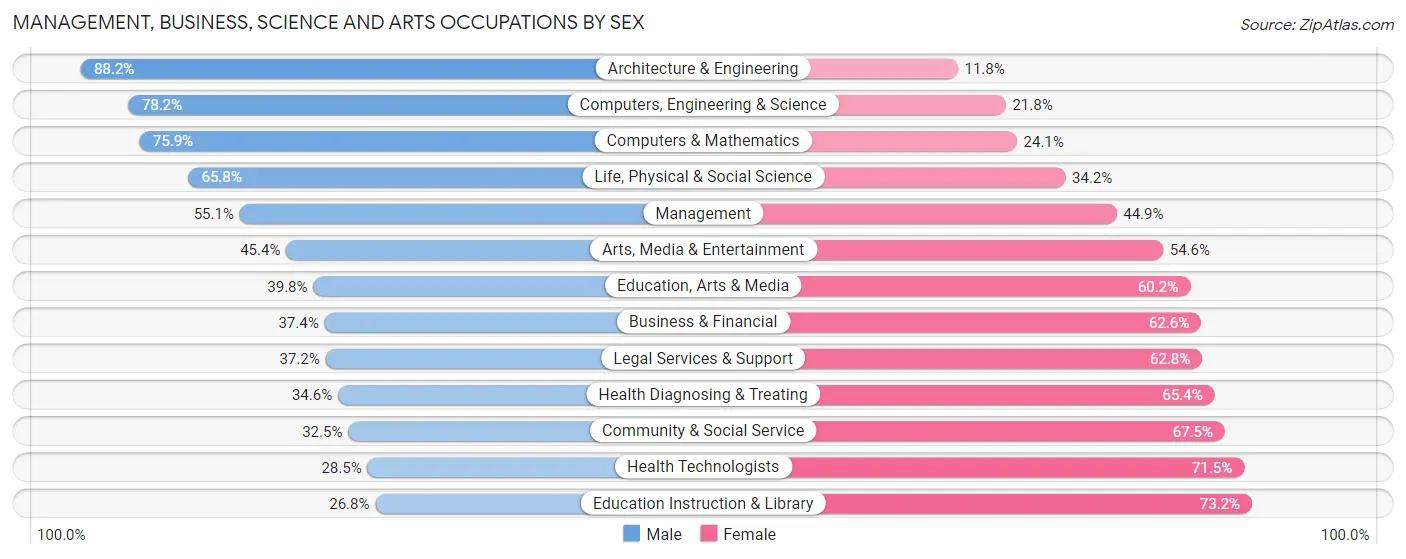
Management, Business, Science and Arts Occupations by Sex
Within the Management, Business, Science and Arts occupations in Glendale, the most male-oriented occupations are Architecture & Engineering (88.2%), Computers, Engineering & Science (78.2%), and Computers & Mathematics (75.9%), while the most female-oriented occupations are Education Instruction & Library (73.2%), Health Technologists (71.5%), and Community & Social Service (67.5%).
| Occupation | Male | Female |
| Management | 5,411 (55.1%) | 4,406 (44.9%) |
| Business & Financial | 2,035 (37.4%) | 3,401 (62.6%) |
| Computers, Engineering & Science | 4,077 (78.2%) | 1,134 (21.8%) |
| Computers & Mathematics | 2,253 (75.9%) | 714 (24.1%) |
| Architecture & Engineering | 1,366 (88.2%) | 182 (11.8%) |
| Life, Physical & Social Science | 458 (65.8%) | 238 (34.2%) |
| Community & Social Service | 3,133 (32.5%) | 6,511 (67.5%) |
| Education, Arts & Media | 765 (39.8%) | 1,159 (60.2%) |
| Legal Services & Support | 261 (37.2%) | 440 (62.8%) |
| Education Instruction & Library | 1,561 (26.8%) | 4,256 (73.2%) |
| Arts, Media & Entertainment | 546 (45.4%) | 656 (54.6%) |
| Health Diagnosing & Treating | 2,196 (34.6%) | 4,146 (65.4%) |
| Health Technologists | 1,047 (28.5%) | 2,631 (71.5%) |
| Total (Category) | 16,852 (46.2%) | 19,598 (53.8%) |
| Total (Overall) | 61,589 (53.1%) | 54,412 (46.9%) |
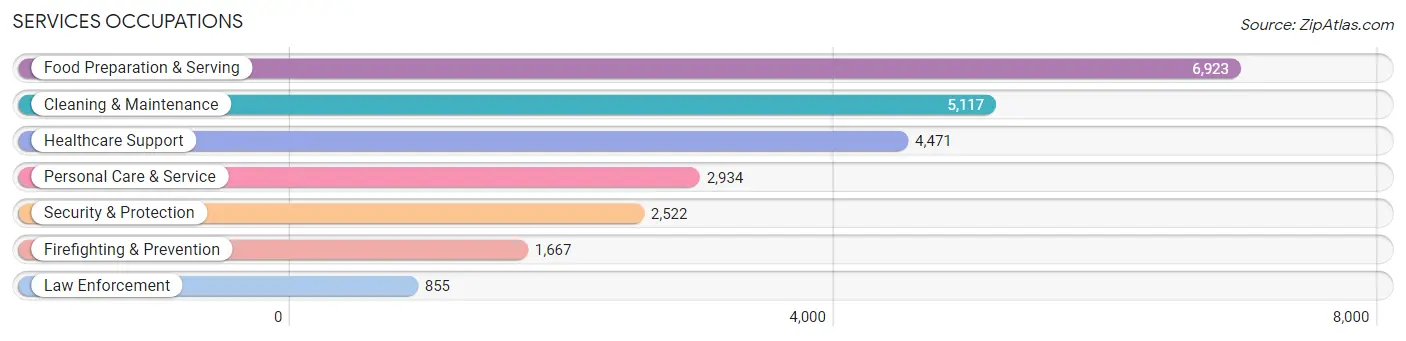
Services Occupations
The most common Services occupations in Glendale are Food Preparation & Serving (6,923 | 6.0%), Cleaning & Maintenance (5,117 | 4.4%), Healthcare Support (4,471 | 3.8%), Personal Care & Service (2,934 | 2.5%), and Security & Protection (2,522 | 2.2%).
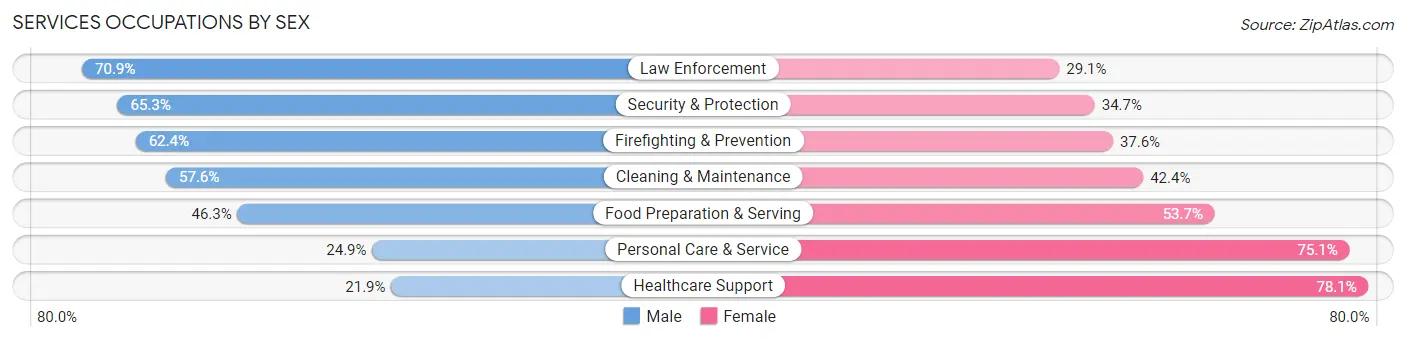
Services Occupations by Sex
Within the Services occupations in Glendale, the most male-oriented occupations are Law Enforcement (70.9%), Security & Protection (65.3%), and Firefighting & Prevention (62.4%), while the most female-oriented occupations are Healthcare Support (78.1%), Personal Care & Service (75.1%), and Food Preparation & Serving (53.7%).
| Occupation | Male | Female |
| Healthcare Support | 979 (21.9%) | 3,492 (78.1%) |
| Security & Protection | 1,646 (65.3%) | 876 (34.7%) |
| Firefighting & Prevention | 1,040 (62.4%) | 627 (37.6%) |
| Law Enforcement | 606 (70.9%) | 249 (29.1%) |
| Food Preparation & Serving | 3,203 (46.3%) | 3,720 (53.7%) |
| Cleaning & Maintenance | 2,947 (57.6%) | 2,170 (42.4%) |
| Personal Care & Service | 731 (24.9%) | 2,203 (75.1%) |
| Total (Category) | 9,506 (43.3%) | 12,461 (56.7%) |
| Total (Overall) | 61,589 (53.1%) | 54,412 (46.9%) |
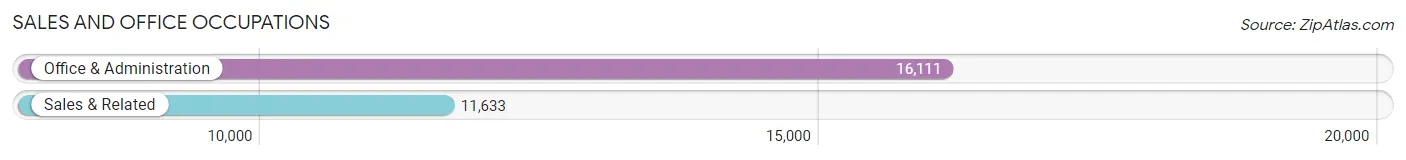
Sales and Office Occupations
The most common Sales and Office occupations in Glendale are Office & Administration (16,111 | 13.9%), and Sales & Related (11,633 | 10.0%).
Sales and Office Occupations by Sex
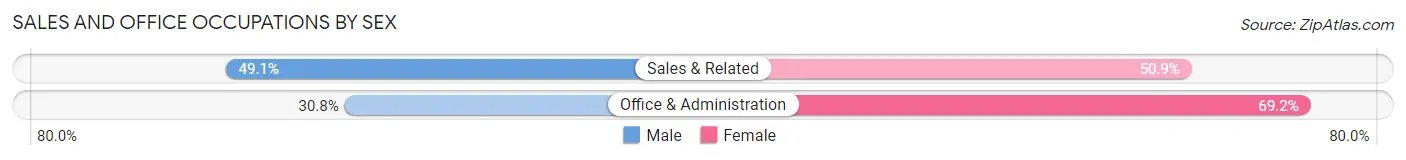
| Occupation | Male | Female |
| Sales & Related | 5,707 (49.1%) | 5,926 (50.9%) |
| Office & Administration | 4,959 (30.8%) | 11,152 (69.2%) |
| Total (Category) | 10,666 (38.4%) | 17,078 (61.6%) |
| Total (Overall) | 61,589 (53.1%) | 54,412 (46.9%) |
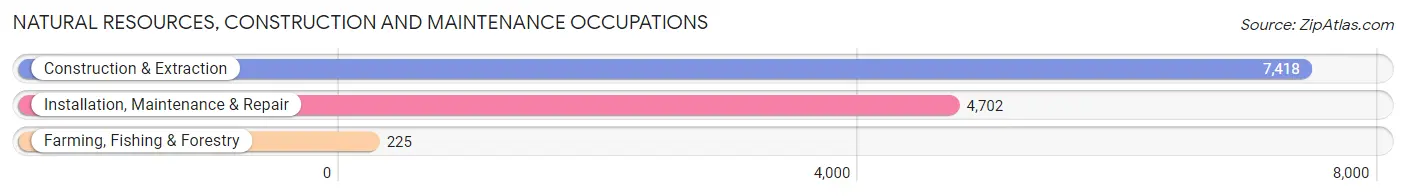
Natural Resources, Construction and Maintenance Occupations
The most common Natural Resources, Construction and Maintenance occupations in Glendale are Construction & Extraction (7,418 | 6.4%), Installation, Maintenance & Repair (4,702 | 4.1%), and Farming, Fishing & Forestry (225 | 0.2%).
Natural Resources, Construction and Maintenance Occupations by Sex
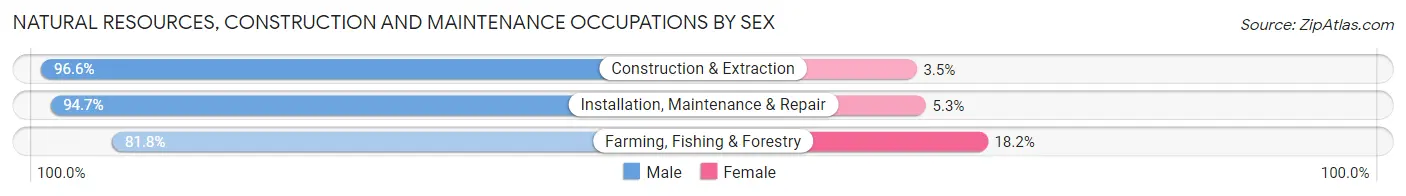
| Occupation | Male | Female |
| Farming, Fishing & Forestry | 184 (81.8%) | 41 (18.2%) |
| Construction & Extraction | 7,162 (96.6%) | 256 (3.5%) |
| Installation, Maintenance & Repair | 4,451 (94.7%) | 251 (5.3%) |
| Total (Category) | 11,797 (95.6%) | 548 (4.4%) |
| Total (Overall) | 61,589 (53.1%) | 54,412 (46.9%) |
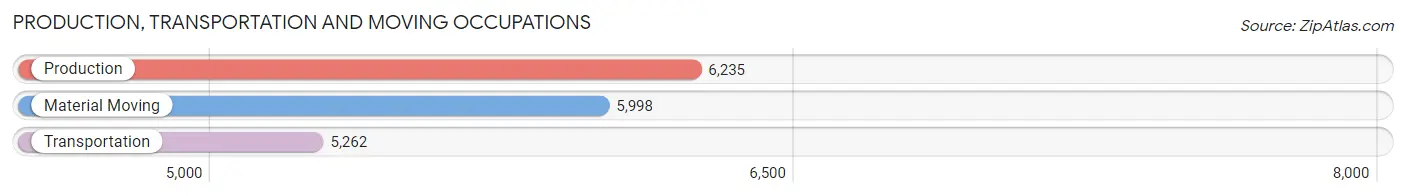
Production, Transportation and Moving Occupations
The most common Production, Transportation and Moving occupations in Glendale are Production (6,235 | 5.4%), Material Moving (5,998 | 5.2%), and Transportation (5,262 | 4.5%).
Production, Transportation and Moving Occupations by Sex
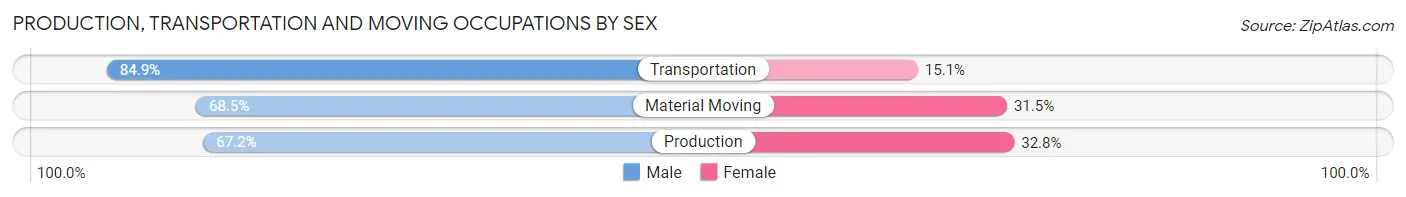
| Occupation | Male | Female |
| Production | 4,190 (67.2%) | 2,045 (32.8%) |
| Transportation | 4,467 (84.9%) | 795 (15.1%) |
| Material Moving | 4,111 (68.5%) | 1,887 (31.5%) |
| Total (Category) | 12,768 (73.0%) | 4,727 (27.0%) |
| Total (Overall) | 61,589 (53.1%) | 54,412 (46.9%) |
Employment Industries by Sex in Glendale
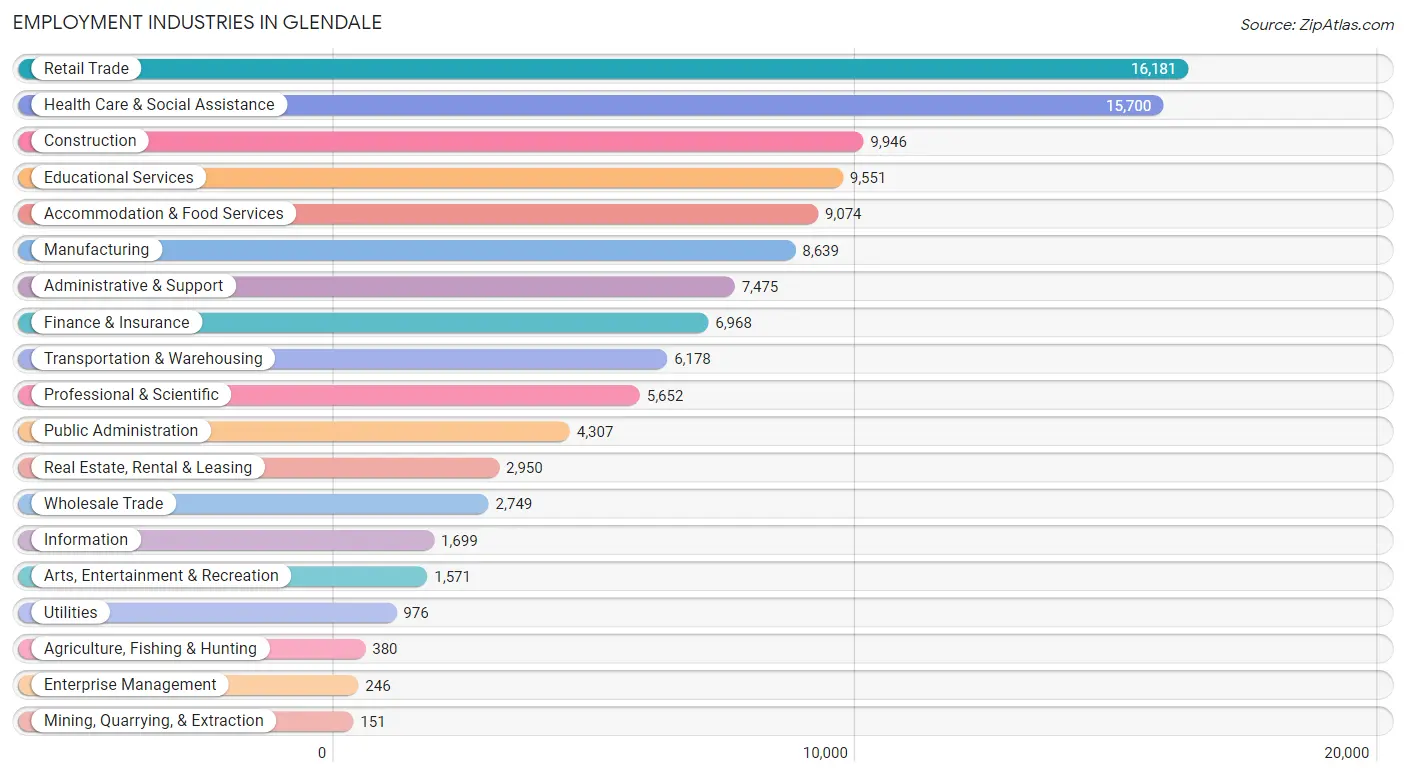
Employment Industries in Glendale
The major employment industries in Glendale include Retail Trade (16,181 | 14.0%), Health Care & Social Assistance (15,700 | 13.5%), Construction (9,946 | 8.6%), Educational Services (9,551 | 8.2%), and Accommodation & Food Services (9,074 | 7.8%).
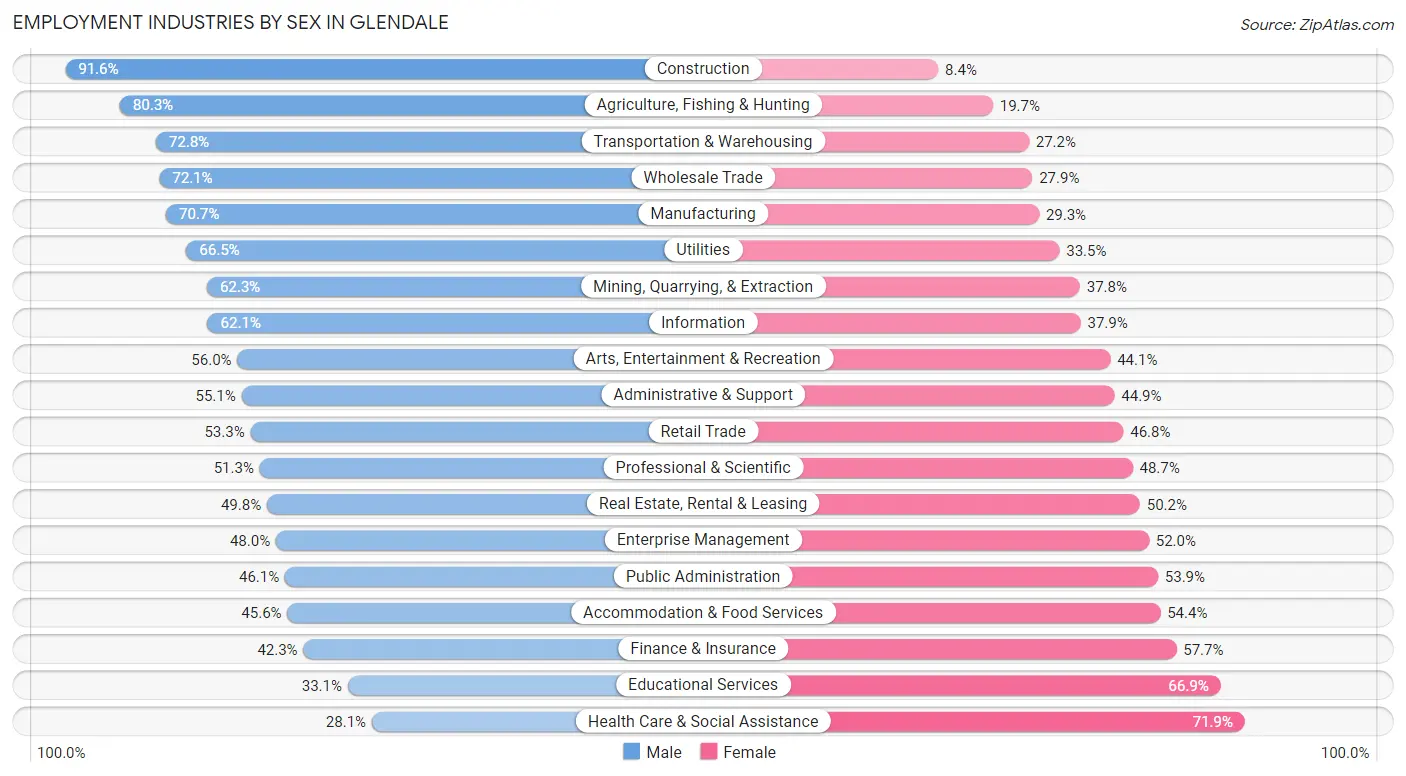
Employment Industries by Sex in Glendale
The Glendale industries that see more men than women are Construction (91.6%), Agriculture, Fishing & Hunting (80.3%), and Transportation & Warehousing (72.8%), whereas the industries that tend to have a higher number of women are Health Care & Social Assistance (71.9%), Educational Services (66.9%), and Finance & Insurance (57.7%).
| Industry | Male | Female |
| Agriculture, Fishing & Hunting | 305 (80.3%) | 75 (19.7%) |
| Mining, Quarrying, & Extraction | 94 (62.3%) | 57 (37.8%) |
| Construction | 9,108 (91.6%) | 838 (8.4%) |
| Manufacturing | 6,109 (70.7%) | 2,530 (29.3%) |
| Wholesale Trade | 1,982 (72.1%) | 767 (27.9%) |
| Retail Trade | 8,616 (53.2%) | 7,565 (46.8%) |
| Transportation & Warehousing | 4,498 (72.8%) | 1,680 (27.2%) |
| Utilities | 649 (66.5%) | 327 (33.5%) |
| Information | 1,055 (62.1%) | 644 (37.9%) |
| Finance & Insurance | 2,946 (42.3%) | 4,022 (57.7%) |
| Real Estate, Rental & Leasing | 1,470 (49.8%) | 1,480 (50.2%) |
| Professional & Scientific | 2,901 (51.3%) | 2,751 (48.7%) |
| Enterprise Management | 118 (48.0%) | 128 (52.0%) |
| Administrative & Support | 4,119 (55.1%) | 3,356 (44.9%) |
| Educational Services | 3,161 (33.1%) | 6,390 (66.9%) |
| Health Care & Social Assistance | 4,413 (28.1%) | 11,287 (71.9%) |
| Arts, Entertainment & Recreation | 879 (55.9%) | 692 (44.1%) |
| Accommodation & Food Services | 4,138 (45.6%) | 4,936 (54.4%) |
| Public Administration | 1,985 (46.1%) | 2,322 (53.9%) |
| Total | 61,589 (53.1%) | 54,412 (46.9%) |
Education in Glendale
School Enrollment in Glendale
The most common levels of schooling among the 65,028 students in Glendale are high school (14,662 | 22.6%), middle school (13,999 | 21.5%), and elementary school (13,970 | 21.5%).
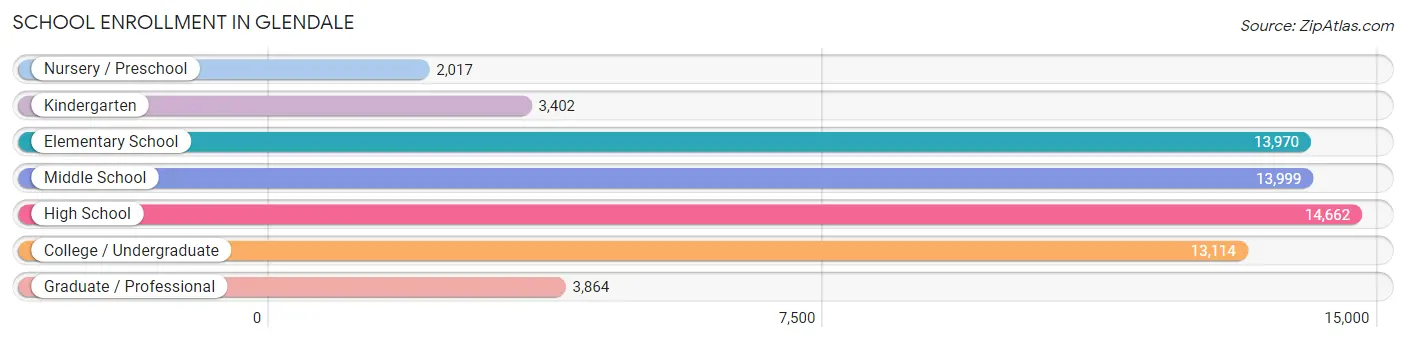
| School Level | # Students | % Students |
| Nursery / Preschool | 2,017 | 3.1% |
| Kindergarten | 3,402 | 5.2% |
| Elementary School | 13,970 | 21.5% |
| Middle School | 13,999 | 21.5% |
| High School | 14,662 | 22.6% |
| College / Undergraduate | 13,114 | 20.2% |
| Graduate / Professional | 3,864 | 5.9% |
| Total | 65,028 | 100.0% |
School Enrollment by Age by Funding Source in Glendale
Out of a total of 65,028 students who are enrolled in schools in Glendale, 9,624 (14.8%) attend a private institution, while the remaining 55,404 (85.2%) are enrolled in public schools. The age group of 25 to 34 year olds has the highest likelihood of being enrolled in private schools, with 2,752 (48.5% in the age bracket) enrolled. Conversely, the age group of 10 to 14 year olds has the lowest likelihood of being enrolled in a private school, with 16,288 (94.0% in the age bracket) attending a public institution.
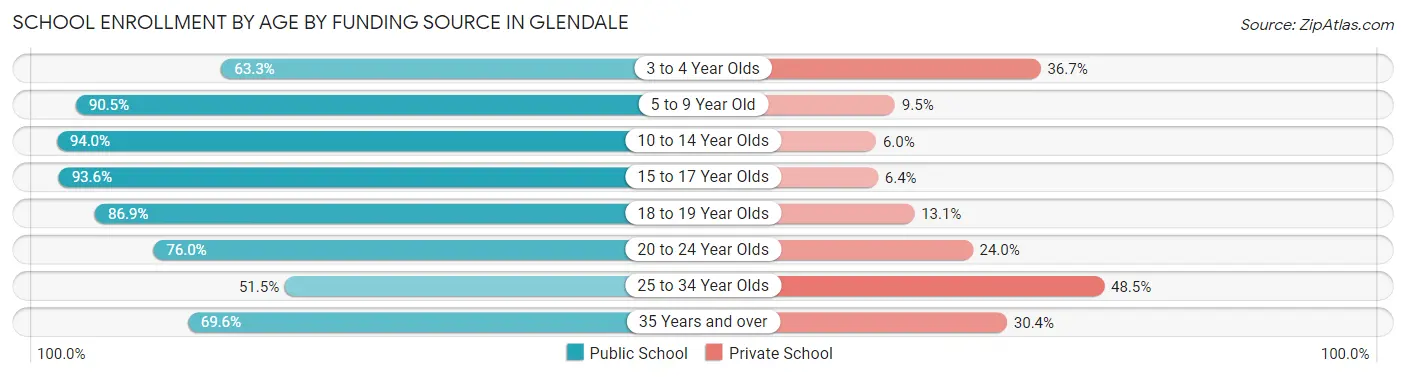
| Age Bracket | Public School | Private School |
| 3 to 4 Year Olds | 1,047 (63.3%) | 606 (36.7%) |
| 5 to 9 Year Old | 14,267 (90.5%) | 1,505 (9.5%) |
| 10 to 14 Year Olds | 16,288 (94.0%) | 1,044 (6.0%) |
| 15 to 17 Year Olds | 9,663 (93.6%) | 656 (6.4%) |
| 18 to 19 Year Olds | 4,404 (86.9%) | 666 (13.1%) |
| 20 to 24 Year Olds | 4,893 (76.0%) | 1,545 (24.0%) |
| 25 to 34 Year Olds | 2,922 (51.5%) | 2,752 (48.5%) |
| 35 Years and over | 1,928 (69.6%) | 842 (30.4%) |
| Total | 55,404 (85.2%) | 9,624 (14.8%) |
Educational Attainment by Field of Study in Glendale
Business (8,085 | 21.1%), education (5,183 | 13.5%), science & technology (4,418 | 11.6%), bio, nature & agricultural (2,984 | 7.8%), and arts & humanities (2,701 | 7.1%) are the most common fields of study among 38,266 individuals in Glendale who have obtained a bachelor's degree or higher.
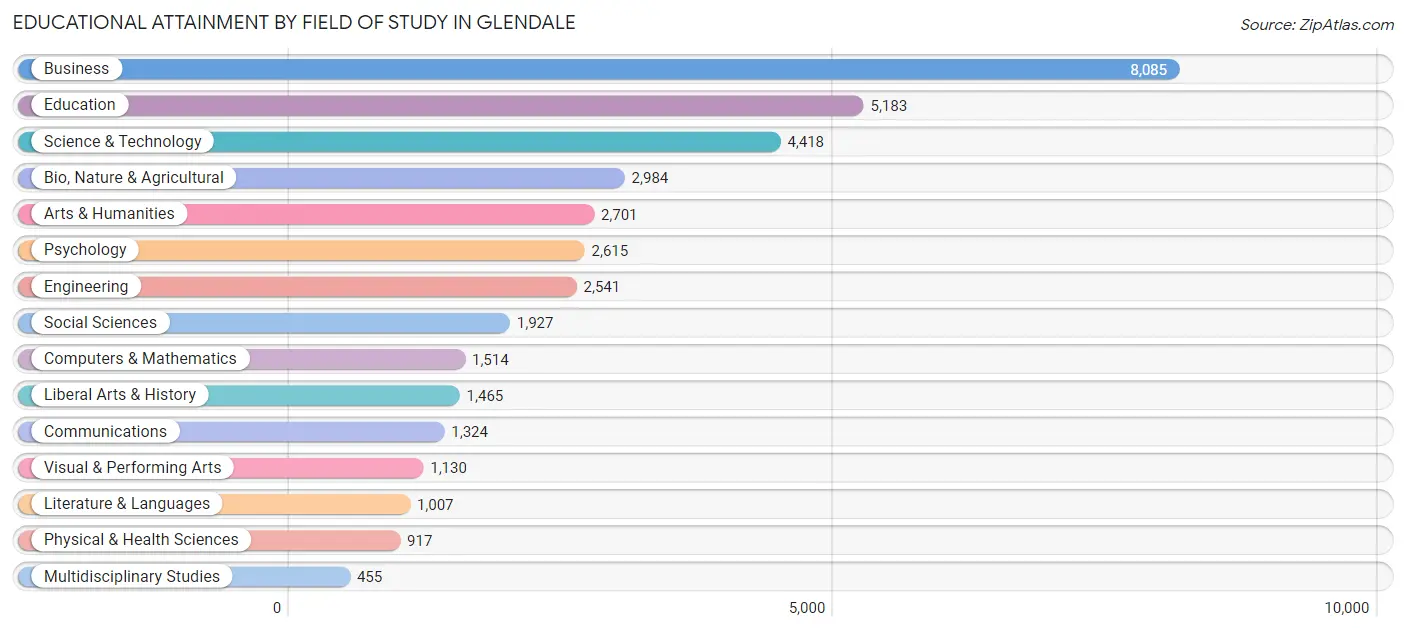
| Field of Study | # Graduates | % Graduates |
| Computers & Mathematics | 1,514 | 4.0% |
| Bio, Nature & Agricultural | 2,984 | 7.8% |
| Physical & Health Sciences | 917 | 2.4% |
| Psychology | 2,615 | 6.8% |
| Social Sciences | 1,927 | 5.0% |
| Engineering | 2,541 | 6.6% |
| Multidisciplinary Studies | 455 | 1.2% |
| Science & Technology | 4,418 | 11.6% |
| Business | 8,085 | 21.1% |
| Education | 5,183 | 13.5% |
| Literature & Languages | 1,007 | 2.6% |
| Liberal Arts & History | 1,465 | 3.8% |
| Visual & Performing Arts | 1,130 | 2.9% |
| Communications | 1,324 | 3.5% |
| Arts & Humanities | 2,701 | 7.1% |
| Total | 38,266 | 100.0% |
Transportation & Commute in Glendale
Vehicle Availability by Sex in Glendale
The most prevalent vehicle ownership categories in Glendale are males with 2 vehicles (24,182, accounting for 39.5%) and females with 2 vehicles (20,320, making up 45.6%).
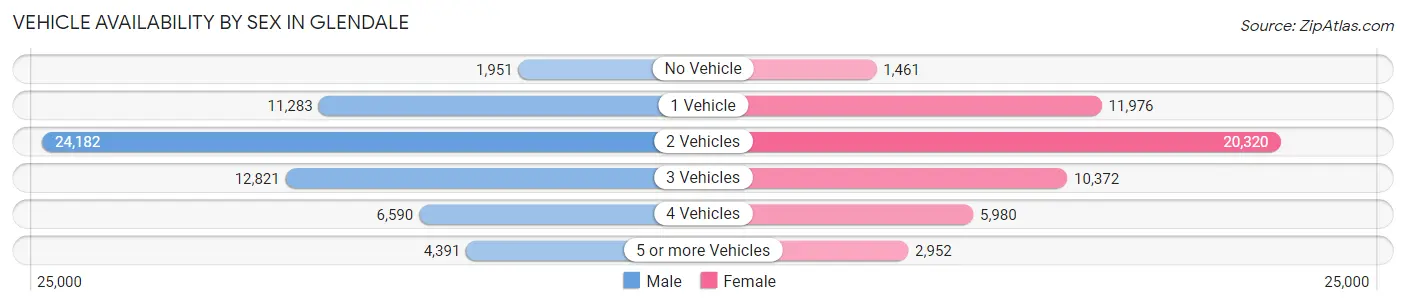
| Vehicles Available | Male | Female |
| No Vehicle | 1,951 (3.2%) | 1,461 (2.8%) |
| 1 Vehicle | 11,283 (18.4%) | 11,976 (22.6%) |
| 2 Vehicles | 24,182 (39.5%) | 20,320 (38.3%) |
| 3 Vehicles | 12,821 (20.9%) | 10,372 (19.6%) |
| 4 Vehicles | 6,590 (10.8%) | 5,980 (11.3%) |
| 5 or more Vehicles | 4,391 (7.2%) | 2,952 (5.6%) |
| Total | 61,218 (100.0%) | 53,061 (100.0%) |
Commute Time in Glendale
The most frequently occuring commute durations in Glendale are 30 to 34 minutes (19,415 commuters, 19.0%), 20 to 24 minutes (15,872 commuters, 15.5%), and 15 to 19 minutes (12,820 commuters, 12.5%).
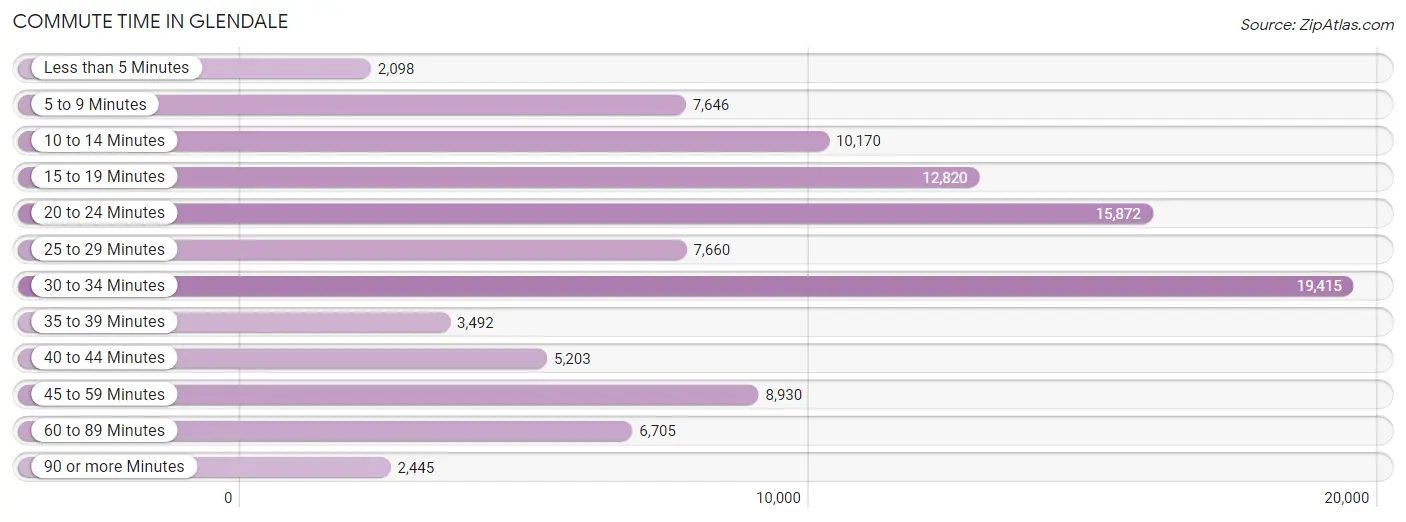
| Commute Time | # Commuters | % Commuters |
| Less than 5 Minutes | 2,098 | 2.1% |
| 5 to 9 Minutes | 7,646 | 7.5% |
| 10 to 14 Minutes | 10,170 | 9.9% |
| 15 to 19 Minutes | 12,820 | 12.5% |
| 20 to 24 Minutes | 15,872 | 15.5% |
| 25 to 29 Minutes | 7,660 | 7.5% |
| 30 to 34 Minutes | 19,415 | 19.0% |
| 35 to 39 Minutes | 3,492 | 3.4% |
| 40 to 44 Minutes | 5,203 | 5.1% |
| 45 to 59 Minutes | 8,930 | 8.7% |
| 60 to 89 Minutes | 6,705 | 6.5% |
| 90 or more Minutes | 2,445 | 2.4% |
Commute Time by Sex in Glendale
The most common commute times in Glendale are 30 to 34 minutes (11,641 commuters, 20.7%) for males and 30 to 34 minutes (7,774 commuters, 16.8%) for females.
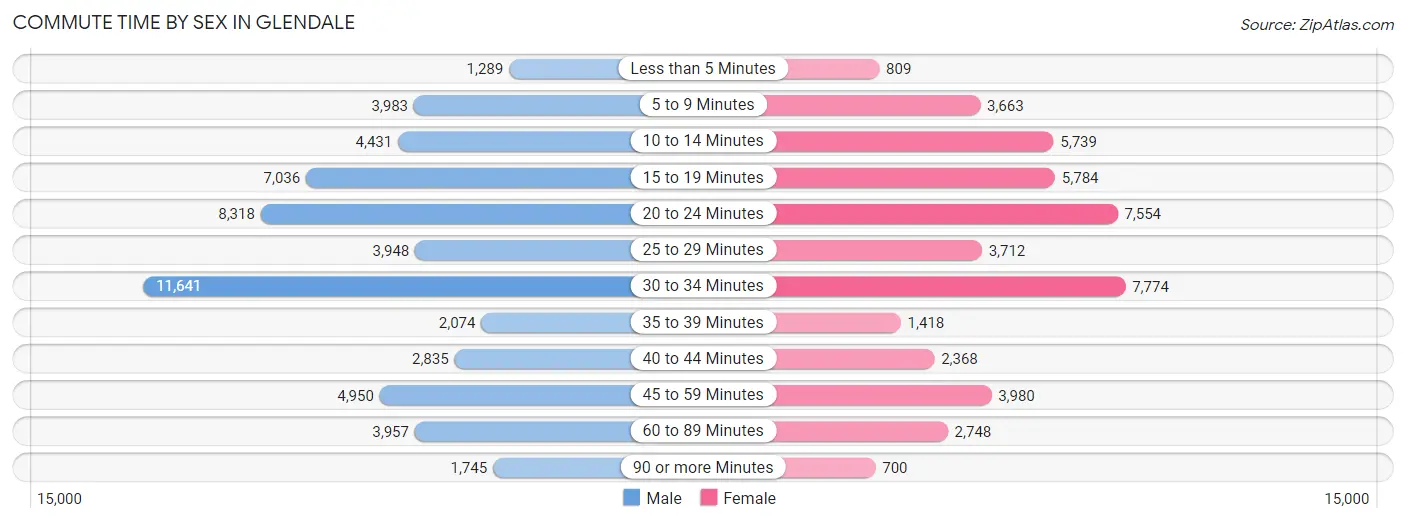
| Commute Time | Male | Female |
| Less than 5 Minutes | 1,289 (2.3%) | 809 (1.8%) |
| 5 to 9 Minutes | 3,983 (7.1%) | 3,663 (7.9%) |
| 10 to 14 Minutes | 4,431 (7.9%) | 5,739 (12.4%) |
| 15 to 19 Minutes | 7,036 (12.5%) | 5,784 (12.5%) |
| 20 to 24 Minutes | 8,318 (14.8%) | 7,554 (16.3%) |
| 25 to 29 Minutes | 3,948 (7.0%) | 3,712 (8.0%) |
| 30 to 34 Minutes | 11,641 (20.7%) | 7,774 (16.8%) |
| 35 to 39 Minutes | 2,074 (3.7%) | 1,418 (3.1%) |
| 40 to 44 Minutes | 2,835 (5.0%) | 2,368 (5.1%) |
| 45 to 59 Minutes | 4,950 (8.8%) | 3,980 (8.6%) |
| 60 to 89 Minutes | 3,957 (7.0%) | 2,748 (5.9%) |
| 90 or more Minutes | 1,745 (3.1%) | 700 (1.5%) |
Time of Departure to Work by Sex in Glendale
The most frequent times of departure to work in Glendale are 12:00 AM to 4:59 AM (6,937, 12.3%) for males and 7:00 AM to 7:29 AM (6,499, 14.1%) for females.
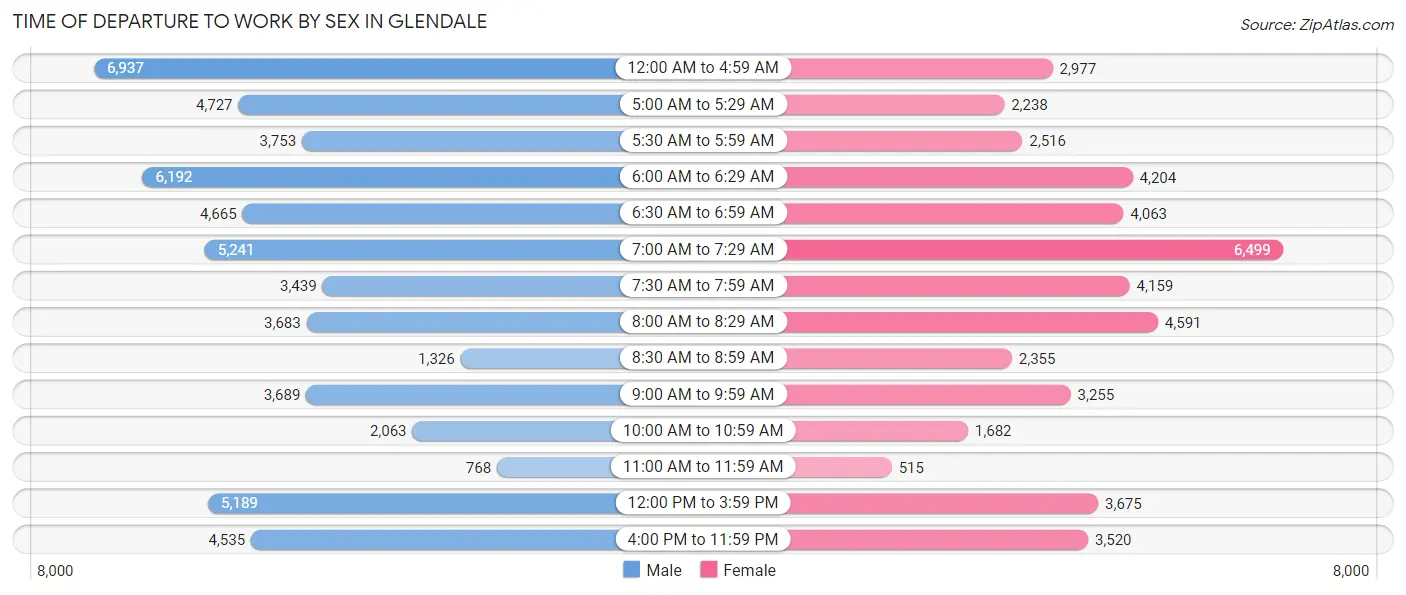
| Time of Departure | Male | Female |
| 12:00 AM to 4:59 AM | 6,937 (12.3%) | 2,977 (6.4%) |
| 5:00 AM to 5:29 AM | 4,727 (8.4%) | 2,238 (4.8%) |
| 5:30 AM to 5:59 AM | 3,753 (6.7%) | 2,516 (5.4%) |
| 6:00 AM to 6:29 AM | 6,192 (11.0%) | 4,204 (9.1%) |
| 6:30 AM to 6:59 AM | 4,665 (8.3%) | 4,063 (8.8%) |
| 7:00 AM to 7:29 AM | 5,241 (9.3%) | 6,499 (14.1%) |
| 7:30 AM to 7:59 AM | 3,439 (6.1%) | 4,159 (9.0%) |
| 8:00 AM to 8:29 AM | 3,683 (6.6%) | 4,591 (9.9%) |
| 8:30 AM to 8:59 AM | 1,326 (2.4%) | 2,355 (5.1%) |
| 9:00 AM to 9:59 AM | 3,689 (6.6%) | 3,255 (7.0%) |
| 10:00 AM to 10:59 AM | 2,063 (3.7%) | 1,682 (3.6%) |
| 11:00 AM to 11:59 AM | 768 (1.4%) | 515 (1.1%) |
| 12:00 PM to 3:59 PM | 5,189 (9.2%) | 3,675 (8.0%) |
| 4:00 PM to 11:59 PM | 4,535 (8.1%) | 3,520 (7.6%) |
| Total | 56,207 (100.0%) | 46,249 (100.0%) |
Housing Occupancy in Glendale
Occupancy by Ownership in Glendale
Of the total 85,379 dwellings in Glendale, owner-occupied units account for 48,876 (57.3%), while renter-occupied units make up 36,503 (42.7%).
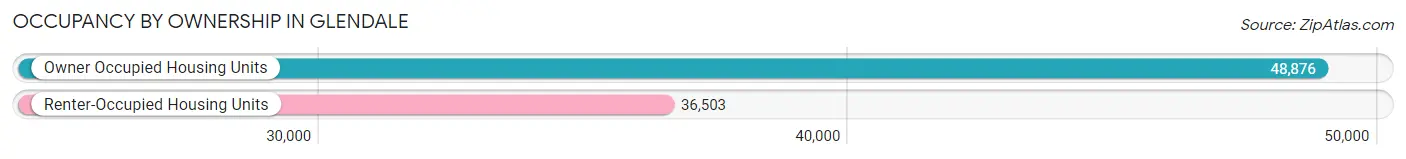
| Occupancy | # Housing Units | % Housing Units |
| Owner Occupied Housing Units | 48,876 | 57.3% |
| Renter-Occupied Housing Units | 36,503 | 42.7% |
| Total Occupied Housing Units | 85,379 | 100.0% |
Occupancy by Household Size in Glendale
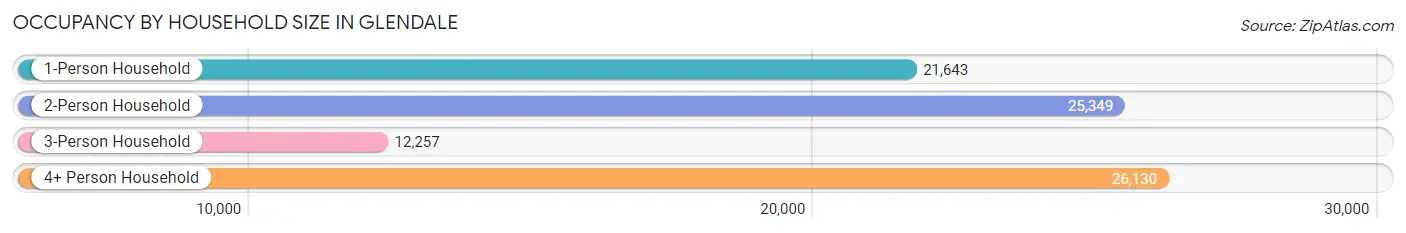
| Household Size | # Housing Units | % Housing Units |
| 1-Person Household | 21,643 | 25.4% |
| 2-Person Household | 25,349 | 29.7% |
| 3-Person Household | 12,257 | 14.4% |
| 4+ Person Household | 26,130 | 30.6% |
| Total Housing Units | 85,379 | 100.0% |
Occupancy by Ownership by Household Size in Glendale
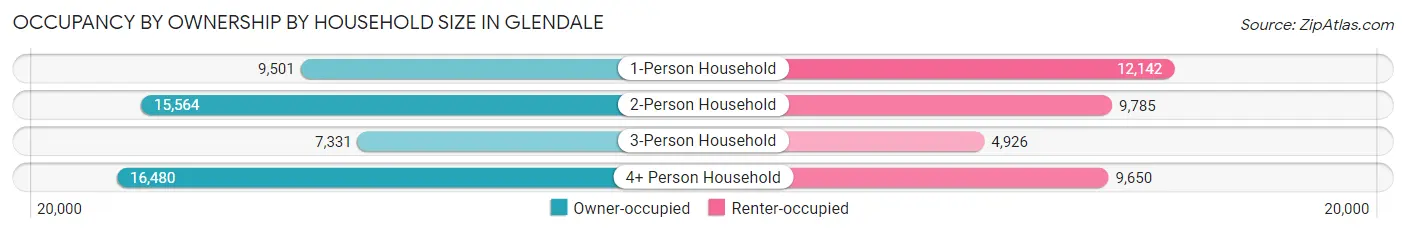
| Household Size | Owner-occupied | Renter-occupied |
| 1-Person Household | 9,501 (43.9%) | 12,142 (56.1%) |
| 2-Person Household | 15,564 (61.4%) | 9,785 (38.6%) |
| 3-Person Household | 7,331 (59.8%) | 4,926 (40.2%) |
| 4+ Person Household | 16,480 (63.1%) | 9,650 (36.9%) |
| Total Housing Units | 48,876 (57.3%) | 36,503 (42.7%) |
Occupancy by Educational Attainment in Glendale
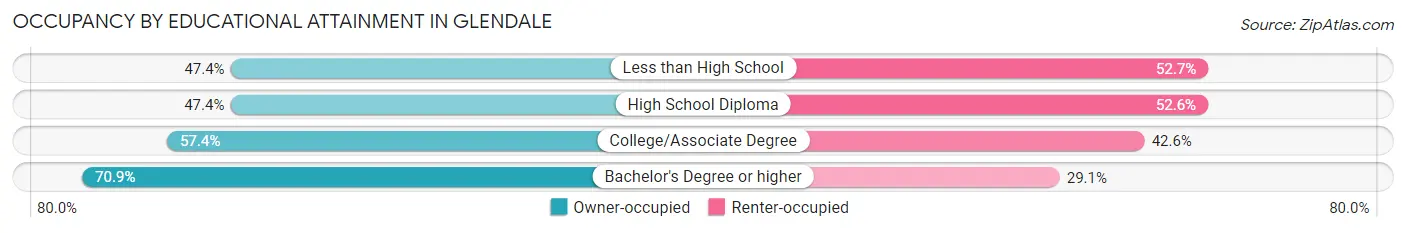
| Household Size | Owner-occupied | Renter-occupied |
| Less than High School | 5,208 (47.3%) | 5,791 (52.6%) |
| High School Diploma | 9,687 (47.4%) | 10,757 (52.6%) |
| College/Associate Degree | 18,100 (57.4%) | 13,427 (42.6%) |
| Bachelor's Degree or higher | 15,881 (70.9%) | 6,528 (29.1%) |
Occupancy by Age of Householder in Glendale
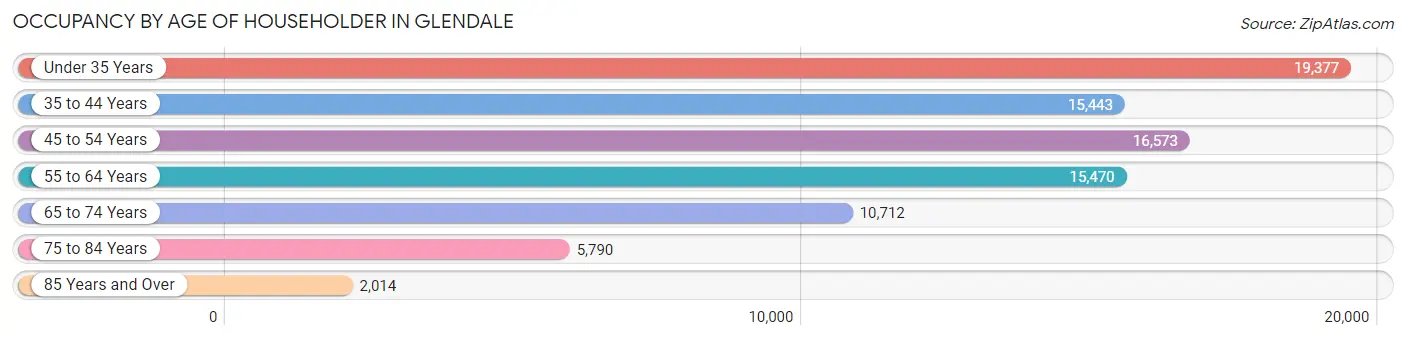
| Age Bracket | # Households | % Households |
| Under 35 Years | 19,377 | 22.7% |
| 35 to 44 Years | 15,443 | 18.1% |
| 45 to 54 Years | 16,573 | 19.4% |
| 55 to 64 Years | 15,470 | 18.1% |
| 65 to 74 Years | 10,712 | 12.6% |
| 75 to 84 Years | 5,790 | 6.8% |
| 85 Years and Over | 2,014 | 2.4% |
| Total | 85,379 | 100.0% |
Housing Finances in Glendale
Median Income by Occupancy in Glendale
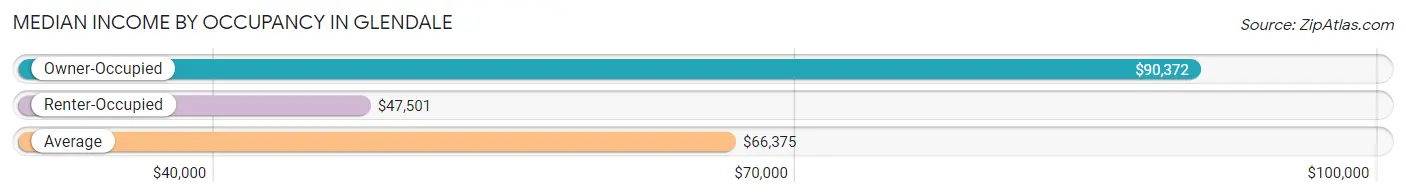
| Occupancy Type | # Households | Median Income |
| Owner-Occupied | 48,876 (57.3%) | $90,372 |
| Renter-Occupied | 36,503 (42.7%) | $47,501 |
| Average | 85,379 (100.0%) | $66,375 |
Occupancy by Householder Income Bracket in Glendale
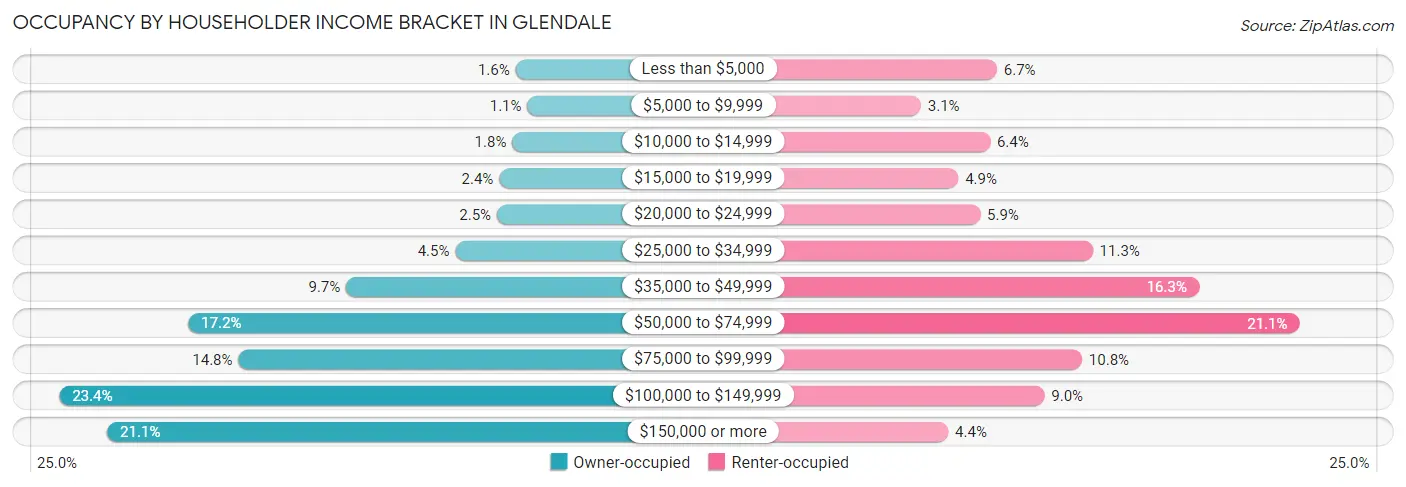
| Income Bracket | Owner-occupied | Renter-occupied |
| Less than $5,000 | 792 (1.6%) | 2,458 (6.7%) |
| $5,000 to $9,999 | 518 (1.1%) | 1,134 (3.1%) |
| $10,000 to $14,999 | 872 (1.8%) | 2,335 (6.4%) |
| $15,000 to $19,999 | 1,171 (2.4%) | 1,785 (4.9%) |
| $20,000 to $24,999 | 1,228 (2.5%) | 2,164 (5.9%) |
| $25,000 to $34,999 | 2,194 (4.5%) | 4,120 (11.3%) |
| $35,000 to $49,999 | 4,737 (9.7%) | 5,964 (16.3%) |
| $50,000 to $74,999 | 8,410 (17.2%) | 7,714 (21.1%) |
| $75,000 to $99,999 | 7,245 (14.8%) | 3,936 (10.8%) |
| $100,000 to $149,999 | 11,411 (23.4%) | 3,282 (9.0%) |
| $150,000 or more | 10,298 (21.1%) | 1,611 (4.4%) |
| Total | 48,876 (100.0%) | 36,503 (100.0%) |
Monthly Housing Cost Tiers in Glendale
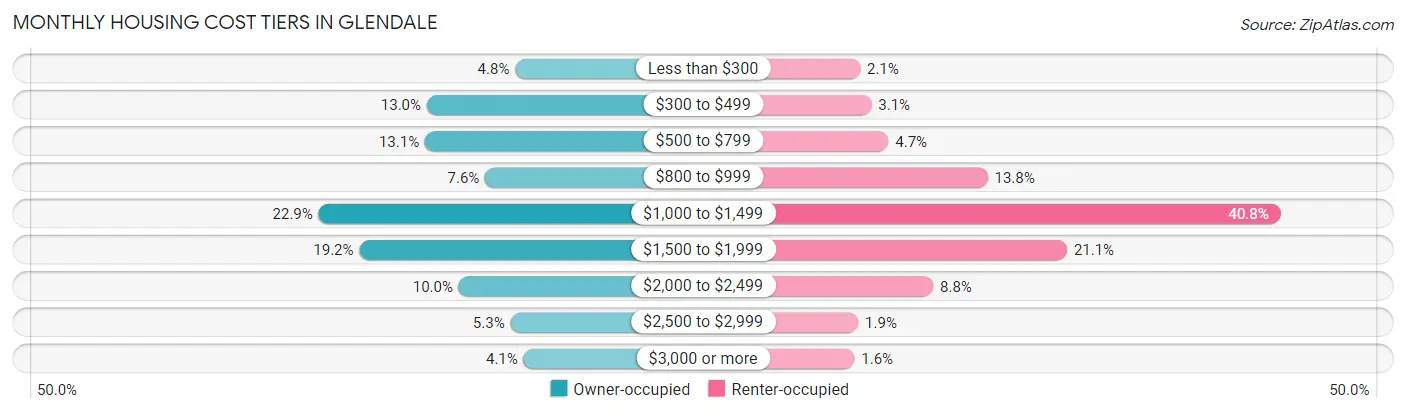
| Monthly Cost | Owner-occupied | Renter-occupied |
| Less than $300 | 2,360 (4.8%) | 758 (2.1%) |
| $300 to $499 | 6,337 (13.0%) | 1,140 (3.1%) |
| $500 to $799 | 6,421 (13.1%) | 1,712 (4.7%) |
| $800 to $999 | 3,716 (7.6%) | 5,044 (13.8%) |
| $1,000 to $1,499 | 11,212 (22.9%) | 14,891 (40.8%) |
| $1,500 to $1,999 | 9,372 (19.2%) | 7,712 (21.1%) |
| $2,000 to $2,499 | 4,900 (10.0%) | 3,216 (8.8%) |
| $2,500 to $2,999 | 2,575 (5.3%) | 696 (1.9%) |
| $3,000 or more | 1,983 (4.1%) | 570 (1.6%) |
| Total | 48,876 (100.0%) | 36,503 (100.0%) |
Physical Housing Characteristics in Glendale
Housing Structures in Glendale
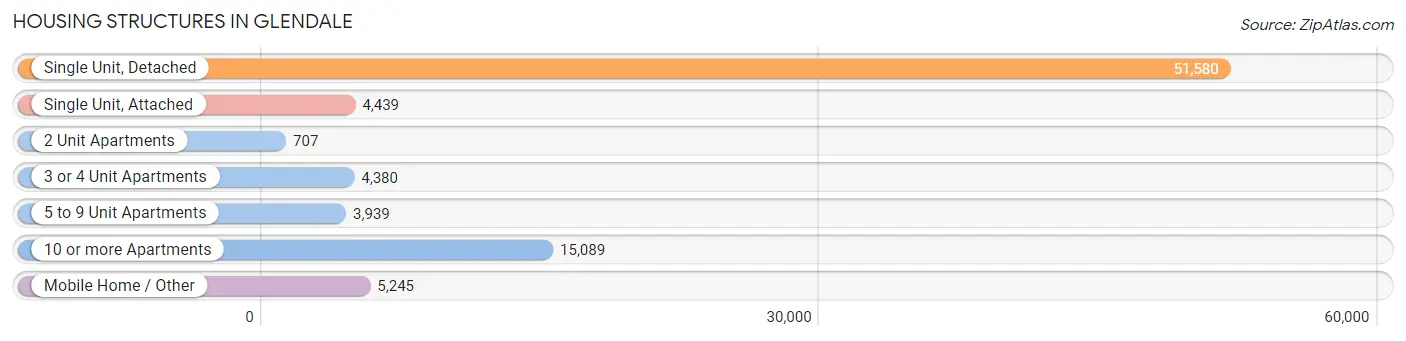
| Structure Type | # Housing Units | % Housing Units |
| Single Unit, Detached | 51,580 | 60.4% |
| Single Unit, Attached | 4,439 | 5.2% |
| 2 Unit Apartments | 707 | 0.8% |
| 3 or 4 Unit Apartments | 4,380 | 5.1% |
| 5 to 9 Unit Apartments | 3,939 | 4.6% |
| 10 or more Apartments | 15,089 | 17.7% |
| Mobile Home / Other | 5,245 | 6.1% |
| Total | 85,379 | 100.0% |
Housing Structures by Occupancy in Glendale
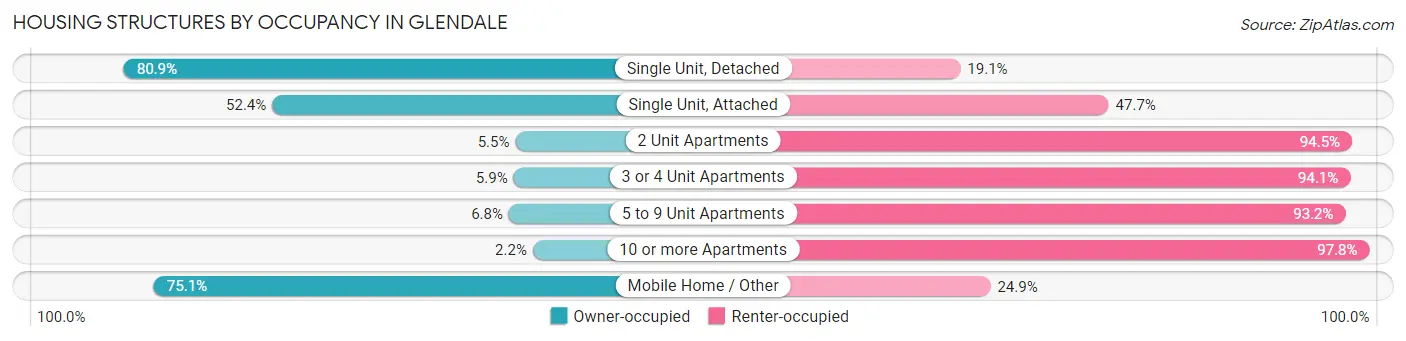
| Structure Type | Owner-occupied | Renter-occupied |
| Single Unit, Detached | 41,724 (80.9%) | 9,856 (19.1%) |
| Single Unit, Attached | 2,324 (52.3%) | 2,115 (47.6%) |
| 2 Unit Apartments | 39 (5.5%) | 668 (94.5%) |
| 3 or 4 Unit Apartments | 257 (5.9%) | 4,123 (94.1%) |
| 5 to 9 Unit Apartments | 267 (6.8%) | 3,672 (93.2%) |
| 10 or more Apartments | 326 (2.2%) | 14,763 (97.8%) |
| Mobile Home / Other | 3,939 (75.1%) | 1,306 (24.9%) |
| Total | 48,876 (57.3%) | 36,503 (42.7%) |
Housing Structures by Number of Rooms in Glendale
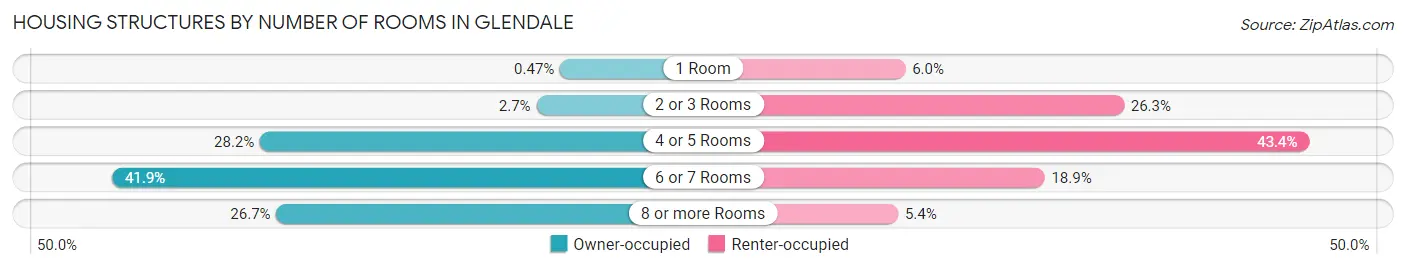
| Number of Rooms | Owner-occupied | Renter-occupied |
| 1 Room | 232 (0.5%) | 2,205 (6.0%) |
| 2 or 3 Rooms | 1,302 (2.7%) | 9,583 (26.3%) |
| 4 or 5 Rooms | 13,795 (28.2%) | 15,847 (43.4%) |
| 6 or 7 Rooms | 20,491 (41.9%) | 6,906 (18.9%) |
| 8 or more Rooms | 13,056 (26.7%) | 1,962 (5.4%) |
| Total | 48,876 (100.0%) | 36,503 (100.0%) |
Housing Structure by Heating Type in Glendale
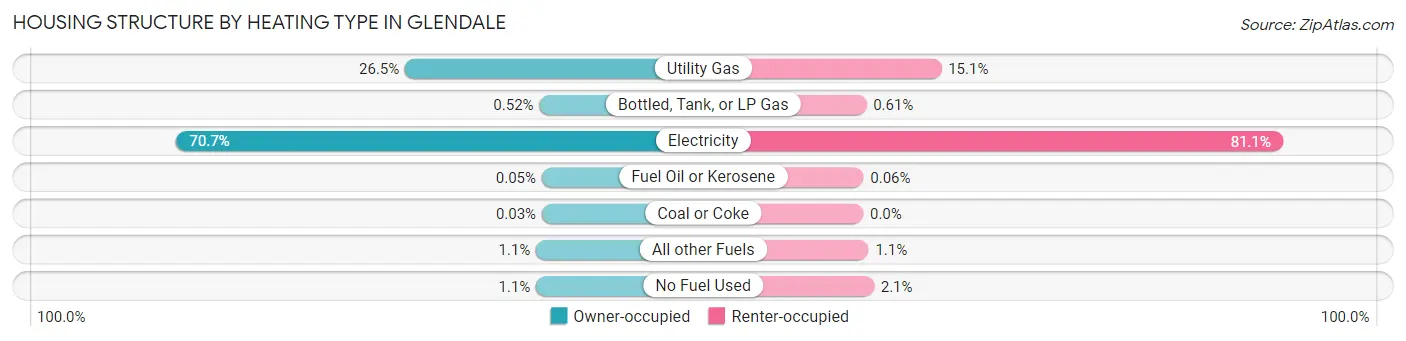
| Heating Type | Owner-occupied | Renter-occupied |
| Utility Gas | 12,937 (26.5%) | 5,517 (15.1%) |
| Bottled, Tank, or LP Gas | 255 (0.5%) | 221 (0.6%) |
| Electricity | 34,534 (70.7%) | 29,605 (81.1%) |
| Fuel Oil or Kerosene | 26 (0.1%) | 23 (0.1%) |
| Coal or Coke | 14 (0.0%) | 0 (0.0%) |
| All other Fuels | 555 (1.1%) | 383 (1.1%) |
| No Fuel Used | 555 (1.1%) | 754 (2.1%) |
| Total | 48,876 (100.0%) | 36,503 (100.0%) |
Household Vehicle Usage in Glendale
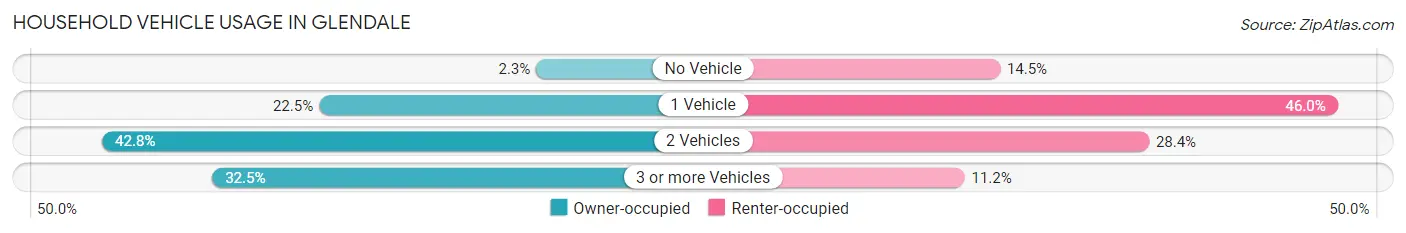
| Vehicles per Household | Owner-occupied | Renter-occupied |
| No Vehicle | 1,098 (2.2%) | 5,281 (14.5%) |
| 1 Vehicle | 11,006 (22.5%) | 16,786 (46.0%) |
| 2 Vehicles | 20,898 (42.8%) | 10,359 (28.4%) |
| 3 or more Vehicles | 15,874 (32.5%) | 4,077 (11.2%) |
| Total | 48,876 (100.0%) | 36,503 (100.0%) |
Real Estate & Mortgages in Glendale
Real Estate and Mortgage Overview in Glendale
| Characteristic | Without Mortgage | With Mortgage |
| Housing Units | 15,692 | 33,184 |
| Median Property Value | $275,600 | $322,500 |
| Median Household Income | $67,943 | $8,004 |
| Monthly Housing Costs | $482 | $1,858 |
| Real Estate Taxes | $1,410 | $1,426 |
Property Value by Mortgage Status in Glendale
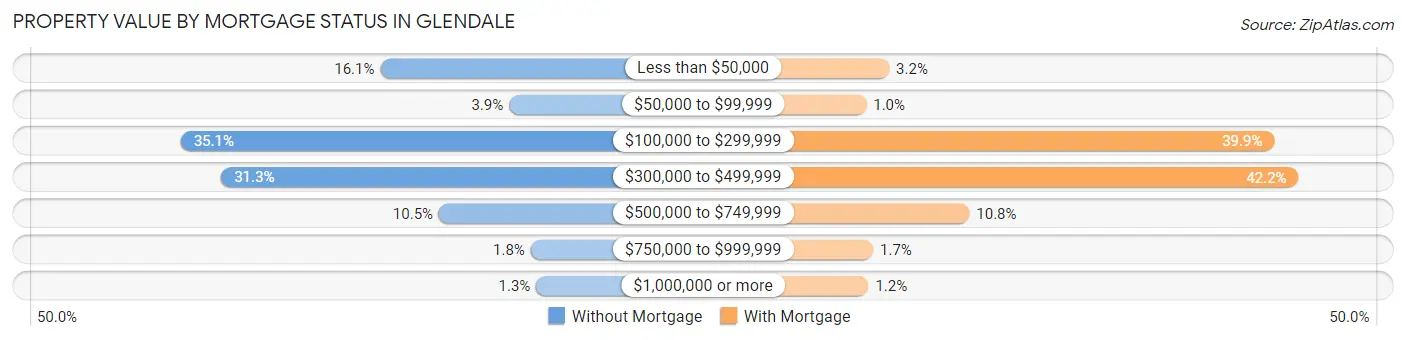
| Property Value | Without Mortgage | With Mortgage |
| Less than $50,000 | 2,529 (16.1%) | 1,061 (3.2%) |
| $50,000 to $99,999 | 606 (3.9%) | 339 (1.0%) |
| $100,000 to $299,999 | 5,512 (35.1%) | 13,229 (39.9%) |
| $300,000 to $499,999 | 4,907 (31.3%) | 13,996 (42.2%) |
| $500,000 to $749,999 | 1,654 (10.5%) | 3,598 (10.8%) |
| $750,000 to $999,999 | 283 (1.8%) | 554 (1.7%) |
| $1,000,000 or more | 201 (1.3%) | 407 (1.2%) |
| Total | 15,692 (100.0%) | 33,184 (100.0%) |
Household Income by Mortgage Status in Glendale
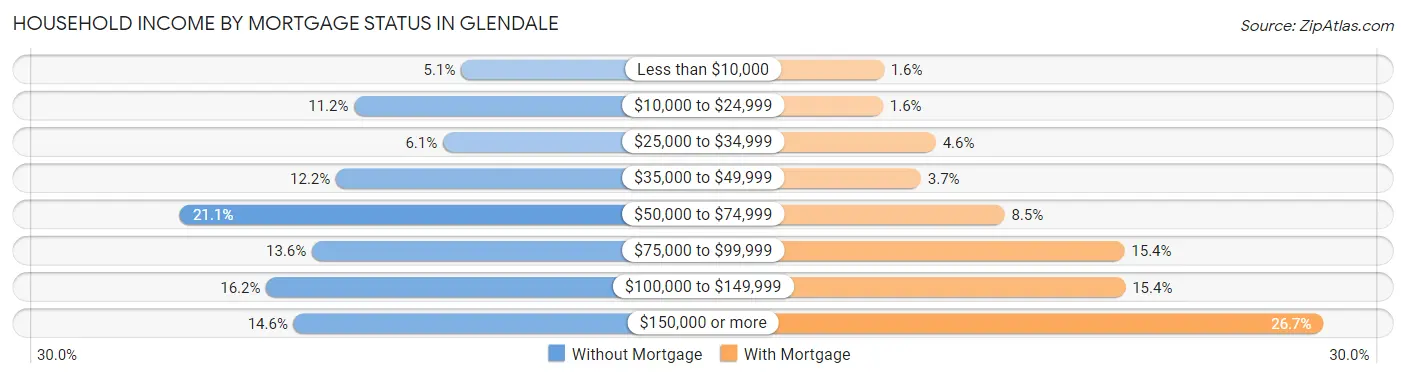
| Household Income | Without Mortgage | With Mortgage |
| Less than $10,000 | 792 (5.1%) | 535 (1.6%) |
| $10,000 to $24,999 | 1,752 (11.2%) | 518 (1.6%) |
| $25,000 to $34,999 | 956 (6.1%) | 1,519 (4.6%) |
| $35,000 to $49,999 | 1,914 (12.2%) | 1,238 (3.7%) |
| $50,000 to $74,999 | 3,314 (21.1%) | 2,823 (8.5%) |
| $75,000 to $99,999 | 2,130 (13.6%) | 5,096 (15.4%) |
| $100,000 to $149,999 | 2,540 (16.2%) | 5,115 (15.4%) |
| $150,000 or more | 2,294 (14.6%) | 8,871 (26.7%) |
| Total | 15,692 (100.0%) | 33,184 (100.0%) |
Property Value to Household Income Ratio in Glendale
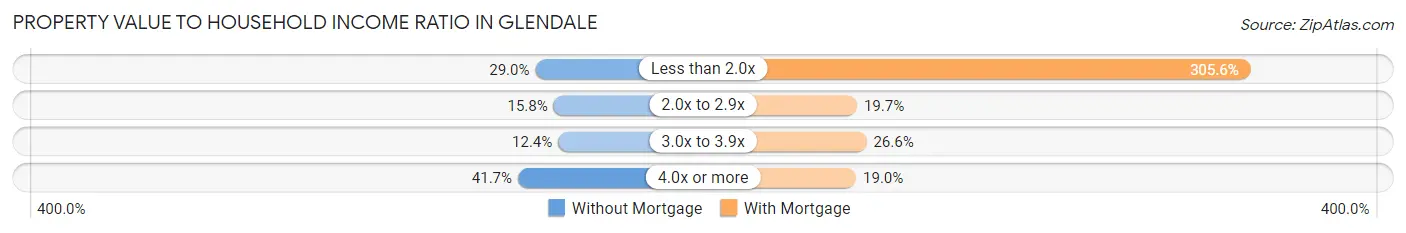
| Value-to-Income Ratio | Without Mortgage | With Mortgage |
| Less than 2.0x | 4,553 (29.0%) | 101,412 (305.6%) |
| 2.0x to 2.9x | 2,475 (15.8%) | 6,525 (19.7%) |
| 3.0x to 3.9x | 1,951 (12.4%) | 8,817 (26.6%) |
| 4.0x or more | 6,537 (41.7%) | 6,319 (19.0%) |
| Total | 15,692 (100.0%) | 33,184 (100.0%) |
Real Estate Taxes by Mortgage Status in Glendale
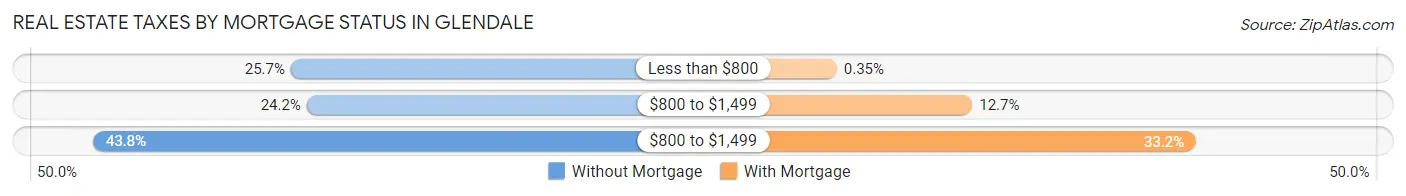
| Property Taxes | Without Mortgage | With Mortgage |
| Less than $800 | 4,032 (25.7%) | 115 (0.4%) |
| $800 to $1,499 | 3,803 (24.2%) | 4,221 (12.7%) |
| $800 to $1,499 | 6,869 (43.8%) | 10,999 (33.2%) |
| Total | 15,692 (100.0%) | 33,184 (100.0%) |
Health & Disability in Glendale
Health Insurance Coverage by Age in Glendale
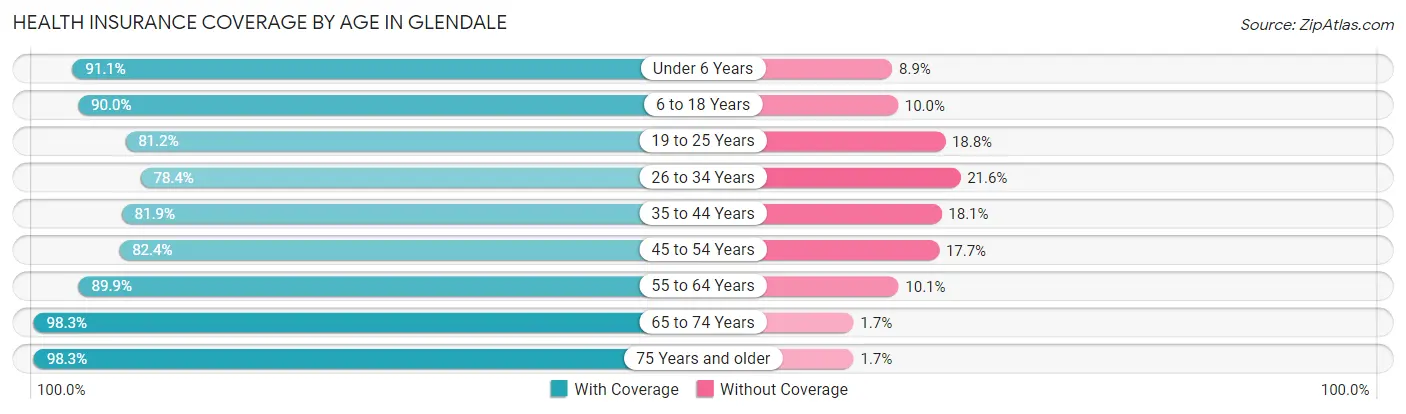
| Age Bracket | With Coverage | Without Coverage |
| Under 6 Years | 18,716 (91.1%) | 1,831 (8.9%) |
| 6 to 18 Years | 41,679 (90.0%) | 4,621 (10.0%) |
| 19 to 25 Years | 20,738 (81.2%) | 4,792 (18.8%) |
| 26 to 34 Years | 25,715 (78.4%) | 7,087 (21.6%) |
| 35 to 44 Years | 25,034 (81.9%) | 5,531 (18.1%) |
| 45 to 54 Years | 25,478 (82.4%) | 5,460 (17.6%) |
| 55 to 64 Years | 24,712 (89.9%) | 2,771 (10.1%) |
| 65 to 74 Years | 17,840 (98.3%) | 308 (1.7%) |
| 75 Years and older | 12,503 (98.3%) | 219 (1.7%) |
| Total | 212,415 (86.7%) | 32,620 (13.3%) |
Health Insurance Coverage by Citizenship Status in Glendale
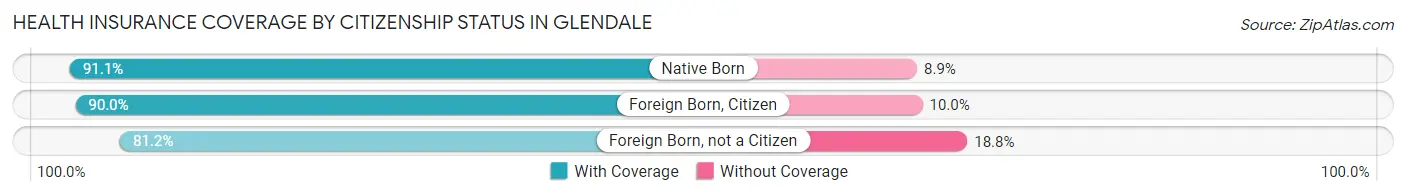
| Citizenship Status | With Coverage | Without Coverage |
| Native Born | 18,716 (91.1%) | 1,831 (8.9%) |
| Foreign Born, Citizen | 41,679 (90.0%) | 4,621 (10.0%) |
| Foreign Born, not a Citizen | 20,738 (81.2%) | 4,792 (18.8%) |
Health Insurance Coverage by Household Income in Glendale
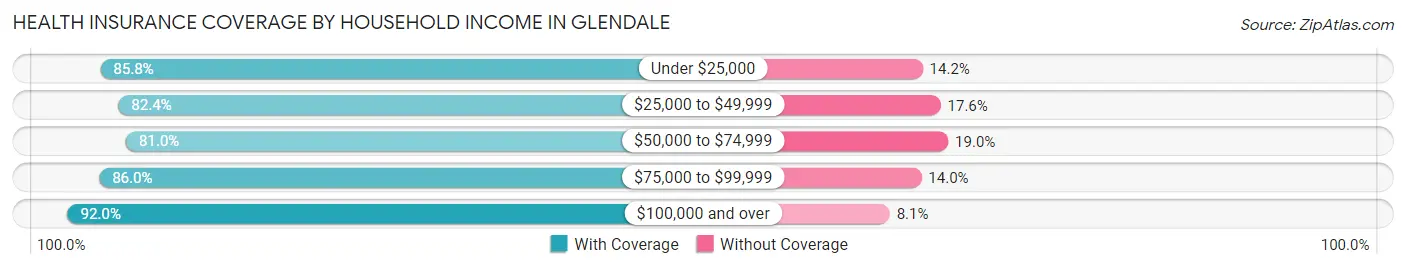
| Household Income | With Coverage | Without Coverage |
| Under $25,000 | 25,873 (85.8%) | 4,286 (14.2%) |
| $25,000 to $49,999 | 33,723 (82.4%) | 7,193 (17.6%) |
| $50,000 to $74,999 | 36,857 (81.0%) | 8,639 (19.0%) |
| $75,000 to $99,999 | 29,034 (86.0%) | 4,718 (14.0%) |
| $100,000 and over | 84,879 (91.9%) | 7,435 (8.1%) |
Public vs Private Health Insurance Coverage by Age in Glendale
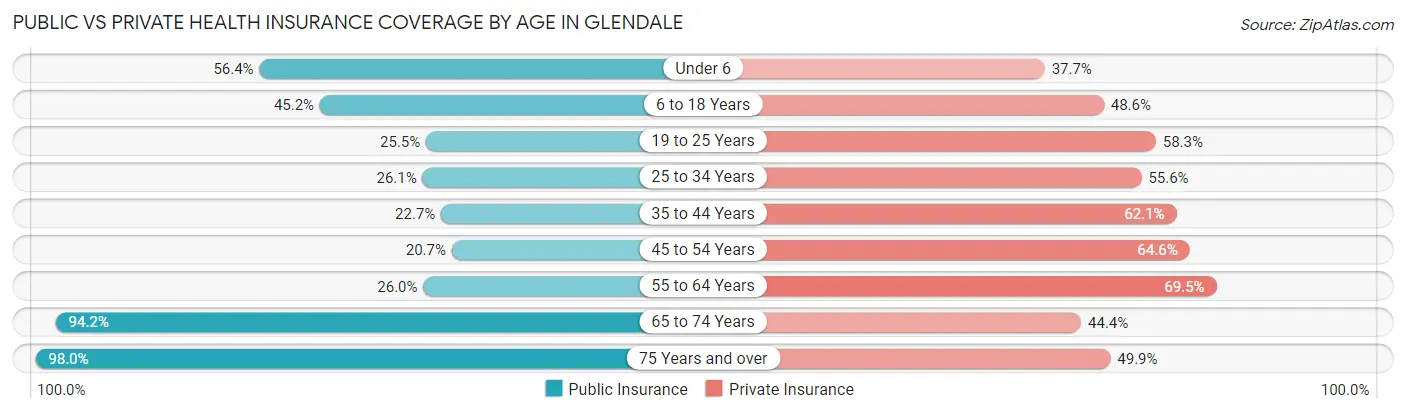
| Age Bracket | Public Insurance | Private Insurance |
| Under 6 | 11,591 (56.4%) | 7,738 (37.7%) |
| 6 to 18 Years | 20,920 (45.2%) | 22,515 (48.6%) |
| 19 to 25 Years | 6,502 (25.5%) | 14,881 (58.3%) |
| 25 to 34 Years | 8,575 (26.1%) | 18,245 (55.6%) |
| 35 to 44 Years | 6,932 (22.7%) | 18,985 (62.1%) |
| 45 to 54 Years | 6,407 (20.7%) | 19,969 (64.5%) |
| 55 to 64 Years | 7,140 (26.0%) | 19,110 (69.5%) |
| 65 to 74 Years | 17,102 (94.2%) | 8,061 (44.4%) |
| 75 Years and over | 12,467 (98.0%) | 6,342 (49.8%) |
| Total | 97,636 (39.9%) | 135,846 (55.4%) |
Disability Status by Sex by Age in Glendale
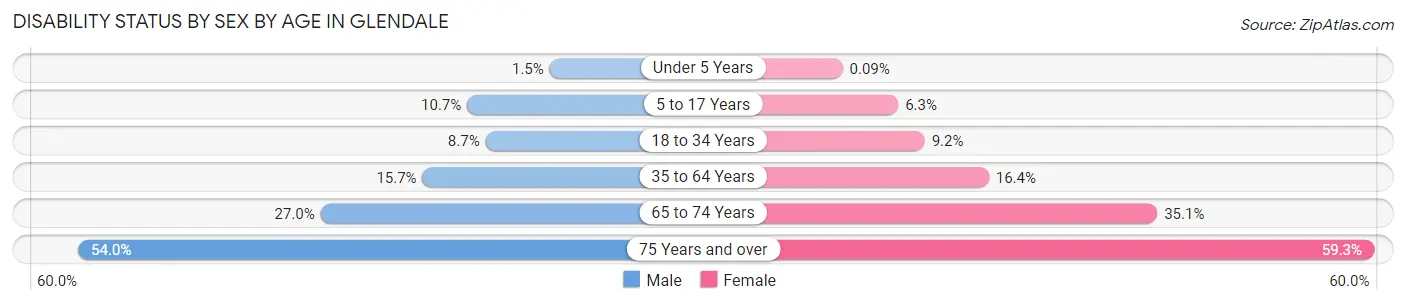
| Age Bracket | Male | Female |
| Under 5 Years | 131 (1.5%) | 8 (0.1%) |
| 5 to 17 Years | 2,565 (10.7%) | 1,354 (6.3%) |
| 18 to 34 Years | 2,674 (8.7%) | 2,932 (9.2%) |
| 35 to 64 Years | 6,871 (15.7%) | 7,399 (16.4%) |
| 65 to 74 Years | 2,215 (27.0%) | 3,497 (35.1%) |
| 75 Years and over | 2,613 (54.0%) | 4,673 (59.3%) |
Disability Class by Sex by Age in Glendale
Disability Class: Hearing Difficulty
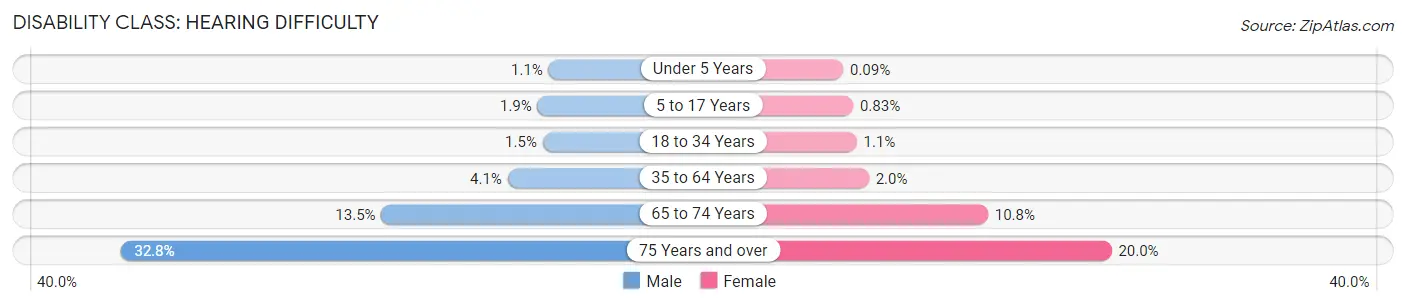
| Age Bracket | Male | Female |
| Under 5 Years | 93 (1.1%) | 8 (0.1%) |
| 5 to 17 Years | 456 (1.9%) | 180 (0.8%) |
| 18 to 34 Years | 471 (1.5%) | 348 (1.1%) |
| 35 to 64 Years | 1,807 (4.1%) | 902 (2.0%) |
| 65 to 74 Years | 1,107 (13.5%) | 1,079 (10.8%) |
| 75 Years and over | 1,587 (32.8%) | 1,579 (20.0%) |
Disability Class: Vision Difficulty
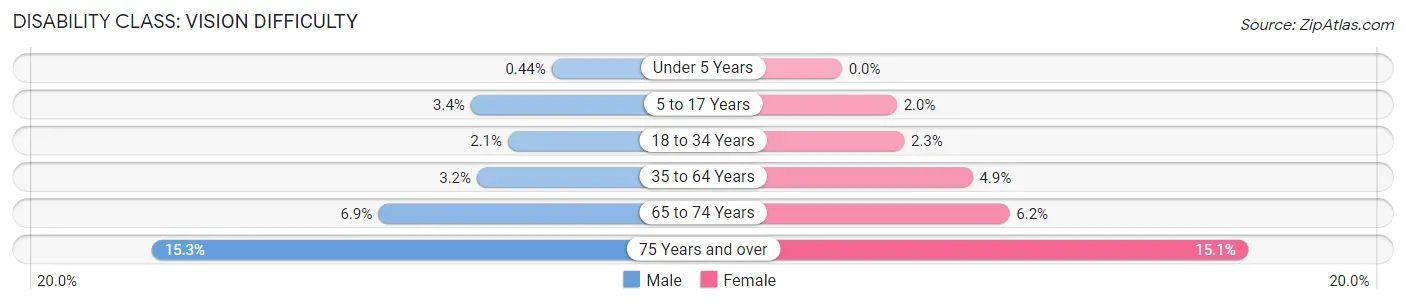
| Age Bracket | Male | Female |
| Under 5 Years | 38 (0.4%) | 0 (0.0%) |
| 5 to 17 Years | 823 (3.4%) | 440 (2.0%) |
| 18 to 34 Years | 636 (2.1%) | 732 (2.3%) |
| 35 to 64 Years | 1,405 (3.2%) | 2,193 (4.9%) |
| 65 to 74 Years | 564 (6.9%) | 619 (6.2%) |
| 75 Years and over | 739 (15.3%) | 1,188 (15.1%) |
Disability Class: Cognitive Difficulty
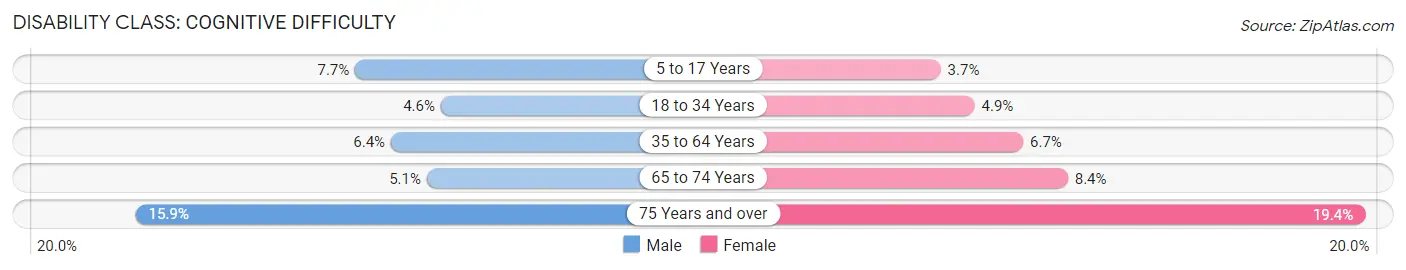
| Age Bracket | Male | Female |
| 5 to 17 Years | 1,848 (7.7%) | 791 (3.7%) |
| 18 to 34 Years | 1,403 (4.5%) | 1,564 (4.9%) |
| 35 to 64 Years | 2,804 (6.4%) | 3,041 (6.7%) |
| 65 to 74 Years | 415 (5.1%) | 835 (8.4%) |
| 75 Years and over | 768 (15.9%) | 1,532 (19.4%) |
Disability Class: Ambulatory Difficulty
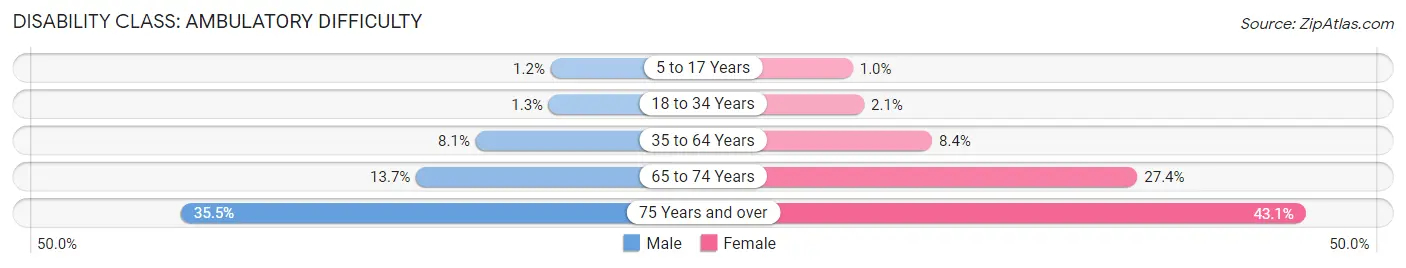
| Age Bracket | Male | Female |
| 5 to 17 Years | 279 (1.2%) | 220 (1.0%) |
| 18 to 34 Years | 413 (1.3%) | 657 (2.1%) |
| 35 to 64 Years | 3,558 (8.1%) | 3,789 (8.4%) |
| 65 to 74 Years | 1,119 (13.7%) | 2,731 (27.4%) |
| 75 Years and over | 1,716 (35.5%) | 3,395 (43.0%) |
Disability Class: Self-Care Difficulty
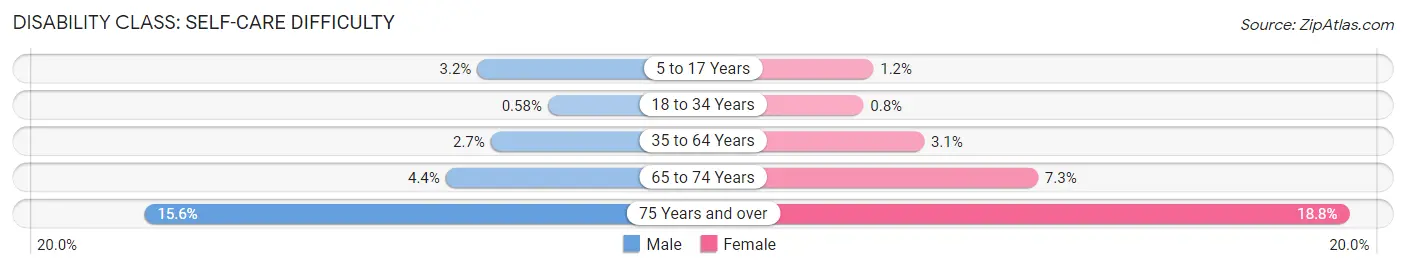
| Age Bracket | Male | Female |
| 5 to 17 Years | 765 (3.2%) | 253 (1.2%) |
| 18 to 34 Years | 180 (0.6%) | 254 (0.8%) |
| 35 to 64 Years | 1,184 (2.7%) | 1,381 (3.0%) |
| 65 to 74 Years | 358 (4.4%) | 725 (7.3%) |
| 75 Years and over | 752 (15.5%) | 1,486 (18.8%) |
Technology Access in Glendale
Computing Device Access in Glendale
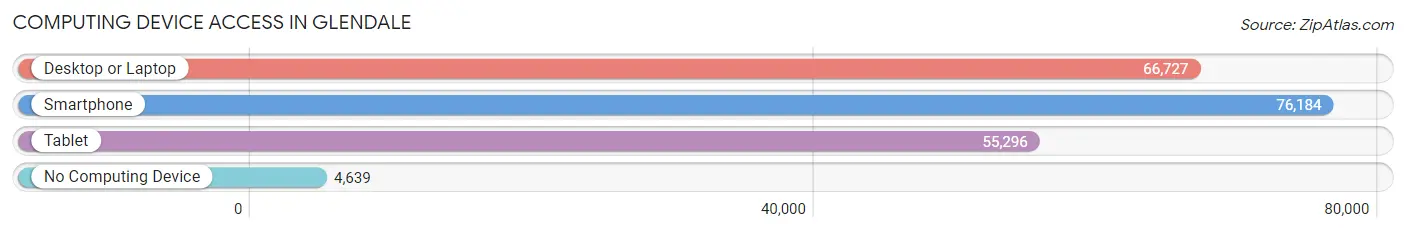
| Device Type | # Households | % Households |
| Desktop or Laptop | 66,727 | 78.1% |
| Smartphone | 76,184 | 89.2% |
| Tablet | 55,296 | 64.8% |
| No Computing Device | 4,639 | 5.4% |
| Total | 85,379 | 100.0% |
Internet Access in Glendale
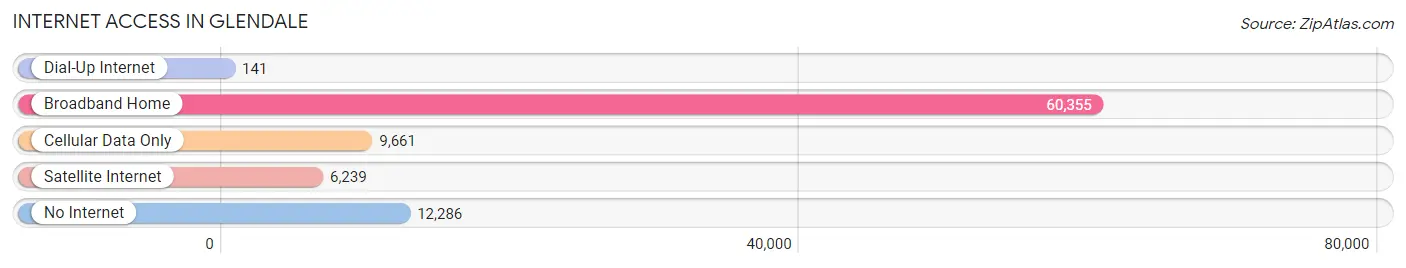
| Internet Type | # Households | % Households |
| Dial-Up Internet | 141 | 0.2% |
| Broadband Home | 60,355 | 70.7% |
| Cellular Data Only | 9,661 | 11.3% |
| Satellite Internet | 6,239 | 7.3% |
| No Internet | 12,286 | 14.4% |
| Total | 85,379 | 100.0% |
Glendale Summary
Glendale, Arizona is a city located in Maricopa County, Arizona, United States. It is a suburb of Phoenix and is the fifth-largest city in the state. The city is located in the northwestern part of the Phoenix metropolitan area, approximately nine miles northwest of downtown Phoenix. As of the 2010 census, the population of Glendale was 226,721, making it the third-largest city in Arizona.
Geography
Glendale is located in the northwestern part of Maricopa County, Arizona, approximately nine miles northwest of downtown Phoenix. The city is bordered by the cities of Peoria to the west, Phoenix to the south, and Surprise to the north. The city is situated in the Sonoran Desert, with an elevation of 1,100 feet above sea level. The city covers an area of approximately 54 square miles, with a population density of 4,092 people per square mile.
Climate
Glendale has a hot desert climate, with hot summers and mild winters. The average high temperature in the summer months is around 100°F, while the average low temperature in the winter months is around 40°F. The city receives an average of 8.5 inches of precipitation per year, with most of the precipitation occurring in the summer months.
Demographics
As of the 2010 census, the population of Glendale was 226,721, making it the third-largest city in Arizona. The racial makeup of the city was 73.3% White, 4.2% African American, 1.3% Native American, 4.2% Asian, 0.2% Pacific Islander, and 16.7% from other races. Hispanic or Latino of any race were 33.2% of the population.
Economy
Glendale is home to a diverse economy, with a variety of industries represented. The city is home to several major employers, including the University of Phoenix, Honeywell, and the Phoenix Coyotes hockey team. The city is also home to a number of retail and entertainment venues, including the Westgate Entertainment District, Tanger Outlets, and the Arrowhead Towne Center.
The city is also home to a number of manufacturing and distribution companies, including Nestle Purina PetCare, Frito-Lay, and the Coca-Cola Company. The city is also home to a number of healthcare providers, including Banner Health, Dignity Health, and the Mayo Clinic.
Conclusion
Glendale, Arizona is a city located in Maricopa County, Arizona, United States. It is a suburb of Phoenix and is the fifth-largest city in the state. The city is located in the northwestern part of the Phoenix metropolitan area, approximately nine miles northwest of downtown Phoenix. As of the 2010 census, the population of Glendale was 226,721, making it the third-largest city in Arizona. The city has a hot desert climate, with hot summers and mild winters. The racial makeup of the city was 73.3% White, 4.2% African American, 1.3% Native American, 4.2% Asian, 0.2% Pacific Islander, and 16.7% from other races. Hispanic or Latino of any race were 33.2% of the population. Glendale is home to a diverse economy, with a variety of industries represented. The city is home to several major employers, including the University of Phoenix, Honeywell, and the Phoenix Coyotes hockey team. The city is also home to a number of retail and entertainment venues, manufacturing and distribution companies, and healthcare providers.
Common Questions
What is Per Capita Income in Glendale?
Per Capita income in Glendale is $30,316.
What is the Median Family Income in Glendale?
Median Family Income in Glendale is $77,602.
What is the Median Household income in Glendale?
Median Household Income in Glendale is $66,375.
What is Income or Wage Gap in Glendale?
Income or Wage Gap in Glendale is 24.8%.
Women in Glendale earn 75.2 cents for every dollar earned by a man.
What is Family Income Deficit in Glendale?
Family Income Deficit in Glendale is $12,025.
Families that are below poverty line in Glendale earn $12,025 less on average than the poverty threshold level.
What is Inequality or Gini Index in Glendale?
Inequality or Gini Index in Glendale is 0.44.
What is the Total Population of Glendale?
Total Population of Glendale is 248,083.
What is the Total Male Population of Glendale?
Total Male Population of Glendale is 122,156.
What is the Total Female Population of Glendale?
Total Female Population of Glendale is 125,927.
What is the Ratio of Males per 100 Females in Glendale?
There are 97.01 Males per 100 Females in Glendale.
What is the Ratio of Females per 100 Males in Glendale?
There are 103.09 Females per 100 Males in Glendale.
What is the Median Population Age in Glendale?
Median Population Age in Glendale is 34.1 Years.
What is the Average Family Size in Glendale
Average Family Size in Glendale is 3.5 People.
What is the Average Household Size in Glendale
Average Household Size in Glendale is 2.9 People.
How Large is the Labor Force in Glendale?
There are 124,681 People in the Labor Forcein in Glendale.
What is the Percentage of People in the Labor Force in Glendale?
64.7% of People are in the Labor Force in Glendale.
What is the Unemployment Rate in Glendale?
Unemployment Rate in Glendale is 5.7%.