Madera, CA Map & Demographics
Madera Map
Madera Overview
$23,006
PER CAPITA INCOME
$61,323
AVG FAMILY INCOME
$61,626
AVG HOUSEHOLD INCOME
22.1%
WAGE / INCOME GAP [ % ]
77.9¢/ $1
WAGE / INCOME GAP [ $ ]
$10,876
FAMILY INCOME DEFICIT
0.47
INEQUALITY / GINI INDEX
66,784
TOTAL POPULATION
32,627
MALE POPULATION
34,157
FEMALE POPULATION
95.52
MALES / 100 FEMALES
104.69
FEMALES / 100 MALES
29.2
MEDIAN AGE
4.2
AVG FAMILY SIZE
3.9
AVG HOUSEHOLD SIZE
30,288
LABOR FORCE [ PEOPLE ]
63.3%
PERCENT IN LABOR FORCE
12.8%
UNEMPLOYMENT RATE
Madera Area Codes
Income in Madera
Income Overview in Madera
Per Capita Income in Madera is $23,006, while median incomes of families and households are $61,323 and $61,626 respectively.
| Characteristic | Number | Measure |
| Per Capita Income | 66,784 | $23,006 |
| Median Family Income | 13,743 | $61,323 |
| Mean Family Income | 13,743 | $85,649 |
| Median Household Income | 16,871 | $61,626 |
| Mean Household Income | 16,871 | $83,001 |
| Income Deficit | 13,743 | $10,876 |
| Wage / Income Gap (%) | 66,784 | 22.06% |
| Wage / Income Gap ($) | 66,784 | 77.94¢ per $1 |
| Gini / Inequality Index | 66,784 | 0.47 |
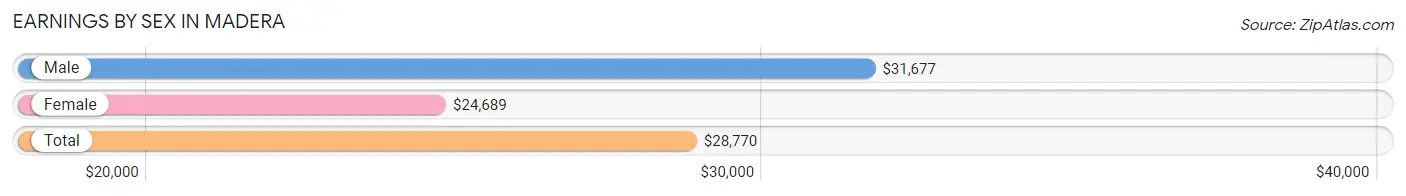
Earnings by Sex in Madera
Average Earnings in Madera are $28,770, $31,677 for men and $24,689 for women, a difference of 22.1%.
| Sex | Number | Average Earnings |
| Male | 16,399 (55.1%) | $31,677 |
| Female | 13,362 (44.9%) | $24,689 |
| Total | 29,761 (100.0%) | $28,770 |
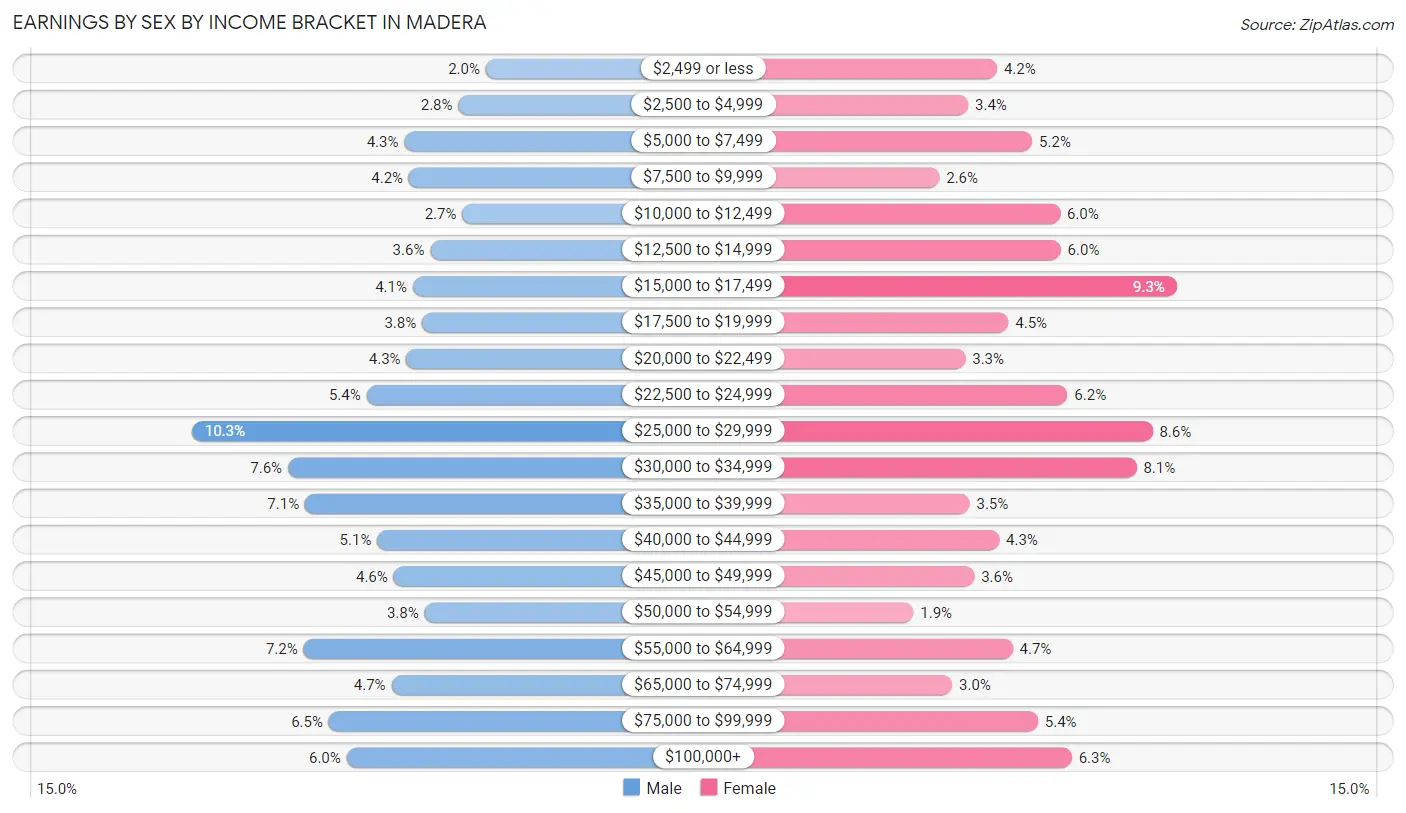
Earnings by Sex by Income Bracket in Madera
The most common earnings brackets in Madera are $25,000 to $29,999 for men (1,689 | 10.3%) and $15,000 to $17,499 for women (1,238 | 9.3%).
| Income | Male | Female |
| $2,499 or less | 334 (2.0%) | 564 (4.2%) |
| $2,500 to $4,999 | 460 (2.8%) | 455 (3.4%) |
| $5,000 to $7,499 | 710 (4.3%) | 696 (5.2%) |
| $7,500 to $9,999 | 688 (4.2%) | 348 (2.6%) |
| $10,000 to $12,499 | 442 (2.7%) | 800 (6.0%) |
| $12,500 to $14,999 | 591 (3.6%) | 803 (6.0%) |
| $15,000 to $17,499 | 670 (4.1%) | 1,238 (9.3%) |
| $17,500 to $19,999 | 628 (3.8%) | 606 (4.5%) |
| $20,000 to $22,499 | 701 (4.3%) | 445 (3.3%) |
| $22,500 to $24,999 | 884 (5.4%) | 829 (6.2%) |
| $25,000 to $29,999 | 1,689 (10.3%) | 1,148 (8.6%) |
| $30,000 to $34,999 | 1,247 (7.6%) | 1,087 (8.1%) |
| $35,000 to $39,999 | 1,168 (7.1%) | 461 (3.5%) |
| $40,000 to $44,999 | 835 (5.1%) | 572 (4.3%) |
| $45,000 to $49,999 | 759 (4.6%) | 479 (3.6%) |
| $50,000 to $54,999 | 616 (3.8%) | 250 (1.9%) |
| $55,000 to $64,999 | 1,174 (7.2%) | 623 (4.7%) |
| $65,000 to $74,999 | 769 (4.7%) | 395 (3.0%) |
| $75,000 to $99,999 | 1,058 (6.5%) | 718 (5.4%) |
| $100,000+ | 976 (5.9%) | 845 (6.3%) |
| Total | 16,399 (100.0%) | 13,362 (100.0%) |
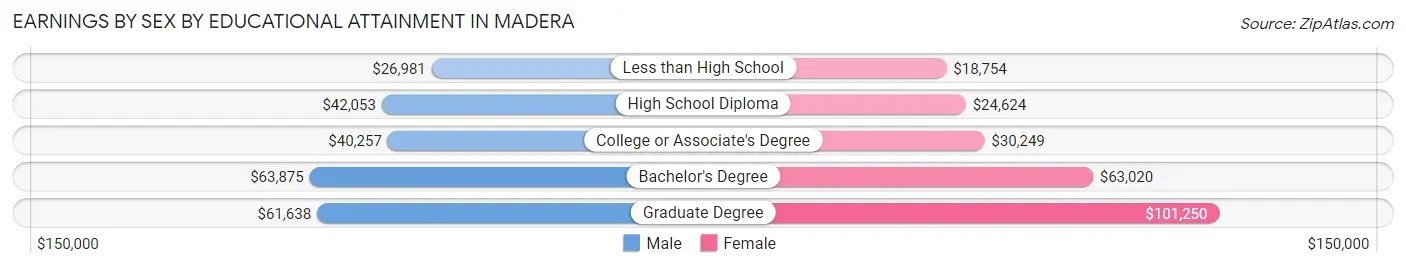
Earnings by Sex by Educational Attainment in Madera
Average earnings in Madera are $34,761 for men and $28,824 for women, a difference of 17.1%. Men with an educational attainment of bachelor's degree enjoy the highest average annual earnings of $63,875, while those with less than high school education earn the least with $26,981. Women with an educational attainment of graduate degree earn the most with the average annual earnings of $101,250, while those with less than high school education have the smallest earnings of $18,754.
| Educational Attainment | Male Income | Female Income |
| Less than High School | $26,981 | $18,754 |
| High School Diploma | $42,053 | $24,624 |
| College or Associate's Degree | $40,257 | $30,249 |
| Bachelor's Degree | $63,875 | $63,020 |
| Graduate Degree | $61,638 | $101,250 |
| Total | $34,761 | $28,824 |
Family Income in Madera
Family Income Brackets in Madera
According to the Madera family income data, there are 2,171 families falling into the $75,000 to $99,999 income range, which is the most common income bracket and makes up 15.8% of all families. Conversely, the $10,000 to $14,999 income bracket is the least frequent group with only 275 families (2.0%) belonging to this category.
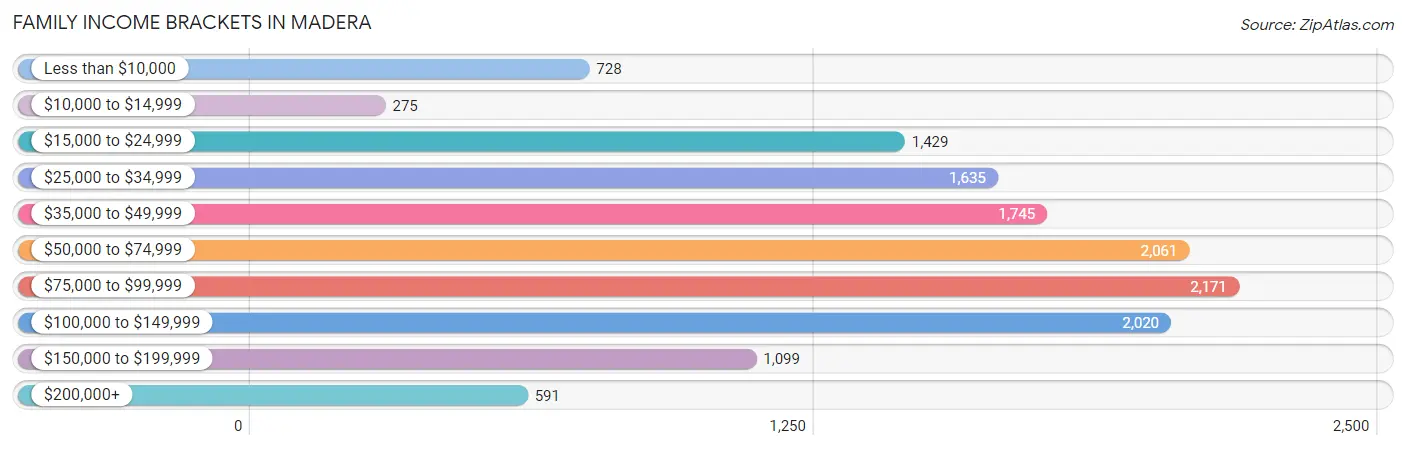
| Income Bracket | # Families | % Families |
| Less than $10,000 | 728 | 5.3% |
| $10,000 to $14,999 | 275 | 2.0% |
| $15,000 to $24,999 | 1,429 | 10.4% |
| $25,000 to $34,999 | 1,635 | 11.9% |
| $35,000 to $49,999 | 1,745 | 12.7% |
| $50,000 to $74,999 | 2,061 | 15.0% |
| $75,000 to $99,999 | 2,171 | 15.8% |
| $100,000 to $149,999 | 2,020 | 14.7% |
| $150,000 to $199,999 | 1,099 | 8.0% |
| $200,000+ | 591 | 4.3% |
Family Income by Famaliy Size in Madera
4-person families (2,931 | 21.3%) account for the highest median family income in Madera with $76,322 per family, while 2-person families (3,243 | 23.6%) have the highest median income of $32,895 per family member.
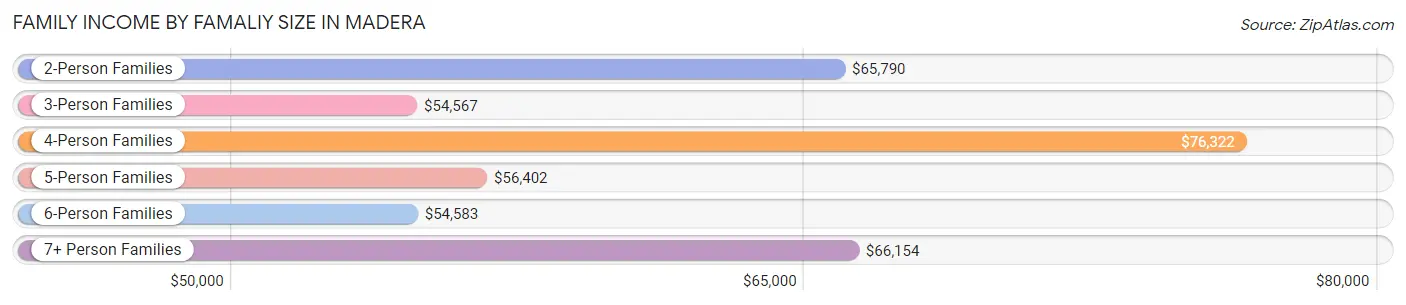
| Income Bracket | # Families | Median Income |
| 2-Person Families | 3,243 (23.6%) | $65,790 |
| 3-Person Families | 3,342 (24.3%) | $54,567 |
| 4-Person Families | 2,931 (21.3%) | $76,322 |
| 5-Person Families | 1,970 (14.3%) | $56,402 |
| 6-Person Families | 1,315 (9.6%) | $54,583 |
| 7+ Person Families | 942 (6.9%) | $66,154 |
| Total | 13,743 (100.0%) | $61,323 |
Family Income by Number of Earners in Madera
The median family income in Madera is $61,323, with families comprising 3+ earners (2,321) having the highest median family income of $107,691, while families with no earners (1,491) have the lowest median family income of $30,793, accounting for 16.9% and 10.8% of families, respectively.
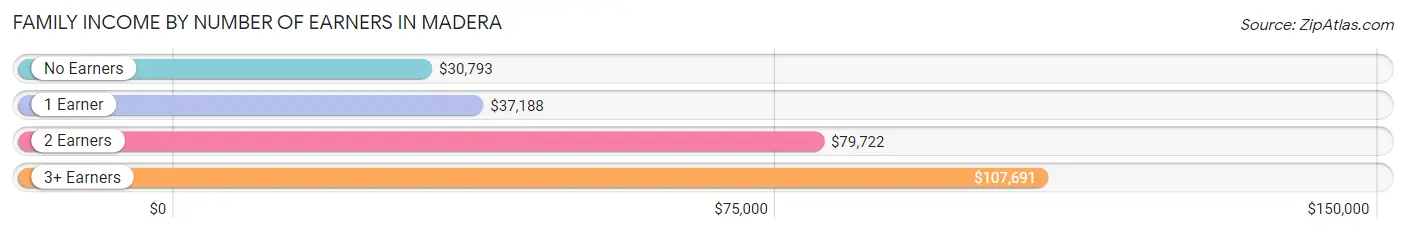
| Number of Earners | # Families | Median Income |
| No Earners | 1,491 (10.8%) | $30,793 |
| 1 Earner | 5,424 (39.5%) | $37,188 |
| 2 Earners | 4,507 (32.8%) | $79,722 |
| 3+ Earners | 2,321 (16.9%) | $107,691 |
| Total | 13,743 (100.0%) | $61,323 |
Household Income in Madera
Household Income Brackets in Madera
With 2,750 households falling in the category, the $50,000 to $74,999 income range is the most frequent in Madera, accounting for 16.3% of all households. In contrast, only 590 households (3.5%) fall into the $10,000 to $14,999 income bracket, making it the least populous group.
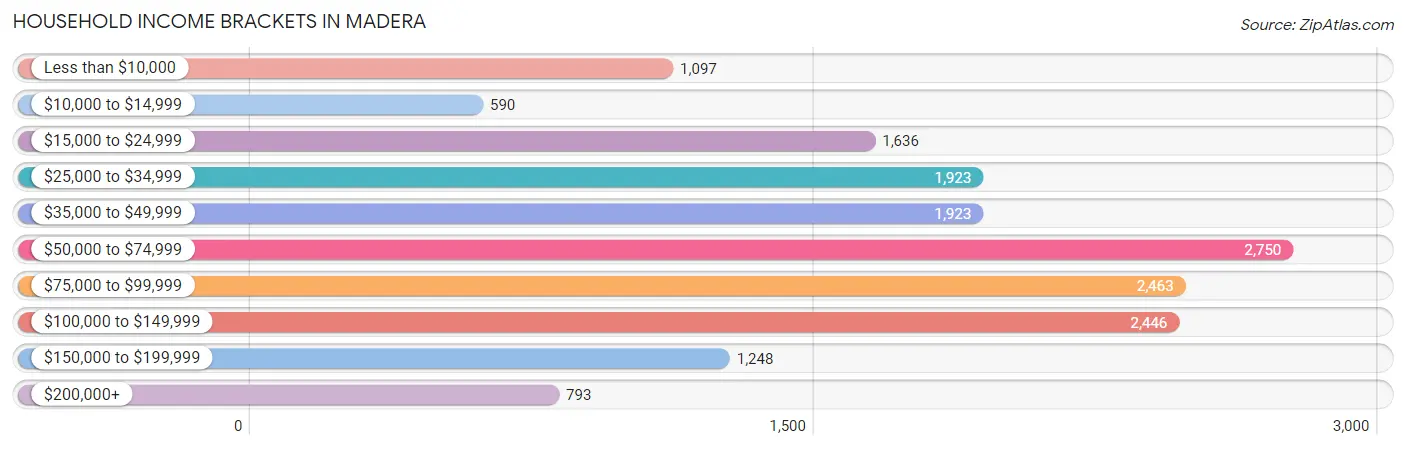
| Income Bracket | # Households | % Households |
| Less than $10,000 | 1,097 | 6.5% |
| $10,000 to $14,999 | 590 | 3.5% |
| $15,000 to $24,999 | 1,636 | 9.7% |
| $25,000 to $34,999 | 1,923 | 11.4% |
| $35,000 to $49,999 | 1,923 | 11.4% |
| $50,000 to $74,999 | 2,750 | 16.3% |
| $75,000 to $99,999 | 2,463 | 14.6% |
| $100,000 to $149,999 | 2,446 | 14.5% |
| $150,000 to $199,999 | 1,248 | 7.4% |
| $200,000+ | 793 | 4.7% |
Household Income by Householder Age in Madera
The median household income in Madera is $61,626, with the highest median household income of $69,939 found in the 45 to 64 years age bracket for the primary householder. A total of 6,597 households (39.1%) fall into this category. Meanwhile, the 65+ years age bracket for the primary householder has the lowest median household income of $37,219, with 2,859 households (17.0%) in this group.
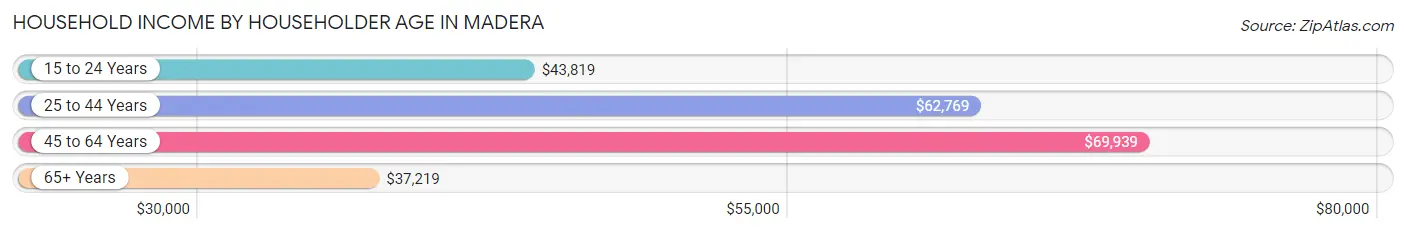
| Income Bracket | # Households | Median Income |
| 15 to 24 Years | 321 (1.9%) | $43,819 |
| 25 to 44 Years | 7,094 (42.0%) | $62,769 |
| 45 to 64 Years | 6,597 (39.1%) | $69,939 |
| 65+ Years | 2,859 (17.0%) | $37,219 |
| Total | 16,871 (100.0%) | $61,626 |
Poverty in Madera
Income Below Poverty by Sex and Age in Madera
With 26.4% poverty level for males and 29.0% for females among the residents of Madera, 15 year old males and 16 and 17 year old females are the most vulnerable to poverty, with 285 males (46.9%) and 686 females (54.9%) in their respective age groups living below the poverty level.
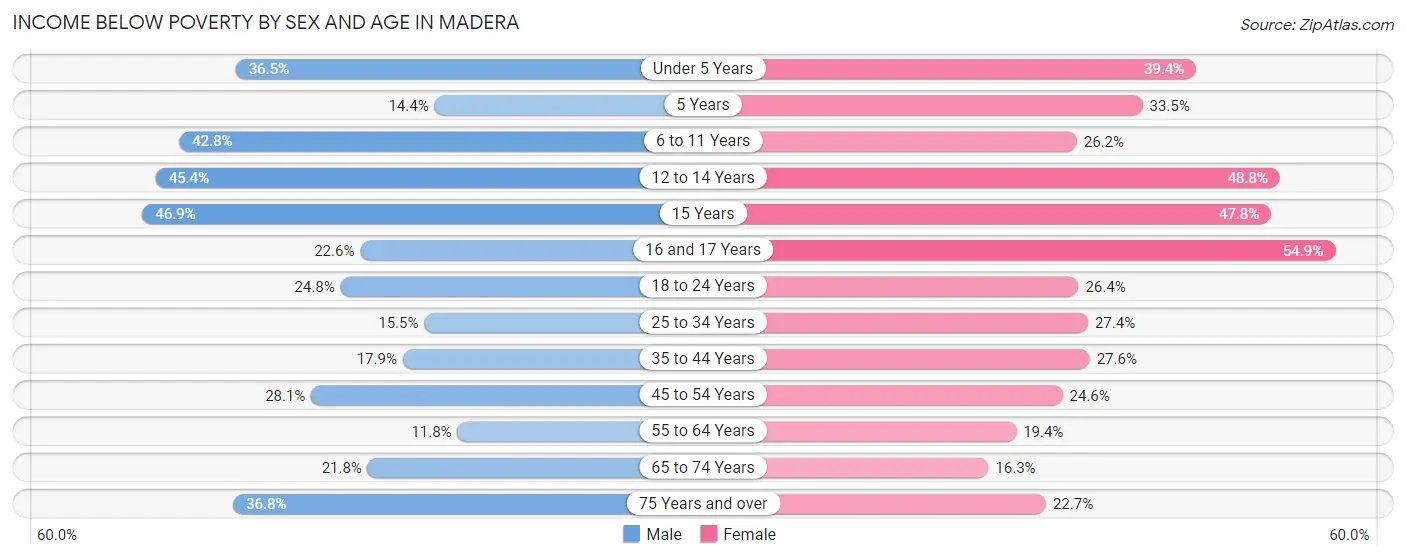
| Age Bracket | Male | Female |
| Under 5 Years | 1,017 (36.5%) | 921 (39.4%) |
| 5 Years | 61 (14.3%) | 288 (33.5%) |
| 6 to 11 Years | 1,493 (42.8%) | 1,084 (26.2%) |
| 12 to 14 Years | 777 (45.4%) | 912 (48.8%) |
| 15 Years | 285 (46.9%) | 239 (47.8%) |
| 16 and 17 Years | 302 (22.6%) | 686 (54.9%) |
| 18 to 24 Years | 881 (24.8%) | 991 (26.4%) |
| 25 to 34 Years | 793 (15.5%) | 1,291 (27.4%) |
| 35 to 44 Years | 726 (17.9%) | 1,321 (27.6%) |
| 45 to 54 Years | 1,110 (28.1%) | 938 (24.6%) |
| 55 to 64 Years | 300 (11.8%) | 512 (19.4%) |
| 65 to 74 Years | 299 (21.8%) | 262 (16.3%) |
| 75 Years and over | 399 (36.8%) | 363 (22.7%) |
| Total | 8,443 (26.4%) | 9,808 (29.0%) |
Income Above Poverty by Sex and Age in Madera
According to the poverty statistics in Madera, males aged 55 to 64 years and females aged 65 to 74 years are the age groups that are most secure financially, with 88.2% of males and 83.7% of females in these age groups living above the poverty line.
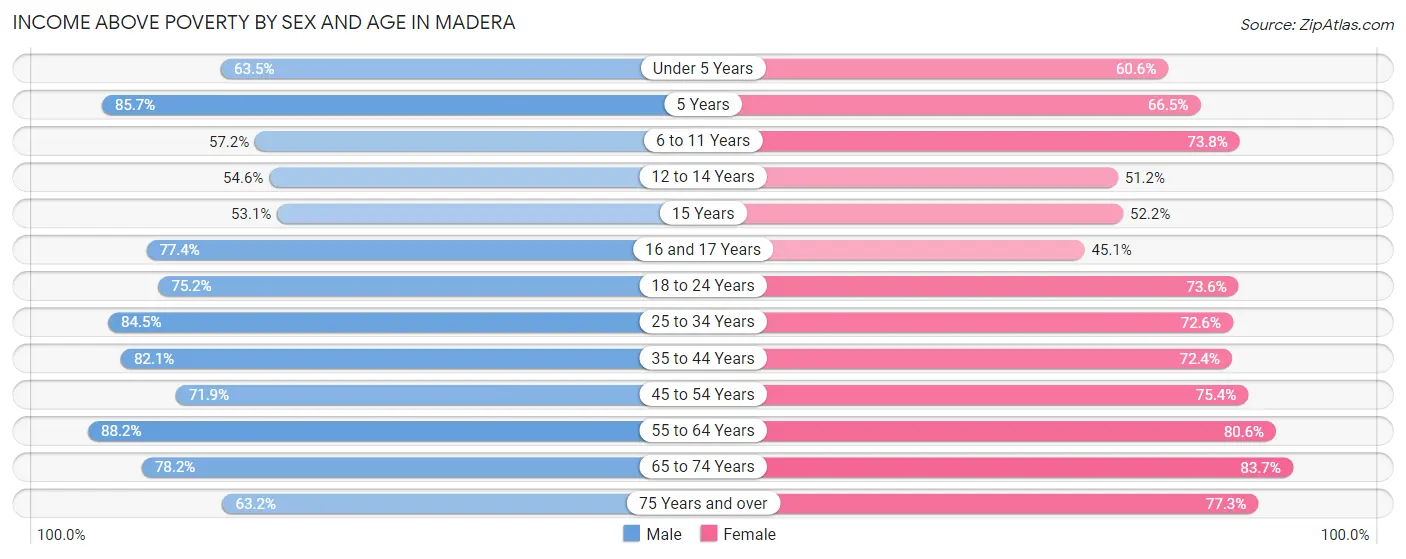
| Age Bracket | Male | Female |
| Under 5 Years | 1,771 (63.5%) | 1,414 (60.6%) |
| 5 Years | 364 (85.7%) | 572 (66.5%) |
| 6 to 11 Years | 1,997 (57.2%) | 3,058 (73.8%) |
| 12 to 14 Years | 935 (54.6%) | 958 (51.2%) |
| 15 Years | 323 (53.1%) | 261 (52.2%) |
| 16 and 17 Years | 1,033 (77.4%) | 563 (45.1%) |
| 18 to 24 Years | 2,669 (75.2%) | 2,768 (73.6%) |
| 25 to 34 Years | 4,325 (84.5%) | 3,418 (72.6%) |
| 35 to 44 Years | 3,331 (82.1%) | 3,463 (72.4%) |
| 45 to 54 Years | 2,843 (71.9%) | 2,876 (75.4%) |
| 55 to 64 Years | 2,242 (88.2%) | 2,124 (80.6%) |
| 65 to 74 Years | 1,073 (78.2%) | 1,342 (83.7%) |
| 75 Years and over | 686 (63.2%) | 1,233 (77.3%) |
| Total | 23,592 (73.6%) | 24,050 (71.0%) |
Income Below Poverty Among Married-Couple Families in Madera
The poverty statistics for married-couple families in Madera show that 17.9% or 1,461 of the total 8,138 families live below the poverty line. Families with 3 or 4 children have the highest poverty rate of 45.6%, comprising of 756 families. On the other hand, families with no children have the lowest poverty rate of 8.7%, which includes 270 families.
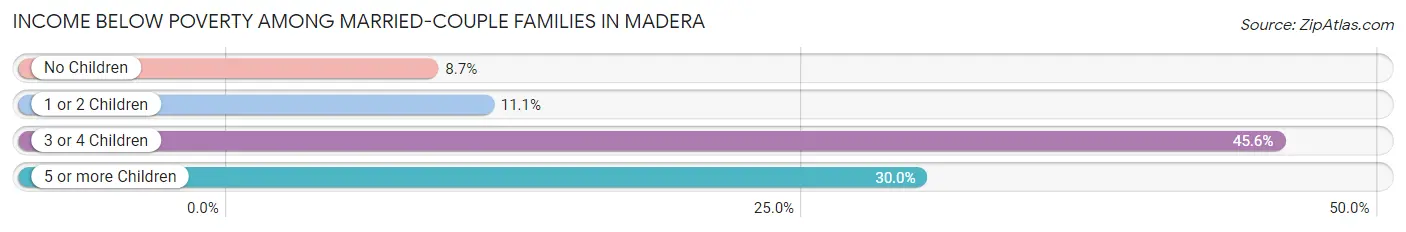
| Children | Above Poverty | Below Poverty |
| No Children | 2,826 (91.3%) | 270 (8.7%) |
| 1 or 2 Children | 2,731 (88.9%) | 342 (11.1%) |
| 3 or 4 Children | 903 (54.4%) | 756 (45.6%) |
| 5 or more Children | 217 (70.0%) | 93 (30.0%) |
| Total | 6,677 (82.1%) | 1,461 (17.9%) |
Income Below Poverty Among Single-Parent Households in Madera
According to the poverty data in Madera, 31.5% or 595 single-father households and 31.7% or 1,178 single-mother households are living below the poverty line. Among single-father households, those with 3 or 4 children have the highest poverty rate, with 259 households (64.4%) experiencing poverty. Likewise, among single-mother households, those with 3 or 4 children have the highest poverty rate, with 359 households (48.0%) falling below the poverty line.
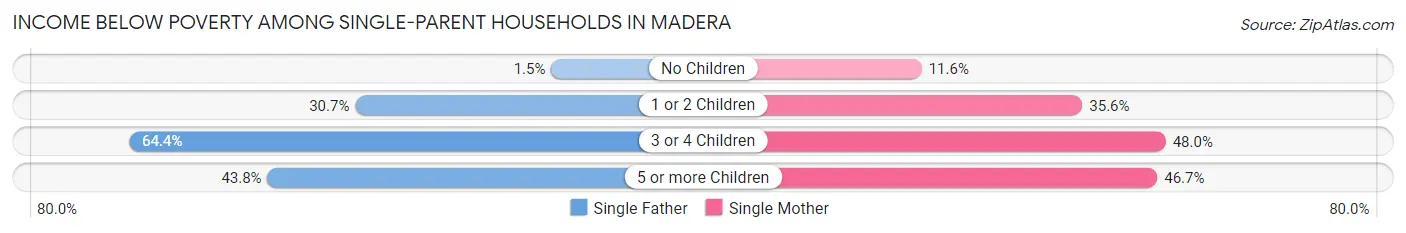
| Children | Single Father | Single Mother |
| No Children | 7 (1.5%) | 120 (11.6%) |
| 1 or 2 Children | 283 (30.7%) | 656 (35.6%) |
| 3 or 4 Children | 259 (64.4%) | 359 (48.0%) |
| 5 or more Children | 46 (43.8%) | 43 (46.7%) |
| Total | 595 (31.5%) | 1,178 (31.7%) |
Income Below Poverty Among Married-Couple vs Single-Parent Households in Madera
The poverty data for Madera shows that 1,461 of the married-couple family households (17.9%) and 1,773 of the single-parent households (31.6%) are living below the poverty level. Within the married-couple family households, those with 3 or 4 children have the highest poverty rate, with 756 households (45.6%) falling below the poverty line. Among the single-parent households, those with 3 or 4 children have the highest poverty rate, with 618 household (53.7%) living below poverty.
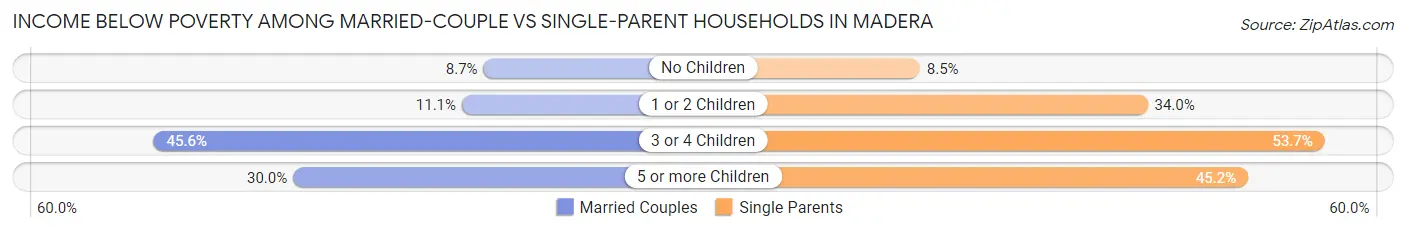
| Children | Married-Couple Families | Single-Parent Households |
| No Children | 270 (8.7%) | 127 (8.5%) |
| 1 or 2 Children | 342 (11.1%) | 939 (34.0%) |
| 3 or 4 Children | 756 (45.6%) | 618 (53.7%) |
| 5 or more Children | 93 (30.0%) | 89 (45.2%) |
| Total | 1,461 (17.9%) | 1,773 (31.6%) |
Race in Madera
The most populous races in Madera are Hispanic or Latino (54,112 | 81.0%), Some other Race (27,745 | 41.5%), and White / Caucasian (23,666 | 35.4%).
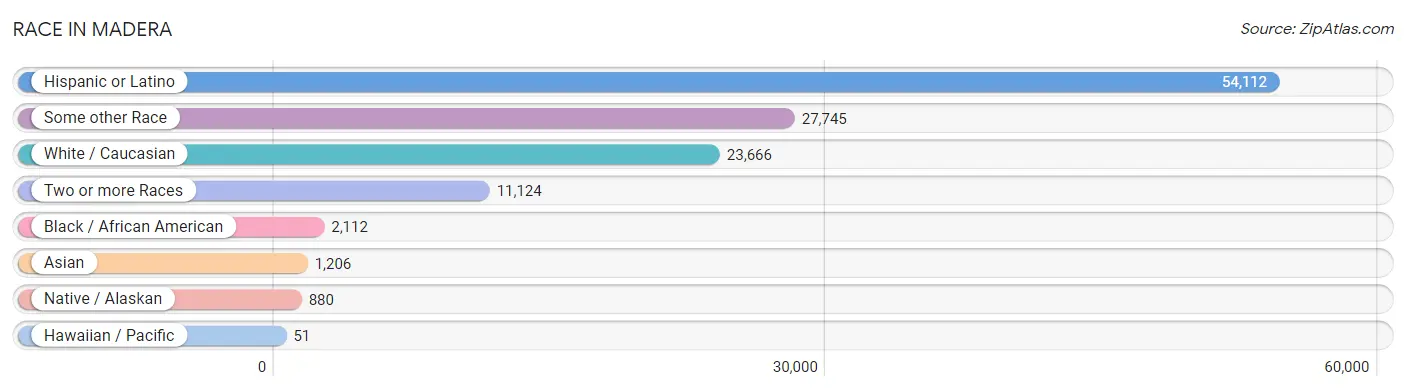
| Race | # Population | % Population |
| Asian | 1,206 | 1.8% |
| Black / African American | 2,112 | 3.2% |
| Hawaiian / Pacific | 51 | 0.1% |
| Hispanic or Latino | 54,112 | 81.0% |
| Native / Alaskan | 880 | 1.3% |
| White / Caucasian | 23,666 | 35.4% |
| Two or more Races | 11,124 | 16.7% |
| Some other Race | 27,745 | 41.5% |
| Total | 66,784 | 100.0% |
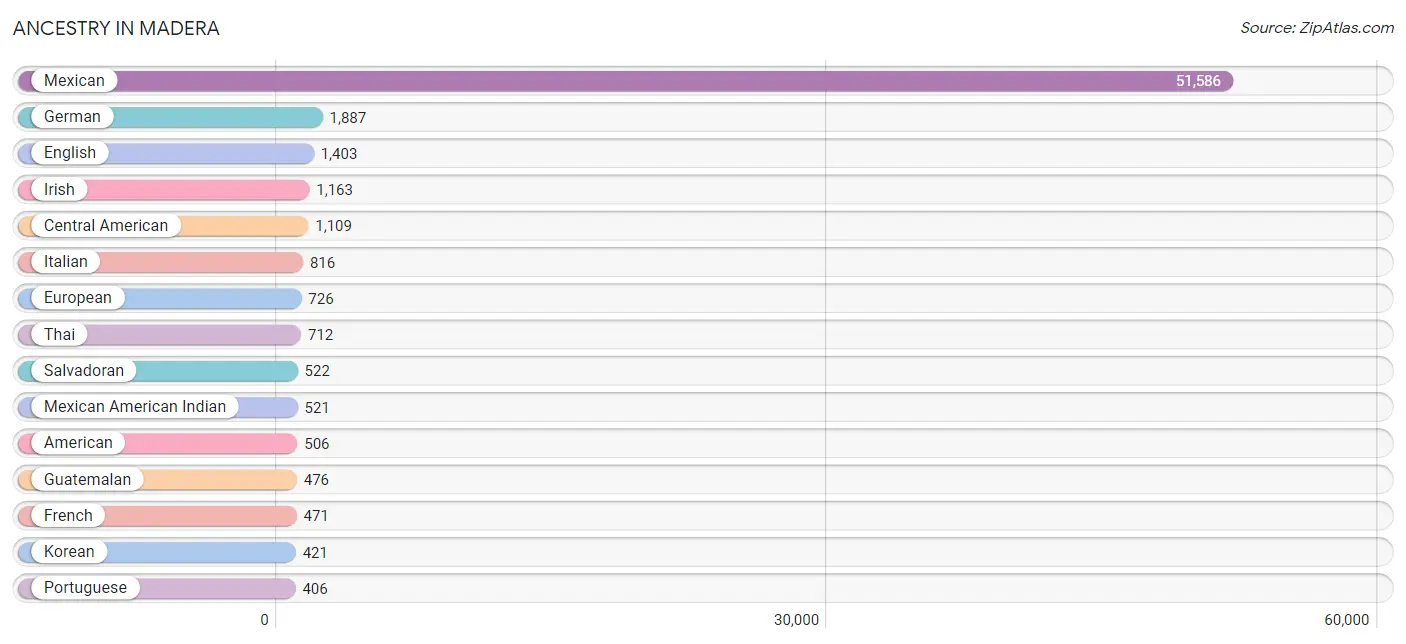
Ancestry in Madera
The most populous ancestries reported in Madera are Mexican (51,586 | 77.2%), German (1,887 | 2.8%), English (1,403 | 2.1%), Irish (1,163 | 1.7%), and Central American (1,109 | 1.7%), together accounting for 85.6% of all Madera residents.
| Ancestry | # Population | % Population |
| African | 258 | 0.4% |
| American | 506 | 0.8% |
| Arab | 271 | 0.4% |
| Armenian | 130 | 0.2% |
| Austrian | 17 | 0.0% |
| Basque | 1 | 0.0% |
| Blackfeet | 202 | 0.3% |
| British | 59 | 0.1% |
| Bulgarian | 7 | 0.0% |
| Canadian | 21 | 0.0% |
| Celtic | 97 | 0.2% |
| Central American | 1,109 | 1.7% |
| Central American Indian | 56 | 0.1% |
| Cherokee | 218 | 0.3% |
| Chilean | 49 | 0.1% |
| Chippewa | 38 | 0.1% |
| Colombian | 202 | 0.3% |
| Costa Rican | 63 | 0.1% |
| Creek | 52 | 0.1% |
| Cuban | 11 | 0.0% |
| Czech | 8 | 0.0% |
| Danish | 11 | 0.0% |
| Dominican | 18 | 0.0% |
| Dutch | 298 | 0.4% |
| English | 1,403 | 2.1% |
| European | 726 | 1.1% |
| Finnish | 8 | 0.0% |
| French | 471 | 0.7% |
| German | 1,887 | 2.8% |
| Greek | 17 | 0.0% |
| Guamanian / Chamorro | 11 | 0.0% |
| Guatemalan | 476 | 0.7% |
| Honduran | 48 | 0.1% |
| Indian (Asian) | 373 | 0.6% |
| Irish | 1,163 | 1.7% |
| Iroquois | 57 | 0.1% |
| Italian | 816 | 1.2% |
| Korean | 421 | 0.6% |
| Lebanese | 74 | 0.1% |
| Lithuanian | 18 | 0.0% |
| Malaysian | 3 | 0.0% |
| Mexican | 51,586 | 77.2% |
| Mexican American Indian | 521 | 0.8% |
| Native Hawaiian | 30 | 0.0% |
| Norwegian | 173 | 0.3% |
| Palestinian | 188 | 0.3% |
| Polish | 45 | 0.1% |
| Portuguese | 406 | 0.6% |
| Puerto Rican | 264 | 0.4% |
| Romanian | 55 | 0.1% |
| Russian | 90 | 0.1% |
| Salvadoran | 522 | 0.8% |
| Samoan | 48 | 0.1% |
| Scotch-Irish | 146 | 0.2% |
| Scottish | 47 | 0.1% |
| Slovene | 59 | 0.1% |
| South American | 251 | 0.4% |
| Spaniard | 88 | 0.1% |
| Spanish | 51 | 0.1% |
| Spanish American Indian | 12 | 0.0% |
| Sri Lankan | 262 | 0.4% |
| Subsaharan African | 258 | 0.4% |
| Swedish | 165 | 0.3% |
| Swiss | 78 | 0.1% |
| Thai | 712 | 1.1% |
| Turkish | 20 | 0.0% |
| Ukrainian | 12 | 0.0% |
| Welsh | 79 | 0.1% |
| Yaqui | 19 | 0.0% |
| Yugoslavian | 16 | 0.0% | View All 70 Rows |
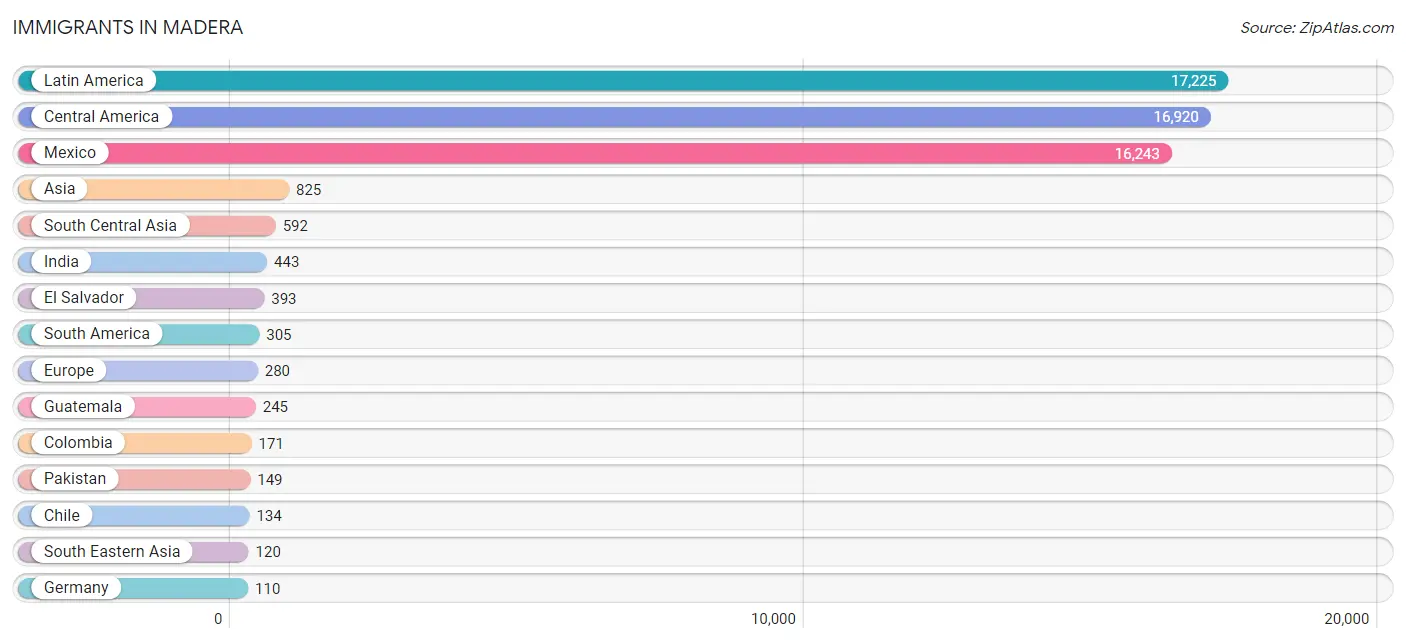
Immigrants in Madera
The most numerous immigrant groups reported in Madera came from Latin America (17,225 | 25.8%), Central America (16,920 | 25.3%), Mexico (16,243 | 24.3%), Asia (825 | 1.2%), and South Central Asia (592 | 0.9%), together accounting for 77.6% of all Madera residents.
| Immigration Origin | # Population | % Population |
| Asia | 825 | 1.2% |
| Azores | 28 | 0.0% |
| Canada | 32 | 0.1% |
| Central America | 16,920 | 25.3% |
| Chile | 134 | 0.2% |
| China | 28 | 0.0% |
| Colombia | 171 | 0.3% |
| Denmark | 11 | 0.0% |
| Eastern Asia | 28 | 0.0% |
| Eastern Europe | 55 | 0.1% |
| El Salvador | 393 | 0.6% |
| Europe | 280 | 0.4% |
| Germany | 110 | 0.2% |
| Greece | 8 | 0.0% |
| Guatemala | 245 | 0.4% |
| Honduras | 39 | 0.1% |
| India | 443 | 0.7% |
| Italy | 35 | 0.1% |
| Jordan | 9 | 0.0% |
| Latin America | 17,225 | 25.8% |
| Lebanon | 24 | 0.0% |
| Lithuania | 12 | 0.0% |
| Mexico | 16,243 | 24.3% |
| Northern Europe | 11 | 0.0% |
| Oceania | 6 | 0.0% |
| Pakistan | 149 | 0.2% |
| Philippines | 60 | 0.1% |
| Portugal | 47 | 0.1% |
| Saudi Arabia | 52 | 0.1% |
| South America | 305 | 0.5% |
| South Central Asia | 592 | 0.9% |
| South Eastern Asia | 120 | 0.2% |
| Southern Europe | 104 | 0.2% |
| Spain | 14 | 0.0% |
| Vietnam | 60 | 0.1% |
| Western Asia | 85 | 0.1% |
| Western Europe | 110 | 0.2% | View All 37 Rows |
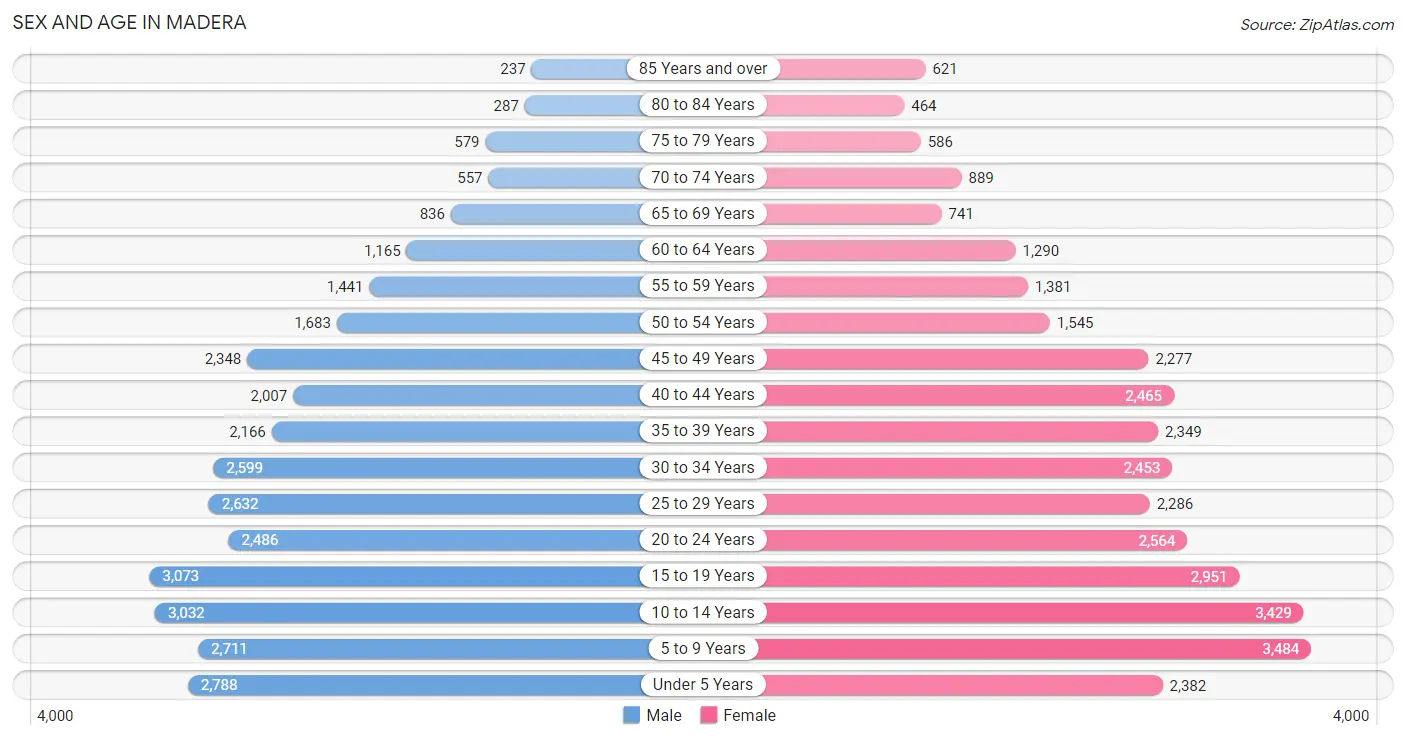
Sex and Age in Madera
Sex and Age in Madera
The most populous age groups in Madera are 15 to 19 Years (3,073 | 9.4%) for men and 5 to 9 Years (3,484 | 10.2%) for women.
| Age Bracket | Male | Female |
| Under 5 Years | 2,788 (8.6%) | 2,382 (7.0%) |
| 5 to 9 Years | 2,711 (8.3%) | 3,484 (10.2%) |
| 10 to 14 Years | 3,032 (9.3%) | 3,429 (10.0%) |
| 15 to 19 Years | 3,073 (9.4%) | 2,951 (8.6%) |
| 20 to 24 Years | 2,486 (7.6%) | 2,564 (7.5%) |
| 25 to 29 Years | 2,632 (8.1%) | 2,286 (6.7%) |
| 30 to 34 Years | 2,599 (8.0%) | 2,453 (7.2%) |
| 35 to 39 Years | 2,166 (6.6%) | 2,349 (6.9%) |
| 40 to 44 Years | 2,007 (6.1%) | 2,465 (7.2%) |
| 45 to 49 Years | 2,348 (7.2%) | 2,277 (6.7%) |
| 50 to 54 Years | 1,683 (5.2%) | 1,545 (4.5%) |
| 55 to 59 Years | 1,441 (4.4%) | 1,381 (4.0%) |
| 60 to 64 Years | 1,165 (3.6%) | 1,290 (3.8%) |
| 65 to 69 Years | 836 (2.6%) | 741 (2.2%) |
| 70 to 74 Years | 557 (1.7%) | 889 (2.6%) |
| 75 to 79 Years | 579 (1.8%) | 586 (1.7%) |
| 80 to 84 Years | 287 (0.9%) | 464 (1.4%) |
| 85 Years and over | 237 (0.7%) | 621 (1.8%) |
| Total | 32,627 (100.0%) | 34,157 (100.0%) |
Families and Households in Madera
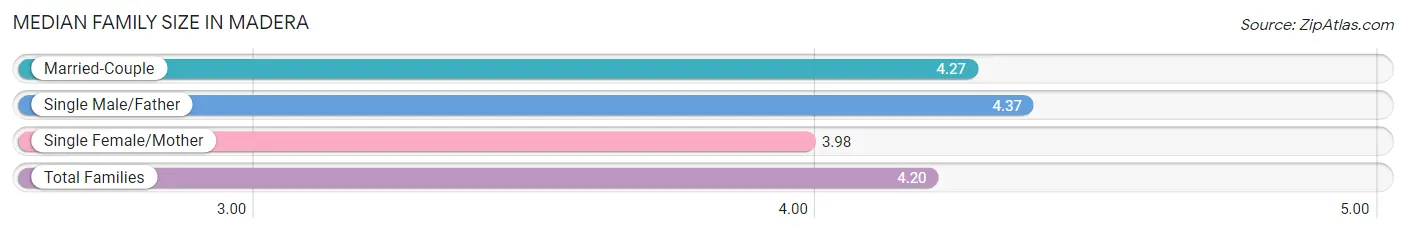
Median Family Size in Madera
The median family size in Madera is 4.20 persons per family, with single male/father families (1,889 | 13.8%) accounting for the largest median family size of 4.37 persons per family. On the other hand, single female/mother families (3,716 | 27.0%) represent the smallest median family size with 3.98 persons per family.
| Family Type | # Families | Family Size |
| Married-Couple | 8,138 (59.2%) | 4.27 |
| Single Male/Father | 1,889 (13.8%) | 4.37 |
| Single Female/Mother | 3,716 (27.0%) | 3.98 |
| Total Families | 13,743 (100.0%) | 4.20 |
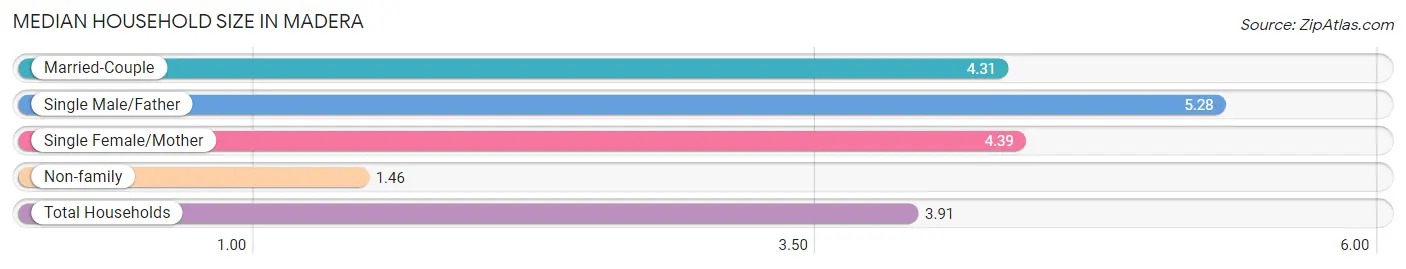
Median Household Size in Madera
The median household size in Madera is 3.91 persons per household, with single male/father households (1,889 | 11.2%) accounting for the largest median household size of 5.28 persons per household. non-family households (3,128 | 18.5%) represent the smallest median household size with 1.46 persons per household.
| Household Type | # Households | Household Size |
| Married-Couple | 8,138 (48.2%) | 4.31 |
| Single Male/Father | 1,889 (11.2%) | 5.28 |
| Single Female/Mother | 3,716 (22.0%) | 4.39 |
| Non-family | 3,128 (18.5%) | 1.46 |
| Total Households | 16,871 (100.0%) | 3.91 |
Household Size by Marriage Status in Madera
Out of a total of 16,871 households in Madera, 13,743 (81.5%) are family households, while 3,128 (18.5%) are nonfamily households. The most numerous type of family households are 4-person households, comprising 3,011, and the most common type of nonfamily households are 1-person households, comprising 2,307.
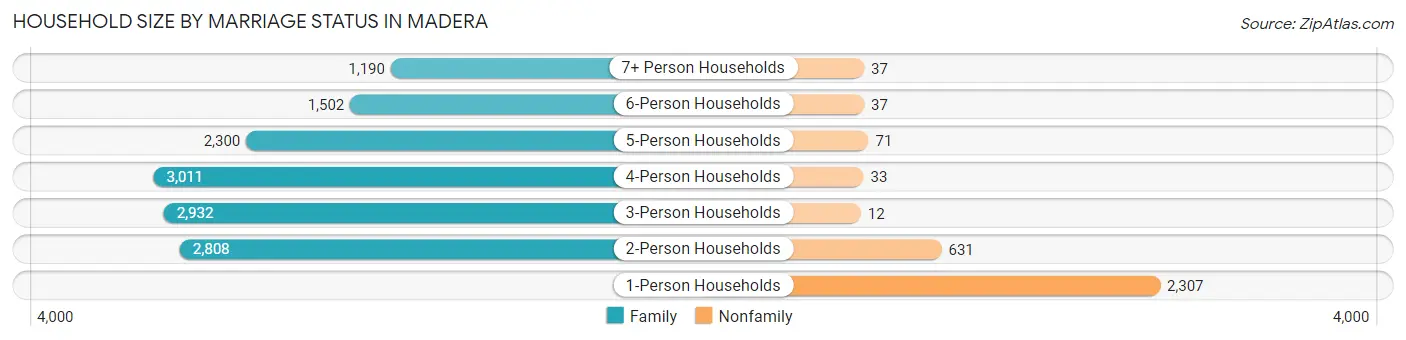
| Household Size | Family Households | Nonfamily Households |
| 1-Person Households | - | 2,307 (13.7%) |
| 2-Person Households | 2,808 (16.6%) | 631 (3.7%) |
| 3-Person Households | 2,932 (17.4%) | 12 (0.1%) |
| 4-Person Households | 3,011 (17.8%) | 33 (0.2%) |
| 5-Person Households | 2,300 (13.6%) | 71 (0.4%) |
| 6-Person Households | 1,502 (8.9%) | 37 (0.2%) |
| 7+ Person Households | 1,190 (7.0%) | 37 (0.2%) |
| Total | 13,743 (81.5%) | 3,128 (18.5%) |
Female Fertility in Madera
Fertility by Age in Madera
Average fertility rate in Madera is 70.0 births per 1,000 women. Women in the age bracket of 20 to 34 years have the highest fertility rate with 126.0 births per 1,000 women. Women in the age bracket of 20 to 34 years acount for 74.1% of all women with births.
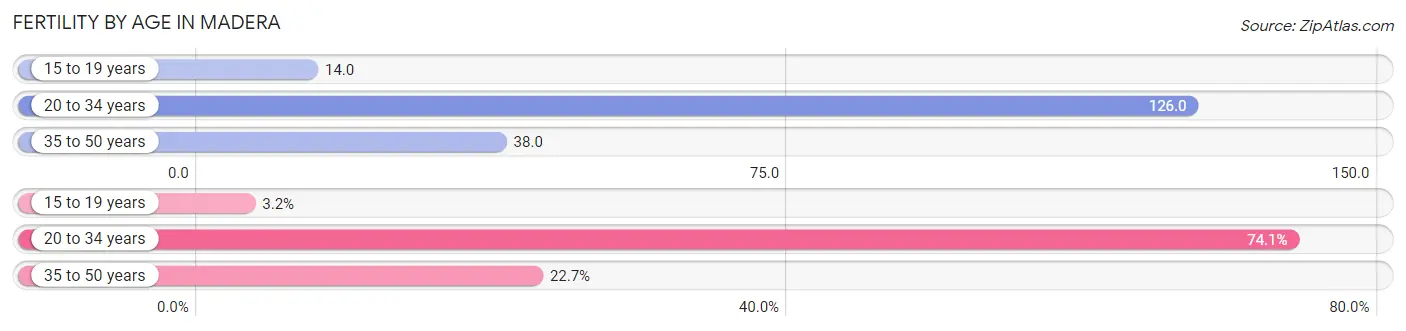
| Age Bracket | Women with Births | Births / 1,000 Women |
| 15 to 19 years | 40 (3.2%) | 14.0 |
| 20 to 34 years | 922 (74.1%) | 126.0 |
| 35 to 50 years | 283 (22.7%) | 38.0 |
| Total | 1,245 (100.0%) | 70.0 |
Fertility by Age by Marriage Status in Madera
61.1% of women with births (1,245) in Madera are married. The highest percentage of unmarried women with births falls into 15 to 19 years age bracket with 100.0% of them unmarried at the time of birth, while the lowest percentage of unmarried women with births belong to 35 to 50 years age bracket with 27.6% of them unmarried.
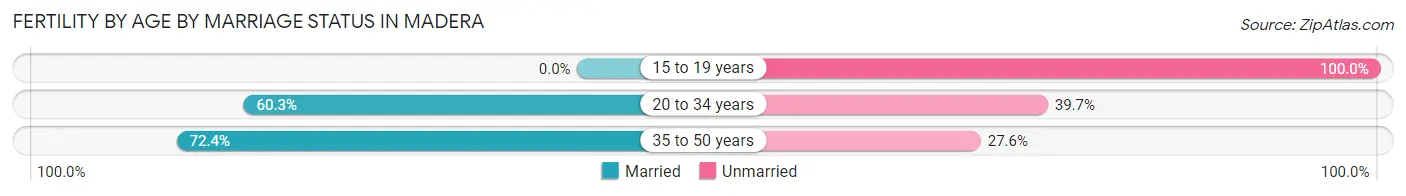
| Age Bracket | Married | Unmarried |
| 15 to 19 years | 0 (0.0%) | 40 (100.0%) |
| 20 to 34 years | 556 (60.3%) | 366 (39.7%) |
| 35 to 50 years | 205 (72.4%) | 78 (27.6%) |
| Total | 761 (61.1%) | 484 (38.9%) |
Fertility by Education in Madera
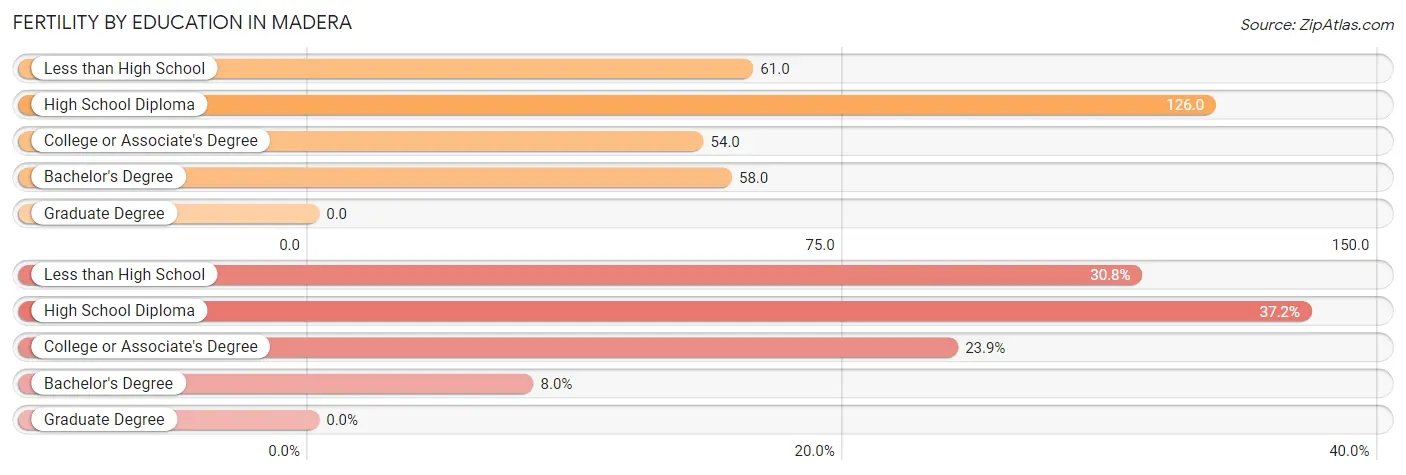
| Educational Attainment | Women with Births | Births / 1,000 Women |
| Less than High School | 384 (30.8%) | 61.0 |
| High School Diploma | 463 (37.2%) | 126.0 |
| College or Associate's Degree | 298 (23.9%) | 54.0 |
| Bachelor's Degree | 100 (8.0%) | 58.0 |
| Graduate Degree | 0 (0.0%) | 0.0 |
| Total | 1,245 (100.0%) | 70.0 |
Fertility by Education by Marriage Status in Madera
38.9% of women with births in Madera are unmarried. Women with the educational attainment of college or associate's degree are most likely to be married with 71.1% of them married at childbirth, while women with the educational attainment of bachelor's degree are least likely to be married with 76.0% of them unmarried at childbirth.
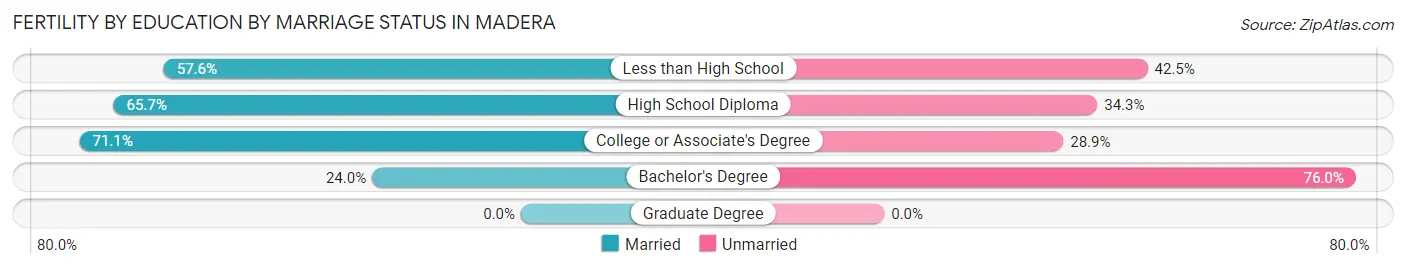
| Educational Attainment | Married | Unmarried |
| Less than High School | 221 (57.6%) | 163 (42.4%) |
| High School Diploma | 304 (65.7%) | 159 (34.3%) |
| College or Associate's Degree | 212 (71.1%) | 86 (28.9%) |
| Bachelor's Degree | 24 (24.0%) | 76 (76.0%) |
| Graduate Degree | 0 (0.0%) | 0 (0.0%) |
| Total | 761 (61.1%) | 484 (38.9%) |
Employment Characteristics in Madera
Employment by Class of Employer in Madera
Among the 25,239 employed individuals in Madera, private company employees (17,963 | 71.2%), local government employees (2,439 | 9.7%), and not-for-profit organizations (1,403 | 5.6%) make up the most common classes of employment.
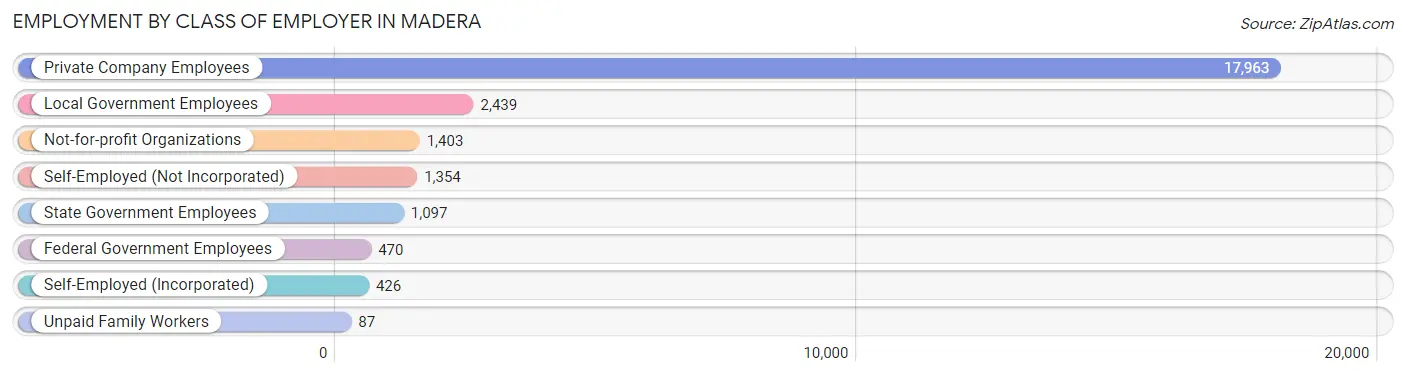
| Employer Class | # Employees | % Employees |
| Private Company Employees | 17,963 | 71.2% |
| Self-Employed (Incorporated) | 426 | 1.7% |
| Self-Employed (Not Incorporated) | 1,354 | 5.4% |
| Not-for-profit Organizations | 1,403 | 5.6% |
| Local Government Employees | 2,439 | 9.7% |
| State Government Employees | 1,097 | 4.3% |
| Federal Government Employees | 470 | 1.9% |
| Unpaid Family Workers | 87 | 0.3% |
| Total | 25,239 | 100.0% |
Employment Status by Age in Madera
According to the labor force statistics for Madera, out of the total population over 16 years of age (47,848), 63.3% or 30,288 individuals are in the labor force, with 12.8% or 3,877 of them unemployed. The age group with the highest labor force participation rate is 35 to 44 years, with 82.3% or 7,396 individuals in the labor force. Within the labor force, the 16 to 19 years age range has the highest percentage of unemployed individuals, with 36.9% or 618 of them being unemployed.
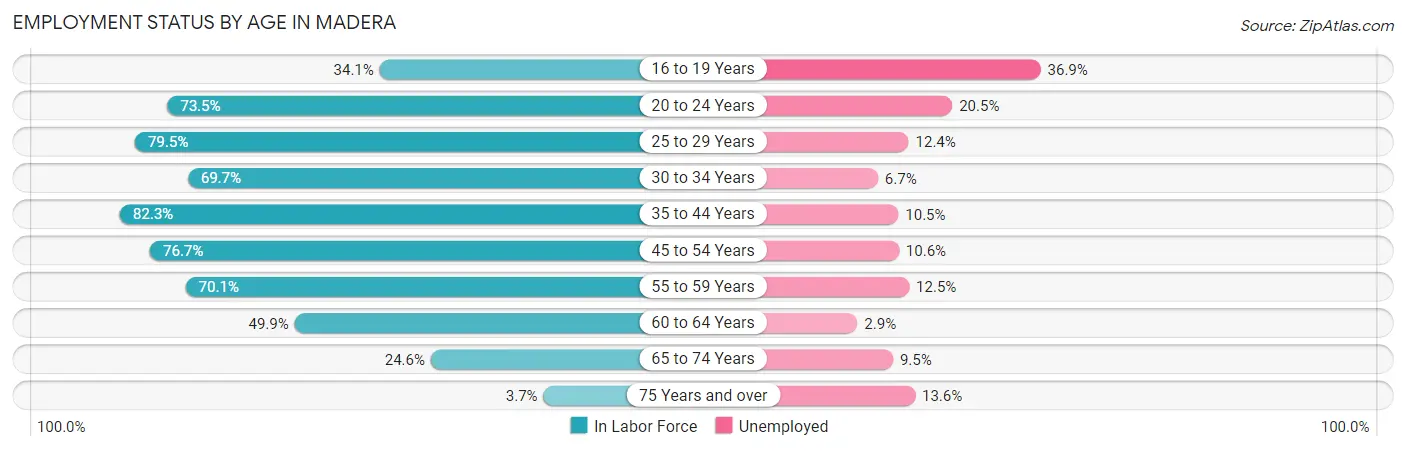
| Age Bracket | In Labor Force | Unemployed |
| 16 to 19 Years | 1,676 (34.1%) | 618 (36.9%) |
| 20 to 24 Years | 3,712 (73.5%) | 761 (20.5%) |
| 25 to 29 Years | 3,910 (79.5%) | 485 (12.4%) |
| 30 to 34 Years | 3,521 (69.7%) | 236 (6.7%) |
| 35 to 44 Years | 7,396 (82.3%) | 777 (10.5%) |
| 45 to 54 Years | 6,023 (76.7%) | 638 (10.6%) |
| 55 to 59 Years | 1,978 (70.1%) | 247 (12.5%) |
| 60 to 64 Years | 1,225 (49.9%) | 36 (2.9%) |
| 65 to 74 Years | 744 (24.6%) | 71 (9.5%) |
| 75 Years and over | 103 (3.7%) | 14 (13.6%) |
| Total | 30,288 (63.3%) | 3,877 (12.8%) |
Employment Status by Educational Attainment in Madera
According to labor force statistics for Madera, 74.9% of individuals (24,033) out of the total population between 25 and 64 years of age (32,087) are in the labor force, with 10.0% or 2,403 of them being unemployed. The group with the highest labor force participation rate are those with the educational attainment of bachelor's degree or higher, with 94.4% or 3,162 individuals in the labor force. Within the labor force, individuals with less than high school education have the highest percentage of unemployment, with 14.6% or 1,302 of them being unemployed.
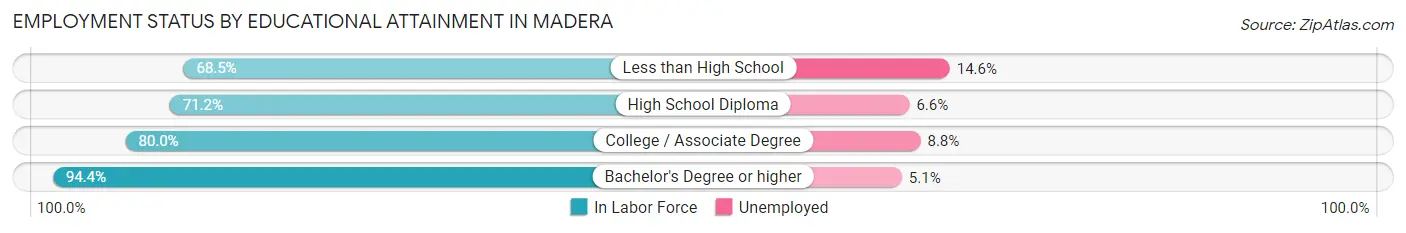
| Educational Attainment | In Labor Force | Unemployed |
| Less than High School | 8,917 (68.5%) | 1,901 (14.6%) |
| High School Diploma | 4,914 (71.2%) | 456 (6.6%) |
| College / Associate Degree | 7,054 (80.0%) | 776 (8.8%) |
| Bachelor's Degree or higher | 3,162 (94.4%) | 171 (5.1%) |
| Total | 24,033 (74.9%) | 3,209 (10.0%) |
Employment Occupations by Sex in Madera
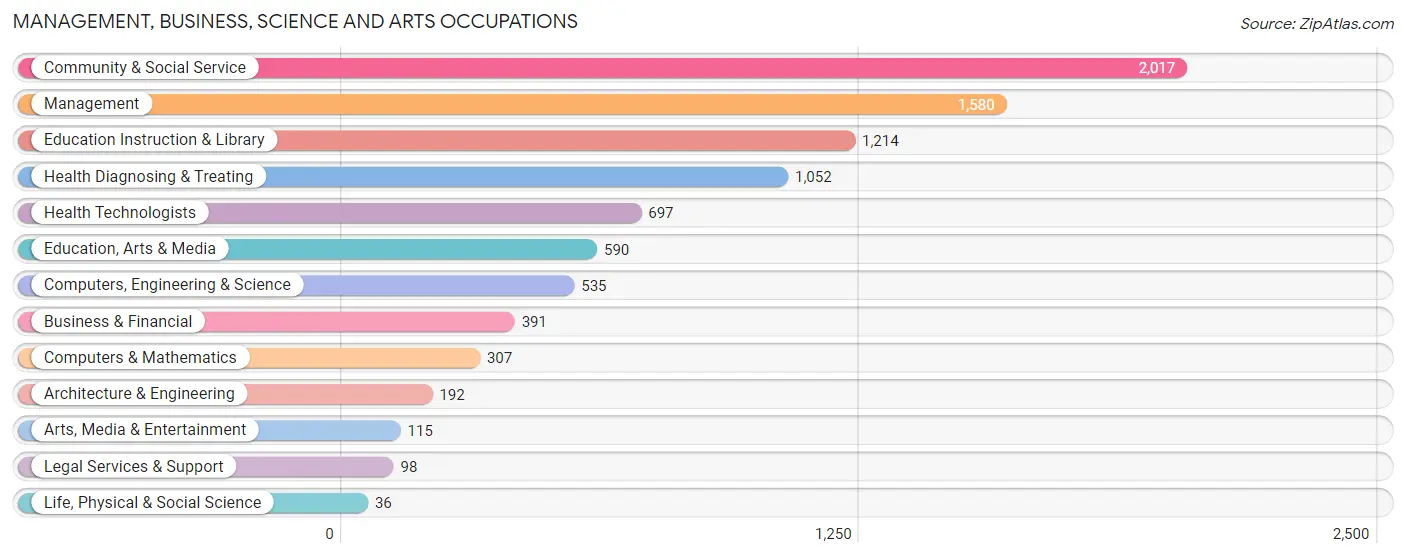
Management, Business, Science and Arts Occupations
The most common Management, Business, Science and Arts occupations in Madera are Community & Social Service (2,017 | 7.7%), Management (1,580 | 6.0%), Education Instruction & Library (1,214 | 4.6%), Health Diagnosing & Treating (1,052 | 4.0%), and Health Technologists (697 | 2.6%).
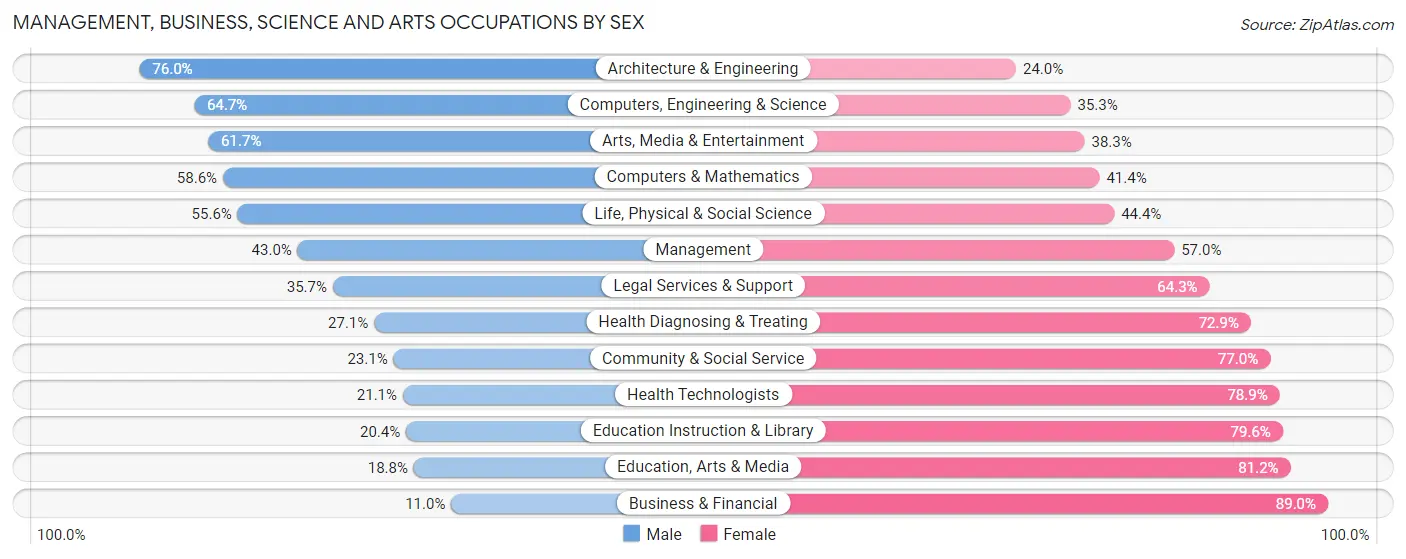
Management, Business, Science and Arts Occupations by Sex
Within the Management, Business, Science and Arts occupations in Madera, the most male-oriented occupations are Architecture & Engineering (76.0%), Computers, Engineering & Science (64.7%), and Arts, Media & Entertainment (61.7%), while the most female-oriented occupations are Business & Financial (89.0%), Education, Arts & Media (81.2%), and Education Instruction & Library (79.6%).
| Occupation | Male | Female |
| Management | 680 (43.0%) | 900 (57.0%) |
| Business & Financial | 43 (11.0%) | 348 (89.0%) |
| Computers, Engineering & Science | 346 (64.7%) | 189 (35.3%) |
| Computers & Mathematics | 180 (58.6%) | 127 (41.4%) |
| Architecture & Engineering | 146 (76.0%) | 46 (24.0%) |
| Life, Physical & Social Science | 20 (55.6%) | 16 (44.4%) |
| Community & Social Service | 465 (23.1%) | 1,552 (76.9%) |
| Education, Arts & Media | 111 (18.8%) | 479 (81.2%) |
| Legal Services & Support | 35 (35.7%) | 63 (64.3%) |
| Education Instruction & Library | 248 (20.4%) | 966 (79.6%) |
| Arts, Media & Entertainment | 71 (61.7%) | 44 (38.3%) |
| Health Diagnosing & Treating | 285 (27.1%) | 767 (72.9%) |
| Health Technologists | 147 (21.1%) | 550 (78.9%) |
| Total (Category) | 1,819 (32.6%) | 3,756 (67.4%) |
| Total (Overall) | 14,529 (55.2%) | 11,775 (44.8%) |
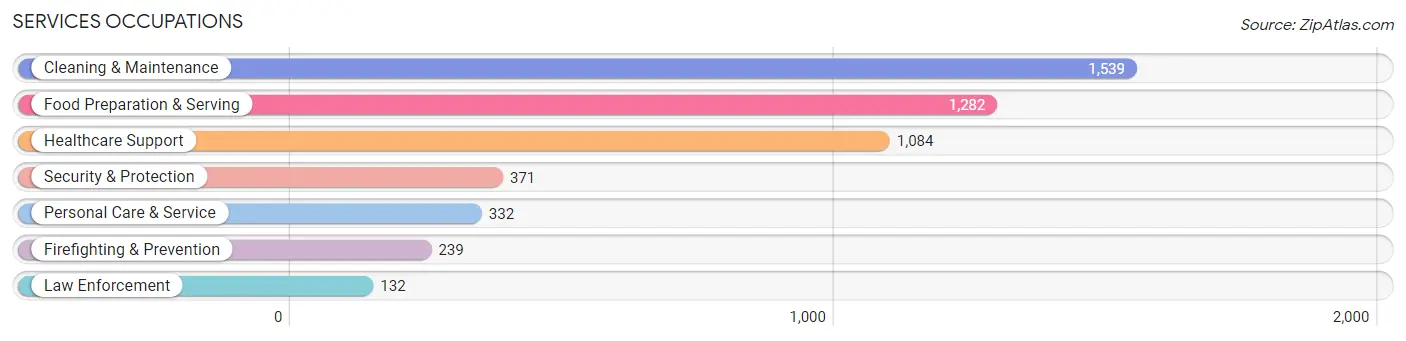
Services Occupations
The most common Services occupations in Madera are Cleaning & Maintenance (1,539 | 5.9%), Food Preparation & Serving (1,282 | 4.9%), Healthcare Support (1,084 | 4.1%), Security & Protection (371 | 1.4%), and Personal Care & Service (332 | 1.3%).
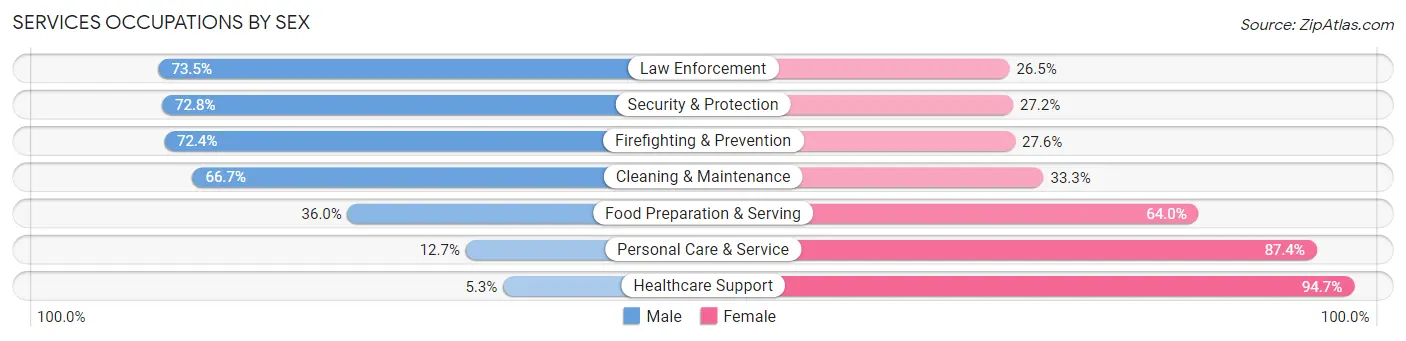
Services Occupations by Sex
Within the Services occupations in Madera, the most male-oriented occupations are Law Enforcement (73.5%), Security & Protection (72.8%), and Firefighting & Prevention (72.4%), while the most female-oriented occupations are Healthcare Support (94.7%), Personal Care & Service (87.4%), and Food Preparation & Serving (64.0%).
| Occupation | Male | Female |
| Healthcare Support | 57 (5.3%) | 1,027 (94.7%) |
| Security & Protection | 270 (72.8%) | 101 (27.2%) |
| Firefighting & Prevention | 173 (72.4%) | 66 (27.6%) |
| Law Enforcement | 97 (73.5%) | 35 (26.5%) |
| Food Preparation & Serving | 462 (36.0%) | 820 (64.0%) |
| Cleaning & Maintenance | 1,027 (66.7%) | 512 (33.3%) |
| Personal Care & Service | 42 (12.7%) | 290 (87.4%) |
| Total (Category) | 1,858 (40.3%) | 2,750 (59.7%) |
| Total (Overall) | 14,529 (55.2%) | 11,775 (44.8%) |
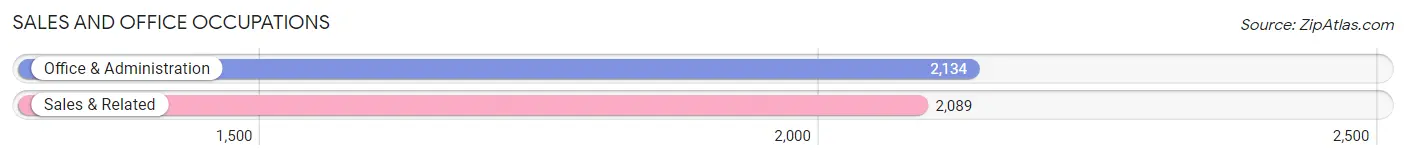
Sales and Office Occupations
The most common Sales and Office occupations in Madera are Office & Administration (2,134 | 8.1%), and Sales & Related (2,089 | 7.9%).
Sales and Office Occupations by Sex
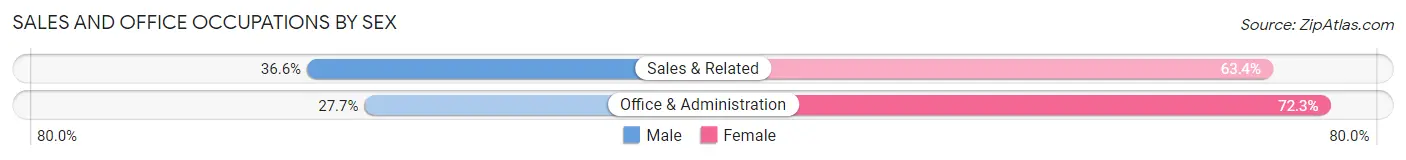
| Occupation | Male | Female |
| Sales & Related | 764 (36.6%) | 1,325 (63.4%) |
| Office & Administration | 592 (27.7%) | 1,542 (72.3%) |
| Total (Category) | 1,356 (32.1%) | 2,867 (67.9%) |
| Total (Overall) | 14,529 (55.2%) | 11,775 (44.8%) |
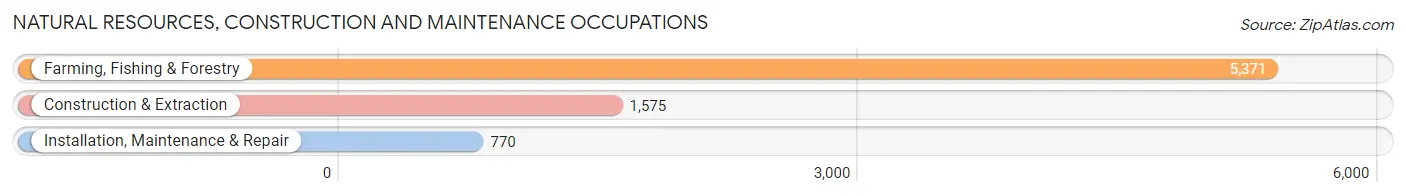
Natural Resources, Construction and Maintenance Occupations
The most common Natural Resources, Construction and Maintenance occupations in Madera are Farming, Fishing & Forestry (5,371 | 20.4%), Construction & Extraction (1,575 | 6.0%), and Installation, Maintenance & Repair (770 | 2.9%).
Natural Resources, Construction and Maintenance Occupations by Sex
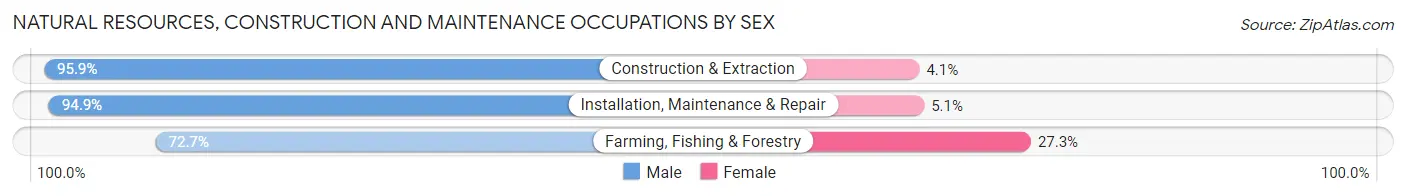
| Occupation | Male | Female |
| Farming, Fishing & Forestry | 3,907 (72.7%) | 1,464 (27.3%) |
| Construction & Extraction | 1,511 (95.9%) | 64 (4.1%) |
| Installation, Maintenance & Repair | 731 (94.9%) | 39 (5.1%) |
| Total (Category) | 6,149 (79.7%) | 1,567 (20.3%) |
| Total (Overall) | 14,529 (55.2%) | 11,775 (44.8%) |
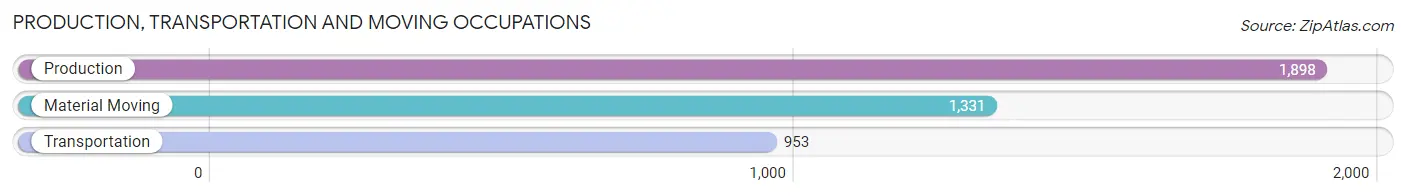
Production, Transportation and Moving Occupations
The most common Production, Transportation and Moving occupations in Madera are Production (1,898 | 7.2%), Material Moving (1,331 | 5.1%), and Transportation (953 | 3.6%).
Production, Transportation and Moving Occupations by Sex
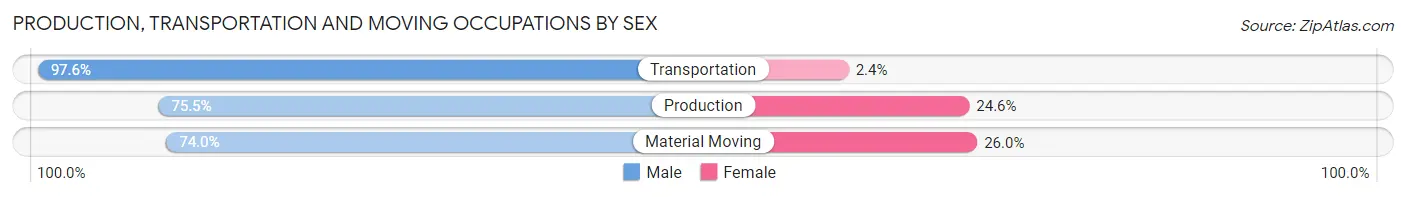
| Occupation | Male | Female |
| Production | 1,432 (75.4%) | 466 (24.5%) |
| Transportation | 930 (97.6%) | 23 (2.4%) |
| Material Moving | 985 (74.0%) | 346 (26.0%) |
| Total (Category) | 3,347 (80.0%) | 835 (20.0%) |
| Total (Overall) | 14,529 (55.2%) | 11,775 (44.8%) |
Employment Industries by Sex in Madera
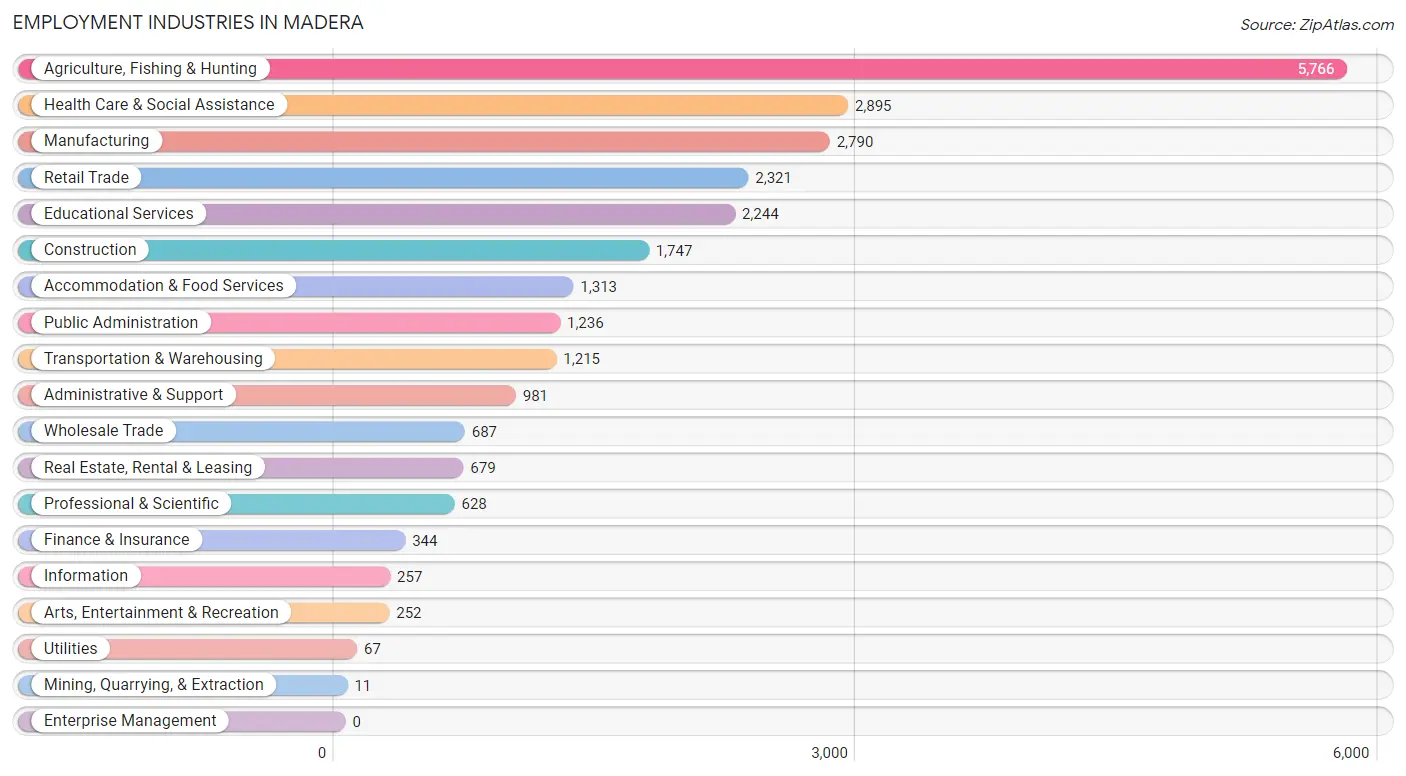
Employment Industries in Madera
The major employment industries in Madera include Agriculture, Fishing & Hunting (5,766 | 21.9%), Health Care & Social Assistance (2,895 | 11.0%), Manufacturing (2,790 | 10.6%), Retail Trade (2,321 | 8.8%), and Educational Services (2,244 | 8.5%).
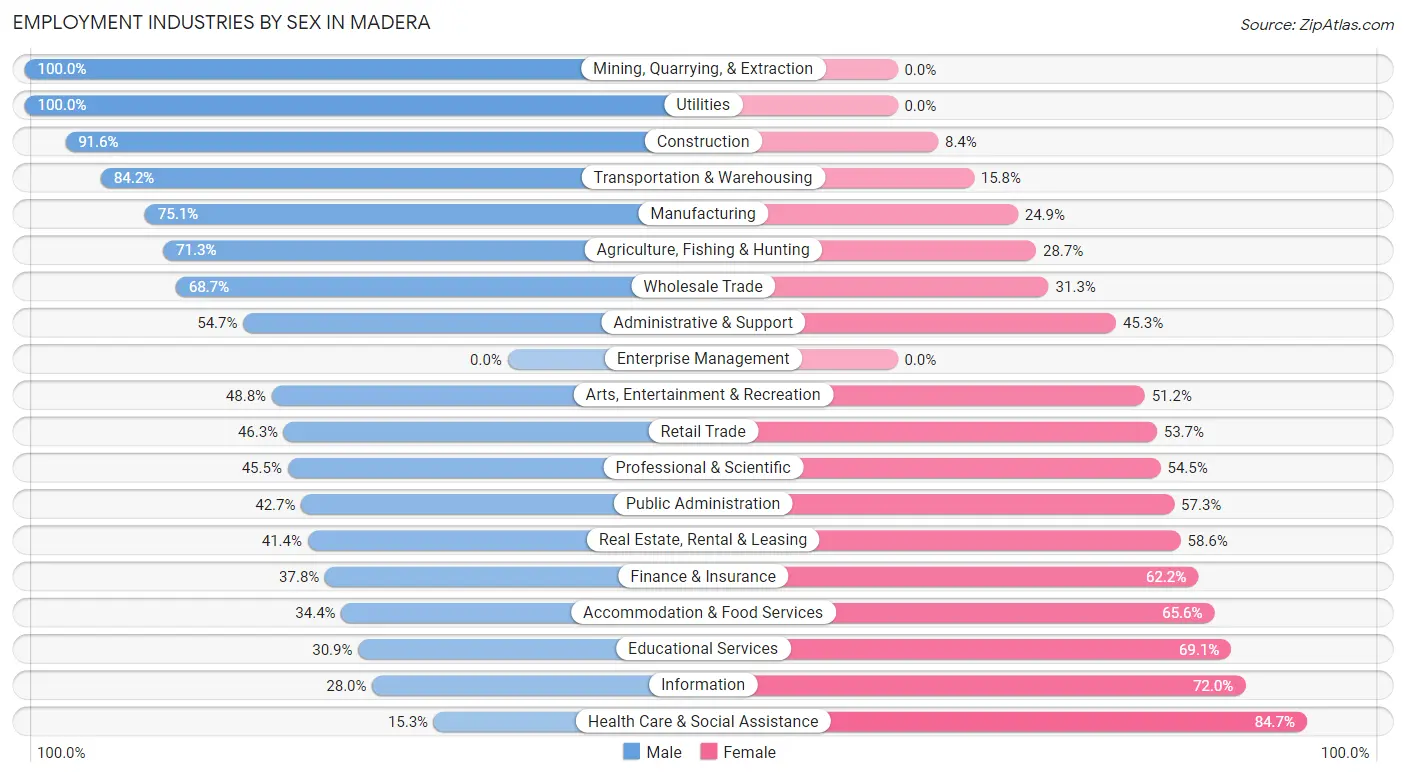
Employment Industries by Sex in Madera
The Madera industries that see more men than women are Mining, Quarrying, & Extraction (100.0%), Utilities (100.0%), and Construction (91.6%), whereas the industries that tend to have a higher number of women are Health Care & Social Assistance (84.7%), Information (72.0%), and Educational Services (69.1%).
| Industry | Male | Female |
| Agriculture, Fishing & Hunting | 4,112 (71.3%) | 1,654 (28.7%) |
| Mining, Quarrying, & Extraction | 11 (100.0%) | 0 (0.0%) |
| Construction | 1,600 (91.6%) | 147 (8.4%) |
| Manufacturing | 2,095 (75.1%) | 695 (24.9%) |
| Wholesale Trade | 472 (68.7%) | 215 (31.3%) |
| Retail Trade | 1,075 (46.3%) | 1,246 (53.7%) |
| Transportation & Warehousing | 1,023 (84.2%) | 192 (15.8%) |
| Utilities | 67 (100.0%) | 0 (0.0%) |
| Information | 72 (28.0%) | 185 (72.0%) |
| Finance & Insurance | 130 (37.8%) | 214 (62.2%) |
| Real Estate, Rental & Leasing | 281 (41.4%) | 398 (58.6%) |
| Professional & Scientific | 286 (45.5%) | 342 (54.5%) |
| Enterprise Management | 0 (0.0%) | 0 (0.0%) |
| Administrative & Support | 537 (54.7%) | 444 (45.3%) |
| Educational Services | 694 (30.9%) | 1,550 (69.1%) |
| Health Care & Social Assistance | 442 (15.3%) | 2,453 (84.7%) |
| Arts, Entertainment & Recreation | 123 (48.8%) | 129 (51.2%) |
| Accommodation & Food Services | 452 (34.4%) | 861 (65.6%) |
| Public Administration | 528 (42.7%) | 708 (57.3%) |
| Total | 14,529 (55.2%) | 11,775 (44.8%) |
Education in Madera
School Enrollment in Madera
The most common levels of schooling among the 23,676 students in Madera are high school (6,322 | 26.7%), elementary school (4,884 | 20.6%), and college / undergraduate (4,800 | 20.3%).
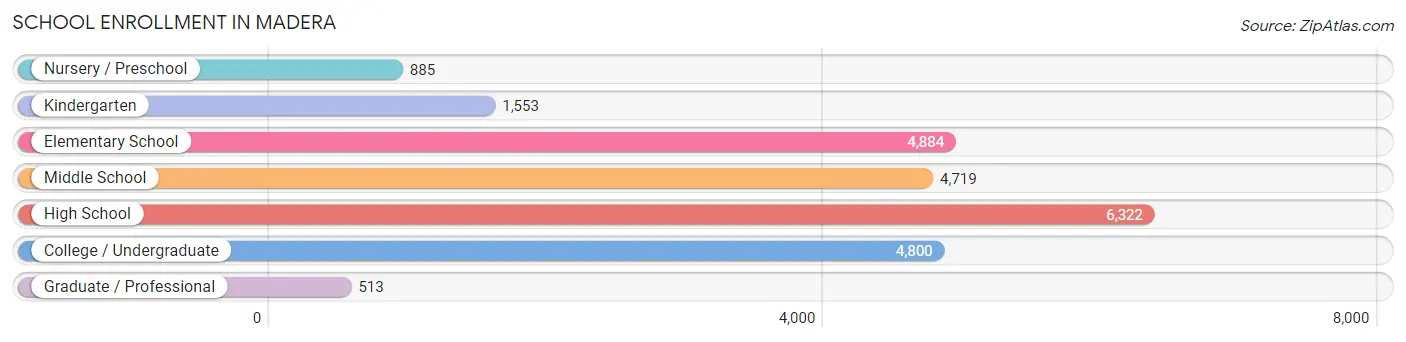
| School Level | # Students | % Students |
| Nursery / Preschool | 885 | 3.7% |
| Kindergarten | 1,553 | 6.6% |
| Elementary School | 4,884 | 20.6% |
| Middle School | 4,719 | 19.9% |
| High School | 6,322 | 26.7% |
| College / Undergraduate | 4,800 | 20.3% |
| Graduate / Professional | 513 | 2.2% |
| Total | 23,676 | 100.0% |
School Enrollment by Age by Funding Source in Madera
Out of a total of 23,676 students who are enrolled in schools in Madera, 1,136 (4.8%) attend a private institution, while the remaining 22,540 (95.2%) are enrolled in public schools. The age group of 3 to 4 year olds has the highest likelihood of being enrolled in private schools, with 85 (10.6% in the age bracket) enrolled. Conversely, the age group of 5 to 9 year old has the lowest likelihood of being enrolled in a private school, with 5,814 (97.1% in the age bracket) attending a public institution.
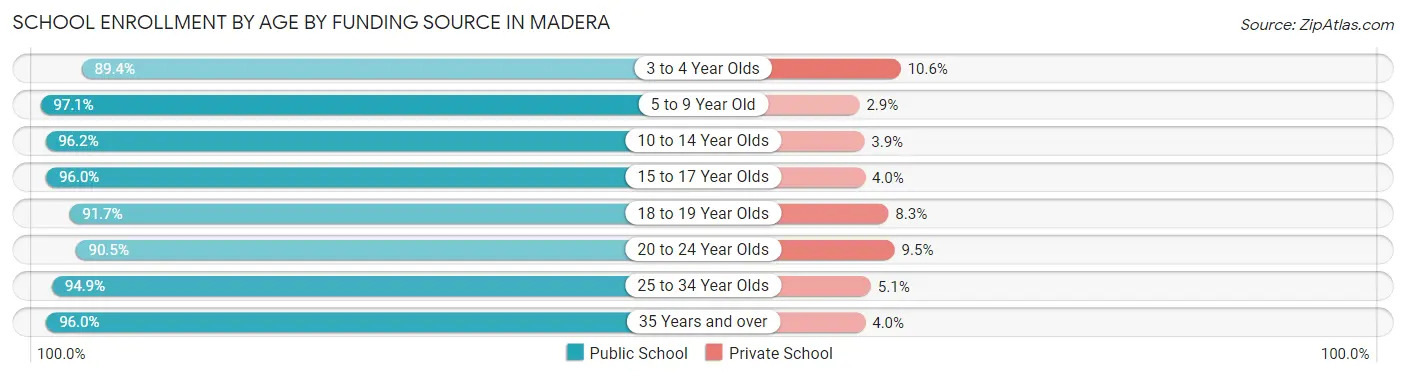
| Age Bracket | Public School | Private School |
| 3 to 4 Year Olds | 715 (89.4%) | 85 (10.6%) |
| 5 to 9 Year Old | 5,814 (97.1%) | 176 (2.9%) |
| 10 to 14 Year Olds | 5,870 (96.2%) | 235 (3.8%) |
| 15 to 17 Year Olds | 3,477 (96.0%) | 144 (4.0%) |
| 18 to 19 Year Olds | 1,541 (91.7%) | 140 (8.3%) |
| 20 to 24 Year Olds | 1,954 (90.5%) | 205 (9.5%) |
| 25 to 34 Year Olds | 1,386 (94.9%) | 74 (5.1%) |
| 35 Years and over | 1,785 (96.0%) | 75 (4.0%) |
| Total | 22,540 (95.2%) | 1,136 (4.8%) |
Educational Attainment by Field of Study in Madera
Business (933 | 22.8%), education (488 | 11.9%), arts & humanities (405 | 9.9%), liberal arts & history (398 | 9.7%), and science & technology (395 | 9.7%) are the most common fields of study among 4,092 individuals in Madera who have obtained a bachelor's degree or higher.
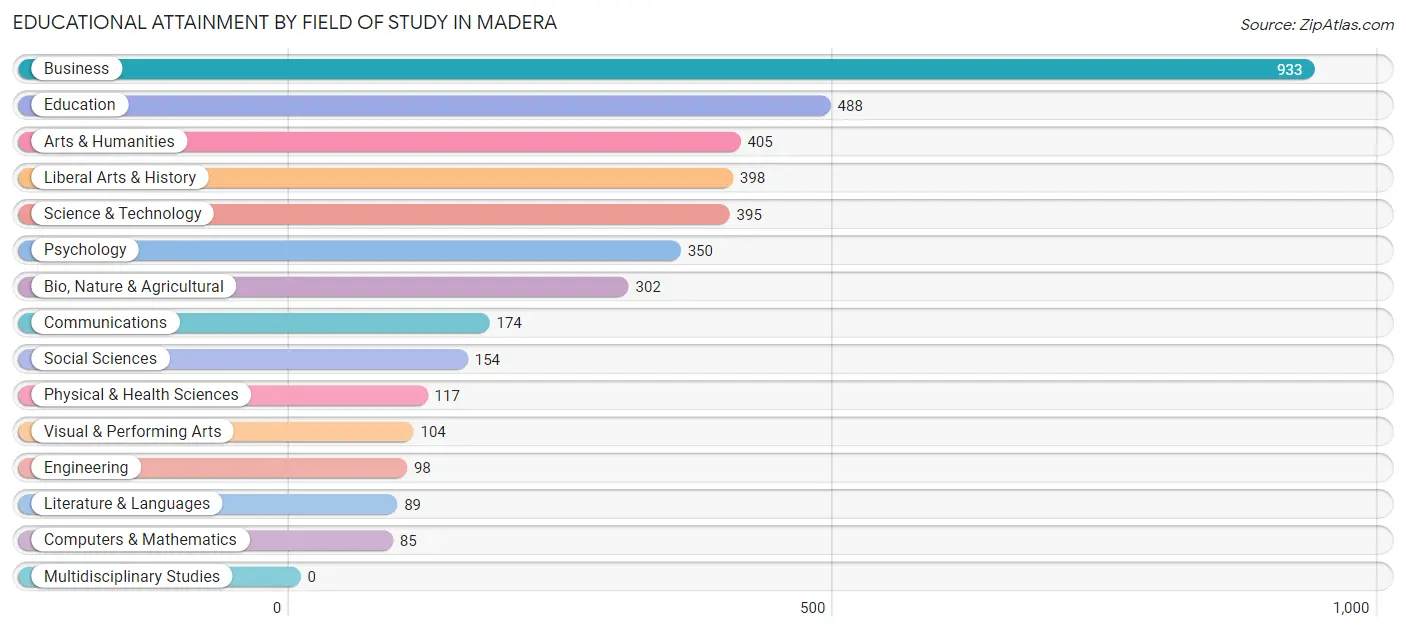
| Field of Study | # Graduates | % Graduates |
| Computers & Mathematics | 85 | 2.1% |
| Bio, Nature & Agricultural | 302 | 7.4% |
| Physical & Health Sciences | 117 | 2.9% |
| Psychology | 350 | 8.6% |
| Social Sciences | 154 | 3.8% |
| Engineering | 98 | 2.4% |
| Multidisciplinary Studies | 0 | 0.0% |
| Science & Technology | 395 | 9.7% |
| Business | 933 | 22.8% |
| Education | 488 | 11.9% |
| Literature & Languages | 89 | 2.2% |
| Liberal Arts & History | 398 | 9.7% |
| Visual & Performing Arts | 104 | 2.5% |
| Communications | 174 | 4.3% |
| Arts & Humanities | 405 | 9.9% |
| Total | 4,092 | 100.0% |
Transportation & Commute in Madera
Vehicle Availability by Sex in Madera
The most prevalent vehicle ownership categories in Madera are males with 2 vehicles (5,290, accounting for 37.4%) and females with 2 vehicles (3,857, making up 47.7%).
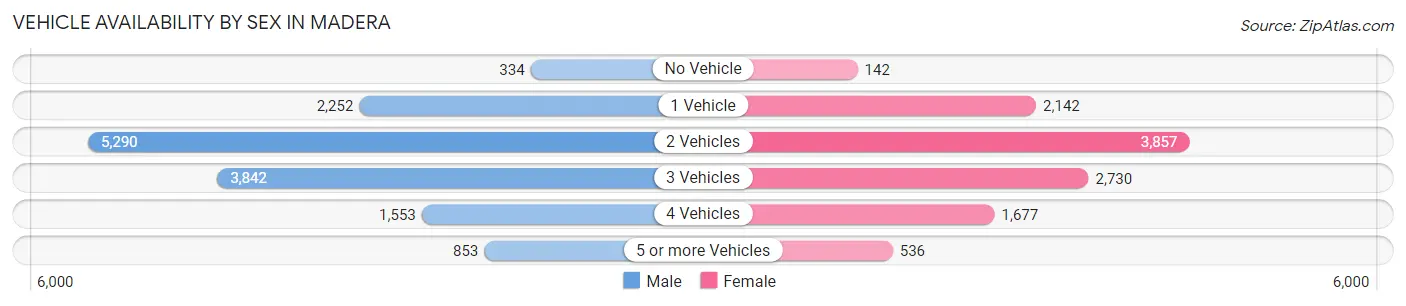
| Vehicles Available | Male | Female |
| No Vehicle | 334 (2.4%) | 142 (1.3%) |
| 1 Vehicle | 2,252 (15.9%) | 2,142 (19.3%) |
| 2 Vehicles | 5,290 (37.4%) | 3,857 (34.8%) |
| 3 Vehicles | 3,842 (27.2%) | 2,730 (24.6%) |
| 4 Vehicles | 1,553 (11.0%) | 1,677 (15.1%) |
| 5 or more Vehicles | 853 (6.0%) | 536 (4.8%) |
| Total | 14,124 (100.0%) | 11,084 (100.0%) |
Commute Time in Madera
The most frequently occuring commute durations in Madera are 30 to 34 minutes (3,941 commuters, 16.4%), 10 to 14 minutes (3,391 commuters, 14.1%), and 5 to 9 minutes (3,272 commuters, 13.6%).
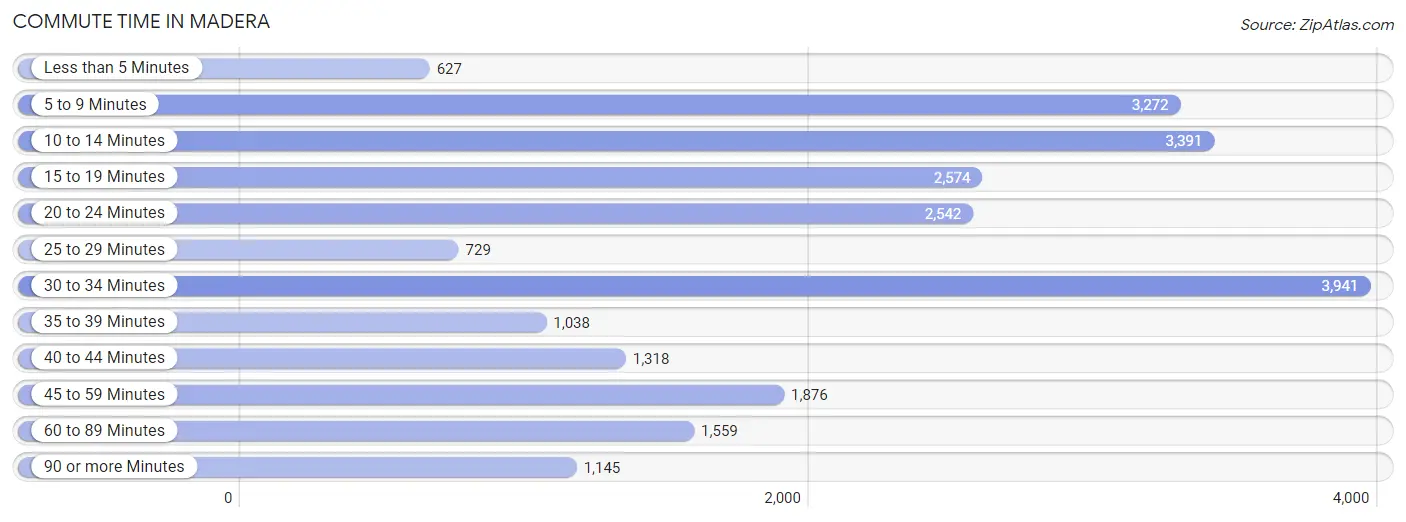
| Commute Time | # Commuters | % Commuters |
| Less than 5 Minutes | 627 | 2.6% |
| 5 to 9 Minutes | 3,272 | 13.6% |
| 10 to 14 Minutes | 3,391 | 14.1% |
| 15 to 19 Minutes | 2,574 | 10.7% |
| 20 to 24 Minutes | 2,542 | 10.6% |
| 25 to 29 Minutes | 729 | 3.0% |
| 30 to 34 Minutes | 3,941 | 16.4% |
| 35 to 39 Minutes | 1,038 | 4.3% |
| 40 to 44 Minutes | 1,318 | 5.5% |
| 45 to 59 Minutes | 1,876 | 7.8% |
| 60 to 89 Minutes | 1,559 | 6.5% |
| 90 or more Minutes | 1,145 | 4.8% |
Commute Time by Sex in Madera
The most common commute times in Madera are 30 to 34 minutes (2,395 commuters, 17.4%) for males and 30 to 34 minutes (1,546 commuters, 15.1%) for females.
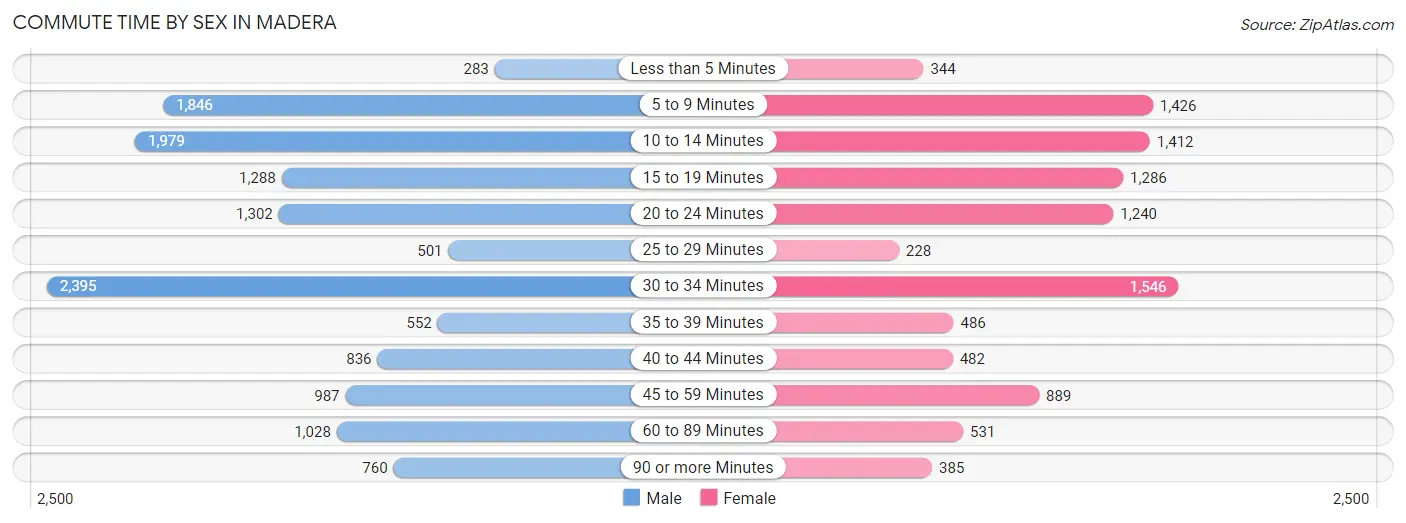
| Commute Time | Male | Female |
| Less than 5 Minutes | 283 (2.1%) | 344 (3.4%) |
| 5 to 9 Minutes | 1,846 (13.4%) | 1,426 (13.9%) |
| 10 to 14 Minutes | 1,979 (14.4%) | 1,412 (13.8%) |
| 15 to 19 Minutes | 1,288 (9.4%) | 1,286 (12.5%) |
| 20 to 24 Minutes | 1,302 (9.5%) | 1,240 (12.1%) |
| 25 to 29 Minutes | 501 (3.6%) | 228 (2.2%) |
| 30 to 34 Minutes | 2,395 (17.4%) | 1,546 (15.1%) |
| 35 to 39 Minutes | 552 (4.0%) | 486 (4.7%) |
| 40 to 44 Minutes | 836 (6.1%) | 482 (4.7%) |
| 45 to 59 Minutes | 987 (7.2%) | 889 (8.7%) |
| 60 to 89 Minutes | 1,028 (7.5%) | 531 (5.2%) |
| 90 or more Minutes | 760 (5.5%) | 385 (3.7%) |
Time of Departure to Work by Sex in Madera
The most frequent times of departure to work in Madera are 12:00 AM to 4:59 AM (2,189, 15.9%) for males and 7:00 AM to 7:29 AM (1,822, 17.8%) for females.
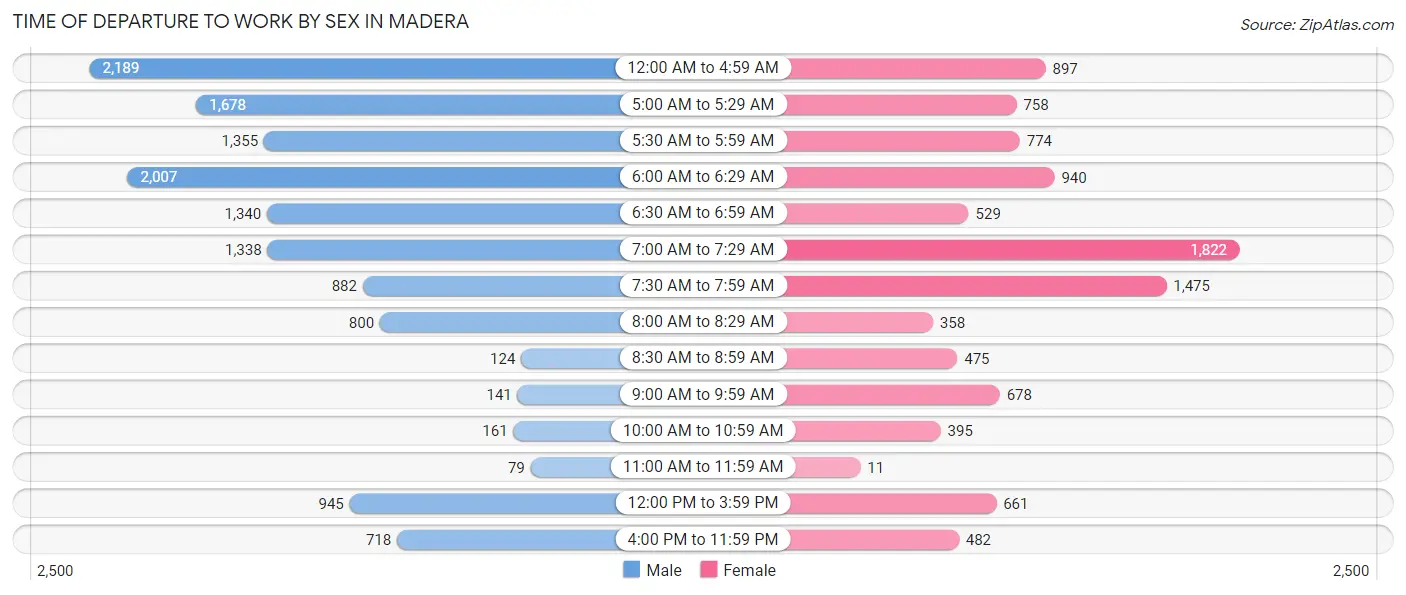
| Time of Departure | Male | Female |
| 12:00 AM to 4:59 AM | 2,189 (15.9%) | 897 (8.7%) |
| 5:00 AM to 5:29 AM | 1,678 (12.2%) | 758 (7.4%) |
| 5:30 AM to 5:59 AM | 1,355 (9.9%) | 774 (7.5%) |
| 6:00 AM to 6:29 AM | 2,007 (14.6%) | 940 (9.2%) |
| 6:30 AM to 6:59 AM | 1,340 (9.7%) | 529 (5.2%) |
| 7:00 AM to 7:29 AM | 1,338 (9.7%) | 1,822 (17.8%) |
| 7:30 AM to 7:59 AM | 882 (6.4%) | 1,475 (14.4%) |
| 8:00 AM to 8:29 AM | 800 (5.8%) | 358 (3.5%) |
| 8:30 AM to 8:59 AM | 124 (0.9%) | 475 (4.6%) |
| 9:00 AM to 9:59 AM | 141 (1.0%) | 678 (6.6%) |
| 10:00 AM to 10:59 AM | 161 (1.2%) | 395 (3.8%) |
| 11:00 AM to 11:59 AM | 79 (0.6%) | 11 (0.1%) |
| 12:00 PM to 3:59 PM | 945 (6.9%) | 661 (6.5%) |
| 4:00 PM to 11:59 PM | 718 (5.2%) | 482 (4.7%) |
| Total | 13,757 (100.0%) | 10,255 (100.0%) |
Housing Occupancy in Madera
Occupancy by Ownership in Madera
Of the total 16,871 dwellings in Madera, owner-occupied units account for 8,537 (50.6%), while renter-occupied units make up 8,334 (49.4%).
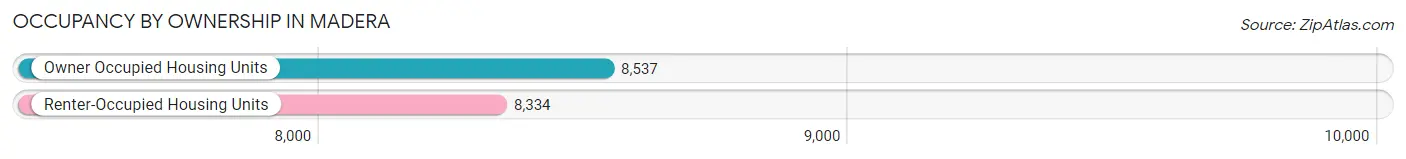
| Occupancy | # Housing Units | % Housing Units |
| Owner Occupied Housing Units | 8,537 | 50.6% |
| Renter-Occupied Housing Units | 8,334 | 49.4% |
| Total Occupied Housing Units | 16,871 | 100.0% |
Occupancy by Household Size in Madera
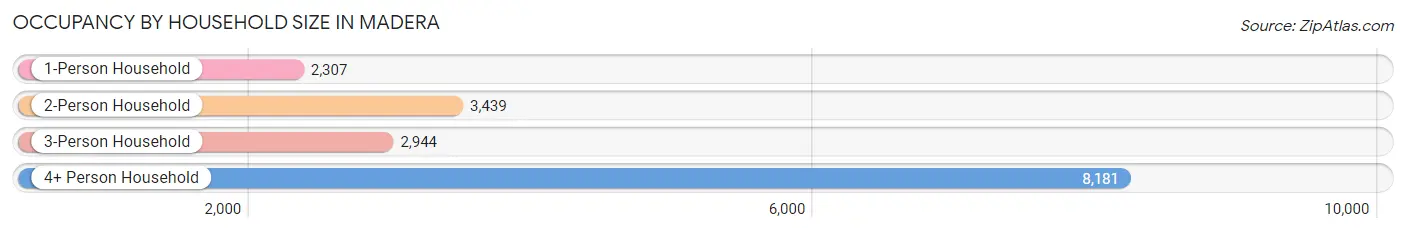
| Household Size | # Housing Units | % Housing Units |
| 1-Person Household | 2,307 | 13.7% |
| 2-Person Household | 3,439 | 20.4% |
| 3-Person Household | 2,944 | 17.4% |
| 4+ Person Household | 8,181 | 48.5% |
| Total Housing Units | 16,871 | 100.0% |
Occupancy by Ownership by Household Size in Madera
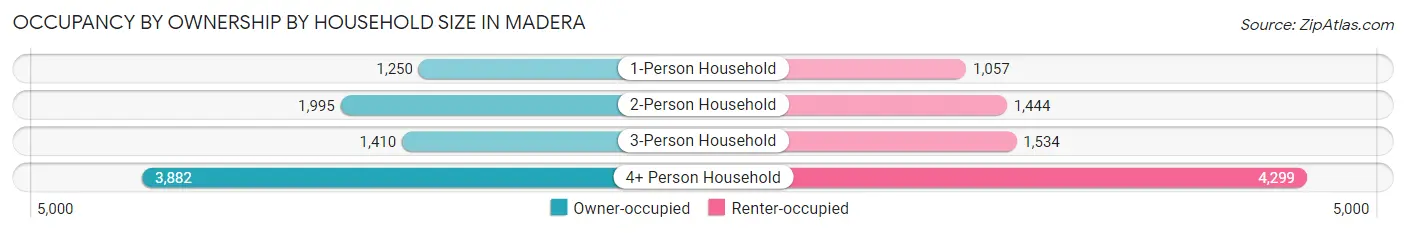
| Household Size | Owner-occupied | Renter-occupied |
| 1-Person Household | 1,250 (54.2%) | 1,057 (45.8%) |
| 2-Person Household | 1,995 (58.0%) | 1,444 (42.0%) |
| 3-Person Household | 1,410 (47.9%) | 1,534 (52.1%) |
| 4+ Person Household | 3,882 (47.4%) | 4,299 (52.5%) |
| Total Housing Units | 8,537 (50.6%) | 8,334 (49.4%) |
Occupancy by Educational Attainment in Madera
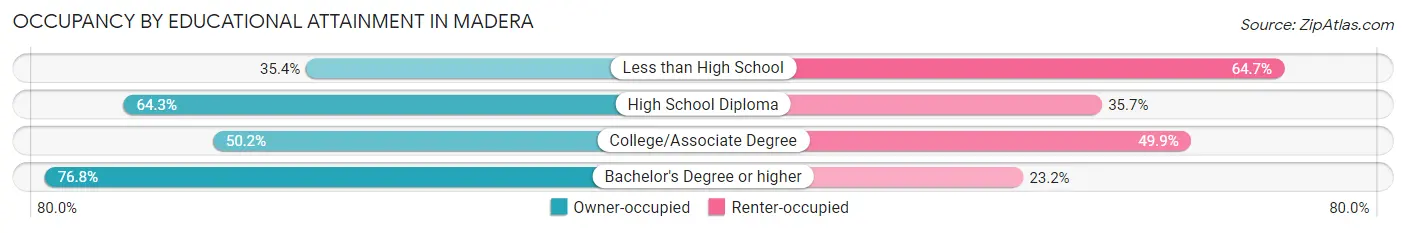
| Household Size | Owner-occupied | Renter-occupied |
| Less than High School | 2,295 (35.3%) | 4,198 (64.6%) |
| High School Diploma | 2,491 (64.3%) | 1,383 (35.7%) |
| College/Associate Degree | 2,341 (50.1%) | 2,327 (49.8%) |
| Bachelor's Degree or higher | 1,410 (76.8%) | 426 (23.2%) |
Occupancy by Age of Householder in Madera
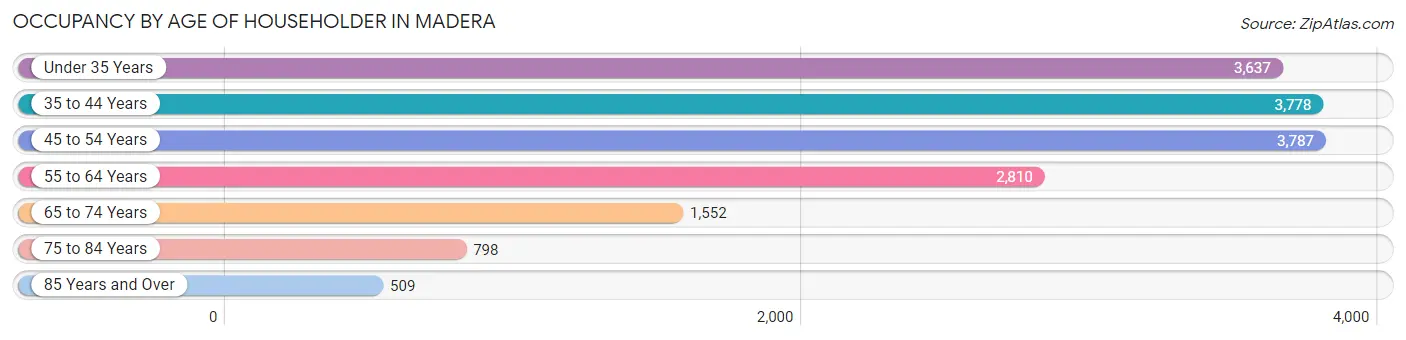
| Age Bracket | # Households | % Households |
| Under 35 Years | 3,637 | 21.6% |
| 35 to 44 Years | 3,778 | 22.4% |
| 45 to 54 Years | 3,787 | 22.5% |
| 55 to 64 Years | 2,810 | 16.7% |
| 65 to 74 Years | 1,552 | 9.2% |
| 75 to 84 Years | 798 | 4.7% |
| 85 Years and Over | 509 | 3.0% |
| Total | 16,871 | 100.0% |
Housing Finances in Madera
Median Income by Occupancy in Madera
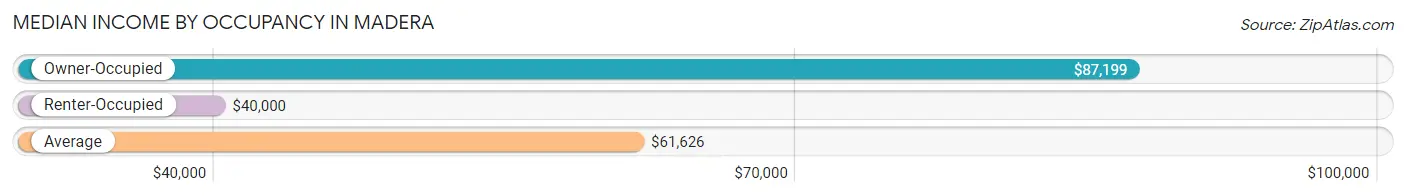
| Occupancy Type | # Households | Median Income |
| Owner-Occupied | 8,537 (50.6%) | $87,199 |
| Renter-Occupied | 8,334 (49.4%) | $40,000 |
| Average | 16,871 (100.0%) | $61,626 |
Occupancy by Householder Income Bracket in Madera
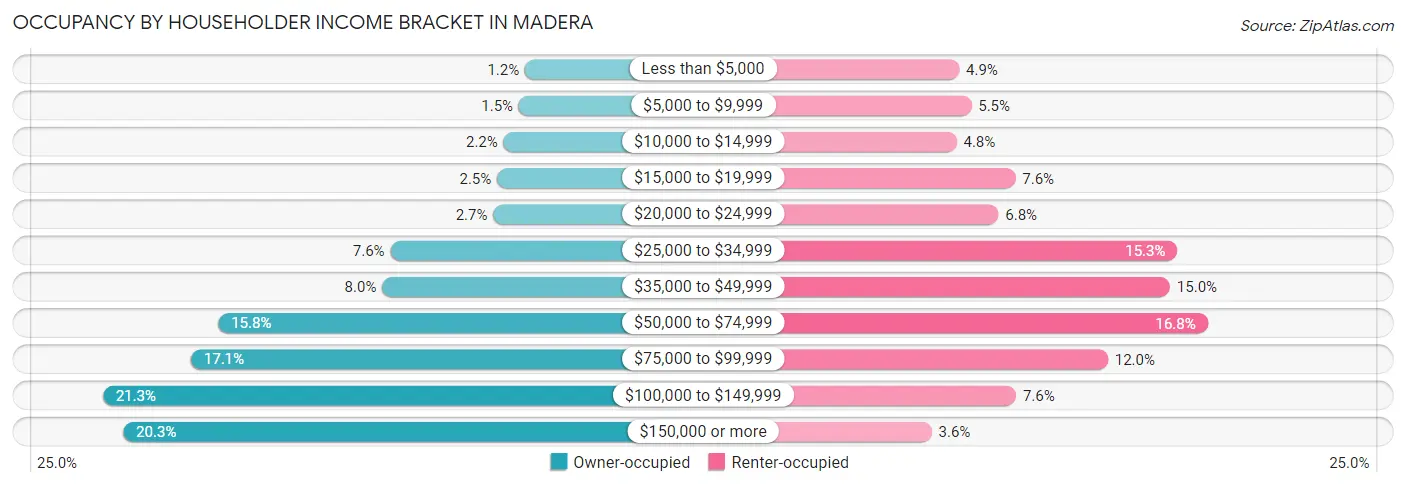
| Income Bracket | Owner-occupied | Renter-occupied |
| Less than $5,000 | 100 (1.2%) | 411 (4.9%) |
| $5,000 to $9,999 | 125 (1.5%) | 459 (5.5%) |
| $10,000 to $14,999 | 187 (2.2%) | 401 (4.8%) |
| $15,000 to $19,999 | 213 (2.5%) | 634 (7.6%) |
| $20,000 to $24,999 | 229 (2.7%) | 567 (6.8%) |
| $25,000 to $34,999 | 647 (7.6%) | 1,277 (15.3%) |
| $35,000 to $49,999 | 680 (8.0%) | 1,248 (15.0%) |
| $50,000 to $74,999 | 1,347 (15.8%) | 1,397 (16.8%) |
| $75,000 to $99,999 | 1,458 (17.1%) | 1,001 (12.0%) |
| $100,000 to $149,999 | 1,817 (21.3%) | 637 (7.6%) |
| $150,000 or more | 1,734 (20.3%) | 302 (3.6%) |
| Total | 8,537 (100.0%) | 8,334 (100.0%) |
Monthly Housing Cost Tiers in Madera
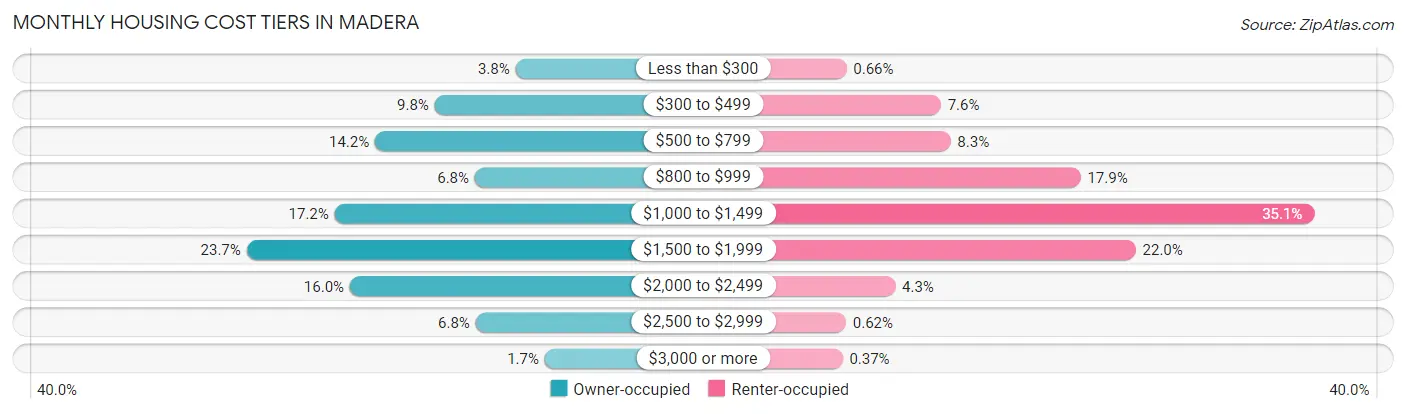
| Monthly Cost | Owner-occupied | Renter-occupied |
| Less than $300 | 328 (3.8%) | 55 (0.7%) |
| $300 to $499 | 837 (9.8%) | 634 (7.6%) |
| $500 to $799 | 1,211 (14.2%) | 693 (8.3%) |
| $800 to $999 | 584 (6.8%) | 1,492 (17.9%) |
| $1,000 to $1,499 | 1,466 (17.2%) | 2,926 (35.1%) |
| $1,500 to $1,999 | 2,019 (23.6%) | 1,830 (22.0%) |
| $2,000 to $2,499 | 1,369 (16.0%) | 354 (4.3%) |
| $2,500 to $2,999 | 579 (6.8%) | 52 (0.6%) |
| $3,000 or more | 144 (1.7%) | 31 (0.4%) |
| Total | 8,537 (100.0%) | 8,334 (100.0%) |
Physical Housing Characteristics in Madera
Housing Structures in Madera
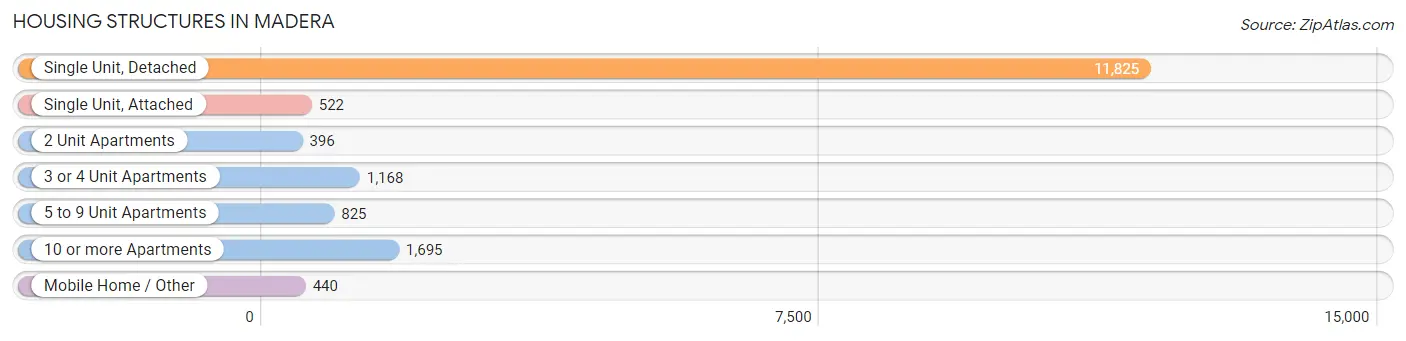
| Structure Type | # Housing Units | % Housing Units |
| Single Unit, Detached | 11,825 | 70.1% |
| Single Unit, Attached | 522 | 3.1% |
| 2 Unit Apartments | 396 | 2.4% |
| 3 or 4 Unit Apartments | 1,168 | 6.9% |
| 5 to 9 Unit Apartments | 825 | 4.9% |
| 10 or more Apartments | 1,695 | 10.1% |
| Mobile Home / Other | 440 | 2.6% |
| Total | 16,871 | 100.0% |
Housing Structures by Occupancy in Madera
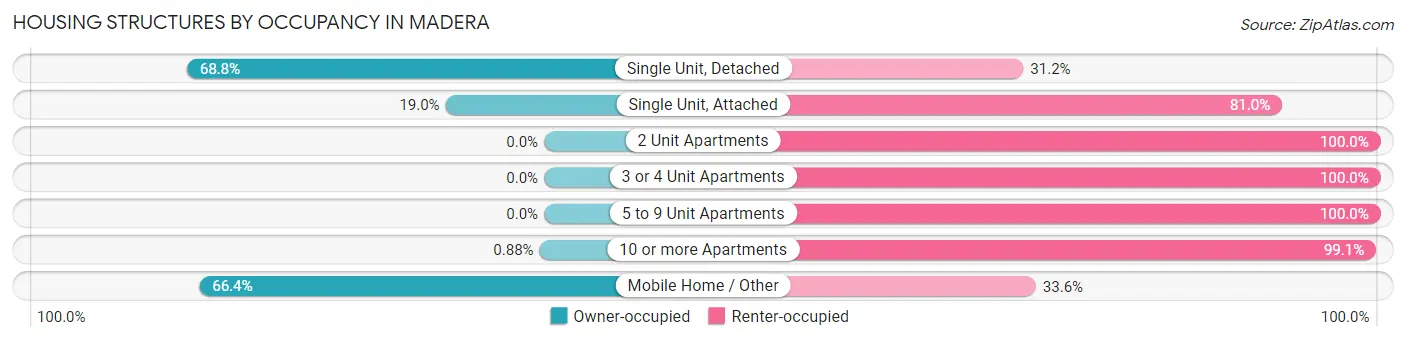
| Structure Type | Owner-occupied | Renter-occupied |
| Single Unit, Detached | 8,131 (68.8%) | 3,694 (31.2%) |
| Single Unit, Attached | 99 (19.0%) | 423 (81.0%) |
| 2 Unit Apartments | 0 (0.0%) | 396 (100.0%) |
| 3 or 4 Unit Apartments | 0 (0.0%) | 1,168 (100.0%) |
| 5 to 9 Unit Apartments | 0 (0.0%) | 825 (100.0%) |
| 10 or more Apartments | 15 (0.9%) | 1,680 (99.1%) |
| Mobile Home / Other | 292 (66.4%) | 148 (33.6%) |
| Total | 8,537 (50.6%) | 8,334 (49.4%) |
Housing Structures by Number of Rooms in Madera
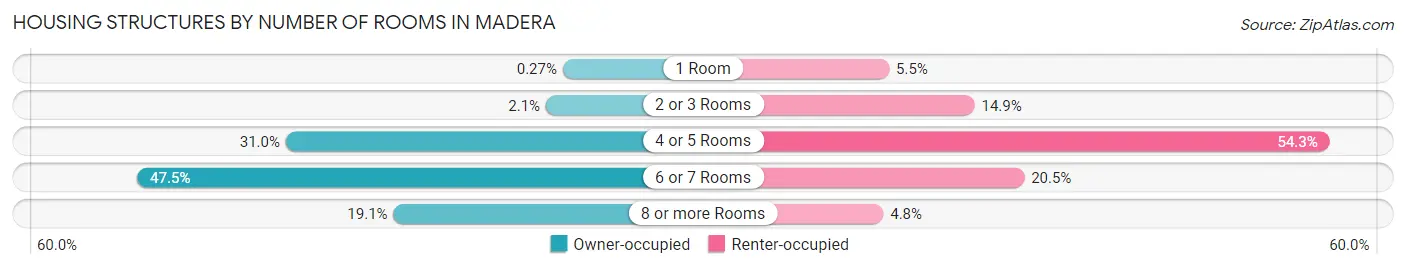
| Number of Rooms | Owner-occupied | Renter-occupied |
| 1 Room | 23 (0.3%) | 455 (5.5%) |
| 2 or 3 Rooms | 183 (2.1%) | 1,245 (14.9%) |
| 4 or 5 Rooms | 2,647 (31.0%) | 4,529 (54.3%) |
| 6 or 7 Rooms | 4,056 (47.5%) | 1,704 (20.4%) |
| 8 or more Rooms | 1,628 (19.1%) | 401 (4.8%) |
| Total | 8,537 (100.0%) | 8,334 (100.0%) |
Housing Structure by Heating Type in Madera
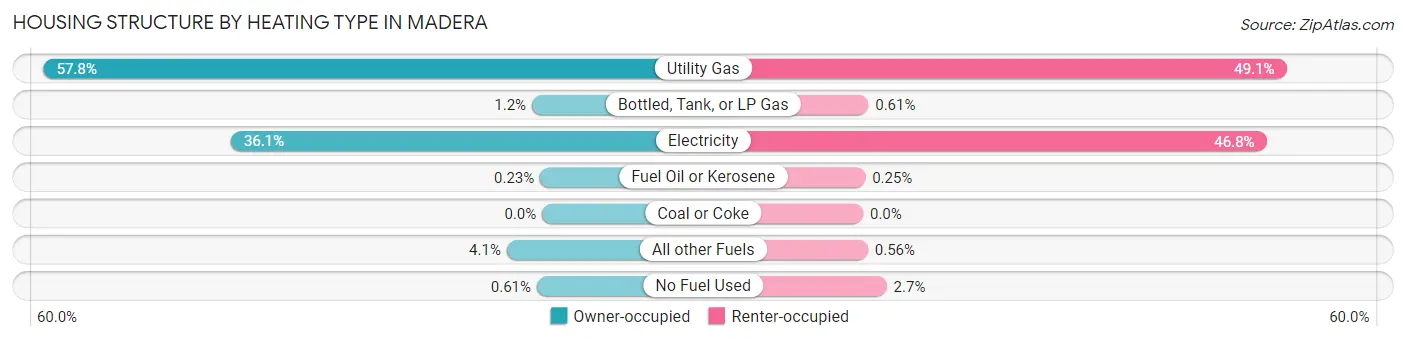
| Heating Type | Owner-occupied | Renter-occupied |
| Utility Gas | 4,934 (57.8%) | 4,090 (49.1%) |
| Bottled, Tank, or LP Gas | 101 (1.2%) | 51 (0.6%) |
| Electricity | 3,080 (36.1%) | 3,897 (46.8%) |
| Fuel Oil or Kerosene | 20 (0.2%) | 21 (0.3%) |
| Coal or Coke | 0 (0.0%) | 0 (0.0%) |
| All other Fuels | 350 (4.1%) | 47 (0.6%) |
| No Fuel Used | 52 (0.6%) | 228 (2.7%) |
| Total | 8,537 (100.0%) | 8,334 (100.0%) |
Household Vehicle Usage in Madera
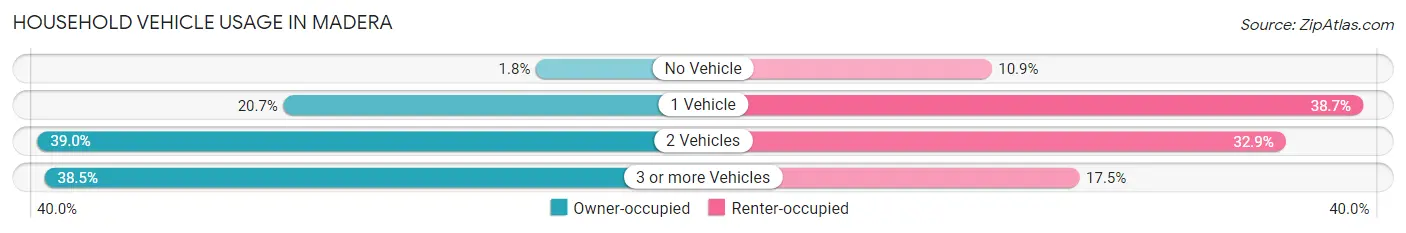
| Vehicles per Household | Owner-occupied | Renter-occupied |
| No Vehicle | 153 (1.8%) | 911 (10.9%) |
| 1 Vehicle | 1,763 (20.6%) | 3,223 (38.7%) |
| 2 Vehicles | 3,333 (39.0%) | 2,742 (32.9%) |
| 3 or more Vehicles | 3,288 (38.5%) | 1,458 (17.5%) |
| Total | 8,537 (100.0%) | 8,334 (100.0%) |
Real Estate & Mortgages in Madera
Real Estate and Mortgage Overview in Madera
| Characteristic | Without Mortgage | With Mortgage |
| Housing Units | 2,320 | 6,217 |
| Median Property Value | $280,800 | $305,700 |
| Median Household Income | $72,632 | $1,404 |
| Monthly Housing Costs | $520 | $144 |
| Real Estate Taxes | $1,633 | $157 |
Property Value by Mortgage Status in Madera
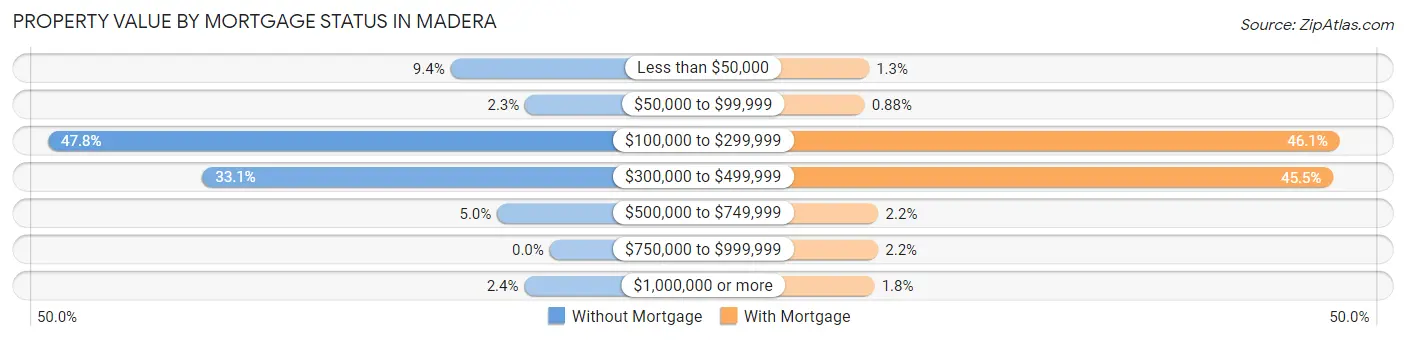
| Property Value | Without Mortgage | With Mortgage |
| Less than $50,000 | 219 (9.4%) | 81 (1.3%) |
| $50,000 to $99,999 | 54 (2.3%) | 55 (0.9%) |
| $100,000 to $299,999 | 1,108 (47.8%) | 2,866 (46.1%) |
| $300,000 to $499,999 | 767 (33.1%) | 2,829 (45.5%) |
| $500,000 to $749,999 | 116 (5.0%) | 137 (2.2%) |
| $750,000 to $999,999 | 0 (0.0%) | 135 (2.2%) |
| $1,000,000 or more | 56 (2.4%) | 114 (1.8%) |
| Total | 2,320 (100.0%) | 6,217 (100.0%) |
Household Income by Mortgage Status in Madera
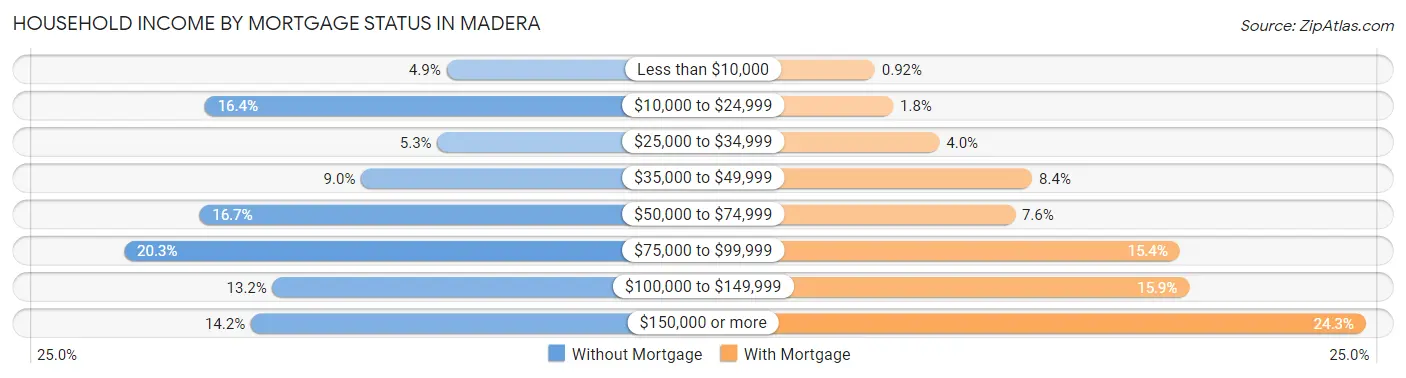
| Household Income | Without Mortgage | With Mortgage |
| Less than $10,000 | 114 (4.9%) | 57 (0.9%) |
| $10,000 to $24,999 | 381 (16.4%) | 111 (1.8%) |
| $25,000 to $34,999 | 124 (5.3%) | 248 (4.0%) |
| $35,000 to $49,999 | 208 (9.0%) | 523 (8.4%) |
| $50,000 to $74,999 | 387 (16.7%) | 472 (7.6%) |
| $75,000 to $99,999 | 470 (20.3%) | 960 (15.4%) |
| $100,000 to $149,999 | 306 (13.2%) | 988 (15.9%) |
| $150,000 or more | 330 (14.2%) | 1,511 (24.3%) |
| Total | 2,320 (100.0%) | 6,217 (100.0%) |
Property Value to Household Income Ratio in Madera
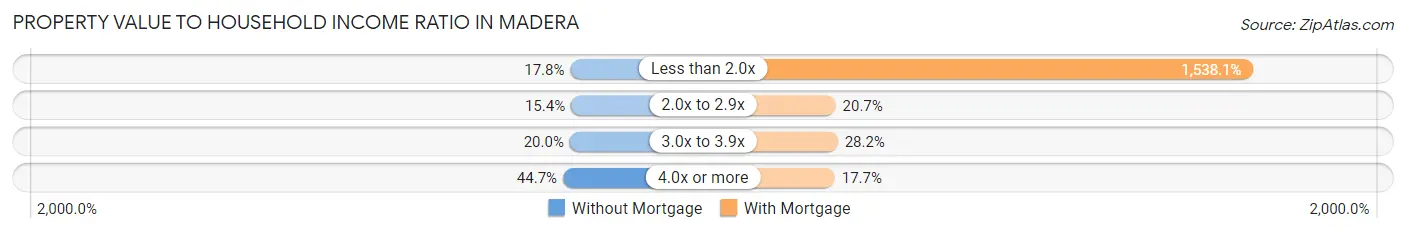
| Value-to-Income Ratio | Without Mortgage | With Mortgage |
| Less than 2.0x | 414 (17.8%) | 95,625 (1,538.1%) |
| 2.0x to 2.9x | 357 (15.4%) | 1,284 (20.6%) |
| 3.0x to 3.9x | 464 (20.0%) | 1,754 (28.2%) |
| 4.0x or more | 1,038 (44.7%) | 1,097 (17.6%) |
| Total | 2,320 (100.0%) | 6,217 (100.0%) |
Real Estate Taxes by Mortgage Status in Madera
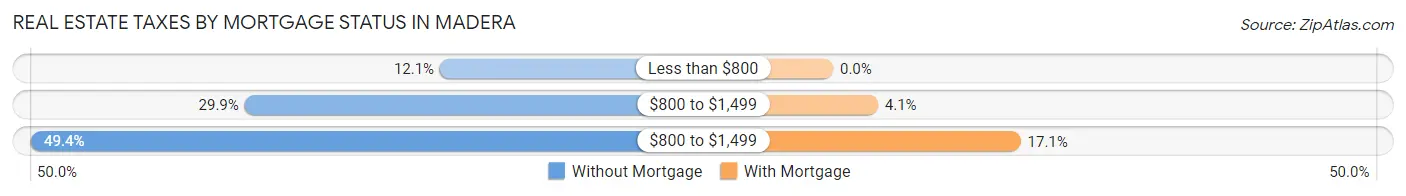
| Property Taxes | Without Mortgage | With Mortgage |
| Less than $800 | 280 (12.1%) | 0 (0.0%) |
| $800 to $1,499 | 694 (29.9%) | 254 (4.1%) |
| $800 to $1,499 | 1,146 (49.4%) | 1,065 (17.1%) |
| Total | 2,320 (100.0%) | 6,217 (100.0%) |
Health & Disability in Madera
Health Insurance Coverage by Age in Madera
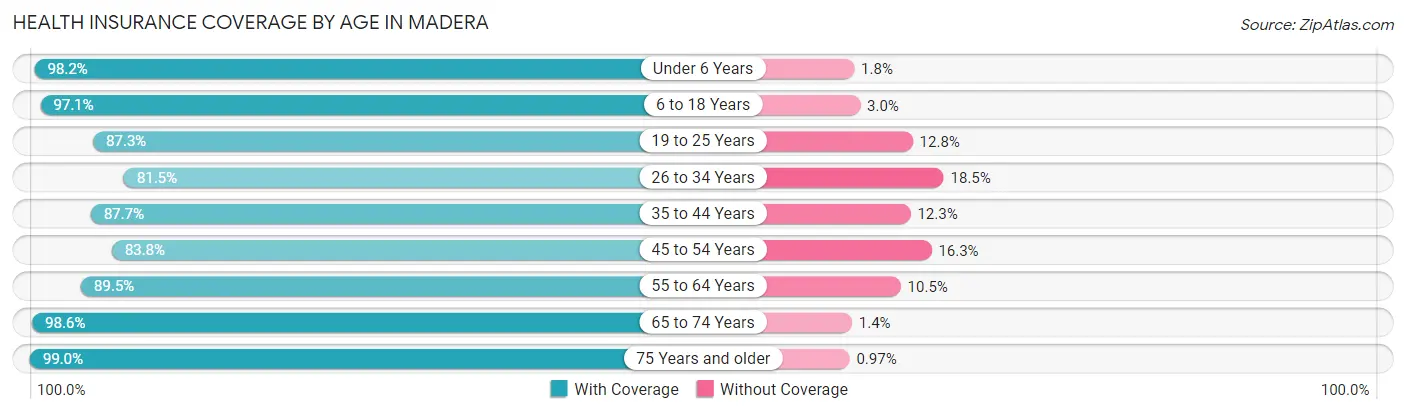
| Age Bracket | With Coverage | Without Coverage |
| Under 6 Years | 6,336 (98.2%) | 119 (1.8%) |
| 6 to 18 Years | 15,814 (97.1%) | 480 (2.9%) |
| 19 to 25 Years | 6,152 (87.3%) | 899 (12.8%) |
| 26 to 34 Years | 7,108 (81.5%) | 1,616 (18.5%) |
| 35 to 44 Years | 7,750 (87.7%) | 1,091 (12.3%) |
| 45 to 54 Years | 6,496 (83.8%) | 1,260 (16.3%) |
| 55 to 64 Years | 4,634 (89.5%) | 544 (10.5%) |
| 65 to 74 Years | 2,934 (98.6%) | 42 (1.4%) |
| 75 Years and older | 2,655 (99.0%) | 26 (1.0%) |
| Total | 59,879 (90.8%) | 6,077 (9.2%) |
Health Insurance Coverage by Citizenship Status in Madera
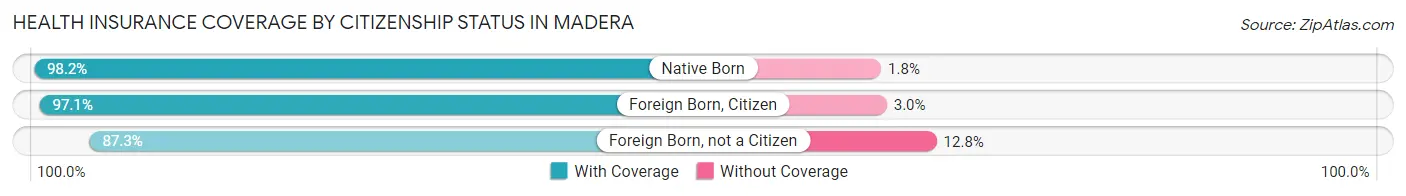
| Citizenship Status | With Coverage | Without Coverage |
| Native Born | 6,336 (98.2%) | 119 (1.8%) |
| Foreign Born, Citizen | 15,814 (97.1%) | 480 (2.9%) |
| Foreign Born, not a Citizen | 6,152 (87.3%) | 899 (12.8%) |
Health Insurance Coverage by Household Income in Madera
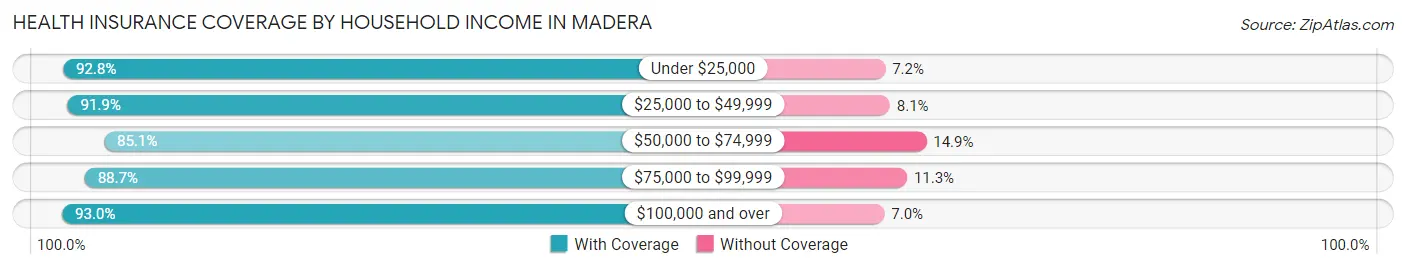
| Household Income | With Coverage | Without Coverage |
| Under $25,000 | 8,515 (92.8%) | 661 (7.2%) |
| $25,000 to $49,999 | 14,076 (91.9%) | 1,234 (8.1%) |
| $50,000 to $74,999 | 8,834 (85.1%) | 1,545 (14.9%) |
| $75,000 to $99,999 | 9,506 (88.7%) | 1,207 (11.3%) |
| $100,000 and over | 18,813 (93.0%) | 1,425 (7.0%) |
Public vs Private Health Insurance Coverage by Age in Madera
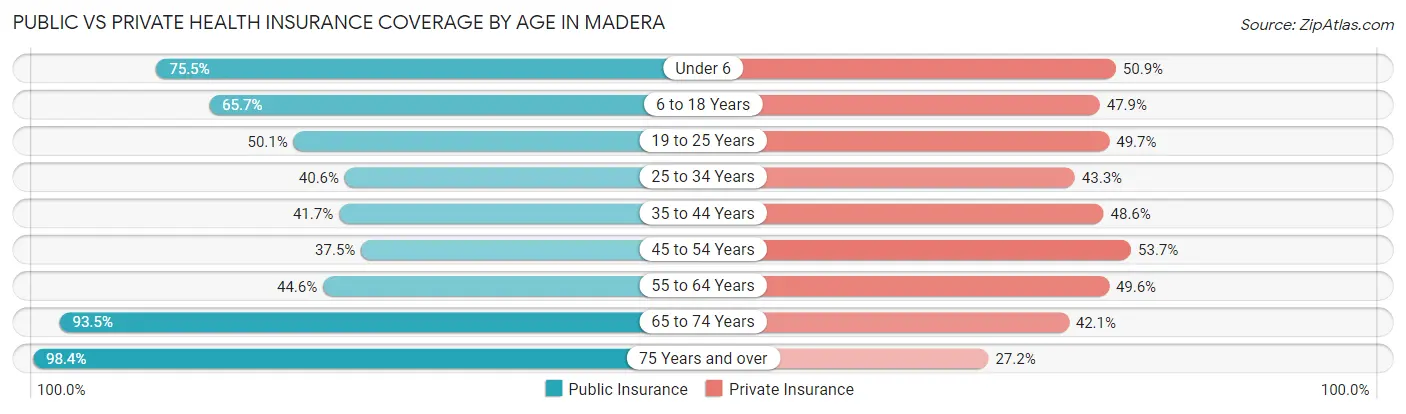
| Age Bracket | Public Insurance | Private Insurance |
| Under 6 | 4,876 (75.5%) | 3,284 (50.9%) |
| 6 to 18 Years | 10,711 (65.7%) | 7,803 (47.9%) |
| 19 to 25 Years | 3,531 (50.1%) | 3,501 (49.6%) |
| 25 to 34 Years | 3,538 (40.6%) | 3,775 (43.3%) |
| 35 to 44 Years | 3,682 (41.6%) | 4,297 (48.6%) |
| 45 to 54 Years | 2,911 (37.5%) | 4,165 (53.7%) |
| 55 to 64 Years | 2,310 (44.6%) | 2,568 (49.6%) |
| 65 to 74 Years | 2,783 (93.5%) | 1,254 (42.1%) |
| 75 Years and over | 2,639 (98.4%) | 730 (27.2%) |
| Total | 36,981 (56.1%) | 31,377 (47.6%) |
Disability Status by Sex by Age in Madera
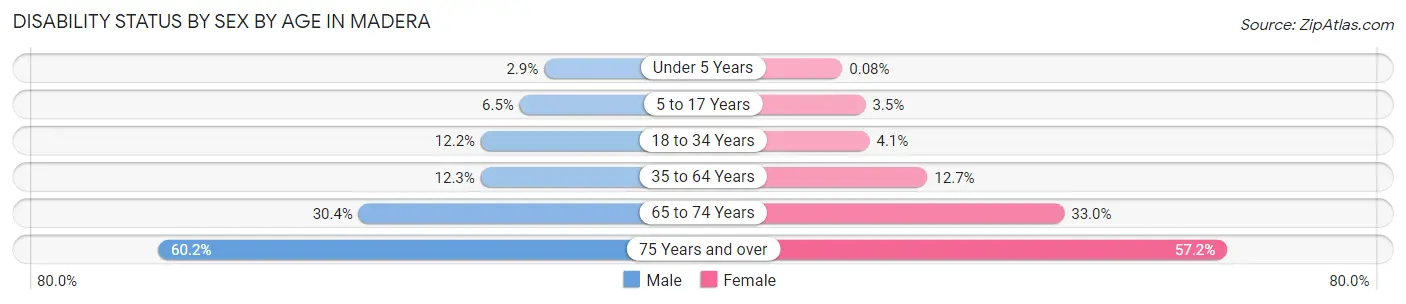
| Age Bracket | Male | Female |
| Under 5 Years | 80 (2.9%) | 2 (0.1%) |
| 5 to 17 Years | 497 (6.5%) | 304 (3.5%) |
| 18 to 34 Years | 1,056 (12.2%) | 346 (4.1%) |
| 35 to 64 Years | 1,295 (12.3%) | 1,428 (12.7%) |
| 65 to 74 Years | 417 (30.4%) | 530 (33.0%) |
| 75 Years and over | 653 (60.2%) | 913 (57.2%) |
Disability Class by Sex by Age in Madera
Disability Class: Hearing Difficulty
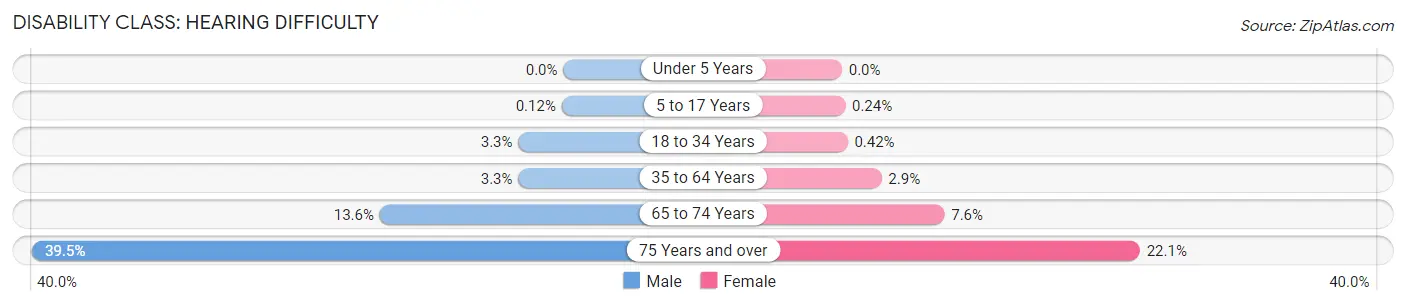
| Age Bracket | Male | Female |
| Under 5 Years | 0 (0.0%) | 0 (0.0%) |
| 5 to 17 Years | 9 (0.1%) | 21 (0.2%) |
| 18 to 34 Years | 288 (3.3%) | 35 (0.4%) |
| 35 to 64 Years | 352 (3.3%) | 330 (2.9%) |
| 65 to 74 Years | 187 (13.6%) | 122 (7.6%) |
| 75 Years and over | 428 (39.5%) | 353 (22.1%) |
Disability Class: Vision Difficulty
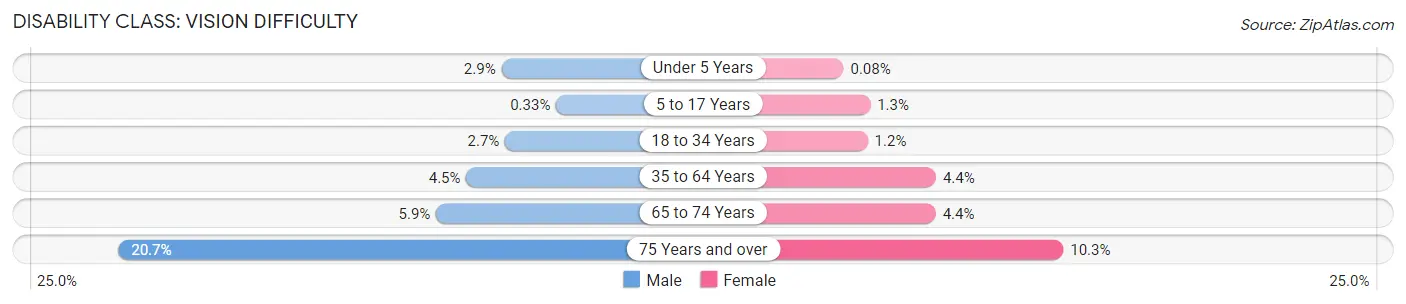
| Age Bracket | Male | Female |
| Under 5 Years | 80 (2.9%) | 2 (0.1%) |
| 5 to 17 Years | 25 (0.3%) | 114 (1.3%) |
| 18 to 34 Years | 233 (2.7%) | 101 (1.2%) |
| 35 to 64 Years | 474 (4.5%) | 491 (4.4%) |
| 65 to 74 Years | 81 (5.9%) | 70 (4.4%) |
| 75 Years and over | 224 (20.6%) | 164 (10.3%) |
Disability Class: Cognitive Difficulty
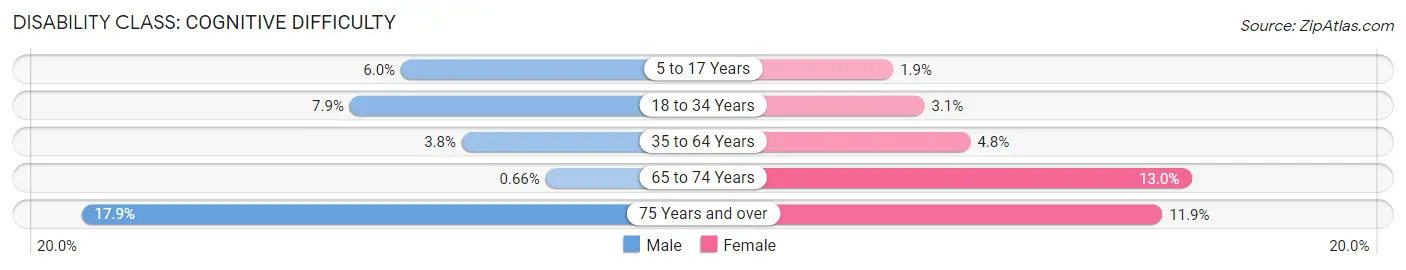
| Age Bracket | Male | Female |
| 5 to 17 Years | 463 (6.0%) | 165 (1.9%) |
| 18 to 34 Years | 684 (7.9%) | 258 (3.1%) |
| 35 to 64 Years | 397 (3.8%) | 537 (4.8%) |
| 65 to 74 Years | 9 (0.7%) | 208 (13.0%) |
| 75 Years and over | 194 (17.9%) | 190 (11.9%) |
Disability Class: Ambulatory Difficulty
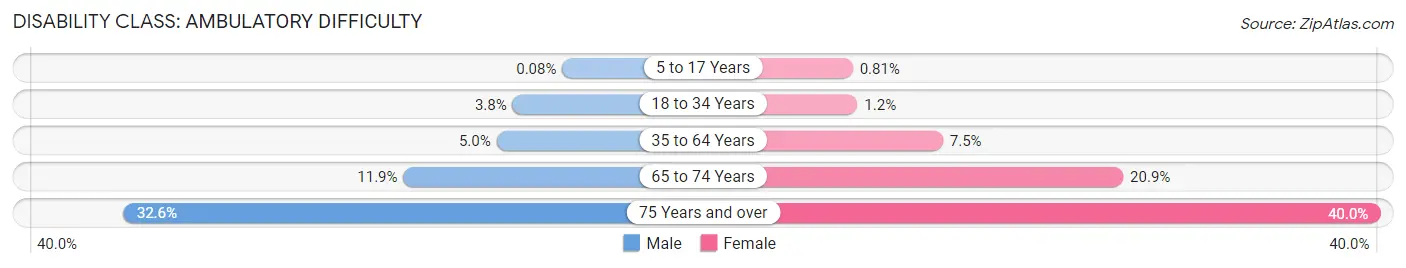
| Age Bracket | Male | Female |
| 5 to 17 Years | 6 (0.1%) | 70 (0.8%) |
| 18 to 34 Years | 325 (3.8%) | 97 (1.2%) |
| 35 to 64 Years | 523 (5.0%) | 843 (7.5%) |
| 65 to 74 Years | 163 (11.9%) | 335 (20.9%) |
| 75 Years and over | 354 (32.6%) | 638 (40.0%) |
Disability Class: Self-Care Difficulty
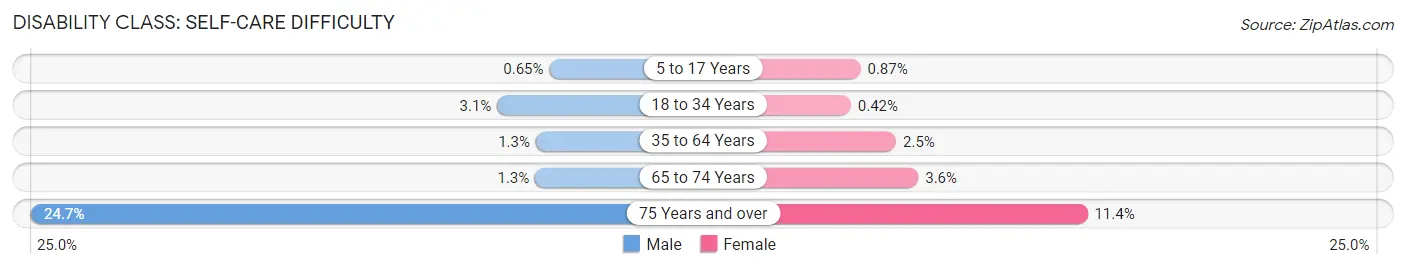
| Age Bracket | Male | Female |
| 5 to 17 Years | 50 (0.6%) | 75 (0.9%) |
| 18 to 34 Years | 265 (3.1%) | 35 (0.4%) |
| 35 to 64 Years | 135 (1.3%) | 283 (2.5%) |
| 65 to 74 Years | 18 (1.3%) | 57 (3.5%) |
| 75 Years and over | 268 (24.7%) | 182 (11.4%) |
Technology Access in Madera
Computing Device Access in Madera
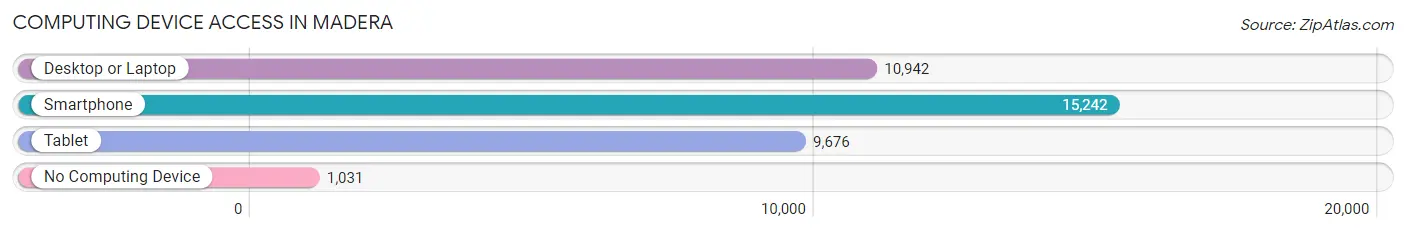
| Device Type | # Households | % Households |
| Desktop or Laptop | 10,942 | 64.9% |
| Smartphone | 15,242 | 90.3% |
| Tablet | 9,676 | 57.4% |
| No Computing Device | 1,031 | 6.1% |
| Total | 16,871 | 100.0% |
Internet Access in Madera
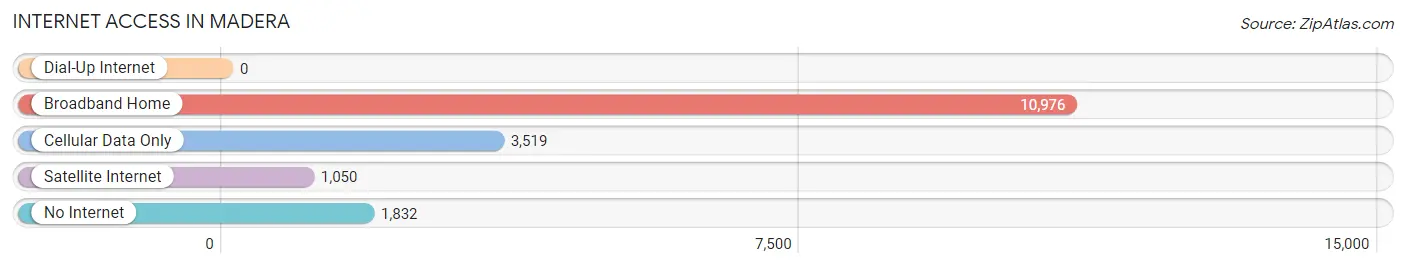
| Internet Type | # Households | % Households |
| Dial-Up Internet | 0 | 0.0% |
| Broadband Home | 10,976 | 65.1% |
| Cellular Data Only | 3,519 | 20.9% |
| Satellite Internet | 1,050 | 6.2% |
| No Internet | 1,832 | 10.9% |
| Total | 16,871 | 100.0% |
Madera Summary
Madera, California is a city located in the Central Valley of California, in the San Joaquin Valley region. It is the county seat of Madera County and is situated in the foothills of the Sierra Nevada Mountains. The city has a population of approximately 64,000 people and is the gateway to Yosemite National Park.
History
Madera was founded in 1876 by John R. Miller, a former Union Army soldier who had served in the Civil War. Miller had been granted a land grant from the U.S. government and he chose the area that is now Madera as the site for his new town. He named the town after the Spanish word for wood, “madera”, because of the abundance of timber in the area.
The town quickly grew and by the early 1900s, it had become a major agricultural center. The area was known for its production of grapes, peaches, and other fruits and vegetables. The town was also home to a large lumber industry, which provided much of the timber used in the construction of the nearby Yosemite National Park.
In the early 20th century, Madera was a popular destination for tourists, who came to enjoy the scenery and the outdoor activities available in the area. The town was also home to a large number of Basque immigrants, who had come to the area to work in the lumber and agricultural industries.
Geography
Madera is located in the Central Valley of California, in the San Joaquin Valley region. It is situated in the foothills of the Sierra Nevada Mountains, about 60 miles north of Fresno. The city is bordered by the Fresno River to the east and the Chowchilla River to the west.
The city has a total area of 16.3 square miles, of which 16.2 square miles is land and 0.1 square miles is water. The elevation of the city is approximately 300 feet above sea level.
Economy
Madera’s economy is largely based on agriculture and tourism. The city is home to a large number of vineyards and wineries, as well as a variety of other agricultural businesses. The city is also home to a number of manufacturing companies, including a large furniture factory.
Tourism is also an important part of the local economy. Madera is located near Yosemite National Park, which attracts millions of visitors each year. The city is also home to a number of outdoor recreation areas, including Bass Lake and the Sierra National Forest.
Demographics
As of the 2010 census, the population of Madera was 64,869. The racial makeup of the city was 57.2% White, 2.2% African American, 1.2% Native American, 1.3% Asian, 0.2% Pacific Islander, and 37.1% from other races. Hispanic or Latino of any race were 64.2% of the population.
The median household income in Madera was $41,919, and the median family income was $48,919. The per capita income for the city was $19,845. About 17.2% of families and 21.3% of the population were below the poverty line, including 28.2% of those under age 18 and 11.2% of those age 65 or over.
Common Questions
What is Per Capita Income in Madera?
Per Capita income in Madera is $23,006.
What is the Median Family Income in Madera?
Median Family Income in Madera is $61,323.
What is the Median Household income in Madera?
Median Household Income in Madera is $61,626.
What is Income or Wage Gap in Madera?
Income or Wage Gap in Madera is 22.1%.
Women in Madera earn 77.9 cents for every dollar earned by a man.
What is Family Income Deficit in Madera?
Family Income Deficit in Madera is $10,876.
Families that are below poverty line in Madera earn $10,876 less on average than the poverty threshold level.
What is Inequality or Gini Index in Madera?
Inequality or Gini Index in Madera is 0.47.
What is the Total Population of Madera?
Total Population of Madera is 66,784.
What is the Total Male Population of Madera?
Total Male Population of Madera is 32,627.
What is the Total Female Population of Madera?
Total Female Population of Madera is 34,157.
What is the Ratio of Males per 100 Females in Madera?
There are 95.52 Males per 100 Females in Madera.
What is the Ratio of Females per 100 Males in Madera?
There are 104.69 Females per 100 Males in Madera.
What is the Median Population Age in Madera?
Median Population Age in Madera is 29.2 Years.
What is the Average Family Size in Madera
Average Family Size in Madera is 4.2 People.
What is the Average Household Size in Madera
Average Household Size in Madera is 3.9 People.
How Large is the Labor Force in Madera?
There are 30,288 People in the Labor Forcein in Madera.
What is the Percentage of People in the Labor Force in Madera?
63.3% of People are in the Labor Force in Madera.
What is the Unemployment Rate in Madera?
Unemployment Rate in Madera is 12.8%.