Cicero, IL Map & Demographics
Cicero Map
Cicero Overview
$23,597
PER CAPITA INCOME
$69,785
AVG FAMILY INCOME
$64,325
AVG HOUSEHOLD INCOME
26.8%
WAGE / INCOME GAP [ % ]
73.2¢/ $1
WAGE / INCOME GAP [ $ ]
$10,597
FAMILY INCOME DEFICIT
0.40
INEQUALITY / GINI INDEX
84,189
TOTAL POPULATION
41,508
MALE POPULATION
42,681
FEMALE POPULATION
97.25
MALES / 100 FEMALES
102.83
FEMALES / 100 MALES
33.4
MEDIAN AGE
3.9
AVG FAMILY SIZE
3.4
AVG HOUSEHOLD SIZE
41,252
LABOR FORCE [ PEOPLE ]
62.9%
PERCENT IN LABOR FORCE
3.9%
UNEMPLOYMENT RATE
Cicero Zip Codes
Income in Cicero
Income Overview in Cicero
Per Capita Income in Cicero is $23,597, while median incomes of families and households are $69,785 and $64,325 respectively.
| Characteristic | Number | Measure |
| Per Capita Income | 84,189 | $23,597 |
| Median Family Income | 18,469 | $69,785 |
| Mean Family Income | 18,469 | $83,718 |
| Median Household Income | 24,600 | $64,325 |
| Mean Household Income | 24,600 | $78,091 |
| Income Deficit | 18,469 | $10,597 |
| Wage / Income Gap (%) | 84,189 | 26.77% |
| Wage / Income Gap ($) | 84,189 | 73.23¢ per $1 |
| Gini / Inequality Index | 84,189 | 0.40 |
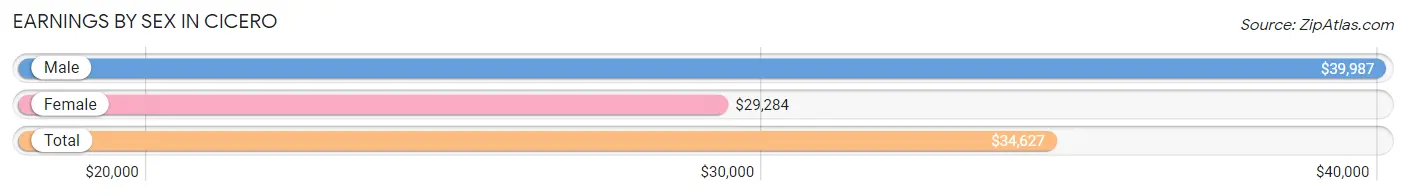
Earnings by Sex in Cicero
Average Earnings in Cicero are $34,627, $39,987 for men and $29,284 for women, a difference of 26.8%.
| Sex | Number | Average Earnings |
| Male | 23,798 (56.7%) | $39,987 |
| Female | 18,207 (43.3%) | $29,284 |
| Total | 42,005 (100.0%) | $34,627 |
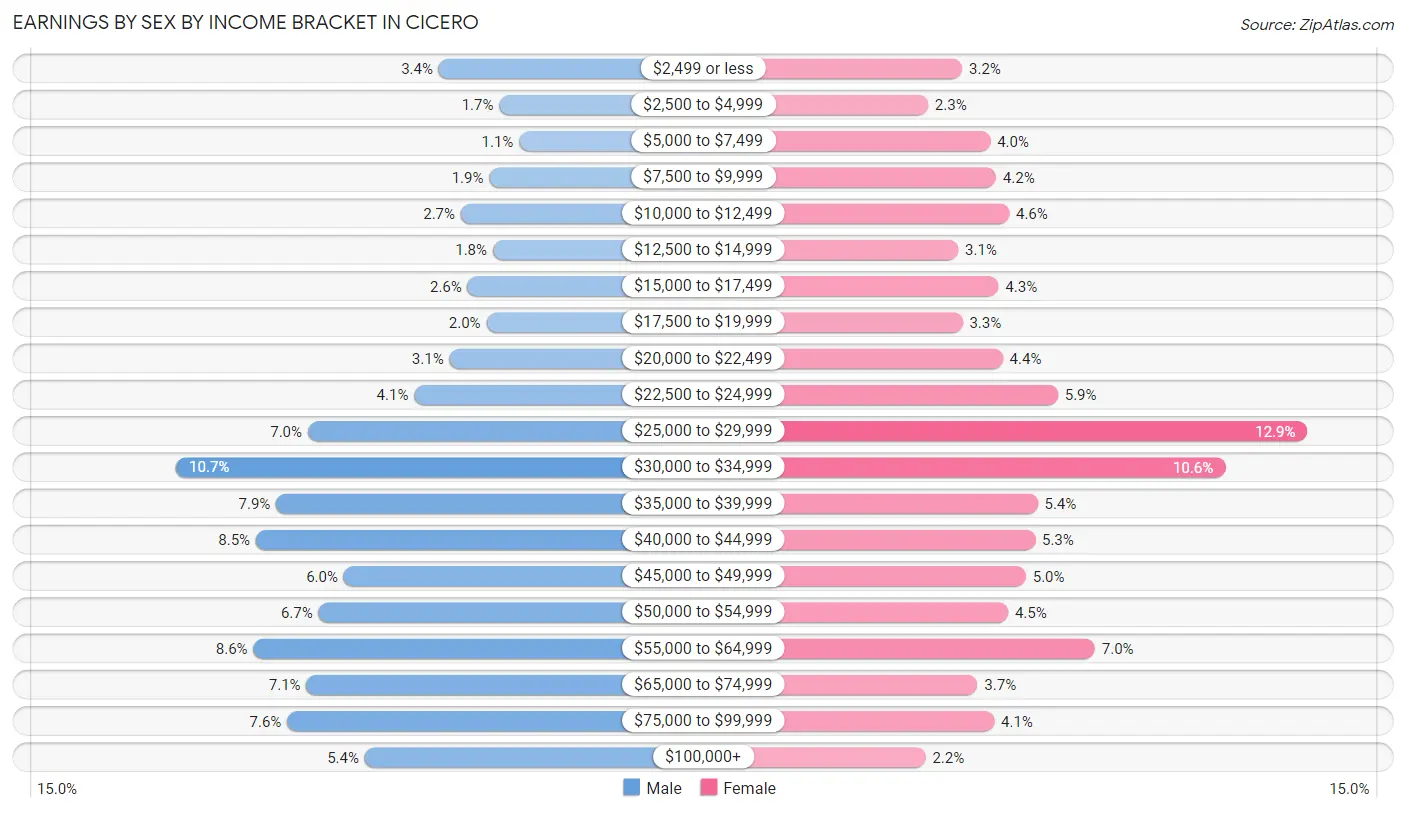
Earnings by Sex by Income Bracket in Cicero
The most common earnings brackets in Cicero are $30,000 to $34,999 for men (2,555 | 10.7%) and $25,000 to $29,999 for women (2,356 | 12.9%).
| Income | Male | Female |
| $2,499 or less | 799 (3.4%) | 589 (3.2%) |
| $2,500 to $4,999 | 394 (1.7%) | 416 (2.3%) |
| $5,000 to $7,499 | 262 (1.1%) | 733 (4.0%) |
| $7,500 to $9,999 | 461 (1.9%) | 762 (4.2%) |
| $10,000 to $12,499 | 651 (2.7%) | 831 (4.6%) |
| $12,500 to $14,999 | 438 (1.8%) | 569 (3.1%) |
| $15,000 to $17,499 | 608 (2.5%) | 775 (4.3%) |
| $17,500 to $19,999 | 481 (2.0%) | 591 (3.3%) |
| $20,000 to $22,499 | 729 (3.1%) | 798 (4.4%) |
| $22,500 to $24,999 | 963 (4.1%) | 1,079 (5.9%) |
| $25,000 to $29,999 | 1,675 (7.0%) | 2,356 (12.9%) |
| $30,000 to $34,999 | 2,555 (10.7%) | 1,935 (10.6%) |
| $35,000 to $39,999 | 1,887 (7.9%) | 975 (5.4%) |
| $40,000 to $44,999 | 2,022 (8.5%) | 964 (5.3%) |
| $45,000 to $49,999 | 1,435 (6.0%) | 915 (5.0%) |
| $50,000 to $54,999 | 1,605 (6.7%) | 825 (4.5%) |
| $55,000 to $64,999 | 2,040 (8.6%) | 1,269 (7.0%) |
| $65,000 to $74,999 | 1,685 (7.1%) | 669 (3.7%) |
| $75,000 to $99,999 | 1,813 (7.6%) | 754 (4.1%) |
| $100,000+ | 1,295 (5.4%) | 402 (2.2%) |
| Total | 23,798 (100.0%) | 18,207 (100.0%) |
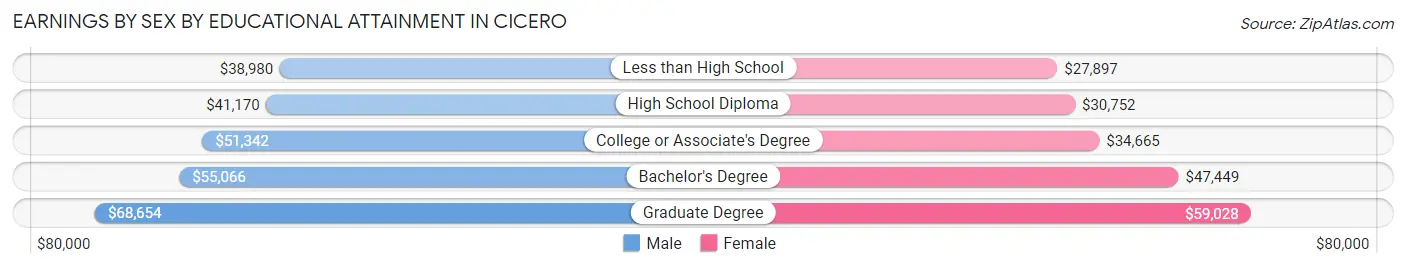
Earnings by Sex by Educational Attainment in Cicero
Average earnings in Cicero are $42,799 for men and $33,006 for women, a difference of 22.9%. Men with an educational attainment of graduate degree enjoy the highest average annual earnings of $68,654, while those with less than high school education earn the least with $38,980. Women with an educational attainment of graduate degree earn the most with the average annual earnings of $59,028, while those with less than high school education have the smallest earnings of $27,897.
| Educational Attainment | Male Income | Female Income |
| Less than High School | $38,980 | $27,897 |
| High School Diploma | $41,170 | $30,752 |
| College or Associate's Degree | $51,342 | $34,665 |
| Bachelor's Degree | $55,066 | $47,449 |
| Graduate Degree | $68,654 | $59,028 |
| Total | $42,799 | $33,006 |
Family Income in Cicero
Family Income Brackets in Cicero
According to the Cicero family income data, there are 4,192 families falling into the $50,000 to $74,999 income range, which is the most common income bracket and makes up 22.7% of all families. Conversely, the $10,000 to $14,999 income bracket is the least frequent group with only 296 families (1.6%) belonging to this category.
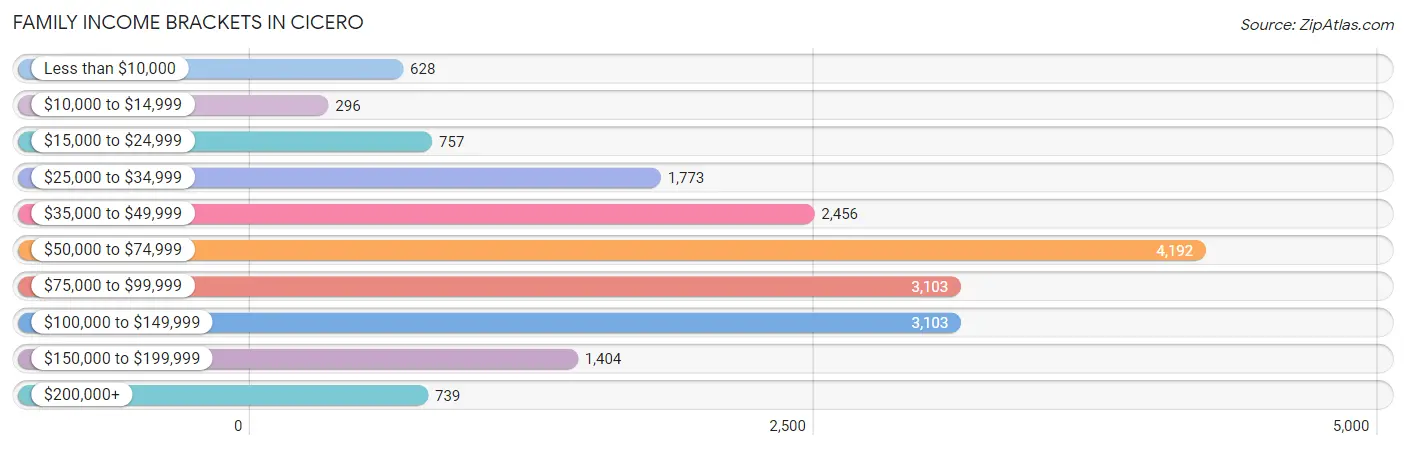
| Income Bracket | # Families | % Families |
| Less than $10,000 | 628 | 3.4% |
| $10,000 to $14,999 | 296 | 1.6% |
| $15,000 to $24,999 | 757 | 4.1% |
| $25,000 to $34,999 | 1,773 | 9.6% |
| $35,000 to $49,999 | 2,456 | 13.3% |
| $50,000 to $74,999 | 4,192 | 22.7% |
| $75,000 to $99,999 | 3,103 | 16.8% |
| $100,000 to $149,999 | 3,103 | 16.8% |
| $150,000 to $199,999 | 1,404 | 7.6% |
| $200,000+ | 739 | 4.0% |
Family Income by Famaliy Size in Cicero
6-person families (1,371 | 7.4%) account for the highest median family income in Cicero with $112,535 per family, while 2-person families (5,162 | 28.0%) have the highest median income of $27,480 per family member.
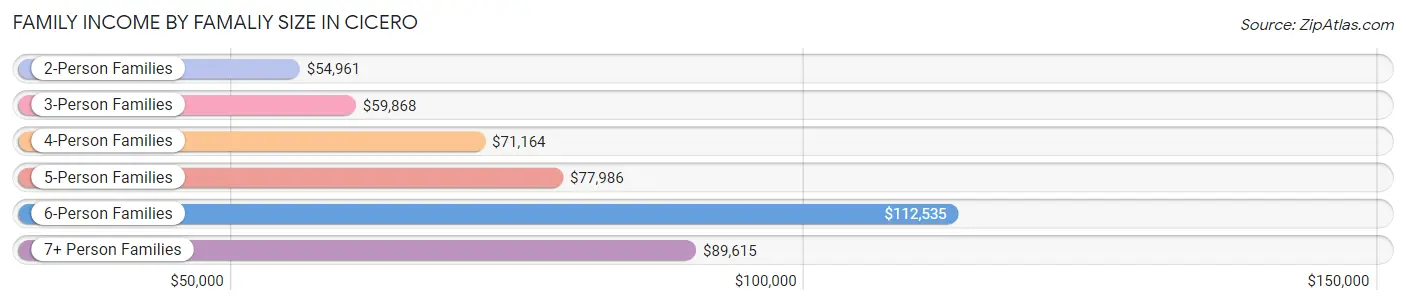
| Income Bracket | # Families | Median Income |
| 2-Person Families | 5,162 (28.0%) | $54,961 |
| 3-Person Families | 4,105 (22.2%) | $59,868 |
| 4-Person Families | 4,383 (23.7%) | $71,164 |
| 5-Person Families | 2,380 (12.9%) | $77,986 |
| 6-Person Families | 1,371 (7.4%) | $112,535 |
| 7+ Person Families | 1,068 (5.8%) | $89,615 |
| Total | 18,469 (100.0%) | $69,785 |
Family Income by Number of Earners in Cicero
The median family income in Cicero is $69,785, with families comprising 3+ earners (3,781) having the highest median family income of $120,772, while families with no earners (1,363) have the lowest median family income of $28,102, accounting for 20.5% and 7.4% of families, respectively.
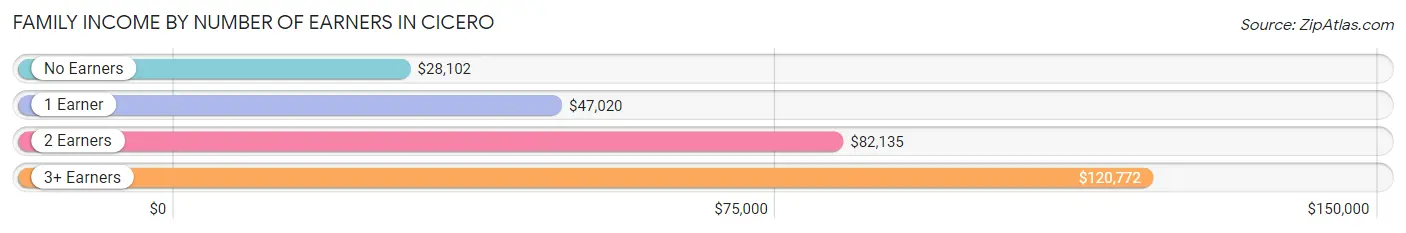
| Number of Earners | # Families | Median Income |
| No Earners | 1,363 (7.4%) | $28,102 |
| 1 Earner | 6,639 (35.9%) | $47,020 |
| 2 Earners | 6,686 (36.2%) | $82,135 |
| 3+ Earners | 3,781 (20.5%) | $120,772 |
| Total | 18,469 (100.0%) | $69,785 |
Household Income in Cicero
Household Income Brackets in Cicero
With 5,461 households falling in the category, the $50,000 to $74,999 income range is the most frequent in Cicero, accounting for 22.2% of all households. In contrast, only 935 households (3.8%) fall into the $200,000+ income bracket, making it the least populous group.
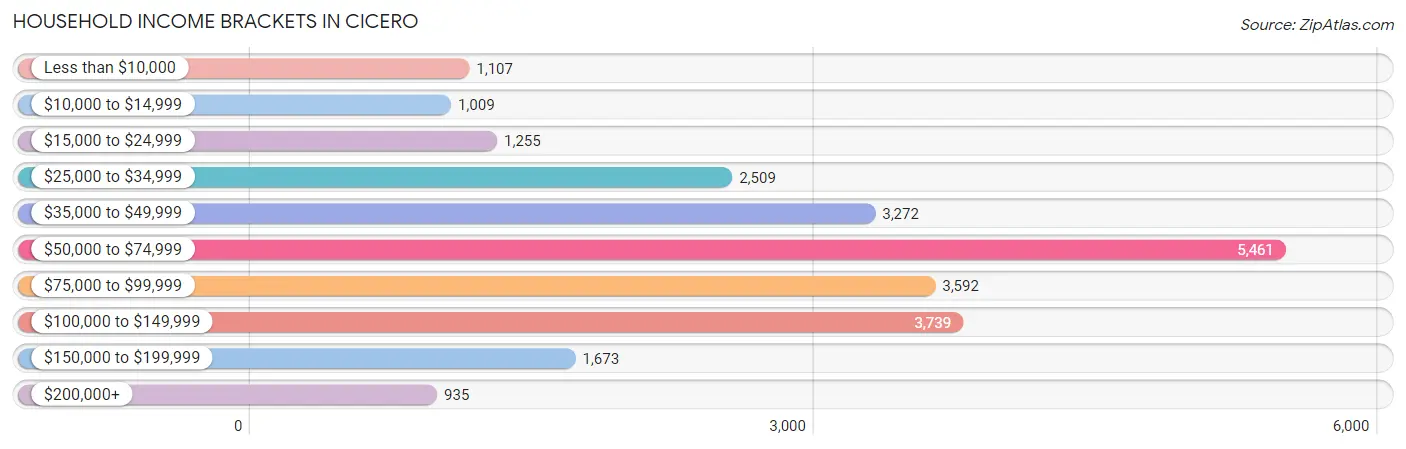
| Income Bracket | # Households | % Households |
| Less than $10,000 | 1,107 | 4.5% |
| $10,000 to $14,999 | 1,009 | 4.1% |
| $15,000 to $24,999 | 1,255 | 5.1% |
| $25,000 to $34,999 | 2,509 | 10.2% |
| $35,000 to $49,999 | 3,272 | 13.3% |
| $50,000 to $74,999 | 5,461 | 22.2% |
| $75,000 to $99,999 | 3,592 | 14.6% |
| $100,000 to $149,999 | 3,739 | 15.2% |
| $150,000 to $199,999 | 1,673 | 6.8% |
| $200,000+ | 935 | 3.8% |
Household Income by Householder Age in Cicero
The median household income in Cicero is $64,325, with the highest median household income of $71,991 found in the 45 to 64 years age bracket for the primary householder. A total of 10,188 households (41.4%) fall into this category. Meanwhile, the 65+ years age bracket for the primary householder has the lowest median household income of $46,553, with 4,132 households (16.8%) in this group.
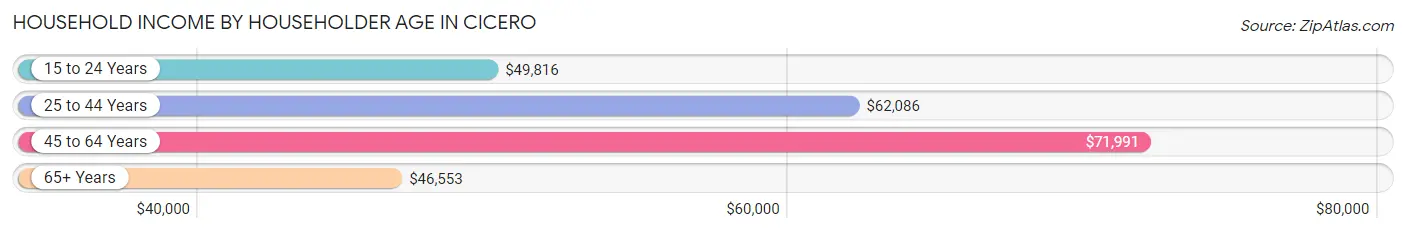
| Income Bracket | # Households | Median Income |
| 15 to 24 Years | 1,125 (4.6%) | $49,816 |
| 25 to 44 Years | 9,155 (37.2%) | $62,086 |
| 45 to 64 Years | 10,188 (41.4%) | $71,991 |
| 65+ Years | 4,132 (16.8%) | $46,553 |
| Total | 24,600 (100.0%) | $64,325 |
Poverty in Cicero
Income Below Poverty by Sex and Age in Cicero
With 11.4% poverty level for males and 14.8% for females among the residents of Cicero, 16 and 17 year old males and 5 year old females are the most vulnerable to poverty, with 370 males (23.8%) and 158 females (20.8%) in their respective age groups living below the poverty level.
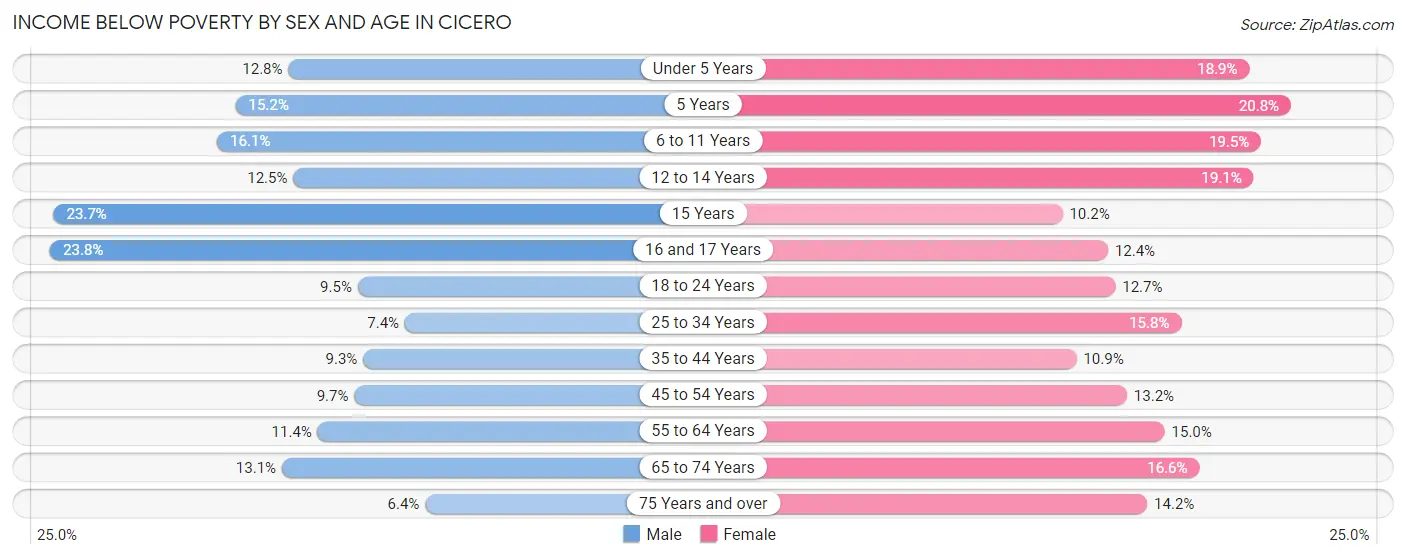
| Age Bracket | Male | Female |
| Under 5 Years | 217 (12.8%) | 510 (18.9%) |
| 5 Years | 68 (15.2%) | 158 (20.8%) |
| 6 to 11 Years | 597 (16.1%) | 630 (19.5%) |
| 12 to 14 Years | 269 (12.5%) | 388 (19.1%) |
| 15 Years | 190 (23.7%) | 59 (10.2%) |
| 16 and 17 Years | 370 (23.8%) | 241 (12.3%) |
| 18 to 24 Years | 501 (9.5%) | 743 (12.7%) |
| 25 to 34 Years | 384 (7.3%) | 890 (15.8%) |
| 35 to 44 Years | 547 (9.3%) | 615 (10.9%) |
| 45 to 54 Years | 610 (9.7%) | 655 (13.2%) |
| 55 to 64 Years | 523 (11.4%) | 623 (15.0%) |
| 65 to 74 Years | 319 (13.1%) | 467 (16.6%) |
| 75 Years and over | 59 (6.4%) | 231 (14.2%) |
| Total | 4,654 (11.4%) | 6,210 (14.8%) |
Income Above Poverty by Sex and Age in Cicero
According to the poverty statistics in Cicero, males aged 75 years and over and females aged 15 years are the age groups that are most secure financially, with 93.6% of males and 89.8% of females in these age groups living above the poverty line.
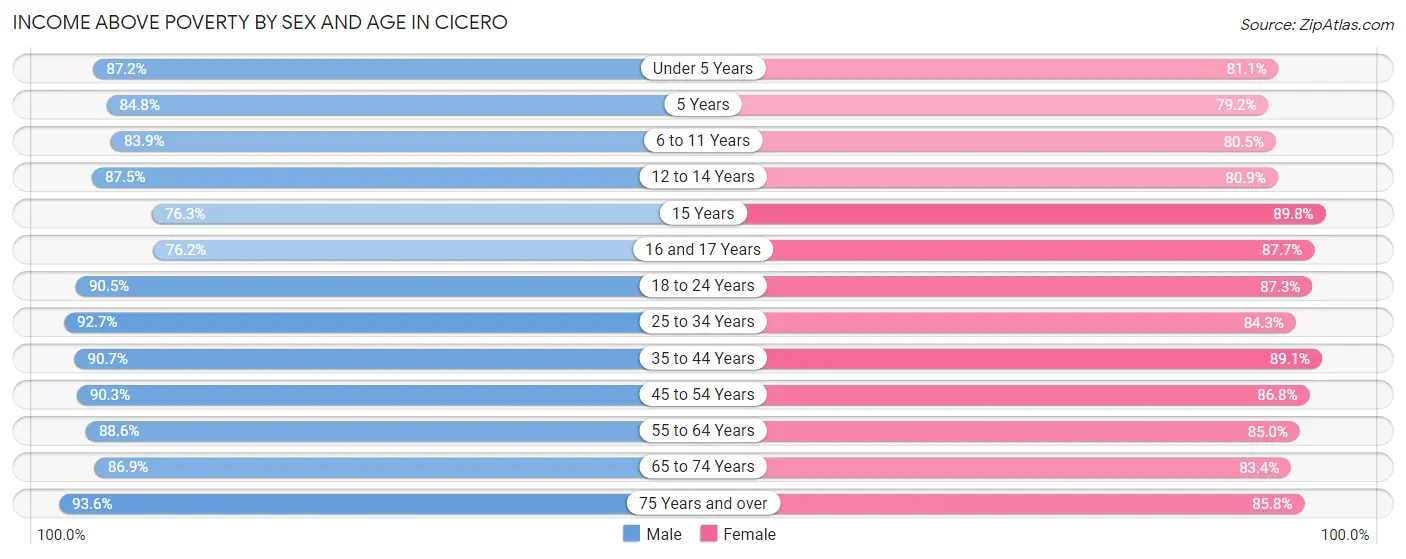
| Age Bracket | Male | Female |
| Under 5 Years | 1,483 (87.2%) | 2,187 (81.1%) |
| 5 Years | 379 (84.8%) | 600 (79.2%) |
| 6 to 11 Years | 3,117 (83.9%) | 2,608 (80.5%) |
| 12 to 14 Years | 1,877 (87.5%) | 1,642 (80.9%) |
| 15 Years | 613 (76.3%) | 517 (89.8%) |
| 16 and 17 Years | 1,183 (76.2%) | 1,710 (87.6%) |
| 18 to 24 Years | 4,753 (90.5%) | 5,111 (87.3%) |
| 25 to 34 Years | 4,844 (92.6%) | 4,762 (84.3%) |
| 35 to 44 Years | 5,344 (90.7%) | 5,034 (89.1%) |
| 45 to 54 Years | 5,679 (90.3%) | 4,294 (86.8%) |
| 55 to 64 Years | 4,065 (88.6%) | 3,536 (85.0%) |
| 65 to 74 Years | 2,123 (86.9%) | 2,348 (83.4%) |
| 75 Years and over | 862 (93.6%) | 1,399 (85.8%) |
| Total | 36,322 (88.6%) | 35,748 (85.2%) |
Income Below Poverty Among Married-Couple Families in Cicero
The poverty statistics for married-couple families in Cicero show that 5.8% or 667 of the total 11,422 families live below the poverty line. Families with 3 or 4 children have the highest poverty rate of 10.3%, comprising of 155 families. On the other hand, families with 5 or more children have the lowest poverty rate of 0.0%, which includes 0 families.
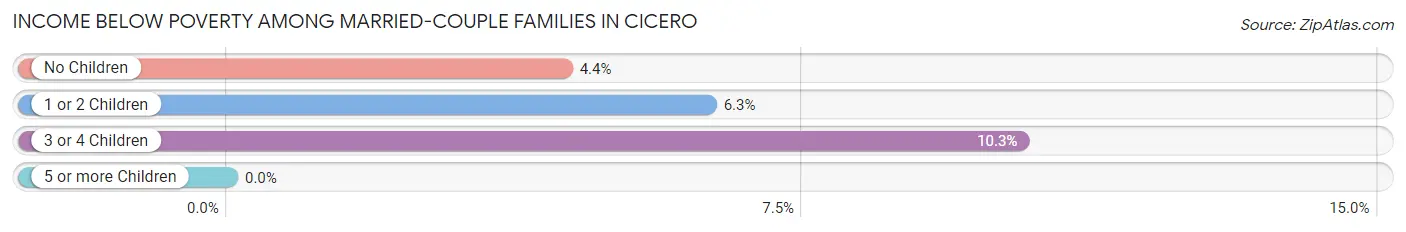
| Children | Above Poverty | Below Poverty |
| No Children | 5,140 (95.6%) | 235 (4.4%) |
| 1 or 2 Children | 4,155 (93.8%) | 277 (6.2%) |
| 3 or 4 Children | 1,346 (89.7%) | 155 (10.3%) |
| 5 or more Children | 114 (100.0%) | 0 (0.0%) |
| Total | 10,755 (94.2%) | 667 (5.8%) |
Income Below Poverty Among Single-Parent Households in Cicero
According to the poverty data in Cicero, 10.9% or 270 single-father households and 19.5% or 893 single-mother households are living below the poverty line. Among single-father households, those with 3 or 4 children have the highest poverty rate, with 68 households (28.3%) experiencing poverty. Likewise, among single-mother households, those with 3 or 4 children have the highest poverty rate, with 205 households (50.1%) falling below the poverty line.
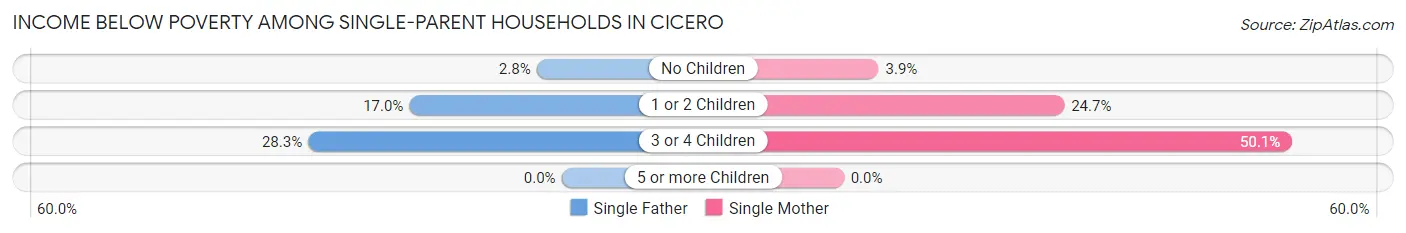
| Children | Single Father | Single Mother |
| No Children | 35 (2.8%) | 61 (3.9%) |
| 1 or 2 Children | 167 (17.0%) | 627 (24.6%) |
| 3 or 4 Children | 68 (28.3%) | 205 (50.1%) |
| 5 or more Children | 0 (0.0%) | 0 (0.0%) |
| Total | 270 (10.9%) | 893 (19.5%) |
Income Below Poverty Among Married-Couple vs Single-Parent Households in Cicero
The poverty data for Cicero shows that 667 of the married-couple family households (5.8%) and 1,163 of the single-parent households (16.5%) are living below the poverty level. Within the married-couple family households, those with 3 or 4 children have the highest poverty rate, with 155 households (10.3%) falling below the poverty line. Among the single-parent households, those with 3 or 4 children have the highest poverty rate, with 273 household (42.1%) living below poverty.
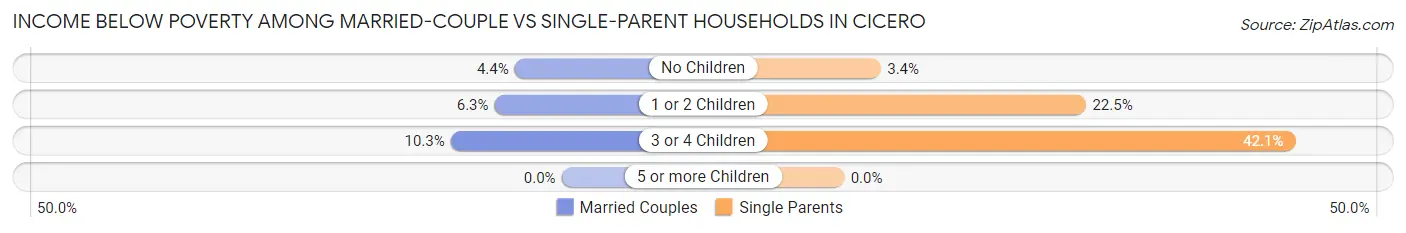
| Children | Married-Couple Families | Single-Parent Households |
| No Children | 235 (4.4%) | 96 (3.4%) |
| 1 or 2 Children | 277 (6.2%) | 794 (22.5%) |
| 3 or 4 Children | 155 (10.3%) | 273 (42.1%) |
| 5 or more Children | 0 (0.0%) | 0 (0.0%) |
| Total | 667 (5.8%) | 1,163 (16.5%) |
Race in Cicero
The most populous races in Cicero are Hispanic or Latino (73,974 | 87.9%), Some other Race (47,596 | 56.5%), and White / Caucasian (20,624 | 24.5%).
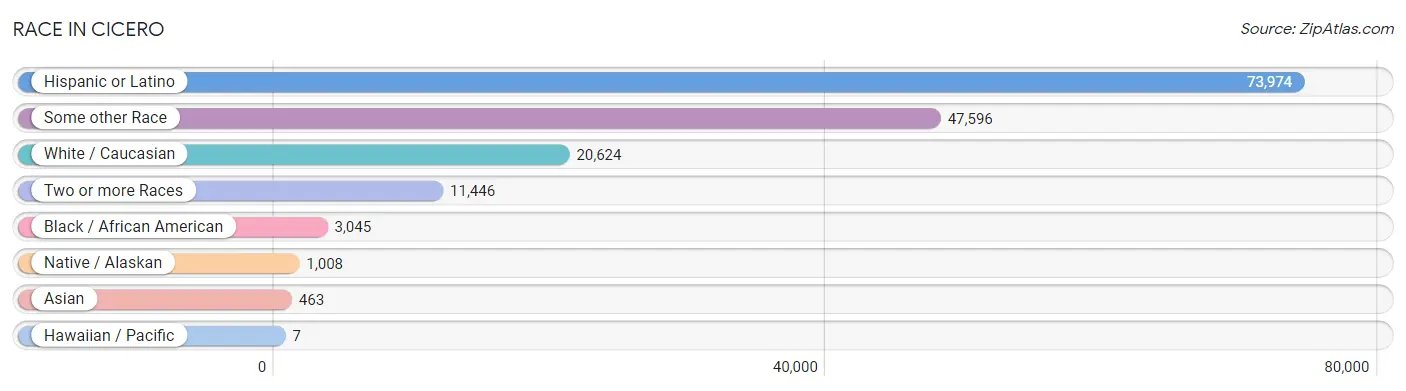
| Race | # Population | % Population |
| Asian | 463 | 0.5% |
| Black / African American | 3,045 | 3.6% |
| Hawaiian / Pacific | 7 | 0.0% |
| Hispanic or Latino | 73,974 | 87.9% |
| Native / Alaskan | 1,008 | 1.2% |
| White / Caucasian | 20,624 | 24.5% |
| Two or more Races | 11,446 | 13.6% |
| Some other Race | 47,596 | 56.5% |
| Total | 84,189 | 100.0% |
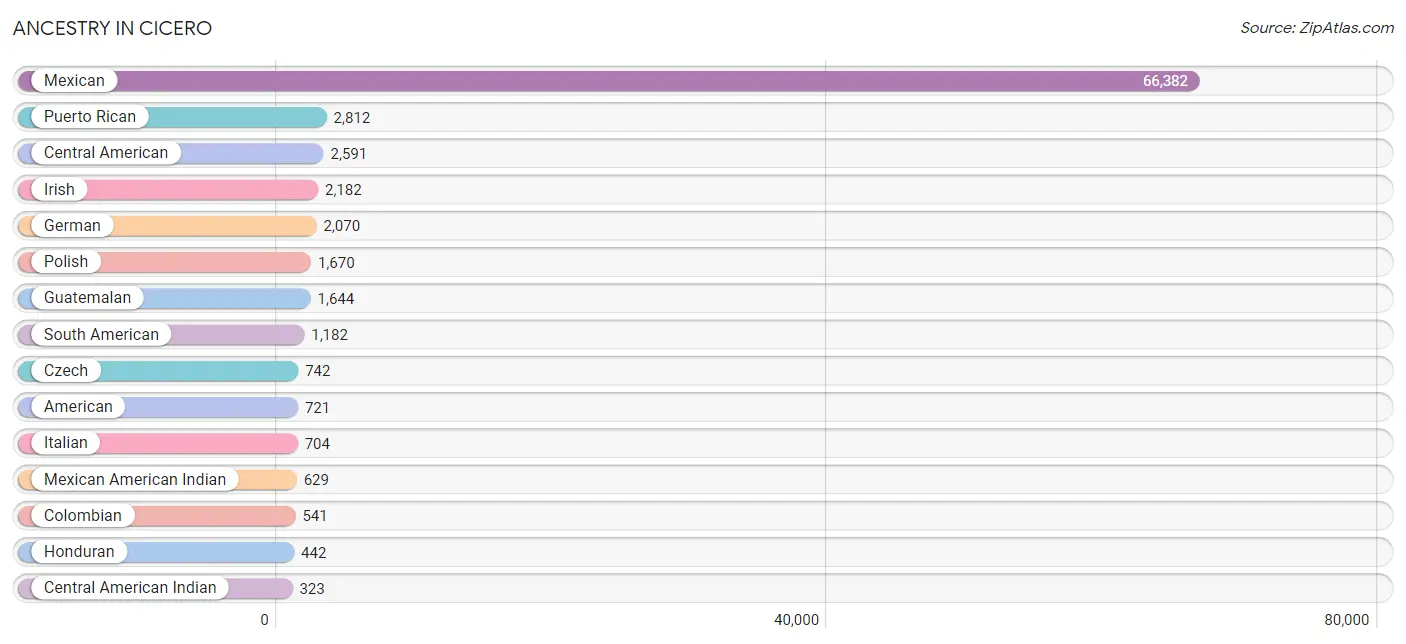
Ancestry in Cicero
The most populous ancestries reported in Cicero are Mexican (66,382 | 78.8%), Puerto Rican (2,812 | 3.3%), Central American (2,591 | 3.1%), Irish (2,182 | 2.6%), and German (2,070 | 2.5%), together accounting for 90.3% of all Cicero residents.
| Ancestry | # Population | % Population |
| African | 25 | 0.0% |
| American | 721 | 0.9% |
| Apache | 7 | 0.0% |
| Arab | 220 | 0.3% |
| Argentinean | 166 | 0.2% |
| Armenian | 35 | 0.0% |
| Belgian | 8 | 0.0% |
| Canadian | 6 | 0.0% |
| Central American | 2,591 | 3.1% |
| Central American Indian | 323 | 0.4% |
| Cherokee | 60 | 0.1% |
| Colombian | 541 | 0.6% |
| Croatian | 60 | 0.1% |
| Cuban | 49 | 0.1% |
| Czech | 742 | 0.9% |
| Czechoslovakian | 9 | 0.0% |
| Danish | 49 | 0.1% |
| Dominican | 204 | 0.2% |
| Dutch | 28 | 0.0% |
| Eastern European | 17 | 0.0% |
| Ecuadorian | 294 | 0.4% |
| English | 308 | 0.4% |
| European | 56 | 0.1% |
| Finnish | 10 | 0.0% |
| French | 253 | 0.3% |
| French Canadian | 18 | 0.0% |
| German | 2,070 | 2.5% |
| Greek | 71 | 0.1% |
| Guatemalan | 1,644 | 1.9% |
| Guyanese | 24 | 0.0% |
| Haitian | 12 | 0.0% |
| Honduran | 442 | 0.5% |
| Hungarian | 19 | 0.0% |
| Indian (Asian) | 68 | 0.1% |
| Indonesian | 90 | 0.1% |
| Iraqi | 26 | 0.0% |
| Irish | 2,182 | 2.6% |
| Israeli | 3 | 0.0% |
| Italian | 704 | 0.8% |
| Jamaican | 36 | 0.0% |
| Japanese | 11 | 0.0% |
| Kenyan | 1 | 0.0% |
| Korean | 188 | 0.2% |
| Lebanese | 14 | 0.0% |
| Lithuanian | 105 | 0.1% |
| Mexican | 66,382 | 78.8% |
| Mexican American Indian | 629 | 0.7% |
| Nicaraguan | 155 | 0.2% |
| Norwegian | 10 | 0.0% |
| Pakistani | 22 | 0.0% |
| Palestinian | 22 | 0.0% |
| Panamanian | 34 | 0.0% |
| Peruvian | 168 | 0.2% |
| Polish | 1,670 | 2.0% |
| Puerto Rican | 2,812 | 3.3% |
| Romanian | 22 | 0.0% |
| Russian | 24 | 0.0% |
| Salvadoran | 316 | 0.4% |
| Scandinavian | 4 | 0.0% |
| Scotch-Irish | 24 | 0.0% |
| Scottish | 113 | 0.1% |
| Serbian | 30 | 0.0% |
| Slovak | 4 | 0.0% |
| Slovene | 40 | 0.1% |
| South American | 1,182 | 1.4% |
| Spaniard | 151 | 0.2% |
| Spanish | 197 | 0.2% |
| Subsaharan African | 67 | 0.1% |
| Swedish | 84 | 0.1% |
| Swiss | 39 | 0.1% |
| Thai | 56 | 0.1% |
| Turkish | 27 | 0.0% |
| Ugandan | 41 | 0.1% |
| Ukrainian | 76 | 0.1% |
| Uruguayan | 5 | 0.0% |
| Venezuelan | 8 | 0.0% |
| Welsh | 16 | 0.0% |
| Yaqui | 7 | 0.0% |
| Yugoslavian | 21 | 0.0% | View All 79 Rows |
Immigrants in Cicero
The most numerous immigrant groups reported in Cicero came from Latin America (31,575 | 37.5%), Central America (30,642 | 36.4%), Mexico (29,311 | 34.8%), Guatemala (789 | 0.9%), and South America (676 | 0.8%), together accounting for 110.5% of all Cicero residents.
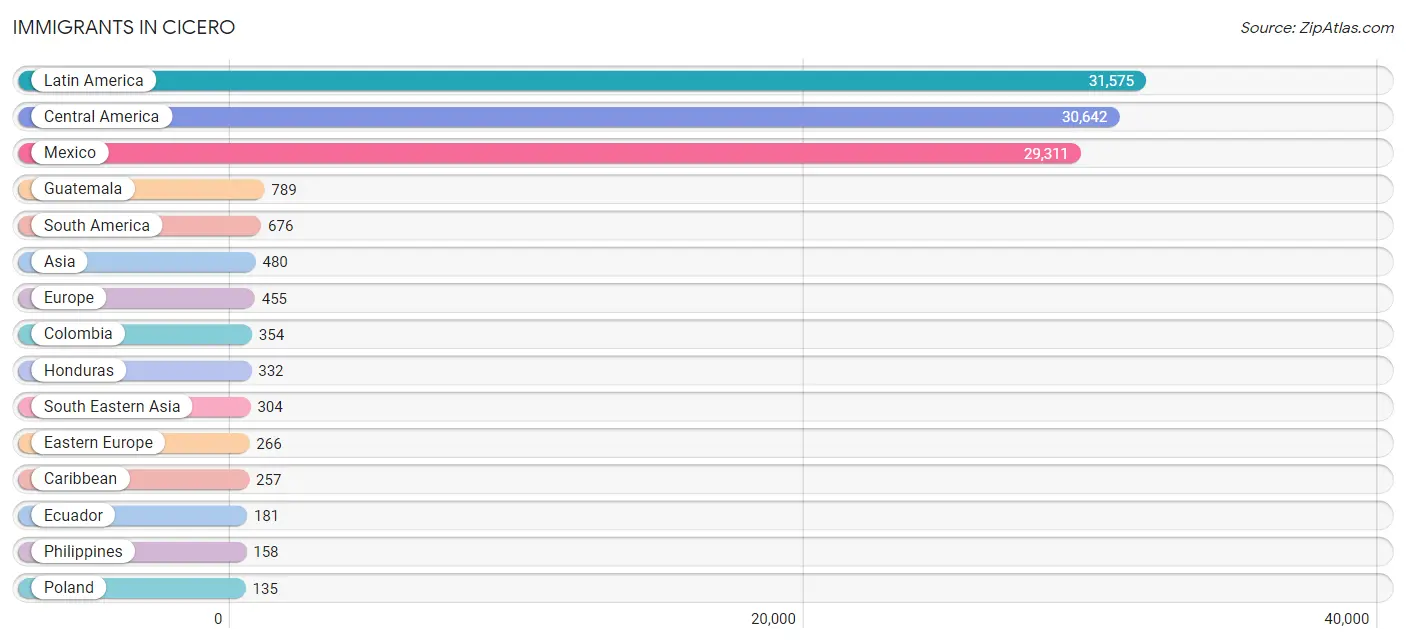
| Immigration Origin | # Population | % Population |
| Africa | 49 | 0.1% |
| Argentina | 74 | 0.1% |
| Asia | 480 | 0.6% |
| Cambodia | 23 | 0.0% |
| Canada | 12 | 0.0% |
| Caribbean | 257 | 0.3% |
| Central America | 30,642 | 36.4% |
| Chile | 25 | 0.0% |
| China | 29 | 0.0% |
| Colombia | 354 | 0.4% |
| Cuba | 54 | 0.1% |
| Czechoslovakia | 59 | 0.1% |
| Dominican Republic | 133 | 0.2% |
| Eastern Africa | 42 | 0.1% |
| Eastern Asia | 40 | 0.1% |
| Eastern Europe | 266 | 0.3% |
| Ecuador | 181 | 0.2% |
| El Salvador | 91 | 0.1% |
| Europe | 455 | 0.5% |
| Germany | 87 | 0.1% |
| Ghana | 7 | 0.0% |
| Greece | 12 | 0.0% |
| Guatemala | 789 | 0.9% |
| Guyana | 6 | 0.0% |
| Honduras | 332 | 0.4% |
| Hungary | 3 | 0.0% |
| India | 11 | 0.0% |
| Indonesia | 11 | 0.0% |
| Ireland | 8 | 0.0% |
| Israel | 100 | 0.1% |
| Jamaica | 70 | 0.1% |
| Kenya | 1 | 0.0% |
| Korea | 11 | 0.0% |
| Latin America | 31,575 | 37.5% |
| Mexico | 29,311 | 34.8% |
| Nicaragua | 96 | 0.1% |
| Northern Europe | 32 | 0.0% |
| Oceania | 7 | 0.0% |
| Panama | 14 | 0.0% |
| Peru | 23 | 0.0% |
| Philippines | 158 | 0.2% |
| Poland | 135 | 0.2% |
| Russia | 39 | 0.1% |
| Saudi Arabia | 25 | 0.0% |
| Serbia | 30 | 0.0% |
| South America | 676 | 0.8% |
| South Central Asia | 11 | 0.0% |
| South Eastern Asia | 304 | 0.4% |
| Southern Europe | 70 | 0.1% |
| Spain | 58 | 0.1% |
| Thailand | 22 | 0.0% |
| Uganda | 41 | 0.1% |
| Uruguay | 5 | 0.0% |
| Venezuela | 8 | 0.0% |
| Western Africa | 7 | 0.0% |
| Western Asia | 125 | 0.2% |
| Western Europe | 87 | 0.1% | View All 57 Rows |
Sex and Age in Cicero
Sex and Age in Cicero
The most populous age groups in Cicero are 20 to 24 Years (3,881 | 9.3%) for men and 15 to 19 Years (4,295 | 10.1%) for women.
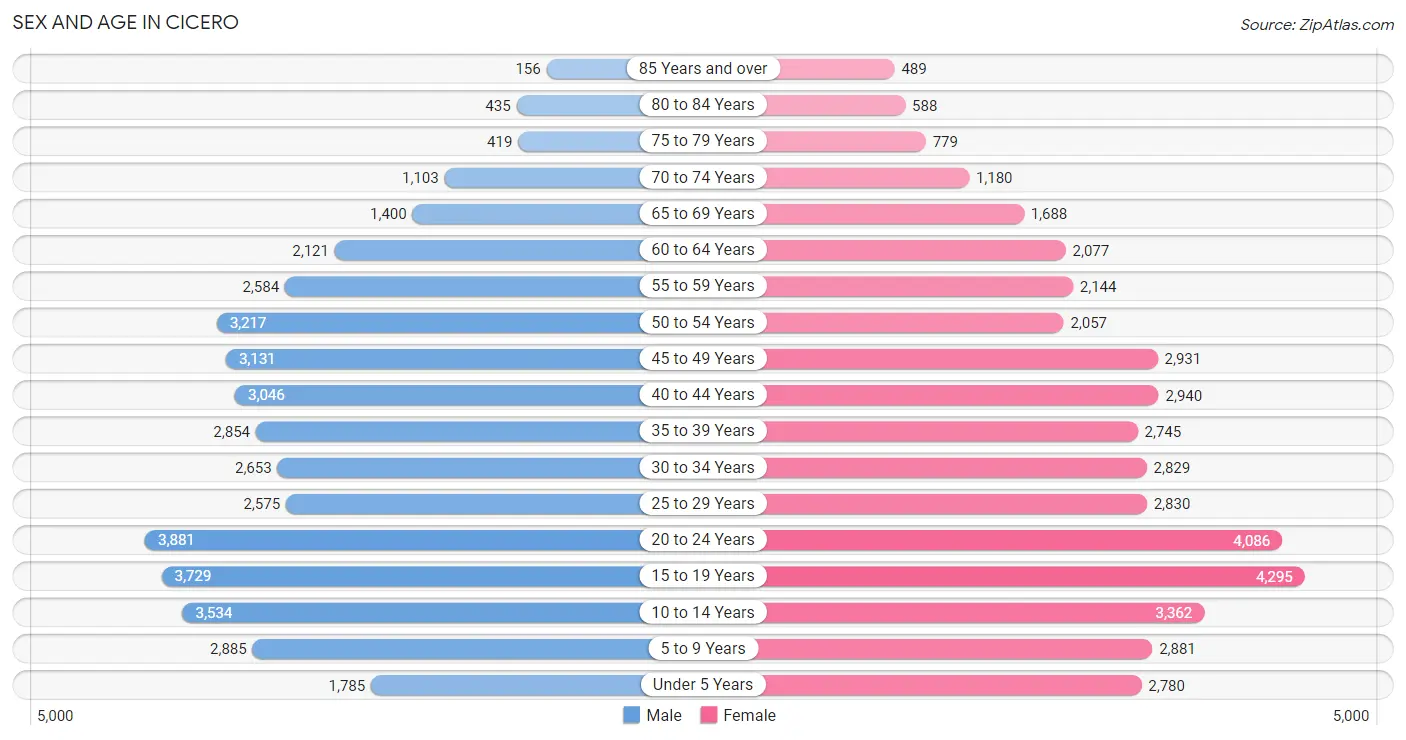
| Age Bracket | Male | Female |
| Under 5 Years | 1,785 (4.3%) | 2,780 (6.5%) |
| 5 to 9 Years | 2,885 (7.0%) | 2,881 (6.8%) |
| 10 to 14 Years | 3,534 (8.5%) | 3,362 (7.9%) |
| 15 to 19 Years | 3,729 (9.0%) | 4,295 (10.1%) |
| 20 to 24 Years | 3,881 (9.3%) | 4,086 (9.6%) |
| 25 to 29 Years | 2,575 (6.2%) | 2,830 (6.6%) |
| 30 to 34 Years | 2,653 (6.4%) | 2,829 (6.6%) |
| 35 to 39 Years | 2,854 (6.9%) | 2,745 (6.4%) |
| 40 to 44 Years | 3,046 (7.3%) | 2,940 (6.9%) |
| 45 to 49 Years | 3,131 (7.5%) | 2,931 (6.9%) |
| 50 to 54 Years | 3,217 (7.7%) | 2,057 (4.8%) |
| 55 to 59 Years | 2,584 (6.2%) | 2,144 (5.0%) |
| 60 to 64 Years | 2,121 (5.1%) | 2,077 (4.9%) |
| 65 to 69 Years | 1,400 (3.4%) | 1,688 (4.0%) |
| 70 to 74 Years | 1,103 (2.7%) | 1,180 (2.8%) |
| 75 to 79 Years | 419 (1.0%) | 779 (1.8%) |
| 80 to 84 Years | 435 (1.1%) | 588 (1.4%) |
| 85 Years and over | 156 (0.4%) | 489 (1.1%) |
| Total | 41,508 (100.0%) | 42,681 (100.0%) |
Families and Households in Cicero
Median Family Size in Cicero
The median family size in Cicero is 3.89 persons per family, with married-couple families (11,422 | 61.8%) accounting for the largest median family size of 4.18 persons per family. On the other hand, single male/father families (2,475 | 13.4%) represent the smallest median family size with 3.15 persons per family.
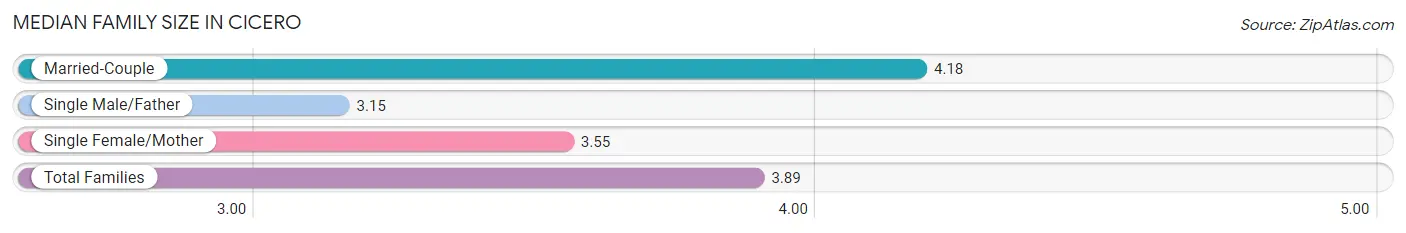
| Family Type | # Families | Family Size |
| Married-Couple | 11,422 (61.8%) | 4.18 |
| Single Male/Father | 2,475 (13.4%) | 3.15 |
| Single Female/Mother | 4,572 (24.7%) | 3.55 |
| Total Families | 18,469 (100.0%) | 3.89 |
Median Household Size in Cicero
The median household size in Cicero is 3.39 persons per household, with married-couple households (11,422 | 46.4%) accounting for the largest median household size of 4.27 persons per household. non-family households (6,131 | 24.9%) represent the smallest median household size with 1.31 persons per household.
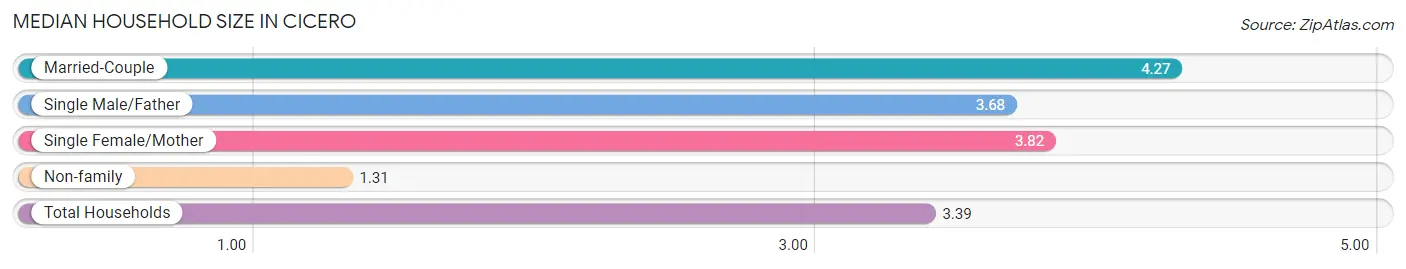
| Household Type | # Households | Household Size |
| Married-Couple | 11,422 (46.4%) | 4.27 |
| Single Male/Father | 2,475 (10.1%) | 3.68 |
| Single Female/Mother | 4,572 (18.6%) | 3.82 |
| Non-family | 6,131 (24.9%) | 1.31 |
| Total Households | 24,600 (100.0%) | 3.39 |
Household Size by Marriage Status in Cicero
Out of a total of 24,600 households in Cicero, 18,469 (75.1%) are family households, while 6,131 (24.9%) are nonfamily households. The most numerous type of family households are 4-person households, comprising 4,516, and the most common type of nonfamily households are 1-person households, comprising 5,028.
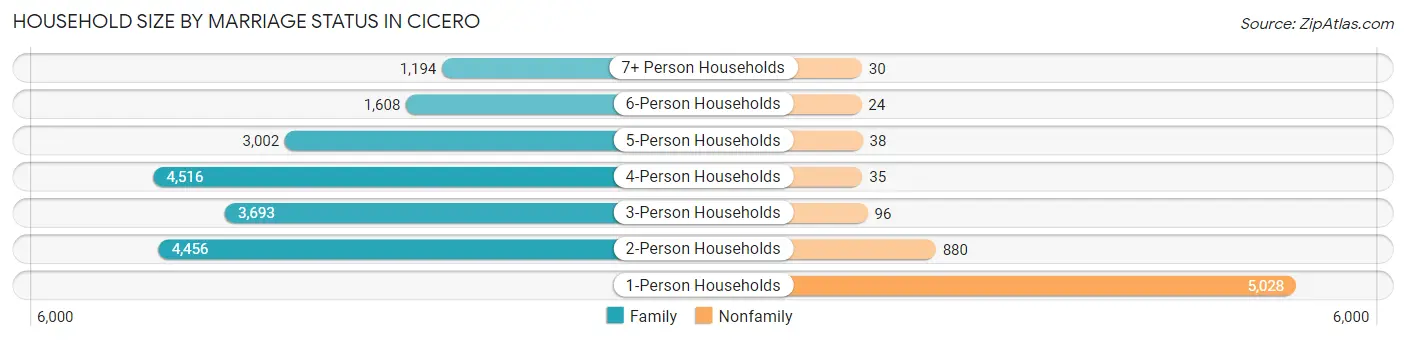
| Household Size | Family Households | Nonfamily Households |
| 1-Person Households | - | 5,028 (20.4%) |
| 2-Person Households | 4,456 (18.1%) | 880 (3.6%) |
| 3-Person Households | 3,693 (15.0%) | 96 (0.4%) |
| 4-Person Households | 4,516 (18.4%) | 35 (0.1%) |
| 5-Person Households | 3,002 (12.2%) | 38 (0.2%) |
| 6-Person Households | 1,608 (6.5%) | 24 (0.1%) |
| 7+ Person Households | 1,194 (4.9%) | 30 (0.1%) |
| Total | 18,469 (75.1%) | 6,131 (24.9%) |
Female Fertility in Cicero
Fertility by Age in Cicero
Average fertility rate in Cicero is 44.0 births per 1,000 women. Women in the age bracket of 20 to 34 years have the highest fertility rate with 70.0 births per 1,000 women. Women in the age bracket of 20 to 34 years acount for 67.6% of all women with births.
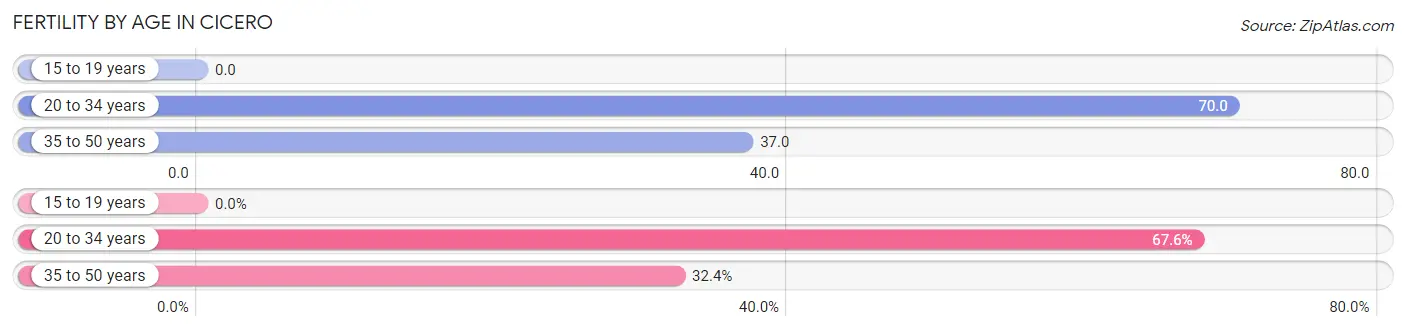
| Age Bracket | Women with Births | Births / 1,000 Women |
| 15 to 19 years | 0 (0.0%) | 0.0 |
| 20 to 34 years | 687 (67.6%) | 70.0 |
| 35 to 50 years | 329 (32.4%) | 37.0 |
| Total | 1,016 (100.0%) | 44.0 |
Fertility by Age by Marriage Status in Cicero
43.8% of women with births (1,016) in Cicero are married. The highest percentage of unmarried women with births falls into 20 to 34 years age bracket with 63.2% of them unmarried at the time of birth, while the lowest percentage of unmarried women with births belong to 35 to 50 years age bracket with 41.6% of them unmarried.
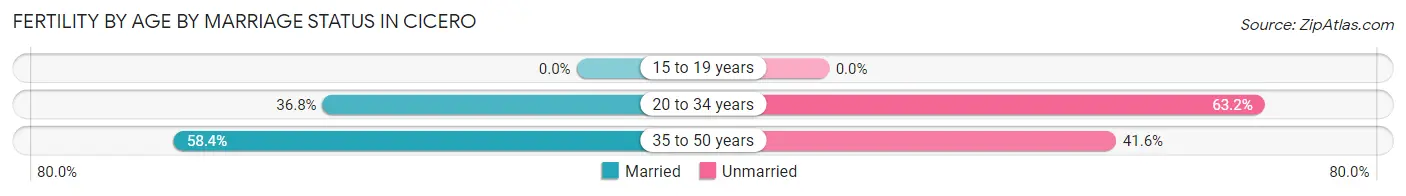
| Age Bracket | Married | Unmarried |
| 15 to 19 years | 0 (0.0%) | 0 (0.0%) |
| 20 to 34 years | 253 (36.8%) | 434 (63.2%) |
| 35 to 50 years | 192 (58.4%) | 137 (41.6%) |
| Total | 445 (43.8%) | 571 (56.2%) |
Fertility by Education in Cicero
Average fertility rate in Cicero is 44.0 births per 1,000 women. Women with the education attainment of high school diploma have the highest fertility rate of 77.0 births per 1,000 women, while women with the education attainment of graduate degree have the lowest fertility at 18.0 births per 1,000 women. Women with the education attainment of high school diploma represent 52.8% of all women with births.
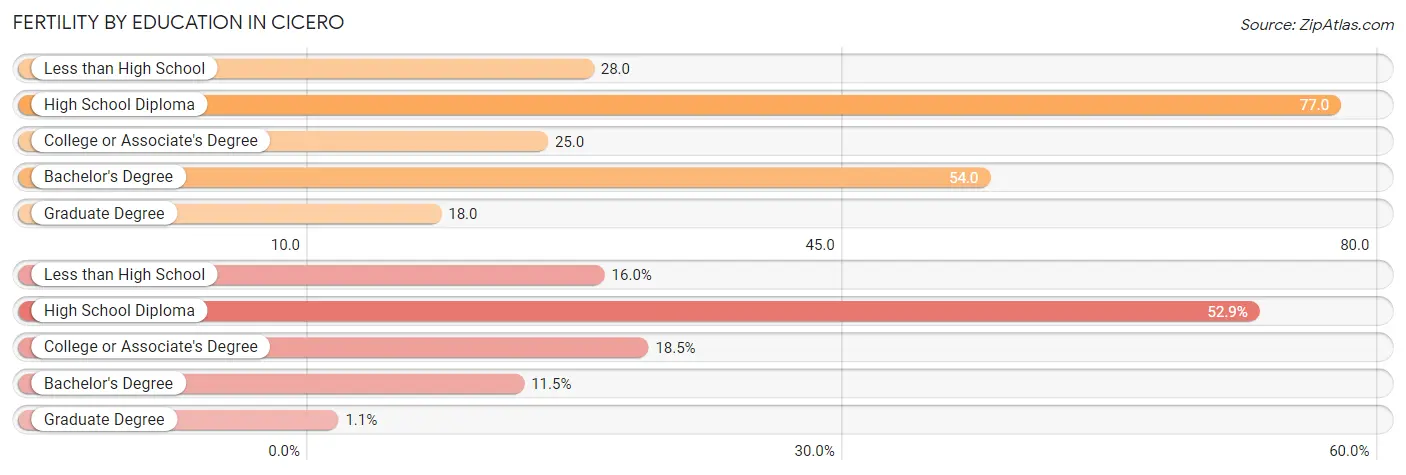
| Educational Attainment | Women with Births | Births / 1,000 Women |
| Less than High School | 163 (16.0%) | 28.0 |
| High School Diploma | 537 (52.8%) | 77.0 |
| College or Associate's Degree | 188 (18.5%) | 25.0 |
| Bachelor's Degree | 117 (11.5%) | 54.0 |
| Graduate Degree | 11 (1.1%) | 18.0 |
| Total | 1,016 (100.0%) | 44.0 |
Fertility by Education by Marriage Status in Cicero
56.2% of women with births in Cicero are unmarried. Women with the educational attainment of bachelor's degree are most likely to be married with 55.6% of them married at childbirth, while women with the educational attainment of graduate degree are least likely to be married with 100.0% of them unmarried at childbirth.
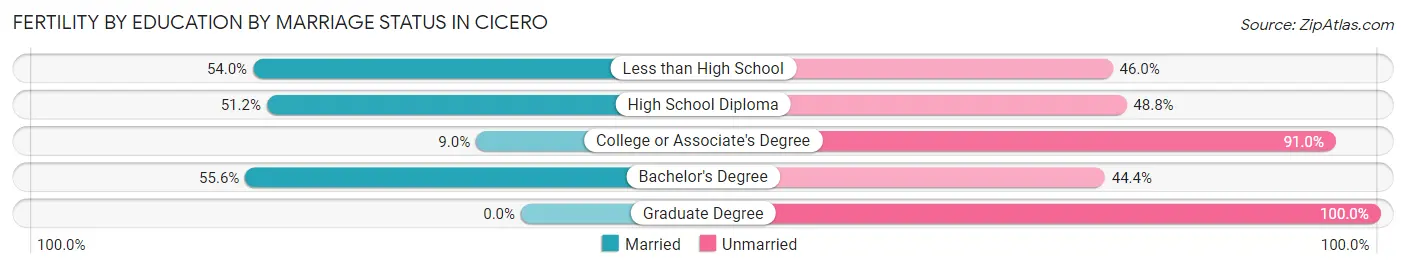
| Educational Attainment | Married | Unmarried |
| Less than High School | 88 (54.0%) | 75 (46.0%) |
| High School Diploma | 275 (51.2%) | 262 (48.8%) |
| College or Associate's Degree | 17 (9.0%) | 171 (91.0%) |
| Bachelor's Degree | 65 (55.6%) | 52 (44.4%) |
| Graduate Degree | 0 (0.0%) | 11 (100.0%) |
| Total | 445 (43.8%) | 571 (56.2%) |
Employment Characteristics in Cicero
Employment by Class of Employer in Cicero
Among the 39,169 employed individuals in Cicero, private company employees (30,867 | 78.8%), not-for-profit organizations (2,375 | 6.1%), and self-employed (not incorporated) (2,189 | 5.6%) make up the most common classes of employment.
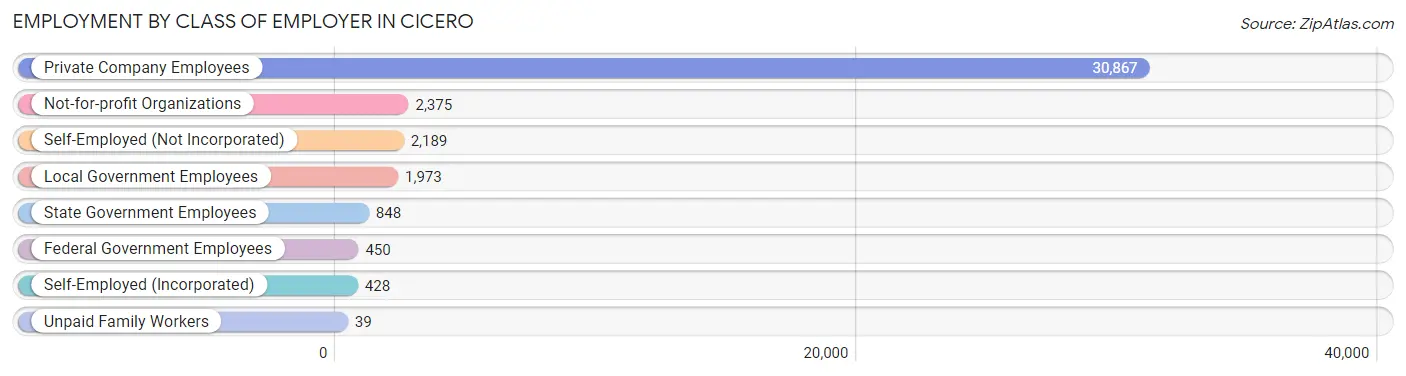
| Employer Class | # Employees | % Employees |
| Private Company Employees | 30,867 | 78.8% |
| Self-Employed (Incorporated) | 428 | 1.1% |
| Self-Employed (Not Incorporated) | 2,189 | 5.6% |
| Not-for-profit Organizations | 2,375 | 6.1% |
| Local Government Employees | 1,973 | 5.0% |
| State Government Employees | 848 | 2.2% |
| Federal Government Employees | 450 | 1.1% |
| Unpaid Family Workers | 39 | 0.1% |
| Total | 39,169 | 100.0% |
Employment Status by Age in Cicero
According to the labor force statistics for Cicero, out of the total population over 16 years of age (65,583), 62.9% or 41,252 individuals are in the labor force, with 3.9% or 1,609 of them unemployed. The age group with the highest labor force participation rate is 25 to 29 years, with 84.0% or 4,540 individuals in the labor force. Within the labor force, the 16 to 19 years age range has the highest percentage of unemployed individuals, with 18.8% or 287 of them being unemployed.
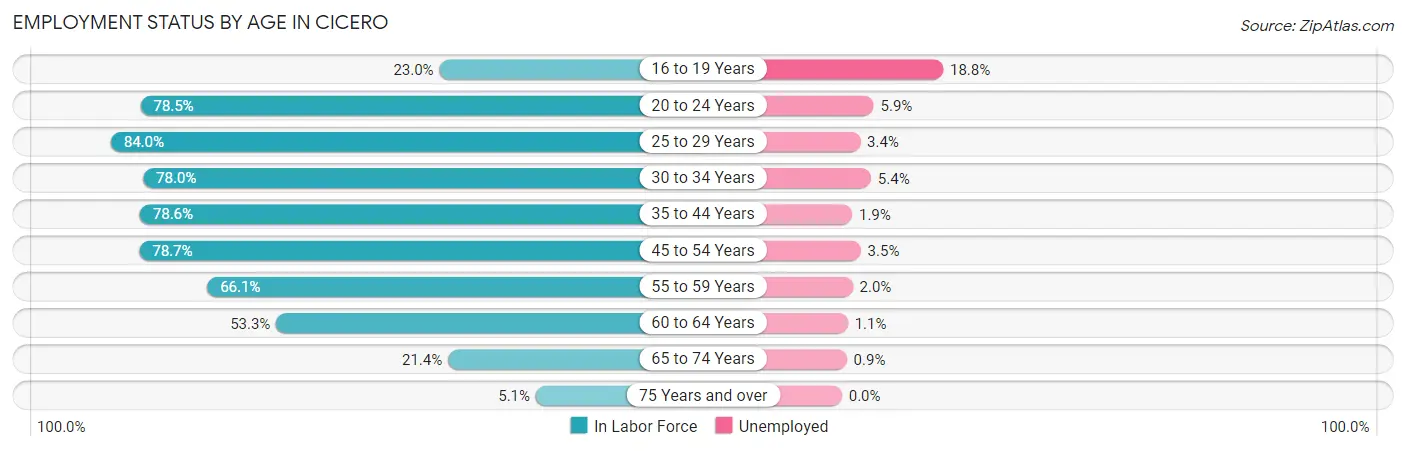
| Age Bracket | In Labor Force | Unemployed |
| 16 to 19 Years | 1,528 (23.0%) | 287 (18.8%) |
| 20 to 24 Years | 6,254 (78.5%) | 369 (5.9%) |
| 25 to 29 Years | 4,540 (84.0%) | 154 (3.4%) |
| 30 to 34 Years | 4,276 (78.0%) | 231 (5.4%) |
| 35 to 44 Years | 9,106 (78.6%) | 173 (1.9%) |
| 45 to 54 Years | 8,921 (78.7%) | 312 (3.5%) |
| 55 to 59 Years | 3,125 (66.1%) | 62 (2.0%) |
| 60 to 64 Years | 2,238 (53.3%) | 25 (1.1%) |
| 65 to 74 Years | 1,149 (21.4%) | 10 (0.9%) |
| 75 Years and over | 146 (5.1%) | 0 (0.0%) |
| Total | 41,252 (62.9%) | 1,609 (3.9%) |
Employment Status by Educational Attainment in Cicero
According to labor force statistics for Cicero, 75.4% of individuals (32,221) out of the total population between 25 and 64 years of age (42,734) are in the labor force, with 3.0% or 967 of them being unemployed. The group with the highest labor force participation rate are those with the educational attainment of bachelor's degree or higher, with 88.2% or 4,453 individuals in the labor force. Within the labor force, individuals with college / associate degree education have the highest percentage of unemployment, with 3.6% or 266 of them being unemployed.
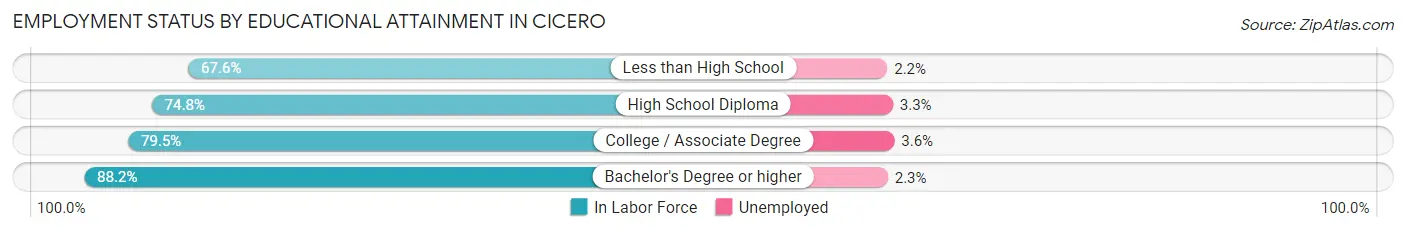
| Educational Attainment | In Labor Force | Unemployed |
| Less than High School | 8,218 (67.6%) | 267 (2.2%) |
| High School Diploma | 12,148 (74.8%) | 536 (3.3%) |
| College / Associate Degree | 7,383 (79.5%) | 334 (3.6%) |
| Bachelor's Degree or higher | 4,453 (88.2%) | 116 (2.3%) |
| Total | 32,221 (75.4%) | 1,282 (3.0%) |
Employment Occupations by Sex in Cicero
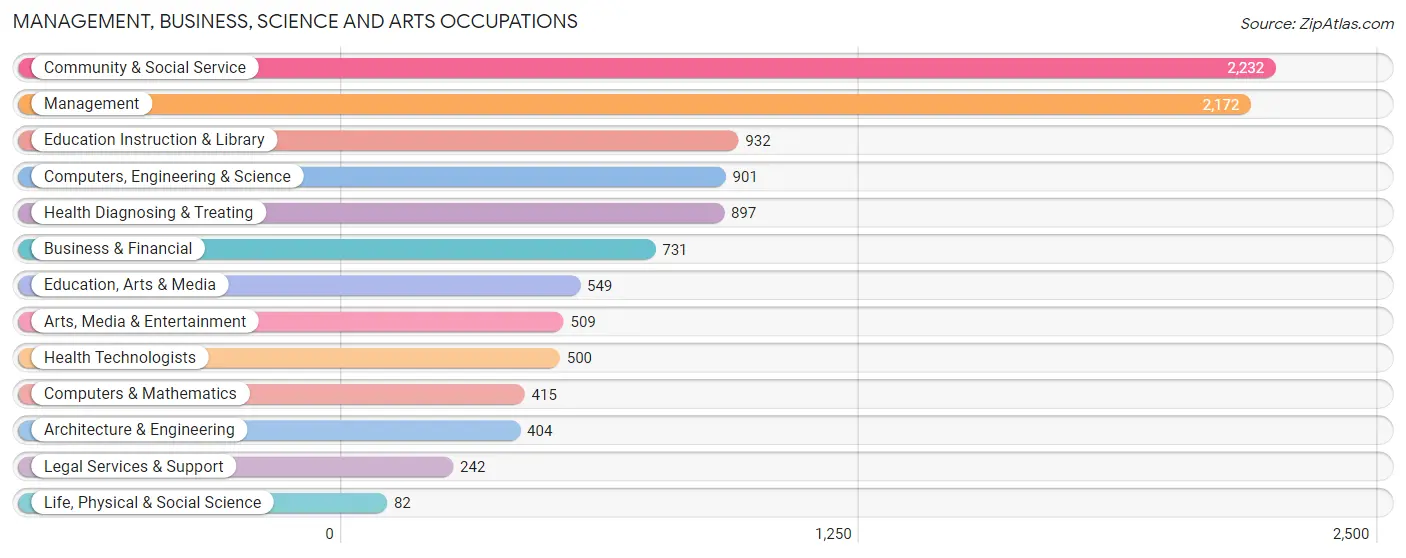
Management, Business, Science and Arts Occupations
The most common Management, Business, Science and Arts occupations in Cicero are Community & Social Service (2,232 | 5.6%), Management (2,172 | 5.5%), Education Instruction & Library (932 | 2.4%), Computers, Engineering & Science (901 | 2.3%), and Health Diagnosing & Treating (897 | 2.3%).
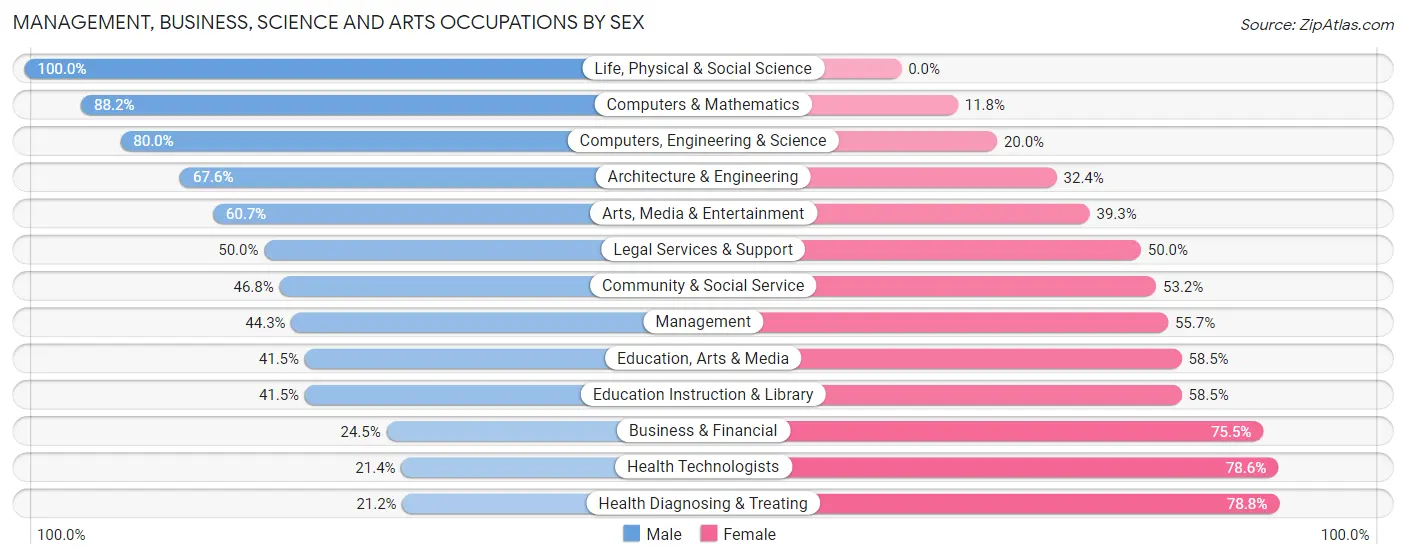
Management, Business, Science and Arts Occupations by Sex
Within the Management, Business, Science and Arts occupations in Cicero, the most male-oriented occupations are Life, Physical & Social Science (100.0%), Computers & Mathematics (88.2%), and Computers, Engineering & Science (80.0%), while the most female-oriented occupations are Health Diagnosing & Treating (78.8%), Health Technologists (78.6%), and Business & Financial (75.5%).
| Occupation | Male | Female |
| Management | 963 (44.3%) | 1,209 (55.7%) |
| Business & Financial | 179 (24.5%) | 552 (75.5%) |
| Computers, Engineering & Science | 721 (80.0%) | 180 (20.0%) |
| Computers & Mathematics | 366 (88.2%) | 49 (11.8%) |
| Architecture & Engineering | 273 (67.6%) | 131 (32.4%) |
| Life, Physical & Social Science | 82 (100.0%) | 0 (0.0%) |
| Community & Social Service | 1,045 (46.8%) | 1,187 (53.2%) |
| Education, Arts & Media | 228 (41.5%) | 321 (58.5%) |
| Legal Services & Support | 121 (50.0%) | 121 (50.0%) |
| Education Instruction & Library | 387 (41.5%) | 545 (58.5%) |
| Arts, Media & Entertainment | 309 (60.7%) | 200 (39.3%) |
| Health Diagnosing & Treating | 190 (21.2%) | 707 (78.8%) |
| Health Technologists | 107 (21.4%) | 393 (78.6%) |
| Total (Category) | 3,098 (44.7%) | 3,835 (55.3%) |
| Total (Overall) | 22,811 (57.6%) | 16,791 (42.4%) |
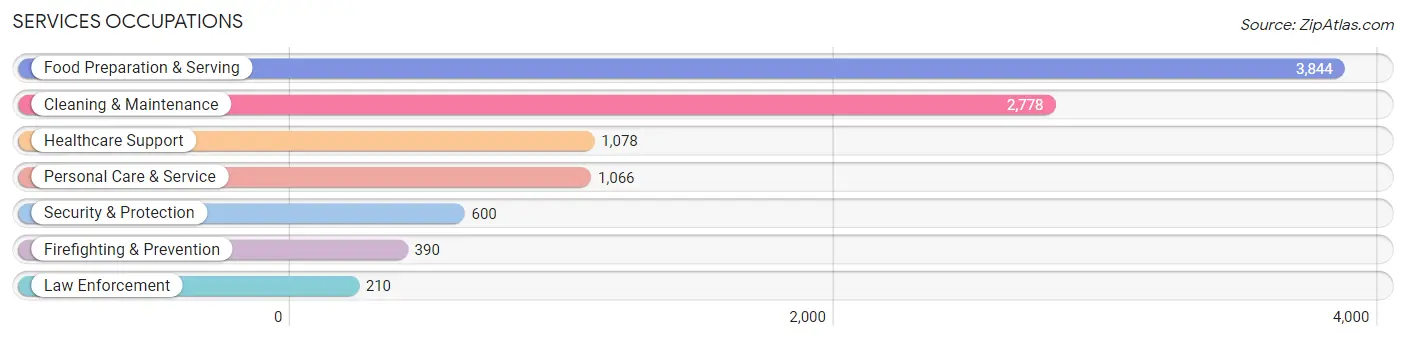
Services Occupations
The most common Services occupations in Cicero are Food Preparation & Serving (3,844 | 9.7%), Cleaning & Maintenance (2,778 | 7.0%), Healthcare Support (1,078 | 2.7%), Personal Care & Service (1,066 | 2.7%), and Security & Protection (600 | 1.5%).
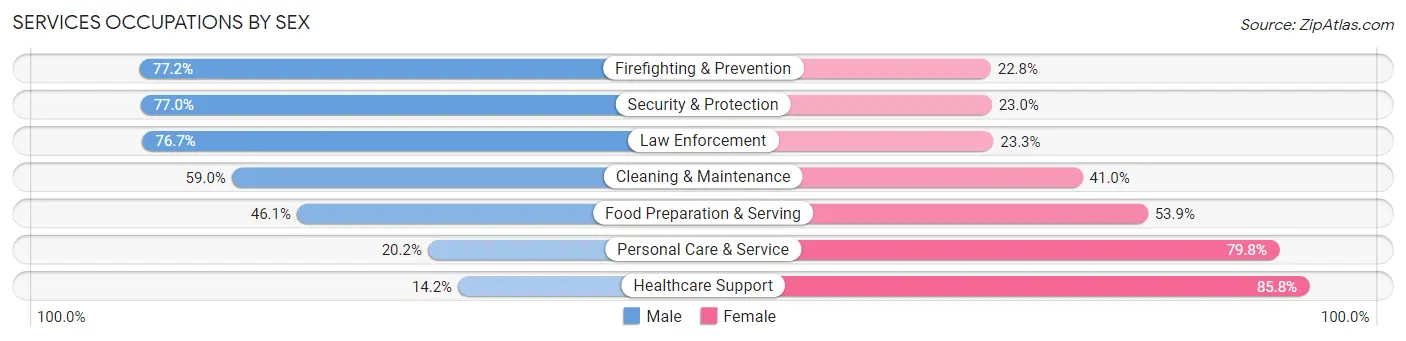
Services Occupations by Sex
Within the Services occupations in Cicero, the most male-oriented occupations are Firefighting & Prevention (77.2%), Security & Protection (77.0%), and Law Enforcement (76.7%), while the most female-oriented occupations are Healthcare Support (85.8%), Personal Care & Service (79.8%), and Food Preparation & Serving (53.9%).
| Occupation | Male | Female |
| Healthcare Support | 153 (14.2%) | 925 (85.8%) |
| Security & Protection | 462 (77.0%) | 138 (23.0%) |
| Firefighting & Prevention | 301 (77.2%) | 89 (22.8%) |
| Law Enforcement | 161 (76.7%) | 49 (23.3%) |
| Food Preparation & Serving | 1,772 (46.1%) | 2,072 (53.9%) |
| Cleaning & Maintenance | 1,639 (59.0%) | 1,139 (41.0%) |
| Personal Care & Service | 215 (20.2%) | 851 (79.8%) |
| Total (Category) | 4,241 (45.3%) | 5,125 (54.7%) |
| Total (Overall) | 22,811 (57.6%) | 16,791 (42.4%) |
Sales and Office Occupations
The most common Sales and Office occupations in Cicero are Office & Administration (3,983 | 10.1%), and Sales & Related (3,500 | 8.8%).

Sales and Office Occupations by Sex

| Occupation | Male | Female |
| Sales & Related | 1,483 (42.4%) | 2,017 (57.6%) |
| Office & Administration | 1,315 (33.0%) | 2,668 (67.0%) |
| Total (Category) | 2,798 (37.4%) | 4,685 (62.6%) |
| Total (Overall) | 22,811 (57.6%) | 16,791 (42.4%) |
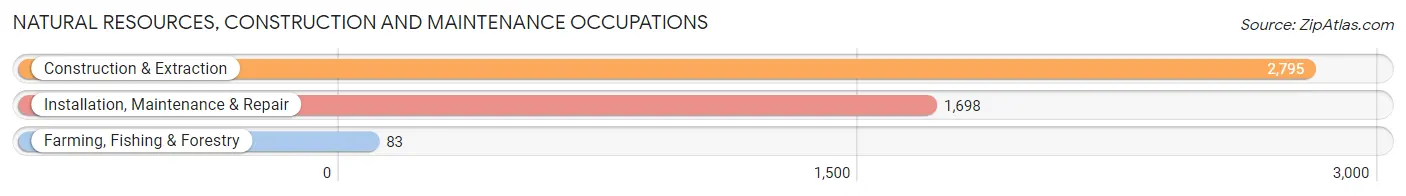
Natural Resources, Construction and Maintenance Occupations
The most common Natural Resources, Construction and Maintenance occupations in Cicero are Construction & Extraction (2,795 | 7.1%), Installation, Maintenance & Repair (1,698 | 4.3%), and Farming, Fishing & Forestry (83 | 0.2%).
Natural Resources, Construction and Maintenance Occupations by Sex
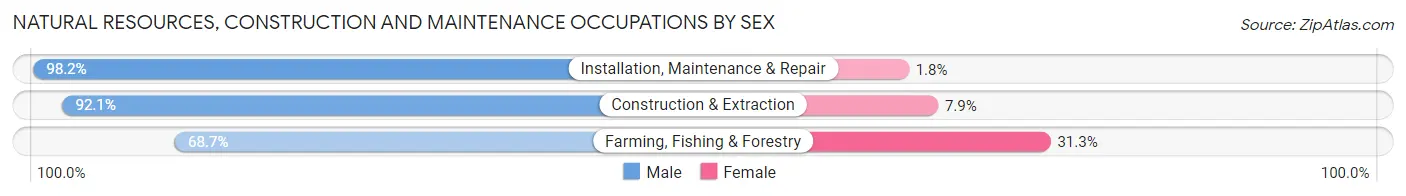
| Occupation | Male | Female |
| Farming, Fishing & Forestry | 57 (68.7%) | 26 (31.3%) |
| Construction & Extraction | 2,574 (92.1%) | 221 (7.9%) |
| Installation, Maintenance & Repair | 1,667 (98.2%) | 31 (1.8%) |
| Total (Category) | 4,298 (93.9%) | 278 (6.1%) |
| Total (Overall) | 22,811 (57.6%) | 16,791 (42.4%) |
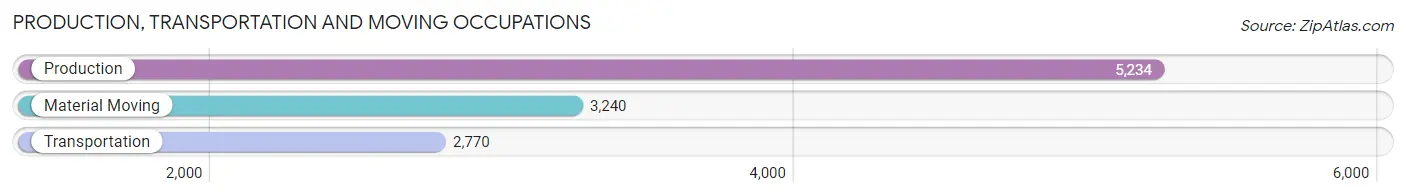
Production, Transportation and Moving Occupations
The most common Production, Transportation and Moving occupations in Cicero are Production (5,234 | 13.2%), Material Moving (3,240 | 8.2%), and Transportation (2,770 | 7.0%).
Production, Transportation and Moving Occupations by Sex
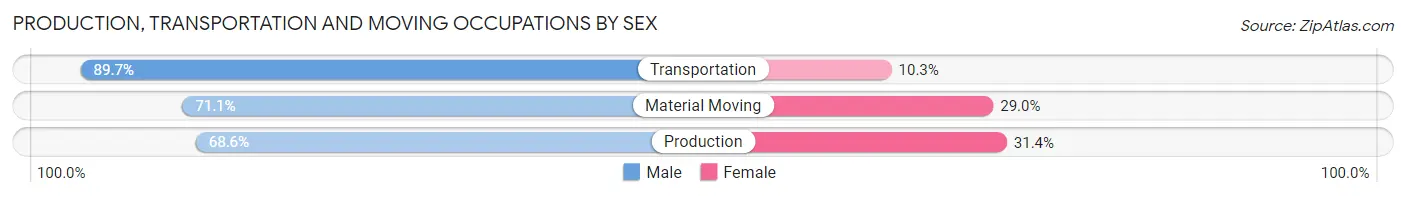
| Occupation | Male | Female |
| Production | 3,589 (68.6%) | 1,645 (31.4%) |
| Transportation | 2,485 (89.7%) | 285 (10.3%) |
| Material Moving | 2,302 (71.1%) | 938 (28.9%) |
| Total (Category) | 8,376 (74.5%) | 2,868 (25.5%) |
| Total (Overall) | 22,811 (57.6%) | 16,791 (42.4%) |
Employment Industries by Sex in Cicero
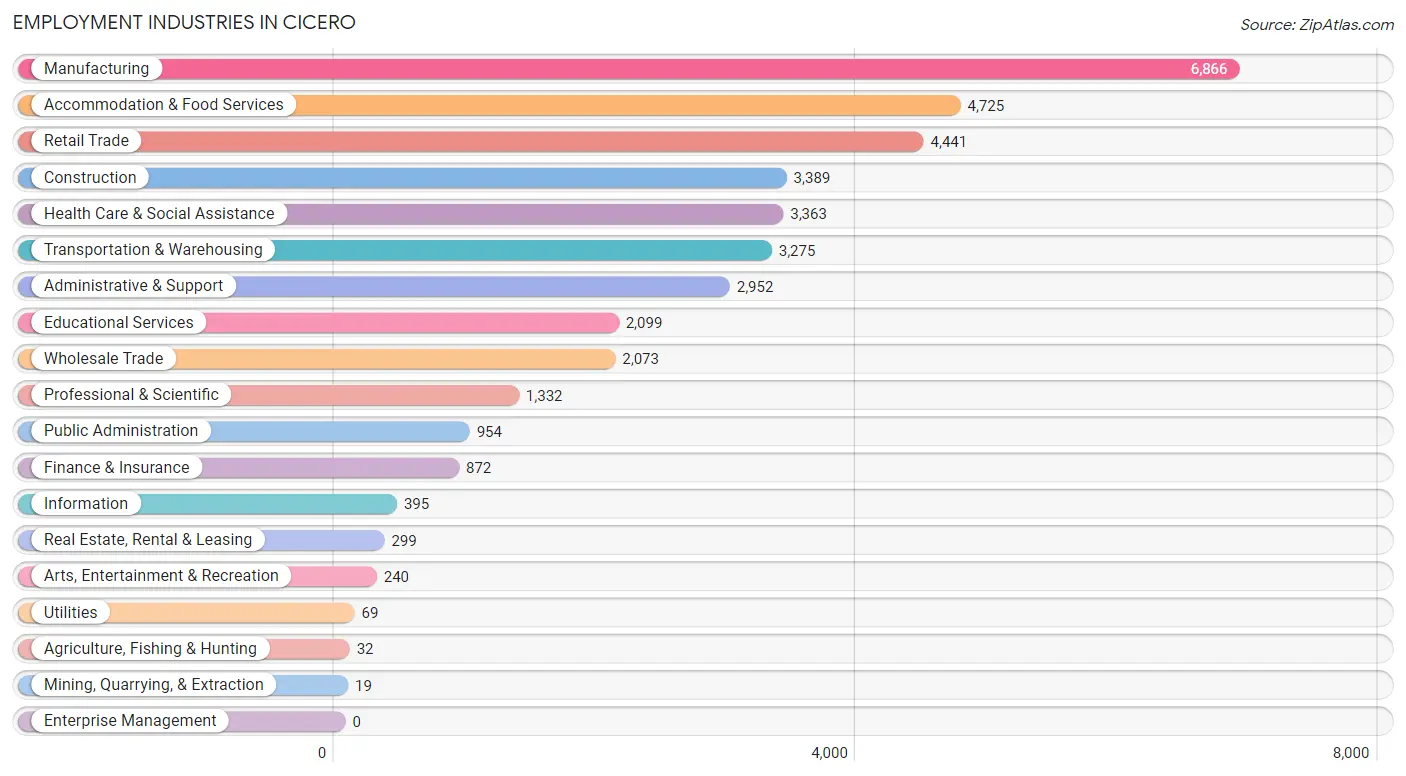
Employment Industries in Cicero
The major employment industries in Cicero include Manufacturing (6,866 | 17.3%), Accommodation & Food Services (4,725 | 11.9%), Retail Trade (4,441 | 11.2%), Construction (3,389 | 8.6%), and Health Care & Social Assistance (3,363 | 8.5%).
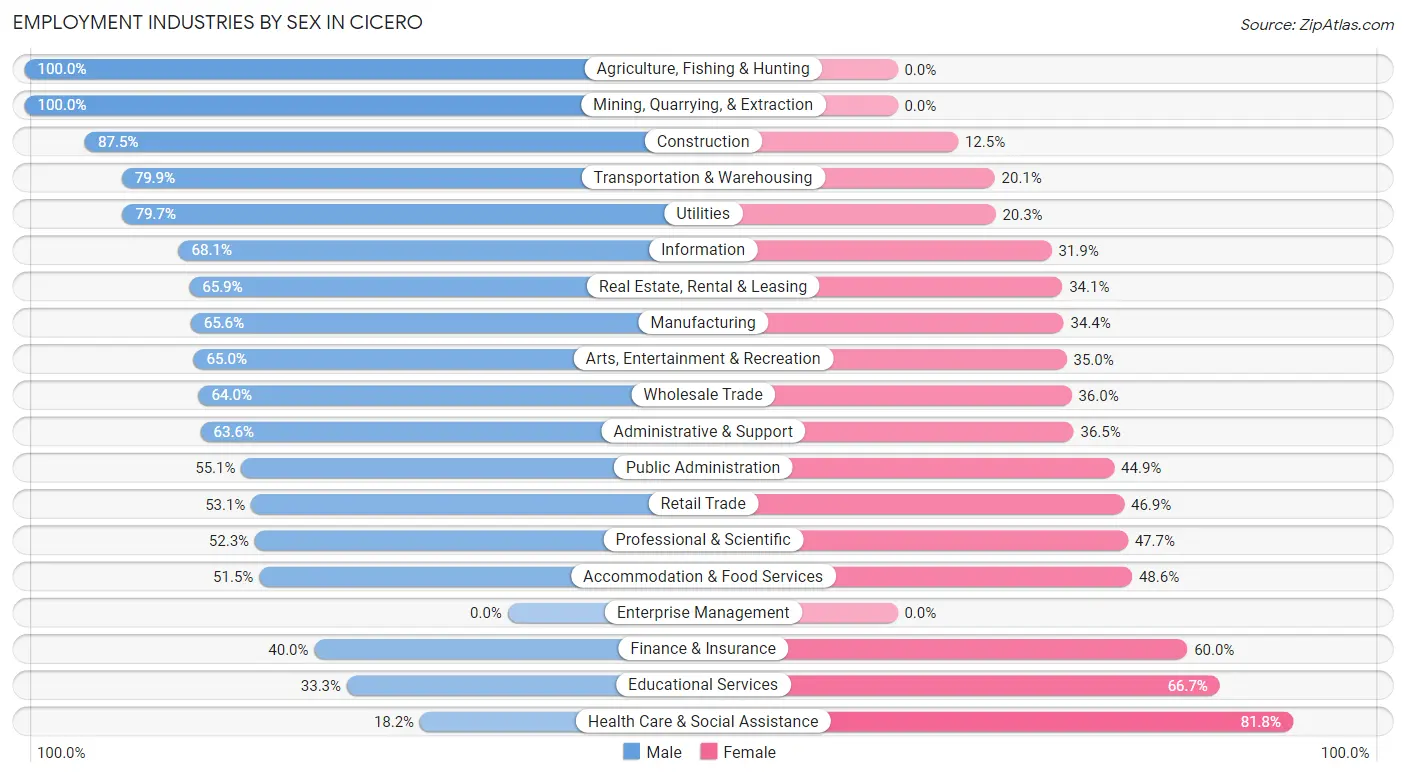
Employment Industries by Sex in Cicero
The Cicero industries that see more men than women are Agriculture, Fishing & Hunting (100.0%), Mining, Quarrying, & Extraction (100.0%), and Construction (87.5%), whereas the industries that tend to have a higher number of women are Health Care & Social Assistance (81.8%), Educational Services (66.7%), and Finance & Insurance (60.0%).
| Industry | Male | Female |
| Agriculture, Fishing & Hunting | 32 (100.0%) | 0 (0.0%) |
| Mining, Quarrying, & Extraction | 19 (100.0%) | 0 (0.0%) |
| Construction | 2,964 (87.5%) | 425 (12.5%) |
| Manufacturing | 4,504 (65.6%) | 2,362 (34.4%) |
| Wholesale Trade | 1,326 (64.0%) | 747 (36.0%) |
| Retail Trade | 2,358 (53.1%) | 2,083 (46.9%) |
| Transportation & Warehousing | 2,616 (79.9%) | 659 (20.1%) |
| Utilities | 55 (79.7%) | 14 (20.3%) |
| Information | 269 (68.1%) | 126 (31.9%) |
| Finance & Insurance | 349 (40.0%) | 523 (60.0%) |
| Real Estate, Rental & Leasing | 197 (65.9%) | 102 (34.1%) |
| Professional & Scientific | 697 (52.3%) | 635 (47.7%) |
| Enterprise Management | 0 (0.0%) | 0 (0.0%) |
| Administrative & Support | 1,876 (63.5%) | 1,076 (36.4%) |
| Educational Services | 699 (33.3%) | 1,400 (66.7%) |
| Health Care & Social Assistance | 611 (18.2%) | 2,752 (81.8%) |
| Arts, Entertainment & Recreation | 156 (65.0%) | 84 (35.0%) |
| Accommodation & Food Services | 2,431 (51.4%) | 2,294 (48.5%) |
| Public Administration | 526 (55.1%) | 428 (44.9%) |
| Total | 22,811 (57.6%) | 16,791 (42.4%) |
Education in Cicero
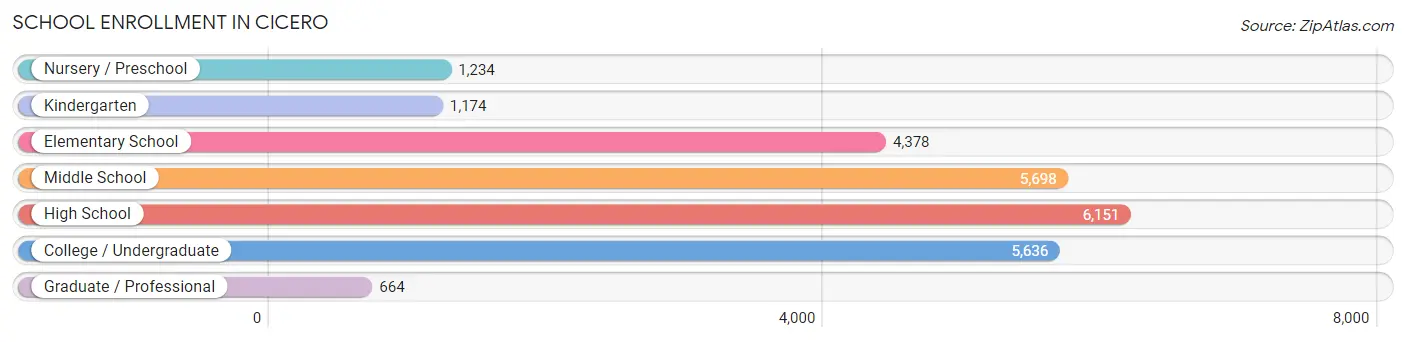
School Enrollment in Cicero
The most common levels of schooling among the 24,935 students in Cicero are high school (6,151 | 24.7%), middle school (5,698 | 22.9%), and college / undergraduate (5,636 | 22.6%).
| School Level | # Students | % Students |
| Nursery / Preschool | 1,234 | 5.0% |
| Kindergarten | 1,174 | 4.7% |
| Elementary School | 4,378 | 17.6% |
| Middle School | 5,698 | 22.9% |
| High School | 6,151 | 24.7% |
| College / Undergraduate | 5,636 | 22.6% |
| Graduate / Professional | 664 | 2.7% |
| Total | 24,935 | 100.0% |
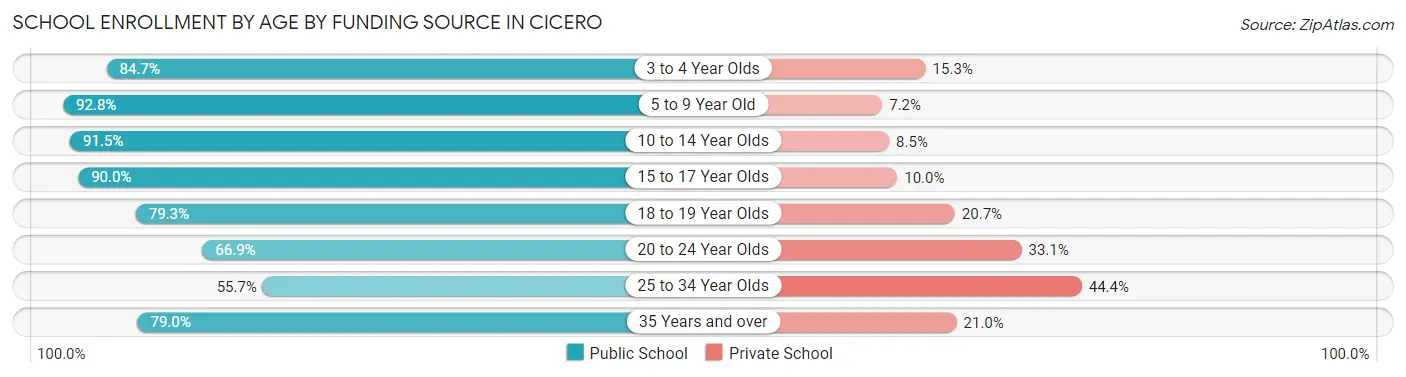
School Enrollment by Age by Funding Source in Cicero
Out of a total of 24,935 students who are enrolled in schools in Cicero, 3,641 (14.6%) attend a private institution, while the remaining 21,294 (85.4%) are enrolled in public schools. The age group of 25 to 34 year olds has the highest likelihood of being enrolled in private schools, with 463 (44.4% in the age bracket) enrolled. Conversely, the age group of 5 to 9 year old has the lowest likelihood of being enrolled in a private school, with 5,007 (92.8% in the age bracket) attending a public institution.
| Age Bracket | Public School | Private School |
| 3 to 4 Year Olds | 882 (84.7%) | 159 (15.3%) |
| 5 to 9 Year Old | 5,007 (92.8%) | 388 (7.2%) |
| 10 to 14 Year Olds | 6,312 (91.5%) | 584 (8.5%) |
| 15 to 17 Year Olds | 4,244 (90.0%) | 471 (10.0%) |
| 18 to 19 Year Olds | 1,772 (79.3%) | 463 (20.7%) |
| 20 to 24 Year Olds | 2,016 (66.9%) | 999 (33.1%) |
| 25 to 34 Year Olds | 581 (55.6%) | 463 (44.4%) |
| 35 Years and over | 469 (79.0%) | 125 (21.0%) |
| Total | 21,294 (85.4%) | 3,641 (14.6%) |
Educational Attainment by Field of Study in Cicero
Business (1,038 | 16.6%), education (759 | 12.1%), science & technology (668 | 10.7%), visual & performing arts (562 | 9.0%), and computers & mathematics (490 | 7.8%) are the most common fields of study among 6,267 individuals in Cicero who have obtained a bachelor's degree or higher.
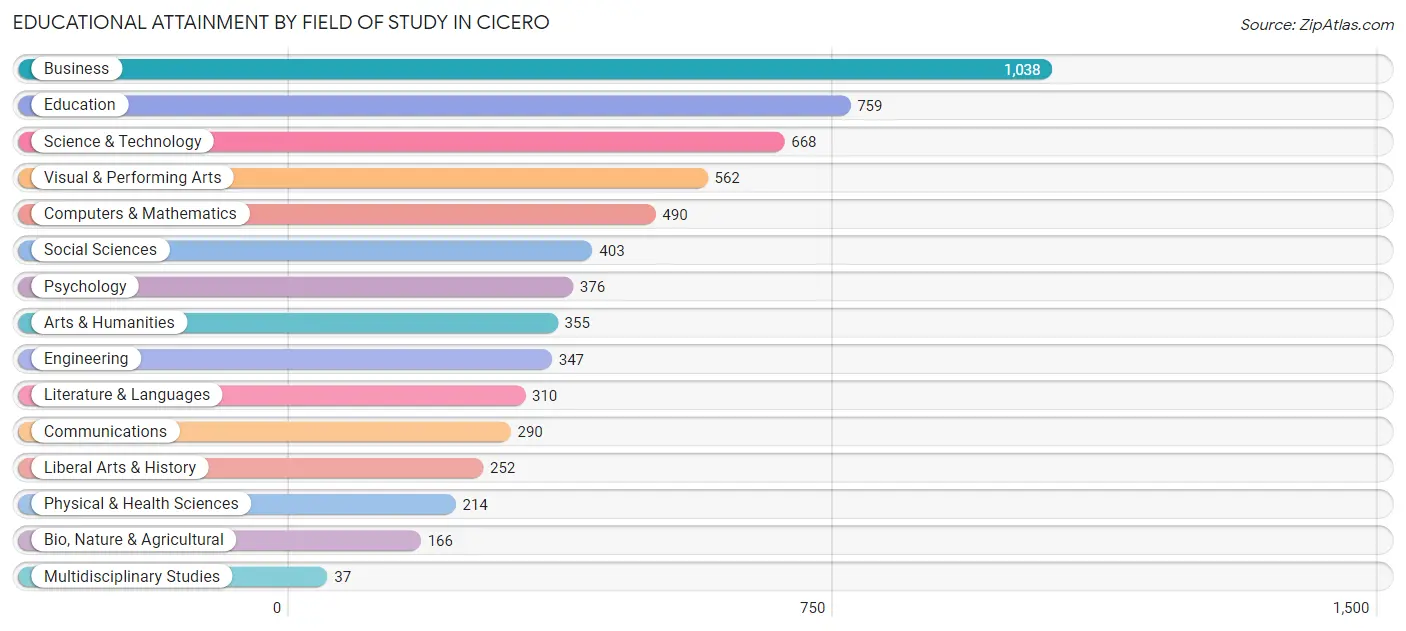
| Field of Study | # Graduates | % Graduates |
| Computers & Mathematics | 490 | 7.8% |
| Bio, Nature & Agricultural | 166 | 2.6% |
| Physical & Health Sciences | 214 | 3.4% |
| Psychology | 376 | 6.0% |
| Social Sciences | 403 | 6.4% |
| Engineering | 347 | 5.5% |
| Multidisciplinary Studies | 37 | 0.6% |
| Science & Technology | 668 | 10.7% |
| Business | 1,038 | 16.6% |
| Education | 759 | 12.1% |
| Literature & Languages | 310 | 5.0% |
| Liberal Arts & History | 252 | 4.0% |
| Visual & Performing Arts | 562 | 9.0% |
| Communications | 290 | 4.6% |
| Arts & Humanities | 355 | 5.7% |
| Total | 6,267 | 100.0% |
Transportation & Commute in Cicero
Vehicle Availability by Sex in Cicero
The most prevalent vehicle ownership categories in Cicero are males with 2 vehicles (8,639, accounting for 38.3%) and females with 2 vehicles (5,610, making up 52.1%).
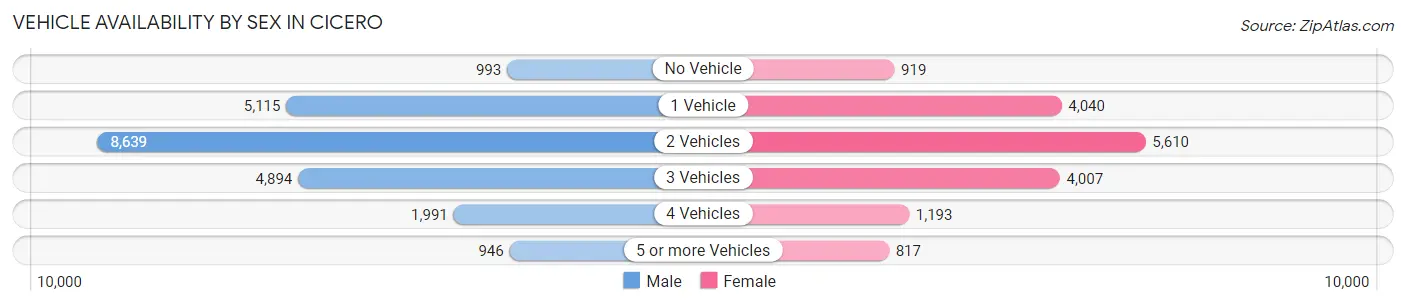
| Vehicles Available | Male | Female |
| No Vehicle | 993 (4.4%) | 919 (5.5%) |
| 1 Vehicle | 5,115 (22.7%) | 4,040 (24.4%) |
| 2 Vehicles | 8,639 (38.3%) | 5,610 (33.8%) |
| 3 Vehicles | 4,894 (21.7%) | 4,007 (24.2%) |
| 4 Vehicles | 1,991 (8.8%) | 1,193 (7.2%) |
| 5 or more Vehicles | 946 (4.2%) | 817 (4.9%) |
| Total | 22,578 (100.0%) | 16,586 (100.0%) |
Commute Time in Cicero
The most frequently occuring commute durations in Cicero are 30 to 34 minutes (7,319 commuters, 19.4%), 15 to 19 minutes (4,647 commuters, 12.3%), and 20 to 24 minutes (4,634 commuters, 12.3%).
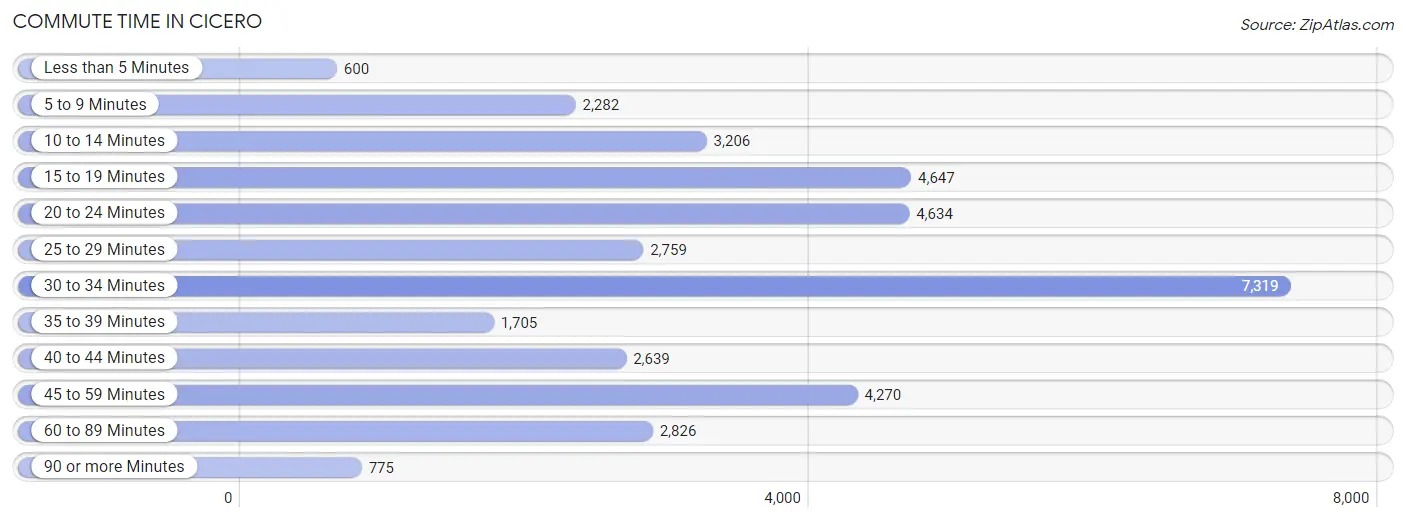
| Commute Time | # Commuters | % Commuters |
| Less than 5 Minutes | 600 | 1.6% |
| 5 to 9 Minutes | 2,282 | 6.1% |
| 10 to 14 Minutes | 3,206 | 8.5% |
| 15 to 19 Minutes | 4,647 | 12.3% |
| 20 to 24 Minutes | 4,634 | 12.3% |
| 25 to 29 Minutes | 2,759 | 7.3% |
| 30 to 34 Minutes | 7,319 | 19.4% |
| 35 to 39 Minutes | 1,705 | 4.5% |
| 40 to 44 Minutes | 2,639 | 7.0% |
| 45 to 59 Minutes | 4,270 | 11.3% |
| 60 to 89 Minutes | 2,826 | 7.5% |
| 90 or more Minutes | 775 | 2.1% |
Commute Time by Sex in Cicero
The most common commute times in Cicero are 30 to 34 minutes (4,649 commuters, 21.2%) for males and 30 to 34 minutes (2,670 commuters, 17.0%) for females.
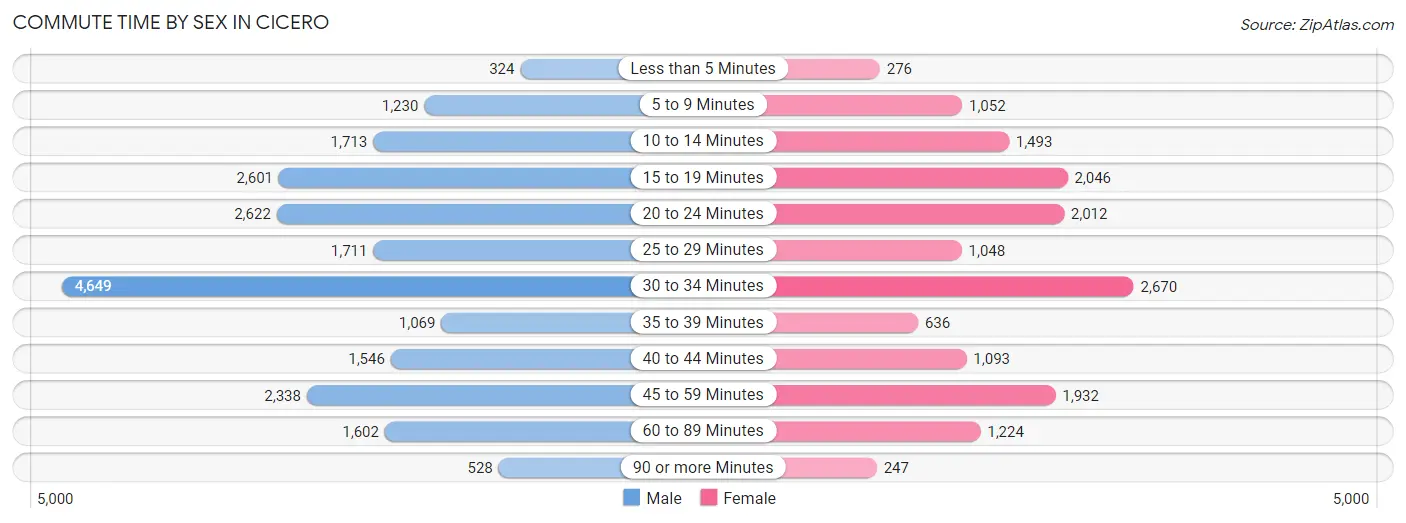
| Commute Time | Male | Female |
| Less than 5 Minutes | 324 (1.5%) | 276 (1.8%) |
| 5 to 9 Minutes | 1,230 (5.6%) | 1,052 (6.7%) |
| 10 to 14 Minutes | 1,713 (7.8%) | 1,493 (9.5%) |
| 15 to 19 Minutes | 2,601 (11.9%) | 2,046 (13.0%) |
| 20 to 24 Minutes | 2,622 (11.9%) | 2,012 (12.8%) |
| 25 to 29 Minutes | 1,711 (7.8%) | 1,048 (6.7%) |
| 30 to 34 Minutes | 4,649 (21.2%) | 2,670 (17.0%) |
| 35 to 39 Minutes | 1,069 (4.9%) | 636 (4.0%) |
| 40 to 44 Minutes | 1,546 (7.0%) | 1,093 (7.0%) |
| 45 to 59 Minutes | 2,338 (10.7%) | 1,932 (12.3%) |
| 60 to 89 Minutes | 1,602 (7.3%) | 1,224 (7.8%) |
| 90 or more Minutes | 528 (2.4%) | 247 (1.6%) |
Time of Departure to Work by Sex in Cicero
The most frequent times of departure to work in Cicero are 12:00 PM to 3:59 PM (2,892, 13.2%) for males and 7:00 AM to 7:29 AM (2,272, 14.4%) for females.
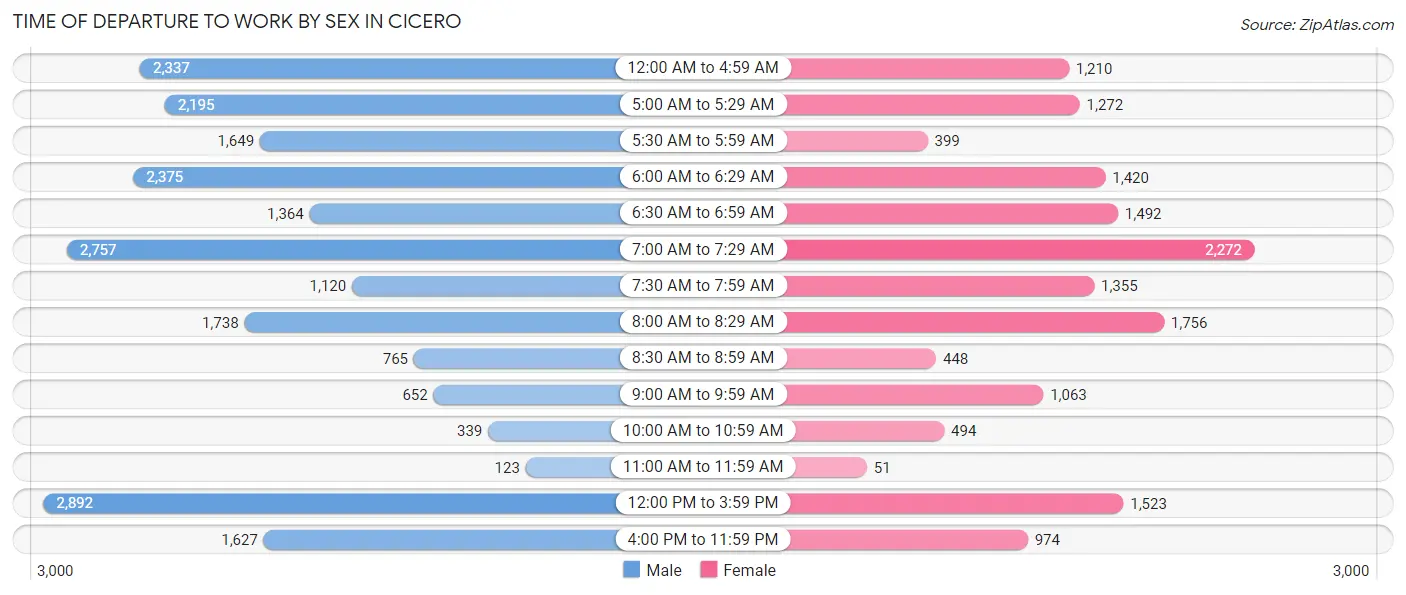
| Time of Departure | Male | Female |
| 12:00 AM to 4:59 AM | 2,337 (10.7%) | 1,210 (7.7%) |
| 5:00 AM to 5:29 AM | 2,195 (10.0%) | 1,272 (8.1%) |
| 5:30 AM to 5:59 AM | 1,649 (7.5%) | 399 (2.5%) |
| 6:00 AM to 6:29 AM | 2,375 (10.8%) | 1,420 (9.0%) |
| 6:30 AM to 6:59 AM | 1,364 (6.2%) | 1,492 (9.5%) |
| 7:00 AM to 7:29 AM | 2,757 (12.6%) | 2,272 (14.4%) |
| 7:30 AM to 7:59 AM | 1,120 (5.1%) | 1,355 (8.6%) |
| 8:00 AM to 8:29 AM | 1,738 (7.9%) | 1,756 (11.2%) |
| 8:30 AM to 8:59 AM | 765 (3.5%) | 448 (2.9%) |
| 9:00 AM to 9:59 AM | 652 (3.0%) | 1,063 (6.8%) |
| 10:00 AM to 10:59 AM | 339 (1.5%) | 494 (3.1%) |
| 11:00 AM to 11:59 AM | 123 (0.6%) | 51 (0.3%) |
| 12:00 PM to 3:59 PM | 2,892 (13.2%) | 1,523 (9.7%) |
| 4:00 PM to 11:59 PM | 1,627 (7.4%) | 974 (6.2%) |
| Total | 21,933 (100.0%) | 15,729 (100.0%) |
Housing Occupancy in Cicero
Occupancy by Ownership in Cicero
Of the total 24,600 dwellings in Cicero, owner-occupied units account for 13,432 (54.6%), while renter-occupied units make up 11,168 (45.4%).
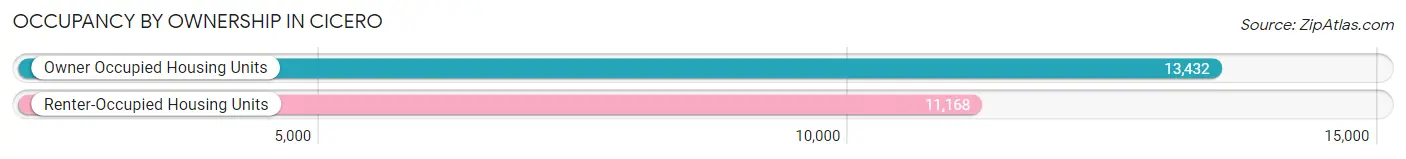
| Occupancy | # Housing Units | % Housing Units |
| Owner Occupied Housing Units | 13,432 | 54.6% |
| Renter-Occupied Housing Units | 11,168 | 45.4% |
| Total Occupied Housing Units | 24,600 | 100.0% |
Occupancy by Household Size in Cicero
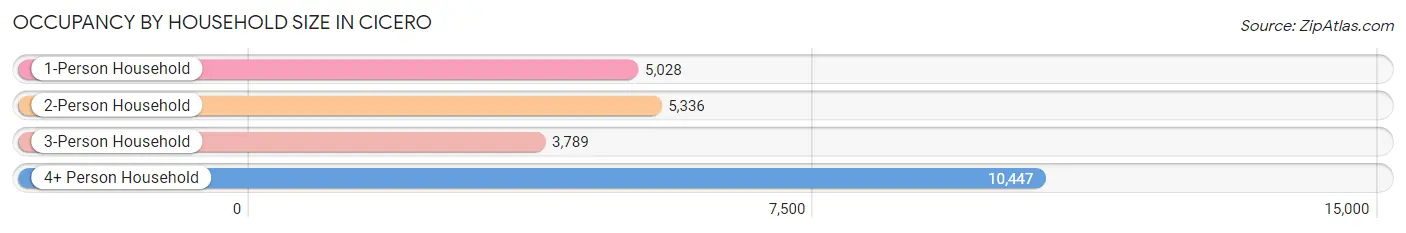
| Household Size | # Housing Units | % Housing Units |
| 1-Person Household | 5,028 | 20.4% |
| 2-Person Household | 5,336 | 21.7% |
| 3-Person Household | 3,789 | 15.4% |
| 4+ Person Household | 10,447 | 42.5% |
| Total Housing Units | 24,600 | 100.0% |
Occupancy by Ownership by Household Size in Cicero
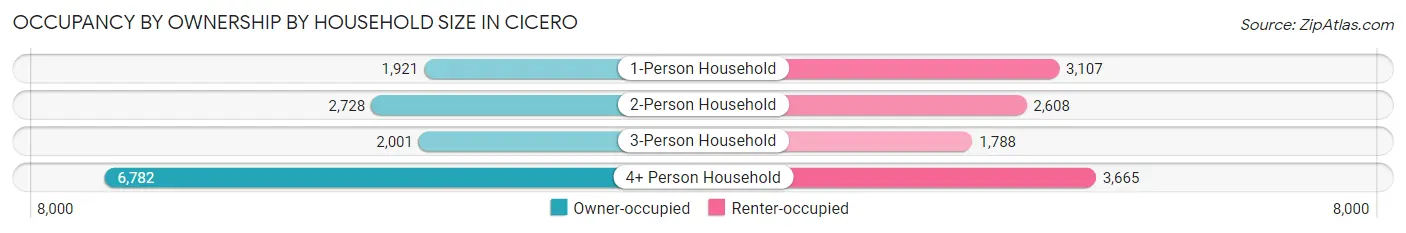
| Household Size | Owner-occupied | Renter-occupied |
| 1-Person Household | 1,921 (38.2%) | 3,107 (61.8%) |
| 2-Person Household | 2,728 (51.1%) | 2,608 (48.9%) |
| 3-Person Household | 2,001 (52.8%) | 1,788 (47.2%) |
| 4+ Person Household | 6,782 (64.9%) | 3,665 (35.1%) |
| Total Housing Units | 13,432 (54.6%) | 11,168 (45.4%) |
Occupancy by Educational Attainment in Cicero
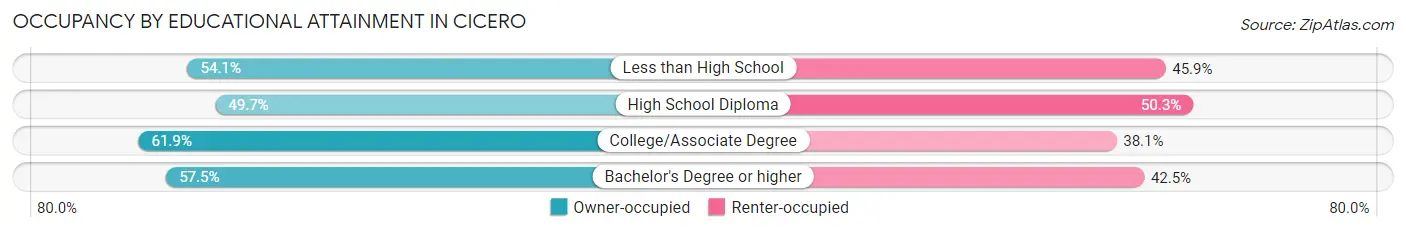
| Household Size | Owner-occupied | Renter-occupied |
| Less than High School | 4,169 (54.1%) | 3,532 (45.9%) |
| High School Diploma | 4,431 (49.7%) | 4,479 (50.3%) |
| College/Associate Degree | 3,327 (61.9%) | 2,046 (38.1%) |
| Bachelor's Degree or higher | 1,505 (57.5%) | 1,111 (42.5%) |
Occupancy by Age of Householder in Cicero
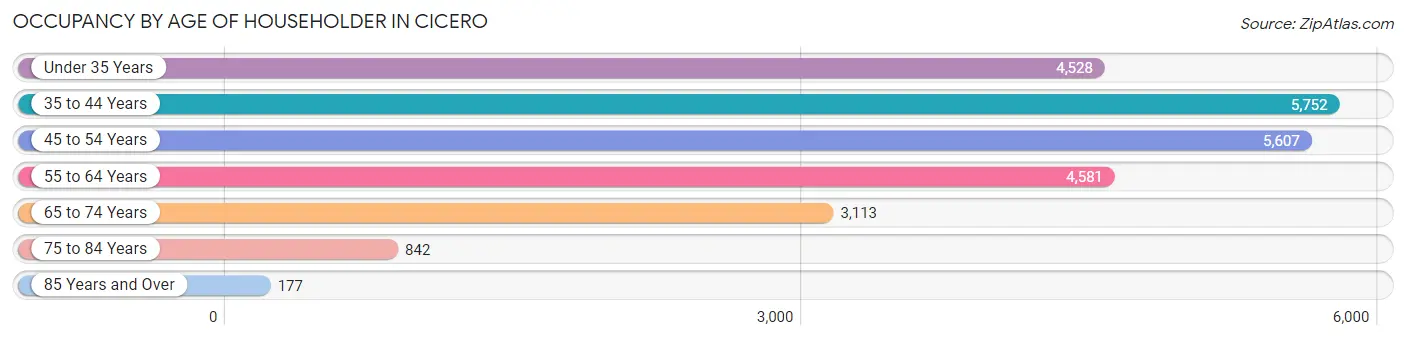
| Age Bracket | # Households | % Households |
| Under 35 Years | 4,528 | 18.4% |
| 35 to 44 Years | 5,752 | 23.4% |
| 45 to 54 Years | 5,607 | 22.8% |
| 55 to 64 Years | 4,581 | 18.6% |
| 65 to 74 Years | 3,113 | 12.7% |
| 75 to 84 Years | 842 | 3.4% |
| 85 Years and Over | 177 | 0.7% |
| Total | 24,600 | 100.0% |
Housing Finances in Cicero
Median Income by Occupancy in Cicero
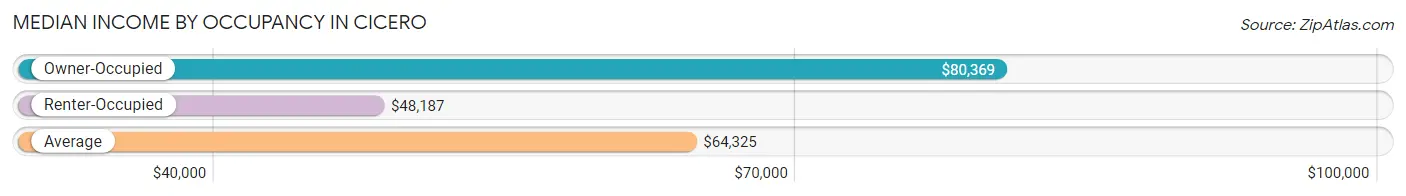
| Occupancy Type | # Households | Median Income |
| Owner-Occupied | 13,432 (54.6%) | $80,369 |
| Renter-Occupied | 11,168 (45.4%) | $48,187 |
| Average | 24,600 (100.0%) | $64,325 |
Occupancy by Householder Income Bracket in Cicero
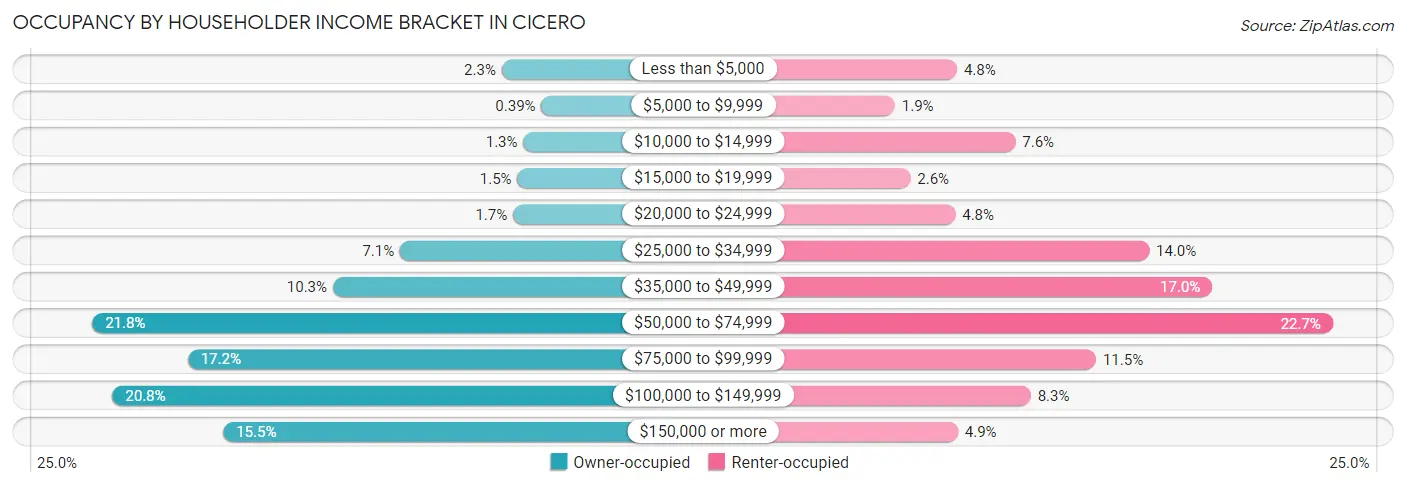
| Income Bracket | Owner-occupied | Renter-occupied |
| Less than $5,000 | 306 (2.3%) | 539 (4.8%) |
| $5,000 to $9,999 | 53 (0.4%) | 209 (1.9%) |
| $10,000 to $14,999 | 168 (1.3%) | 850 (7.6%) |
| $15,000 to $19,999 | 205 (1.5%) | 292 (2.6%) |
| $20,000 to $24,999 | 234 (1.7%) | 530 (4.8%) |
| $25,000 to $34,999 | 956 (7.1%) | 1,561 (14.0%) |
| $35,000 to $49,999 | 1,386 (10.3%) | 1,896 (17.0%) |
| $50,000 to $74,999 | 2,926 (21.8%) | 2,537 (22.7%) |
| $75,000 to $99,999 | 2,314 (17.2%) | 1,279 (11.5%) |
| $100,000 to $149,999 | 2,797 (20.8%) | 931 (8.3%) |
| $150,000 or more | 2,087 (15.5%) | 544 (4.9%) |
| Total | 13,432 (100.0%) | 11,168 (100.0%) |
Monthly Housing Cost Tiers in Cicero
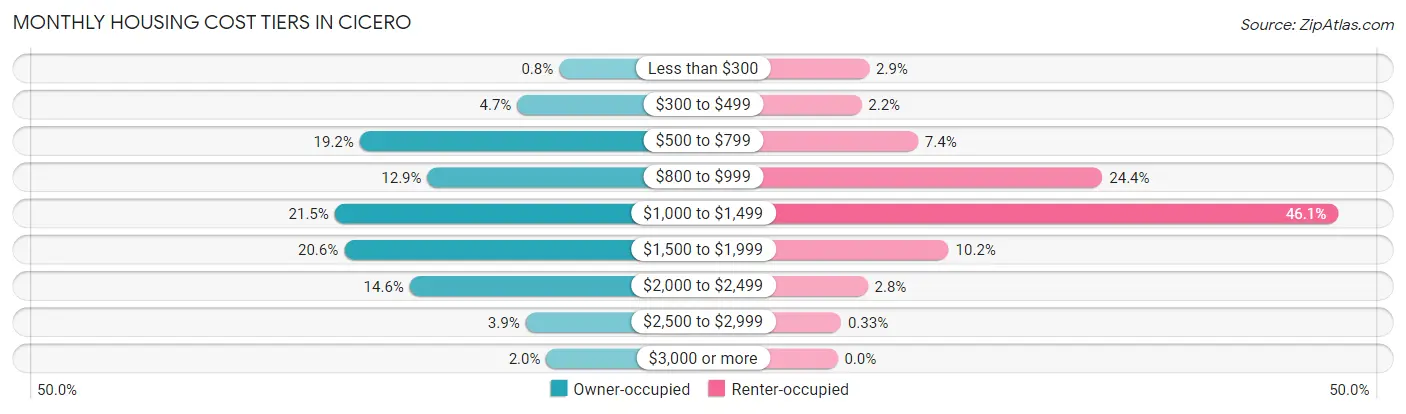
| Monthly Cost | Owner-occupied | Renter-occupied |
| Less than $300 | 108 (0.8%) | 326 (2.9%) |
| $300 to $499 | 624 (4.6%) | 246 (2.2%) |
| $500 to $799 | 2,574 (19.2%) | 828 (7.4%) |
| $800 to $999 | 1,735 (12.9%) | 2,724 (24.4%) |
| $1,000 to $1,499 | 2,882 (21.5%) | 5,146 (46.1%) |
| $1,500 to $1,999 | 2,766 (20.6%) | 1,144 (10.2%) |
| $2,000 to $2,499 | 1,955 (14.5%) | 310 (2.8%) |
| $2,500 to $2,999 | 523 (3.9%) | 37 (0.3%) |
| $3,000 or more | 265 (2.0%) | 0 (0.0%) |
| Total | 13,432 (100.0%) | 11,168 (100.0%) |
Physical Housing Characteristics in Cicero
Housing Structures in Cicero
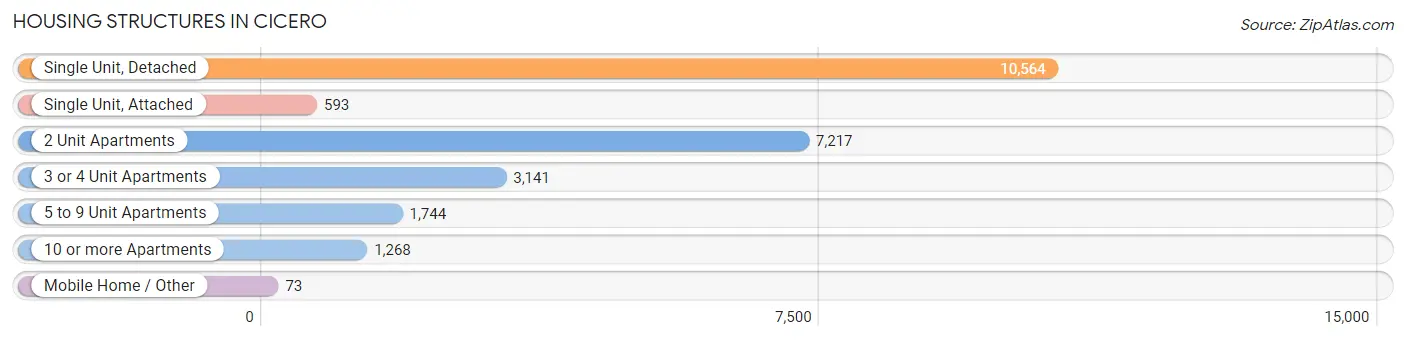
| Structure Type | # Housing Units | % Housing Units |
| Single Unit, Detached | 10,564 | 42.9% |
| Single Unit, Attached | 593 | 2.4% |
| 2 Unit Apartments | 7,217 | 29.3% |
| 3 or 4 Unit Apartments | 3,141 | 12.8% |
| 5 to 9 Unit Apartments | 1,744 | 7.1% |
| 10 or more Apartments | 1,268 | 5.1% |
| Mobile Home / Other | 73 | 0.3% |
| Total | 24,600 | 100.0% |
Housing Structures by Occupancy in Cicero
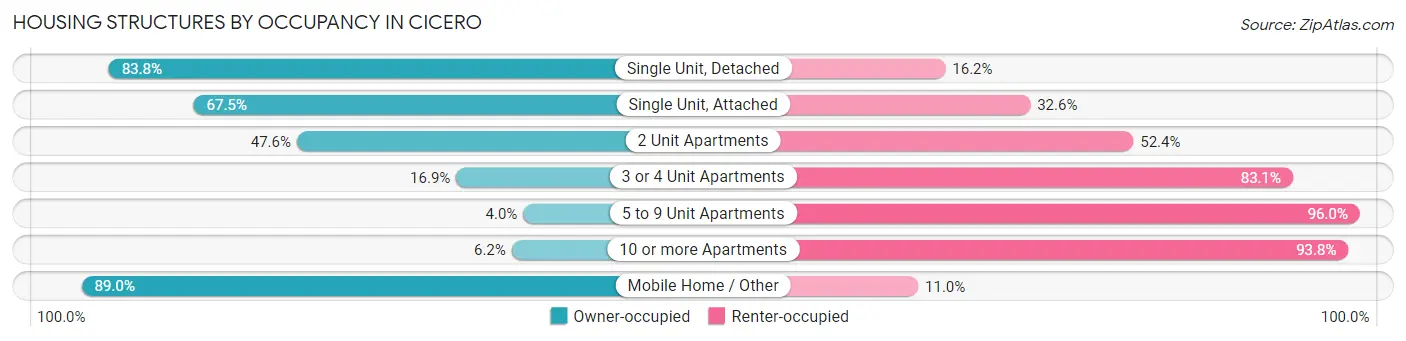
| Structure Type | Owner-occupied | Renter-occupied |
| Single Unit, Detached | 8,852 (83.8%) | 1,712 (16.2%) |
| Single Unit, Attached | 400 (67.4%) | 193 (32.6%) |
| 2 Unit Apartments | 3,435 (47.6%) | 3,782 (52.4%) |
| 3 or 4 Unit Apartments | 531 (16.9%) | 2,610 (83.1%) |
| 5 to 9 Unit Apartments | 70 (4.0%) | 1,674 (96.0%) |
| 10 or more Apartments | 79 (6.2%) | 1,189 (93.8%) |
| Mobile Home / Other | 65 (89.0%) | 8 (11.0%) |
| Total | 13,432 (54.6%) | 11,168 (45.4%) |
Housing Structures by Number of Rooms in Cicero
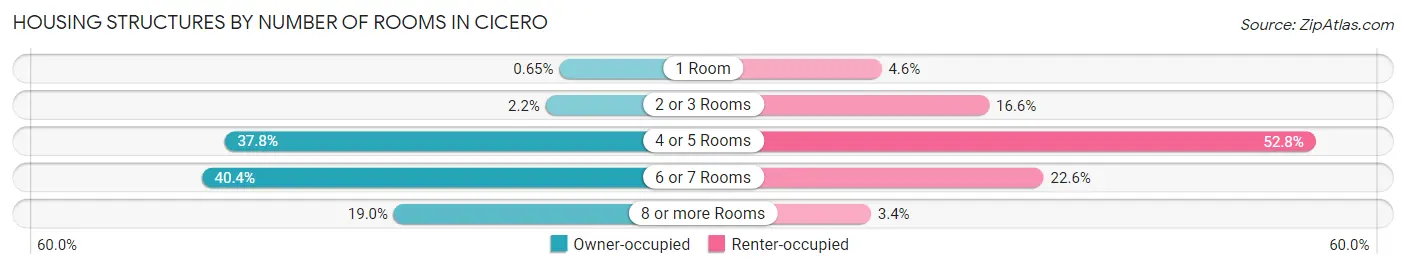
| Number of Rooms | Owner-occupied | Renter-occupied |
| 1 Room | 87 (0.6%) | 515 (4.6%) |
| 2 or 3 Rooms | 292 (2.2%) | 1,849 (16.6%) |
| 4 or 5 Rooms | 5,078 (37.8%) | 5,896 (52.8%) |
| 6 or 7 Rooms | 5,420 (40.4%) | 2,525 (22.6%) |
| 8 or more Rooms | 2,555 (19.0%) | 383 (3.4%) |
| Total | 13,432 (100.0%) | 11,168 (100.0%) |
Housing Structure by Heating Type in Cicero
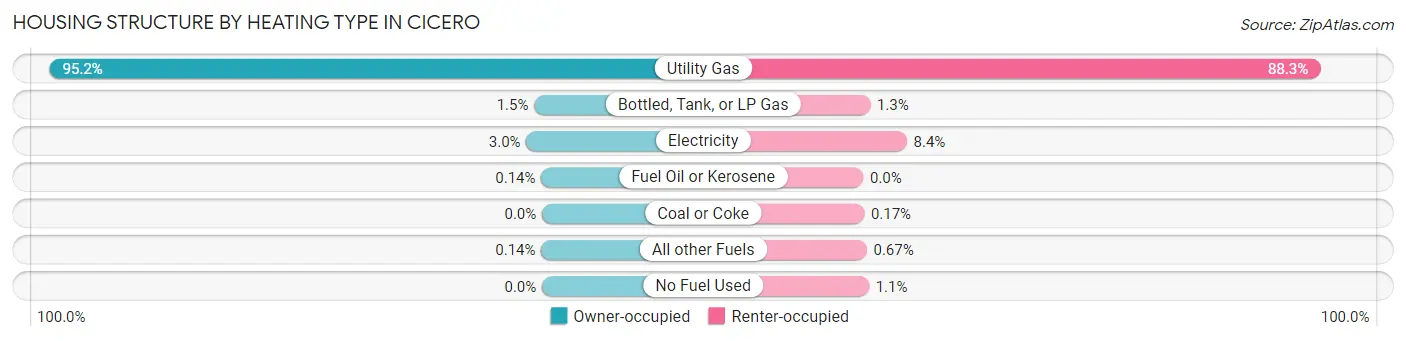
| Heating Type | Owner-occupied | Renter-occupied |
| Utility Gas | 12,786 (95.2%) | 9,862 (88.3%) |
| Bottled, Tank, or LP Gas | 201 (1.5%) | 150 (1.3%) |
| Electricity | 407 (3.0%) | 940 (8.4%) |
| Fuel Oil or Kerosene | 19 (0.1%) | 0 (0.0%) |
| Coal or Coke | 0 (0.0%) | 19 (0.2%) |
| All other Fuels | 19 (0.1%) | 75 (0.7%) |
| No Fuel Used | 0 (0.0%) | 122 (1.1%) |
| Total | 13,432 (100.0%) | 11,168 (100.0%) |
Household Vehicle Usage in Cicero

| Vehicles per Household | Owner-occupied | Renter-occupied |
| No Vehicle | 578 (4.3%) | 1,795 (16.1%) |
| 1 Vehicle | 3,557 (26.5%) | 4,973 (44.5%) |
| 2 Vehicles | 5,004 (37.2%) | 3,421 (30.6%) |
| 3 or more Vehicles | 4,293 (32.0%) | 979 (8.8%) |
| Total | 13,432 (100.0%) | 11,168 (100.0%) |
Real Estate & Mortgages in Cicero
Real Estate and Mortgage Overview in Cicero
| Characteristic | Without Mortgage | With Mortgage |
| Housing Units | 5,814 | 7,618 |
| Median Property Value | $206,000 | $238,500 |
| Median Household Income | $69,457 | $1,330 |
| Monthly Housing Costs | $779 | $265 |
| Real Estate Taxes | $4,919 | $247 |
Property Value by Mortgage Status in Cicero
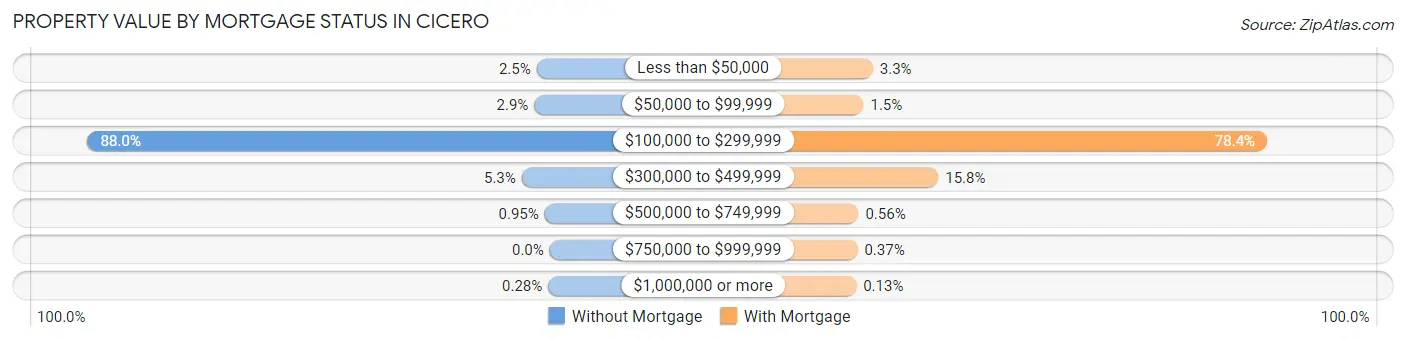
| Property Value | Without Mortgage | With Mortgage |
| Less than $50,000 | 145 (2.5%) | 251 (3.3%) |
| $50,000 to $99,999 | 171 (2.9%) | 116 (1.5%) |
| $100,000 to $299,999 | 5,117 (88.0%) | 5,969 (78.3%) |
| $300,000 to $499,999 | 310 (5.3%) | 1,201 (15.8%) |
| $500,000 to $749,999 | 55 (0.9%) | 43 (0.6%) |
| $750,000 to $999,999 | 0 (0.0%) | 28 (0.4%) |
| $1,000,000 or more | 16 (0.3%) | 10 (0.1%) |
| Total | 5,814 (100.0%) | 7,618 (100.0%) |
Household Income by Mortgage Status in Cicero
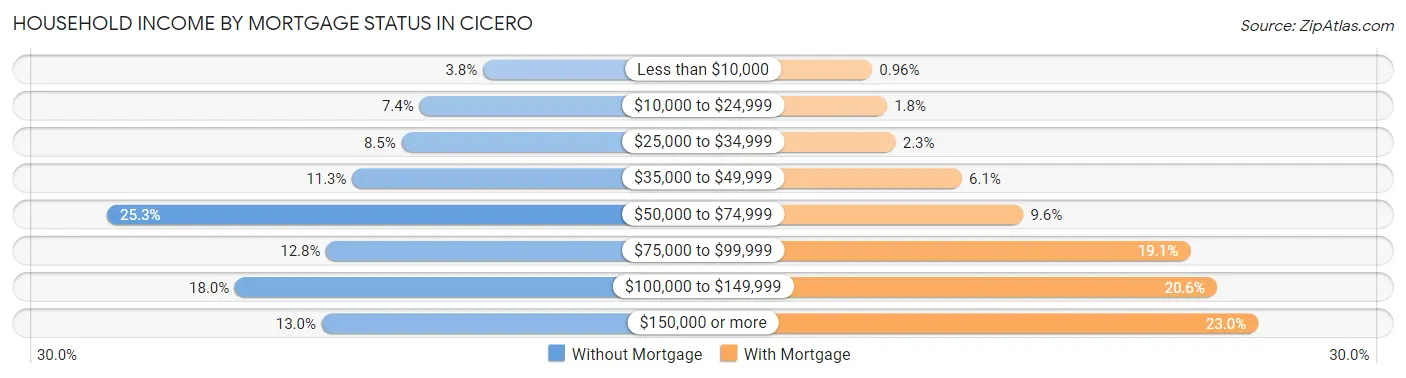
| Household Income | Without Mortgage | With Mortgage |
| Less than $10,000 | 221 (3.8%) | 73 (1.0%) |
| $10,000 to $24,999 | 432 (7.4%) | 138 (1.8%) |
| $25,000 to $34,999 | 492 (8.5%) | 175 (2.3%) |
| $35,000 to $49,999 | 655 (11.3%) | 464 (6.1%) |
| $50,000 to $74,999 | 1,470 (25.3%) | 731 (9.6%) |
| $75,000 to $99,999 | 742 (12.8%) | 1,456 (19.1%) |
| $100,000 to $149,999 | 1,045 (18.0%) | 1,572 (20.6%) |
| $150,000 or more | 757 (13.0%) | 1,752 (23.0%) |
| Total | 5,814 (100.0%) | 7,618 (100.0%) |
Property Value to Household Income Ratio in Cicero
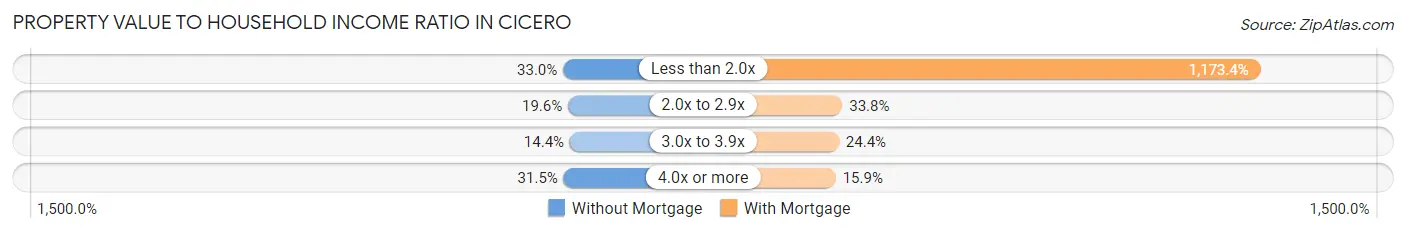
| Value-to-Income Ratio | Without Mortgage | With Mortgage |
| Less than 2.0x | 1,919 (33.0%) | 89,387 (1,173.4%) |
| 2.0x to 2.9x | 1,139 (19.6%) | 2,571 (33.8%) |
| 3.0x to 3.9x | 839 (14.4%) | 1,862 (24.4%) |
| 4.0x or more | 1,829 (31.5%) | 1,211 (15.9%) |
| Total | 5,814 (100.0%) | 7,618 (100.0%) |
Real Estate Taxes by Mortgage Status in Cicero

| Property Taxes | Without Mortgage | With Mortgage |
| Less than $800 | 180 (3.1%) | 49 (0.6%) |
| $800 to $1,499 | 119 (2.1%) | 198 (2.6%) |
| $800 to $1,499 | 5,275 (90.7%) | 139 (1.8%) |
| Total | 5,814 (100.0%) | 7,618 (100.0%) |
Health & Disability in Cicero
Health Insurance Coverage by Age in Cicero
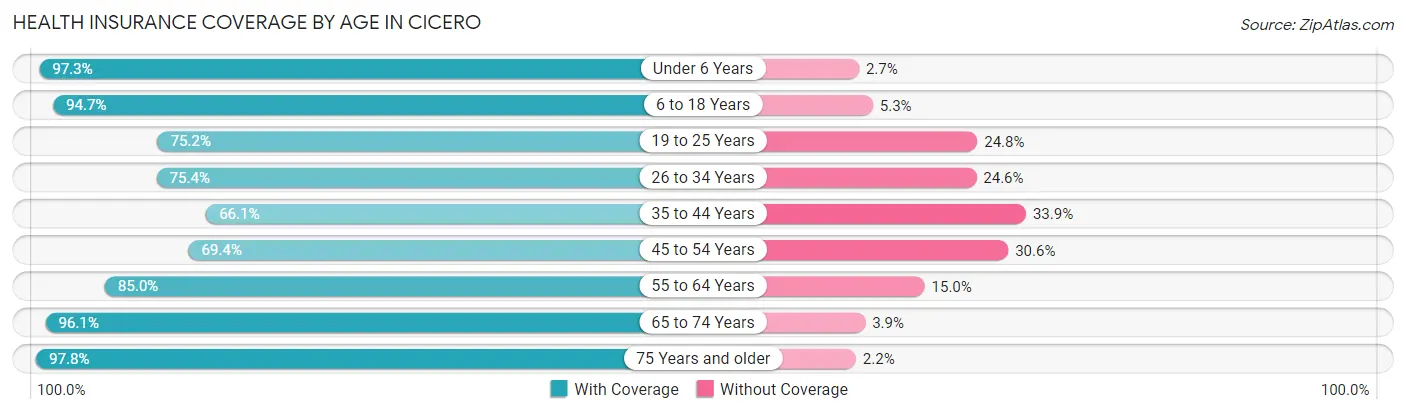
| Age Bracket | With Coverage | Without Coverage |
| Under 6 Years | 5,678 (97.3%) | 160 (2.7%) |
| 6 to 18 Years | 16,849 (94.7%) | 948 (5.3%) |
| 19 to 25 Years | 8,182 (75.2%) | 2,699 (24.8%) |
| 26 to 34 Years | 7,191 (75.4%) | 2,350 (24.6%) |
| 35 to 44 Years | 7,620 (66.1%) | 3,905 (33.9%) |
| 45 to 54 Years | 7,803 (69.4%) | 3,435 (30.6%) |
| 55 to 64 Years | 7,436 (85.0%) | 1,310 (15.0%) |
| 65 to 74 Years | 5,052 (96.1%) | 205 (3.9%) |
| 75 Years and older | 2,496 (97.8%) | 55 (2.2%) |
| Total | 68,307 (81.9%) | 15,067 (18.1%) |
Health Insurance Coverage by Citizenship Status in Cicero
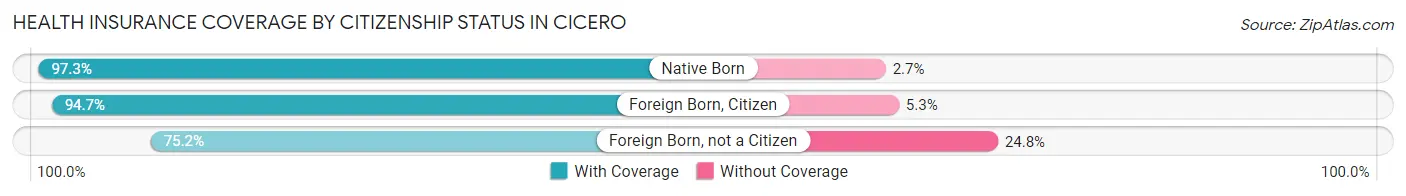
| Citizenship Status | With Coverage | Without Coverage |
| Native Born | 5,678 (97.3%) | 160 (2.7%) |
| Foreign Born, Citizen | 16,849 (94.7%) | 948 (5.3%) |
| Foreign Born, not a Citizen | 8,182 (75.2%) | 2,699 (24.8%) |
Health Insurance Coverage by Household Income in Cicero
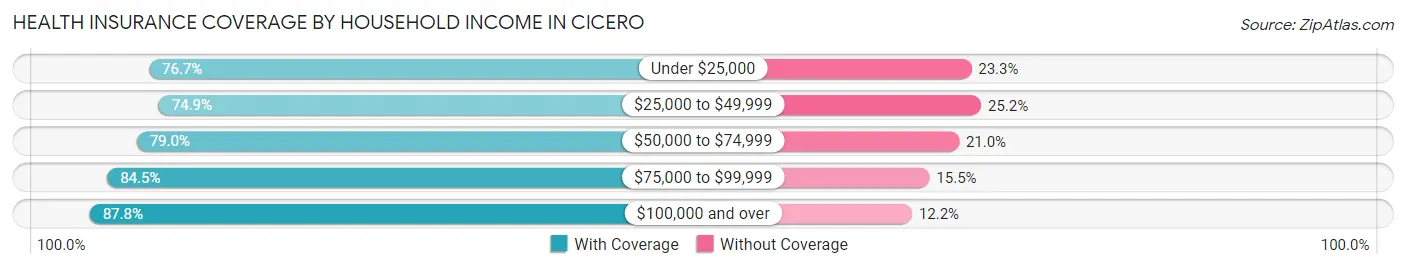
| Household Income | With Coverage | Without Coverage |
| Under $25,000 | 4,969 (76.7%) | 1,511 (23.3%) |
| $25,000 to $49,999 | 12,231 (74.9%) | 4,109 (25.2%) |
| $50,000 to $74,999 | 14,367 (79.0%) | 3,821 (21.0%) |
| $75,000 to $99,999 | 11,793 (84.5%) | 2,160 (15.5%) |
| $100,000 and over | 24,911 (87.8%) | 3,464 (12.2%) |
Public vs Private Health Insurance Coverage by Age in Cicero
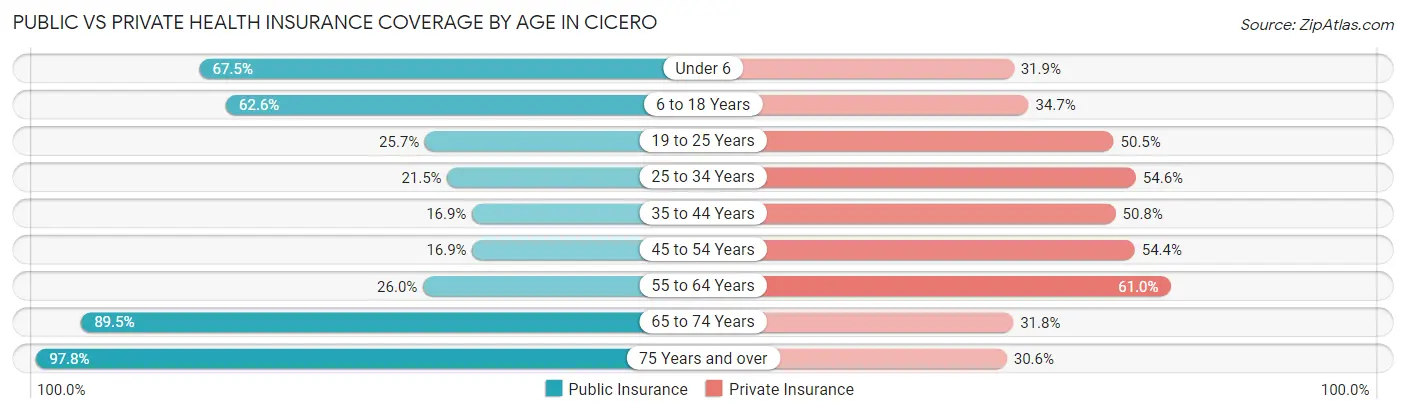
| Age Bracket | Public Insurance | Private Insurance |
| Under 6 | 3,942 (67.5%) | 1,863 (31.9%) |
| 6 to 18 Years | 11,146 (62.6%) | 6,170 (34.7%) |
| 19 to 25 Years | 2,792 (25.7%) | 5,490 (50.4%) |
| 25 to 34 Years | 2,052 (21.5%) | 5,208 (54.6%) |
| 35 to 44 Years | 1,950 (16.9%) | 5,857 (50.8%) |
| 45 to 54 Years | 1,896 (16.9%) | 6,112 (54.4%) |
| 55 to 64 Years | 2,276 (26.0%) | 5,333 (61.0%) |
| 65 to 74 Years | 4,704 (89.5%) | 1,673 (31.8%) |
| 75 Years and over | 2,496 (97.8%) | 781 (30.6%) |
| Total | 33,254 (39.9%) | 38,487 (46.2%) |
Disability Status by Sex by Age in Cicero
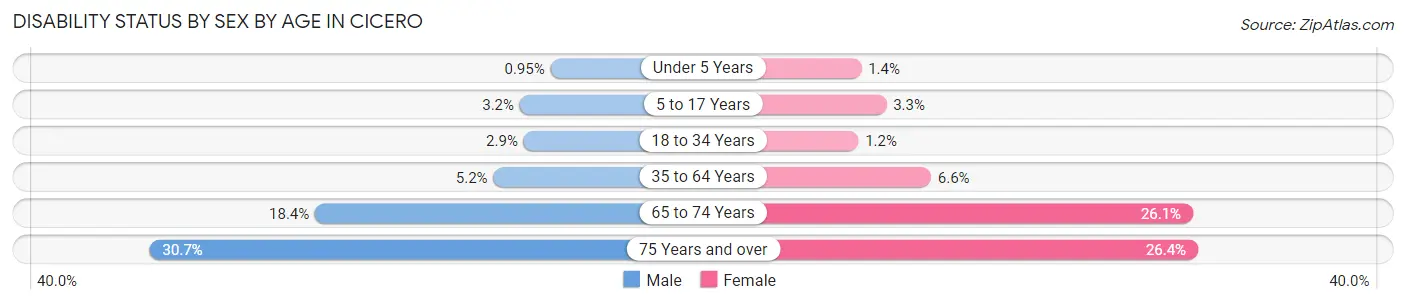
| Age Bracket | Male | Female |
| Under 5 Years | 17 (0.9%) | 40 (1.4%) |
| 5 to 17 Years | 283 (3.2%) | 289 (3.3%) |
| 18 to 34 Years | 308 (2.9%) | 140 (1.2%) |
| 35 to 64 Years | 869 (5.2%) | 976 (6.6%) |
| 65 to 74 Years | 450 (18.4%) | 734 (26.1%) |
| 75 Years and over | 283 (30.7%) | 431 (26.4%) |
Disability Class by Sex by Age in Cicero
Disability Class: Hearing Difficulty
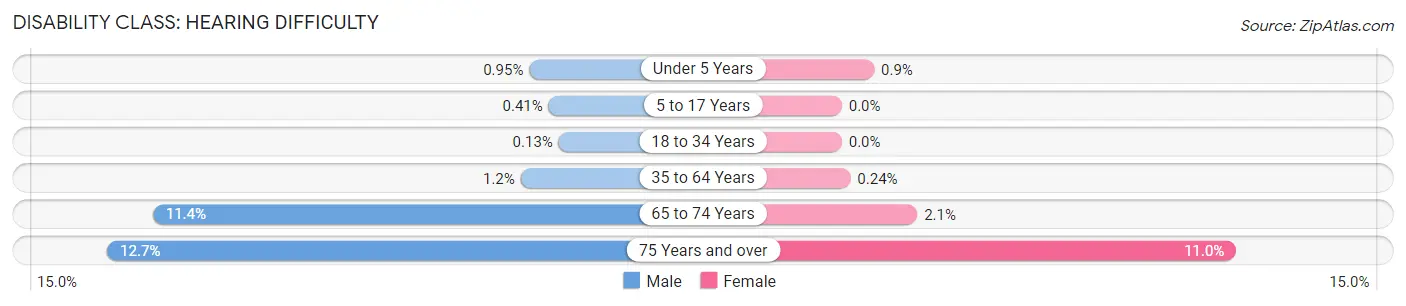
| Age Bracket | Male | Female |
| Under 5 Years | 17 (0.9%) | 25 (0.9%) |
| 5 to 17 Years | 36 (0.4%) | 0 (0.0%) |
| 18 to 34 Years | 14 (0.1%) | 0 (0.0%) |
| 35 to 64 Years | 199 (1.2%) | 35 (0.2%) |
| 65 to 74 Years | 279 (11.4%) | 59 (2.1%) |
| 75 Years and over | 117 (12.7%) | 179 (11.0%) |
Disability Class: Vision Difficulty
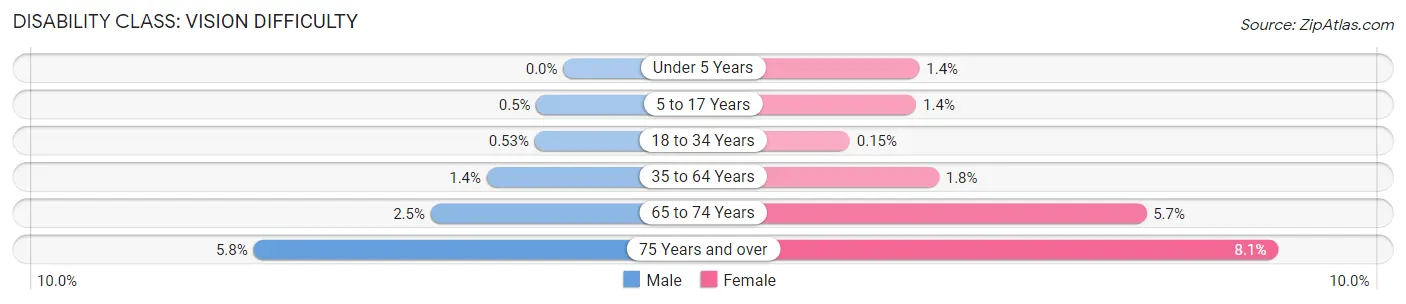
| Age Bracket | Male | Female |
| Under 5 Years | 0 (0.0%) | 40 (1.4%) |
| 5 to 17 Years | 44 (0.5%) | 121 (1.4%) |
| 18 to 34 Years | 55 (0.5%) | 17 (0.2%) |
| 35 to 64 Years | 238 (1.4%) | 266 (1.8%) |
| 65 to 74 Years | 60 (2.5%) | 159 (5.7%) |
| 75 Years and over | 53 (5.8%) | 132 (8.1%) |
Disability Class: Cognitive Difficulty
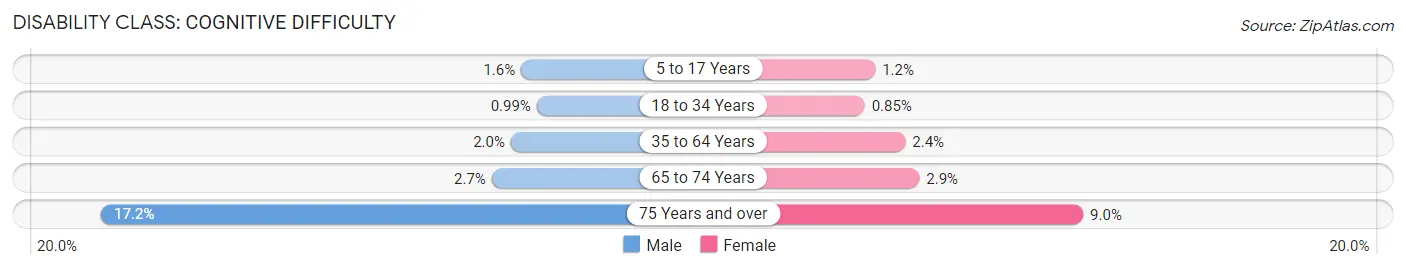
| Age Bracket | Male | Female |
| 5 to 17 Years | 138 (1.6%) | 109 (1.2%) |
| 18 to 34 Years | 104 (1.0%) | 97 (0.9%) |
| 35 to 64 Years | 326 (1.9%) | 348 (2.4%) |
| 65 to 74 Years | 65 (2.7%) | 81 (2.9%) |
| 75 Years and over | 158 (17.2%) | 146 (9.0%) |
Disability Class: Ambulatory Difficulty
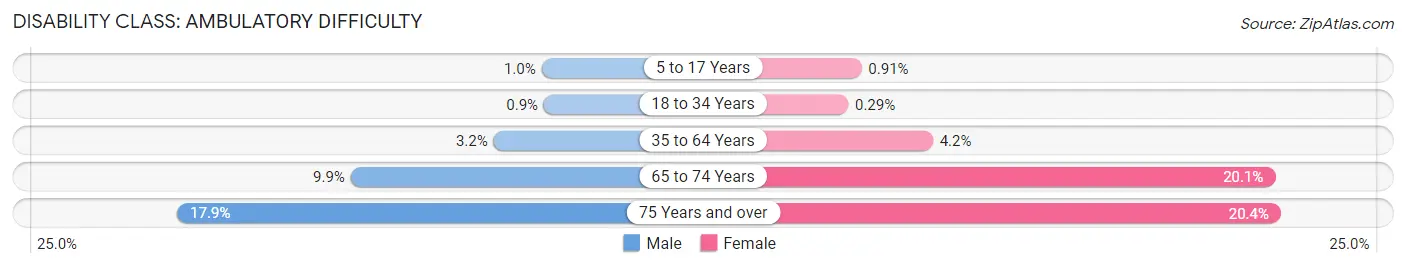
| Age Bracket | Male | Female |
| 5 to 17 Years | 89 (1.0%) | 80 (0.9%) |
| 18 to 34 Years | 94 (0.9%) | 33 (0.3%) |
| 35 to 64 Years | 543 (3.2%) | 623 (4.2%) |
| 65 to 74 Years | 241 (9.9%) | 566 (20.1%) |
| 75 Years and over | 165 (17.9%) | 332 (20.4%) |
Disability Class: Self-Care Difficulty
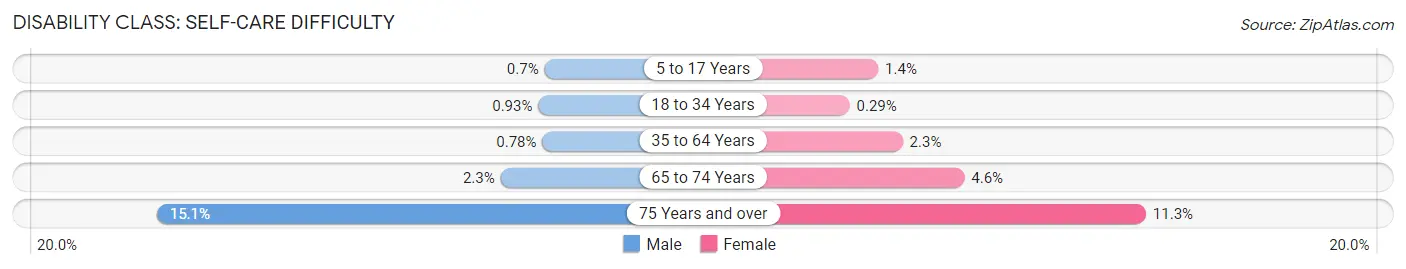
| Age Bracket | Male | Female |
| 5 to 17 Years | 61 (0.7%) | 118 (1.3%) |
| 18 to 34 Years | 97 (0.9%) | 33 (0.3%) |
| 35 to 64 Years | 131 (0.8%) | 334 (2.3%) |
| 65 to 74 Years | 57 (2.3%) | 128 (4.5%) |
| 75 Years and over | 139 (15.1%) | 184 (11.3%) |
Technology Access in Cicero
Computing Device Access in Cicero
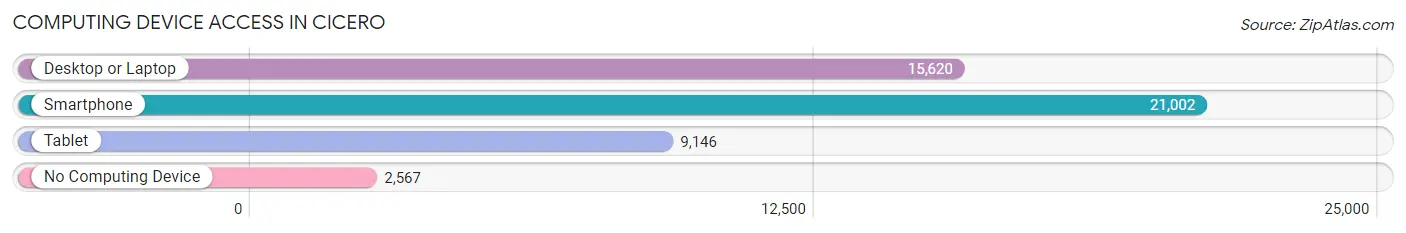
| Device Type | # Households | % Households |
| Desktop or Laptop | 15,620 | 63.5% |
| Smartphone | 21,002 | 85.4% |
| Tablet | 9,146 | 37.2% |
| No Computing Device | 2,567 | 10.4% |
| Total | 24,600 | 100.0% |
Internet Access in Cicero
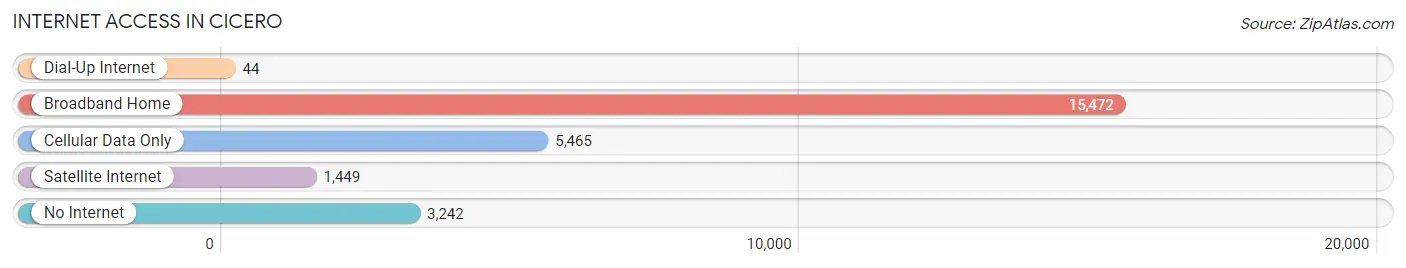
| Internet Type | # Households | % Households |
| Dial-Up Internet | 44 | 0.2% |
| Broadband Home | 15,472 | 62.9% |
| Cellular Data Only | 5,465 | 22.2% |
| Satellite Internet | 1,449 | 5.9% |
| No Internet | 3,242 | 13.2% |
| Total | 24,600 | 100.0% |
Cicero Summary
Cicero, Illinois is a town located in Cook County, Illinois, United States. It is a suburb of Chicago and is located about 10 miles west of the city. The population of Cicero was 83,891 at the 2010 census, making it the 11th largest municipality in Illinois.
History
Cicero was founded in 1849 by a group of settlers from Cicero, New York. The town was named after the Roman statesman Marcus Tullius Cicero. The town was incorporated in 1869 and was annexed to Chicago in 1889.
Cicero has a long and colorful history. It was the site of the infamous St. Valentine's Day Massacre in 1929, when seven members of the North Side Gang were gunned down by members of Al Capone's gang. The town was also the site of the Haymarket Riot in 1886, when a bomb was thrown at police officers during a labor protest.
Cicero has also been home to many famous people, including former President Barack Obama, who lived in the town for several years as a child.
Geography
Cicero is located in Cook County, Illinois, about 10 miles west of Chicago. It is bordered by the towns of Berwyn, Stickney, and Lyons. The town covers an area of 5.5 square miles and has a population density of 15,000 people per square mile.
The town is located on the Des Plaines River and is home to several parks, including the Cicero Community Park, which features a playground, picnic area, and walking trails.
Economy
Cicero has a diverse economy, with a mix of manufacturing, retail, and service industries. The town is home to several large employers, including the Cermak Fresh Market, a large grocery store chain, and the Cicero Industrial Park, which is home to several manufacturing companies.
The town also has a thriving retail sector, with several shopping centers and malls, including the North Riverside Mall and the Cicero Town Center.
Demographics
As of the 2010 census, the population of Cicero was 83,891. The racial makeup of the town was 57.3% White, 28.2% Hispanic or Latino, 10.2% African American, and 4.3% Asian.
The median household income in Cicero was $41,945, and the median family income was $50,945. The per capita income was $20,945.
Conclusion
Cicero, Illinois is a town located in Cook County, Illinois, about 10 miles west of Chicago. It has a long and colorful history, and is the site of the infamous St. Valentine's Day Massacre and the Haymarket Riot. The town has a diverse economy, with a mix of manufacturing, retail, and service industries. The population of Cicero was 83,891 at the 2010 census, and the racial makeup of the town was 57.3% White, 28.2% Hispanic or Latino, 10.2% African American, and 4.3% Asian. The median household income in Cicero was $41,945, and the median family income was $50,945.
Common Questions
What is Per Capita Income in Cicero?
Per Capita income in Cicero is $23,597.
What is the Median Family Income in Cicero?
Median Family Income in Cicero is $69,785.
What is the Median Household income in Cicero?
Median Household Income in Cicero is $64,325.
What is Income or Wage Gap in Cicero?
Income or Wage Gap in Cicero is 26.8%.
Women in Cicero earn 73.2 cents for every dollar earned by a man.
What is Family Income Deficit in Cicero?
Family Income Deficit in Cicero is $10,597.
Families that are below poverty line in Cicero earn $10,597 less on average than the poverty threshold level.
What is Inequality or Gini Index in Cicero?
Inequality or Gini Index in Cicero is 0.40.
What is the Total Population of Cicero?
Total Population of Cicero is 84,189.
What is the Total Male Population of Cicero?
Total Male Population of Cicero is 41,508.
What is the Total Female Population of Cicero?
Total Female Population of Cicero is 42,681.
What is the Ratio of Males per 100 Females in Cicero?
There are 97.25 Males per 100 Females in Cicero.
What is the Ratio of Females per 100 Males in Cicero?
There are 102.83 Females per 100 Males in Cicero.
What is the Median Population Age in Cicero?
Median Population Age in Cicero is 33.4 Years.
What is the Average Family Size in Cicero
Average Family Size in Cicero is 3.9 People.
What is the Average Household Size in Cicero
Average Household Size in Cicero is 3.4 People.
How Large is the Labor Force in Cicero?
There are 41,252 People in the Labor Forcein in Cicero.
What is the Percentage of People in the Labor Force in Cicero?
62.9% of People are in the Labor Force in Cicero.
What is the Unemployment Rate in Cicero?
Unemployment Rate in Cicero is 3.9%.