Kansas City, KS Map & Demographics
Kansas City Map
Kansas City Overview
$27,034
PER CAPITA INCOME
$68,316
AVG FAMILY INCOME
$56,120
AVG HOUSEHOLD INCOME
21.3%
WAGE / INCOME GAP [ % ]
78.7¢/ $1
WAGE / INCOME GAP [ $ ]
$10,636
FAMILY INCOME DEFICIT
0.43
INEQUALITY / GINI INDEX
155,438
TOTAL POPULATION
78,302
MALE POPULATION
77,136
FEMALE POPULATION
101.51
MALES / 100 FEMALES
98.51
FEMALES / 100 MALES
34.1
MEDIAN AGE
3.5
AVG FAMILY SIZE
2.7
AVG HOUSEHOLD SIZE
77,241
LABOR FORCE [ PEOPLE ]
65.7%
PERCENT IN LABOR FORCE
6.0%
UNEMPLOYMENT RATE
Kansas City Area Codes
Income in Kansas City
Income Overview in Kansas City
Per Capita Income in Kansas City is $27,034, while median incomes of families and households are $68,316 and $56,120 respectively.
| Characteristic | Number | Measure |
| Per Capita Income | 155,438 | $27,034 |
| Median Family Income | 35,550 | $68,316 |
| Mean Family Income | 35,550 | $81,665 |
| Median Household Income | 56,842 | $56,120 |
| Mean Household Income | 56,842 | $70,793 |
| Income Deficit | 35,550 | $10,636 |
| Wage / Income Gap (%) | 155,438 | 21.26% |
| Wage / Income Gap ($) | 155,438 | 78.74¢ per $1 |
| Gini / Inequality Index | 155,438 | 0.43 |
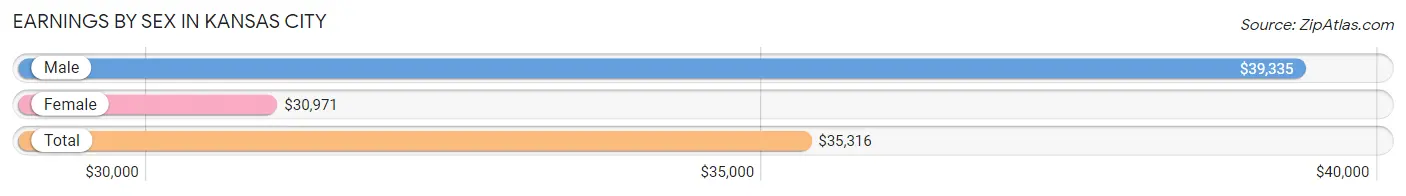
Earnings by Sex in Kansas City
Average Earnings in Kansas City are $35,316, $39,335 for men and $30,971 for women, a difference of 21.3%.
| Sex | Number | Average Earnings |
| Male | 43,506 (54.4%) | $39,335 |
| Female | 36,487 (45.6%) | $30,971 |
| Total | 79,993 (100.0%) | $35,316 |
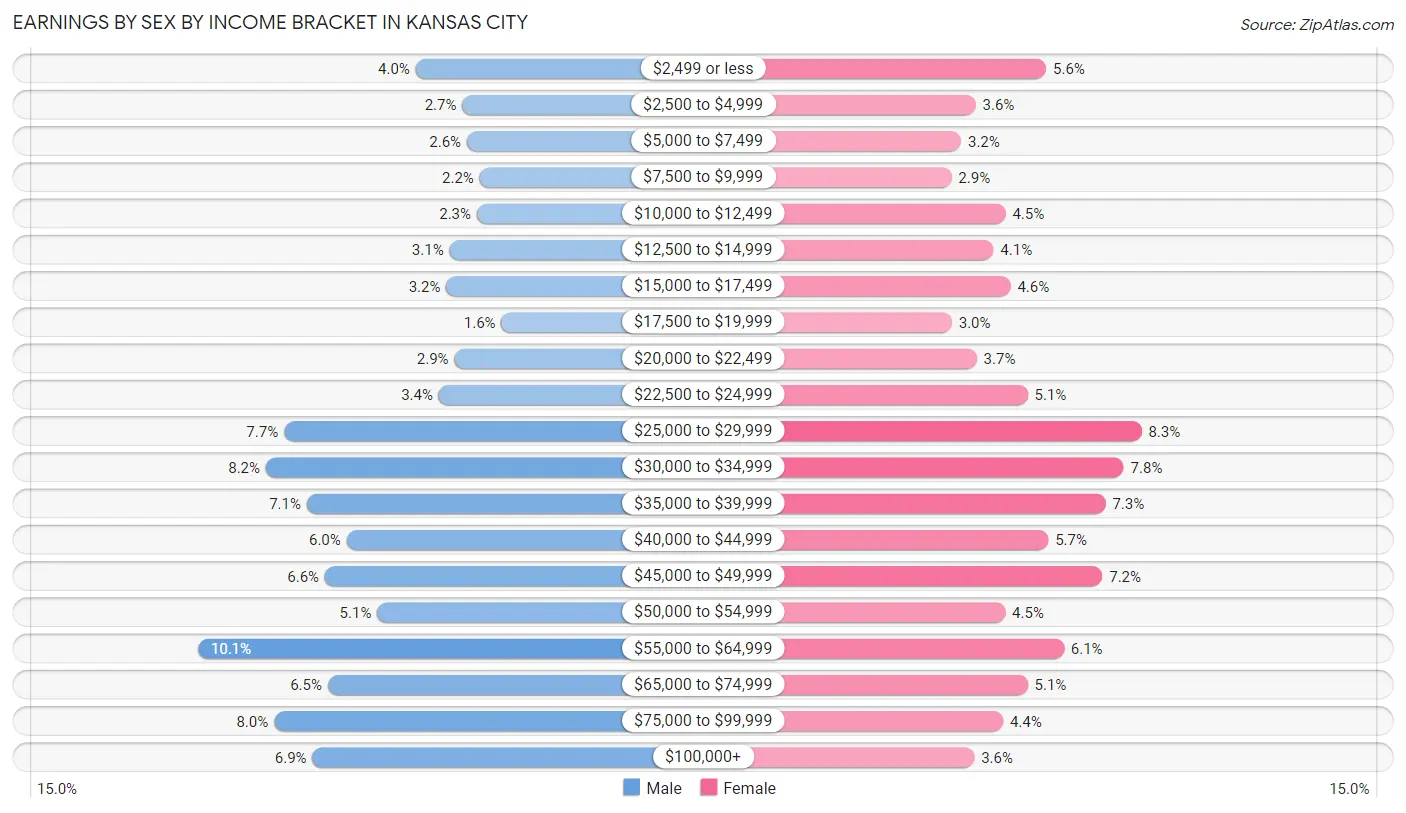
Earnings by Sex by Income Bracket in Kansas City
The most common earnings brackets in Kansas City are $55,000 to $64,999 for men (4,409 | 10.1%) and $25,000 to $29,999 for women (3,021 | 8.3%).
| Income | Male | Female |
| $2,499 or less | 1,745 (4.0%) | 2,045 (5.6%) |
| $2,500 to $4,999 | 1,173 (2.7%) | 1,322 (3.6%) |
| $5,000 to $7,499 | 1,116 (2.6%) | 1,172 (3.2%) |
| $7,500 to $9,999 | 962 (2.2%) | 1,071 (2.9%) |
| $10,000 to $12,499 | 997 (2.3%) | 1,627 (4.5%) |
| $12,500 to $14,999 | 1,333 (3.1%) | 1,503 (4.1%) |
| $15,000 to $17,499 | 1,372 (3.2%) | 1,679 (4.6%) |
| $17,500 to $19,999 | 695 (1.6%) | 1,075 (2.9%) |
| $20,000 to $22,499 | 1,272 (2.9%) | 1,332 (3.6%) |
| $22,500 to $24,999 | 1,460 (3.4%) | 1,853 (5.1%) |
| $25,000 to $29,999 | 3,355 (7.7%) | 3,021 (8.3%) |
| $30,000 to $34,999 | 3,578 (8.2%) | 2,839 (7.8%) |
| $35,000 to $39,999 | 3,075 (7.1%) | 2,653 (7.3%) |
| $40,000 to $44,999 | 2,590 (5.9%) | 2,066 (5.7%) |
| $45,000 to $49,999 | 2,853 (6.6%) | 2,618 (7.2%) |
| $50,000 to $54,999 | 2,215 (5.1%) | 1,624 (4.4%) |
| $55,000 to $64,999 | 4,409 (10.1%) | 2,226 (6.1%) |
| $65,000 to $74,999 | 2,820 (6.5%) | 1,852 (5.1%) |
| $75,000 to $99,999 | 3,478 (8.0%) | 1,602 (4.4%) |
| $100,000+ | 3,008 (6.9%) | 1,307 (3.6%) |
| Total | 43,506 (100.0%) | 36,487 (100.0%) |
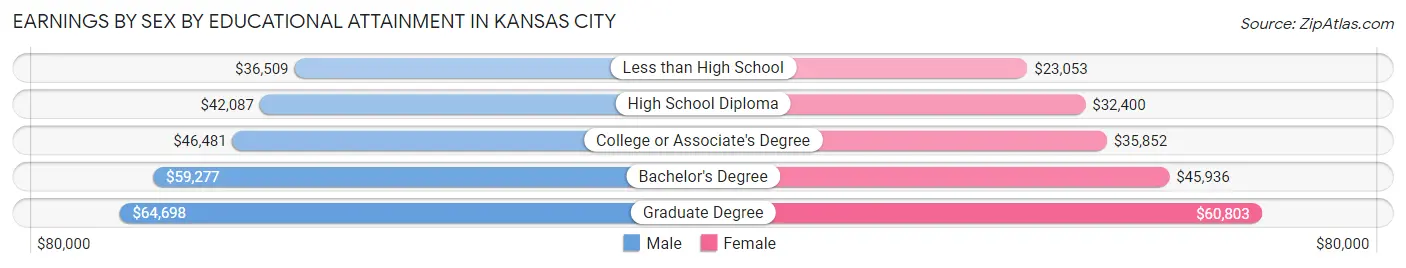
Earnings by Sex by Educational Attainment in Kansas City
Average earnings in Kansas City are $44,961 for men and $35,808 for women, a difference of 20.4%. Men with an educational attainment of graduate degree enjoy the highest average annual earnings of $64,698, while those with less than high school education earn the least with $36,509. Women with an educational attainment of graduate degree earn the most with the average annual earnings of $60,803, while those with less than high school education have the smallest earnings of $23,053.
| Educational Attainment | Male Income | Female Income |
| Less than High School | $36,509 | $23,053 |
| High School Diploma | $42,087 | $32,400 |
| College or Associate's Degree | $46,481 | $35,852 |
| Bachelor's Degree | $59,277 | $45,936 |
| Graduate Degree | $64,698 | $60,803 |
| Total | $44,961 | $35,808 |
Family Income in Kansas City
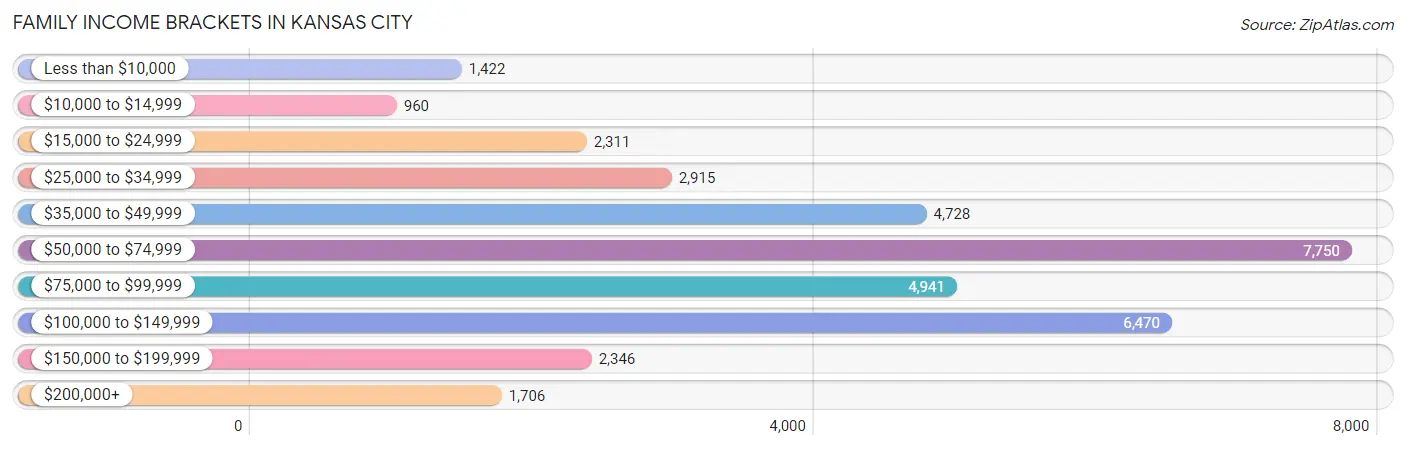
Family Income Brackets in Kansas City
According to the Kansas City family income data, there are 7,750 families falling into the $50,000 to $74,999 income range, which is the most common income bracket and makes up 21.8% of all families. Conversely, the $10,000 to $14,999 income bracket is the least frequent group with only 960 families (2.7%) belonging to this category.
| Income Bracket | # Families | % Families |
| Less than $10,000 | 1,422 | 4.0% |
| $10,000 to $14,999 | 960 | 2.7% |
| $15,000 to $24,999 | 2,311 | 6.5% |
| $25,000 to $34,999 | 2,915 | 8.2% |
| $35,000 to $49,999 | 4,728 | 13.3% |
| $50,000 to $74,999 | 7,750 | 21.8% |
| $75,000 to $99,999 | 4,941 | 13.9% |
| $100,000 to $149,999 | 6,470 | 18.2% |
| $150,000 to $199,999 | 2,346 | 6.6% |
| $200,000+ | 1,706 | 4.8% |
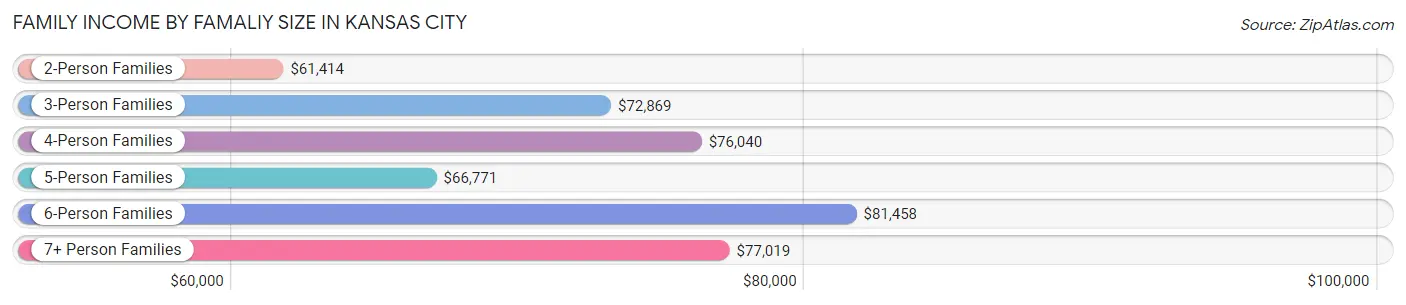
Family Income by Famaliy Size in Kansas City
6-person families (1,660 | 4.7%) account for the highest median family income in Kansas City with $81,458 per family, while 2-person families (15,039 | 42.3%) have the highest median income of $30,707 per family member.
| Income Bracket | # Families | Median Income |
| 2-Person Families | 15,039 (42.3%) | $61,414 |
| 3-Person Families | 7,756 (21.8%) | $72,869 |
| 4-Person Families | 6,807 (19.2%) | $76,040 |
| 5-Person Families | 3,231 (9.1%) | $66,771 |
| 6-Person Families | 1,660 (4.7%) | $81,458 |
| 7+ Person Families | 1,057 (3.0%) | $77,019 |
| Total | 35,550 (100.0%) | $68,316 |
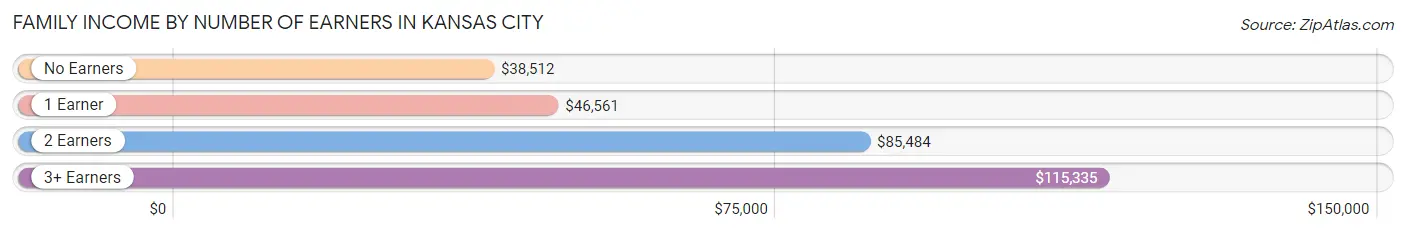
Family Income by Number of Earners in Kansas City
The median family income in Kansas City is $68,316, with families comprising 3+ earners (4,868) having the highest median family income of $115,335, while families with no earners (4,176) have the lowest median family income of $38,512, accounting for 13.7% and 11.7% of families, respectively.
| Number of Earners | # Families | Median Income |
| No Earners | 4,176 (11.7%) | $38,512 |
| 1 Earner | 12,734 (35.8%) | $46,561 |
| 2 Earners | 13,772 (38.7%) | $85,484 |
| 3+ Earners | 4,868 (13.7%) | $115,335 |
| Total | 35,550 (100.0%) | $68,316 |
Household Income in Kansas City
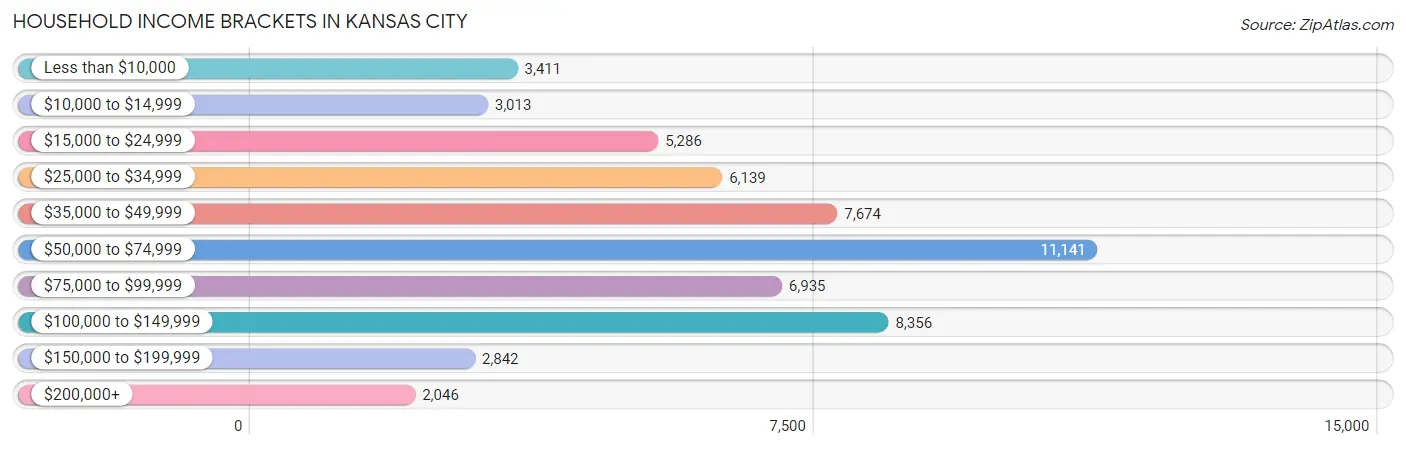
Household Income Brackets in Kansas City
With 11,141 households falling in the category, the $50,000 to $74,999 income range is the most frequent in Kansas City, accounting for 19.6% of all households. In contrast, only 2,046 households (3.6%) fall into the $200,000+ income bracket, making it the least populous group.
| Income Bracket | # Households | % Households |
| Less than $10,000 | 3,411 | 6.0% |
| $10,000 to $14,999 | 3,013 | 5.3% |
| $15,000 to $24,999 | 5,286 | 9.3% |
| $25,000 to $34,999 | 6,139 | 10.8% |
| $35,000 to $49,999 | 7,674 | 13.5% |
| $50,000 to $74,999 | 11,141 | 19.6% |
| $75,000 to $99,999 | 6,935 | 12.2% |
| $100,000 to $149,999 | 8,356 | 14.7% |
| $150,000 to $199,999 | 2,842 | 5.0% |
| $200,000+ | 2,046 | 3.6% |
Household Income by Householder Age in Kansas City
The median household income in Kansas City is $56,120, with the highest median household income of $61,953 found in the 25 to 44 years age bracket for the primary householder. A total of 20,190 households (35.5%) fall into this category. Meanwhile, the 15 to 24 years age bracket for the primary householder has the lowest median household income of $42,220, with 2,689 households (4.7%) in this group.
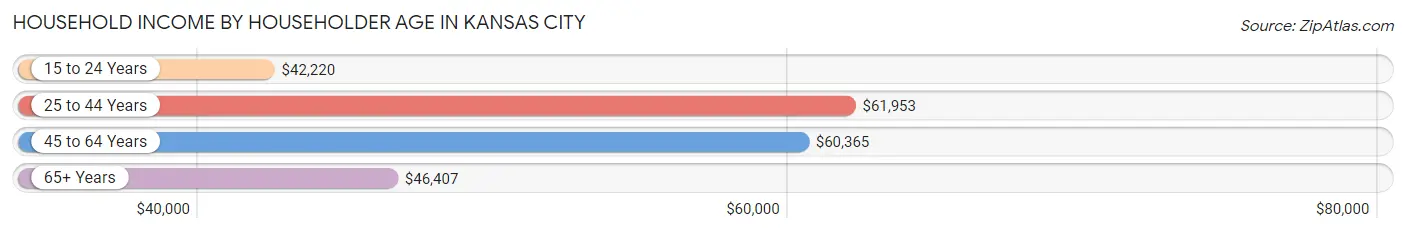
| Income Bracket | # Households | Median Income |
| 15 to 24 Years | 2,689 (4.7%) | $42,220 |
| 25 to 44 Years | 20,190 (35.5%) | $61,953 |
| 45 to 64 Years | 20,154 (35.5%) | $60,365 |
| 65+ Years | 13,809 (24.3%) | $46,407 |
| Total | 56,842 (100.0%) | $56,120 |
Poverty in Kansas City
Income Below Poverty by Sex and Age in Kansas City
With 15.5% poverty level for males and 19.2% for females among the residents of Kansas City, 5 year old males and 5 year old females are the most vulnerable to poverty, with 381 males (40.2%) and 378 females (35.3%) in their respective age groups living below the poverty level.
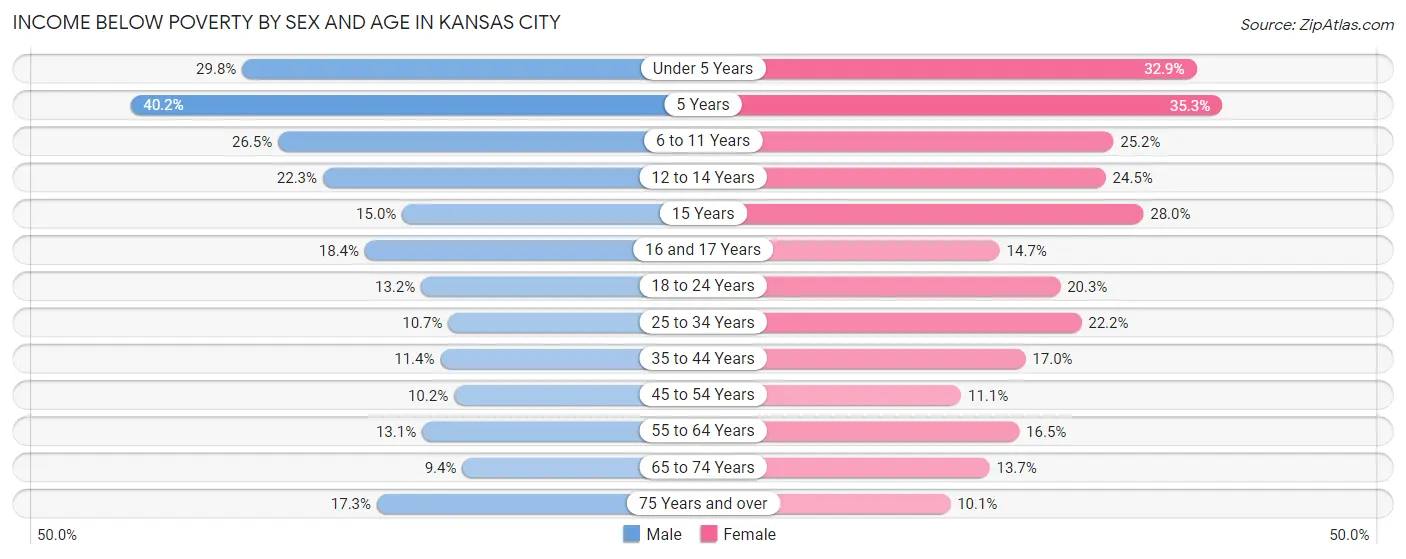
| Age Bracket | Male | Female |
| Under 5 Years | 1,727 (29.8%) | 1,788 (32.9%) |
| 5 Years | 381 (40.2%) | 378 (35.3%) |
| 6 to 11 Years | 1,887 (26.5%) | 1,754 (25.2%) |
| 12 to 14 Years | 875 (22.3%) | 866 (24.5%) |
| 15 Years | 186 (15.0%) | 286 (28.0%) |
| 16 and 17 Years | 400 (18.4%) | 330 (14.6%) |
| 18 to 24 Years | 974 (13.2%) | 1,411 (20.3%) |
| 25 to 34 Years | 1,219 (10.7%) | 2,459 (22.2%) |
| 35 to 44 Years | 1,210 (11.4%) | 1,713 (17.0%) |
| 45 to 54 Years | 918 (10.2%) | 902 (11.1%) |
| 55 to 64 Years | 1,147 (13.1%) | 1,437 (16.5%) |
| 65 to 74 Years | 547 (9.4%) | 894 (13.7%) |
| 75 Years and over | 524 (17.3%) | 469 (10.1%) |
| Total | 11,995 (15.5%) | 14,687 (19.2%) |
Income Above Poverty by Sex and Age in Kansas City
According to the poverty statistics in Kansas City, males aged 65 to 74 years and females aged 75 years and over are the age groups that are most secure financially, with 90.6% of males and 89.9% of females in these age groups living above the poverty line.
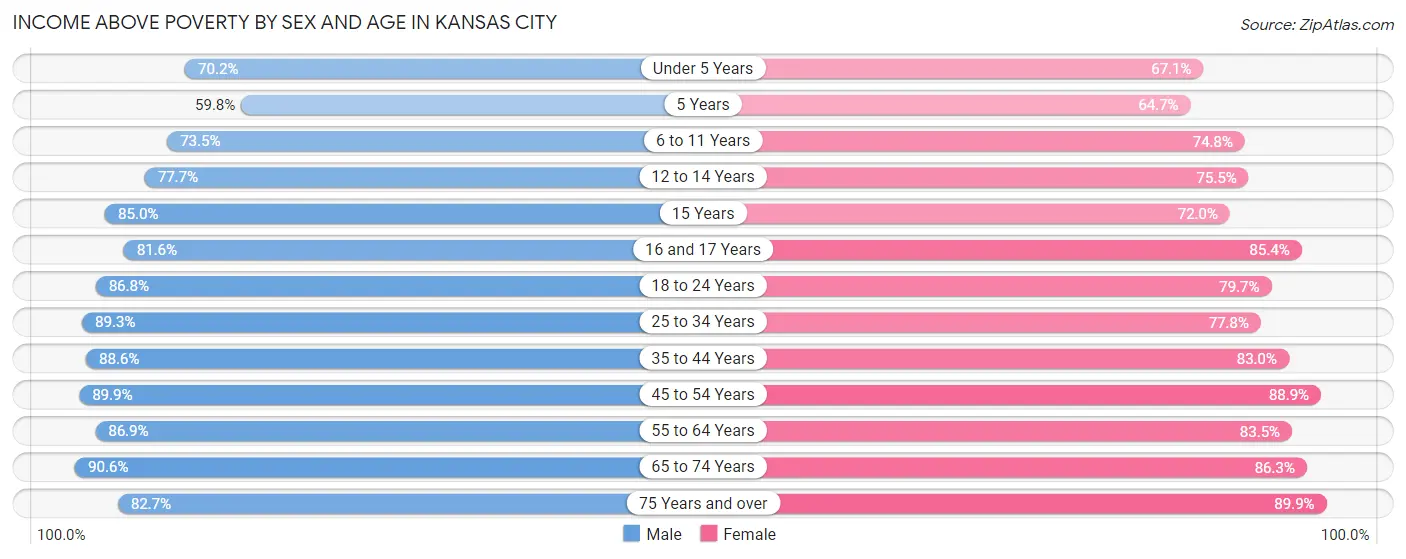
| Age Bracket | Male | Female |
| Under 5 Years | 4,066 (70.2%) | 3,646 (67.1%) |
| 5 Years | 567 (59.8%) | 693 (64.7%) |
| 6 to 11 Years | 5,238 (73.5%) | 5,205 (74.8%) |
| 12 to 14 Years | 3,046 (77.7%) | 2,670 (75.5%) |
| 15 Years | 1,057 (85.0%) | 736 (72.0%) |
| 16 and 17 Years | 1,771 (81.6%) | 1,923 (85.4%) |
| 18 to 24 Years | 6,398 (86.8%) | 5,549 (79.7%) |
| 25 to 34 Years | 10,192 (89.3%) | 8,603 (77.8%) |
| 35 to 44 Years | 9,384 (88.6%) | 8,337 (83.0%) |
| 45 to 54 Years | 8,129 (89.8%) | 7,247 (88.9%) |
| 55 to 64 Years | 7,594 (86.9%) | 7,291 (83.5%) |
| 65 to 74 Years | 5,284 (90.6%) | 5,626 (86.3%) |
| 75 Years and over | 2,504 (82.7%) | 4,191 (89.9%) |
| Total | 65,230 (84.5%) | 61,717 (80.8%) |
Income Below Poverty Among Married-Couple Families in Kansas City
The poverty statistics for married-couple families in Kansas City show that 7.4% or 1,706 of the total 23,071 families live below the poverty line. Families with 5 or more children have the highest poverty rate of 38.3%, comprising of 105 families. On the other hand, families with no children have the lowest poverty rate of 4.1%, which includes 493 families.
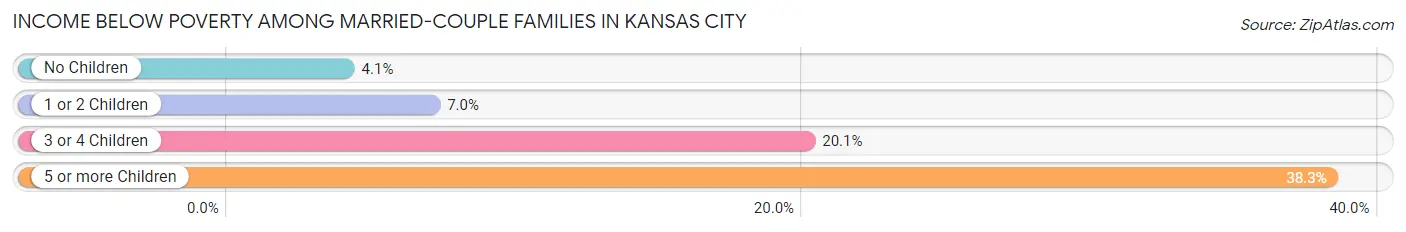
| Children | Above Poverty | Below Poverty |
| No Children | 11,638 (95.9%) | 493 (4.1%) |
| 1 or 2 Children | 7,372 (93.0%) | 558 (7.0%) |
| 3 or 4 Children | 2,186 (79.9%) | 550 (20.1%) |
| 5 or more Children | 169 (61.7%) | 105 (38.3%) |
| Total | 21,365 (92.6%) | 1,706 (7.4%) |
Income Below Poverty Among Single-Parent Households in Kansas City
According to the poverty data in Kansas City, 12.8% or 450 single-father households and 29.4% or 2,633 single-mother households are living below the poverty line. Among single-father households, those with 5 or more children have the highest poverty rate, with 77 households (85.6%) experiencing poverty. Likewise, among single-mother households, those with 5 or more children have the highest poverty rate, with 59 households (60.2%) falling below the poverty line.
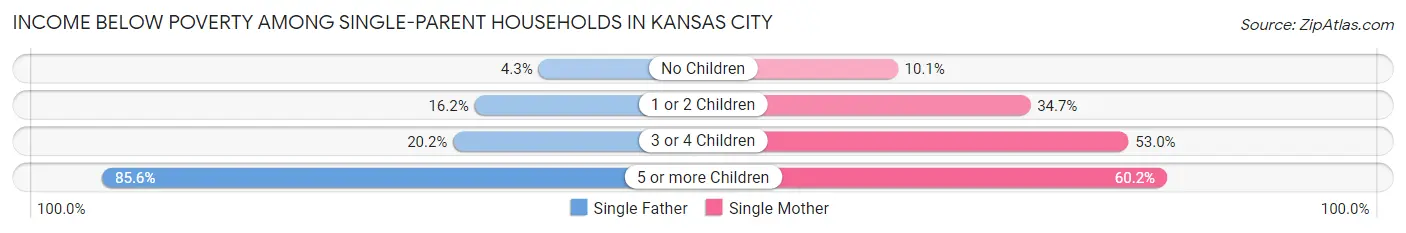
| Children | Single Father | Single Mother |
| No Children | 70 (4.3%) | 312 (10.1%) |
| 1 or 2 Children | 231 (16.2%) | 1,511 (34.7%) |
| 3 or 4 Children | 72 (20.2%) | 751 (53.0%) |
| 5 or more Children | 77 (85.6%) | 59 (60.2%) |
| Total | 450 (12.8%) | 2,633 (29.4%) |
Income Below Poverty Among Married-Couple vs Single-Parent Households in Kansas City
The poverty data for Kansas City shows that 1,706 of the married-couple family households (7.4%) and 3,083 of the single-parent households (24.7%) are living below the poverty level. Within the married-couple family households, those with 5 or more children have the highest poverty rate, with 105 households (38.3%) falling below the poverty line. Among the single-parent households, those with 5 or more children have the highest poverty rate, with 136 household (72.3%) living below poverty.
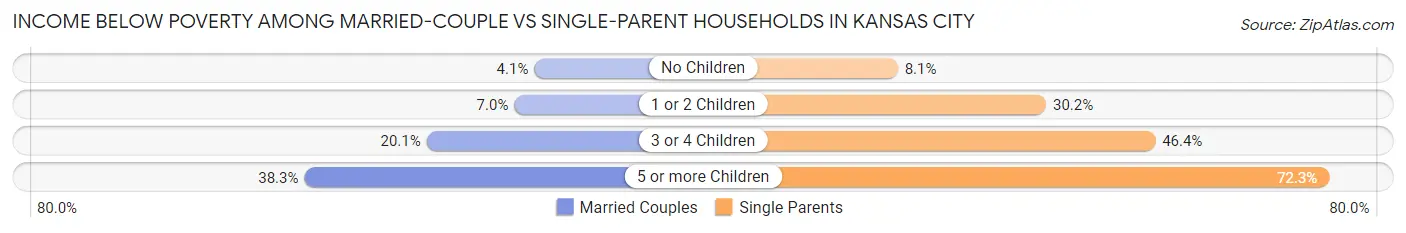
| Children | Married-Couple Families | Single-Parent Households |
| No Children | 493 (4.1%) | 382 (8.1%) |
| 1 or 2 Children | 558 (7.0%) | 1,742 (30.2%) |
| 3 or 4 Children | 550 (20.1%) | 823 (46.4%) |
| 5 or more Children | 105 (38.3%) | 136 (72.3%) |
| Total | 1,706 (7.4%) | 3,083 (24.7%) |
Race in Kansas City
The most populous races in Kansas City are White / Caucasian (74,501 | 47.9%), Hispanic or Latino (49,190 | 31.7%), and Black / African American (34,019 | 21.9%).
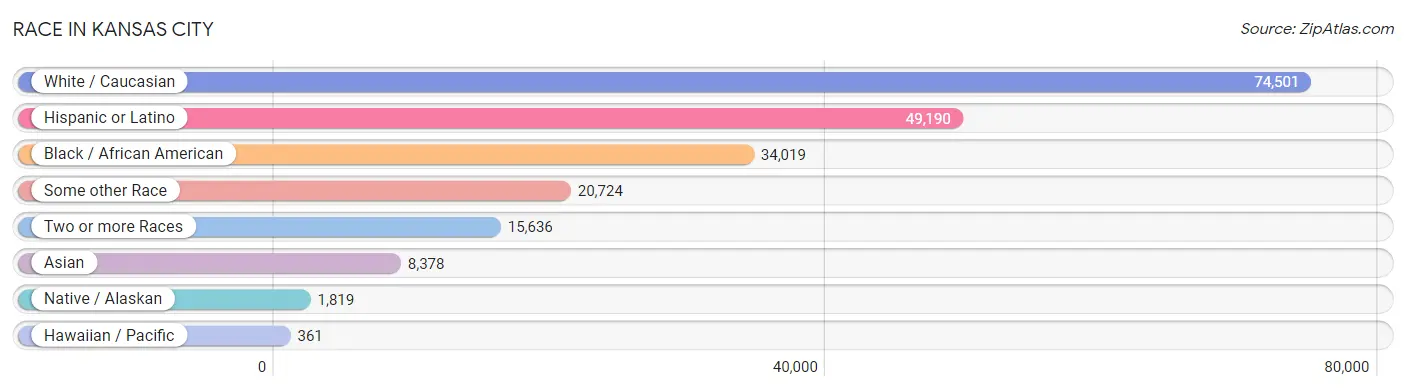
| Race | # Population | % Population |
| Asian | 8,378 | 5.4% |
| Black / African American | 34,019 | 21.9% |
| Hawaiian / Pacific | 361 | 0.2% |
| Hispanic or Latino | 49,190 | 31.7% |
| Native / Alaskan | 1,819 | 1.2% |
| White / Caucasian | 74,501 | 47.9% |
| Two or more Races | 15,636 | 10.1% |
| Some other Race | 20,724 | 13.3% |
| Total | 155,438 | 100.0% |
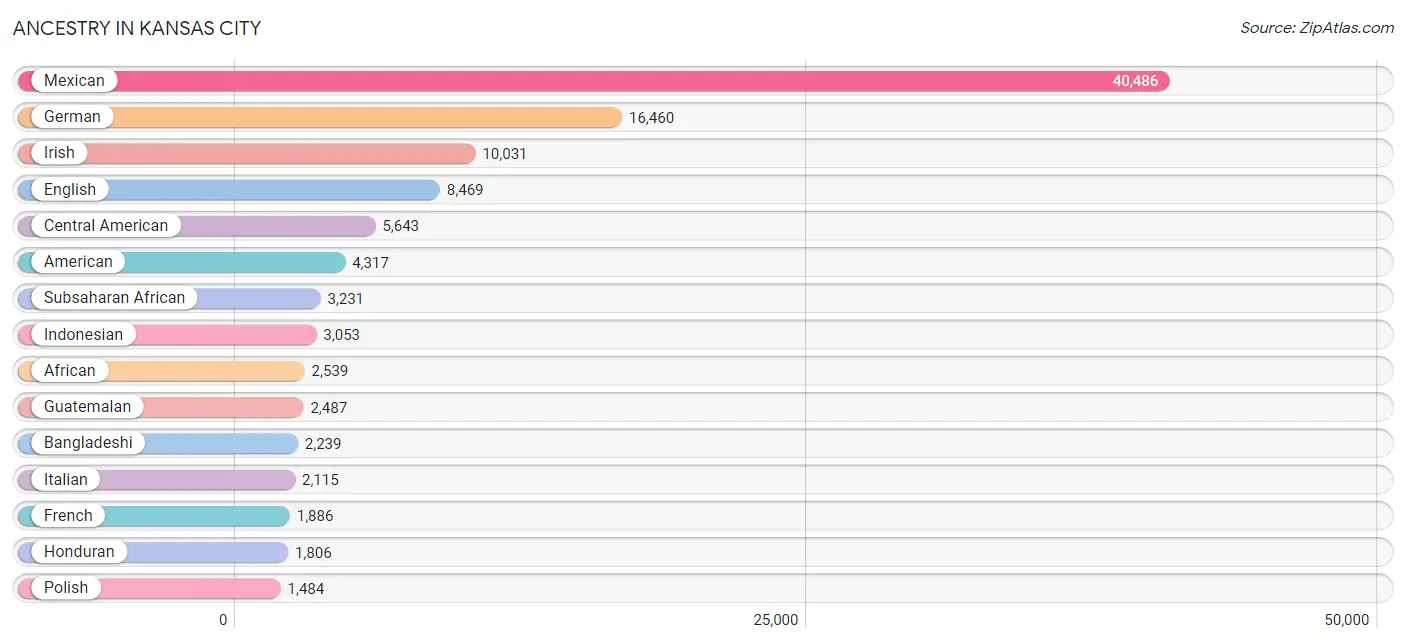
Ancestry in Kansas City
The most populous ancestries reported in Kansas City are Mexican (40,486 | 26.1%), German (16,460 | 10.6%), Irish (10,031 | 6.5%), English (8,469 | 5.4%), and Central American (5,643 | 3.6%), together accounting for 52.2% of all Kansas City residents.
| Ancestry | # Population | % Population |
| African | 2,539 | 1.6% |
| Alaskan Athabascan | 27 | 0.0% |
| American | 4,317 | 2.8% |
| Apache | 91 | 0.1% |
| Arab | 142 | 0.1% |
| Arapaho | 9 | 0.0% |
| Argentinean | 4 | 0.0% |
| Armenian | 46 | 0.0% |
| Australian | 58 | 0.0% |
| Austrian | 130 | 0.1% |
| Bangladeshi | 2,239 | 1.4% |
| Barbadian | 11 | 0.0% |
| Basque | 45 | 0.0% |
| Belgian | 118 | 0.1% |
| Bhutanese | 183 | 0.1% |
| Blackfeet | 303 | 0.2% |
| Bolivian | 48 | 0.0% |
| Brazilian | 36 | 0.0% |
| British | 406 | 0.3% |
| Burmese | 139 | 0.1% |
| Cajun | 28 | 0.0% |
| Canadian | 249 | 0.2% |
| Celtic | 27 | 0.0% |
| Central American | 5,643 | 3.6% |
| Central American Indian | 784 | 0.5% |
| Cherokee | 988 | 0.6% |
| Chickasaw | 20 | 0.0% |
| Chippewa | 6 | 0.0% |
| Choctaw | 236 | 0.2% |
| Colombian | 87 | 0.1% |
| Comanche | 4 | 0.0% |
| Costa Rican | 26 | 0.0% |
| Creek | 24 | 0.0% |
| Croatian | 698 | 0.4% |
| Crow | 55 | 0.0% |
| Cuban | 746 | 0.5% |
| Czech | 480 | 0.3% |
| Czechoslovakian | 191 | 0.1% |
| Danish | 390 | 0.3% |
| Delaware | 50 | 0.0% |
| Dominican | 177 | 0.1% |
| Dutch | 1,078 | 0.7% |
| Eastern European | 364 | 0.2% |
| Ecuadorian | 77 | 0.1% |
| Egyptian | 10 | 0.0% |
| English | 8,469 | 5.4% |
| Ethiopian | 53 | 0.0% |
| European | 1,175 | 0.8% |
| French | 1,886 | 1.2% |
| French Canadian | 257 | 0.2% |
| German | 16,460 | 10.6% |
| German Russian | 23 | 0.0% |
| Ghanaian | 73 | 0.1% |
| Greek | 243 | 0.2% |
| Guamanian / Chamorro | 19 | 0.0% |
| Guatemalan | 2,487 | 1.6% |
| Haitian | 42 | 0.0% |
| Honduran | 1,806 | 1.2% |
| Hopi | 7 | 0.0% |
| Hungarian | 23 | 0.0% |
| Indian (Asian) | 590 | 0.4% |
| Indonesian | 3,053 | 2.0% |
| Iranian | 23 | 0.0% |
| Iraqi | 13 | 0.0% |
| Irish | 10,031 | 6.5% |
| Iroquois | 37 | 0.0% |
| Israeli | 20 | 0.0% |
| Italian | 2,115 | 1.4% |
| Jamaican | 150 | 0.1% |
| Japanese | 6 | 0.0% |
| Kenyan | 32 | 0.0% |
| Kiowa | 1 | 0.0% |
| Korean | 470 | 0.3% |
| Lebanese | 4 | 0.0% |
| Liberian | 41 | 0.0% |
| Lithuanian | 79 | 0.1% |
| Malaysian | 467 | 0.3% |
| Mexican | 40,486 | 26.1% |
| Mexican American Indian | 602 | 0.4% |
| Mongolian | 16 | 0.0% |
| Moroccan | 38 | 0.0% |
| Native Hawaiian | 114 | 0.1% |
| Navajo | 10 | 0.0% |
| Nicaraguan | 30 | 0.0% |
| Nigerian | 108 | 0.1% |
| Northern European | 62 | 0.0% |
| Norwegian | 853 | 0.5% |
| Osage | 24 | 0.0% |
| Pakistani | 156 | 0.1% |
| Palestinian | 9 | 0.0% |
| Panamanian | 18 | 0.0% |
| Pennsylvania German | 6 | 0.0% |
| Peruvian | 20 | 0.0% |
| Polish | 1,484 | 0.9% |
| Portuguese | 126 | 0.1% |
| Potawatomi | 90 | 0.1% |
| Puerto Rican | 850 | 0.5% |
| Romanian | 29 | 0.0% |
| Russian | 317 | 0.2% |
| Salvadoran | 1,133 | 0.7% |
| Samoan | 26 | 0.0% |
| Scandinavian | 365 | 0.2% |
| Scotch-Irish | 785 | 0.5% |
| Scottish | 988 | 0.6% |
| Serbian | 121 | 0.1% |
| Sioux | 76 | 0.1% |
| Slavic | 25 | 0.0% |
| Slovak | 27 | 0.0% |
| Slovene | 98 | 0.1% |
| Somali | 95 | 0.1% |
| South American | 304 | 0.2% |
| Spaniard | 324 | 0.2% |
| Spanish | 123 | 0.1% |
| Sri Lankan | 397 | 0.3% |
| Subsaharan African | 3,231 | 2.1% |
| Sudanese | 26 | 0.0% |
| Swedish | 844 | 0.5% |
| Swiss | 107 | 0.1% |
| Thai | 500 | 0.3% |
| Tlingit-Haida | 25 | 0.0% |
| Turkish | 9 | 0.0% |
| Ugandan | 98 | 0.1% |
| Ukrainian | 48 | 0.0% |
| Uruguayan | 68 | 0.0% |
| Vietnamese | 34 | 0.0% |
| Welsh | 401 | 0.3% |
| West Indian | 115 | 0.1% |
| Yugoslavian | 106 | 0.1% | View All 128 Rows |
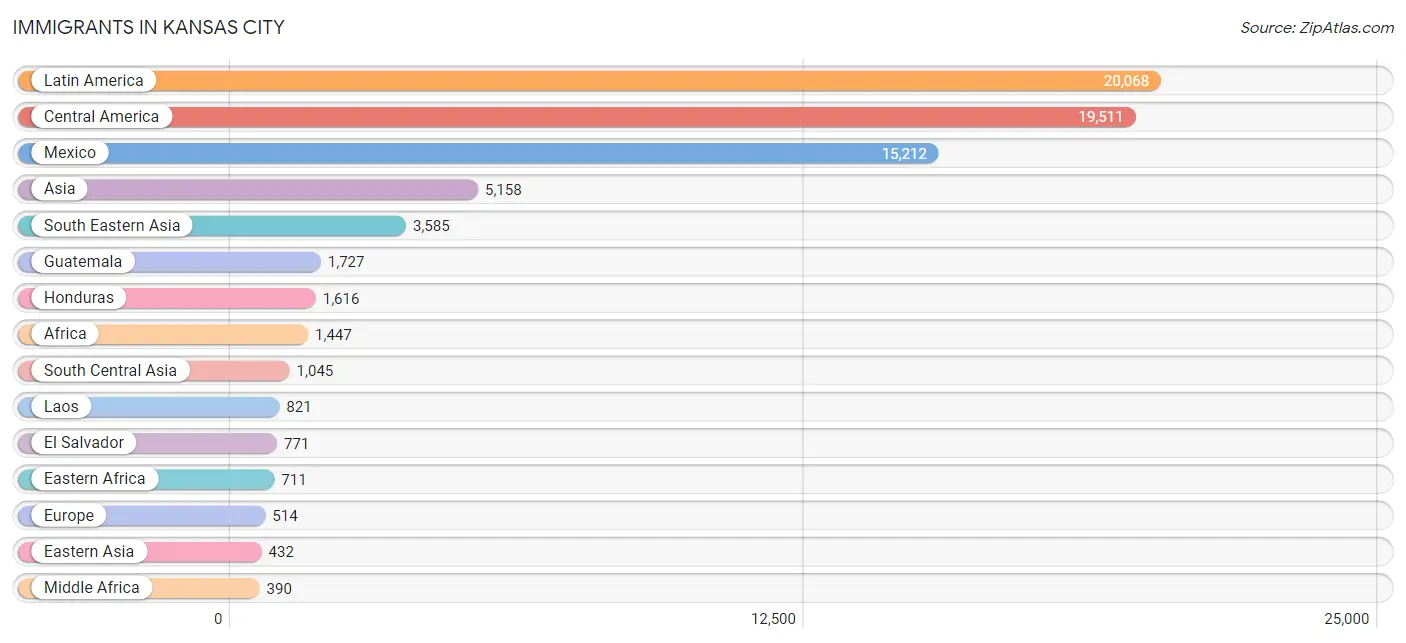
Immigrants in Kansas City
The most numerous immigrant groups reported in Kansas City came from Latin America (20,068 | 12.9%), Central America (19,511 | 12.6%), Mexico (15,212 | 9.8%), Asia (5,158 | 3.3%), and South Eastern Asia (3,585 | 2.3%), together accounting for 40.9% of all Kansas City residents.
| Immigration Origin | # Population | % Population |
| Africa | 1,447 | 0.9% |
| Argentina | 4 | 0.0% |
| Asia | 5,158 | 3.3% |
| Australia | 44 | 0.0% |
| Bangladesh | 34 | 0.0% |
| Barbados | 11 | 0.0% |
| Bolivia | 48 | 0.0% |
| Bosnia and Herzegovina | 57 | 0.0% |
| Brazil | 66 | 0.0% |
| Cambodia | 6 | 0.0% |
| Canada | 62 | 0.0% |
| Caribbean | 278 | 0.2% |
| Central America | 19,511 | 12.6% |
| China | 336 | 0.2% |
| Colombia | 46 | 0.0% |
| Congo | 315 | 0.2% |
| Costa Rica | 22 | 0.0% |
| Cuba | 102 | 0.1% |
| Dominican Republic | 13 | 0.0% |
| Eastern Africa | 711 | 0.5% |
| Eastern Asia | 432 | 0.3% |
| Eastern Europe | 158 | 0.1% |
| Ecuador | 77 | 0.1% |
| El Salvador | 771 | 0.5% |
| England | 28 | 0.0% |
| Eritrea | 44 | 0.0% |
| Ethiopia | 45 | 0.0% |
| Europe | 514 | 0.3% |
| France | 82 | 0.1% |
| Germany | 43 | 0.0% |
| Ghana | 20 | 0.0% |
| Guatemala | 1,727 | 1.1% |
| Haiti | 25 | 0.0% |
| Honduras | 1,616 | 1.0% |
| Hong Kong | 6 | 0.0% |
| India | 263 | 0.2% |
| Iran | 7 | 0.0% |
| Iraq | 81 | 0.1% |
| Jamaica | 101 | 0.1% |
| Japan | 30 | 0.0% |
| Jordan | 15 | 0.0% |
| Kenya | 102 | 0.1% |
| Korea | 66 | 0.0% |
| Laos | 821 | 0.5% |
| Latin America | 20,068 | 12.9% |
| Liberia | 41 | 0.0% |
| Malaysia | 145 | 0.1% |
| Mexico | 15,212 | 9.8% |
| Micronesia | 223 | 0.1% |
| Middle Africa | 390 | 0.3% |
| Nepal | 319 | 0.2% |
| Nigeria | 51 | 0.0% |
| Northern Africa | 136 | 0.1% |
| Northern Europe | 104 | 0.1% |
| Oceania | 269 | 0.2% |
| Pakistan | 43 | 0.0% |
| Panama | 25 | 0.0% |
| Peru | 14 | 0.0% |
| Philippines | 120 | 0.1% |
| Poland | 10 | 0.0% |
| Romania | 21 | 0.0% |
| Russia | 45 | 0.0% |
| Serbia | 25 | 0.0% |
| Somalia | 62 | 0.0% |
| South Africa | 9 | 0.0% |
| South America | 279 | 0.2% |
| South Central Asia | 1,045 | 0.7% |
| South Eastern Asia | 3,585 | 2.3% |
| Southern Europe | 127 | 0.1% |
| Spain | 127 | 0.1% |
| Sri Lanka | 48 | 0.0% |
| Sudan | 136 | 0.1% |
| Sweden | 5 | 0.0% |
| Thailand | 358 | 0.2% |
| Uganda | 183 | 0.1% |
| Uruguay | 24 | 0.0% |
| Vietnam | 180 | 0.1% |
| Western Africa | 127 | 0.1% |
| Western Asia | 96 | 0.1% |
| Western Europe | 125 | 0.1% |
| Zaire | 75 | 0.1% | View All 81 Rows |
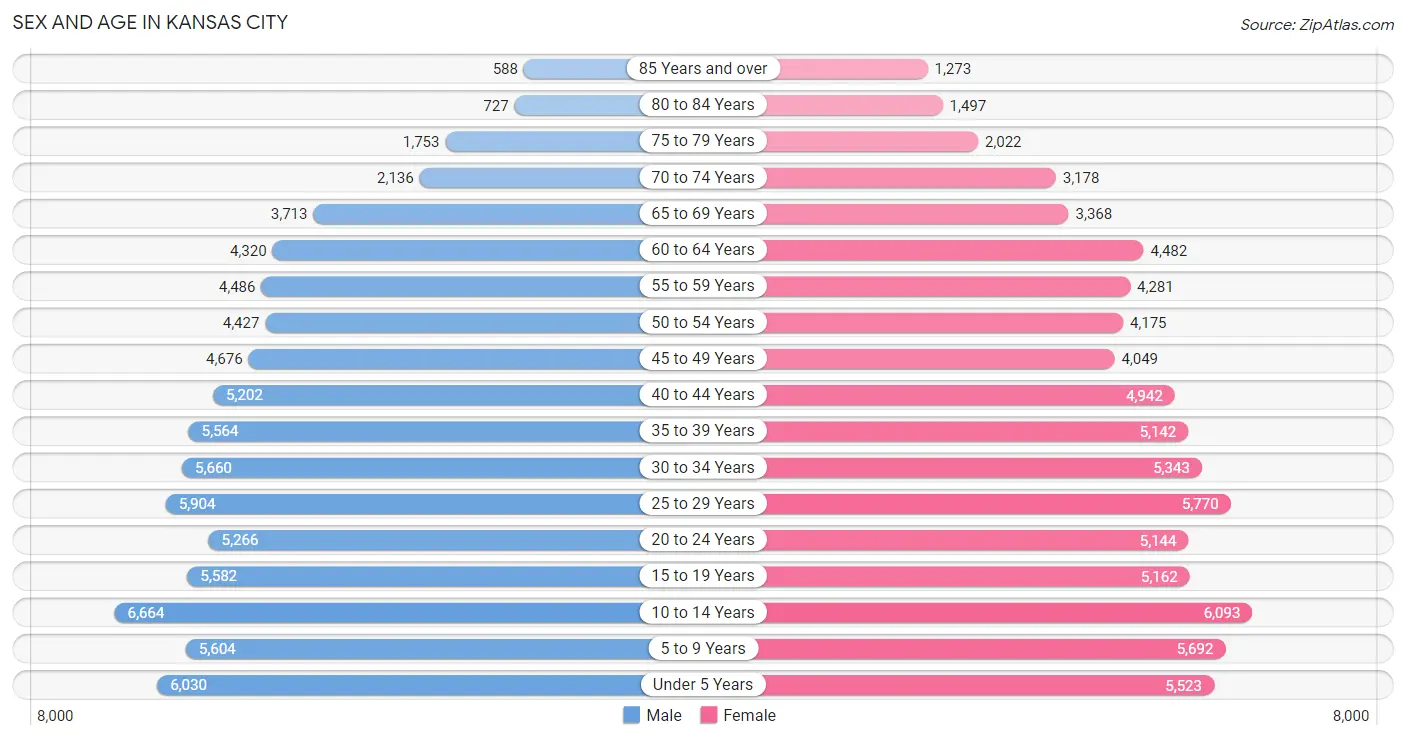
Sex and Age in Kansas City
Sex and Age in Kansas City
The most populous age groups in Kansas City are 10 to 14 Years (6,664 | 8.5%) for men and 10 to 14 Years (6,093 | 7.9%) for women.
| Age Bracket | Male | Female |
| Under 5 Years | 6,030 (7.7%) | 5,523 (7.2%) |
| 5 to 9 Years | 5,604 (7.2%) | 5,692 (7.4%) |
| 10 to 14 Years | 6,664 (8.5%) | 6,093 (7.9%) |
| 15 to 19 Years | 5,582 (7.1%) | 5,162 (6.7%) |
| 20 to 24 Years | 5,266 (6.7%) | 5,144 (6.7%) |
| 25 to 29 Years | 5,904 (7.5%) | 5,770 (7.5%) |
| 30 to 34 Years | 5,660 (7.2%) | 5,343 (6.9%) |
| 35 to 39 Years | 5,564 (7.1%) | 5,142 (6.7%) |
| 40 to 44 Years | 5,202 (6.6%) | 4,942 (6.4%) |
| 45 to 49 Years | 4,676 (6.0%) | 4,049 (5.2%) |
| 50 to 54 Years | 4,427 (5.7%) | 4,175 (5.4%) |
| 55 to 59 Years | 4,486 (5.7%) | 4,281 (5.6%) |
| 60 to 64 Years | 4,320 (5.5%) | 4,482 (5.8%) |
| 65 to 69 Years | 3,713 (4.7%) | 3,368 (4.4%) |
| 70 to 74 Years | 2,136 (2.7%) | 3,178 (4.1%) |
| 75 to 79 Years | 1,753 (2.2%) | 2,022 (2.6%) |
| 80 to 84 Years | 727 (0.9%) | 1,497 (1.9%) |
| 85 Years and over | 588 (0.7%) | 1,273 (1.7%) |
| Total | 78,302 (100.0%) | 77,136 (100.0%) |
Families and Households in Kansas City
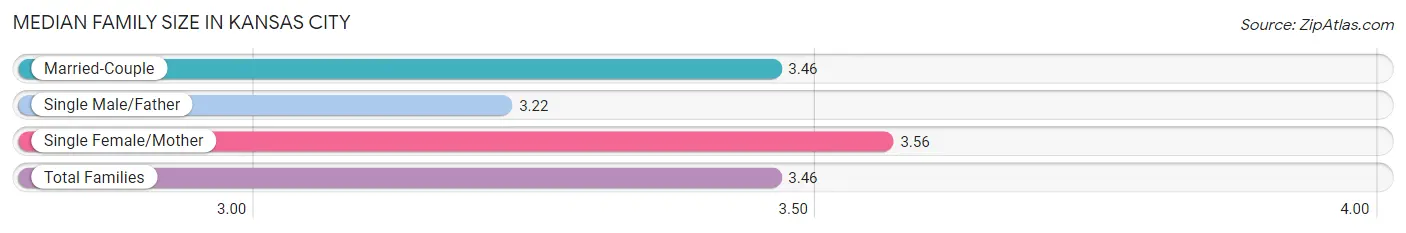
Median Family Size in Kansas City
The median family size in Kansas City is 3.46 persons per family, with single female/mother families (8,969 | 25.2%) accounting for the largest median family size of 3.56 persons per family. On the other hand, single male/father families (3,510 | 9.9%) represent the smallest median family size with 3.22 persons per family.
| Family Type | # Families | Family Size |
| Married-Couple | 23,071 (64.9%) | 3.46 |
| Single Male/Father | 3,510 (9.9%) | 3.22 |
| Single Female/Mother | 8,969 (25.2%) | 3.56 |
| Total Families | 35,550 (100.0%) | 3.46 |
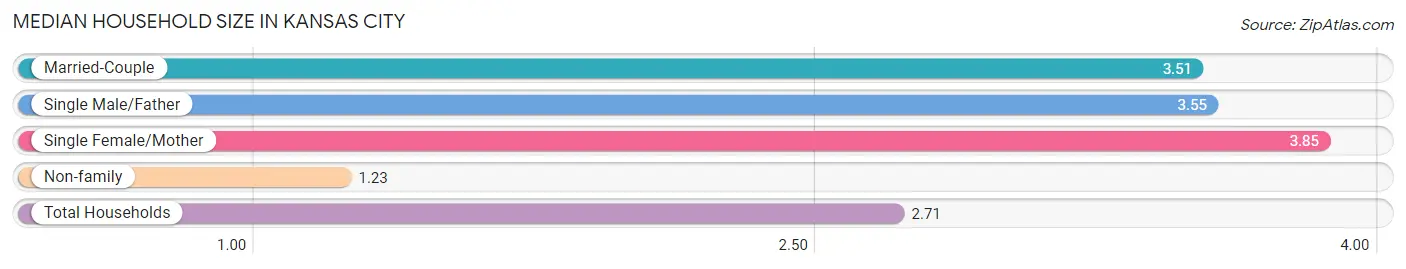
Median Household Size in Kansas City
The median household size in Kansas City is 2.71 persons per household, with single female/mother households (8,969 | 15.8%) accounting for the largest median household size of 3.85 persons per household. non-family households (21,292 | 37.5%) represent the smallest median household size with 1.23 persons per household.
| Household Type | # Households | Household Size |
| Married-Couple | 23,071 (40.6%) | 3.51 |
| Single Male/Father | 3,510 (6.2%) | 3.55 |
| Single Female/Mother | 8,969 (15.8%) | 3.85 |
| Non-family | 21,292 (37.5%) | 1.23 |
| Total Households | 56,842 (100.0%) | 2.71 |
Household Size by Marriage Status in Kansas City
Out of a total of 56,842 households in Kansas City, 35,550 (62.5%) are family households, while 21,292 (37.5%) are nonfamily households. The most numerous type of family households are 2-person households, comprising 13,881, and the most common type of nonfamily households are 1-person households, comprising 17,704.
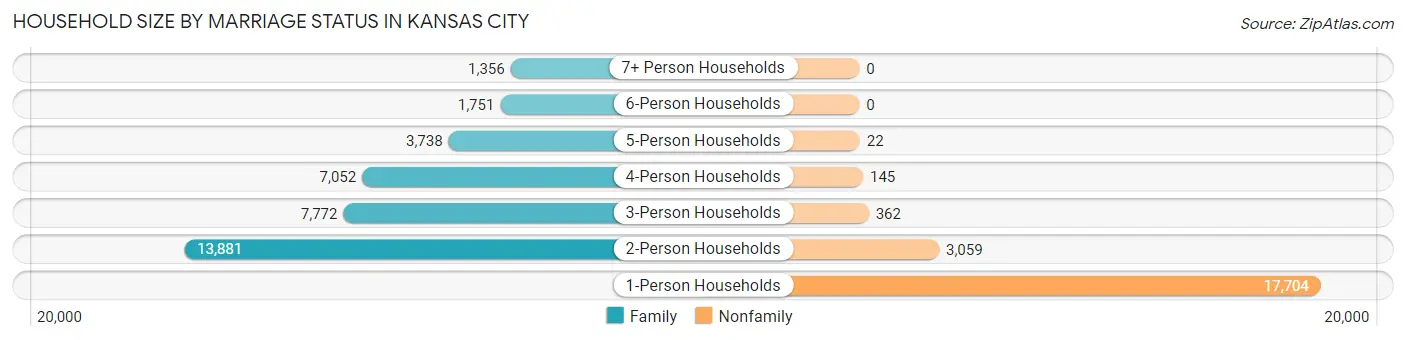
| Household Size | Family Households | Nonfamily Households |
| 1-Person Households | - | 17,704 (31.1%) |
| 2-Person Households | 13,881 (24.4%) | 3,059 (5.4%) |
| 3-Person Households | 7,772 (13.7%) | 362 (0.6%) |
| 4-Person Households | 7,052 (12.4%) | 145 (0.3%) |
| 5-Person Households | 3,738 (6.6%) | 22 (0.0%) |
| 6-Person Households | 1,751 (3.1%) | 0 (0.0%) |
| 7+ Person Households | 1,356 (2.4%) | 0 (0.0%) |
| Total | 35,550 (62.5%) | 21,292 (37.5%) |
Female Fertility in Kansas City
Fertility by Age in Kansas City
Average fertility rate in Kansas City is 74.0 births per 1,000 women. Women in the age bracket of 20 to 34 years have the highest fertility rate with 113.0 births per 1,000 women. Women in the age bracket of 20 to 34 years acount for 68.8% of all women with births.
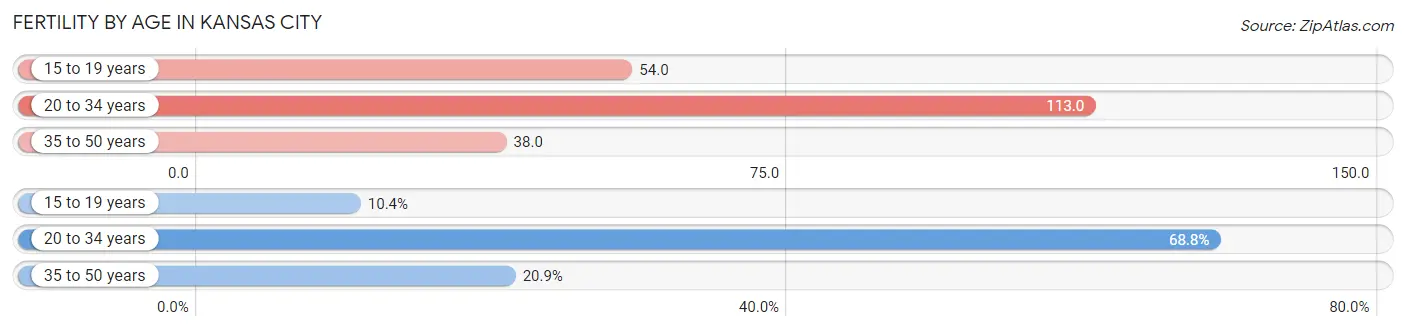
| Age Bracket | Women with Births | Births / 1,000 Women |
| 15 to 19 years | 278 (10.4%) | 54.0 |
| 20 to 34 years | 1,844 (68.8%) | 113.0 |
| 35 to 50 years | 560 (20.9%) | 38.0 |
| Total | 2,682 (100.0%) | 74.0 |
Fertility by Age by Marriage Status in Kansas City
58.4% of women with births (2,682) in Kansas City are married. The highest percentage of unmarried women with births falls into 15 to 19 years age bracket with 89.2% of them unmarried at the time of birth, while the lowest percentage of unmarried women with births belong to 35 to 50 years age bracket with 17.0% of them unmarried.
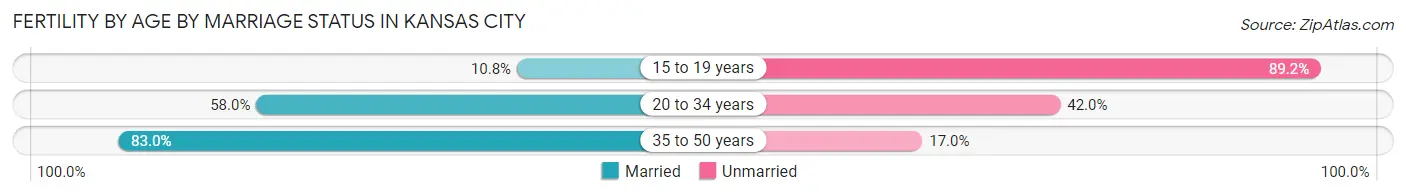
| Age Bracket | Married | Unmarried |
| 15 to 19 years | 30 (10.8%) | 248 (89.2%) |
| 20 to 34 years | 1,070 (58.0%) | 774 (42.0%) |
| 35 to 50 years | 465 (83.0%) | 95 (17.0%) |
| Total | 1,566 (58.4%) | 1,116 (41.6%) |
Fertility by Education in Kansas City
Average fertility rate in Kansas City is 74.0 births per 1,000 women. Women with the education attainment of less than high school have the highest fertility rate of 95.0 births per 1,000 women, while women with the education attainment of graduate degree have the lowest fertility at 47.0 births per 1,000 women. Women with the education attainment of less than high school represent 33.0% of all women with births.
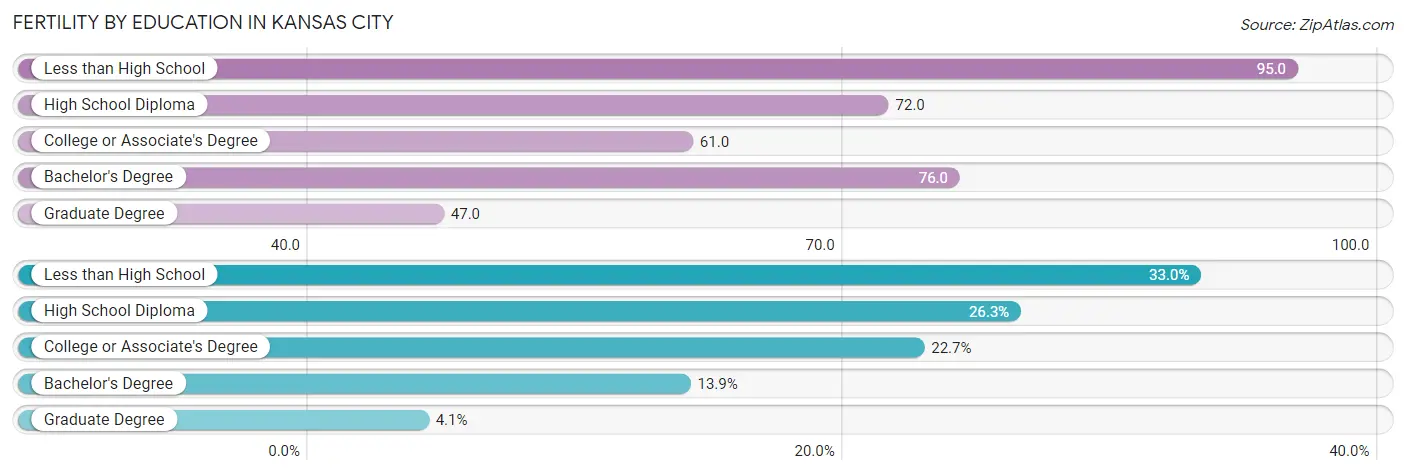
| Educational Attainment | Women with Births | Births / 1,000 Women |
| Less than High School | 886 (33.0%) | 95.0 |
| High School Diploma | 705 (26.3%) | 72.0 |
| College or Associate's Degree | 608 (22.7%) | 61.0 |
| Bachelor's Degree | 373 (13.9%) | 76.0 |
| Graduate Degree | 110 (4.1%) | 47.0 |
| Total | 2,682 (100.0%) | 74.0 |
Fertility by Education by Marriage Status in Kansas City
41.6% of women with births in Kansas City are unmarried. Women with the educational attainment of graduate degree are most likely to be married with 100.0% of them married at childbirth, while women with the educational attainment of college or associate's degree are least likely to be married with 63.6% of them unmarried at childbirth.
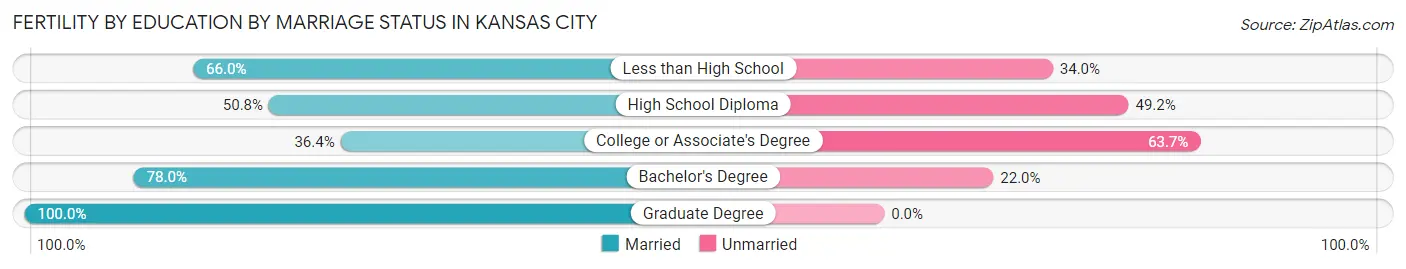
| Educational Attainment | Married | Unmarried |
| Less than High School | 585 (66.0%) | 301 (34.0%) |
| High School Diploma | 358 (50.8%) | 347 (49.2%) |
| College or Associate's Degree | 221 (36.3%) | 387 (63.6%) |
| Bachelor's Degree | 291 (78.0%) | 82 (22.0%) |
| Graduate Degree | 110 (100.0%) | 0 (0.0%) |
| Total | 1,566 (58.4%) | 1,116 (41.6%) |
Employment Characteristics in Kansas City
Employment by Class of Employer in Kansas City
Among the 70,714 employed individuals in Kansas City, private company employees (52,219 | 73.9%), local government employees (5,233 | 7.4%), and not-for-profit organizations (4,671 | 6.6%) make up the most common classes of employment.
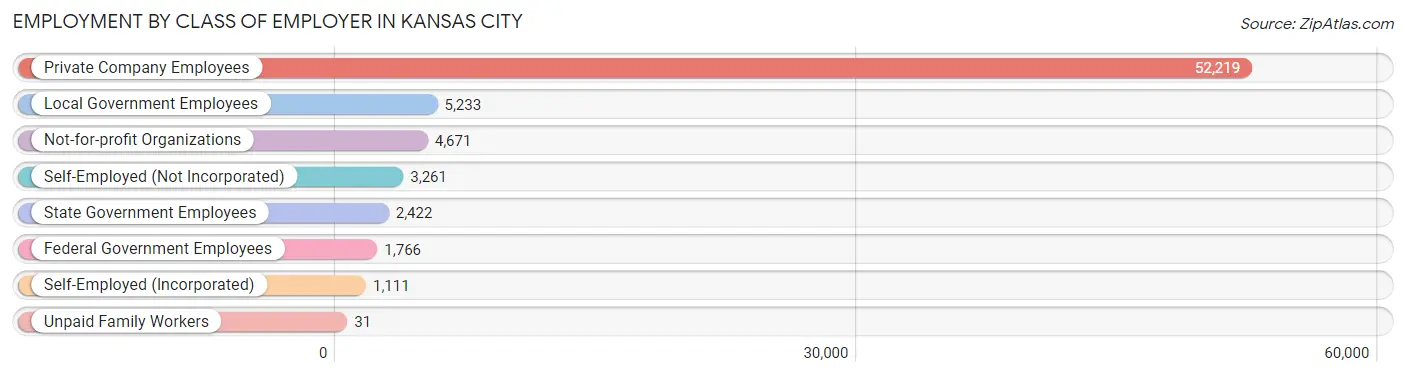
| Employer Class | # Employees | % Employees |
| Private Company Employees | 52,219 | 73.9% |
| Self-Employed (Incorporated) | 1,111 | 1.6% |
| Self-Employed (Not Incorporated) | 3,261 | 4.6% |
| Not-for-profit Organizations | 4,671 | 6.6% |
| Local Government Employees | 5,233 | 7.4% |
| State Government Employees | 2,422 | 3.4% |
| Federal Government Employees | 1,766 | 2.5% |
| Unpaid Family Workers | 31 | 0.0% |
| Total | 70,714 | 100.0% |
Employment Status by Age in Kansas City
According to the labor force statistics for Kansas City, out of the total population over 16 years of age (117,566), 65.7% or 77,241 individuals are in the labor force, with 6.0% or 4,634 of them unemployed. The age group with the highest labor force participation rate is 35 to 44 years, with 83.4% or 17,389 individuals in the labor force. Within the labor force, the 16 to 19 years age range has the highest percentage of unemployed individuals, with 15.2% or 638 of them being unemployed.
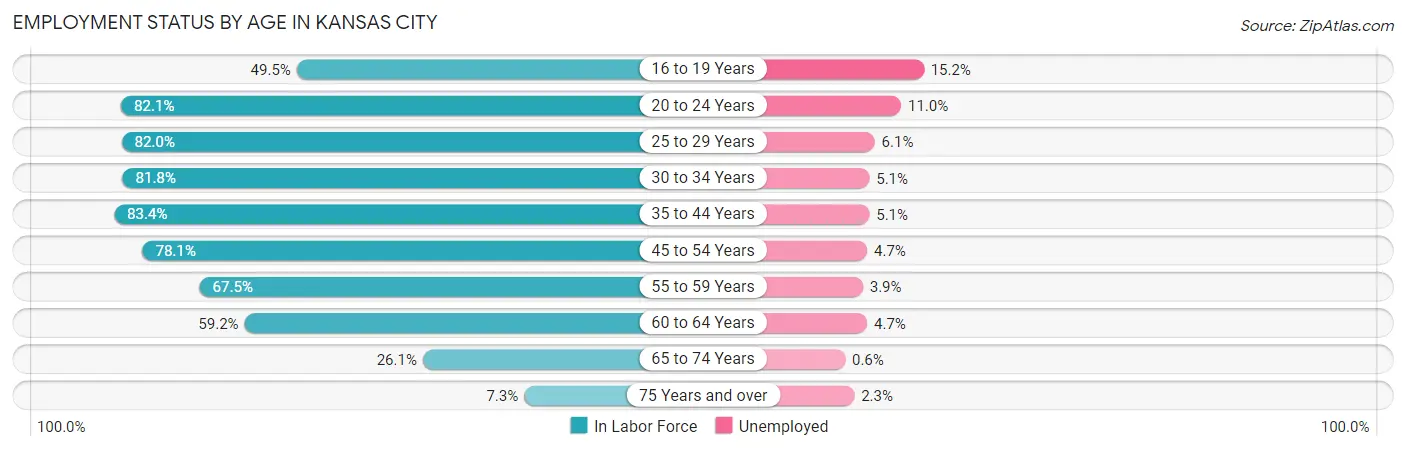
| Age Bracket | In Labor Force | Unemployed |
| 16 to 19 Years | 4,197 (49.5%) | 638 (15.2%) |
| 20 to 24 Years | 8,547 (82.1%) | 940 (11.0%) |
| 25 to 29 Years | 9,573 (82.0%) | 584 (6.1%) |
| 30 to 34 Years | 9,000 (81.8%) | 459 (5.1%) |
| 35 to 44 Years | 17,389 (83.4%) | 887 (5.1%) |
| 45 to 54 Years | 13,532 (78.1%) | 636 (4.7%) |
| 55 to 59 Years | 5,918 (67.5%) | 231 (3.9%) |
| 60 to 64 Years | 5,211 (59.2%) | 245 (4.7%) |
| 65 to 74 Years | 3,235 (26.1%) | 19 (0.6%) |
| 75 Years and over | 574 (7.3%) | 13 (2.3%) |
| Total | 77,241 (65.7%) | 4,634 (6.0%) |
Employment Status by Educational Attainment in Kansas City
According to labor force statistics for Kansas City, 77.3% of individuals (60,621) out of the total population between 25 and 64 years of age (78,423) are in the labor force, with 5.0% or 3,031 of them being unemployed. The group with the highest labor force participation rate are those with the educational attainment of bachelor's degree or higher, with 88.1% or 13,493 individuals in the labor force. Within the labor force, individuals with high school diploma education have the highest percentage of unemployment, with 7.0% or 1,260 of them being unemployed.
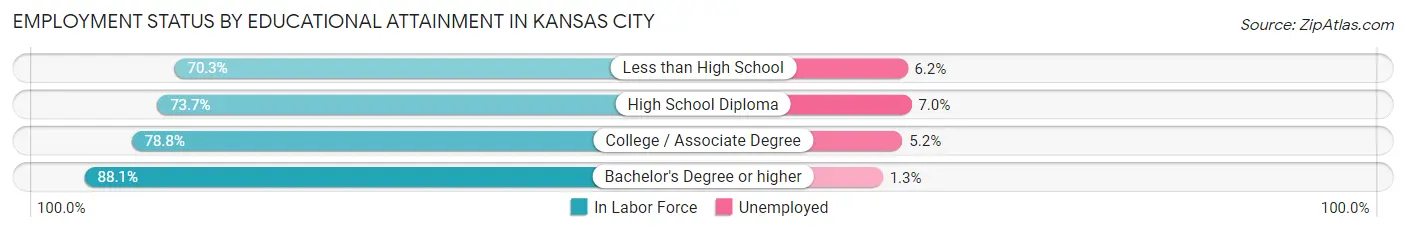
| Educational Attainment | In Labor Force | Unemployed |
| Less than High School | 10,896 (70.3%) | 961 (6.2%) |
| High School Diploma | 17,995 (73.7%) | 1,709 (7.0%) |
| College / Associate Degree | 18,274 (78.8%) | 1,206 (5.2%) |
| Bachelor's Degree or higher | 13,493 (88.1%) | 199 (1.3%) |
| Total | 60,621 (77.3%) | 3,921 (5.0%) |
Employment Occupations by Sex in Kansas City
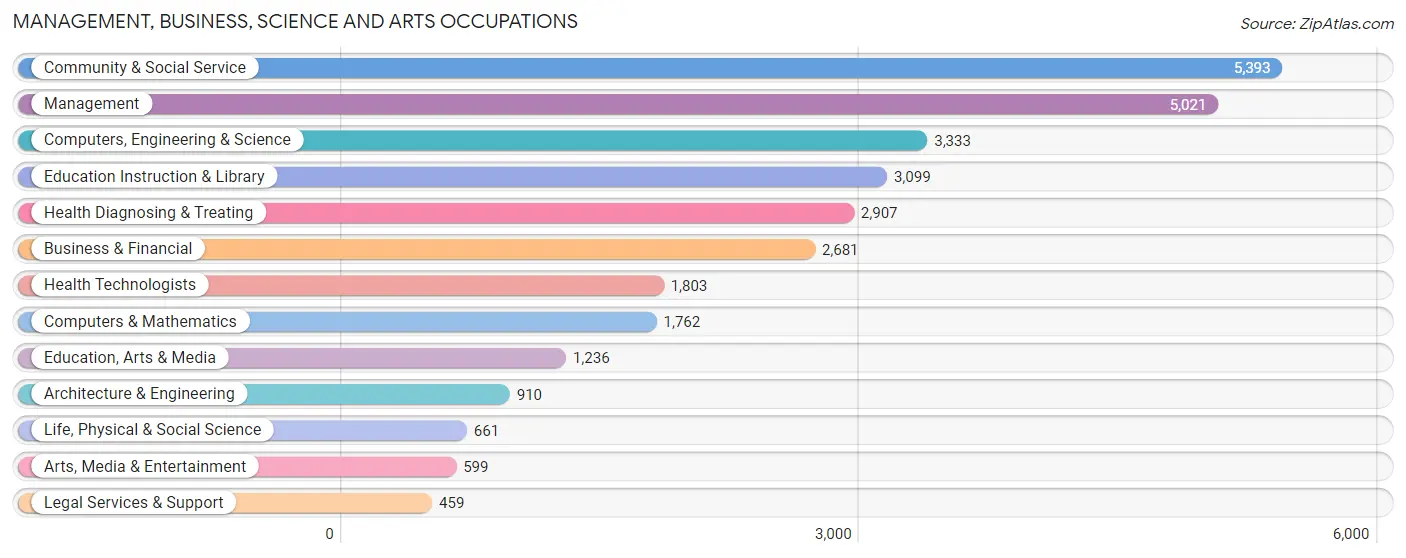
Management, Business, Science and Arts Occupations
The most common Management, Business, Science and Arts occupations in Kansas City are Community & Social Service (5,393 | 7.5%), Management (5,021 | 6.9%), Computers, Engineering & Science (3,333 | 4.6%), Education Instruction & Library (3,099 | 4.3%), and Health Diagnosing & Treating (2,907 | 4.0%).
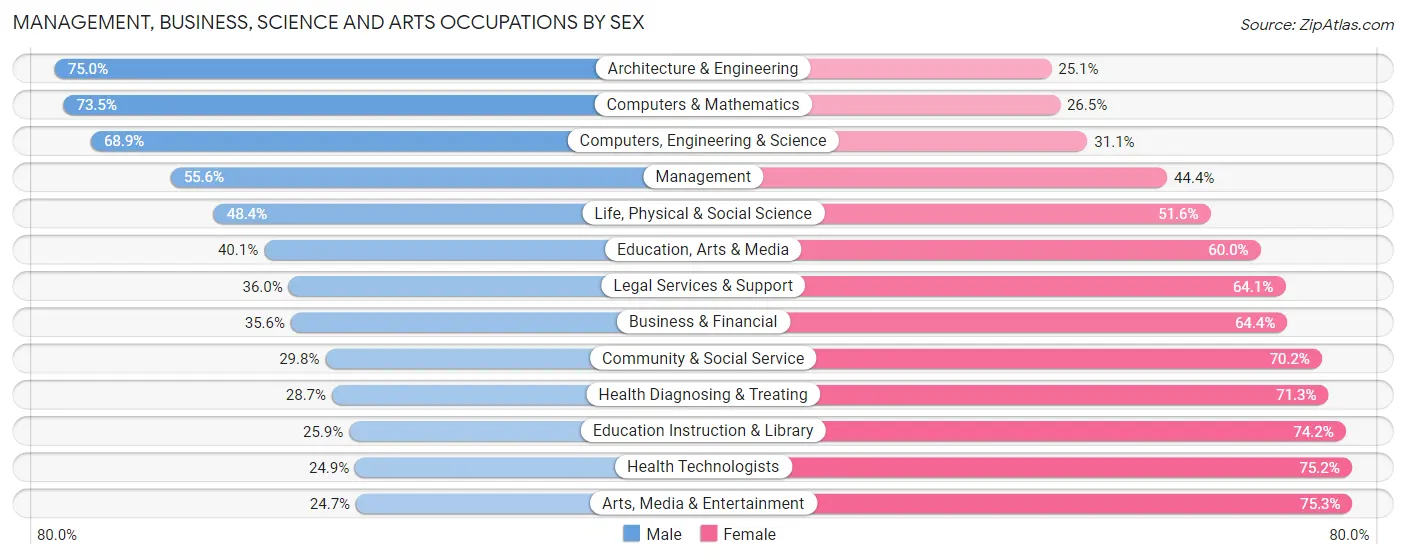
Management, Business, Science and Arts Occupations by Sex
Within the Management, Business, Science and Arts occupations in Kansas City, the most male-oriented occupations are Architecture & Engineering (75.0%), Computers & Mathematics (73.5%), and Computers, Engineering & Science (68.9%), while the most female-oriented occupations are Arts, Media & Entertainment (75.3%), Health Technologists (75.1%), and Education Instruction & Library (74.2%).
| Occupation | Male | Female |
| Management | 2,792 (55.6%) | 2,229 (44.4%) |
| Business & Financial | 954 (35.6%) | 1,727 (64.4%) |
| Computers, Engineering & Science | 2,297 (68.9%) | 1,036 (31.1%) |
| Computers & Mathematics | 1,295 (73.5%) | 467 (26.5%) |
| Architecture & Engineering | 682 (75.0%) | 228 (25.1%) |
| Life, Physical & Social Science | 320 (48.4%) | 341 (51.6%) |
| Community & Social Service | 1,609 (29.8%) | 3,784 (70.2%) |
| Education, Arts & Media | 495 (40.1%) | 741 (60.0%) |
| Legal Services & Support | 165 (35.9%) | 294 (64.0%) |
| Education Instruction & Library | 801 (25.9%) | 2,298 (74.2%) |
| Arts, Media & Entertainment | 148 (24.7%) | 451 (75.3%) |
| Health Diagnosing & Treating | 835 (28.7%) | 2,072 (71.3%) |
| Health Technologists | 448 (24.8%) | 1,355 (75.1%) |
| Total (Category) | 8,487 (43.9%) | 10,848 (56.1%) |
| Total (Overall) | 39,497 (54.6%) | 32,814 (45.4%) |
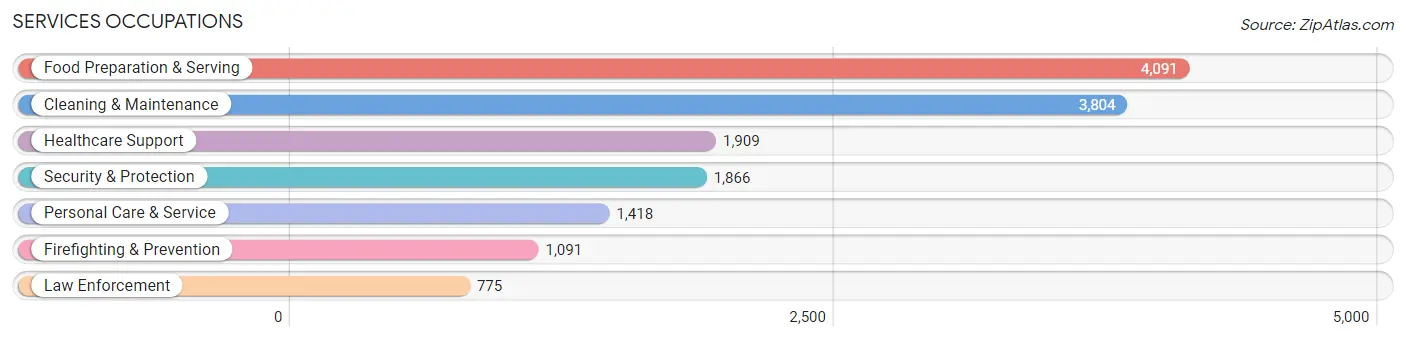
Services Occupations
The most common Services occupations in Kansas City are Food Preparation & Serving (4,091 | 5.7%), Cleaning & Maintenance (3,804 | 5.3%), Healthcare Support (1,909 | 2.6%), Security & Protection (1,866 | 2.6%), and Personal Care & Service (1,418 | 2.0%).
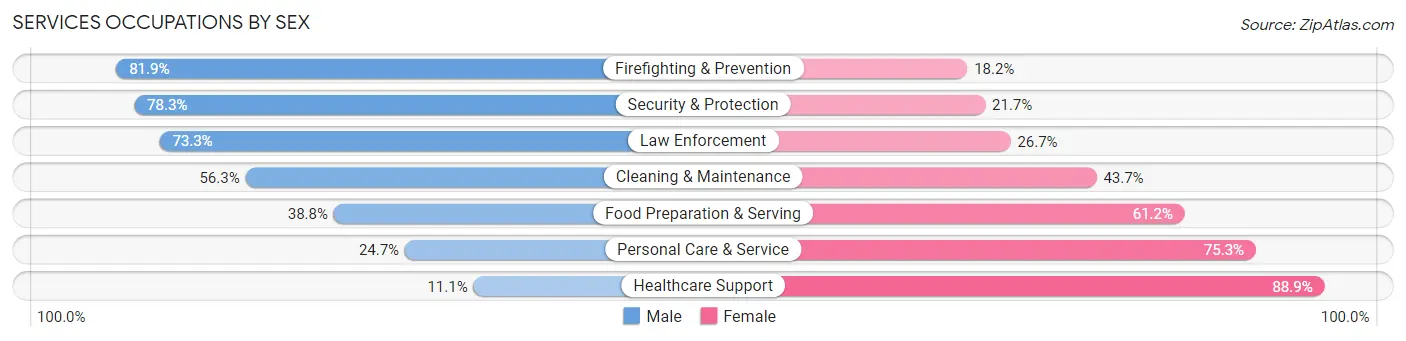
Services Occupations by Sex
Within the Services occupations in Kansas City, the most male-oriented occupations are Firefighting & Prevention (81.9%), Security & Protection (78.3%), and Law Enforcement (73.3%), while the most female-oriented occupations are Healthcare Support (88.9%), Personal Care & Service (75.3%), and Food Preparation & Serving (61.2%).
| Occupation | Male | Female |
| Healthcare Support | 212 (11.1%) | 1,697 (88.9%) |
| Security & Protection | 1,461 (78.3%) | 405 (21.7%) |
| Firefighting & Prevention | 893 (81.9%) | 198 (18.1%) |
| Law Enforcement | 568 (73.3%) | 207 (26.7%) |
| Food Preparation & Serving | 1,586 (38.8%) | 2,505 (61.2%) |
| Cleaning & Maintenance | 2,140 (56.3%) | 1,664 (43.7%) |
| Personal Care & Service | 350 (24.7%) | 1,068 (75.3%) |
| Total (Category) | 5,749 (43.9%) | 7,339 (56.1%) |
| Total (Overall) | 39,497 (54.6%) | 32,814 (45.4%) |
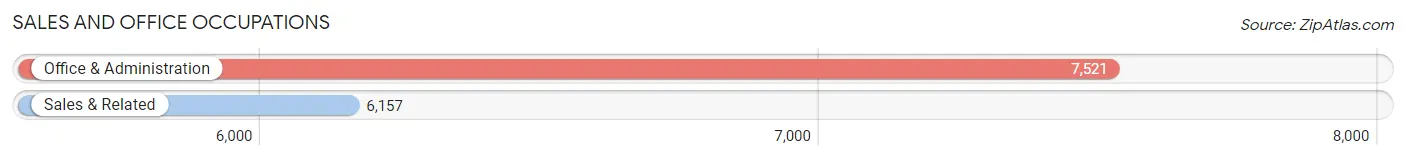
Sales and Office Occupations
The most common Sales and Office occupations in Kansas City are Office & Administration (7,521 | 10.4%), and Sales & Related (6,157 | 8.5%).
Sales and Office Occupations by Sex
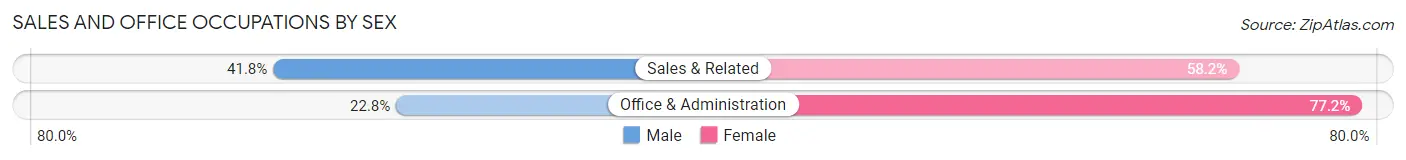
| Occupation | Male | Female |
| Sales & Related | 2,572 (41.8%) | 3,585 (58.2%) |
| Office & Administration | 1,718 (22.8%) | 5,803 (77.2%) |
| Total (Category) | 4,290 (31.4%) | 9,388 (68.6%) |
| Total (Overall) | 39,497 (54.6%) | 32,814 (45.4%) |
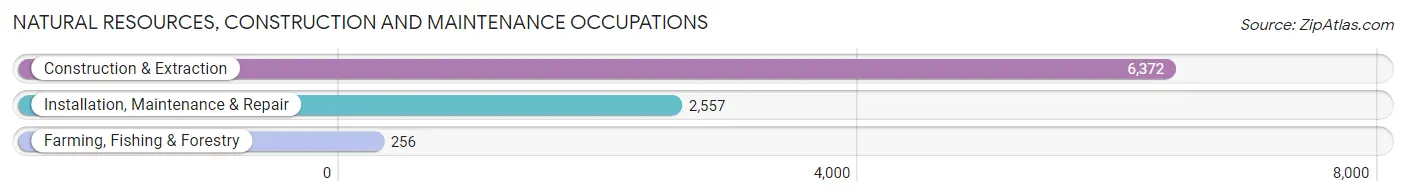
Natural Resources, Construction and Maintenance Occupations
The most common Natural Resources, Construction and Maintenance occupations in Kansas City are Construction & Extraction (6,372 | 8.8%), Installation, Maintenance & Repair (2,557 | 3.5%), and Farming, Fishing & Forestry (256 | 0.4%).
Natural Resources, Construction and Maintenance Occupations by Sex
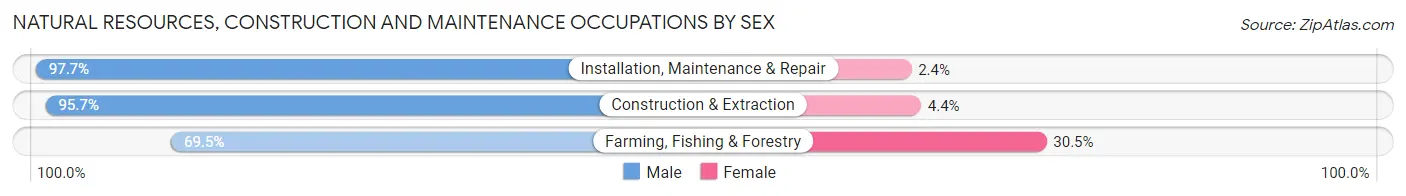
| Occupation | Male | Female |
| Farming, Fishing & Forestry | 178 (69.5%) | 78 (30.5%) |
| Construction & Extraction | 6,095 (95.7%) | 277 (4.3%) |
| Installation, Maintenance & Repair | 2,497 (97.7%) | 60 (2.4%) |
| Total (Category) | 8,770 (95.5%) | 415 (4.5%) |
| Total (Overall) | 39,497 (54.6%) | 32,814 (45.4%) |
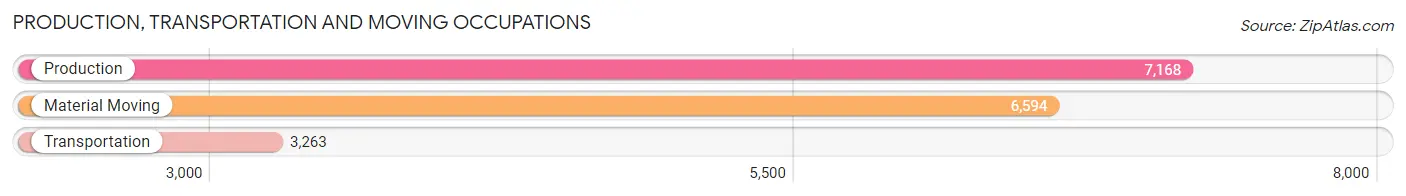
Production, Transportation and Moving Occupations
The most common Production, Transportation and Moving occupations in Kansas City are Production (7,168 | 9.9%), Material Moving (6,594 | 9.1%), and Transportation (3,263 | 4.5%).
Production, Transportation and Moving Occupations by Sex
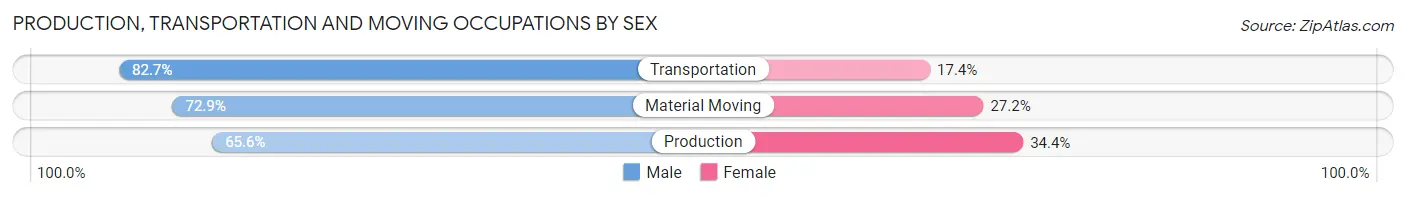
| Occupation | Male | Female |
| Production | 4,700 (65.6%) | 2,468 (34.4%) |
| Transportation | 2,697 (82.7%) | 566 (17.3%) |
| Material Moving | 4,804 (72.9%) | 1,790 (27.2%) |
| Total (Category) | 12,201 (71.7%) | 4,824 (28.3%) |
| Total (Overall) | 39,497 (54.6%) | 32,814 (45.4%) |
Employment Industries by Sex in Kansas City
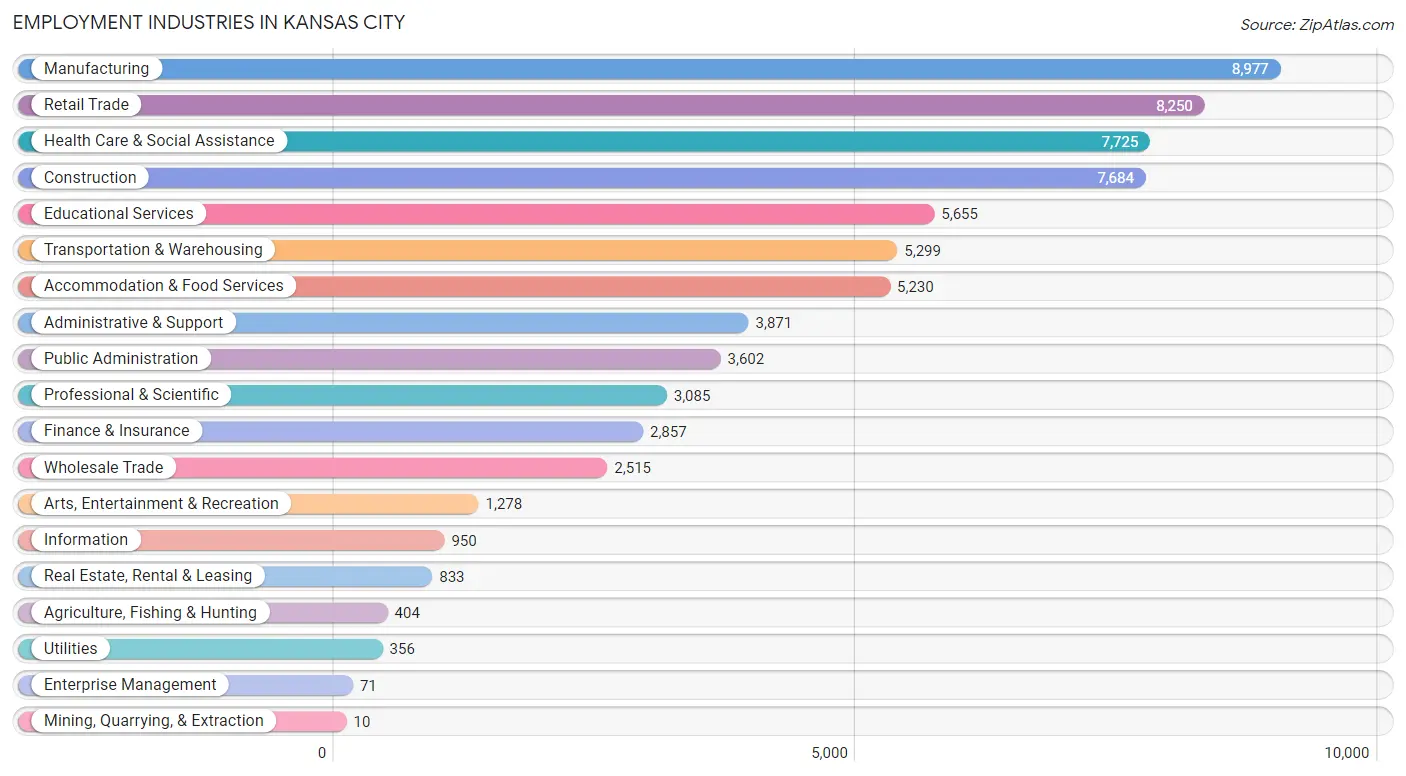
Employment Industries in Kansas City
The major employment industries in Kansas City include Manufacturing (8,977 | 12.4%), Retail Trade (8,250 | 11.4%), Health Care & Social Assistance (7,725 | 10.7%), Construction (7,684 | 10.6%), and Educational Services (5,655 | 7.8%).
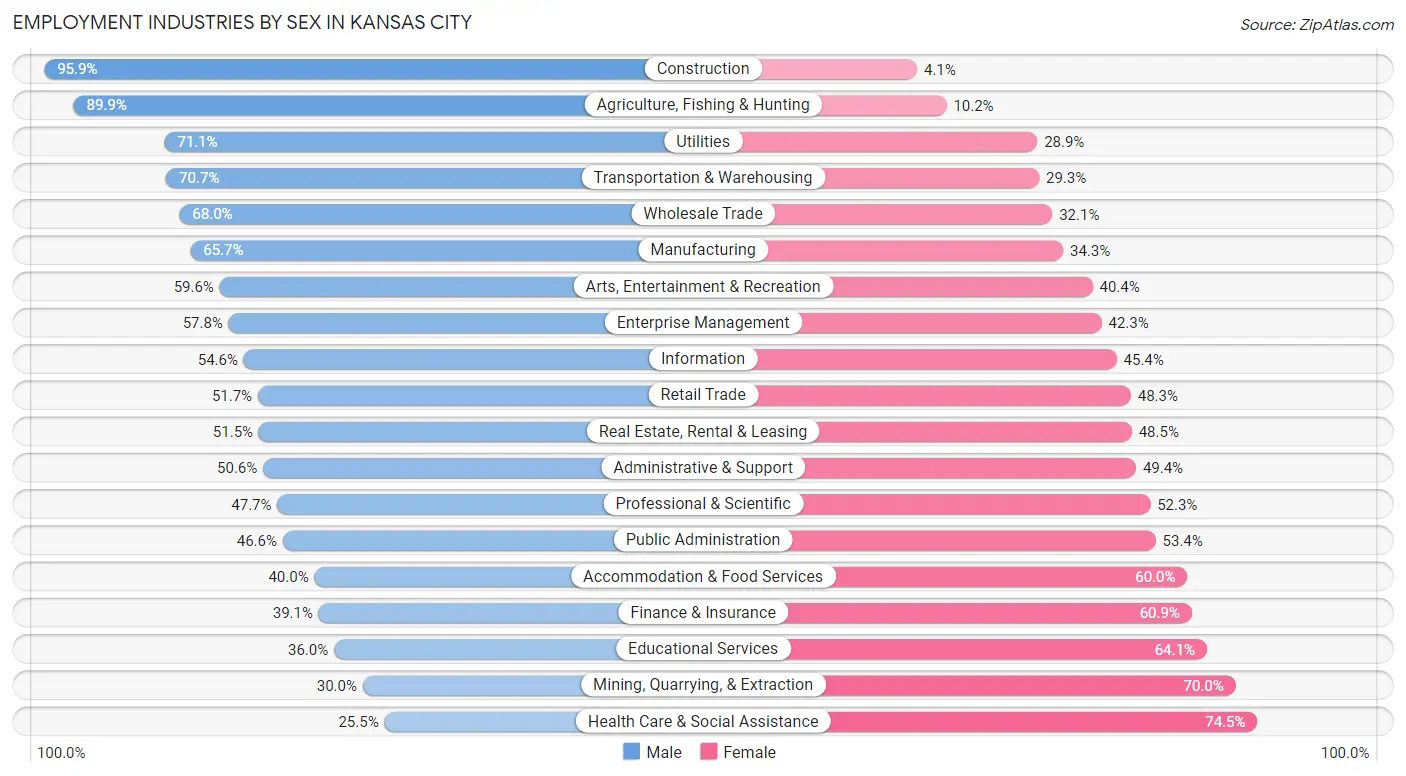
Employment Industries by Sex in Kansas City
The Kansas City industries that see more men than women are Construction (95.9%), Agriculture, Fishing & Hunting (89.8%), and Utilities (71.1%), whereas the industries that tend to have a higher number of women are Health Care & Social Assistance (74.5%), Mining, Quarrying, & Extraction (70.0%), and Educational Services (64.0%).
| Industry | Male | Female |
| Agriculture, Fishing & Hunting | 363 (89.8%) | 41 (10.2%) |
| Mining, Quarrying, & Extraction | 3 (30.0%) | 7 (70.0%) |
| Construction | 7,372 (95.9%) | 312 (4.1%) |
| Manufacturing | 5,899 (65.7%) | 3,078 (34.3%) |
| Wholesale Trade | 1,709 (67.9%) | 806 (32.1%) |
| Retail Trade | 4,265 (51.7%) | 3,985 (48.3%) |
| Transportation & Warehousing | 3,746 (70.7%) | 1,553 (29.3%) |
| Utilities | 253 (71.1%) | 103 (28.9%) |
| Information | 519 (54.6%) | 431 (45.4%) |
| Finance & Insurance | 1,117 (39.1%) | 1,740 (60.9%) |
| Real Estate, Rental & Leasing | 429 (51.5%) | 404 (48.5%) |
| Professional & Scientific | 1,471 (47.7%) | 1,614 (52.3%) |
| Enterprise Management | 41 (57.8%) | 30 (42.2%) |
| Administrative & Support | 1,960 (50.6%) | 1,911 (49.4%) |
| Educational Services | 2,033 (35.9%) | 3,622 (64.0%) |
| Health Care & Social Assistance | 1,971 (25.5%) | 5,754 (74.5%) |
| Arts, Entertainment & Recreation | 762 (59.6%) | 516 (40.4%) |
| Accommodation & Food Services | 2,092 (40.0%) | 3,138 (60.0%) |
| Public Administration | 1,677 (46.6%) | 1,925 (53.4%) |
| Total | 39,497 (54.6%) | 32,814 (45.4%) |
Education in Kansas City
School Enrollment in Kansas City
The most common levels of schooling among the 39,856 students in Kansas City are middle school (9,751 | 24.5%), high school (9,234 | 23.2%), and elementary school (8,863 | 22.2%).
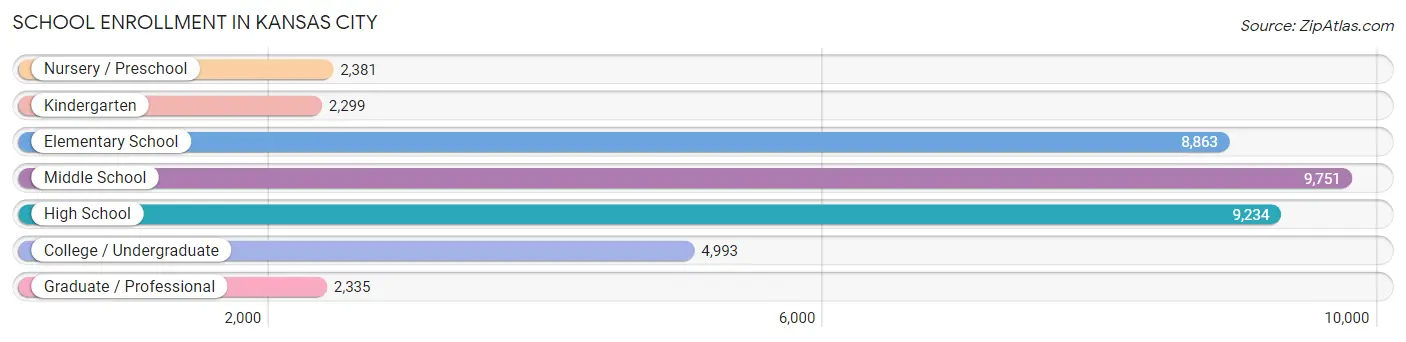
| School Level | # Students | % Students |
| Nursery / Preschool | 2,381 | 6.0% |
| Kindergarten | 2,299 | 5.8% |
| Elementary School | 8,863 | 22.2% |
| Middle School | 9,751 | 24.5% |
| High School | 9,234 | 23.2% |
| College / Undergraduate | 4,993 | 12.5% |
| Graduate / Professional | 2,335 | 5.9% |
| Total | 39,856 | 100.0% |
School Enrollment by Age by Funding Source in Kansas City
Out of a total of 39,856 students who are enrolled in schools in Kansas City, 4,265 (10.7%) attend a private institution, while the remaining 35,591 (89.3%) are enrolled in public schools. The age group of 35 years and over has the highest likelihood of being enrolled in private schools, with 335 (23.7% in the age bracket) enrolled. Conversely, the age group of 5 to 9 year old has the lowest likelihood of being enrolled in a private school, with 9,827 (92.7% in the age bracket) attending a public institution.
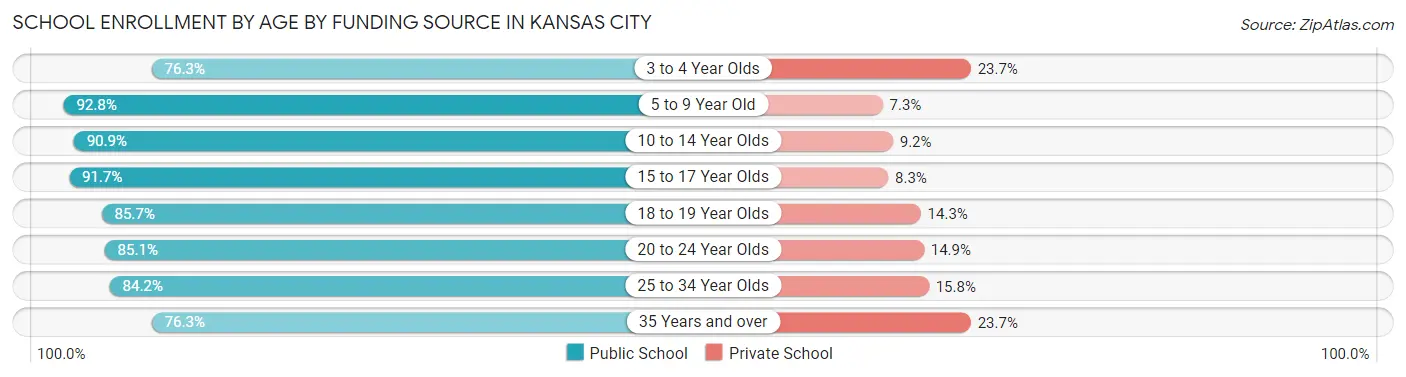
| Age Bracket | Public School | Private School |
| 3 to 4 Year Olds | 1,323 (76.3%) | 410 (23.7%) |
| 5 to 9 Year Old | 9,827 (92.7%) | 768 (7.2%) |
| 10 to 14 Year Olds | 11,396 (90.8%) | 1,148 (9.1%) |
| 15 to 17 Year Olds | 5,937 (91.7%) | 536 (8.3%) |
| 18 to 19 Year Olds | 1,834 (85.7%) | 307 (14.3%) |
| 20 to 24 Year Olds | 2,132 (85.1%) | 374 (14.9%) |
| 25 to 34 Year Olds | 2,061 (84.2%) | 388 (15.8%) |
| 35 Years and over | 1,080 (76.3%) | 335 (23.7%) |
| Total | 35,591 (89.3%) | 4,265 (10.7%) |
Educational Attainment by Field of Study in Kansas City
Business (4,151 | 19.8%), education (3,245 | 15.5%), science & technology (2,066 | 9.9%), bio, nature & agricultural (1,591 | 7.6%), and psychology (1,573 | 7.5%) are the most common fields of study among 20,971 individuals in Kansas City who have obtained a bachelor's degree or higher.
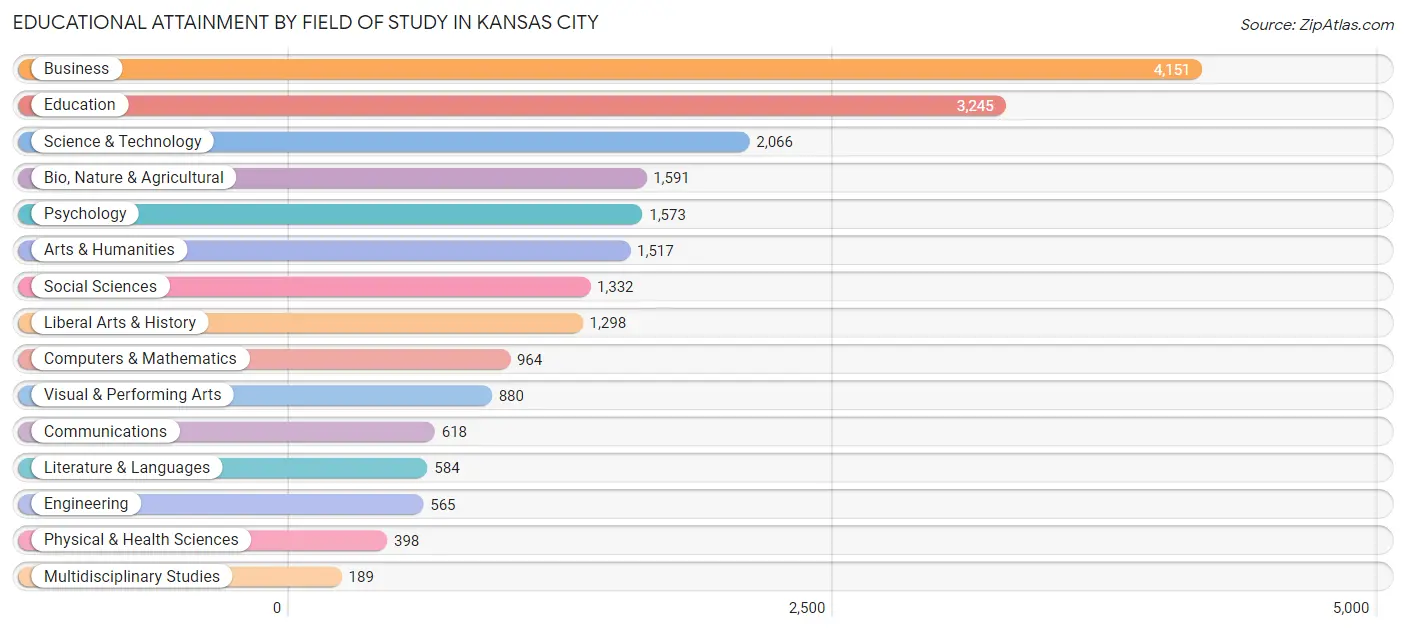
| Field of Study | # Graduates | % Graduates |
| Computers & Mathematics | 964 | 4.6% |
| Bio, Nature & Agricultural | 1,591 | 7.6% |
| Physical & Health Sciences | 398 | 1.9% |
| Psychology | 1,573 | 7.5% |
| Social Sciences | 1,332 | 6.4% |
| Engineering | 565 | 2.7% |
| Multidisciplinary Studies | 189 | 0.9% |
| Science & Technology | 2,066 | 9.9% |
| Business | 4,151 | 19.8% |
| Education | 3,245 | 15.5% |
| Literature & Languages | 584 | 2.8% |
| Liberal Arts & History | 1,298 | 6.2% |
| Visual & Performing Arts | 880 | 4.2% |
| Communications | 618 | 2.9% |
| Arts & Humanities | 1,517 | 7.2% |
| Total | 20,971 | 100.0% |
Transportation & Commute in Kansas City
Vehicle Availability by Sex in Kansas City
The most prevalent vehicle ownership categories in Kansas City are males with 2 vehicles (14,667, accounting for 38.0%) and females with 2 vehicles (11,690, making up 45.9%).
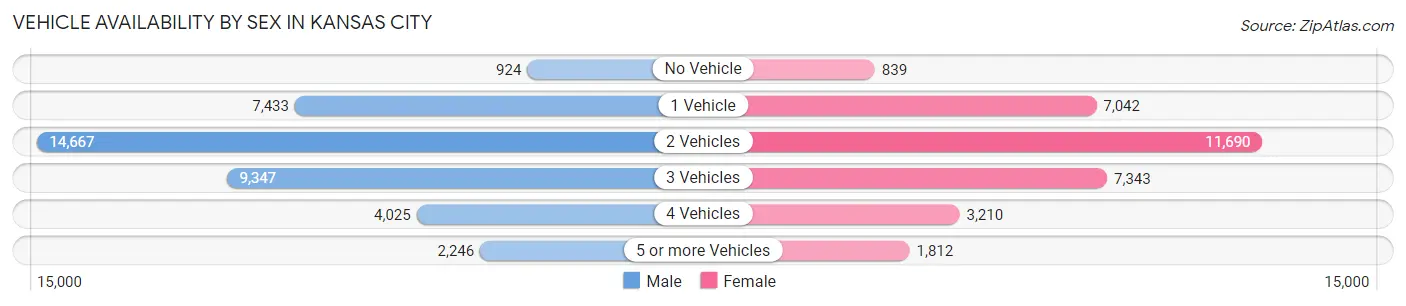
| Vehicles Available | Male | Female |
| No Vehicle | 924 (2.4%) | 839 (2.6%) |
| 1 Vehicle | 7,433 (19.2%) | 7,042 (22.1%) |
| 2 Vehicles | 14,667 (38.0%) | 11,690 (36.6%) |
| 3 Vehicles | 9,347 (24.2%) | 7,343 (23.0%) |
| 4 Vehicles | 4,025 (10.4%) | 3,210 (10.1%) |
| 5 or more Vehicles | 2,246 (5.8%) | 1,812 (5.7%) |
| Total | 38,642 (100.0%) | 31,936 (100.0%) |
Commute Time in Kansas City
The most frequently occuring commute durations in Kansas City are 15 to 19 minutes (14,052 commuters, 21.5%), 20 to 24 minutes (13,643 commuters, 20.8%), and 10 to 14 minutes (9,652 commuters, 14.7%).
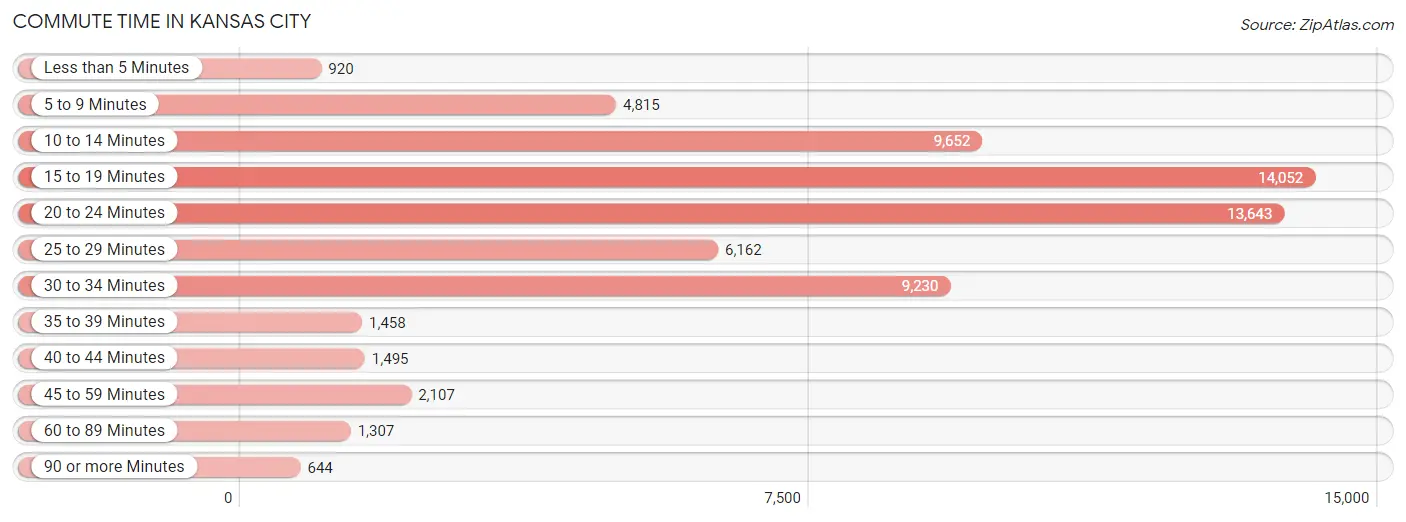
| Commute Time | # Commuters | % Commuters |
| Less than 5 Minutes | 920 | 1.4% |
| 5 to 9 Minutes | 4,815 | 7.3% |
| 10 to 14 Minutes | 9,652 | 14.7% |
| 15 to 19 Minutes | 14,052 | 21.5% |
| 20 to 24 Minutes | 13,643 | 20.8% |
| 25 to 29 Minutes | 6,162 | 9.4% |
| 30 to 34 Minutes | 9,230 | 14.1% |
| 35 to 39 Minutes | 1,458 | 2.2% |
| 40 to 44 Minutes | 1,495 | 2.3% |
| 45 to 59 Minutes | 2,107 | 3.2% |
| 60 to 89 Minutes | 1,307 | 2.0% |
| 90 or more Minutes | 644 | 1.0% |
Commute Time by Sex in Kansas City
The most common commute times in Kansas City are 15 to 19 minutes (8,234 commuters, 22.5%) for males and 20 to 24 minutes (6,362 commuters, 22.0%) for females.
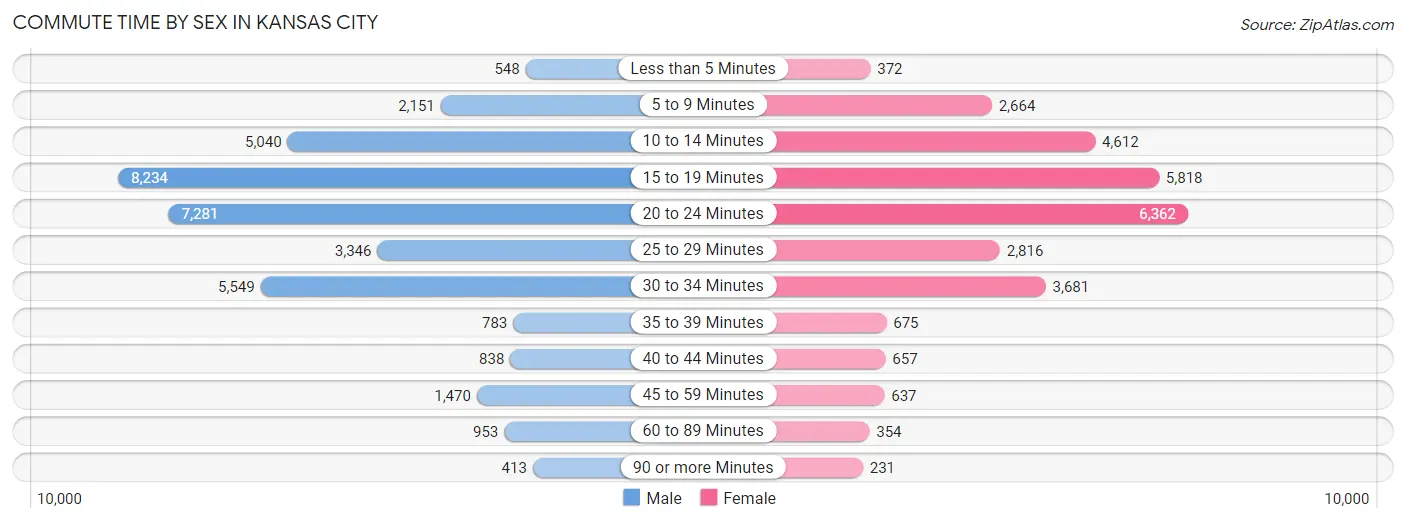
| Commute Time | Male | Female |
| Less than 5 Minutes | 548 (1.5%) | 372 (1.3%) |
| 5 to 9 Minutes | 2,151 (5.9%) | 2,664 (9.2%) |
| 10 to 14 Minutes | 5,040 (13.8%) | 4,612 (16.0%) |
| 15 to 19 Minutes | 8,234 (22.5%) | 5,818 (20.2%) |
| 20 to 24 Minutes | 7,281 (19.9%) | 6,362 (22.0%) |
| 25 to 29 Minutes | 3,346 (9.1%) | 2,816 (9.8%) |
| 30 to 34 Minutes | 5,549 (15.2%) | 3,681 (12.8%) |
| 35 to 39 Minutes | 783 (2.1%) | 675 (2.3%) |
| 40 to 44 Minutes | 838 (2.3%) | 657 (2.3%) |
| 45 to 59 Minutes | 1,470 (4.0%) | 637 (2.2%) |
| 60 to 89 Minutes | 953 (2.6%) | 354 (1.2%) |
| 90 or more Minutes | 413 (1.1%) | 231 (0.8%) |
Time of Departure to Work by Sex in Kansas City
The most frequent times of departure to work in Kansas City are 7:00 AM to 7:29 AM (4,743, 13.0%) for males and 4:00 PM to 11:59 PM (3,530, 12.2%) for females.
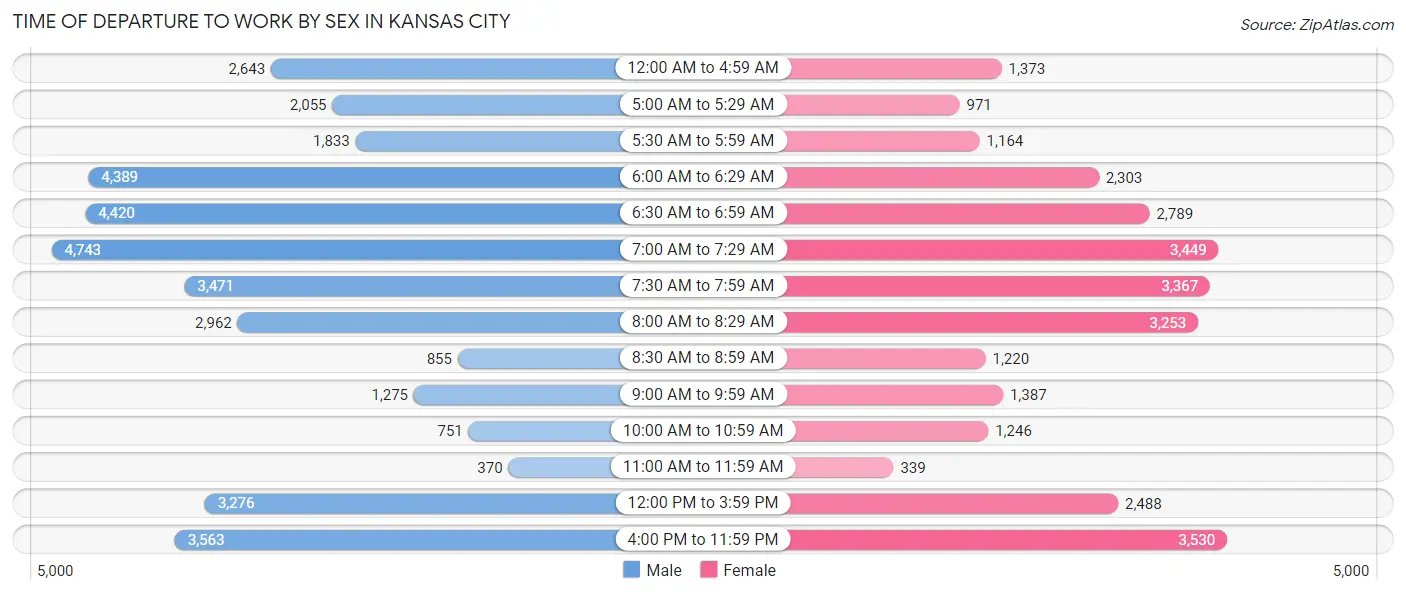
| Time of Departure | Male | Female |
| 12:00 AM to 4:59 AM | 2,643 (7.2%) | 1,373 (4.8%) |
| 5:00 AM to 5:29 AM | 2,055 (5.6%) | 971 (3.4%) |
| 5:30 AM to 5:59 AM | 1,833 (5.0%) | 1,164 (4.0%) |
| 6:00 AM to 6:29 AM | 4,389 (12.0%) | 2,303 (8.0%) |
| 6:30 AM to 6:59 AM | 4,420 (12.1%) | 2,789 (9.7%) |
| 7:00 AM to 7:29 AM | 4,743 (13.0%) | 3,449 (11.9%) |
| 7:30 AM to 7:59 AM | 3,471 (9.5%) | 3,367 (11.7%) |
| 8:00 AM to 8:29 AM | 2,962 (8.1%) | 3,253 (11.3%) |
| 8:30 AM to 8:59 AM | 855 (2.3%) | 1,220 (4.2%) |
| 9:00 AM to 9:59 AM | 1,275 (3.5%) | 1,387 (4.8%) |
| 10:00 AM to 10:59 AM | 751 (2.1%) | 1,246 (4.3%) |
| 11:00 AM to 11:59 AM | 370 (1.0%) | 339 (1.2%) |
| 12:00 PM to 3:59 PM | 3,276 (8.9%) | 2,488 (8.6%) |
| 4:00 PM to 11:59 PM | 3,563 (9.7%) | 3,530 (12.2%) |
| Total | 36,606 (100.0%) | 28,879 (100.0%) |
Housing Occupancy in Kansas City
Occupancy by Ownership in Kansas City
Of the total 56,842 dwellings in Kansas City, owner-occupied units account for 33,806 (59.5%), while renter-occupied units make up 23,036 (40.5%).
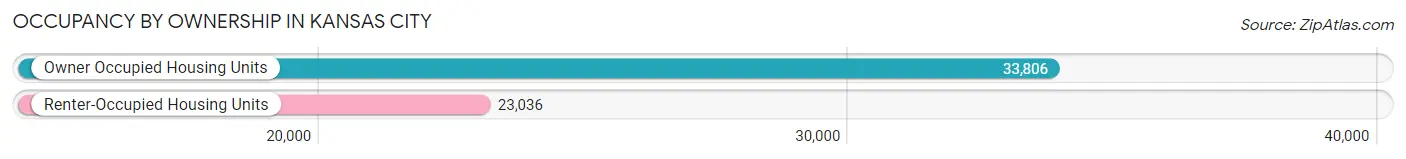
| Occupancy | # Housing Units | % Housing Units |
| Owner Occupied Housing Units | 33,806 | 59.5% |
| Renter-Occupied Housing Units | 23,036 | 40.5% |
| Total Occupied Housing Units | 56,842 | 100.0% |
Occupancy by Household Size in Kansas City
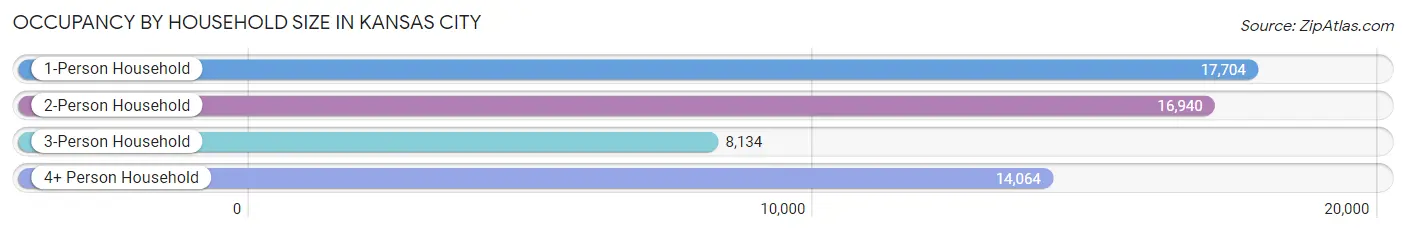
| Household Size | # Housing Units | % Housing Units |
| 1-Person Household | 17,704 | 31.1% |
| 2-Person Household | 16,940 | 29.8% |
| 3-Person Household | 8,134 | 14.3% |
| 4+ Person Household | 14,064 | 24.7% |
| Total Housing Units | 56,842 | 100.0% |
Occupancy by Ownership by Household Size in Kansas City
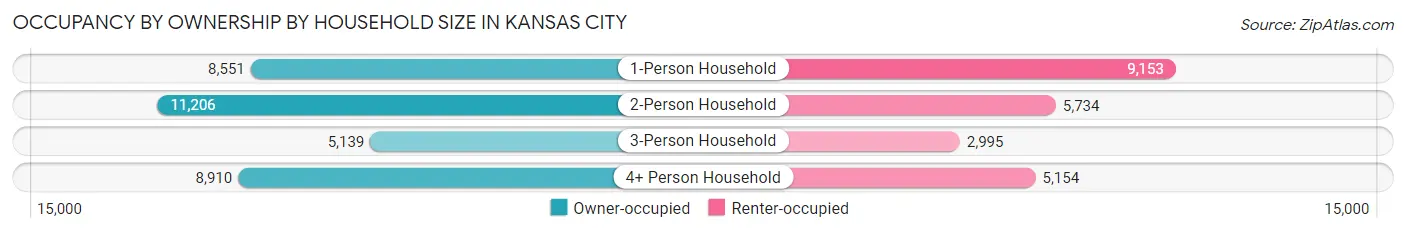
| Household Size | Owner-occupied | Renter-occupied |
| 1-Person Household | 8,551 (48.3%) | 9,153 (51.7%) |
| 2-Person Household | 11,206 (66.1%) | 5,734 (33.9%) |
| 3-Person Household | 5,139 (63.2%) | 2,995 (36.8%) |
| 4+ Person Household | 8,910 (63.3%) | 5,154 (36.6%) |
| Total Housing Units | 33,806 (59.5%) | 23,036 (40.5%) |
Occupancy by Educational Attainment in Kansas City
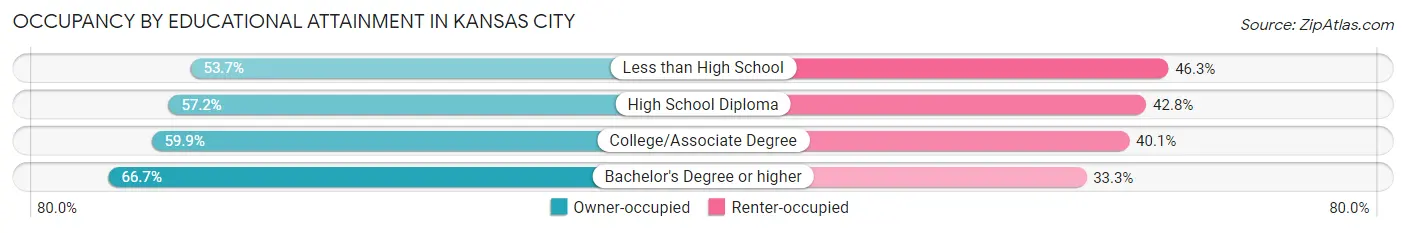
| Household Size | Owner-occupied | Renter-occupied |
| Less than High School | 5,167 (53.7%) | 4,458 (46.3%) |
| High School Diploma | 10,062 (57.2%) | 7,535 (42.8%) |
| College/Associate Degree | 10,322 (59.9%) | 6,919 (40.1%) |
| Bachelor's Degree or higher | 8,255 (66.7%) | 4,124 (33.3%) |
Occupancy by Age of Householder in Kansas City
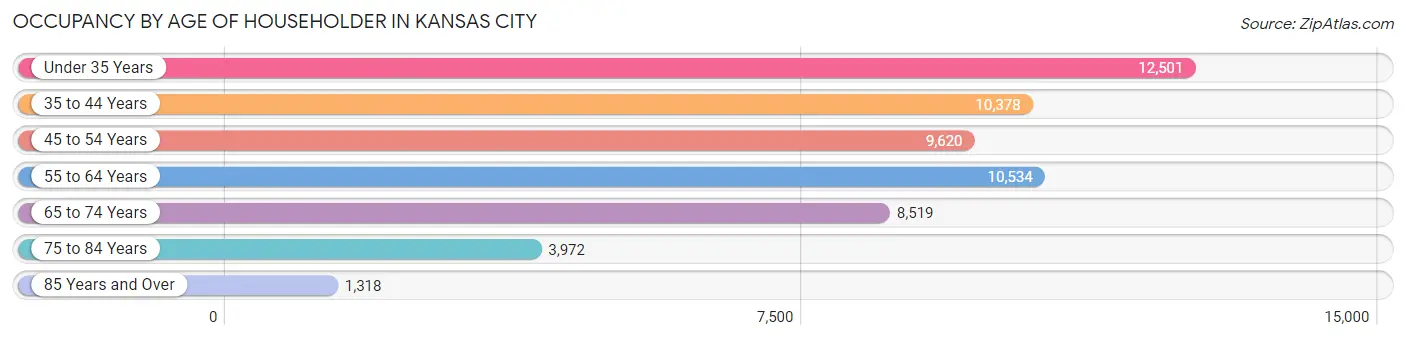
| Age Bracket | # Households | % Households |
| Under 35 Years | 12,501 | 22.0% |
| 35 to 44 Years | 10,378 | 18.3% |
| 45 to 54 Years | 9,620 | 16.9% |
| 55 to 64 Years | 10,534 | 18.5% |
| 65 to 74 Years | 8,519 | 15.0% |
| 75 to 84 Years | 3,972 | 7.0% |
| 85 Years and Over | 1,318 | 2.3% |
| Total | 56,842 | 100.0% |
Housing Finances in Kansas City
Median Income by Occupancy in Kansas City
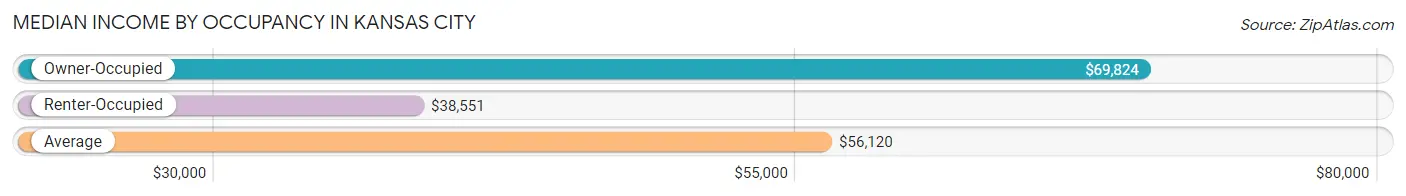
| Occupancy Type | # Households | Median Income |
| Owner-Occupied | 33,806 (59.5%) | $69,824 |
| Renter-Occupied | 23,036 (40.5%) | $38,551 |
| Average | 56,842 (100.0%) | $56,120 |
Occupancy by Householder Income Bracket in Kansas City
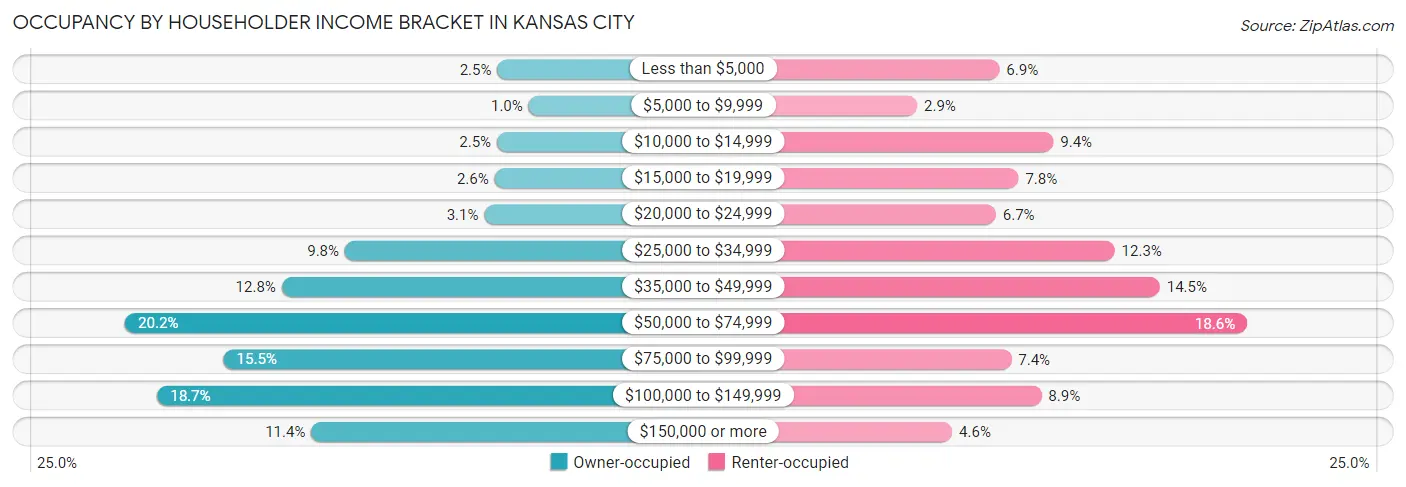
| Income Bracket | Owner-occupied | Renter-occupied |
| Less than $5,000 | 841 (2.5%) | 1,578 (6.9%) |
| $5,000 to $9,999 | 339 (1.0%) | 676 (2.9%) |
| $10,000 to $14,999 | 848 (2.5%) | 2,171 (9.4%) |
| $15,000 to $19,999 | 887 (2.6%) | 1,788 (7.8%) |
| $20,000 to $24,999 | 1,050 (3.1%) | 1,538 (6.7%) |
| $25,000 to $34,999 | 3,297 (9.8%) | 2,842 (12.3%) |
| $35,000 to $49,999 | 4,314 (12.8%) | 3,339 (14.5%) |
| $50,000 to $74,999 | 6,831 (20.2%) | 4,295 (18.6%) |
| $75,000 to $99,999 | 5,248 (15.5%) | 1,710 (7.4%) |
| $100,000 to $149,999 | 6,315 (18.7%) | 2,039 (8.8%) |
| $150,000 or more | 3,836 (11.4%) | 1,060 (4.6%) |
| Total | 33,806 (100.0%) | 23,036 (100.0%) |
Monthly Housing Cost Tiers in Kansas City
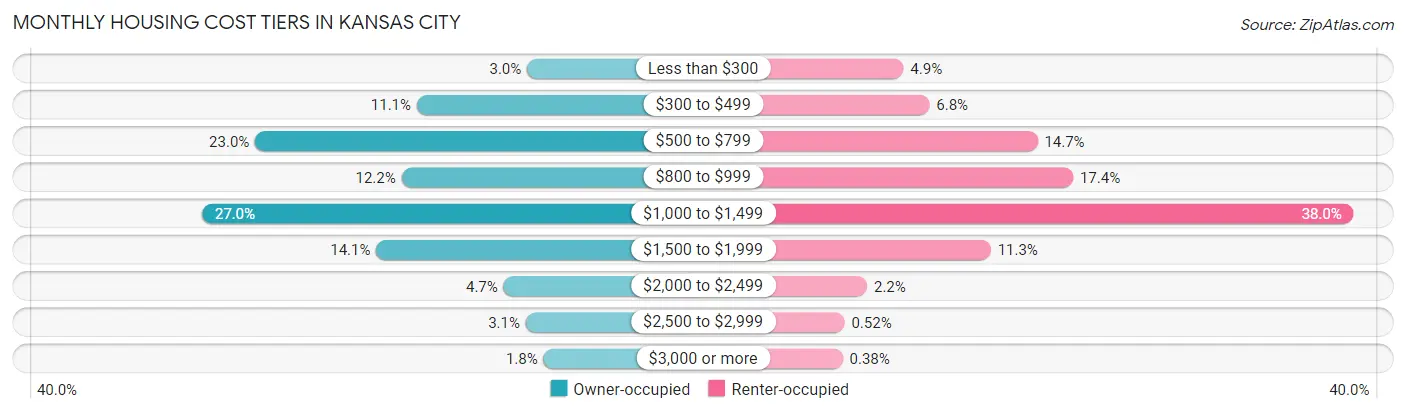
| Monthly Cost | Owner-occupied | Renter-occupied |
| Less than $300 | 1,011 (3.0%) | 1,120 (4.9%) |
| $300 to $499 | 3,757 (11.1%) | 1,560 (6.8%) |
| $500 to $799 | 7,783 (23.0%) | 3,394 (14.7%) |
| $800 to $999 | 4,137 (12.2%) | 3,996 (17.3%) |
| $1,000 to $1,499 | 9,110 (27.0%) | 8,758 (38.0%) |
| $1,500 to $1,999 | 4,768 (14.1%) | 2,600 (11.3%) |
| $2,000 to $2,499 | 1,595 (4.7%) | 503 (2.2%) |
| $2,500 to $2,999 | 1,044 (3.1%) | 120 (0.5%) |
| $3,000 or more | 601 (1.8%) | 87 (0.4%) |
| Total | 33,806 (100.0%) | 23,036 (100.0%) |
Physical Housing Characteristics in Kansas City
Housing Structures in Kansas City
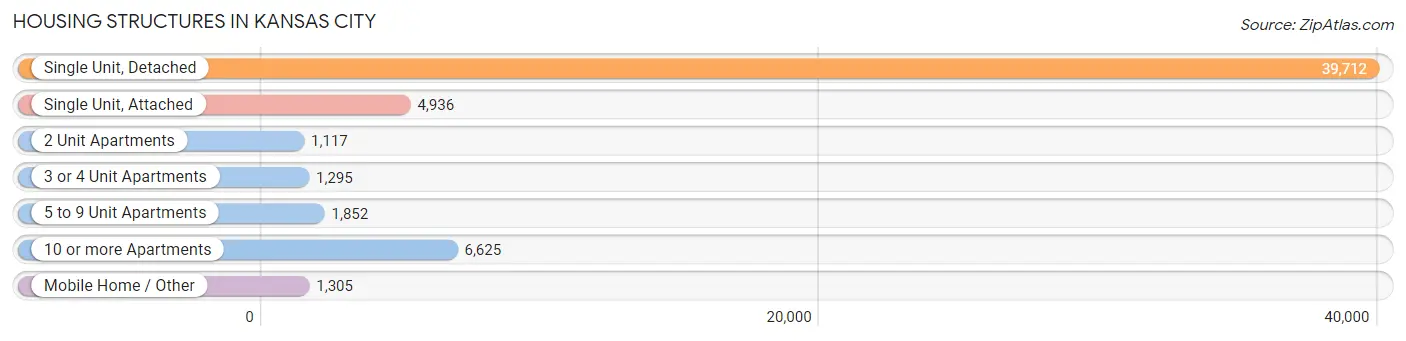
| Structure Type | # Housing Units | % Housing Units |
| Single Unit, Detached | 39,712 | 69.9% |
| Single Unit, Attached | 4,936 | 8.7% |
| 2 Unit Apartments | 1,117 | 2.0% |
| 3 or 4 Unit Apartments | 1,295 | 2.3% |
| 5 to 9 Unit Apartments | 1,852 | 3.3% |
| 10 or more Apartments | 6,625 | 11.7% |
| Mobile Home / Other | 1,305 | 2.3% |
| Total | 56,842 | 100.0% |
Housing Structures by Occupancy in Kansas City
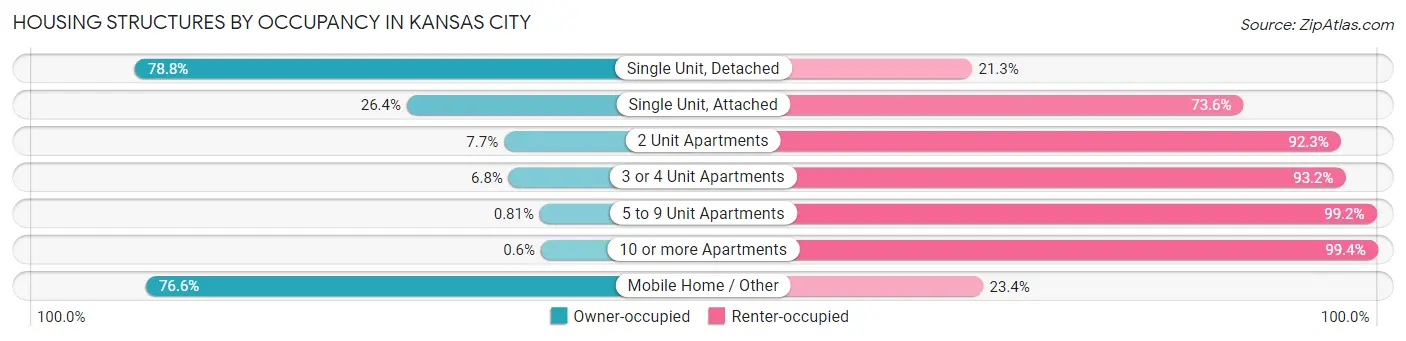
| Structure Type | Owner-occupied | Renter-occupied |
| Single Unit, Detached | 31,273 (78.7%) | 8,439 (21.2%) |
| Single Unit, Attached | 1,304 (26.4%) | 3,632 (73.6%) |
| 2 Unit Apartments | 86 (7.7%) | 1,031 (92.3%) |
| 3 or 4 Unit Apartments | 88 (6.8%) | 1,207 (93.2%) |
| 5 to 9 Unit Apartments | 15 (0.8%) | 1,837 (99.2%) |
| 10 or more Apartments | 40 (0.6%) | 6,585 (99.4%) |
| Mobile Home / Other | 1,000 (76.6%) | 305 (23.4%) |
| Total | 33,806 (59.5%) | 23,036 (40.5%) |
Housing Structures by Number of Rooms in Kansas City
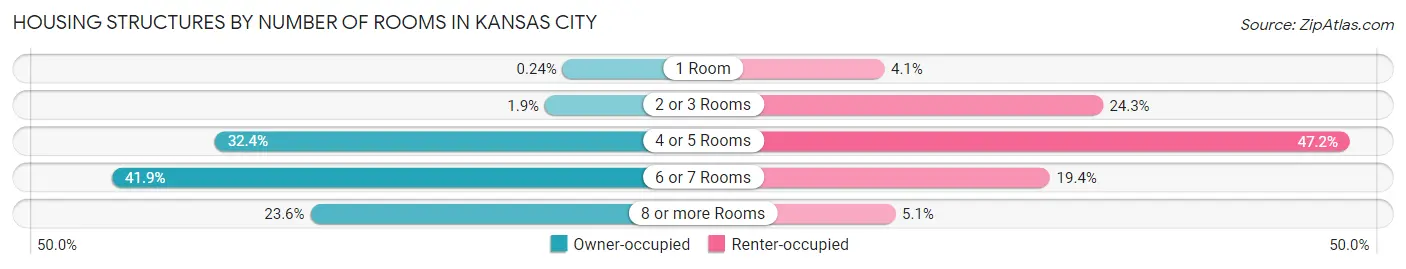
| Number of Rooms | Owner-occupied | Renter-occupied |
| 1 Room | 81 (0.2%) | 941 (4.1%) |
| 2 or 3 Rooms | 635 (1.9%) | 5,592 (24.3%) |
| 4 or 5 Rooms | 10,958 (32.4%) | 10,861 (47.1%) |
| 6 or 7 Rooms | 14,165 (41.9%) | 4,468 (19.4%) |
| 8 or more Rooms | 7,967 (23.6%) | 1,174 (5.1%) |
| Total | 33,806 (100.0%) | 23,036 (100.0%) |
Housing Structure by Heating Type in Kansas City
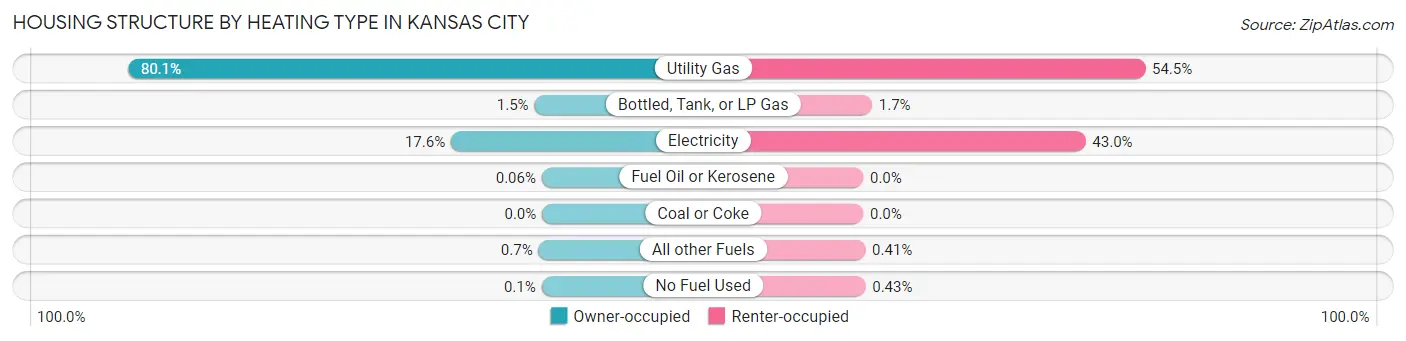
| Heating Type | Owner-occupied | Renter-occupied |
| Utility Gas | 27,061 (80.0%) | 12,553 (54.5%) |
| Bottled, Tank, or LP Gas | 503 (1.5%) | 391 (1.7%) |
| Electricity | 5,953 (17.6%) | 9,898 (43.0%) |
| Fuel Oil or Kerosene | 19 (0.1%) | 0 (0.0%) |
| Coal or Coke | 0 (0.0%) | 0 (0.0%) |
| All other Fuels | 236 (0.7%) | 95 (0.4%) |
| No Fuel Used | 34 (0.1%) | 99 (0.4%) |
| Total | 33,806 (100.0%) | 23,036 (100.0%) |
Household Vehicle Usage in Kansas City
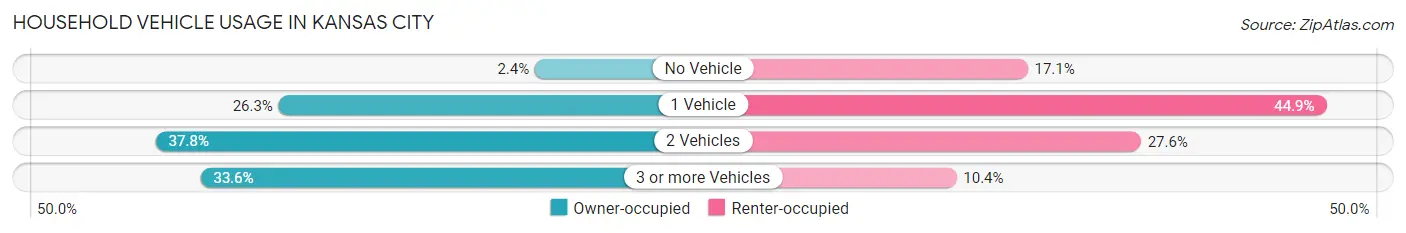
| Vehicles per Household | Owner-occupied | Renter-occupied |
| No Vehicle | 793 (2.4%) | 3,927 (17.1%) |
| 1 Vehicle | 8,885 (26.3%) | 10,353 (44.9%) |
| 2 Vehicles | 12,768 (37.8%) | 6,360 (27.6%) |
| 3 or more Vehicles | 11,360 (33.6%) | 2,396 (10.4%) |
| Total | 33,806 (100.0%) | 23,036 (100.0%) |
Real Estate & Mortgages in Kansas City
Real Estate and Mortgage Overview in Kansas City
| Characteristic | Without Mortgage | With Mortgage |
| Housing Units | 14,896 | 18,910 |
| Median Property Value | $104,200 | $155,400 |
| Median Household Income | $55,706 | $2,852 |
| Monthly Housing Costs | $594 | $595 |
| Real Estate Taxes | $1,699 | $519 |
Property Value by Mortgage Status in Kansas City
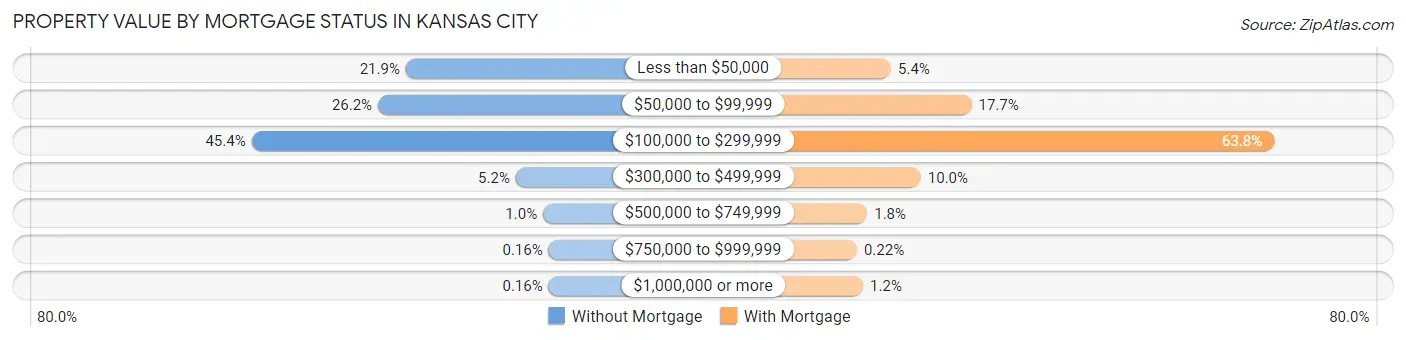
| Property Value | Without Mortgage | With Mortgage |
| Less than $50,000 | 3,265 (21.9%) | 1,025 (5.4%) |
| $50,000 to $99,999 | 3,897 (26.2%) | 3,346 (17.7%) |
| $100,000 to $299,999 | 6,767 (45.4%) | 12,057 (63.8%) |
| $300,000 to $499,999 | 769 (5.2%) | 1,882 (10.0%) |
| $500,000 to $749,999 | 150 (1.0%) | 339 (1.8%) |
| $750,000 to $999,999 | 24 (0.2%) | 42 (0.2%) |
| $1,000,000 or more | 24 (0.2%) | 219 (1.2%) |
| Total | 14,896 (100.0%) | 18,910 (100.0%) |
Household Income by Mortgage Status in Kansas City
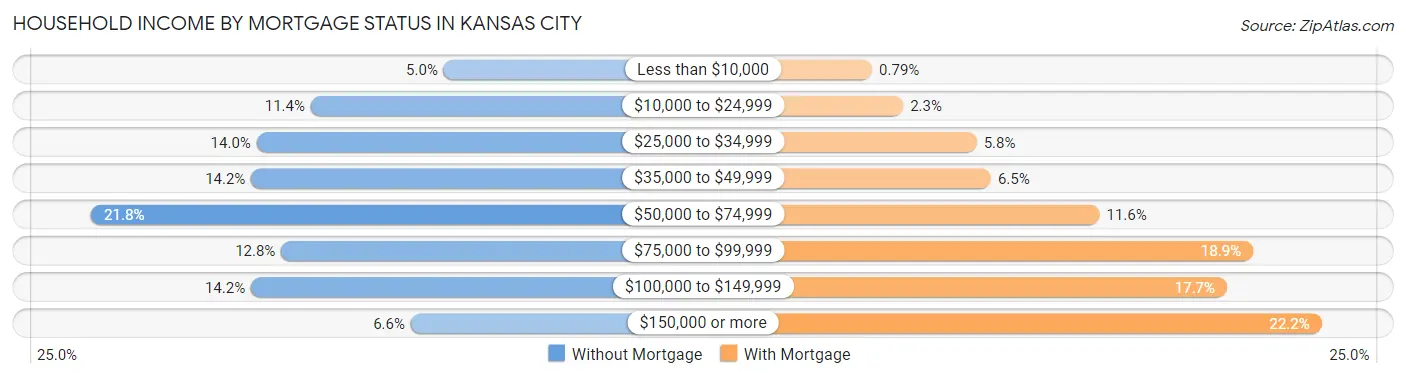
| Household Income | Without Mortgage | With Mortgage |
| Less than $10,000 | 751 (5.0%) | 149 (0.8%) |
| $10,000 to $24,999 | 1,693 (11.4%) | 429 (2.3%) |
| $25,000 to $34,999 | 2,078 (14.0%) | 1,092 (5.8%) |
| $35,000 to $49,999 | 2,116 (14.2%) | 1,219 (6.5%) |
| $50,000 to $74,999 | 3,252 (21.8%) | 2,198 (11.6%) |
| $75,000 to $99,999 | 1,904 (12.8%) | 3,579 (18.9%) |
| $100,000 to $149,999 | 2,118 (14.2%) | 3,344 (17.7%) |
| $150,000 or more | 984 (6.6%) | 4,197 (22.2%) |
| Total | 14,896 (100.0%) | 18,910 (100.0%) |
Property Value to Household Income Ratio in Kansas City
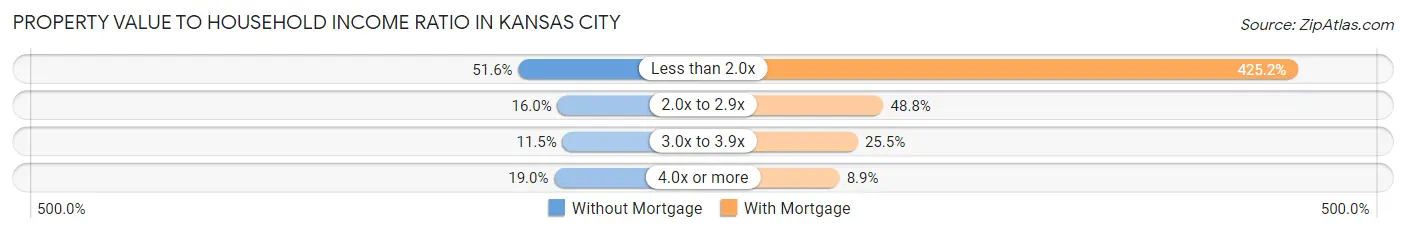
| Value-to-Income Ratio | Without Mortgage | With Mortgage |
| Less than 2.0x | 7,687 (51.6%) | 80,399 (425.2%) |
| 2.0x to 2.9x | 2,387 (16.0%) | 9,228 (48.8%) |
| 3.0x to 3.9x | 1,710 (11.5%) | 4,820 (25.5%) |
| 4.0x or more | 2,834 (19.0%) | 1,689 (8.9%) |
| Total | 14,896 (100.0%) | 18,910 (100.0%) |
Real Estate Taxes by Mortgage Status in Kansas City
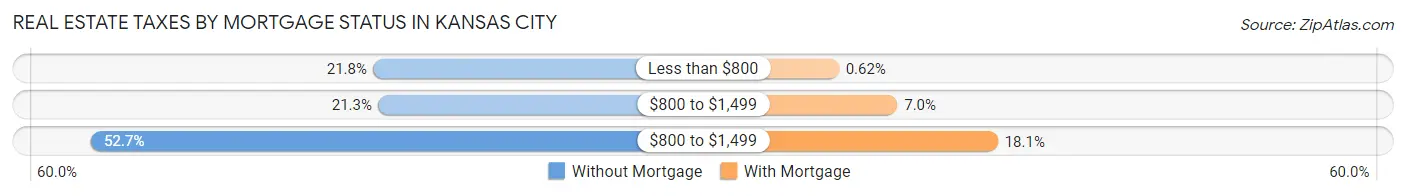
| Property Taxes | Without Mortgage | With Mortgage |
| Less than $800 | 3,254 (21.8%) | 118 (0.6%) |
| $800 to $1,499 | 3,172 (21.3%) | 1,332 (7.0%) |
| $800 to $1,499 | 7,853 (52.7%) | 3,413 (18.0%) |
| Total | 14,896 (100.0%) | 18,910 (100.0%) |
Health & Disability in Kansas City
Health Insurance Coverage by Age in Kansas City
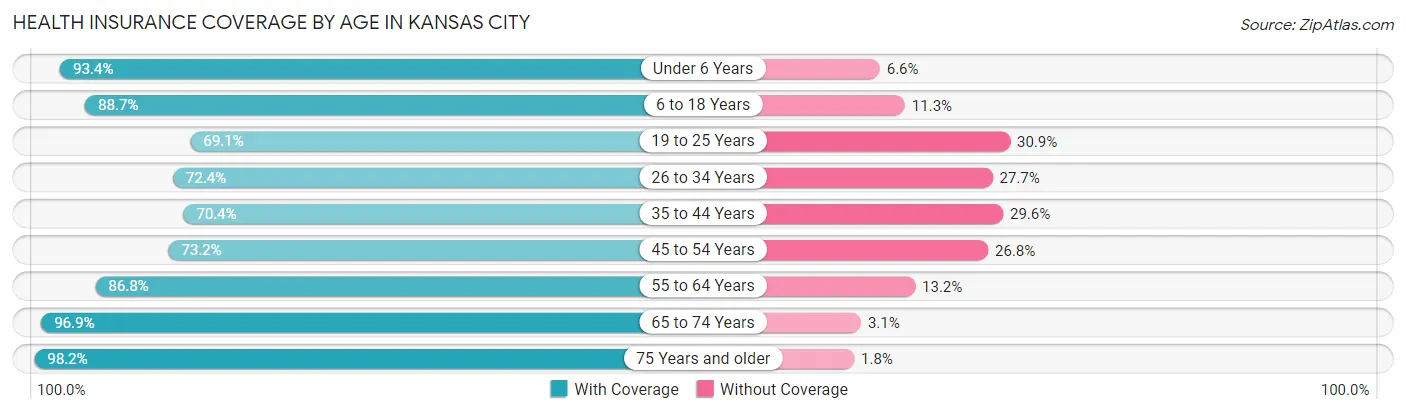
| Age Bracket | With Coverage | Without Coverage |
| Under 6 Years | 12,754 (93.4%) | 904 (6.6%) |
| 6 to 18 Years | 27,179 (88.7%) | 3,462 (11.3%) |
| 19 to 25 Years | 10,422 (69.1%) | 4,663 (30.9%) |
| 26 to 34 Years | 14,186 (72.4%) | 5,422 (27.7%) |
| 35 to 44 Years | 14,501 (70.4%) | 6,100 (29.6%) |
| 45 to 54 Years | 12,584 (73.2%) | 4,612 (26.8%) |
| 55 to 64 Years | 15,161 (86.8%) | 2,308 (13.2%) |
| 65 to 74 Years | 11,967 (96.9%) | 384 (3.1%) |
| 75 Years and older | 7,547 (98.2%) | 141 (1.8%) |
| Total | 126,301 (81.9%) | 27,996 (18.1%) |
Health Insurance Coverage by Citizenship Status in Kansas City
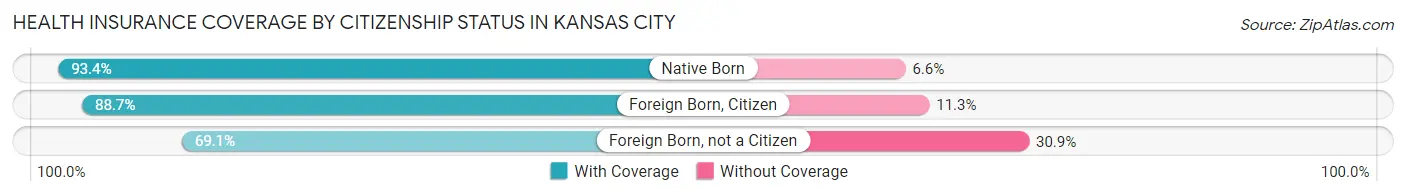
| Citizenship Status | With Coverage | Without Coverage |
| Native Born | 12,754 (93.4%) | 904 (6.6%) |
| Foreign Born, Citizen | 27,179 (88.7%) | 3,462 (11.3%) |
| Foreign Born, not a Citizen | 10,422 (69.1%) | 4,663 (30.9%) |
Health Insurance Coverage by Household Income in Kansas City
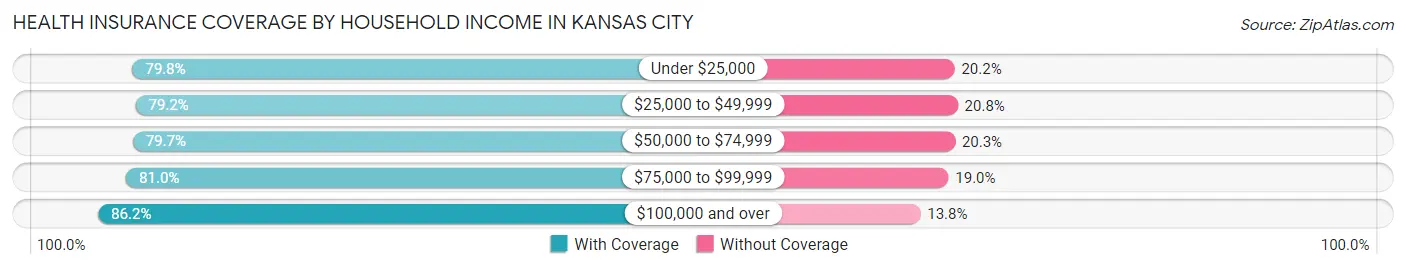
| Household Income | With Coverage | Without Coverage |
| Under $25,000 | 17,662 (79.8%) | 4,466 (20.2%) |
| $25,000 to $49,999 | 25,248 (79.2%) | 6,619 (20.8%) |
| $50,000 to $74,999 | 24,355 (79.7%) | 6,188 (20.3%) |
| $75,000 to $99,999 | 17,789 (81.0%) | 4,180 (19.0%) |
| $100,000 and over | 40,868 (86.2%) | 6,526 (13.8%) |
Public vs Private Health Insurance Coverage by Age in Kansas City
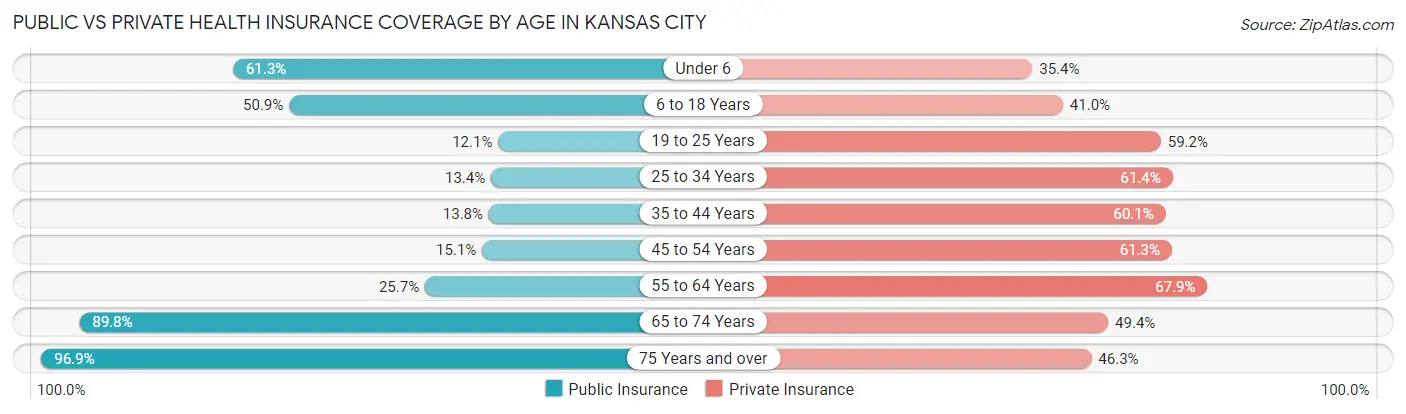
| Age Bracket | Public Insurance | Private Insurance |
| Under 6 | 8,377 (61.3%) | 4,829 (35.4%) |
| 6 to 18 Years | 15,595 (50.9%) | 12,576 (41.0%) |
| 19 to 25 Years | 1,824 (12.1%) | 8,932 (59.2%) |
| 25 to 34 Years | 2,631 (13.4%) | 12,039 (61.4%) |
| 35 to 44 Years | 2,849 (13.8%) | 12,377 (60.1%) |
| 45 to 54 Years | 2,591 (15.1%) | 10,534 (61.3%) |
| 55 to 64 Years | 4,486 (25.7%) | 11,852 (67.8%) |
| 65 to 74 Years | 11,096 (89.8%) | 6,106 (49.4%) |
| 75 Years and over | 7,450 (96.9%) | 3,562 (46.3%) |
| Total | 56,899 (36.9%) | 82,807 (53.7%) |
Disability Status by Sex by Age in Kansas City
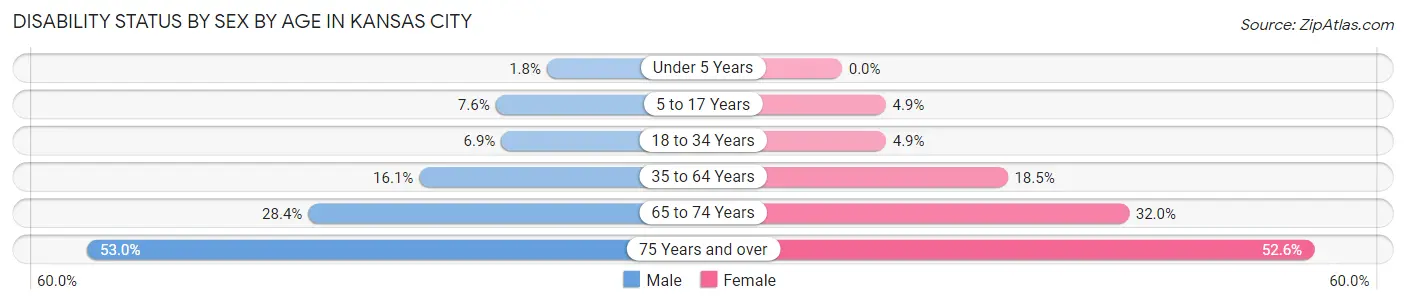
| Age Bracket | Male | Female |
| Under 5 Years | 111 (1.8%) | 0 (0.0%) |
| 5 to 17 Years | 1,185 (7.6%) | 733 (4.9%) |
| 18 to 34 Years | 1,289 (6.9%) | 886 (4.9%) |
| 35 to 64 Years | 4,550 (16.1%) | 4,967 (18.4%) |
| 65 to 74 Years | 1,657 (28.4%) | 2,084 (32.0%) |
| 75 Years and over | 1,606 (53.0%) | 2,450 (52.6%) |
Disability Class by Sex by Age in Kansas City
Disability Class: Hearing Difficulty
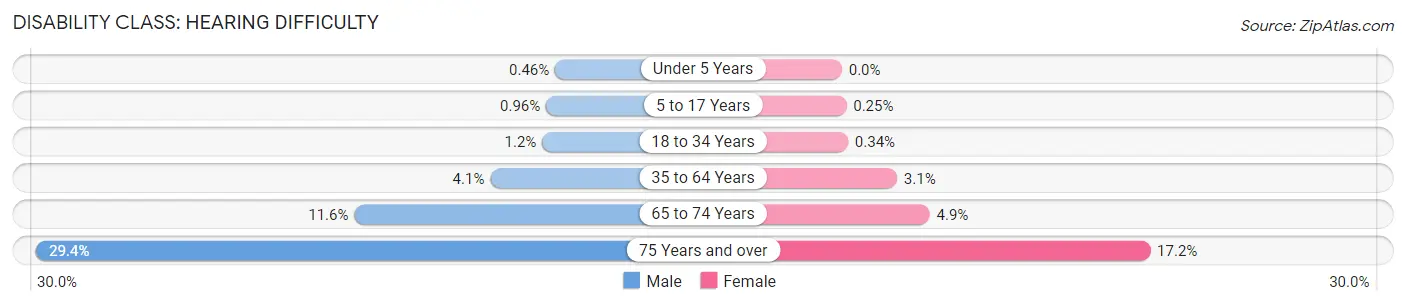
| Age Bracket | Male | Female |
| Under 5 Years | 28 (0.5%) | 0 (0.0%) |
| 5 to 17 Years | 151 (1.0%) | 38 (0.3%) |
| 18 to 34 Years | 219 (1.2%) | 62 (0.3%) |
| 35 to 64 Years | 1,153 (4.1%) | 826 (3.1%) |
| 65 to 74 Years | 679 (11.6%) | 319 (4.9%) |
| 75 Years and over | 889 (29.4%) | 800 (17.2%) |
Disability Class: Vision Difficulty
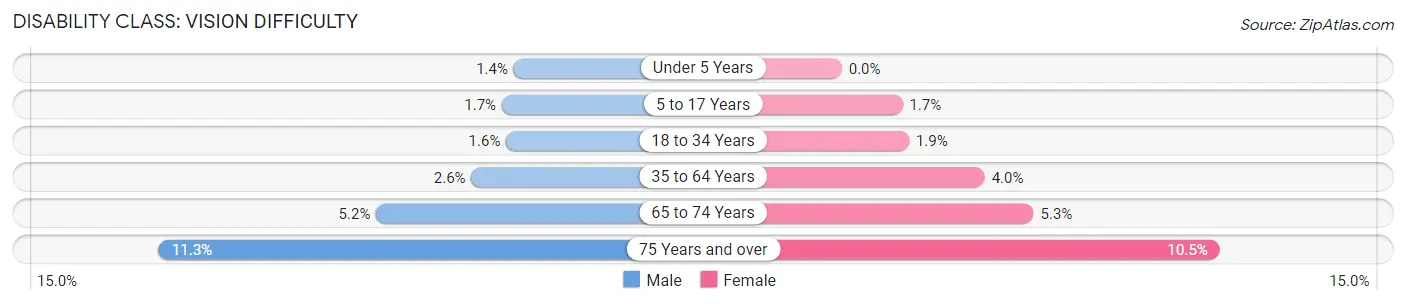
| Age Bracket | Male | Female |
| Under 5 Years | 83 (1.4%) | 0 (0.0%) |
| 5 to 17 Years | 268 (1.7%) | 255 (1.7%) |
| 18 to 34 Years | 297 (1.6%) | 339 (1.9%) |
| 35 to 64 Years | 725 (2.6%) | 1,073 (4.0%) |
| 65 to 74 Years | 304 (5.2%) | 348 (5.3%) |
| 75 Years and over | 341 (11.3%) | 490 (10.5%) |
Disability Class: Cognitive Difficulty
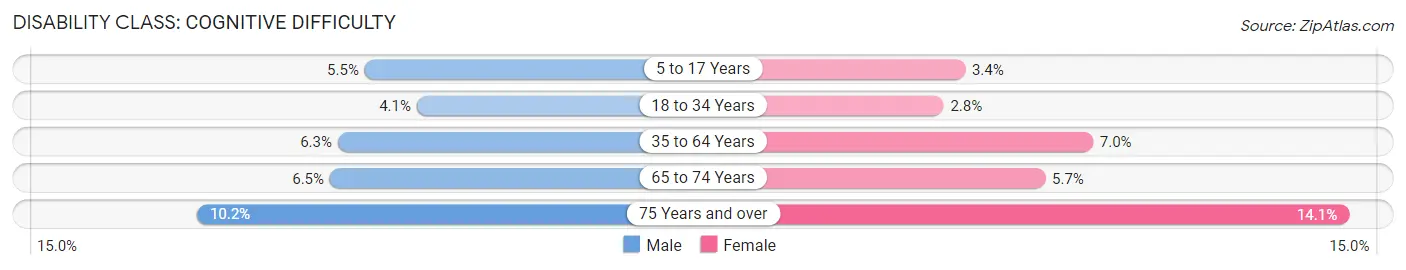
| Age Bracket | Male | Female |
| 5 to 17 Years | 866 (5.5%) | 516 (3.4%) |
| 18 to 34 Years | 761 (4.1%) | 512 (2.8%) |
| 35 to 64 Years | 1,781 (6.3%) | 1,881 (7.0%) |
| 65 to 74 Years | 379 (6.5%) | 369 (5.7%) |
| 75 Years and over | 309 (10.2%) | 658 (14.1%) |
Disability Class: Ambulatory Difficulty
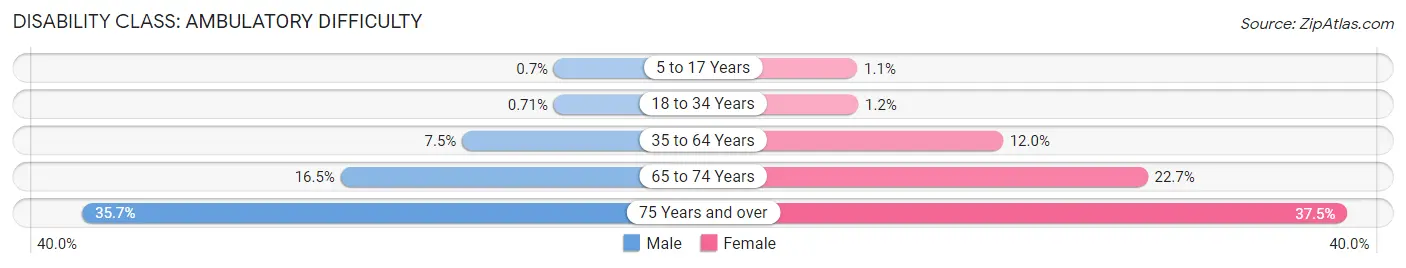
| Age Bracket | Male | Female |
| 5 to 17 Years | 109 (0.7%) | 172 (1.1%) |
| 18 to 34 Years | 133 (0.7%) | 219 (1.2%) |
| 35 to 64 Years | 2,129 (7.5%) | 3,217 (11.9%) |
| 65 to 74 Years | 964 (16.5%) | 1,480 (22.7%) |
| 75 Years and over | 1,082 (35.7%) | 1,749 (37.5%) |
Disability Class: Self-Care Difficulty
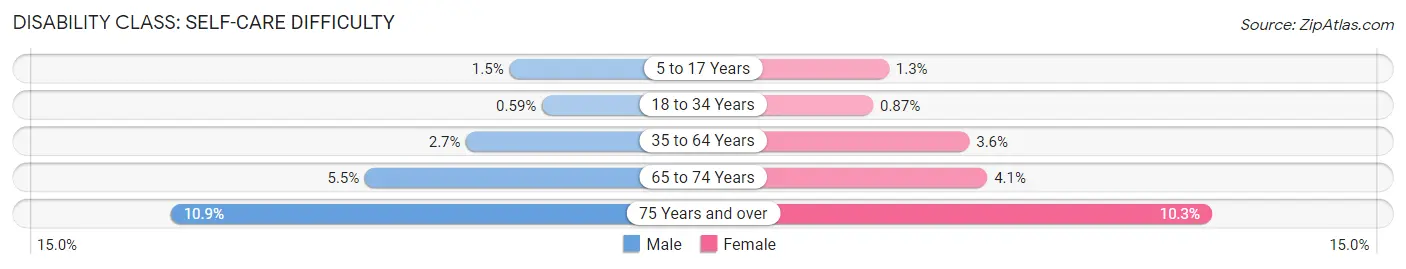
| Age Bracket | Male | Female |
| 5 to 17 Years | 235 (1.5%) | 197 (1.3%) |
| 18 to 34 Years | 110 (0.6%) | 157 (0.9%) |
| 35 to 64 Years | 766 (2.7%) | 955 (3.5%) |
| 65 to 74 Years | 322 (5.5%) | 264 (4.1%) |
| 75 Years and over | 331 (10.9%) | 480 (10.3%) |
Technology Access in Kansas City
Computing Device Access in Kansas City
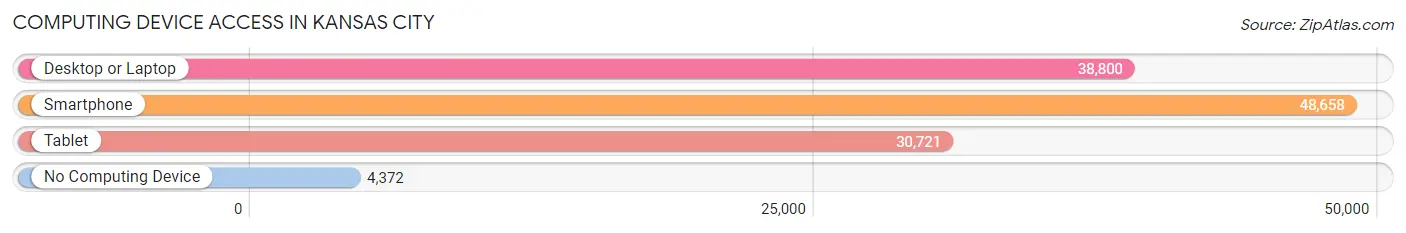
| Device Type | # Households | % Households |
| Desktop or Laptop | 38,800 | 68.3% |
| Smartphone | 48,658 | 85.6% |
| Tablet | 30,721 | 54.0% |
| No Computing Device | 4,372 | 7.7% |
| Total | 56,842 | 100.0% |
Internet Access in Kansas City
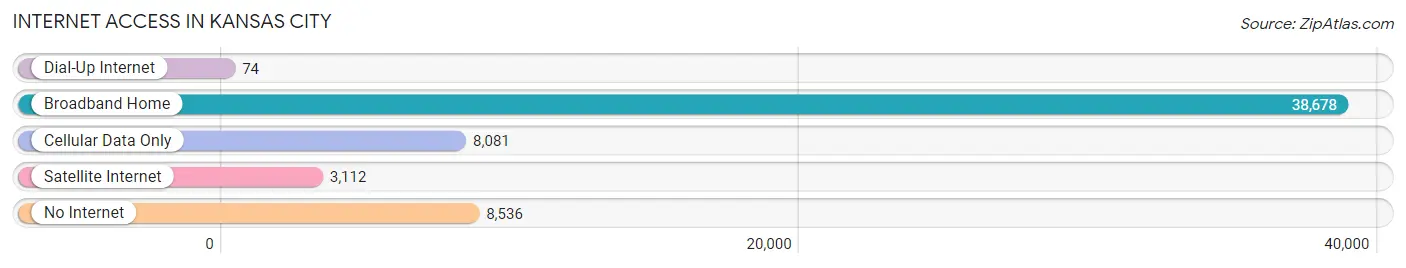
| Internet Type | # Households | % Households |
| Dial-Up Internet | 74 | 0.1% |
| Broadband Home | 38,678 | 68.0% |
| Cellular Data Only | 8,081 | 14.2% |
| Satellite Internet | 3,112 | 5.5% |
| No Internet | 8,536 | 15.0% |
| Total | 56,842 | 100.0% |
Kansas City Summary
Kansas City, KS is a city located in Wyandotte County, Kansas, United States. It is situated along the Missouri River and is part of the Kansas City metropolitan area. As of the 2010 census, the city had a population of 145,786, making it the third-largest city in the state.
History
The area that is now Kansas City, KS was first settled by the Wyandot Native American tribe in the early 1800s. The tribe was relocated to the area from Ohio in 1843, and the city was officially incorporated in 1872.
The city was originally known as Wyandotte City, but was renamed Kansas City in 1886. The city was a major hub for the Union Pacific Railroad, and was the site of the first transcontinental railroad bridge across the Missouri River.
The city experienced rapid growth in the late 19th and early 20th centuries, and was a major center for the meatpacking industry. The city was also a major center for jazz music in the 1920s and 1930s.
Geography
Kansas City, KS is located in Wyandotte County, Kansas, and is part of the Kansas City metropolitan area. The city is situated along the Missouri River, and is bordered by the cities of Kansas City, MO to the east and Bonner Springs to the west.
The city has a total area of 64.3 square miles, of which 62.2 square miles is land and 2.1 square miles is water. The city has a humid continental climate, with hot, humid summers and cold, dry winters.
Economy
Kansas City, KS is a major center for the meatpacking industry, and is home to several large meatpacking plants. The city is also a major center for the automotive industry, and is home to several large automotive parts manufacturers.
The city is also home to several large retail and commercial centers, including the Legends Outlets Kansas City, the Kansas Speedway, and the Village West Shopping Center.
Demographics
As of the 2010 census, the city had a population of 145,786. The racial makeup of the city was 63.3% White, 24.2% African American, 0.7% Native American, 2.2% Asian, 0.1% Pacific Islander, 6.2% from other races, and 3.4% from two or more races. Hispanic or Latino of any race were 13.2% of the population.
The median income for a household in the city was $41,945, and the median income for a family was $50,945. The per capita income for the city was $20,945. About 16.2% of families and 19.3% of the population were below the poverty line, including 28.2% of those under age 18 and 10.2% of those age 65 or over.
Common Questions
What is Per Capita Income in Kansas City?
Per Capita income in Kansas City is $27,034.
What is the Median Family Income in Kansas City?
Median Family Income in Kansas City is $68,316.
What is the Median Household income in Kansas City?
Median Household Income in Kansas City is $56,120.
What is Income or Wage Gap in Kansas City?
Income or Wage Gap in Kansas City is 21.3%.
Women in Kansas City earn 78.7 cents for every dollar earned by a man.
What is Family Income Deficit in Kansas City?
Family Income Deficit in Kansas City is $10,636.
Families that are below poverty line in Kansas City earn $10,636 less on average than the poverty threshold level.
What is Inequality or Gini Index in Kansas City?
Inequality or Gini Index in Kansas City is 0.43.
What is the Total Population of Kansas City?
Total Population of Kansas City is 155,438.
What is the Total Male Population of Kansas City?
Total Male Population of Kansas City is 78,302.
What is the Total Female Population of Kansas City?
Total Female Population of Kansas City is 77,136.
What is the Ratio of Males per 100 Females in Kansas City?
There are 101.51 Males per 100 Females in Kansas City.
What is the Ratio of Females per 100 Males in Kansas City?
There are 98.51 Females per 100 Males in Kansas City.
What is the Median Population Age in Kansas City?
Median Population Age in Kansas City is 34.1 Years.
What is the Average Family Size in Kansas City
Average Family Size in Kansas City is 3.5 People.
What is the Average Household Size in Kansas City
Average Household Size in Kansas City is 2.7 People.
How Large is the Labor Force in Kansas City?
There are 77,241 People in the Labor Forcein in Kansas City.
What is the Percentage of People in the Labor Force in Kansas City?
65.7% of People are in the Labor Force in Kansas City.
What is the Unemployment Rate in Kansas City?
Unemployment Rate in Kansas City is 6.0%.