Victorville, CA Map & Demographics
Victorville Map
Victorville Overview
$24,811
PER CAPITA INCOME
$71,573
AVG FAMILY INCOME
$65,746
AVG HOUSEHOLD INCOME
32.9%
WAGE / INCOME GAP [ % ]
67.1¢/ $1
WAGE / INCOME GAP [ $ ]
$12,117
FAMILY INCOME DEFICIT
0.46
INEQUALITY / GINI INDEX
134,417
TOTAL POPULATION
67,584
MALE POPULATION
66,833
FEMALE POPULATION
101.12
MALES / 100 FEMALES
98.89
FEMALES / 100 MALES
31.8
MEDIAN AGE
4.0
AVG FAMILY SIZE
3.5
AVG HOUSEHOLD SIZE
54,838
LABOR FORCE [ PEOPLE ]
55.9%
PERCENT IN LABOR FORCE
10.3%
UNEMPLOYMENT RATE
Income in Victorville
Income Overview in Victorville
Per Capita Income in Victorville is $24,811, while median incomes of families and households are $71,573 and $65,746 respectively.
| Characteristic | Number | Measure |
| Per Capita Income | 134,417 | $24,811 |
| Median Family Income | 28,942 | $71,573 |
| Mean Family Income | 28,942 | $95,020 |
| Median Household Income | 36,842 | $65,746 |
| Mean Household Income | 36,842 | $87,081 |
| Income Deficit | 28,942 | $12,117 |
| Wage / Income Gap (%) | 134,417 | 32.91% |
| Wage / Income Gap ($) | 134,417 | 67.09¢ per $1 |
| Gini / Inequality Index | 134,417 | 0.46 |
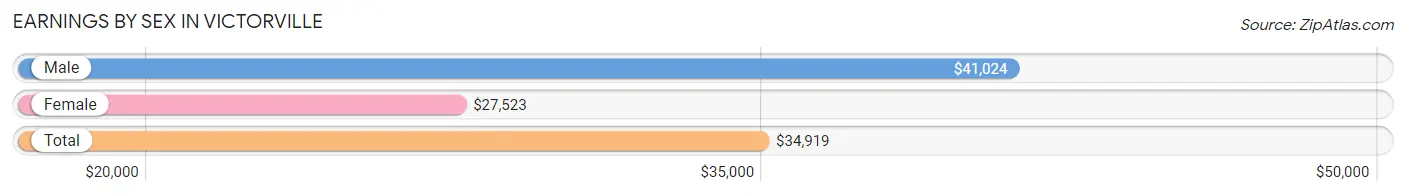
Earnings by Sex in Victorville
Average Earnings in Victorville are $34,919, $41,024 for men and $27,523 for women, a difference of 32.9%.
| Sex | Number | Average Earnings |
| Male | 29,678 (54.2%) | $41,024 |
| Female | 25,108 (45.8%) | $27,523 |
| Total | 54,786 (100.0%) | $34,919 |
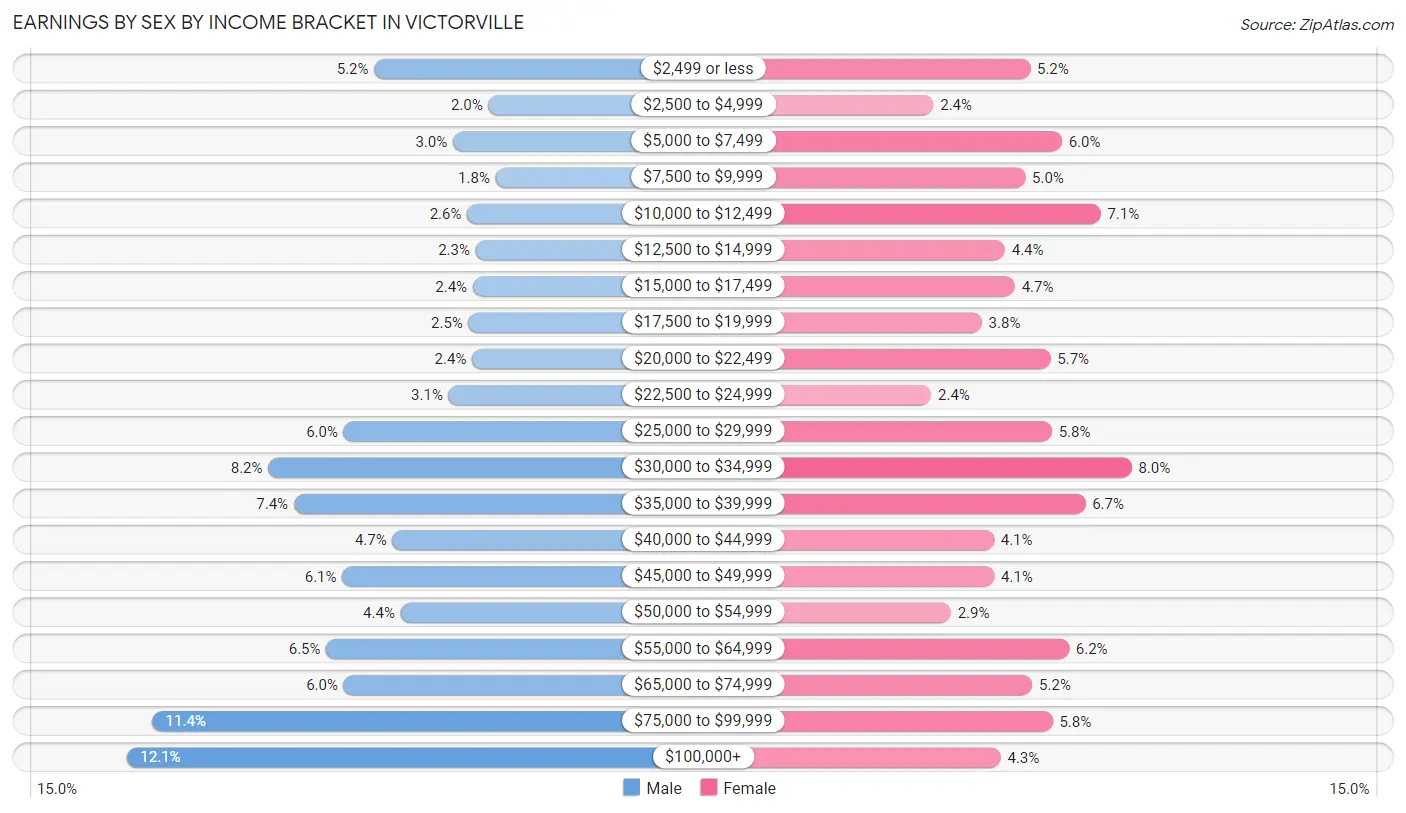
Earnings by Sex by Income Bracket in Victorville
The most common earnings brackets in Victorville are $100,000+ for men (3,595 | 12.1%) and $30,000 to $34,999 for women (2,008 | 8.0%).
| Income | Male | Female |
| $2,499 or less | 1,533 (5.2%) | 1,294 (5.1%) |
| $2,500 to $4,999 | 582 (2.0%) | 611 (2.4%) |
| $5,000 to $7,499 | 879 (3.0%) | 1,517 (6.0%) |
| $7,500 to $9,999 | 522 (1.8%) | 1,258 (5.0%) |
| $10,000 to $12,499 | 760 (2.6%) | 1,791 (7.1%) |
| $12,500 to $14,999 | 689 (2.3%) | 1,114 (4.4%) |
| $15,000 to $17,499 | 713 (2.4%) | 1,185 (4.7%) |
| $17,500 to $19,999 | 749 (2.5%) | 951 (3.8%) |
| $20,000 to $22,499 | 719 (2.4%) | 1,435 (5.7%) |
| $22,500 to $24,999 | 915 (3.1%) | 595 (2.4%) |
| $25,000 to $29,999 | 1,790 (6.0%) | 1,447 (5.8%) |
| $30,000 to $34,999 | 2,420 (8.2%) | 2,008 (8.0%) |
| $35,000 to $39,999 | 2,204 (7.4%) | 1,682 (6.7%) |
| $40,000 to $44,999 | 1,382 (4.7%) | 1,038 (4.1%) |
| $45,000 to $49,999 | 1,800 (6.1%) | 1,040 (4.1%) |
| $50,000 to $54,999 | 1,316 (4.4%) | 734 (2.9%) |
| $55,000 to $64,999 | 1,936 (6.5%) | 1,567 (6.2%) |
| $65,000 to $74,999 | 1,790 (6.0%) | 1,307 (5.2%) |
| $75,000 to $99,999 | 3,384 (11.4%) | 1,450 (5.8%) |
| $100,000+ | 3,595 (12.1%) | 1,084 (4.3%) |
| Total | 29,678 (100.0%) | 25,108 (100.0%) |
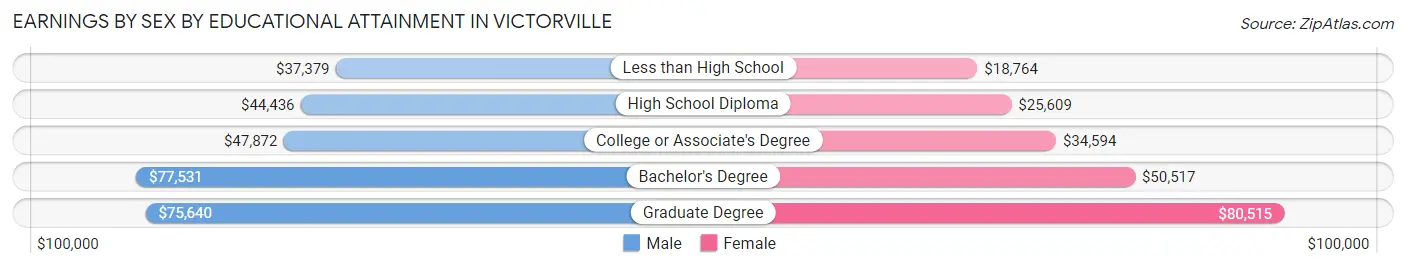
Earnings by Sex by Educational Attainment in Victorville
Average earnings in Victorville are $46,697 for men and $33,206 for women, a difference of 28.9%. Men with an educational attainment of bachelor's degree enjoy the highest average annual earnings of $77,531, while those with less than high school education earn the least with $37,379. Women with an educational attainment of graduate degree earn the most with the average annual earnings of $80,515, while those with less than high school education have the smallest earnings of $18,764.
| Educational Attainment | Male Income | Female Income |
| Less than High School | $37,379 | $18,764 |
| High School Diploma | $44,436 | $25,609 |
| College or Associate's Degree | $47,872 | $34,594 |
| Bachelor's Degree | $77,531 | $50,517 |
| Graduate Degree | $75,640 | $80,515 |
| Total | $46,697 | $33,206 |
Family Income in Victorville
Family Income Brackets in Victorville
According to the Victorville family income data, there are 5,904 families falling into the $50,000 to $74,999 income range, which is the most common income bracket and makes up 20.4% of all families. Conversely, the $10,000 to $14,999 income bracket is the least frequent group with only 868 families (3.0%) belonging to this category.
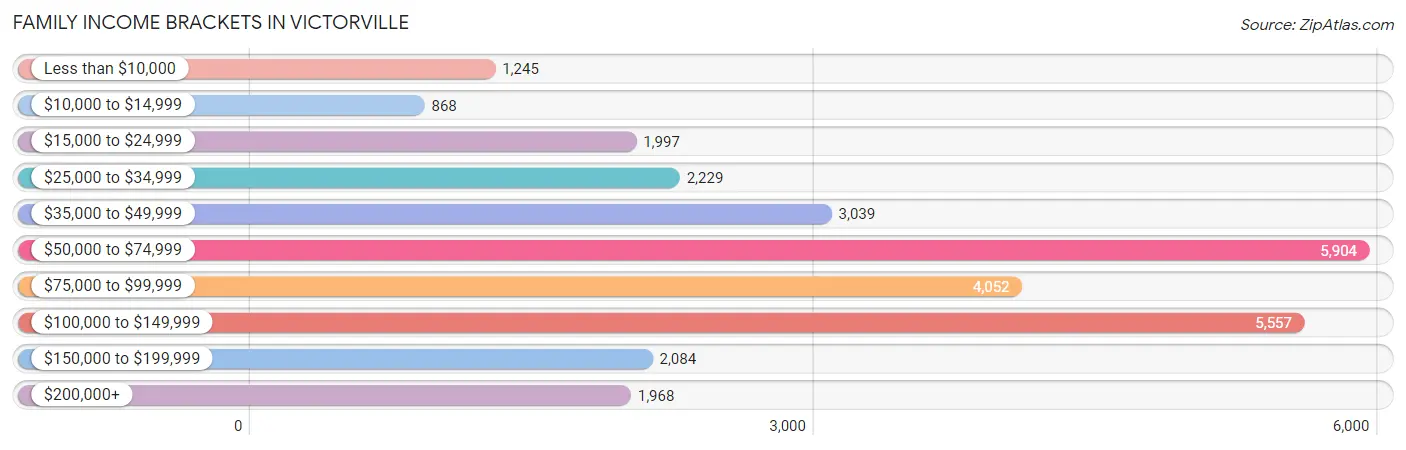
| Income Bracket | # Families | % Families |
| Less than $10,000 | 1,245 | 4.3% |
| $10,000 to $14,999 | 868 | 3.0% |
| $15,000 to $24,999 | 1,997 | 6.9% |
| $25,000 to $34,999 | 2,229 | 7.7% |
| $35,000 to $49,999 | 3,039 | 10.5% |
| $50,000 to $74,999 | 5,904 | 20.4% |
| $75,000 to $99,999 | 4,052 | 14.0% |
| $100,000 to $149,999 | 5,557 | 19.2% |
| $150,000 to $199,999 | 2,084 | 7.2% |
| $200,000+ | 1,968 | 6.8% |
Family Income by Famaliy Size in Victorville
7+ person families (2,293 | 7.9%) account for the highest median family income in Victorville with $94,696 per family, while 2-person families (8,022 | 27.7%) have the highest median income of $29,163 per family member.
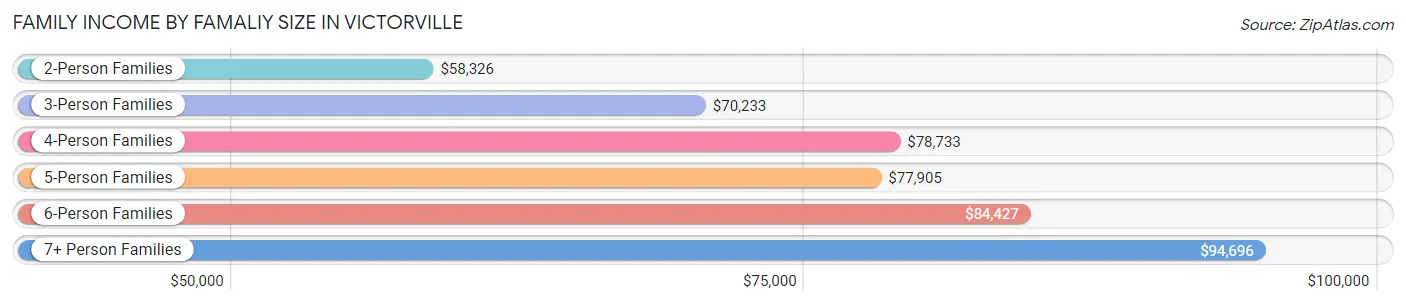
| Income Bracket | # Families | Median Income |
| 2-Person Families | 8,022 (27.7%) | $58,326 |
| 3-Person Families | 6,549 (22.6%) | $70,233 |
| 4-Person Families | 6,101 (21.1%) | $78,733 |
| 5-Person Families | 3,772 (13.0%) | $77,905 |
| 6-Person Families | 2,205 (7.6%) | $84,427 |
| 7+ Person Families | 2,293 (7.9%) | $94,696 |
| Total | 28,942 (100.0%) | $71,573 |
Family Income by Number of Earners in Victorville
The median family income in Victorville is $71,573, with families comprising 3+ earners (4,593) having the highest median family income of $125,836, while families with no earners (4,257) have the lowest median family income of $28,837, accounting for 15.9% and 14.7% of families, respectively.
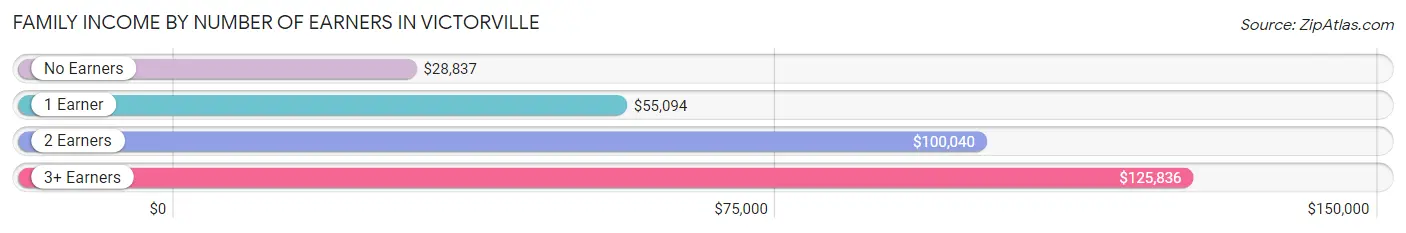
| Number of Earners | # Families | Median Income |
| No Earners | 4,257 (14.7%) | $28,837 |
| 1 Earner | 10,768 (37.2%) | $55,094 |
| 2 Earners | 9,324 (32.2%) | $100,040 |
| 3+ Earners | 4,593 (15.9%) | $125,836 |
| Total | 28,942 (100.0%) | $71,573 |
Household Income in Victorville
Household Income Brackets in Victorville
With 7,037 households falling in the category, the $50,000 to $74,999 income range is the most frequent in Victorville, accounting for 19.1% of all households. In contrast, only 1,511 households (4.1%) fall into the $10,000 to $14,999 income bracket, making it the least populous group.
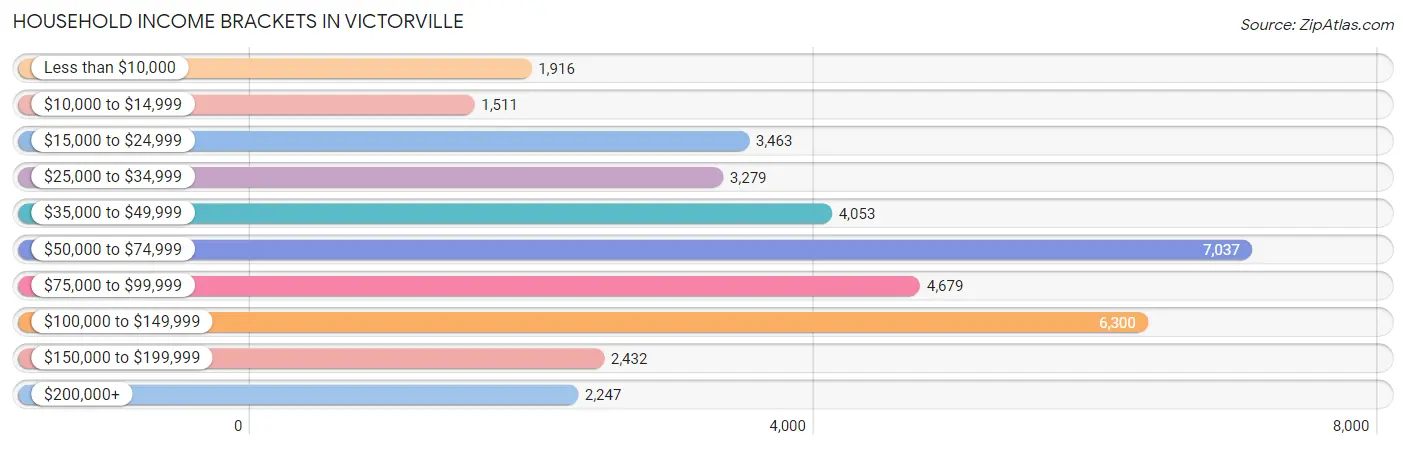
| Income Bracket | # Households | % Households |
| Less than $10,000 | 1,916 | 5.2% |
| $10,000 to $14,999 | 1,511 | 4.1% |
| $15,000 to $24,999 | 3,463 | 9.4% |
| $25,000 to $34,999 | 3,279 | 8.9% |
| $35,000 to $49,999 | 4,053 | 11.0% |
| $50,000 to $74,999 | 7,037 | 19.1% |
| $75,000 to $99,999 | 4,679 | 12.7% |
| $100,000 to $149,999 | 6,300 | 17.1% |
| $150,000 to $199,999 | 2,432 | 6.6% |
| $200,000+ | 2,247 | 6.1% |
Household Income by Householder Age in Victorville
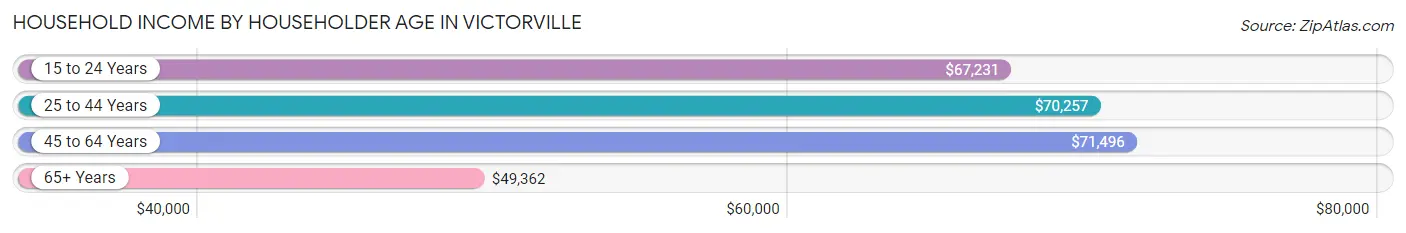
The median household income in Victorville is $65,746, with the highest median household income of $71,496 found in the 45 to 64 years age bracket for the primary householder. A total of 13,534 households (36.7%) fall into this category. Meanwhile, the 65+ years age bracket for the primary householder has the lowest median household income of $49,362, with 7,766 households (21.1%) in this group.
| Income Bracket | # Households | Median Income |
| 15 to 24 Years | 644 (1.8%) | $67,231 |
| 25 to 44 Years | 14,898 (40.4%) | $70,257 |
| 45 to 64 Years | 13,534 (36.7%) | $71,496 |
| 65+ Years | 7,766 (21.1%) | $49,362 |
| Total | 36,842 (100.0%) | $65,746 |
Poverty in Victorville
Income Below Poverty by Sex and Age in Victorville
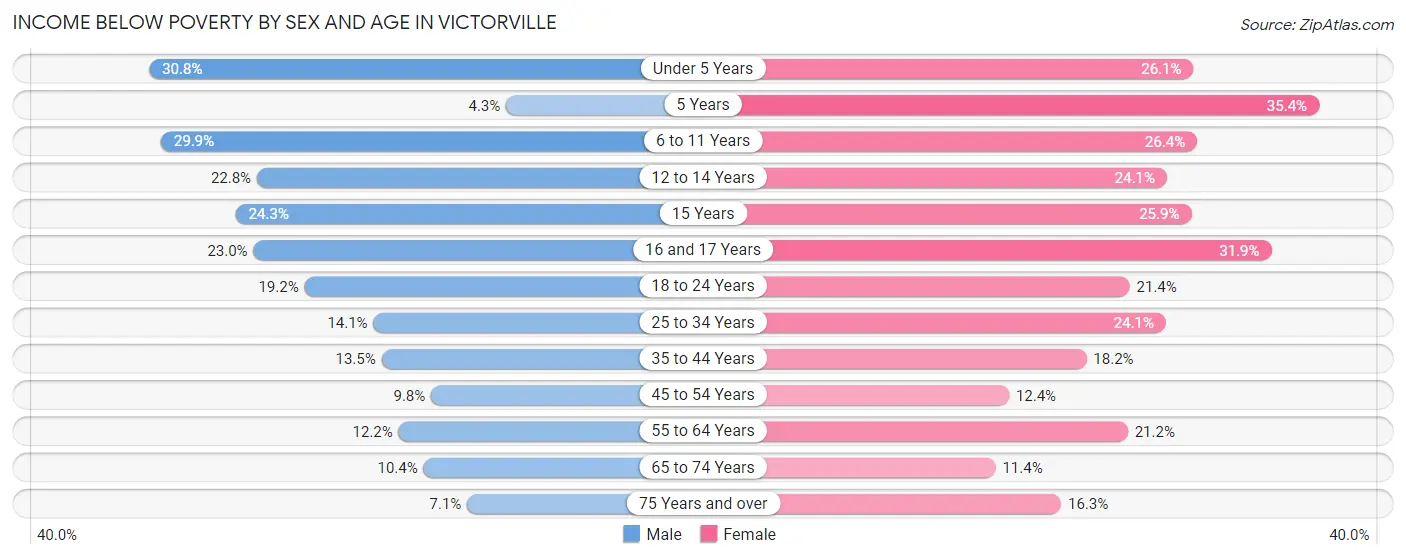
With 17.2% poverty level for males and 21.0% for females among the residents of Victorville, under 5 year old males and 5 year old females are the most vulnerable to poverty, with 1,353 males (30.8%) and 255 females (35.4%) in their respective age groups living below the poverty level.
| Age Bracket | Male | Female |
| Under 5 Years | 1,353 (30.8%) | 1,164 (26.1%) |
| 5 Years | 56 (4.3%) | 255 (35.4%) |
| 6 to 11 Years | 2,082 (29.9%) | 1,855 (26.4%) |
| 12 to 14 Years | 899 (22.8%) | 897 (24.1%) |
| 15 Years | 239 (24.3%) | 213 (25.9%) |
| 16 and 17 Years | 509 (23.0%) | 676 (31.9%) |
| 18 to 24 Years | 1,440 (19.2%) | 1,357 (21.4%) |
| 25 to 34 Years | 1,166 (14.1%) | 2,367 (24.1%) |
| 35 to 44 Years | 1,239 (13.5%) | 1,611 (18.2%) |
| 45 to 54 Years | 624 (9.8%) | 958 (12.4%) |
| 55 to 64 Years | 723 (12.2%) | 1,390 (21.2%) |
| 65 to 74 Years | 408 (10.4%) | 462 (11.4%) |
| 75 Years and over | 155 (7.1%) | 520 (16.3%) |
| Total | 10,893 (17.2%) | 13,725 (21.0%) |
Income Above Poverty by Sex and Age in Victorville
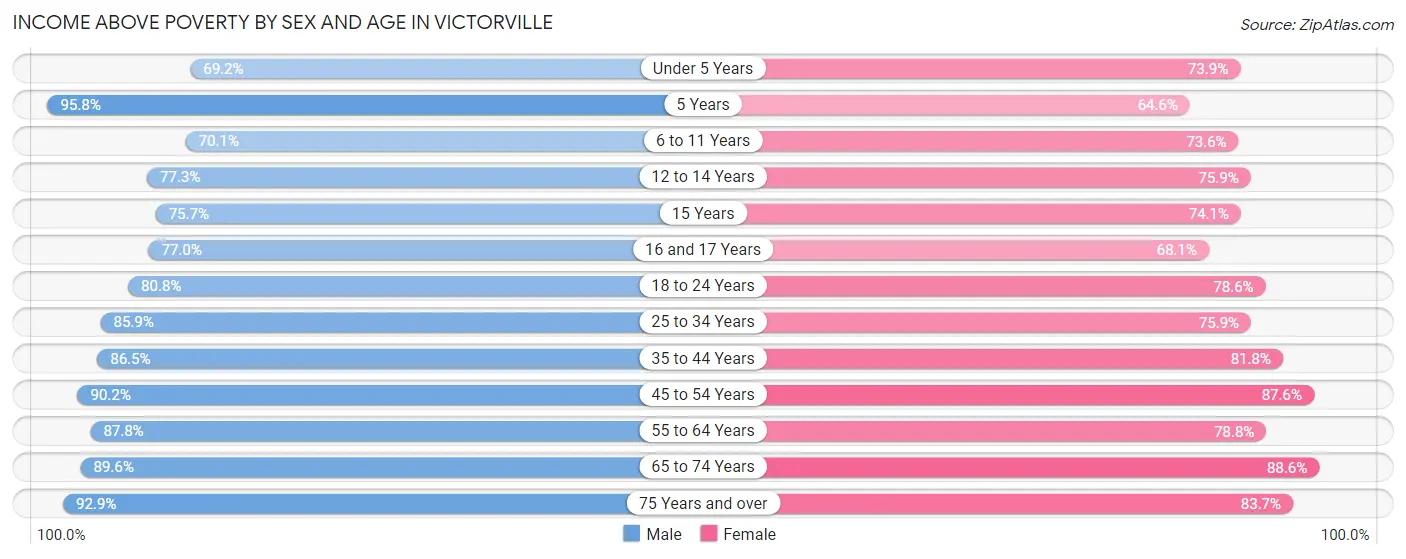
According to the poverty statistics in Victorville, males aged 5 years and females aged 65 to 74 years are the age groups that are most secure financially, with 95.8% of males and 88.6% of females in these age groups living above the poverty line.
| Age Bracket | Male | Female |
| Under 5 Years | 3,046 (69.2%) | 3,295 (73.9%) |
| 5 Years | 1,262 (95.8%) | 465 (64.6%) |
| 6 to 11 Years | 4,887 (70.1%) | 5,177 (73.6%) |
| 12 to 14 Years | 3,052 (77.2%) | 2,821 (75.9%) |
| 15 Years | 743 (75.7%) | 608 (74.1%) |
| 16 and 17 Years | 1,703 (77.0%) | 1,444 (68.1%) |
| 18 to 24 Years | 6,052 (80.8%) | 4,993 (78.6%) |
| 25 to 34 Years | 7,106 (85.9%) | 7,471 (75.9%) |
| 35 to 44 Years | 7,942 (86.5%) | 7,259 (81.8%) |
| 45 to 54 Years | 5,731 (90.2%) | 6,763 (87.6%) |
| 55 to 64 Years | 5,188 (87.8%) | 5,156 (78.8%) |
| 65 to 74 Years | 3,523 (89.6%) | 3,587 (88.6%) |
| 75 Years and over | 2,017 (92.9%) | 2,674 (83.7%) |
| Total | 52,252 (82.8%) | 51,713 (79.0%) |
Income Below Poverty Among Married-Couple Families in Victorville
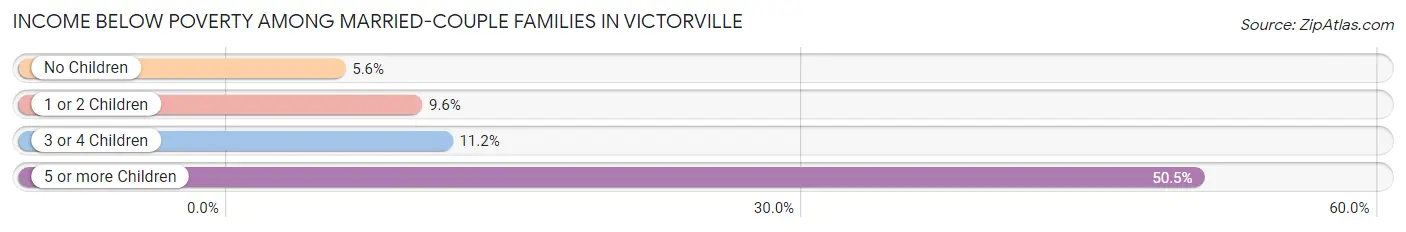
The poverty statistics for married-couple families in Victorville show that 9.3% or 1,698 of the total 18,223 families live below the poverty line. Families with 5 or more children have the highest poverty rate of 50.5%, comprising of 267 families. On the other hand, families with no children have the lowest poverty rate of 5.6%, which includes 437 families.
| Children | Above Poverty | Below Poverty |
| No Children | 7,363 (94.4%) | 437 (5.6%) |
| 1 or 2 Children | 6,465 (90.4%) | 687 (9.6%) |
| 3 or 4 Children | 2,435 (88.8%) | 307 (11.2%) |
| 5 or more Children | 262 (49.5%) | 267 (50.5%) |
| Total | 16,525 (90.7%) | 1,698 (9.3%) |
Income Below Poverty Among Single-Parent Households in Victorville
According to the poverty data in Victorville, 10.1% or 288 single-father households and 31.5% or 2,479 single-mother households are living below the poverty line. Among single-father households, those with 1 or 2 children have the highest poverty rate, with 150 households (14.6%) experiencing poverty. Likewise, among single-mother households, those with 3 or 4 children have the highest poverty rate, with 867 households (64.8%) falling below the poverty line.
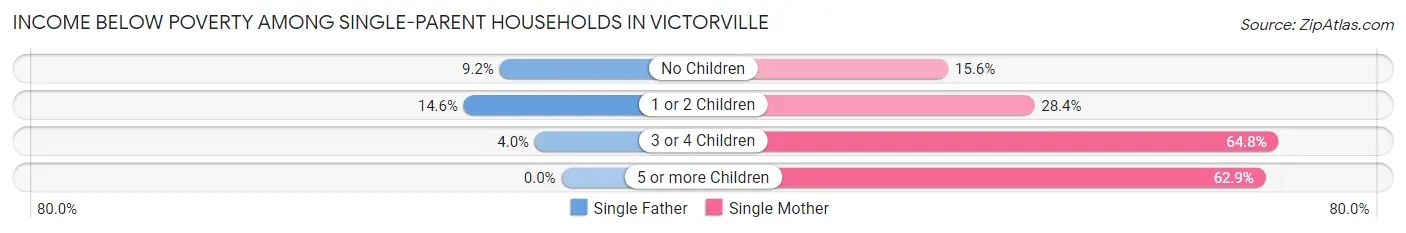
| Children | Single Father | Single Mother |
| No Children | 115 (9.2%) | 401 (15.5%) |
| 1 or 2 Children | 150 (14.6%) | 1,045 (28.4%) |
| 3 or 4 Children | 23 (4.0%) | 867 (64.8%) |
| 5 or more Children | 0 (0.0%) | 166 (62.9%) |
| Total | 288 (10.1%) | 2,479 (31.5%) |
Income Below Poverty Among Married-Couple vs Single-Parent Households in Victorville
The poverty data for Victorville shows that 1,698 of the married-couple family households (9.3%) and 2,767 of the single-parent households (25.8%) are living below the poverty level. Within the married-couple family households, those with 5 or more children have the highest poverty rate, with 267 households (50.5%) falling below the poverty line. Among the single-parent households, those with 5 or more children have the highest poverty rate, with 166 household (62.9%) living below poverty.
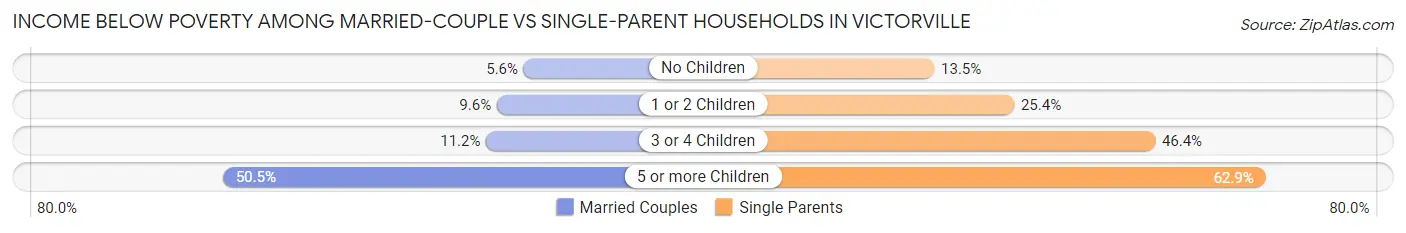
| Children | Married-Couple Families | Single-Parent Households |
| No Children | 437 (5.6%) | 516 (13.5%) |
| 1 or 2 Children | 687 (9.6%) | 1,195 (25.4%) |
| 3 or 4 Children | 307 (11.2%) | 890 (46.4%) |
| 5 or more Children | 267 (50.5%) | 166 (62.9%) |
| Total | 1,698 (9.3%) | 2,767 (25.8%) |
Race in Victorville
The most populous races in Victorville are Hispanic or Latino (74,460 | 55.4%), White / Caucasian (56,549 | 42.1%), and Two or more Races (25,403 | 18.9%).
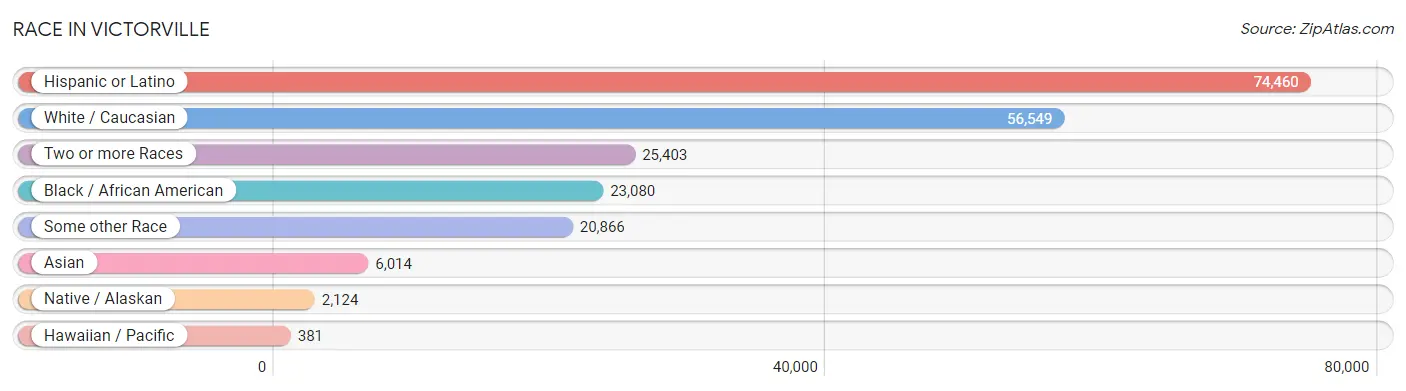
| Race | # Population | % Population |
| Asian | 6,014 | 4.5% |
| Black / African American | 23,080 | 17.2% |
| Hawaiian / Pacific | 381 | 0.3% |
| Hispanic or Latino | 74,460 | 55.4% |
| Native / Alaskan | 2,124 | 1.6% |
| White / Caucasian | 56,549 | 42.1% |
| Two or more Races | 25,403 | 18.9% |
| Some other Race | 20,866 | 15.5% |
| Total | 134,417 | 100.0% |
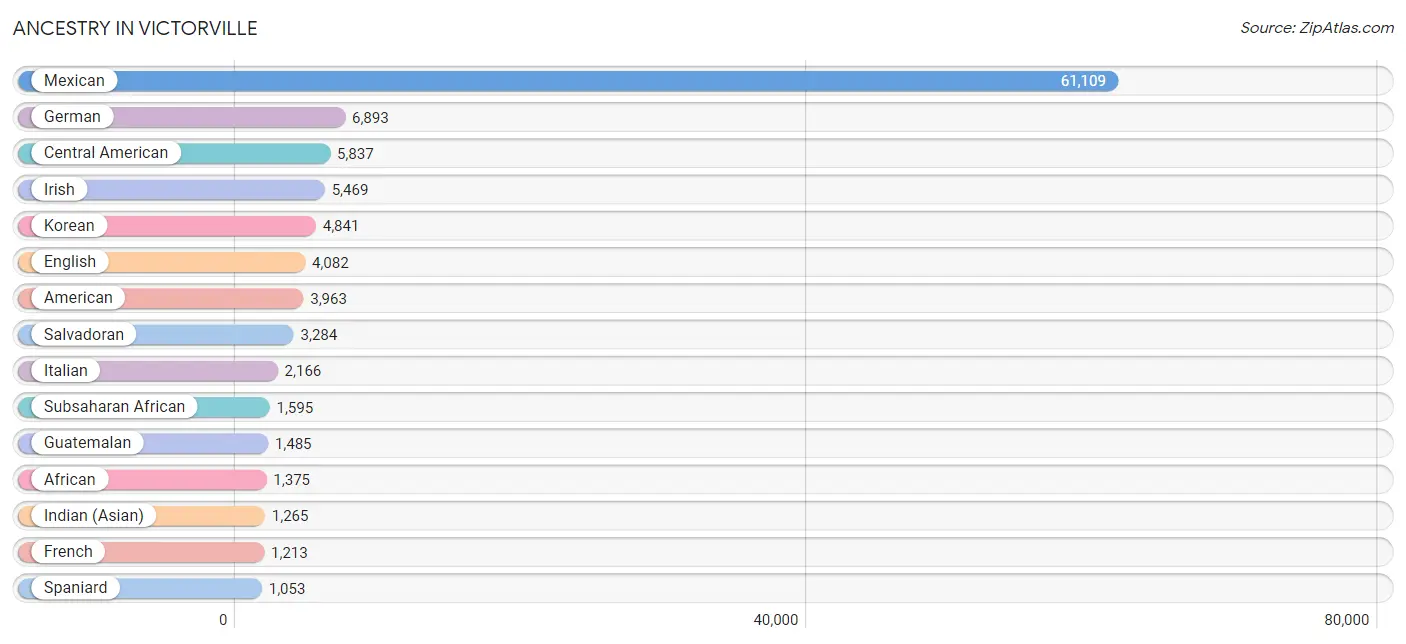
Ancestry in Victorville
The most populous ancestries reported in Victorville are Mexican (61,109 | 45.5%), German (6,893 | 5.1%), Central American (5,837 | 4.3%), Irish (5,469 | 4.1%), and Korean (4,841 | 3.6%), together accounting for 62.6% of all Victorville residents.
| Ancestry | # Population | % Population |
| African | 1,375 | 1.0% |
| Alaskan Athabascan | 12 | 0.0% |
| American | 3,963 | 2.9% |
| Apache | 48 | 0.0% |
| Arab | 907 | 0.7% |
| Argentinean | 21 | 0.0% |
| Armenian | 100 | 0.1% |
| Australian | 94 | 0.1% |
| Austrian | 36 | 0.0% |
| Basque | 15 | 0.0% |
| Belgian | 36 | 0.0% |
| Belizean | 36 | 0.0% |
| Bhutanese | 777 | 0.6% |
| Blackfeet | 108 | 0.1% |
| Bolivian | 48 | 0.0% |
| Brazilian | 16 | 0.0% |
| British | 276 | 0.2% |
| Burmese | 737 | 0.5% |
| Canadian | 16 | 0.0% |
| Central American | 5,837 | 4.3% |
| Central American Indian | 400 | 0.3% |
| Cherokee | 235 | 0.2% |
| Chickasaw | 9 | 0.0% |
| Chippewa | 20 | 0.0% |
| Choctaw | 69 | 0.1% |
| Colombian | 155 | 0.1% |
| Costa Rican | 389 | 0.3% |
| Creek | 8 | 0.0% |
| Croatian | 41 | 0.0% |
| Cuban | 407 | 0.3% |
| Czech | 22 | 0.0% |
| Czechoslovakian | 63 | 0.1% |
| Danish | 51 | 0.0% |
| Delaware | 9 | 0.0% |
| Dutch | 662 | 0.5% |
| Eastern European | 71 | 0.1% |
| Ecuadorian | 488 | 0.4% |
| Egyptian | 199 | 0.2% |
| English | 4,082 | 3.0% |
| European | 586 | 0.4% |
| Filipino | 44 | 0.0% |
| French | 1,213 | 0.9% |
| French American Indian | 8 | 0.0% |
| French Canadian | 272 | 0.2% |
| German | 6,893 | 5.1% |
| Ghanaian | 47 | 0.0% |
| Greek | 38 | 0.0% |
| Guamanian / Chamorro | 166 | 0.1% |
| Guatemalan | 1,485 | 1.1% |
| Haitian | 172 | 0.1% |
| Honduran | 368 | 0.3% |
| Hopi | 17 | 0.0% |
| Hungarian | 188 | 0.1% |
| Indian (Asian) | 1,265 | 0.9% |
| Inupiat | 24 | 0.0% |
| Iranian | 62 | 0.1% |
| Irish | 5,469 | 4.1% |
| Iroquois | 31 | 0.0% |
| Italian | 2,166 | 1.6% |
| Jamaican | 168 | 0.1% |
| Japanese | 348 | 0.3% |
| Jordanian | 23 | 0.0% |
| Korean | 4,841 | 3.6% |
| Laotian | 46 | 0.0% |
| Lebanese | 222 | 0.2% |
| Lithuanian | 119 | 0.1% |
| Malaysian | 8 | 0.0% |
| Mexican | 61,109 | 45.5% |
| Mexican American Indian | 393 | 0.3% |
| Moroccan | 59 | 0.0% |
| Native Hawaiian | 729 | 0.5% |
| Navajo | 515 | 0.4% |
| Nicaraguan | 207 | 0.2% |
| Nigerian | 92 | 0.1% |
| Northern European | 86 | 0.1% |
| Norwegian | 915 | 0.7% |
| Osage | 14 | 0.0% |
| Pakistani | 407 | 0.3% |
| Panamanian | 83 | 0.1% |
| Peruvian | 224 | 0.2% |
| Pima | 21 | 0.0% |
| Polish | 733 | 0.5% |
| Portuguese | 279 | 0.2% |
| Potawatomi | 30 | 0.0% |
| Pueblo | 75 | 0.1% |
| Puerto Rican | 912 | 0.7% |
| Puget Sound Salish | 8 | 0.0% |
| Romanian | 9 | 0.0% |
| Russian | 327 | 0.2% |
| Salvadoran | 3,284 | 2.4% |
| Samoan | 185 | 0.1% |
| Scandinavian | 142 | 0.1% |
| Scotch-Irish | 142 | 0.1% |
| Scottish | 485 | 0.4% |
| Seminole | 59 | 0.0% |
| Sioux | 44 | 0.0% |
| Slovak | 48 | 0.0% |
| Slovene | 12 | 0.0% |
| South American | 972 | 0.7% |
| Spaniard | 1,053 | 0.8% |
| Spanish | 403 | 0.3% |
| Sri Lankan | 369 | 0.3% |
| Subsaharan African | 1,595 | 1.2% |
| Sudanese | 30 | 0.0% |
| Swedish | 356 | 0.3% |
| Swiss | 80 | 0.1% |
| Syrian | 164 | 0.1% |
| Thai | 311 | 0.2% |
| Tlingit-Haida | 33 | 0.0% |
| Tohono O'Odham | 9 | 0.0% |
| Ukrainian | 95 | 0.1% |
| Uruguayan | 19 | 0.0% |
| Ute | 7 | 0.0% |
| Venezuelan | 17 | 0.0% |
| Welsh | 113 | 0.1% |
| Yaqui | 54 | 0.0% |
| Yugoslavian | 59 | 0.0% |
| Yuman | 96 | 0.1% | View All 118 Rows |
Immigrants in Victorville
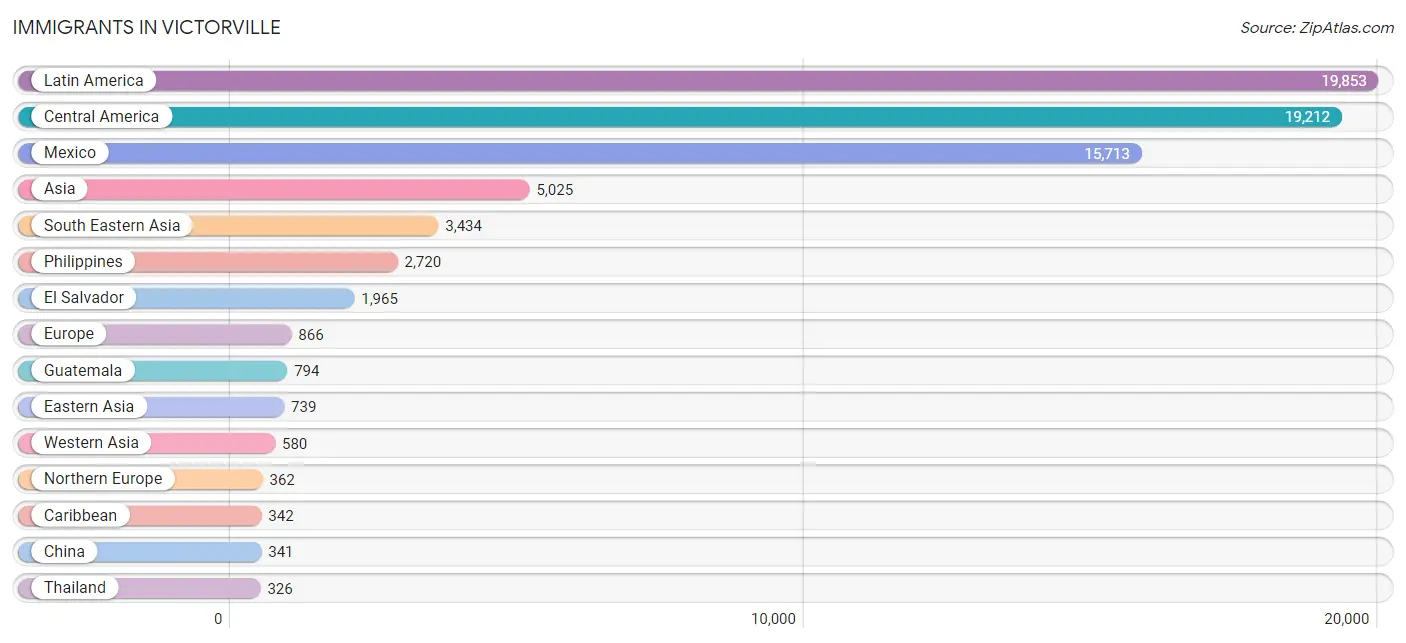
The most numerous immigrant groups reported in Victorville came from Latin America (19,853 | 14.8%), Central America (19,212 | 14.3%), Mexico (15,713 | 11.7%), Asia (5,025 | 3.7%), and South Eastern Asia (3,434 | 2.5%), together accounting for 47.0% of all Victorville residents.
| Immigration Origin | # Population | % Population |
| Africa | 276 | 0.2% |
| Argentina | 21 | 0.0% |
| Armenia | 16 | 0.0% |
| Asia | 5,025 | 3.7% |
| Australia | 25 | 0.0% |
| Azores | 23 | 0.0% |
| Belize | 25 | 0.0% |
| Bolivia | 24 | 0.0% |
| Brazil | 16 | 0.0% |
| Cambodia | 107 | 0.1% |
| Canada | 35 | 0.0% |
| Caribbean | 342 | 0.3% |
| Central America | 19,212 | 14.3% |
| China | 341 | 0.3% |
| Colombia | 59 | 0.0% |
| Costa Rica | 175 | 0.1% |
| Cuba | 58 | 0.0% |
| Dominican Republic | 10 | 0.0% |
| Eastern Africa | 21 | 0.0% |
| Eastern Asia | 739 | 0.5% |
| Eastern Europe | 143 | 0.1% |
| Ecuador | 11 | 0.0% |
| Egypt | 113 | 0.1% |
| El Salvador | 1,965 | 1.5% |
| England | 305 | 0.2% |
| Europe | 866 | 0.6% |
| Germany | 193 | 0.1% |
| Ghana | 6 | 0.0% |
| Guatemala | 794 | 0.6% |
| Guyana | 38 | 0.0% |
| Haiti | 167 | 0.1% |
| Honduras | 270 | 0.2% |
| Hong Kong | 42 | 0.0% |
| India | 188 | 0.1% |
| Indonesia | 88 | 0.1% |
| Iran | 65 | 0.1% |
| Iraq | 51 | 0.0% |
| Israel | 20 | 0.0% |
| Italy | 47 | 0.0% |
| Jamaica | 107 | 0.1% |
| Japan | 112 | 0.1% |
| Jordan | 68 | 0.1% |
| Korea | 286 | 0.2% |
| Laos | 8 | 0.0% |
| Latin America | 19,853 | 14.8% |
| Lebanon | 50 | 0.0% |
| Mexico | 15,713 | 11.7% |
| Morocco | 112 | 0.1% |
| Netherlands | 10 | 0.0% |
| Nicaragua | 156 | 0.1% |
| Nigeria | 15 | 0.0% |
| Northern Africa | 225 | 0.2% |
| Northern Europe | 362 | 0.3% |
| Oceania | 25 | 0.0% |
| Pakistan | 9 | 0.0% |
| Panama | 114 | 0.1% |
| Peru | 109 | 0.1% |
| Philippines | 2,720 | 2.0% |
| Portugal | 38 | 0.0% |
| Russia | 82 | 0.1% |
| Saudi Arabia | 61 | 0.1% |
| Somalia | 8 | 0.0% |
| South Africa | 9 | 0.0% |
| South America | 299 | 0.2% |
| South Central Asia | 272 | 0.2% |
| South Eastern Asia | 3,434 | 2.5% |
| Southern Europe | 102 | 0.1% |
| Spain | 17 | 0.0% |
| Sri Lanka | 10 | 0.0% |
| Syria | 284 | 0.2% |
| Taiwan | 32 | 0.0% |
| Thailand | 326 | 0.2% |
| Ukraine | 56 | 0.0% |
| Venezuela | 21 | 0.0% |
| Vietnam | 185 | 0.1% |
| Western Africa | 21 | 0.0% |
| Western Asia | 580 | 0.4% |
| Western Europe | 203 | 0.2% |
| Zimbabwe | 13 | 0.0% | View All 79 Rows |
Sex and Age in Victorville
Sex and Age in Victorville
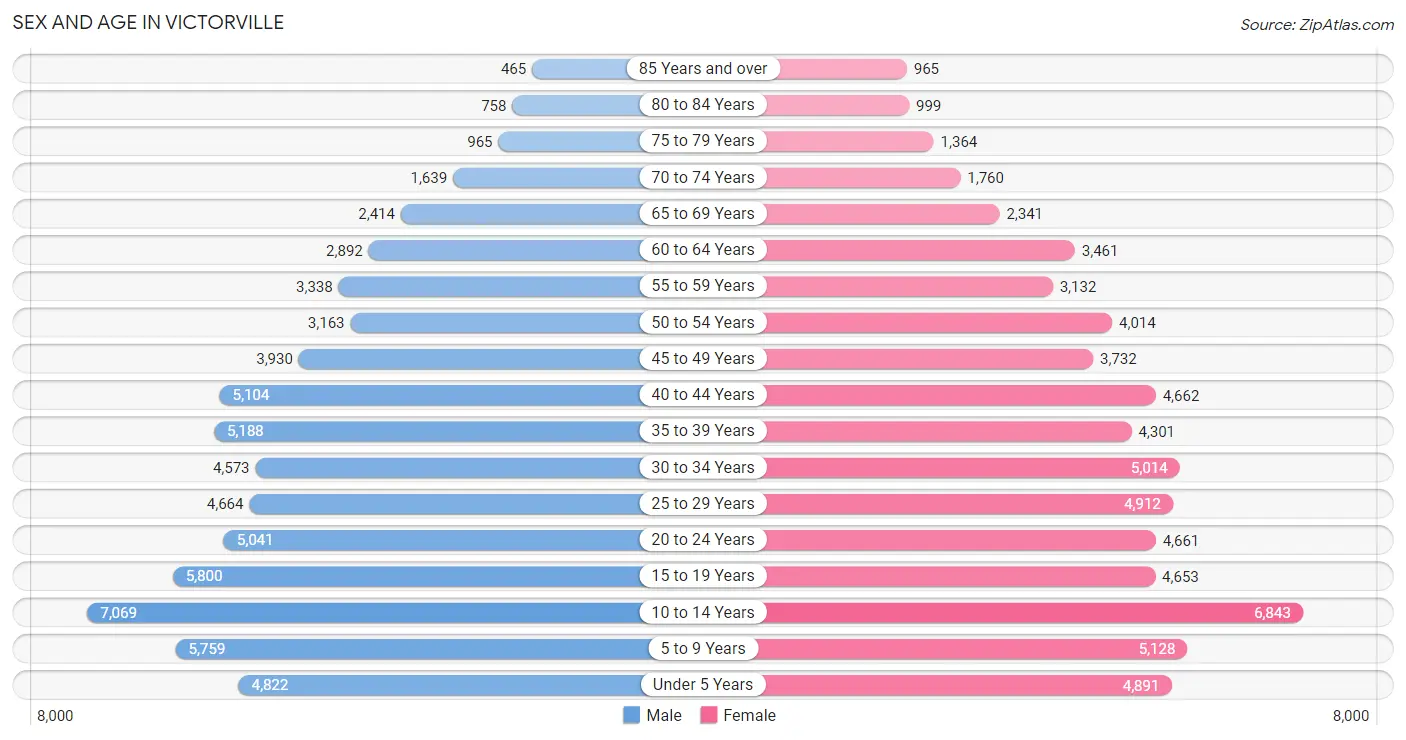
The most populous age groups in Victorville are 10 to 14 Years (7,069 | 10.5%) for men and 10 to 14 Years (6,843 | 10.2%) for women.
| Age Bracket | Male | Female |
| Under 5 Years | 4,822 (7.1%) | 4,891 (7.3%) |
| 5 to 9 Years | 5,759 (8.5%) | 5,128 (7.7%) |
| 10 to 14 Years | 7,069 (10.5%) | 6,843 (10.2%) |
| 15 to 19 Years | 5,800 (8.6%) | 4,653 (7.0%) |
| 20 to 24 Years | 5,041 (7.5%) | 4,661 (7.0%) |
| 25 to 29 Years | 4,664 (6.9%) | 4,912 (7.3%) |
| 30 to 34 Years | 4,573 (6.8%) | 5,014 (7.5%) |
| 35 to 39 Years | 5,188 (7.7%) | 4,301 (6.4%) |
| 40 to 44 Years | 5,104 (7.5%) | 4,662 (7.0%) |
| 45 to 49 Years | 3,930 (5.8%) | 3,732 (5.6%) |
| 50 to 54 Years | 3,163 (4.7%) | 4,014 (6.0%) |
| 55 to 59 Years | 3,338 (4.9%) | 3,132 (4.7%) |
| 60 to 64 Years | 2,892 (4.3%) | 3,461 (5.2%) |
| 65 to 69 Years | 2,414 (3.6%) | 2,341 (3.5%) |
| 70 to 74 Years | 1,639 (2.4%) | 1,760 (2.6%) |
| 75 to 79 Years | 965 (1.4%) | 1,364 (2.0%) |
| 80 to 84 Years | 758 (1.1%) | 999 (1.5%) |
| 85 Years and over | 465 (0.7%) | 965 (1.4%) |
| Total | 67,584 (100.0%) | 66,833 (100.0%) |
Families and Households in Victorville
Median Family Size in Victorville
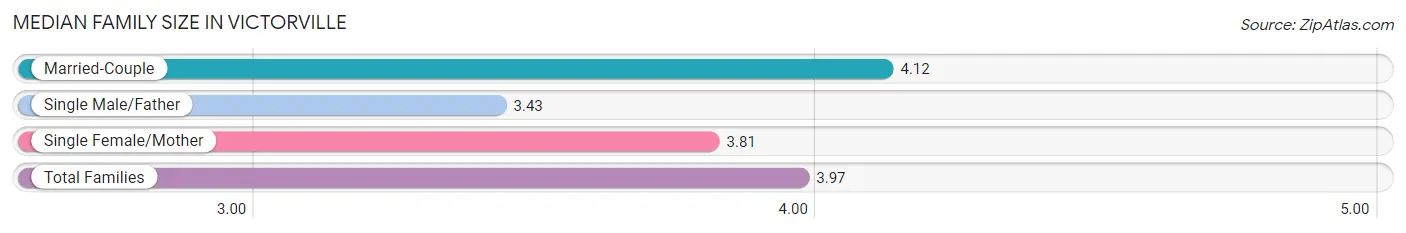
The median family size in Victorville is 3.97 persons per family, with married-couple families (18,223 | 63.0%) accounting for the largest median family size of 4.12 persons per family. On the other hand, single male/father families (2,860 | 9.9%) represent the smallest median family size with 3.43 persons per family.
| Family Type | # Families | Family Size |
| Married-Couple | 18,223 (63.0%) | 4.12 |
| Single Male/Father | 2,860 (9.9%) | 3.43 |
| Single Female/Mother | 7,859 (27.2%) | 3.81 |
| Total Families | 28,942 (100.0%) | 3.97 |
Median Household Size in Victorville
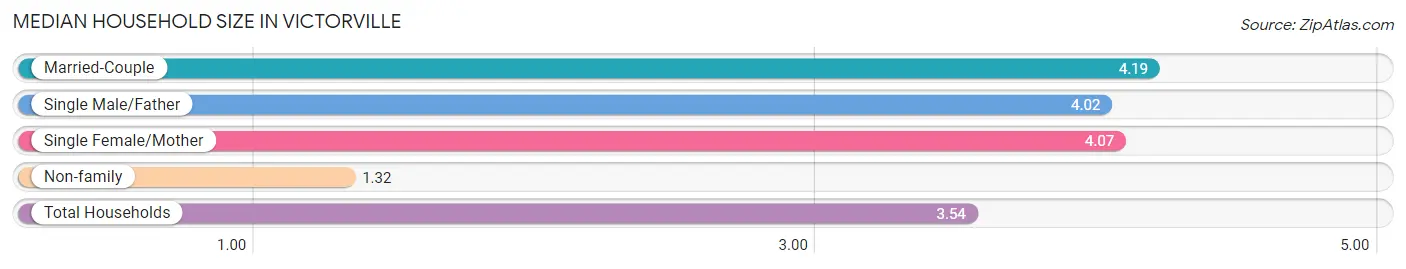
The median household size in Victorville is 3.54 persons per household, with married-couple households (18,223 | 49.5%) accounting for the largest median household size of 4.19 persons per household. non-family households (7,900 | 21.4%) represent the smallest median household size with 1.32 persons per household.
| Household Type | # Households | Household Size |
| Married-Couple | 18,223 (49.5%) | 4.19 |
| Single Male/Father | 2,860 (7.8%) | 4.02 |
| Single Female/Mother | 7,859 (21.3%) | 4.07 |
| Non-family | 7,900 (21.4%) | 1.32 |
| Total Households | 36,842 (100.0%) | 3.54 |
Household Size by Marriage Status in Victorville
Out of a total of 36,842 households in Victorville, 28,942 (78.6%) are family households, while 7,900 (21.4%) are nonfamily households. The most numerous type of family households are 2-person households, comprising 7,067, and the most common type of nonfamily households are 1-person households, comprising 6,401.
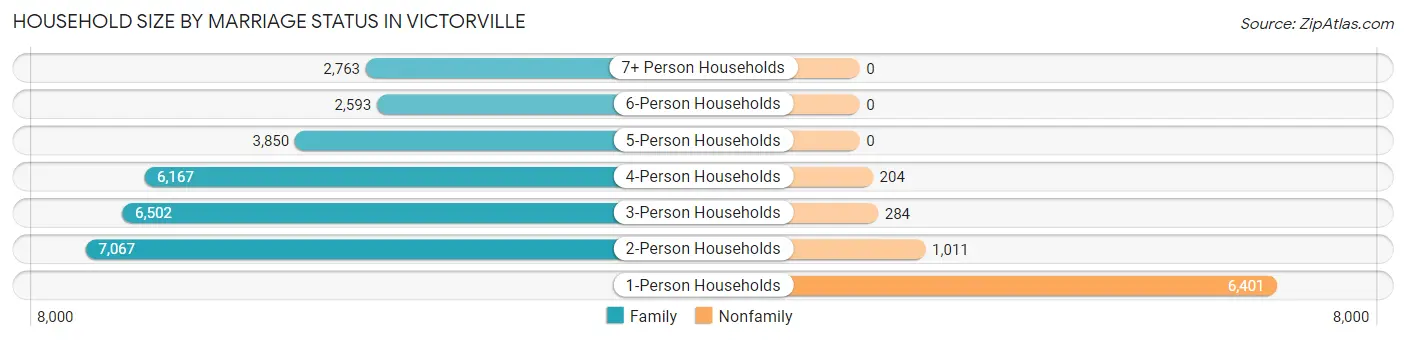
| Household Size | Family Households | Nonfamily Households |
| 1-Person Households | - | 6,401 (17.4%) |
| 2-Person Households | 7,067 (19.2%) | 1,011 (2.7%) |
| 3-Person Households | 6,502 (17.6%) | 284 (0.8%) |
| 4-Person Households | 6,167 (16.7%) | 204 (0.5%) |
| 5-Person Households | 3,850 (10.4%) | 0 (0.0%) |
| 6-Person Households | 2,593 (7.0%) | 0 (0.0%) |
| 7+ Person Households | 2,763 (7.5%) | 0 (0.0%) |
| Total | 28,942 (78.6%) | 7,900 (21.4%) |
Female Fertility in Victorville
Fertility by Age in Victorville
Average fertility rate in Victorville is 76.0 births per 1,000 women. Women in the age bracket of 20 to 34 years have the highest fertility rate with 107.0 births per 1,000 women. Women in the age bracket of 20 to 34 years acount for 62.7% of all women with births.
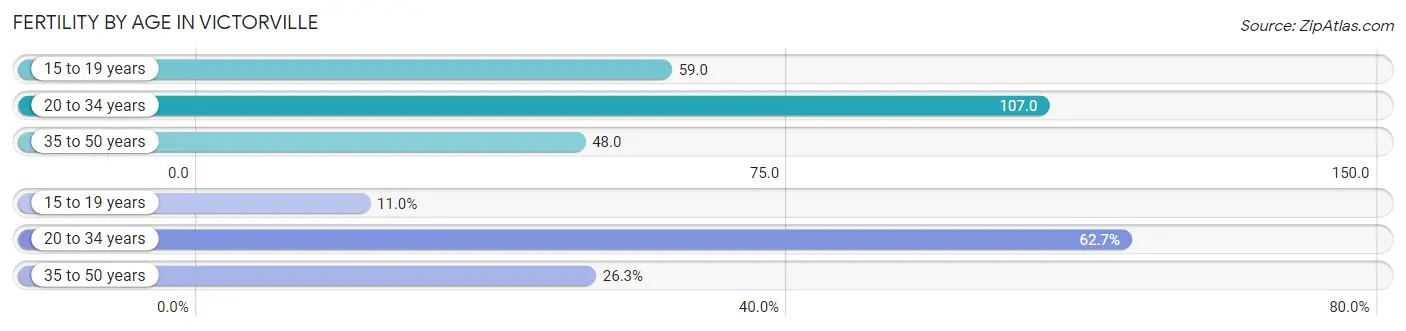
| Age Bracket | Women with Births | Births / 1,000 Women |
| 15 to 19 years | 273 (11.0%) | 59.0 |
| 20 to 34 years | 1,555 (62.7%) | 107.0 |
| 35 to 50 years | 653 (26.3%) | 48.0 |
| Total | 2,481 (100.0%) | 76.0 |
Fertility by Age by Marriage Status in Victorville
53.6% of women with births (2,481) in Victorville are married. The highest percentage of unmarried women with births falls into 15 to 19 years age bracket with 92.3% of them unmarried at the time of birth, while the lowest percentage of unmarried women with births belong to 35 to 50 years age bracket with 19.5% of them unmarried.
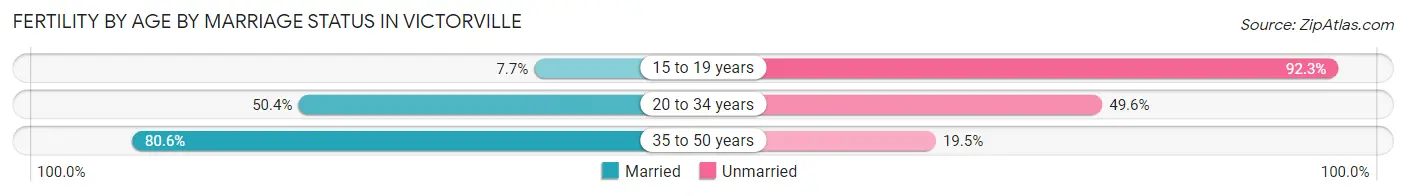
| Age Bracket | Married | Unmarried |
| 15 to 19 years | 21 (7.7%) | 252 (92.3%) |
| 20 to 34 years | 784 (50.4%) | 771 (49.6%) |
| 35 to 50 years | 526 (80.5%) | 127 (19.5%) |
| Total | 1,330 (53.6%) | 1,151 (46.4%) |
Fertility by Education in Victorville
Average fertility rate in Victorville is 76.0 births per 1,000 women. Women with the education attainment of college or associate's degree have the highest fertility rate of 90.0 births per 1,000 women, while women with the education attainment of graduate degree have the lowest fertility at 11.0 births per 1,000 women. Women with the education attainment of college or associate's degree represent 45.1% of all women with births.
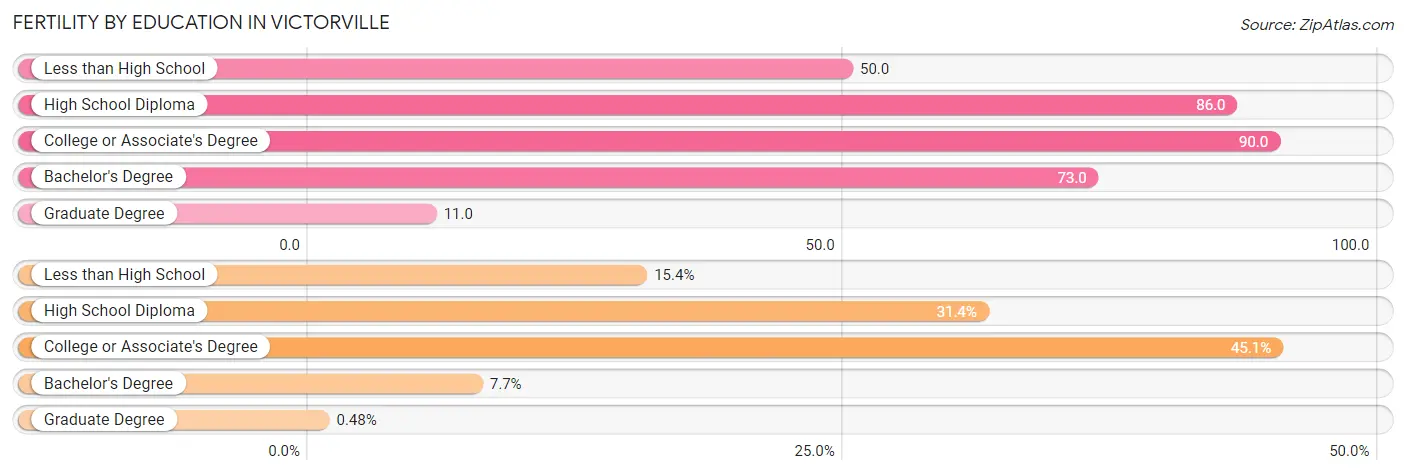
| Educational Attainment | Women with Births | Births / 1,000 Women |
| Less than High School | 381 (15.4%) | 50.0 |
| High School Diploma | 778 (31.4%) | 86.0 |
| College or Associate's Degree | 1,120 (45.1%) | 90.0 |
| Bachelor's Degree | 190 (7.7%) | 73.0 |
| Graduate Degree | 12 (0.5%) | 11.0 |
| Total | 2,481 (100.0%) | 76.0 |
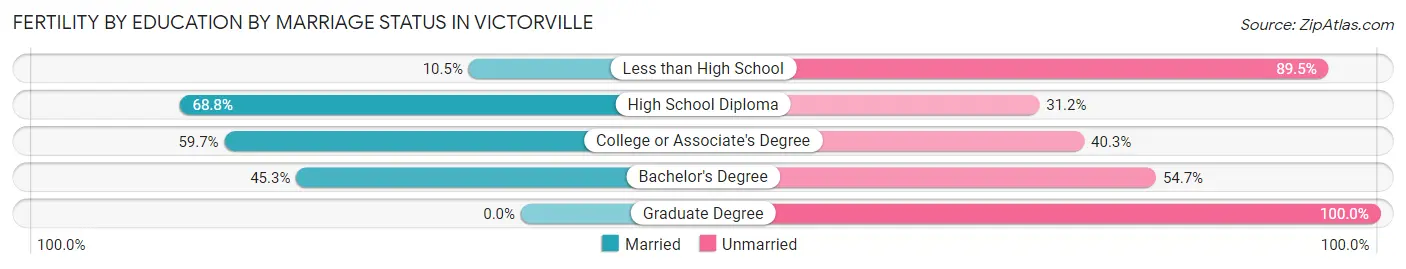
Fertility by Education by Marriage Status in Victorville
46.4% of women with births in Victorville are unmarried. Women with the educational attainment of high school diploma are most likely to be married with 68.8% of them married at childbirth, while women with the educational attainment of graduate degree are least likely to be married with 100.0% of them unmarried at childbirth.
| Educational Attainment | Married | Unmarried |
| Less than High School | 40 (10.5%) | 341 (89.5%) |
| High School Diploma | 535 (68.8%) | 243 (31.2%) |
| College or Associate's Degree | 669 (59.7%) | 451 (40.3%) |
| Bachelor's Degree | 86 (45.3%) | 104 (54.7%) |
| Graduate Degree | 0 (0.0%) | 12 (100.0%) |
| Total | 1,330 (53.6%) | 1,151 (46.4%) |
Employment Characteristics in Victorville
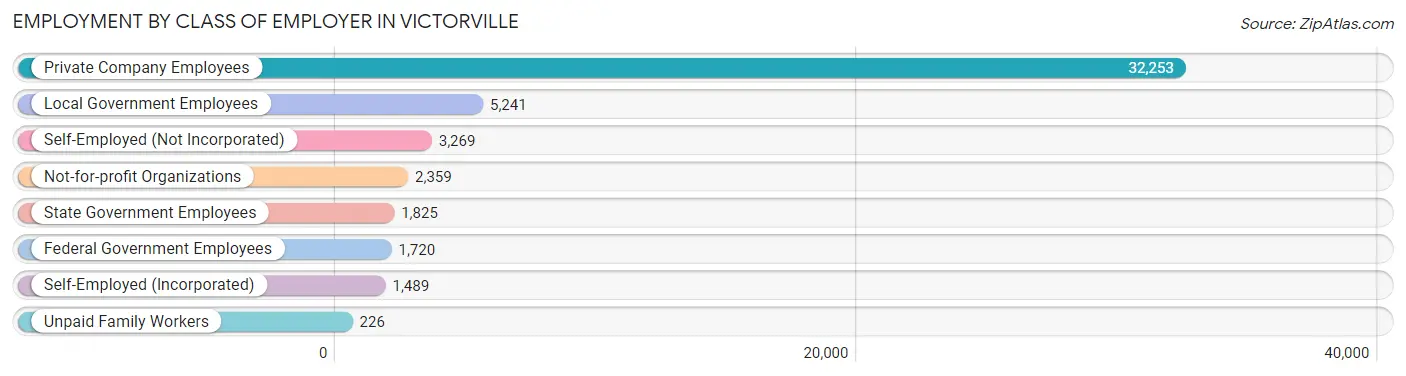
Employment by Class of Employer in Victorville
Among the 48,382 employed individuals in Victorville, private company employees (32,253 | 66.7%), local government employees (5,241 | 10.8%), and self-employed (not incorporated) (3,269 | 6.8%) make up the most common classes of employment.
| Employer Class | # Employees | % Employees |
| Private Company Employees | 32,253 | 66.7% |
| Self-Employed (Incorporated) | 1,489 | 3.1% |
| Self-Employed (Not Incorporated) | 3,269 | 6.8% |
| Not-for-profit Organizations | 2,359 | 4.9% |
| Local Government Employees | 5,241 | 10.8% |
| State Government Employees | 1,825 | 3.8% |
| Federal Government Employees | 1,720 | 3.6% |
| Unpaid Family Workers | 226 | 0.5% |
| Total | 48,382 | 100.0% |
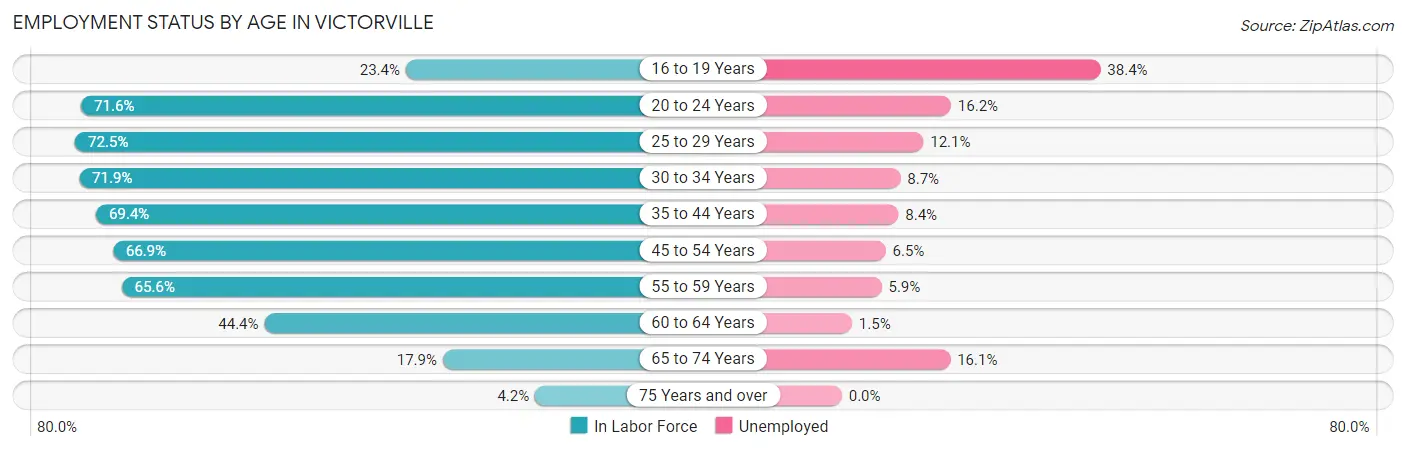
Employment Status by Age in Victorville
According to the labor force statistics for Victorville, out of the total population over 16 years of age (98,100), 55.9% or 54,838 individuals are in the labor force, with 10.3% or 5,648 of them unemployed. The age group with the highest labor force participation rate is 25 to 29 years, with 72.5% or 6,943 individuals in the labor force. Within the labor force, the 16 to 19 years age range has the highest percentage of unemployed individuals, with 38.4% or 777 of them being unemployed.
| Age Bracket | In Labor Force | Unemployed |
| 16 to 19 Years | 2,024 (23.4%) | 777 (38.4%) |
| 20 to 24 Years | 6,947 (71.6%) | 1,125 (16.2%) |
| 25 to 29 Years | 6,943 (72.5%) | 840 (12.1%) |
| 30 to 34 Years | 6,893 (71.9%) | 600 (8.7%) |
| 35 to 44 Years | 13,363 (69.4%) | 1,122 (8.4%) |
| 45 to 54 Years | 9,927 (66.9%) | 645 (6.5%) |
| 55 to 59 Years | 4,244 (65.6%) | 250 (5.9%) |
| 60 to 64 Years | 2,821 (44.4%) | 42 (1.5%) |
| 65 to 74 Years | 1,460 (17.9%) | 235 (16.1%) |
| 75 Years and over | 232 (4.2%) | 0 (0.0%) |
| Total | 54,838 (55.9%) | 5,648 (10.3%) |
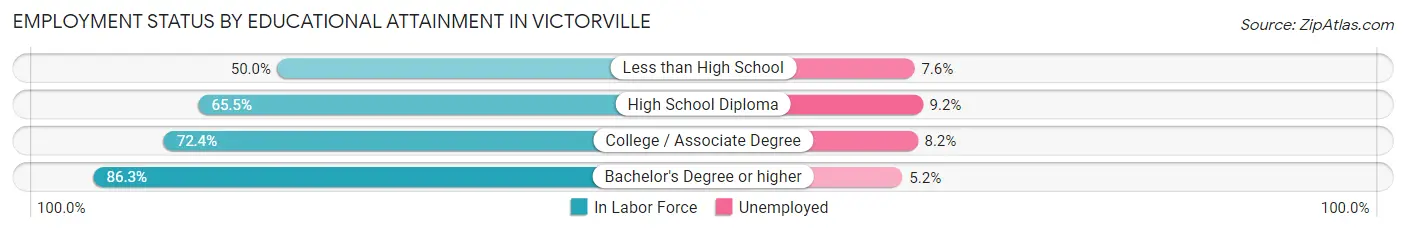
Employment Status by Educational Attainment in Victorville
According to labor force statistics for Victorville, 66.9% of individuals (44,208) out of the total population between 25 and 64 years of age (66,080) are in the labor force, with 7.9% or 3,492 of them being unemployed. The group with the highest labor force participation rate are those with the educational attainment of bachelor's degree or higher, with 86.3% or 6,679 individuals in the labor force. Within the labor force, individuals with high school diploma education have the highest percentage of unemployment, with 9.2% or 1,188 of them being unemployed.
| Educational Attainment | In Labor Force | Unemployed |
| Less than High School | 7,528 (50.0%) | 1,144 (7.6%) |
| High School Diploma | 12,915 (65.5%) | 1,814 (9.2%) |
| College / Associate Degree | 17,064 (72.4%) | 1,933 (8.2%) |
| Bachelor's Degree or higher | 6,679 (86.3%) | 402 (5.2%) |
| Total | 44,208 (66.9%) | 5,220 (7.9%) |
Employment Occupations by Sex in Victorville
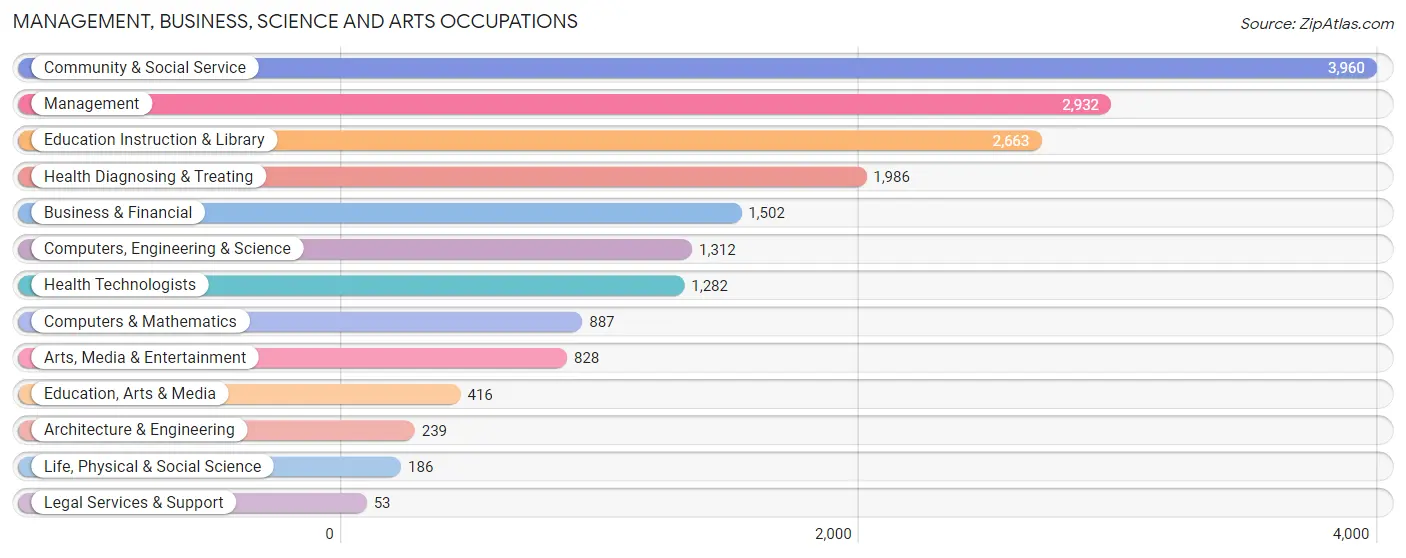
Management, Business, Science and Arts Occupations
The most common Management, Business, Science and Arts occupations in Victorville are Community & Social Service (3,960 | 8.1%), Management (2,932 | 6.0%), Education Instruction & Library (2,663 | 5.4%), Health Diagnosing & Treating (1,986 | 4.1%), and Business & Financial (1,502 | 3.1%).
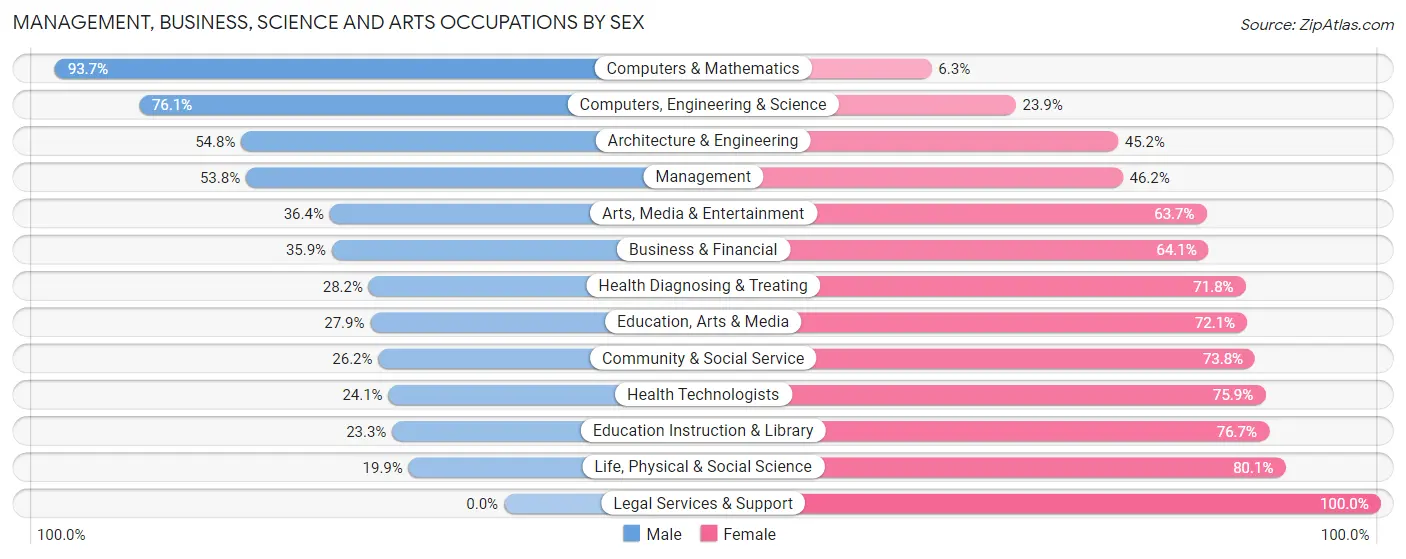
Management, Business, Science and Arts Occupations by Sex
Within the Management, Business, Science and Arts occupations in Victorville, the most male-oriented occupations are Computers & Mathematics (93.7%), Computers, Engineering & Science (76.1%), and Architecture & Engineering (54.8%), while the most female-oriented occupations are Legal Services & Support (100.0%), Life, Physical & Social Science (80.1%), and Education Instruction & Library (76.7%).
| Occupation | Male | Female |
| Management | 1,578 (53.8%) | 1,354 (46.2%) |
| Business & Financial | 539 (35.9%) | 963 (64.1%) |
| Computers, Engineering & Science | 999 (76.1%) | 313 (23.9%) |
| Computers & Mathematics | 831 (93.7%) | 56 (6.3%) |
| Architecture & Engineering | 131 (54.8%) | 108 (45.2%) |
| Life, Physical & Social Science | 37 (19.9%) | 149 (80.1%) |
| Community & Social Service | 1,038 (26.2%) | 2,922 (73.8%) |
| Education, Arts & Media | 116 (27.9%) | 300 (72.1%) |
| Legal Services & Support | 0 (0.0%) | 53 (100.0%) |
| Education Instruction & Library | 621 (23.3%) | 2,042 (76.7%) |
| Arts, Media & Entertainment | 301 (36.3%) | 527 (63.6%) |
| Health Diagnosing & Treating | 560 (28.2%) | 1,426 (71.8%) |
| Health Technologists | 309 (24.1%) | 973 (75.9%) |
| Total (Category) | 4,714 (40.3%) | 6,978 (59.7%) |
| Total (Overall) | 26,680 (54.4%) | 22,339 (45.6%) |
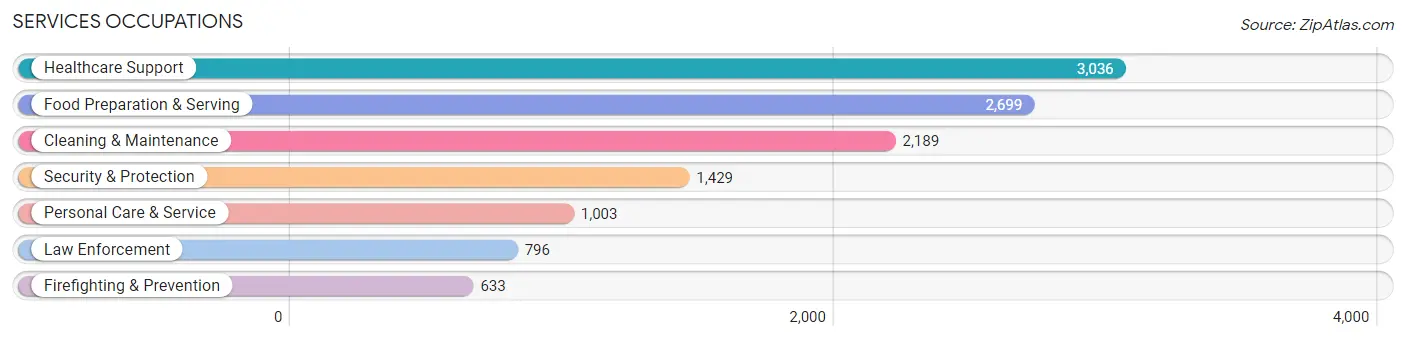
Services Occupations
The most common Services occupations in Victorville are Healthcare Support (3,036 | 6.2%), Food Preparation & Serving (2,699 | 5.5%), Cleaning & Maintenance (2,189 | 4.5%), Security & Protection (1,429 | 2.9%), and Personal Care & Service (1,003 | 2.1%).
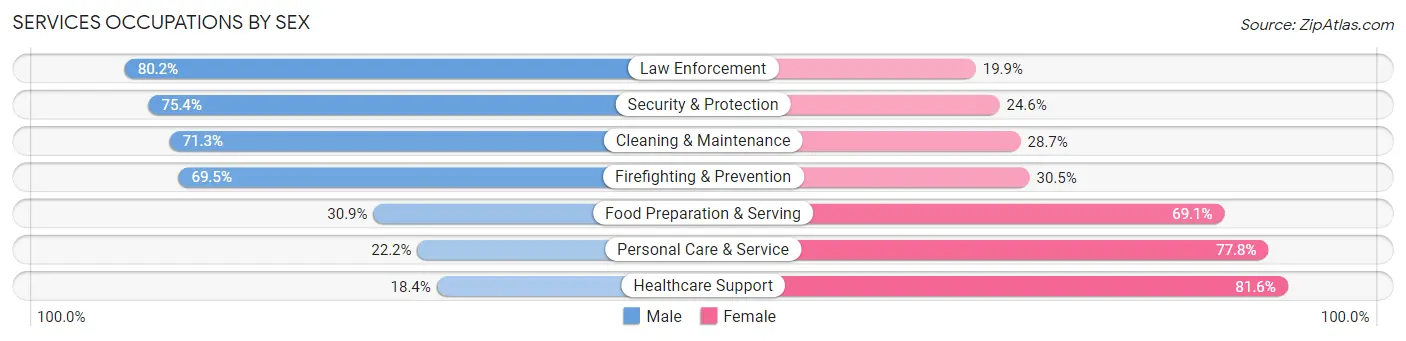
Services Occupations by Sex
Within the Services occupations in Victorville, the most male-oriented occupations are Law Enforcement (80.1%), Security & Protection (75.4%), and Cleaning & Maintenance (71.3%), while the most female-oriented occupations are Healthcare Support (81.6%), Personal Care & Service (77.8%), and Food Preparation & Serving (69.1%).
| Occupation | Male | Female |
| Healthcare Support | 559 (18.4%) | 2,477 (81.6%) |
| Security & Protection | 1,078 (75.4%) | 351 (24.6%) |
| Firefighting & Prevention | 440 (69.5%) | 193 (30.5%) |
| Law Enforcement | 638 (80.1%) | 158 (19.9%) |
| Food Preparation & Serving | 835 (30.9%) | 1,864 (69.1%) |
| Cleaning & Maintenance | 1,560 (71.3%) | 629 (28.7%) |
| Personal Care & Service | 223 (22.2%) | 780 (77.8%) |
| Total (Category) | 4,255 (41.1%) | 6,101 (58.9%) |
| Total (Overall) | 26,680 (54.4%) | 22,339 (45.6%) |
Sales and Office Occupations
The most common Sales and Office occupations in Victorville are Sales & Related (6,089 | 12.4%), and Office & Administration (4,963 | 10.1%).

Sales and Office Occupations by Sex
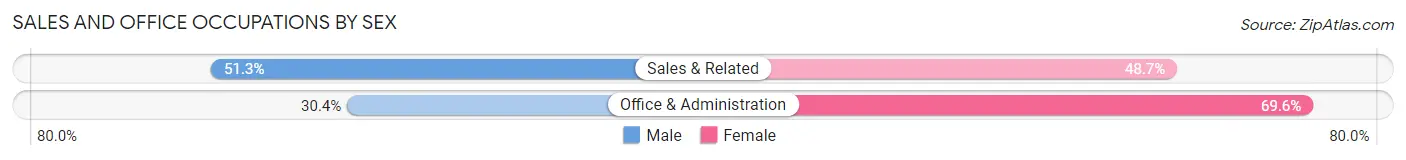
| Occupation | Male | Female |
| Sales & Related | 3,124 (51.3%) | 2,965 (48.7%) |
| Office & Administration | 1,508 (30.4%) | 3,455 (69.6%) |
| Total (Category) | 4,632 (41.9%) | 6,420 (58.1%) |
| Total (Overall) | 26,680 (54.4%) | 22,339 (45.6%) |
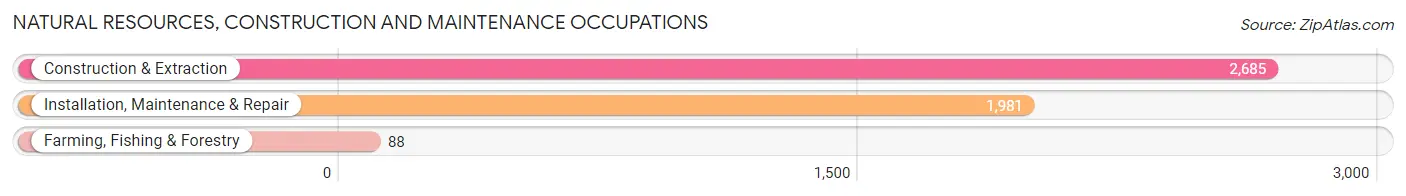
Natural Resources, Construction and Maintenance Occupations
The most common Natural Resources, Construction and Maintenance occupations in Victorville are Construction & Extraction (2,685 | 5.5%), Installation, Maintenance & Repair (1,981 | 4.0%), and Farming, Fishing & Forestry (88 | 0.2%).
Natural Resources, Construction and Maintenance Occupations by Sex
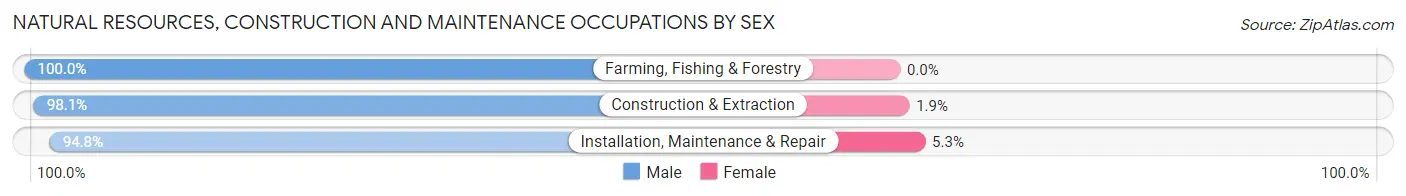
| Occupation | Male | Female |
| Farming, Fishing & Forestry | 88 (100.0%) | 0 (0.0%) |
| Construction & Extraction | 2,633 (98.1%) | 52 (1.9%) |
| Installation, Maintenance & Repair | 1,877 (94.8%) | 104 (5.2%) |
| Total (Category) | 4,598 (96.7%) | 156 (3.3%) |
| Total (Overall) | 26,680 (54.4%) | 22,339 (45.6%) |
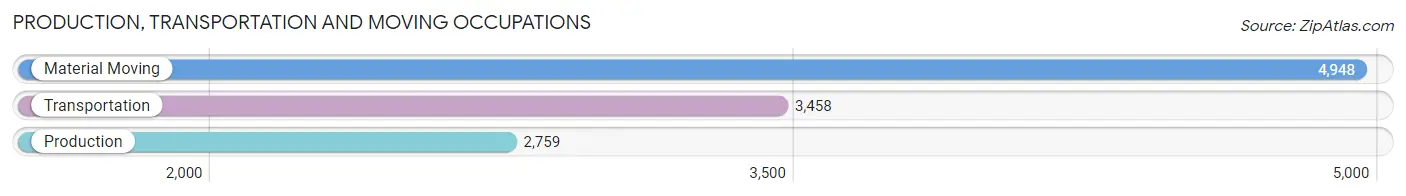
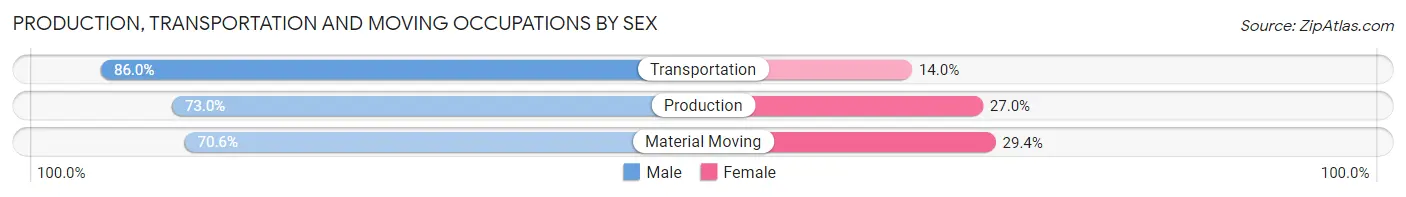
Production, Transportation and Moving Occupations
The most common Production, Transportation and Moving occupations in Victorville are Material Moving (4,948 | 10.1%), Transportation (3,458 | 7.0%), and Production (2,759 | 5.6%).
Production, Transportation and Moving Occupations by Sex
| Occupation | Male | Female |
| Production | 2,013 (73.0%) | 746 (27.0%) |
| Transportation | 2,973 (86.0%) | 485 (14.0%) |
| Material Moving | 3,495 (70.6%) | 1,453 (29.4%) |
| Total (Category) | 8,481 (76.0%) | 2,684 (24.0%) |
| Total (Overall) | 26,680 (54.4%) | 22,339 (45.6%) |
Employment Industries by Sex in Victorville
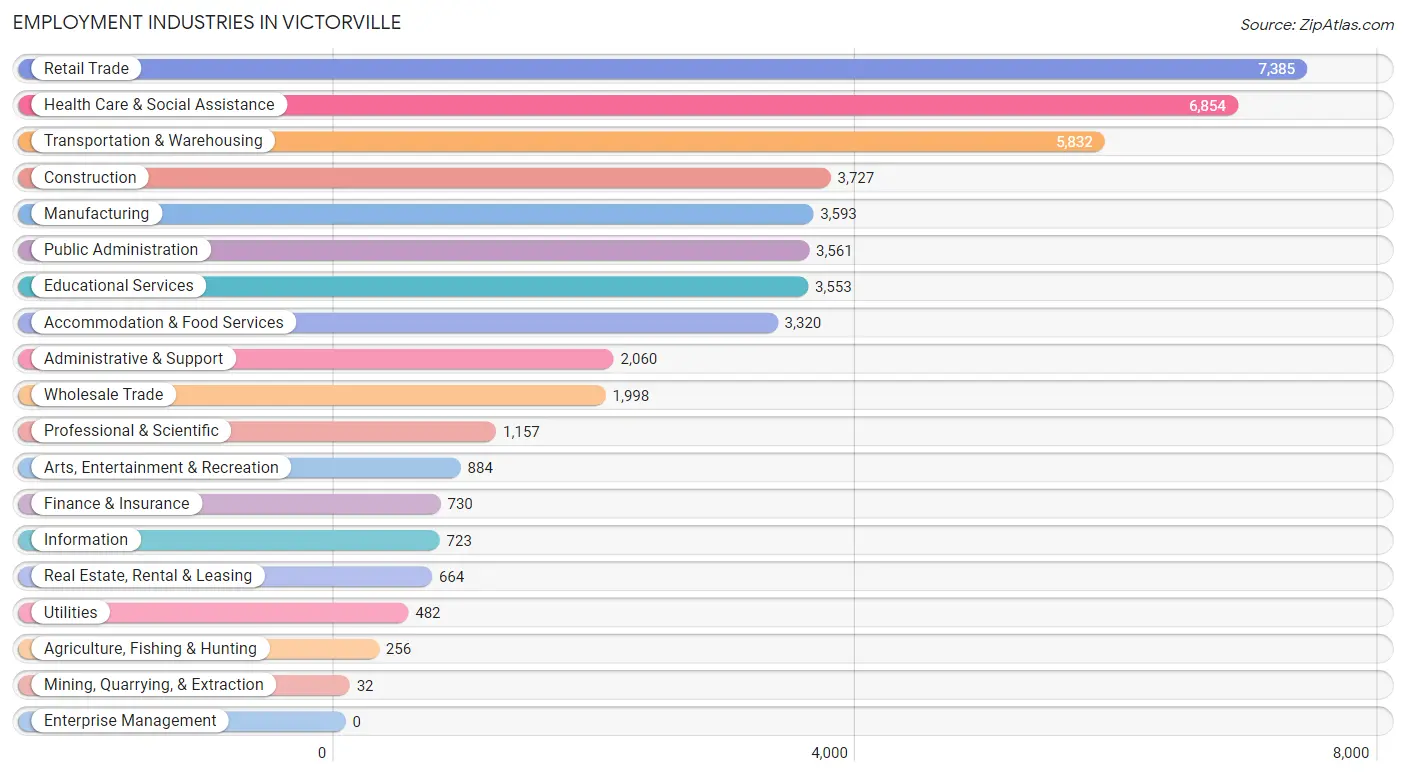
Employment Industries in Victorville
The major employment industries in Victorville include Retail Trade (7,385 | 15.1%), Health Care & Social Assistance (6,854 | 14.0%), Transportation & Warehousing (5,832 | 11.9%), Construction (3,727 | 7.6%), and Manufacturing (3,593 | 7.3%).
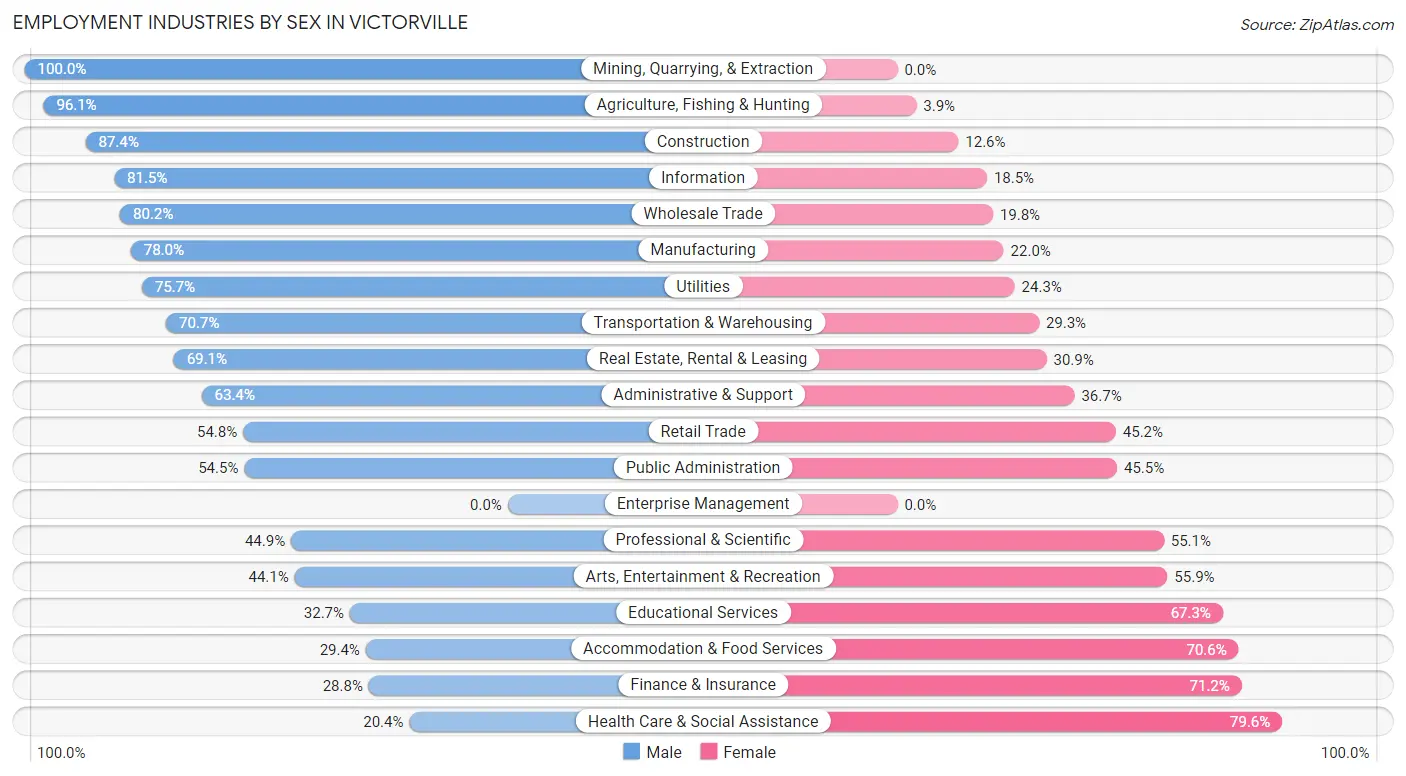
Employment Industries by Sex in Victorville
The Victorville industries that see more men than women are Mining, Quarrying, & Extraction (100.0%), Agriculture, Fishing & Hunting (96.1%), and Construction (87.4%), whereas the industries that tend to have a higher number of women are Health Care & Social Assistance (79.6%), Finance & Insurance (71.2%), and Accommodation & Food Services (70.6%).
| Industry | Male | Female |
| Agriculture, Fishing & Hunting | 246 (96.1%) | 10 (3.9%) |
| Mining, Quarrying, & Extraction | 32 (100.0%) | 0 (0.0%) |
| Construction | 3,257 (87.4%) | 470 (12.6%) |
| Manufacturing | 2,803 (78.0%) | 790 (22.0%) |
| Wholesale Trade | 1,603 (80.2%) | 395 (19.8%) |
| Retail Trade | 4,046 (54.8%) | 3,339 (45.2%) |
| Transportation & Warehousing | 4,124 (70.7%) | 1,708 (29.3%) |
| Utilities | 365 (75.7%) | 117 (24.3%) |
| Information | 589 (81.5%) | 134 (18.5%) |
| Finance & Insurance | 210 (28.8%) | 520 (71.2%) |
| Real Estate, Rental & Leasing | 459 (69.1%) | 205 (30.9%) |
| Professional & Scientific | 519 (44.9%) | 638 (55.1%) |
| Enterprise Management | 0 (0.0%) | 0 (0.0%) |
| Administrative & Support | 1,305 (63.3%) | 755 (36.6%) |
| Educational Services | 1,161 (32.7%) | 2,392 (67.3%) |
| Health Care & Social Assistance | 1,397 (20.4%) | 5,457 (79.6%) |
| Arts, Entertainment & Recreation | 390 (44.1%) | 494 (55.9%) |
| Accommodation & Food Services | 976 (29.4%) | 2,344 (70.6%) |
| Public Administration | 1,942 (54.5%) | 1,619 (45.5%) |
| Total | 26,680 (54.4%) | 22,339 (45.6%) |
Education in Victorville
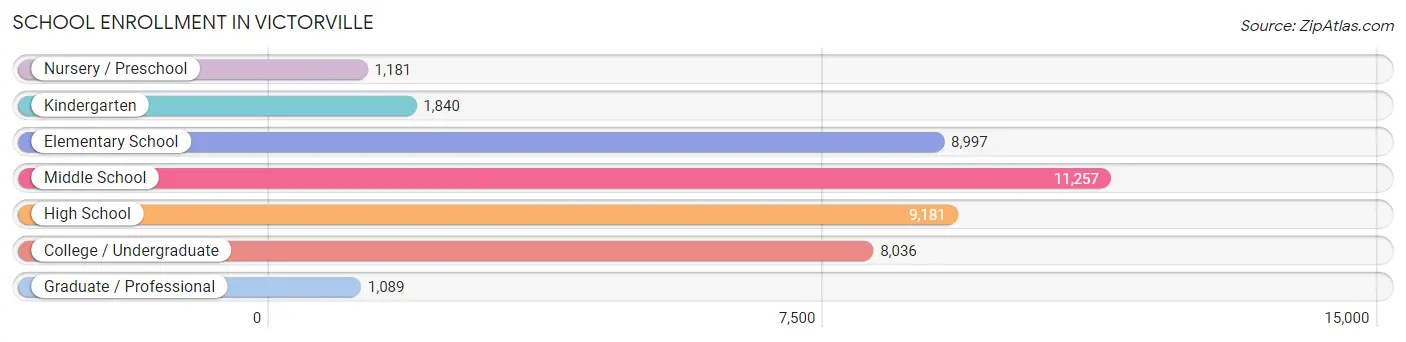
School Enrollment in Victorville
The most common levels of schooling among the 41,581 students in Victorville are middle school (11,257 | 27.1%), high school (9,181 | 22.1%), and elementary school (8,997 | 21.6%).
| School Level | # Students | % Students |
| Nursery / Preschool | 1,181 | 2.8% |
| Kindergarten | 1,840 | 4.4% |
| Elementary School | 8,997 | 21.6% |
| Middle School | 11,257 | 27.1% |
| High School | 9,181 | 22.1% |
| College / Undergraduate | 8,036 | 19.3% |
| Graduate / Professional | 1,089 | 2.6% |
| Total | 41,581 | 100.0% |
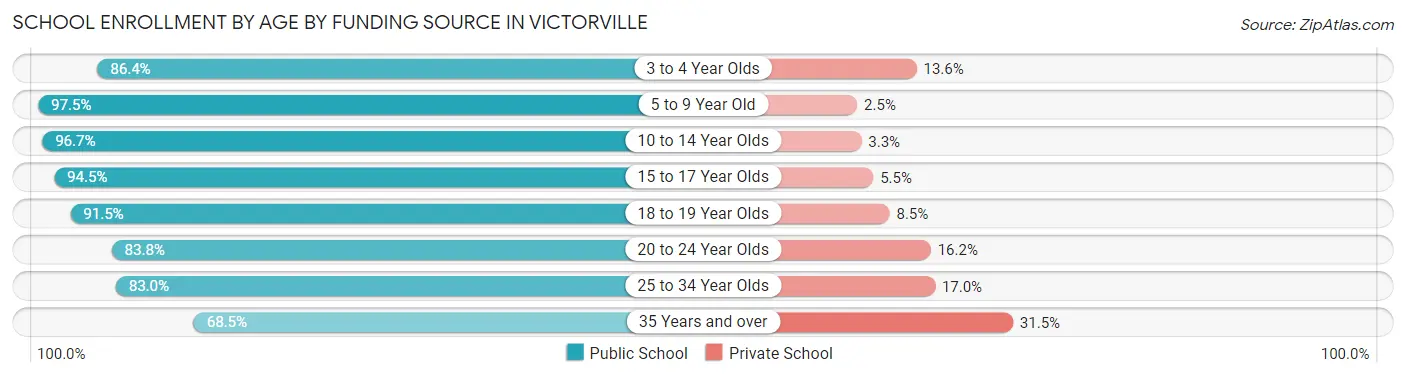
School Enrollment by Age by Funding Source in Victorville
Out of a total of 41,581 students who are enrolled in schools in Victorville, 3,119 (7.5%) attend a private institution, while the remaining 38,462 (92.5%) are enrolled in public schools. The age group of 35 years and over has the highest likelihood of being enrolled in private schools, with 862 (31.5% in the age bracket) enrolled. Conversely, the age group of 5 to 9 year old has the lowest likelihood of being enrolled in a private school, with 10,002 (97.5% in the age bracket) attending a public institution.
| Age Bracket | Public School | Private School |
| 3 to 4 Year Olds | 771 (86.4%) | 121 (13.6%) |
| 5 to 9 Year Old | 10,002 (97.5%) | 257 (2.5%) |
| 10 to 14 Year Olds | 13,362 (96.7%) | 455 (3.3%) |
| 15 to 17 Year Olds | 5,422 (94.5%) | 316 (5.5%) |
| 18 to 19 Year Olds | 2,484 (91.5%) | 232 (8.5%) |
| 20 to 24 Year Olds | 2,928 (83.8%) | 567 (16.2%) |
| 25 to 34 Year Olds | 1,601 (83.0%) | 328 (17.0%) |
| 35 Years and over | 1,873 (68.5%) | 862 (31.5%) |
| Total | 38,462 (92.5%) | 3,119 (7.5%) |
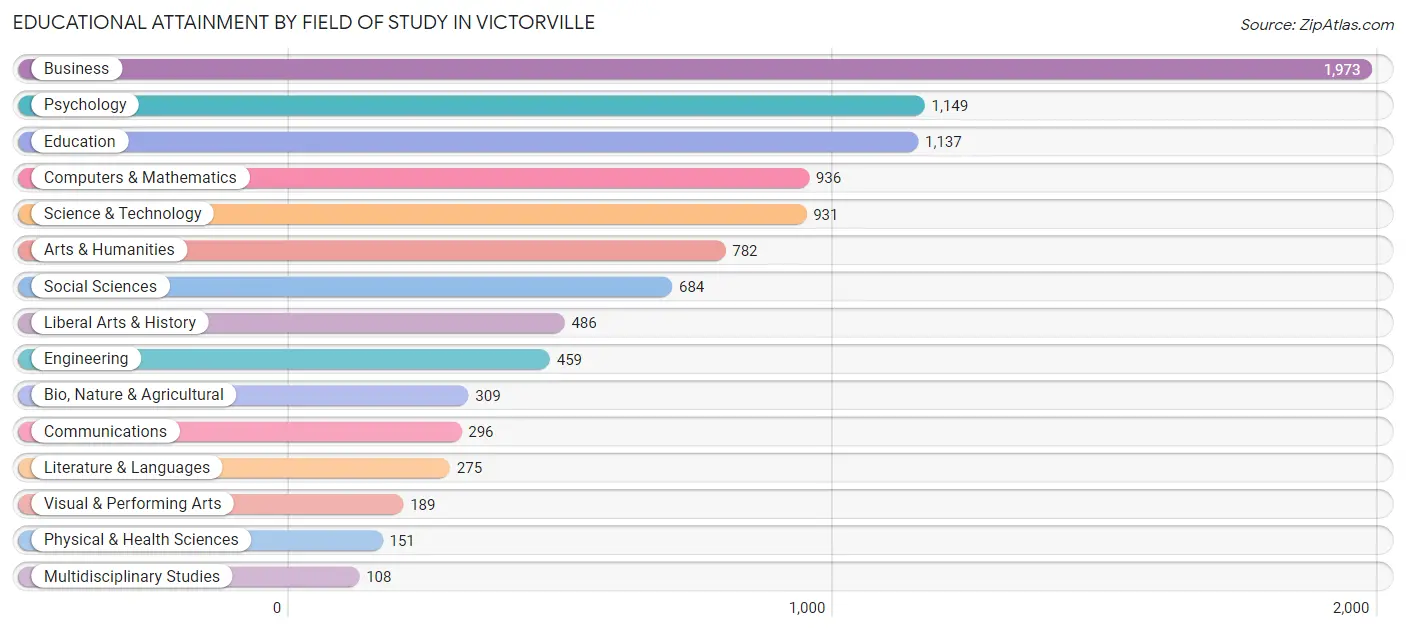
Educational Attainment by Field of Study in Victorville
Business (1,973 | 20.0%), psychology (1,149 | 11.7%), education (1,137 | 11.5%), computers & mathematics (936 | 9.5%), and science & technology (931 | 9.4%) are the most common fields of study among 9,865 individuals in Victorville who have obtained a bachelor's degree or higher.
| Field of Study | # Graduates | % Graduates |
| Computers & Mathematics | 936 | 9.5% |
| Bio, Nature & Agricultural | 309 | 3.1% |
| Physical & Health Sciences | 151 | 1.5% |
| Psychology | 1,149 | 11.7% |
| Social Sciences | 684 | 6.9% |
| Engineering | 459 | 4.6% |
| Multidisciplinary Studies | 108 | 1.1% |
| Science & Technology | 931 | 9.4% |
| Business | 1,973 | 20.0% |
| Education | 1,137 | 11.5% |
| Literature & Languages | 275 | 2.8% |
| Liberal Arts & History | 486 | 4.9% |
| Visual & Performing Arts | 189 | 1.9% |
| Communications | 296 | 3.0% |
| Arts & Humanities | 782 | 7.9% |
| Total | 9,865 | 100.0% |
Transportation & Commute in Victorville
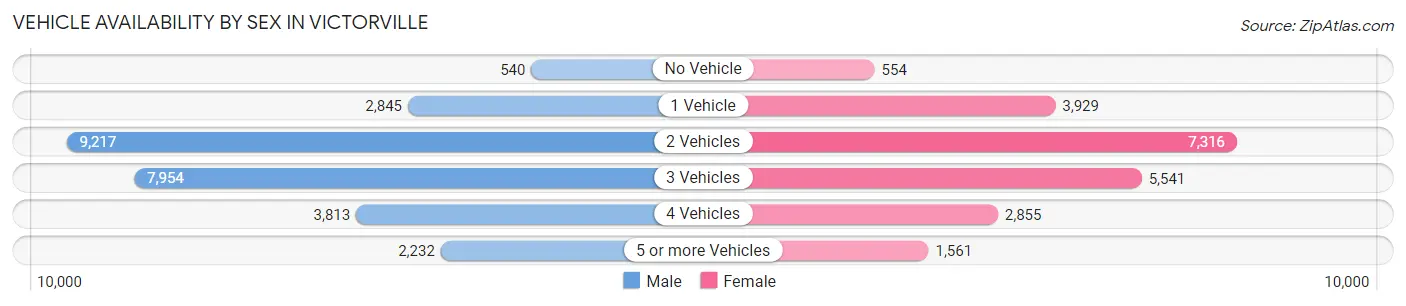
Vehicle Availability by Sex in Victorville
The most prevalent vehicle ownership categories in Victorville are males with 2 vehicles (9,217, accounting for 34.6%) and females with 2 vehicles (7,316, making up 42.4%).
| Vehicles Available | Male | Female |
| No Vehicle | 540 (2.0%) | 554 (2.5%) |
| 1 Vehicle | 2,845 (10.7%) | 3,929 (18.1%) |
| 2 Vehicles | 9,217 (34.6%) | 7,316 (33.6%) |
| 3 Vehicles | 7,954 (29.9%) | 5,541 (25.5%) |
| 4 Vehicles | 3,813 (14.3%) | 2,855 (13.1%) |
| 5 or more Vehicles | 2,232 (8.4%) | 1,561 (7.2%) |
| Total | 26,601 (100.0%) | 21,756 (100.0%) |
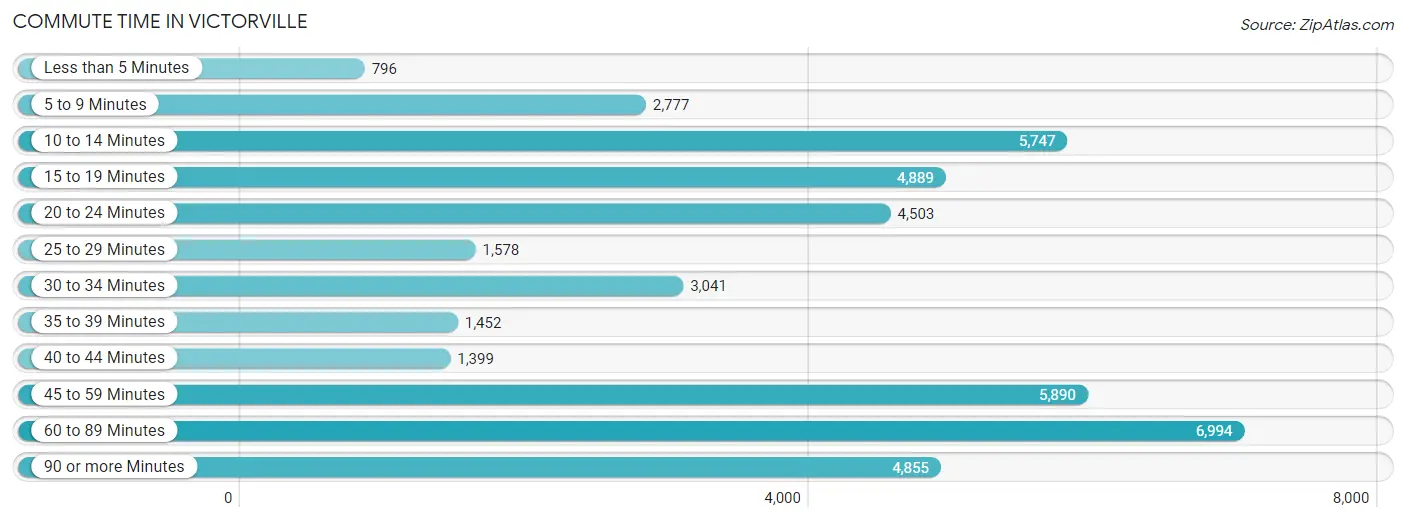
Commute Time in Victorville
The most frequently occuring commute durations in Victorville are 60 to 89 minutes (6,994 commuters, 15.9%), 45 to 59 minutes (5,890 commuters, 13.4%), and 10 to 14 minutes (5,747 commuters, 13.1%).
| Commute Time | # Commuters | % Commuters |
| Less than 5 Minutes | 796 | 1.8% |
| 5 to 9 Minutes | 2,777 | 6.3% |
| 10 to 14 Minutes | 5,747 | 13.1% |
| 15 to 19 Minutes | 4,889 | 11.1% |
| 20 to 24 Minutes | 4,503 | 10.2% |
| 25 to 29 Minutes | 1,578 | 3.6% |
| 30 to 34 Minutes | 3,041 | 6.9% |
| 35 to 39 Minutes | 1,452 | 3.3% |
| 40 to 44 Minutes | 1,399 | 3.2% |
| 45 to 59 Minutes | 5,890 | 13.4% |
| 60 to 89 Minutes | 6,994 | 15.9% |
| 90 or more Minutes | 4,855 | 11.1% |
Commute Time by Sex in Victorville
The most common commute times in Victorville are 60 to 89 minutes (4,705 commuters, 18.9%) for males and 10 to 14 minutes (3,243 commuters, 17.1%) for females.
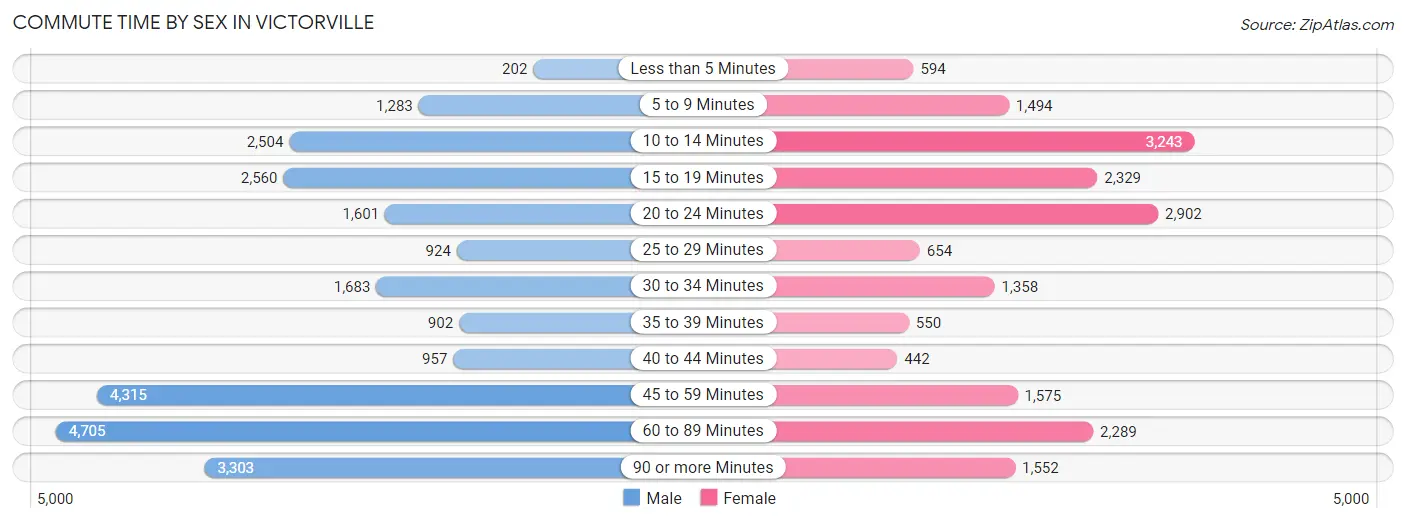
| Commute Time | Male | Female |
| Less than 5 Minutes | 202 (0.8%) | 594 (3.1%) |
| 5 to 9 Minutes | 1,283 (5.1%) | 1,494 (7.9%) |
| 10 to 14 Minutes | 2,504 (10.0%) | 3,243 (17.1%) |
| 15 to 19 Minutes | 2,560 (10.3%) | 2,329 (12.3%) |
| 20 to 24 Minutes | 1,601 (6.4%) | 2,902 (15.3%) |
| 25 to 29 Minutes | 924 (3.7%) | 654 (3.5%) |
| 30 to 34 Minutes | 1,683 (6.8%) | 1,358 (7.1%) |
| 35 to 39 Minutes | 902 (3.6%) | 550 (2.9%) |
| 40 to 44 Minutes | 957 (3.8%) | 442 (2.3%) |
| 45 to 59 Minutes | 4,315 (17.3%) | 1,575 (8.3%) |
| 60 to 89 Minutes | 4,705 (18.9%) | 2,289 (12.1%) |
| 90 or more Minutes | 3,303 (13.2%) | 1,552 (8.2%) |
Time of Departure to Work by Sex in Victorville
The most frequent times of departure to work in Victorville are 12:00 AM to 4:59 AM (4,904, 19.7%) for males and 8:00 AM to 8:29 AM (1,945, 10.2%) for females.
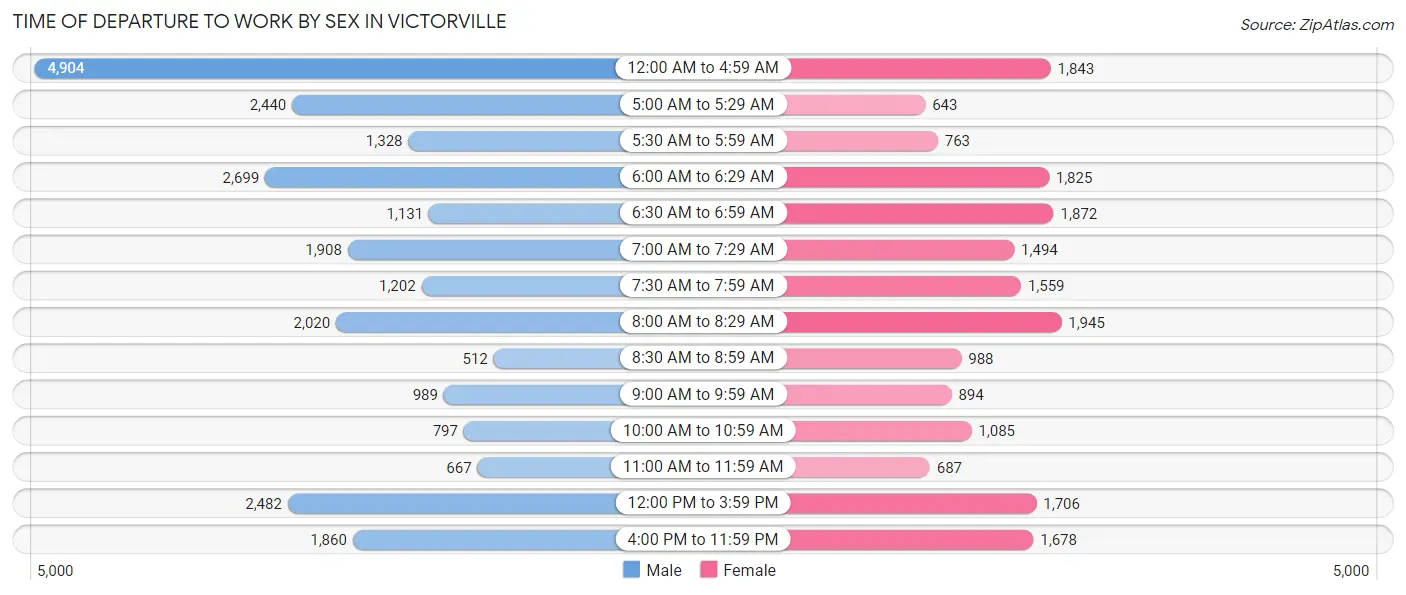
| Time of Departure | Male | Female |
| 12:00 AM to 4:59 AM | 4,904 (19.7%) | 1,843 (9.7%) |
| 5:00 AM to 5:29 AM | 2,440 (9.8%) | 643 (3.4%) |
| 5:30 AM to 5:59 AM | 1,328 (5.3%) | 763 (4.0%) |
| 6:00 AM to 6:29 AM | 2,699 (10.8%) | 1,825 (9.6%) |
| 6:30 AM to 6:59 AM | 1,131 (4.5%) | 1,872 (9.9%) |
| 7:00 AM to 7:29 AM | 1,908 (7.6%) | 1,494 (7.9%) |
| 7:30 AM to 7:59 AM | 1,202 (4.8%) | 1,559 (8.2%) |
| 8:00 AM to 8:29 AM | 2,020 (8.1%) | 1,945 (10.2%) |
| 8:30 AM to 8:59 AM | 512 (2.1%) | 988 (5.2%) |
| 9:00 AM to 9:59 AM | 989 (4.0%) | 894 (4.7%) |
| 10:00 AM to 10:59 AM | 797 (3.2%) | 1,085 (5.7%) |
| 11:00 AM to 11:59 AM | 667 (2.7%) | 687 (3.6%) |
| 12:00 PM to 3:59 PM | 2,482 (10.0%) | 1,706 (9.0%) |
| 4:00 PM to 11:59 PM | 1,860 (7.5%) | 1,678 (8.8%) |
| Total | 24,939 (100.0%) | 18,982 (100.0%) |
Housing Occupancy in Victorville
Occupancy by Ownership in Victorville
Of the total 36,842 dwellings in Victorville, owner-occupied units account for 22,012 (59.8%), while renter-occupied units make up 14,830 (40.3%).
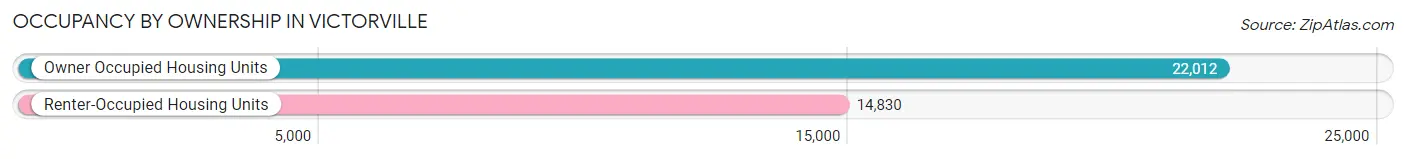
| Occupancy | # Housing Units | % Housing Units |
| Owner Occupied Housing Units | 22,012 | 59.8% |
| Renter-Occupied Housing Units | 14,830 | 40.3% |
| Total Occupied Housing Units | 36,842 | 100.0% |
Occupancy by Household Size in Victorville
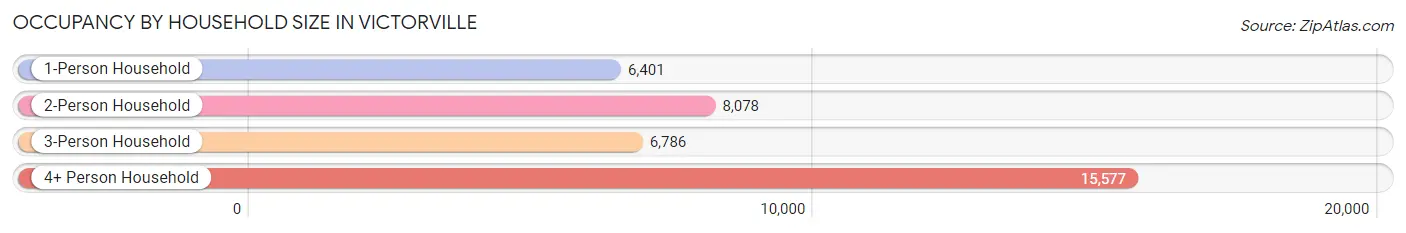
| Household Size | # Housing Units | % Housing Units |
| 1-Person Household | 6,401 | 17.4% |
| 2-Person Household | 8,078 | 21.9% |
| 3-Person Household | 6,786 | 18.4% |
| 4+ Person Household | 15,577 | 42.3% |
| Total Housing Units | 36,842 | 100.0% |
Occupancy by Ownership by Household Size in Victorville
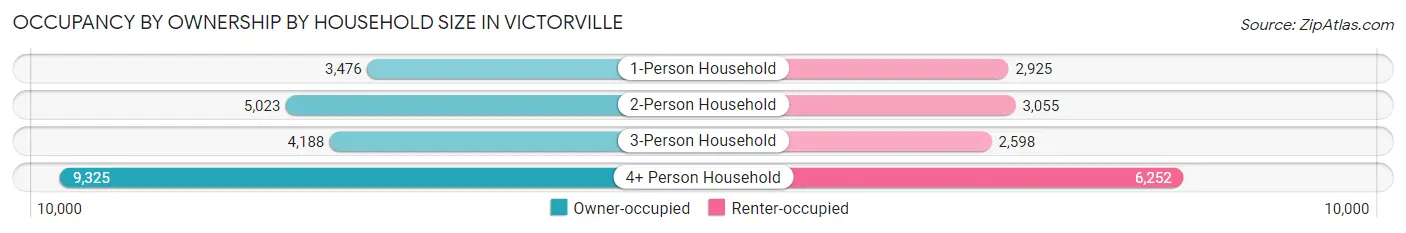
| Household Size | Owner-occupied | Renter-occupied |
| 1-Person Household | 3,476 (54.3%) | 2,925 (45.7%) |
| 2-Person Household | 5,023 (62.2%) | 3,055 (37.8%) |
| 3-Person Household | 4,188 (61.7%) | 2,598 (38.3%) |
| 4+ Person Household | 9,325 (59.9%) | 6,252 (40.1%) |
| Total Housing Units | 22,012 (59.8%) | 14,830 (40.3%) |
Occupancy by Educational Attainment in Victorville
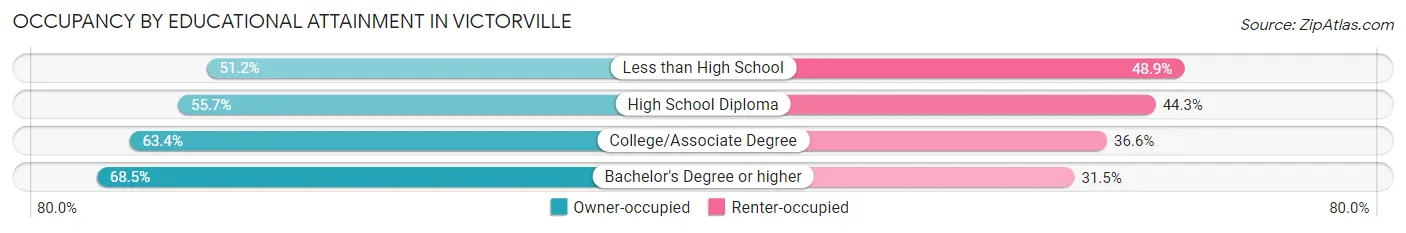
| Household Size | Owner-occupied | Renter-occupied |
| Less than High School | 3,839 (51.1%) | 3,667 (48.8%) |
| High School Diploma | 5,054 (55.7%) | 4,026 (44.3%) |
| College/Associate Degree | 9,352 (63.4%) | 5,408 (36.6%) |
| Bachelor's Degree or higher | 3,767 (68.5%) | 1,729 (31.5%) |
Occupancy by Age of Householder in Victorville
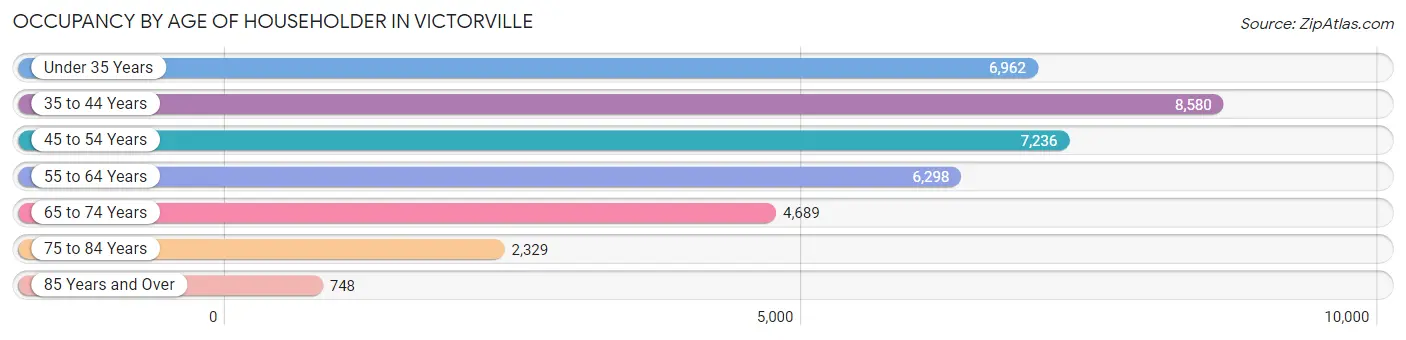
| Age Bracket | # Households | % Households |
| Under 35 Years | 6,962 | 18.9% |
| 35 to 44 Years | 8,580 | 23.3% |
| 45 to 54 Years | 7,236 | 19.6% |
| 55 to 64 Years | 6,298 | 17.1% |
| 65 to 74 Years | 4,689 | 12.7% |
| 75 to 84 Years | 2,329 | 6.3% |
| 85 Years and Over | 748 | 2.0% |
| Total | 36,842 | 100.0% |
Housing Finances in Victorville
Median Income by Occupancy in Victorville
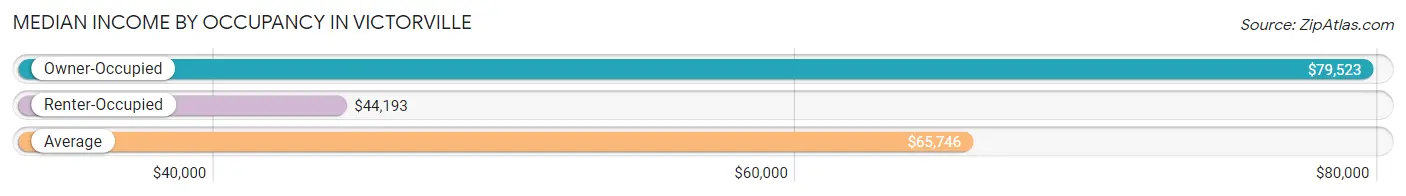
| Occupancy Type | # Households | Median Income |
| Owner-Occupied | 22,012 (59.8%) | $79,523 |
| Renter-Occupied | 14,830 (40.3%) | $44,193 |
| Average | 36,842 (100.0%) | $65,746 |
Occupancy by Householder Income Bracket in Victorville
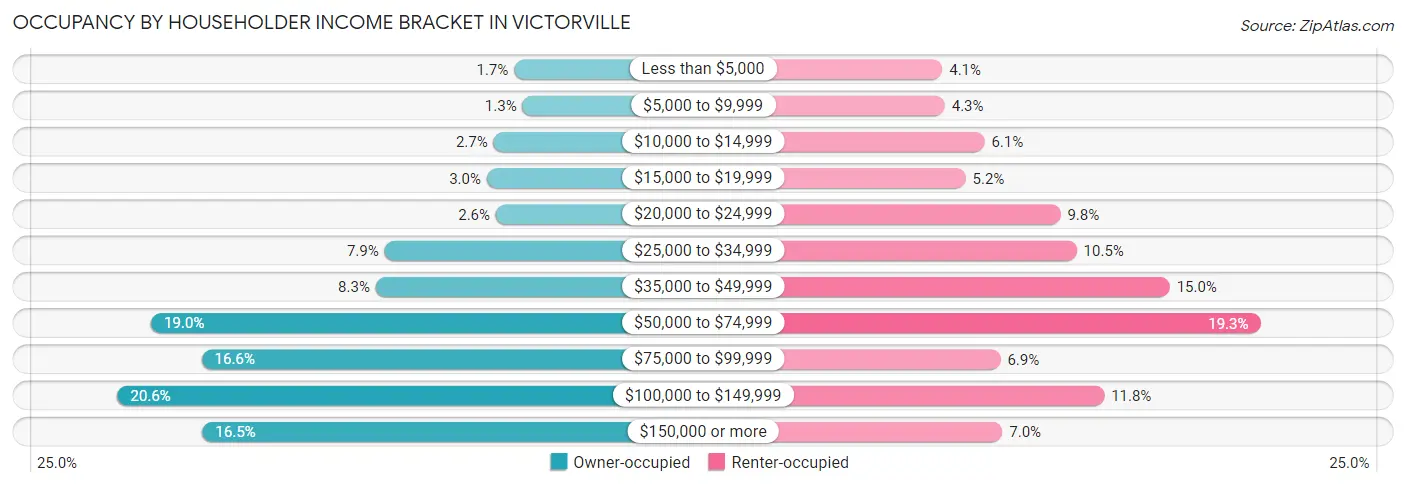
| Income Bracket | Owner-occupied | Renter-occupied |
| Less than $5,000 | 371 (1.7%) | 613 (4.1%) |
| $5,000 to $9,999 | 285 (1.3%) | 630 (4.3%) |
| $10,000 to $14,999 | 588 (2.7%) | 910 (6.1%) |
| $15,000 to $19,999 | 658 (3.0%) | 777 (5.2%) |
| $20,000 to $24,999 | 564 (2.6%) | 1,447 (9.8%) |
| $25,000 to $34,999 | 1,730 (7.9%) | 1,561 (10.5%) |
| $35,000 to $49,999 | 1,822 (8.3%) | 2,218 (15.0%) |
| $50,000 to $74,999 | 4,177 (19.0%) | 2,857 (19.3%) |
| $75,000 to $99,999 | 3,648 (16.6%) | 1,024 (6.9%) |
| $100,000 to $149,999 | 4,531 (20.6%) | 1,756 (11.8%) |
| $150,000 or more | 3,638 (16.5%) | 1,037 (7.0%) |
| Total | 22,012 (100.0%) | 14,830 (100.0%) |
Monthly Housing Cost Tiers in Victorville
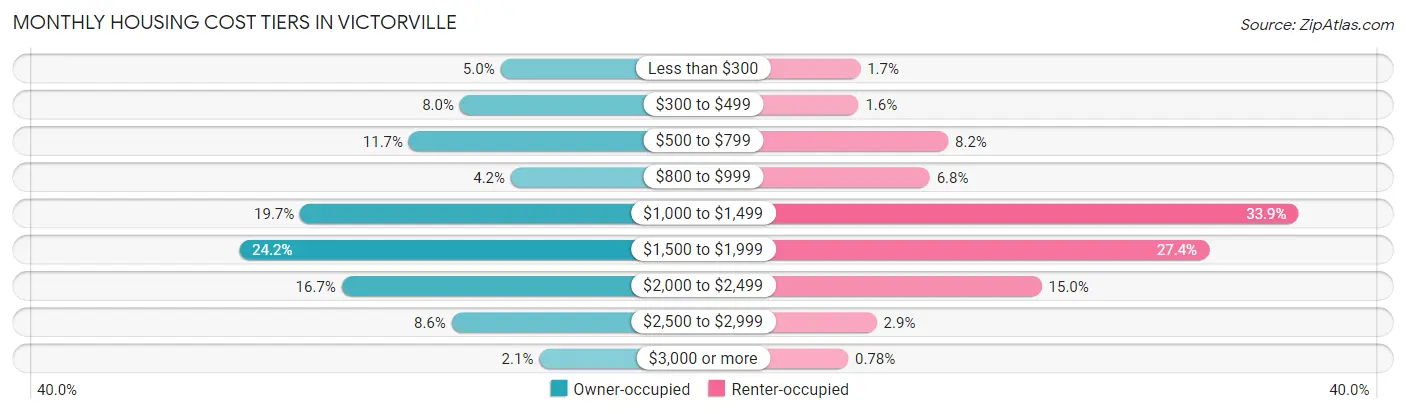
| Monthly Cost | Owner-occupied | Renter-occupied |
| Less than $300 | 1,089 (5.0%) | 249 (1.7%) |
| $300 to $499 | 1,749 (8.0%) | 230 (1.5%) |
| $500 to $799 | 2,575 (11.7%) | 1,208 (8.2%) |
| $800 to $999 | 922 (4.2%) | 1,008 (6.8%) |
| $1,000 to $1,499 | 4,338 (19.7%) | 5,033 (33.9%) |
| $1,500 to $1,999 | 5,327 (24.2%) | 4,058 (27.4%) |
| $2,000 to $2,499 | 3,666 (16.7%) | 2,230 (15.0%) |
| $2,500 to $2,999 | 1,883 (8.6%) | 428 (2.9%) |
| $3,000 or more | 463 (2.1%) | 115 (0.8%) |
| Total | 22,012 (100.0%) | 14,830 (100.0%) |
Physical Housing Characteristics in Victorville
Housing Structures in Victorville
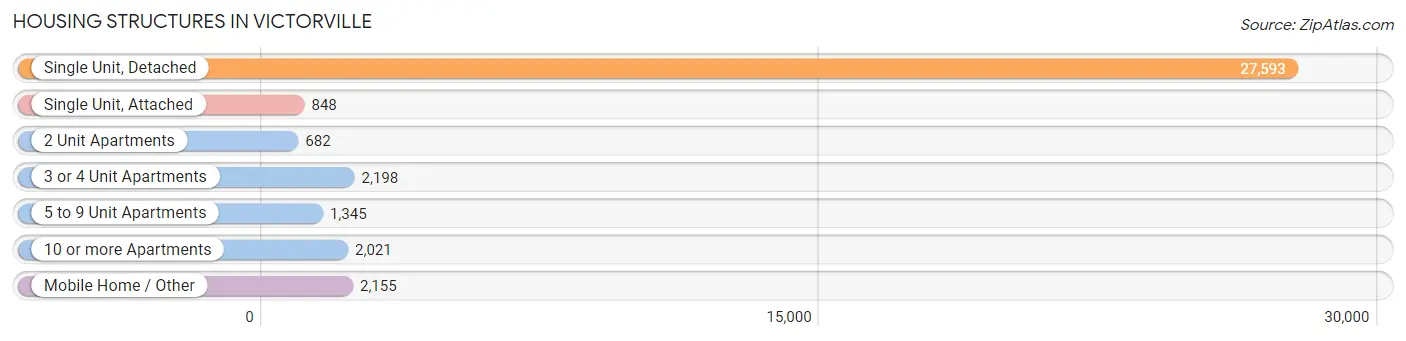
| Structure Type | # Housing Units | % Housing Units |
| Single Unit, Detached | 27,593 | 74.9% |
| Single Unit, Attached | 848 | 2.3% |
| 2 Unit Apartments | 682 | 1.8% |
| 3 or 4 Unit Apartments | 2,198 | 6.0% |
| 5 to 9 Unit Apartments | 1,345 | 3.6% |
| 10 or more Apartments | 2,021 | 5.5% |
| Mobile Home / Other | 2,155 | 5.9% |
| Total | 36,842 | 100.0% |
Housing Structures by Occupancy in Victorville
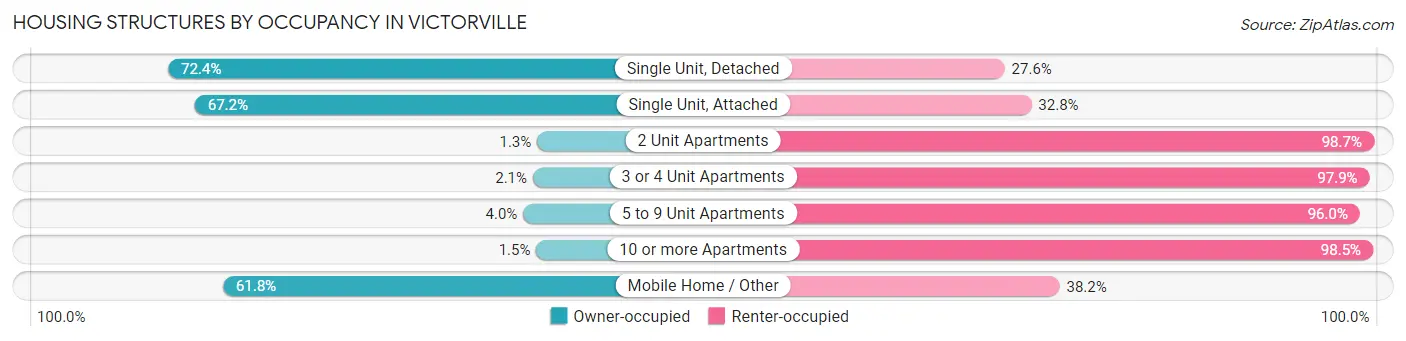
| Structure Type | Owner-occupied | Renter-occupied |
| Single Unit, Detached | 19,970 (72.4%) | 7,623 (27.6%) |
| Single Unit, Attached | 570 (67.2%) | 278 (32.8%) |
| 2 Unit Apartments | 9 (1.3%) | 673 (98.7%) |
| 3 or 4 Unit Apartments | 47 (2.1%) | 2,151 (97.9%) |
| 5 to 9 Unit Apartments | 54 (4.0%) | 1,291 (96.0%) |
| 10 or more Apartments | 30 (1.5%) | 1,991 (98.5%) |
| Mobile Home / Other | 1,332 (61.8%) | 823 (38.2%) |
| Total | 22,012 (59.8%) | 14,830 (40.3%) |
Housing Structures by Number of Rooms in Victorville
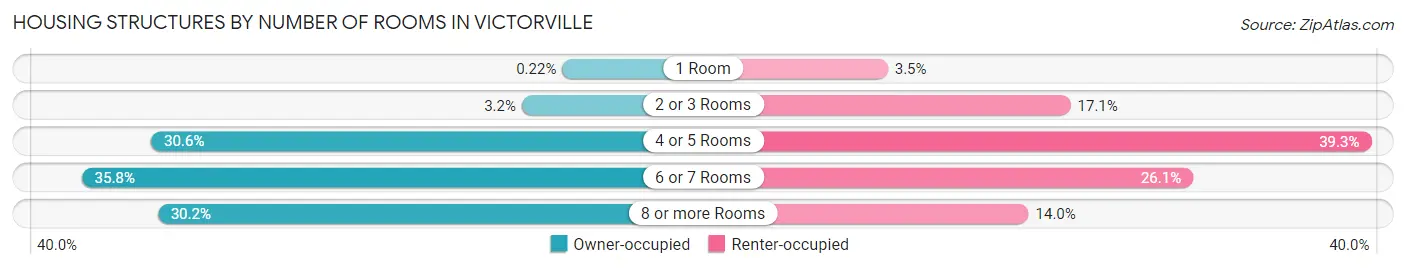
| Number of Rooms | Owner-occupied | Renter-occupied |
| 1 Room | 48 (0.2%) | 525 (3.5%) |
| 2 or 3 Rooms | 707 (3.2%) | 2,531 (17.1%) |
| 4 or 5 Rooms | 6,745 (30.6%) | 5,829 (39.3%) |
| 6 or 7 Rooms | 7,876 (35.8%) | 3,874 (26.1%) |
| 8 or more Rooms | 6,636 (30.1%) | 2,071 (14.0%) |
| Total | 22,012 (100.0%) | 14,830 (100.0%) |
Housing Structure by Heating Type in Victorville
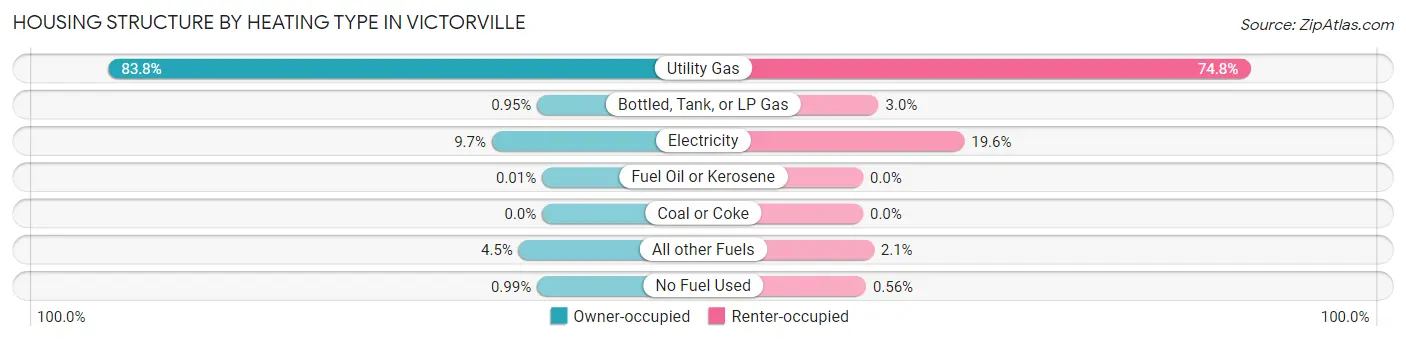
| Heating Type | Owner-occupied | Renter-occupied |
| Utility Gas | 18,448 (83.8%) | 11,089 (74.8%) |
| Bottled, Tank, or LP Gas | 210 (0.9%) | 446 (3.0%) |
| Electricity | 2,139 (9.7%) | 2,902 (19.6%) |
| Fuel Oil or Kerosene | 2 (0.0%) | 0 (0.0%) |
| Coal or Coke | 0 (0.0%) | 0 (0.0%) |
| All other Fuels | 994 (4.5%) | 310 (2.1%) |
| No Fuel Used | 219 (1.0%) | 83 (0.6%) |
| Total | 22,012 (100.0%) | 14,830 (100.0%) |
Household Vehicle Usage in Victorville
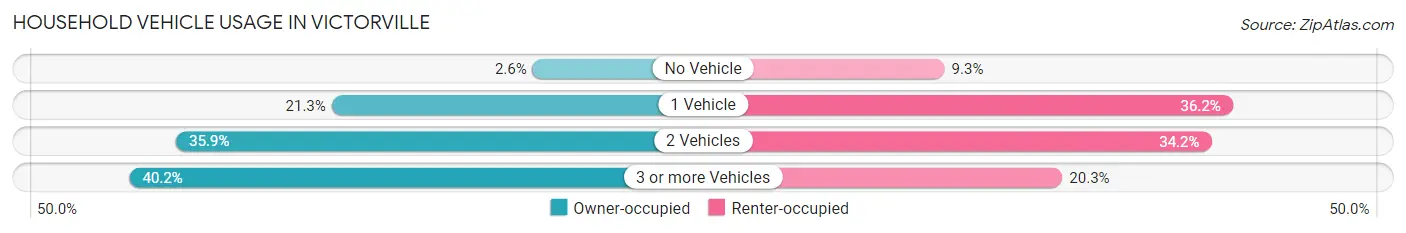
| Vehicles per Household | Owner-occupied | Renter-occupied |
| No Vehicle | 568 (2.6%) | 1,380 (9.3%) |
| 1 Vehicle | 4,698 (21.3%) | 5,367 (36.2%) |
| 2 Vehicles | 7,894 (35.9%) | 5,072 (34.2%) |
| 3 or more Vehicles | 8,852 (40.2%) | 3,011 (20.3%) |
| Total | 22,012 (100.0%) | 14,830 (100.0%) |
Real Estate & Mortgages in Victorville
Real Estate and Mortgage Overview in Victorville
| Characteristic | Without Mortgage | With Mortgage |
| Housing Units | 5,964 | 16,048 |
| Median Property Value | $265,200 | $312,700 |
| Median Household Income | $63,000 | $2,791 |
| Monthly Housing Costs | $539 | $463 |
| Real Estate Taxes | $1,843 | $303 |
Property Value by Mortgage Status in Victorville
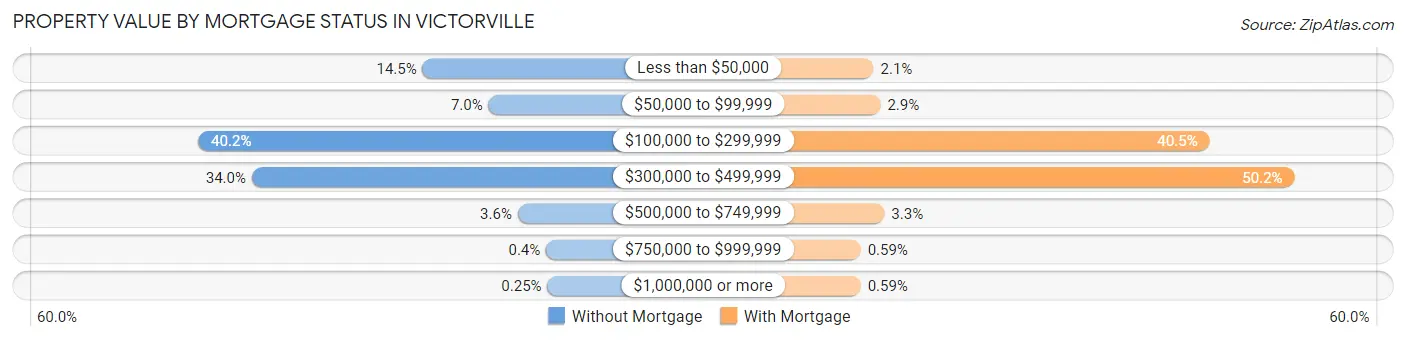
| Property Value | Without Mortgage | With Mortgage |
| Less than $50,000 | 866 (14.5%) | 330 (2.1%) |
| $50,000 to $99,999 | 416 (7.0%) | 458 (2.9%) |
| $100,000 to $299,999 | 2,396 (40.2%) | 6,492 (40.5%) |
| $300,000 to $499,999 | 2,030 (34.0%) | 8,048 (50.1%) |
| $500,000 to $749,999 | 217 (3.6%) | 530 (3.3%) |
| $750,000 to $999,999 | 24 (0.4%) | 95 (0.6%) |
| $1,000,000 or more | 15 (0.3%) | 95 (0.6%) |
| Total | 5,964 (100.0%) | 16,048 (100.0%) |
Household Income by Mortgage Status in Victorville
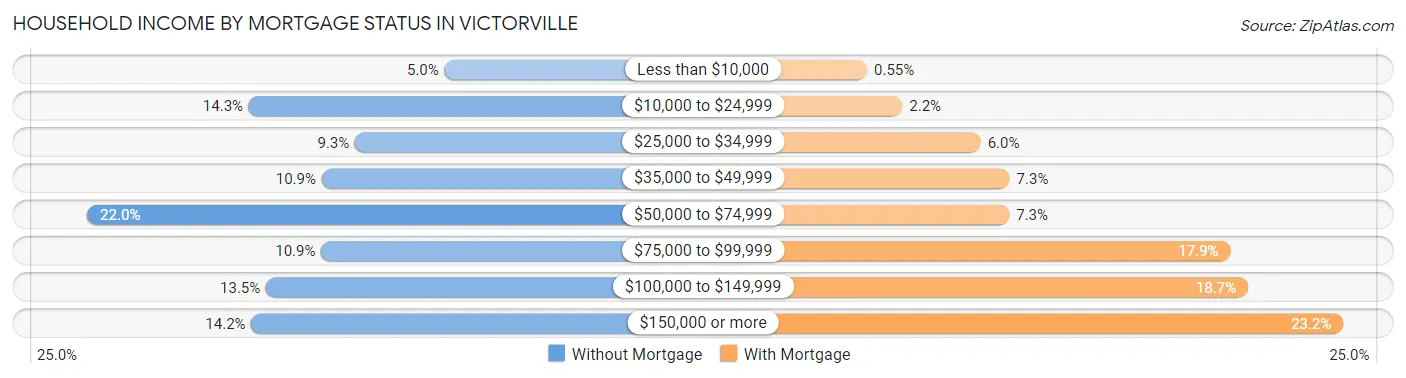
| Household Income | Without Mortgage | With Mortgage |
| Less than $10,000 | 298 (5.0%) | 88 (0.5%) |
| $10,000 to $24,999 | 854 (14.3%) | 358 (2.2%) |
| $25,000 to $34,999 | 552 (9.3%) | 956 (6.0%) |
| $35,000 to $49,999 | 647 (10.8%) | 1,178 (7.3%) |
| $50,000 to $74,999 | 1,313 (22.0%) | 1,175 (7.3%) |
| $75,000 to $99,999 | 648 (10.9%) | 2,864 (17.8%) |
| $100,000 to $149,999 | 805 (13.5%) | 3,000 (18.7%) |
| $150,000 or more | 847 (14.2%) | 3,726 (23.2%) |
| Total | 5,964 (100.0%) | 16,048 (100.0%) |
Property Value to Household Income Ratio in Victorville
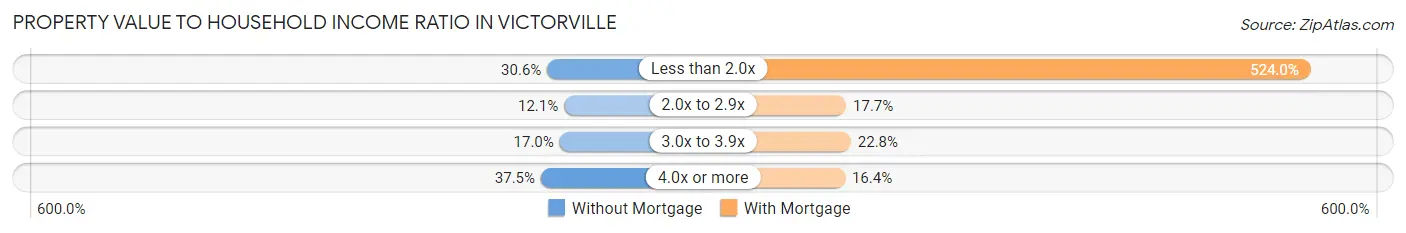
| Value-to-Income Ratio | Without Mortgage | With Mortgage |
| Less than 2.0x | 1,825 (30.6%) | 84,090 (524.0%) |
| 2.0x to 2.9x | 724 (12.1%) | 2,834 (17.7%) |
| 3.0x to 3.9x | 1,014 (17.0%) | 3,660 (22.8%) |
| 4.0x or more | 2,234 (37.5%) | 2,634 (16.4%) |
| Total | 5,964 (100.0%) | 16,048 (100.0%) |
Real Estate Taxes by Mortgage Status in Victorville
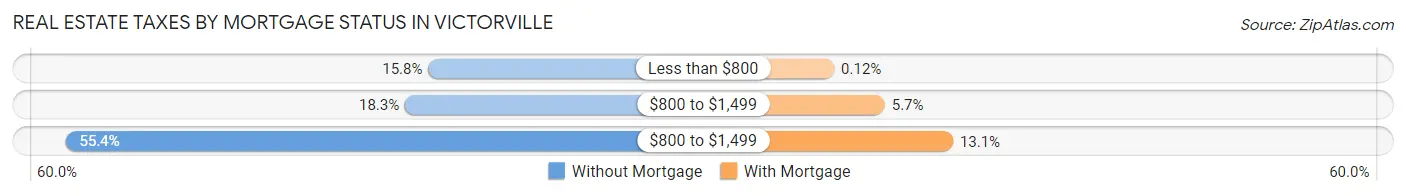
| Property Taxes | Without Mortgage | With Mortgage |
| Less than $800 | 940 (15.8%) | 20 (0.1%) |
| $800 to $1,499 | 1,092 (18.3%) | 910 (5.7%) |
| $800 to $1,499 | 3,305 (55.4%) | 2,109 (13.1%) |
| Total | 5,964 (100.0%) | 16,048 (100.0%) |
Health & Disability in Victorville
Health Insurance Coverage by Age in Victorville
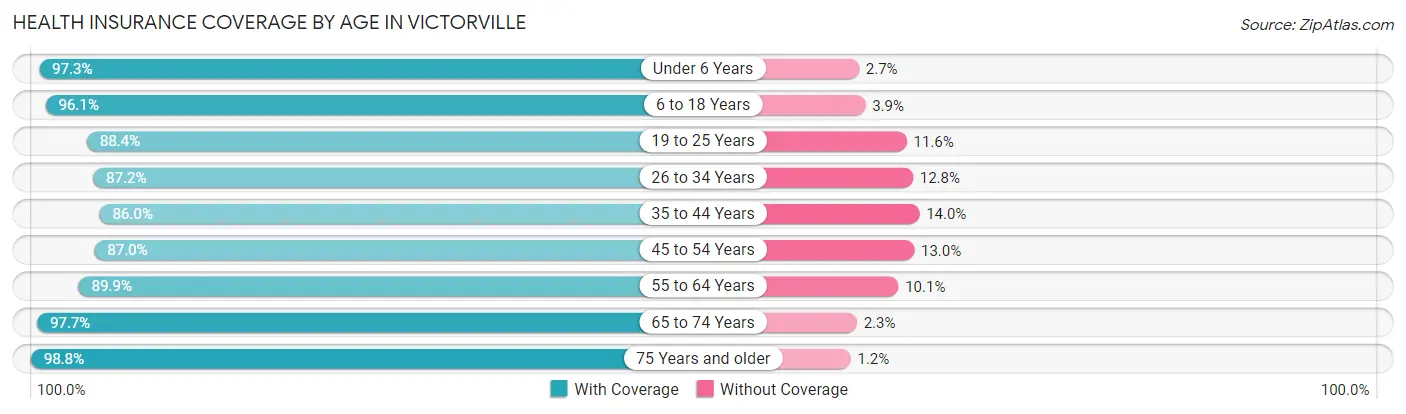
| Age Bracket | With Coverage | Without Coverage |
| Under 6 Years | 11,432 (97.3%) | 319 (2.7%) |
| 6 to 18 Years | 30,144 (96.1%) | 1,224 (3.9%) |
| 19 to 25 Years | 11,356 (88.4%) | 1,492 (11.6%) |
| 26 to 34 Years | 14,349 (87.2%) | 2,102 (12.8%) |
| 35 to 44 Years | 15,529 (86.0%) | 2,522 (14.0%) |
| 45 to 54 Years | 12,207 (87.0%) | 1,825 (13.0%) |
| 55 to 64 Years | 11,204 (89.9%) | 1,253 (10.1%) |
| 65 to 74 Years | 7,796 (97.7%) | 184 (2.3%) |
| 75 Years and older | 5,304 (98.8%) | 62 (1.2%) |
| Total | 119,321 (91.6%) | 10,983 (8.4%) |
Health Insurance Coverage by Citizenship Status in Victorville
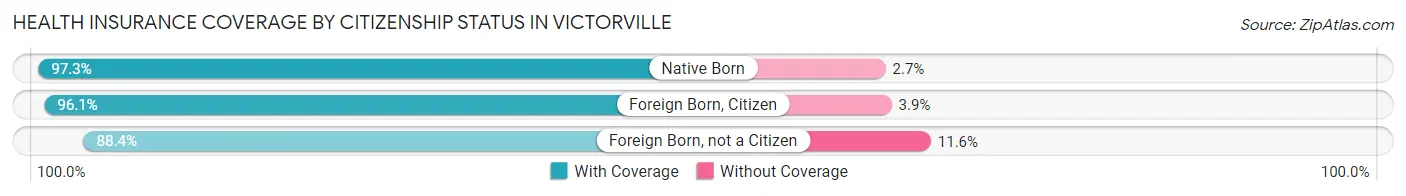
| Citizenship Status | With Coverage | Without Coverage |
| Native Born | 11,432 (97.3%) | 319 (2.7%) |
| Foreign Born, Citizen | 30,144 (96.1%) | 1,224 (3.9%) |
| Foreign Born, not a Citizen | 11,356 (88.4%) | 1,492 (11.6%) |
Health Insurance Coverage by Household Income in Victorville
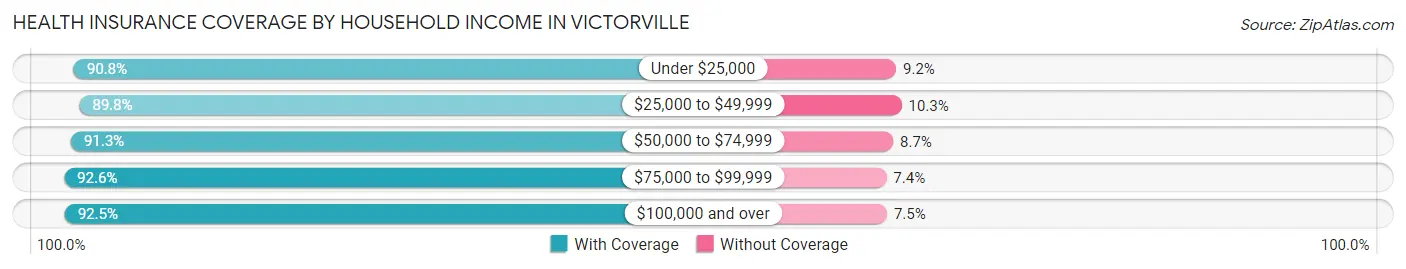
| Household Income | With Coverage | Without Coverage |
| Under $25,000 | 14,763 (90.8%) | 1,502 (9.2%) |
| $25,000 to $49,999 | 21,169 (89.7%) | 2,418 (10.2%) |
| $50,000 to $74,999 | 23,147 (91.3%) | 2,199 (8.7%) |
| $75,000 to $99,999 | 16,134 (92.6%) | 1,294 (7.4%) |
| $100,000 and over | 43,873 (92.5%) | 3,565 (7.5%) |
Public vs Private Health Insurance Coverage by Age in Victorville
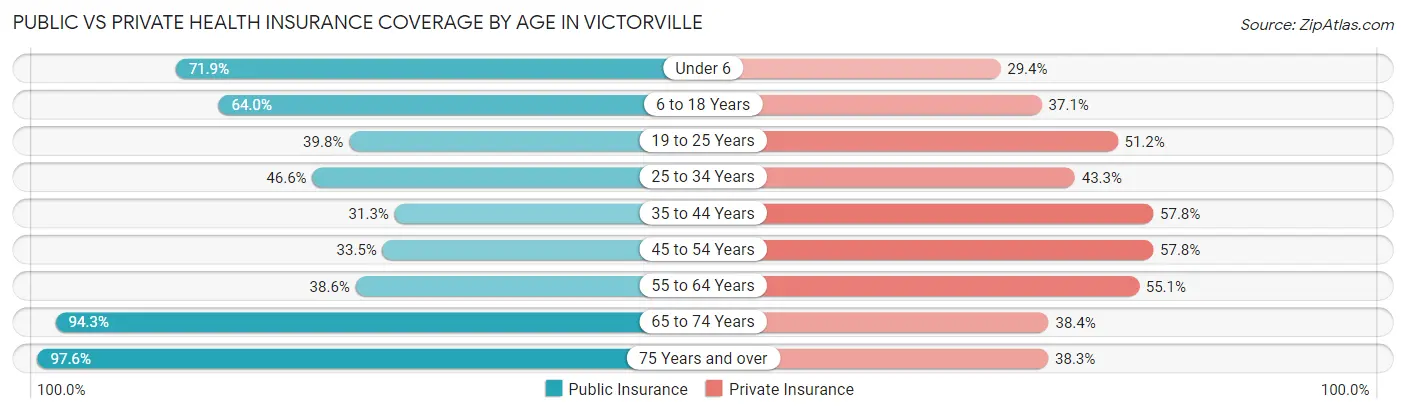
| Age Bracket | Public Insurance | Private Insurance |
| Under 6 | 8,454 (71.9%) | 3,457 (29.4%) |
| 6 to 18 Years | 20,073 (64.0%) | 11,639 (37.1%) |
| 19 to 25 Years | 5,109 (39.8%) | 6,576 (51.2%) |
| 25 to 34 Years | 7,663 (46.6%) | 7,115 (43.2%) |
| 35 to 44 Years | 5,651 (31.3%) | 10,430 (57.8%) |
| 45 to 54 Years | 4,706 (33.5%) | 8,107 (57.8%) |
| 55 to 64 Years | 4,802 (38.6%) | 6,867 (55.1%) |
| 65 to 74 Years | 7,521 (94.3%) | 3,063 (38.4%) |
| 75 Years and over | 5,236 (97.6%) | 2,055 (38.3%) |
| Total | 69,215 (53.1%) | 59,309 (45.5%) |
Disability Status by Sex by Age in Victorville
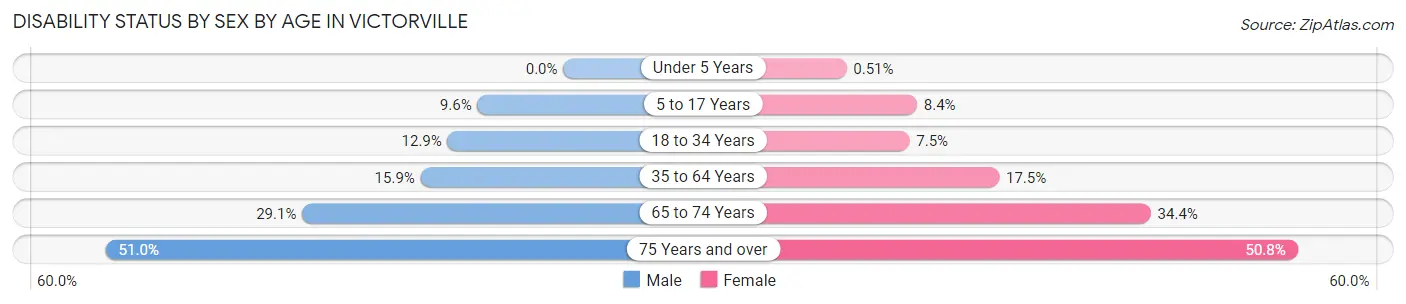
| Age Bracket | Male | Female |
| Under 5 Years | 0 (0.0%) | 25 (0.5%) |
| 5 to 17 Years | 1,532 (9.6%) | 1,246 (8.4%) |
| 18 to 34 Years | 2,014 (12.9%) | 1,214 (7.5%) |
| 35 to 64 Years | 3,401 (15.9%) | 4,052 (17.5%) |
| 65 to 74 Years | 1,143 (29.1%) | 1,393 (34.4%) |
| 75 Years and over | 1,107 (51.0%) | 1,621 (50.7%) |
Disability Class by Sex by Age in Victorville
Disability Class: Hearing Difficulty
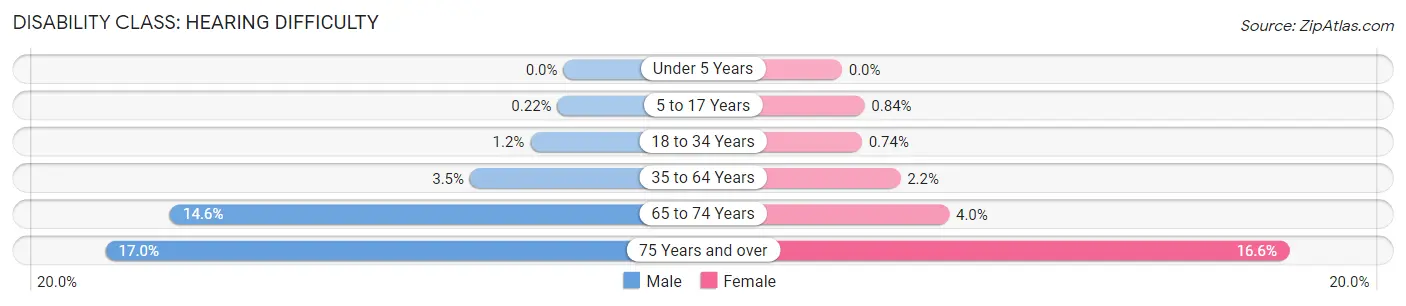
| Age Bracket | Male | Female |
| Under 5 Years | 0 (0.0%) | 0 (0.0%) |
| 5 to 17 Years | 35 (0.2%) | 125 (0.8%) |
| 18 to 34 Years | 192 (1.2%) | 120 (0.7%) |
| 35 to 64 Years | 742 (3.5%) | 503 (2.2%) |
| 65 to 74 Years | 574 (14.6%) | 161 (4.0%) |
| 75 Years and over | 369 (17.0%) | 530 (16.6%) |
Disability Class: Vision Difficulty
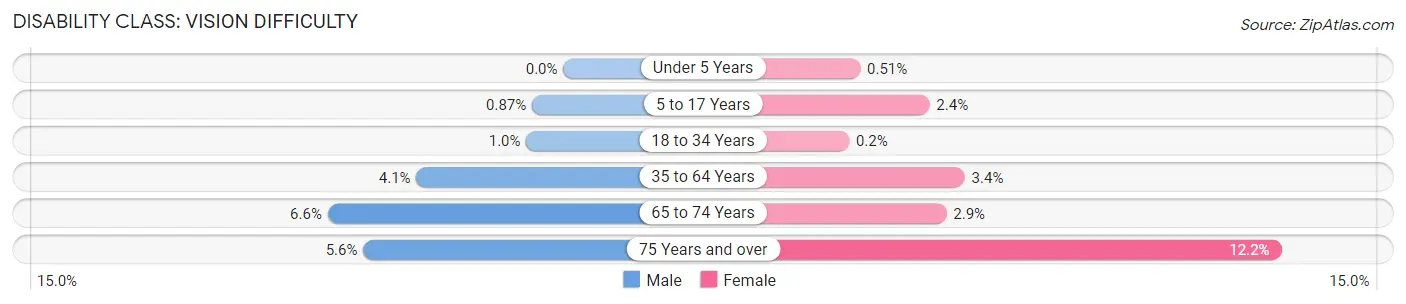
| Age Bracket | Male | Female |
| Under 5 Years | 0 (0.0%) | 25 (0.5%) |
| 5 to 17 Years | 139 (0.9%) | 364 (2.4%) |
| 18 to 34 Years | 161 (1.0%) | 33 (0.2%) |
| 35 to 64 Years | 876 (4.1%) | 791 (3.4%) |
| 65 to 74 Years | 258 (6.6%) | 118 (2.9%) |
| 75 Years and over | 121 (5.6%) | 391 (12.2%) |
Disability Class: Cognitive Difficulty
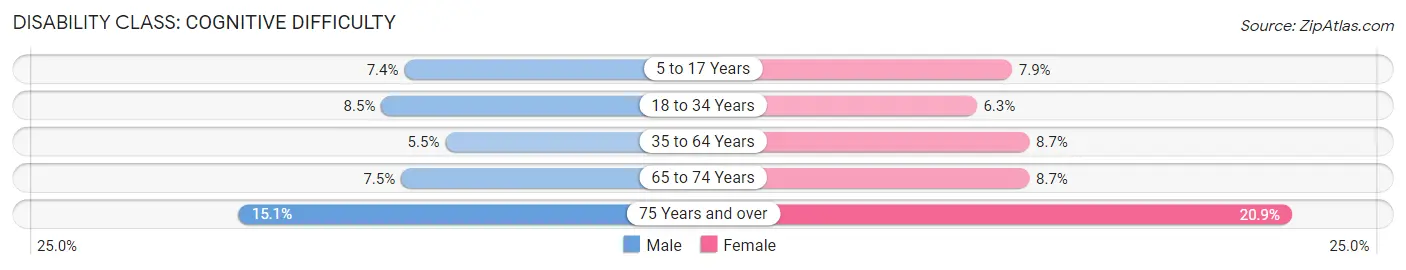
| Age Bracket | Male | Female |
| 5 to 17 Years | 1,182 (7.4%) | 1,176 (7.9%) |
| 18 to 34 Years | 1,321 (8.5%) | 1,009 (6.2%) |
| 35 to 64 Years | 1,172 (5.5%) | 2,010 (8.7%) |
| 65 to 74 Years | 296 (7.5%) | 352 (8.7%) |
| 75 Years and over | 327 (15.1%) | 667 (20.9%) |
Disability Class: Ambulatory Difficulty
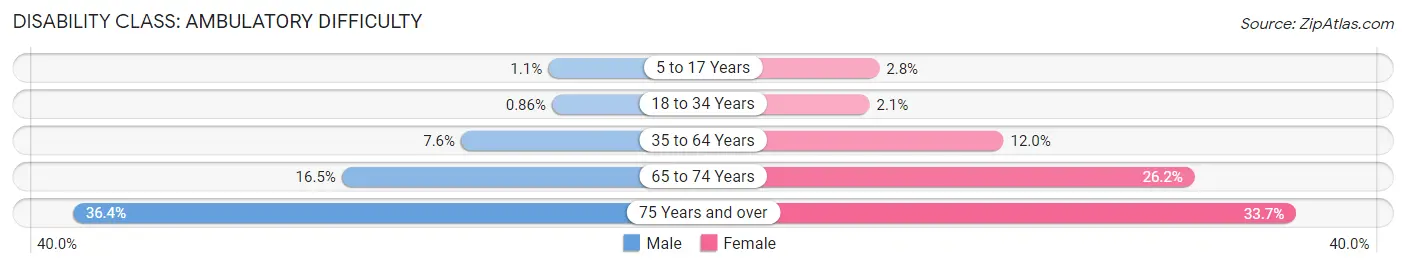
| Age Bracket | Male | Female |
| 5 to 17 Years | 183 (1.1%) | 416 (2.8%) |
| 18 to 34 Years | 135 (0.9%) | 333 (2.1%) |
| 35 to 64 Years | 1,629 (7.6%) | 2,779 (12.0%) |
| 65 to 74 Years | 647 (16.5%) | 1,061 (26.2%) |
| 75 Years and over | 791 (36.4%) | 1,077 (33.7%) |
Disability Class: Self-Care Difficulty
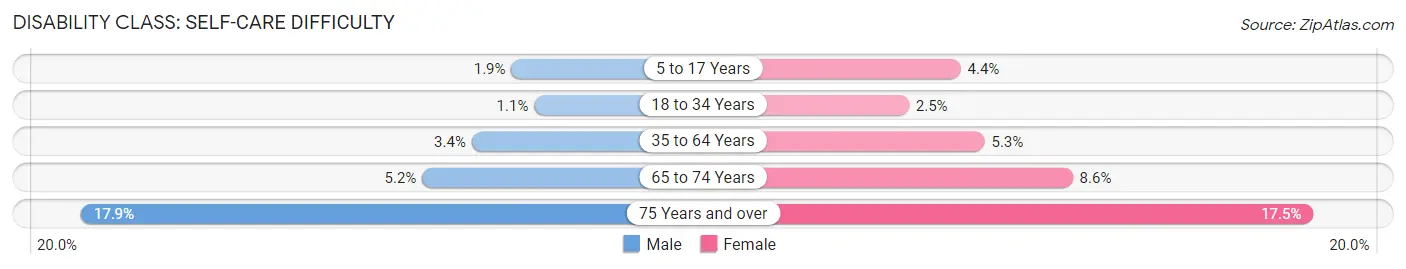
| Age Bracket | Male | Female |
| 5 to 17 Years | 310 (1.9%) | 658 (4.4%) |
| 18 to 34 Years | 169 (1.1%) | 402 (2.5%) |
| 35 to 64 Years | 728 (3.4%) | 1,226 (5.3%) |
| 65 to 74 Years | 206 (5.2%) | 347 (8.6%) |
| 75 Years and over | 389 (17.9%) | 559 (17.5%) |
Technology Access in Victorville
Computing Device Access in Victorville
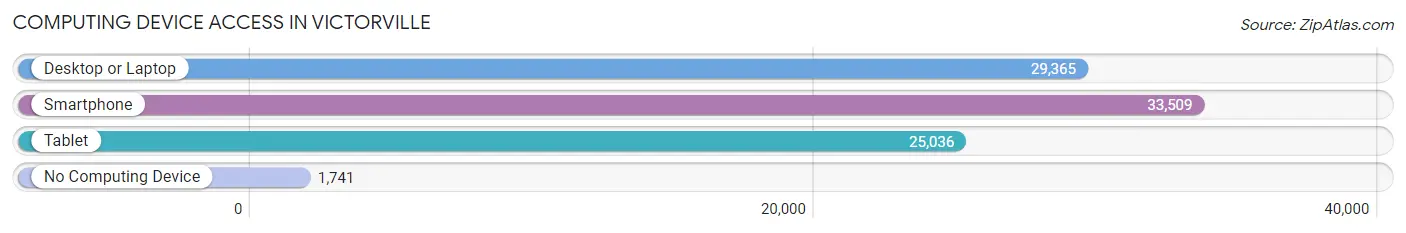
| Device Type | # Households | % Households |
| Desktop or Laptop | 29,365 | 79.7% |
| Smartphone | 33,509 | 90.9% |
| Tablet | 25,036 | 68.0% |
| No Computing Device | 1,741 | 4.7% |
| Total | 36,842 | 100.0% |
Internet Access in Victorville
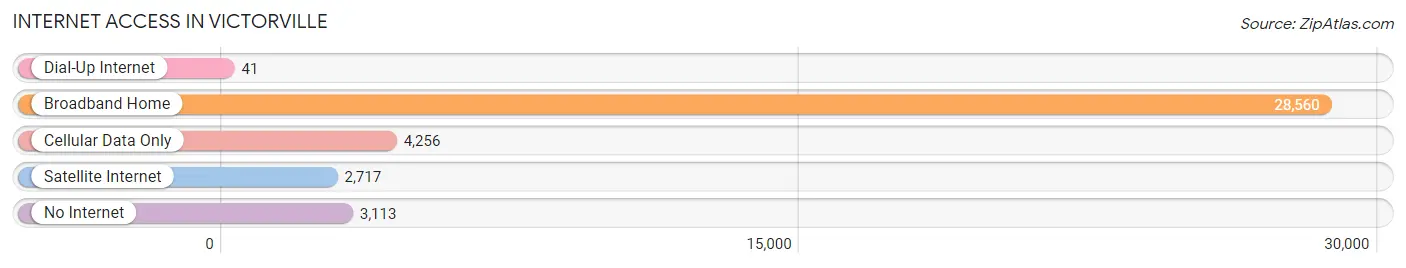
| Internet Type | # Households | % Households |
| Dial-Up Internet | 41 | 0.1% |
| Broadband Home | 28,560 | 77.5% |
| Cellular Data Only | 4,256 | 11.6% |
| Satellite Internet | 2,717 | 7.4% |
| No Internet | 3,113 | 8.5% |
| Total | 36,842 | 100.0% |
Victorville Summary
Victorville is a city located in the Mojave Desert of San Bernardino County, California. It is situated in the Victor Valley, which is surrounded by the San Bernardino Mountains. The city is located approximately 85 miles northeast of Los Angeles and 35 miles south of Barstow. As of the 2010 census, the population of Victorville was 115,903, making it the largest city in the High Desert region of the Mojave Desert.
History
The area that is now Victorville was first inhabited by the Serrano Indians, who were the original inhabitants of the Mojave Desert. The first Europeans to settle in the area were the Mormon pioneers, who arrived in 1858. The area was named Victorville in 1861, after Jacob Nash Victor, a California State Engineer.
Victorville was officially incorporated as a city in 1962. During the 1960s and 1970s, the city experienced rapid growth due to the construction of the nearby Mojave Freeway (Interstate 15). This growth was further accelerated by the opening of the nearby George Air Force Base in the 1980s.
Geography
Victorville is located in the Mojave Desert of San Bernardino County, California. It is situated in the Victor Valley, which is surrounded by the San Bernardino Mountains. The city is located approximately 85 miles northeast of Los Angeles and 35 miles south of Barstow.
The city has a total area of 73.2 square miles, of which 73.1 square miles is land and 0.1 square miles is water. The elevation of Victorville is 2,890 feet above sea level.
Economy
Victorville is a major economic center in the High Desert region of the Mojave Desert. The city is home to several major employers, including the Southern California Logistics Airport, the Mojave Air and Space Port, and the Victor Valley College.
The city is also home to several major retail centers, including the Mall of Victor Valley, the Victor Valley Mall, and the Victor Valley Town Center.
Demographics
As of the 2010 census, the population of Victorville was 115,903. The racial makeup of the city was 57.2% White, 11.3% African American, 1.2% Native American, 5.2% Asian, 0.3% Pacific Islander, and 24.8% from other races. Hispanic or Latino of any race were 44.2% of the population.
The median income for a household in Victorville was $45,837, and the median income for a family was $51,837. The per capita income for the city was $20,837. About 17.2% of families and 20.7% of the population were below the poverty line, including 28.3% of those under age 18 and 10.2% of those age 65 or over.
Common Questions
What is Per Capita Income in Victorville?
Per Capita income in Victorville is $24,811.
What is the Median Family Income in Victorville?
Median Family Income in Victorville is $71,573.
What is the Median Household income in Victorville?
Median Household Income in Victorville is $65,746.
What is Income or Wage Gap in Victorville?
Income or Wage Gap in Victorville is 32.9%.
Women in Victorville earn 67.1 cents for every dollar earned by a man.
What is Family Income Deficit in Victorville?
Family Income Deficit in Victorville is $12,117.
Families that are below poverty line in Victorville earn $12,117 less on average than the poverty threshold level.
What is Inequality or Gini Index in Victorville?
Inequality or Gini Index in Victorville is 0.46.
What is the Total Population of Victorville?
Total Population of Victorville is 134,417.
What is the Total Male Population of Victorville?
Total Male Population of Victorville is 67,584.
What is the Total Female Population of Victorville?
Total Female Population of Victorville is 66,833.
What is the Ratio of Males per 100 Females in Victorville?
There are 101.12 Males per 100 Females in Victorville.
What is the Ratio of Females per 100 Males in Victorville?
There are 98.89 Females per 100 Males in Victorville.
What is the Median Population Age in Victorville?
Median Population Age in Victorville is 31.8 Years.
What is the Average Family Size in Victorville
Average Family Size in Victorville is 4.0 People.
What is the Average Household Size in Victorville
Average Household Size in Victorville is 3.5 People.
How Large is the Labor Force in Victorville?
There are 54,838 People in the Labor Forcein in Victorville.
What is the Percentage of People in the Labor Force in Victorville?
55.9% of People are in the Labor Force in Victorville.
What is the Unemployment Rate in Victorville?
Unemployment Rate in Victorville is 10.3%.