South Gate, CA Map & Demographics
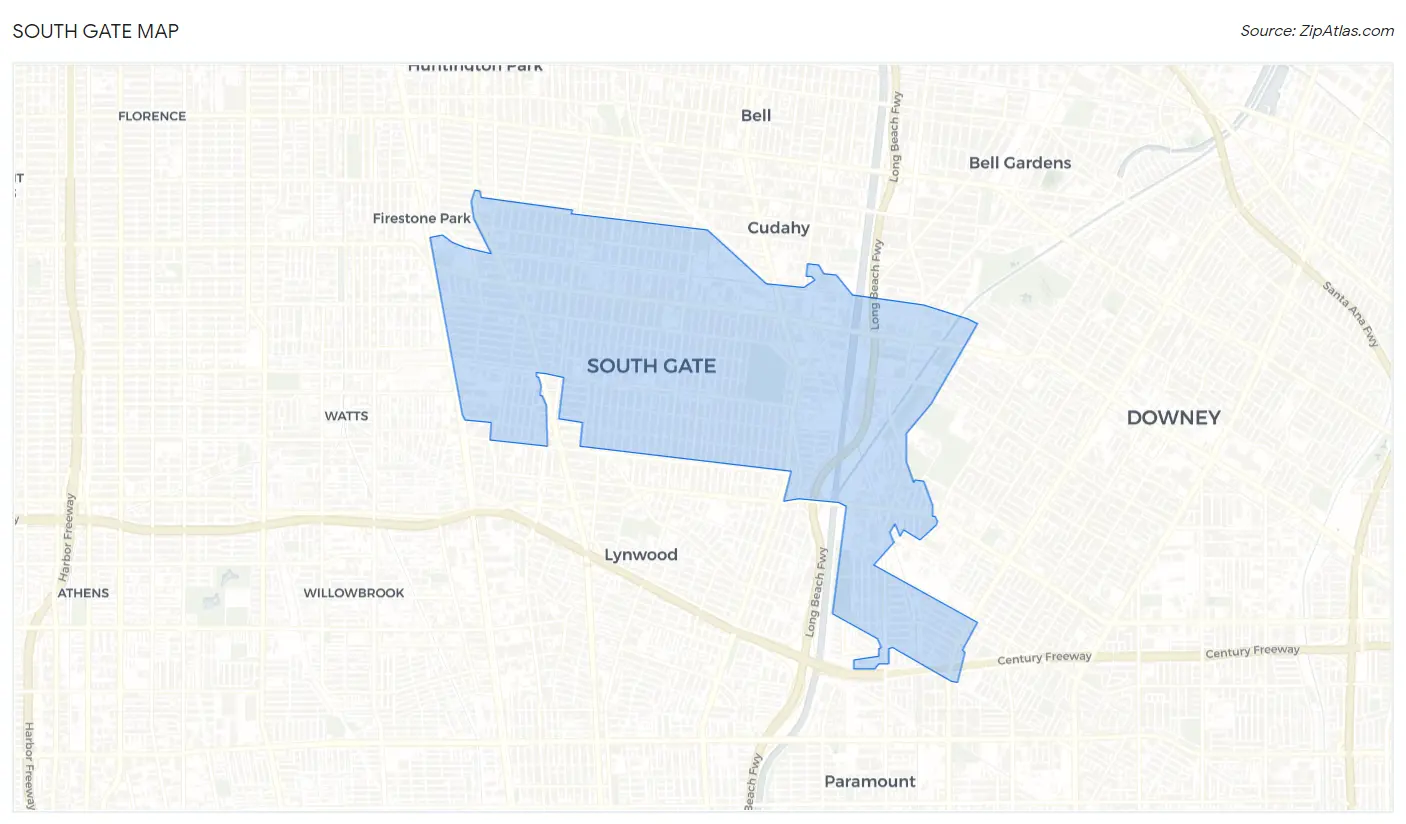
South Gate Map
South Gate Overview
$22,927
PER CAPITA INCOME
$68,884
AVG FAMILY INCOME
$67,188
AVG HOUSEHOLD INCOME
21.3%
WAGE / INCOME GAP [ % ]
78.7¢/ $1
WAGE / INCOME GAP [ $ ]
$9,093
FAMILY INCOME DEFICIT
0.41
INEQUALITY / GINI INDEX
92,381
TOTAL POPULATION
45,530
MALE POPULATION
46,851
FEMALE POPULATION
97.18
MALES / 100 FEMALES
102.90
FEMALES / 100 MALES
33.7
MEDIAN AGE
4.1
AVG FAMILY SIZE
3.9
AVG HOUSEHOLD SIZE
47,122
LABOR FORCE [ PEOPLE ]
65.3%
PERCENT IN LABOR FORCE
7.9%
UNEMPLOYMENT RATE
South Gate Zip Codes
South Gate Area Codes
Income in South Gate
Income Overview in South Gate
Per Capita Income in South Gate is $22,927, while median incomes of families and households are $68,884 and $67,188 respectively.
| Characteristic | Number | Measure |
| Per Capita Income | 92,381 | $22,927 |
| Median Family Income | 19,991 | $68,884 |
| Mean Family Income | 19,991 | $84,411 |
| Median Household Income | 23,920 | $67,188 |
| Mean Household Income | 23,920 | $82,579 |
| Income Deficit | 19,991 | $9,093 |
| Wage / Income Gap (%) | 92,381 | 21.32% |
| Wage / Income Gap ($) | 92,381 | 78.68¢ per $1 |
| Gini / Inequality Index | 92,381 | 0.41 |
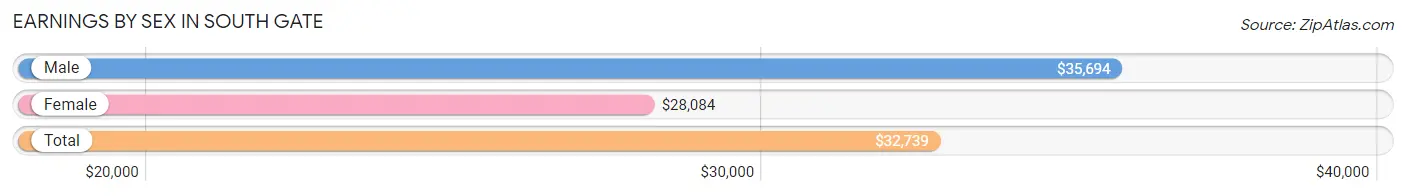
Earnings by Sex in South Gate
Average Earnings in South Gate are $32,739, $35,694 for men and $28,084 for women, a difference of 21.3%.
| Sex | Number | Average Earnings |
| Male | 26,104 (56.3%) | $35,694 |
| Female | 20,267 (43.7%) | $28,084 |
| Total | 46,371 (100.0%) | $32,739 |
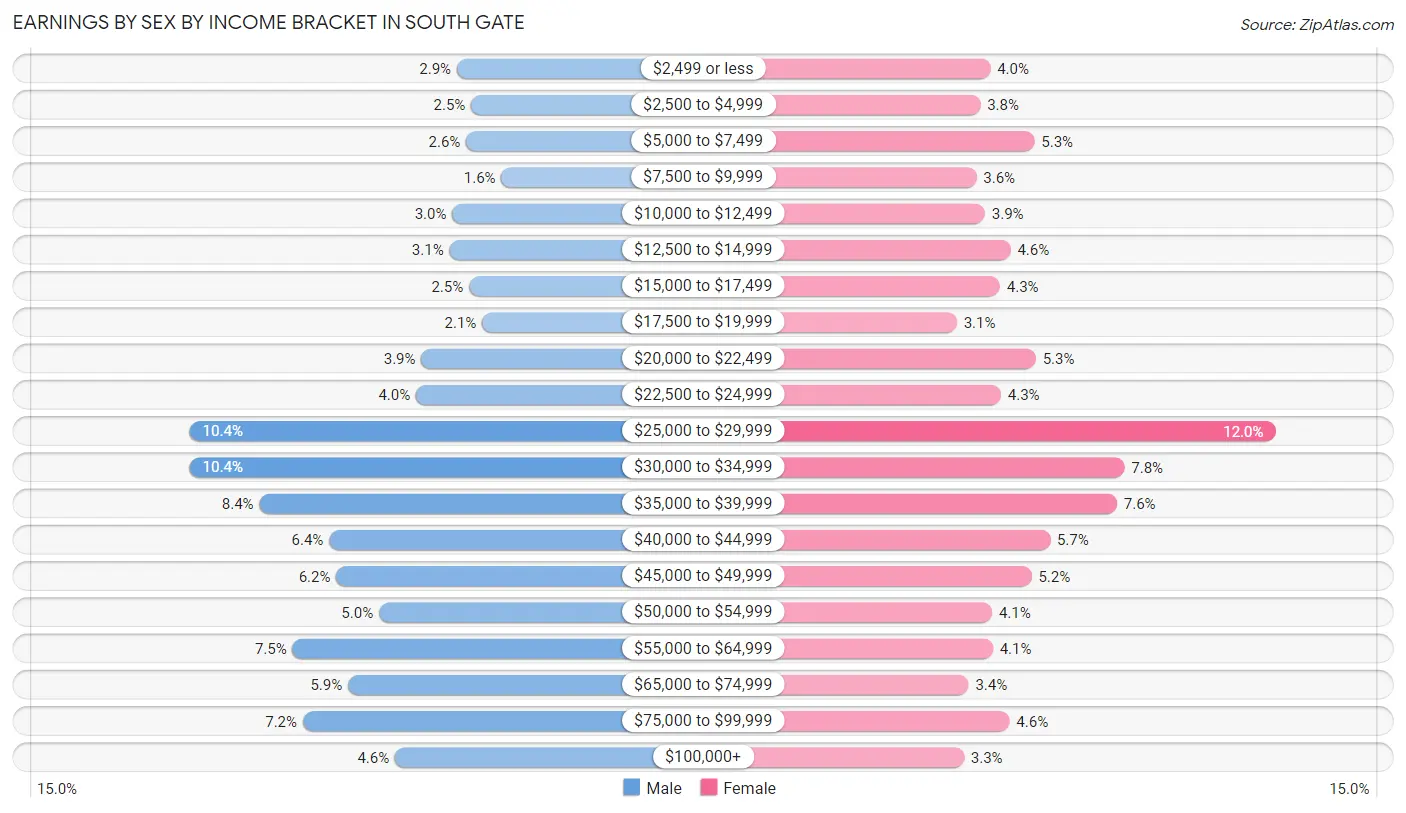
Earnings by Sex by Income Bracket in South Gate
The most common earnings brackets in South Gate are $25,000 to $29,999 for men (2,704 | 10.4%) and $25,000 to $29,999 for women (2,440 | 12.0%).
| Income | Male | Female |
| $2,499 or less | 744 (2.9%) | 816 (4.0%) |
| $2,500 to $4,999 | 640 (2.5%) | 761 (3.7%) |
| $5,000 to $7,499 | 675 (2.6%) | 1,069 (5.3%) |
| $7,500 to $9,999 | 418 (1.6%) | 737 (3.6%) |
| $10,000 to $12,499 | 778 (3.0%) | 786 (3.9%) |
| $12,500 to $14,999 | 799 (3.1%) | 933 (4.6%) |
| $15,000 to $17,499 | 656 (2.5%) | 872 (4.3%) |
| $17,500 to $19,999 | 558 (2.1%) | 627 (3.1%) |
| $20,000 to $22,499 | 1,004 (3.8%) | 1,076 (5.3%) |
| $22,500 to $24,999 | 1,043 (4.0%) | 877 (4.3%) |
| $25,000 to $29,999 | 2,704 (10.4%) | 2,440 (12.0%) |
| $30,000 to $34,999 | 2,704 (10.4%) | 1,580 (7.8%) |
| $35,000 to $39,999 | 2,193 (8.4%) | 1,539 (7.6%) |
| $40,000 to $44,999 | 1,681 (6.4%) | 1,158 (5.7%) |
| $45,000 to $49,999 | 1,628 (6.2%) | 1,051 (5.2%) |
| $50,000 to $54,999 | 1,316 (5.0%) | 827 (4.1%) |
| $55,000 to $64,999 | 1,949 (7.5%) | 830 (4.1%) |
| $65,000 to $74,999 | 1,542 (5.9%) | 694 (3.4%) |
| $75,000 to $99,999 | 1,875 (7.2%) | 927 (4.6%) |
| $100,000+ | 1,197 (4.6%) | 667 (3.3%) |
| Total | 26,104 (100.0%) | 20,267 (100.0%) |
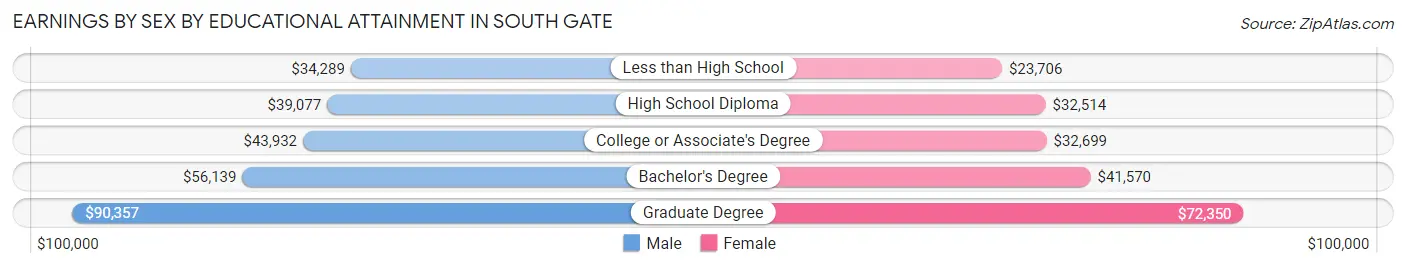
Earnings by Sex by Educational Attainment in South Gate
Average earnings in South Gate are $39,144 for men and $30,756 for women, a difference of 21.4%. Men with an educational attainment of graduate degree enjoy the highest average annual earnings of $90,357, while those with less than high school education earn the least with $34,289. Women with an educational attainment of graduate degree earn the most with the average annual earnings of $72,350, while those with less than high school education have the smallest earnings of $23,706.
| Educational Attainment | Male Income | Female Income |
| Less than High School | $34,289 | $23,706 |
| High School Diploma | $39,077 | $32,514 |
| College or Associate's Degree | $43,932 | $32,699 |
| Bachelor's Degree | $56,139 | $41,570 |
| Graduate Degree | $90,357 | $72,350 |
| Total | $39,144 | $30,756 |
Family Income in South Gate
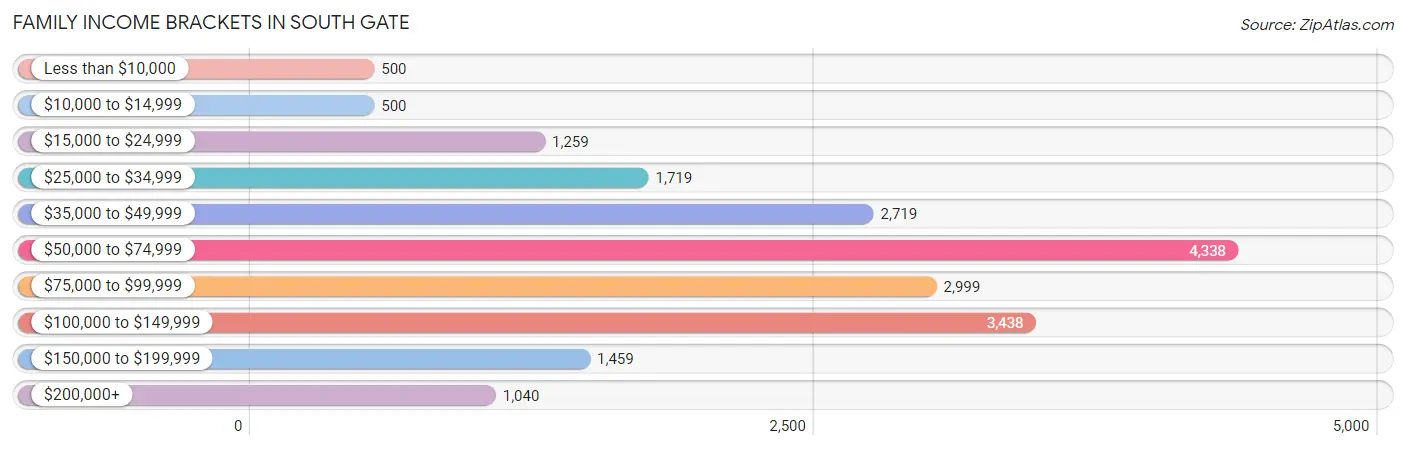
Family Income Brackets in South Gate
According to the South Gate family income data, there are 4,338 families falling into the $50,000 to $74,999 income range, which is the most common income bracket and makes up 21.7% of all families. Conversely, the less than $10,000 income bracket is the least frequent group with only 500 families (2.5%) belonging to this category.
| Income Bracket | # Families | % Families |
| Less than $10,000 | 500 | 2.5% |
| $10,000 to $14,999 | 500 | 2.5% |
| $15,000 to $24,999 | 1,259 | 6.3% |
| $25,000 to $34,999 | 1,719 | 8.6% |
| $35,000 to $49,999 | 2,719 | 13.6% |
| $50,000 to $74,999 | 4,338 | 21.7% |
| $75,000 to $99,999 | 2,999 | 15.0% |
| $100,000 to $149,999 | 3,438 | 17.2% |
| $150,000 to $199,999 | 1,459 | 7.3% |
| $200,000+ | 1,040 | 5.2% |
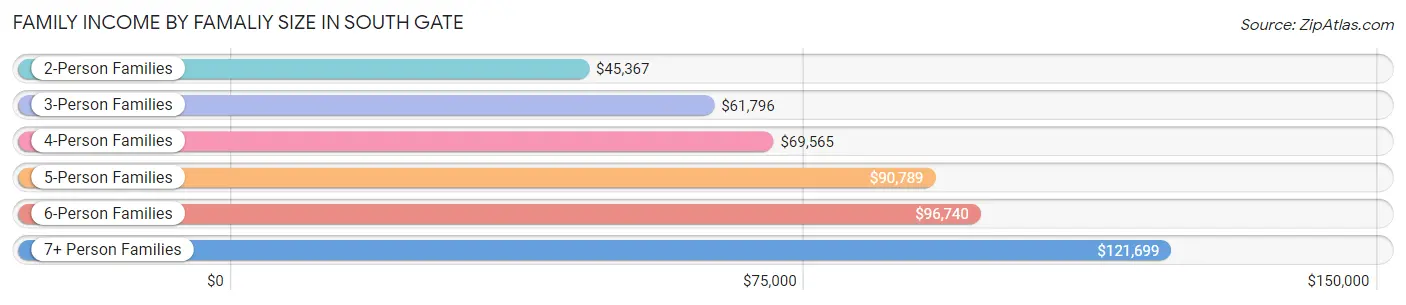
Family Income by Famaliy Size in South Gate
7+ person families (1,301 | 6.5%) account for the highest median family income in South Gate with $121,699 per family, while 2-person families (4,543 | 22.7%) have the highest median income of $22,684 per family member.
| Income Bracket | # Families | Median Income |
| 2-Person Families | 4,543 (22.7%) | $45,367 |
| 3-Person Families | 4,541 (22.7%) | $61,796 |
| 4-Person Families | 5,173 (25.9%) | $69,565 |
| 5-Person Families | 3,096 (15.5%) | $90,789 |
| 6-Person Families | 1,337 (6.7%) | $96,740 |
| 7+ Person Families | 1,301 (6.5%) | $121,699 |
| Total | 19,991 (100.0%) | $68,884 |
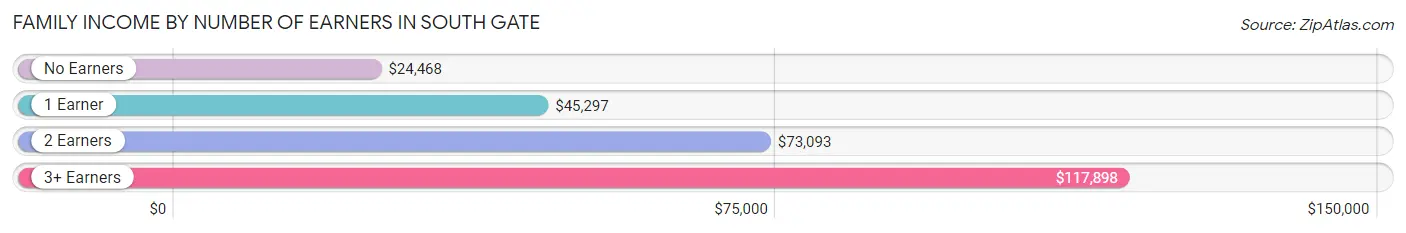
Family Income by Number of Earners in South Gate
The median family income in South Gate is $68,884, with families comprising 3+ earners (5,144) having the highest median family income of $117,898, while families with no earners (1,728) have the lowest median family income of $24,468, accounting for 25.7% and 8.6% of families, respectively.
| Number of Earners | # Families | Median Income |
| No Earners | 1,728 (8.6%) | $24,468 |
| 1 Earner | 6,209 (31.1%) | $45,297 |
| 2 Earners | 6,910 (34.6%) | $73,093 |
| 3+ Earners | 5,144 (25.7%) | $117,898 |
| Total | 19,991 (100.0%) | $68,884 |
Household Income in South Gate
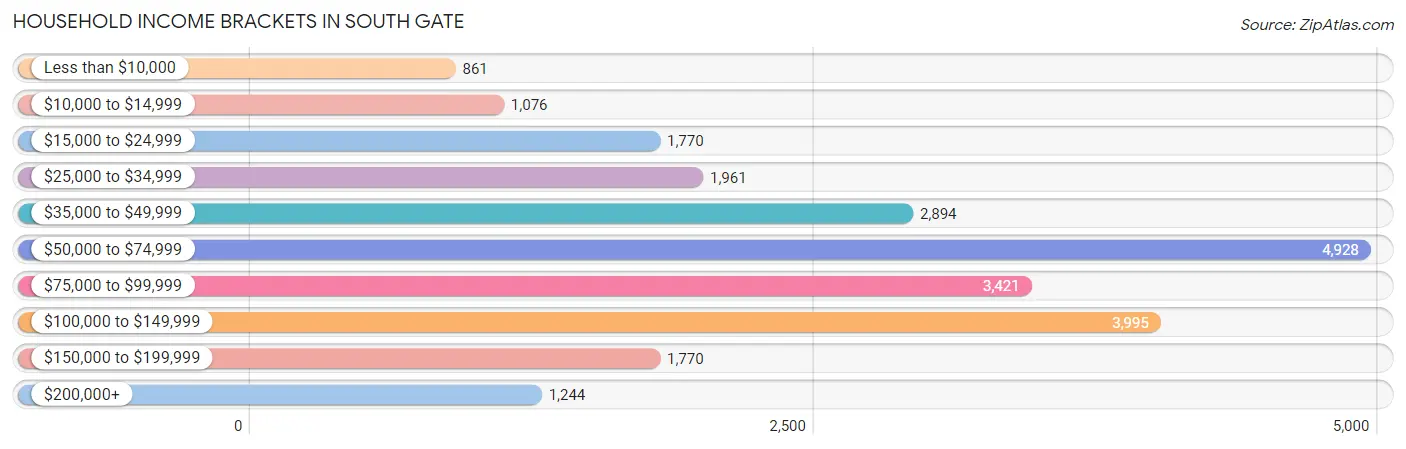
Household Income Brackets in South Gate
With 4,928 households falling in the category, the $50,000 to $74,999 income range is the most frequent in South Gate, accounting for 20.6% of all households. In contrast, only 861 households (3.6%) fall into the less than $10,000 income bracket, making it the least populous group.
| Income Bracket | # Households | % Households |
| Less than $10,000 | 861 | 3.6% |
| $10,000 to $14,999 | 1,076 | 4.5% |
| $15,000 to $24,999 | 1,770 | 7.4% |
| $25,000 to $34,999 | 1,961 | 8.2% |
| $35,000 to $49,999 | 2,894 | 12.1% |
| $50,000 to $74,999 | 4,928 | 20.6% |
| $75,000 to $99,999 | 3,421 | 14.3% |
| $100,000 to $149,999 | 3,995 | 16.7% |
| $150,000 to $199,999 | 1,770 | 7.4% |
| $200,000+ | 1,244 | 5.2% |
Household Income by Householder Age in South Gate
The median household income in South Gate is $67,188, with the highest median household income of $80,182 found in the 45 to 64 years age bracket for the primary householder. A total of 10,341 households (43.2%) fall into this category. Meanwhile, the 65+ years age bracket for the primary householder has the lowest median household income of $47,319, with 5,065 households (21.2%) in this group.
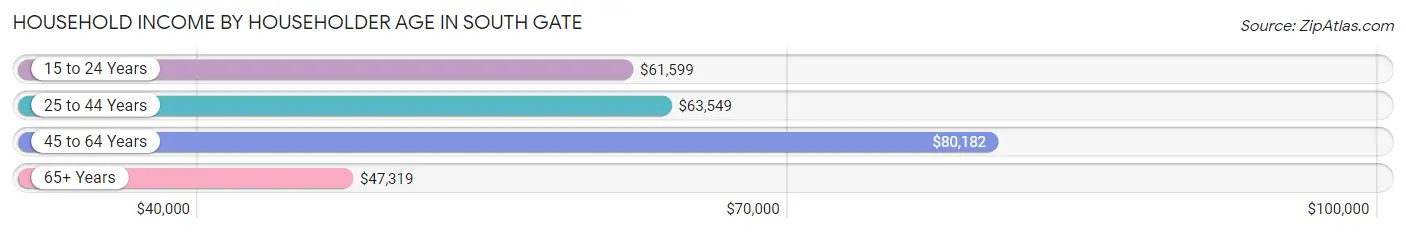
| Income Bracket | # Households | Median Income |
| 15 to 24 Years | 539 (2.2%) | $61,599 |
| 25 to 44 Years | 7,975 (33.3%) | $63,549 |
| 45 to 64 Years | 10,341 (43.2%) | $80,182 |
| 65+ Years | 5,065 (21.2%) | $47,319 |
| Total | 23,920 (100.0%) | $67,188 |
Poverty in South Gate
Income Below Poverty by Sex and Age in South Gate
With 12.0% poverty level for males and 15.4% for females among the residents of South Gate, 5 year old males and 5 year old females are the most vulnerable to poverty, with 87 males (25.5%) and 104 females (25.6%) in their respective age groups living below the poverty level.
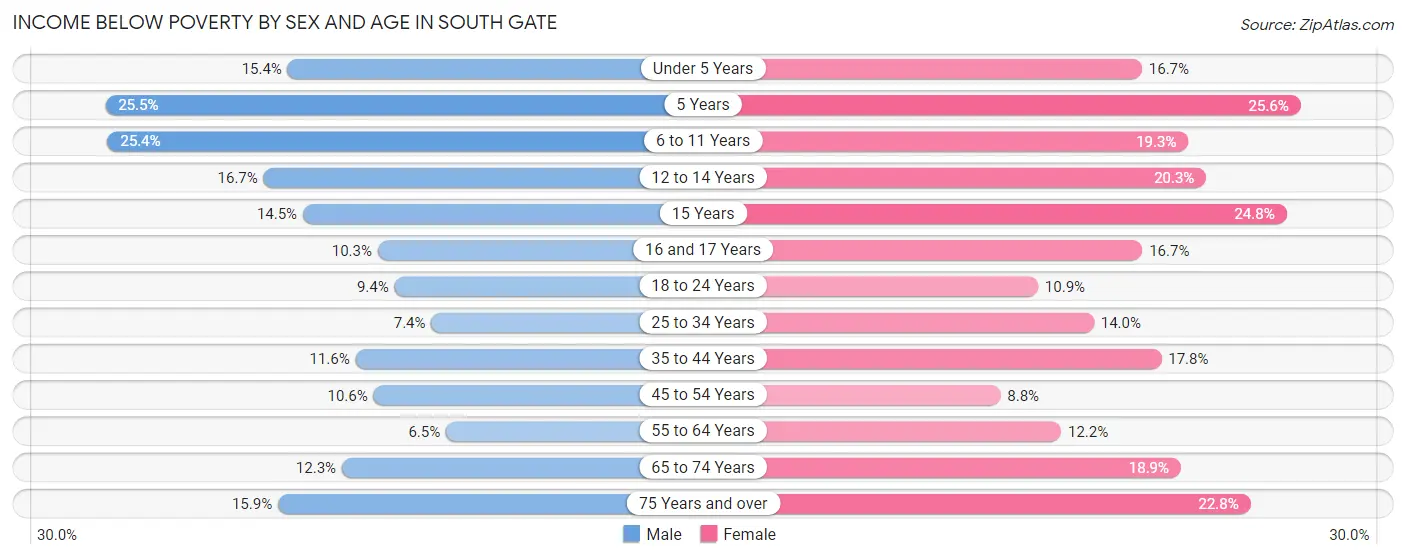
| Age Bracket | Male | Female |
| Under 5 Years | 448 (15.3%) | 405 (16.7%) |
| 5 Years | 87 (25.5%) | 104 (25.6%) |
| 6 to 11 Years | 1,051 (25.4%) | 706 (19.3%) |
| 12 to 14 Years | 314 (16.7%) | 526 (20.3%) |
| 15 Years | 123 (14.5%) | 177 (24.8%) |
| 16 and 17 Years | 127 (10.3%) | 249 (16.7%) |
| 18 to 24 Years | 475 (9.4%) | 564 (10.9%) |
| 25 to 34 Years | 544 (7.3%) | 1,017 (14.0%) |
| 35 to 44 Years | 675 (11.6%) | 1,096 (17.8%) |
| 45 to 54 Years | 675 (10.6%) | 498 (8.8%) |
| 55 to 64 Years | 313 (6.5%) | 648 (12.2%) |
| 65 to 74 Years | 392 (12.3%) | 675 (18.9%) |
| 75 Years and over | 212 (15.9%) | 523 (22.8%) |
| Total | 5,436 (12.0%) | 7,188 (15.4%) |
Income Above Poverty by Sex and Age in South Gate
According to the poverty statistics in South Gate, males aged 55 to 64 years and females aged 45 to 54 years are the age groups that are most secure financially, with 93.5% of males and 91.2% of females in these age groups living above the poverty line.
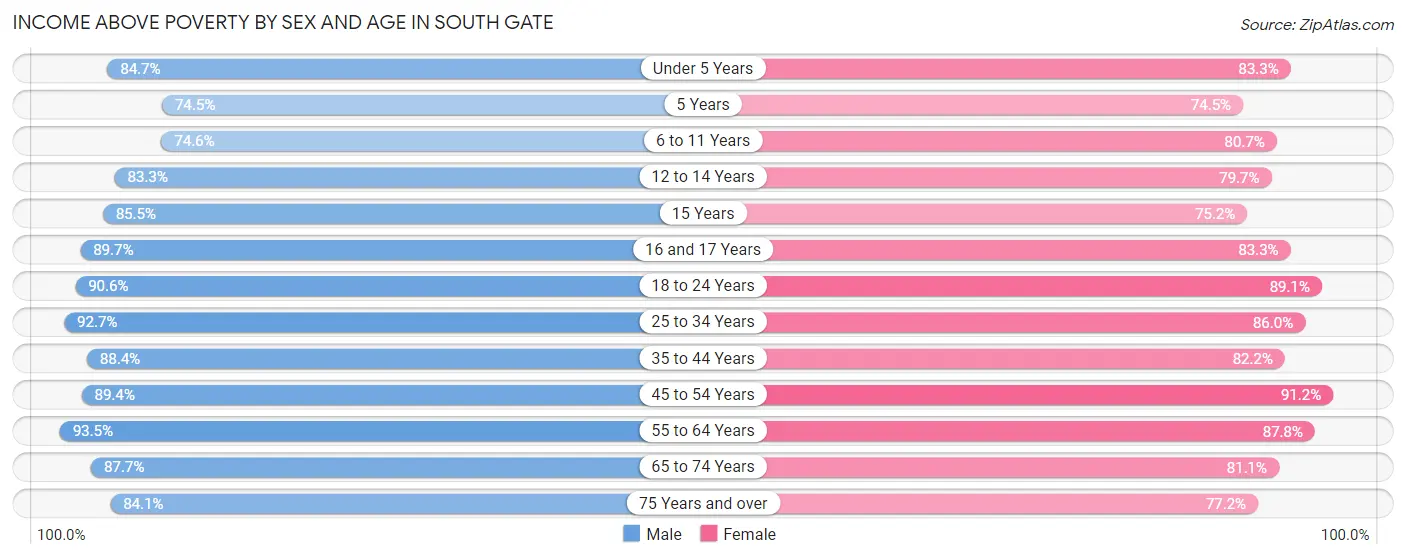
| Age Bracket | Male | Female |
| Under 5 Years | 2,471 (84.7%) | 2,019 (83.3%) |
| 5 Years | 254 (74.5%) | 303 (74.5%) |
| 6 to 11 Years | 3,089 (74.6%) | 2,953 (80.7%) |
| 12 to 14 Years | 1,567 (83.3%) | 2,066 (79.7%) |
| 15 Years | 725 (85.5%) | 538 (75.2%) |
| 16 and 17 Years | 1,103 (89.7%) | 1,239 (83.3%) |
| 18 to 24 Years | 4,578 (90.6%) | 4,599 (89.1%) |
| 25 to 34 Years | 6,853 (92.6%) | 6,233 (86.0%) |
| 35 to 44 Years | 5,160 (88.4%) | 5,066 (82.2%) |
| 45 to 54 Years | 5,711 (89.4%) | 5,143 (91.2%) |
| 55 to 64 Years | 4,483 (93.5%) | 4,658 (87.8%) |
| 65 to 74 Years | 2,786 (87.7%) | 2,901 (81.1%) |
| 75 Years and over | 1,122 (84.1%) | 1,775 (77.2%) |
| Total | 39,902 (88.0%) | 39,493 (84.6%) |
Income Below Poverty Among Married-Couple Families in South Gate
The poverty statistics for married-couple families in South Gate show that 7.6% or 932 of the total 12,241 families live below the poverty line. Families with 3 or 4 children have the highest poverty rate of 20.6%, comprising of 242 families. On the other hand, families with no children have the lowest poverty rate of 4.4%, which includes 255 families.
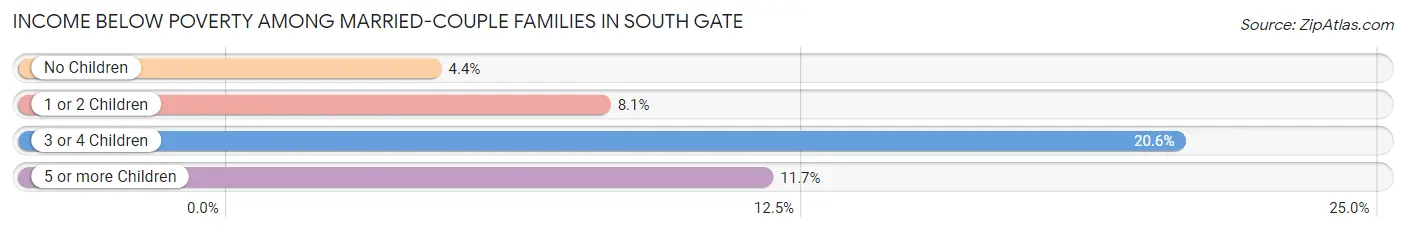
| Children | Above Poverty | Below Poverty |
| No Children | 5,495 (95.6%) | 255 (4.4%) |
| 1 or 2 Children | 4,792 (91.9%) | 423 (8.1%) |
| 3 or 4 Children | 931 (79.4%) | 242 (20.6%) |
| 5 or more Children | 91 (88.3%) | 12 (11.7%) |
| Total | 11,309 (92.4%) | 932 (7.6%) |
Income Below Poverty Among Single-Parent Households in South Gate
According to the poverty data in South Gate, 18.2% or 533 single-father households and 19.0% or 917 single-mother households are living below the poverty line. Among single-father households, those with 3 or 4 children have the highest poverty rate, with 121 households (41.6%) experiencing poverty. Likewise, among single-mother households, those with 3 or 4 children have the highest poverty rate, with 252 households (38.2%) falling below the poverty line.
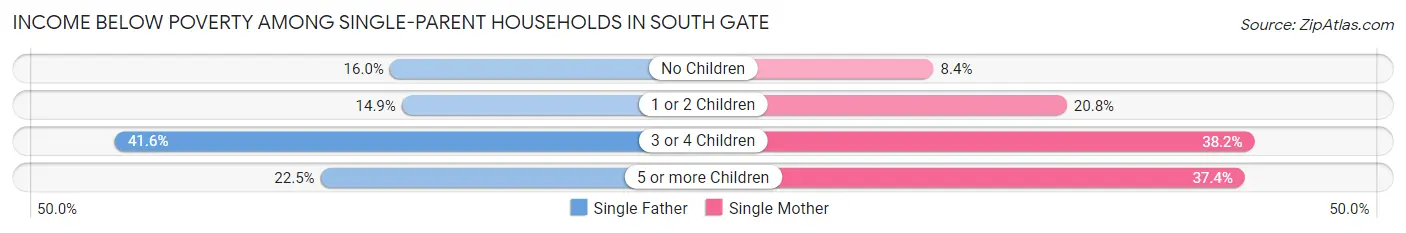
| Children | Single Father | Single Mother |
| No Children | 215 (16.0%) | 144 (8.4%) |
| 1 or 2 Children | 186 (14.9%) | 490 (20.8%) |
| 3 or 4 Children | 121 (41.6%) | 252 (38.2%) |
| 5 or more Children | 11 (22.5%) | 31 (37.3%) |
| Total | 533 (18.2%) | 917 (19.0%) |
Income Below Poverty Among Married-Couple vs Single-Parent Households in South Gate
The poverty data for South Gate shows that 932 of the married-couple family households (7.6%) and 1,450 of the single-parent households (18.7%) are living below the poverty level. Within the married-couple family households, those with 3 or 4 children have the highest poverty rate, with 242 households (20.6%) falling below the poverty line. Among the single-parent households, those with 3 or 4 children have the highest poverty rate, with 373 household (39.3%) living below poverty.
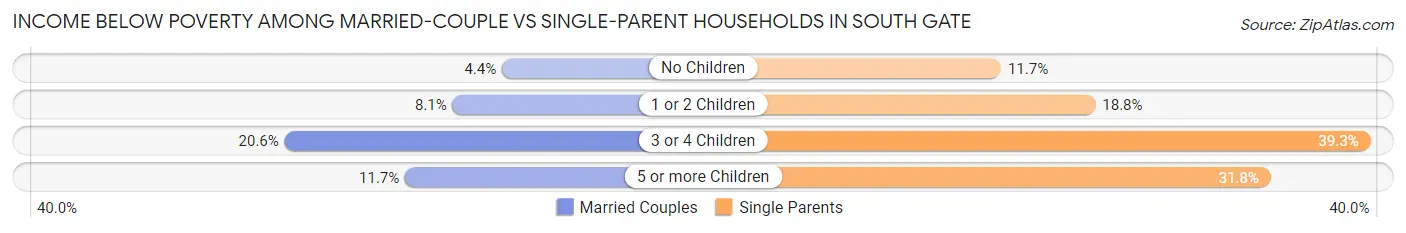
| Children | Married-Couple Families | Single-Parent Households |
| No Children | 255 (4.4%) | 359 (11.7%) |
| 1 or 2 Children | 423 (8.1%) | 676 (18.8%) |
| 3 or 4 Children | 242 (20.6%) | 373 (39.3%) |
| 5 or more Children | 12 (11.7%) | 42 (31.8%) |
| Total | 932 (7.6%) | 1,450 (18.7%) |
Race in South Gate
The most populous races in South Gate are Hispanic or Latino (87,994 | 95.3%), Some other Race (37,512 | 40.6%), and White / Caucasian (32,757 | 35.5%).
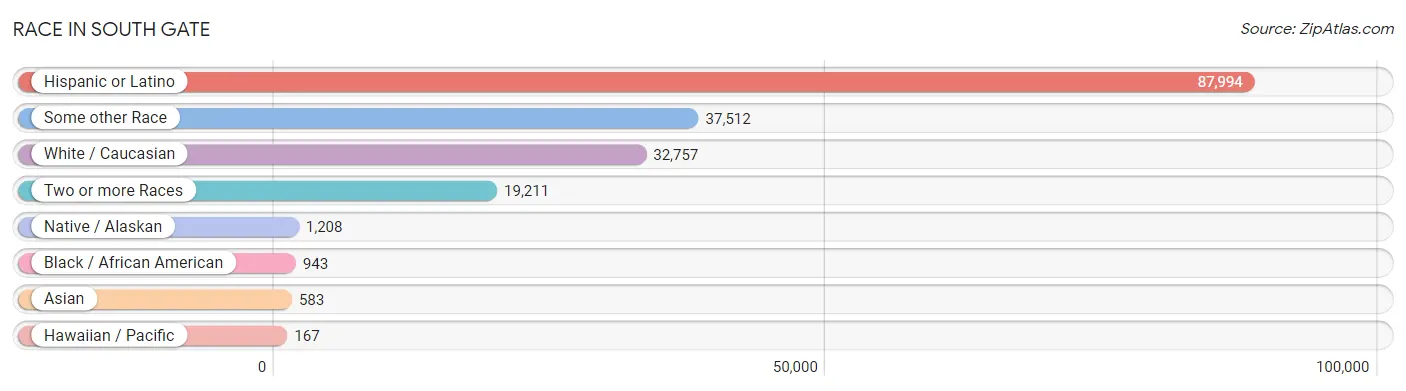
| Race | # Population | % Population |
| Asian | 583 | 0.6% |
| Black / African American | 943 | 1.0% |
| Hawaiian / Pacific | 167 | 0.2% |
| Hispanic or Latino | 87,994 | 95.3% |
| Native / Alaskan | 1,208 | 1.3% |
| White / Caucasian | 32,757 | 35.5% |
| Two or more Races | 19,211 | 20.8% |
| Some other Race | 37,512 | 40.6% |
| Total | 92,381 | 100.0% |
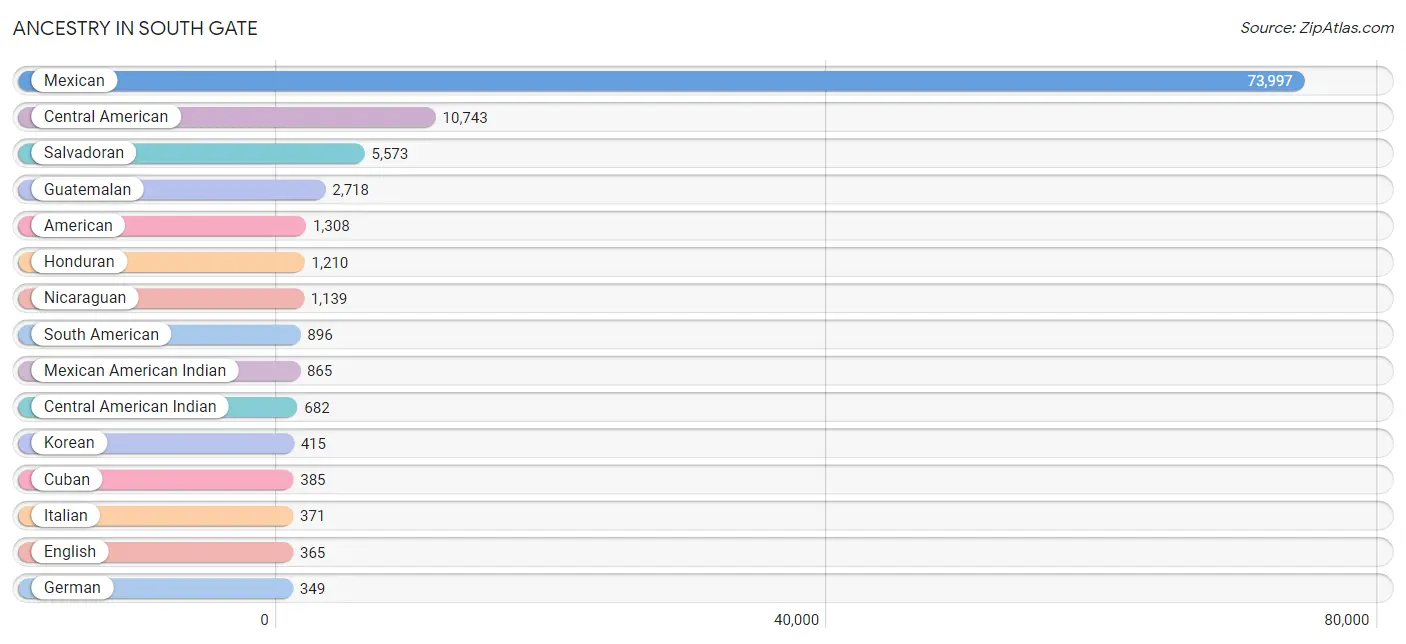
Ancestry in South Gate
The most populous ancestries reported in South Gate are Mexican (73,997 | 80.1%), Central American (10,743 | 11.6%), Salvadoran (5,573 | 6.0%), Guatemalan (2,718 | 2.9%), and American (1,308 | 1.4%), together accounting for 102.1% of all South Gate residents.
| Ancestry | # Population | % Population |
| African | 81 | 0.1% |
| American | 1,308 | 1.4% |
| Apache | 66 | 0.1% |
| Arab | 114 | 0.1% |
| Argentinean | 154 | 0.2% |
| Bhutanese | 52 | 0.1% |
| Brazilian | 6 | 0.0% |
| British | 8 | 0.0% |
| Burmese | 51 | 0.1% |
| Cajun | 66 | 0.1% |
| Canadian | 15 | 0.0% |
| Central American | 10,743 | 11.6% |
| Central American Indian | 682 | 0.7% |
| Cherokee | 52 | 0.1% |
| Colombian | 240 | 0.3% |
| Costa Rican | 80 | 0.1% |
| Croatian | 8 | 0.0% |
| Cuban | 385 | 0.4% |
| Danish | 41 | 0.0% |
| Dutch | 71 | 0.1% |
| Eastern European | 6 | 0.0% |
| Ecuadorian | 293 | 0.3% |
| Egyptian | 18 | 0.0% |
| English | 365 | 0.4% |
| Ethiopian | 88 | 0.1% |
| European | 74 | 0.1% |
| Finnish | 16 | 0.0% |
| French | 184 | 0.2% |
| German | 349 | 0.4% |
| Ghanaian | 28 | 0.0% |
| Guamanian / Chamorro | 41 | 0.0% |
| Guatemalan | 2,718 | 2.9% |
| Haitian | 177 | 0.2% |
| Honduran | 1,210 | 1.3% |
| Indian (Asian) | 101 | 0.1% |
| Inupiat | 17 | 0.0% |
| Irish | 328 | 0.4% |
| Israeli | 19 | 0.0% |
| Italian | 371 | 0.4% |
| Japanese | 8 | 0.0% |
| Korean | 415 | 0.4% |
| Lebanese | 71 | 0.1% |
| Mexican | 73,997 | 80.1% |
| Mexican American Indian | 865 | 0.9% |
| Nicaraguan | 1,139 | 1.2% |
| Nigerian | 14 | 0.0% |
| Norwegian | 117 | 0.1% |
| Osage | 10 | 0.0% |
| Paiute | 33 | 0.0% |
| Pakistani | 51 | 0.1% |
| Palestinian | 9 | 0.0% |
| Panamanian | 14 | 0.0% |
| Peruvian | 168 | 0.2% |
| Pima | 4 | 0.0% |
| Polish | 85 | 0.1% |
| Portuguese | 16 | 0.0% |
| Puerto Rican | 148 | 0.2% |
| Romanian | 89 | 0.1% |
| Russian | 28 | 0.0% |
| Salvadoran | 5,573 | 6.0% |
| Samoan | 130 | 0.1% |
| Scotch-Irish | 3 | 0.0% |
| Scottish | 92 | 0.1% |
| South American | 896 | 1.0% |
| South American Indian | 13 | 0.0% |
| Spaniard | 117 | 0.1% |
| Spanish | 124 | 0.1% |
| Spanish American Indian | 128 | 0.1% |
| Subsaharan African | 199 | 0.2% |
| Swedish | 28 | 0.0% |
| Thai | 114 | 0.1% |
| Ugandan | 16 | 0.0% |
| Ukrainian | 11 | 0.0% |
| Uruguayan | 9 | 0.0% |
| Venezuelan | 32 | 0.0% |
| Welsh | 8 | 0.0% |
| Yaqui | 38 | 0.0% | View All 77 Rows |
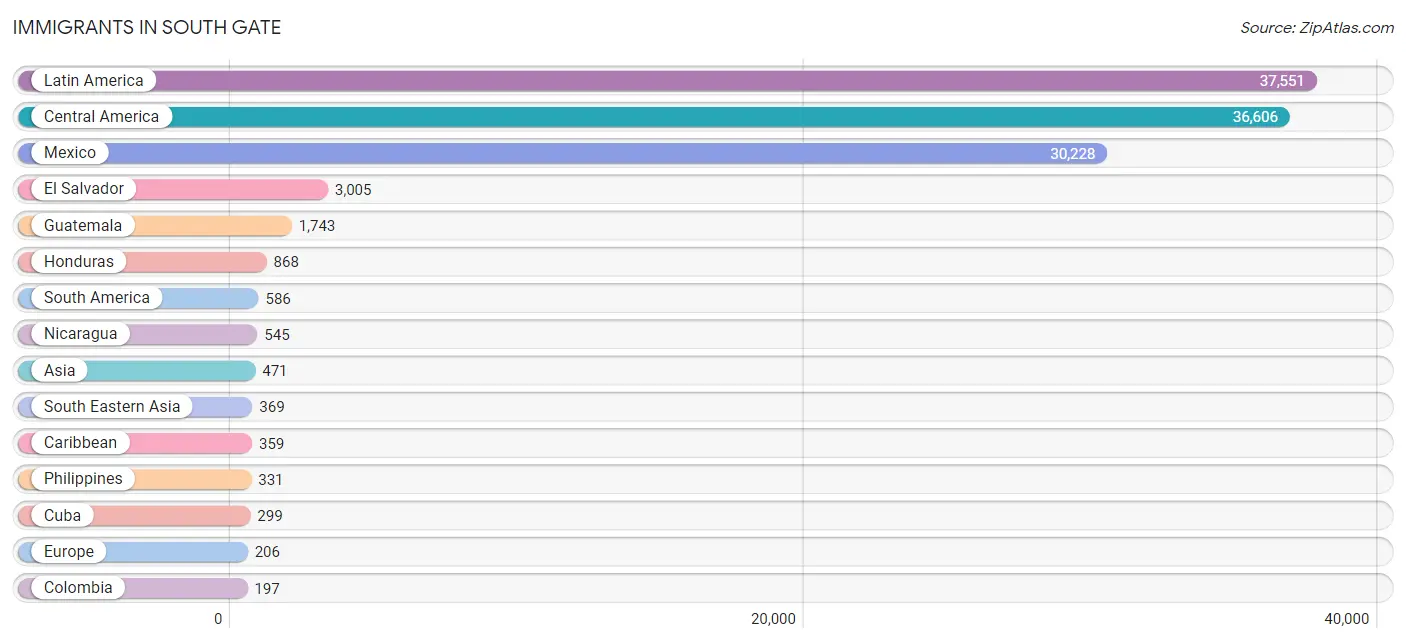
Immigrants in South Gate
The most numerous immigrant groups reported in South Gate came from Latin America (37,551 | 40.6%), Central America (36,606 | 39.6%), Mexico (30,228 | 32.7%), El Salvador (3,005 | 3.3%), and Guatemala (1,743 | 1.9%), together accounting for 118.1% of all South Gate residents.
| Immigration Origin | # Population | % Population |
| Africa | 140 | 0.2% |
| Argentina | 58 | 0.1% |
| Asia | 471 | 0.5% |
| Belize | 70 | 0.1% |
| Brazil | 6 | 0.0% |
| Canada | 15 | 0.0% |
| Caribbean | 359 | 0.4% |
| Central America | 36,606 | 39.6% |
| Colombia | 197 | 0.2% |
| Costa Rica | 53 | 0.1% |
| Croatia | 14 | 0.0% |
| Cuba | 299 | 0.3% |
| Dominica | 9 | 0.0% |
| Eastern Africa | 80 | 0.1% |
| Eastern Asia | 9 | 0.0% |
| Eastern Europe | 164 | 0.2% |
| Ecuador | 159 | 0.2% |
| Egypt | 18 | 0.0% |
| El Salvador | 3,005 | 3.3% |
| Ethiopia | 64 | 0.1% |
| Europe | 206 | 0.2% |
| Fiji | 24 | 0.0% |
| France | 6 | 0.0% |
| Ghana | 28 | 0.0% |
| Greece | 19 | 0.0% |
| Guatemala | 1,743 | 1.9% |
| Haiti | 51 | 0.1% |
| Honduras | 868 | 0.9% |
| India | 50 | 0.1% |
| Indonesia | 11 | 0.0% |
| Israel | 43 | 0.1% |
| Japan | 9 | 0.0% |
| Latin America | 37,551 | 40.6% |
| Mexico | 30,228 | 32.7% |
| Netherlands | 17 | 0.0% |
| Nicaragua | 545 | 0.6% |
| Nigeria | 14 | 0.0% |
| Northern Africa | 18 | 0.0% |
| Oceania | 54 | 0.1% |
| Panama | 14 | 0.0% |
| Peru | 148 | 0.2% |
| Philippines | 331 | 0.4% |
| Romania | 96 | 0.1% |
| South America | 586 | 0.6% |
| South Central Asia | 50 | 0.1% |
| South Eastern Asia | 369 | 0.4% |
| Southern Europe | 19 | 0.0% |
| Thailand | 27 | 0.0% |
| Uganda | 16 | 0.0% |
| Ukraine | 11 | 0.0% |
| Uruguay | 18 | 0.0% |
| Western Africa | 42 | 0.1% |
| Western Asia | 43 | 0.1% |
| Western Europe | 23 | 0.0% | View All 54 Rows |
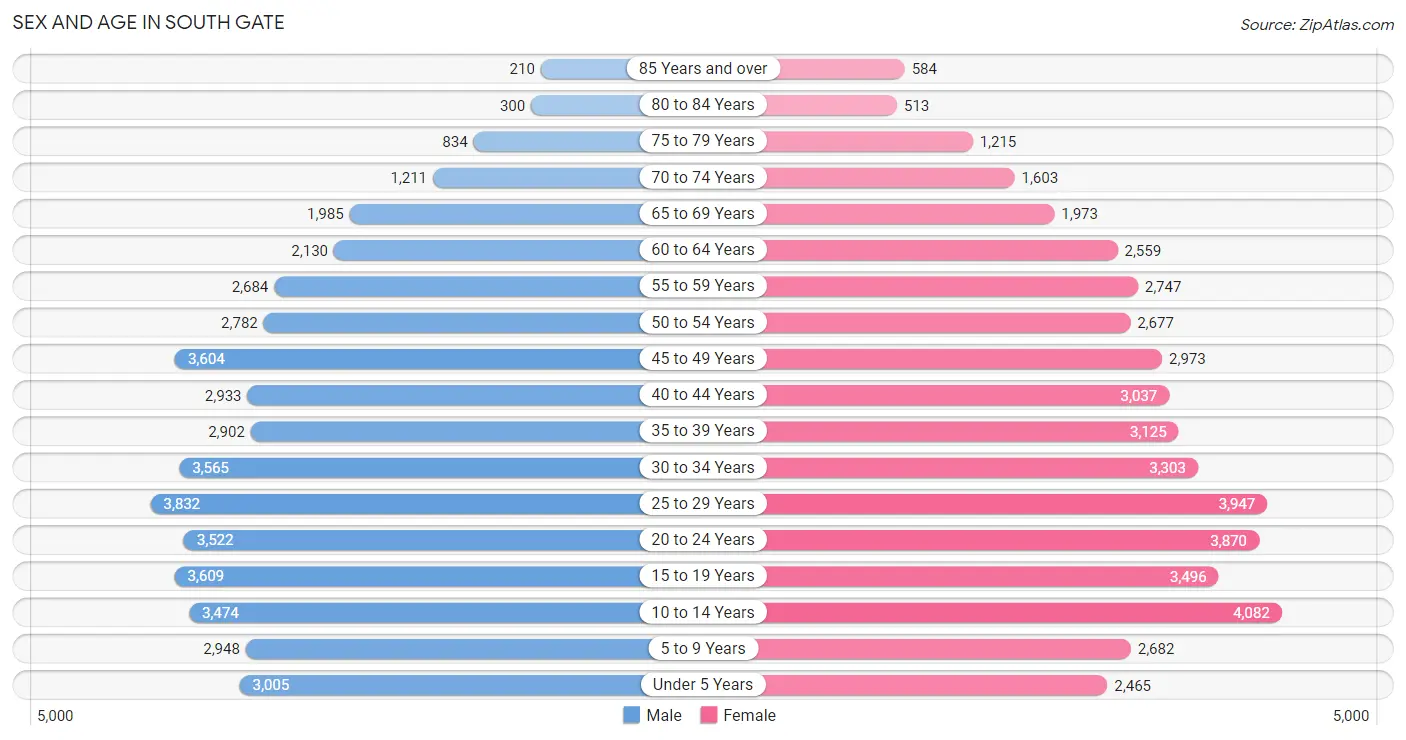
Sex and Age in South Gate
Sex and Age in South Gate
The most populous age groups in South Gate are 25 to 29 Years (3,832 | 8.4%) for men and 10 to 14 Years (4,082 | 8.7%) for women.
| Age Bracket | Male | Female |
| Under 5 Years | 3,005 (6.6%) | 2,465 (5.3%) |
| 5 to 9 Years | 2,948 (6.5%) | 2,682 (5.7%) |
| 10 to 14 Years | 3,474 (7.6%) | 4,082 (8.7%) |
| 15 to 19 Years | 3,609 (7.9%) | 3,496 (7.5%) |
| 20 to 24 Years | 3,522 (7.7%) | 3,870 (8.3%) |
| 25 to 29 Years | 3,832 (8.4%) | 3,947 (8.4%) |
| 30 to 34 Years | 3,565 (7.8%) | 3,303 (7.0%) |
| 35 to 39 Years | 2,902 (6.4%) | 3,125 (6.7%) |
| 40 to 44 Years | 2,933 (6.4%) | 3,037 (6.5%) |
| 45 to 49 Years | 3,604 (7.9%) | 2,973 (6.4%) |
| 50 to 54 Years | 2,782 (6.1%) | 2,677 (5.7%) |
| 55 to 59 Years | 2,684 (5.9%) | 2,747 (5.9%) |
| 60 to 64 Years | 2,130 (4.7%) | 2,559 (5.5%) |
| 65 to 69 Years | 1,985 (4.4%) | 1,973 (4.2%) |
| 70 to 74 Years | 1,211 (2.7%) | 1,603 (3.4%) |
| 75 to 79 Years | 834 (1.8%) | 1,215 (2.6%) |
| 80 to 84 Years | 300 (0.7%) | 513 (1.1%) |
| 85 Years and over | 210 (0.5%) | 584 (1.3%) |
| Total | 45,530 (100.0%) | 46,851 (100.0%) |
Families and Households in South Gate
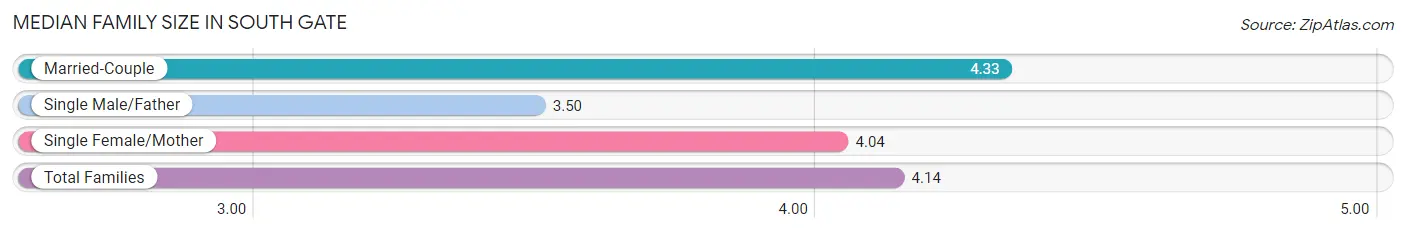
Median Family Size in South Gate
The median family size in South Gate is 4.14 persons per family, with married-couple families (12,241 | 61.2%) accounting for the largest median family size of 4.33 persons per family. On the other hand, single male/father families (2,933 | 14.7%) represent the smallest median family size with 3.50 persons per family.
| Family Type | # Families | Family Size |
| Married-Couple | 12,241 (61.2%) | 4.33 |
| Single Male/Father | 2,933 (14.7%) | 3.50 |
| Single Female/Mother | 4,817 (24.1%) | 4.04 |
| Total Families | 19,991 (100.0%) | 4.14 |
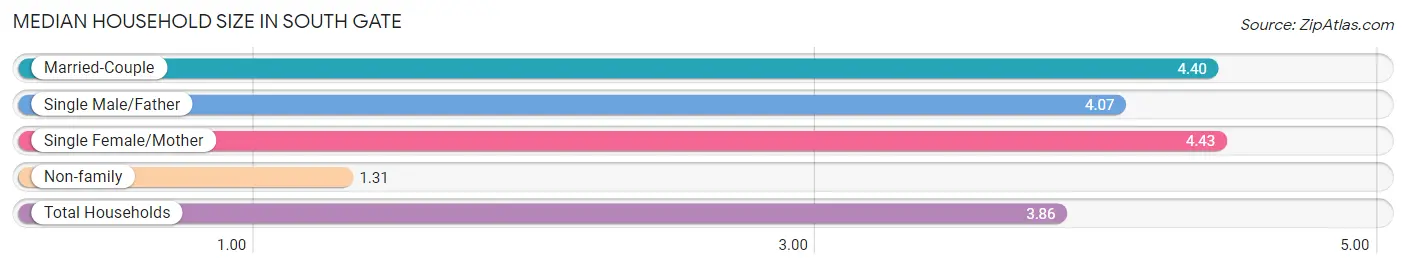
Median Household Size in South Gate
The median household size in South Gate is 3.86 persons per household, with single female/mother households (4,817 | 20.1%) accounting for the largest median household size of 4.43 persons per household. non-family households (3,929 | 16.4%) represent the smallest median household size with 1.31 persons per household.
| Household Type | # Households | Household Size |
| Married-Couple | 12,241 (51.2%) | 4.40 |
| Single Male/Father | 2,933 (12.3%) | 4.07 |
| Single Female/Mother | 4,817 (20.1%) | 4.43 |
| Non-family | 3,929 (16.4%) | 1.31 |
| Total Households | 23,920 (100.0%) | 3.86 |
Household Size by Marriage Status in South Gate
Out of a total of 23,920 households in South Gate, 19,991 (83.6%) are family households, while 3,929 (16.4%) are nonfamily households. The most numerous type of family households are 4-person households, comprising 5,326, and the most common type of nonfamily households are 1-person households, comprising 3,087.
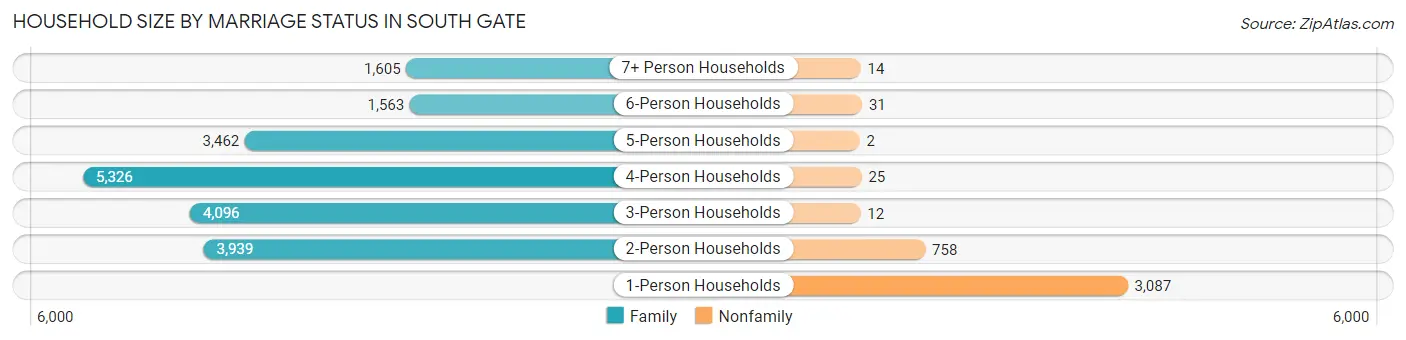
| Household Size | Family Households | Nonfamily Households |
| 1-Person Households | - | 3,087 (12.9%) |
| 2-Person Households | 3,939 (16.5%) | 758 (3.2%) |
| 3-Person Households | 4,096 (17.1%) | 12 (0.1%) |
| 4-Person Households | 5,326 (22.3%) | 25 (0.1%) |
| 5-Person Households | 3,462 (14.5%) | 2 (0.0%) |
| 6-Person Households | 1,563 (6.5%) | 31 (0.1%) |
| 7+ Person Households | 1,605 (6.7%) | 14 (0.1%) |
| Total | 19,991 (83.6%) | 3,929 (16.4%) |
Female Fertility in South Gate
Fertility by Age in South Gate
Average fertility rate in South Gate is 45.0 births per 1,000 women. Women in the age bracket of 20 to 34 years have the highest fertility rate with 65.0 births per 1,000 women. Women in the age bracket of 20 to 34 years acount for 66.0% of all women with births.
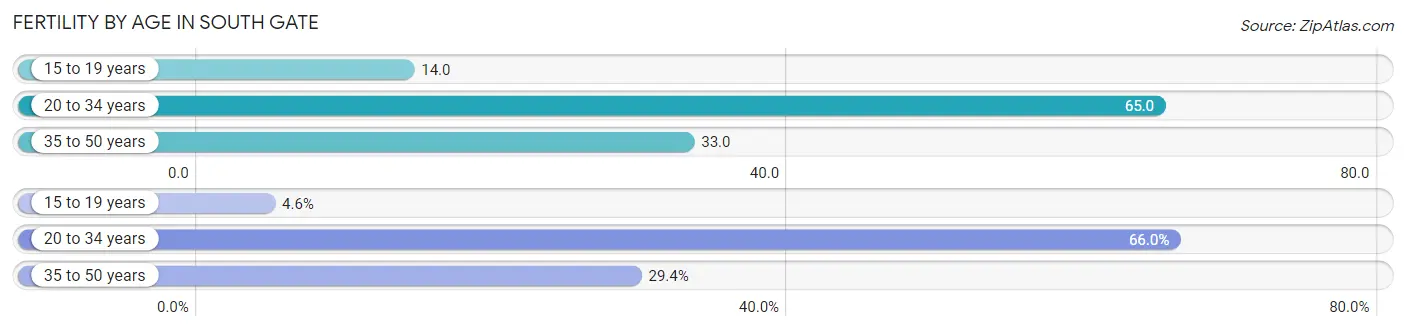
| Age Bracket | Women with Births | Births / 1,000 Women |
| 15 to 19 years | 50 (4.5%) | 14.0 |
| 20 to 34 years | 725 (66.0%) | 65.0 |
| 35 to 50 years | 323 (29.4%) | 33.0 |
| Total | 1,098 (100.0%) | 45.0 |
Fertility by Age by Marriage Status in South Gate
59.9% of women with births (1,098) in South Gate are married. The highest percentage of unmarried women with births falls into 15 to 19 years age bracket with 100.0% of them unmarried at the time of birth, while the lowest percentage of unmarried women with births belong to 35 to 50 years age bracket with 32.8% of them unmarried.
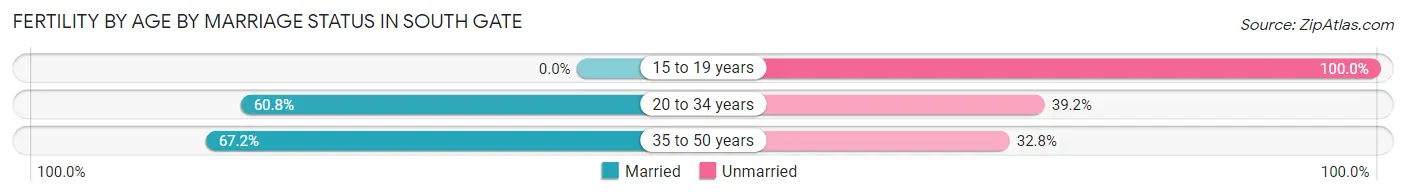
| Age Bracket | Married | Unmarried |
| 15 to 19 years | 0 (0.0%) | 50 (100.0%) |
| 20 to 34 years | 441 (60.8%) | 284 (39.2%) |
| 35 to 50 years | 217 (67.2%) | 106 (32.8%) |
| Total | 658 (59.9%) | 440 (40.1%) |
Fertility by Education in South Gate
Average fertility rate in South Gate is 45.0 births per 1,000 women. Women with the education attainment of less than high school have the highest fertility rate of 55.0 births per 1,000 women, while women with the education attainment of bachelor's degree have the lowest fertility at 31.0 births per 1,000 women. Women with the education attainment of less than high school represent 33.6% of all women with births.
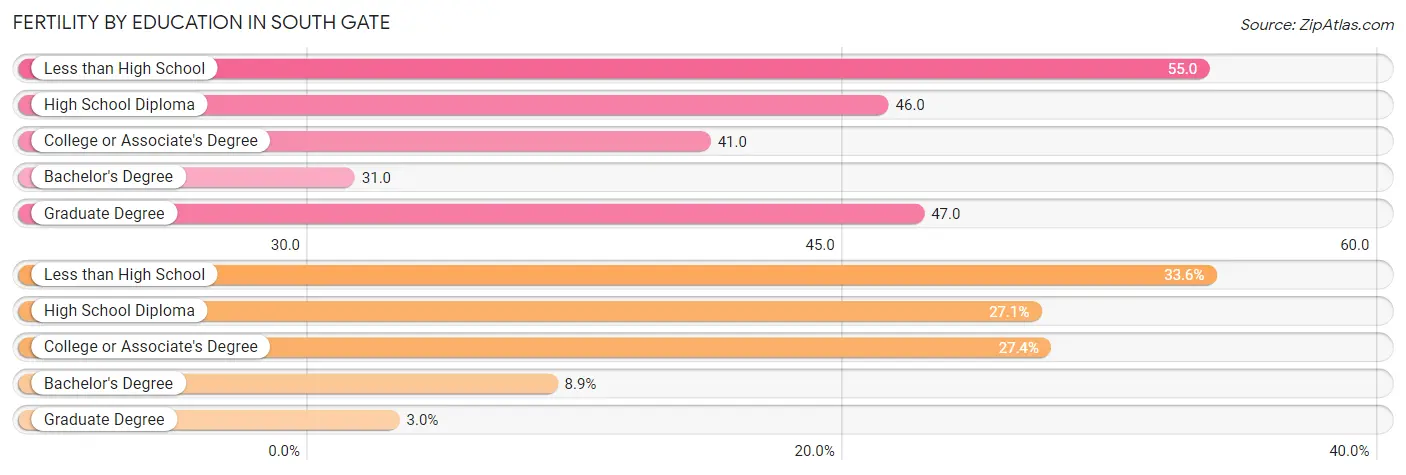
| Educational Attainment | Women with Births | Births / 1,000 Women |
| Less than High School | 369 (33.6%) | 55.0 |
| High School Diploma | 297 (27.1%) | 46.0 |
| College or Associate's Degree | 301 (27.4%) | 41.0 |
| Bachelor's Degree | 98 (8.9%) | 31.0 |
| Graduate Degree | 33 (3.0%) | 47.0 |
| Total | 1,098 (100.0%) | 45.0 |
Fertility by Education by Marriage Status in South Gate
40.1% of women with births in South Gate are unmarried. Women with the educational attainment of graduate degree are most likely to be married with 100.0% of them married at childbirth, while women with the educational attainment of high school diploma are least likely to be married with 57.6% of them unmarried at childbirth.
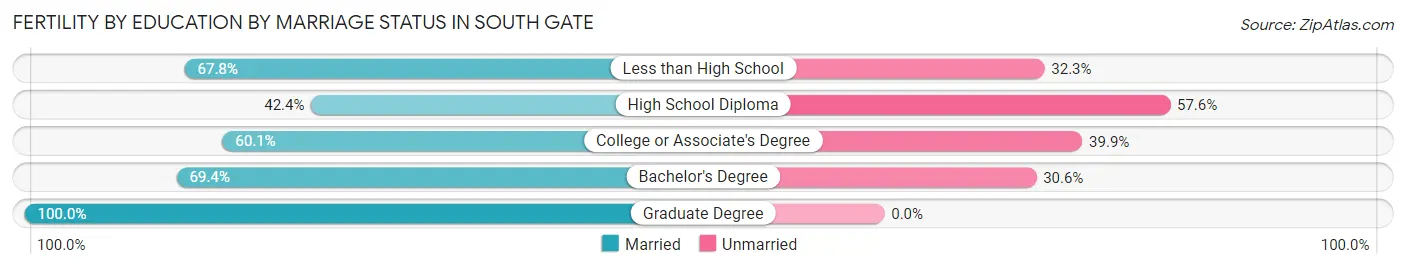
| Educational Attainment | Married | Unmarried |
| Less than High School | 250 (67.7%) | 119 (32.3%) |
| High School Diploma | 126 (42.4%) | 171 (57.6%) |
| College or Associate's Degree | 181 (60.1%) | 120 (39.9%) |
| Bachelor's Degree | 68 (69.4%) | 30 (30.6%) |
| Graduate Degree | 33 (100.0%) | 0 (0.0%) |
| Total | 658 (59.9%) | 440 (40.1%) |
Employment Characteristics in South Gate
Employment by Class of Employer in South Gate
Among the 42,224 employed individuals in South Gate, private company employees (31,986 | 75.7%), local government employees (2,930 | 6.9%), and self-employed (not incorporated) (2,404 | 5.7%) make up the most common classes of employment.
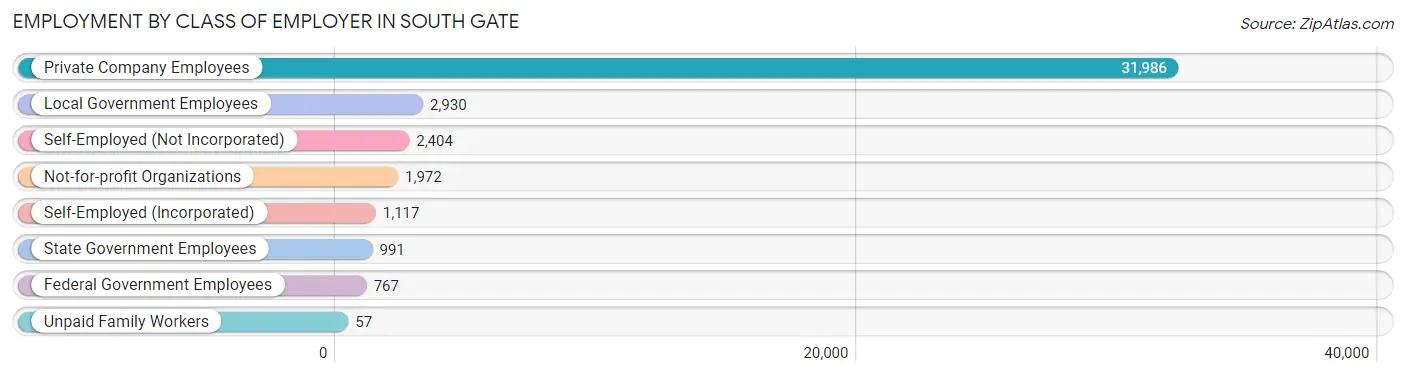
| Employer Class | # Employees | % Employees |
| Private Company Employees | 31,986 | 75.7% |
| Self-Employed (Incorporated) | 1,117 | 2.6% |
| Self-Employed (Not Incorporated) | 2,404 | 5.7% |
| Not-for-profit Organizations | 1,972 | 4.7% |
| Local Government Employees | 2,930 | 6.9% |
| State Government Employees | 991 | 2.4% |
| Federal Government Employees | 767 | 1.8% |
| Unpaid Family Workers | 57 | 0.1% |
| Total | 42,224 | 100.0% |
Employment Status by Age in South Gate
According to the labor force statistics for South Gate, out of the total population over 16 years of age (72,162), 65.3% or 47,122 individuals are in the labor force, with 7.9% or 3,723 of them unemployed. The age group with the highest labor force participation rate is 30 to 34 years, with 84.2% or 5,783 individuals in the labor force. Within the labor force, the 16 to 19 years age range has the highest percentage of unemployed individuals, with 30.7% or 519 of them being unemployed.
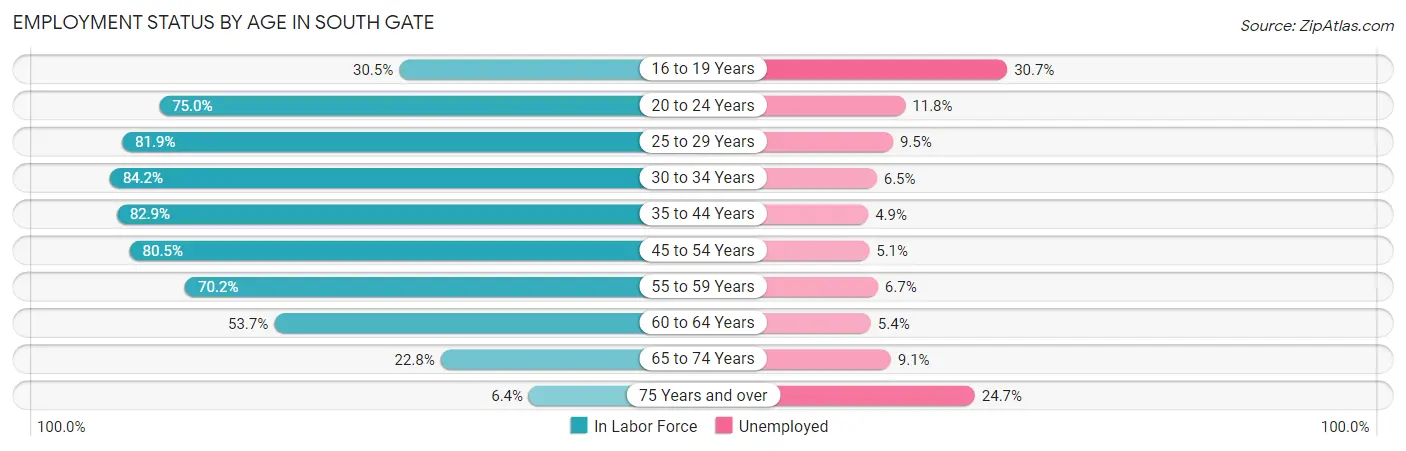
| Age Bracket | In Labor Force | Unemployed |
| 16 to 19 Years | 1,690 (30.5%) | 519 (30.7%) |
| 20 to 24 Years | 5,544 (75.0%) | 654 (11.8%) |
| 25 to 29 Years | 6,371 (81.9%) | 605 (9.5%) |
| 30 to 34 Years | 5,783 (84.2%) | 376 (6.5%) |
| 35 to 44 Years | 9,946 (82.9%) | 487 (4.9%) |
| 45 to 54 Years | 9,689 (80.5%) | 494 (5.1%) |
| 55 to 59 Years | 3,813 (70.2%) | 255 (6.7%) |
| 60 to 64 Years | 2,518 (53.7%) | 136 (5.4%) |
| 65 to 74 Years | 1,544 (22.8%) | 141 (9.1%) |
| 75 Years and over | 234 (6.4%) | 58 (24.7%) |
| Total | 47,122 (65.3%) | 3,723 (7.9%) |
Employment Status by Educational Attainment in South Gate
According to labor force statistics for South Gate, 78.1% of individuals (38,113) out of the total population between 25 and 64 years of age (48,800) are in the labor force, with 6.1% or 2,325 of them being unemployed. The group with the highest labor force participation rate are those with the educational attainment of bachelor's degree or higher, with 89.7% or 5,707 individuals in the labor force. Within the labor force, individuals with college / associate degree education have the highest percentage of unemployment, with 8.1% or 799 of them being unemployed.
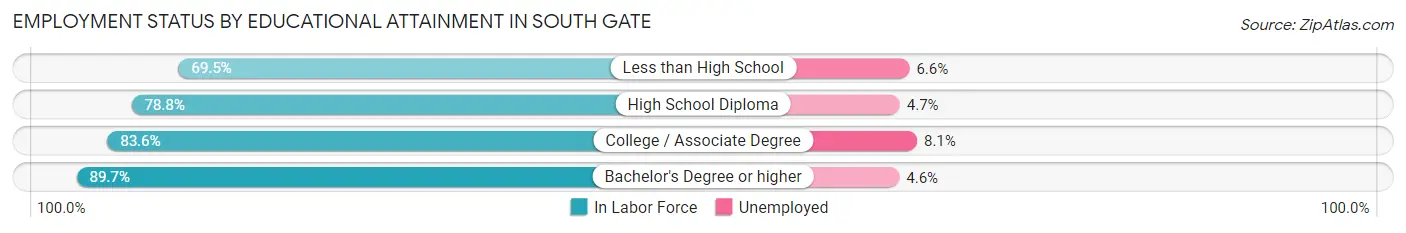
| Educational Attainment | In Labor Force | Unemployed |
| Less than High School | 11,943 (69.5%) | 1,134 (6.6%) |
| High School Diploma | 10,606 (78.8%) | 633 (4.7%) |
| College / Associate Degree | 9,861 (83.6%) | 955 (8.1%) |
| Bachelor's Degree or higher | 5,707 (89.7%) | 293 (4.6%) |
| Total | 38,113 (78.1%) | 2,977 (6.1%) |
Employment Occupations by Sex in South Gate
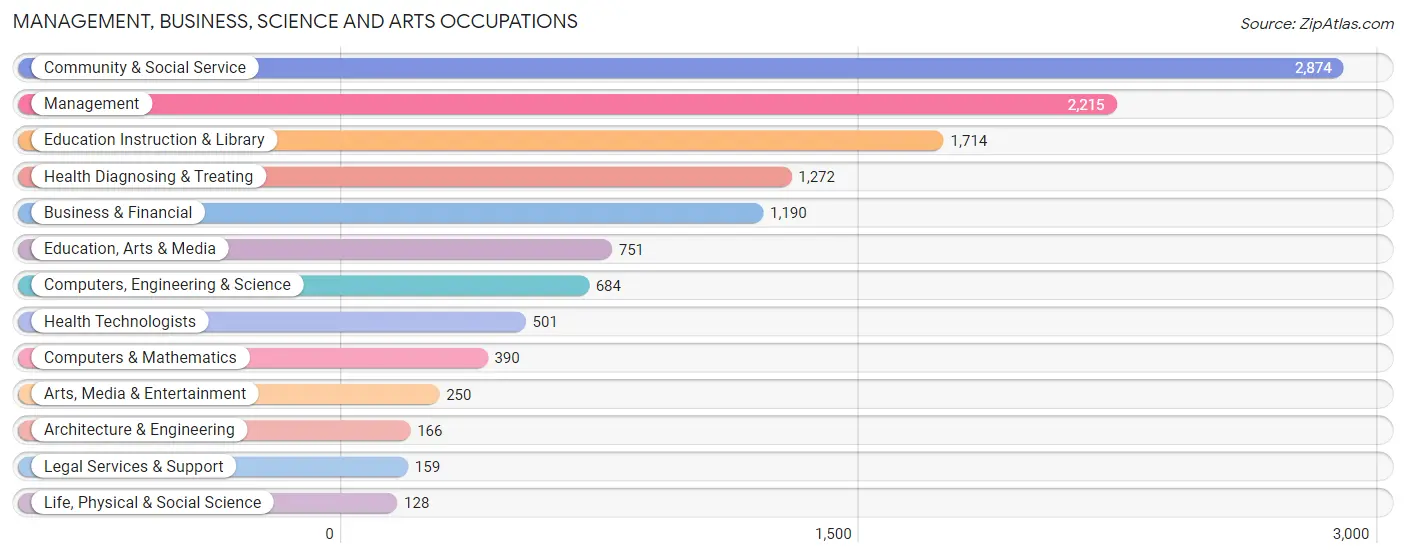
Management, Business, Science and Arts Occupations
The most common Management, Business, Science and Arts occupations in South Gate are Community & Social Service (2,874 | 6.6%), Management (2,215 | 5.1%), Education Instruction & Library (1,714 | 4.0%), Health Diagnosing & Treating (1,272 | 2.9%), and Business & Financial (1,190 | 2.8%).
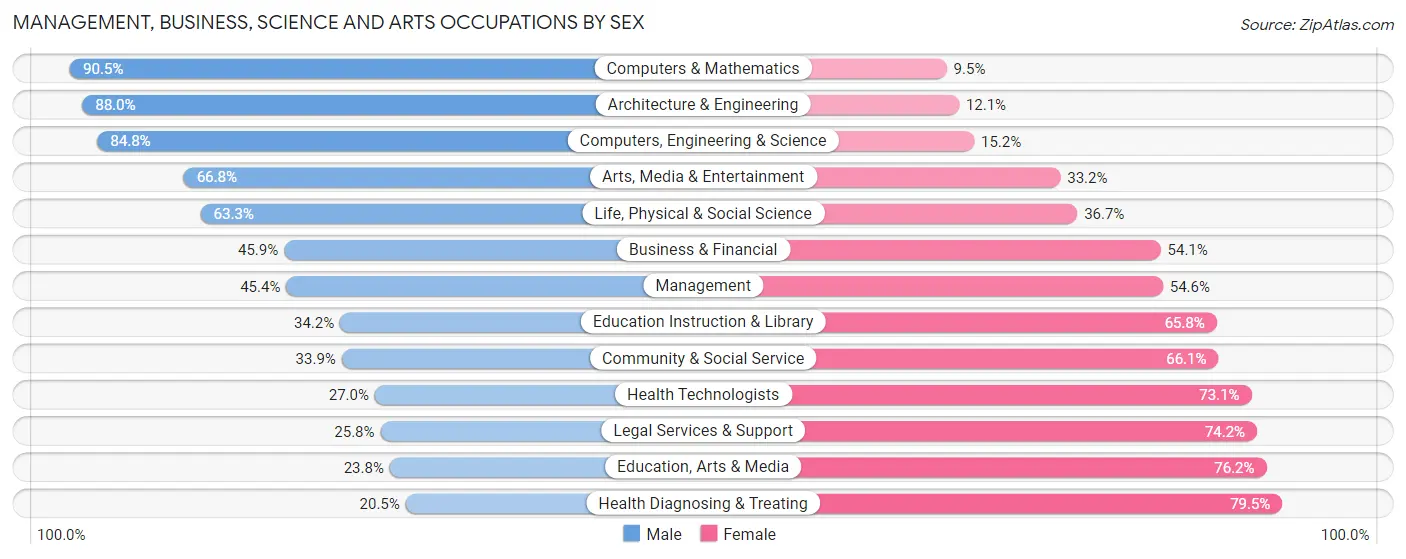
Management, Business, Science and Arts Occupations by Sex
Within the Management, Business, Science and Arts occupations in South Gate, the most male-oriented occupations are Computers & Mathematics (90.5%), Architecture & Engineering (87.9%), and Computers, Engineering & Science (84.8%), while the most female-oriented occupations are Health Diagnosing & Treating (79.5%), Education, Arts & Media (76.2%), and Legal Services & Support (74.2%).
| Occupation | Male | Female |
| Management | 1,006 (45.4%) | 1,209 (54.6%) |
| Business & Financial | 546 (45.9%) | 644 (54.1%) |
| Computers, Engineering & Science | 580 (84.8%) | 104 (15.2%) |
| Computers & Mathematics | 353 (90.5%) | 37 (9.5%) |
| Architecture & Engineering | 146 (87.9%) | 20 (12.0%) |
| Life, Physical & Social Science | 81 (63.3%) | 47 (36.7%) |
| Community & Social Service | 973 (33.9%) | 1,901 (66.1%) |
| Education, Arts & Media | 179 (23.8%) | 572 (76.2%) |
| Legal Services & Support | 41 (25.8%) | 118 (74.2%) |
| Education Instruction & Library | 586 (34.2%) | 1,128 (65.8%) |
| Arts, Media & Entertainment | 167 (66.8%) | 83 (33.2%) |
| Health Diagnosing & Treating | 261 (20.5%) | 1,011 (79.5%) |
| Health Technologists | 135 (27.0%) | 366 (73.1%) |
| Total (Category) | 3,366 (40.9%) | 4,869 (59.1%) |
| Total (Overall) | 24,644 (56.9%) | 18,698 (43.1%) |
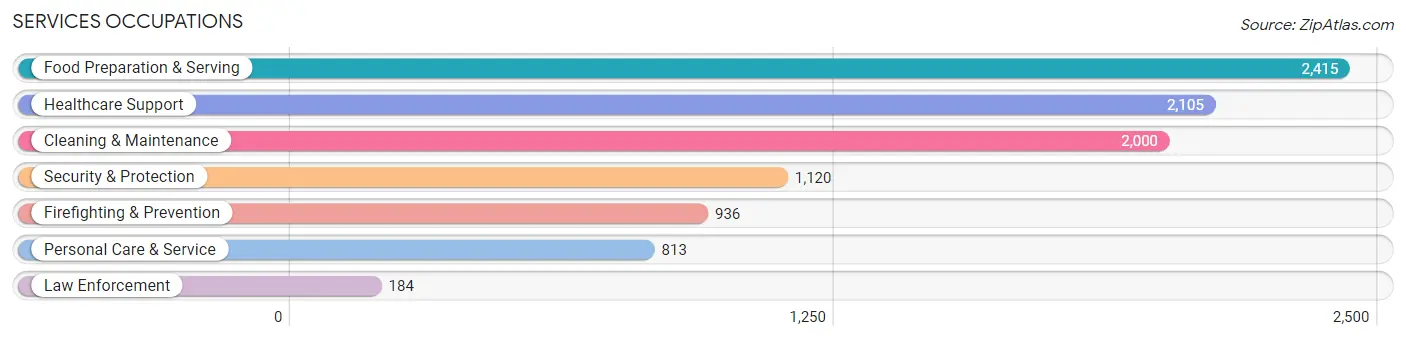
Services Occupations
The most common Services occupations in South Gate are Food Preparation & Serving (2,415 | 5.6%), Healthcare Support (2,105 | 4.9%), Cleaning & Maintenance (2,000 | 4.6%), Security & Protection (1,120 | 2.6%), and Firefighting & Prevention (936 | 2.2%).
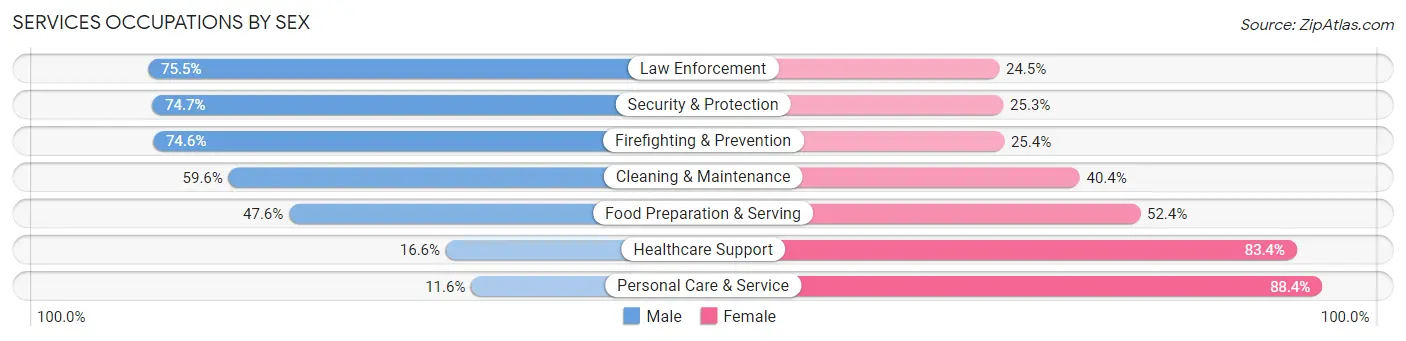
Services Occupations by Sex
Within the Services occupations in South Gate, the most male-oriented occupations are Law Enforcement (75.5%), Security & Protection (74.7%), and Firefighting & Prevention (74.6%), while the most female-oriented occupations are Personal Care & Service (88.4%), Healthcare Support (83.4%), and Food Preparation & Serving (52.4%).
| Occupation | Male | Female |
| Healthcare Support | 349 (16.6%) | 1,756 (83.4%) |
| Security & Protection | 837 (74.7%) | 283 (25.3%) |
| Firefighting & Prevention | 698 (74.6%) | 238 (25.4%) |
| Law Enforcement | 139 (75.5%) | 45 (24.5%) |
| Food Preparation & Serving | 1,150 (47.6%) | 1,265 (52.4%) |
| Cleaning & Maintenance | 1,192 (59.6%) | 808 (40.4%) |
| Personal Care & Service | 94 (11.6%) | 719 (88.4%) |
| Total (Category) | 3,622 (42.8%) | 4,831 (57.2%) |
| Total (Overall) | 24,644 (56.9%) | 18,698 (43.1%) |
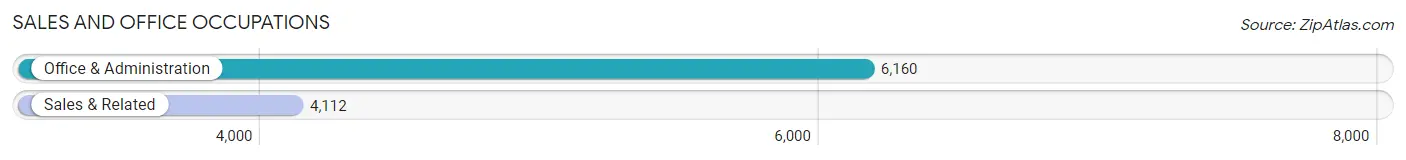
Sales and Office Occupations
The most common Sales and Office occupations in South Gate are Office & Administration (6,160 | 14.2%), and Sales & Related (4,112 | 9.5%).
Sales and Office Occupations by Sex
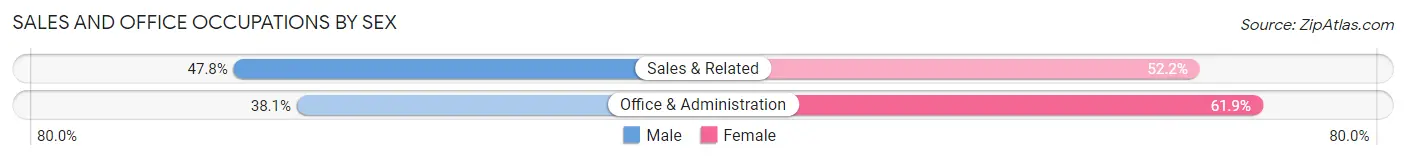
| Occupation | Male | Female |
| Sales & Related | 1,967 (47.8%) | 2,145 (52.2%) |
| Office & Administration | 2,348 (38.1%) | 3,812 (61.9%) |
| Total (Category) | 4,315 (42.0%) | 5,957 (58.0%) |
| Total (Overall) | 24,644 (56.9%) | 18,698 (43.1%) |
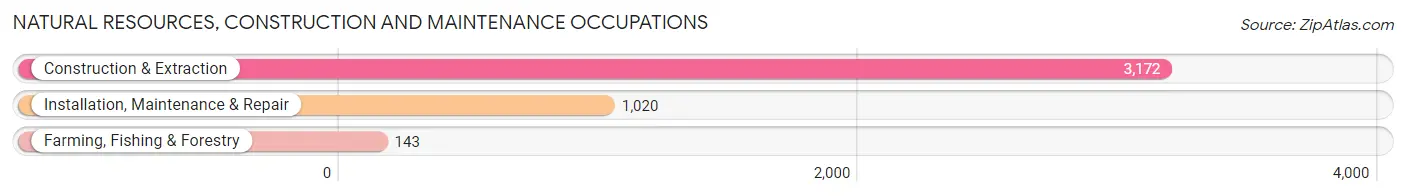
Natural Resources, Construction and Maintenance Occupations
The most common Natural Resources, Construction and Maintenance occupations in South Gate are Construction & Extraction (3,172 | 7.3%), Installation, Maintenance & Repair (1,020 | 2.4%), and Farming, Fishing & Forestry (143 | 0.3%).
Natural Resources, Construction and Maintenance Occupations by Sex
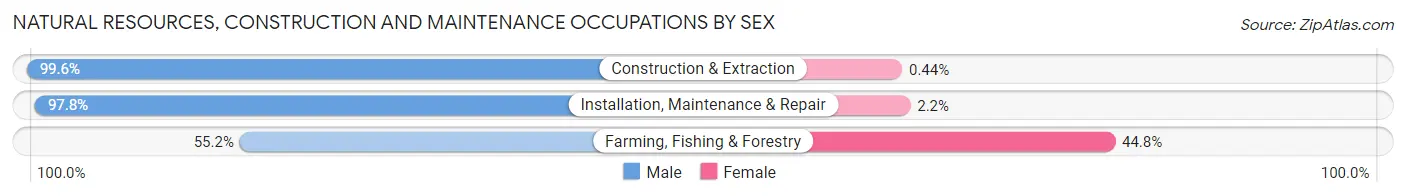
| Occupation | Male | Female |
| Farming, Fishing & Forestry | 79 (55.2%) | 64 (44.8%) |
| Construction & Extraction | 3,158 (99.6%) | 14 (0.4%) |
| Installation, Maintenance & Repair | 998 (97.8%) | 22 (2.2%) |
| Total (Category) | 4,235 (97.7%) | 100 (2.3%) |
| Total (Overall) | 24,644 (56.9%) | 18,698 (43.1%) |
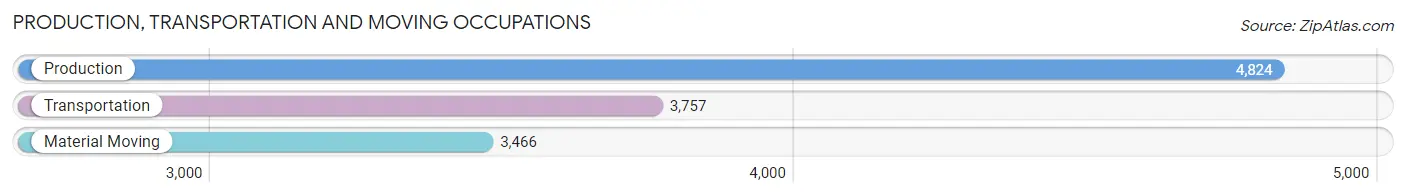
Production, Transportation and Moving Occupations
The most common Production, Transportation and Moving occupations in South Gate are Production (4,824 | 11.1%), Transportation (3,757 | 8.7%), and Material Moving (3,466 | 8.0%).
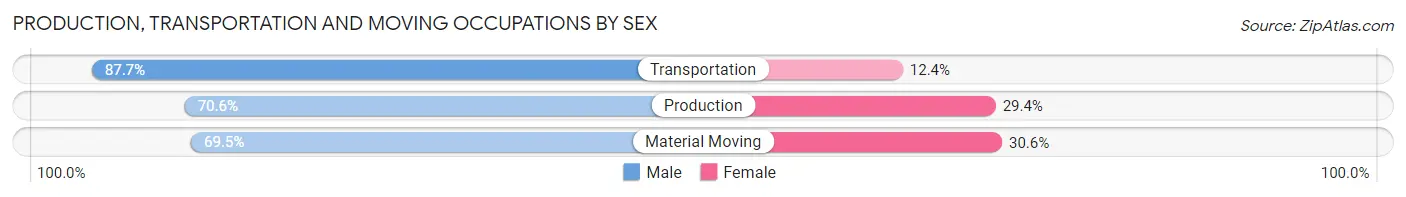
Production, Transportation and Moving Occupations by Sex
| Occupation | Male | Female |
| Production | 3,406 (70.6%) | 1,418 (29.4%) |
| Transportation | 3,293 (87.6%) | 464 (12.3%) |
| Material Moving | 2,407 (69.5%) | 1,059 (30.5%) |
| Total (Category) | 9,106 (75.6%) | 2,941 (24.4%) |
| Total (Overall) | 24,644 (56.9%) | 18,698 (43.1%) |
Employment Industries by Sex in South Gate
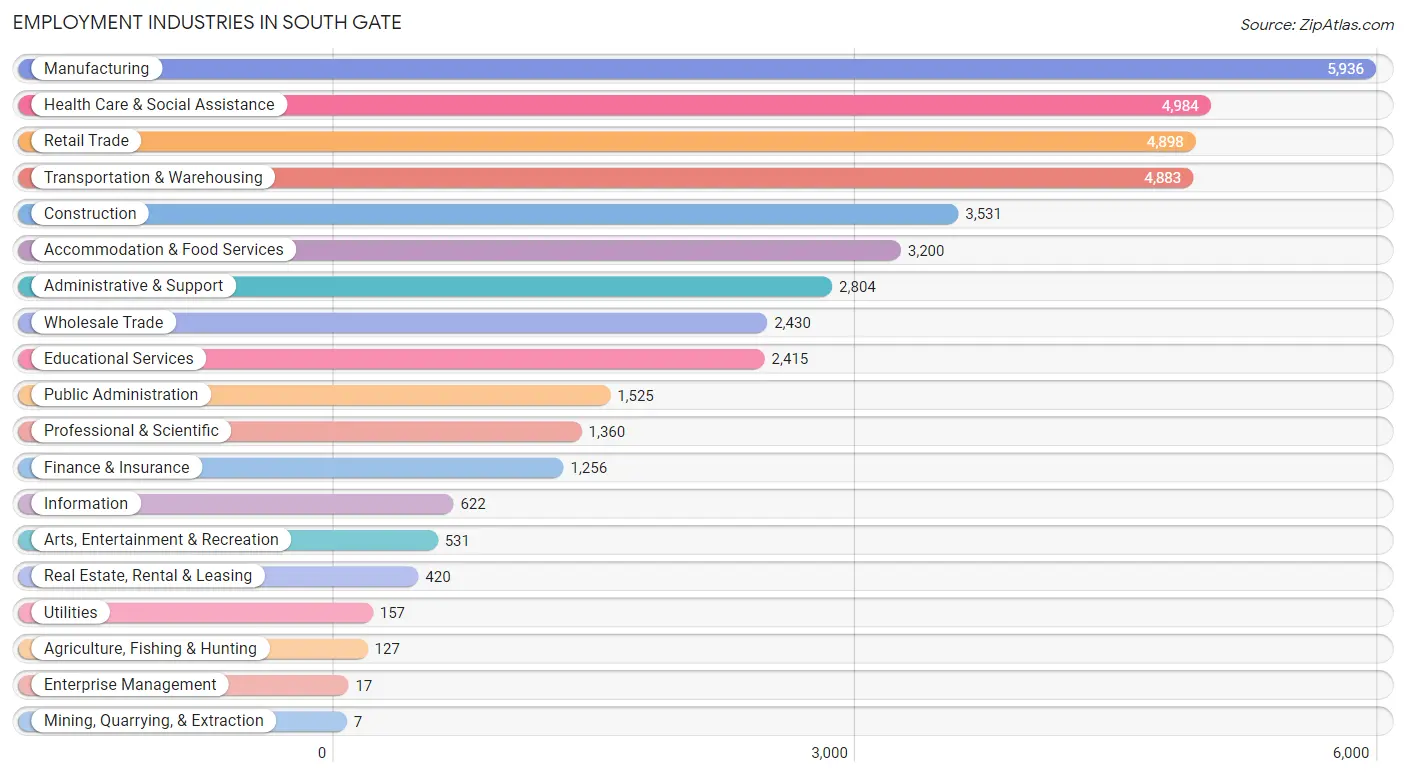
Employment Industries in South Gate
The major employment industries in South Gate include Manufacturing (5,936 | 13.7%), Health Care & Social Assistance (4,984 | 11.5%), Retail Trade (4,898 | 11.3%), Transportation & Warehousing (4,883 | 11.3%), and Construction (3,531 | 8.2%).
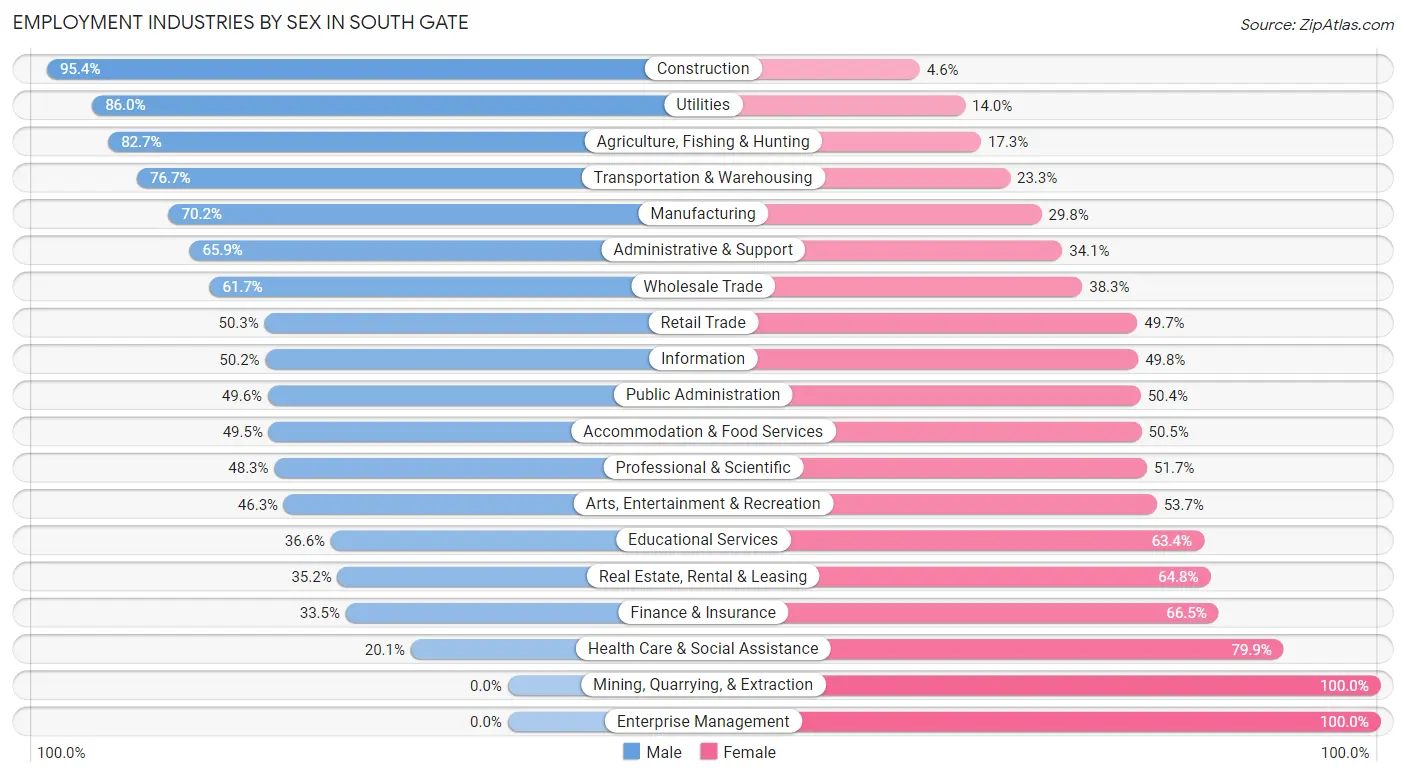
Employment Industries by Sex in South Gate
The South Gate industries that see more men than women are Construction (95.4%), Utilities (86.0%), and Agriculture, Fishing & Hunting (82.7%), whereas the industries that tend to have a higher number of women are Mining, Quarrying, & Extraction (100.0%), Enterprise Management (100.0%), and Health Care & Social Assistance (79.9%).
| Industry | Male | Female |
| Agriculture, Fishing & Hunting | 105 (82.7%) | 22 (17.3%) |
| Mining, Quarrying, & Extraction | 0 (0.0%) | 7 (100.0%) |
| Construction | 3,367 (95.4%) | 164 (4.6%) |
| Manufacturing | 4,165 (70.2%) | 1,771 (29.8%) |
| Wholesale Trade | 1,500 (61.7%) | 930 (38.3%) |
| Retail Trade | 2,465 (50.3%) | 2,433 (49.7%) |
| Transportation & Warehousing | 3,745 (76.7%) | 1,138 (23.3%) |
| Utilities | 135 (86.0%) | 22 (14.0%) |
| Information | 312 (50.2%) | 310 (49.8%) |
| Finance & Insurance | 421 (33.5%) | 835 (66.5%) |
| Real Estate, Rental & Leasing | 148 (35.2%) | 272 (64.8%) |
| Professional & Scientific | 657 (48.3%) | 703 (51.7%) |
| Enterprise Management | 0 (0.0%) | 17 (100.0%) |
| Administrative & Support | 1,847 (65.9%) | 957 (34.1%) |
| Educational Services | 884 (36.6%) | 1,531 (63.4%) |
| Health Care & Social Assistance | 1,000 (20.1%) | 3,984 (79.9%) |
| Arts, Entertainment & Recreation | 246 (46.3%) | 285 (53.7%) |
| Accommodation & Food Services | 1,583 (49.5%) | 1,617 (50.5%) |
| Public Administration | 757 (49.6%) | 768 (50.4%) |
| Total | 24,644 (56.9%) | 18,698 (43.1%) |
Education in South Gate
School Enrollment in South Gate
The most common levels of schooling among the 26,654 students in South Gate are college / undergraduate (6,615 | 24.8%), high school (6,161 | 23.1%), and middle school (5,710 | 21.4%).
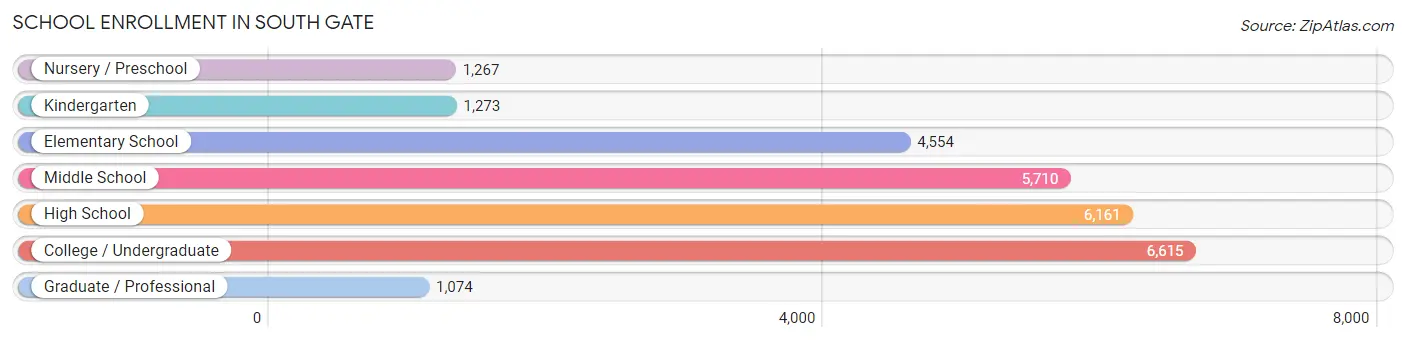
| School Level | # Students | % Students |
| Nursery / Preschool | 1,267 | 4.8% |
| Kindergarten | 1,273 | 4.8% |
| Elementary School | 4,554 | 17.1% |
| Middle School | 5,710 | 21.4% |
| High School | 6,161 | 23.1% |
| College / Undergraduate | 6,615 | 24.8% |
| Graduate / Professional | 1,074 | 4.0% |
| Total | 26,654 | 100.0% |
School Enrollment by Age by Funding Source in South Gate
Out of a total of 26,654 students who are enrolled in schools in South Gate, 1,706 (6.4%) attend a private institution, while the remaining 24,948 (93.6%) are enrolled in public schools. The age group of 35 years and over has the highest likelihood of being enrolled in private schools, with 264 (20.9% in the age bracket) enrolled. Conversely, the age group of 15 to 17 year olds has the lowest likelihood of being enrolled in a private school, with 4,034 (97.2% in the age bracket) attending a public institution.
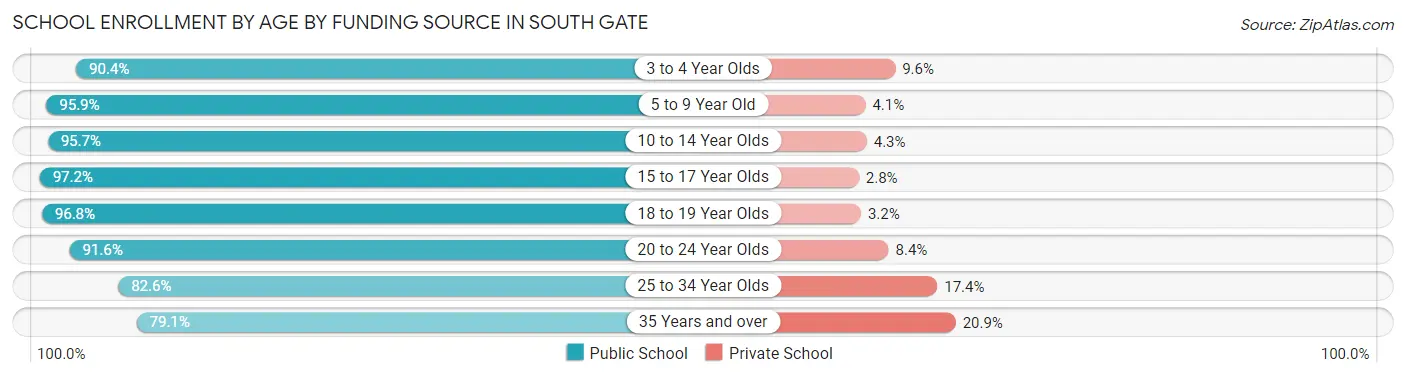
| Age Bracket | Public School | Private School |
| 3 to 4 Year Olds | 979 (90.4%) | 104 (9.6%) |
| 5 to 9 Year Old | 5,300 (95.9%) | 224 (4.1%) |
| 10 to 14 Year Olds | 6,973 (95.7%) | 314 (4.3%) |
| 15 to 17 Year Olds | 4,034 (97.2%) | 117 (2.8%) |
| 18 to 19 Year Olds | 2,013 (96.8%) | 67 (3.2%) |
| 20 to 24 Year Olds | 3,021 (91.6%) | 276 (8.4%) |
| 25 to 34 Year Olds | 1,624 (82.6%) | 343 (17.4%) |
| 35 Years and over | 1,001 (79.1%) | 264 (20.9%) |
| Total | 24,948 (93.6%) | 1,706 (6.4%) |
Educational Attainment by Field of Study in South Gate
Business (1,199 | 16.6%), social sciences (1,072 | 14.9%), arts & humanities (873 | 12.1%), engineering (596 | 8.3%), and education (525 | 7.3%) are the most common fields of study among 7,208 individuals in South Gate who have obtained a bachelor's degree or higher.
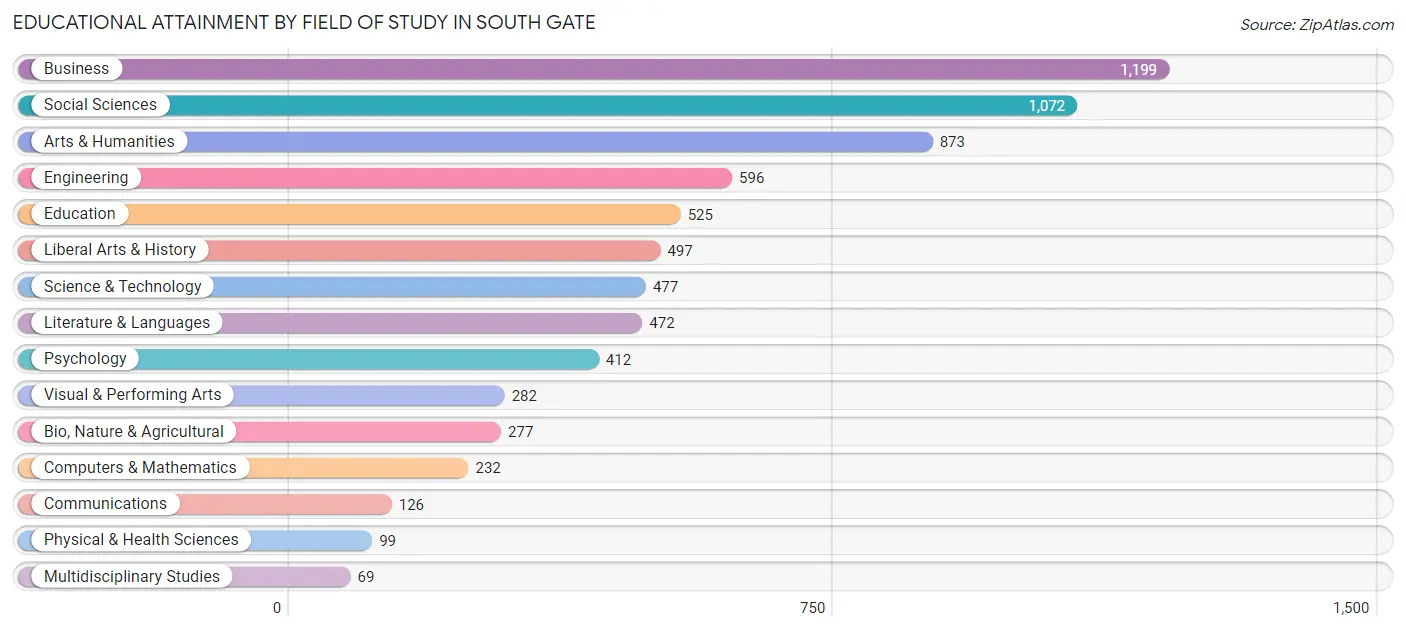
| Field of Study | # Graduates | % Graduates |
| Computers & Mathematics | 232 | 3.2% |
| Bio, Nature & Agricultural | 277 | 3.8% |
| Physical & Health Sciences | 99 | 1.4% |
| Psychology | 412 | 5.7% |
| Social Sciences | 1,072 | 14.9% |
| Engineering | 596 | 8.3% |
| Multidisciplinary Studies | 69 | 1.0% |
| Science & Technology | 477 | 6.6% |
| Business | 1,199 | 16.6% |
| Education | 525 | 7.3% |
| Literature & Languages | 472 | 6.6% |
| Liberal Arts & History | 497 | 6.9% |
| Visual & Performing Arts | 282 | 3.9% |
| Communications | 126 | 1.8% |
| Arts & Humanities | 873 | 12.1% |
| Total | 7,208 | 100.0% |
Transportation & Commute in South Gate
Vehicle Availability by Sex in South Gate
The most prevalent vehicle ownership categories in South Gate are males with 2 vehicles (6,845, accounting for 28.2%) and females with 2 vehicles (4,835, making up 38.1%).
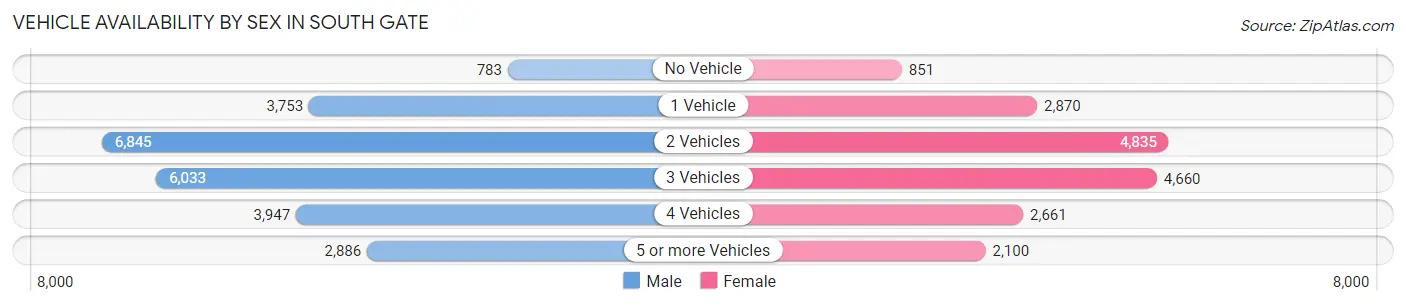
| Vehicles Available | Male | Female |
| No Vehicle | 783 (3.2%) | 851 (4.7%) |
| 1 Vehicle | 3,753 (15.5%) | 2,870 (16.0%) |
| 2 Vehicles | 6,845 (28.2%) | 4,835 (26.9%) |
| 3 Vehicles | 6,033 (24.9%) | 4,660 (25.9%) |
| 4 Vehicles | 3,947 (16.3%) | 2,661 (14.8%) |
| 5 or more Vehicles | 2,886 (11.9%) | 2,100 (11.7%) |
| Total | 24,247 (100.0%) | 17,977 (100.0%) |
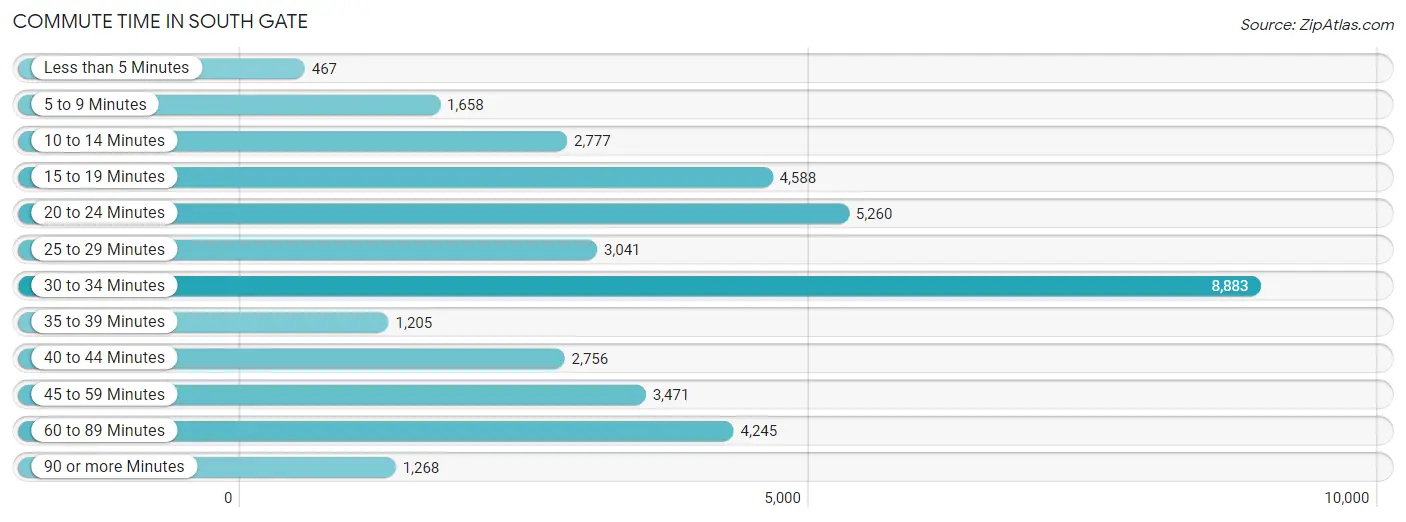
Commute Time in South Gate
The most frequently occuring commute durations in South Gate are 30 to 34 minutes (8,883 commuters, 22.4%), 20 to 24 minutes (5,260 commuters, 13.3%), and 15 to 19 minutes (4,588 commuters, 11.6%).
| Commute Time | # Commuters | % Commuters |
| Less than 5 Minutes | 467 | 1.2% |
| 5 to 9 Minutes | 1,658 | 4.2% |
| 10 to 14 Minutes | 2,777 | 7.0% |
| 15 to 19 Minutes | 4,588 | 11.6% |
| 20 to 24 Minutes | 5,260 | 13.3% |
| 25 to 29 Minutes | 3,041 | 7.7% |
| 30 to 34 Minutes | 8,883 | 22.4% |
| 35 to 39 Minutes | 1,205 | 3.0% |
| 40 to 44 Minutes | 2,756 | 7.0% |
| 45 to 59 Minutes | 3,471 | 8.8% |
| 60 to 89 Minutes | 4,245 | 10.7% |
| 90 or more Minutes | 1,268 | 3.2% |
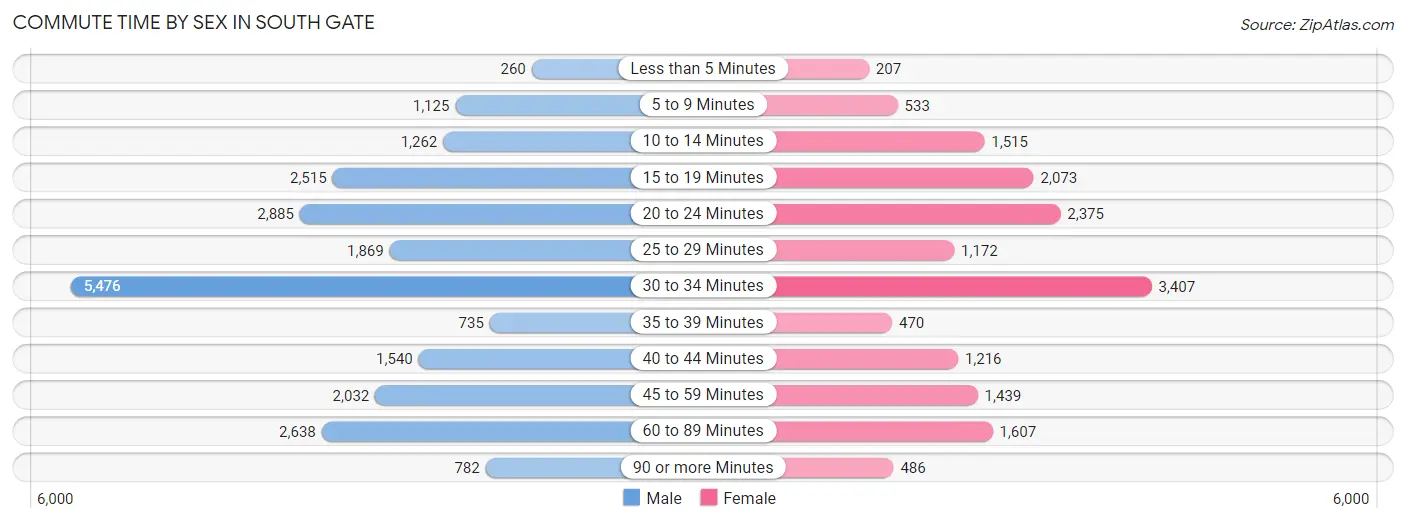
Commute Time by Sex in South Gate
The most common commute times in South Gate are 30 to 34 minutes (5,476 commuters, 23.7%) for males and 30 to 34 minutes (3,407 commuters, 20.6%) for females.
| Commute Time | Male | Female |
| Less than 5 Minutes | 260 (1.1%) | 207 (1.3%) |
| 5 to 9 Minutes | 1,125 (4.9%) | 533 (3.2%) |
| 10 to 14 Minutes | 1,262 (5.5%) | 1,515 (9.2%) |
| 15 to 19 Minutes | 2,515 (10.9%) | 2,073 (12.6%) |
| 20 to 24 Minutes | 2,885 (12.5%) | 2,375 (14.4%) |
| 25 to 29 Minutes | 1,869 (8.1%) | 1,172 (7.1%) |
| 30 to 34 Minutes | 5,476 (23.7%) | 3,407 (20.6%) |
| 35 to 39 Minutes | 735 (3.2%) | 470 (2.9%) |
| 40 to 44 Minutes | 1,540 (6.7%) | 1,216 (7.4%) |
| 45 to 59 Minutes | 2,032 (8.8%) | 1,439 (8.7%) |
| 60 to 89 Minutes | 2,638 (11.4%) | 1,607 (9.7%) |
| 90 or more Minutes | 782 (3.4%) | 486 (2.9%) |
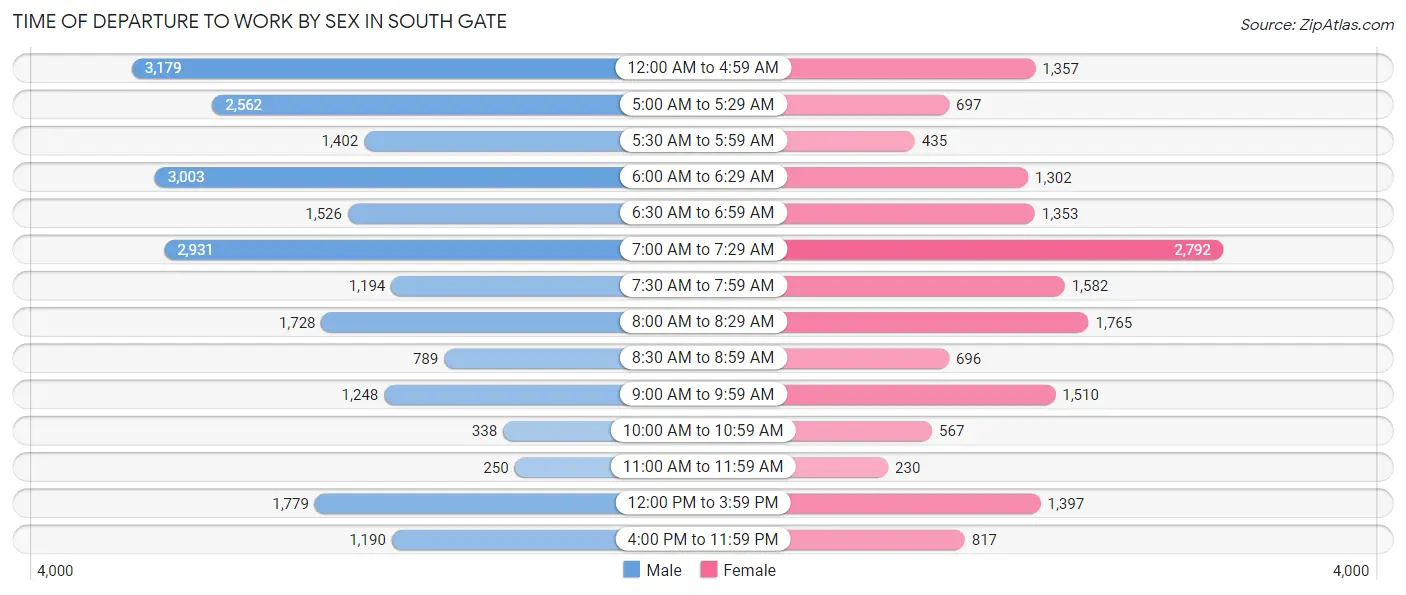
Time of Departure to Work by Sex in South Gate
The most frequent times of departure to work in South Gate are 12:00 AM to 4:59 AM (3,179, 13.8%) for males and 7:00 AM to 7:29 AM (2,792, 16.9%) for females.
| Time of Departure | Male | Female |
| 12:00 AM to 4:59 AM | 3,179 (13.8%) | 1,357 (8.2%) |
| 5:00 AM to 5:29 AM | 2,562 (11.1%) | 697 (4.2%) |
| 5:30 AM to 5:59 AM | 1,402 (6.1%) | 435 (2.6%) |
| 6:00 AM to 6:29 AM | 3,003 (13.0%) | 1,302 (7.9%) |
| 6:30 AM to 6:59 AM | 1,526 (6.6%) | 1,353 (8.2%) |
| 7:00 AM to 7:29 AM | 2,931 (12.7%) | 2,792 (16.9%) |
| 7:30 AM to 7:59 AM | 1,194 (5.2%) | 1,582 (9.6%) |
| 8:00 AM to 8:29 AM | 1,728 (7.5%) | 1,765 (10.7%) |
| 8:30 AM to 8:59 AM | 789 (3.4%) | 696 (4.2%) |
| 9:00 AM to 9:59 AM | 1,248 (5.4%) | 1,510 (9.1%) |
| 10:00 AM to 10:59 AM | 338 (1.5%) | 567 (3.4%) |
| 11:00 AM to 11:59 AM | 250 (1.1%) | 230 (1.4%) |
| 12:00 PM to 3:59 PM | 1,779 (7.7%) | 1,397 (8.5%) |
| 4:00 PM to 11:59 PM | 1,190 (5.1%) | 817 (5.0%) |
| Total | 23,119 (100.0%) | 16,500 (100.0%) |
Housing Occupancy in South Gate
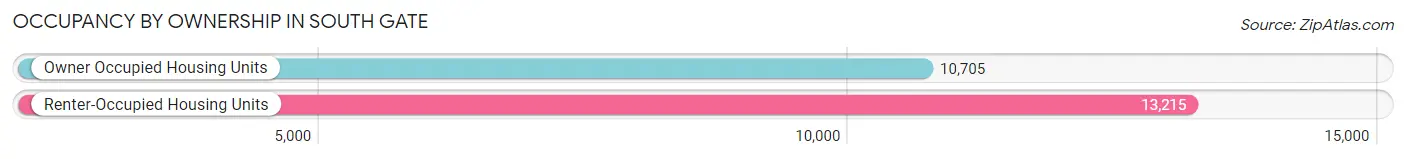
Occupancy by Ownership in South Gate
Of the total 23,920 dwellings in South Gate, owner-occupied units account for 10,705 (44.8%), while renter-occupied units make up 13,215 (55.2%).
| Occupancy | # Housing Units | % Housing Units |
| Owner Occupied Housing Units | 10,705 | 44.8% |
| Renter-Occupied Housing Units | 13,215 | 55.2% |
| Total Occupied Housing Units | 23,920 | 100.0% |
Occupancy by Household Size in South Gate
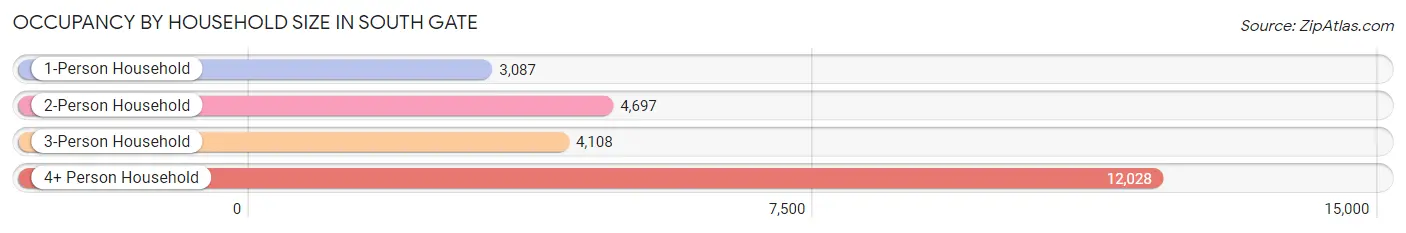
| Household Size | # Housing Units | % Housing Units |
| 1-Person Household | 3,087 | 12.9% |
| 2-Person Household | 4,697 | 19.6% |
| 3-Person Household | 4,108 | 17.2% |
| 4+ Person Household | 12,028 | 50.3% |
| Total Housing Units | 23,920 | 100.0% |
Occupancy by Ownership by Household Size in South Gate
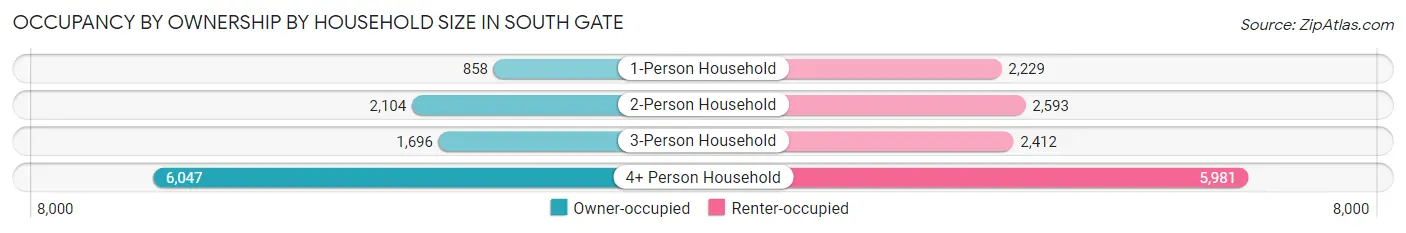
| Household Size | Owner-occupied | Renter-occupied |
| 1-Person Household | 858 (27.8%) | 2,229 (72.2%) |
| 2-Person Household | 2,104 (44.8%) | 2,593 (55.2%) |
| 3-Person Household | 1,696 (41.3%) | 2,412 (58.7%) |
| 4+ Person Household | 6,047 (50.3%) | 5,981 (49.7%) |
| Total Housing Units | 10,705 (44.8%) | 13,215 (55.2%) |
Occupancy by Educational Attainment in South Gate
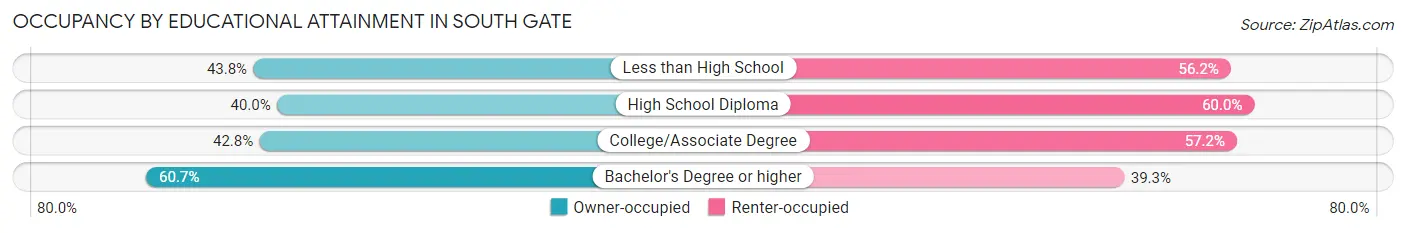
| Household Size | Owner-occupied | Renter-occupied |
| Less than High School | 4,416 (43.8%) | 5,671 (56.2%) |
| High School Diploma | 2,248 (40.0%) | 3,367 (60.0%) |
| College/Associate Degree | 2,269 (42.8%) | 3,031 (57.2%) |
| Bachelor's Degree or higher | 1,772 (60.7%) | 1,146 (39.3%) |
Occupancy by Age of Householder in South Gate
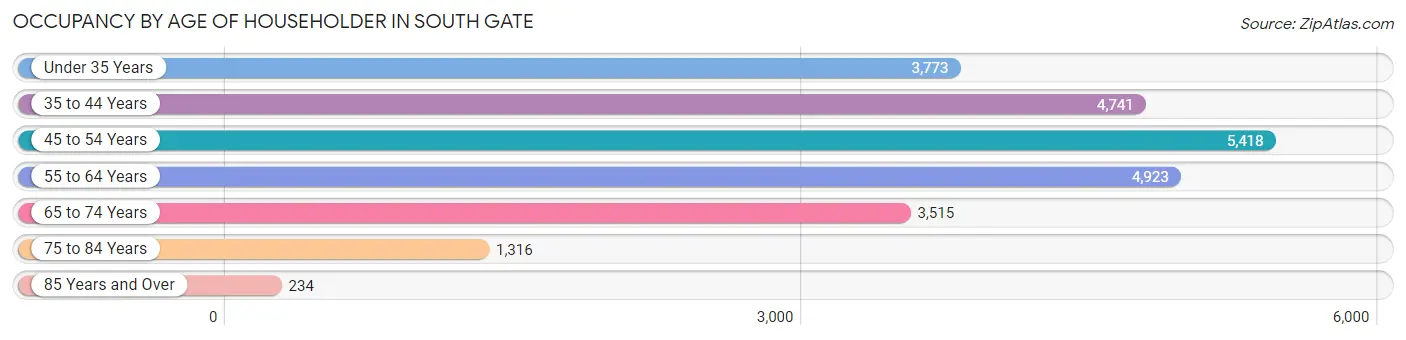
| Age Bracket | # Households | % Households |
| Under 35 Years | 3,773 | 15.8% |
| 35 to 44 Years | 4,741 | 19.8% |
| 45 to 54 Years | 5,418 | 22.7% |
| 55 to 64 Years | 4,923 | 20.6% |
| 65 to 74 Years | 3,515 | 14.7% |
| 75 to 84 Years | 1,316 | 5.5% |
| 85 Years and Over | 234 | 1.0% |
| Total | 23,920 | 100.0% |
Housing Finances in South Gate
Median Income by Occupancy in South Gate
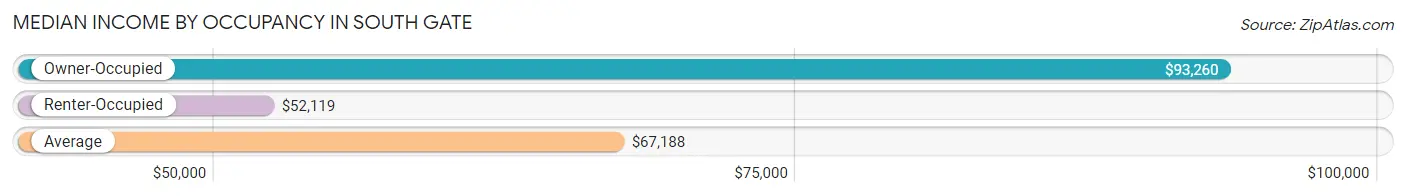
| Occupancy Type | # Households | Median Income |
| Owner-Occupied | 10,705 (44.8%) | $93,260 |
| Renter-Occupied | 13,215 (55.2%) | $52,119 |
| Average | 23,920 (100.0%) | $67,188 |
Occupancy by Householder Income Bracket in South Gate
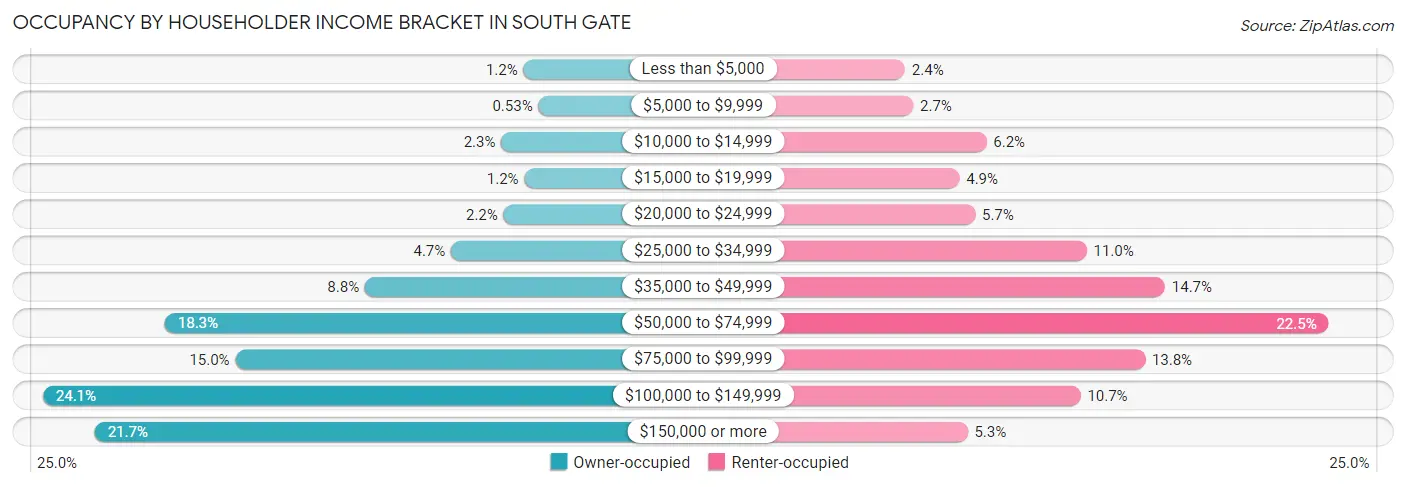
| Income Bracket | Owner-occupied | Renter-occupied |
| Less than $5,000 | 133 (1.2%) | 310 (2.4%) |
| $5,000 to $9,999 | 57 (0.5%) | 362 (2.7%) |
| $10,000 to $14,999 | 246 (2.3%) | 823 (6.2%) |
| $15,000 to $19,999 | 128 (1.2%) | 653 (4.9%) |
| $20,000 to $24,999 | 234 (2.2%) | 752 (5.7%) |
| $25,000 to $34,999 | 502 (4.7%) | 1,453 (11.0%) |
| $35,000 to $49,999 | 941 (8.8%) | 1,946 (14.7%) |
| $50,000 to $74,999 | 1,961 (18.3%) | 2,976 (22.5%) |
| $75,000 to $99,999 | 1,601 (15.0%) | 1,821 (13.8%) |
| $100,000 to $149,999 | 2,583 (24.1%) | 1,415 (10.7%) |
| $150,000 or more | 2,319 (21.7%) | 704 (5.3%) |
| Total | 10,705 (100.0%) | 13,215 (100.0%) |
Monthly Housing Cost Tiers in South Gate
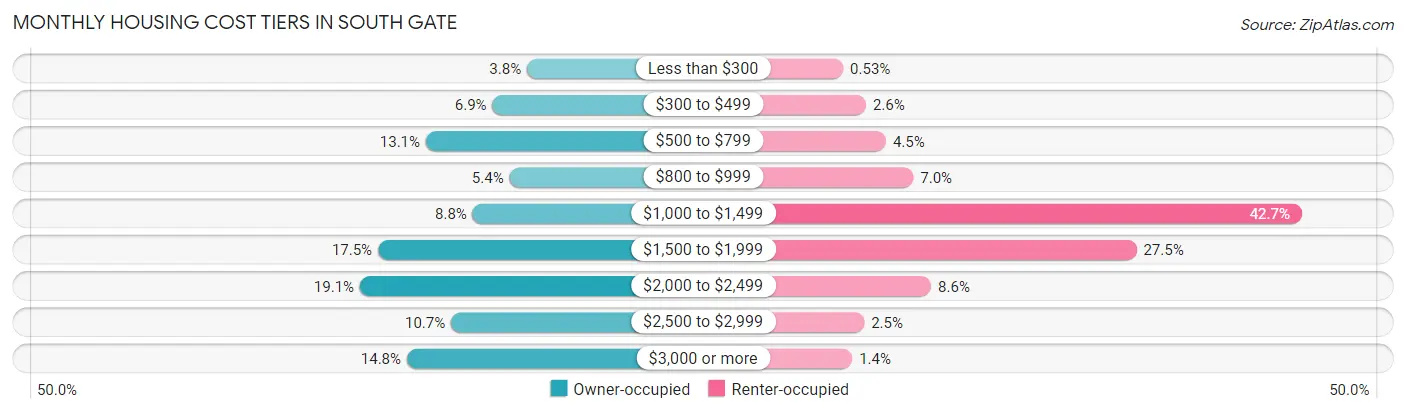
| Monthly Cost | Owner-occupied | Renter-occupied |
| Less than $300 | 401 (3.7%) | 70 (0.5%) |
| $300 to $499 | 742 (6.9%) | 348 (2.6%) |
| $500 to $799 | 1,398 (13.1%) | 591 (4.5%) |
| $800 to $999 | 574 (5.4%) | 924 (7.0%) |
| $1,000 to $1,499 | 937 (8.7%) | 5,648 (42.7%) |
| $1,500 to $1,999 | 1,870 (17.5%) | 3,638 (27.5%) |
| $2,000 to $2,499 | 2,048 (19.1%) | 1,141 (8.6%) |
| $2,500 to $2,999 | 1,150 (10.7%) | 327 (2.5%) |
| $3,000 or more | 1,585 (14.8%) | 180 (1.4%) |
| Total | 10,705 (100.0%) | 13,215 (100.0%) |
Physical Housing Characteristics in South Gate
Housing Structures in South Gate
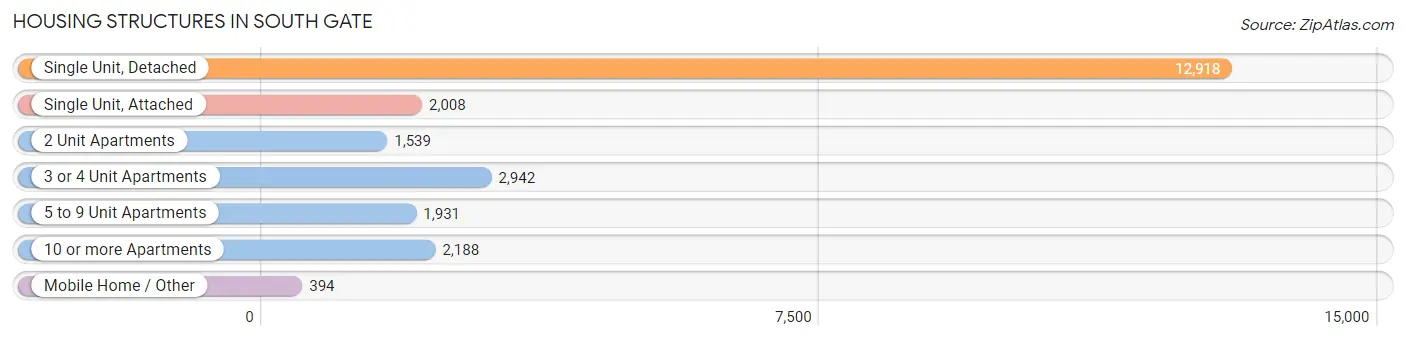
| Structure Type | # Housing Units | % Housing Units |
| Single Unit, Detached | 12,918 | 54.0% |
| Single Unit, Attached | 2,008 | 8.4% |
| 2 Unit Apartments | 1,539 | 6.4% |
| 3 or 4 Unit Apartments | 2,942 | 12.3% |
| 5 to 9 Unit Apartments | 1,931 | 8.1% |
| 10 or more Apartments | 2,188 | 9.1% |
| Mobile Home / Other | 394 | 1.7% |
| Total | 23,920 | 100.0% |
Housing Structures by Occupancy in South Gate
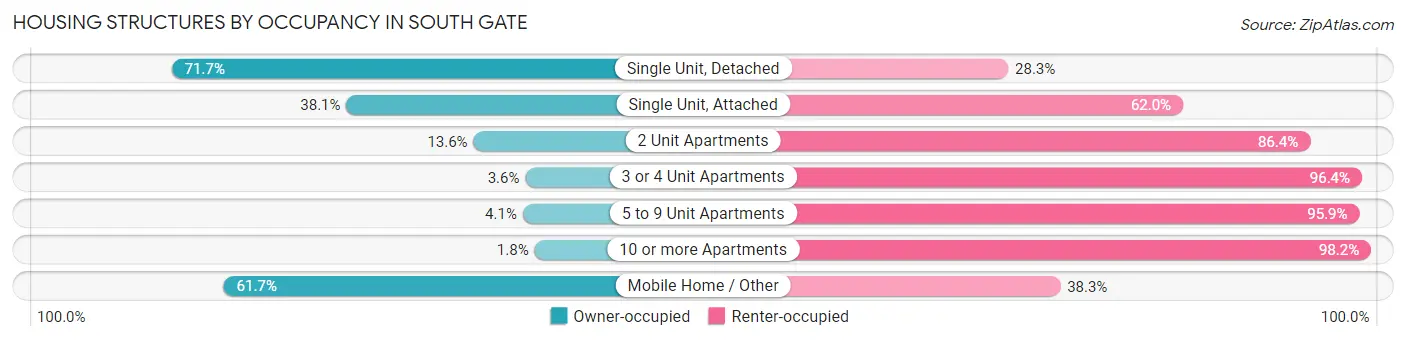
| Structure Type | Owner-occupied | Renter-occupied |
| Single Unit, Detached | 9,264 (71.7%) | 3,654 (28.3%) |
| Single Unit, Attached | 764 (38.1%) | 1,244 (62.0%) |
| 2 Unit Apartments | 209 (13.6%) | 1,330 (86.4%) |
| 3 or 4 Unit Apartments | 106 (3.6%) | 2,836 (96.4%) |
| 5 to 9 Unit Apartments | 79 (4.1%) | 1,852 (95.9%) |
| 10 or more Apartments | 40 (1.8%) | 2,148 (98.2%) |
| Mobile Home / Other | 243 (61.7%) | 151 (38.3%) |
| Total | 10,705 (44.8%) | 13,215 (55.2%) |
Housing Structures by Number of Rooms in South Gate
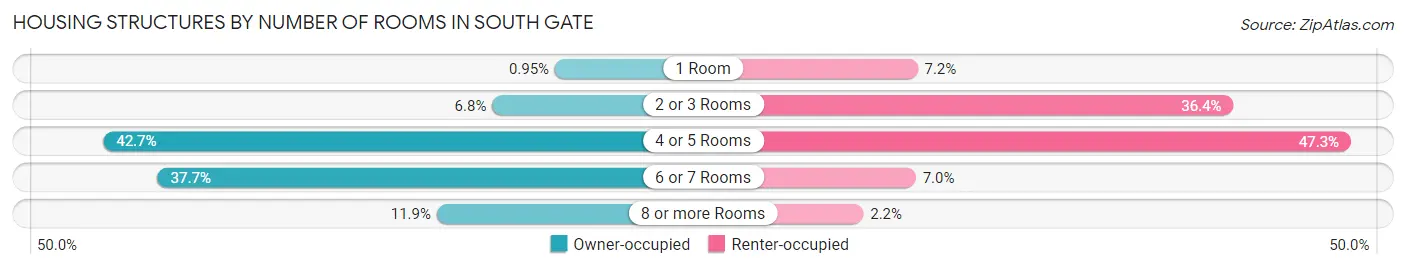
| Number of Rooms | Owner-occupied | Renter-occupied |
| 1 Room | 102 (0.9%) | 949 (7.2%) |
| 2 or 3 Rooms | 723 (6.8%) | 4,809 (36.4%) |
| 4 or 5 Rooms | 4,573 (42.7%) | 6,246 (47.3%) |
| 6 or 7 Rooms | 4,035 (37.7%) | 926 (7.0%) |
| 8 or more Rooms | 1,272 (11.9%) | 285 (2.2%) |
| Total | 10,705 (100.0%) | 13,215 (100.0%) |
Housing Structure by Heating Type in South Gate
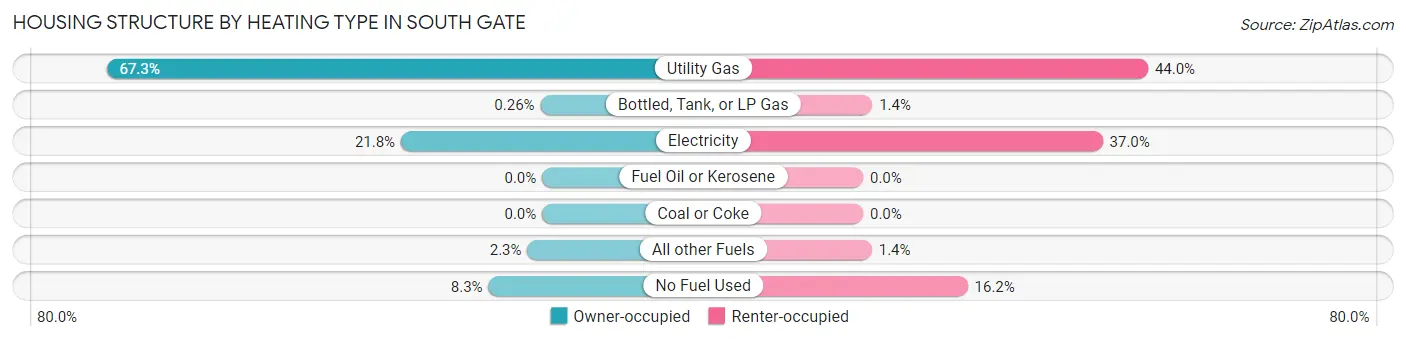
| Heating Type | Owner-occupied | Renter-occupied |
| Utility Gas | 7,208 (67.3%) | 5,820 (44.0%) |
| Bottled, Tank, or LP Gas | 28 (0.3%) | 187 (1.4%) |
| Electricity | 2,336 (21.8%) | 4,894 (37.0%) |
| Fuel Oil or Kerosene | 0 (0.0%) | 0 (0.0%) |
| Coal or Coke | 0 (0.0%) | 0 (0.0%) |
| All other Fuels | 244 (2.3%) | 179 (1.3%) |
| No Fuel Used | 889 (8.3%) | 2,135 (16.2%) |
| Total | 10,705 (100.0%) | 13,215 (100.0%) |
Household Vehicle Usage in South Gate

| Vehicles per Household | Owner-occupied | Renter-occupied |
| No Vehicle | 416 (3.9%) | 1,535 (11.6%) |
| 1 Vehicle | 1,443 (13.5%) | 4,940 (37.4%) |
| 2 Vehicles | 2,743 (25.6%) | 4,277 (32.4%) |
| 3 or more Vehicles | 6,103 (57.0%) | 2,463 (18.6%) |
| Total | 10,705 (100.0%) | 13,215 (100.0%) |
Real Estate & Mortgages in South Gate
Real Estate and Mortgage Overview in South Gate
| Characteristic | Without Mortgage | With Mortgage |
| Housing Units | 3,094 | 7,611 |
| Median Property Value | $558,500 | $585,700 |
| Median Household Income | $73,841 | $1,844 |
| Monthly Housing Costs | $567 | $1,559 |
| Real Estate Taxes | $3,312 | $103 |
Property Value by Mortgage Status in South Gate
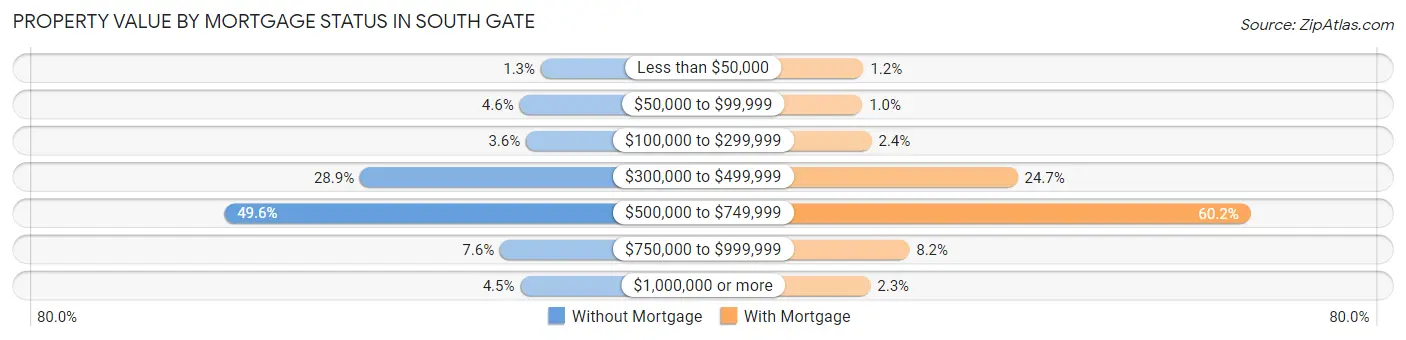
| Property Value | Without Mortgage | With Mortgage |
| Less than $50,000 | 41 (1.3%) | 92 (1.2%) |
| $50,000 to $99,999 | 142 (4.6%) | 78 (1.0%) |
| $100,000 to $299,999 | 111 (3.6%) | 186 (2.4%) |
| $300,000 to $499,999 | 894 (28.9%) | 1,879 (24.7%) |
| $500,000 to $749,999 | 1,534 (49.6%) | 4,582 (60.2%) |
| $750,000 to $999,999 | 234 (7.6%) | 623 (8.2%) |
| $1,000,000 or more | 138 (4.5%) | 171 (2.2%) |
| Total | 3,094 (100.0%) | 7,611 (100.0%) |
Household Income by Mortgage Status in South Gate
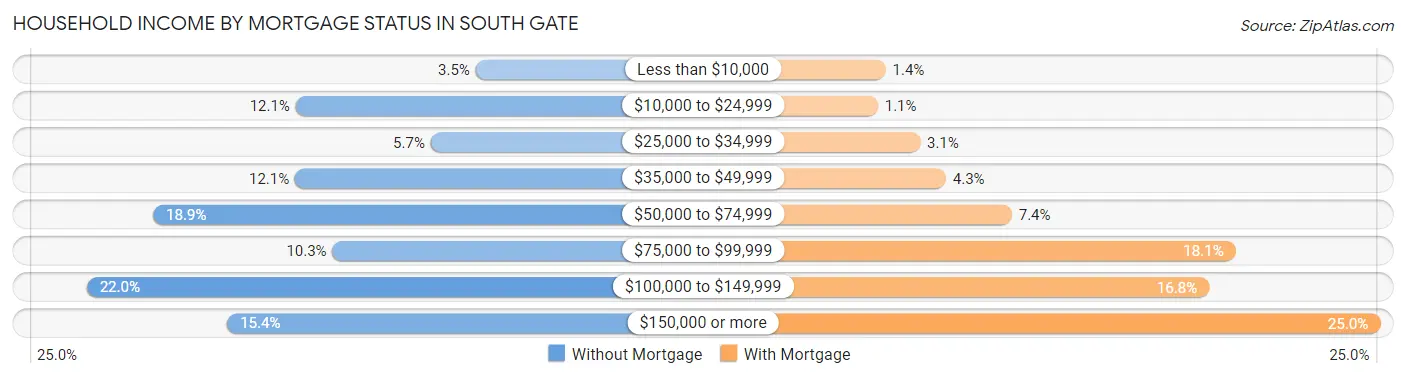
| Household Income | Without Mortgage | With Mortgage |
| Less than $10,000 | 109 (3.5%) | 109 (1.4%) |
| $10,000 to $24,999 | 374 (12.1%) | 81 (1.1%) |
| $25,000 to $34,999 | 175 (5.7%) | 234 (3.1%) |
| $35,000 to $49,999 | 375 (12.1%) | 327 (4.3%) |
| $50,000 to $74,999 | 584 (18.9%) | 566 (7.4%) |
| $75,000 to $99,999 | 320 (10.3%) | 1,377 (18.1%) |
| $100,000 to $149,999 | 682 (22.0%) | 1,281 (16.8%) |
| $150,000 or more | 475 (15.3%) | 1,901 (25.0%) |
| Total | 3,094 (100.0%) | 7,611 (100.0%) |
Property Value to Household Income Ratio in South Gate
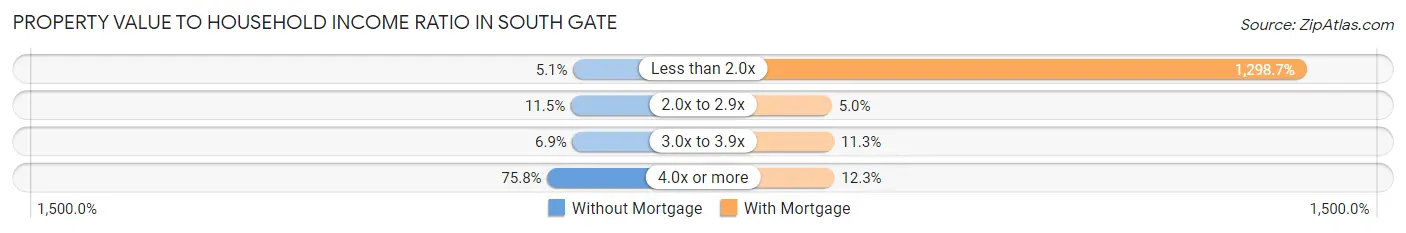
| Value-to-Income Ratio | Without Mortgage | With Mortgage |
| Less than 2.0x | 159 (5.1%) | 98,845 (1,298.7%) |
| 2.0x to 2.9x | 357 (11.5%) | 381 (5.0%) |
| 3.0x to 3.9x | 214 (6.9%) | 859 (11.3%) |
| 4.0x or more | 2,345 (75.8%) | 934 (12.3%) |
| Total | 3,094 (100.0%) | 7,611 (100.0%) |
Real Estate Taxes by Mortgage Status in South Gate
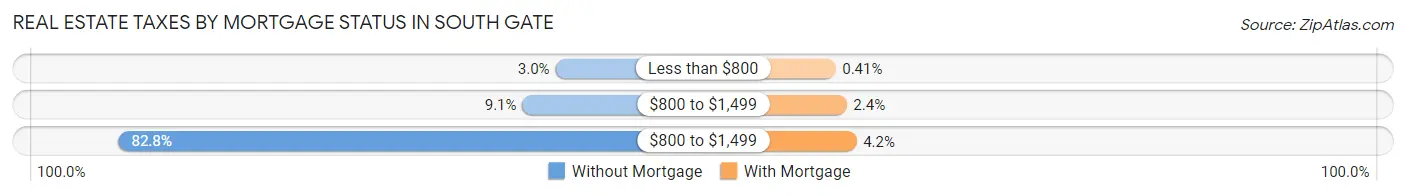
| Property Taxes | Without Mortgage | With Mortgage |
| Less than $800 | 94 (3.0%) | 31 (0.4%) |
| $800 to $1,499 | 281 (9.1%) | 186 (2.4%) |
| $800 to $1,499 | 2,563 (82.8%) | 322 (4.2%) |
| Total | 3,094 (100.0%) | 7,611 (100.0%) |
Health & Disability in South Gate
Health Insurance Coverage by Age in South Gate
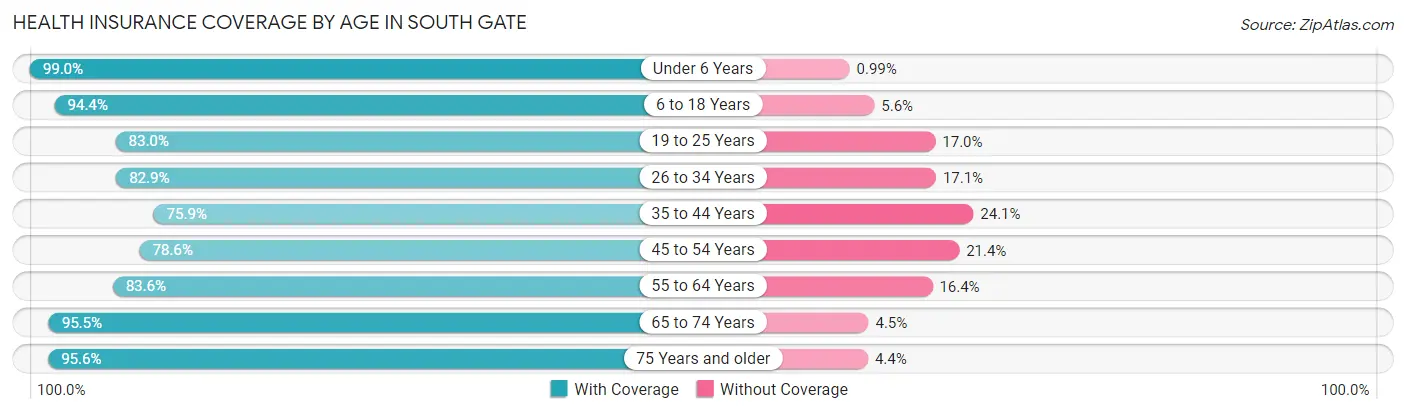
| Age Bracket | With Coverage | Without Coverage |
| Under 6 Years | 6,170 (99.0%) | 62 (1.0%) |
| 6 to 18 Years | 17,096 (94.4%) | 1,014 (5.6%) |
| 19 to 25 Years | 8,724 (83.0%) | 1,784 (17.0%) |
| 26 to 34 Years | 10,670 (82.9%) | 2,200 (17.1%) |
| 35 to 44 Years | 9,109 (75.9%) | 2,888 (24.1%) |
| 45 to 54 Years | 9,450 (78.6%) | 2,577 (21.4%) |
| 55 to 64 Years | 8,441 (83.6%) | 1,661 (16.4%) |
| 65 to 74 Years | 6,449 (95.5%) | 305 (4.5%) |
| 75 Years and older | 3,472 (95.6%) | 160 (4.4%) |
| Total | 79,581 (86.3%) | 12,651 (13.7%) |
Health Insurance Coverage by Citizenship Status in South Gate
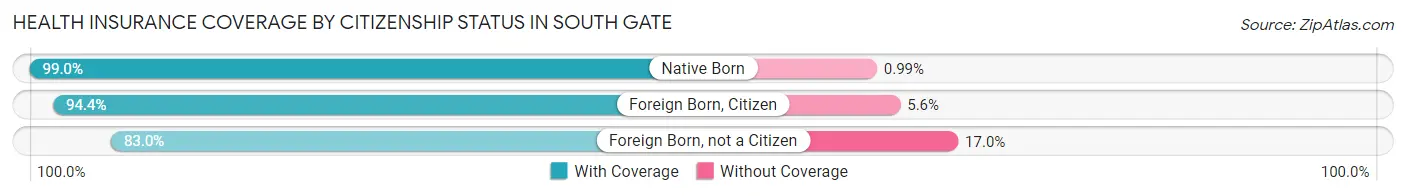
| Citizenship Status | With Coverage | Without Coverage |
| Native Born | 6,170 (99.0%) | 62 (1.0%) |
| Foreign Born, Citizen | 17,096 (94.4%) | 1,014 (5.6%) |
| Foreign Born, not a Citizen | 8,724 (83.0%) | 1,784 (17.0%) |
Health Insurance Coverage by Household Income in South Gate
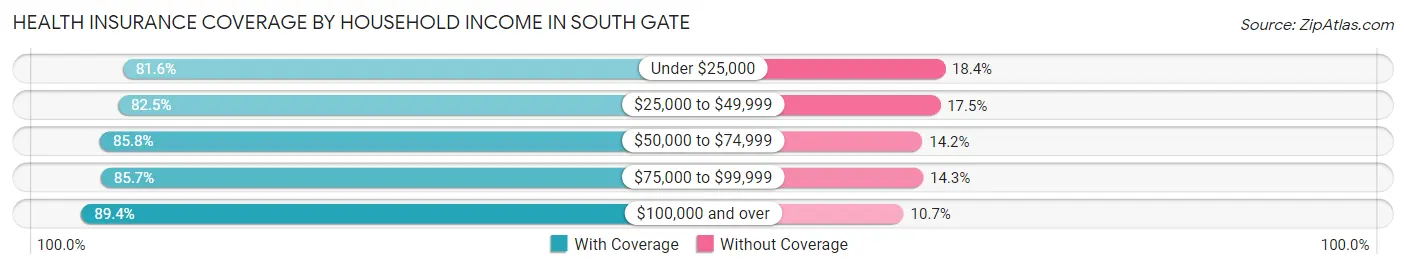
| Household Income | With Coverage | Without Coverage |
| Under $25,000 | 6,401 (81.6%) | 1,442 (18.4%) |
| $25,000 to $49,999 | 12,728 (82.5%) | 2,700 (17.5%) |
| $50,000 to $74,999 | 16,011 (85.8%) | 2,642 (14.2%) |
| $75,000 to $99,999 | 12,029 (85.7%) | 2,005 (14.3%) |
| $100,000 and over | 32,397 (89.3%) | 3,862 (10.6%) |
Public vs Private Health Insurance Coverage by Age in South Gate
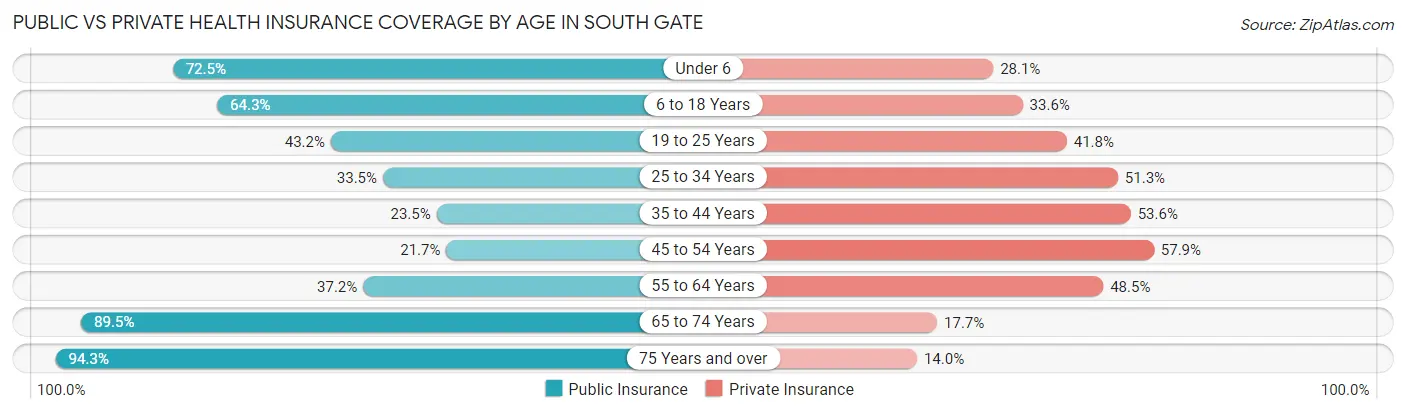
| Age Bracket | Public Insurance | Private Insurance |
| Under 6 | 4,518 (72.5%) | 1,751 (28.1%) |
| 6 to 18 Years | 11,635 (64.2%) | 6,079 (33.6%) |
| 19 to 25 Years | 4,535 (43.2%) | 4,388 (41.8%) |
| 25 to 34 Years | 4,312 (33.5%) | 6,596 (51.2%) |
| 35 to 44 Years | 2,824 (23.5%) | 6,434 (53.6%) |
| 45 to 54 Years | 2,613 (21.7%) | 6,966 (57.9%) |
| 55 to 64 Years | 3,755 (37.2%) | 4,903 (48.5%) |
| 65 to 74 Years | 6,046 (89.5%) | 1,195 (17.7%) |
| 75 Years and over | 3,423 (94.3%) | 507 (14.0%) |
| Total | 43,661 (47.3%) | 38,819 (42.1%) |
Disability Status by Sex by Age in South Gate
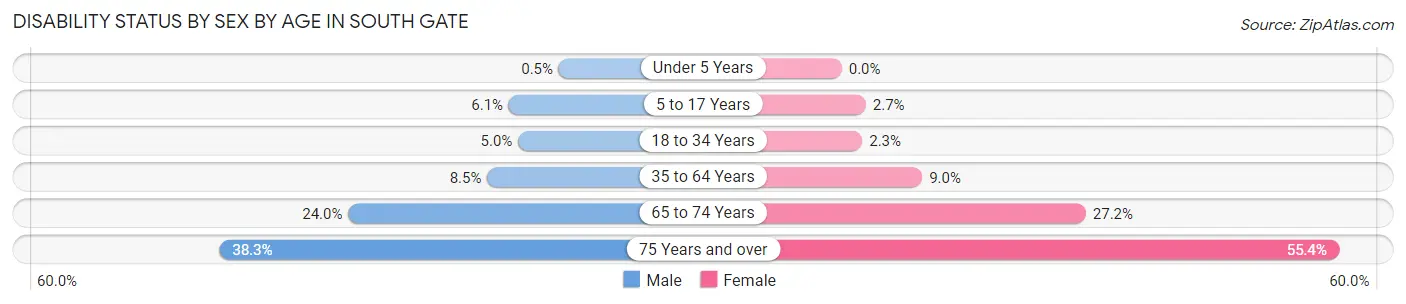
| Age Bracket | Male | Female |
| Under 5 Years | 15 (0.5%) | 0 (0.0%) |
| 5 to 17 Years | 515 (6.1%) | 240 (2.7%) |
| 18 to 34 Years | 623 (5.0%) | 283 (2.3%) |
| 35 to 64 Years | 1,441 (8.5%) | 1,533 (9.0%) |
| 65 to 74 Years | 761 (23.9%) | 972 (27.2%) |
| 75 Years and over | 511 (38.3%) | 1,272 (55.3%) |
Disability Class by Sex by Age in South Gate
Disability Class: Hearing Difficulty
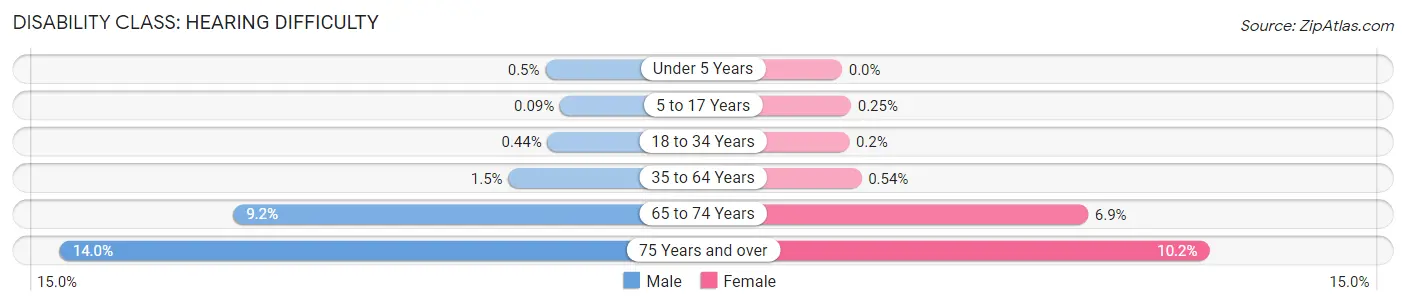
| Age Bracket | Male | Female |
| Under 5 Years | 15 (0.5%) | 0 (0.0%) |
| 5 to 17 Years | 8 (0.1%) | 22 (0.3%) |
| 18 to 34 Years | 54 (0.4%) | 25 (0.2%) |
| 35 to 64 Years | 260 (1.5%) | 92 (0.5%) |
| 65 to 74 Years | 292 (9.2%) | 245 (6.9%) |
| 75 Years and over | 187 (14.0%) | 235 (10.2%) |
Disability Class: Vision Difficulty
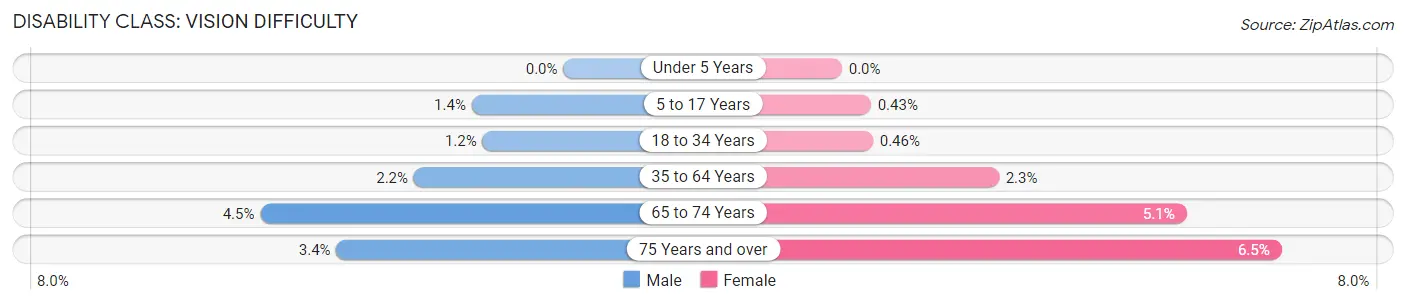
| Age Bracket | Male | Female |
| Under 5 Years | 0 (0.0%) | 0 (0.0%) |
| 5 to 17 Years | 116 (1.4%) | 39 (0.4%) |
| 18 to 34 Years | 148 (1.2%) | 57 (0.5%) |
| 35 to 64 Years | 377 (2.2%) | 399 (2.3%) |
| 65 to 74 Years | 143 (4.5%) | 183 (5.1%) |
| 75 Years and over | 45 (3.4%) | 150 (6.5%) |
Disability Class: Cognitive Difficulty
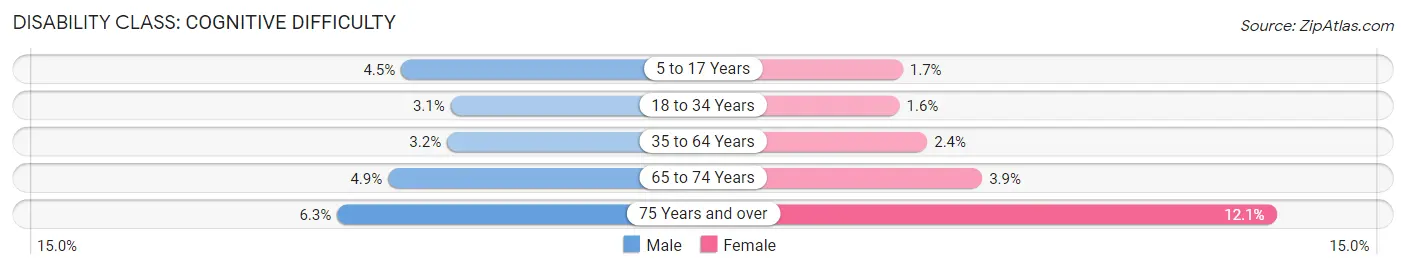
| Age Bracket | Male | Female |
| 5 to 17 Years | 384 (4.5%) | 152 (1.7%) |
| 18 to 34 Years | 389 (3.1%) | 200 (1.6%) |
| 35 to 64 Years | 552 (3.2%) | 408 (2.4%) |
| 65 to 74 Years | 155 (4.9%) | 140 (3.9%) |
| 75 Years and over | 84 (6.3%) | 278 (12.1%) |
Disability Class: Ambulatory Difficulty
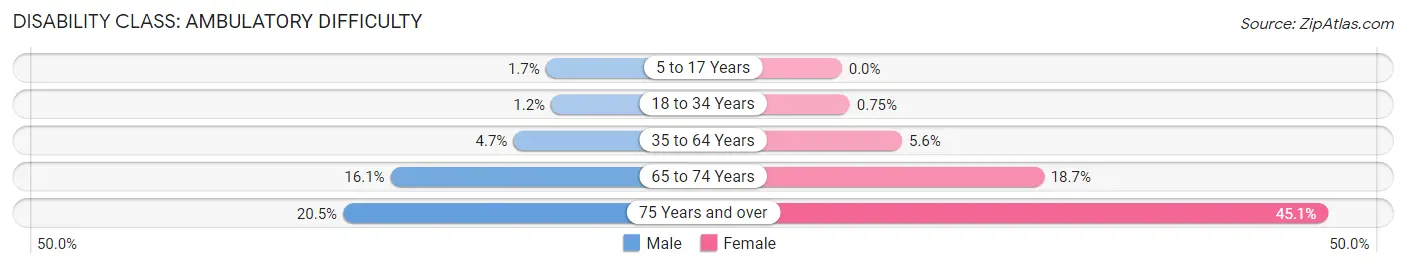
| Age Bracket | Male | Female |
| 5 to 17 Years | 140 (1.7%) | 0 (0.0%) |
| 18 to 34 Years | 143 (1.1%) | 93 (0.7%) |
| 35 to 64 Years | 793 (4.7%) | 957 (5.6%) |
| 65 to 74 Years | 510 (16.1%) | 670 (18.7%) |
| 75 Years and over | 273 (20.5%) | 1,037 (45.1%) |
Disability Class: Self-Care Difficulty
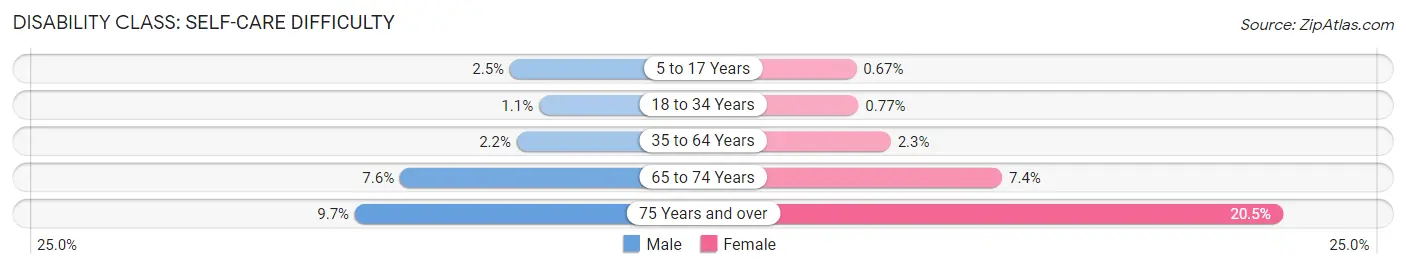
| Age Bracket | Male | Female |
| 5 to 17 Years | 211 (2.5%) | 60 (0.7%) |
| 18 to 34 Years | 140 (1.1%) | 96 (0.8%) |
| 35 to 64 Years | 367 (2.2%) | 389 (2.3%) |
| 65 to 74 Years | 241 (7.6%) | 266 (7.4%) |
| 75 Years and over | 129 (9.7%) | 470 (20.4%) |
Technology Access in South Gate
Computing Device Access in South Gate
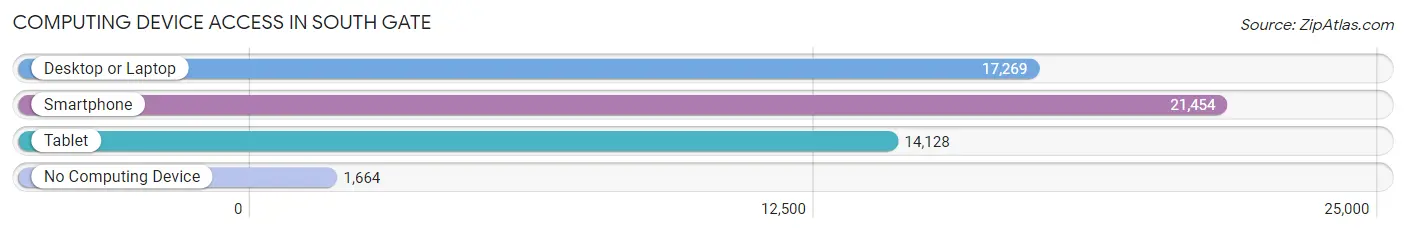
| Device Type | # Households | % Households |
| Desktop or Laptop | 17,269 | 72.2% |
| Smartphone | 21,454 | 89.7% |
| Tablet | 14,128 | 59.1% |
| No Computing Device | 1,664 | 7.0% |
| Total | 23,920 | 100.0% |
Internet Access in South Gate
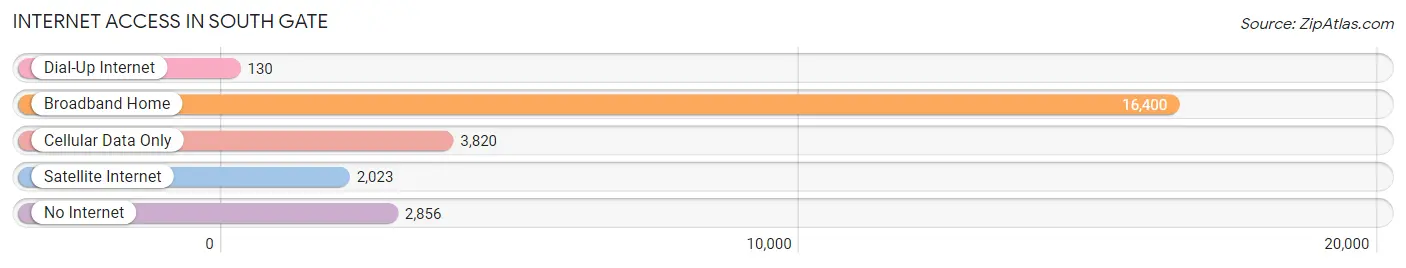
| Internet Type | # Households | % Households |
| Dial-Up Internet | 130 | 0.5% |
| Broadband Home | 16,400 | 68.6% |
| Cellular Data Only | 3,820 | 16.0% |
| Satellite Internet | 2,023 | 8.5% |
| No Internet | 2,856 | 11.9% |
| Total | 23,920 | 100.0% |
South Gate Summary
History
South Gate is a city located in the southeastern region of Los Angeles County, California. It is bordered by the cities of Lynwood to the north, Downey to the northwest, Bell to the southwest, and Huntington Park to the south. The city was incorporated in 1923 and has a population of approximately 94,396 as of the 2010 census.
South Gate was originally part of the Rancho San Antonio, a Spanish land grant given to Juan Jose Dominguez in 1784. The area was first settled by the Spanish in the late 1700s and was known as Rancho San Antonio de los Palos Verdes. The area was later developed by the Dominguez family, who built a large adobe ranch house in the area. The area was then sold to the South Gate Land and Water Company in 1906, which began to develop the area into a residential community.
The city was officially incorporated in 1923 and was named after the large iron gates that were installed at the entrance of the city. The gates were designed by the city's first mayor, John S. Gibson, and were meant to symbolize the city's progress and prosperity.
Geography
South Gate is located in the southeastern region of Los Angeles County, California. It is bordered by the cities of Lynwood to the north, Downey to the northwest, Bell to the southwest, and Huntington Park to the south. The city has a total area of 5.2 square miles, all of which is land.
The city is located in the Los Angeles Basin and is surrounded by the San Gabriel Mountains to the north and the San Bernardino Mountains to the east. The city is located in the Los Angeles-Long Beach-Anaheim metropolitan area and is part of the Gateway Cities region.
Economy
South Gate is a primarily residential city, but it does have a few major employers. The largest employer in the city is the South Gate Unified School District, which employs over 2,000 people. Other major employers include the City of South Gate, the Los Angeles County Sheriff's Department, and the Los Angeles County Fire Department.
The city also has a number of small businesses, including restaurants, retail stores, and auto repair shops. The city is also home to a number of industrial businesses, including a steel mill, a paper mill, and a plastics factory.
Demographics
As of the 2010 census, South Gate had a population of 94,396. The racial makeup of the city was 57.2% Hispanic or Latino, 28.2% White (non-Hispanic), 8.3% African American, 0.7% Native American, 1.2% Asian, 0.1% Pacific Islander, and 2.5% from two or more races.
The median household income in South Gate was $41,945 in 2010, and the median family income was $45,945. The per capita income was $17,845. The city has a poverty rate of 24.3%, which is higher than the national average.
Common Questions
What is Per Capita Income in South Gate?
Per Capita income in South Gate is $22,927.
What is the Median Family Income in South Gate?
Median Family Income in South Gate is $68,884.
What is the Median Household income in South Gate?
Median Household Income in South Gate is $67,188.
What is Income or Wage Gap in South Gate?
Income or Wage Gap in South Gate is 21.3%.
Women in South Gate earn 78.7 cents for every dollar earned by a man.
What is Family Income Deficit in South Gate?
Family Income Deficit in South Gate is $9,093.
Families that are below poverty line in South Gate earn $9,093 less on average than the poverty threshold level.
What is Inequality or Gini Index in South Gate?
Inequality or Gini Index in South Gate is 0.41.
What is the Total Population of South Gate?
Total Population of South Gate is 92,381.
What is the Total Male Population of South Gate?
Total Male Population of South Gate is 45,530.
What is the Total Female Population of South Gate?
Total Female Population of South Gate is 46,851.
What is the Ratio of Males per 100 Females in South Gate?
There are 97.18 Males per 100 Females in South Gate.
What is the Ratio of Females per 100 Males in South Gate?
There are 102.90 Females per 100 Males in South Gate.
What is the Median Population Age in South Gate?
Median Population Age in South Gate is 33.7 Years.
What is the Average Family Size in South Gate
Average Family Size in South Gate is 4.1 People.
What is the Average Household Size in South Gate
Average Household Size in South Gate is 3.9 People.
How Large is the Labor Force in South Gate?
There are 47,122 People in the Labor Forcein in South Gate.
What is the Percentage of People in the Labor Force in South Gate?
65.3% of People are in the Labor Force in South Gate.
What is the Unemployment Rate in South Gate?
Unemployment Rate in South Gate is 7.9%.