Pflugerville, TX Map & Demographics
Pflugerville Map
Pflugerville Overview
$45,098
PER CAPITA INCOME
$122,422
AVG FAMILY INCOME
$111,151
AVG HOUSEHOLD INCOME
23.6%
WAGE / INCOME GAP [ % ]
76.4¢/ $1
WAGE / INCOME GAP [ $ ]
$11,562
FAMILY INCOME DEFICIT
0.33
INEQUALITY / GINI INDEX
64,528
TOTAL POPULATION
31,691
MALE POPULATION
32,837
FEMALE POPULATION
96.51
MALES / 100 FEMALES
103.62
FEMALES / 100 MALES
37.1
MEDIAN AGE
3.1
AVG FAMILY SIZE
2.7
AVG HOUSEHOLD SIZE
38,959
LABOR FORCE [ PEOPLE ]
75.9%
PERCENT IN LABOR FORCE
3.9%
UNEMPLOYMENT RATE
Pflugerville Zip Codes
Pflugerville Area Codes
Income in Pflugerville
Income Overview in Pflugerville
Per Capita Income in Pflugerville is $45,098, while median incomes of families and households are $122,422 and $111,151 respectively.
| Characteristic | Number | Measure |
| Per Capita Income | 64,528 | $45,098 |
| Median Family Income | 17,351 | $122,422 |
| Mean Family Income | 17,351 | $132,264 |
| Median Household Income | 23,719 | $111,151 |
| Mean Household Income | 23,719 | $121,576 |
| Income Deficit | 17,351 | $11,562 |
| Wage / Income Gap (%) | 64,528 | 23.63% |
| Wage / Income Gap ($) | 64,528 | 76.37¢ per $1 |
| Gini / Inequality Index | 64,528 | 0.33 |
Earnings by Sex in Pflugerville
Average Earnings in Pflugerville are $53,978, $61,085 for men and $46,649 for women, a difference of 23.6%.
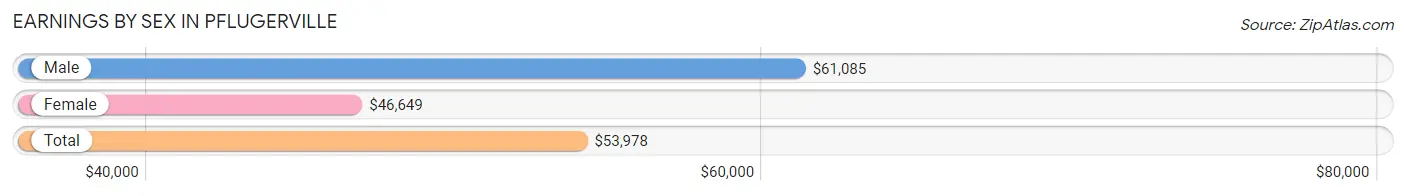
| Sex | Number | Average Earnings |
| Male | 21,025 (52.5%) | $61,085 |
| Female | 19,000 (47.5%) | $46,649 |
| Total | 40,025 (100.0%) | $53,978 |
Earnings by Sex by Income Bracket in Pflugerville
The most common earnings brackets in Pflugerville are $100,000+ for men (5,686 | 27.0%) and $100,000+ for women (2,473 | 13.0%).
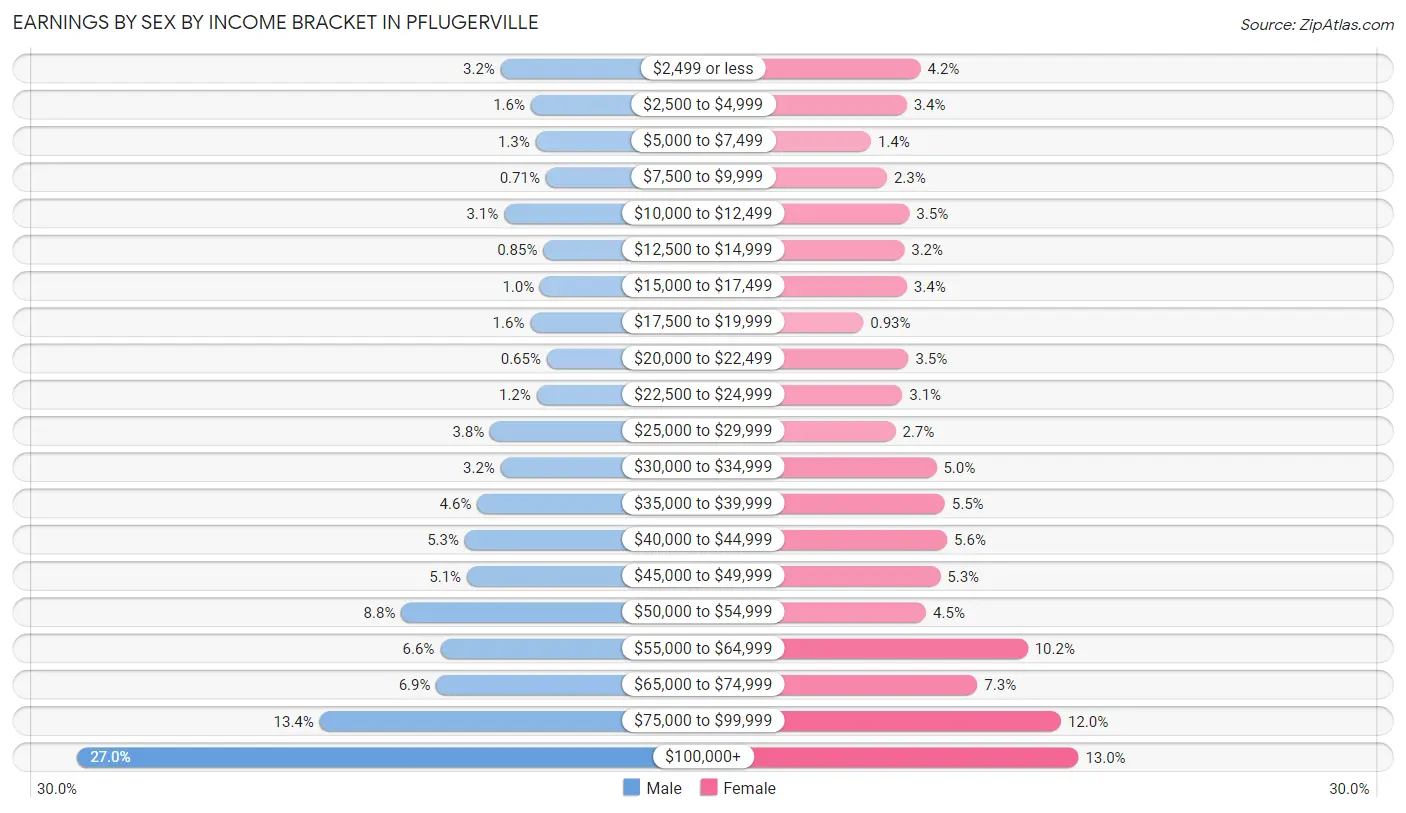
| Income | Male | Female |
| $2,499 or less | 681 (3.2%) | 788 (4.2%) |
| $2,500 to $4,999 | 325 (1.5%) | 640 (3.4%) |
| $5,000 to $7,499 | 269 (1.3%) | 259 (1.4%) |
| $7,500 to $9,999 | 150 (0.7%) | 430 (2.3%) |
| $10,000 to $12,499 | 641 (3.0%) | 668 (3.5%) |
| $12,500 to $14,999 | 179 (0.9%) | 613 (3.2%) |
| $15,000 to $17,499 | 216 (1.0%) | 643 (3.4%) |
| $17,500 to $19,999 | 333 (1.6%) | 177 (0.9%) |
| $20,000 to $22,499 | 137 (0.6%) | 660 (3.5%) |
| $22,500 to $24,999 | 257 (1.2%) | 593 (3.1%) |
| $25,000 to $29,999 | 808 (3.8%) | 520 (2.7%) |
| $30,000 to $34,999 | 682 (3.2%) | 958 (5.0%) |
| $35,000 to $39,999 | 958 (4.6%) | 1,047 (5.5%) |
| $40,000 to $44,999 | 1,106 (5.3%) | 1,072 (5.6%) |
| $45,000 to $49,999 | 1,080 (5.1%) | 999 (5.3%) |
| $50,000 to $54,999 | 1,857 (8.8%) | 847 (4.5%) |
| $55,000 to $64,999 | 1,396 (6.6%) | 1,932 (10.2%) |
| $65,000 to $74,999 | 1,442 (6.9%) | 1,394 (7.3%) |
| $75,000 to $99,999 | 2,822 (13.4%) | 2,287 (12.0%) |
| $100,000+ | 5,686 (27.0%) | 2,473 (13.0%) |
| Total | 21,025 (100.0%) | 19,000 (100.0%) |
Earnings by Sex by Educational Attainment in Pflugerville
Average earnings in Pflugerville are $68,263 for men and $52,418 for women, a difference of 23.2%. Men with an educational attainment of graduate degree enjoy the highest average annual earnings of $102,229, while those with less than high school education earn the least with $39,476. Women with an educational attainment of graduate degree earn the most with the average annual earnings of $75,237, while those with less than high school education have the smallest earnings of $23,088.
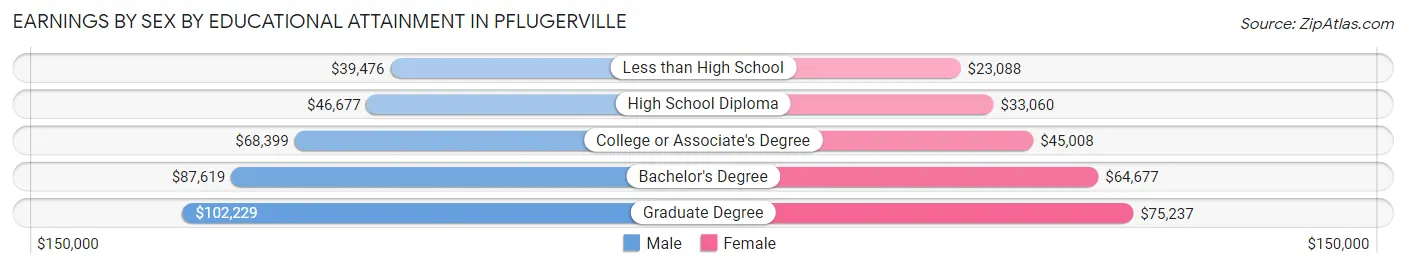
| Educational Attainment | Male Income | Female Income |
| Less than High School | $39,476 | $23,088 |
| High School Diploma | $46,677 | $33,060 |
| College or Associate's Degree | $68,399 | $45,008 |
| Bachelor's Degree | $87,619 | $64,677 |
| Graduate Degree | $102,229 | $75,237 |
| Total | $68,263 | $52,418 |
Family Income in Pflugerville
Family Income Brackets in Pflugerville
According to the Pflugerville family income data, there are 5,119 families falling into the $100,000 to $149,999 income range, which is the most common income bracket and makes up 29.5% of all families. Conversely, the $10,000 to $14,999 income bracket is the least frequent group with only 87 families (0.5%) belonging to this category.
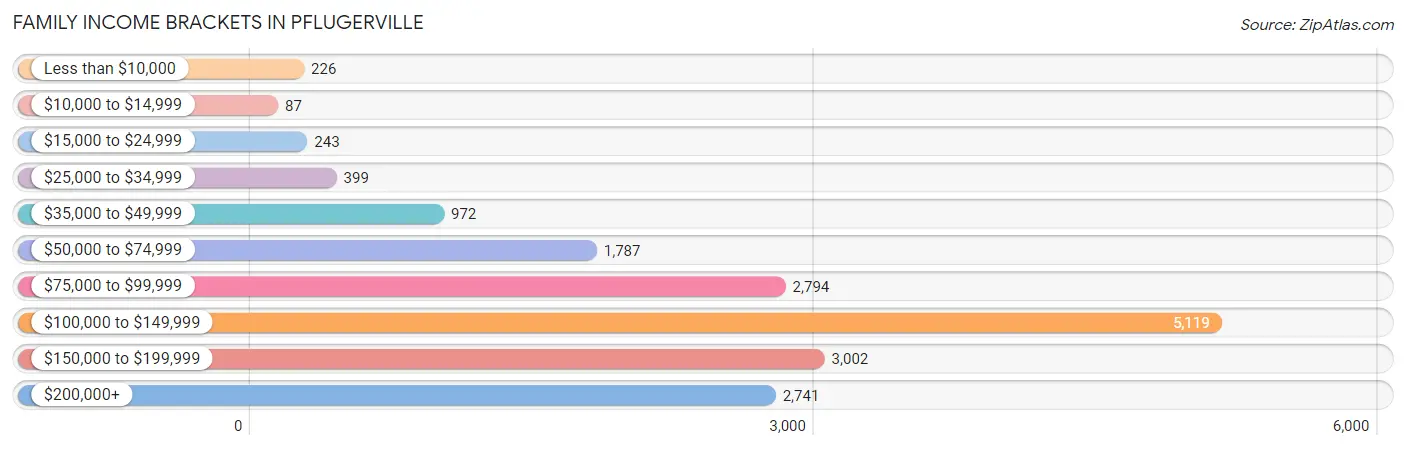
| Income Bracket | # Families | % Families |
| Less than $10,000 | 226 | 1.3% |
| $10,000 to $14,999 | 87 | 0.5% |
| $15,000 to $24,999 | 243 | 1.4% |
| $25,000 to $34,999 | 399 | 2.3% |
| $35,000 to $49,999 | 972 | 5.6% |
| $50,000 to $74,999 | 1,787 | 10.3% |
| $75,000 to $99,999 | 2,794 | 16.1% |
| $100,000 to $149,999 | 5,119 | 29.5% |
| $150,000 to $199,999 | 3,002 | 17.3% |
| $200,000+ | 2,741 | 15.8% |
Family Income by Famaliy Size in Pflugerville
6-person families (732 | 4.2%) account for the highest median family income in Pflugerville with $170,079 per family, while 2-person families (6,869 | 39.6%) have the highest median income of $57,220 per family member.
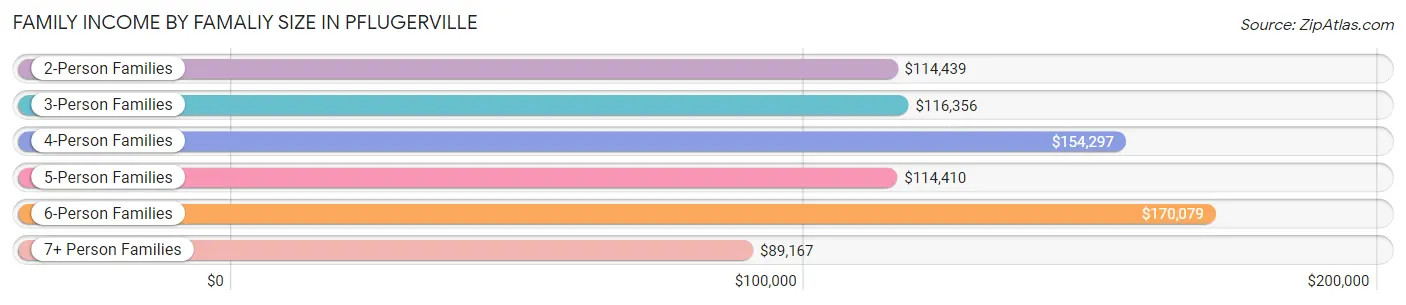
| Income Bracket | # Families | Median Income |
| 2-Person Families | 6,869 (39.6%) | $114,439 |
| 3-Person Families | 3,934 (22.7%) | $116,356 |
| 4-Person Families | 4,021 (23.2%) | $154,297 |
| 5-Person Families | 1,453 (8.4%) | $114,410 |
| 6-Person Families | 732 (4.2%) | $170,079 |
| 7+ Person Families | 342 (2.0%) | $89,167 |
| Total | 17,351 (100.0%) | $122,422 |
Family Income by Number of Earners in Pflugerville
The median family income in Pflugerville is $122,422, with families comprising 2 earners (9,026) having the highest median family income of $139,057, while families with no earners (671) have the lowest median family income of $43,319, accounting for 52.0% and 3.9% of families, respectively.
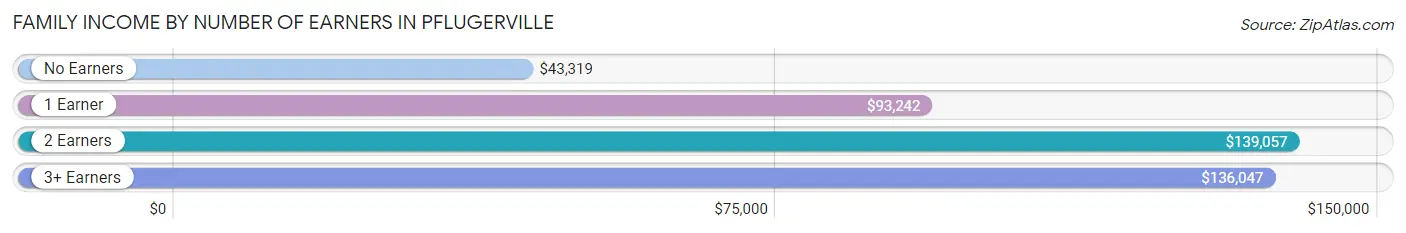
| Number of Earners | # Families | Median Income |
| No Earners | 671 (3.9%) | $43,319 |
| 1 Earner | 4,759 (27.4%) | $93,242 |
| 2 Earners | 9,026 (52.0%) | $139,057 |
| 3+ Earners | 2,895 (16.7%) | $136,047 |
| Total | 17,351 (100.0%) | $122,422 |
Household Income in Pflugerville
Household Income Brackets in Pflugerville
With 6,404 households falling in the category, the $100,000 to $149,999 income range is the most frequent in Pflugerville, accounting for 27.0% of all households. In contrast, only 427 households (1.8%) fall into the less than $10,000 income bracket, making it the least populous group.
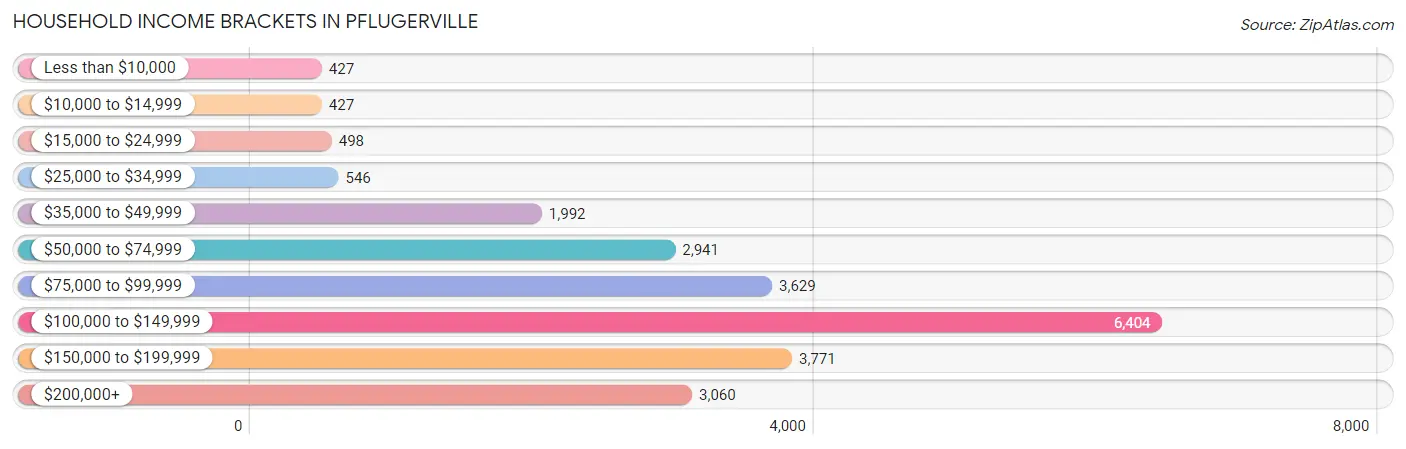
| Income Bracket | # Households | % Households |
| Less than $10,000 | 427 | 1.8% |
| $10,000 to $14,999 | 427 | 1.8% |
| $15,000 to $24,999 | 498 | 2.1% |
| $25,000 to $34,999 | 546 | 2.3% |
| $35,000 to $49,999 | 1,992 | 8.4% |
| $50,000 to $74,999 | 2,941 | 12.4% |
| $75,000 to $99,999 | 3,629 | 15.3% |
| $100,000 to $149,999 | 6,404 | 27.0% |
| $150,000 to $199,999 | 3,771 | 15.9% |
| $200,000+ | 3,060 | 12.9% |
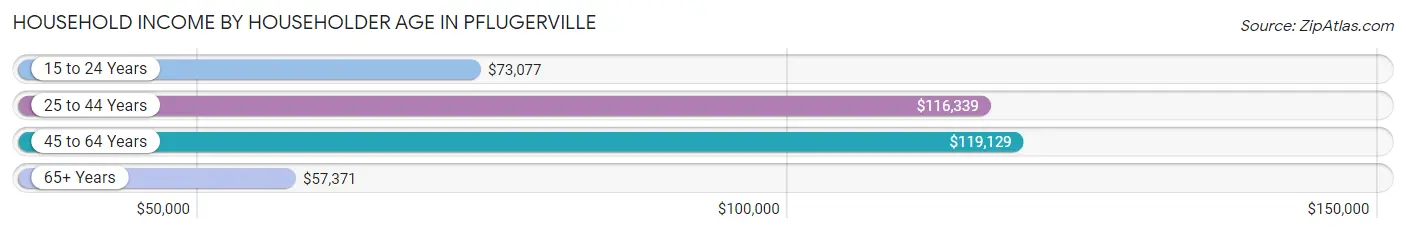
Household Income by Householder Age in Pflugerville
The median household income in Pflugerville is $111,151, with the highest median household income of $119,129 found in the 45 to 64 years age bracket for the primary householder. A total of 9,661 households (40.7%) fall into this category. Meanwhile, the 65+ years age bracket for the primary householder has the lowest median household income of $57,371, with 3,438 households (14.5%) in this group.
| Income Bracket | # Households | Median Income |
| 15 to 24 Years | 464 (2.0%) | $73,077 |
| 25 to 44 Years | 10,156 (42.8%) | $116,339 |
| 45 to 64 Years | 9,661 (40.7%) | $119,129 |
| 65+ Years | 3,438 (14.5%) | $57,371 |
| Total | 23,719 (100.0%) | $111,151 |
Poverty in Pflugerville
Income Below Poverty by Sex and Age in Pflugerville
With 5.3% poverty level for males and 6.2% for females among the residents of Pflugerville, 5 year old males and 75 year old and over females are the most vulnerable to poverty, with 42 males (12.3%) and 290 females (25.6%) in their respective age groups living below the poverty level.
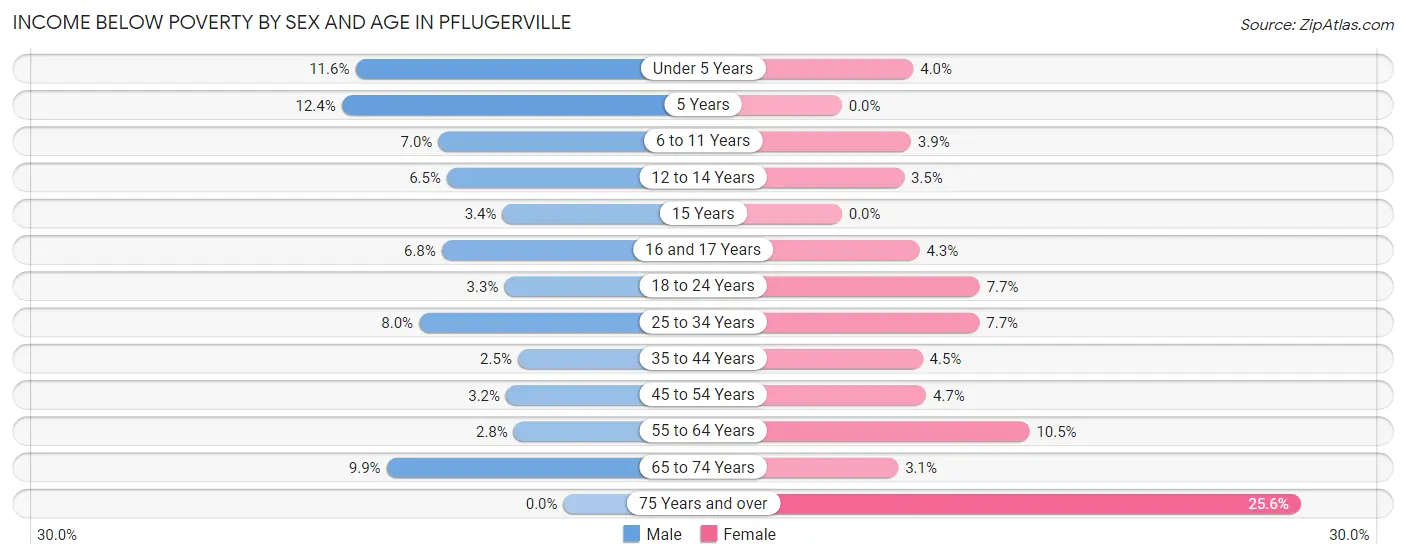
| Age Bracket | Male | Female |
| Under 5 Years | 280 (11.6%) | 72 (4.0%) |
| 5 Years | 42 (12.3%) | 0 (0.0%) |
| 6 to 11 Years | 148 (7.0%) | 84 (3.8%) |
| 12 to 14 Years | 89 (6.5%) | 55 (3.5%) |
| 15 Years | 13 (3.4%) | 0 (0.0%) |
| 16 and 17 Years | 86 (6.8%) | 47 (4.3%) |
| 18 to 24 Years | 65 (3.3%) | 185 (7.7%) |
| 25 to 34 Years | 372 (8.0%) | 396 (7.7%) |
| 35 to 44 Years | 154 (2.5%) | 233 (4.5%) |
| 45 to 54 Years | 174 (3.2%) | 257 (4.7%) |
| 55 to 64 Years | 98 (2.8%) | 344 (10.4%) |
| 65 to 74 Years | 147 (9.9%) | 77 (3.1%) |
| 75 Years and over | 0 (0.0%) | 290 (25.6%) |
| Total | 1,668 (5.3%) | 2,040 (6.2%) |
Income Above Poverty by Sex and Age in Pflugerville
According to the poverty statistics in Pflugerville, males aged 75 years and over and females aged 5 years are the age groups that are most secure financially, with 100.0% of males and 100.0% of females in these age groups living above the poverty line.
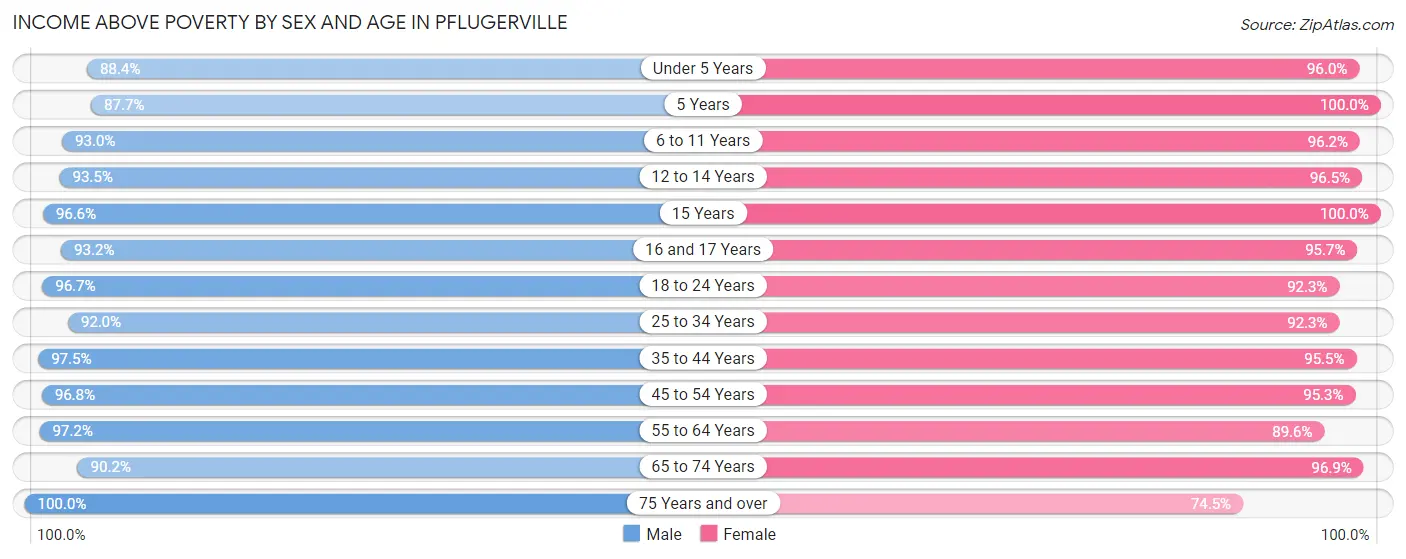
| Age Bracket | Male | Female |
| Under 5 Years | 2,135 (88.4%) | 1,735 (96.0%) |
| 5 Years | 298 (87.6%) | 392 (100.0%) |
| 6 to 11 Years | 1,976 (93.0%) | 2,098 (96.2%) |
| 12 to 14 Years | 1,282 (93.5%) | 1,534 (96.5%) |
| 15 Years | 369 (96.6%) | 456 (100.0%) |
| 16 and 17 Years | 1,182 (93.2%) | 1,039 (95.7%) |
| 18 to 24 Years | 1,909 (96.7%) | 2,225 (92.3%) |
| 25 to 34 Years | 4,257 (92.0%) | 4,773 (92.3%) |
| 35 to 44 Years | 5,911 (97.5%) | 4,945 (95.5%) |
| 45 to 54 Years | 5,266 (96.8%) | 5,220 (95.3%) |
| 55 to 64 Years | 3,439 (97.2%) | 2,947 (89.5%) |
| 65 to 74 Years | 1,346 (90.1%) | 2,374 (96.9%) |
| 75 Years and over | 476 (100.0%) | 845 (74.5%) |
| Total | 29,846 (94.7%) | 30,583 (93.8%) |
Income Below Poverty Among Married-Couple Families in Pflugerville
The poverty statistics for married-couple families in Pflugerville show that 1.3% or 169 of the total 13,235 families live below the poverty line. Families with 3 or 4 children have the highest poverty rate of 5.6%, comprising of 52 families. On the other hand, families with 5 or more children have the lowest poverty rate of 0.0%, which includes 0 families.
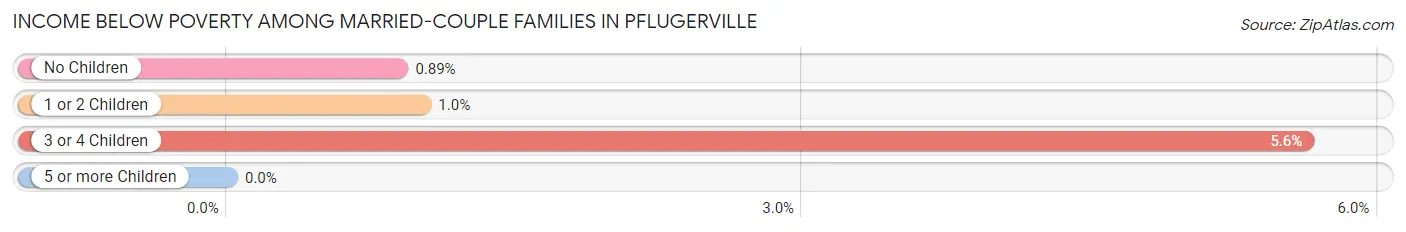
| Children | Above Poverty | Below Poverty |
| No Children | 5,990 (99.1%) | 54 (0.9%) |
| 1 or 2 Children | 6,174 (99.0%) | 63 (1.0%) |
| 3 or 4 Children | 873 (94.4%) | 52 (5.6%) |
| 5 or more Children | 29 (100.0%) | 0 (0.0%) |
| Total | 13,066 (98.7%) | 169 (1.3%) |
Income Below Poverty Among Single-Parent Households in Pflugerville
According to the poverty data in Pflugerville, 4.3% or 47 single-father households and 11.6% or 349 single-mother households are living below the poverty line. Among single-father households, those with no children have the highest poverty rate, with 26 households (6.9%) experiencing poverty. Likewise, among single-mother households, those with 5 or more children have the highest poverty rate, with 44 households (100.0%) falling below the poverty line.
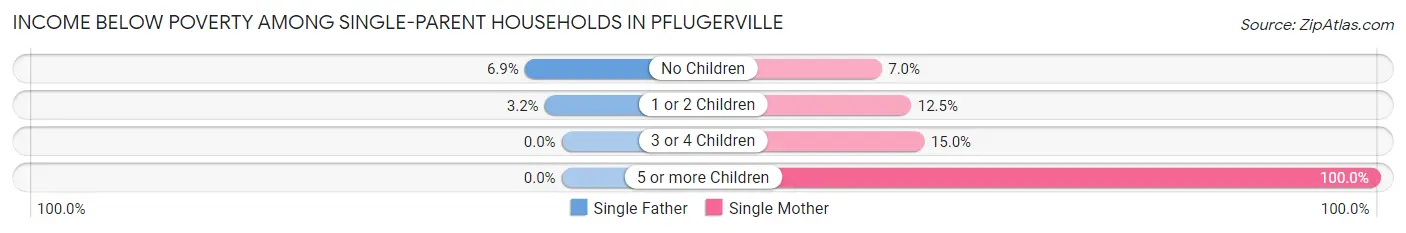
| Children | Single Father | Single Mother |
| No Children | 26 (6.9%) | 92 (7.0%) |
| 1 or 2 Children | 21 (3.2%) | 181 (12.5%) |
| 3 or 4 Children | 0 (0.0%) | 32 (14.9%) |
| 5 or more Children | 0 (0.0%) | 44 (100.0%) |
| Total | 47 (4.3%) | 349 (11.6%) |
Income Below Poverty Among Married-Couple vs Single-Parent Households in Pflugerville
The poverty data for Pflugerville shows that 169 of the married-couple family households (1.3%) and 396 of the single-parent households (9.6%) are living below the poverty level. Within the married-couple family households, those with 3 or 4 children have the highest poverty rate, with 52 households (5.6%) falling below the poverty line. Among the single-parent households, those with 5 or more children have the highest poverty rate, with 44 household (50.0%) living below poverty.
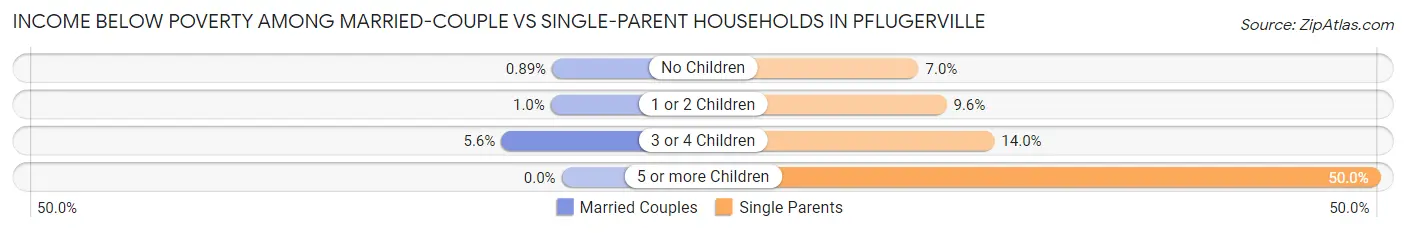
| Children | Married-Couple Families | Single-Parent Households |
| No Children | 54 (0.9%) | 118 (7.0%) |
| 1 or 2 Children | 63 (1.0%) | 202 (9.6%) |
| 3 or 4 Children | 52 (5.6%) | 32 (14.0%) |
| 5 or more Children | 0 (0.0%) | 44 (50.0%) |
| Total | 169 (1.3%) | 396 (9.6%) |
Race in Pflugerville
The most populous races in Pflugerville are White / Caucasian (34,677 | 53.7%), Hispanic or Latino (21,460 | 33.3%), and Black / African American (11,138 | 17.3%).
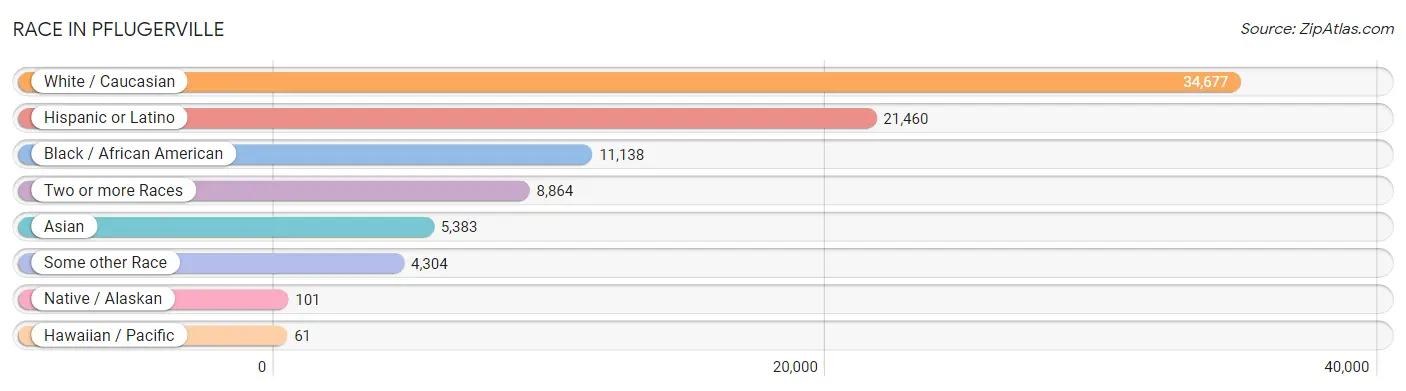
| Race | # Population | % Population |
| Asian | 5,383 | 8.3% |
| Black / African American | 11,138 | 17.3% |
| Hawaiian / Pacific | 61 | 0.1% |
| Hispanic or Latino | 21,460 | 33.3% |
| Native / Alaskan | 101 | 0.2% |
| White / Caucasian | 34,677 | 53.7% |
| Two or more Races | 8,864 | 13.7% |
| Some other Race | 4,304 | 6.7% |
| Total | 64,528 | 100.0% |
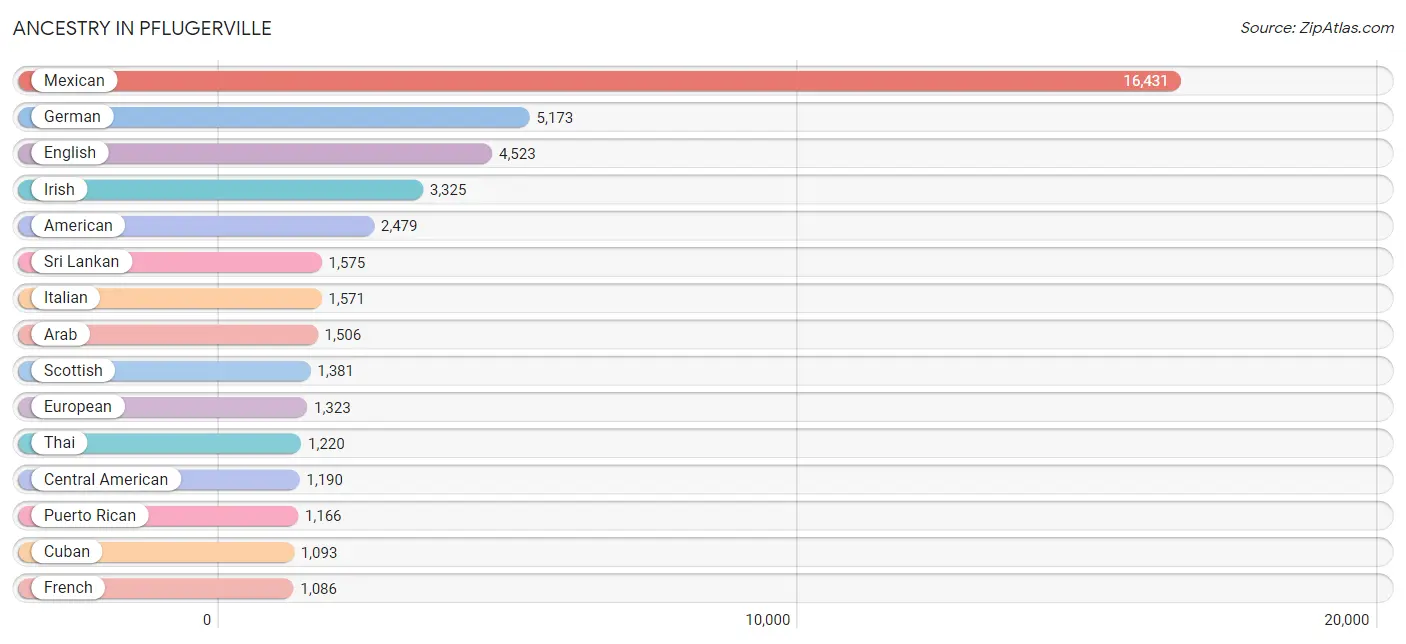
Ancestry in Pflugerville
The most populous ancestries reported in Pflugerville are Mexican (16,431 | 25.5%), German (5,173 | 8.0%), English (4,523 | 7.0%), Irish (3,325 | 5.1%), and American (2,479 | 3.8%), together accounting for 49.5% of all Pflugerville residents.
| Ancestry | # Population | % Population |
| African | 573 | 0.9% |
| American | 2,479 | 3.8% |
| Apache | 26 | 0.0% |
| Arab | 1,506 | 2.3% |
| Argentinean | 36 | 0.1% |
| Australian | 79 | 0.1% |
| Austrian | 11 | 0.0% |
| Belgian | 113 | 0.2% |
| Belizean | 58 | 0.1% |
| Bhutanese | 349 | 0.5% |
| Blackfeet | 12 | 0.0% |
| Brazilian | 60 | 0.1% |
| British | 696 | 1.1% |
| Burmese | 258 | 0.4% |
| Canadian | 83 | 0.1% |
| Central American | 1,190 | 1.8% |
| Central American Indian | 14 | 0.0% |
| Cherokee | 234 | 0.4% |
| Choctaw | 24 | 0.0% |
| Colombian | 302 | 0.5% |
| Costa Rican | 139 | 0.2% |
| Croatian | 60 | 0.1% |
| Cuban | 1,093 | 1.7% |
| Czech | 404 | 0.6% |
| Czechoslovakian | 49 | 0.1% |
| Danish | 160 | 0.3% |
| Dominican | 57 | 0.1% |
| Dutch | 165 | 0.3% |
| Eastern European | 479 | 0.7% |
| Ecuadorian | 165 | 0.3% |
| English | 4,523 | 7.0% |
| Ethiopian | 81 | 0.1% |
| European | 1,323 | 2.1% |
| Filipino | 38 | 0.1% |
| Finnish | 20 | 0.0% |
| French | 1,086 | 1.7% |
| French Canadian | 262 | 0.4% |
| German | 5,173 | 8.0% |
| Greek | 10 | 0.0% |
| Guatemalan | 261 | 0.4% |
| Haitian | 29 | 0.0% |
| Honduran | 446 | 0.7% |
| Hungarian | 303 | 0.5% |
| Icelander | 60 | 0.1% |
| Indian (Asian) | 486 | 0.7% |
| Indonesian | 33 | 0.1% |
| Iranian | 10 | 0.0% |
| Irish | 3,325 | 5.1% |
| Italian | 1,571 | 2.4% |
| Jamaican | 19 | 0.0% |
| Japanese | 83 | 0.1% |
| Jordanian | 1,052 | 1.6% |
| Kenyan | 37 | 0.1% |
| Korean | 744 | 1.1% |
| Latvian | 29 | 0.0% |
| Lebanese | 335 | 0.5% |
| Lithuanian | 25 | 0.0% |
| Luxembourger | 49 | 0.1% |
| Malaysian | 53 | 0.1% |
| Maltese | 129 | 0.2% |
| Mexican | 16,431 | 25.5% |
| Mexican American Indian | 45 | 0.1% |
| Moroccan | 39 | 0.1% |
| Nicaraguan | 31 | 0.1% |
| Nigerian | 209 | 0.3% |
| Northern European | 162 | 0.3% |
| Norwegian | 565 | 0.9% |
| Pakistani | 85 | 0.1% |
| Palestinian | 28 | 0.0% |
| Panamanian | 44 | 0.1% |
| Polish | 758 | 1.2% |
| Portuguese | 252 | 0.4% |
| Puerto Rican | 1,166 | 1.8% |
| Romanian | 82 | 0.1% |
| Russian | 252 | 0.4% |
| Salvadoran | 269 | 0.4% |
| Samoan | 61 | 0.1% |
| Scandinavian | 249 | 0.4% |
| Scotch-Irish | 242 | 0.4% |
| Scottish | 1,381 | 2.1% |
| Serbian | 69 | 0.1% |
| Slavic | 17 | 0.0% |
| Slovak | 10 | 0.0% |
| Slovene | 121 | 0.2% |
| South American | 718 | 1.1% |
| Spaniard | 353 | 0.5% |
| Spanish | 61 | 0.1% |
| Sri Lankan | 1,575 | 2.4% |
| Subsaharan African | 911 | 1.4% |
| Swedish | 634 | 1.0% |
| Swiss | 135 | 0.2% |
| Thai | 1,220 | 1.9% |
| Trinidadian and Tobagonian | 15 | 0.0% |
| Turkish | 29 | 0.0% |
| Ukrainian | 23 | 0.0% |
| Uruguayan | 62 | 0.1% |
| Venezuelan | 153 | 0.2% |
| Vietnamese | 46 | 0.1% |
| Welsh | 292 | 0.4% |
| West Indian | 24 | 0.0% |
| Yugoslavian | 28 | 0.0% | View All 101 Rows |
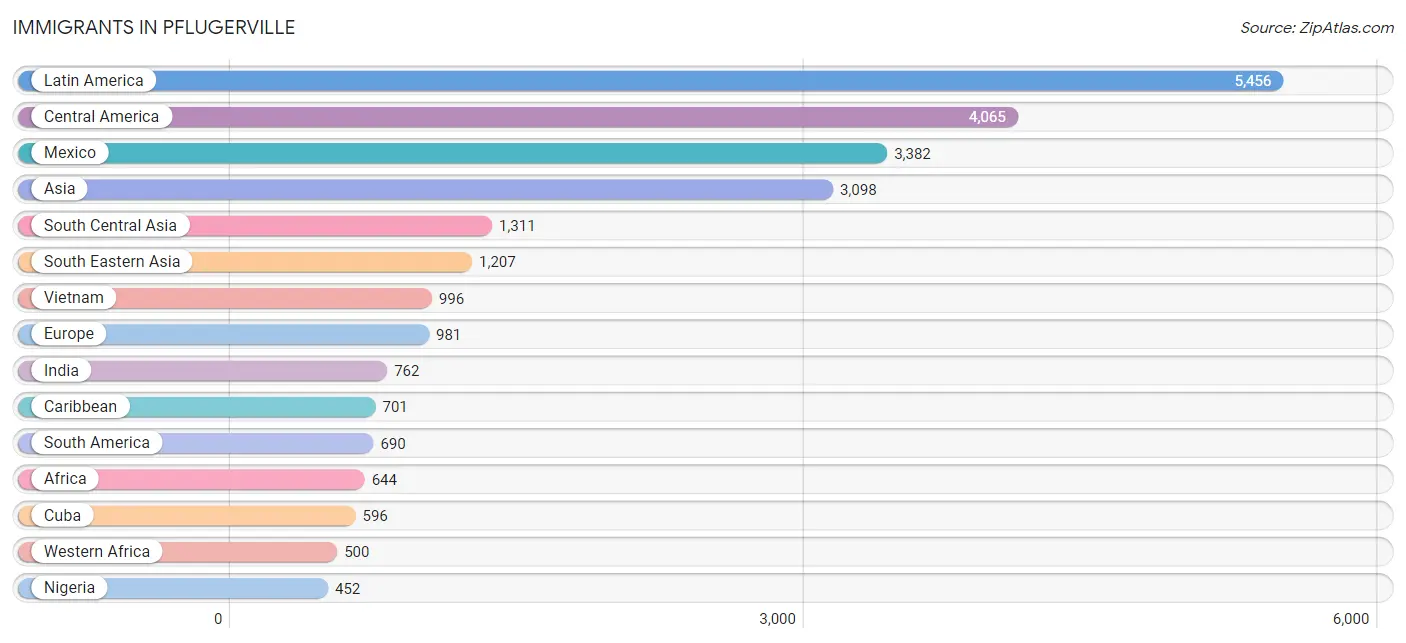
Immigrants in Pflugerville
The most numerous immigrant groups reported in Pflugerville came from Latin America (5,456 | 8.5%), Central America (4,065 | 6.3%), Mexico (3,382 | 5.2%), Asia (3,098 | 4.8%), and South Central Asia (1,311 | 2.0%), together accounting for 26.8% of all Pflugerville residents.
| Immigration Origin | # Population | % Population |
| Africa | 644 | 1.0% |
| Argentina | 23 | 0.0% |
| Asia | 3,098 | 4.8% |
| Belize | 18 | 0.0% |
| Bosnia and Herzegovina | 57 | 0.1% |
| Brazil | 57 | 0.1% |
| Canada | 31 | 0.1% |
| Caribbean | 701 | 1.1% |
| Central America | 4,065 | 6.3% |
| China | 176 | 0.3% |
| Colombia | 59 | 0.1% |
| Costa Rica | 139 | 0.2% |
| Cuba | 596 | 0.9% |
| Czechoslovakia | 37 | 0.1% |
| Dominican Republic | 42 | 0.1% |
| Eastern Africa | 60 | 0.1% |
| Eastern Asia | 240 | 0.4% |
| Eastern Europe | 212 | 0.3% |
| Ecuador | 20 | 0.0% |
| El Salvador | 256 | 0.4% |
| England | 334 | 0.5% |
| Eritrea | 37 | 0.1% |
| Europe | 981 | 1.5% |
| Germany | 354 | 0.5% |
| Guatemala | 27 | 0.0% |
| Haiti | 29 | 0.0% |
| Honduras | 188 | 0.3% |
| Hong Kong | 59 | 0.1% |
| India | 762 | 1.2% |
| Iran | 10 | 0.0% |
| Ireland | 5 | 0.0% |
| Japan | 34 | 0.1% |
| Jordan | 220 | 0.3% |
| Kazakhstan | 54 | 0.1% |
| Kenya | 23 | 0.0% |
| Korea | 30 | 0.1% |
| Latin America | 5,456 | 8.5% |
| Lebanon | 61 | 0.1% |
| Mexico | 3,382 | 5.2% |
| Morocco | 39 | 0.1% |
| Nepal | 49 | 0.1% |
| Nicaragua | 17 | 0.0% |
| Nigeria | 452 | 0.7% |
| Northern Africa | 39 | 0.1% |
| Northern Europe | 391 | 0.6% |
| Oceania | 22 | 0.0% |
| Pakistan | 421 | 0.6% |
| Panama | 38 | 0.1% |
| Philippines | 125 | 0.2% |
| Poland | 5 | 0.0% |
| Russia | 71 | 0.1% |
| Saudi Arabia | 28 | 0.0% |
| Scotland | 25 | 0.0% |
| Serbia | 9 | 0.0% |
| South Africa | 45 | 0.1% |
| South America | 690 | 1.1% |
| South Central Asia | 1,311 | 2.0% |
| South Eastern Asia | 1,207 | 1.9% |
| Southern Europe | 24 | 0.0% |
| Spain | 24 | 0.0% |
| Sri Lanka | 15 | 0.0% |
| Taiwan | 36 | 0.1% |
| Thailand | 68 | 0.1% |
| Turkey | 19 | 0.0% |
| Ukraine | 17 | 0.0% |
| Uruguay | 412 | 0.6% |
| Venezuela | 119 | 0.2% |
| Vietnam | 996 | 1.5% |
| West Indies | 6 | 0.0% |
| Western Africa | 500 | 0.8% |
| Western Asia | 340 | 0.5% |
| Western Europe | 354 | 0.5% | View All 72 Rows |
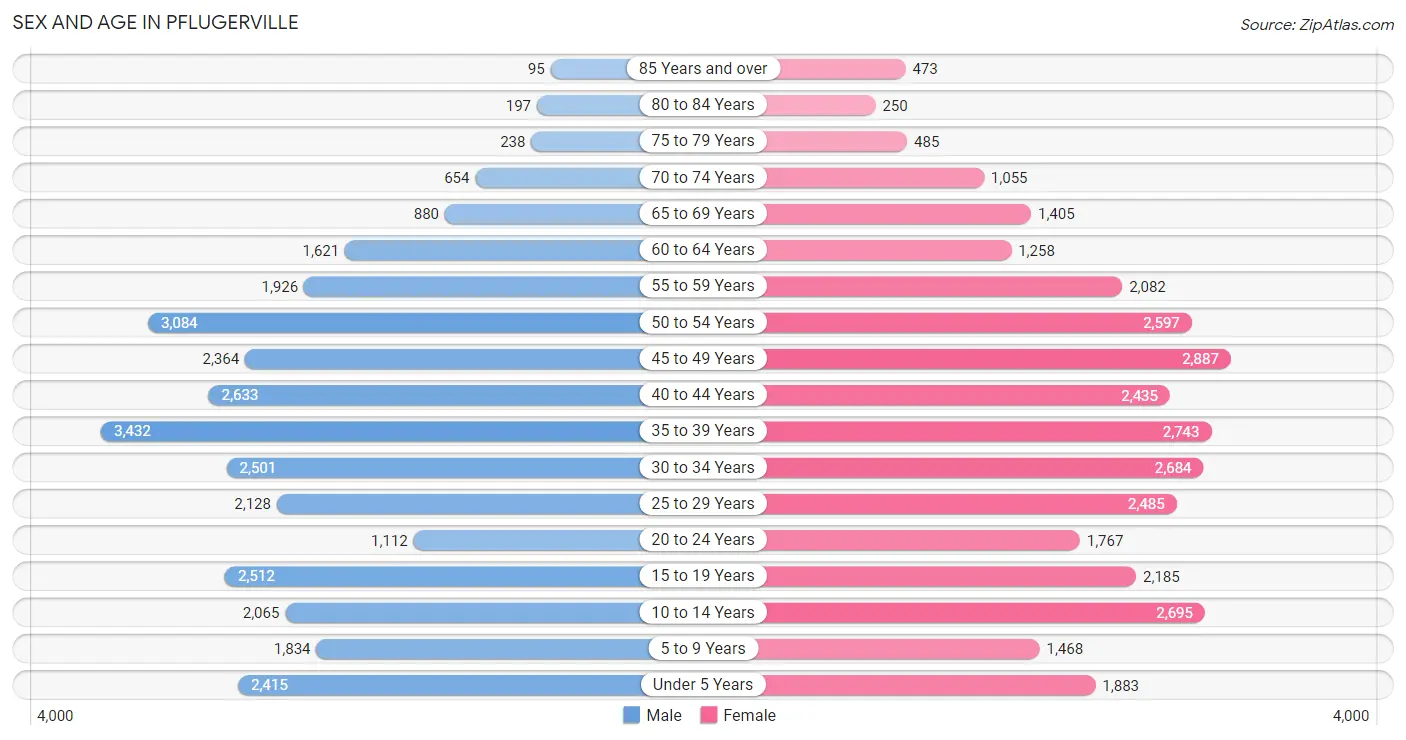
Sex and Age in Pflugerville
Sex and Age in Pflugerville
The most populous age groups in Pflugerville are 35 to 39 Years (3,432 | 10.8%) for men and 45 to 49 Years (2,887 | 8.8%) for women.
| Age Bracket | Male | Female |
| Under 5 Years | 2,415 (7.6%) | 1,883 (5.7%) |
| 5 to 9 Years | 1,834 (5.8%) | 1,468 (4.5%) |
| 10 to 14 Years | 2,065 (6.5%) | 2,695 (8.2%) |
| 15 to 19 Years | 2,512 (7.9%) | 2,185 (6.7%) |
| 20 to 24 Years | 1,112 (3.5%) | 1,767 (5.4%) |
| 25 to 29 Years | 2,128 (6.7%) | 2,485 (7.6%) |
| 30 to 34 Years | 2,501 (7.9%) | 2,684 (8.2%) |
| 35 to 39 Years | 3,432 (10.8%) | 2,743 (8.4%) |
| 40 to 44 Years | 2,633 (8.3%) | 2,435 (7.4%) |
| 45 to 49 Years | 2,364 (7.5%) | 2,887 (8.8%) |
| 50 to 54 Years | 3,084 (9.7%) | 2,597 (7.9%) |
| 55 to 59 Years | 1,926 (6.1%) | 2,082 (6.3%) |
| 60 to 64 Years | 1,621 (5.1%) | 1,258 (3.8%) |
| 65 to 69 Years | 880 (2.8%) | 1,405 (4.3%) |
| 70 to 74 Years | 654 (2.1%) | 1,055 (3.2%) |
| 75 to 79 Years | 238 (0.7%) | 485 (1.5%) |
| 80 to 84 Years | 197 (0.6%) | 250 (0.8%) |
| 85 Years and over | 95 (0.3%) | 473 (1.4%) |
| Total | 31,691 (100.0%) | 32,837 (100.0%) |
Families and Households in Pflugerville
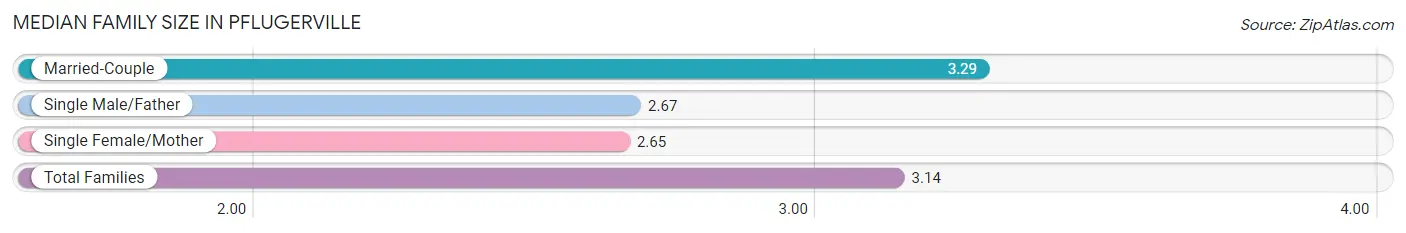
Median Family Size in Pflugerville
The median family size in Pflugerville is 3.14 persons per family, with married-couple families (13,235 | 76.3%) accounting for the largest median family size of 3.29 persons per family. On the other hand, single female/mother families (3,019 | 17.4%) represent the smallest median family size with 2.65 persons per family.
| Family Type | # Families | Family Size |
| Married-Couple | 13,235 (76.3%) | 3.29 |
| Single Male/Father | 1,097 (6.3%) | 2.67 |
| Single Female/Mother | 3,019 (17.4%) | 2.65 |
| Total Families | 17,351 (100.0%) | 3.14 |
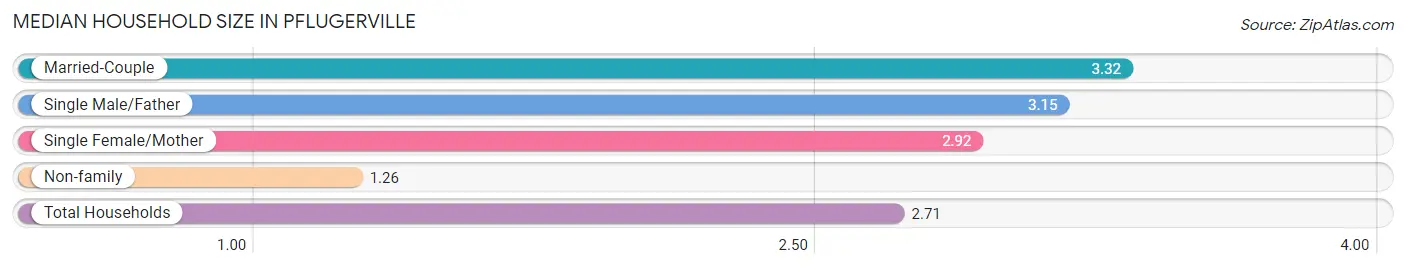
Median Household Size in Pflugerville
The median household size in Pflugerville is 2.71 persons per household, with married-couple households (13,235 | 55.8%) accounting for the largest median household size of 3.32 persons per household. non-family households (6,368 | 26.9%) represent the smallest median household size with 1.26 persons per household.
| Household Type | # Households | Household Size |
| Married-Couple | 13,235 (55.8%) | 3.32 |
| Single Male/Father | 1,097 (4.6%) | 3.15 |
| Single Female/Mother | 3,019 (12.7%) | 2.92 |
| Non-family | 6,368 (26.9%) | 1.26 |
| Total Households | 23,719 (100.0%) | 2.71 |
Household Size by Marriage Status in Pflugerville
Out of a total of 23,719 households in Pflugerville, 17,351 (73.2%) are family households, while 6,368 (26.9%) are nonfamily households. The most numerous type of family households are 2-person households, comprising 6,024, and the most common type of nonfamily households are 1-person households, comprising 5,014.
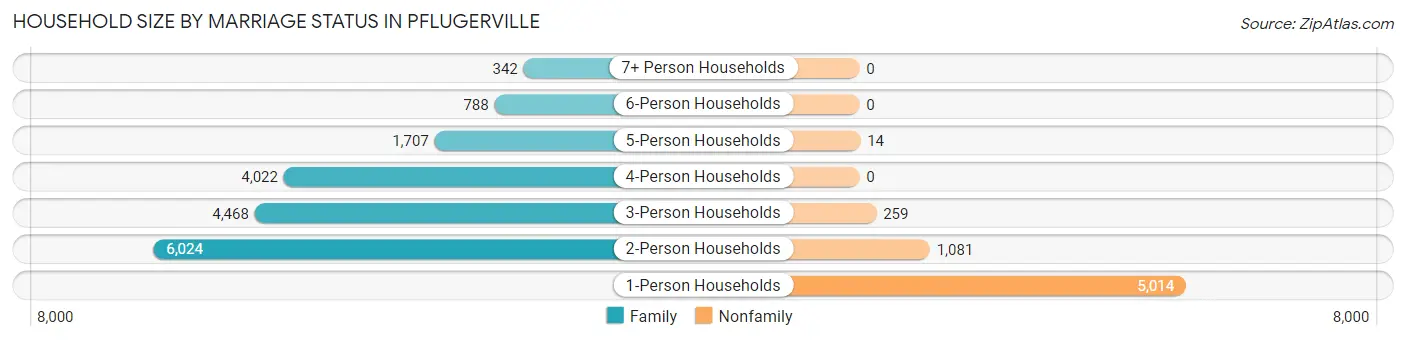
| Household Size | Family Households | Nonfamily Households |
| 1-Person Households | - | 5,014 (21.1%) |
| 2-Person Households | 6,024 (25.4%) | 1,081 (4.6%) |
| 3-Person Households | 4,468 (18.8%) | 259 (1.1%) |
| 4-Person Households | 4,022 (17.0%) | 0 (0.0%) |
| 5-Person Households | 1,707 (7.2%) | 14 (0.1%) |
| 6-Person Households | 788 (3.3%) | 0 (0.0%) |
| 7+ Person Households | 342 (1.4%) | 0 (0.0%) |
| Total | 17,351 (73.2%) | 6,368 (26.9%) |
Female Fertility in Pflugerville
Fertility by Age in Pflugerville
Average fertility rate in Pflugerville is 48.0 births per 1,000 women. Women in the age bracket of 20 to 34 years have the highest fertility rate with 65.0 births per 1,000 women. Women in the age bracket of 20 to 34 years acount for 53.1% of all women with births.
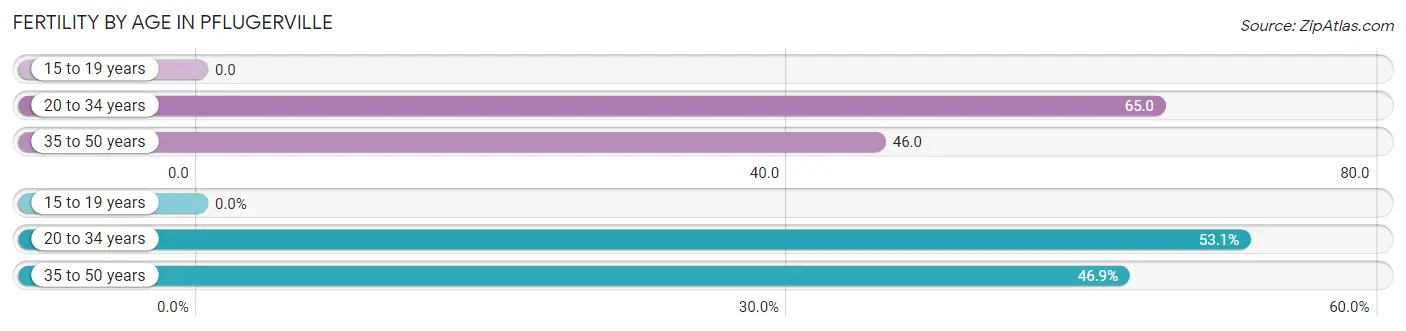
| Age Bracket | Women with Births | Births / 1,000 Women |
| 15 to 19 years | 0 (0.0%) | 0.0 |
| 20 to 34 years | 448 (53.1%) | 65.0 |
| 35 to 50 years | 396 (46.9%) | 46.0 |
| Total | 844 (100.0%) | 48.0 |
Fertility by Age by Marriage Status in Pflugerville
80.0% of women with births (844) in Pflugerville are married. The highest percentage of unmarried women with births falls into 35 to 50 years age bracket with 20.4% of them unmarried at the time of birth, while the lowest percentage of unmarried women with births belong to 20 to 34 years age bracket with 19.6% of them unmarried.
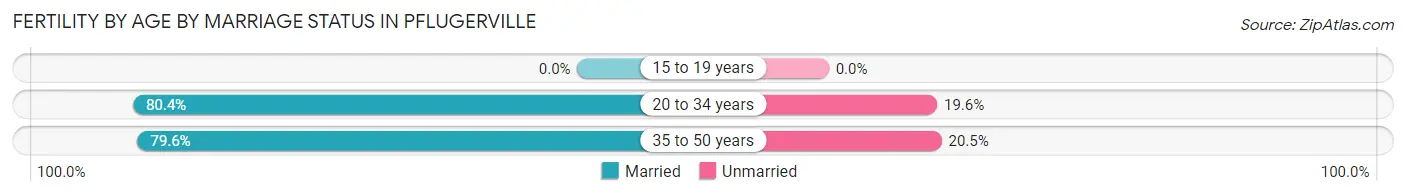
| Age Bracket | Married | Unmarried |
| 15 to 19 years | 0 (0.0%) | 0 (0.0%) |
| 20 to 34 years | 360 (80.4%) | 88 (19.6%) |
| 35 to 50 years | 315 (79.5%) | 81 (20.4%) |
| Total | 675 (80.0%) | 169 (20.0%) |
Fertility by Education in Pflugerville
Average fertility rate in Pflugerville is 48.0 births per 1,000 women. Women with the education attainment of graduate degree have the highest fertility rate of 119.0 births per 1,000 women, while women with the education attainment of less than high school have the lowest fertility at 10.0 births per 1,000 women. Women with the education attainment of graduate degree represent 28.5% of all women with births.
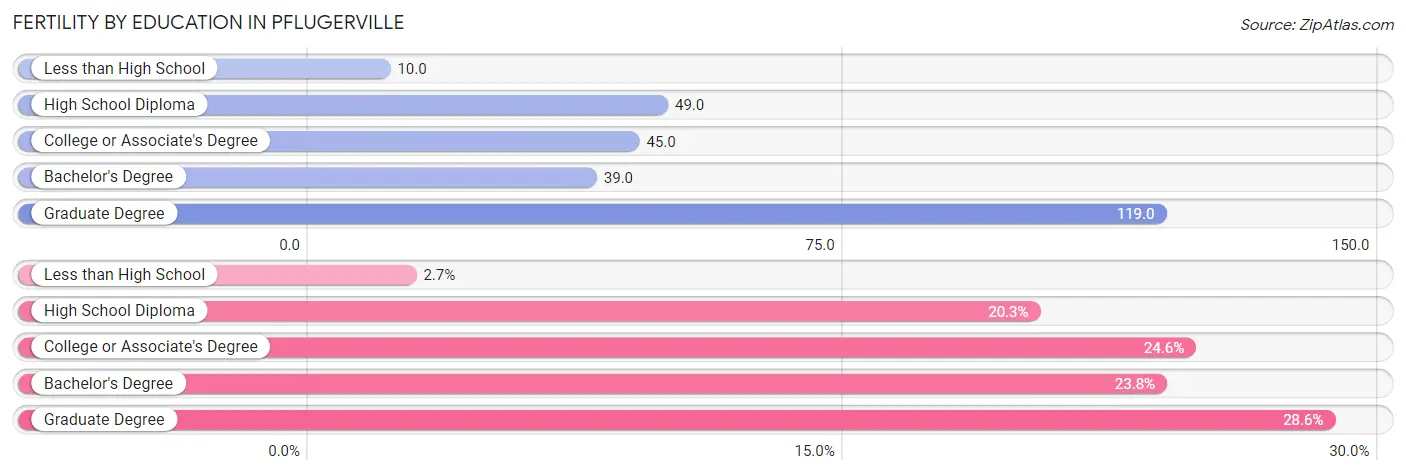
| Educational Attainment | Women with Births | Births / 1,000 Women |
| Less than High School | 23 (2.7%) | 10.0 |
| High School Diploma | 171 (20.3%) | 49.0 |
| College or Associate's Degree | 208 (24.6%) | 45.0 |
| Bachelor's Degree | 201 (23.8%) | 39.0 |
| Graduate Degree | 241 (28.5%) | 119.0 |
| Total | 844 (100.0%) | 48.0 |
Fertility by Education by Marriage Status in Pflugerville
20.0% of women with births in Pflugerville are unmarried. Women with the educational attainment of high school diploma are most likely to be married with 100.0% of them married at childbirth, while women with the educational attainment of less than high school are least likely to be married with 100.0% of them unmarried at childbirth.
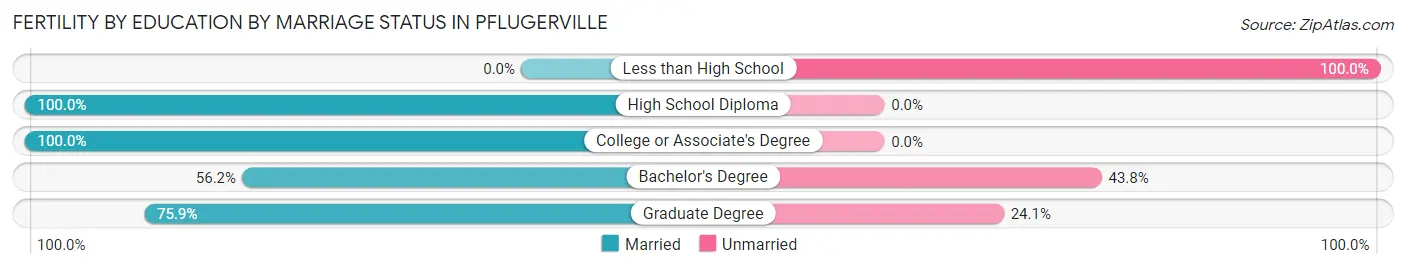
| Educational Attainment | Married | Unmarried |
| Less than High School | 0 (0.0%) | 23 (100.0%) |
| High School Diploma | 171 (100.0%) | 0 (0.0%) |
| College or Associate's Degree | 208 (100.0%) | 0 (0.0%) |
| Bachelor's Degree | 113 (56.2%) | 88 (43.8%) |
| Graduate Degree | 183 (75.9%) | 58 (24.1%) |
| Total | 675 (80.0%) | 169 (20.0%) |
Employment Characteristics in Pflugerville
Employment by Class of Employer in Pflugerville
Among the 36,644 employed individuals in Pflugerville, private company employees (23,052 | 62.9%), state government employees (3,471 | 9.5%), and local government employees (3,054 | 8.3%) make up the most common classes of employment.
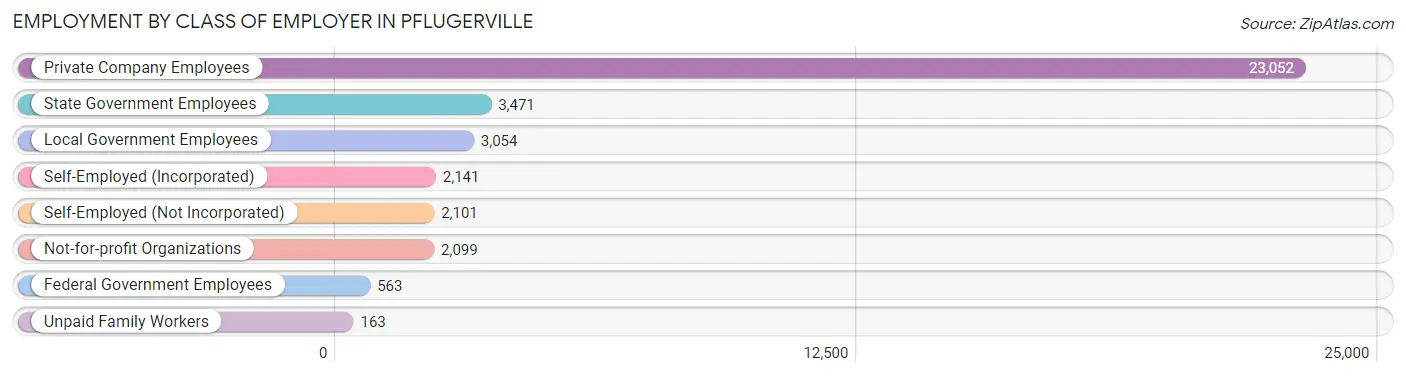
| Employer Class | # Employees | % Employees |
| Private Company Employees | 23,052 | 62.9% |
| Self-Employed (Incorporated) | 2,141 | 5.8% |
| Self-Employed (Not Incorporated) | 2,101 | 5.7% |
| Not-for-profit Organizations | 2,099 | 5.7% |
| Local Government Employees | 3,054 | 8.3% |
| State Government Employees | 3,471 | 9.5% |
| Federal Government Employees | 563 | 1.5% |
| Unpaid Family Workers | 163 | 0.4% |
| Total | 36,644 | 100.0% |
Employment Status by Age in Pflugerville
According to the labor force statistics for Pflugerville, out of the total population over 16 years of age (51,330), 75.9% or 38,959 individuals are in the labor force, with 3.9% or 1,519 of them unemployed. The age group with the highest labor force participation rate is 45 to 54 years, with 92.0% or 10,057 individuals in the labor force. Within the labor force, the 20 to 24 years age range has the highest percentage of unemployed individuals, with 14.7% or 345 of them being unemployed.
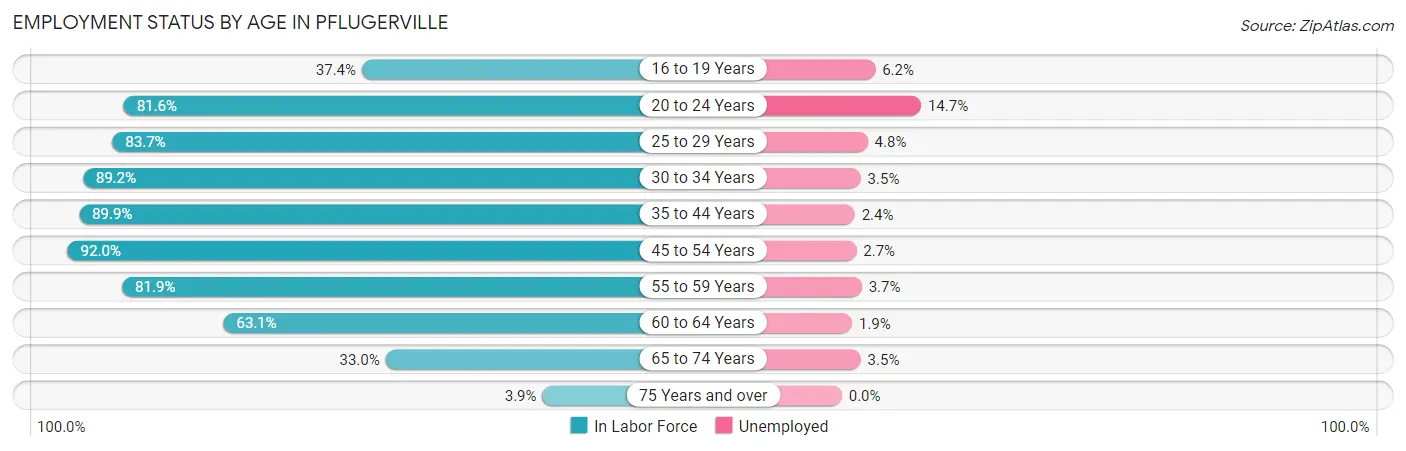
| Age Bracket | In Labor Force | Unemployed |
| 16 to 19 Years | 1,443 (37.4%) | 89 (6.2%) |
| 20 to 24 Years | 2,349 (81.6%) | 345 (14.7%) |
| 25 to 29 Years | 3,861 (83.7%) | 185 (4.8%) |
| 30 to 34 Years | 4,625 (89.2%) | 162 (3.5%) |
| 35 to 44 Years | 10,107 (89.9%) | 243 (2.4%) |
| 45 to 54 Years | 10,057 (92.0%) | 272 (2.7%) |
| 55 to 59 Years | 3,283 (81.9%) | 121 (3.7%) |
| 60 to 64 Years | 1,817 (63.1%) | 35 (1.9%) |
| 65 to 74 Years | 1,318 (33.0%) | 46 (3.5%) |
| 75 Years and over | 68 (3.9%) | 0 (0.0%) |
| Total | 38,959 (75.9%) | 1,519 (3.9%) |
Employment Status by Educational Attainment in Pflugerville
According to labor force statistics for Pflugerville, 86.9% of individuals (33,769) out of the total population between 25 and 64 years of age (38,860) are in the labor force, with 3.0% or 1,013 of them being unemployed. The group with the highest labor force participation rate are those with the educational attainment of bachelor's degree or higher, with 92.4% or 15,206 individuals in the labor force. Within the labor force, individuals with college / associate degree education have the highest percentage of unemployment, with 5.6% or 582 of them being unemployed.
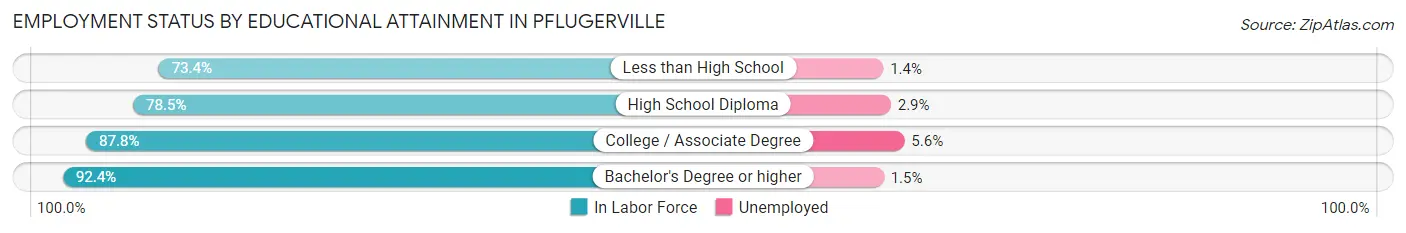
| Educational Attainment | In Labor Force | Unemployed |
| Less than High School | 1,840 (73.4%) | 35 (1.4%) |
| High School Diploma | 6,321 (78.5%) | 234 (2.9%) |
| College / Associate Degree | 10,399 (87.8%) | 663 (5.6%) |
| Bachelor's Degree or higher | 15,206 (92.4%) | 247 (1.5%) |
| Total | 33,769 (86.9%) | 1,166 (3.0%) |
Employment Occupations by Sex in Pflugerville
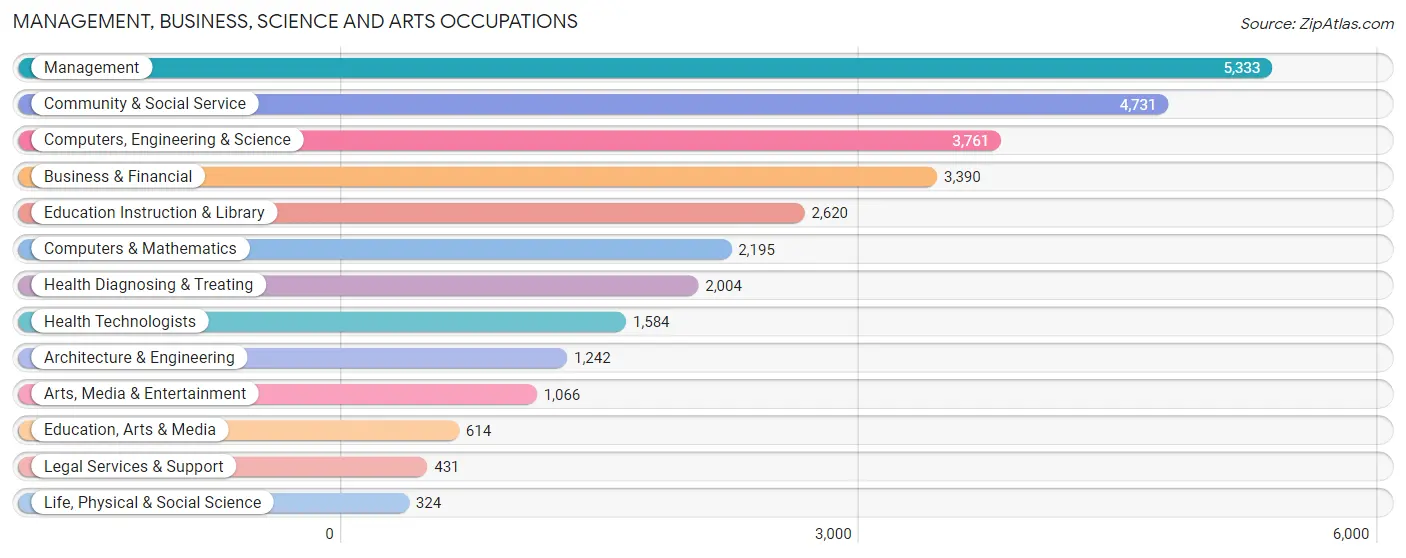
Management, Business, Science and Arts Occupations
The most common Management, Business, Science and Arts occupations in Pflugerville are Management (5,333 | 14.3%), Community & Social Service (4,731 | 12.7%), Computers, Engineering & Science (3,761 | 10.1%), Business & Financial (3,390 | 9.1%), and Education Instruction & Library (2,620 | 7.0%).
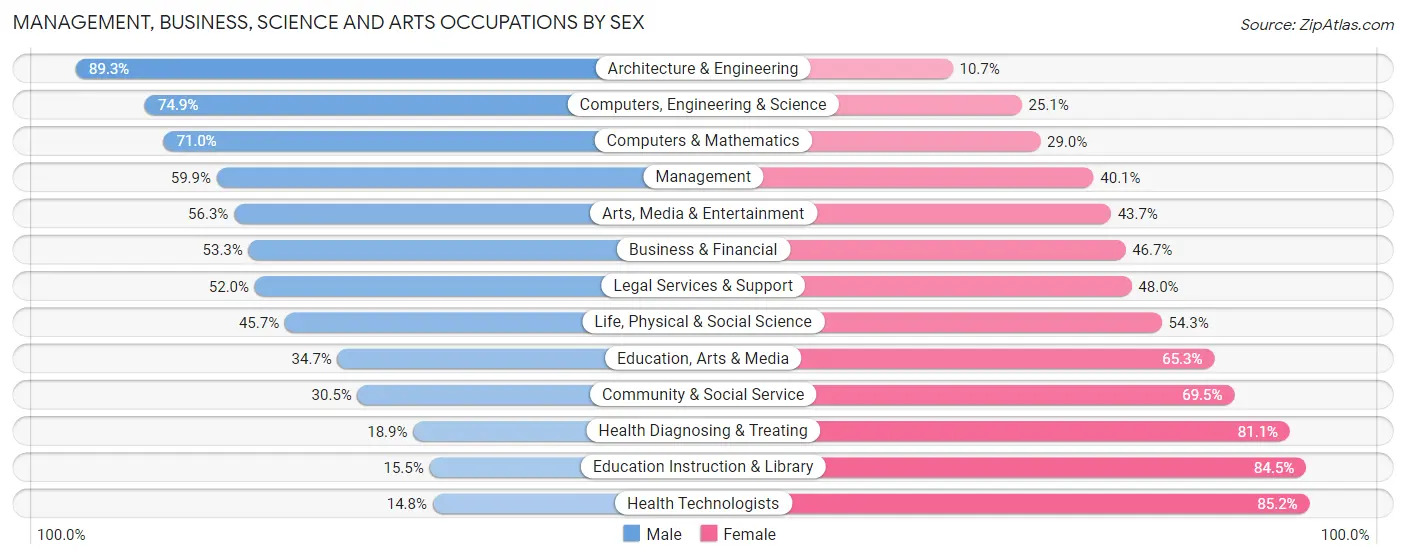
Management, Business, Science and Arts Occupations by Sex
Within the Management, Business, Science and Arts occupations in Pflugerville, the most male-oriented occupations are Architecture & Engineering (89.3%), Computers, Engineering & Science (74.9%), and Computers & Mathematics (71.0%), while the most female-oriented occupations are Health Technologists (85.2%), Education Instruction & Library (84.5%), and Health Diagnosing & Treating (81.1%).
| Occupation | Male | Female |
| Management | 3,195 (59.9%) | 2,138 (40.1%) |
| Business & Financial | 1,806 (53.3%) | 1,584 (46.7%) |
| Computers, Engineering & Science | 2,816 (74.9%) | 945 (25.1%) |
| Computers & Mathematics | 1,559 (71.0%) | 636 (29.0%) |
| Architecture & Engineering | 1,109 (89.3%) | 133 (10.7%) |
| Life, Physical & Social Science | 148 (45.7%) | 176 (54.3%) |
| Community & Social Service | 1,444 (30.5%) | 3,287 (69.5%) |
| Education, Arts & Media | 213 (34.7%) | 401 (65.3%) |
| Legal Services & Support | 224 (52.0%) | 207 (48.0%) |
| Education Instruction & Library | 407 (15.5%) | 2,213 (84.5%) |
| Arts, Media & Entertainment | 600 (56.3%) | 466 (43.7%) |
| Health Diagnosing & Treating | 379 (18.9%) | 1,625 (81.1%) |
| Health Technologists | 235 (14.8%) | 1,349 (85.2%) |
| Total (Category) | 9,640 (50.2%) | 9,579 (49.8%) |
| Total (Overall) | 19,826 (53.1%) | 17,524 (46.9%) |
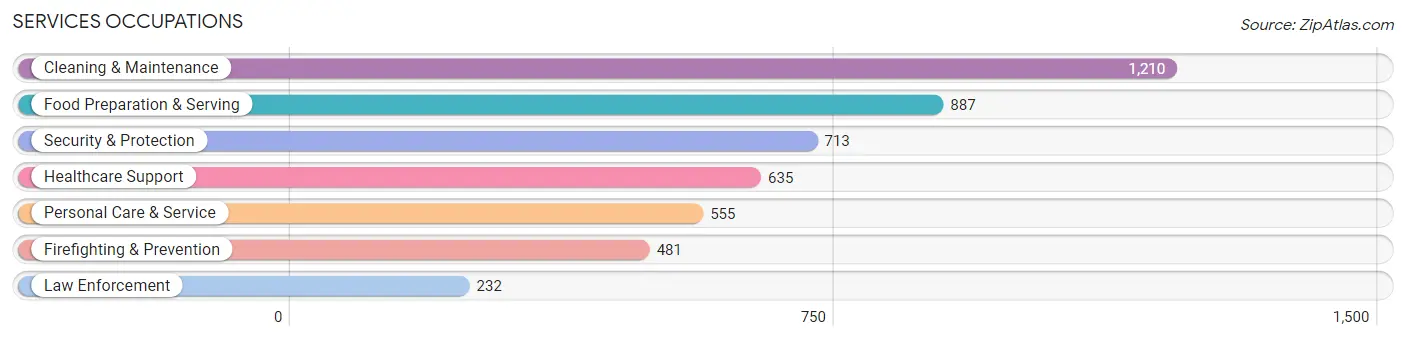
Services Occupations
The most common Services occupations in Pflugerville are Cleaning & Maintenance (1,210 | 3.2%), Food Preparation & Serving (887 | 2.4%), Security & Protection (713 | 1.9%), Healthcare Support (635 | 1.7%), and Personal Care & Service (555 | 1.5%).
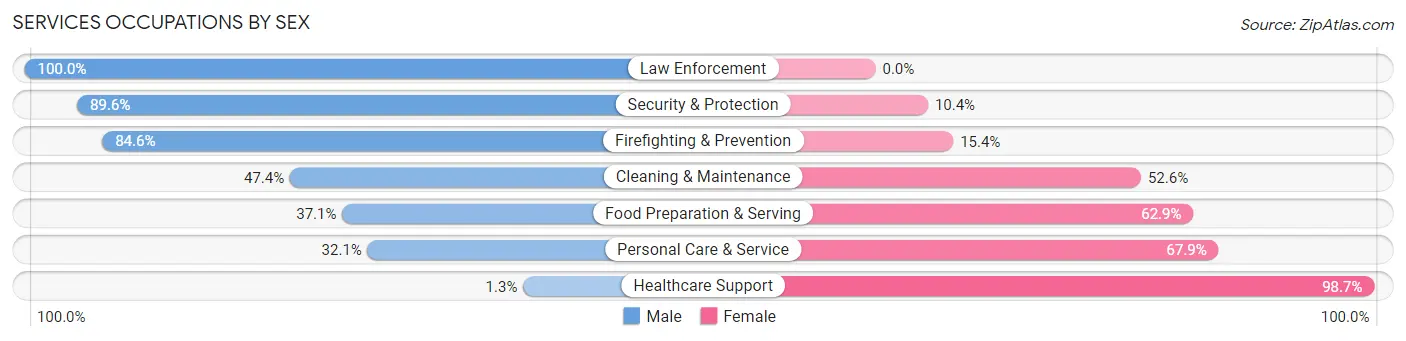
Services Occupations by Sex
Within the Services occupations in Pflugerville, the most male-oriented occupations are Law Enforcement (100.0%), Security & Protection (89.6%), and Firefighting & Prevention (84.6%), while the most female-oriented occupations are Healthcare Support (98.7%), Personal Care & Service (67.9%), and Food Preparation & Serving (62.9%).
| Occupation | Male | Female |
| Healthcare Support | 8 (1.3%) | 627 (98.7%) |
| Security & Protection | 639 (89.6%) | 74 (10.4%) |
| Firefighting & Prevention | 407 (84.6%) | 74 (15.4%) |
| Law Enforcement | 232 (100.0%) | 0 (0.0%) |
| Food Preparation & Serving | 329 (37.1%) | 558 (62.9%) |
| Cleaning & Maintenance | 574 (47.4%) | 636 (52.6%) |
| Personal Care & Service | 178 (32.1%) | 377 (67.9%) |
| Total (Category) | 1,728 (43.2%) | 2,272 (56.8%) |
| Total (Overall) | 19,826 (53.1%) | 17,524 (46.9%) |
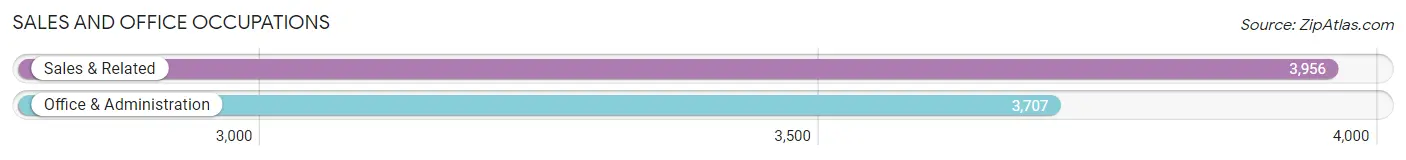
Sales and Office Occupations
The most common Sales and Office occupations in Pflugerville are Sales & Related (3,956 | 10.6%), and Office & Administration (3,707 | 9.9%).
Sales and Office Occupations by Sex
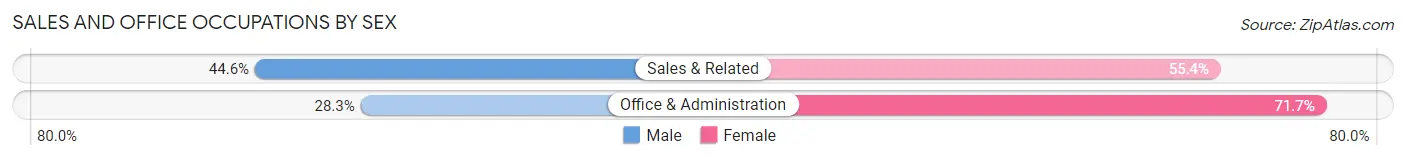
| Occupation | Male | Female |
| Sales & Related | 1,763 (44.6%) | 2,193 (55.4%) |
| Office & Administration | 1,050 (28.3%) | 2,657 (71.7%) |
| Total (Category) | 2,813 (36.7%) | 4,850 (63.3%) |
| Total (Overall) | 19,826 (53.1%) | 17,524 (46.9%) |
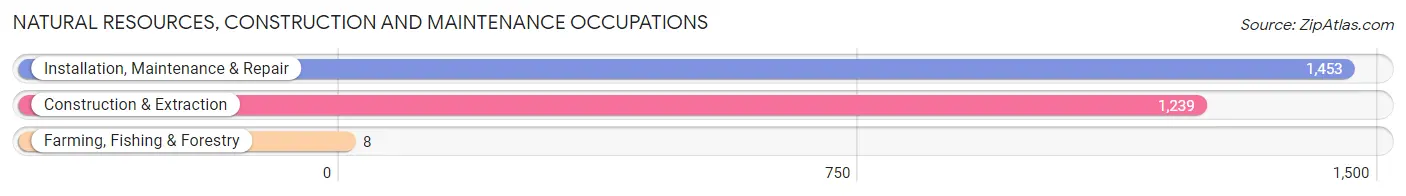
Natural Resources, Construction and Maintenance Occupations
The most common Natural Resources, Construction and Maintenance occupations in Pflugerville are Installation, Maintenance & Repair (1,453 | 3.9%), Construction & Extraction (1,239 | 3.3%), and Farming, Fishing & Forestry (8 | 0.0%).
Natural Resources, Construction and Maintenance Occupations by Sex
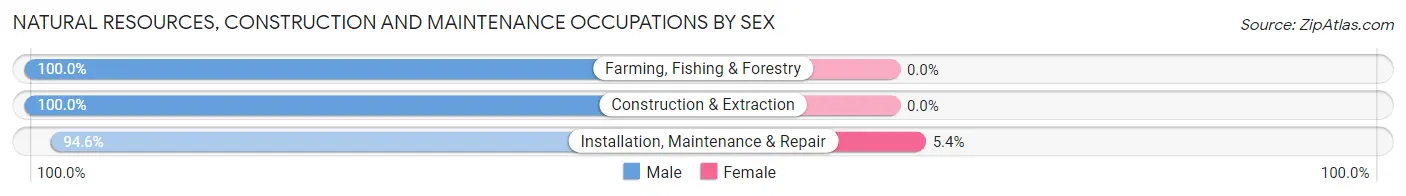
| Occupation | Male | Female |
| Farming, Fishing & Forestry | 8 (100.0%) | 0 (0.0%) |
| Construction & Extraction | 1,239 (100.0%) | 0 (0.0%) |
| Installation, Maintenance & Repair | 1,375 (94.6%) | 78 (5.4%) |
| Total (Category) | 2,622 (97.1%) | 78 (2.9%) |
| Total (Overall) | 19,826 (53.1%) | 17,524 (46.9%) |
Production, Transportation and Moving Occupations
The most common Production, Transportation and Moving occupations in Pflugerville are Transportation (1,683 | 4.5%), Production (1,400 | 3.7%), and Material Moving (685 | 1.8%).
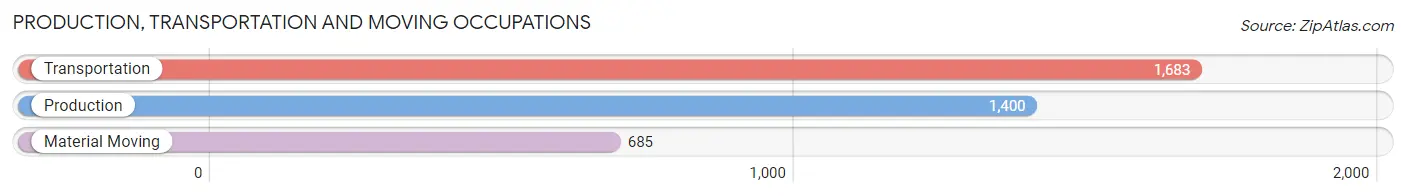
Production, Transportation and Moving Occupations by Sex
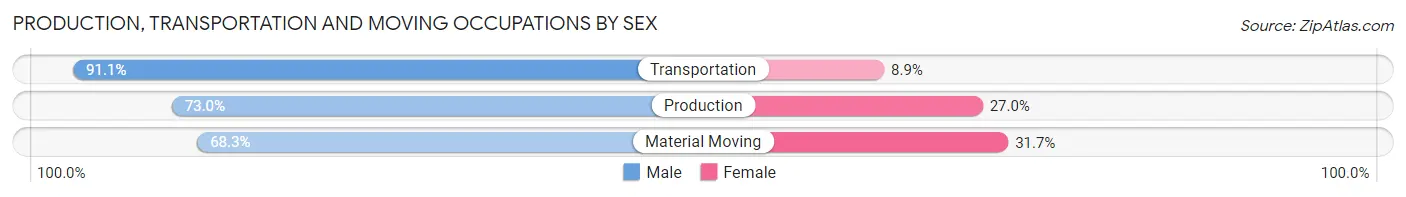
| Occupation | Male | Female |
| Production | 1,022 (73.0%) | 378 (27.0%) |
| Transportation | 1,533 (91.1%) | 150 (8.9%) |
| Material Moving | 468 (68.3%) | 217 (31.7%) |
| Total (Category) | 3,023 (80.2%) | 745 (19.8%) |
| Total (Overall) | 19,826 (53.1%) | 17,524 (46.9%) |
Employment Industries by Sex in Pflugerville
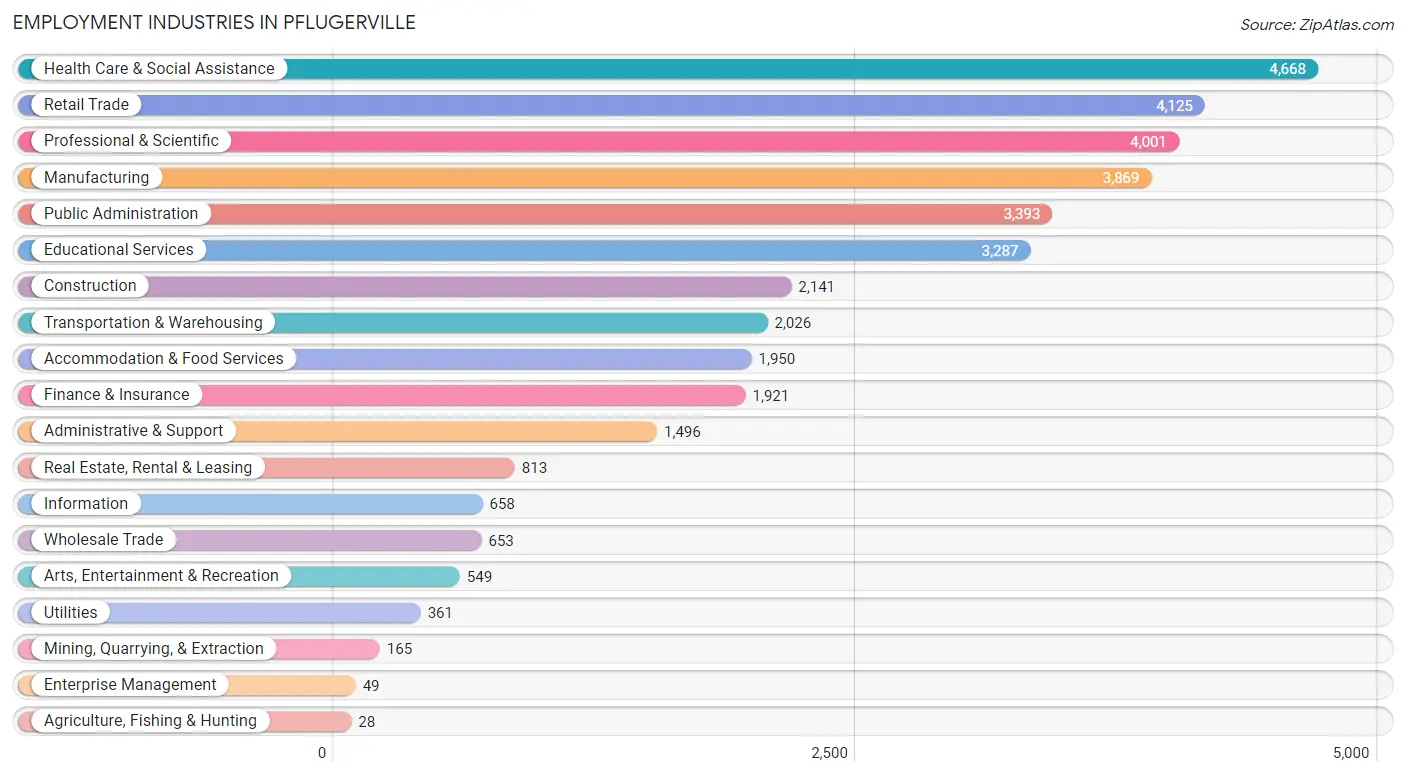
Employment Industries in Pflugerville
The major employment industries in Pflugerville include Health Care & Social Assistance (4,668 | 12.5%), Retail Trade (4,125 | 11.0%), Professional & Scientific (4,001 | 10.7%), Manufacturing (3,869 | 10.4%), and Public Administration (3,393 | 9.1%).
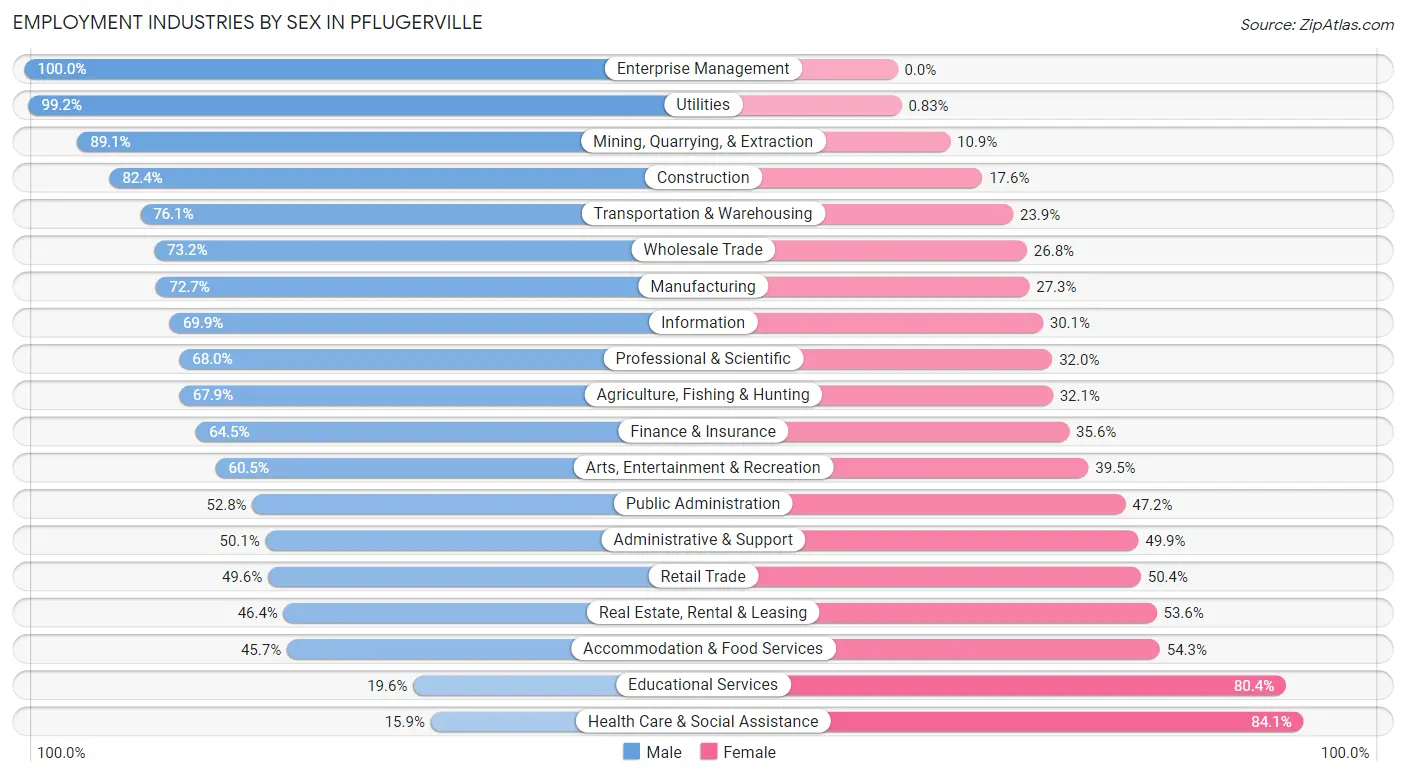
Employment Industries by Sex in Pflugerville
The Pflugerville industries that see more men than women are Enterprise Management (100.0%), Utilities (99.2%), and Mining, Quarrying, & Extraction (89.1%), whereas the industries that tend to have a higher number of women are Health Care & Social Assistance (84.1%), Educational Services (80.4%), and Accommodation & Food Services (54.3%).
| Industry | Male | Female |
| Agriculture, Fishing & Hunting | 19 (67.9%) | 9 (32.1%) |
| Mining, Quarrying, & Extraction | 147 (89.1%) | 18 (10.9%) |
| Construction | 1,765 (82.4%) | 376 (17.6%) |
| Manufacturing | 2,813 (72.7%) | 1,056 (27.3%) |
| Wholesale Trade | 478 (73.2%) | 175 (26.8%) |
| Retail Trade | 2,047 (49.6%) | 2,078 (50.4%) |
| Transportation & Warehousing | 1,541 (76.1%) | 485 (23.9%) |
| Utilities | 358 (99.2%) | 3 (0.8%) |
| Information | 460 (69.9%) | 198 (30.1%) |
| Finance & Insurance | 1,238 (64.4%) | 683 (35.5%) |
| Real Estate, Rental & Leasing | 377 (46.4%) | 436 (53.6%) |
| Professional & Scientific | 2,719 (68.0%) | 1,282 (32.0%) |
| Enterprise Management | 49 (100.0%) | 0 (0.0%) |
| Administrative & Support | 750 (50.1%) | 746 (49.9%) |
| Educational Services | 643 (19.6%) | 2,644 (80.4%) |
| Health Care & Social Assistance | 744 (15.9%) | 3,924 (84.1%) |
| Arts, Entertainment & Recreation | 332 (60.5%) | 217 (39.5%) |
| Accommodation & Food Services | 891 (45.7%) | 1,059 (54.3%) |
| Public Administration | 1,793 (52.8%) | 1,600 (47.2%) |
| Total | 19,826 (53.1%) | 17,524 (46.9%) |
Education in Pflugerville
School Enrollment in Pflugerville
The most common levels of schooling among the 15,646 students in Pflugerville are middle school (4,010 | 25.6%), high school (4,007 | 25.6%), and elementary school (2,814 | 18.0%).
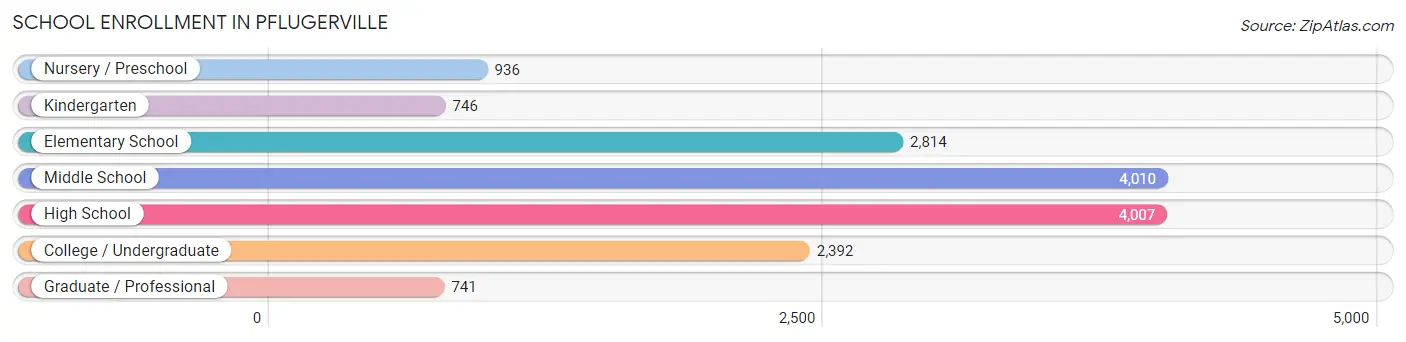
| School Level | # Students | % Students |
| Nursery / Preschool | 936 | 6.0% |
| Kindergarten | 746 | 4.8% |
| Elementary School | 2,814 | 18.0% |
| Middle School | 4,010 | 25.6% |
| High School | 4,007 | 25.6% |
| College / Undergraduate | 2,392 | 15.3% |
| Graduate / Professional | 741 | 4.7% |
| Total | 15,646 | 100.0% |
School Enrollment by Age by Funding Source in Pflugerville
Out of a total of 15,646 students who are enrolled in schools in Pflugerville, 1,862 (11.9%) attend a private institution, while the remaining 13,784 (88.1%) are enrolled in public schools. The age group of 35 years and over has the highest likelihood of being enrolled in private schools, with 495 (52.3% in the age bracket) enrolled. Conversely, the age group of 10 to 14 year olds has the lowest likelihood of being enrolled in a private school, with 4,610 (96.9% in the age bracket) attending a public institution.
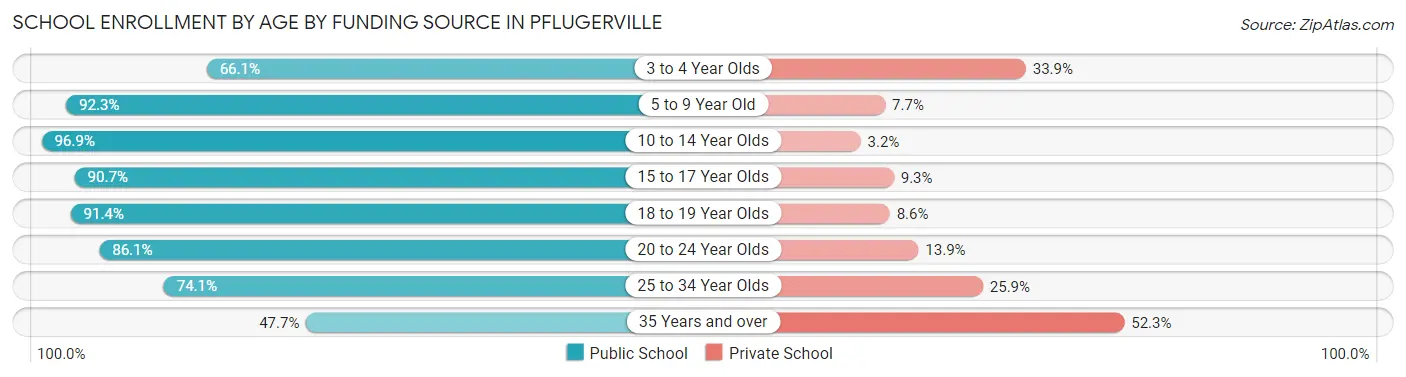
| Age Bracket | Public School | Private School |
| 3 to 4 Year Olds | 586 (66.1%) | 301 (33.9%) |
| 5 to 9 Year Old | 2,974 (92.3%) | 249 (7.7%) |
| 10 to 14 Year Olds | 4,610 (96.9%) | 150 (3.2%) |
| 15 to 17 Year Olds | 2,857 (90.7%) | 294 (9.3%) |
| 18 to 19 Year Olds | 1,076 (91.4%) | 101 (8.6%) |
| 20 to 24 Year Olds | 804 (86.1%) | 130 (13.9%) |
| 25 to 34 Year Olds | 420 (74.1%) | 147 (25.9%) |
| 35 Years and over | 452 (47.7%) | 495 (52.3%) |
| Total | 13,784 (88.1%) | 1,862 (11.9%) |
Educational Attainment by Field of Study in Pflugerville
Business (4,393 | 22.6%), engineering (1,956 | 10.1%), education (1,841 | 9.5%), bio, nature & agricultural (1,506 | 7.7%), and social sciences (1,433 | 7.4%) are the most common fields of study among 19,421 individuals in Pflugerville who have obtained a bachelor's degree or higher.
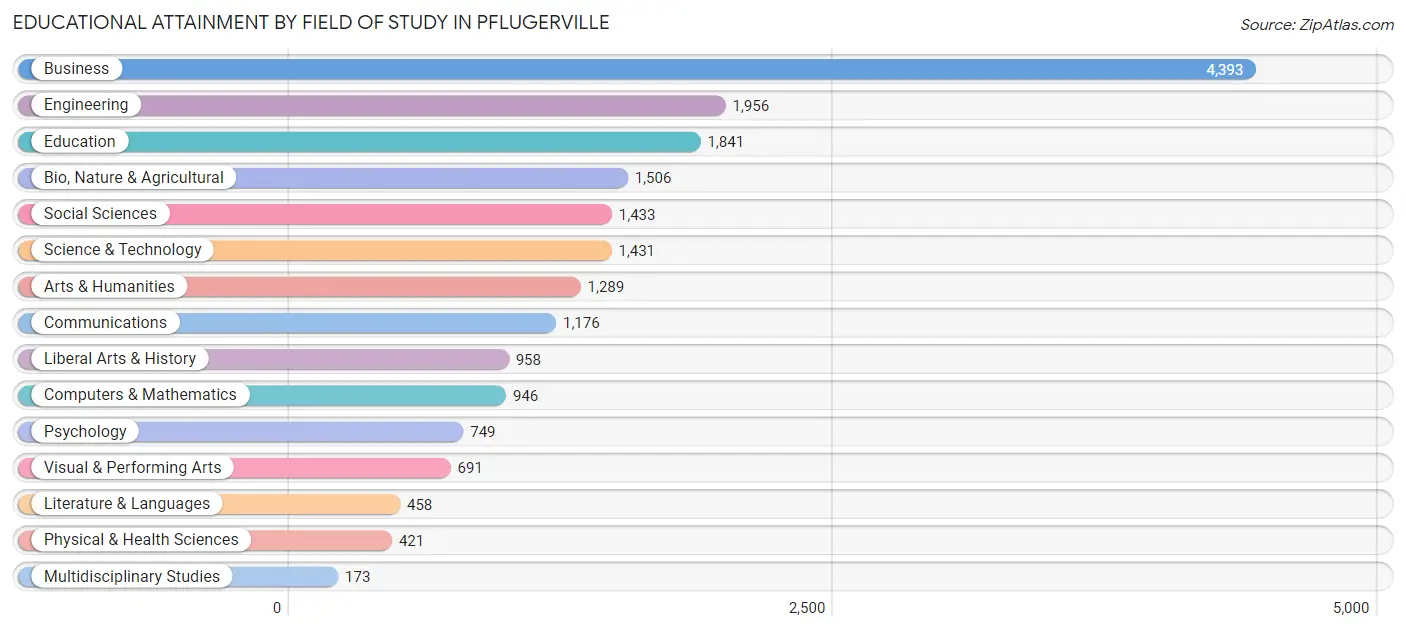
| Field of Study | # Graduates | % Graduates |
| Computers & Mathematics | 946 | 4.9% |
| Bio, Nature & Agricultural | 1,506 | 7.7% |
| Physical & Health Sciences | 421 | 2.2% |
| Psychology | 749 | 3.9% |
| Social Sciences | 1,433 | 7.4% |
| Engineering | 1,956 | 10.1% |
| Multidisciplinary Studies | 173 | 0.9% |
| Science & Technology | 1,431 | 7.4% |
| Business | 4,393 | 22.6% |
| Education | 1,841 | 9.5% |
| Literature & Languages | 458 | 2.4% |
| Liberal Arts & History | 958 | 4.9% |
| Visual & Performing Arts | 691 | 3.6% |
| Communications | 1,176 | 6.1% |
| Arts & Humanities | 1,289 | 6.6% |
| Total | 19,421 | 100.0% |
Transportation & Commute in Pflugerville
Vehicle Availability by Sex in Pflugerville
The most prevalent vehicle ownership categories in Pflugerville are males with 2 vehicles (9,946, accounting for 51.1%) and females with 2 vehicles (7,975, making up 57.9%).
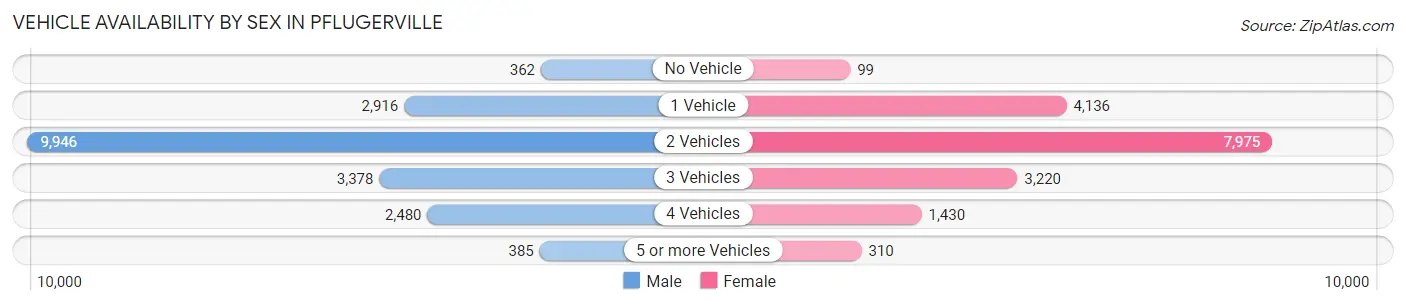
| Vehicles Available | Male | Female |
| No Vehicle | 362 (1.9%) | 99 (0.6%) |
| 1 Vehicle | 2,916 (15.0%) | 4,136 (24.1%) |
| 2 Vehicles | 9,946 (51.1%) | 7,975 (46.5%) |
| 3 Vehicles | 3,378 (17.3%) | 3,220 (18.8%) |
| 4 Vehicles | 2,480 (12.7%) | 1,430 (8.3%) |
| 5 or more Vehicles | 385 (2.0%) | 310 (1.8%) |
| Total | 19,467 (100.0%) | 17,170 (100.0%) |
Commute Time in Pflugerville
The most frequently occuring commute durations in Pflugerville are 30 to 34 minutes (6,533 commuters, 22.0%), 20 to 24 minutes (4,613 commuters, 15.6%), and 15 to 19 minutes (3,595 commuters, 12.1%).
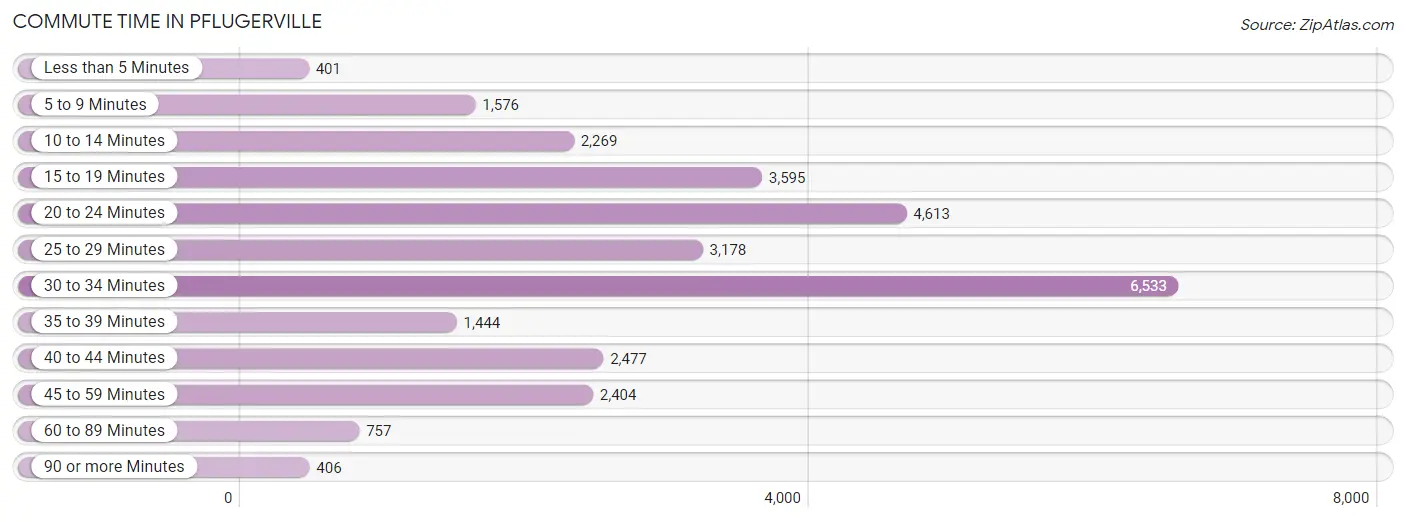
| Commute Time | # Commuters | % Commuters |
| Less than 5 Minutes | 401 | 1.3% |
| 5 to 9 Minutes | 1,576 | 5.3% |
| 10 to 14 Minutes | 2,269 | 7.6% |
| 15 to 19 Minutes | 3,595 | 12.1% |
| 20 to 24 Minutes | 4,613 | 15.6% |
| 25 to 29 Minutes | 3,178 | 10.7% |
| 30 to 34 Minutes | 6,533 | 22.0% |
| 35 to 39 Minutes | 1,444 | 4.9% |
| 40 to 44 Minutes | 2,477 | 8.4% |
| 45 to 59 Minutes | 2,404 | 8.1% |
| 60 to 89 Minutes | 757 | 2.5% |
| 90 or more Minutes | 406 | 1.4% |
Commute Time by Sex in Pflugerville
The most common commute times in Pflugerville are 30 to 34 minutes (2,996 commuters, 18.7%) for males and 30 to 34 minutes (3,537 commuters, 25.9%) for females.
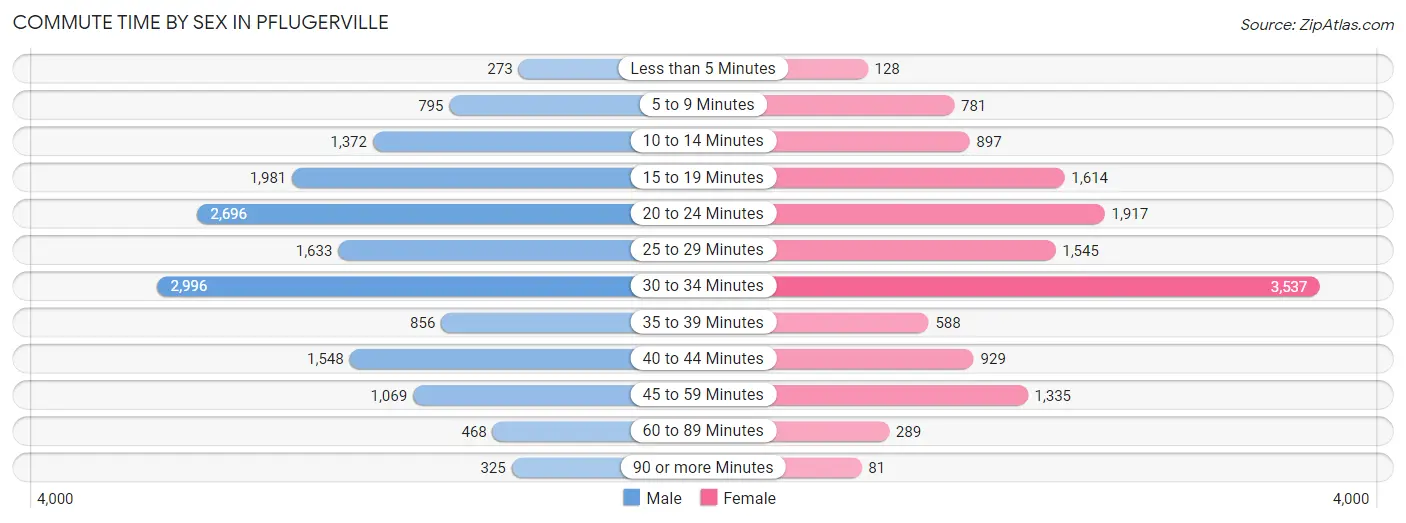
| Commute Time | Male | Female |
| Less than 5 Minutes | 273 (1.7%) | 128 (0.9%) |
| 5 to 9 Minutes | 795 (5.0%) | 781 (5.7%) |
| 10 to 14 Minutes | 1,372 (8.6%) | 897 (6.6%) |
| 15 to 19 Minutes | 1,981 (12.4%) | 1,614 (11.8%) |
| 20 to 24 Minutes | 2,696 (16.8%) | 1,917 (14.1%) |
| 25 to 29 Minutes | 1,633 (10.2%) | 1,545 (11.3%) |
| 30 to 34 Minutes | 2,996 (18.7%) | 3,537 (25.9%) |
| 35 to 39 Minutes | 856 (5.3%) | 588 (4.3%) |
| 40 to 44 Minutes | 1,548 (9.7%) | 929 (6.8%) |
| 45 to 59 Minutes | 1,069 (6.7%) | 1,335 (9.8%) |
| 60 to 89 Minutes | 468 (2.9%) | 289 (2.1%) |
| 90 or more Minutes | 325 (2.0%) | 81 (0.6%) |
Time of Departure to Work by Sex in Pflugerville
The most frequent times of departure to work in Pflugerville are 7:30 AM to 7:59 AM (2,747, 17.2%) for males and 7:00 AM to 7:29 AM (2,515, 18.4%) for females.
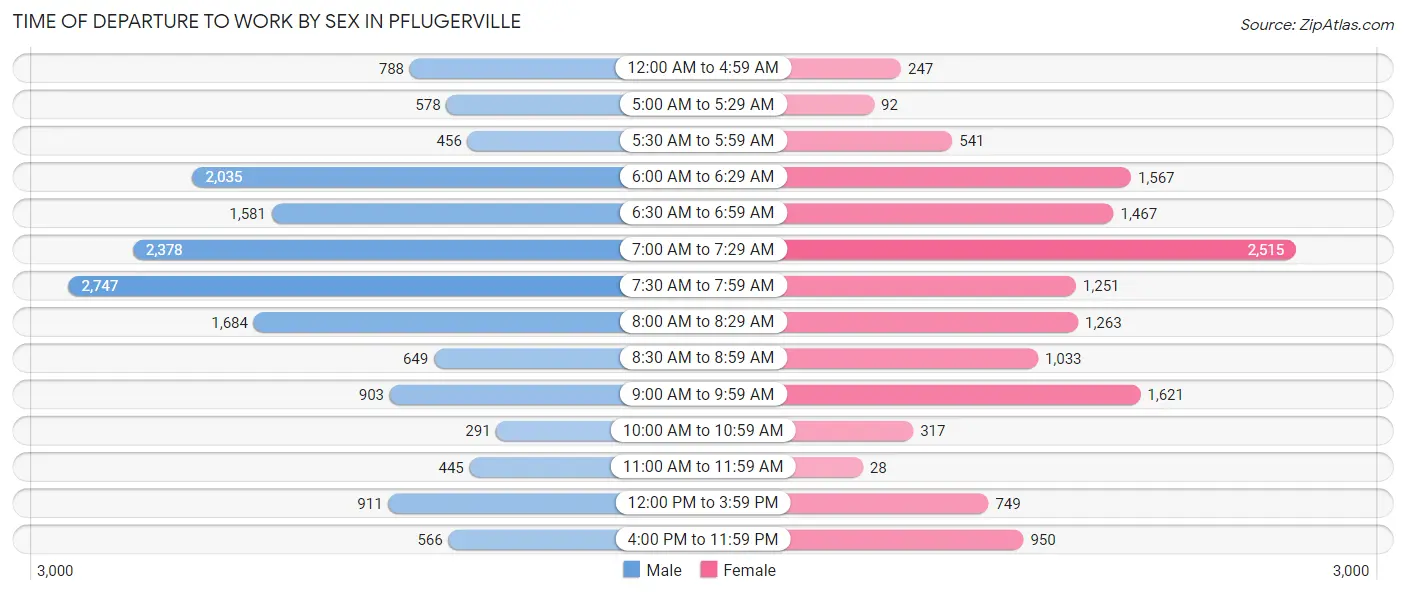
| Time of Departure | Male | Female |
| 12:00 AM to 4:59 AM | 788 (4.9%) | 247 (1.8%) |
| 5:00 AM to 5:29 AM | 578 (3.6%) | 92 (0.7%) |
| 5:30 AM to 5:59 AM | 456 (2.9%) | 541 (4.0%) |
| 6:00 AM to 6:29 AM | 2,035 (12.7%) | 1,567 (11.5%) |
| 6:30 AM to 6:59 AM | 1,581 (9.9%) | 1,467 (10.7%) |
| 7:00 AM to 7:29 AM | 2,378 (14.8%) | 2,515 (18.4%) |
| 7:30 AM to 7:59 AM | 2,747 (17.2%) | 1,251 (9.2%) |
| 8:00 AM to 8:29 AM | 1,684 (10.5%) | 1,263 (9.3%) |
| 8:30 AM to 8:59 AM | 649 (4.1%) | 1,033 (7.6%) |
| 9:00 AM to 9:59 AM | 903 (5.6%) | 1,621 (11.9%) |
| 10:00 AM to 10:59 AM | 291 (1.8%) | 317 (2.3%) |
| 11:00 AM to 11:59 AM | 445 (2.8%) | 28 (0.2%) |
| 12:00 PM to 3:59 PM | 911 (5.7%) | 749 (5.5%) |
| 4:00 PM to 11:59 PM | 566 (3.5%) | 950 (7.0%) |
| Total | 16,012 (100.0%) | 13,641 (100.0%) |
Housing Occupancy in Pflugerville
Occupancy by Ownership in Pflugerville
Of the total 23,719 dwellings in Pflugerville, owner-occupied units account for 17,252 (72.7%), while renter-occupied units make up 6,467 (27.3%).
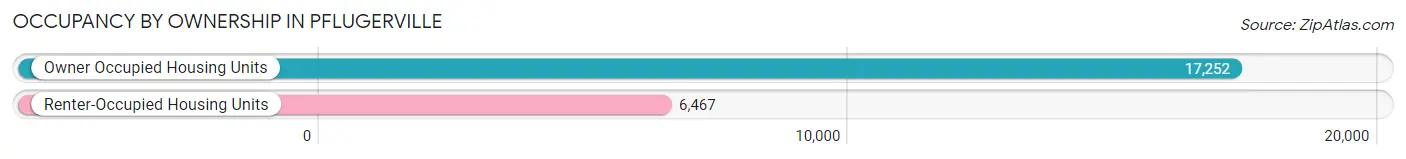
| Occupancy | # Housing Units | % Housing Units |
| Owner Occupied Housing Units | 17,252 | 72.7% |
| Renter-Occupied Housing Units | 6,467 | 27.3% |
| Total Occupied Housing Units | 23,719 | 100.0% |
Occupancy by Household Size in Pflugerville
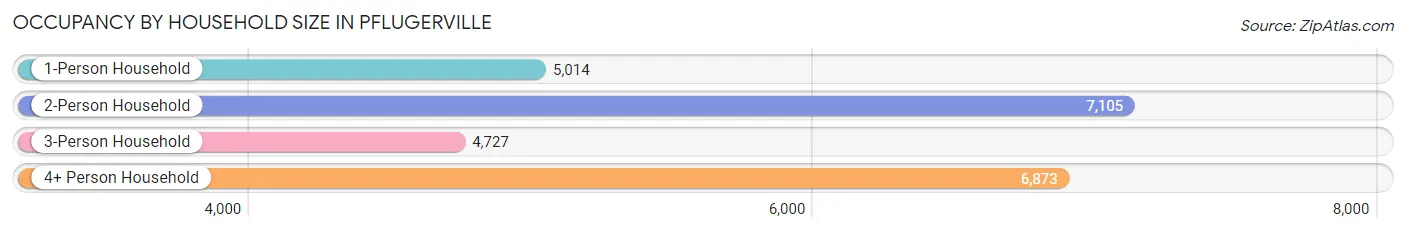
| Household Size | # Housing Units | % Housing Units |
| 1-Person Household | 5,014 | 21.1% |
| 2-Person Household | 7,105 | 29.9% |
| 3-Person Household | 4,727 | 19.9% |
| 4+ Person Household | 6,873 | 29.0% |
| Total Housing Units | 23,719 | 100.0% |
Occupancy by Ownership by Household Size in Pflugerville
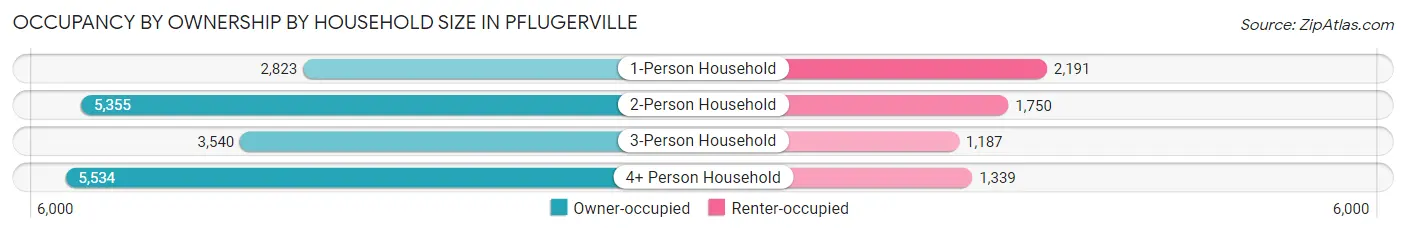
| Household Size | Owner-occupied | Renter-occupied |
| 1-Person Household | 2,823 (56.3%) | 2,191 (43.7%) |
| 2-Person Household | 5,355 (75.4%) | 1,750 (24.6%) |
| 3-Person Household | 3,540 (74.9%) | 1,187 (25.1%) |
| 4+ Person Household | 5,534 (80.5%) | 1,339 (19.5%) |
| Total Housing Units | 17,252 (72.7%) | 6,467 (27.3%) |
Occupancy by Educational Attainment in Pflugerville
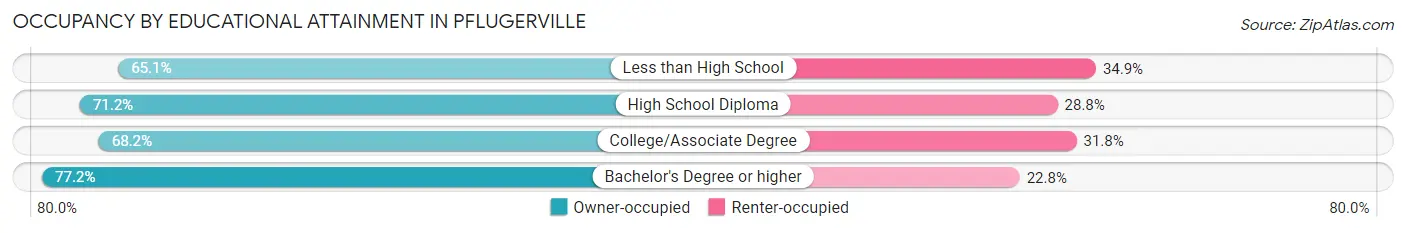
| Household Size | Owner-occupied | Renter-occupied |
| Less than High School | 727 (65.1%) | 389 (34.9%) |
| High School Diploma | 3,069 (71.2%) | 1,240 (28.8%) |
| College/Associate Degree | 5,093 (68.2%) | 2,373 (31.8%) |
| Bachelor's Degree or higher | 8,363 (77.2%) | 2,465 (22.8%) |
Occupancy by Age of Householder in Pflugerville
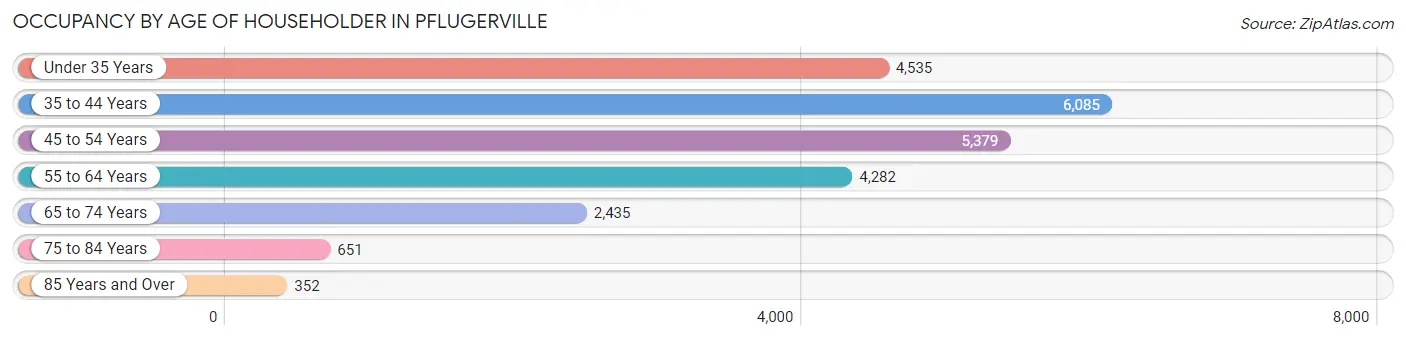
| Age Bracket | # Households | % Households |
| Under 35 Years | 4,535 | 19.1% |
| 35 to 44 Years | 6,085 | 25.7% |
| 45 to 54 Years | 5,379 | 22.7% |
| 55 to 64 Years | 4,282 | 18.0% |
| 65 to 74 Years | 2,435 | 10.3% |
| 75 to 84 Years | 651 | 2.7% |
| 85 Years and Over | 352 | 1.5% |
| Total | 23,719 | 100.0% |
Housing Finances in Pflugerville
Median Income by Occupancy in Pflugerville
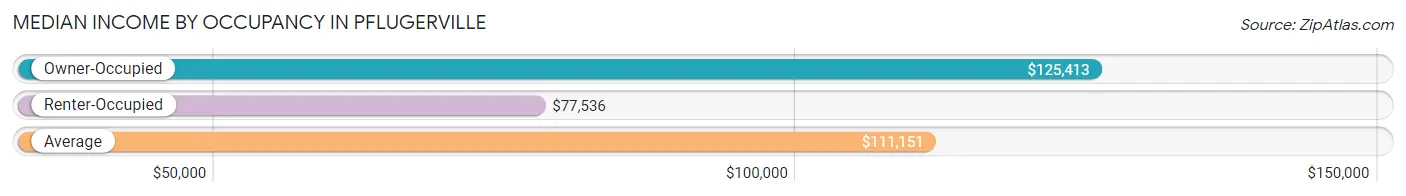
| Occupancy Type | # Households | Median Income |
| Owner-Occupied | 17,252 (72.7%) | $125,413 |
| Renter-Occupied | 6,467 (27.3%) | $77,536 |
| Average | 23,719 (100.0%) | $111,151 |
Occupancy by Householder Income Bracket in Pflugerville
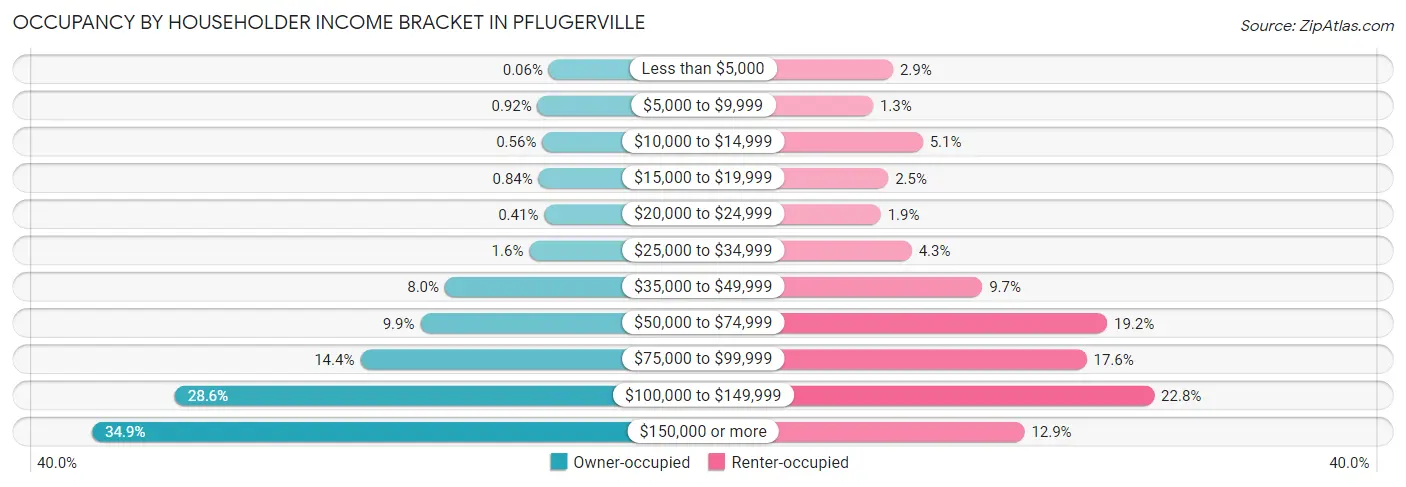
| Income Bracket | Owner-occupied | Renter-occupied |
| Less than $5,000 | 10 (0.1%) | 184 (2.9%) |
| $5,000 to $9,999 | 158 (0.9%) | 86 (1.3%) |
| $10,000 to $14,999 | 96 (0.6%) | 331 (5.1%) |
| $15,000 to $19,999 | 145 (0.8%) | 161 (2.5%) |
| $20,000 to $24,999 | 70 (0.4%) | 124 (1.9%) |
| $25,000 to $34,999 | 267 (1.5%) | 277 (4.3%) |
| $35,000 to $49,999 | 1,377 (8.0%) | 624 (9.7%) |
| $50,000 to $74,999 | 1,699 (9.9%) | 1,239 (19.2%) |
| $75,000 to $99,999 | 2,490 (14.4%) | 1,138 (17.6%) |
| $100,000 to $149,999 | 4,926 (28.5%) | 1,471 (22.8%) |
| $150,000 or more | 6,014 (34.9%) | 832 (12.9%) |
| Total | 17,252 (100.0%) | 6,467 (100.0%) |
Monthly Housing Cost Tiers in Pflugerville
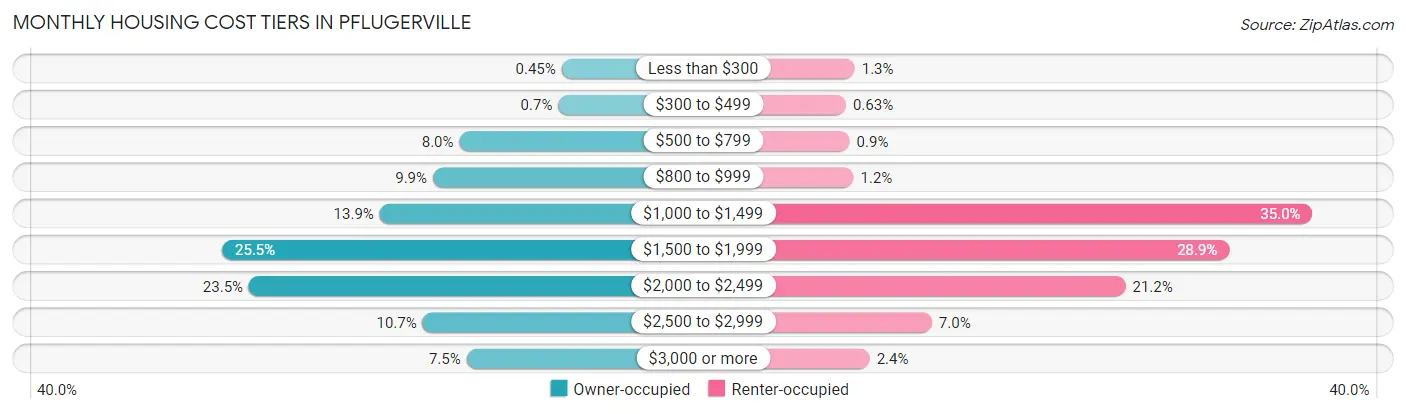
| Monthly Cost | Owner-occupied | Renter-occupied |
| Less than $300 | 78 (0.4%) | 83 (1.3%) |
| $300 to $499 | 121 (0.7%) | 41 (0.6%) |
| $500 to $799 | 1,376 (8.0%) | 58 (0.9%) |
| $800 to $999 | 1,713 (9.9%) | 77 (1.2%) |
| $1,000 to $1,499 | 2,389 (13.9%) | 2,262 (35.0%) |
| $1,500 to $1,999 | 4,394 (25.5%) | 1,866 (28.8%) |
| $2,000 to $2,499 | 4,051 (23.5%) | 1,372 (21.2%) |
| $2,500 to $2,999 | 1,845 (10.7%) | 450 (7.0%) |
| $3,000 or more | 1,285 (7.4%) | 154 (2.4%) |
| Total | 17,252 (100.0%) | 6,467 (100.0%) |
Physical Housing Characteristics in Pflugerville
Housing Structures in Pflugerville
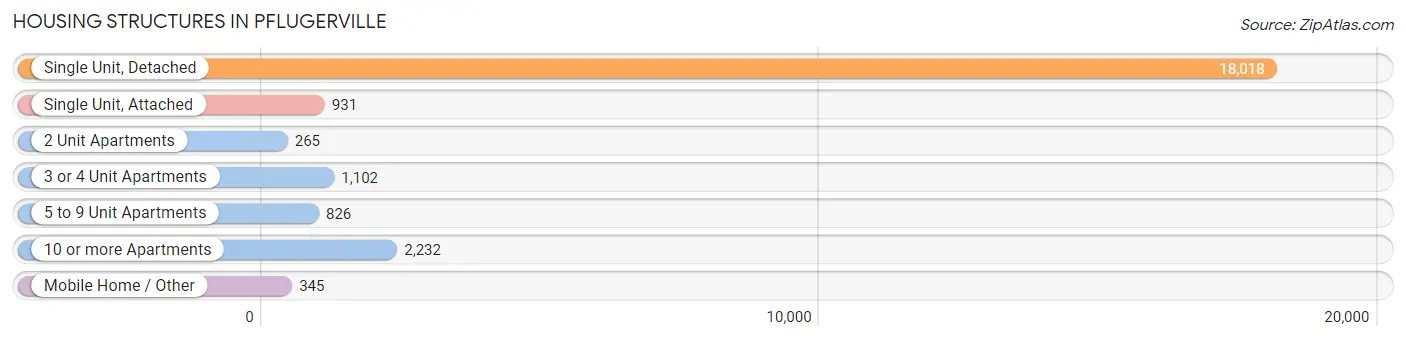
| Structure Type | # Housing Units | % Housing Units |
| Single Unit, Detached | 18,018 | 76.0% |
| Single Unit, Attached | 931 | 3.9% |
| 2 Unit Apartments | 265 | 1.1% |
| 3 or 4 Unit Apartments | 1,102 | 4.6% |
| 5 to 9 Unit Apartments | 826 | 3.5% |
| 10 or more Apartments | 2,232 | 9.4% |
| Mobile Home / Other | 345 | 1.5% |
| Total | 23,719 | 100.0% |
Housing Structures by Occupancy in Pflugerville
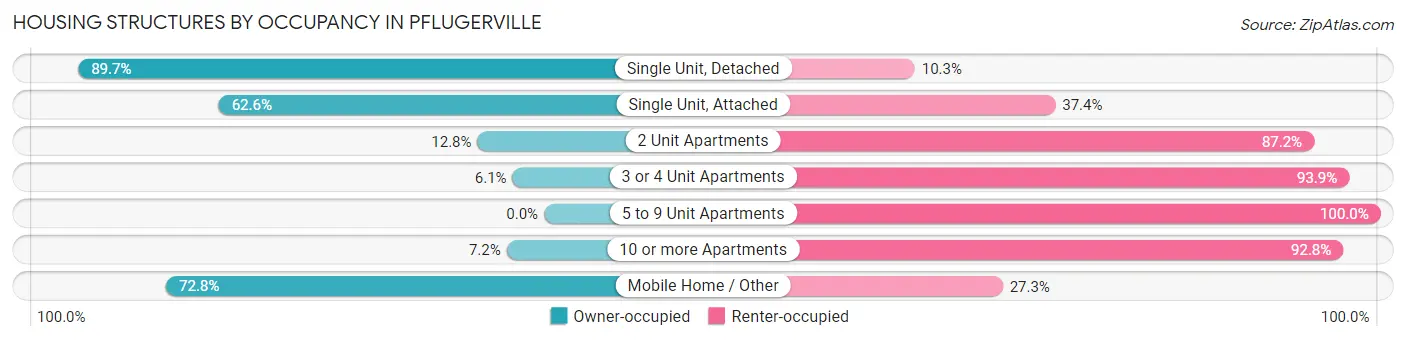
| Structure Type | Owner-occupied | Renter-occupied |
| Single Unit, Detached | 16,156 (89.7%) | 1,862 (10.3%) |
| Single Unit, Attached | 583 (62.6%) | 348 (37.4%) |
| 2 Unit Apartments | 34 (12.8%) | 231 (87.2%) |
| 3 or 4 Unit Apartments | 67 (6.1%) | 1,035 (93.9%) |
| 5 to 9 Unit Apartments | 0 (0.0%) | 826 (100.0%) |
| 10 or more Apartments | 161 (7.2%) | 2,071 (92.8%) |
| Mobile Home / Other | 251 (72.8%) | 94 (27.3%) |
| Total | 17,252 (72.7%) | 6,467 (27.3%) |
Housing Structures by Number of Rooms in Pflugerville
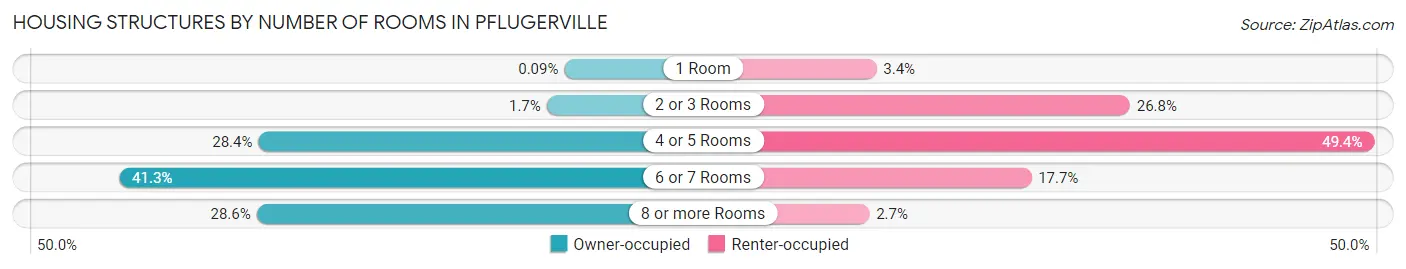
| Number of Rooms | Owner-occupied | Renter-occupied |
| 1 Room | 15 (0.1%) | 218 (3.4%) |
| 2 or 3 Rooms | 297 (1.7%) | 1,734 (26.8%) |
| 4 or 5 Rooms | 4,897 (28.4%) | 3,196 (49.4%) |
| 6 or 7 Rooms | 7,117 (41.2%) | 1,144 (17.7%) |
| 8 or more Rooms | 4,926 (28.5%) | 175 (2.7%) |
| Total | 17,252 (100.0%) | 6,467 (100.0%) |
Housing Structure by Heating Type in Pflugerville
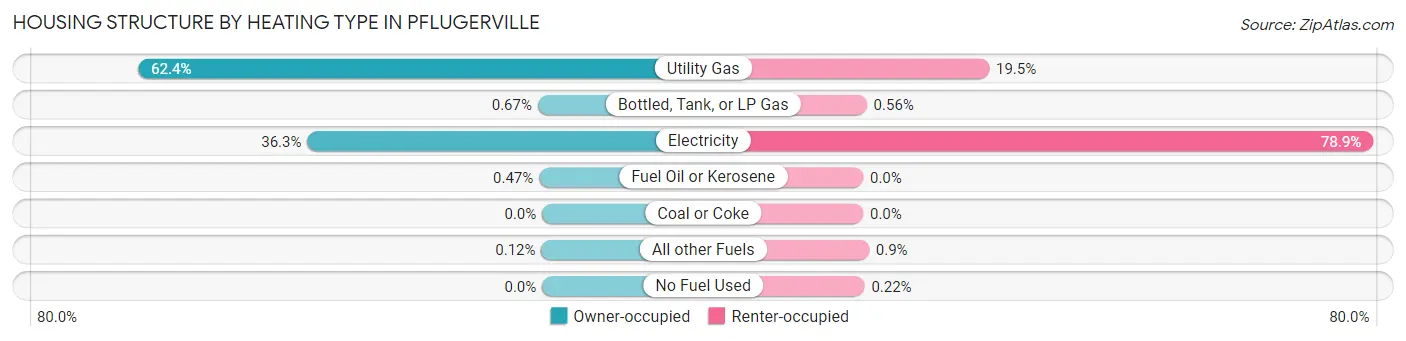
| Heating Type | Owner-occupied | Renter-occupied |
| Utility Gas | 10,772 (62.4%) | 1,260 (19.5%) |
| Bottled, Tank, or LP Gas | 115 (0.7%) | 36 (0.6%) |
| Electricity | 6,263 (36.3%) | 5,099 (78.8%) |
| Fuel Oil or Kerosene | 81 (0.5%) | 0 (0.0%) |
| Coal or Coke | 0 (0.0%) | 0 (0.0%) |
| All other Fuels | 21 (0.1%) | 58 (0.9%) |
| No Fuel Used | 0 (0.0%) | 14 (0.2%) |
| Total | 17,252 (100.0%) | 6,467 (100.0%) |
Household Vehicle Usage in Pflugerville
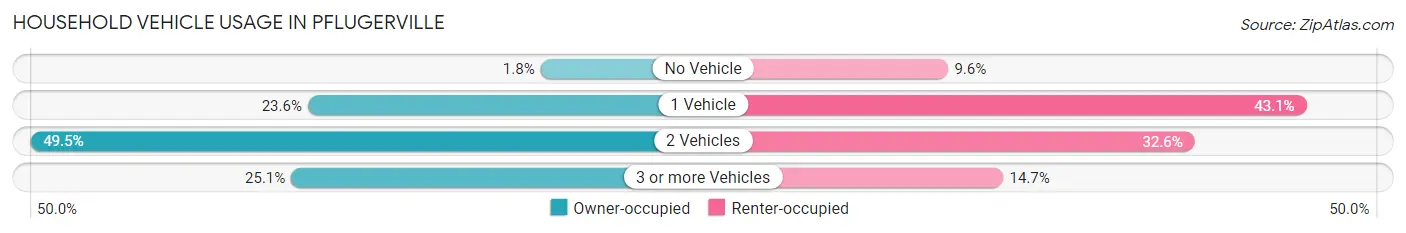
| Vehicles per Household | Owner-occupied | Renter-occupied |
| No Vehicle | 317 (1.8%) | 619 (9.6%) |
| 1 Vehicle | 4,067 (23.6%) | 2,786 (43.1%) |
| 2 Vehicles | 8,535 (49.5%) | 2,111 (32.6%) |
| 3 or more Vehicles | 4,333 (25.1%) | 951 (14.7%) |
| Total | 17,252 (100.0%) | 6,467 (100.0%) |
Real Estate & Mortgages in Pflugerville
Real Estate and Mortgage Overview in Pflugerville
| Characteristic | Without Mortgage | With Mortgage |
| Housing Units | 4,161 | 13,091 |
| Median Property Value | $309,900 | $324,600 |
| Median Household Income | $101,762 | $5,041 |
| Monthly Housing Costs | $915 | $1,285 |
| Real Estate Taxes | $5,922 | $286 |
Property Value by Mortgage Status in Pflugerville
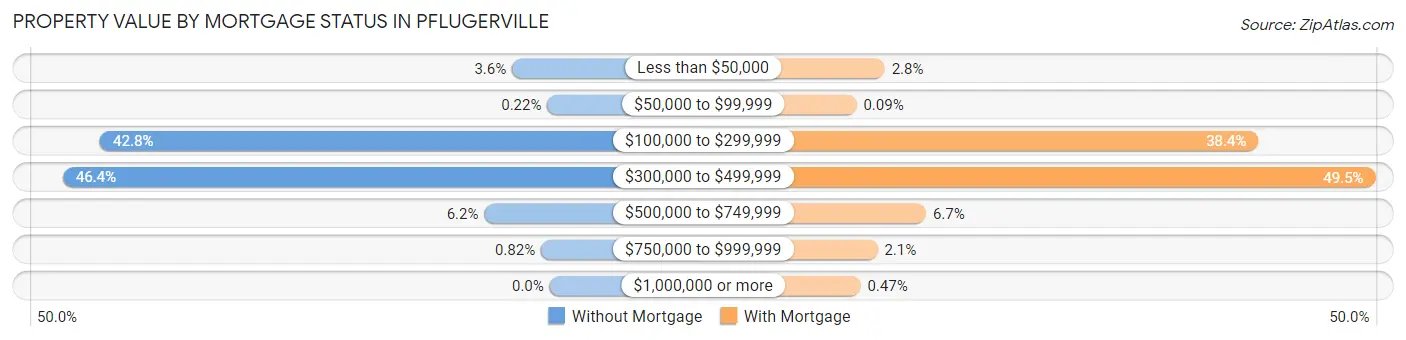
| Property Value | Without Mortgage | With Mortgage |
| Less than $50,000 | 149 (3.6%) | 364 (2.8%) |
| $50,000 to $99,999 | 9 (0.2%) | 12 (0.1%) |
| $100,000 to $299,999 | 1,781 (42.8%) | 5,021 (38.4%) |
| $300,000 to $499,999 | 1,929 (46.4%) | 6,481 (49.5%) |
| $500,000 to $749,999 | 259 (6.2%) | 879 (6.7%) |
| $750,000 to $999,999 | 34 (0.8%) | 273 (2.1%) |
| $1,000,000 or more | 0 (0.0%) | 61 (0.5%) |
| Total | 4,161 (100.0%) | 13,091 (100.0%) |
Household Income by Mortgage Status in Pflugerville
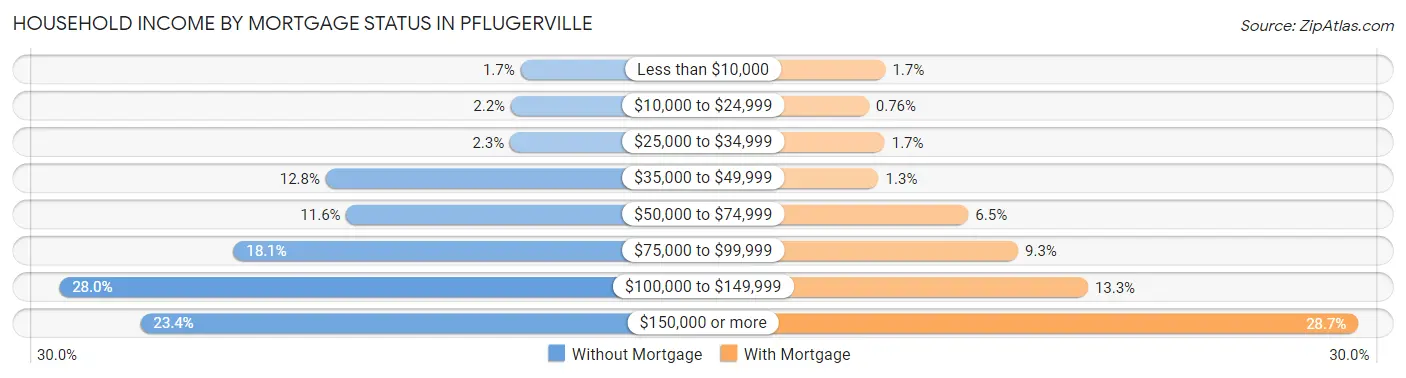
| Household Income | Without Mortgage | With Mortgage |
| Less than $10,000 | 69 (1.7%) | 224 (1.7%) |
| $10,000 to $24,999 | 92 (2.2%) | 99 (0.8%) |
| $25,000 to $34,999 | 94 (2.3%) | 219 (1.7%) |
| $35,000 to $49,999 | 532 (12.8%) | 173 (1.3%) |
| $50,000 to $74,999 | 483 (11.6%) | 845 (6.5%) |
| $75,000 to $99,999 | 752 (18.1%) | 1,216 (9.3%) |
| $100,000 to $149,999 | 1,166 (28.0%) | 1,738 (13.3%) |
| $150,000 or more | 973 (23.4%) | 3,760 (28.7%) |
| Total | 4,161 (100.0%) | 13,091 (100.0%) |
Property Value to Household Income Ratio in Pflugerville
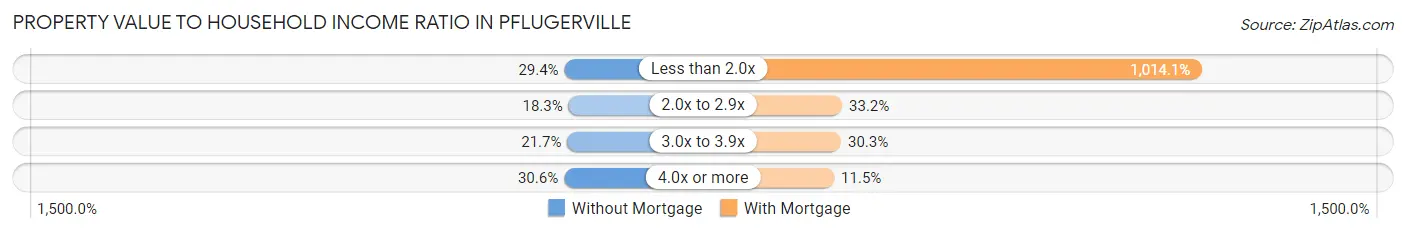
| Value-to-Income Ratio | Without Mortgage | With Mortgage |
| Less than 2.0x | 1,224 (29.4%) | 132,749 (1,014.0%) |
| 2.0x to 2.9x | 760 (18.3%) | 4,348 (33.2%) |
| 3.0x to 3.9x | 902 (21.7%) | 3,967 (30.3%) |
| 4.0x or more | 1,275 (30.6%) | 1,506 (11.5%) |
| Total | 4,161 (100.0%) | 13,091 (100.0%) |
Real Estate Taxes by Mortgage Status in Pflugerville
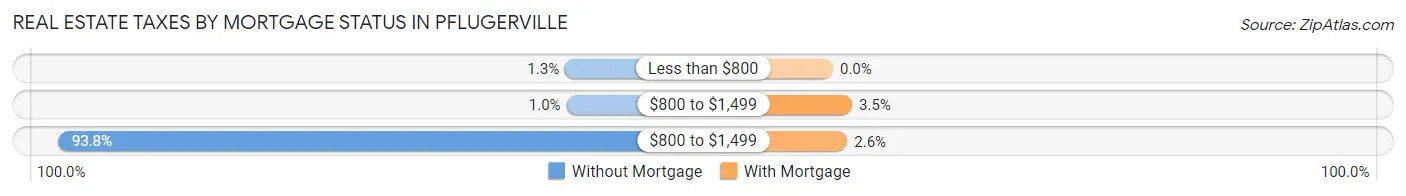
| Property Taxes | Without Mortgage | With Mortgage |
| Less than $800 | 54 (1.3%) | 0 (0.0%) |
| $800 to $1,499 | 43 (1.0%) | 455 (3.5%) |
| $800 to $1,499 | 3,901 (93.8%) | 342 (2.6%) |
| Total | 4,161 (100.0%) | 13,091 (100.0%) |
Health & Disability in Pflugerville
Health Insurance Coverage by Age in Pflugerville
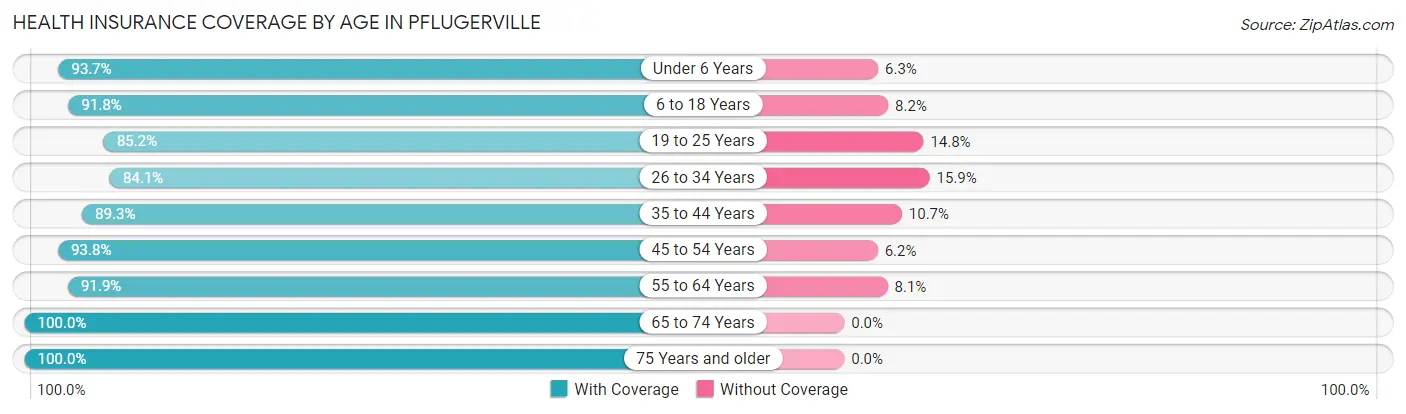
| Age Bracket | With Coverage | Without Coverage |
| Under 6 Years | 4,713 (93.7%) | 317 (6.3%) |
| 6 to 18 Years | 10,075 (91.8%) | 898 (8.2%) |
| 19 to 25 Years | 3,897 (85.2%) | 675 (14.8%) |
| 26 to 34 Years | 7,678 (84.1%) | 1,453 (15.9%) |
| 35 to 44 Years | 10,022 (89.3%) | 1,205 (10.7%) |
| 45 to 54 Years | 10,196 (93.8%) | 677 (6.2%) |
| 55 to 64 Years | 6,276 (91.9%) | 552 (8.1%) |
| 65 to 74 Years | 3,944 (100.0%) | 0 (0.0%) |
| 75 Years and older | 1,611 (100.0%) | 0 (0.0%) |
| Total | 58,412 (91.0%) | 5,777 (9.0%) |
Health Insurance Coverage by Citizenship Status in Pflugerville
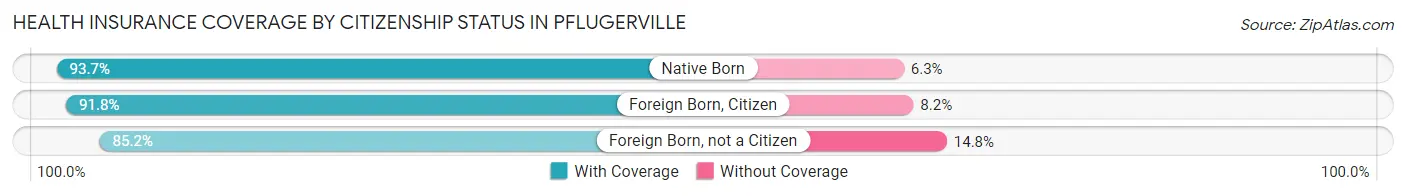
| Citizenship Status | With Coverage | Without Coverage |
| Native Born | 4,713 (93.7%) | 317 (6.3%) |
| Foreign Born, Citizen | 10,075 (91.8%) | 898 (8.2%) |
| Foreign Born, not a Citizen | 3,897 (85.2%) | 675 (14.8%) |
Health Insurance Coverage by Household Income in Pflugerville
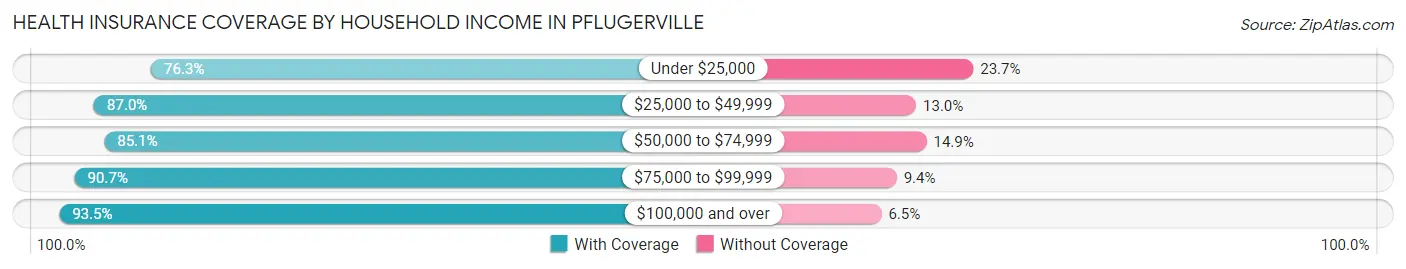
| Household Income | With Coverage | Without Coverage |
| Under $25,000 | 1,919 (76.3%) | 596 (23.7%) |
| $25,000 to $49,999 | 4,226 (87.0%) | 631 (13.0%) |
| $50,000 to $74,999 | 5,621 (85.1%) | 987 (14.9%) |
| $75,000 to $99,999 | 9,671 (90.6%) | 997 (9.3%) |
| $100,000 and over | 36,929 (93.5%) | 2,563 (6.5%) |
Public vs Private Health Insurance Coverage by Age in Pflugerville
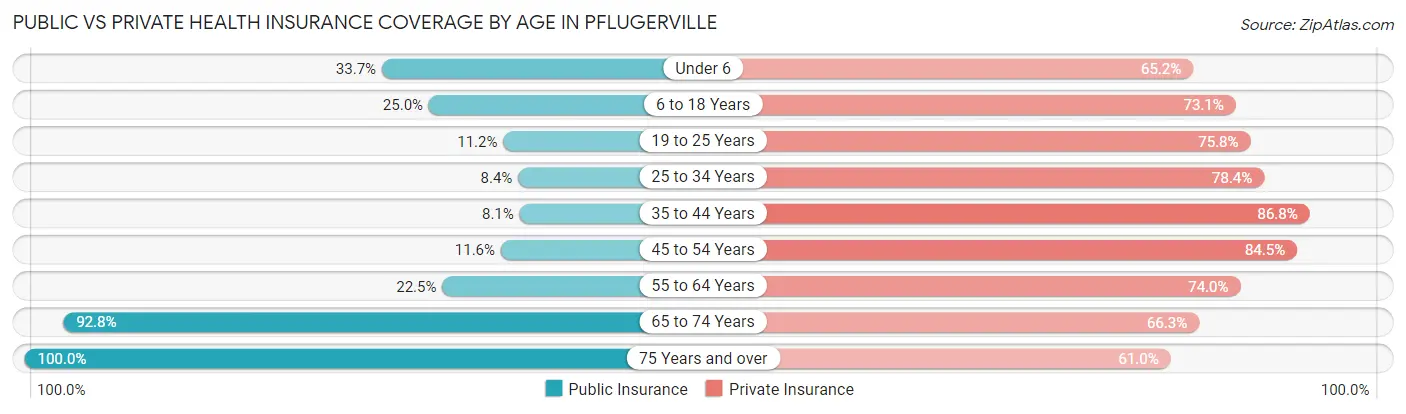
| Age Bracket | Public Insurance | Private Insurance |
| Under 6 | 1,694 (33.7%) | 3,279 (65.2%) |
| 6 to 18 Years | 2,738 (24.9%) | 8,021 (73.1%) |
| 19 to 25 Years | 510 (11.2%) | 3,467 (75.8%) |
| 25 to 34 Years | 765 (8.4%) | 7,157 (78.4%) |
| 35 to 44 Years | 912 (8.1%) | 9,747 (86.8%) |
| 45 to 54 Years | 1,261 (11.6%) | 9,188 (84.5%) |
| 55 to 64 Years | 1,534 (22.5%) | 5,050 (74.0%) |
| 65 to 74 Years | 3,661 (92.8%) | 2,615 (66.3%) |
| 75 Years and over | 1,611 (100.0%) | 983 (61.0%) |
| Total | 14,686 (22.9%) | 49,507 (77.1%) |
Disability Status by Sex by Age in Pflugerville
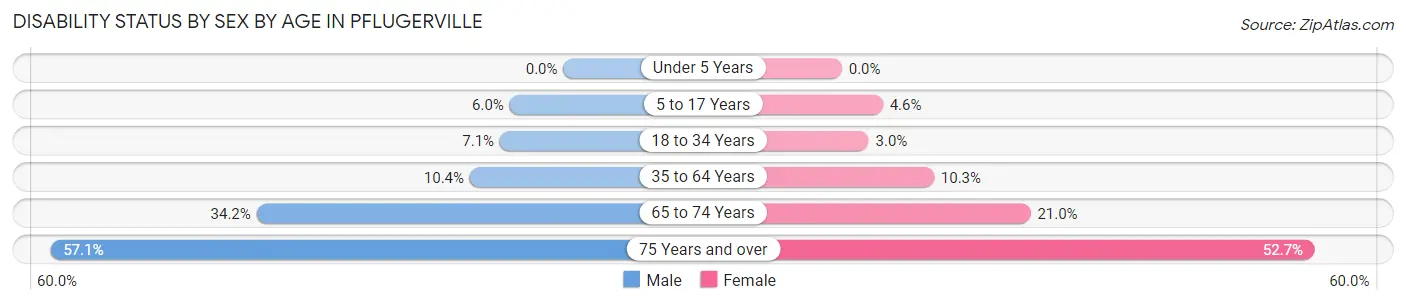
| Age Bracket | Male | Female |
| Under 5 Years | 0 (0.0%) | 0 (0.0%) |
| 5 to 17 Years | 332 (6.0%) | 260 (4.6%) |
| 18 to 34 Years | 466 (7.1%) | 225 (3.0%) |
| 35 to 64 Years | 1,559 (10.4%) | 1,429 (10.2%) |
| 65 to 74 Years | 510 (34.2%) | 515 (21.0%) |
| 75 Years and over | 272 (57.1%) | 598 (52.7%) |
Disability Class by Sex by Age in Pflugerville
Disability Class: Hearing Difficulty
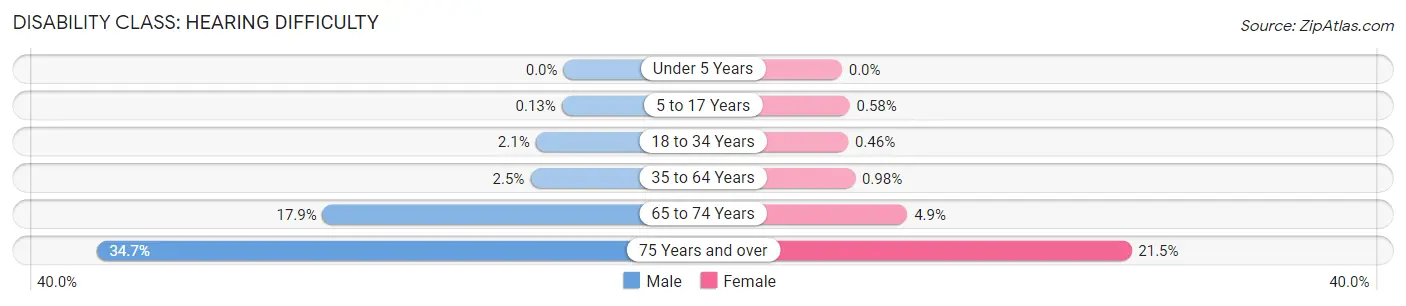
| Age Bracket | Male | Female |
| Under 5 Years | 0 (0.0%) | 0 (0.0%) |
| 5 to 17 Years | 7 (0.1%) | 33 (0.6%) |
| 18 to 34 Years | 137 (2.1%) | 35 (0.5%) |
| 35 to 64 Years | 369 (2.5%) | 137 (1.0%) |
| 65 to 74 Years | 267 (17.9%) | 119 (4.9%) |
| 75 Years and over | 165 (34.7%) | 244 (21.5%) |
Disability Class: Vision Difficulty
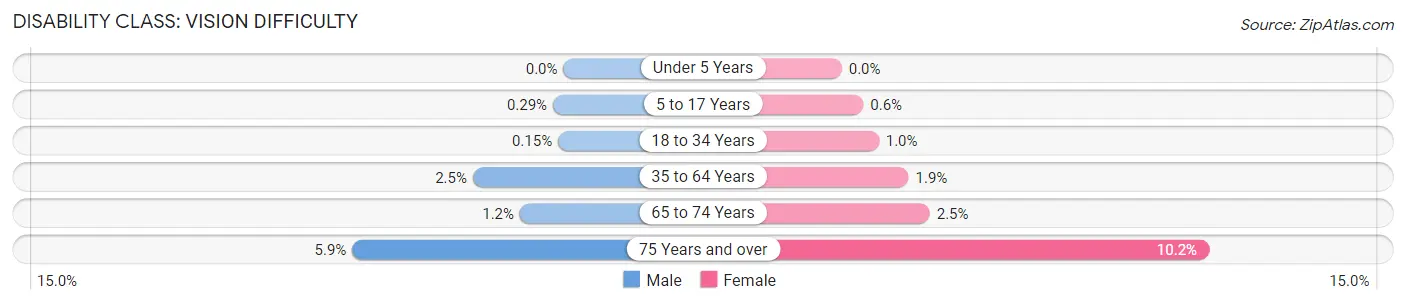
| Age Bracket | Male | Female |
| Under 5 Years | 0 (0.0%) | 0 (0.0%) |
| 5 to 17 Years | 16 (0.3%) | 34 (0.6%) |
| 18 to 34 Years | 10 (0.2%) | 78 (1.0%) |
| 35 to 64 Years | 377 (2.5%) | 260 (1.9%) |
| 65 to 74 Years | 18 (1.2%) | 60 (2.5%) |
| 75 Years and over | 28 (5.9%) | 116 (10.2%) |
Disability Class: Cognitive Difficulty
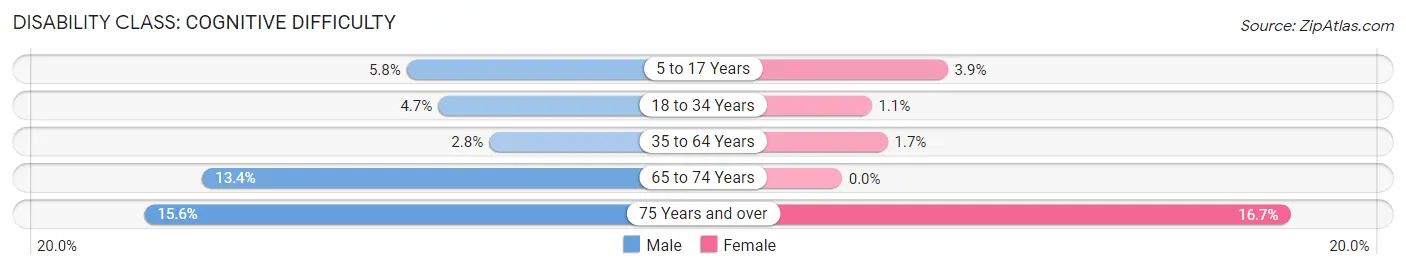
| Age Bracket | Male | Female |
| 5 to 17 Years | 323 (5.8%) | 224 (3.9%) |
| 18 to 34 Years | 307 (4.6%) | 83 (1.1%) |
| 35 to 64 Years | 414 (2.8%) | 237 (1.7%) |
| 65 to 74 Years | 200 (13.4%) | 0 (0.0%) |
| 75 Years and over | 74 (15.5%) | 189 (16.7%) |
Disability Class: Ambulatory Difficulty
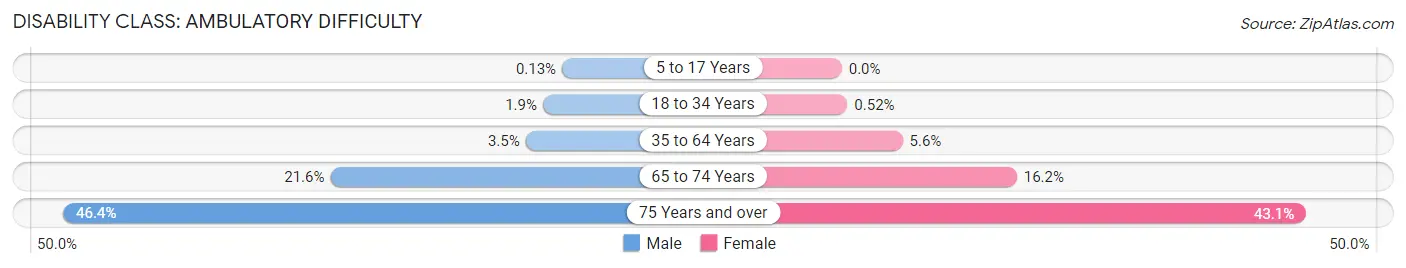
| Age Bracket | Male | Female |
| 5 to 17 Years | 7 (0.1%) | 0 (0.0%) |
| 18 to 34 Years | 126 (1.9%) | 39 (0.5%) |
| 35 to 64 Years | 526 (3.5%) | 787 (5.6%) |
| 65 to 74 Years | 323 (21.6%) | 398 (16.2%) |
| 75 Years and over | 221 (46.4%) | 489 (43.1%) |
Disability Class: Self-Care Difficulty
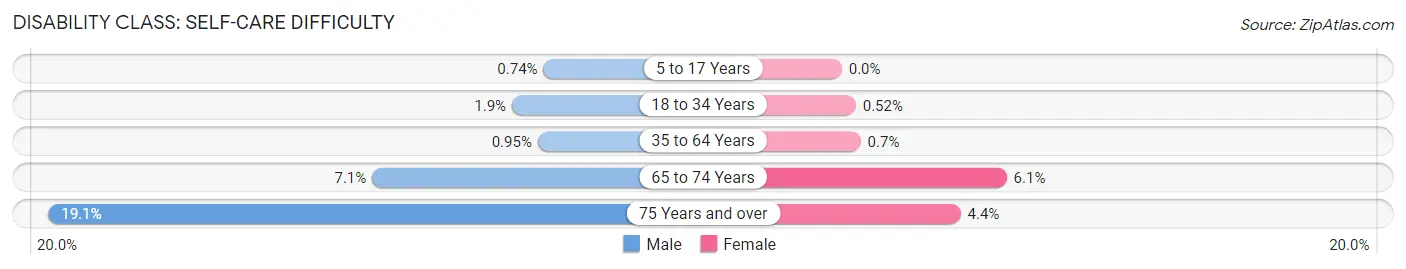
| Age Bracket | Male | Female |
| 5 to 17 Years | 41 (0.7%) | 0 (0.0%) |
| 18 to 34 Years | 126 (1.9%) | 39 (0.5%) |
| 35 to 64 Years | 142 (0.9%) | 97 (0.7%) |
| 65 to 74 Years | 106 (7.1%) | 150 (6.1%) |
| 75 Years and over | 91 (19.1%) | 50 (4.4%) |
Technology Access in Pflugerville
Computing Device Access in Pflugerville
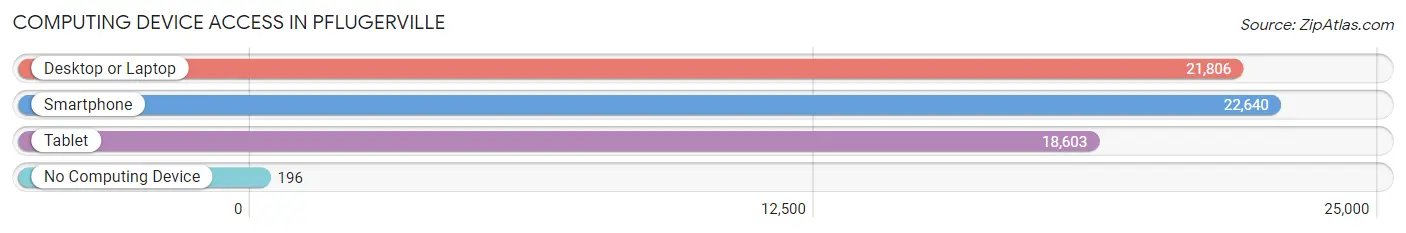
| Device Type | # Households | % Households |
| Desktop or Laptop | 21,806 | 91.9% |
| Smartphone | 22,640 | 95.5% |
| Tablet | 18,603 | 78.4% |
| No Computing Device | 196 | 0.8% |
| Total | 23,719 | 100.0% |
Internet Access in Pflugerville
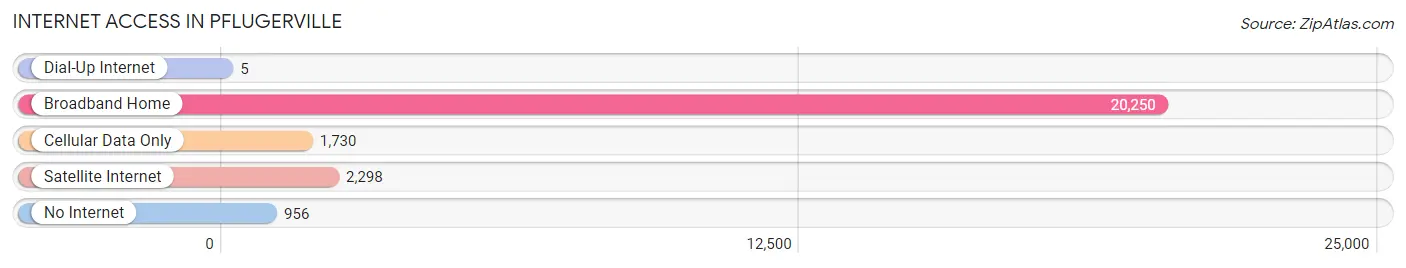
| Internet Type | # Households | % Households |
| Dial-Up Internet | 5 | 0.0% |
| Broadband Home | 20,250 | 85.4% |
| Cellular Data Only | 1,730 | 7.3% |
| Satellite Internet | 2,298 | 9.7% |
| No Internet | 956 | 4.0% |
| Total | 23,719 | 100.0% |
Pflugerville Summary
Pflugerville, Texas is a city located in Travis County, Texas, United States. It is a suburb of Austin, the state capital, and is part of the Austin-Round Rock metropolitan area. The population was 46,936 at the 2010 census, and estimated to be 63,359 in 2019.
History
Pflugerville was founded in 1860 by German immigrant Henry Pfluger, Sr. The city was named after him. The city was originally a farming community, and the first post office was established in 1871. The city was incorporated in 1965, and the first mayor was elected in 1966.
Geography
Pflugerville is located at 30°26′N 97°37′W (30.4333, -97.6167). It is situated in the Blackland Prairie region of Central Texas, and is located about 20 miles (32 km) northeast of Austin. The city has a total area of 22.2 square miles (57.5 km2), of which 22.1 square miles (57.3 km2) is land and 0.1 square miles (0.2 km2) is water.
Economy
Pflugerville is home to a variety of businesses, including technology, retail, and manufacturing. The city is home to several major employers, including Dell, Home Depot, and Amazon. The city also has a vibrant small business community, with many locally owned restaurants, shops, and services.
Demographics
As of the 2010 census, there were 46,936 people, 16,945 households, and 12,845 families residing in the city. The population density was 2,118.3 people per square mile (817.7/km2). The racial makeup of the city was 68.2% White, 11.3% African American, 0.5% Native American, 8.2% Asian, 0.1% Pacific Islander, 8.7% from other races, and 3.1% from two or more races. Hispanic or Latino of any race were 22.2% of the population.
In the city, the population was spread out, with 33.2% under the age of 18, 8.2% from 18 to 24, 33.2% from 25 to 44, 18.2% from 45 to 64, and 7.2% who were 65 years of age or older. The median age was 31.4 years. For every 100 females, there were 95.2 males. For every 100 females age 18 and over, there were 92.2 males.
The median income for a household in the city was $62,945, and the median income for a family was $71,945. Males had a median income of $50,945 versus $37,945 for females. The per capita income for the city was $27,945. About 6.2% of families and 8.2% of the population were below the poverty line, including 11.2% of those under age 18 and 6.2% of those age 65 or over.
Common Questions
What is Per Capita Income in Pflugerville?
Per Capita income in Pflugerville is $45,098.
What is the Median Family Income in Pflugerville?
Median Family Income in Pflugerville is $122,422.
What is the Median Household income in Pflugerville?
Median Household Income in Pflugerville is $111,151.
What is Income or Wage Gap in Pflugerville?
Income or Wage Gap in Pflugerville is 23.6%.
Women in Pflugerville earn 76.4 cents for every dollar earned by a man.
What is Family Income Deficit in Pflugerville?
Family Income Deficit in Pflugerville is $11,562.
Families that are below poverty line in Pflugerville earn $11,562 less on average than the poverty threshold level.
What is Inequality or Gini Index in Pflugerville?
Inequality or Gini Index in Pflugerville is 0.33.
What is the Total Population of Pflugerville?
Total Population of Pflugerville is 64,528.
What is the Total Male Population of Pflugerville?
Total Male Population of Pflugerville is 31,691.
What is the Total Female Population of Pflugerville?
Total Female Population of Pflugerville is 32,837.
What is the Ratio of Males per 100 Females in Pflugerville?
There are 96.51 Males per 100 Females in Pflugerville.
What is the Ratio of Females per 100 Males in Pflugerville?
There are 103.62 Females per 100 Males in Pflugerville.
What is the Median Population Age in Pflugerville?
Median Population Age in Pflugerville is 37.1 Years.
What is the Average Family Size in Pflugerville
Average Family Size in Pflugerville is 3.1 People.
What is the Average Household Size in Pflugerville
Average Household Size in Pflugerville is 2.7 People.
How Large is the Labor Force in Pflugerville?
There are 38,959 People in the Labor Forcein in Pflugerville.
What is the Percentage of People in the Labor Force in Pflugerville?
75.9% of People are in the Labor Force in Pflugerville.
What is the Unemployment Rate in Pflugerville?
Unemployment Rate in Pflugerville is 3.9%.