West Hollywood, CA Map & Demographics
West Hollywood Map
West Hollywood Overview
$79,645
PER CAPITA INCOME
$123,811
AVG FAMILY INCOME
$89,034
AVG HOUSEHOLD INCOME
15.7%
WAGE / INCOME GAP [ % ]
84.3¢/ $1
WAGE / INCOME GAP [ $ ]
0.51
INEQUALITY / GINI INDEX
35,358
TOTAL POPULATION
20,291
MALE POPULATION
15,067
FEMALE POPULATION
134.67
MALES / 100 FEMALES
74.25
FEMALES / 100 MALES
40.3
MEDIAN AGE
2.4
AVG FAMILY SIZE
1.5
AVG HOUSEHOLD SIZE
26,540
LABOR FORCE [ PEOPLE ]
78.0%
PERCENT IN LABOR FORCE
8.0%
UNEMPLOYMENT RATE
West Hollywood Zip Codes
Income in West Hollywood
Income Overview in West Hollywood
Per Capita Income in West Hollywood is $79,645, while median incomes of families and households are $123,811 and $89,034 respectively.
| Characteristic | Number | Measure |
| Per Capita Income | 35,358 | $79,645 |
| Median Family Income | 4,569 | $123,811 |
| Mean Family Income | 4,569 | $164,035 |
| Median Household Income | 22,836 | $89,034 |
| Mean Household Income | 22,836 | $121,960 |
| Income Deficit | 4,569 | $0 |
| Wage / Income Gap (%) | 35,358 | 15.67% |
| Wage / Income Gap ($) | 35,358 | 84.33¢ per $1 |
| Gini / Inequality Index | 35,358 | 0.51 |
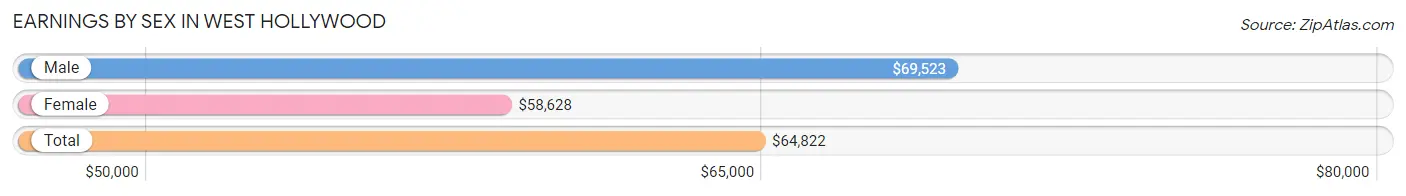
Earnings by Sex in West Hollywood
Average Earnings in West Hollywood are $64,822, $69,523 for men and $58,628 for women, a difference of 15.7%.
| Sex | Number | Average Earnings |
| Male | 16,192 (59.9%) | $69,523 |
| Female | 10,822 (40.1%) | $58,628 |
| Total | 27,014 (100.0%) | $64,822 |
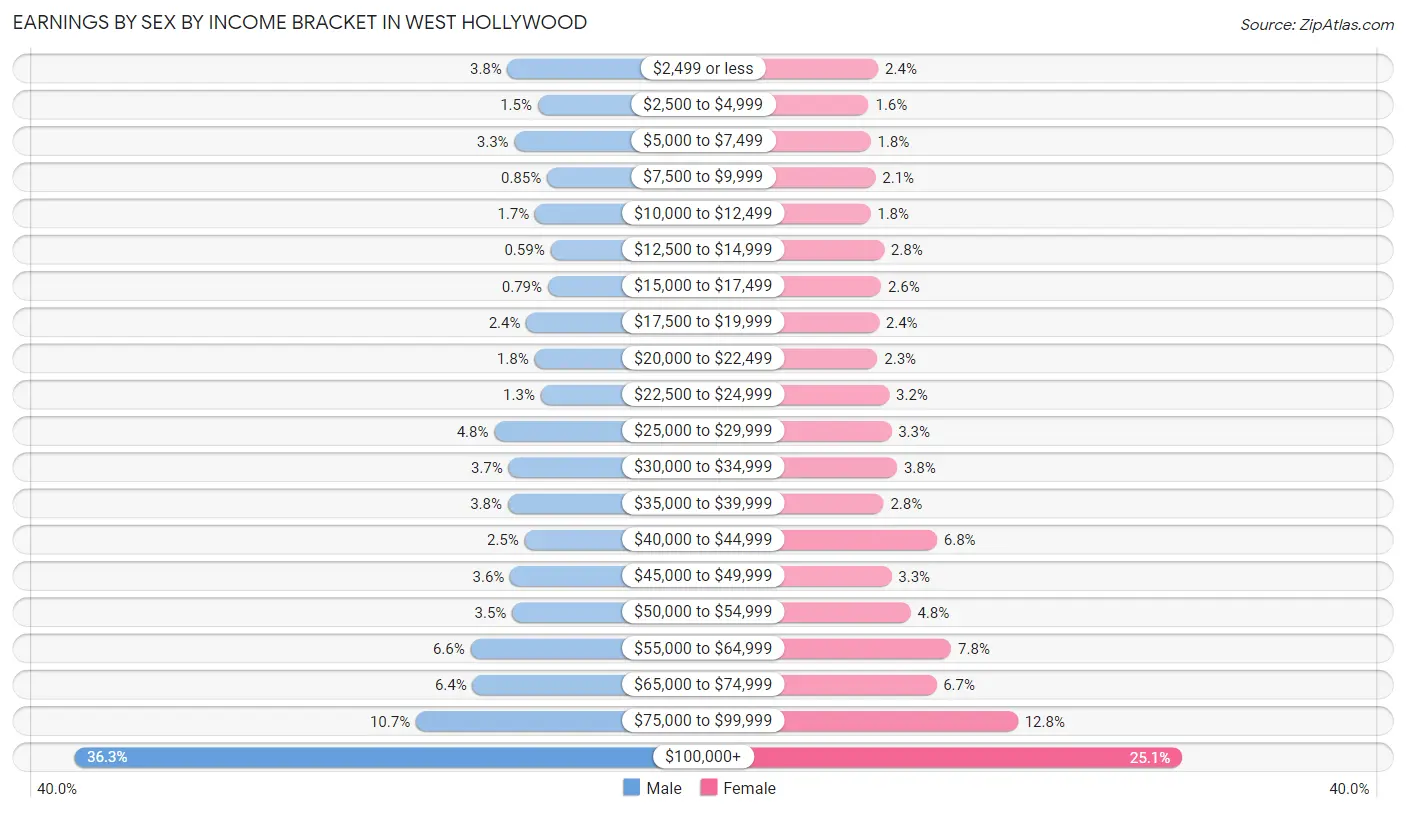
Earnings by Sex by Income Bracket in West Hollywood
The most common earnings brackets in West Hollywood are $100,000+ for men (5,876 | 36.3%) and $100,000+ for women (2,718 | 25.1%).
| Income | Male | Female |
| $2,499 or less | 616 (3.8%) | 254 (2.4%) |
| $2,500 to $4,999 | 250 (1.5%) | 176 (1.6%) |
| $5,000 to $7,499 | 533 (3.3%) | 193 (1.8%) |
| $7,500 to $9,999 | 137 (0.9%) | 232 (2.1%) |
| $10,000 to $12,499 | 282 (1.7%) | 190 (1.8%) |
| $12,500 to $14,999 | 96 (0.6%) | 301 (2.8%) |
| $15,000 to $17,499 | 128 (0.8%) | 277 (2.6%) |
| $17,500 to $19,999 | 388 (2.4%) | 260 (2.4%) |
| $20,000 to $22,499 | 290 (1.8%) | 248 (2.3%) |
| $22,500 to $24,999 | 213 (1.3%) | 343 (3.2%) |
| $25,000 to $29,999 | 778 (4.8%) | 360 (3.3%) |
| $30,000 to $34,999 | 604 (3.7%) | 407 (3.8%) |
| $35,000 to $39,999 | 613 (3.8%) | 298 (2.8%) |
| $40,000 to $44,999 | 410 (2.5%) | 731 (6.8%) |
| $45,000 to $49,999 | 584 (3.6%) | 361 (3.3%) |
| $50,000 to $54,999 | 561 (3.5%) | 516 (4.8%) |
| $55,000 to $64,999 | 1,065 (6.6%) | 846 (7.8%) |
| $65,000 to $74,999 | 1,041 (6.4%) | 725 (6.7%) |
| $75,000 to $99,999 | 1,727 (10.7%) | 1,386 (12.8%) |
| $100,000+ | 5,876 (36.3%) | 2,718 (25.1%) |
| Total | 16,192 (100.0%) | 10,822 (100.0%) |
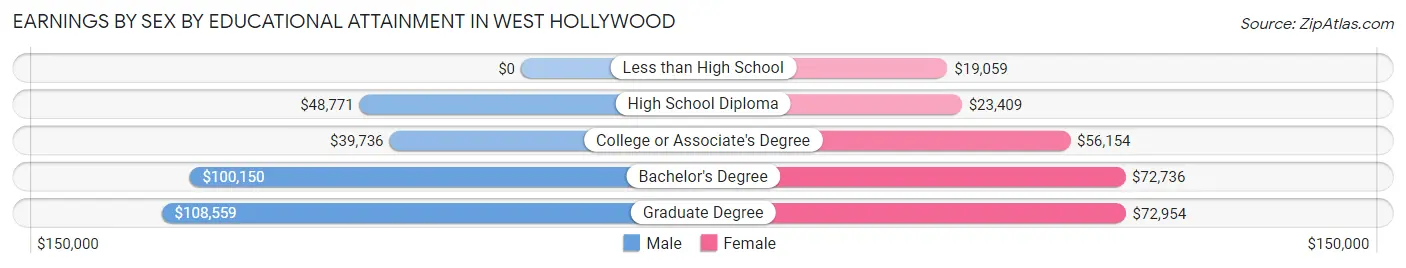
Earnings by Sex by Educational Attainment in West Hollywood
Average earnings in West Hollywood are $73,538 for men and $62,788 for women, a difference of 14.6%. Men with an educational attainment of graduate degree enjoy the highest average annual earnings of $108,559, while those with college or associate's degree education earn the least with $39,736. Women with an educational attainment of graduate degree earn the most with the average annual earnings of $72,954, while those with less than high school education have the smallest earnings of $19,059.
| Educational Attainment | Male Income | Female Income |
| Less than High School | - | - |
| High School Diploma | $48,771 | $23,409 |
| College or Associate's Degree | $39,736 | $56,154 |
| Bachelor's Degree | $100,150 | $72,736 |
| Graduate Degree | $108,559 | $72,954 |
| Total | $73,538 | $62,788 |
Family Income in West Hollywood
Family Income Brackets in West Hollywood
According to the West Hollywood family income data, there are 1,183 families falling into the $200,000+ income range, which is the most common income bracket and makes up 25.9% of all families. Conversely, the $10,000 to $14,999 income bracket is the least frequent group with only 23 families (0.5%) belonging to this category.
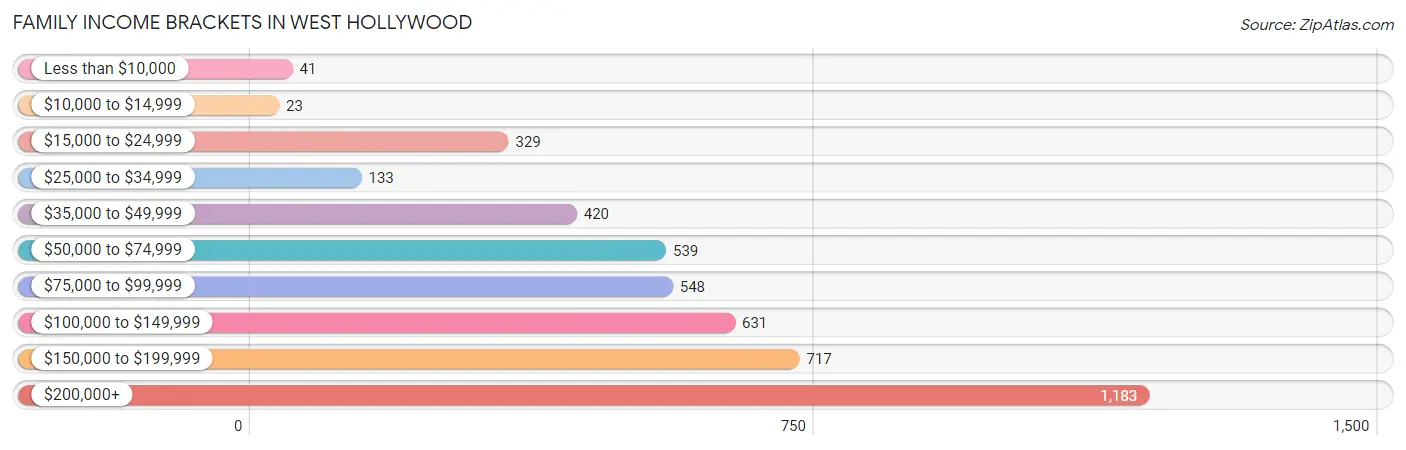
| Income Bracket | # Families | % Families |
| Less than $10,000 | 41 | 0.9% |
| $10,000 to $14,999 | 23 | 0.5% |
| $15,000 to $24,999 | 329 | 7.2% |
| $25,000 to $34,999 | 133 | 2.9% |
| $35,000 to $49,999 | 420 | 9.2% |
| $50,000 to $74,999 | 539 | 11.8% |
| $75,000 to $99,999 | 548 | 12.0% |
| $100,000 to $149,999 | 631 | 13.8% |
| $150,000 to $199,999 | 717 | 15.7% |
| $200,000+ | 1,183 | 25.9% |
Family Income by Famaliy Size in West Hollywood
3-person families (696 | 15.2%) account for the highest median family income in West Hollywood with $177,717 per family, while 3-person families (696 | 15.2%) have the highest median income of $59,239 per family member.
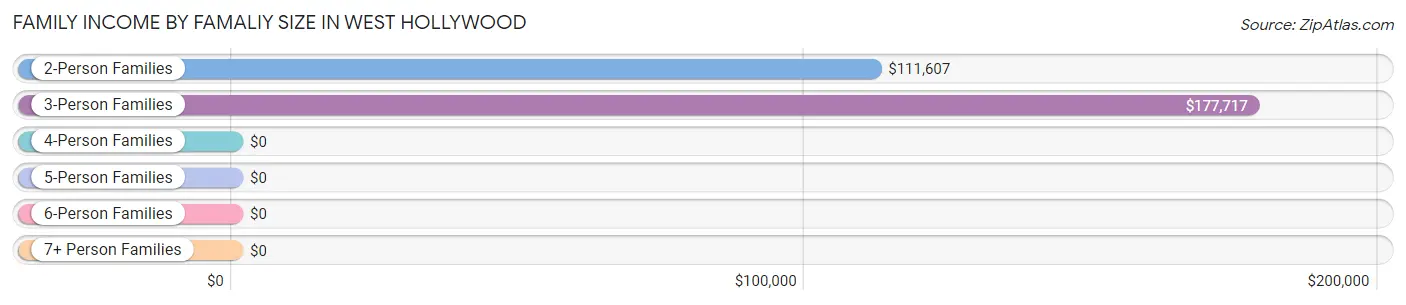
| Income Bracket | # Families | Median Income |
| 2-Person Families | 3,560 (77.9%) | $111,607 |
| 3-Person Families | 696 (15.2%) | $177,717 |
| 4-Person Families | 236 (5.2%) | $0 |
| 5-Person Families | 74 (1.6%) | $0 |
| 6-Person Families | 3 (0.1%) | $0 |
| 7+ Person Families | 0 (0.0%) | $0 |
| Total | 4,569 (100.0%) | $123,811 |
Family Income by Number of Earners in West Hollywood
The median family income in West Hollywood is $123,811, with families comprising 3+ earners (225) having the highest median family income of $198,671, while families with no earners (510) have the lowest median family income of $22,895, accounting for 4.9% and 11.2% of families, respectively.
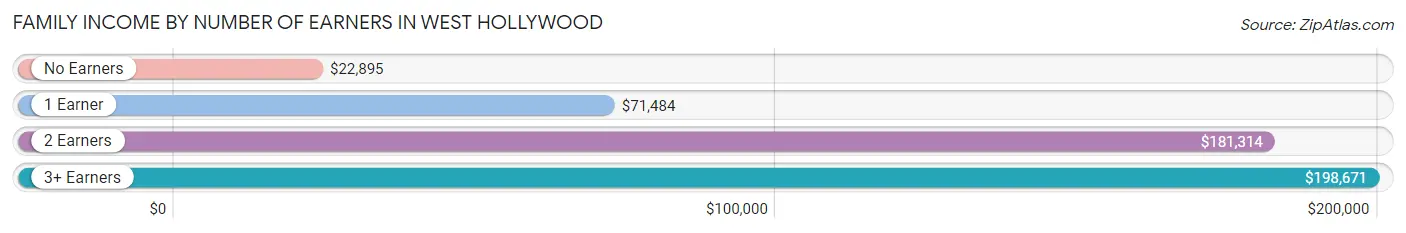
| Number of Earners | # Families | Median Income |
| No Earners | 510 (11.2%) | $22,895 |
| 1 Earner | 1,576 (34.5%) | $71,484 |
| 2 Earners | 2,258 (49.4%) | $181,314 |
| 3+ Earners | 225 (4.9%) | $198,671 |
| Total | 4,569 (100.0%) | $123,811 |
Household Income in West Hollywood
Household Income Brackets in West Hollywood
With 3,973 households falling in the category, the $100,000 to $149,999 income range is the most frequent in West Hollywood, accounting for 17.4% of all households. In contrast, only 1,187 households (5.2%) fall into the $10,000 to $14,999 income bracket, making it the least populous group.
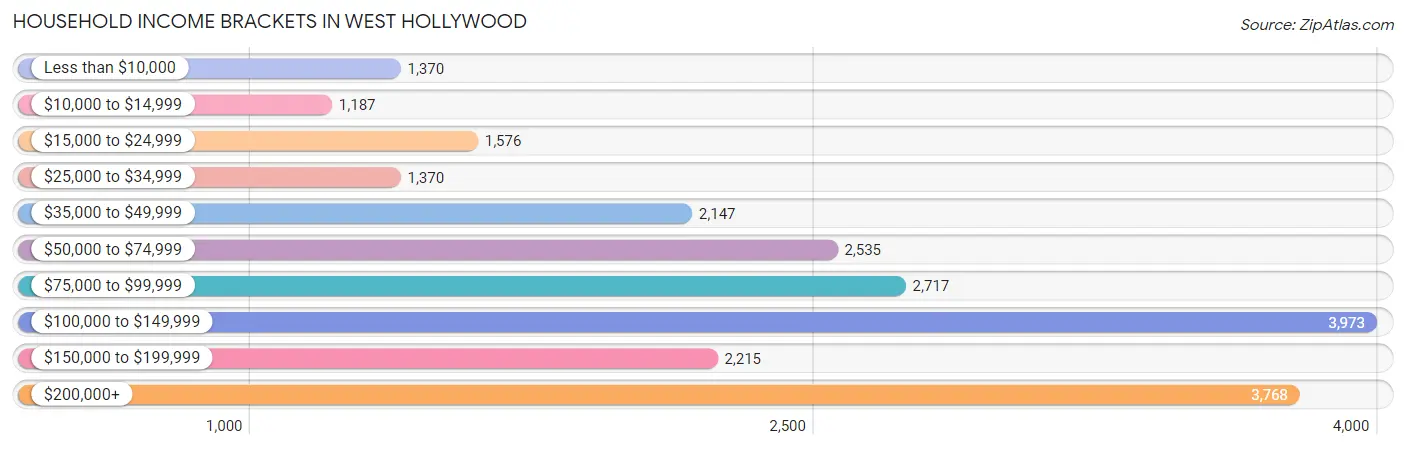
| Income Bracket | # Households | % Households |
| Less than $10,000 | 1,370 | 6.0% |
| $10,000 to $14,999 | 1,187 | 5.2% |
| $15,000 to $24,999 | 1,576 | 6.9% |
| $25,000 to $34,999 | 1,370 | 6.0% |
| $35,000 to $49,999 | 2,147 | 9.4% |
| $50,000 to $74,999 | 2,535 | 11.1% |
| $75,000 to $99,999 | 2,717 | 11.9% |
| $100,000 to $149,999 | 3,973 | 17.4% |
| $150,000 to $199,999 | 2,215 | 9.7% |
| $200,000+ | 3,768 | 16.5% |
Household Income by Householder Age in West Hollywood
The median household income in West Hollywood is $89,034, with the highest median household income of $109,900 found in the 25 to 44 years age bracket for the primary householder. A total of 10,399 households (45.5%) fall into this category. Meanwhile, the 65+ years age bracket for the primary householder has the lowest median household income of $39,050, with 3,787 households (16.6%) in this group.
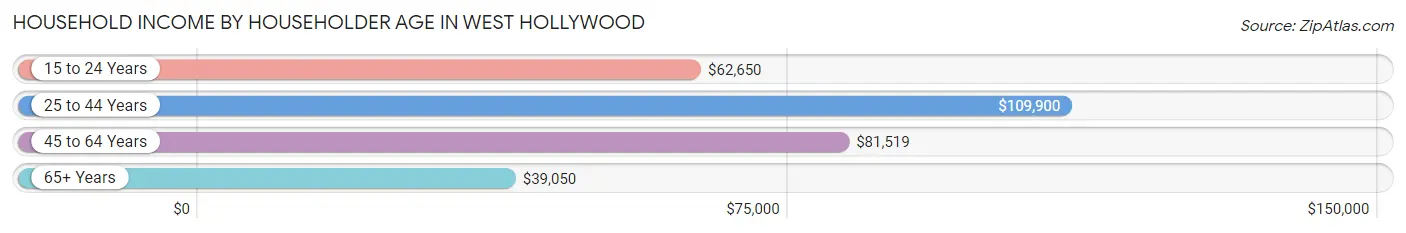
| Income Bracket | # Households | Median Income |
| 15 to 24 Years | 934 (4.1%) | $62,650 |
| 25 to 44 Years | 10,399 (45.5%) | $109,900 |
| 45 to 64 Years | 7,716 (33.8%) | $81,519 |
| 65+ Years | 3,787 (16.6%) | $39,050 |
| Total | 22,836 (100.0%) | $89,034 |
Poverty in West Hollywood
Income Below Poverty by Sex and Age in West Hollywood
With 11.2% poverty level for males and 14.9% for females among the residents of West Hollywood, 5 year old males and 12 to 14 year old females are the most vulnerable to poverty, with 11 males (42.3%) and 102 females (91.1%) in their respective age groups living below the poverty level.
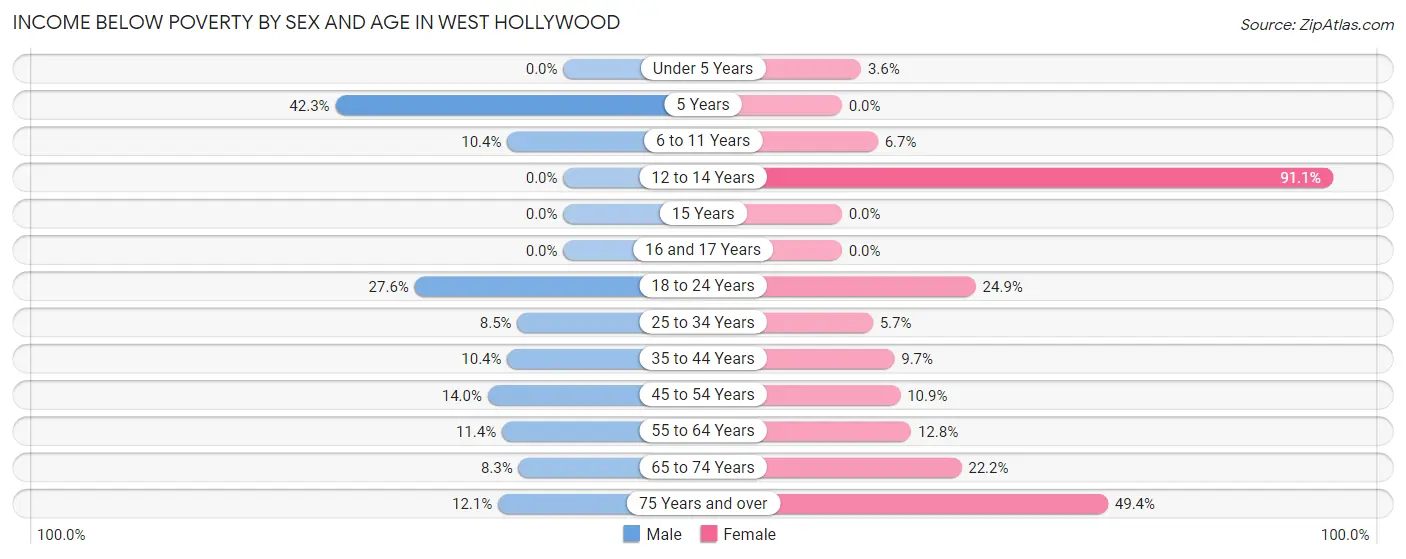
| Age Bracket | Male | Female |
| Under 5 Years | 0 (0.0%) | 15 (3.6%) |
| 5 Years | 11 (42.3%) | 0 (0.0%) |
| 6 to 11 Years | 26 (10.4%) | 3 (6.7%) |
| 12 to 14 Years | 0 (0.0%) | 102 (91.1%) |
| 15 Years | 0 (0.0%) | 0 (0.0%) |
| 16 and 17 Years | 0 (0.0%) | 0 (0.0%) |
| 18 to 24 Years | 236 (27.6%) | 281 (24.8%) |
| 25 to 34 Years | 412 (8.5%) | 304 (5.7%) |
| 35 to 44 Years | 436 (10.4%) | 213 (9.7%) |
| 45 to 54 Years | 441 (14.0%) | 184 (10.8%) |
| 55 to 64 Years | 443 (11.4%) | 174 (12.8%) |
| 65 to 74 Years | 133 (8.3%) | 313 (22.2%) |
| 75 Years and over | 121 (12.1%) | 651 (49.4%) |
| Total | 2,259 (11.2%) | 2,240 (14.9%) |
Income Above Poverty by Sex and Age in West Hollywood
According to the poverty statistics in West Hollywood, males aged under 5 years and females aged 5 years are the age groups that are most secure financially, with 100.0% of males and 100.0% of females in these age groups living above the poverty line.
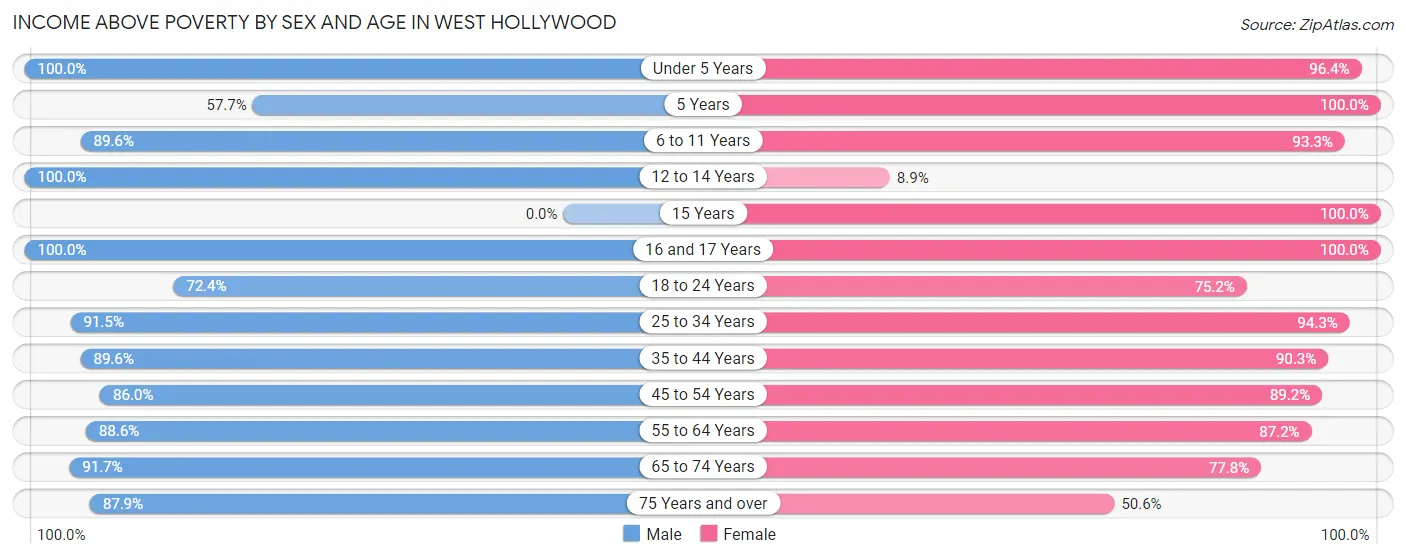
| Age Bracket | Male | Female |
| Under 5 Years | 297 (100.0%) | 406 (96.4%) |
| 5 Years | 15 (57.7%) | 24 (100.0%) |
| 6 to 11 Years | 224 (89.6%) | 42 (93.3%) |
| 12 to 14 Years | 119 (100.0%) | 10 (8.9%) |
| 15 Years | 0 (0.0%) | 38 (100.0%) |
| 16 and 17 Years | 34 (100.0%) | 22 (100.0%) |
| 18 to 24 Years | 619 (72.4%) | 850 (75.1%) |
| 25 to 34 Years | 4,424 (91.5%) | 4,991 (94.3%) |
| 35 to 44 Years | 3,762 (89.6%) | 1,973 (90.3%) |
| 45 to 54 Years | 2,705 (86.0%) | 1,512 (89.1%) |
| 55 to 64 Years | 3,447 (88.6%) | 1,181 (87.2%) |
| 65 to 74 Years | 1,468 (91.7%) | 1,098 (77.8%) |
| 75 Years and over | 877 (87.9%) | 667 (50.6%) |
| Total | 17,991 (88.8%) | 12,814 (85.1%) |
Income Below Poverty Among Married-Couple Families in West Hollywood
The poverty statistics for married-couple families in West Hollywood show that 0.8% or 28 of the total 3,451 families live below the poverty line. Families with 3 or 4 children have the highest poverty rate of 5.4%, comprising of 3 families. On the other hand, families with no children have the lowest poverty rate of 0.5%, which includes 15 families.
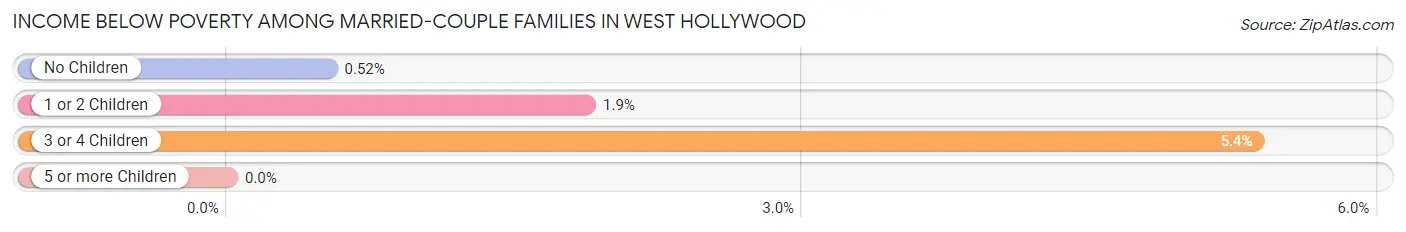
| Children | Above Poverty | Below Poverty |
| No Children | 2,844 (99.5%) | 15 (0.5%) |
| 1 or 2 Children | 526 (98.1%) | 10 (1.9%) |
| 3 or 4 Children | 53 (94.6%) | 3 (5.4%) |
| 5 or more Children | 0 (0.0%) | 0 (0.0%) |
| Total | 3,423 (99.2%) | 28 (0.8%) |
Income Below Poverty Among Single-Parent Households in West Hollywood
According to the poverty data in West Hollywood, 13.0% or 36 single-father households and 17.5% or 147 single-mother households are living below the poverty line. Among single-father households, those with 1 or 2 children have the highest poverty rate, with 21 households (40.4%) experiencing poverty. Likewise, among single-mother households, those with 1 or 2 children have the highest poverty rate, with 90 households (33.1%) falling below the poverty line.
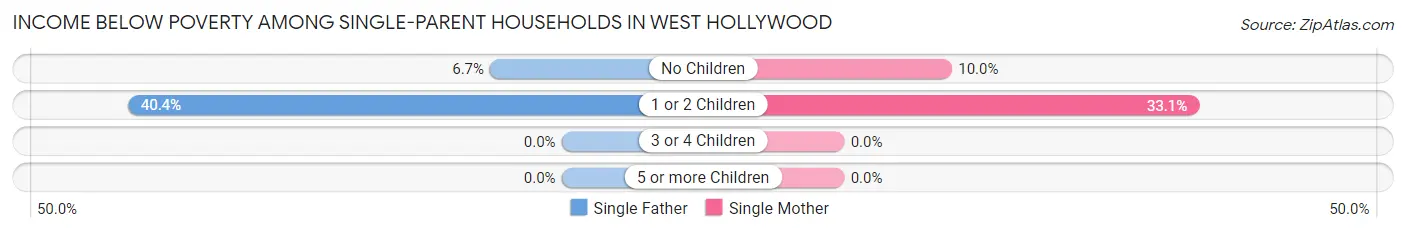
| Children | Single Father | Single Mother |
| No Children | 15 (6.7%) | 57 (10.0%) |
| 1 or 2 Children | 21 (40.4%) | 90 (33.1%) |
| 3 or 4 Children | 0 (0.0%) | 0 (0.0%) |
| 5 or more Children | 0 (0.0%) | 0 (0.0%) |
| Total | 36 (13.0%) | 147 (17.5%) |
Income Below Poverty Among Married-Couple vs Single-Parent Households in West Hollywood
The poverty data for West Hollywood shows that 28 of the married-couple family households (0.8%) and 183 of the single-parent households (16.4%) are living below the poverty level. Within the married-couple family households, those with 3 or 4 children have the highest poverty rate, with 3 households (5.4%) falling below the poverty line. Among the single-parent households, those with 1 or 2 children have the highest poverty rate, with 111 household (34.3%) living below poverty.
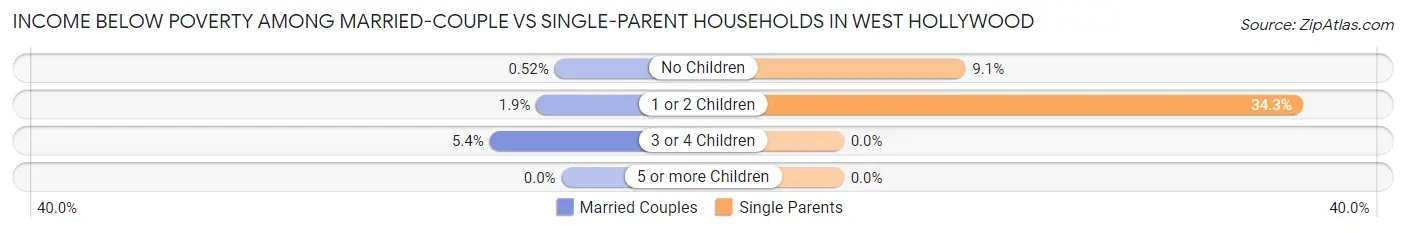
| Children | Married-Couple Families | Single-Parent Households |
| No Children | 15 (0.5%) | 72 (9.1%) |
| 1 or 2 Children | 10 (1.9%) | 111 (34.3%) |
| 3 or 4 Children | 3 (5.4%) | 0 (0.0%) |
| 5 or more Children | 0 (0.0%) | 0 (0.0%) |
| Total | 28 (0.8%) | 183 (16.4%) |
Race in West Hollywood
The most populous races in West Hollywood are White / Caucasian (26,744 | 75.6%), Hispanic or Latino (4,679 | 13.2%), and Two or more Races (4,076 | 11.5%).
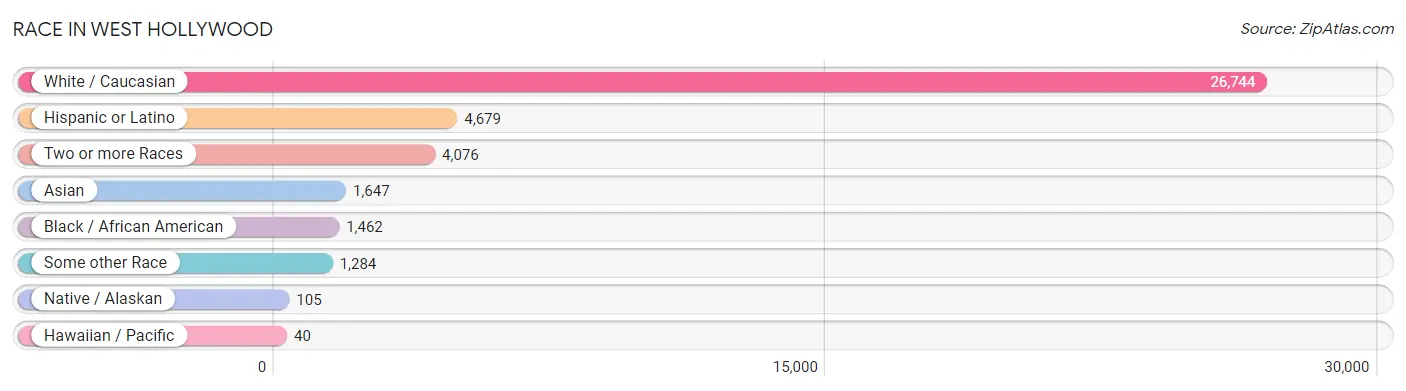
| Race | # Population | % Population |
| Asian | 1,647 | 4.7% |
| Black / African American | 1,462 | 4.1% |
| Hawaiian / Pacific | 40 | 0.1% |
| Hispanic or Latino | 4,679 | 13.2% |
| Native / Alaskan | 105 | 0.3% |
| White / Caucasian | 26,744 | 75.6% |
| Two or more Races | 4,076 | 11.5% |
| Some other Race | 1,284 | 3.6% |
| Total | 35,358 | 100.0% |
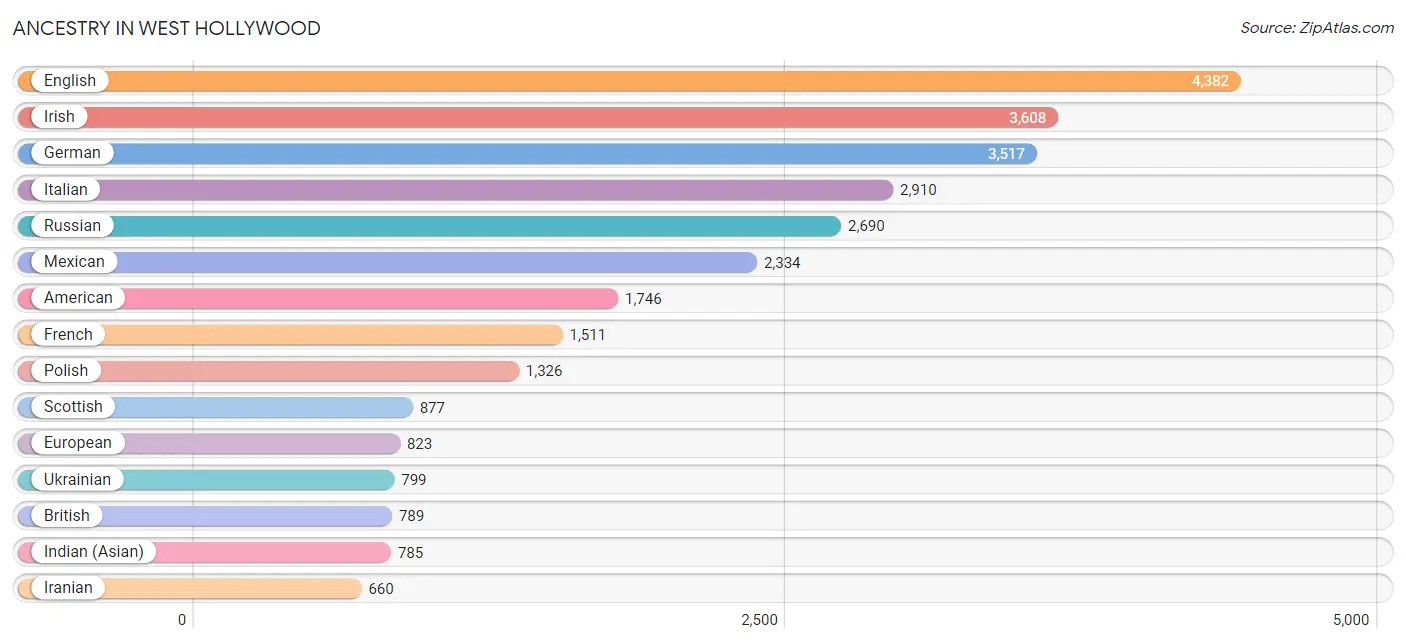
Ancestry in West Hollywood
The most populous ancestries reported in West Hollywood are English (4,382 | 12.4%), Irish (3,608 | 10.2%), German (3,517 | 10.0%), Italian (2,910 | 8.2%), and Russian (2,690 | 7.6%), together accounting for 48.4% of all West Hollywood residents.
| Ancestry | # Population | % Population |
| African | 32 | 0.1% |
| Alsatian | 19 | 0.1% |
| American | 1,746 | 4.9% |
| Apache | 26 | 0.1% |
| Arab | 509 | 1.4% |
| Argentinean | 120 | 0.3% |
| Armenian | 63 | 0.2% |
| Australian | 61 | 0.2% |
| Austrian | 262 | 0.7% |
| Bhutanese | 321 | 0.9% |
| Blackfeet | 24 | 0.1% |
| Bolivian | 10 | 0.0% |
| Brazilian | 68 | 0.2% |
| British | 789 | 2.2% |
| British West Indian | 33 | 0.1% |
| Bulgarian | 11 | 0.0% |
| Burmese | 314 | 0.9% |
| Canadian | 396 | 1.1% |
| Celtic | 1 | 0.0% |
| Central American | 561 | 1.6% |
| Central American Indian | 36 | 0.1% |
| Cherokee | 180 | 0.5% |
| Chilean | 67 | 0.2% |
| Choctaw | 17 | 0.1% |
| Colombian | 181 | 0.5% |
| Croatian | 114 | 0.3% |
| Cuban | 31 | 0.1% |
| Czech | 205 | 0.6% |
| Danish | 64 | 0.2% |
| Dominican | 1 | 0.0% |
| Dutch | 514 | 1.5% |
| Eastern European | 596 | 1.7% |
| Egyptian | 83 | 0.2% |
| English | 4,382 | 12.4% |
| European | 823 | 2.3% |
| Filipino | 48 | 0.1% |
| Finnish | 68 | 0.2% |
| French | 1,511 | 4.3% |
| French Canadian | 181 | 0.5% |
| German | 3,517 | 10.0% |
| Greek | 272 | 0.8% |
| Guatemalan | 347 | 1.0% |
| Guyanese | 25 | 0.1% |
| Honduran | 36 | 0.1% |
| Hungarian | 213 | 0.6% |
| Indian (Asian) | 785 | 2.2% |
| Iranian | 660 | 1.9% |
| Irish | 3,608 | 10.2% |
| Israeli | 474 | 1.3% |
| Italian | 2,910 | 8.2% |
| Jamaican | 50 | 0.1% |
| Japanese | 17 | 0.1% |
| Jordanian | 22 | 0.1% |
| Korean | 635 | 1.8% |
| Laotian | 50 | 0.1% |
| Latvian | 16 | 0.1% |
| Lebanese | 160 | 0.4% |
| Liberian | 5 | 0.0% |
| Lithuanian | 135 | 0.4% |
| Macedonian | 20 | 0.1% |
| Mexican | 2,334 | 6.6% |
| Mexican American Indian | 21 | 0.1% |
| Native Hawaiian | 117 | 0.3% |
| Navajo | 27 | 0.1% |
| Nicaraguan | 14 | 0.0% |
| Nigerian | 19 | 0.1% |
| Northern European | 115 | 0.3% |
| Norwegian | 341 | 1.0% |
| Palestinian | 50 | 0.1% |
| Peruvian | 45 | 0.1% |
| Polish | 1,326 | 3.7% |
| Portuguese | 199 | 0.6% |
| Puerto Rican | 245 | 0.7% |
| Romanian | 324 | 0.9% |
| Russian | 2,690 | 7.6% |
| Salvadoran | 164 | 0.5% |
| Scandinavian | 36 | 0.1% |
| Scotch-Irish | 211 | 0.6% |
| Scottish | 877 | 2.5% |
| Serbian | 171 | 0.5% |
| Slovak | 193 | 0.5% |
| South African | 53 | 0.2% |
| South American | 494 | 1.4% |
| South American Indian | 13 | 0.0% |
| Soviet Union | 43 | 0.1% |
| Spaniard | 170 | 0.5% |
| Spanish | 409 | 1.2% |
| Sri Lankan | 74 | 0.2% |
| Subsaharan African | 139 | 0.4% |
| Swedish | 557 | 1.6% |
| Swiss | 49 | 0.1% |
| Syrian | 112 | 0.3% |
| Thai | 426 | 1.2% |
| Trinidadian and Tobagonian | 32 | 0.1% |
| Turkish | 172 | 0.5% |
| Ugandan | 30 | 0.1% |
| Ukrainian | 799 | 2.3% |
| Venezuelan | 71 | 0.2% |
| Welsh | 185 | 0.5% | View All 99 Rows |
Immigrants in West Hollywood
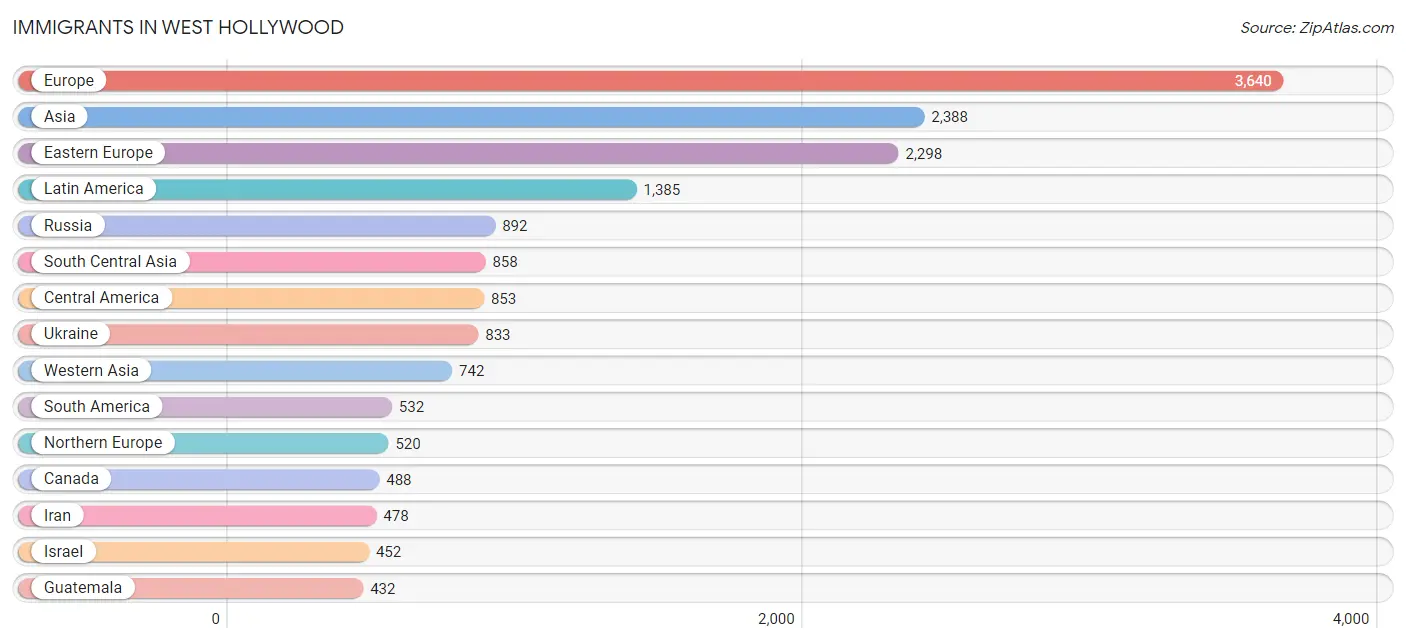
The most numerous immigrant groups reported in West Hollywood came from Europe (3,640 | 10.3%), Asia (2,388 | 6.8%), Eastern Europe (2,298 | 6.5%), Latin America (1,385 | 3.9%), and Russia (892 | 2.5%), together accounting for 30.0% of all West Hollywood residents.
| Immigration Origin | # Population | % Population |
| Afghanistan | 36 | 0.1% |
| Africa | 161 | 0.5% |
| Argentina | 136 | 0.4% |
| Armenia | 6 | 0.0% |
| Asia | 2,388 | 6.8% |
| Australia | 254 | 0.7% |
| Azores | 1 | 0.0% |
| Belarus | 104 | 0.3% |
| Belgium | 14 | 0.0% |
| Bolivia | 16 | 0.1% |
| Brazil | 120 | 0.3% |
| Bulgaria | 33 | 0.1% |
| Cambodia | 10 | 0.0% |
| Canada | 488 | 1.4% |
| Central America | 853 | 2.4% |
| Chile | 101 | 0.3% |
| China | 262 | 0.7% |
| Colombia | 102 | 0.3% |
| Czechoslovakia | 24 | 0.1% |
| Denmark | 19 | 0.1% |
| Eastern Africa | 13 | 0.0% |
| Eastern Asia | 425 | 1.2% |
| Eastern Europe | 2,298 | 6.5% |
| Egypt | 29 | 0.1% |
| El Salvador | 59 | 0.2% |
| England | 323 | 0.9% |
| Europe | 3,640 | 10.3% |
| France | 151 | 0.4% |
| Germany | 207 | 0.6% |
| Guatemala | 432 | 1.2% |
| Hong Kong | 17 | 0.1% |
| Hungary | 32 | 0.1% |
| India | 59 | 0.2% |
| Indonesia | 31 | 0.1% |
| Iran | 478 | 1.3% |
| Israel | 452 | 1.3% |
| Italy | 100 | 0.3% |
| Japan | 24 | 0.1% |
| Kazakhstan | 30 | 0.1% |
| Korea | 139 | 0.4% |
| Latin America | 1,385 | 3.9% |
| Lebanon | 46 | 0.1% |
| Mexico | 348 | 1.0% |
| Micronesia | 32 | 0.1% |
| Moldova | 73 | 0.2% |
| Morocco | 39 | 0.1% |
| Netherlands | 28 | 0.1% |
| Nicaragua | 14 | 0.0% |
| Northern Africa | 78 | 0.2% |
| Northern Europe | 520 | 1.5% |
| Oceania | 332 | 0.9% |
| Pakistan | 34 | 0.1% |
| Peru | 19 | 0.1% |
| Philippines | 285 | 0.8% |
| Poland | 46 | 0.1% |
| Portugal | 1 | 0.0% |
| Romania | 88 | 0.3% |
| Russia | 892 | 2.5% |
| Saudi Arabia | 58 | 0.2% |
| South Africa | 70 | 0.2% |
| South America | 532 | 1.5% |
| South Central Asia | 858 | 2.4% |
| South Eastern Asia | 363 | 1.0% |
| Southern Europe | 384 | 1.1% |
| Spain | 283 | 0.8% |
| Sweden | 26 | 0.1% |
| Switzerland | 13 | 0.0% |
| Taiwan | 77 | 0.2% |
| Turkey | 112 | 0.3% |
| Ukraine | 833 | 2.4% |
| Uruguay | 20 | 0.1% |
| Uzbekistan | 221 | 0.6% |
| Venezuela | 18 | 0.1% |
| Vietnam | 37 | 0.1% |
| Western Asia | 742 | 2.1% |
| Western Europe | 413 | 1.2% | View All 76 Rows |
Sex and Age in West Hollywood
Sex and Age in West Hollywood
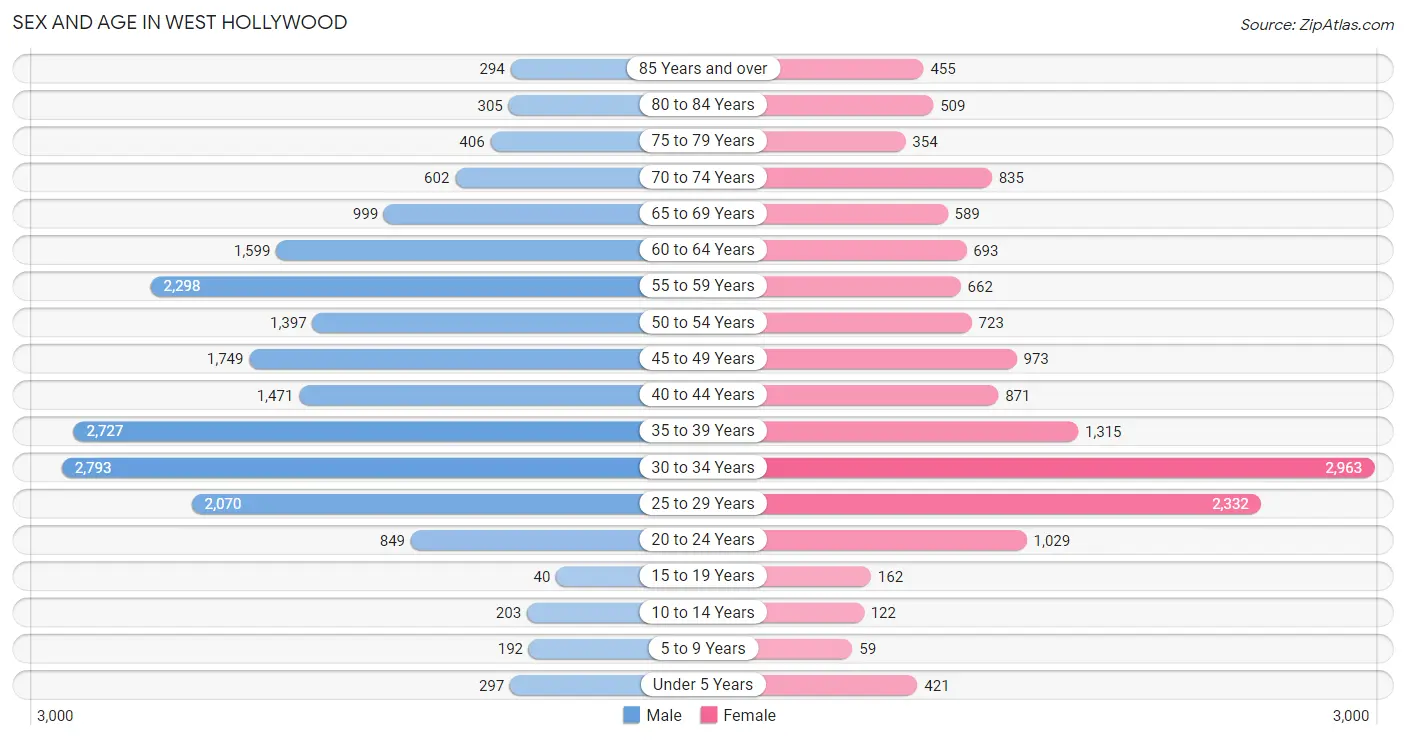
The most populous age groups in West Hollywood are 30 to 34 Years (2,793 | 13.8%) for men and 30 to 34 Years (2,963 | 19.7%) for women.
| Age Bracket | Male | Female |
| Under 5 Years | 297 (1.5%) | 421 (2.8%) |
| 5 to 9 Years | 192 (0.9%) | 59 (0.4%) |
| 10 to 14 Years | 203 (1.0%) | 122 (0.8%) |
| 15 to 19 Years | 40 (0.2%) | 162 (1.1%) |
| 20 to 24 Years | 849 (4.2%) | 1,029 (6.8%) |
| 25 to 29 Years | 2,070 (10.2%) | 2,332 (15.5%) |
| 30 to 34 Years | 2,793 (13.8%) | 2,963 (19.7%) |
| 35 to 39 Years | 2,727 (13.4%) | 1,315 (8.7%) |
| 40 to 44 Years | 1,471 (7.2%) | 871 (5.8%) |
| 45 to 49 Years | 1,749 (8.6%) | 973 (6.5%) |
| 50 to 54 Years | 1,397 (6.9%) | 723 (4.8%) |
| 55 to 59 Years | 2,298 (11.3%) | 662 (4.4%) |
| 60 to 64 Years | 1,599 (7.9%) | 693 (4.6%) |
| 65 to 69 Years | 999 (4.9%) | 589 (3.9%) |
| 70 to 74 Years | 602 (3.0%) | 835 (5.5%) |
| 75 to 79 Years | 406 (2.0%) | 354 (2.4%) |
| 80 to 84 Years | 305 (1.5%) | 509 (3.4%) |
| 85 Years and over | 294 (1.5%) | 455 (3.0%) |
| Total | 20,291 (100.0%) | 15,067 (100.0%) |
Families and Households in West Hollywood
Median Family Size in West Hollywood
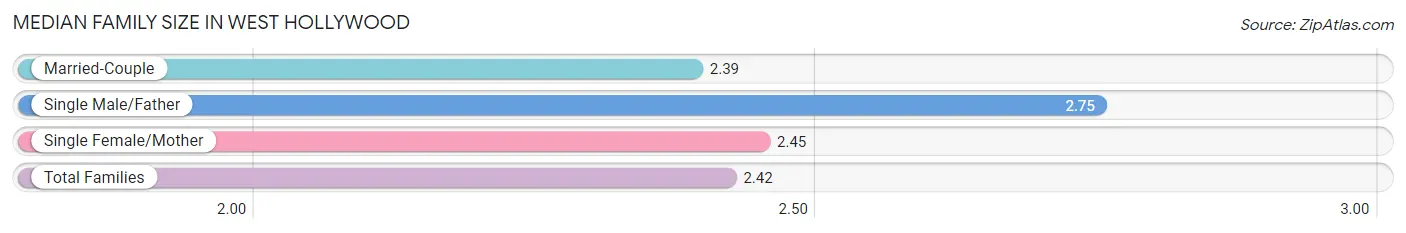
The median family size in West Hollywood is 2.42 persons per family, with single male/father families (277 | 6.1%) accounting for the largest median family size of 2.75 persons per family. On the other hand, married-couple families (3,451 | 75.5%) represent the smallest median family size with 2.39 persons per family.
| Family Type | # Families | Family Size |
| Married-Couple | 3,451 (75.5%) | 2.39 |
| Single Male/Father | 277 (6.1%) | 2.75 |
| Single Female/Mother | 841 (18.4%) | 2.45 |
| Total Families | 4,569 (100.0%) | 2.42 |
Median Household Size in West Hollywood
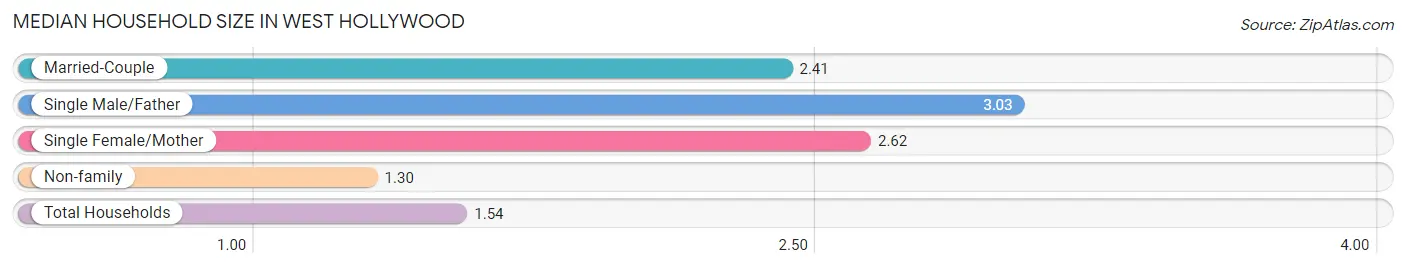
The median household size in West Hollywood is 1.54 persons per household, with single male/father households (277 | 1.2%) accounting for the largest median household size of 3.03 persons per household. non-family households (18,267 | 80.0%) represent the smallest median household size with 1.30 persons per household.
| Household Type | # Households | Household Size |
| Married-Couple | 3,451 (15.1%) | 2.41 |
| Single Male/Father | 277 (1.2%) | 3.03 |
| Single Female/Mother | 841 (3.7%) | 2.62 |
| Non-family | 18,267 (80.0%) | 1.30 |
| Total Households | 22,836 (100.0%) | 1.54 |
Household Size by Marriage Status in West Hollywood
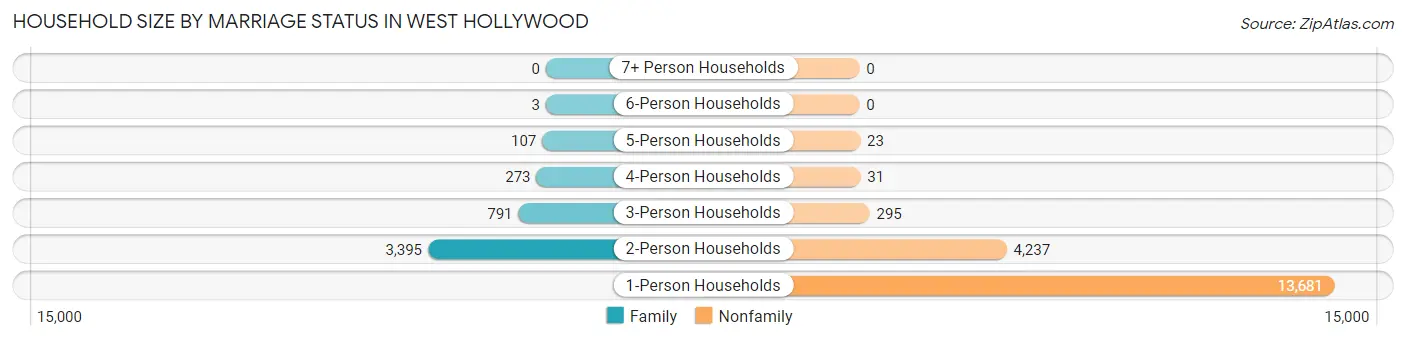
Out of a total of 22,836 households in West Hollywood, 4,569 (20.0%) are family households, while 18,267 (80.0%) are nonfamily households. The most numerous type of family households are 2-person households, comprising 3,395, and the most common type of nonfamily households are 1-person households, comprising 13,681.
| Household Size | Family Households | Nonfamily Households |
| 1-Person Households | - | 13,681 (59.9%) |
| 2-Person Households | 3,395 (14.9%) | 4,237 (18.5%) |
| 3-Person Households | 791 (3.5%) | 295 (1.3%) |
| 4-Person Households | 273 (1.2%) | 31 (0.1%) |
| 5-Person Households | 107 (0.5%) | 23 (0.1%) |
| 6-Person Households | 3 (0.0%) | 0 (0.0%) |
| 7+ Person Households | 0 (0.0%) | 0 (0.0%) |
| Total | 4,569 (20.0%) | 18,267 (80.0%) |
Female Fertility in West Hollywood
Fertility by Age in West Hollywood
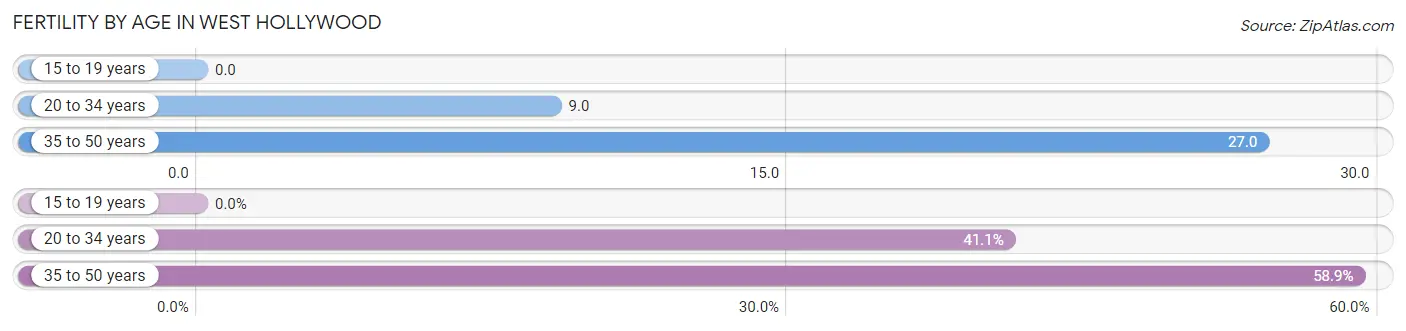
Average fertility rate in West Hollywood is 15.0 births per 1,000 women. Women in the age bracket of 35 to 50 years have the highest fertility rate with 27.0 births per 1,000 women. Women in the age bracket of 35 to 50 years acount for 58.9% of all women with births.
| Age Bracket | Women with Births | Births / 1,000 Women |
| 15 to 19 years | 0 (0.0%) | 0.0 |
| 20 to 34 years | 60 (41.1%) | 9.0 |
| 35 to 50 years | 86 (58.9%) | 27.0 |
| Total | 146 (100.0%) | 15.0 |
Fertility by Age by Marriage Status in West Hollywood
95.9% of women with births (146) in West Hollywood are married. The highest percentage of unmarried women with births falls into 35 to 50 years age bracket with 7.0% of them unmarried at the time of birth, while the lowest percentage of unmarried women with births belong to 20 to 34 years age bracket with 0.0% of them unmarried.
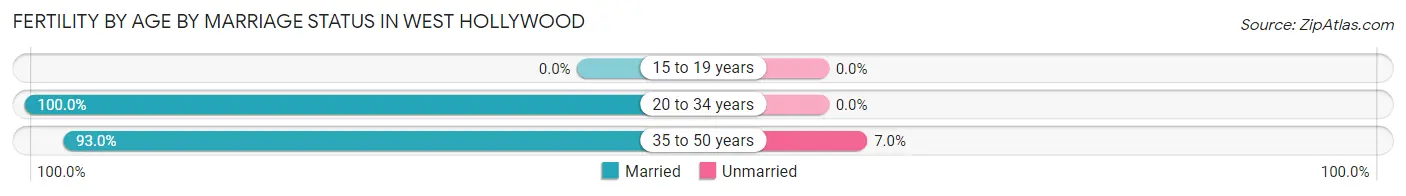
| Age Bracket | Married | Unmarried |
| 15 to 19 years | 0 (0.0%) | 0 (0.0%) |
| 20 to 34 years | 60 (100.0%) | 0 (0.0%) |
| 35 to 50 years | 80 (93.0%) | 6 (7.0%) |
| Total | 140 (95.9%) | 6 (4.1%) |
Fertility by Education in West Hollywood
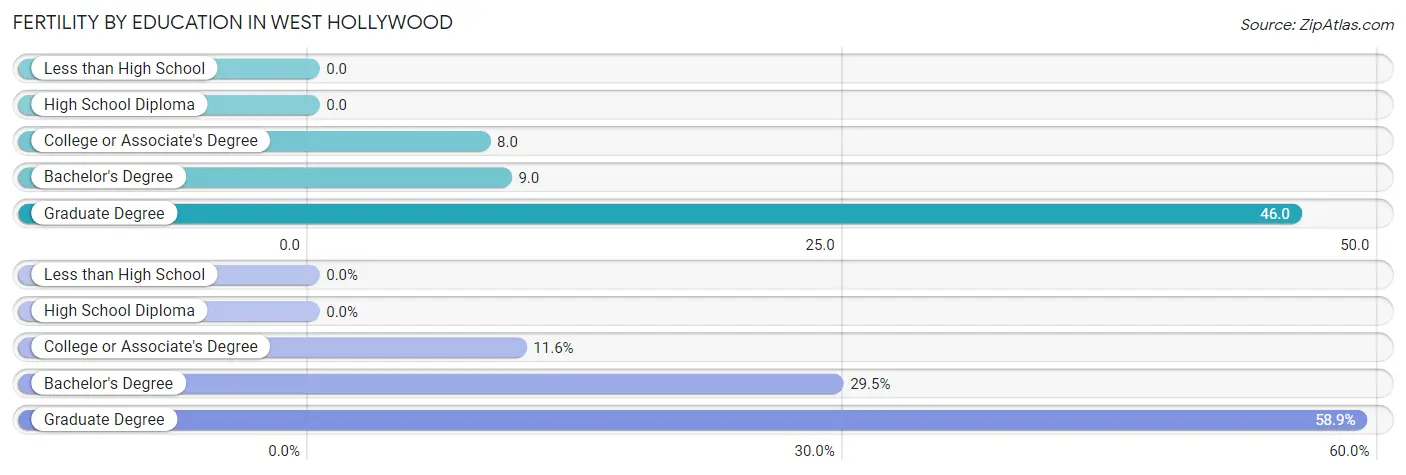
| Educational Attainment | Women with Births | Births / 1,000 Women |
| Less than High School | 0 (0.0%) | 0.0 |
| High School Diploma | 0 (0.0%) | 0.0 |
| College or Associate's Degree | 17 (11.6%) | 8.0 |
| Bachelor's Degree | 43 (29.4%) | 9.0 |
| Graduate Degree | 86 (58.9%) | 46.0 |
| Total | 146 (100.0%) | 15.0 |
Fertility by Education by Marriage Status in West Hollywood
4.1% of women with births in West Hollywood are unmarried. Women with the educational attainment of college or associate's degree are most likely to be married with 100.0% of them married at childbirth, while women with the educational attainment of graduate degree are least likely to be married with 7.0% of them unmarried at childbirth.
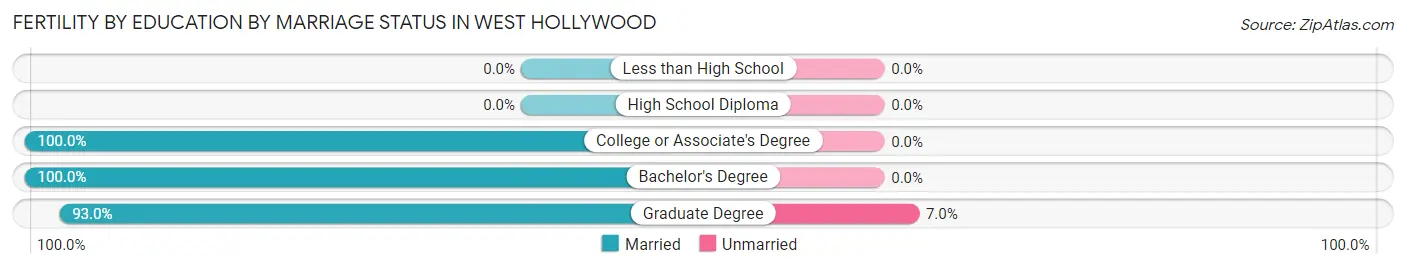
| Educational Attainment | Married | Unmarried |
| Less than High School | 0 (0.0%) | 0 (0.0%) |
| High School Diploma | 0 (0.0%) | 0 (0.0%) |
| College or Associate's Degree | 17 (100.0%) | 0 (0.0%) |
| Bachelor's Degree | 43 (100.0%) | 0 (0.0%) |
| Graduate Degree | 80 (93.0%) | 6 (7.0%) |
| Total | 140 (95.9%) | 6 (4.1%) |
Employment Characteristics in West Hollywood
Employment by Class of Employer in West Hollywood
Among the 23,647 employed individuals in West Hollywood, private company employees (15,228 | 64.4%), self-employed (not incorporated) (2,679 | 11.3%), and self-employed (incorporated) (2,070 | 8.7%) make up the most common classes of employment.
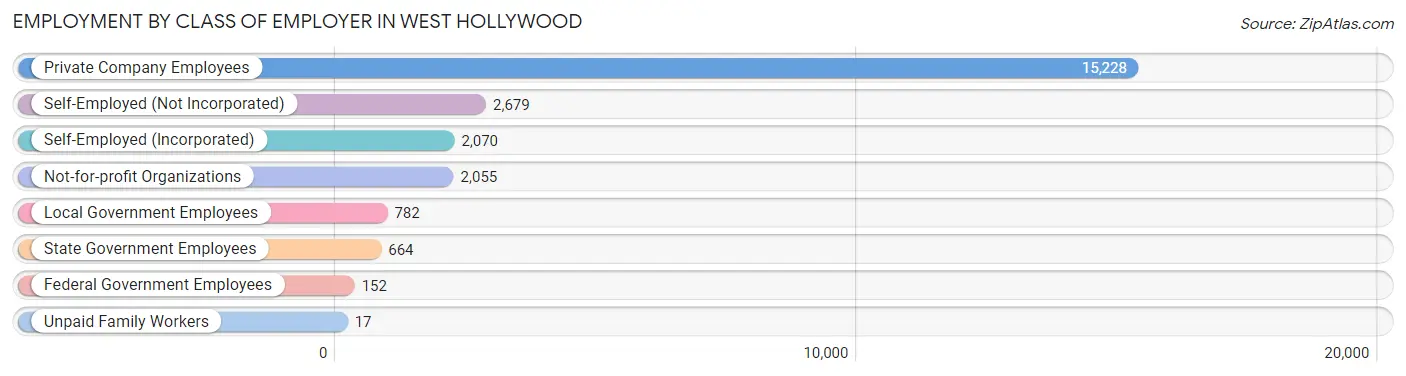
| Employer Class | # Employees | % Employees |
| Private Company Employees | 15,228 | 64.4% |
| Self-Employed (Incorporated) | 2,070 | 8.7% |
| Self-Employed (Not Incorporated) | 2,679 | 11.3% |
| Not-for-profit Organizations | 2,055 | 8.7% |
| Local Government Employees | 782 | 3.3% |
| State Government Employees | 664 | 2.8% |
| Federal Government Employees | 152 | 0.6% |
| Unpaid Family Workers | 17 | 0.1% |
| Total | 23,647 | 100.0% |
Employment Status by Age in West Hollywood
According to the labor force statistics for West Hollywood, out of the total population over 16 years of age (34,026), 78.0% or 26,540 individuals are in the labor force, with 8.0% or 2,123 of them unemployed. The age group with the highest labor force participation rate is 25 to 29 years, with 93.7% or 4,125 individuals in the labor force. Within the labor force, the 65 to 74 years age range has the highest percentage of unemployed individuals, with 13.3% or 197 of them being unemployed.
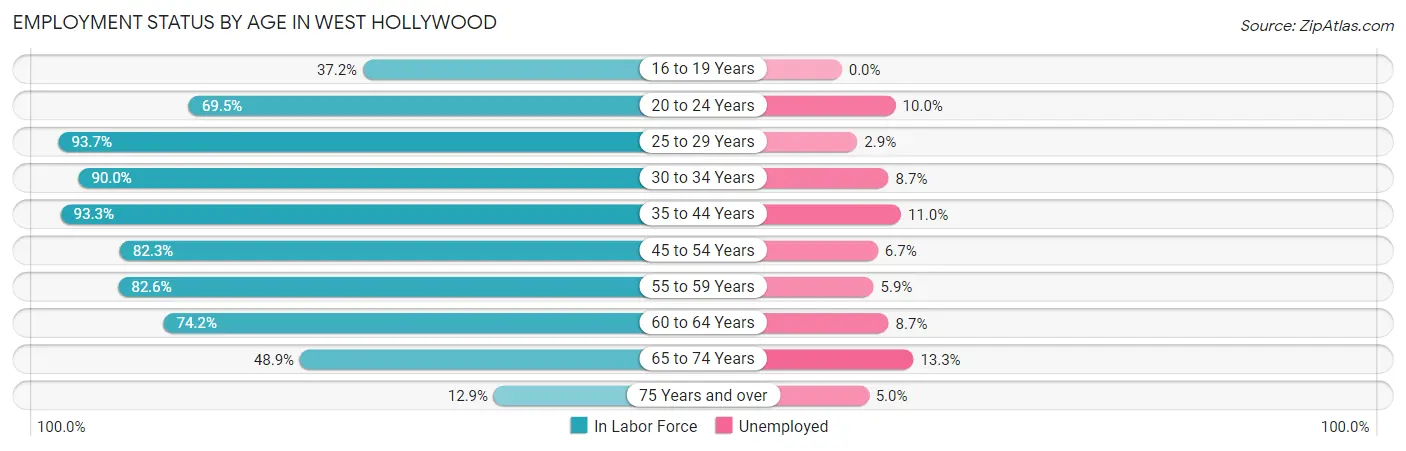
| Age Bracket | In Labor Force | Unemployed |
| 16 to 19 Years | 61 (37.2%) | 0 (0.0%) |
| 20 to 24 Years | 1,305 (69.5%) | 130 (10.0%) |
| 25 to 29 Years | 4,125 (93.7%) | 120 (2.9%) |
| 30 to 34 Years | 5,180 (90.0%) | 451 (8.7%) |
| 35 to 44 Years | 5,956 (93.3%) | 655 (11.0%) |
| 45 to 54 Years | 3,985 (82.3%) | 267 (6.7%) |
| 55 to 59 Years | 2,445 (82.6%) | 144 (5.9%) |
| 60 to 64 Years | 1,701 (74.2%) | 148 (8.7%) |
| 65 to 74 Years | 1,479 (48.9%) | 197 (13.3%) |
| 75 Years and over | 300 (12.9%) | 15 (5.0%) |
| Total | 26,540 (78.0%) | 2,123 (8.0%) |
Employment Status by Educational Attainment in West Hollywood
According to labor force statistics for West Hollywood, 87.8% of individuals (23,386) out of the total population between 25 and 64 years of age (26,636) are in the labor force, with 7.6% or 1,777 of them being unemployed. The group with the highest labor force participation rate are those with the educational attainment of bachelor's degree or higher, with 91.5% or 15,838 individuals in the labor force. Within the labor force, individuals with high school diploma education have the highest percentage of unemployment, with 11.4% or 154 of them being unemployed.
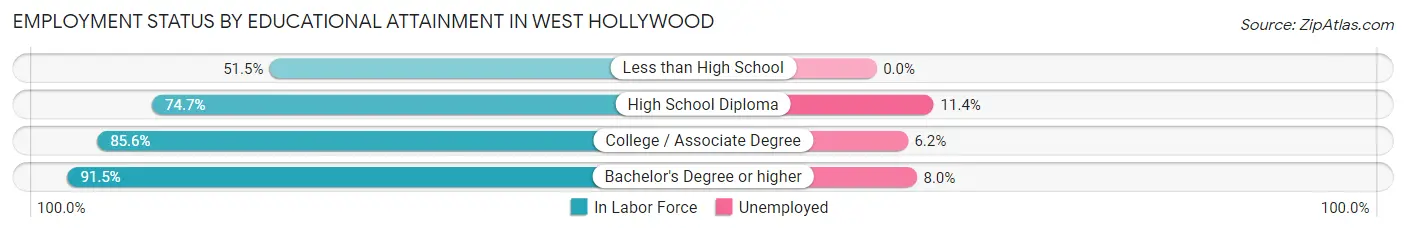
| Educational Attainment | In Labor Force | Unemployed |
| Less than High School | 366 (51.5%) | 0 (0.0%) |
| High School Diploma | 1,349 (74.7%) | 206 (11.4%) |
| College / Associate Degree | 5,830 (85.6%) | 422 (6.2%) |
| Bachelor's Degree or higher | 15,838 (91.5%) | 1,385 (8.0%) |
| Total | 23,386 (87.8%) | 2,024 (7.6%) |
Employment Occupations by Sex in West Hollywood
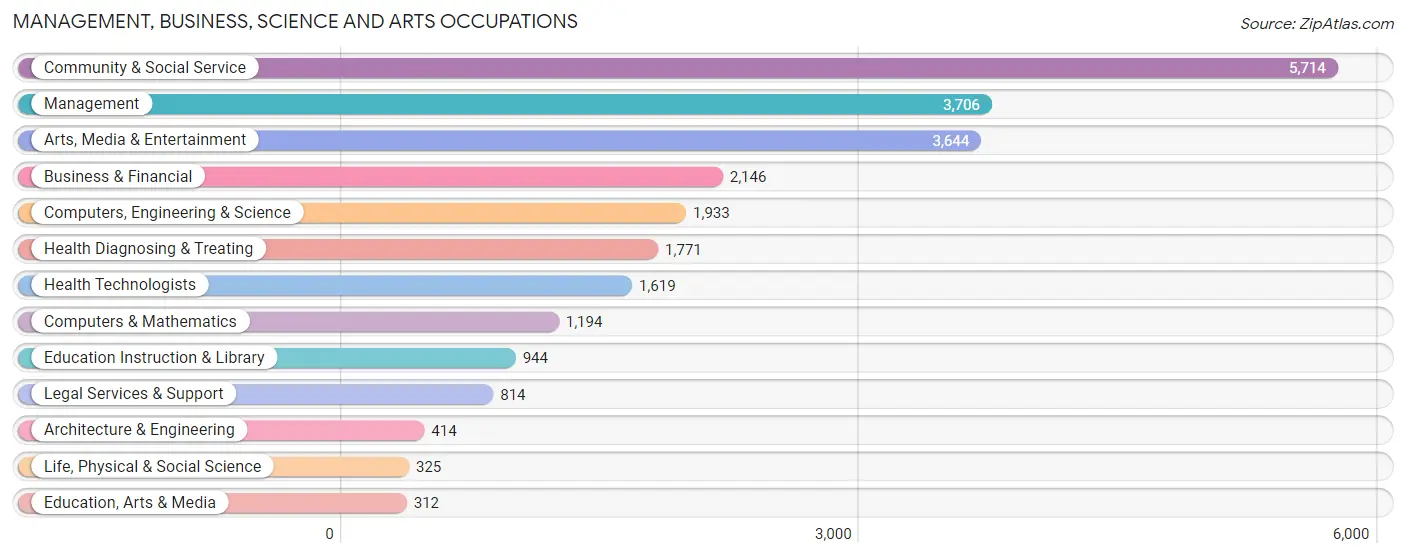
Management, Business, Science and Arts Occupations
The most common Management, Business, Science and Arts occupations in West Hollywood are Community & Social Service (5,714 | 23.4%), Management (3,706 | 15.2%), Arts, Media & Entertainment (3,644 | 14.9%), Business & Financial (2,146 | 8.8%), and Computers, Engineering & Science (1,933 | 7.9%).
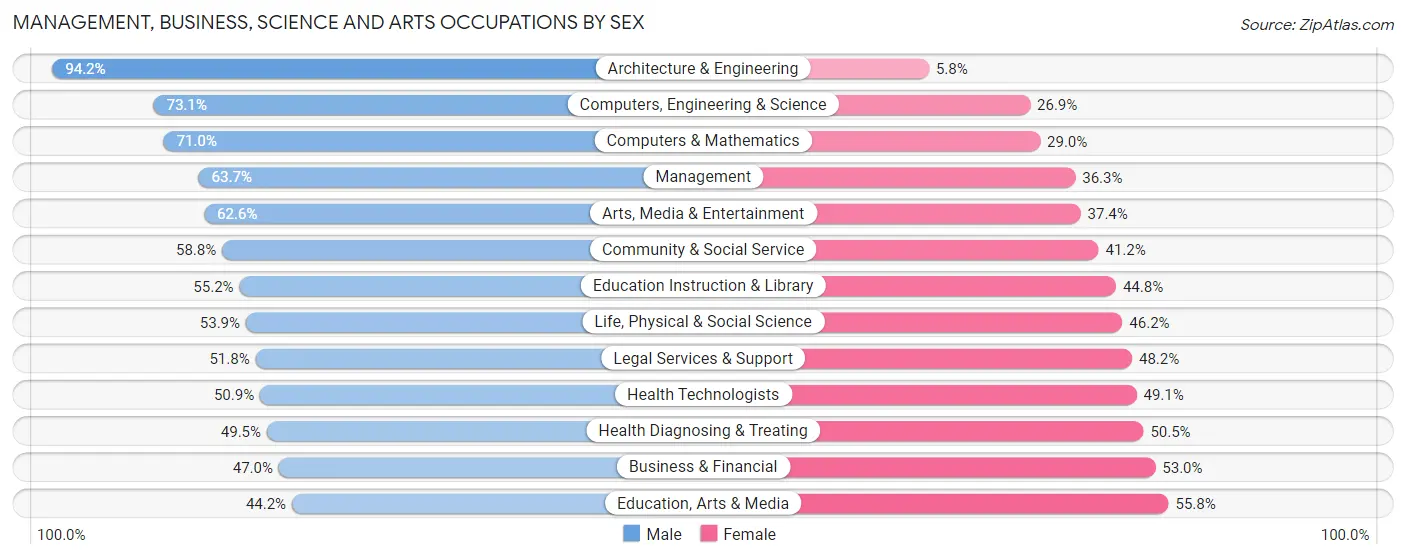
Management, Business, Science and Arts Occupations by Sex
Within the Management, Business, Science and Arts occupations in West Hollywood, the most male-oriented occupations are Architecture & Engineering (94.2%), Computers, Engineering & Science (73.1%), and Computers & Mathematics (71.0%), while the most female-oriented occupations are Education, Arts & Media (55.8%), Business & Financial (53.0%), and Health Diagnosing & Treating (50.5%).
| Occupation | Male | Female |
| Management | 2,360 (63.7%) | 1,346 (36.3%) |
| Business & Financial | 1,008 (47.0%) | 1,138 (53.0%) |
| Computers, Engineering & Science | 1,413 (73.1%) | 520 (26.9%) |
| Computers & Mathematics | 848 (71.0%) | 346 (29.0%) |
| Architecture & Engineering | 390 (94.2%) | 24 (5.8%) |
| Life, Physical & Social Science | 175 (53.8%) | 150 (46.2%) |
| Community & Social Service | 3,361 (58.8%) | 2,353 (41.2%) |
| Education, Arts & Media | 138 (44.2%) | 174 (55.8%) |
| Legal Services & Support | 422 (51.8%) | 392 (48.2%) |
| Education Instruction & Library | 521 (55.2%) | 423 (44.8%) |
| Arts, Media & Entertainment | 2,280 (62.6%) | 1,364 (37.4%) |
| Health Diagnosing & Treating | 876 (49.5%) | 895 (50.5%) |
| Health Technologists | 824 (50.9%) | 795 (49.1%) |
| Total (Category) | 9,018 (59.1%) | 6,252 (40.9%) |
| Total (Overall) | 14,577 (59.7%) | 9,831 (40.3%) |
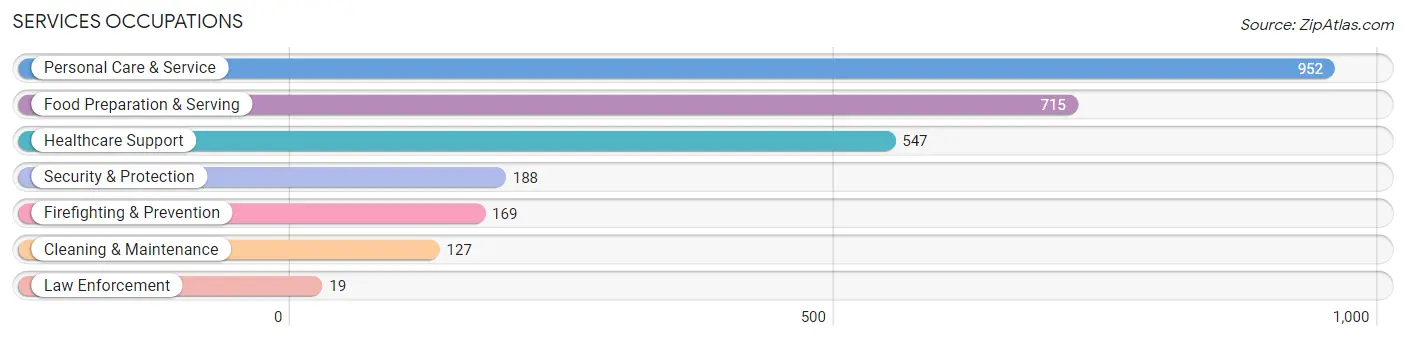
Services Occupations
The most common Services occupations in West Hollywood are Personal Care & Service (952 | 3.9%), Food Preparation & Serving (715 | 2.9%), Healthcare Support (547 | 2.2%), Security & Protection (188 | 0.8%), and Firefighting & Prevention (169 | 0.7%).
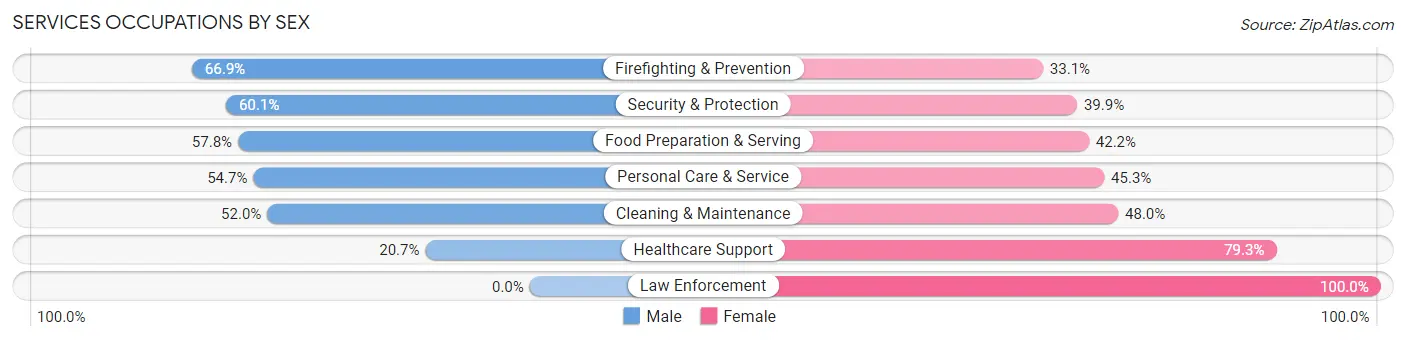
Services Occupations by Sex
Within the Services occupations in West Hollywood, the most male-oriented occupations are Firefighting & Prevention (66.9%), Security & Protection (60.1%), and Food Preparation & Serving (57.8%), while the most female-oriented occupations are Law Enforcement (100.0%), Healthcare Support (79.3%), and Cleaning & Maintenance (48.0%).
| Occupation | Male | Female |
| Healthcare Support | 113 (20.7%) | 434 (79.3%) |
| Security & Protection | 113 (60.1%) | 75 (39.9%) |
| Firefighting & Prevention | 113 (66.9%) | 56 (33.1%) |
| Law Enforcement | 0 (0.0%) | 19 (100.0%) |
| Food Preparation & Serving | 413 (57.8%) | 302 (42.2%) |
| Cleaning & Maintenance | 66 (52.0%) | 61 (48.0%) |
| Personal Care & Service | 521 (54.7%) | 431 (45.3%) |
| Total (Category) | 1,226 (48.5%) | 1,303 (51.5%) |
| Total (Overall) | 14,577 (59.7%) | 9,831 (40.3%) |
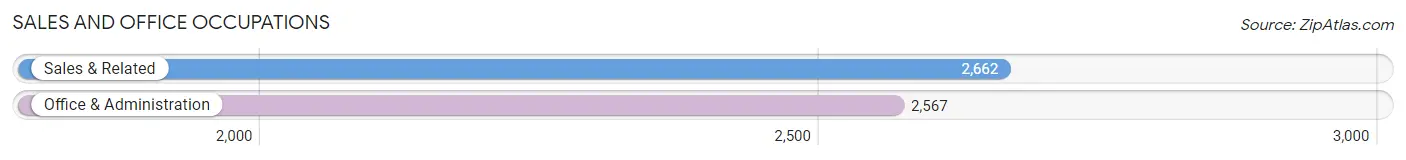
Sales and Office Occupations
The most common Sales and Office occupations in West Hollywood are Sales & Related (2,662 | 10.9%), and Office & Administration (2,567 | 10.5%).
Sales and Office Occupations by Sex
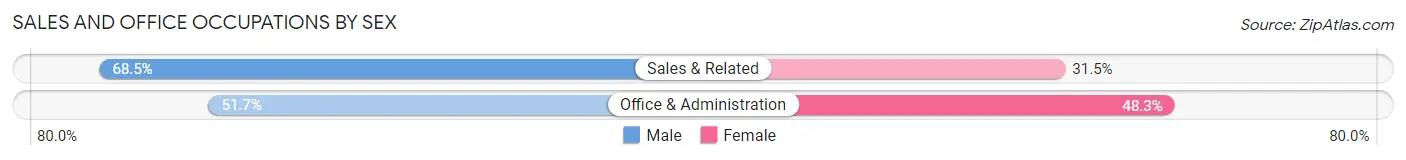
| Occupation | Male | Female |
| Sales & Related | 1,823 (68.5%) | 839 (31.5%) |
| Office & Administration | 1,327 (51.7%) | 1,240 (48.3%) |
| Total (Category) | 3,150 (60.2%) | 2,079 (39.8%) |
| Total (Overall) | 14,577 (59.7%) | 9,831 (40.3%) |
Natural Resources, Construction and Maintenance Occupations
The most common Natural Resources, Construction and Maintenance occupations in West Hollywood are Installation, Maintenance & Repair (110 | 0.4%), and Construction & Extraction (71 | 0.3%).

Natural Resources, Construction and Maintenance Occupations by Sex
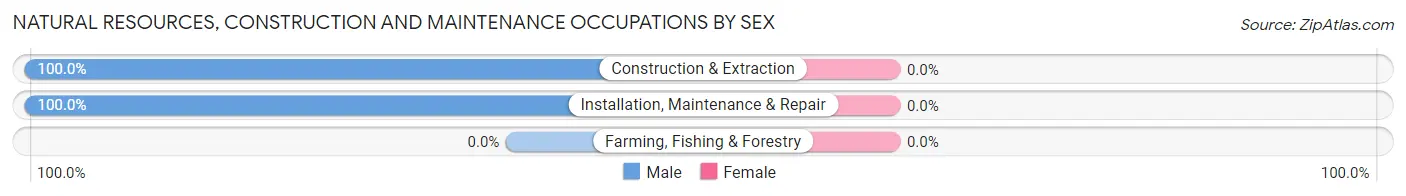
| Occupation | Male | Female |
| Farming, Fishing & Forestry | 0 (0.0%) | 0 (0.0%) |
| Construction & Extraction | 71 (100.0%) | 0 (0.0%) |
| Installation, Maintenance & Repair | 110 (100.0%) | 0 (0.0%) |
| Total (Category) | 181 (100.0%) | 0 (0.0%) |
| Total (Overall) | 14,577 (59.7%) | 9,831 (40.3%) |
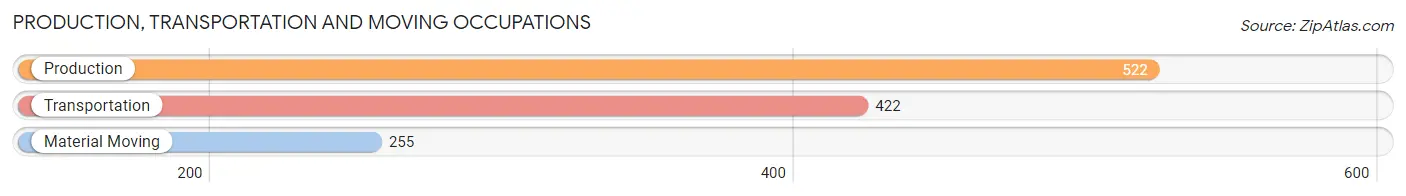
Production, Transportation and Moving Occupations
The most common Production, Transportation and Moving occupations in West Hollywood are Production (522 | 2.1%), Transportation (422 | 1.7%), and Material Moving (255 | 1.0%).
Production, Transportation and Moving Occupations by Sex
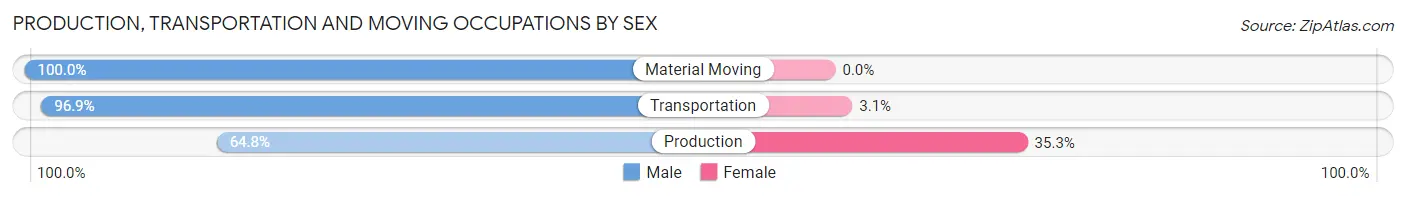
| Occupation | Male | Female |
| Production | 338 (64.7%) | 184 (35.2%) |
| Transportation | 409 (96.9%) | 13 (3.1%) |
| Material Moving | 255 (100.0%) | 0 (0.0%) |
| Total (Category) | 1,002 (83.6%) | 197 (16.4%) |
| Total (Overall) | 14,577 (59.7%) | 9,831 (40.3%) |
Employment Industries by Sex in West Hollywood
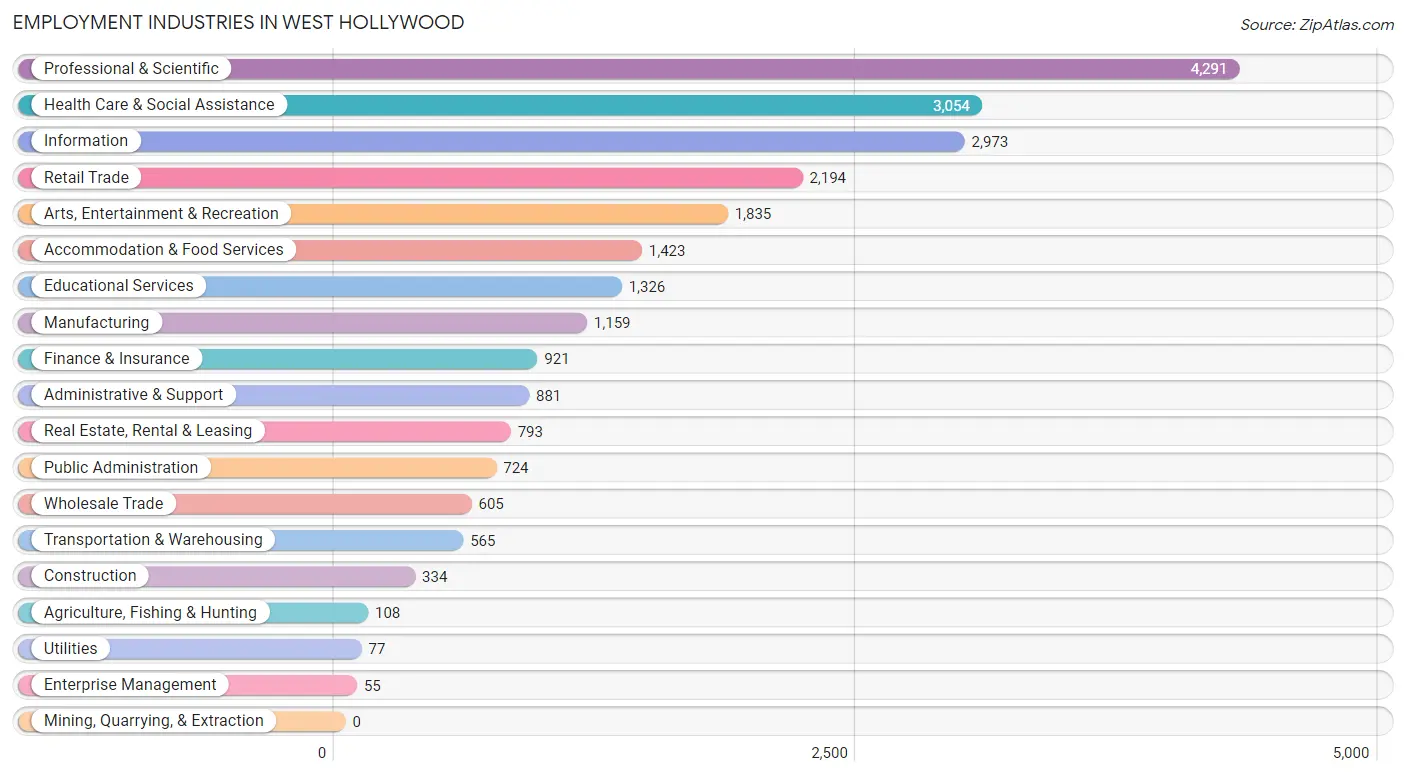
Employment Industries in West Hollywood
The major employment industries in West Hollywood include Professional & Scientific (4,291 | 17.6%), Health Care & Social Assistance (3,054 | 12.5%), Information (2,973 | 12.2%), Retail Trade (2,194 | 9.0%), and Arts, Entertainment & Recreation (1,835 | 7.5%).
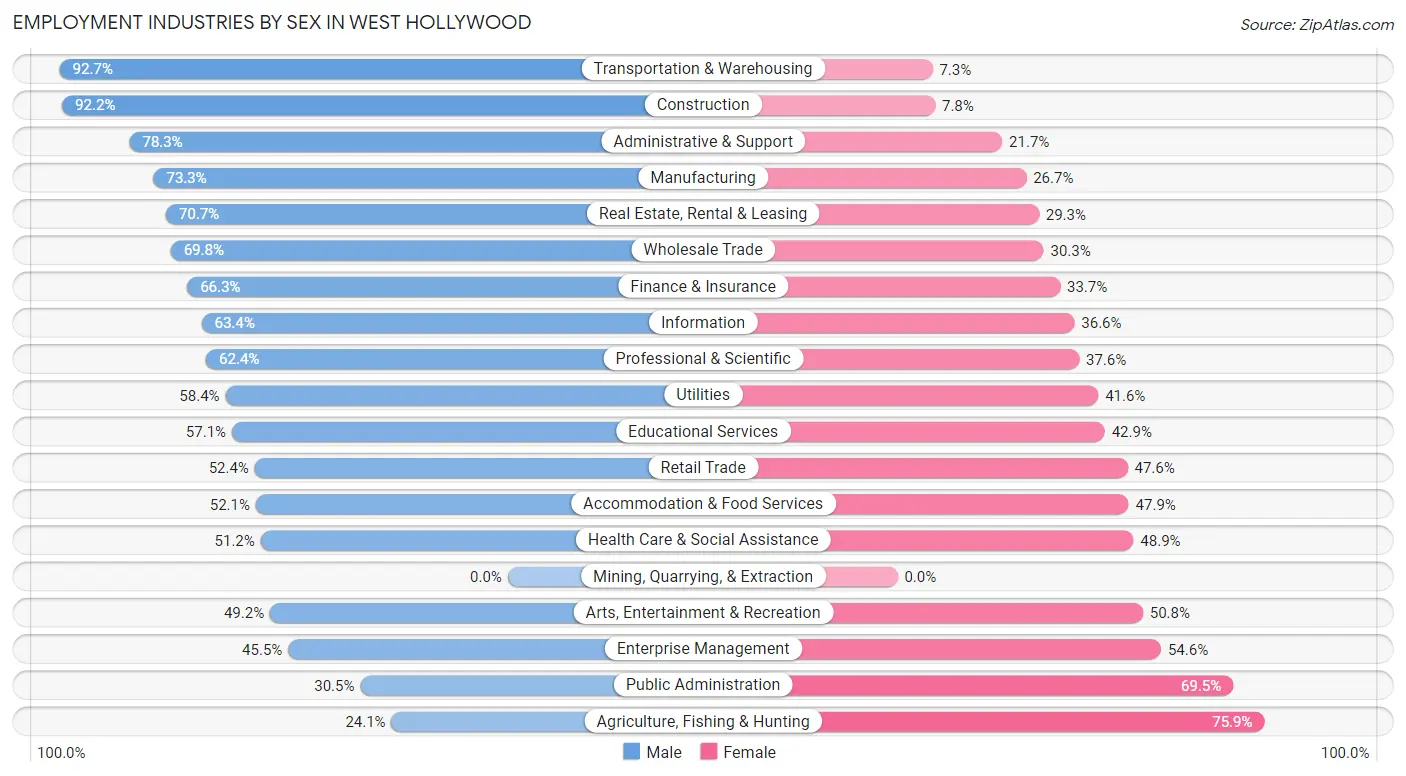
Employment Industries by Sex in West Hollywood
The West Hollywood industries that see more men than women are Transportation & Warehousing (92.7%), Construction (92.2%), and Administrative & Support (78.3%), whereas the industries that tend to have a higher number of women are Agriculture, Fishing & Hunting (75.9%), Public Administration (69.5%), and Enterprise Management (54.5%).
| Industry | Male | Female |
| Agriculture, Fishing & Hunting | 26 (24.1%) | 82 (75.9%) |
| Mining, Quarrying, & Extraction | 0 (0.0%) | 0 (0.0%) |
| Construction | 308 (92.2%) | 26 (7.8%) |
| Manufacturing | 850 (73.3%) | 309 (26.7%) |
| Wholesale Trade | 422 (69.8%) | 183 (30.2%) |
| Retail Trade | 1,149 (52.4%) | 1,045 (47.6%) |
| Transportation & Warehousing | 524 (92.7%) | 41 (7.3%) |
| Utilities | 45 (58.4%) | 32 (41.6%) |
| Information | 1,884 (63.4%) | 1,089 (36.6%) |
| Finance & Insurance | 611 (66.3%) | 310 (33.7%) |
| Real Estate, Rental & Leasing | 561 (70.7%) | 232 (29.3%) |
| Professional & Scientific | 2,678 (62.4%) | 1,613 (37.6%) |
| Enterprise Management | 25 (45.5%) | 30 (54.5%) |
| Administrative & Support | 690 (78.3%) | 191 (21.7%) |
| Educational Services | 757 (57.1%) | 569 (42.9%) |
| Health Care & Social Assistance | 1,562 (51.1%) | 1,492 (48.8%) |
| Arts, Entertainment & Recreation | 903 (49.2%) | 932 (50.8%) |
| Accommodation & Food Services | 742 (52.1%) | 681 (47.9%) |
| Public Administration | 221 (30.5%) | 503 (69.5%) |
| Total | 14,577 (59.7%) | 9,831 (40.3%) |
Education in West Hollywood
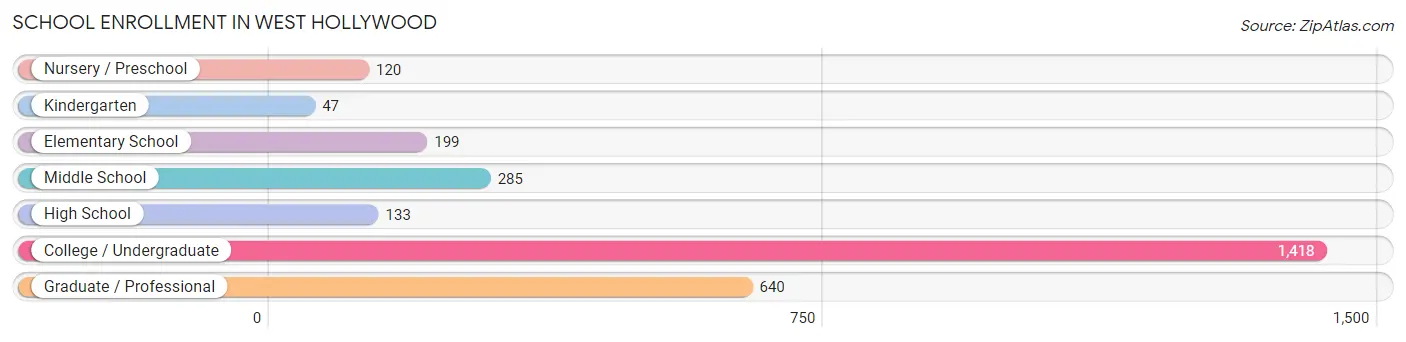
School Enrollment in West Hollywood
The most common levels of schooling among the 2,842 students in West Hollywood are college / undergraduate (1,418 | 49.9%), graduate / professional (640 | 22.5%), and middle school (285 | 10.0%).
| School Level | # Students | % Students |
| Nursery / Preschool | 120 | 4.2% |
| Kindergarten | 47 | 1.7% |
| Elementary School | 199 | 7.0% |
| Middle School | 285 | 10.0% |
| High School | 133 | 4.7% |
| College / Undergraduate | 1,418 | 49.9% |
| Graduate / Professional | 640 | 22.5% |
| Total | 2,842 | 100.0% |
School Enrollment by Age by Funding Source in West Hollywood
Out of a total of 2,842 students who are enrolled in schools in West Hollywood, 858 (30.2%) attend a private institution, while the remaining 1,984 (69.8%) are enrolled in public schools. The age group of 3 to 4 year olds has the highest likelihood of being enrolled in private schools, with 120 (100.0% in the age bracket) enrolled. Conversely, the age group of 15 to 17 year olds has the lowest likelihood of being enrolled in a private school, with 94 (100.0% in the age bracket) attending a public institution.
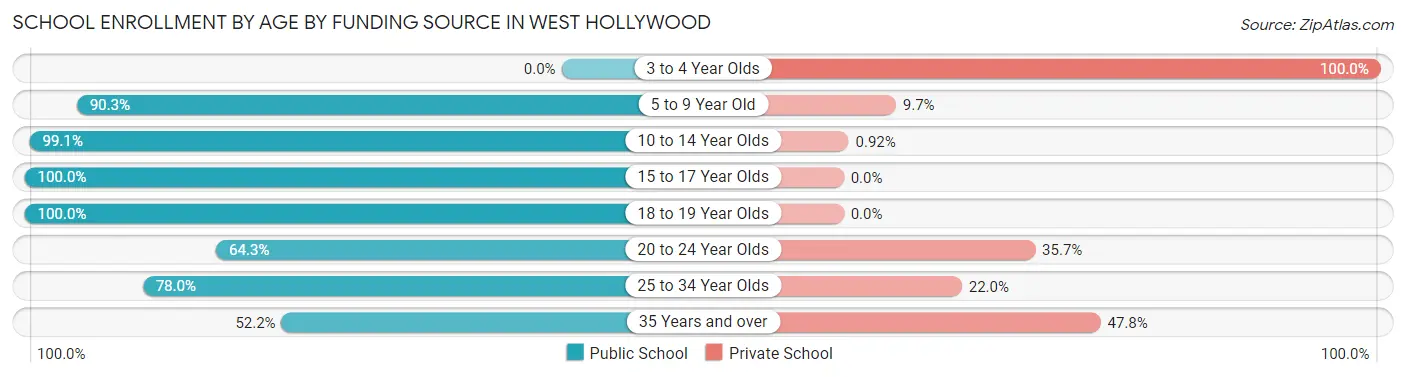
| Age Bracket | Public School | Private School |
| 3 to 4 Year Olds | 0 (0.0%) | 120 (100.0%) |
| 5 to 9 Year Old | 195 (90.3%) | 21 (9.7%) |
| 10 to 14 Year Olds | 322 (99.1%) | 3 (0.9%) |
| 15 to 17 Year Olds | 94 (100.0%) | 0 (0.0%) |
| 18 to 19 Year Olds | 108 (100.0%) | 0 (0.0%) |
| 20 to 24 Year Olds | 404 (64.3%) | 224 (35.7%) |
| 25 to 34 Year Olds | 475 (78.0%) | 134 (22.0%) |
| 35 Years and over | 387 (52.2%) | 355 (47.8%) |
| Total | 1,984 (69.8%) | 858 (30.2%) |
Educational Attainment by Field of Study in West Hollywood
Communications (3,351 | 15.4%), social sciences (3,061 | 14.0%), visual & performing arts (2,803 | 12.9%), business (2,611 | 12.0%), and literature & languages (2,009 | 9.2%) are the most common fields of study among 21,816 individuals in West Hollywood who have obtained a bachelor's degree or higher.
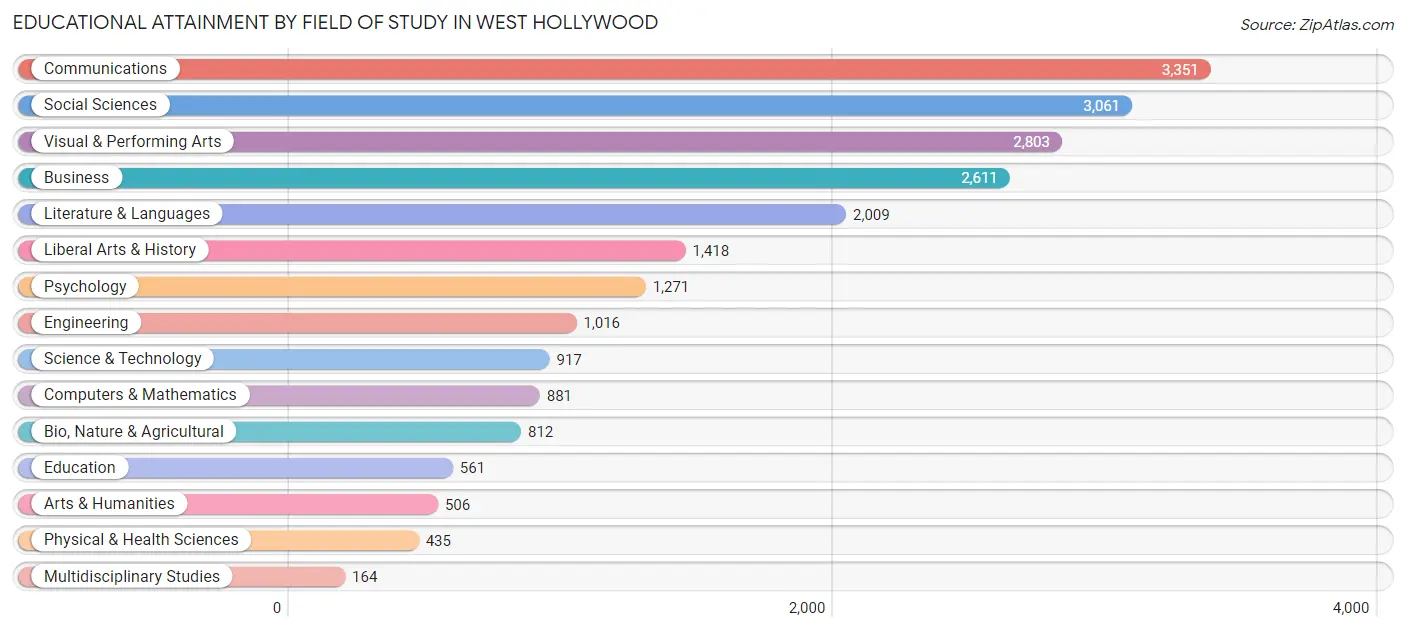
| Field of Study | # Graduates | % Graduates |
| Computers & Mathematics | 881 | 4.0% |
| Bio, Nature & Agricultural | 812 | 3.7% |
| Physical & Health Sciences | 435 | 2.0% |
| Psychology | 1,271 | 5.8% |
| Social Sciences | 3,061 | 14.0% |
| Engineering | 1,016 | 4.7% |
| Multidisciplinary Studies | 164 | 0.7% |
| Science & Technology | 917 | 4.2% |
| Business | 2,611 | 12.0% |
| Education | 561 | 2.6% |
| Literature & Languages | 2,009 | 9.2% |
| Liberal Arts & History | 1,418 | 6.5% |
| Visual & Performing Arts | 2,803 | 12.9% |
| Communications | 3,351 | 15.4% |
| Arts & Humanities | 506 | 2.3% |
| Total | 21,816 | 100.0% |
Transportation & Commute in West Hollywood
Vehicle Availability by Sex in West Hollywood
The most prevalent vehicle ownership categories in West Hollywood are males with 1 vehicle (6,818, accounting for 48.0%) and females with 1 vehicle (4,408, making up 72.4%).
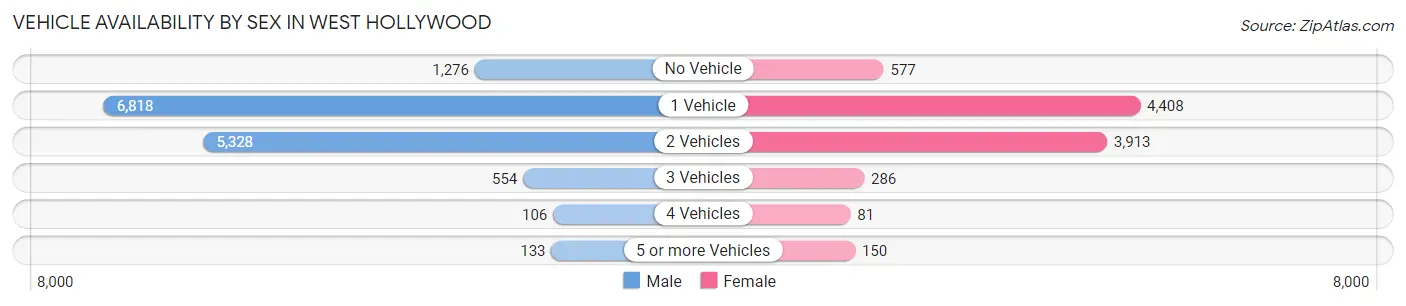
| Vehicles Available | Male | Female |
| No Vehicle | 1,276 (9.0%) | 577 (6.1%) |
| 1 Vehicle | 6,818 (48.0%) | 4,408 (46.8%) |
| 2 Vehicles | 5,328 (37.5%) | 3,913 (41.6%) |
| 3 Vehicles | 554 (3.9%) | 286 (3.0%) |
| 4 Vehicles | 106 (0.7%) | 81 (0.9%) |
| 5 or more Vehicles | 133 (0.9%) | 150 (1.6%) |
| Total | 14,215 (100.0%) | 9,415 (100.0%) |
Commute Time in West Hollywood
The most frequently occuring commute durations in West Hollywood are 30 to 34 minutes (3,870 commuters, 21.2%), 15 to 19 minutes (2,481 commuters, 13.6%), and 20 to 24 minutes (2,340 commuters, 12.8%).
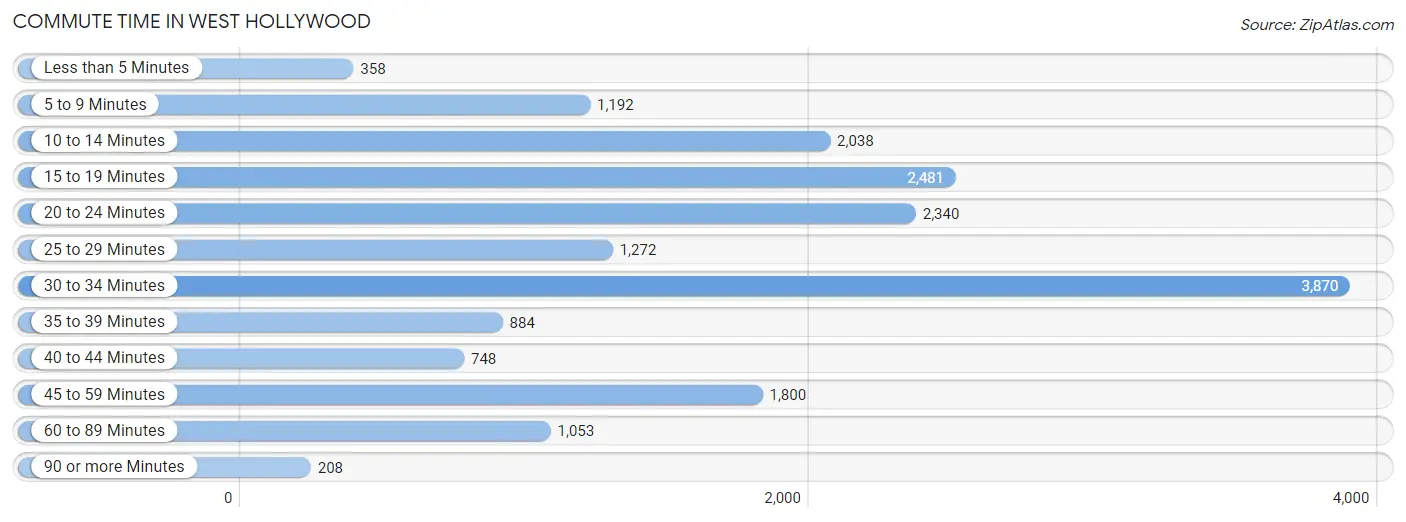
| Commute Time | # Commuters | % Commuters |
| Less than 5 Minutes | 358 | 2.0% |
| 5 to 9 Minutes | 1,192 | 6.5% |
| 10 to 14 Minutes | 2,038 | 11.2% |
| 15 to 19 Minutes | 2,481 | 13.6% |
| 20 to 24 Minutes | 2,340 | 12.8% |
| 25 to 29 Minutes | 1,272 | 7.0% |
| 30 to 34 Minutes | 3,870 | 21.2% |
| 35 to 39 Minutes | 884 | 4.9% |
| 40 to 44 Minutes | 748 | 4.1% |
| 45 to 59 Minutes | 1,800 | 9.9% |
| 60 to 89 Minutes | 1,053 | 5.8% |
| 90 or more Minutes | 208 | 1.1% |
Commute Time by Sex in West Hollywood
The most common commute times in West Hollywood are 30 to 34 minutes (1,967 commuters, 18.3%) for males and 30 to 34 minutes (1,903 commuters, 25.4%) for females.
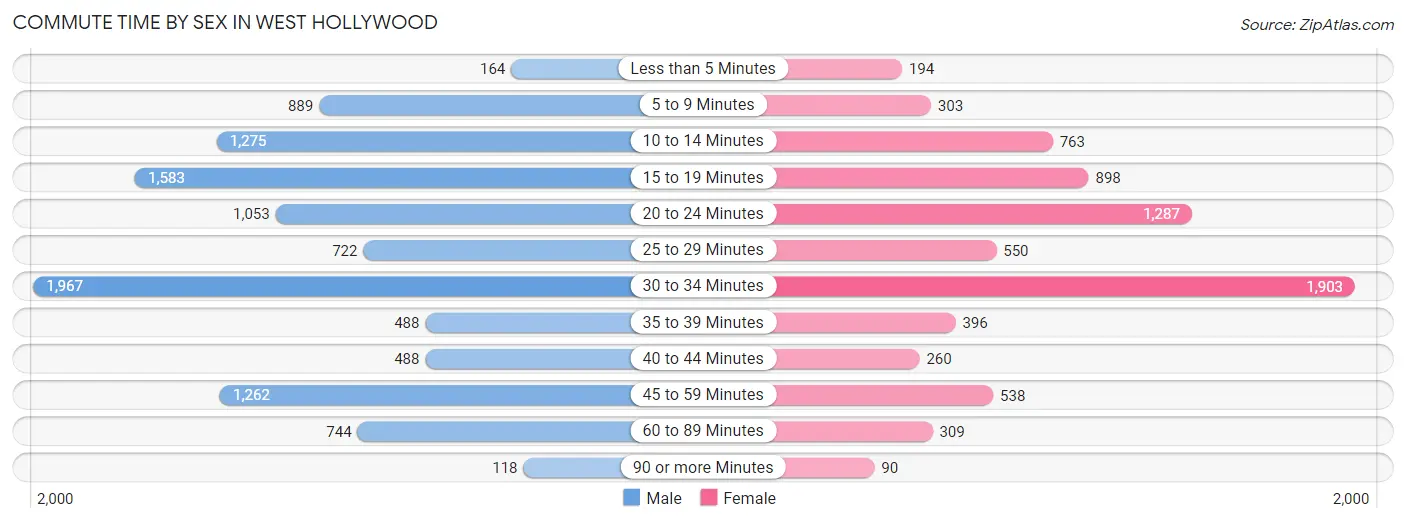
| Commute Time | Male | Female |
| Less than 5 Minutes | 164 (1.5%) | 194 (2.6%) |
| 5 to 9 Minutes | 889 (8.3%) | 303 (4.0%) |
| 10 to 14 Minutes | 1,275 (11.9%) | 763 (10.2%) |
| 15 to 19 Minutes | 1,583 (14.7%) | 898 (12.0%) |
| 20 to 24 Minutes | 1,053 (9.8%) | 1,287 (17.2%) |
| 25 to 29 Minutes | 722 (6.7%) | 550 (7.3%) |
| 30 to 34 Minutes | 1,967 (18.3%) | 1,903 (25.4%) |
| 35 to 39 Minutes | 488 (4.5%) | 396 (5.3%) |
| 40 to 44 Minutes | 488 (4.5%) | 260 (3.5%) |
| 45 to 59 Minutes | 1,262 (11.7%) | 538 (7.2%) |
| 60 to 89 Minutes | 744 (6.9%) | 309 (4.1%) |
| 90 or more Minutes | 118 (1.1%) | 90 (1.2%) |
Time of Departure to Work by Sex in West Hollywood
The most frequent times of departure to work in West Hollywood are 9:00 AM to 9:59 AM (1,948, 18.1%) for males and 8:00 AM to 8:29 AM (1,364, 18.2%) for females.
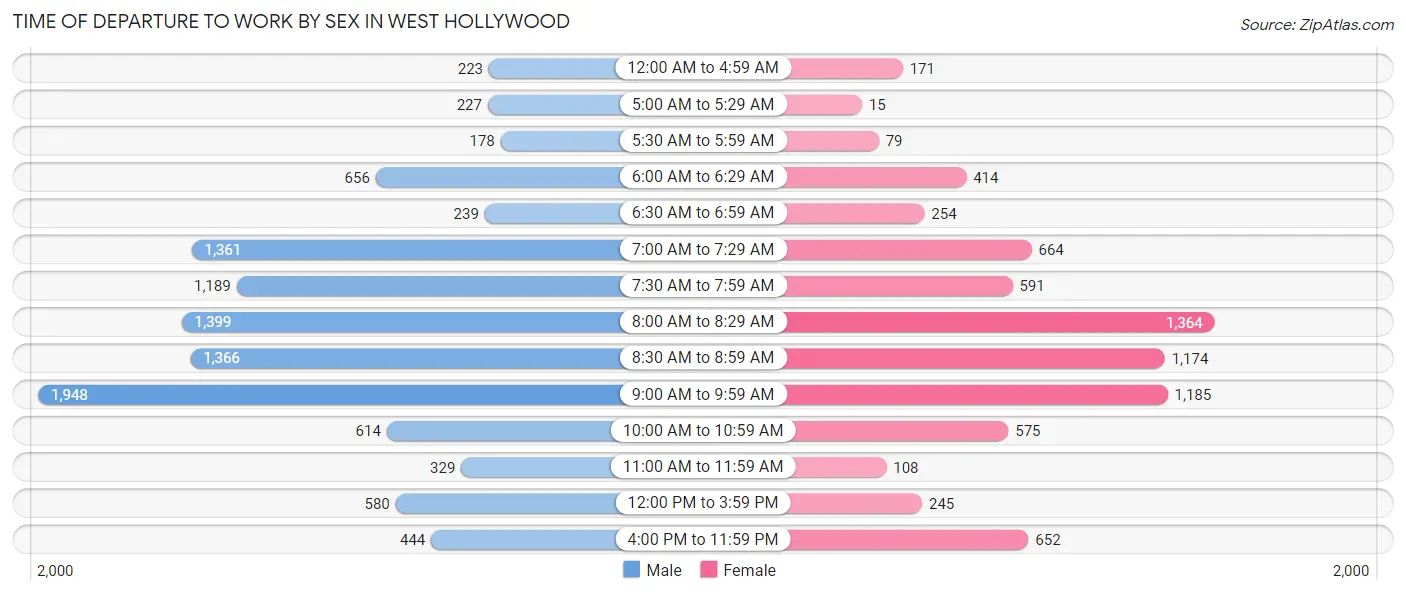
| Time of Departure | Male | Female |
| 12:00 AM to 4:59 AM | 223 (2.1%) | 171 (2.3%) |
| 5:00 AM to 5:29 AM | 227 (2.1%) | 15 (0.2%) |
| 5:30 AM to 5:59 AM | 178 (1.7%) | 79 (1.1%) |
| 6:00 AM to 6:29 AM | 656 (6.1%) | 414 (5.5%) |
| 6:30 AM to 6:59 AM | 239 (2.2%) | 254 (3.4%) |
| 7:00 AM to 7:29 AM | 1,361 (12.7%) | 664 (8.9%) |
| 7:30 AM to 7:59 AM | 1,189 (11.1%) | 591 (7.9%) |
| 8:00 AM to 8:29 AM | 1,399 (13.0%) | 1,364 (18.2%) |
| 8:30 AM to 8:59 AM | 1,366 (12.7%) | 1,174 (15.7%) |
| 9:00 AM to 9:59 AM | 1,948 (18.1%) | 1,185 (15.8%) |
| 10:00 AM to 10:59 AM | 614 (5.7%) | 575 (7.7%) |
| 11:00 AM to 11:59 AM | 329 (3.1%) | 108 (1.4%) |
| 12:00 PM to 3:59 PM | 580 (5.4%) | 245 (3.3%) |
| 4:00 PM to 11:59 PM | 444 (4.1%) | 652 (8.7%) |
| Total | 10,753 (100.0%) | 7,491 (100.0%) |
Housing Occupancy in West Hollywood
Occupancy by Ownership in West Hollywood
Of the total 22,836 dwellings in West Hollywood, owner-occupied units account for 4,404 (19.3%), while renter-occupied units make up 18,432 (80.7%).
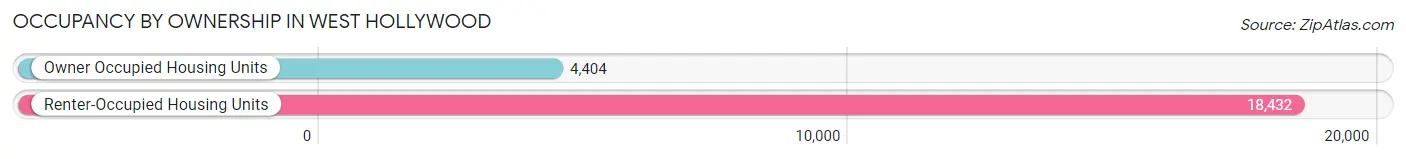
| Occupancy | # Housing Units | % Housing Units |
| Owner Occupied Housing Units | 4,404 | 19.3% |
| Renter-Occupied Housing Units | 18,432 | 80.7% |
| Total Occupied Housing Units | 22,836 | 100.0% |
Occupancy by Household Size in West Hollywood
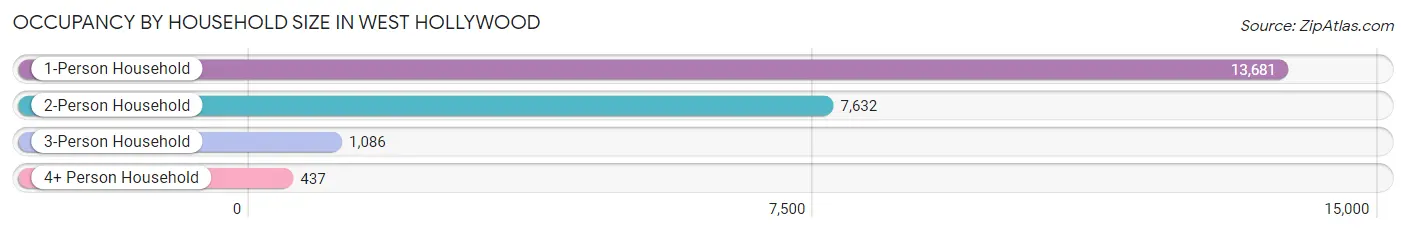
| Household Size | # Housing Units | % Housing Units |
| 1-Person Household | 13,681 | 59.9% |
| 2-Person Household | 7,632 | 33.4% |
| 3-Person Household | 1,086 | 4.8% |
| 4+ Person Household | 437 | 1.9% |
| Total Housing Units | 22,836 | 100.0% |
Occupancy by Ownership by Household Size in West Hollywood
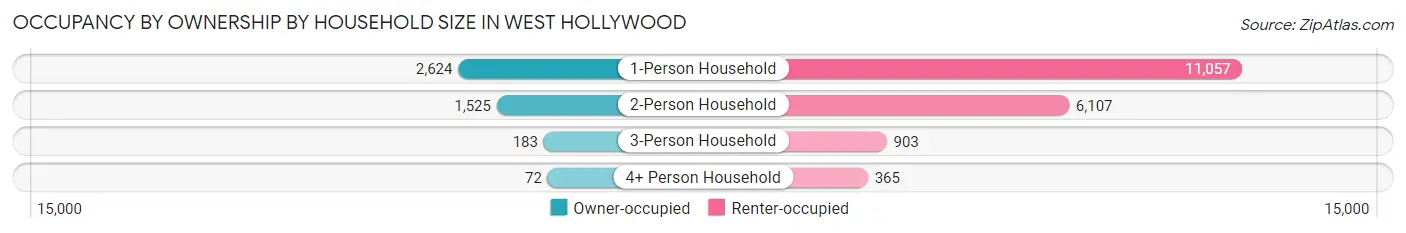
| Household Size | Owner-occupied | Renter-occupied |
| 1-Person Household | 2,624 (19.2%) | 11,057 (80.8%) |
| 2-Person Household | 1,525 (20.0%) | 6,107 (80.0%) |
| 3-Person Household | 183 (16.9%) | 903 (83.2%) |
| 4+ Person Household | 72 (16.5%) | 365 (83.5%) |
| Total Housing Units | 4,404 (19.3%) | 18,432 (80.7%) |
Occupancy by Educational Attainment in West Hollywood
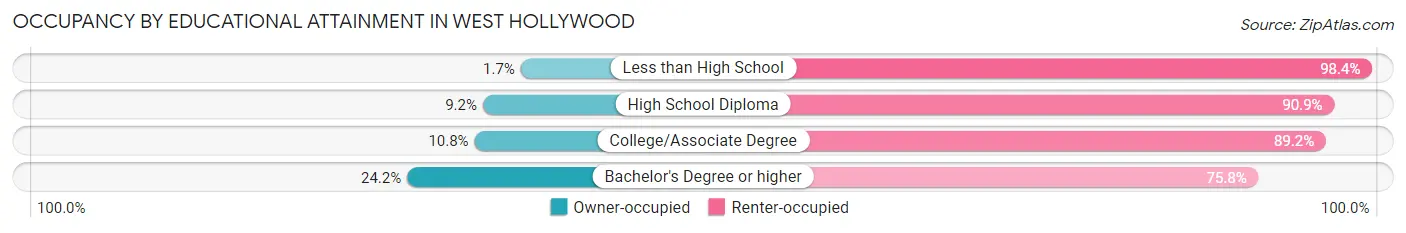
| Household Size | Owner-occupied | Renter-occupied |
| Less than High School | 10 (1.7%) | 596 (98.4%) |
| High School Diploma | 164 (9.1%) | 1,629 (90.8%) |
| College/Associate Degree | 574 (10.8%) | 4,735 (89.2%) |
| Bachelor's Degree or higher | 3,656 (24.2%) | 11,472 (75.8%) |
Occupancy by Age of Householder in West Hollywood
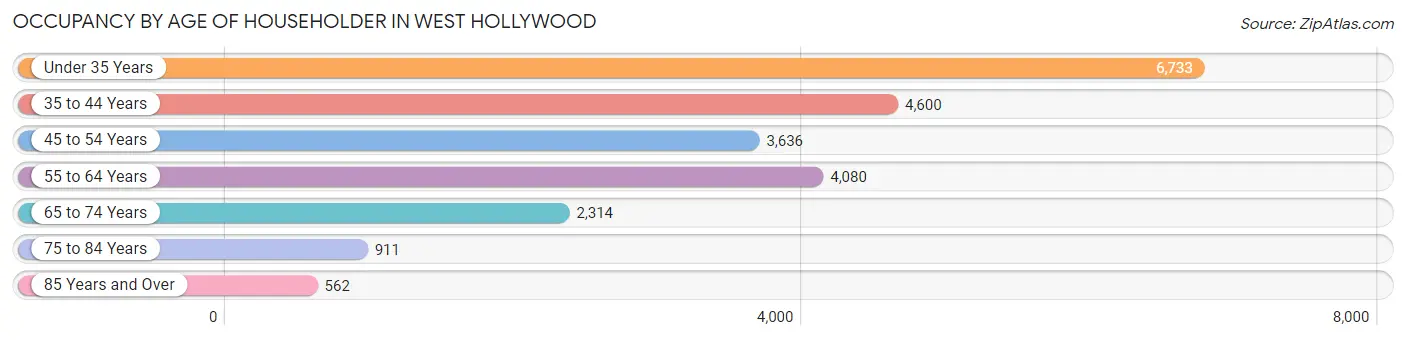
| Age Bracket | # Households | % Households |
| Under 35 Years | 6,733 | 29.5% |
| 35 to 44 Years | 4,600 | 20.1% |
| 45 to 54 Years | 3,636 | 15.9% |
| 55 to 64 Years | 4,080 | 17.9% |
| 65 to 74 Years | 2,314 | 10.1% |
| 75 to 84 Years | 911 | 4.0% |
| 85 Years and Over | 562 | 2.5% |
| Total | 22,836 | 100.0% |
Housing Finances in West Hollywood
Median Income by Occupancy in West Hollywood
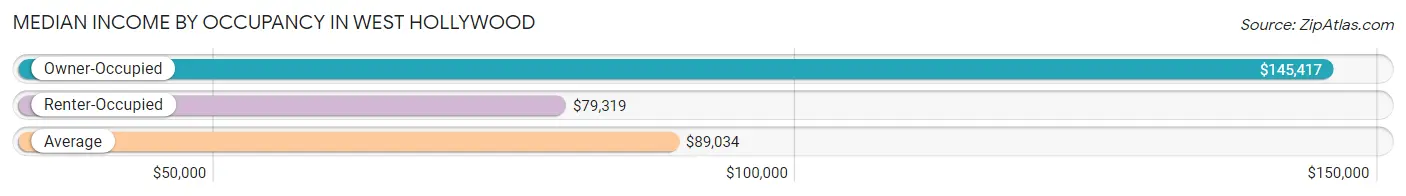
| Occupancy Type | # Households | Median Income |
| Owner-Occupied | 4,404 (19.3%) | $145,417 |
| Renter-Occupied | 18,432 (80.7%) | $79,319 |
| Average | 22,836 (100.0%) | $89,034 |
Occupancy by Householder Income Bracket in West Hollywood
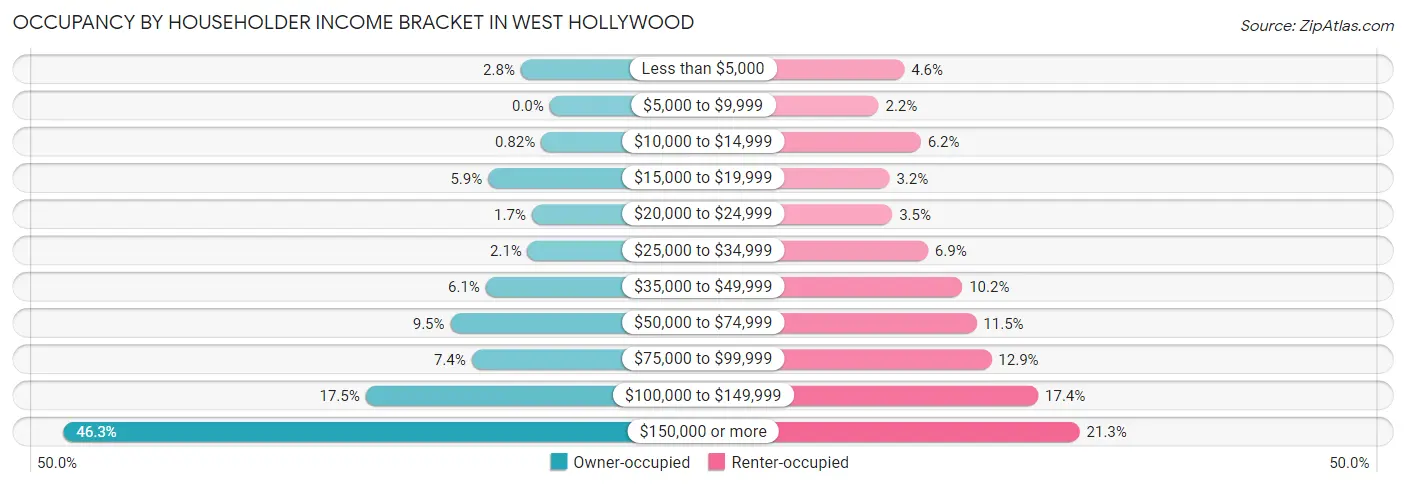
| Income Bracket | Owner-occupied | Renter-occupied |
| Less than $5,000 | 121 (2.8%) | 855 (4.6%) |
| $5,000 to $9,999 | 0 (0.0%) | 403 (2.2%) |
| $10,000 to $14,999 | 36 (0.8%) | 1,145 (6.2%) |
| $15,000 to $19,999 | 258 (5.9%) | 596 (3.2%) |
| $20,000 to $24,999 | 75 (1.7%) | 643 (3.5%) |
| $25,000 to $34,999 | 92 (2.1%) | 1,270 (6.9%) |
| $35,000 to $49,999 | 268 (6.1%) | 1,873 (10.2%) |
| $50,000 to $74,999 | 416 (9.5%) | 2,122 (11.5%) |
| $75,000 to $99,999 | 327 (7.4%) | 2,386 (12.9%) |
| $100,000 to $149,999 | 772 (17.5%) | 3,205 (17.4%) |
| $150,000 or more | 2,039 (46.3%) | 3,934 (21.3%) |
| Total | 4,404 (100.0%) | 18,432 (100.0%) |
Monthly Housing Cost Tiers in West Hollywood
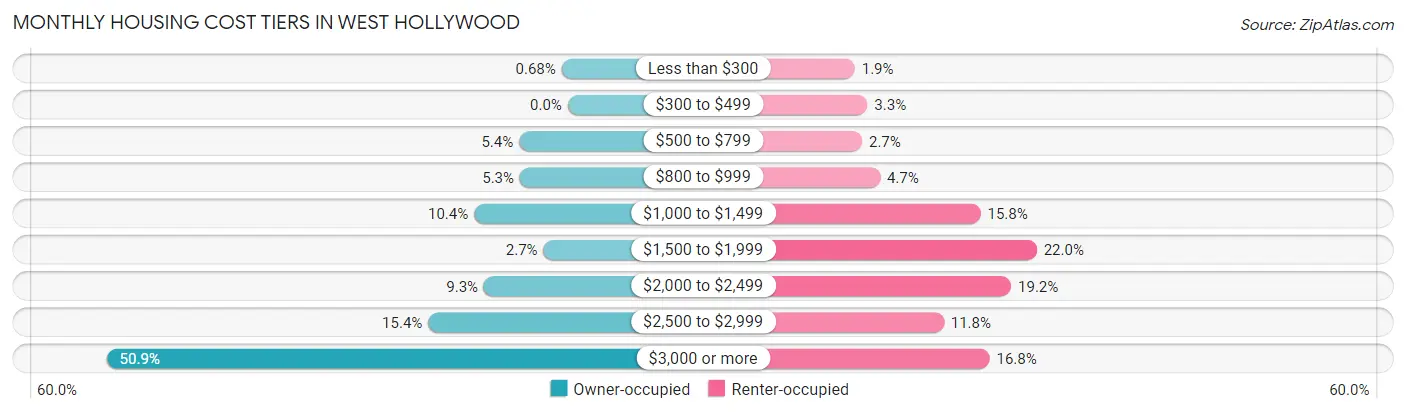
| Monthly Cost | Owner-occupied | Renter-occupied |
| Less than $300 | 30 (0.7%) | 353 (1.9%) |
| $300 to $499 | 0 (0.0%) | 611 (3.3%) |
| $500 to $799 | 237 (5.4%) | 502 (2.7%) |
| $800 to $999 | 233 (5.3%) | 866 (4.7%) |
| $1,000 to $1,499 | 456 (10.3%) | 2,914 (15.8%) |
| $1,500 to $1,999 | 118 (2.7%) | 4,058 (22.0%) |
| $2,000 to $2,499 | 408 (9.3%) | 3,537 (19.2%) |
| $2,500 to $2,999 | 679 (15.4%) | 2,166 (11.7%) |
| $3,000 or more | 2,243 (50.9%) | 3,098 (16.8%) |
| Total | 4,404 (100.0%) | 18,432 (100.0%) |
Physical Housing Characteristics in West Hollywood
Housing Structures in West Hollywood
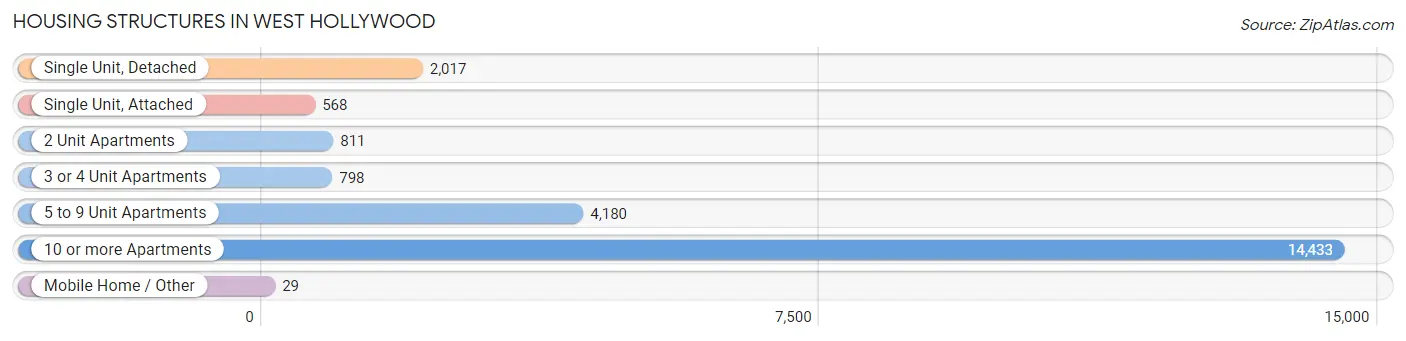
| Structure Type | # Housing Units | % Housing Units |
| Single Unit, Detached | 2,017 | 8.8% |
| Single Unit, Attached | 568 | 2.5% |
| 2 Unit Apartments | 811 | 3.5% |
| 3 or 4 Unit Apartments | 798 | 3.5% |
| 5 to 9 Unit Apartments | 4,180 | 18.3% |
| 10 or more Apartments | 14,433 | 63.2% |
| Mobile Home / Other | 29 | 0.1% |
| Total | 22,836 | 100.0% |
Housing Structures by Occupancy in West Hollywood
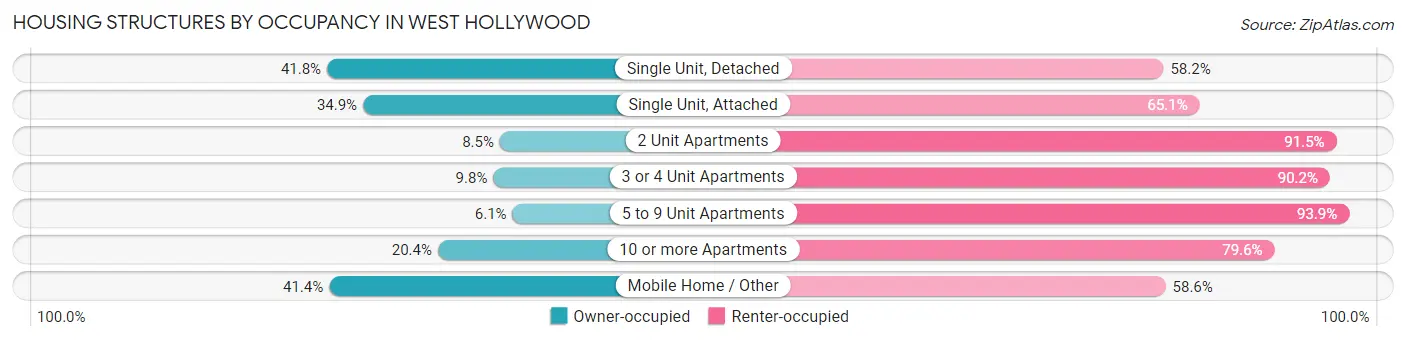
| Structure Type | Owner-occupied | Renter-occupied |
| Single Unit, Detached | 843 (41.8%) | 1,174 (58.2%) |
| Single Unit, Attached | 198 (34.9%) | 370 (65.1%) |
| 2 Unit Apartments | 69 (8.5%) | 742 (91.5%) |
| 3 or 4 Unit Apartments | 78 (9.8%) | 720 (90.2%) |
| 5 to 9 Unit Apartments | 254 (6.1%) | 3,926 (93.9%) |
| 10 or more Apartments | 2,950 (20.4%) | 11,483 (79.6%) |
| Mobile Home / Other | 12 (41.4%) | 17 (58.6%) |
| Total | 4,404 (19.3%) | 18,432 (80.7%) |
Housing Structures by Number of Rooms in West Hollywood
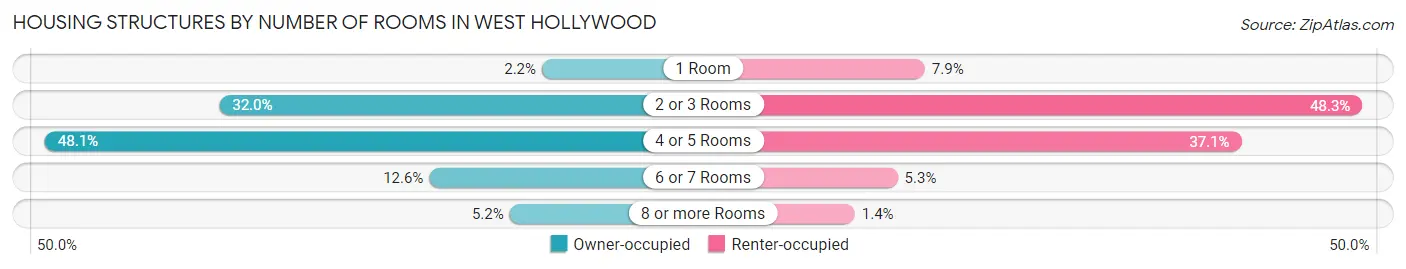
| Number of Rooms | Owner-occupied | Renter-occupied |
| 1 Room | 95 (2.2%) | 1,448 (7.9%) |
| 2 or 3 Rooms | 1,409 (32.0%) | 8,902 (48.3%) |
| 4 or 5 Rooms | 2,119 (48.1%) | 6,844 (37.1%) |
| 6 or 7 Rooms | 554 (12.6%) | 984 (5.3%) |
| 8 or more Rooms | 227 (5.1%) | 254 (1.4%) |
| Total | 4,404 (100.0%) | 18,432 (100.0%) |
Housing Structure by Heating Type in West Hollywood
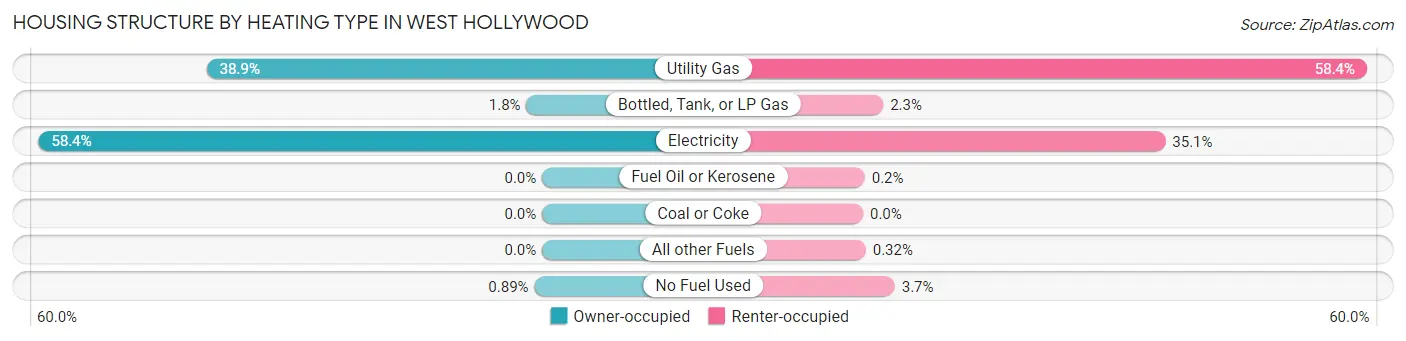
| Heating Type | Owner-occupied | Renter-occupied |
| Utility Gas | 1,713 (38.9%) | 10,766 (58.4%) |
| Bottled, Tank, or LP Gas | 80 (1.8%) | 431 (2.3%) |
| Electricity | 2,572 (58.4%) | 6,461 (35.0%) |
| Fuel Oil or Kerosene | 0 (0.0%) | 37 (0.2%) |
| Coal or Coke | 0 (0.0%) | 0 (0.0%) |
| All other Fuels | 0 (0.0%) | 59 (0.3%) |
| No Fuel Used | 39 (0.9%) | 678 (3.7%) |
| Total | 4,404 (100.0%) | 18,432 (100.0%) |
Household Vehicle Usage in West Hollywood
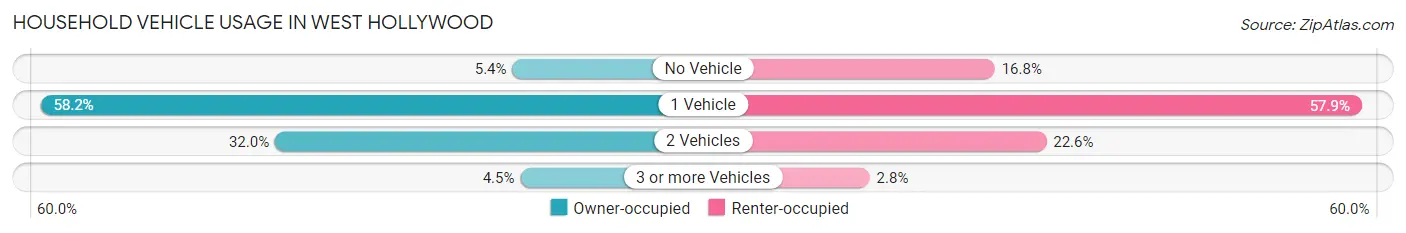
| Vehicles per Household | Owner-occupied | Renter-occupied |
| No Vehicle | 236 (5.4%) | 3,093 (16.8%) |
| 1 Vehicle | 2,564 (58.2%) | 10,670 (57.9%) |
| 2 Vehicles | 1,407 (32.0%) | 4,158 (22.6%) |
| 3 or more Vehicles | 197 (4.5%) | 511 (2.8%) |
| Total | 4,404 (100.0%) | 18,432 (100.0%) |
Real Estate & Mortgages in West Hollywood
Real Estate and Mortgage Overview in West Hollywood
| Characteristic | Without Mortgage | With Mortgage |
| Housing Units | 1,154 | 3,250 |
| Median Property Value | $845,900 | $912,300 |
| Median Household Income | $75,972 | $1,650 |
| Monthly Housing Costs | $1,244 | $2,143 |
| Real Estate Taxes | $5,922 | $49 |
Property Value by Mortgage Status in West Hollywood
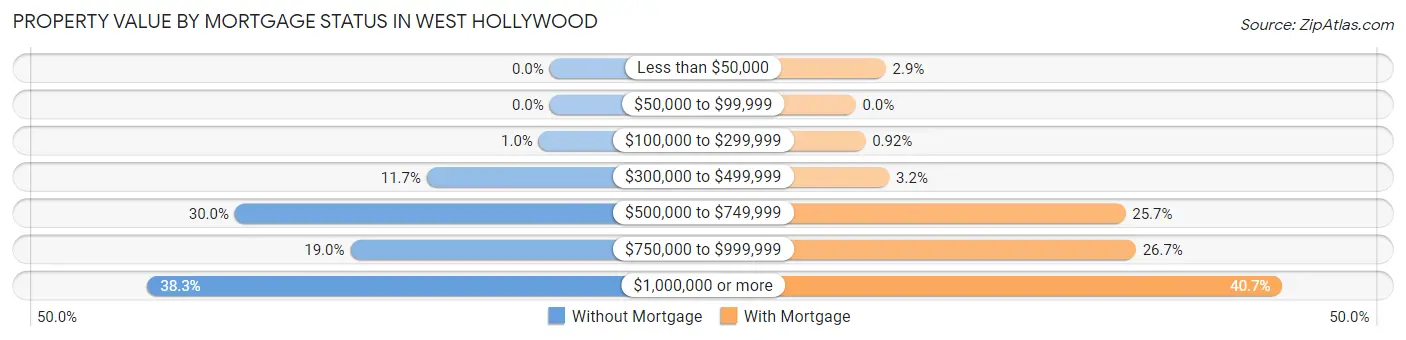
| Property Value | Without Mortgage | With Mortgage |
| Less than $50,000 | 0 (0.0%) | 93 (2.9%) |
| $50,000 to $99,999 | 0 (0.0%) | 0 (0.0%) |
| $100,000 to $299,999 | 12 (1.0%) | 30 (0.9%) |
| $300,000 to $499,999 | 135 (11.7%) | 104 (3.2%) |
| $500,000 to $749,999 | 346 (30.0%) | 835 (25.7%) |
| $750,000 to $999,999 | 219 (19.0%) | 867 (26.7%) |
| $1,000,000 or more | 442 (38.3%) | 1,321 (40.6%) |
| Total | 1,154 (100.0%) | 3,250 (100.0%) |
Household Income by Mortgage Status in West Hollywood
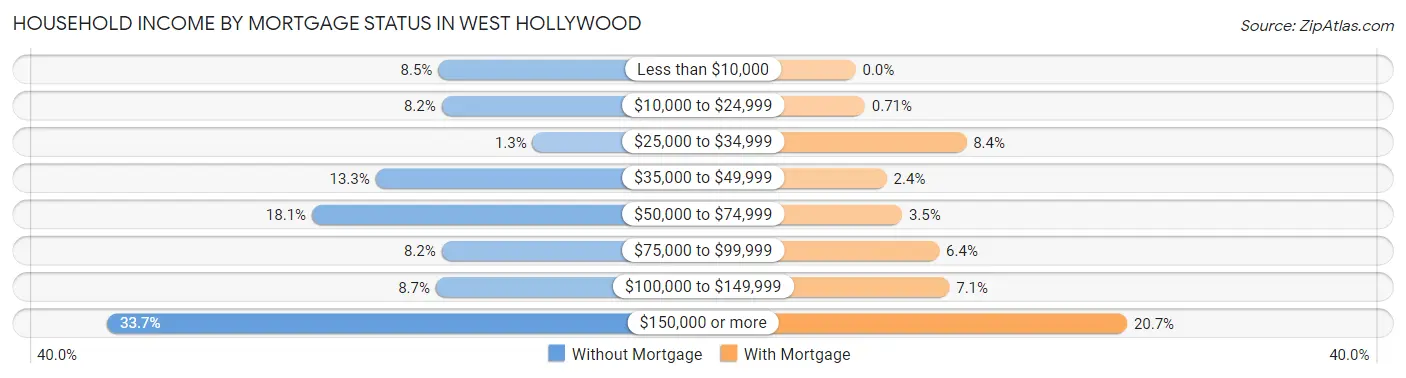
| Household Income | Without Mortgage | With Mortgage |
| Less than $10,000 | 98 (8.5%) | 0 (0.0%) |
| $10,000 to $24,999 | 95 (8.2%) | 23 (0.7%) |
| $25,000 to $34,999 | 15 (1.3%) | 274 (8.4%) |
| $35,000 to $49,999 | 153 (13.3%) | 77 (2.4%) |
| $50,000 to $74,999 | 209 (18.1%) | 115 (3.5%) |
| $75,000 to $99,999 | 95 (8.2%) | 207 (6.4%) |
| $100,000 to $149,999 | 100 (8.7%) | 232 (7.1%) |
| $150,000 or more | 389 (33.7%) | 672 (20.7%) |
| Total | 1,154 (100.0%) | 3,250 (100.0%) |
Property Value to Household Income Ratio in West Hollywood
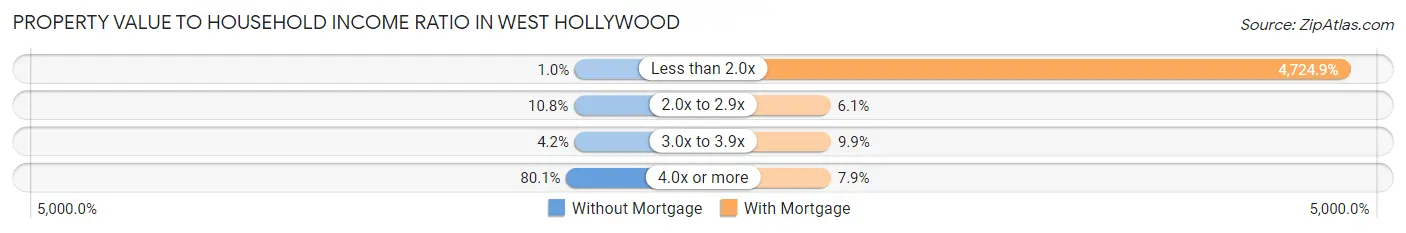
| Value-to-Income Ratio | Without Mortgage | With Mortgage |
| Less than 2.0x | 12 (1.0%) | 153,559 (4,724.9%) |
| 2.0x to 2.9x | 125 (10.8%) | 199 (6.1%) |
| 3.0x to 3.9x | 48 (4.2%) | 320 (9.9%) |
| 4.0x or more | 924 (80.1%) | 257 (7.9%) |
| Total | 1,154 (100.0%) | 3,250 (100.0%) |
Real Estate Taxes by Mortgage Status in West Hollywood
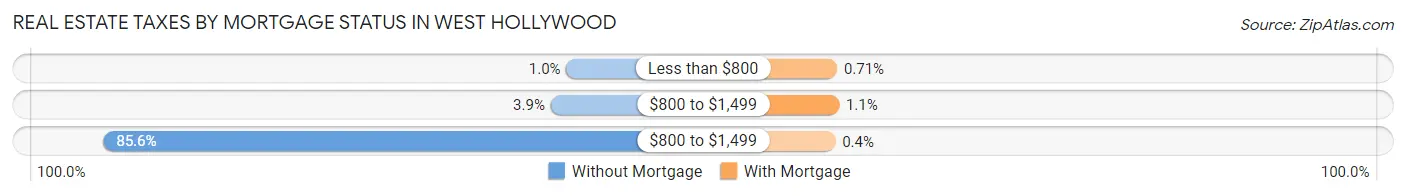
| Property Taxes | Without Mortgage | With Mortgage |
| Less than $800 | 12 (1.0%) | 23 (0.7%) |
| $800 to $1,499 | 45 (3.9%) | 35 (1.1%) |
| $800 to $1,499 | 988 (85.6%) | 13 (0.4%) |
| Total | 1,154 (100.0%) | 3,250 (100.0%) |
Health & Disability in West Hollywood
Health Insurance Coverage by Age in West Hollywood
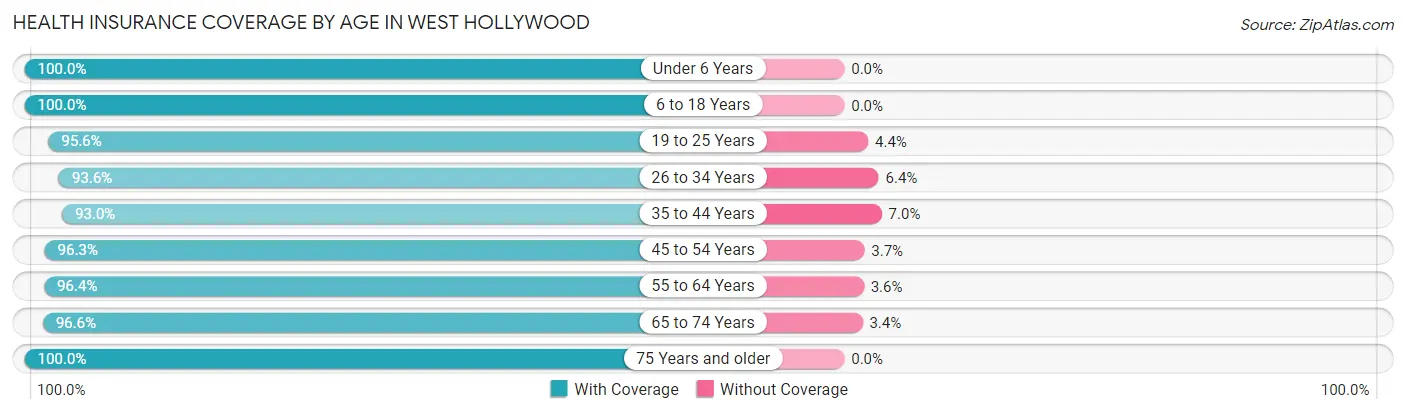
| Age Bracket | With Coverage | Without Coverage |
| Under 6 Years | 768 (100.0%) | 0 (0.0%) |
| 6 to 18 Years | 674 (100.0%) | 0 (0.0%) |
| 19 to 25 Years | 2,623 (95.6%) | 122 (4.4%) |
| 26 to 34 Years | 8,722 (93.6%) | 596 (6.4%) |
| 35 to 44 Years | 5,939 (93.0%) | 445 (7.0%) |
| 45 to 54 Years | 4,661 (96.3%) | 181 (3.7%) |
| 55 to 64 Years | 5,055 (96.4%) | 190 (3.6%) |
| 65 to 74 Years | 2,910 (96.6%) | 102 (3.4%) |
| 75 Years and older | 2,316 (100.0%) | 0 (0.0%) |
| Total | 33,668 (95.4%) | 1,636 (4.6%) |
Health Insurance Coverage by Citizenship Status in West Hollywood
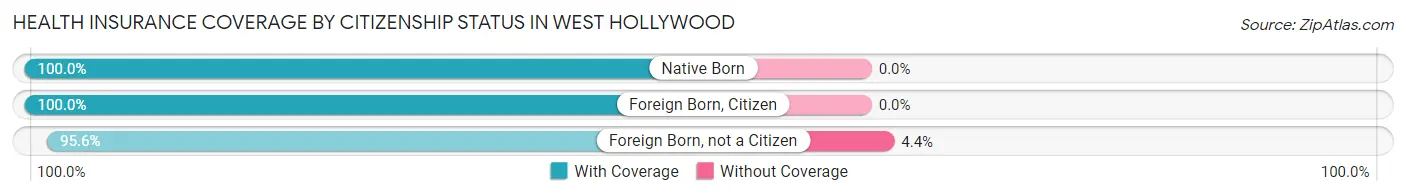
| Citizenship Status | With Coverage | Without Coverage |
| Native Born | 768 (100.0%) | 0 (0.0%) |
| Foreign Born, Citizen | 674 (100.0%) | 0 (0.0%) |
| Foreign Born, not a Citizen | 2,623 (95.6%) | 122 (4.4%) |
Health Insurance Coverage by Household Income in West Hollywood
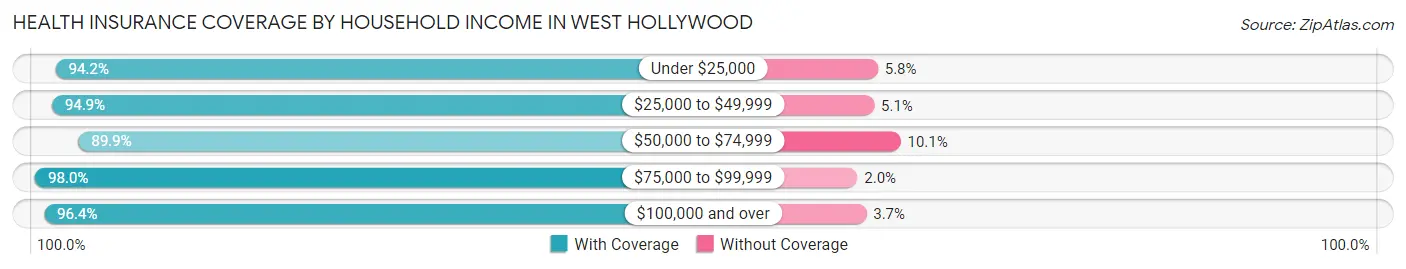
| Household Income | With Coverage | Without Coverage |
| Under $25,000 | 4,446 (94.2%) | 274 (5.8%) |
| $25,000 to $49,999 | 4,378 (94.9%) | 236 (5.1%) |
| $50,000 to $74,999 | 3,553 (89.9%) | 398 (10.1%) |
| $75,000 to $99,999 | 4,467 (98.0%) | 90 (2.0%) |
| $100,000 and over | 16,693 (96.4%) | 633 (3.6%) |
Public vs Private Health Insurance Coverage by Age in West Hollywood
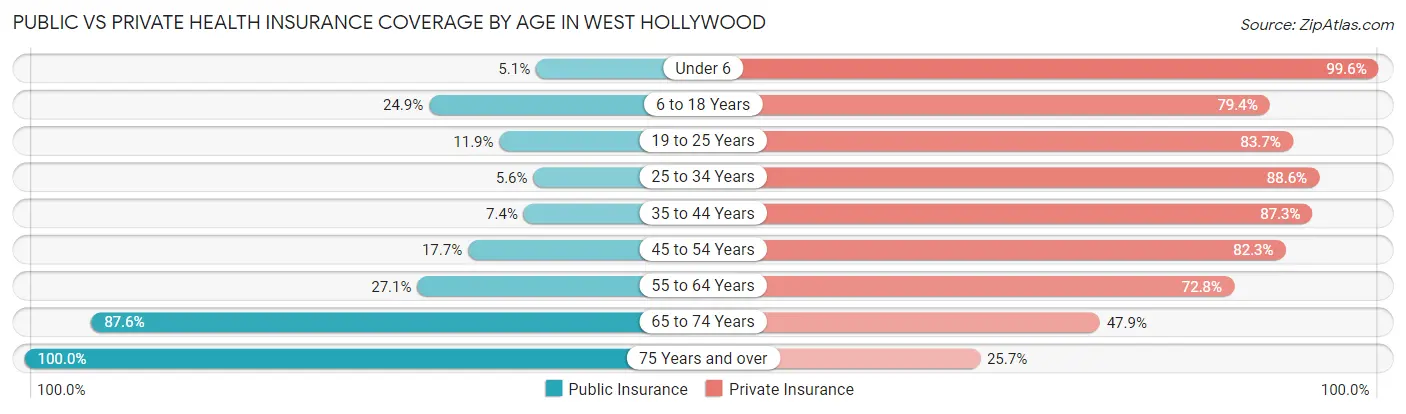
| Age Bracket | Public Insurance | Private Insurance |
| Under 6 | 39 (5.1%) | 765 (99.6%) |
| 6 to 18 Years | 168 (24.9%) | 535 (79.4%) |
| 19 to 25 Years | 326 (11.9%) | 2,297 (83.7%) |
| 25 to 34 Years | 519 (5.6%) | 8,251 (88.5%) |
| 35 to 44 Years | 469 (7.3%) | 5,576 (87.3%) |
| 45 to 54 Years | 857 (17.7%) | 3,986 (82.3%) |
| 55 to 64 Years | 1,422 (27.1%) | 3,817 (72.8%) |
| 65 to 74 Years | 2,639 (87.6%) | 1,442 (47.9%) |
| 75 Years and over | 2,316 (100.0%) | 594 (25.7%) |
| Total | 8,755 (24.8%) | 27,263 (77.2%) |
Disability Status by Sex by Age in West Hollywood
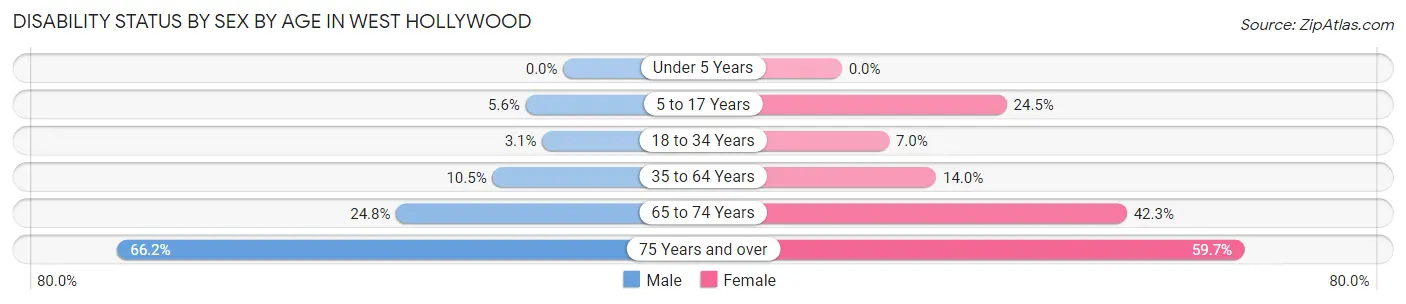
| Age Bracket | Male | Female |
| Under 5 Years | 0 (0.0%) | 0 (0.0%) |
| 5 to 17 Years | 24 (5.6%) | 59 (24.5%) |
| 18 to 34 Years | 178 (3.1%) | 450 (7.0%) |
| 35 to 64 Years | 1,182 (10.5%) | 733 (14.0%) |
| 65 to 74 Years | 397 (24.8%) | 597 (42.3%) |
| 75 Years and over | 661 (66.2%) | 787 (59.7%) |
Disability Class by Sex by Age in West Hollywood
Disability Class: Hearing Difficulty
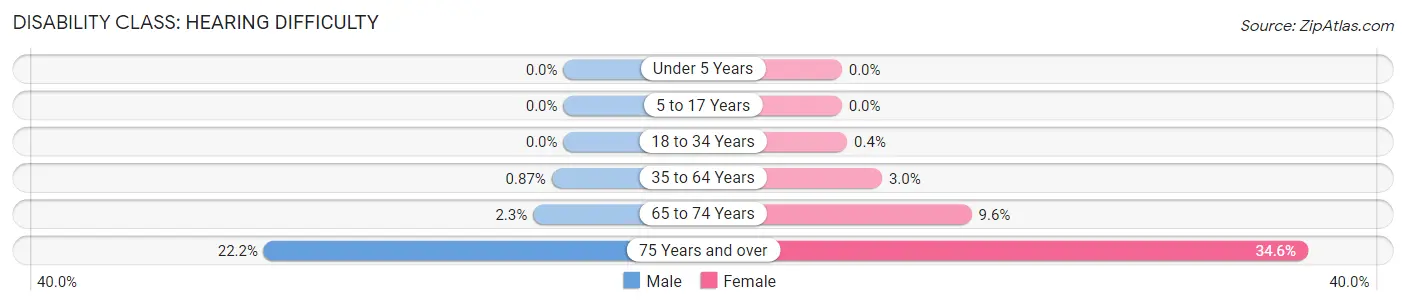
| Age Bracket | Male | Female |
| Under 5 Years | 0 (0.0%) | 0 (0.0%) |
| 5 to 17 Years | 0 (0.0%) | 0 (0.0%) |
| 18 to 34 Years | 0 (0.0%) | 26 (0.4%) |
| 35 to 64 Years | 98 (0.9%) | 156 (3.0%) |
| 65 to 74 Years | 36 (2.2%) | 136 (9.6%) |
| 75 Years and over | 222 (22.2%) | 456 (34.6%) |
Disability Class: Vision Difficulty
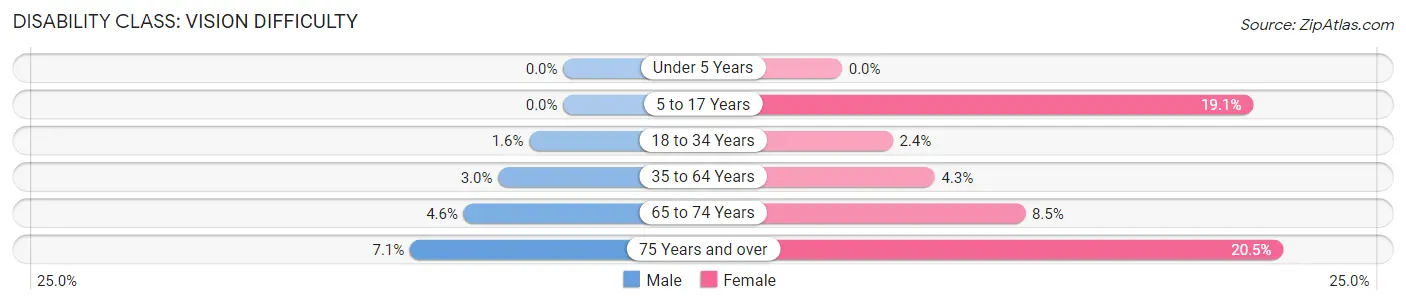
| Age Bracket | Male | Female |
| Under 5 Years | 0 (0.0%) | 0 (0.0%) |
| 5 to 17 Years | 0 (0.0%) | 46 (19.1%) |
| 18 to 34 Years | 90 (1.6%) | 151 (2.4%) |
| 35 to 64 Years | 339 (3.0%) | 225 (4.3%) |
| 65 to 74 Years | 74 (4.6%) | 120 (8.5%) |
| 75 Years and over | 71 (7.1%) | 270 (20.5%) |
Disability Class: Cognitive Difficulty
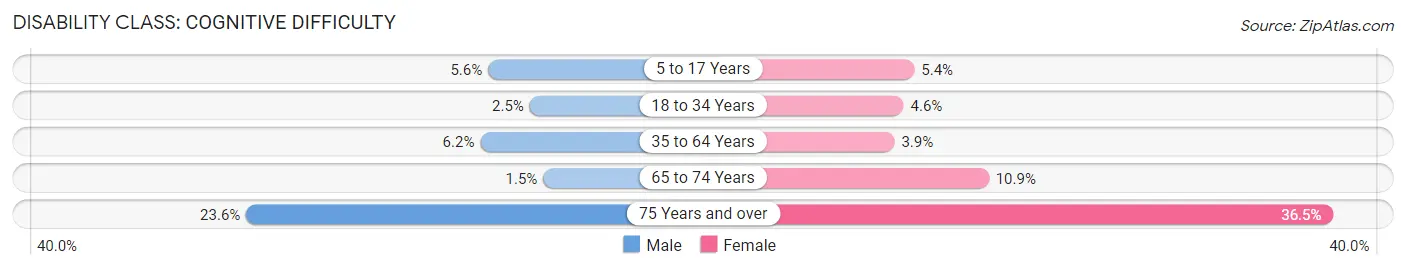
| Age Bracket | Male | Female |
| 5 to 17 Years | 24 (5.6%) | 13 (5.4%) |
| 18 to 34 Years | 142 (2.5%) | 295 (4.6%) |
| 35 to 64 Years | 693 (6.2%) | 205 (3.9%) |
| 65 to 74 Years | 24 (1.5%) | 154 (10.9%) |
| 75 Years and over | 235 (23.5%) | 481 (36.5%) |
Disability Class: Ambulatory Difficulty
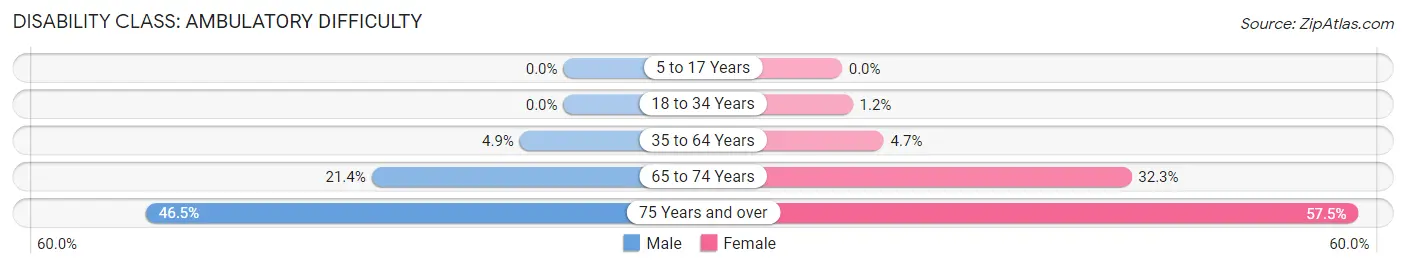
| Age Bracket | Male | Female |
| 5 to 17 Years | 0 (0.0%) | 0 (0.0%) |
| 18 to 34 Years | 0 (0.0%) | 77 (1.2%) |
| 35 to 64 Years | 546 (4.9%) | 244 (4.7%) |
| 65 to 74 Years | 342 (21.4%) | 455 (32.3%) |
| 75 Years and over | 464 (46.5%) | 758 (57.5%) |
Disability Class: Self-Care Difficulty
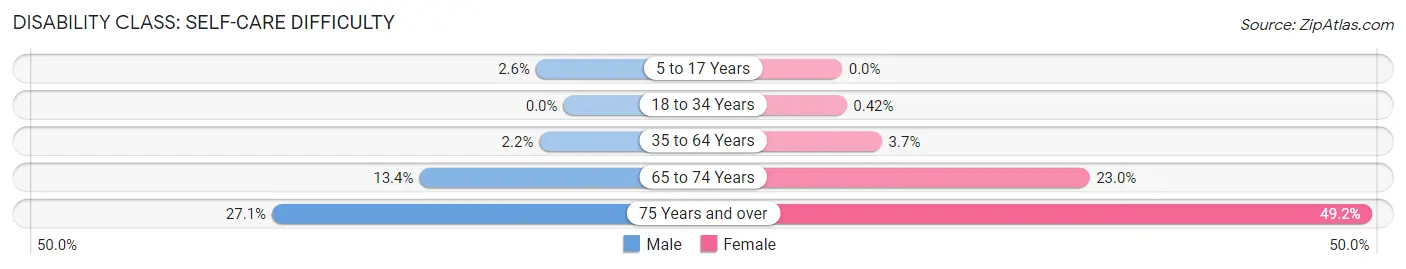
| Age Bracket | Male | Female |
| 5 to 17 Years | 11 (2.6%) | 0 (0.0%) |
| 18 to 34 Years | 0 (0.0%) | 27 (0.4%) |
| 35 to 64 Years | 252 (2.2%) | 194 (3.7%) |
| 65 to 74 Years | 214 (13.4%) | 324 (23.0%) |
| 75 Years and over | 270 (27.1%) | 649 (49.2%) |
Technology Access in West Hollywood
Computing Device Access in West Hollywood
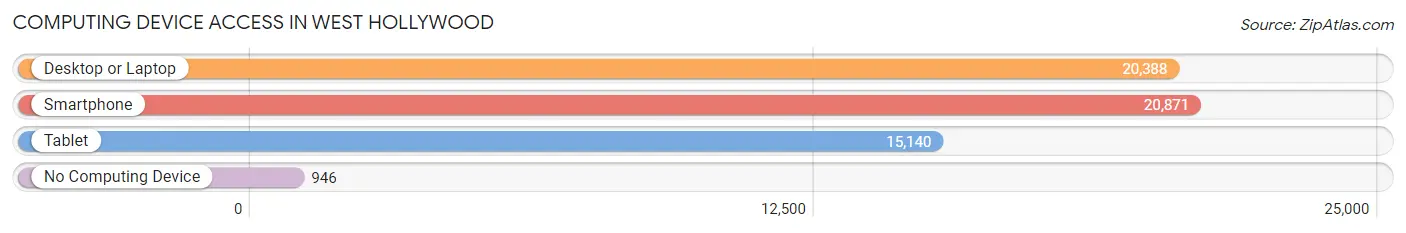
| Device Type | # Households | % Households |
| Desktop or Laptop | 20,388 | 89.3% |
| Smartphone | 20,871 | 91.4% |
| Tablet | 15,140 | 66.3% |
| No Computing Device | 946 | 4.1% |
| Total | 22,836 | 100.0% |
Internet Access in West Hollywood
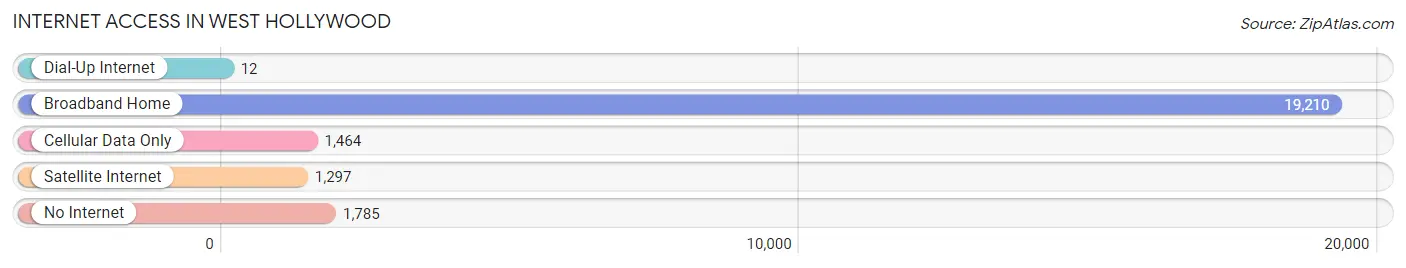
| Internet Type | # Households | % Households |
| Dial-Up Internet | 12 | 0.1% |
| Broadband Home | 19,210 | 84.1% |
| Cellular Data Only | 1,464 | 6.4% |
| Satellite Internet | 1,297 | 5.7% |
| No Internet | 1,785 | 7.8% |
| Total | 22,836 | 100.0% |
West Hollywood Summary
WeHo, as it is affectionately known, is a city located in Los Angeles County, California. It is bordered by the cities of Beverly Hills, West Hollywood, and Hollywood. WeHo is a unique city in that it is an incorporated city, but it is also part of the larger Los Angeles metropolitan area. WeHo is known for its vibrant nightlife, its diverse population, and its progressive politics.
History
WeHo was originally part of the Rancho La Brea Mexican land grant, which was given to Antonio Jose Rocha in 1828. The area was then sold to Benjamin Davis Wilson in 1864. In the late 19th century, the area was developed as a residential area for the wealthy. In the early 20th century, the area became known as a center for the entertainment industry, with many movie studios and nightclubs.
In 1984, the City of West Hollywood was incorporated, becoming the first city in the United States to be incorporated as a city with a majority-LGBTQ population. Since then, WeHo has become a popular destination for LGBTQ people from all over the world.
Geography
WeHo is located in the heart of Los Angeles County, bordered by Beverly Hills, West Hollywood, and Hollywood. It is approximately 2.9 square miles in size, with a population of approximately 35,000 people. The city is divided into two distinct areas: the Sunset Strip and the residential area. The Sunset Strip is known for its vibrant nightlife, while the residential area is known for its quiet, tree-lined streets.
Economy
WeHo is known for its vibrant economy, which is largely driven by the entertainment industry. The city is home to many movie studios, television production companies, and music venues. Additionally, WeHo is home to many restaurants, bars, and nightclubs, which attract tourists from all over the world.
WeHo is also home to many high-end retail stores, art galleries, and boutiques. The city is also home to many corporate offices, including those of major companies such as Apple, Google, and Netflix.
Demographics
WeHo is known for its diverse population. According to the 2010 census, the city had a population of 34,399 people. Of this population, approximately 44% identified as white, 33% identified as Hispanic or Latino, 11% identified as Asian, and 8% identified as African American. Additionally, approximately 10% of the population identified as LGBTQ.
Conclusion
WeHo is a unique city in Los Angeles County, California. It is known for its vibrant nightlife, its diverse population, and its progressive politics. The city is home to many movie studios, television production companies, and music venues, as well as many restaurants, bars, and nightclubs. Additionally, WeHo is home to many corporate offices, including those of major companies such as Apple, Google, and Netflix. The city has a diverse population, with approximately 44% identifying as white, 33% identifying as Hispanic or Latino, 11% identifying as Asian, and 8% identifying as African American. Additionally, approximately 10% of the population identified as LGBTQ.
Common Questions
What is Per Capita Income in West Hollywood?
Per Capita income in West Hollywood is $79,645.
What is the Median Family Income in West Hollywood?
Median Family Income in West Hollywood is $123,811.
What is the Median Household income in West Hollywood?
Median Household Income in West Hollywood is $89,034.
What is Income or Wage Gap in West Hollywood?
Income or Wage Gap in West Hollywood is 15.7%.
Women in West Hollywood earn 84.3 cents for every dollar earned by a man.
What is Inequality or Gini Index in West Hollywood?
Inequality or Gini Index in West Hollywood is 0.51.
What is the Total Population of West Hollywood?
Total Population of West Hollywood is 35,358.
What is the Total Male Population of West Hollywood?
Total Male Population of West Hollywood is 20,291.
What is the Total Female Population of West Hollywood?
Total Female Population of West Hollywood is 15,067.
What is the Ratio of Males per 100 Females in West Hollywood?
There are 134.67 Males per 100 Females in West Hollywood.
What is the Ratio of Females per 100 Males in West Hollywood?
There are 74.25 Females per 100 Males in West Hollywood.
What is the Median Population Age in West Hollywood?
Median Population Age in West Hollywood is 40.3 Years.
What is the Average Family Size in West Hollywood
Average Family Size in West Hollywood is 2.4 People.
What is the Average Household Size in West Hollywood
Average Household Size in West Hollywood is 1.5 People.
How Large is the Labor Force in West Hollywood?
There are 26,540 People in the Labor Forcein in West Hollywood.
What is the Percentage of People in the Labor Force in West Hollywood?
78.0% of People are in the Labor Force in West Hollywood.
What is the Unemployment Rate in West Hollywood?
Unemployment Rate in West Hollywood is 8.0%.