Cities with the Most Immigrants from England in Connecticut
RELATED REPORTS & OPTIONS
England
Connecticut
Compare Cities
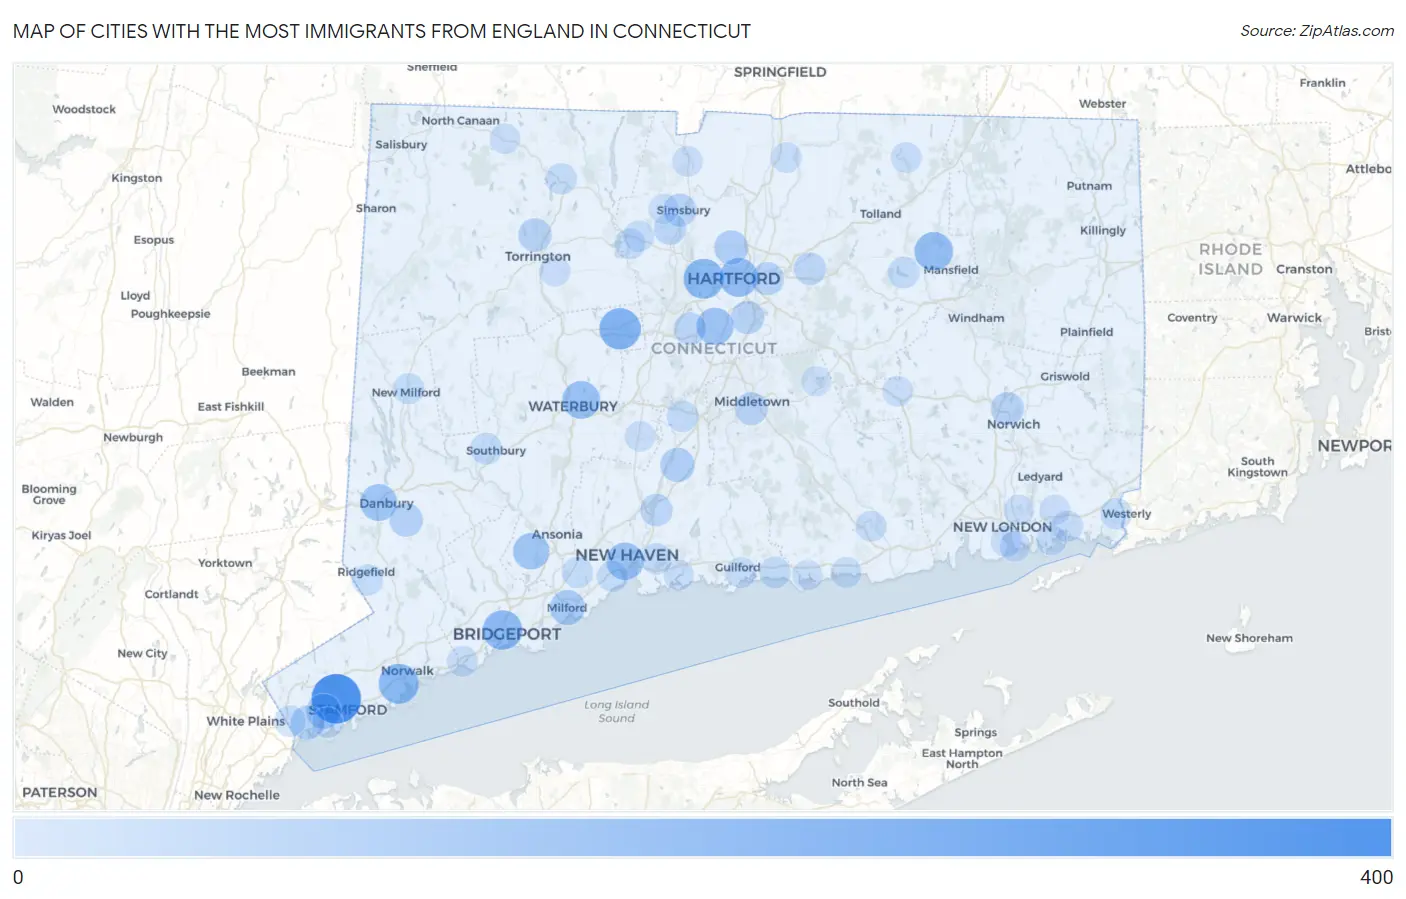
Map of Cities with the Most Immigrants from England in Connecticut
0
400
Cities with the Most Immigrants from England in Connecticut
| City | England | vs State | vs National | |
| 1. | Stamford | 361 | 6,551(5.51%)#1 | 318,896(0.11%)#83 |
| 2. | Bristol | 203 | 6,551(3.10%)#2 | 318,896(0.06%)#182 |
| 3. | West Hartford | 182 | 6,551(2.78%)#3 | 318,896(0.06%)#218 |
| 4. | Norwalk | 179 | 6,551(2.73%)#4 | 318,896(0.06%)#226 |
| 5. | Bridgeport | 170 | 6,551(2.60%)#5 | 318,896(0.05%)#242 |
| 6. | Hartford | 155 | 6,551(2.37%)#6 | 318,896(0.05%)#271 |
| 7. | Storrs | 153 | 6,551(2.34%)#7 | 318,896(0.05%)#278 |
| 8. | Waterbury | 138 | 6,551(2.11%)#8 | 318,896(0.04%)#313 |
| 9. | New Haven | 129 | 6,551(1.97%)#9 | 318,896(0.04%)#340 |
| 10. | Newington | 126 | 6,551(1.92%)#10 | 318,896(0.04%)#363 |
| 11. | Danbury | 121 | 6,551(1.85%)#11 | 318,896(0.04%)#383 |
| 12. | Shelton | 113 | 6,551(1.72%)#12 | 318,896(0.04%)#430 |
| 13. | Staples | 104 | 6,551(1.59%)#13 | 318,896(0.03%)#477 |
| 14. | Milford City Balance | 88 | 6,551(1.34%)#14 | 318,896(0.03%)#575 |
| 15. | Cos Cob | 87 | 6,551(1.33%)#15 | 318,896(0.03%)#585 |
| 16. | Wallingford Center | 74 | 6,551(1.13%)#16 | 318,896(0.02%)#712 |
| 17. | Blue Hills | 72 | 6,551(1.10%)#17 | 318,896(0.02%)#741 |
| 18. | Greenwich | 67 | 6,551(1.02%)#18 | 318,896(0.02%)#790 |
| 19. | Bethel | 61 | 6,551(0.93%)#19 | 318,896(0.02%)#871 |
| 20. | Torrington | 57 | 6,551(0.87%)#20 | 318,896(0.02%)#924 |
| 21. | Wethersfield | 57 | 6,551(0.87%)#21 | 318,896(0.02%)#926 |
| 22. | Norwich | 55 | 6,551(0.84%)#22 | 318,896(0.02%)#967 |
| 23. | Trumbull Center | 55 | 6,551(0.84%)#23 | 318,896(0.02%)#978 |
| 24. | East Hartford | 53 | 6,551(0.81%)#24 | 318,896(0.02%)#1,001 |
| 25. | Simsbury Center | 51 | 6,551(0.78%)#25 | 318,896(0.02%)#1,056 |
| 26. | Old Hill | 51 | 6,551(0.78%)#26 | 318,896(0.02%)#1,058 |
| 27. | Middletown | 49 | 6,551(0.75%)#27 | 318,896(0.02%)#1,089 |
| 28. | New Canaan | 45 | 6,551(0.69%)#28 | 318,896(0.01%)#1,212 |
| 29. | New Britain | 44 | 6,551(0.67%)#29 | 318,896(0.01%)#1,225 |
| 30. | North Haven | 41 | 6,551(0.63%)#30 | 318,896(0.01%)#1,309 |
| 31. | Candlewood Isle | 41 | 6,551(0.63%)#31 | 318,896(0.01%)#1,326 |
| 32. | Manchester | 38 | 6,551(0.58%)#32 | 318,896(0.01%)#1,387 |
| 33. | Weatogue | 38 | 6,551(0.58%)#33 | 318,896(0.01%)#1,406 |
| 34. | Poplar Plains | 36 | 6,551(0.55%)#34 | 318,896(0.01%)#1,463 |
| 35. | Lordship | 30 | 6,551(0.46%)#35 | 318,896(0.01%)#1,702 |
| 36. | Murray | 29 | 6,551(0.44%)#36 | 318,896(0.01%)#1,760 |
| 37. | Pawcatuck | 27 | 6,551(0.41%)#37 | 318,896(0.01%)#1,844 |
| 38. | Heritage Village | 27 | 6,551(0.41%)#38 | 318,896(0.01%)#1,847 |
| 39. | Oronoque | 26 | 6,551(0.40%)#39 | 318,896(0.01%)#1,894 |
| 40. | Meriden | 25 | 6,551(0.38%)#40 | 318,896(0.01%)#1,906 |
| 41. | Madison Center | 24 | 6,551(0.37%)#41 | 318,896(0.01%)#2,014 |
| 42. | South Coventry | 24 | 6,551(0.37%)#42 | 318,896(0.01%)#2,015 |
| 43. | West Haven | 21 | 6,551(0.32%)#43 | 318,896(0.01%)#2,173 |
| 44. | East Haven | 21 | 6,551(0.32%)#44 | 318,896(0.01%)#2,183 |
| 45. | Winsted | 21 | 6,551(0.32%)#45 | 318,896(0.01%)#2,218 |
| 46. | Glenville | 21 | 6,551(0.32%)#46 | 318,896(0.01%)#2,233 |
| 47. | Rock Ridge | 21 | 6,551(0.32%)#47 | 318,896(0.01%)#2,238 |
| 48. | Daniels Farm | 20 | 6,551(0.31%)#48 | 318,896(0.01%)#2,299 |
| 49. | Orange | 19 | 6,551(0.29%)#49 | 318,896(0.01%)#2,349 |
| 50. | New Milford | 18 | 6,551(0.27%)#50 | 318,896(0.01%)#2,477 |
| 51. | Chimney Point | 18 | 6,551(0.27%)#51 | 318,896(0.01%)#2,520 |
| 52. | Ridgefield | 17 | 6,551(0.26%)#52 | 318,896(0.01%)#2,575 |
| 53. | Naugatuck Borough | 16 | 6,551(0.24%)#53 | 318,896(0.01%)#2,618 |
| 54. | Mystic | 15 | 6,551(0.23%)#54 | 318,896(0.00%)#2,771 |
| 55. | Canton Valley | 15 | 6,551(0.23%)#55 | 318,896(0.00%)#2,795 |
| 56. | New London | 14 | 6,551(0.21%)#56 | 318,896(0.00%)#2,821 |
| 57. | Collinsville | 14 | 6,551(0.21%)#57 | 318,896(0.00%)#2,894 |
| 58. | Greens Farms | 13 | 6,551(0.20%)#58 | 318,896(0.00%)#2,995 |
| 59. | Essex Village | 13 | 6,551(0.20%)#59 | 318,896(0.00%)#2,999 |
| 60. | Woodmont Borough | 13 | 6,551(0.20%)#60 | 318,896(0.00%)#3,007 |
| 61. | Southport | 13 | 6,551(0.20%)#61 | 318,896(0.00%)#3,009 |
| 62. | South Wilton | 12 | 6,551(0.18%)#62 | 318,896(0.00%)#3,147 |
| 63. | Southwood Acres | 11 | 6,551(0.17%)#63 | 318,896(0.00%)#3,245 |
| 64. | Stafford Springs | 11 | 6,551(0.17%)#64 | 318,896(0.00%)#3,273 |
| 65. | Compo | 11 | 6,551(0.17%)#65 | 318,896(0.00%)#3,290 |
| 66. | West Mountain | 11 | 6,551(0.17%)#66 | 318,896(0.00%)#3,334 |
| 67. | Guilford Center | 10 | 6,551(0.15%)#67 | 318,896(0.00%)#3,463 |
| 68. | Westbrook Center | 10 | 6,551(0.15%)#68 | 318,896(0.00%)#3,466 |
| 69. | Riverside | 9 | 6,551(0.14%)#69 | 318,896(0.00%)#3,583 |
| 70. | Noroton | 9 | 6,551(0.14%)#70 | 318,896(0.00%)#3,602 |
| 71. | Darien Downtown | 9 | 6,551(0.14%)#71 | 318,896(0.00%)#3,670 |
| 72. | Cornwall Bridge | 9 | 6,551(0.14%)#72 | 318,896(0.00%)#3,684 |
| 73. | Cheshire Village | 8 | 6,551(0.12%)#73 | 318,896(0.00%)#3,762 |
| 74. | Colchester | 8 | 6,551(0.12%)#74 | 318,896(0.00%)#3,769 |
| 75. | Northwest Harwinton | 8 | 6,551(0.12%)#75 | 318,896(0.00%)#3,794 |
| 76. | Salmon Brook | 8 | 6,551(0.12%)#76 | 318,896(0.00%)#3,810 |
| 77. | Noank | 8 | 6,551(0.12%)#77 | 318,896(0.00%)#3,820 |
| 78. | Norfolk | 8 | 6,551(0.12%)#78 | 318,896(0.00%)#3,845 |
| 79. | Branford Center | 7 | 6,551(0.11%)#79 | 318,896(0.00%)#3,921 |
| 80. | Old Mystic | 7 | 6,551(0.11%)#80 | 318,896(0.00%)#3,949 |
| 81. | Groton | 6 | 6,551(0.09%)#81 | 318,896(0.00%)#4,069 |
| 82. | Saugatuck | 6 | 6,551(0.09%)#82 | 318,896(0.00%)#4,115 |
| 83. | Plattsville | 6 | 6,551(0.09%)#83 | 318,896(0.00%)#4,167 |
| 84. | Conning Towers Nautilus Park | 5 | 6,551(0.08%)#84 | 318,896(0.00%)#4,233 |
| 85. | Clinton | 4 | 6,551(0.06%)#85 | 318,896(0.00%)#4,406 |
| 86. | Litchfield Borough | 3 | 6,551(0.05%)#86 | 318,896(0.00%)#4,634 |
| 87. | Stonington Borough | 3 | 6,551(0.05%)#87 | 318,896(0.00%)#4,668 |
| 88. | Lake Pocotopaug | 2 | 6,551(0.03%)#88 | 318,896(0.00%)#4,747 |
| 89. | West Simsbury | 2 | 6,551(0.03%)#89 | 318,896(0.00%)#4,761 |
| 90. | Newtown Borough | 1 | 6,551(0.02%)#90 | 318,896(0.00%)#5,000 |
1
2Common Questions
What are the Top 10 Cities with the Most Immigrants from England in Connecticut?
Top 10 Cities with the Most Immigrants from England in Connecticut are:
#1
361
#2
203
#3
182
#4
179
#5
170
#6
155
#7
153
#8
138
#9
129
#10
126
What city has the Most Immigrants from England in Connecticut?
Stamford has the Most Immigrants from England in Connecticut with 361.
What is the Total Immigrants from England in the State of Connecticut?
Total Immigrants from England in Connecticut is 6,551.
What is the Total Immigrants from England in the United States?
Total Immigrants from England in the United States is 318,896.