Melbourne, FL Map & Demographics
Melbourne Map
Melbourne Overview
$34,236
PER CAPITA INCOME
$74,196
AVG FAMILY INCOME
$60,917
AVG HOUSEHOLD INCOME
22.4%
WAGE / INCOME GAP [ % ]
77.6¢/ $1
WAGE / INCOME GAP [ $ ]
$12,496
FAMILY INCOME DEFICIT
0.44
INEQUALITY / GINI INDEX
84,982
TOTAL POPULATION
41,662
MALE POPULATION
43,320
FEMALE POPULATION
96.17
MALES / 100 FEMALES
103.98
FEMALES / 100 MALES
42.4
MEDIAN AGE
3.0
AVG FAMILY SIZE
2.3
AVG HOUSEHOLD SIZE
42,233
LABOR FORCE [ PEOPLE ]
58.6%
PERCENT IN LABOR FORCE
4.6%
UNEMPLOYMENT RATE
Melbourne Area Codes
Income in Melbourne
Income Overview in Melbourne
Per Capita Income in Melbourne is $34,236, while median incomes of families and households are $74,196 and $60,917 respectively.
| Characteristic | Number | Measure |
| Per Capita Income | 84,982 | $34,236 |
| Median Family Income | 19,643 | $74,196 |
| Mean Family Income | 19,643 | $91,717 |
| Median Household Income | 35,438 | $60,917 |
| Mean Household Income | 35,438 | $77,652 |
| Income Deficit | 19,643 | $12,496 |
| Wage / Income Gap (%) | 84,982 | 22.36% |
| Wage / Income Gap ($) | 84,982 | 77.64¢ per $1 |
| Gini / Inequality Index | 84,982 | 0.44 |
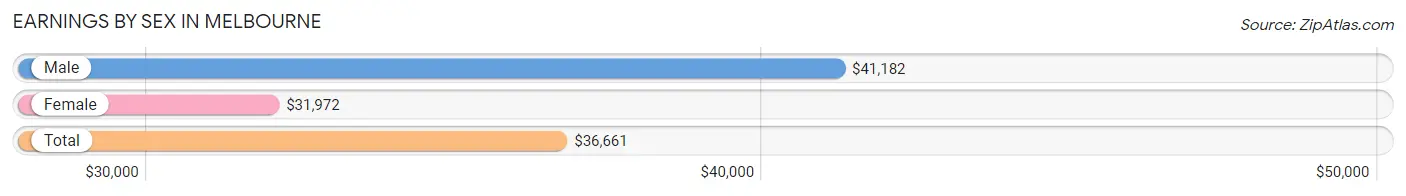
Earnings by Sex in Melbourne
Average Earnings in Melbourne are $36,661, $41,182 for men and $31,972 for women, a difference of 22.4%.
| Sex | Number | Average Earnings |
| Male | 23,582 (53.1%) | $41,182 |
| Female | 20,794 (46.9%) | $31,972 |
| Total | 44,376 (100.0%) | $36,661 |
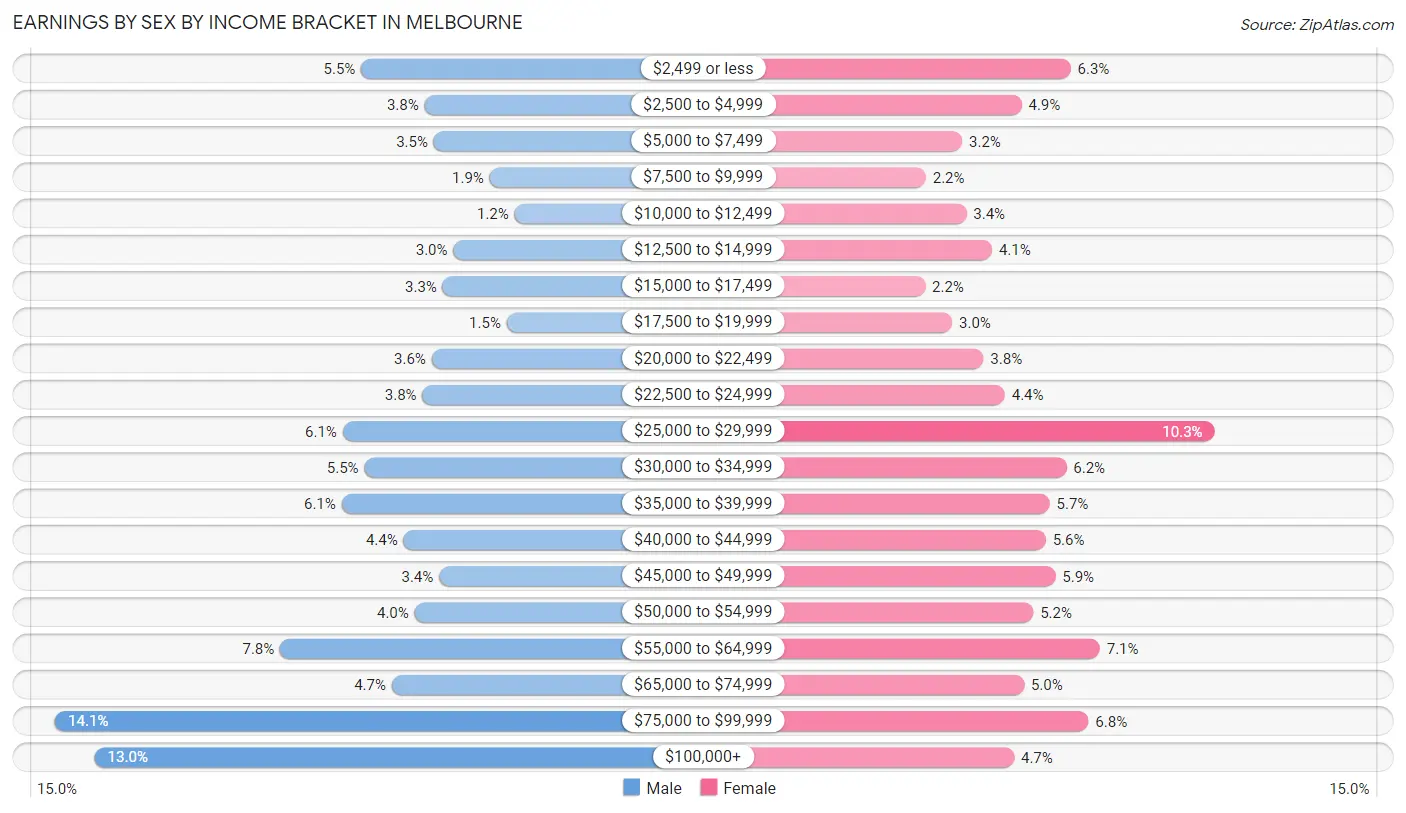
Earnings by Sex by Income Bracket in Melbourne
The most common earnings brackets in Melbourne are $75,000 to $99,999 for men (3,334 | 14.1%) and $25,000 to $29,999 for women (2,147 | 10.3%).
| Income | Male | Female |
| $2,499 or less | 1,306 (5.5%) | 1,308 (6.3%) |
| $2,500 to $4,999 | 887 (3.8%) | 1,021 (4.9%) |
| $5,000 to $7,499 | 825 (3.5%) | 674 (3.2%) |
| $7,500 to $9,999 | 456 (1.9%) | 462 (2.2%) |
| $10,000 to $12,499 | 291 (1.2%) | 698 (3.4%) |
| $12,500 to $14,999 | 695 (2.9%) | 849 (4.1%) |
| $15,000 to $17,499 | 767 (3.3%) | 458 (2.2%) |
| $17,500 to $19,999 | 343 (1.5%) | 615 (3.0%) |
| $20,000 to $22,499 | 840 (3.6%) | 798 (3.8%) |
| $22,500 to $24,999 | 900 (3.8%) | 923 (4.4%) |
| $25,000 to $29,999 | 1,429 (6.1%) | 2,147 (10.3%) |
| $30,000 to $34,999 | 1,285 (5.4%) | 1,284 (6.2%) |
| $35,000 to $39,999 | 1,437 (6.1%) | 1,185 (5.7%) |
| $40,000 to $44,999 | 1,026 (4.3%) | 1,163 (5.6%) |
| $45,000 to $49,999 | 789 (3.4%) | 1,218 (5.9%) |
| $50,000 to $54,999 | 953 (4.0%) | 1,089 (5.2%) |
| $55,000 to $64,999 | 1,844 (7.8%) | 1,478 (7.1%) |
| $65,000 to $74,999 | 1,103 (4.7%) | 1,036 (5.0%) |
| $75,000 to $99,999 | 3,334 (14.1%) | 1,411 (6.8%) |
| $100,000+ | 3,072 (13.0%) | 977 (4.7%) |
| Total | 23,582 (100.0%) | 20,794 (100.0%) |
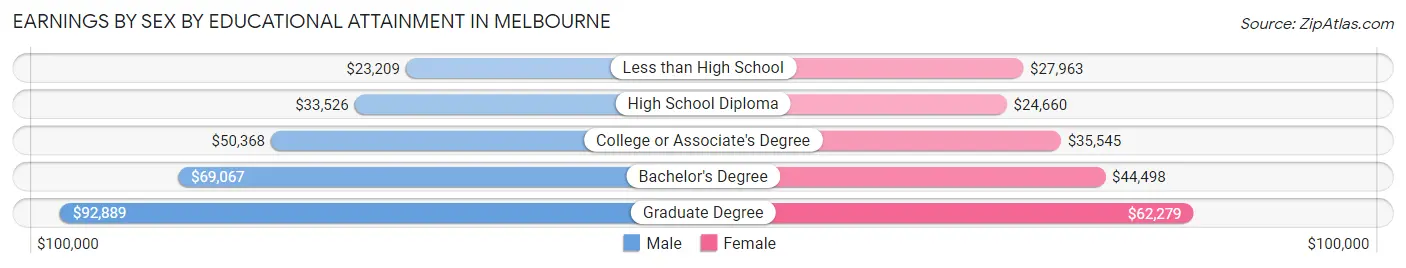
Earnings by Sex by Educational Attainment in Melbourne
Average earnings in Melbourne are $49,105 for men and $37,432 for women, a difference of 23.8%. Men with an educational attainment of graduate degree enjoy the highest average annual earnings of $92,889, while those with less than high school education earn the least with $23,209. Women with an educational attainment of graduate degree earn the most with the average annual earnings of $62,279, while those with high school diploma education have the smallest earnings of $24,660.
| Educational Attainment | Male Income | Female Income |
| Less than High School | $23,209 | $27,963 |
| High School Diploma | $33,526 | $24,660 |
| College or Associate's Degree | $50,368 | $35,545 |
| Bachelor's Degree | $69,067 | $44,498 |
| Graduate Degree | $92,889 | $62,279 |
| Total | $49,105 | $37,432 |
Family Income in Melbourne
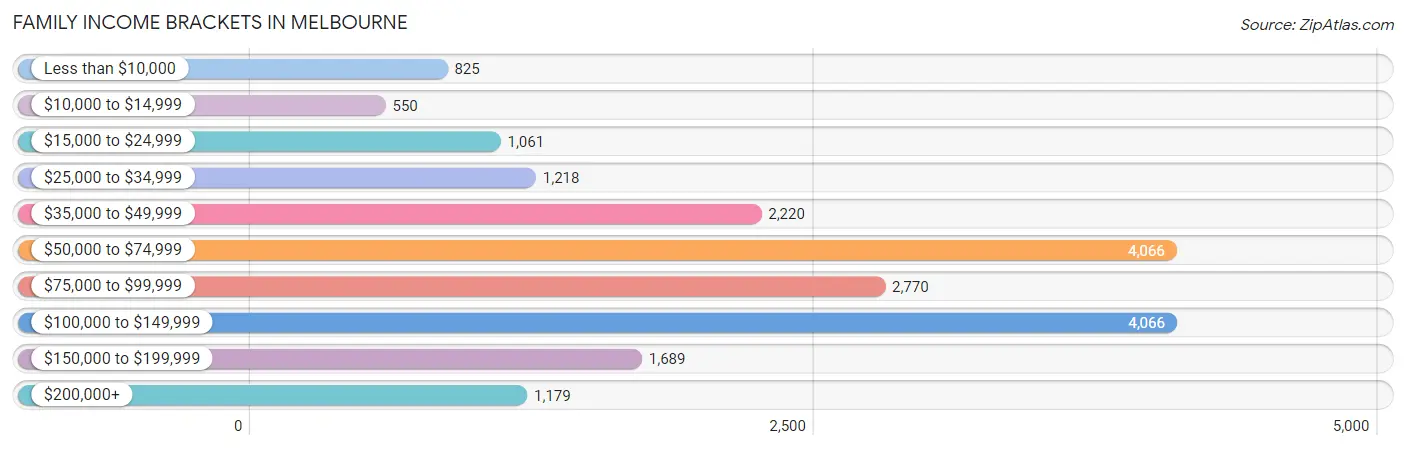
Family Income Brackets in Melbourne
According to the Melbourne family income data, there are 4,066 families falling into the $50,000 to $74,999 income range, which is the most common income bracket and makes up 20.7% of all families. Conversely, the $10,000 to $14,999 income bracket is the least frequent group with only 550 families (2.8%) belonging to this category.
| Income Bracket | # Families | % Families |
| Less than $10,000 | 825 | 4.2% |
| $10,000 to $14,999 | 550 | 2.8% |
| $15,000 to $24,999 | 1,061 | 5.4% |
| $25,000 to $34,999 | 1,218 | 6.2% |
| $35,000 to $49,999 | 2,220 | 11.3% |
| $50,000 to $74,999 | 4,066 | 20.7% |
| $75,000 to $99,999 | 2,770 | 14.1% |
| $100,000 to $149,999 | 4,066 | 20.7% |
| $150,000 to $199,999 | 1,689 | 8.6% |
| $200,000+ | 1,179 | 6.0% |
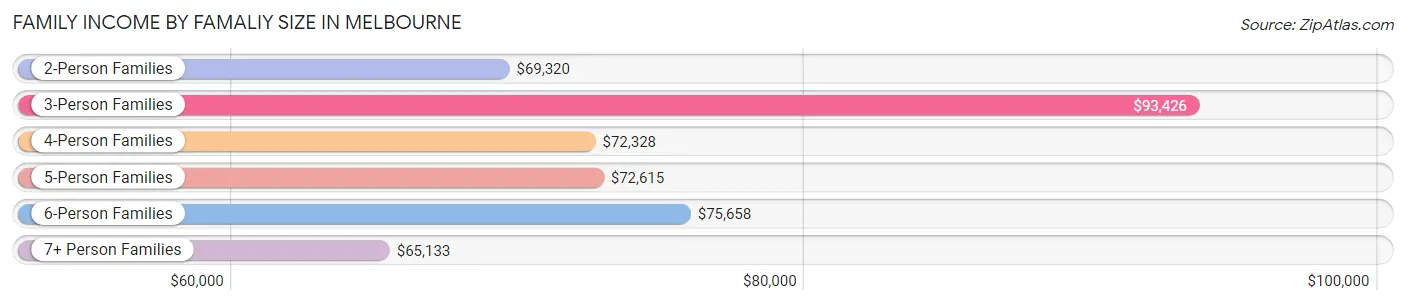
Family Income by Famaliy Size in Melbourne
3-person families (4,406 | 22.4%) account for the highest median family income in Melbourne with $93,426 per family, while 2-person families (10,990 | 55.9%) have the highest median income of $34,660 per family member.
| Income Bracket | # Families | Median Income |
| 2-Person Families | 10,990 (55.9%) | $69,320 |
| 3-Person Families | 4,406 (22.4%) | $93,426 |
| 4-Person Families | 2,389 (12.2%) | $72,328 |
| 5-Person Families | 1,055 (5.4%) | $72,615 |
| 6-Person Families | 588 (3.0%) | $75,658 |
| 7+ Person Families | 215 (1.1%) | $65,133 |
| Total | 19,643 (100.0%) | $74,196 |
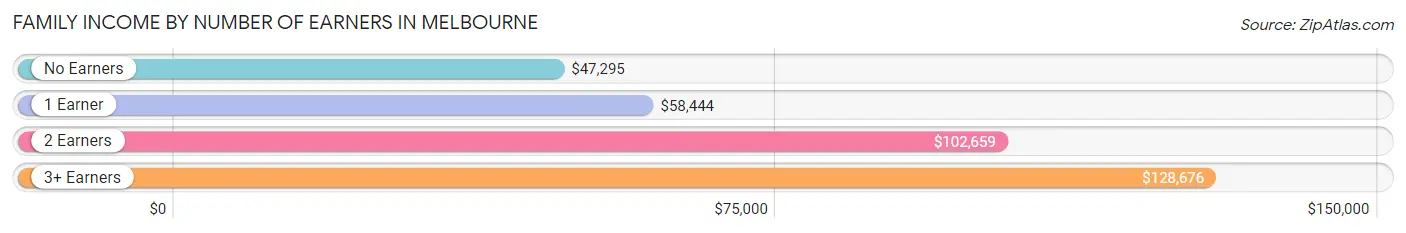
Family Income by Number of Earners in Melbourne
The median family income in Melbourne is $74,196, with families comprising 3+ earners (1,626) having the highest median family income of $128,676, while families with no earners (3,593) have the lowest median family income of $47,295, accounting for 8.3% and 18.3% of families, respectively.
| Number of Earners | # Families | Median Income |
| No Earners | 3,593 (18.3%) | $47,295 |
| 1 Earner | 6,849 (34.9%) | $58,444 |
| 2 Earners | 7,575 (38.6%) | $102,659 |
| 3+ Earners | 1,626 (8.3%) | $128,676 |
| Total | 19,643 (100.0%) | $74,196 |
Household Income in Melbourne
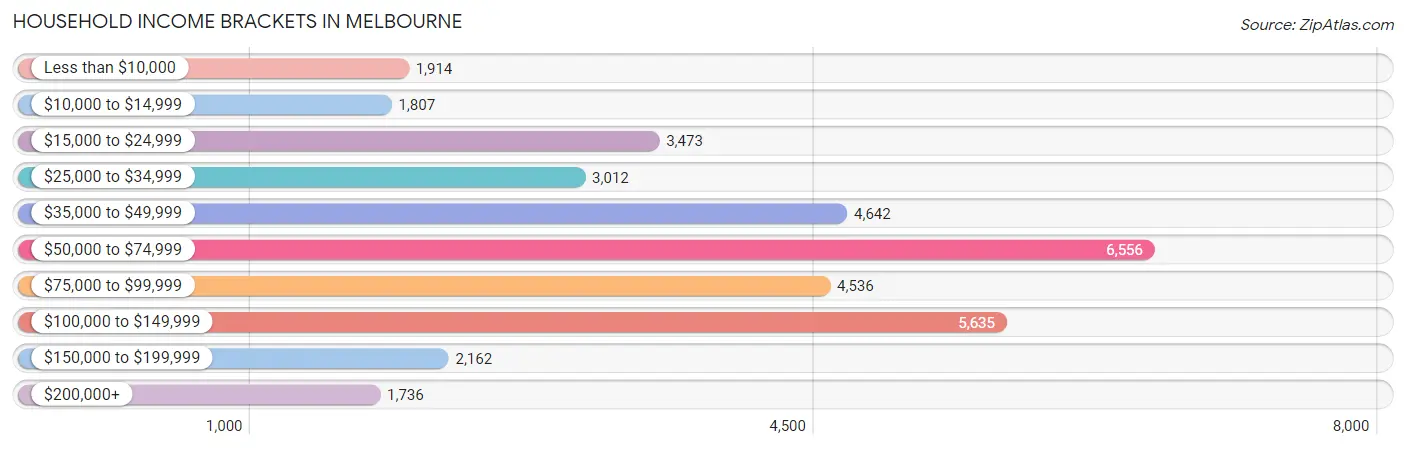
Household Income Brackets in Melbourne
With 6,556 households falling in the category, the $50,000 to $74,999 income range is the most frequent in Melbourne, accounting for 18.5% of all households. In contrast, only 1,736 households (4.9%) fall into the $200,000+ income bracket, making it the least populous group.
| Income Bracket | # Households | % Households |
| Less than $10,000 | 1,914 | 5.4% |
| $10,000 to $14,999 | 1,807 | 5.1% |
| $15,000 to $24,999 | 3,473 | 9.8% |
| $25,000 to $34,999 | 3,012 | 8.5% |
| $35,000 to $49,999 | 4,642 | 13.1% |
| $50,000 to $74,999 | 6,556 | 18.5% |
| $75,000 to $99,999 | 4,536 | 12.8% |
| $100,000 to $149,999 | 5,635 | 15.9% |
| $150,000 to $199,999 | 2,162 | 6.1% |
| $200,000+ | 1,736 | 4.9% |
Household Income by Householder Age in Melbourne
The median household income in Melbourne is $60,917, with the highest median household income of $71,342 found in the 45 to 64 years age bracket for the primary householder. A total of 12,079 households (34.1%) fall into this category. Meanwhile, the 15 to 24 years age bracket for the primary householder has the lowest median household income of $43,835, with 1,637 households (4.6%) in this group.
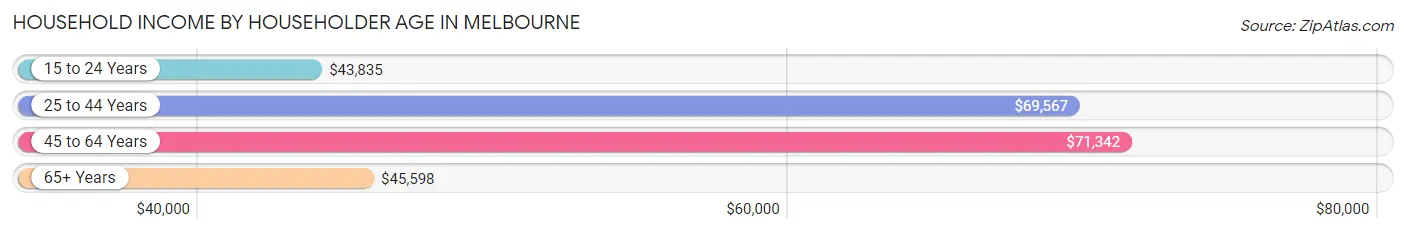
| Income Bracket | # Households | Median Income |
| 15 to 24 Years | 1,637 (4.6%) | $43,835 |
| 25 to 44 Years | 10,005 (28.2%) | $69,567 |
| 45 to 64 Years | 12,079 (34.1%) | $71,342 |
| 65+ Years | 11,717 (33.1%) | $45,598 |
| Total | 35,438 (100.0%) | $60,917 |
Poverty in Melbourne
Income Below Poverty by Sex and Age in Melbourne
With 14.8% poverty level for males and 15.4% for females among the residents of Melbourne, 5 year old males and 15 year old females are the most vulnerable to poverty, with 117 males (34.5%) and 74 females (29.5%) in their respective age groups living below the poverty level.
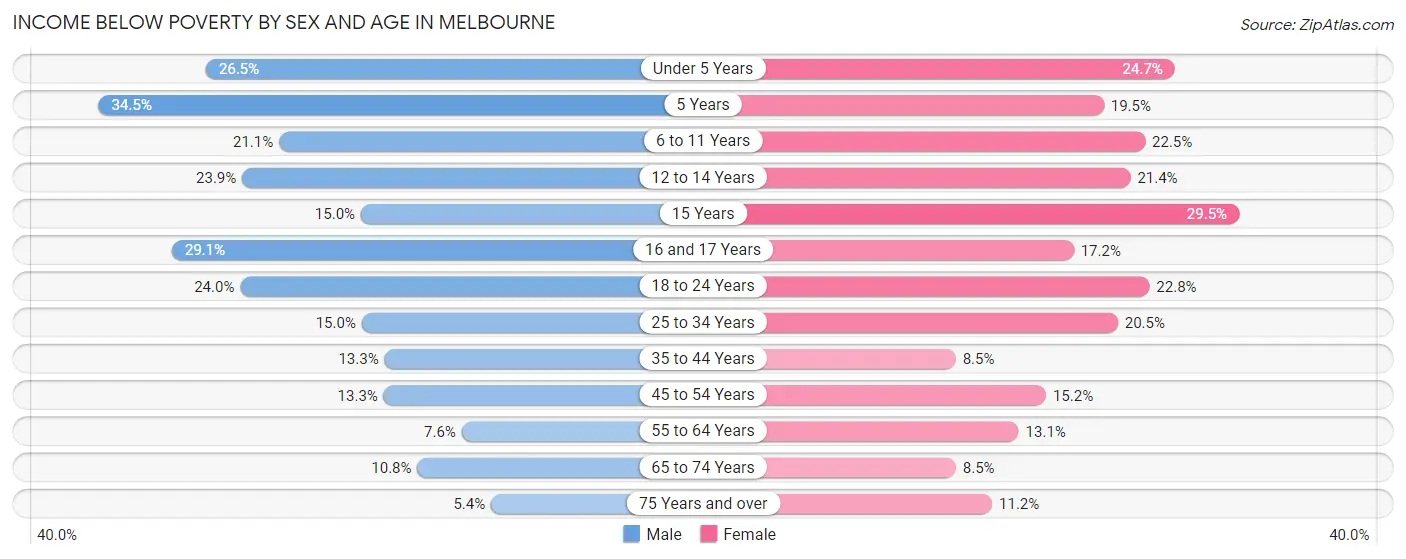
| Age Bracket | Male | Female |
| Under 5 Years | 440 (26.5%) | 548 (24.7%) |
| 5 Years | 117 (34.5%) | 106 (19.5%) |
| 6 to 11 Years | 515 (21.1%) | 519 (22.5%) |
| 12 to 14 Years | 316 (23.8%) | 267 (21.4%) |
| 15 Years | 46 (15.0%) | 74 (29.5%) |
| 16 and 17 Years | 282 (29.1%) | 161 (17.2%) |
| 18 to 24 Years | 947 (24.0%) | 626 (22.8%) |
| 25 to 34 Years | 859 (15.0%) | 1,259 (20.5%) |
| 35 to 44 Years | 650 (13.3%) | 342 (8.5%) |
| 45 to 54 Years | 630 (13.3%) | 739 (15.2%) |
| 55 to 64 Years | 448 (7.5%) | 858 (13.1%) |
| 65 to 74 Years | 478 (10.8%) | 462 (8.5%) |
| 75 Years and over | 161 (5.4%) | 521 (11.2%) |
| Total | 5,889 (14.8%) | 6,482 (15.4%) |
Income Above Poverty by Sex and Age in Melbourne
According to the poverty statistics in Melbourne, males aged 75 years and over and females aged 35 to 44 years are the age groups that are most secure financially, with 94.6% of males and 91.5% of females in these age groups living above the poverty line.
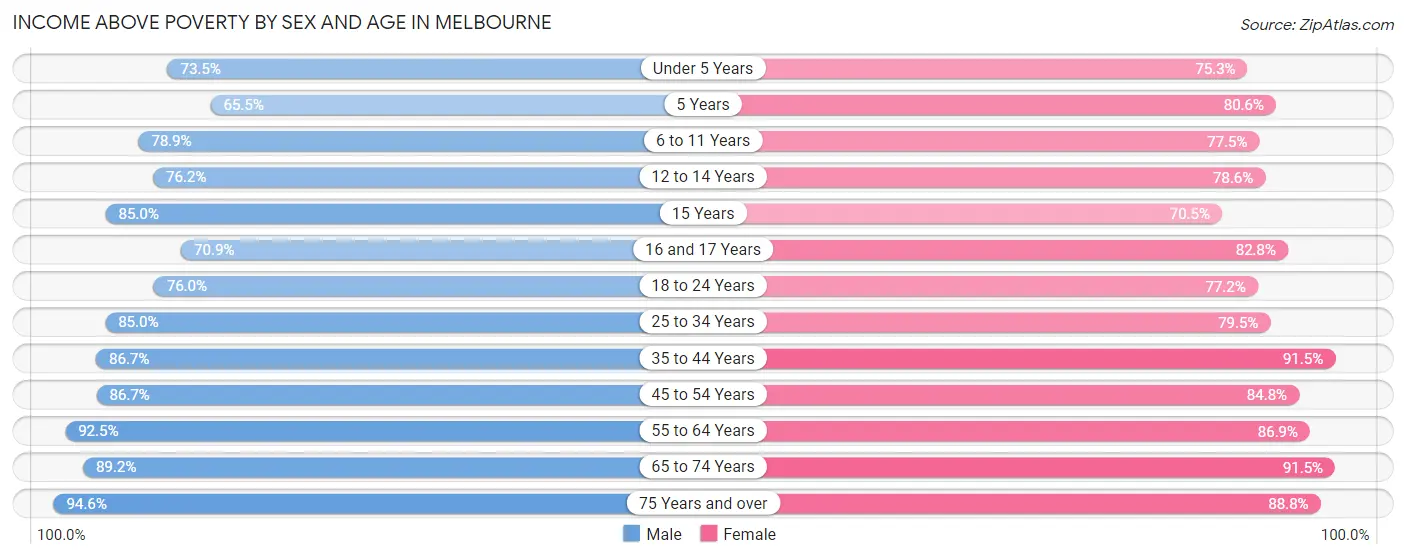
| Age Bracket | Male | Female |
| Under 5 Years | 1,218 (73.5%) | 1,670 (75.3%) |
| 5 Years | 222 (65.5%) | 439 (80.5%) |
| 6 to 11 Years | 1,925 (78.9%) | 1,786 (77.5%) |
| 12 to 14 Years | 1,009 (76.1%) | 979 (78.6%) |
| 15 Years | 260 (85.0%) | 177 (70.5%) |
| 16 and 17 Years | 688 (70.9%) | 774 (82.8%) |
| 18 to 24 Years | 3,000 (76.0%) | 2,115 (77.2%) |
| 25 to 34 Years | 4,881 (85.0%) | 4,884 (79.5%) |
| 35 to 44 Years | 4,243 (86.7%) | 3,702 (91.5%) |
| 45 to 54 Years | 4,094 (86.7%) | 4,136 (84.8%) |
| 55 to 64 Years | 5,482 (92.4%) | 5,675 (86.9%) |
| 65 to 74 Years | 3,931 (89.2%) | 4,995 (91.5%) |
| 75 Years and over | 2,837 (94.6%) | 4,148 (88.8%) |
| Total | 33,790 (85.2%) | 35,480 (84.6%) |
Income Below Poverty Among Married-Couple Families in Melbourne
The poverty statistics for married-couple families in Melbourne show that 7.3% or 1,009 of the total 13,766 families live below the poverty line. Families with 5 or more children have the highest poverty rate of 39.4%, comprising of 41 families. On the other hand, families with no children have the lowest poverty rate of 3.4%, which includes 308 families.
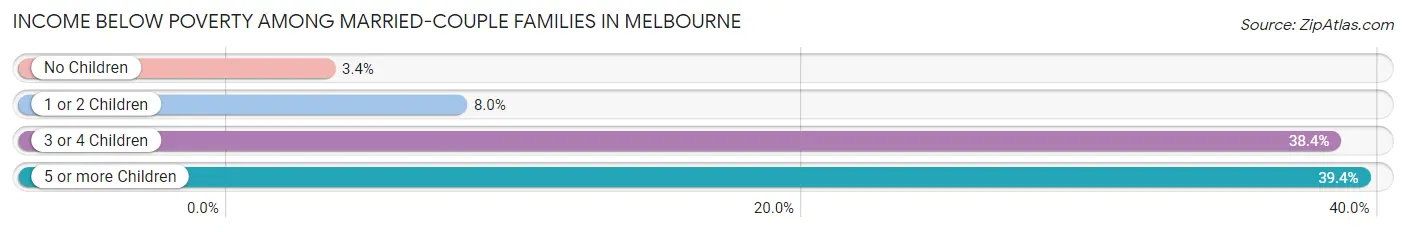
| Children | Above Poverty | Below Poverty |
| No Children | 8,811 (96.6%) | 308 (3.4%) |
| 1 or 2 Children | 3,280 (92.0%) | 284 (8.0%) |
| 3 or 4 Children | 603 (61.6%) | 376 (38.4%) |
| 5 or more Children | 63 (60.6%) | 41 (39.4%) |
| Total | 12,757 (92.7%) | 1,009 (7.3%) |
Income Below Poverty Among Single-Parent Households in Melbourne
According to the poverty data in Melbourne, 7.9% or 127 single-father households and 21.6% or 920 single-mother households are living below the poverty line. Among single-father households, those with no children have the highest poverty rate, with 95 households (13.3%) experiencing poverty. Likewise, among single-mother households, those with 3 or 4 children have the highest poverty rate, with 224 households (56.6%) falling below the poverty line.
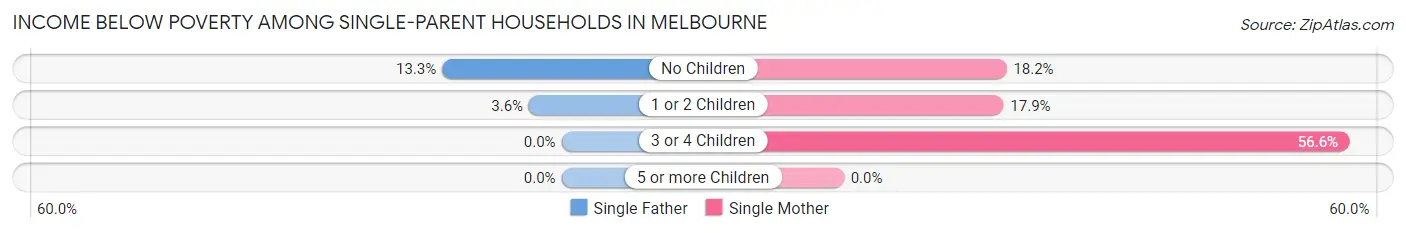
| Children | Single Father | Single Mother |
| No Children | 95 (13.3%) | 364 (18.2%) |
| 1 or 2 Children | 32 (3.6%) | 332 (17.8%) |
| 3 or 4 Children | 0 (0.0%) | 224 (56.6%) |
| 5 or more Children | 0 (0.0%) | 0 (0.0%) |
| Total | 127 (7.9%) | 920 (21.6%) |
Income Below Poverty Among Married-Couple vs Single-Parent Households in Melbourne
The poverty data for Melbourne shows that 1,009 of the married-couple family households (7.3%) and 1,047 of the single-parent households (17.8%) are living below the poverty level. Within the married-couple family households, those with 5 or more children have the highest poverty rate, with 41 households (39.4%) falling below the poverty line. Among the single-parent households, those with 3 or 4 children have the highest poverty rate, with 224 household (53.2%) living below poverty.
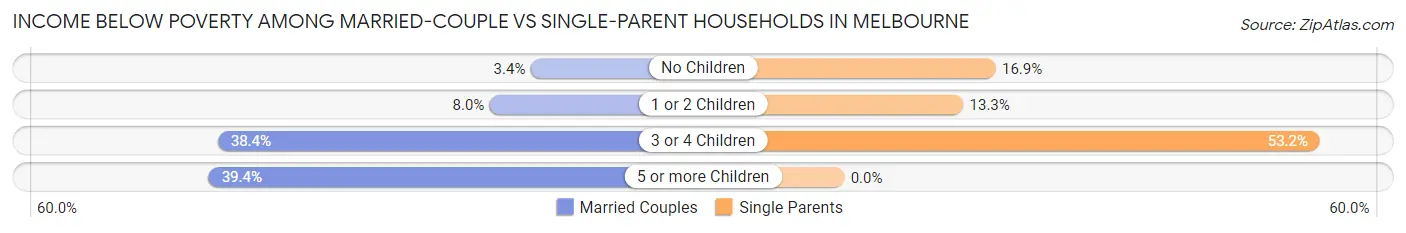
| Children | Married-Couple Families | Single-Parent Households |
| No Children | 308 (3.4%) | 459 (16.9%) |
| 1 or 2 Children | 284 (8.0%) | 364 (13.3%) |
| 3 or 4 Children | 376 (38.4%) | 224 (53.2%) |
| 5 or more Children | 41 (39.4%) | 0 (0.0%) |
| Total | 1,009 (7.3%) | 1,047 (17.8%) |
Race in Melbourne
The most populous races in Melbourne are White / Caucasian (64,777 | 76.2%), Hispanic or Latino (10,235 | 12.0%), and Black / African American (8,659 | 10.2%).
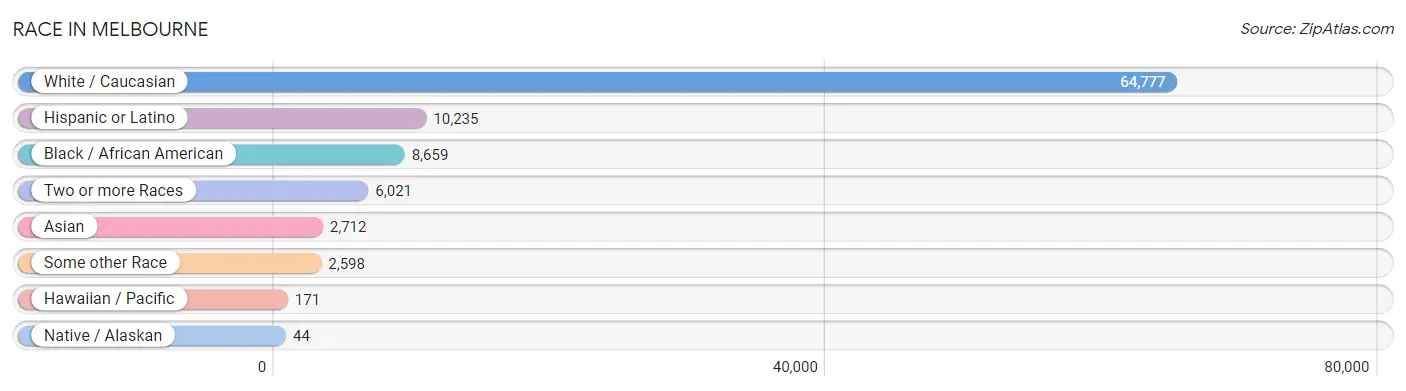
| Race | # Population | % Population |
| Asian | 2,712 | 3.2% |
| Black / African American | 8,659 | 10.2% |
| Hawaiian / Pacific | 171 | 0.2% |
| Hispanic or Latino | 10,235 | 12.0% |
| Native / Alaskan | 44 | 0.1% |
| White / Caucasian | 64,777 | 76.2% |
| Two or more Races | 6,021 | 7.1% |
| Some other Race | 2,598 | 3.1% |
| Total | 84,982 | 100.0% |
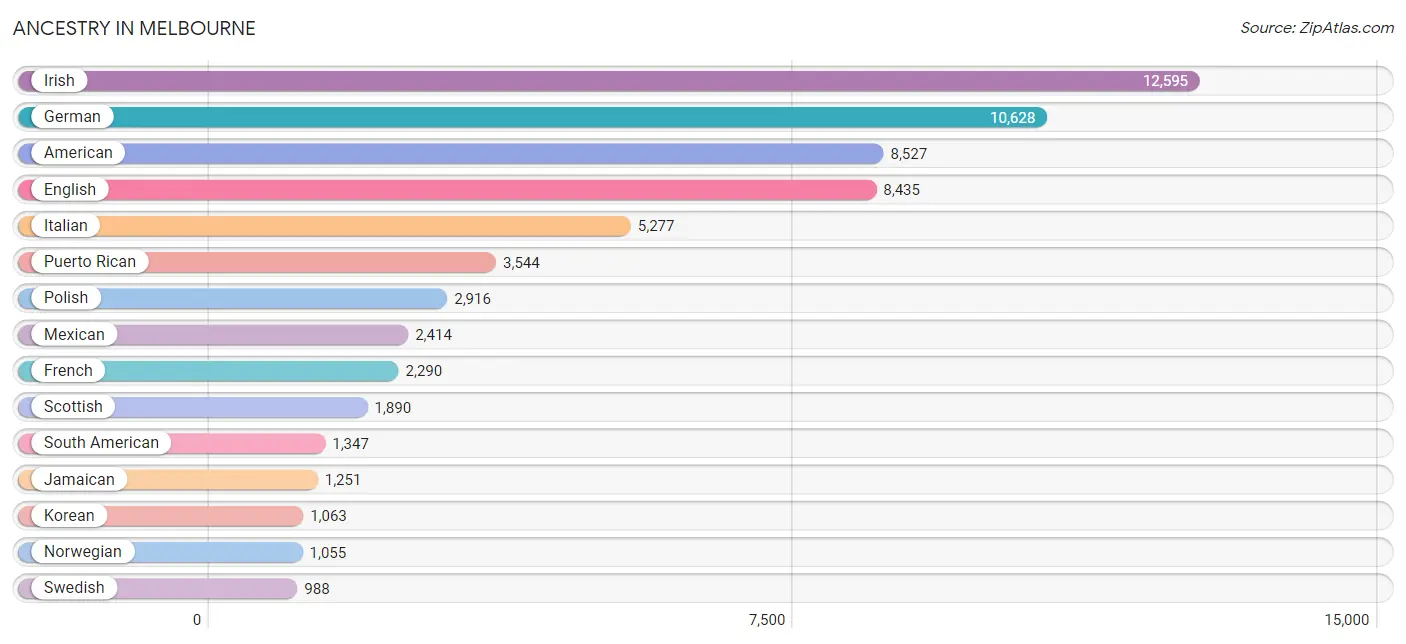
Ancestry in Melbourne
The most populous ancestries reported in Melbourne are Irish (12,595 | 14.8%), German (10,628 | 12.5%), American (8,527 | 10.0%), English (8,435 | 9.9%), and Italian (5,277 | 6.2%), together accounting for 53.5% of all Melbourne residents.
| Ancestry | # Population | % Population |
| African | 347 | 0.4% |
| Alaska Native | 5 | 0.0% |
| Albanian | 26 | 0.0% |
| American | 8,527 | 10.0% |
| Arab | 680 | 0.8% |
| Argentinean | 40 | 0.1% |
| Armenian | 67 | 0.1% |
| Australian | 90 | 0.1% |
| Austrian | 274 | 0.3% |
| Bahamian | 95 | 0.1% |
| Barbadian | 12 | 0.0% |
| Basque | 81 | 0.1% |
| Belgian | 31 | 0.0% |
| Belizean | 21 | 0.0% |
| Bhutanese | 412 | 0.5% |
| Blackfeet | 100 | 0.1% |
| Bolivian | 28 | 0.0% |
| Brazilian | 325 | 0.4% |
| British | 315 | 0.4% |
| British West Indian | 80 | 0.1% |
| Bulgarian | 24 | 0.0% |
| Burmese | 314 | 0.4% |
| Canadian | 215 | 0.3% |
| Cape Verdean | 26 | 0.0% |
| Celtic | 8 | 0.0% |
| Central American | 780 | 0.9% |
| Central American Indian | 60 | 0.1% |
| Cherokee | 411 | 0.5% |
| Chilean | 69 | 0.1% |
| Chippewa | 15 | 0.0% |
| Choctaw | 17 | 0.0% |
| Colombian | 644 | 0.8% |
| Costa Rican | 62 | 0.1% |
| Creek | 8 | 0.0% |
| Croatian | 89 | 0.1% |
| Cuban | 757 | 0.9% |
| Czech | 196 | 0.2% |
| Czechoslovakian | 26 | 0.0% |
| Danish | 134 | 0.2% |
| Dominican | 443 | 0.5% |
| Dutch | 705 | 0.8% |
| Dutch West Indian | 27 | 0.0% |
| Eastern European | 224 | 0.3% |
| Ecuadorian | 216 | 0.3% |
| Egyptian | 87 | 0.1% |
| English | 8,435 | 9.9% |
| Ethiopian | 26 | 0.0% |
| European | 877 | 1.0% |
| Finnish | 126 | 0.2% |
| French | 2,290 | 2.7% |
| French American Indian | 32 | 0.0% |
| French Canadian | 567 | 0.7% |
| German | 10,628 | 12.5% |
| Greek | 367 | 0.4% |
| Guamanian / Chamorro | 7 | 0.0% |
| Guatemalan | 264 | 0.3% |
| Guyanese | 1 | 0.0% |
| Haitian | 526 | 0.6% |
| Honduran | 313 | 0.4% |
| Hungarian | 313 | 0.4% |
| Indian (Asian) | 533 | 0.6% |
| Iranian | 8 | 0.0% |
| Irish | 12,595 | 14.8% |
| Iroquois | 95 | 0.1% |
| Israeli | 54 | 0.1% |
| Italian | 5,277 | 6.2% |
| Jamaican | 1,251 | 1.5% |
| Japanese | 33 | 0.0% |
| Jordanian | 41 | 0.1% |
| Kenyan | 79 | 0.1% |
| Korean | 1,063 | 1.3% |
| Laotian | 40 | 0.1% |
| Latvian | 65 | 0.1% |
| Lebanese | 147 | 0.2% |
| Lithuanian | 492 | 0.6% |
| Macedonian | 22 | 0.0% |
| Malaysian | 95 | 0.1% |
| Maltese | 49 | 0.1% |
| Mexican | 2,414 | 2.8% |
| Mexican American Indian | 20 | 0.0% |
| Moroccan | 96 | 0.1% |
| Native Hawaiian | 13 | 0.0% |
| New Zealander | 168 | 0.2% |
| Nicaraguan | 13 | 0.0% |
| Nigerian | 126 | 0.2% |
| Northern European | 94 | 0.1% |
| Norwegian | 1,055 | 1.2% |
| Ottawa | 9 | 0.0% |
| Pakistani | 215 | 0.3% |
| Panamanian | 114 | 0.1% |
| Pennsylvania German | 41 | 0.1% |
| Peruvian | 80 | 0.1% |
| Polish | 2,916 | 3.4% |
| Portuguese | 451 | 0.5% |
| Puerto Rican | 3,544 | 4.2% |
| Romanian | 22 | 0.0% |
| Russian | 389 | 0.5% |
| Salvadoran | 11 | 0.0% |
| Samoan | 37 | 0.0% |
| Scandinavian | 285 | 0.3% |
| Scotch-Irish | 864 | 1.0% |
| Scottish | 1,890 | 2.2% |
| Seminole | 93 | 0.1% |
| Serbian | 12 | 0.0% |
| Sioux | 43 | 0.1% |
| Slavic | 23 | 0.0% |
| Slovak | 105 | 0.1% |
| South African | 12 | 0.0% |
| South American | 1,347 | 1.6% |
| Spaniard | 198 | 0.2% |
| Spanish | 40 | 0.1% |
| Sri Lankan | 556 | 0.6% |
| Subsaharan African | 657 | 0.8% |
| Swedish | 988 | 1.2% |
| Swiss | 78 | 0.1% |
| Thai | 707 | 0.8% |
| Trinidadian and Tobagonian | 20 | 0.0% |
| Turkish | 24 | 0.0% |
| Ukrainian | 165 | 0.2% |
| Uruguayan | 20 | 0.0% |
| Venezuelan | 250 | 0.3% |
| Vietnamese | 31 | 0.0% |
| Welsh | 472 | 0.6% |
| West Indian | 133 | 0.2% |
| Yugoslavian | 36 | 0.0% | View All 125 Rows |
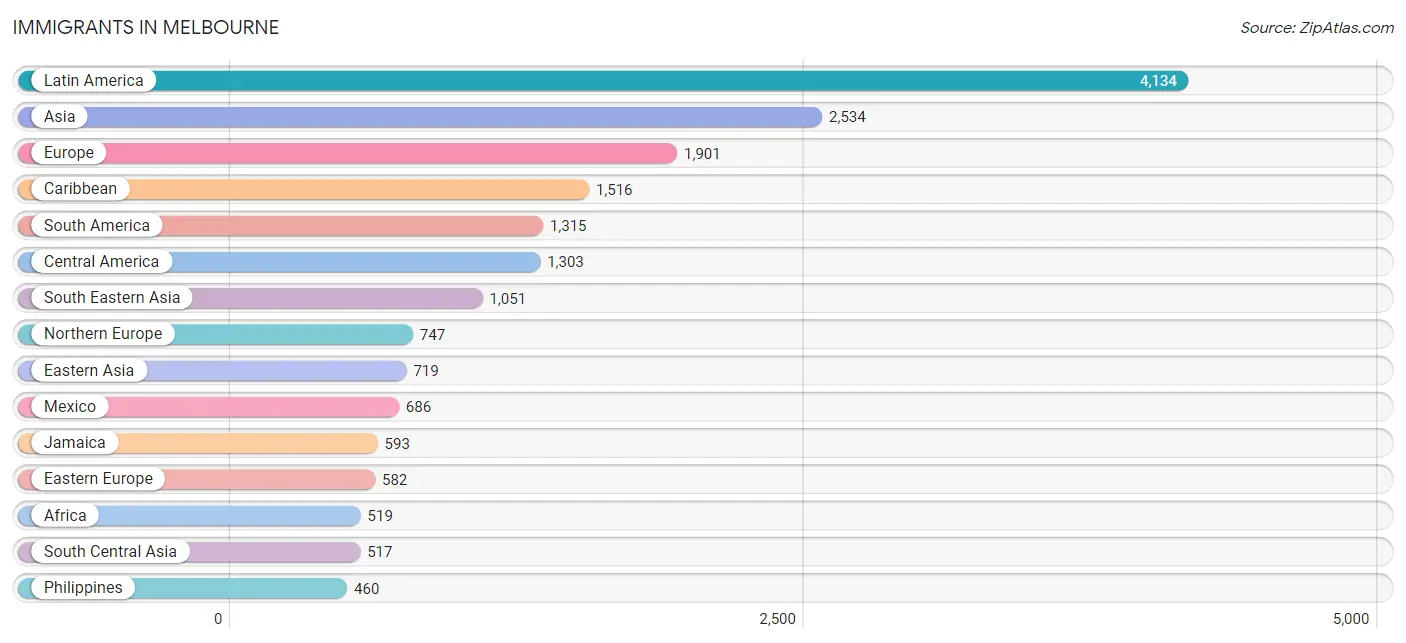
Immigrants in Melbourne
The most numerous immigrant groups reported in Melbourne came from Latin America (4,134 | 4.9%), Asia (2,534 | 3.0%), Europe (1,901 | 2.2%), Caribbean (1,516 | 1.8%), and South America (1,315 | 1.5%), together accounting for 13.4% of all Melbourne residents.
| Immigration Origin | # Population | % Population |
| Africa | 519 | 0.6% |
| Asia | 2,534 | 3.0% |
| Australia | 51 | 0.1% |
| Azores | 13 | 0.0% |
| Bahamas | 89 | 0.1% |
| Bangladesh | 105 | 0.1% |
| Belize | 50 | 0.1% |
| Bolivia | 28 | 0.0% |
| Brazil | 387 | 0.5% |
| Cambodia | 33 | 0.0% |
| Canada | 223 | 0.3% |
| Caribbean | 1,516 | 1.8% |
| Central America | 1,303 | 1.5% |
| Chile | 24 | 0.0% |
| China | 312 | 0.4% |
| Colombia | 416 | 0.5% |
| Cuba | 220 | 0.3% |
| Czechoslovakia | 43 | 0.1% |
| Denmark | 26 | 0.0% |
| Dominica | 40 | 0.1% |
| Dominican Republic | 180 | 0.2% |
| Eastern Africa | 134 | 0.2% |
| Eastern Asia | 719 | 0.9% |
| Eastern Europe | 582 | 0.7% |
| Ecuador | 54 | 0.1% |
| Egypt | 84 | 0.1% |
| England | 359 | 0.4% |
| Europe | 1,901 | 2.2% |
| France | 22 | 0.0% |
| Germany | 355 | 0.4% |
| Greece | 17 | 0.0% |
| Guatemala | 237 | 0.3% |
| Guyana | 15 | 0.0% |
| Haiti | 195 | 0.2% |
| Honduras | 214 | 0.3% |
| Hong Kong | 30 | 0.0% |
| Hungary | 24 | 0.0% |
| India | 394 | 0.5% |
| Indonesia | 44 | 0.1% |
| Iran | 10 | 0.0% |
| Ireland | 30 | 0.0% |
| Israel | 51 | 0.1% |
| Italy | 38 | 0.0% |
| Jamaica | 593 | 0.7% |
| Japan | 185 | 0.2% |
| Jordan | 19 | 0.0% |
| Kazakhstan | 8 | 0.0% |
| Kenya | 99 | 0.1% |
| Korea | 222 | 0.3% |
| Latin America | 4,134 | 4.9% |
| Lithuania | 120 | 0.1% |
| Mexico | 686 | 0.8% |
| Morocco | 64 | 0.1% |
| Netherlands | 69 | 0.1% |
| Nicaragua | 15 | 0.0% |
| Nigeria | 56 | 0.1% |
| North Macedonia | 22 | 0.0% |
| Northern Africa | 273 | 0.3% |
| Northern Europe | 747 | 0.9% |
| Oceania | 204 | 0.2% |
| Panama | 101 | 0.1% |
| Peru | 107 | 0.1% |
| Philippines | 460 | 0.5% |
| Poland | 297 | 0.4% |
| Portugal | 24 | 0.0% |
| Russia | 25 | 0.0% |
| Saudi Arabia | 88 | 0.1% |
| Scotland | 23 | 0.0% |
| South Africa | 43 | 0.1% |
| South America | 1,315 | 1.5% |
| South Central Asia | 517 | 0.6% |
| South Eastern Asia | 1,051 | 1.2% |
| Southern Europe | 126 | 0.2% |
| Spain | 21 | 0.0% |
| Sweden | 70 | 0.1% |
| Taiwan | 32 | 0.0% |
| Thailand | 67 | 0.1% |
| Trinidad and Tobago | 41 | 0.1% |
| Turkey | 18 | 0.0% |
| Ukraine | 35 | 0.0% |
| Uruguay | 20 | 0.0% |
| Venezuela | 264 | 0.3% |
| Vietnam | 447 | 0.5% |
| West Indies | 21 | 0.0% |
| Western Africa | 69 | 0.1% |
| Western Asia | 247 | 0.3% |
| Western Europe | 446 | 0.5% |
| Zimbabwe | 35 | 0.0% | View All 88 Rows |
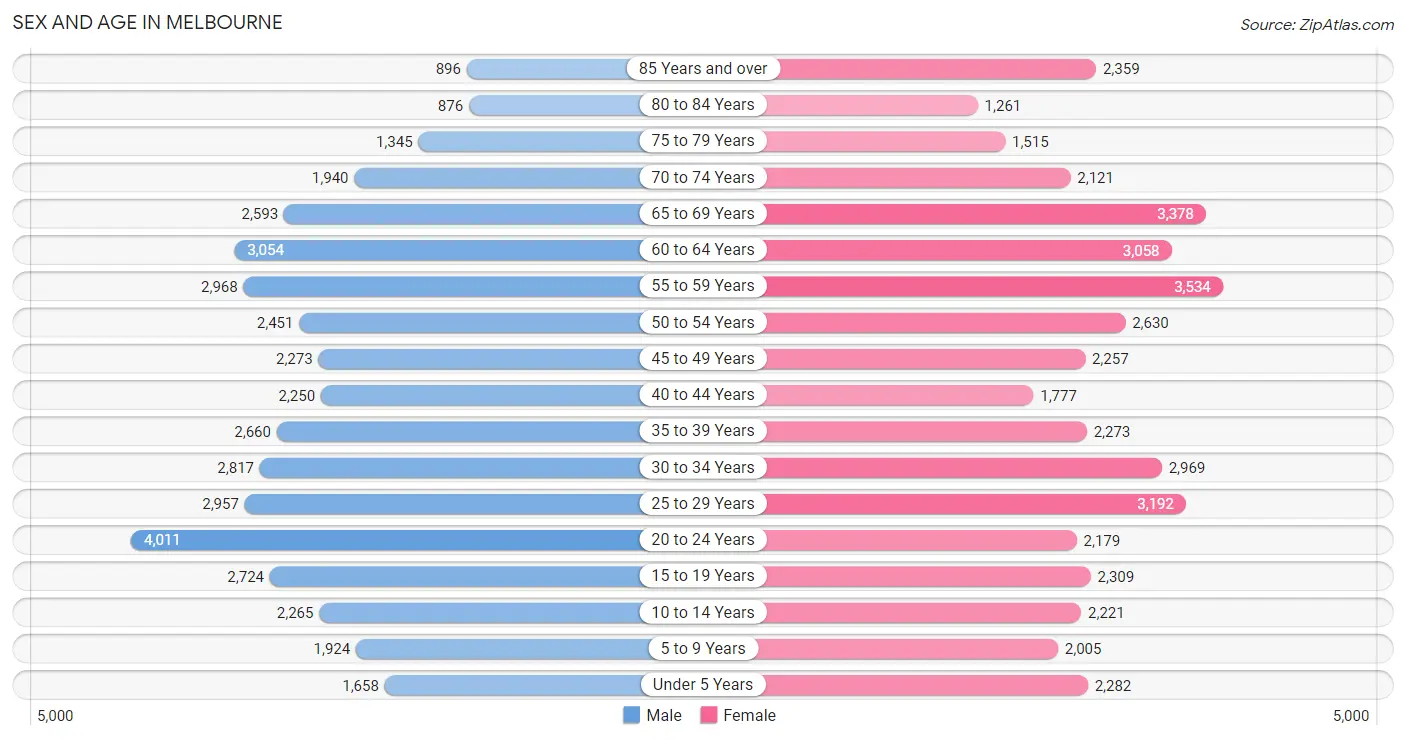
Sex and Age in Melbourne
Sex and Age in Melbourne
The most populous age groups in Melbourne are 20 to 24 Years (4,011 | 9.6%) for men and 55 to 59 Years (3,534 | 8.2%) for women.
| Age Bracket | Male | Female |
| Under 5 Years | 1,658 (4.0%) | 2,282 (5.3%) |
| 5 to 9 Years | 1,924 (4.6%) | 2,005 (4.6%) |
| 10 to 14 Years | 2,265 (5.4%) | 2,221 (5.1%) |
| 15 to 19 Years | 2,724 (6.5%) | 2,309 (5.3%) |
| 20 to 24 Years | 4,011 (9.6%) | 2,179 (5.0%) |
| 25 to 29 Years | 2,957 (7.1%) | 3,192 (7.4%) |
| 30 to 34 Years | 2,817 (6.8%) | 2,969 (6.9%) |
| 35 to 39 Years | 2,660 (6.4%) | 2,273 (5.2%) |
| 40 to 44 Years | 2,250 (5.4%) | 1,777 (4.1%) |
| 45 to 49 Years | 2,273 (5.5%) | 2,257 (5.2%) |
| 50 to 54 Years | 2,451 (5.9%) | 2,630 (6.1%) |
| 55 to 59 Years | 2,968 (7.1%) | 3,534 (8.2%) |
| 60 to 64 Years | 3,054 (7.3%) | 3,058 (7.1%) |
| 65 to 69 Years | 2,593 (6.2%) | 3,378 (7.8%) |
| 70 to 74 Years | 1,940 (4.7%) | 2,121 (4.9%) |
| 75 to 79 Years | 1,345 (3.2%) | 1,515 (3.5%) |
| 80 to 84 Years | 876 (2.1%) | 1,261 (2.9%) |
| 85 Years and over | 896 (2.1%) | 2,359 (5.4%) |
| Total | 41,662 (100.0%) | 43,320 (100.0%) |
Families and Households in Melbourne
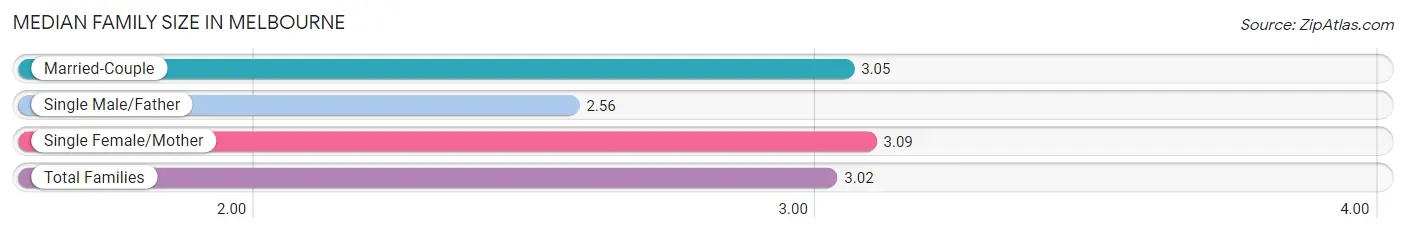
Median Family Size in Melbourne
The median family size in Melbourne is 3.02 persons per family, with single female/mother families (4,261 | 21.7%) accounting for the largest median family size of 3.09 persons per family. On the other hand, single male/father families (1,616 | 8.2%) represent the smallest median family size with 2.56 persons per family.
| Family Type | # Families | Family Size |
| Married-Couple | 13,766 (70.1%) | 3.05 |
| Single Male/Father | 1,616 (8.2%) | 2.56 |
| Single Female/Mother | 4,261 (21.7%) | 3.09 |
| Total Families | 19,643 (100.0%) | 3.02 |
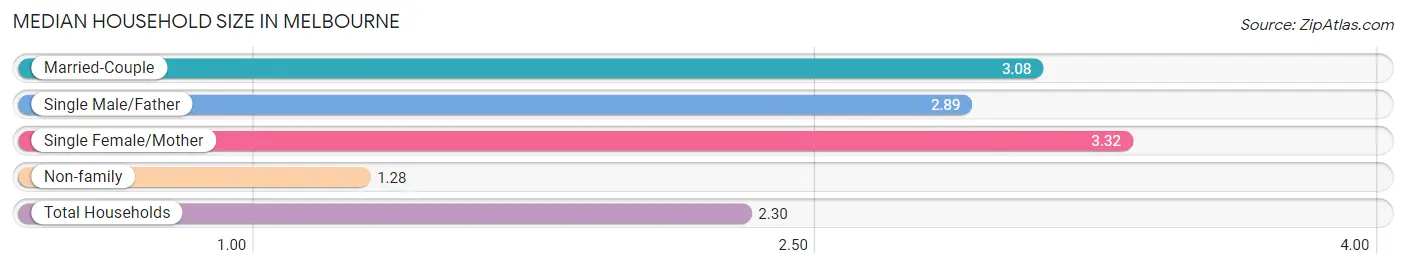
Median Household Size in Melbourne
The median household size in Melbourne is 2.30 persons per household, with single female/mother households (4,261 | 12.0%) accounting for the largest median household size of 3.32 persons per household. non-family households (15,795 | 44.6%) represent the smallest median household size with 1.28 persons per household.
| Household Type | # Households | Household Size |
| Married-Couple | 13,766 (38.9%) | 3.08 |
| Single Male/Father | 1,616 (4.6%) | 2.89 |
| Single Female/Mother | 4,261 (12.0%) | 3.32 |
| Non-family | 15,795 (44.6%) | 1.28 |
| Total Households | 35,438 (100.0%) | 2.30 |
Household Size by Marriage Status in Melbourne
Out of a total of 35,438 households in Melbourne, 19,643 (55.4%) are family households, while 15,795 (44.6%) are nonfamily households. The most numerous type of family households are 2-person households, comprising 10,074, and the most common type of nonfamily households are 1-person households, comprising 12,837.
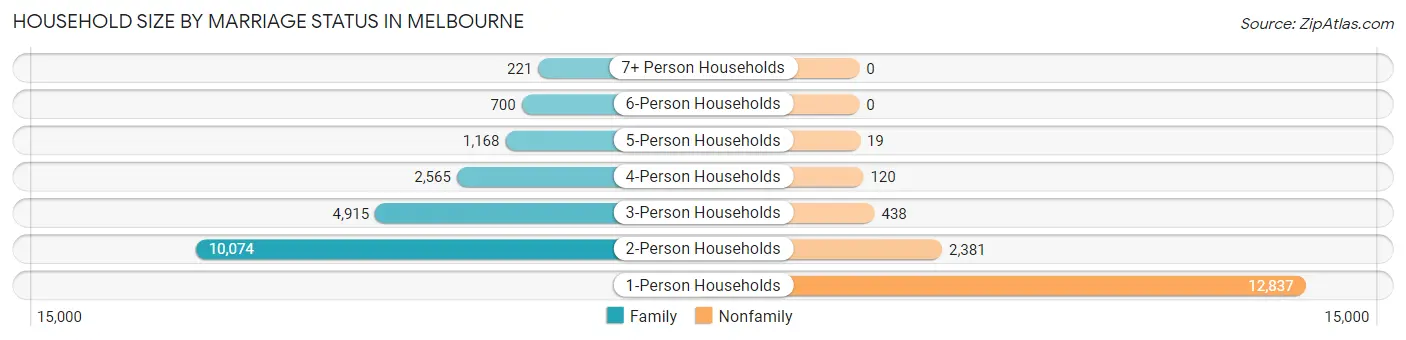
| Household Size | Family Households | Nonfamily Households |
| 1-Person Households | - | 12,837 (36.2%) |
| 2-Person Households | 10,074 (28.4%) | 2,381 (6.7%) |
| 3-Person Households | 4,915 (13.9%) | 438 (1.2%) |
| 4-Person Households | 2,565 (7.2%) | 120 (0.3%) |
| 5-Person Households | 1,168 (3.3%) | 19 (0.1%) |
| 6-Person Households | 700 (2.0%) | 0 (0.0%) |
| 7+ Person Households | 221 (0.6%) | 0 (0.0%) |
| Total | 19,643 (55.4%) | 15,795 (44.6%) |
Female Fertility in Melbourne
Fertility by Age in Melbourne
Average fertility rate in Melbourne is 61.0 births per 1,000 women. Women in the age bracket of 20 to 34 years have the highest fertility rate with 88.0 births per 1,000 women. Women in the age bracket of 20 to 34 years acount for 69.0% of all women with births.
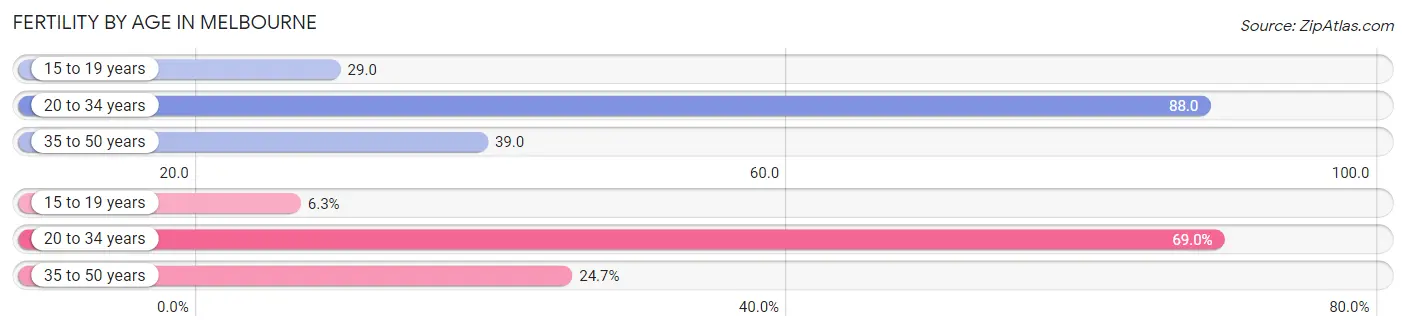
| Age Bracket | Women with Births | Births / 1,000 Women |
| 15 to 19 years | 67 (6.3%) | 29.0 |
| 20 to 34 years | 734 (69.0%) | 88.0 |
| 35 to 50 years | 263 (24.7%) | 39.0 |
| Total | 1,064 (100.0%) | 61.0 |
Fertility by Age by Marriage Status in Melbourne
53.0% of women with births (1,064) in Melbourne are married. The highest percentage of unmarried women with births falls into 15 to 19 years age bracket with 100.0% of them unmarried at the time of birth, while the lowest percentage of unmarried women with births belong to 20 to 34 years age bracket with 42.9% of them unmarried.
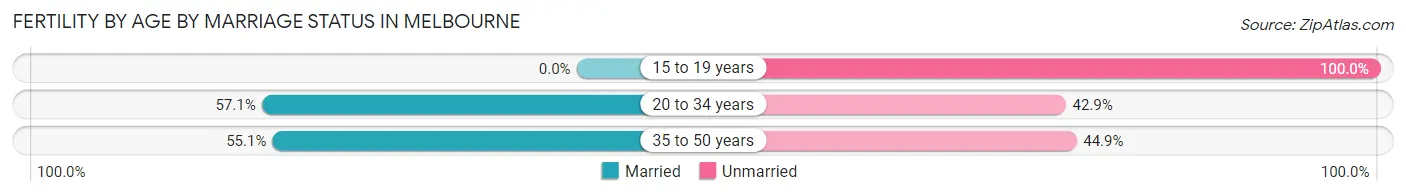
| Age Bracket | Married | Unmarried |
| 15 to 19 years | 0 (0.0%) | 67 (100.0%) |
| 20 to 34 years | 419 (57.1%) | 315 (42.9%) |
| 35 to 50 years | 145 (55.1%) | 118 (44.9%) |
| Total | 564 (53.0%) | 500 (47.0%) |
Fertility by Education in Melbourne
Average fertility rate in Melbourne is 61.0 births per 1,000 women. Women with the education attainment of graduate degree have the highest fertility rate of 104.0 births per 1,000 women, while women with the education attainment of bachelor's degree have the lowest fertility at 50.0 births per 1,000 women. Women with the education attainment of college or associate's degree represent 29.8% of all women with births.
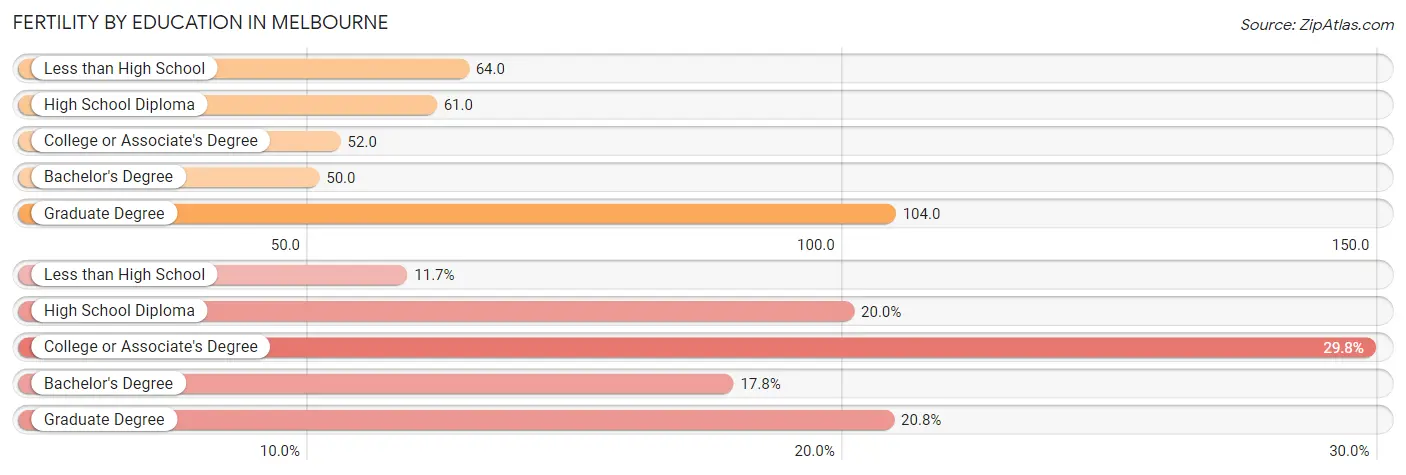
| Educational Attainment | Women with Births | Births / 1,000 Women |
| Less than High School | 124 (11.7%) | 64.0 |
| High School Diploma | 213 (20.0%) | 61.0 |
| College or Associate's Degree | 317 (29.8%) | 52.0 |
| Bachelor's Degree | 189 (17.8%) | 50.0 |
| Graduate Degree | 221 (20.8%) | 104.0 |
| Total | 1,064 (100.0%) | 61.0 |
Fertility by Education by Marriage Status in Melbourne
47.0% of women with births in Melbourne are unmarried. Women with the educational attainment of graduate degree are most likely to be married with 87.8% of them married at childbirth, while women with the educational attainment of college or associate's degree are least likely to be married with 72.6% of them unmarried at childbirth.
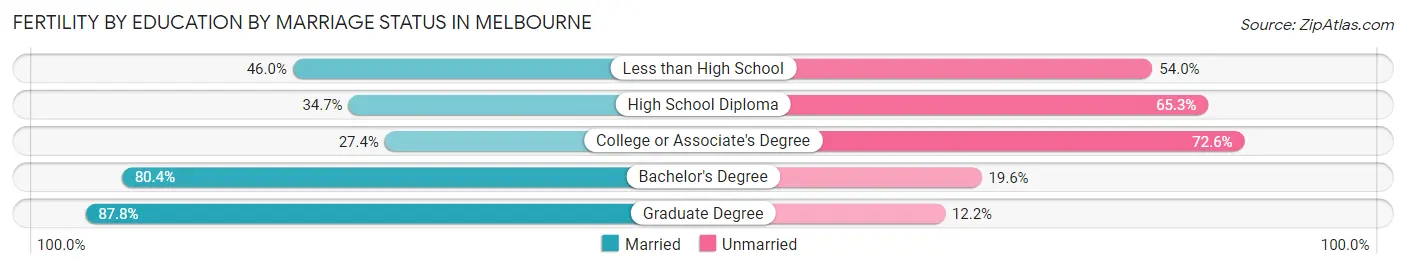
| Educational Attainment | Married | Unmarried |
| Less than High School | 57 (46.0%) | 67 (54.0%) |
| High School Diploma | 74 (34.7%) | 139 (65.3%) |
| College or Associate's Degree | 87 (27.4%) | 230 (72.6%) |
| Bachelor's Degree | 152 (80.4%) | 37 (19.6%) |
| Graduate Degree | 194 (87.8%) | 27 (12.2%) |
| Total | 564 (53.0%) | 500 (47.0%) |
Employment Characteristics in Melbourne
Employment by Class of Employer in Melbourne
Among the 39,116 employed individuals in Melbourne, private company employees (27,796 | 71.1%), not-for-profit organizations (3,292 | 8.4%), and local government employees (2,198 | 5.6%) make up the most common classes of employment.
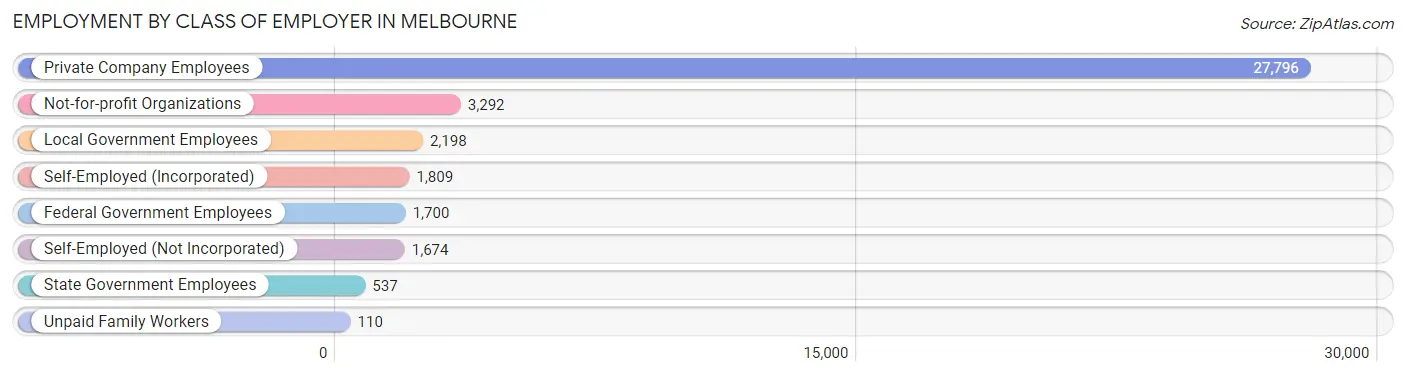
| Employer Class | # Employees | % Employees |
| Private Company Employees | 27,796 | 71.1% |
| Self-Employed (Incorporated) | 1,809 | 4.6% |
| Self-Employed (Not Incorporated) | 1,674 | 4.3% |
| Not-for-profit Organizations | 3,292 | 8.4% |
| Local Government Employees | 2,198 | 5.6% |
| State Government Employees | 537 | 1.4% |
| Federal Government Employees | 1,700 | 4.3% |
| Unpaid Family Workers | 110 | 0.3% |
| Total | 39,116 | 100.0% |
Employment Status by Age in Melbourne
According to the labor force statistics for Melbourne, out of the total population over 16 years of age (72,070), 58.6% or 42,233 individuals are in the labor force, with 4.6% or 1,943 of them unemployed. The age group with the highest labor force participation rate is 25 to 29 years, with 87.2% or 5,362 individuals in the labor force. Within the labor force, the 16 to 19 years age range has the highest percentage of unemployed individuals, with 10.5% or 142 of them being unemployed.
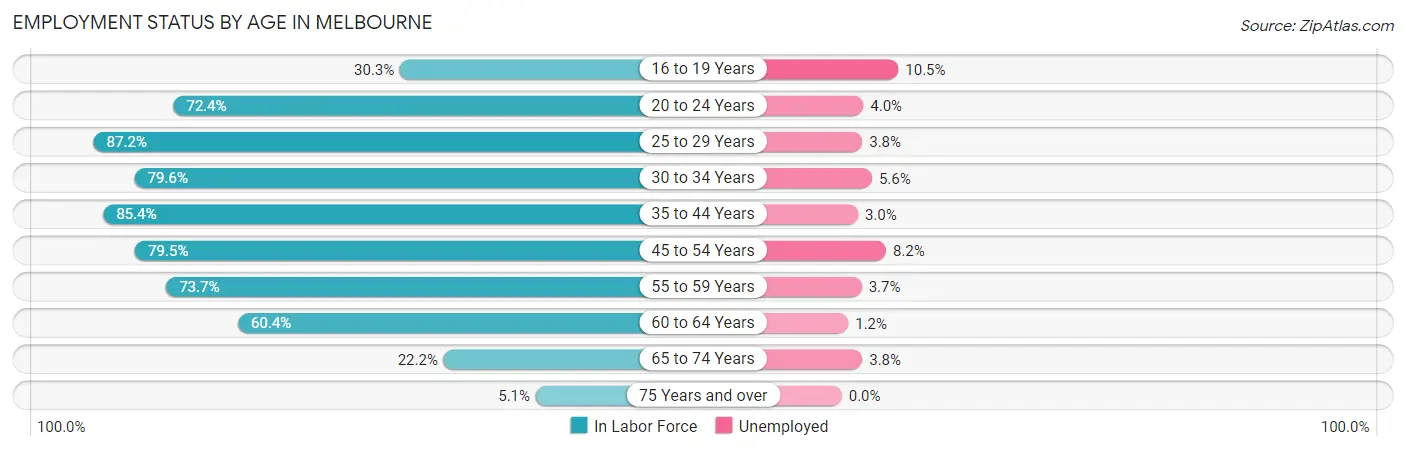
| Age Bracket | In Labor Force | Unemployed |
| 16 to 19 Years | 1,356 (30.3%) | 142 (10.5%) |
| 20 to 24 Years | 4,482 (72.4%) | 179 (4.0%) |
| 25 to 29 Years | 5,362 (87.2%) | 204 (3.8%) |
| 30 to 34 Years | 4,606 (79.6%) | 258 (5.6%) |
| 35 to 44 Years | 7,652 (85.4%) | 230 (3.0%) |
| 45 to 54 Years | 7,641 (79.5%) | 627 (8.2%) |
| 55 to 59 Years | 4,792 (73.7%) | 177 (3.7%) |
| 60 to 64 Years | 3,692 (60.4%) | 44 (1.2%) |
| 65 to 74 Years | 2,227 (22.2%) | 85 (3.8%) |
| 75 Years and over | 421 (5.1%) | 0 (0.0%) |
| Total | 42,233 (58.6%) | 1,943 (4.6%) |
Employment Status by Educational Attainment in Melbourne
According to labor force statistics for Melbourne, 78.3% of individuals (33,763) out of the total population between 25 and 64 years of age (43,120) are in the labor force, with 4.6% or 1,553 of them being unemployed. The group with the highest labor force participation rate are those with the educational attainment of bachelor's degree or higher, with 84.3% or 12,450 individuals in the labor force. Within the labor force, individuals with less than high school education have the highest percentage of unemployment, with 5.8% or 99 of them being unemployed.
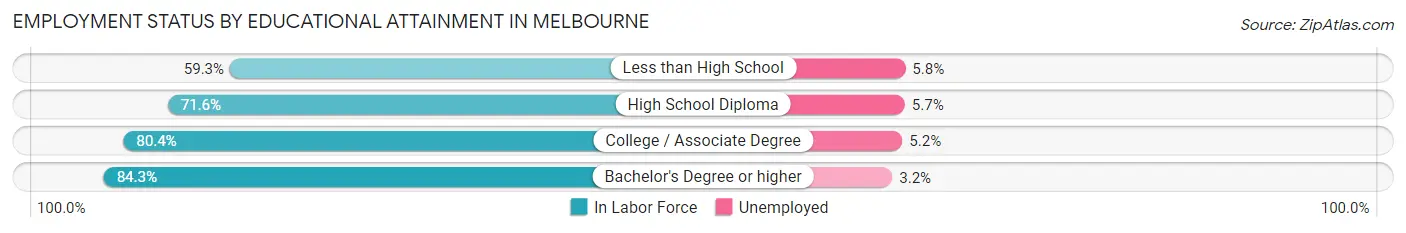
| Educational Attainment | In Labor Force | Unemployed |
| Less than High School | 1,711 (59.3%) | 167 (5.8%) |
| High School Diploma | 7,303 (71.6%) | 581 (5.7%) |
| College / Associate Degree | 12,273 (80.4%) | 794 (5.2%) |
| Bachelor's Degree or higher | 12,450 (84.3%) | 473 (3.2%) |
| Total | 33,763 (78.3%) | 1,984 (4.6%) |
Employment Occupations by Sex in Melbourne
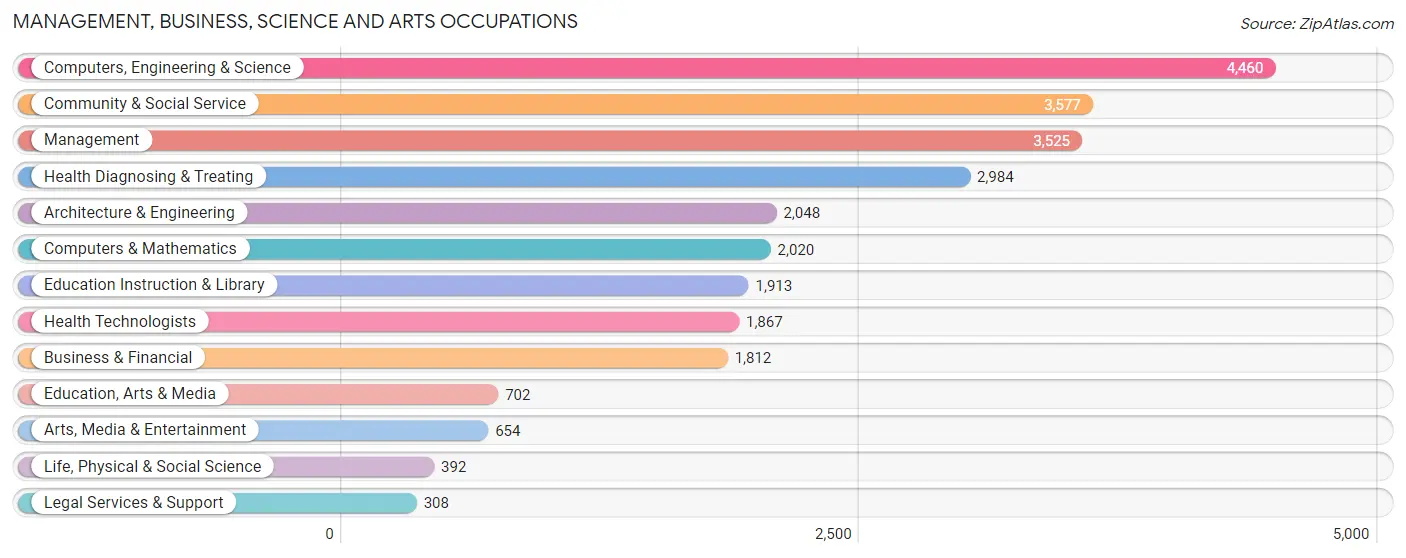
Management, Business, Science and Arts Occupations
The most common Management, Business, Science and Arts occupations in Melbourne are Computers, Engineering & Science (4,460 | 11.2%), Community & Social Service (3,577 | 9.0%), Management (3,525 | 8.8%), Health Diagnosing & Treating (2,984 | 7.5%), and Architecture & Engineering (2,048 | 5.1%).
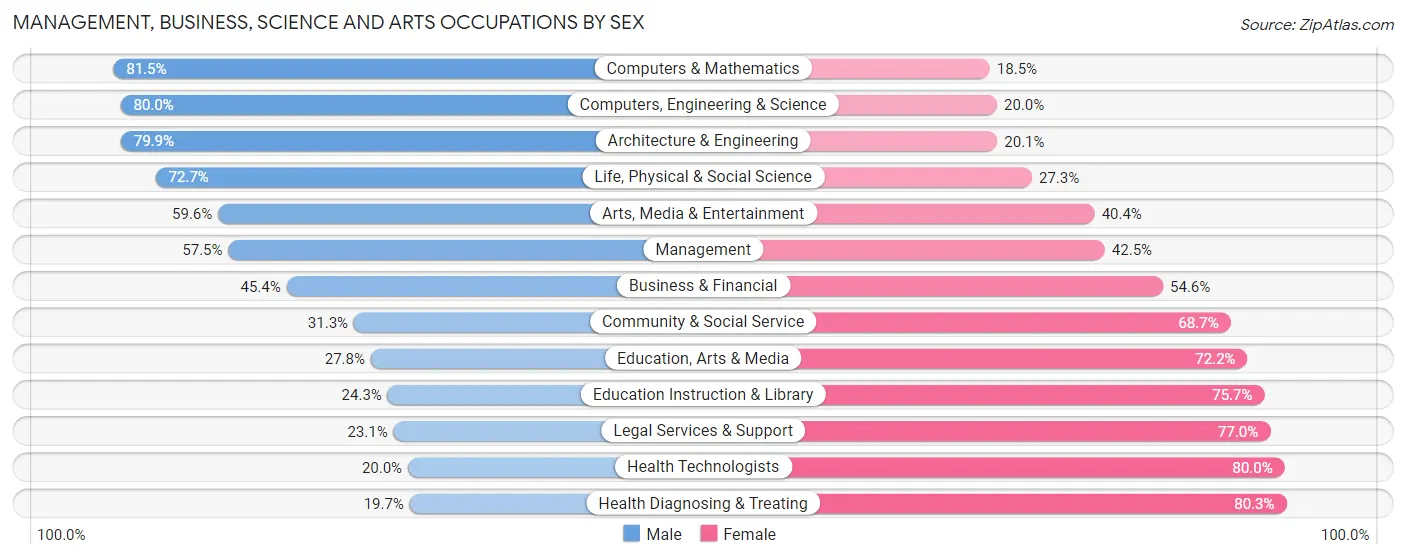
Management, Business, Science and Arts Occupations by Sex
Within the Management, Business, Science and Arts occupations in Melbourne, the most male-oriented occupations are Computers & Mathematics (81.5%), Computers, Engineering & Science (80.0%), and Architecture & Engineering (79.9%), while the most female-oriented occupations are Health Diagnosing & Treating (80.3%), Health Technologists (80.0%), and Legal Services & Support (76.9%).
| Occupation | Male | Female |
| Management | 2,027 (57.5%) | 1,498 (42.5%) |
| Business & Financial | 822 (45.4%) | 990 (54.6%) |
| Computers, Engineering & Science | 3,568 (80.0%) | 892 (20.0%) |
| Computers & Mathematics | 1,646 (81.5%) | 374 (18.5%) |
| Architecture & Engineering | 1,637 (79.9%) | 411 (20.1%) |
| Life, Physical & Social Science | 285 (72.7%) | 107 (27.3%) |
| Community & Social Service | 1,120 (31.3%) | 2,457 (68.7%) |
| Education, Arts & Media | 195 (27.8%) | 507 (72.2%) |
| Legal Services & Support | 71 (23.1%) | 237 (76.9%) |
| Education Instruction & Library | 464 (24.3%) | 1,449 (75.7%) |
| Arts, Media & Entertainment | 390 (59.6%) | 264 (40.4%) |
| Health Diagnosing & Treating | 587 (19.7%) | 2,397 (80.3%) |
| Health Technologists | 374 (20.0%) | 1,493 (80.0%) |
| Total (Category) | 8,124 (49.7%) | 8,234 (50.3%) |
| Total (Overall) | 21,091 (52.8%) | 18,847 (47.2%) |
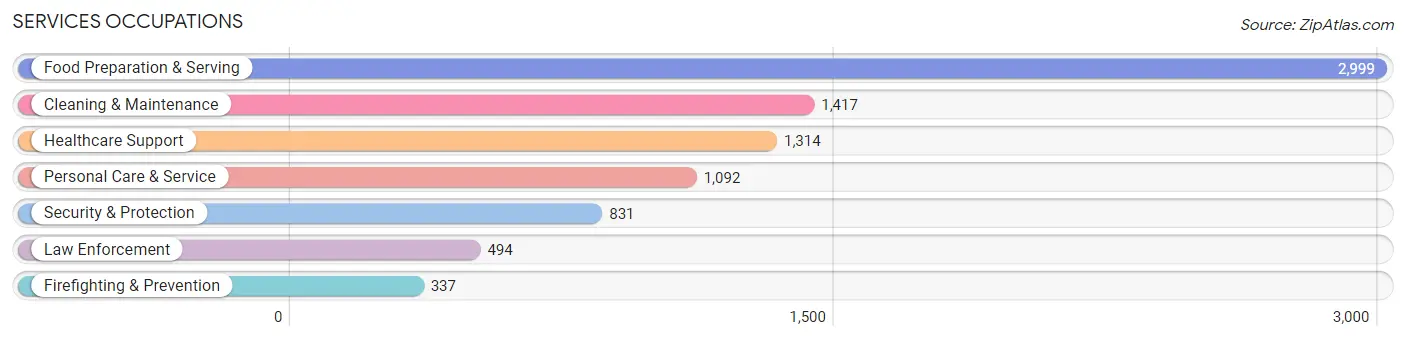
Services Occupations
The most common Services occupations in Melbourne are Food Preparation & Serving (2,999 | 7.5%), Cleaning & Maintenance (1,417 | 3.5%), Healthcare Support (1,314 | 3.3%), Personal Care & Service (1,092 | 2.7%), and Security & Protection (831 | 2.1%).
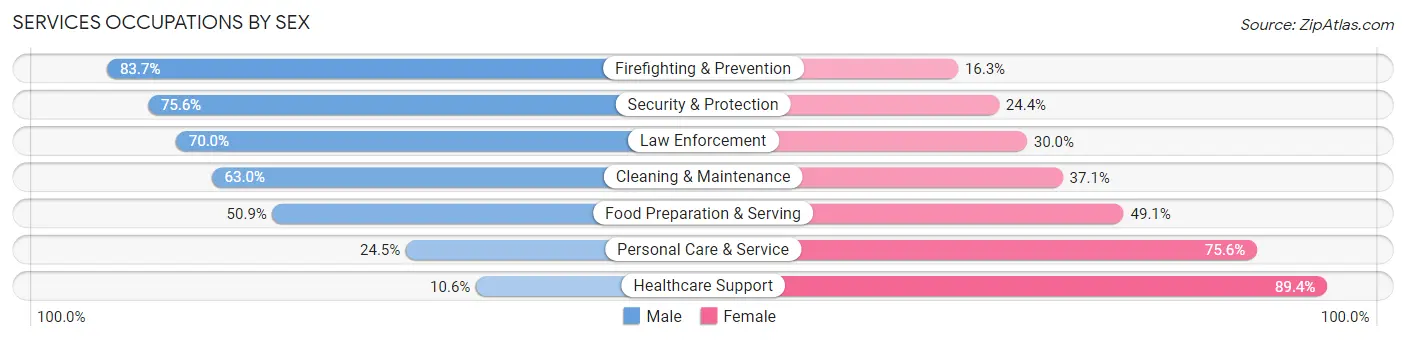
Services Occupations by Sex
Within the Services occupations in Melbourne, the most male-oriented occupations are Firefighting & Prevention (83.7%), Security & Protection (75.6%), and Law Enforcement (70.0%), while the most female-oriented occupations are Healthcare Support (89.4%), Personal Care & Service (75.5%), and Food Preparation & Serving (49.1%).
| Occupation | Male | Female |
| Healthcare Support | 139 (10.6%) | 1,175 (89.4%) |
| Security & Protection | 628 (75.6%) | 203 (24.4%) |
| Firefighting & Prevention | 282 (83.7%) | 55 (16.3%) |
| Law Enforcement | 346 (70.0%) | 148 (30.0%) |
| Food Preparation & Serving | 1,526 (50.9%) | 1,473 (49.1%) |
| Cleaning & Maintenance | 892 (62.9%) | 525 (37.0%) |
| Personal Care & Service | 267 (24.4%) | 825 (75.5%) |
| Total (Category) | 3,452 (45.1%) | 4,201 (54.9%) |
| Total (Overall) | 21,091 (52.8%) | 18,847 (47.2%) |
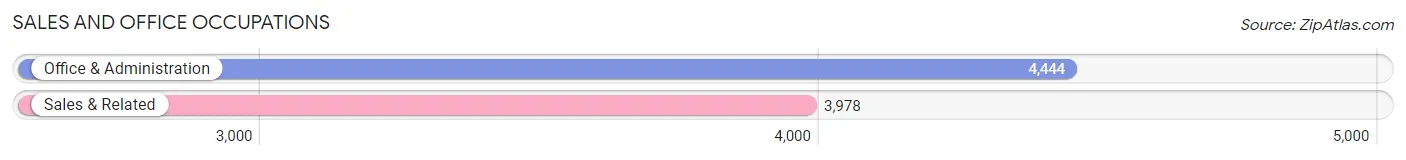
Sales and Office Occupations
The most common Sales and Office occupations in Melbourne are Office & Administration (4,444 | 11.1%), and Sales & Related (3,978 | 10.0%).
Sales and Office Occupations by Sex
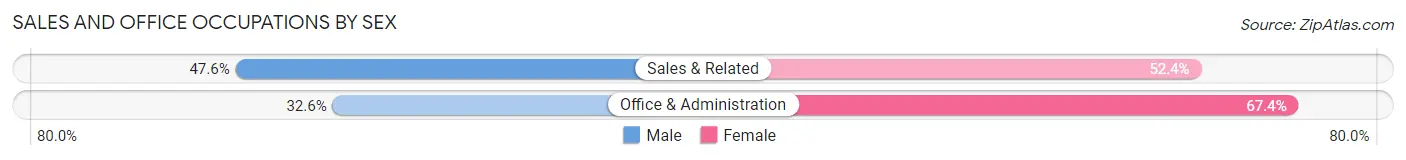
| Occupation | Male | Female |
| Sales & Related | 1,892 (47.6%) | 2,086 (52.4%) |
| Office & Administration | 1,450 (32.6%) | 2,994 (67.4%) |
| Total (Category) | 3,342 (39.7%) | 5,080 (60.3%) |
| Total (Overall) | 21,091 (52.8%) | 18,847 (47.2%) |
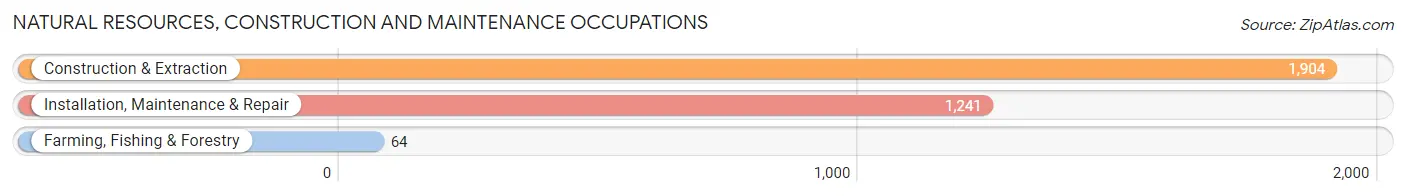
Natural Resources, Construction and Maintenance Occupations
The most common Natural Resources, Construction and Maintenance occupations in Melbourne are Construction & Extraction (1,904 | 4.8%), Installation, Maintenance & Repair (1,241 | 3.1%), and Farming, Fishing & Forestry (64 | 0.2%).
Natural Resources, Construction and Maintenance Occupations by Sex
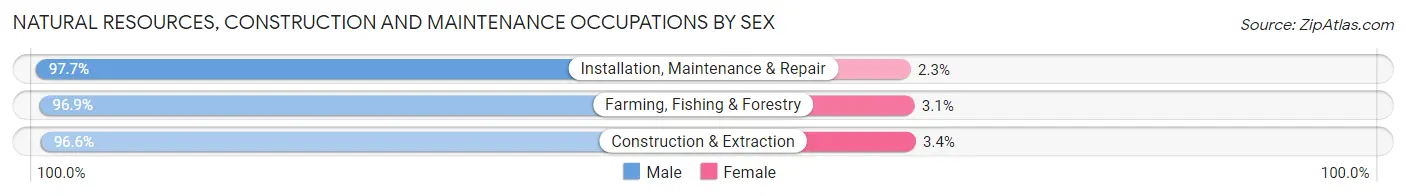
| Occupation | Male | Female |
| Farming, Fishing & Forestry | 62 (96.9%) | 2 (3.1%) |
| Construction & Extraction | 1,840 (96.6%) | 64 (3.4%) |
| Installation, Maintenance & Repair | 1,212 (97.7%) | 29 (2.3%) |
| Total (Category) | 3,114 (97.0%) | 95 (3.0%) |
| Total (Overall) | 21,091 (52.8%) | 18,847 (47.2%) |
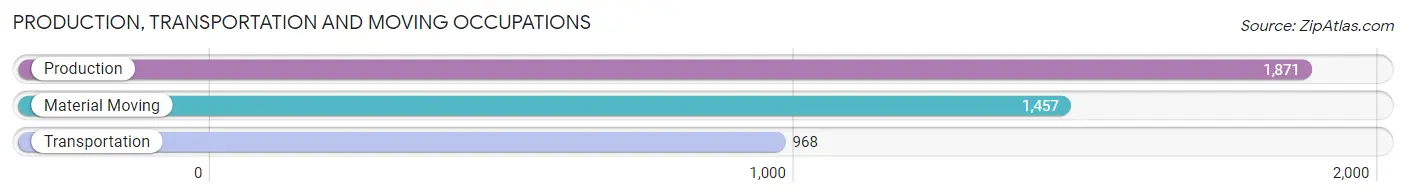
Production, Transportation and Moving Occupations
The most common Production, Transportation and Moving occupations in Melbourne are Production (1,871 | 4.7%), Material Moving (1,457 | 3.6%), and Transportation (968 | 2.4%).
Production, Transportation and Moving Occupations by Sex
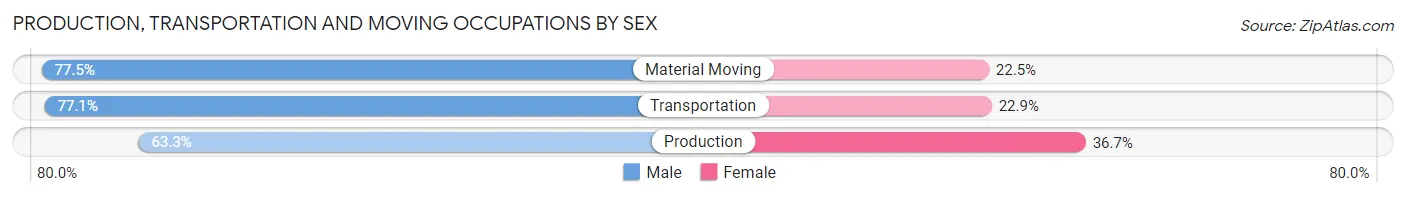
| Occupation | Male | Female |
| Production | 1,184 (63.3%) | 687 (36.7%) |
| Transportation | 746 (77.1%) | 222 (22.9%) |
| Material Moving | 1,129 (77.5%) | 328 (22.5%) |
| Total (Category) | 3,059 (71.2%) | 1,237 (28.8%) |
| Total (Overall) | 21,091 (52.8%) | 18,847 (47.2%) |
Employment Industries by Sex in Melbourne
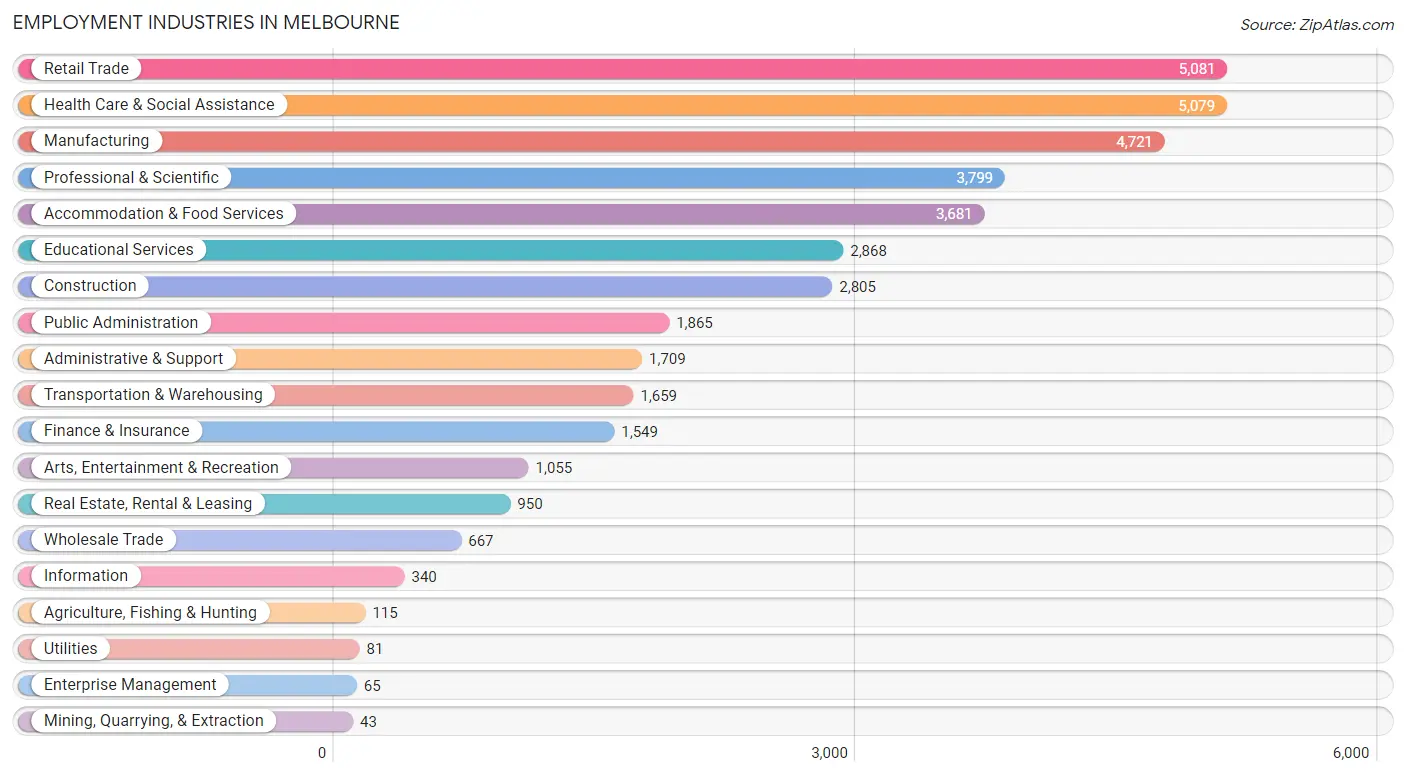
Employment Industries in Melbourne
The major employment industries in Melbourne include Retail Trade (5,081 | 12.7%), Health Care & Social Assistance (5,079 | 12.7%), Manufacturing (4,721 | 11.8%), Professional & Scientific (3,799 | 9.5%), and Accommodation & Food Services (3,681 | 9.2%).
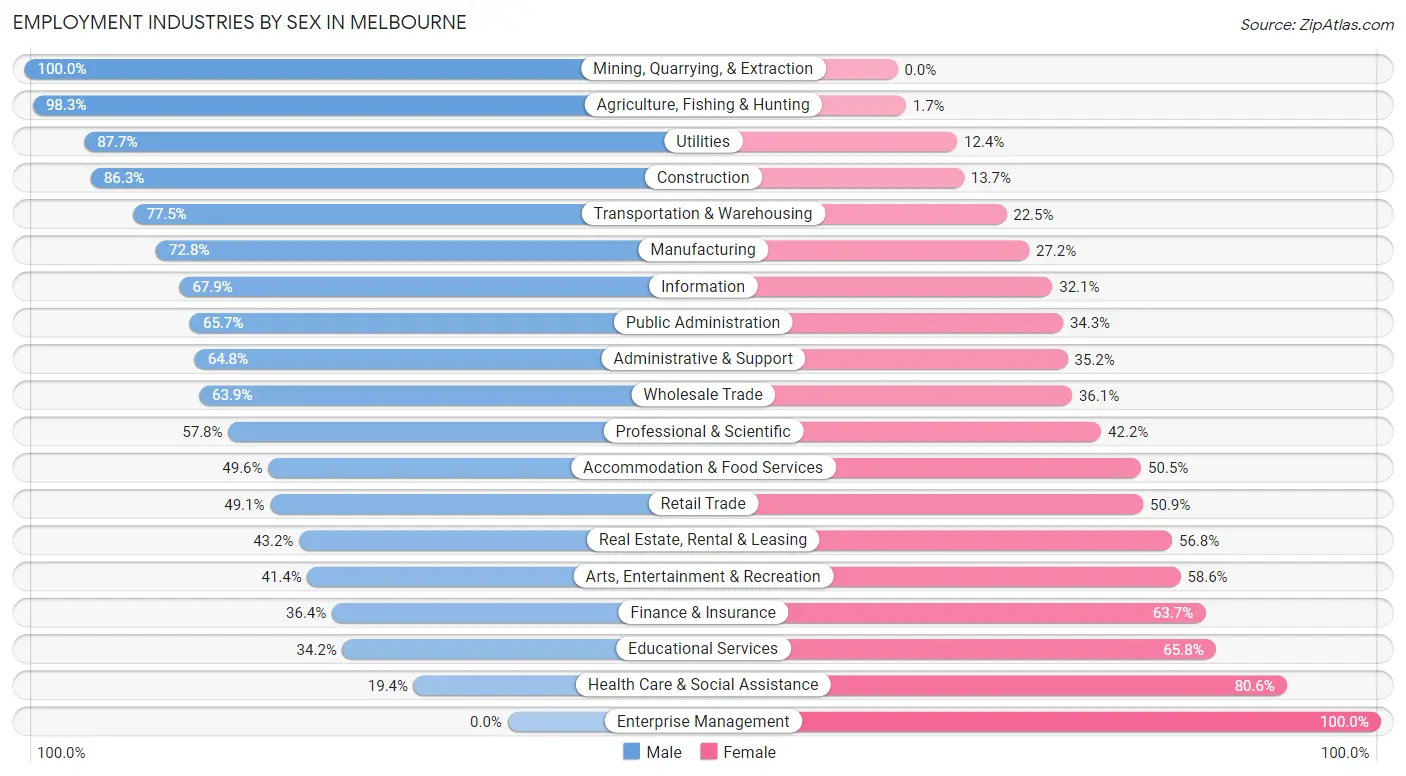
Employment Industries by Sex in Melbourne
The Melbourne industries that see more men than women are Mining, Quarrying, & Extraction (100.0%), Agriculture, Fishing & Hunting (98.3%), and Utilities (87.6%), whereas the industries that tend to have a higher number of women are Enterprise Management (100.0%), Health Care & Social Assistance (80.6%), and Educational Services (65.8%).
| Industry | Male | Female |
| Agriculture, Fishing & Hunting | 113 (98.3%) | 2 (1.7%) |
| Mining, Quarrying, & Extraction | 43 (100.0%) | 0 (0.0%) |
| Construction | 2,420 (86.3%) | 385 (13.7%) |
| Manufacturing | 3,435 (72.8%) | 1,286 (27.2%) |
| Wholesale Trade | 426 (63.9%) | 241 (36.1%) |
| Retail Trade | 2,497 (49.1%) | 2,584 (50.9%) |
| Transportation & Warehousing | 1,285 (77.5%) | 374 (22.5%) |
| Utilities | 71 (87.6%) | 10 (12.3%) |
| Information | 231 (67.9%) | 109 (32.1%) |
| Finance & Insurance | 563 (36.3%) | 986 (63.6%) |
| Real Estate, Rental & Leasing | 410 (43.2%) | 540 (56.8%) |
| Professional & Scientific | 2,197 (57.8%) | 1,602 (42.2%) |
| Enterprise Management | 0 (0.0%) | 65 (100.0%) |
| Administrative & Support | 1,107 (64.8%) | 602 (35.2%) |
| Educational Services | 980 (34.2%) | 1,888 (65.8%) |
| Health Care & Social Assistance | 987 (19.4%) | 4,092 (80.6%) |
| Arts, Entertainment & Recreation | 437 (41.4%) | 618 (58.6%) |
| Accommodation & Food Services | 1,824 (49.5%) | 1,857 (50.4%) |
| Public Administration | 1,226 (65.7%) | 639 (34.3%) |
| Total | 21,091 (52.8%) | 18,847 (47.2%) |
Education in Melbourne
School Enrollment in Melbourne
The most common levels of schooling among the 18,966 students in Melbourne are college / undergraduate (5,726 | 30.2%), middle school (3,457 | 18.2%), and elementary school (3,124 | 16.5%).
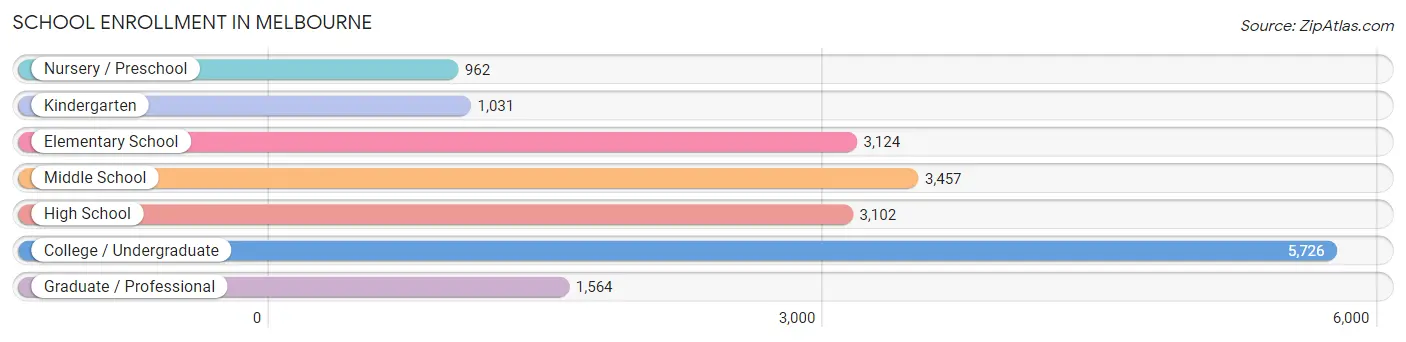
| School Level | # Students | % Students |
| Nursery / Preschool | 962 | 5.1% |
| Kindergarten | 1,031 | 5.4% |
| Elementary School | 3,124 | 16.5% |
| Middle School | 3,457 | 18.2% |
| High School | 3,102 | 16.4% |
| College / Undergraduate | 5,726 | 30.2% |
| Graduate / Professional | 1,564 | 8.3% |
| Total | 18,966 | 100.0% |
School Enrollment by Age by Funding Source in Melbourne
Out of a total of 18,966 students who are enrolled in schools in Melbourne, 6,145 (32.4%) attend a private institution, while the remaining 12,821 (67.6%) are enrolled in public schools. The age group of 18 to 19 year olds has the highest likelihood of being enrolled in private schools, with 1,264 (69.8% in the age bracket) enrolled. Conversely, the age group of 10 to 14 year olds has the lowest likelihood of being enrolled in a private school, with 3,648 (83.2% in the age bracket) attending a public institution.
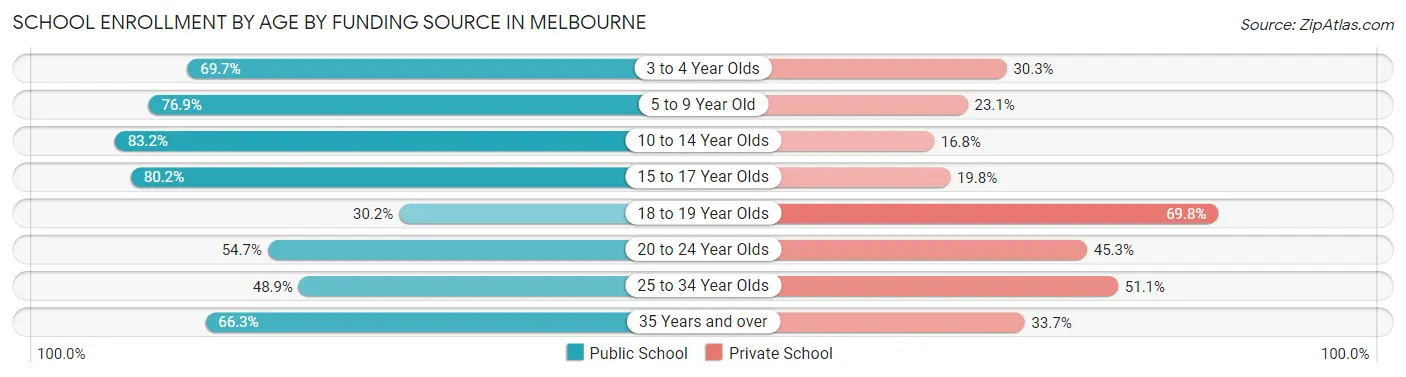
| Age Bracket | Public School | Private School |
| 3 to 4 Year Olds | 570 (69.7%) | 248 (30.3%) |
| 5 to 9 Year Old | 2,856 (76.9%) | 857 (23.1%) |
| 10 to 14 Year Olds | 3,648 (83.2%) | 736 (16.8%) |
| 15 to 17 Year Olds | 2,029 (80.2%) | 501 (19.8%) |
| 18 to 19 Year Olds | 548 (30.2%) | 1,264 (69.8%) |
| 20 to 24 Year Olds | 1,417 (54.7%) | 1,173 (45.3%) |
| 25 to 34 Year Olds | 913 (48.9%) | 953 (51.1%) |
| 35 Years and over | 831 (66.3%) | 422 (33.7%) |
| Total | 12,821 (67.6%) | 6,145 (32.4%) |
Educational Attainment by Field of Study in Melbourne
Business (3,981 | 18.9%), engineering (3,433 | 16.3%), science & technology (2,360 | 11.2%), education (2,243 | 10.6%), and arts & humanities (1,239 | 5.9%) are the most common fields of study among 21,116 individuals in Melbourne who have obtained a bachelor's degree or higher.
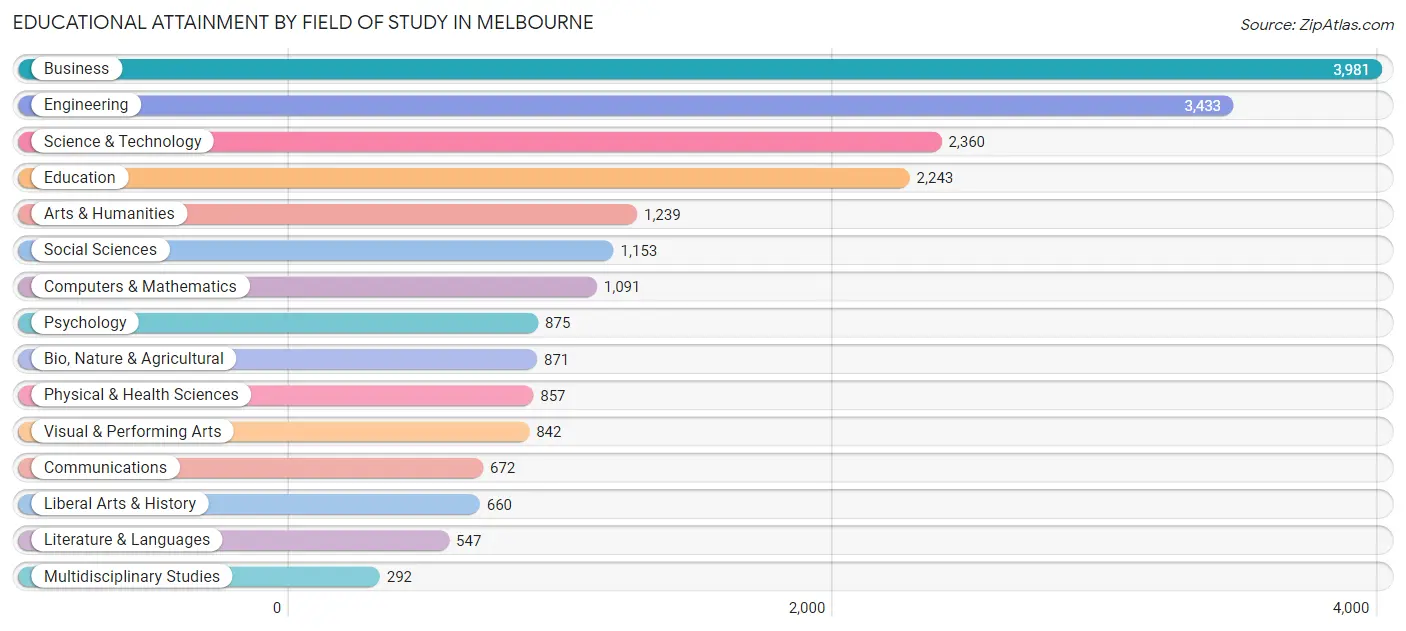
| Field of Study | # Graduates | % Graduates |
| Computers & Mathematics | 1,091 | 5.2% |
| Bio, Nature & Agricultural | 871 | 4.1% |
| Physical & Health Sciences | 857 | 4.1% |
| Psychology | 875 | 4.1% |
| Social Sciences | 1,153 | 5.5% |
| Engineering | 3,433 | 16.3% |
| Multidisciplinary Studies | 292 | 1.4% |
| Science & Technology | 2,360 | 11.2% |
| Business | 3,981 | 18.9% |
| Education | 2,243 | 10.6% |
| Literature & Languages | 547 | 2.6% |
| Liberal Arts & History | 660 | 3.1% |
| Visual & Performing Arts | 842 | 4.0% |
| Communications | 672 | 3.2% |
| Arts & Humanities | 1,239 | 5.9% |
| Total | 21,116 | 100.0% |
Transportation & Commute in Melbourne
Vehicle Availability by Sex in Melbourne
The most prevalent vehicle ownership categories in Melbourne are males with 2 vehicles (9,616, accounting for 46.3%) and females with 2 vehicles (7,423, making up 53.6%).
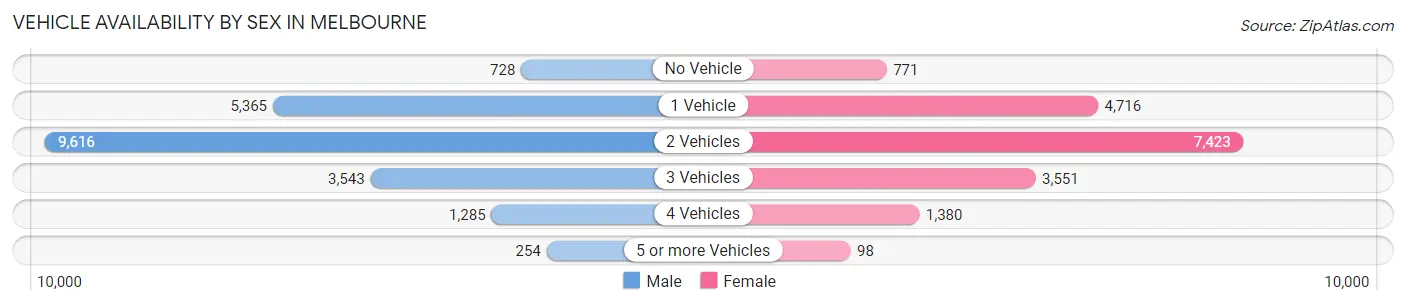
| Vehicles Available | Male | Female |
| No Vehicle | 728 (3.5%) | 771 (4.3%) |
| 1 Vehicle | 5,365 (25.8%) | 4,716 (26.3%) |
| 2 Vehicles | 9,616 (46.3%) | 7,423 (41.4%) |
| 3 Vehicles | 3,543 (17.0%) | 3,551 (19.8%) |
| 4 Vehicles | 1,285 (6.2%) | 1,380 (7.7%) |
| 5 or more Vehicles | 254 (1.2%) | 98 (0.5%) |
| Total | 20,791 (100.0%) | 17,939 (100.0%) |
Commute Time in Melbourne
The most frequently occuring commute durations in Melbourne are 15 to 19 minutes (7,547 commuters, 21.7%), 20 to 24 minutes (5,849 commuters, 16.8%), and 10 to 14 minutes (4,731 commuters, 13.6%).
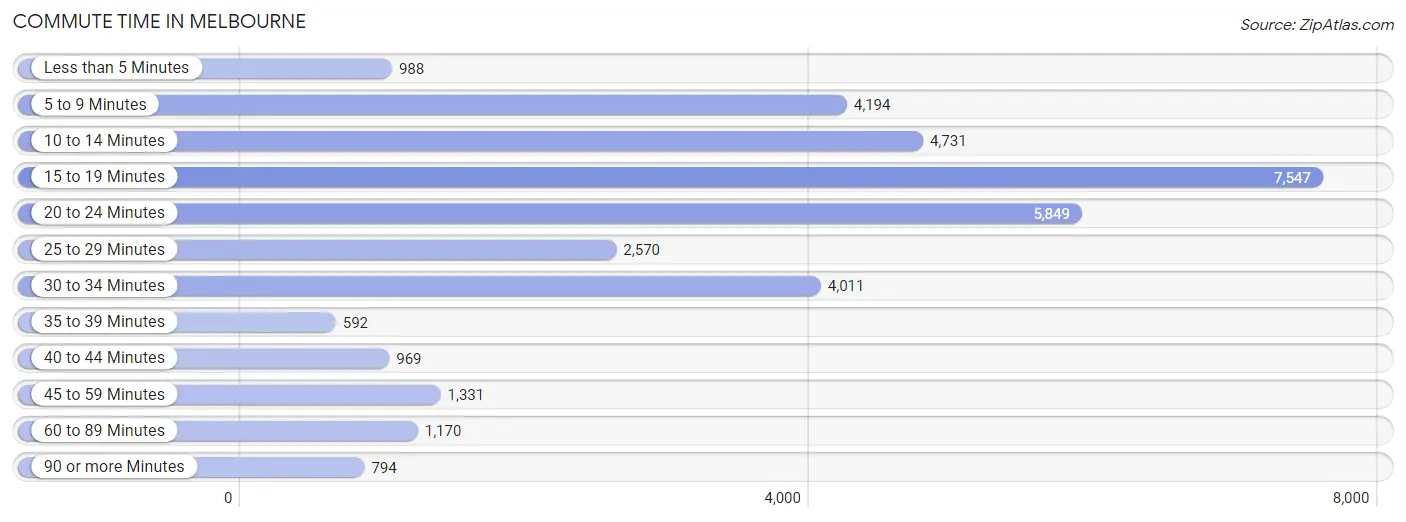
| Commute Time | # Commuters | % Commuters |
| Less than 5 Minutes | 988 | 2.8% |
| 5 to 9 Minutes | 4,194 | 12.1% |
| 10 to 14 Minutes | 4,731 | 13.6% |
| 15 to 19 Minutes | 7,547 | 21.7% |
| 20 to 24 Minutes | 5,849 | 16.8% |
| 25 to 29 Minutes | 2,570 | 7.4% |
| 30 to 34 Minutes | 4,011 | 11.5% |
| 35 to 39 Minutes | 592 | 1.7% |
| 40 to 44 Minutes | 969 | 2.8% |
| 45 to 59 Minutes | 1,331 | 3.8% |
| 60 to 89 Minutes | 1,170 | 3.4% |
| 90 or more Minutes | 794 | 2.3% |
Commute Time by Sex in Melbourne
The most common commute times in Melbourne are 15 to 19 minutes (4,080 commuters, 21.6%) for males and 15 to 19 minutes (3,467 commuters, 21.9%) for females.
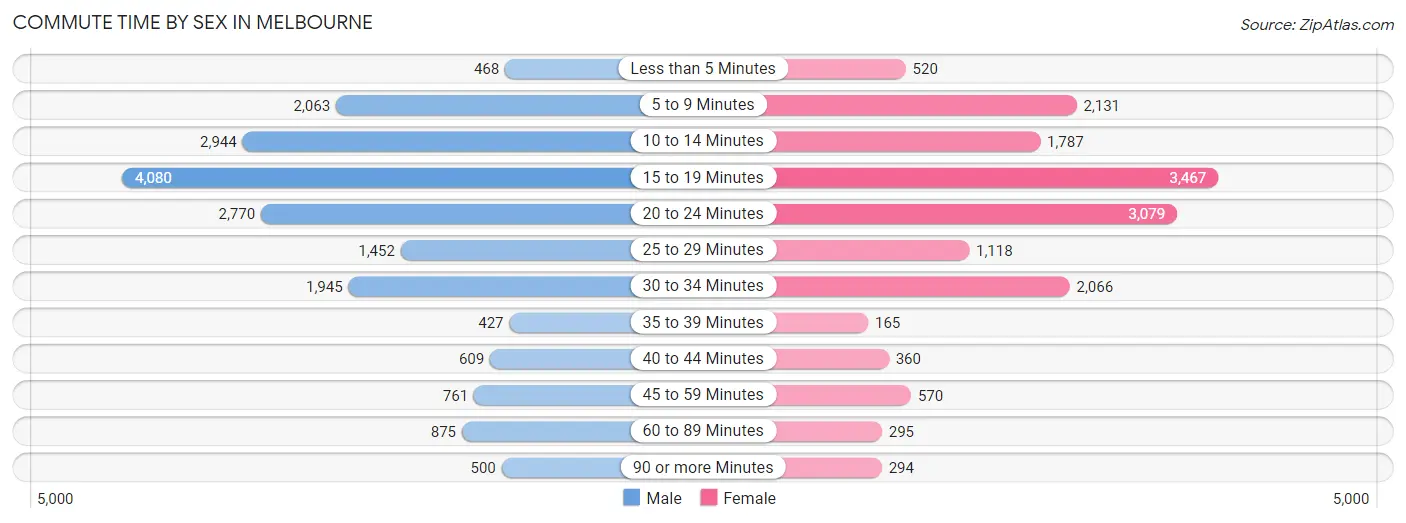
| Commute Time | Male | Female |
| Less than 5 Minutes | 468 (2.5%) | 520 (3.3%) |
| 5 to 9 Minutes | 2,063 (10.9%) | 2,131 (13.4%) |
| 10 to 14 Minutes | 2,944 (15.6%) | 1,787 (11.3%) |
| 15 to 19 Minutes | 4,080 (21.6%) | 3,467 (21.9%) |
| 20 to 24 Minutes | 2,770 (14.7%) | 3,079 (19.4%) |
| 25 to 29 Minutes | 1,452 (7.7%) | 1,118 (7.0%) |
| 30 to 34 Minutes | 1,945 (10.3%) | 2,066 (13.0%) |
| 35 to 39 Minutes | 427 (2.3%) | 165 (1.0%) |
| 40 to 44 Minutes | 609 (3.2%) | 360 (2.3%) |
| 45 to 59 Minutes | 761 (4.0%) | 570 (3.6%) |
| 60 to 89 Minutes | 875 (4.6%) | 295 (1.9%) |
| 90 or more Minutes | 500 (2.6%) | 294 (1.8%) |
Time of Departure to Work by Sex in Melbourne
The most frequent times of departure to work in Melbourne are 7:00 AM to 7:29 AM (3,330, 17.6%) for males and 7:30 AM to 7:59 AM (2,503, 15.8%) for females.
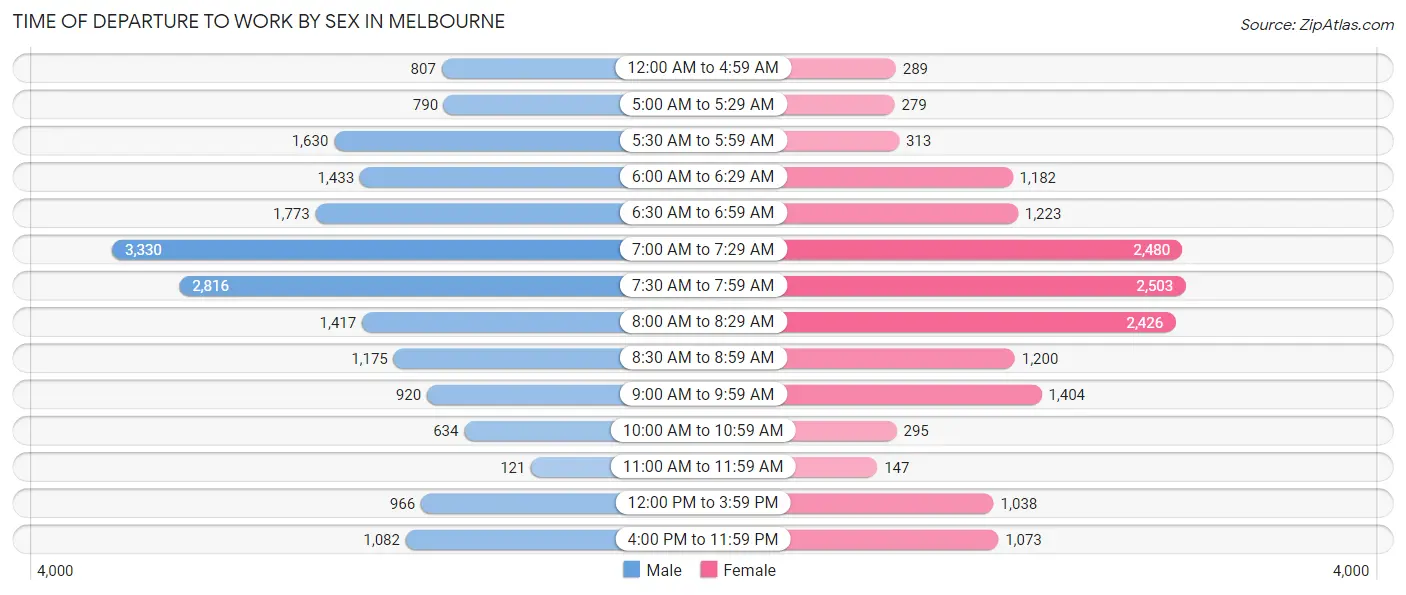
| Time of Departure | Male | Female |
| 12:00 AM to 4:59 AM | 807 (4.3%) | 289 (1.8%) |
| 5:00 AM to 5:29 AM | 790 (4.2%) | 279 (1.8%) |
| 5:30 AM to 5:59 AM | 1,630 (8.6%) | 313 (2.0%) |
| 6:00 AM to 6:29 AM | 1,433 (7.6%) | 1,182 (7.5%) |
| 6:30 AM to 6:59 AM | 1,773 (9.4%) | 1,223 (7.7%) |
| 7:00 AM to 7:29 AM | 3,330 (17.6%) | 2,480 (15.6%) |
| 7:30 AM to 7:59 AM | 2,816 (14.9%) | 2,503 (15.8%) |
| 8:00 AM to 8:29 AM | 1,417 (7.5%) | 2,426 (15.3%) |
| 8:30 AM to 8:59 AM | 1,175 (6.2%) | 1,200 (7.6%) |
| 9:00 AM to 9:59 AM | 920 (4.9%) | 1,404 (8.9%) |
| 10:00 AM to 10:59 AM | 634 (3.4%) | 295 (1.9%) |
| 11:00 AM to 11:59 AM | 121 (0.6%) | 147 (0.9%) |
| 12:00 PM to 3:59 PM | 966 (5.1%) | 1,038 (6.6%) |
| 4:00 PM to 11:59 PM | 1,082 (5.7%) | 1,073 (6.8%) |
| Total | 18,894 (100.0%) | 15,852 (100.0%) |
Housing Occupancy in Melbourne
Occupancy by Ownership in Melbourne
Of the total 35,438 dwellings in Melbourne, owner-occupied units account for 20,849 (58.8%), while renter-occupied units make up 14,589 (41.2%).
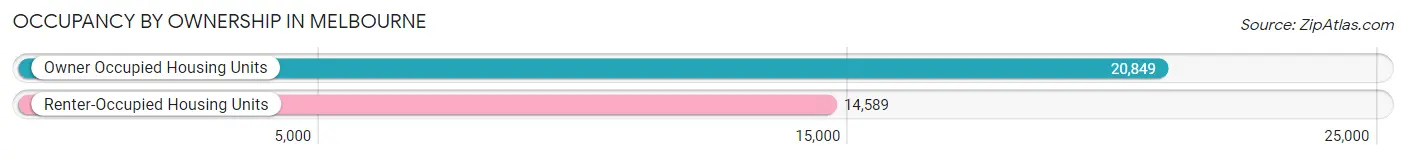
| Occupancy | # Housing Units | % Housing Units |
| Owner Occupied Housing Units | 20,849 | 58.8% |
| Renter-Occupied Housing Units | 14,589 | 41.2% |
| Total Occupied Housing Units | 35,438 | 100.0% |
Occupancy by Household Size in Melbourne
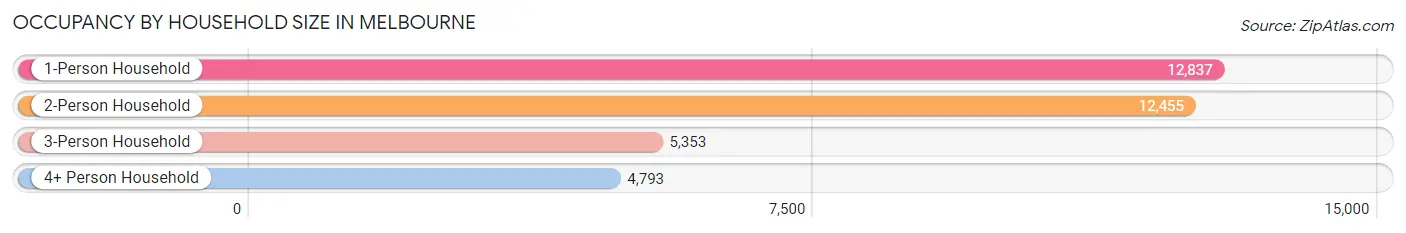
| Household Size | # Housing Units | % Housing Units |
| 1-Person Household | 12,837 | 36.2% |
| 2-Person Household | 12,455 | 35.1% |
| 3-Person Household | 5,353 | 15.1% |
| 4+ Person Household | 4,793 | 13.5% |
| Total Housing Units | 35,438 | 100.0% |
Occupancy by Ownership by Household Size in Melbourne
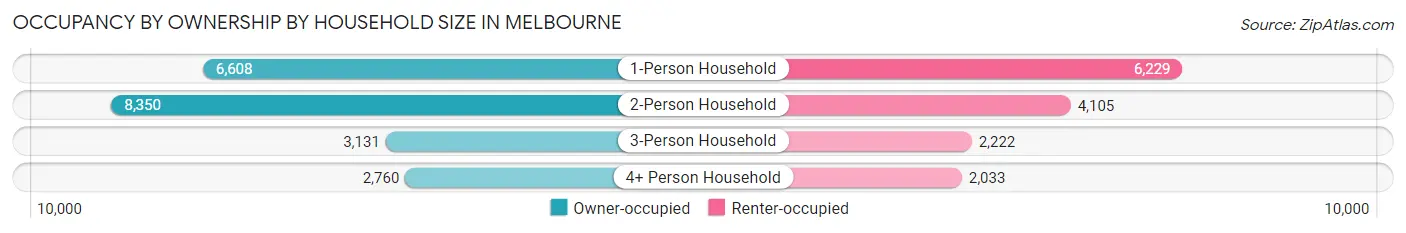
| Household Size | Owner-occupied | Renter-occupied |
| 1-Person Household | 6,608 (51.5%) | 6,229 (48.5%) |
| 2-Person Household | 8,350 (67.0%) | 4,105 (33.0%) |
| 3-Person Household | 3,131 (58.5%) | 2,222 (41.5%) |
| 4+ Person Household | 2,760 (57.6%) | 2,033 (42.4%) |
| Total Housing Units | 20,849 (58.8%) | 14,589 (41.2%) |
Occupancy by Educational Attainment in Melbourne
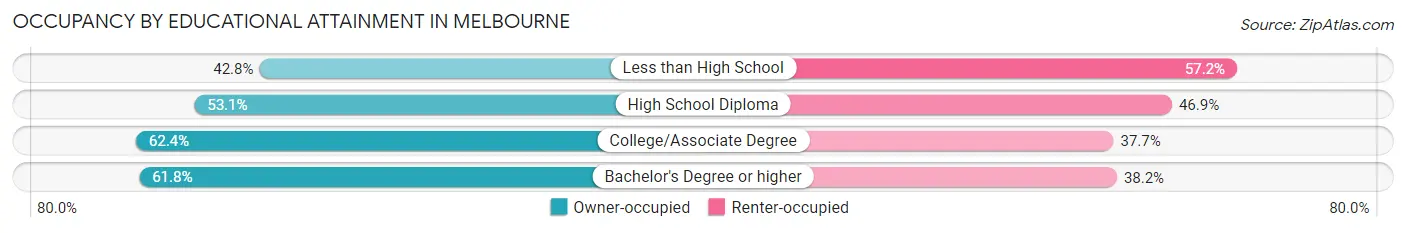
| Household Size | Owner-occupied | Renter-occupied |
| Less than High School | 859 (42.8%) | 1,149 (57.2%) |
| High School Diploma | 4,501 (53.1%) | 3,978 (46.9%) |
| College/Associate Degree | 7,625 (62.4%) | 4,604 (37.7%) |
| Bachelor's Degree or higher | 7,864 (61.8%) | 4,858 (38.2%) |
Occupancy by Age of Householder in Melbourne
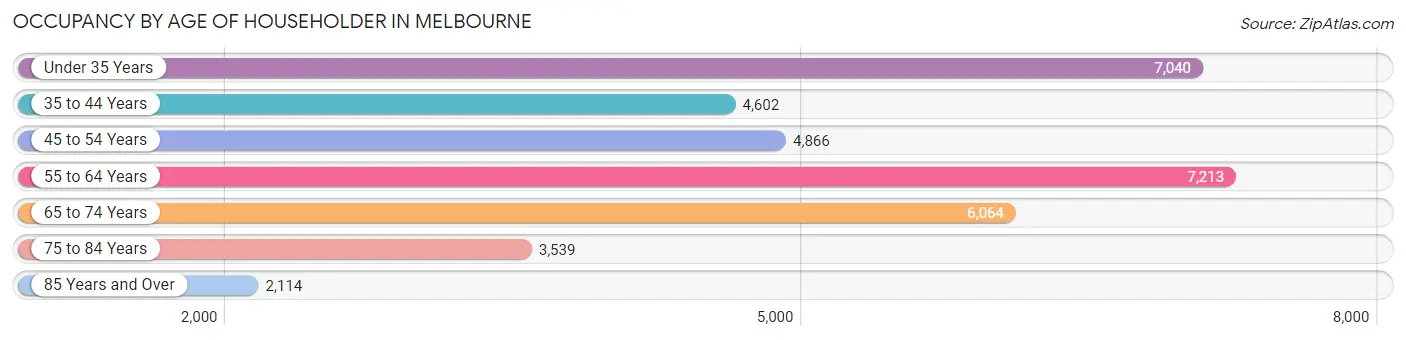
| Age Bracket | # Households | % Households |
| Under 35 Years | 7,040 | 19.9% |
| 35 to 44 Years | 4,602 | 13.0% |
| 45 to 54 Years | 4,866 | 13.7% |
| 55 to 64 Years | 7,213 | 20.3% |
| 65 to 74 Years | 6,064 | 17.1% |
| 75 to 84 Years | 3,539 | 10.0% |
| 85 Years and Over | 2,114 | 6.0% |
| Total | 35,438 | 100.0% |
Housing Finances in Melbourne
Median Income by Occupancy in Melbourne
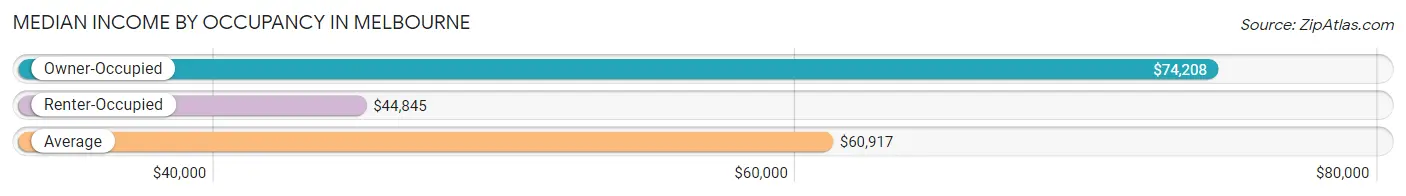
| Occupancy Type | # Households | Median Income |
| Owner-Occupied | 20,849 (58.8%) | $74,208 |
| Renter-Occupied | 14,589 (41.2%) | $44,845 |
| Average | 35,438 (100.0%) | $60,917 |
Occupancy by Householder Income Bracket in Melbourne
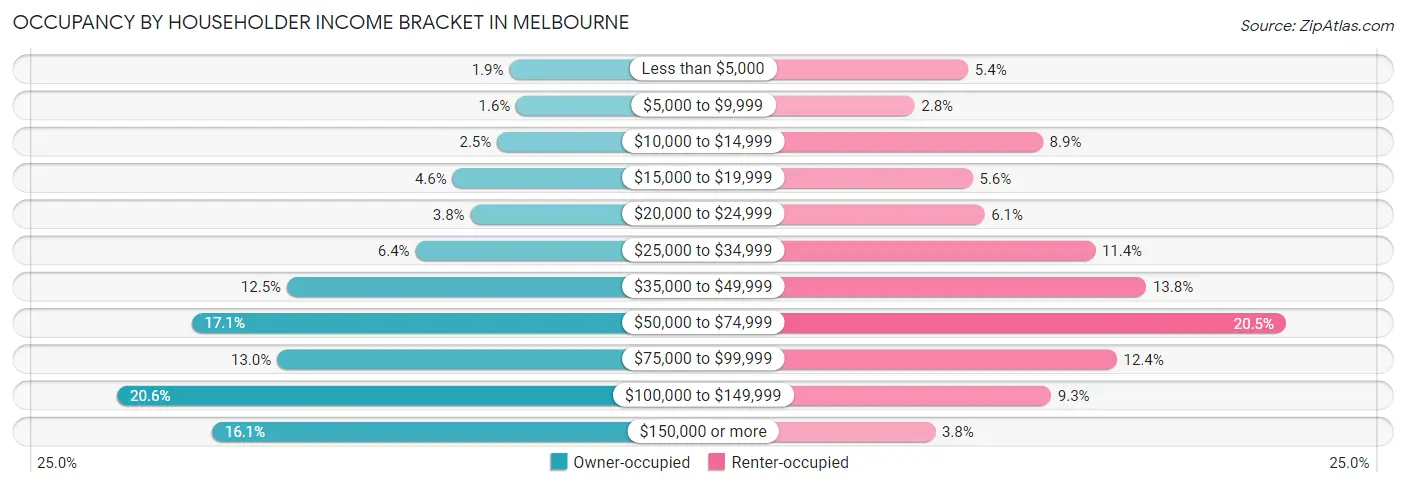
| Income Bracket | Owner-occupied | Renter-occupied |
| Less than $5,000 | 401 (1.9%) | 780 (5.3%) |
| $5,000 to $9,999 | 331 (1.6%) | 409 (2.8%) |
| $10,000 to $14,999 | 521 (2.5%) | 1,300 (8.9%) |
| $15,000 to $19,999 | 963 (4.6%) | 812 (5.6%) |
| $20,000 to $24,999 | 787 (3.8%) | 895 (6.1%) |
| $25,000 to $34,999 | 1,332 (6.4%) | 1,663 (11.4%) |
| $35,000 to $49,999 | 2,608 (12.5%) | 2,018 (13.8%) |
| $50,000 to $74,999 | 3,555 (17.1%) | 2,989 (20.5%) |
| $75,000 to $99,999 | 2,707 (13.0%) | 1,814 (12.4%) |
| $100,000 to $149,999 | 4,292 (20.6%) | 1,357 (9.3%) |
| $150,000 or more | 3,352 (16.1%) | 552 (3.8%) |
| Total | 20,849 (100.0%) | 14,589 (100.0%) |
Monthly Housing Cost Tiers in Melbourne
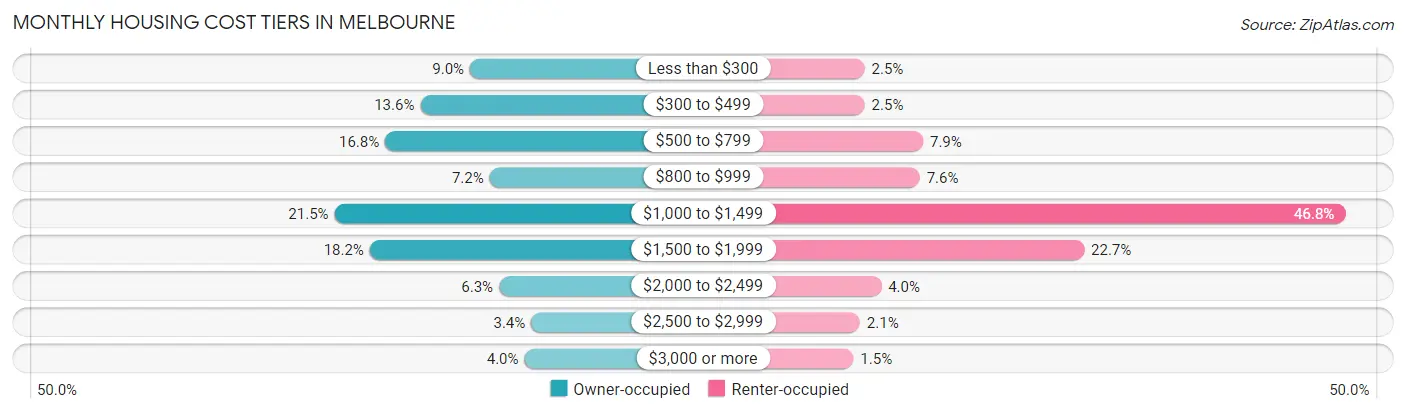
| Monthly Cost | Owner-occupied | Renter-occupied |
| Less than $300 | 1,877 (9.0%) | 364 (2.5%) |
| $300 to $499 | 2,832 (13.6%) | 366 (2.5%) |
| $500 to $799 | 3,506 (16.8%) | 1,150 (7.9%) |
| $800 to $999 | 1,501 (7.2%) | 1,106 (7.6%) |
| $1,000 to $1,499 | 4,479 (21.5%) | 6,832 (46.8%) |
| $1,500 to $1,999 | 3,800 (18.2%) | 3,313 (22.7%) |
| $2,000 to $2,499 | 1,320 (6.3%) | 588 (4.0%) |
| $2,500 to $2,999 | 703 (3.4%) | 302 (2.1%) |
| $3,000 or more | 831 (4.0%) | 215 (1.5%) |
| Total | 20,849 (100.0%) | 14,589 (100.0%) |
Physical Housing Characteristics in Melbourne
Housing Structures in Melbourne
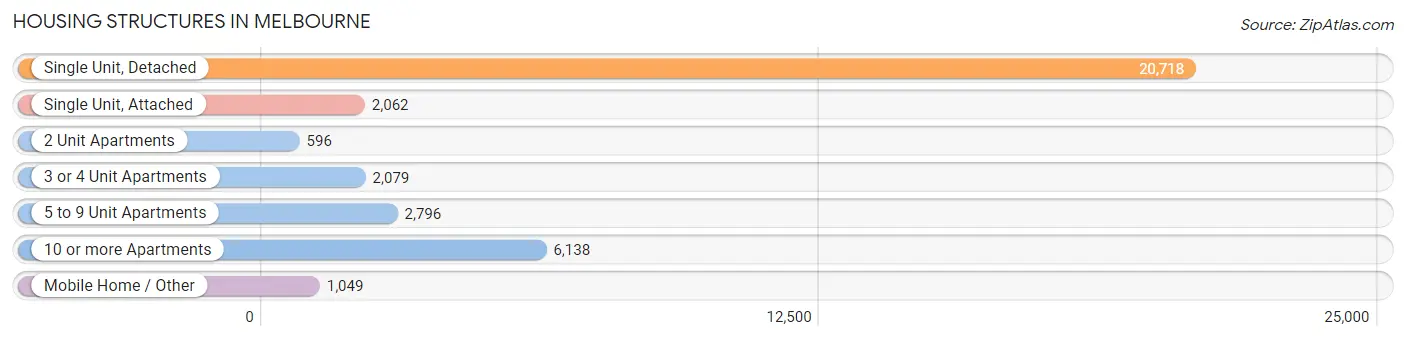
| Structure Type | # Housing Units | % Housing Units |
| Single Unit, Detached | 20,718 | 58.5% |
| Single Unit, Attached | 2,062 | 5.8% |
| 2 Unit Apartments | 596 | 1.7% |
| 3 or 4 Unit Apartments | 2,079 | 5.9% |
| 5 to 9 Unit Apartments | 2,796 | 7.9% |
| 10 or more Apartments | 6,138 | 17.3% |
| Mobile Home / Other | 1,049 | 3.0% |
| Total | 35,438 | 100.0% |
Housing Structures by Occupancy in Melbourne
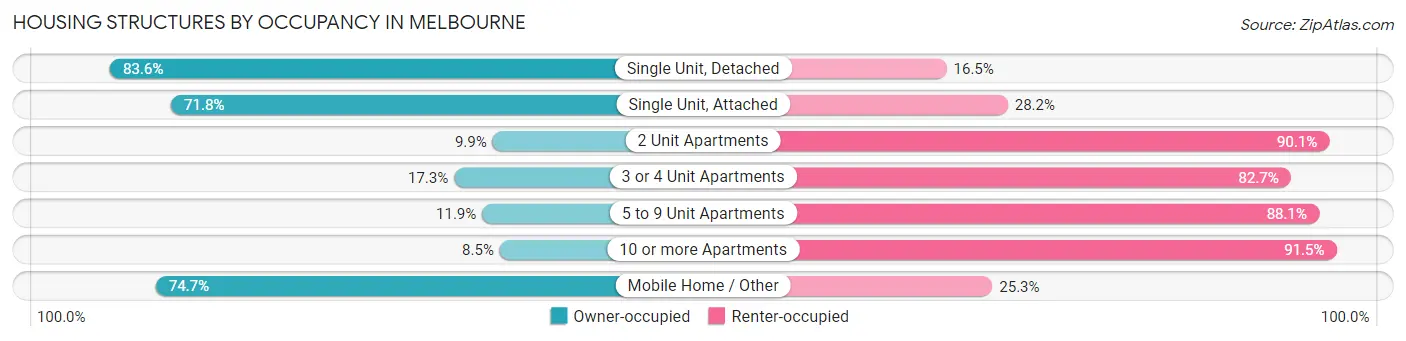
| Structure Type | Owner-occupied | Renter-occupied |
| Single Unit, Detached | 17,310 (83.6%) | 3,408 (16.5%) |
| Single Unit, Attached | 1,480 (71.8%) | 582 (28.2%) |
| 2 Unit Apartments | 59 (9.9%) | 537 (90.1%) |
| 3 or 4 Unit Apartments | 360 (17.3%) | 1,719 (82.7%) |
| 5 to 9 Unit Apartments | 333 (11.9%) | 2,463 (88.1%) |
| 10 or more Apartments | 523 (8.5%) | 5,615 (91.5%) |
| Mobile Home / Other | 784 (74.7%) | 265 (25.3%) |
| Total | 20,849 (58.8%) | 14,589 (41.2%) |
Housing Structures by Number of Rooms in Melbourne
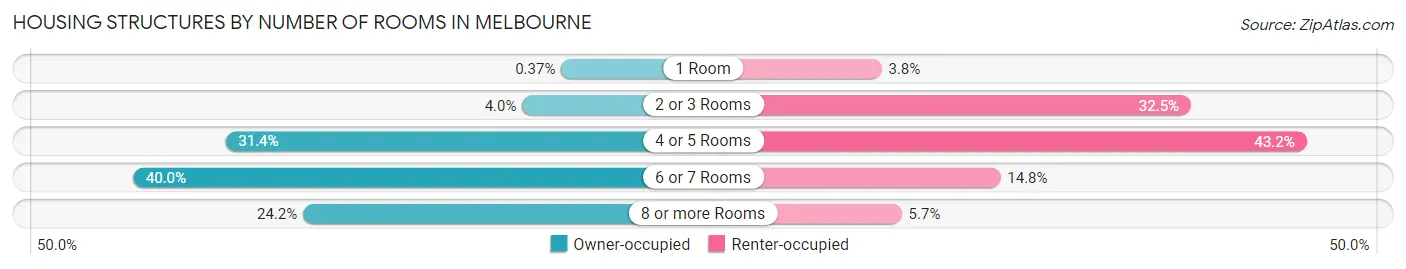
| Number of Rooms | Owner-occupied | Renter-occupied |
| 1 Room | 78 (0.4%) | 560 (3.8%) |
| 2 or 3 Rooms | 828 (4.0%) | 4,736 (32.5%) |
| 4 or 5 Rooms | 6,553 (31.4%) | 6,295 (43.1%) |
| 6 or 7 Rooms | 8,337 (40.0%) | 2,165 (14.8%) |
| 8 or more Rooms | 5,053 (24.2%) | 833 (5.7%) |
| Total | 20,849 (100.0%) | 14,589 (100.0%) |
Housing Structure by Heating Type in Melbourne
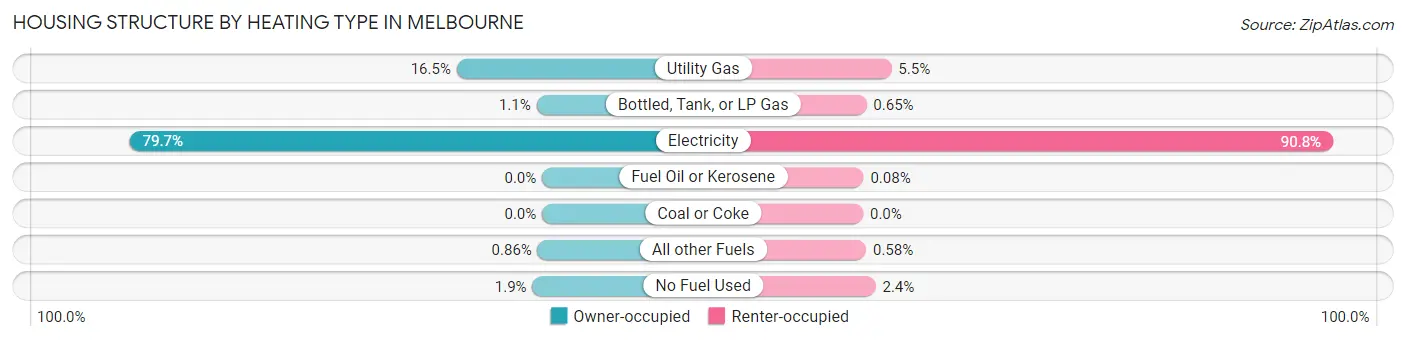
| Heating Type | Owner-occupied | Renter-occupied |
| Utility Gas | 3,440 (16.5%) | 800 (5.5%) |
| Bottled, Tank, or LP Gas | 223 (1.1%) | 95 (0.6%) |
| Electricity | 16,617 (79.7%) | 13,246 (90.8%) |
| Fuel Oil or Kerosene | 0 (0.0%) | 11 (0.1%) |
| Coal or Coke | 0 (0.0%) | 0 (0.0%) |
| All other Fuels | 180 (0.9%) | 85 (0.6%) |
| No Fuel Used | 389 (1.9%) | 352 (2.4%) |
| Total | 20,849 (100.0%) | 14,589 (100.0%) |
Household Vehicle Usage in Melbourne
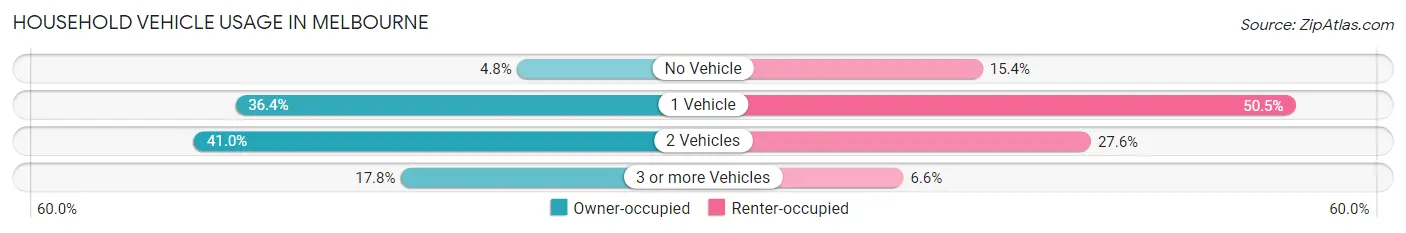
| Vehicles per Household | Owner-occupied | Renter-occupied |
| No Vehicle | 995 (4.8%) | 2,252 (15.4%) |
| 1 Vehicle | 7,588 (36.4%) | 7,360 (50.4%) |
| 2 Vehicles | 8,554 (41.0%) | 4,020 (27.6%) |
| 3 or more Vehicles | 3,712 (17.8%) | 957 (6.6%) |
| Total | 20,849 (100.0%) | 14,589 (100.0%) |
Real Estate & Mortgages in Melbourne
Real Estate and Mortgage Overview in Melbourne
| Characteristic | Without Mortgage | With Mortgage |
| Housing Units | 8,457 | 12,392 |
| Median Property Value | $227,300 | $262,400 |
| Median Household Income | $55,132 | $2,614 |
| Monthly Housing Costs | $470 | $825 |
| Real Estate Taxes | $1,516 | $327 |
Property Value by Mortgage Status in Melbourne
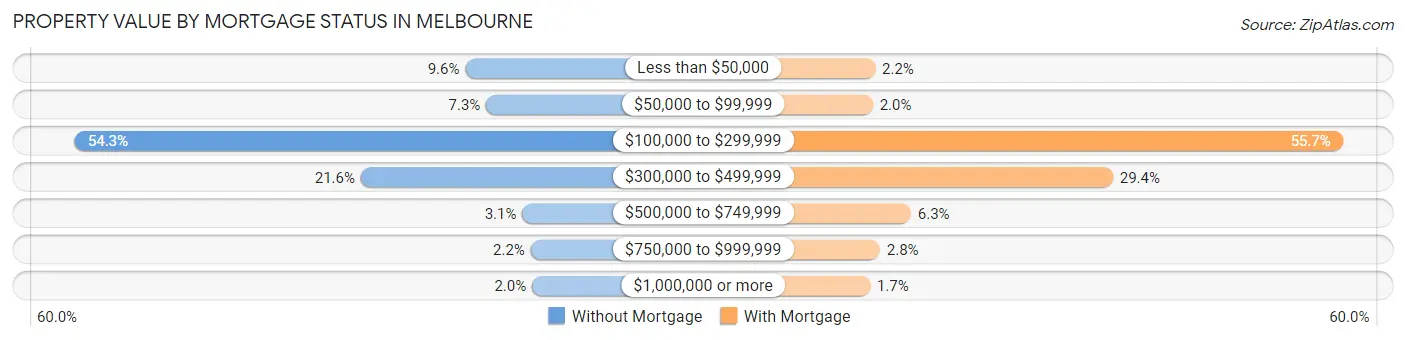
| Property Value | Without Mortgage | With Mortgage |
| Less than $50,000 | 814 (9.6%) | 276 (2.2%) |
| $50,000 to $99,999 | 613 (7.2%) | 243 (2.0%) |
| $100,000 to $299,999 | 4,588 (54.2%) | 6,899 (55.7%) |
| $300,000 to $499,999 | 1,825 (21.6%) | 3,643 (29.4%) |
| $500,000 to $749,999 | 264 (3.1%) | 783 (6.3%) |
| $750,000 to $999,999 | 183 (2.2%) | 344 (2.8%) |
| $1,000,000 or more | 170 (2.0%) | 204 (1.7%) |
| Total | 8,457 (100.0%) | 12,392 (100.0%) |
Household Income by Mortgage Status in Melbourne
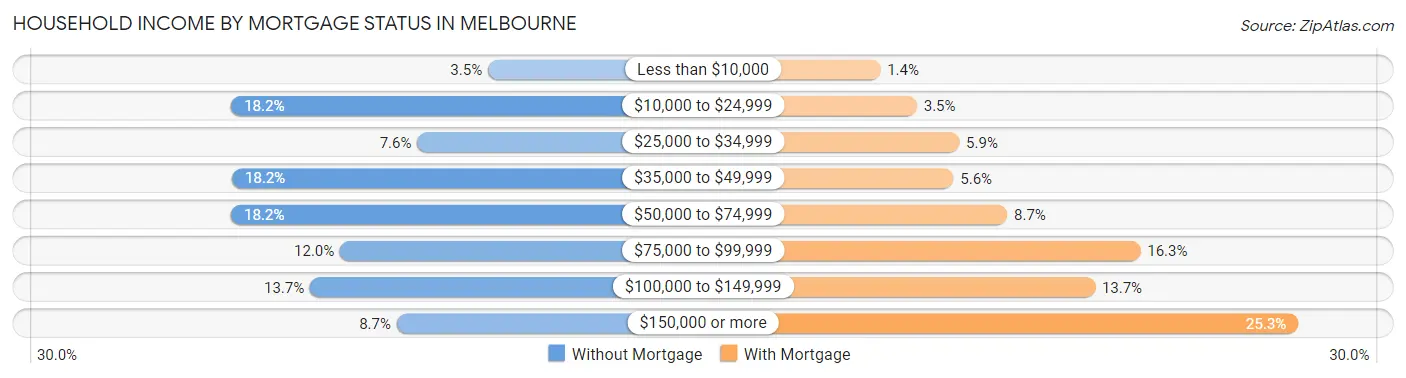
| Household Income | Without Mortgage | With Mortgage |
| Less than $10,000 | 298 (3.5%) | 175 (1.4%) |
| $10,000 to $24,999 | 1,538 (18.2%) | 434 (3.5%) |
| $25,000 to $34,999 | 639 (7.6%) | 733 (5.9%) |
| $35,000 to $49,999 | 1,535 (18.1%) | 693 (5.6%) |
| $50,000 to $74,999 | 1,539 (18.2%) | 1,073 (8.7%) |
| $75,000 to $99,999 | 1,012 (12.0%) | 2,016 (16.3%) |
| $100,000 to $149,999 | 1,158 (13.7%) | 1,695 (13.7%) |
| $150,000 or more | 738 (8.7%) | 3,134 (25.3%) |
| Total | 8,457 (100.0%) | 12,392 (100.0%) |
Property Value to Household Income Ratio in Melbourne
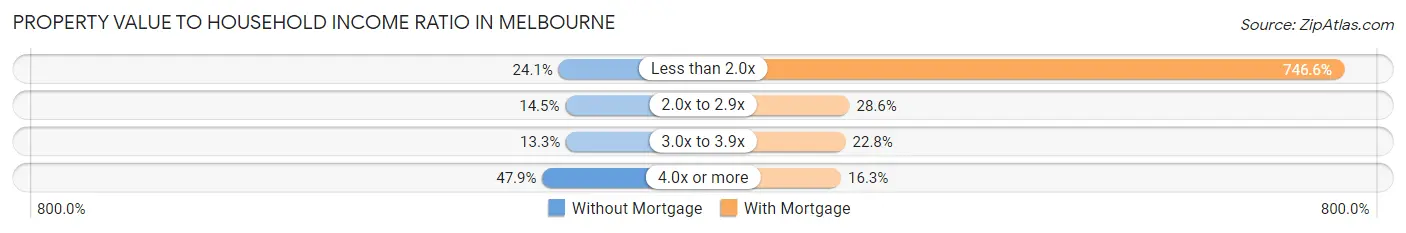
| Value-to-Income Ratio | Without Mortgage | With Mortgage |
| Less than 2.0x | 2,037 (24.1%) | 92,512 (746.5%) |
| 2.0x to 2.9x | 1,224 (14.5%) | 3,538 (28.5%) |
| 3.0x to 3.9x | 1,123 (13.3%) | 2,825 (22.8%) |
| 4.0x or more | 4,049 (47.9%) | 2,018 (16.3%) |
| Total | 8,457 (100.0%) | 12,392 (100.0%) |
Real Estate Taxes by Mortgage Status in Melbourne
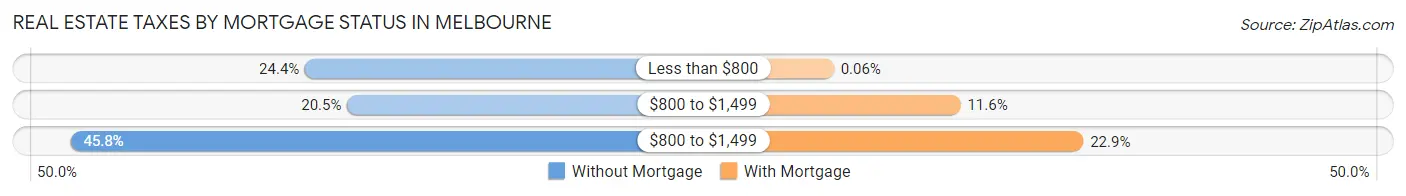
| Property Taxes | Without Mortgage | With Mortgage |
| Less than $800 | 2,062 (24.4%) | 8 (0.1%) |
| $800 to $1,499 | 1,736 (20.5%) | 1,442 (11.6%) |
| $800 to $1,499 | 3,874 (45.8%) | 2,831 (22.9%) |
| Total | 8,457 (100.0%) | 12,392 (100.0%) |
Health & Disability in Melbourne
Health Insurance Coverage by Age in Melbourne
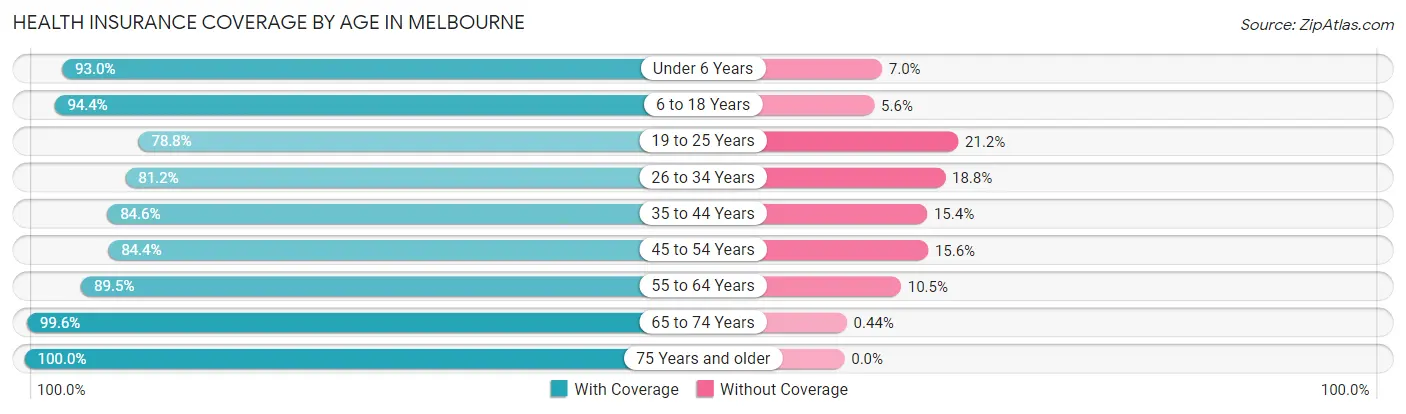
| Age Bracket | With Coverage | Without Coverage |
| Under 6 Years | 4,486 (93.0%) | 338 (7.0%) |
| 6 to 18 Years | 10,706 (94.4%) | 631 (5.6%) |
| 19 to 25 Years | 6,741 (78.8%) | 1,816 (21.2%) |
| 26 to 34 Years | 8,465 (81.2%) | 1,959 (18.8%) |
| 35 to 44 Years | 7,547 (84.6%) | 1,376 (15.4%) |
| 45 to 54 Years | 8,102 (84.4%) | 1,497 (15.6%) |
| 55 to 64 Years | 11,151 (89.5%) | 1,312 (10.5%) |
| 65 to 74 Years | 9,823 (99.6%) | 43 (0.4%) |
| 75 Years and older | 7,667 (100.0%) | 0 (0.0%) |
| Total | 74,688 (89.3%) | 8,972 (10.7%) |
Health Insurance Coverage by Citizenship Status in Melbourne
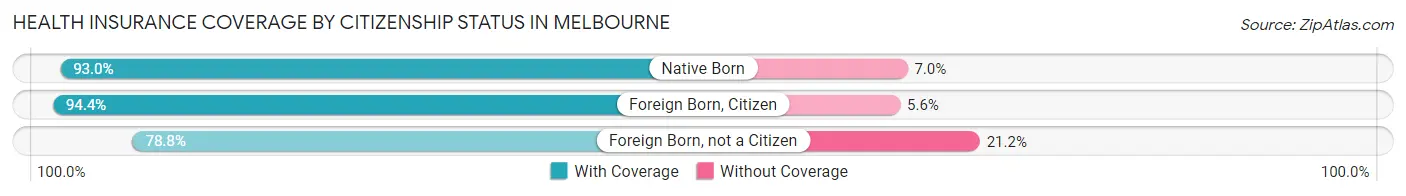
| Citizenship Status | With Coverage | Without Coverage |
| Native Born | 4,486 (93.0%) | 338 (7.0%) |
| Foreign Born, Citizen | 10,706 (94.4%) | 631 (5.6%) |
| Foreign Born, not a Citizen | 6,741 (78.8%) | 1,816 (21.2%) |
Health Insurance Coverage by Household Income in Melbourne
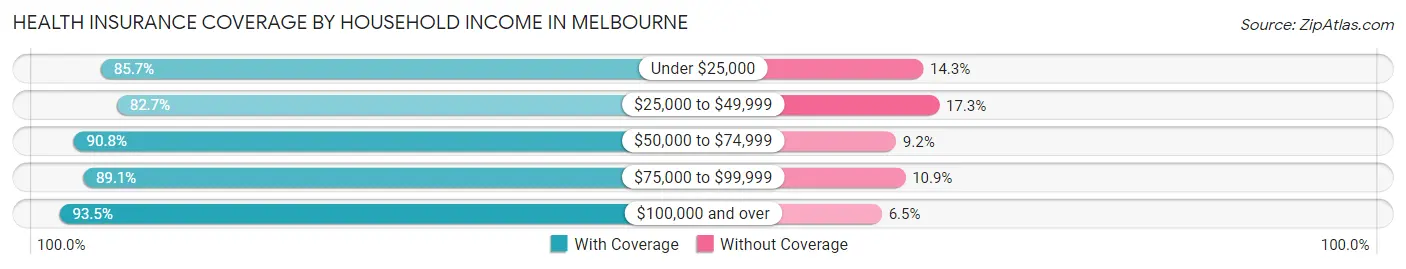
| Household Income | With Coverage | Without Coverage |
| Under $25,000 | 10,638 (85.7%) | 1,773 (14.3%) |
| $25,000 to $49,999 | 12,758 (82.7%) | 2,665 (17.3%) |
| $50,000 to $74,999 | 13,896 (90.8%) | 1,408 (9.2%) |
| $75,000 to $99,999 | 9,926 (89.1%) | 1,219 (10.9%) |
| $100,000 and over | 25,116 (93.5%) | 1,758 (6.5%) |
Public vs Private Health Insurance Coverage by Age in Melbourne
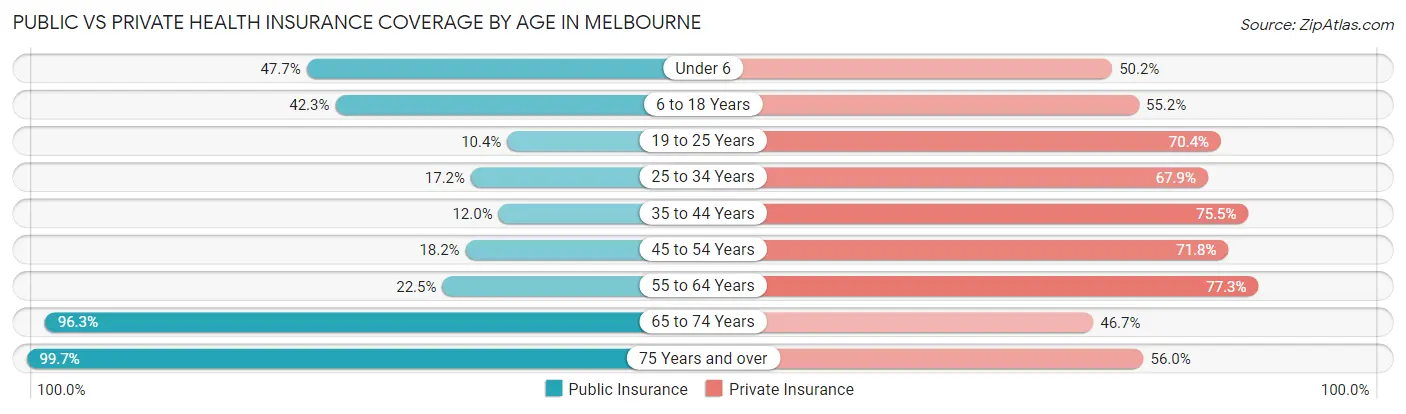
| Age Bracket | Public Insurance | Private Insurance |
| Under 6 | 2,300 (47.7%) | 2,421 (50.2%) |
| 6 to 18 Years | 4,799 (42.3%) | 6,255 (55.2%) |
| 19 to 25 Years | 892 (10.4%) | 6,021 (70.4%) |
| 25 to 34 Years | 1,790 (17.2%) | 7,081 (67.9%) |
| 35 to 44 Years | 1,074 (12.0%) | 6,733 (75.5%) |
| 45 to 54 Years | 1,744 (18.2%) | 6,887 (71.8%) |
| 55 to 64 Years | 2,801 (22.5%) | 9,635 (77.3%) |
| 65 to 74 Years | 9,496 (96.3%) | 4,606 (46.7%) |
| 75 Years and over | 7,640 (99.7%) | 4,294 (56.0%) |
| Total | 32,536 (38.9%) | 53,933 (64.5%) |
Disability Status by Sex by Age in Melbourne
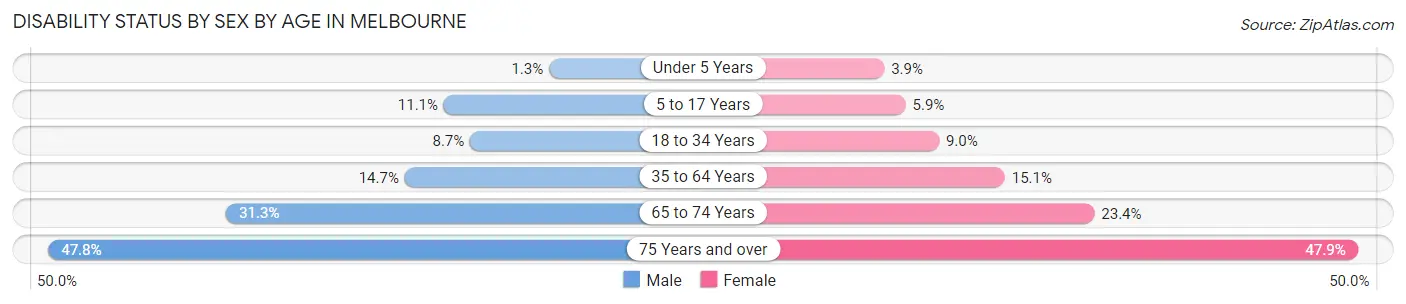
| Age Bracket | Male | Female |
| Under 5 Years | 22 (1.3%) | 90 (3.9%) |
| 5 to 17 Years | 627 (11.1%) | 320 (5.9%) |
| 18 to 34 Years | 934 (8.6%) | 843 (9.0%) |
| 35 to 64 Years | 2,286 (14.7%) | 2,338 (15.1%) |
| 65 to 74 Years | 1,380 (31.3%) | 1,279 (23.4%) |
| 75 Years and over | 1,433 (47.8%) | 2,235 (47.9%) |
Disability Class by Sex by Age in Melbourne
Disability Class: Hearing Difficulty
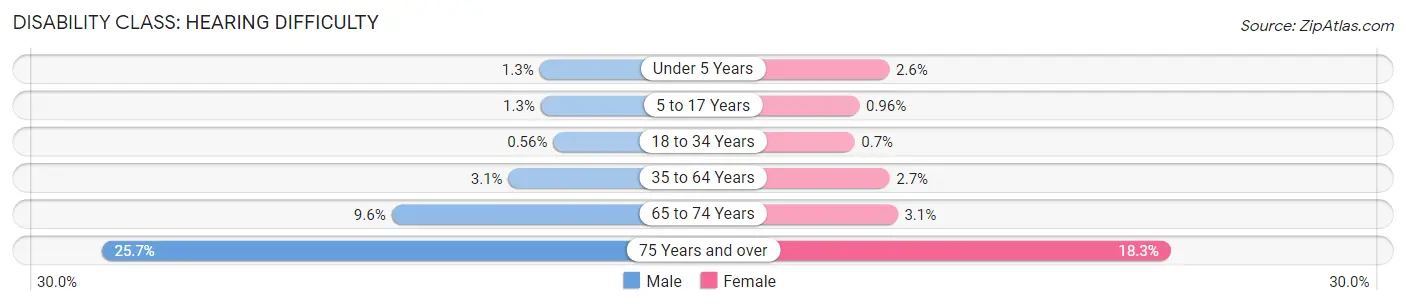
| Age Bracket | Male | Female |
| Under 5 Years | 22 (1.3%) | 60 (2.6%) |
| 5 to 17 Years | 71 (1.3%) | 52 (1.0%) |
| 18 to 34 Years | 60 (0.6%) | 65 (0.7%) |
| 35 to 64 Years | 476 (3.1%) | 409 (2.6%) |
| 65 to 74 Years | 422 (9.6%) | 169 (3.1%) |
| 75 Years and over | 771 (25.7%) | 855 (18.3%) |
Disability Class: Vision Difficulty
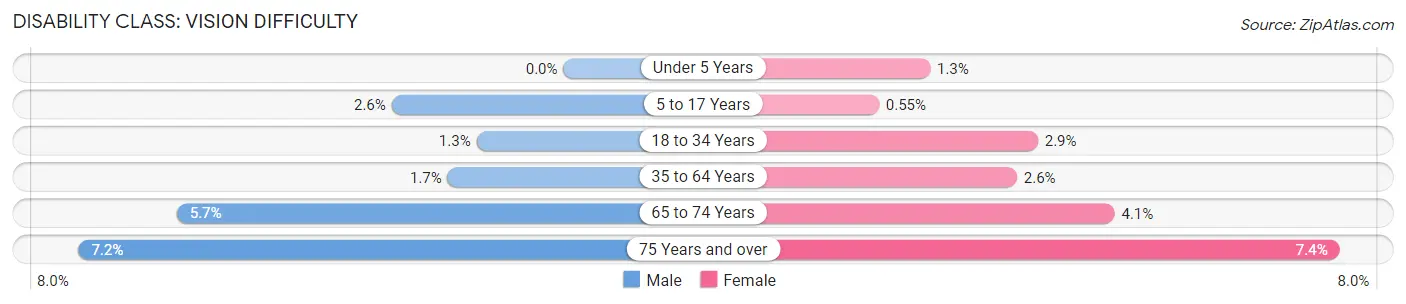
| Age Bracket | Male | Female |
| Under 5 Years | 0 (0.0%) | 30 (1.3%) |
| 5 to 17 Years | 144 (2.5%) | 30 (0.5%) |
| 18 to 34 Years | 139 (1.3%) | 272 (2.9%) |
| 35 to 64 Years | 267 (1.7%) | 402 (2.6%) |
| 65 to 74 Years | 253 (5.7%) | 221 (4.1%) |
| 75 Years and over | 216 (7.2%) | 345 (7.4%) |
Disability Class: Cognitive Difficulty
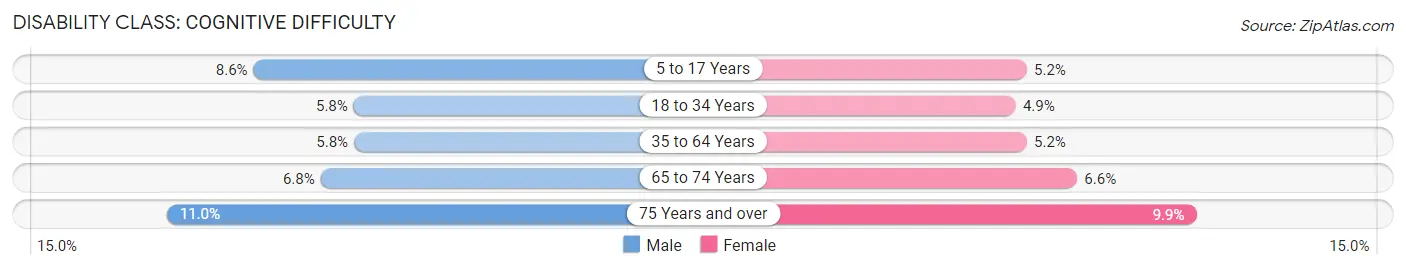
| Age Bracket | Male | Female |
| 5 to 17 Years | 488 (8.6%) | 279 (5.2%) |
| 18 to 34 Years | 631 (5.8%) | 453 (4.9%) |
| 35 to 64 Years | 905 (5.8%) | 797 (5.2%) |
| 65 to 74 Years | 298 (6.8%) | 358 (6.6%) |
| 75 Years and over | 331 (11.0%) | 461 (9.9%) |
Disability Class: Ambulatory Difficulty
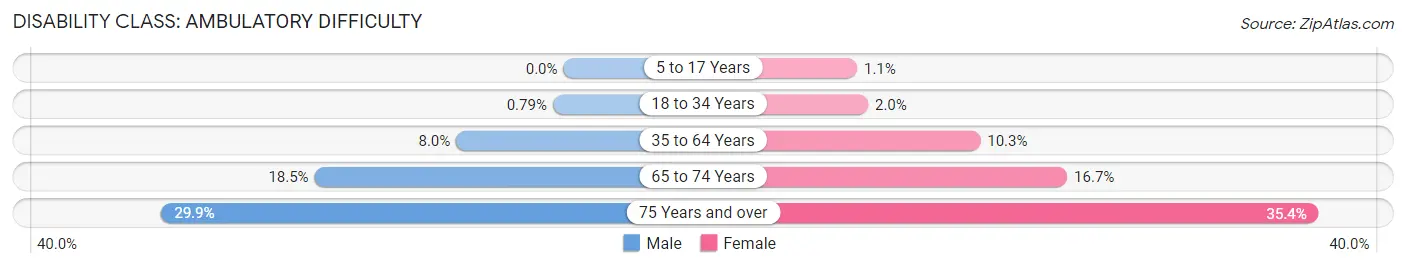
| Age Bracket | Male | Female |
| 5 to 17 Years | 0 (0.0%) | 61 (1.1%) |
| 18 to 34 Years | 85 (0.8%) | 182 (1.9%) |
| 35 to 64 Years | 1,236 (8.0%) | 1,589 (10.3%) |
| 65 to 74 Years | 815 (18.5%) | 913 (16.7%) |
| 75 Years and over | 895 (29.8%) | 1,653 (35.4%) |
Disability Class: Self-Care Difficulty
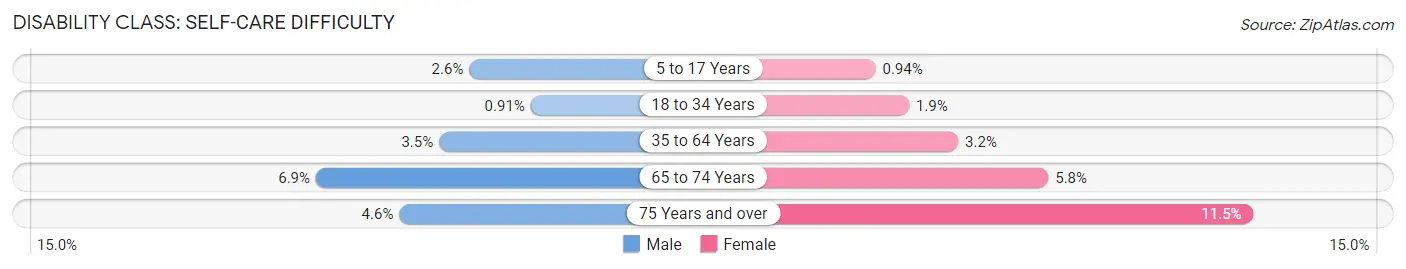
| Age Bracket | Male | Female |
| 5 to 17 Years | 148 (2.6%) | 51 (0.9%) |
| 18 to 34 Years | 98 (0.9%) | 175 (1.9%) |
| 35 to 64 Years | 538 (3.5%) | 501 (3.2%) |
| 65 to 74 Years | 304 (6.9%) | 314 (5.8%) |
| 75 Years and over | 137 (4.6%) | 535 (11.5%) |
Technology Access in Melbourne
Computing Device Access in Melbourne
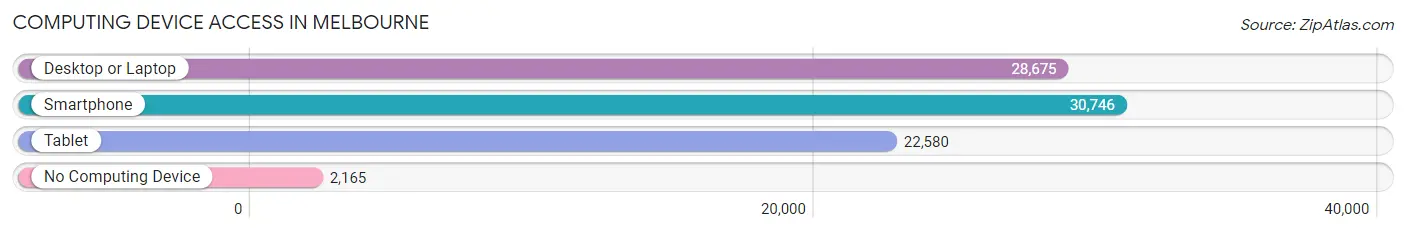
| Device Type | # Households | % Households |
| Desktop or Laptop | 28,675 | 80.9% |
| Smartphone | 30,746 | 86.8% |
| Tablet | 22,580 | 63.7% |
| No Computing Device | 2,165 | 6.1% |
| Total | 35,438 | 100.0% |
Internet Access in Melbourne
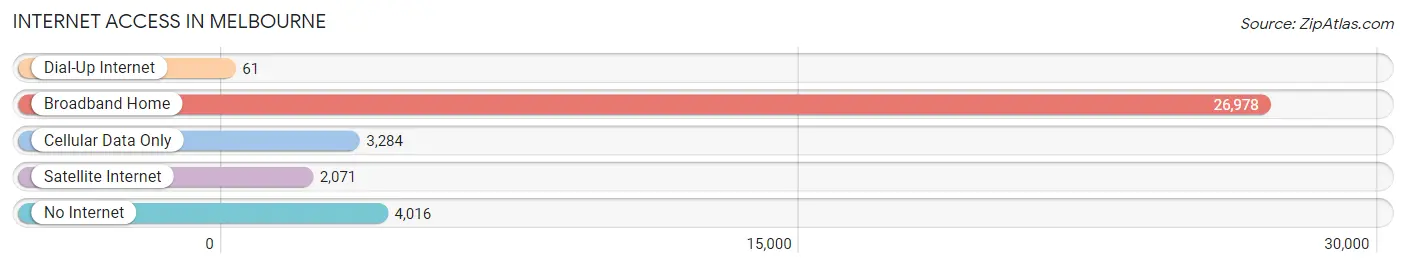
| Internet Type | # Households | % Households |
| Dial-Up Internet | 61 | 0.2% |
| Broadband Home | 26,978 | 76.1% |
| Cellular Data Only | 3,284 | 9.3% |
| Satellite Internet | 2,071 | 5.8% |
| No Internet | 4,016 | 11.3% |
| Total | 35,438 | 100.0% |
Melbourne Summary
Melbourne, Florida is a city located in Brevard County, on the east coast of the state. It is part of the Palm Bay-Melbourne-Titusville Metropolitan Statistical Area. The city has a population of 78,945 as of the 2019 census, making it the second-largest city in Brevard County.
History
The area that is now Melbourne was originally inhabited by the Ais Indians, who were part of the Seminole tribe. The first European settlers arrived in the area in the late 1700s, and the city was officially founded in 1867. The city was named after Melbourne, Australia, which was named after the British Prime Minister of the time, William Lamb, 2nd Viscount Melbourne.
The city was initially a farming community, but it began to grow in the late 1800s when the Florida East Coast Railway was built through the area. This allowed for the development of the citrus industry, which was a major part of the city’s economy for many years.
In the early 1900s, the city began to develop as a tourist destination, and it was incorporated in 1923. The city continued to grow throughout the 20th century, and it is now a major hub for technology, aerospace, and defense industries.
Geography
Melbourne is located on the east coast of Florida, about 50 miles southeast of Orlando. The city is situated on the Indian River Lagoon, which is part of the Atlantic Intracoastal Waterway. The city covers an area of 33.2 square miles, and it is bordered by the cities of Palm Bay and Titusville to the north, and the cities of West Melbourne and Indialantic to the south.
The city has a humid subtropical climate, with hot, humid summers and mild winters. The average temperature in the summer is around 90°F, and the average temperature in the winter is around 60°F.
Economy
Melbourne’s economy is largely based on the aerospace and defense industries. The city is home to the headquarters of Harris Corporation, a major defense contractor, and the Melbourne International Airport, which is a major hub for the aerospace industry.
The city is also home to several major employers, including the Brevard County Public Schools, Health First, and the Brevard County government. The city also has a thriving tourism industry, with several popular attractions, such as the Brevard Zoo, the Brevard Museum of Art and Science, and the Melbourne Square Mall.
Demographics
As of the 2019 census, the population of Melbourne was 78,945. The city has a diverse population, with a mix of races and ethnicities. The largest racial group is White (63.2%), followed by Black or African American (17.2%), Hispanic or Latino (14.2%), and Asian (3.7%).
The median household income in Melbourne is $50,845, and the median home value is $179,400. The city has a high rate of homeownership, with 73.2% of residents owning their homes. The city also has a high rate of educational attainment, with 87.2% of residents having at least a high school diploma and 33.2% having a bachelor’s degree or higher.
Common Questions
What is Per Capita Income in Melbourne?
Per Capita income in Melbourne is $34,236.
What is the Median Family Income in Melbourne?
Median Family Income in Melbourne is $74,196.
What is the Median Household income in Melbourne?
Median Household Income in Melbourne is $60,917.
What is Income or Wage Gap in Melbourne?
Income or Wage Gap in Melbourne is 22.4%.
Women in Melbourne earn 77.6 cents for every dollar earned by a man.
What is Family Income Deficit in Melbourne?
Family Income Deficit in Melbourne is $12,496.
Families that are below poverty line in Melbourne earn $12,496 less on average than the poverty threshold level.
What is Inequality or Gini Index in Melbourne?
Inequality or Gini Index in Melbourne is 0.44.
What is the Total Population of Melbourne?
Total Population of Melbourne is 84,982.
What is the Total Male Population of Melbourne?
Total Male Population of Melbourne is 41,662.
What is the Total Female Population of Melbourne?
Total Female Population of Melbourne is 43,320.
What is the Ratio of Males per 100 Females in Melbourne?
There are 96.17 Males per 100 Females in Melbourne.
What is the Ratio of Females per 100 Males in Melbourne?
There are 103.98 Females per 100 Males in Melbourne.
What is the Median Population Age in Melbourne?
Median Population Age in Melbourne is 42.4 Years.
What is the Average Family Size in Melbourne
Average Family Size in Melbourne is 3.0 People.
What is the Average Household Size in Melbourne
Average Household Size in Melbourne is 2.3 People.
How Large is the Labor Force in Melbourne?
There are 42,233 People in the Labor Forcein in Melbourne.
What is the Percentage of People in the Labor Force in Melbourne?
58.6% of People are in the Labor Force in Melbourne.
What is the Unemployment Rate in Melbourne?
Unemployment Rate in Melbourne is 4.6%.