League City, TX Map & Demographics
League City Map
League City Overview
$51,636
PER CAPITA INCOME
$139,892
AVG FAMILY INCOME
$117,316
AVG HOUSEHOLD INCOME
32.5%
WAGE / INCOME GAP [ % ]
67.5¢/ $1
WAGE / INCOME GAP [ $ ]
0.40
INEQUALITY / GINI INDEX
113,469
TOTAL POPULATION
57,571
MALE POPULATION
55,898
FEMALE POPULATION
102.99
MALES / 100 FEMALES
97.09
FEMALES / 100 MALES
37.1
MEDIAN AGE
3.2
AVG FAMILY SIZE
2.7
AVG HOUSEHOLD SIZE
61,103
LABOR FORCE [ PEOPLE ]
70.2%
PERCENT IN LABOR FORCE
4.2%
UNEMPLOYMENT RATE
League City Zip Codes
Income in League City
Income Overview in League City
Per Capita Income in League City is $51,636, while median incomes of families and households are $139,892 and $117,316 respectively.
| Characteristic | Number | Measure |
| Per Capita Income | 113,469 | $51,636 |
| Median Family Income | 30,835 | $139,892 |
| Mean Family Income | 30,835 | $160,074 |
| Median Household Income | 41,838 | $117,316 |
| Mean Household Income | 41,838 | $139,447 |
| Income Deficit | 30,835 | $0 |
| Wage / Income Gap (%) | 113,469 | 32.46% |
| Wage / Income Gap ($) | 113,469 | 67.54¢ per $1 |
| Gini / Inequality Index | 113,469 | 0.40 |
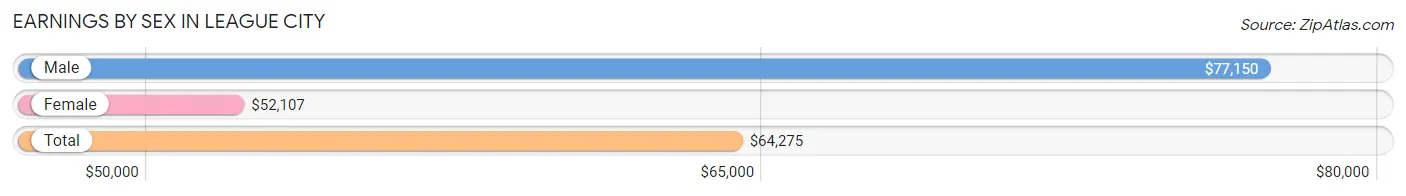
Earnings by Sex in League City
Average Earnings in League City are $64,275, $77,150 for men and $52,107 for women, a difference of 32.5%.
| Sex | Number | Average Earnings |
| Male | 33,781 (53.4%) | $77,150 |
| Female | 29,524 (46.6%) | $52,107 |
| Total | 63,305 (100.0%) | $64,275 |
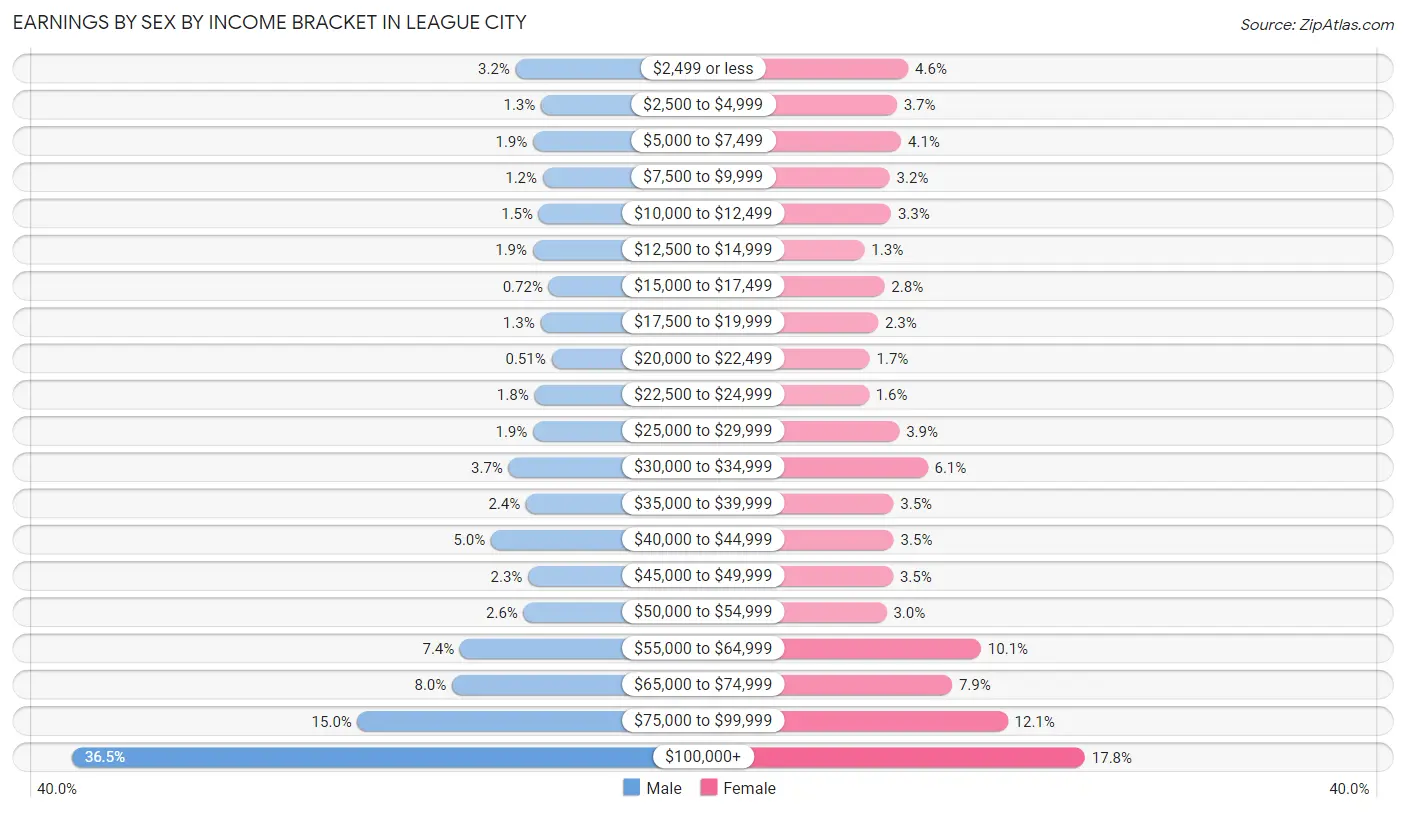
Earnings by Sex by Income Bracket in League City
The most common earnings brackets in League City are $100,000+ for men (12,317 | 36.5%) and $100,000+ for women (5,268 | 17.8%).
| Income | Male | Female |
| $2,499 or less | 1,080 (3.2%) | 1,359 (4.6%) |
| $2,500 to $4,999 | 437 (1.3%) | 1,105 (3.7%) |
| $5,000 to $7,499 | 639 (1.9%) | 1,203 (4.1%) |
| $7,500 to $9,999 | 391 (1.2%) | 949 (3.2%) |
| $10,000 to $12,499 | 493 (1.5%) | 976 (3.3%) |
| $12,500 to $14,999 | 645 (1.9%) | 390 (1.3%) |
| $15,000 to $17,499 | 243 (0.7%) | 834 (2.8%) |
| $17,500 to $19,999 | 453 (1.3%) | 690 (2.3%) |
| $20,000 to $22,499 | 173 (0.5%) | 504 (1.7%) |
| $22,500 to $24,999 | 603 (1.8%) | 484 (1.6%) |
| $25,000 to $29,999 | 639 (1.9%) | 1,161 (3.9%) |
| $30,000 to $34,999 | 1,255 (3.7%) | 1,785 (6.0%) |
| $35,000 to $39,999 | 816 (2.4%) | 1,029 (3.5%) |
| $40,000 to $44,999 | 1,701 (5.0%) | 1,036 (3.5%) |
| $45,000 to $49,999 | 762 (2.3%) | 1,021 (3.5%) |
| $50,000 to $54,999 | 878 (2.6%) | 878 (3.0%) |
| $55,000 to $64,999 | 2,487 (7.4%) | 2,968 (10.1%) |
| $65,000 to $74,999 | 2,688 (8.0%) | 2,327 (7.9%) |
| $75,000 to $99,999 | 5,081 (15.0%) | 3,557 (12.0%) |
| $100,000+ | 12,317 (36.5%) | 5,268 (17.8%) |
| Total | 33,781 (100.0%) | 29,524 (100.0%) |
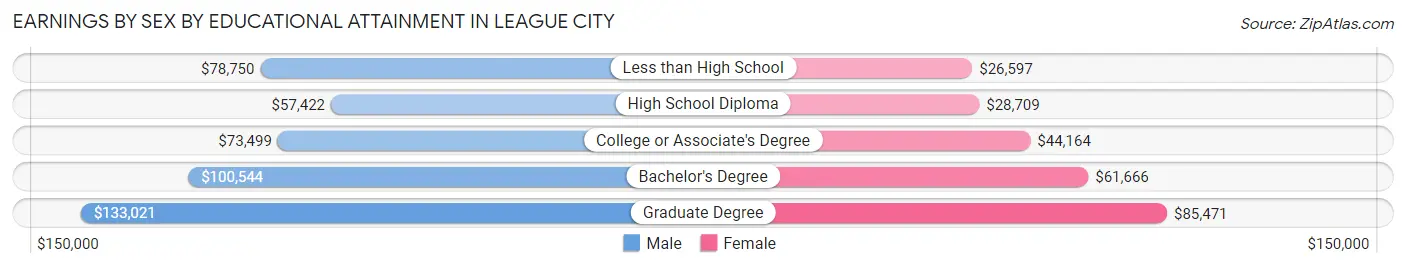
Earnings by Sex by Educational Attainment in League City
Average earnings in League City are $85,225 for men and $57,199 for women, a difference of 32.9%. Men with an educational attainment of graduate degree enjoy the highest average annual earnings of $133,021, while those with high school diploma education earn the least with $57,422. Women with an educational attainment of graduate degree earn the most with the average annual earnings of $85,471, while those with less than high school education have the smallest earnings of $26,597.
| Educational Attainment | Male Income | Female Income |
| Less than High School | $78,750 | $26,597 |
| High School Diploma | $57,422 | $28,709 |
| College or Associate's Degree | $73,499 | $44,164 |
| Bachelor's Degree | $100,544 | $61,666 |
| Graduate Degree | $133,021 | $85,471 |
| Total | $85,225 | $57,199 |
Family Income in League City
Family Income Brackets in League City
According to the League City family income data, there are 8,295 families falling into the $200,000+ income range, which is the most common income bracket and makes up 26.9% of all families. Conversely, the $10,000 to $14,999 income bracket is the least frequent group with only 216 families (0.7%) belonging to this category.
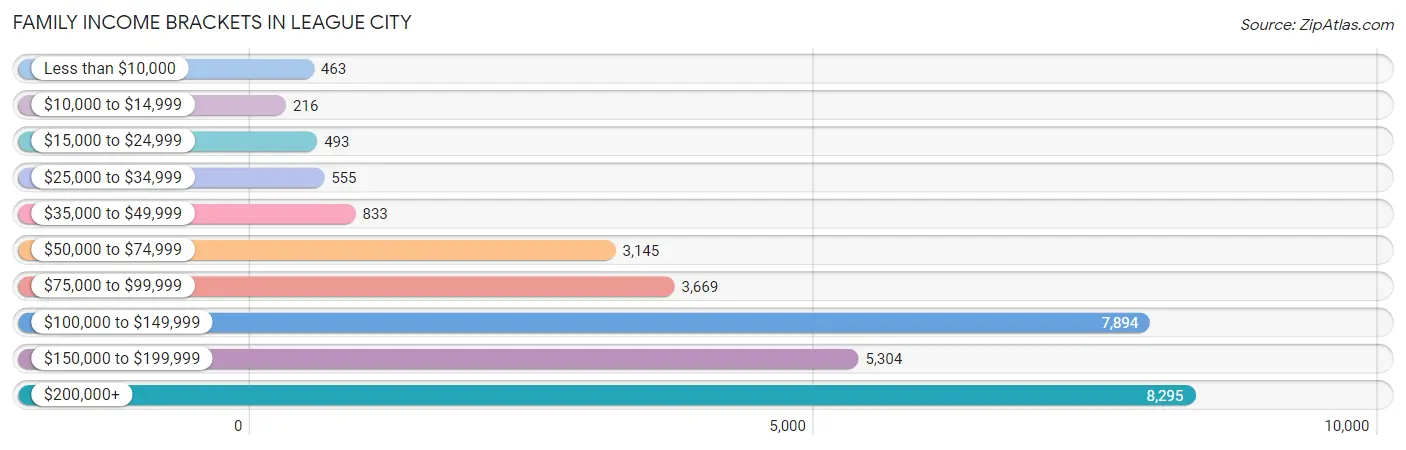
| Income Bracket | # Families | % Families |
| Less than $10,000 | 463 | 1.5% |
| $10,000 to $14,999 | 216 | 0.7% |
| $15,000 to $24,999 | 493 | 1.6% |
| $25,000 to $34,999 | 555 | 1.8% |
| $35,000 to $49,999 | 833 | 2.7% |
| $50,000 to $74,999 | 3,145 | 10.2% |
| $75,000 to $99,999 | 3,669 | 11.9% |
| $100,000 to $149,999 | 7,894 | 25.6% |
| $150,000 to $199,999 | 5,304 | 17.2% |
| $200,000+ | 8,295 | 26.9% |
Family Income by Famaliy Size in League City
6-person families (604 | 2.0%) account for the highest median family income in League City with $169,762 per family, while 2-person families (11,822 | 38.3%) have the highest median income of $60,998 per family member.
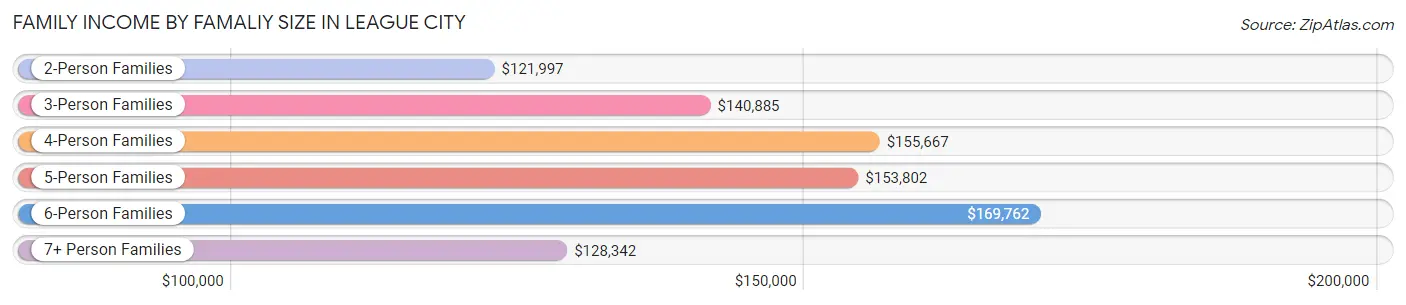
| Income Bracket | # Families | Median Income |
| 2-Person Families | 11,822 (38.3%) | $121,997 |
| 3-Person Families | 7,606 (24.7%) | $140,885 |
| 4-Person Families | 7,321 (23.7%) | $155,667 |
| 5-Person Families | 3,217 (10.4%) | $153,802 |
| 6-Person Families | 604 (2.0%) | $169,762 |
| 7+ Person Families | 265 (0.9%) | $128,342 |
| Total | 30,835 (100.0%) | $139,892 |
Family Income by Number of Earners in League City
The median family income in League City is $139,892, with families comprising 3+ earners (3,763) having the highest median family income of $172,171, while families with no earners (2,368) have the lowest median family income of $75,382, accounting for 12.2% and 7.7% of families, respectively.
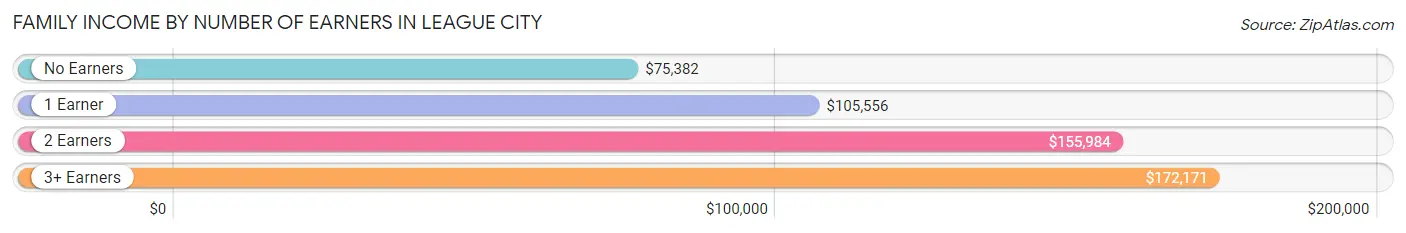
| Number of Earners | # Families | Median Income |
| No Earners | 2,368 (7.7%) | $75,382 |
| 1 Earner | 8,171 (26.5%) | $105,556 |
| 2 Earners | 16,533 (53.6%) | $155,984 |
| 3+ Earners | 3,763 (12.2%) | $172,171 |
| Total | 30,835 (100.0%) | $139,892 |
Household Income in League City
Household Income Brackets in League City
With 9,372 households falling in the category, the $100,000 to $149,999 income range is the most frequent in League City, accounting for 22.4% of all households. In contrast, only 753 households (1.8%) fall into the $10,000 to $14,999 income bracket, making it the least populous group.
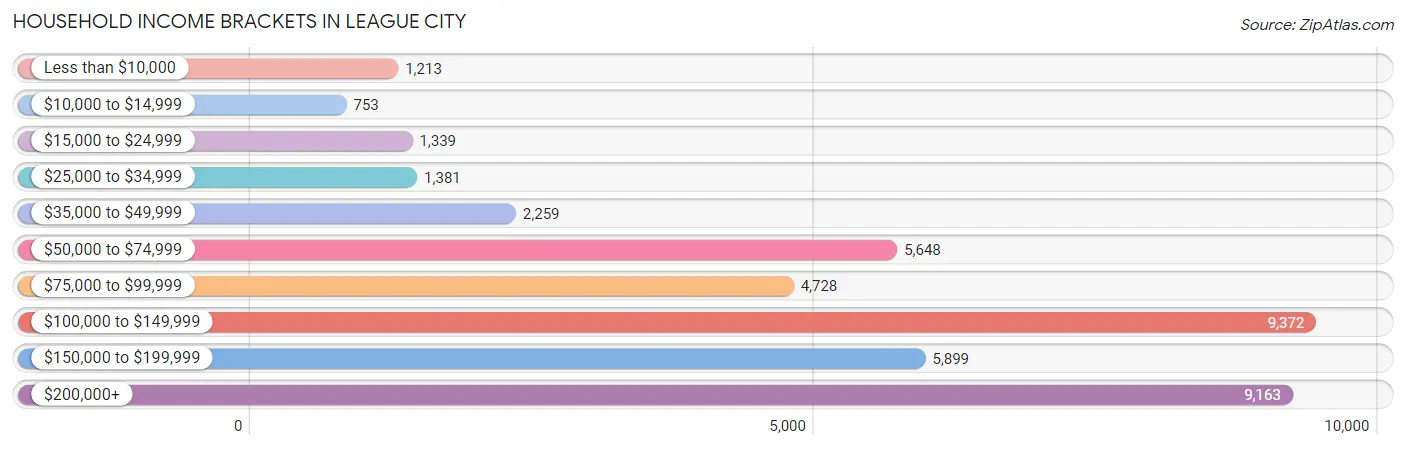
| Income Bracket | # Households | % Households |
| Less than $10,000 | 1,213 | 2.9% |
| $10,000 to $14,999 | 753 | 1.8% |
| $15,000 to $24,999 | 1,339 | 3.2% |
| $25,000 to $34,999 | 1,381 | 3.3% |
| $35,000 to $49,999 | 2,259 | 5.4% |
| $50,000 to $74,999 | 5,648 | 13.5% |
| $75,000 to $99,999 | 4,728 | 11.3% |
| $100,000 to $149,999 | 9,372 | 22.4% |
| $150,000 to $199,999 | 5,899 | 14.1% |
| $200,000+ | 9,163 | 21.9% |
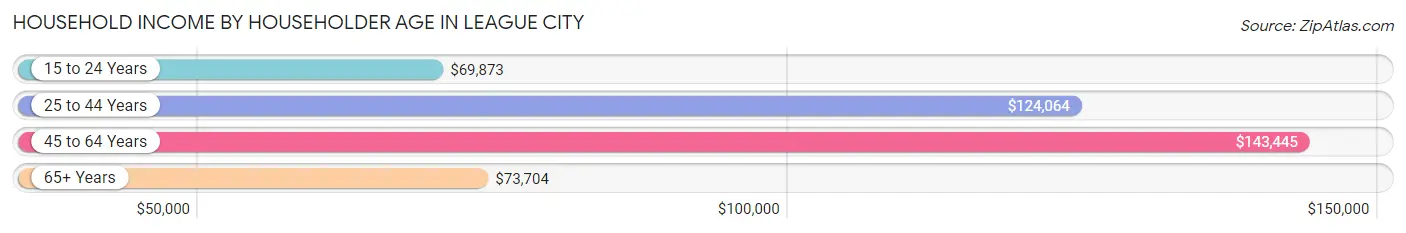
Household Income by Householder Age in League City
The median household income in League City is $117,316, with the highest median household income of $143,445 found in the 45 to 64 years age bracket for the primary householder. A total of 16,072 households (38.4%) fall into this category. Meanwhile, the 15 to 24 years age bracket for the primary householder has the lowest median household income of $69,873, with 1,094 households (2.6%) in this group.
| Income Bracket | # Households | Median Income |
| 15 to 24 Years | 1,094 (2.6%) | $69,873 |
| 25 to 44 Years | 16,811 (40.2%) | $124,064 |
| 45 to 64 Years | 16,072 (38.4%) | $143,445 |
| 65+ Years | 7,861 (18.8%) | $73,704 |
| Total | 41,838 (100.0%) | $117,316 |
Poverty in League City
Income Below Poverty by Sex and Age in League City
With 4.0% poverty level for males and 5.7% for females among the residents of League City, 65 to 74 year old males and 75 year old and over females are the most vulnerable to poverty, with 358 males (9.6%) and 607 females (22.2%) in their respective age groups living below the poverty level.
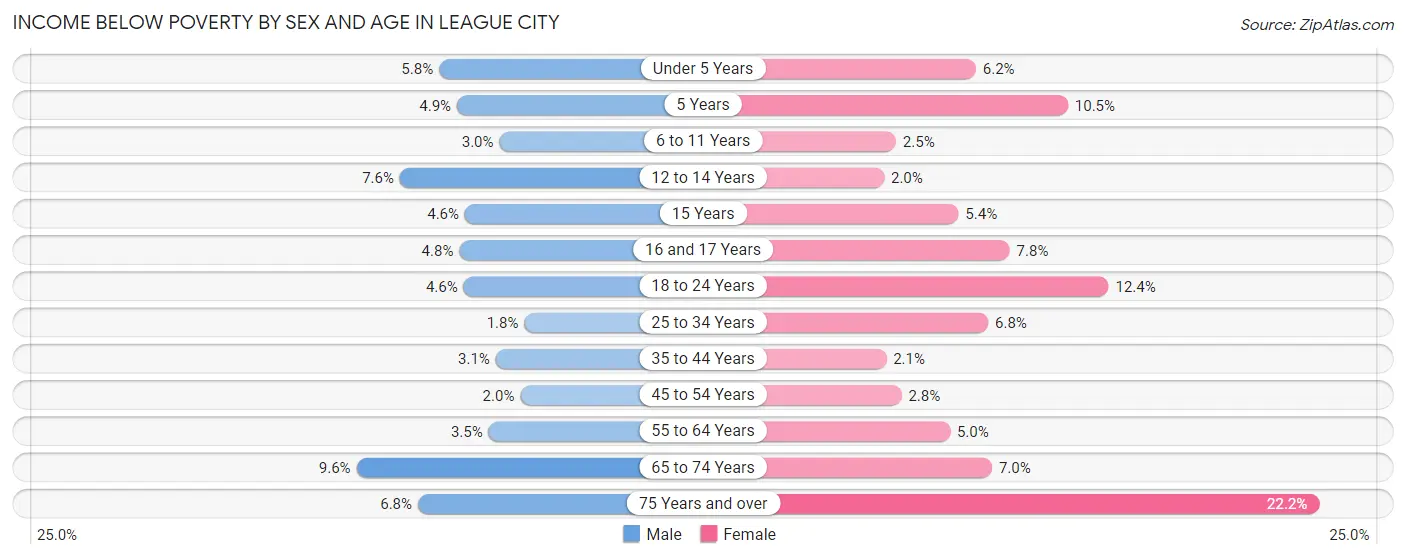
| Age Bracket | Male | Female |
| Under 5 Years | 201 (5.8%) | 211 (6.2%) |
| 5 Years | 70 (4.9%) | 56 (10.5%) |
| 6 to 11 Years | 161 (3.0%) | 125 (2.5%) |
| 12 to 14 Years | 189 (7.6%) | 52 (2.0%) |
| 15 Years | 42 (4.6%) | 49 (5.4%) |
| 16 and 17 Years | 116 (4.8%) | 109 (7.8%) |
| 18 to 24 Years | 190 (4.6%) | 440 (12.4%) |
| 25 to 34 Years | 138 (1.8%) | 498 (6.8%) |
| 35 to 44 Years | 277 (3.1%) | 196 (2.1%) |
| 45 to 54 Years | 169 (2.0%) | 227 (2.8%) |
| 55 to 64 Years | 216 (3.5%) | 318 (5.0%) |
| 65 to 74 Years | 358 (9.6%) | 274 (7.0%) |
| 75 Years and over | 151 (6.8%) | 607 (22.2%) |
| Total | 2,278 (4.0%) | 3,162 (5.7%) |
Income Above Poverty by Sex and Age in League City
According to the poverty statistics in League City, males aged 25 to 34 years and females aged 12 to 14 years are the age groups that are most secure financially, with 98.2% of males and 98.0% of females in these age groups living above the poverty line.
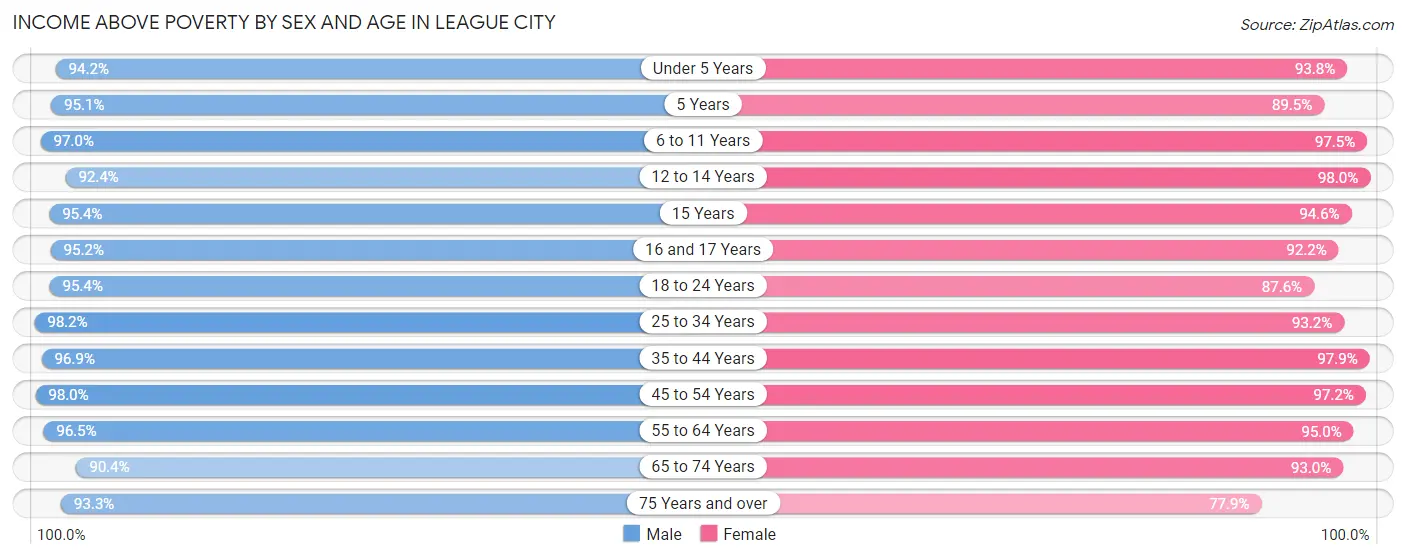
| Age Bracket | Male | Female |
| Under 5 Years | 3,282 (94.2%) | 3,180 (93.8%) |
| 5 Years | 1,347 (95.1%) | 478 (89.5%) |
| 6 to 11 Years | 5,251 (97.0%) | 4,859 (97.5%) |
| 12 to 14 Years | 2,301 (92.4%) | 2,595 (98.0%) |
| 15 Years | 878 (95.4%) | 856 (94.6%) |
| 16 and 17 Years | 2,285 (95.2%) | 1,291 (92.2%) |
| 18 to 24 Years | 3,912 (95.4%) | 3,113 (87.6%) |
| 25 to 34 Years | 7,478 (98.2%) | 6,836 (93.2%) |
| 35 to 44 Years | 8,548 (96.9%) | 9,317 (97.9%) |
| 45 to 54 Years | 8,263 (98.0%) | 7,955 (97.2%) |
| 55 to 64 Years | 6,003 (96.5%) | 6,011 (95.0%) |
| 65 to 74 Years | 3,371 (90.4%) | 3,658 (93.0%) |
| 75 Years and over | 2,087 (93.2%) | 2,134 (77.8%) |
| Total | 55,006 (96.0%) | 52,283 (94.3%) |
Income Below Poverty Among Married-Couple Families in League City
The poverty statistics for married-couple families in League City show that 2.6% or 694 of the total 26,339 families live below the poverty line. Families with no children have the highest poverty rate of 3.0%, comprising of 371 families. On the other hand, families with 5 or more children have the lowest poverty rate of 0.0%, which includes 0 families.
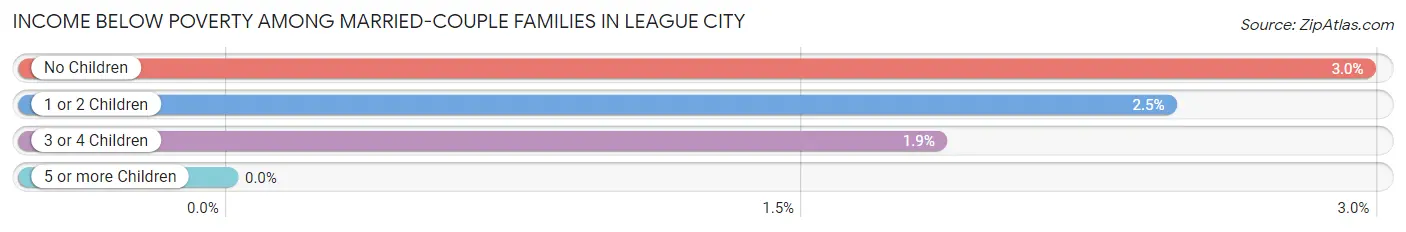
| Children | Above Poverty | Below Poverty |
| No Children | 12,106 (97.0%) | 371 (3.0%) |
| 1 or 2 Children | 11,257 (97.6%) | 283 (2.5%) |
| 3 or 4 Children | 2,123 (98.2%) | 40 (1.8%) |
| 5 or more Children | 159 (100.0%) | 0 (0.0%) |
| Total | 25,645 (97.4%) | 694 (2.6%) |
Income Below Poverty Among Single-Parent Households in League City
According to the poverty data in League City, 5.1% or 73 single-father households and 9.2% or 284 single-mother households are living below the poverty line. Among single-father households, those with 3 or 4 children have the highest poverty rate, with 61 households (82.4%) experiencing poverty. Likewise, among single-mother households, those with 3 or 4 children have the highest poverty rate, with 93 households (67.9%) falling below the poverty line.
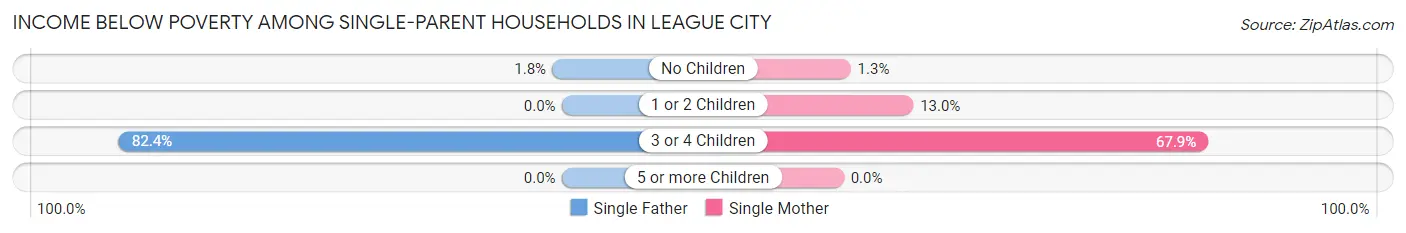
| Children | Single Father | Single Mother |
| No Children | 12 (1.8%) | 21 (1.3%) |
| 1 or 2 Children | 0 (0.0%) | 170 (13.0%) |
| 3 or 4 Children | 61 (82.4%) | 93 (67.9%) |
| 5 or more Children | 0 (0.0%) | 0 (0.0%) |
| Total | 73 (5.1%) | 284 (9.2%) |
Income Below Poverty Among Married-Couple vs Single-Parent Households in League City
The poverty data for League City shows that 694 of the married-couple family households (2.6%) and 357 of the single-parent households (7.9%) are living below the poverty level. Within the married-couple family households, those with no children have the highest poverty rate, with 371 households (3.0%) falling below the poverty line. Among the single-parent households, those with 3 or 4 children have the highest poverty rate, with 154 household (73.0%) living below poverty.
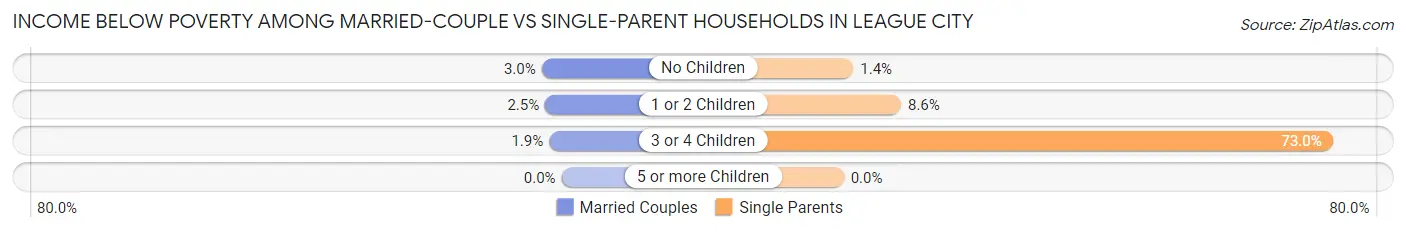
| Children | Married-Couple Families | Single-Parent Households |
| No Children | 371 (3.0%) | 33 (1.4%) |
| 1 or 2 Children | 283 (2.5%) | 170 (8.6%) |
| 3 or 4 Children | 40 (1.8%) | 154 (73.0%) |
| 5 or more Children | 0 (0.0%) | 0 (0.0%) |
| Total | 694 (2.6%) | 357 (7.9%) |
Race in League City
The most populous races in League City are White / Caucasian (82,113 | 72.4%), Hispanic or Latino (22,212 | 19.6%), and Two or more Races (11,608 | 10.2%).
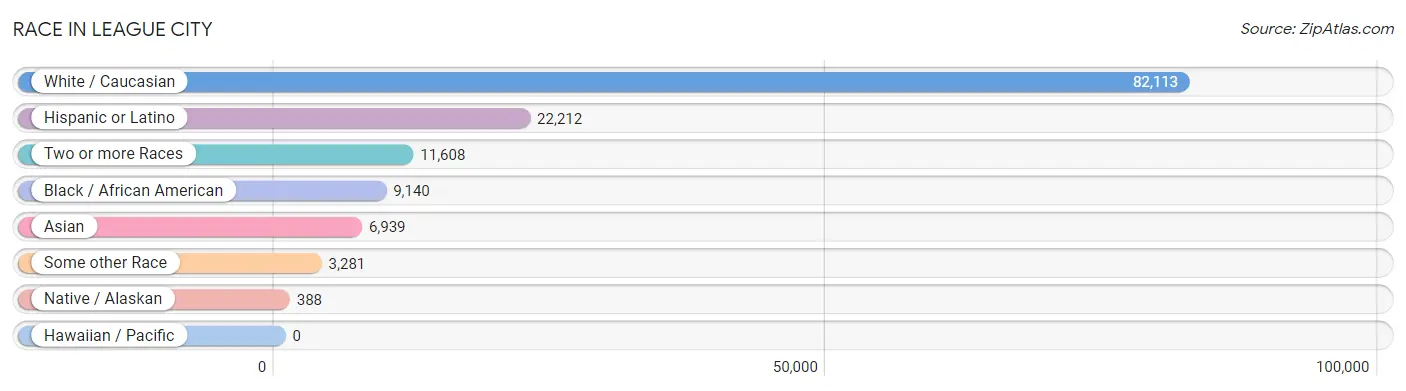
| Race | # Population | % Population |
| Asian | 6,939 | 6.1% |
| Black / African American | 9,140 | 8.1% |
| Hawaiian / Pacific | 0 | 0.0% |
| Hispanic or Latino | 22,212 | 19.6% |
| Native / Alaskan | 388 | 0.3% |
| White / Caucasian | 82,113 | 72.4% |
| Two or more Races | 11,608 | 10.2% |
| Some other Race | 3,281 | 2.9% |
| Total | 113,469 | 100.0% |
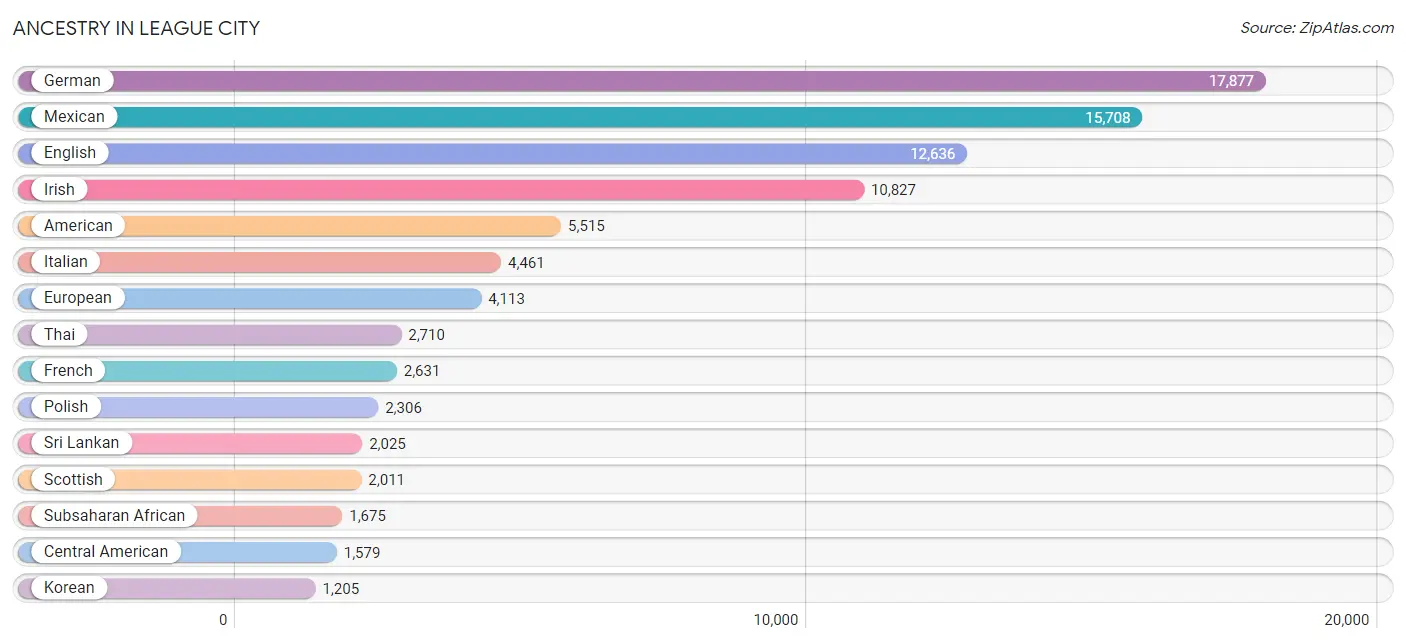
Ancestry in League City
The most populous ancestries reported in League City are German (17,877 | 15.8%), Mexican (15,708 | 13.8%), English (12,636 | 11.1%), Irish (10,827 | 9.5%), and American (5,515 | 4.9%), together accounting for 55.1% of all League City residents.
| Ancestry | # Population | % Population |
| African | 709 | 0.6% |
| Albanian | 17 | 0.0% |
| Aleut | 29 | 0.0% |
| Alsatian | 33 | 0.0% |
| American | 5,515 | 4.9% |
| Arab | 473 | 0.4% |
| Argentinean | 36 | 0.0% |
| Assyrian / Chaldean / Syriac | 24 | 0.0% |
| Australian | 81 | 0.1% |
| Austrian | 147 | 0.1% |
| Bahamian | 572 | 0.5% |
| Belgian | 153 | 0.1% |
| Belizean | 17 | 0.0% |
| Bhutanese | 129 | 0.1% |
| Blackfeet | 25 | 0.0% |
| Bolivian | 8 | 0.0% |
| Brazilian | 356 | 0.3% |
| British | 998 | 0.9% |
| British West Indian | 168 | 0.2% |
| Burmese | 580 | 0.5% |
| Cajun | 92 | 0.1% |
| Canadian | 397 | 0.4% |
| Celtic | 16 | 0.0% |
| Central American | 1,579 | 1.4% |
| Central American Indian | 12 | 0.0% |
| Cherokee | 327 | 0.3% |
| Chickasaw | 7 | 0.0% |
| Chippewa | 5 | 0.0% |
| Choctaw | 35 | 0.0% |
| Colombian | 752 | 0.7% |
| Comanche | 22 | 0.0% |
| Costa Rican | 157 | 0.1% |
| Croatian | 100 | 0.1% |
| Cuban | 773 | 0.7% |
| Czech | 469 | 0.4% |
| Czechoslovakian | 23 | 0.0% |
| Danish | 60 | 0.1% |
| Delaware | 12 | 0.0% |
| Dominican | 26 | 0.0% |
| Dutch | 1,052 | 0.9% |
| Dutch West Indian | 13 | 0.0% |
| Eastern European | 328 | 0.3% |
| Ecuadorian | 20 | 0.0% |
| Egyptian | 32 | 0.0% |
| English | 12,636 | 11.1% |
| European | 4,113 | 3.6% |
| Filipino | 126 | 0.1% |
| Finnish | 7 | 0.0% |
| French | 2,631 | 2.3% |
| French Canadian | 408 | 0.4% |
| German | 17,877 | 15.8% |
| Greek | 666 | 0.6% |
| Guamanian / Chamorro | 305 | 0.3% |
| Guatemalan | 238 | 0.2% |
| Haitian | 152 | 0.1% |
| Honduran | 10 | 0.0% |
| Hopi | 16 | 0.0% |
| Hungarian | 260 | 0.2% |
| Icelander | 43 | 0.0% |
| Indian (Asian) | 792 | 0.7% |
| Iranian | 85 | 0.1% |
| Iraqi | 57 | 0.1% |
| Irish | 10,827 | 9.5% |
| Israeli | 9 | 0.0% |
| Italian | 4,461 | 3.9% |
| Jamaican | 33 | 0.0% |
| Kenyan | 33 | 0.0% |
| Korean | 1,205 | 1.1% |
| Laotian | 46 | 0.0% |
| Latvian | 17 | 0.0% |
| Lebanese | 195 | 0.2% |
| Lithuanian | 138 | 0.1% |
| Malaysian | 296 | 0.3% |
| Mexican | 15,708 | 13.8% |
| Mexican American Indian | 69 | 0.1% |
| Mongolian | 5 | 0.0% |
| Nicaraguan | 252 | 0.2% |
| Nigerian | 179 | 0.2% |
| Northern European | 72 | 0.1% |
| Norwegian | 1,091 | 1.0% |
| Osage | 5 | 0.0% |
| Pakistani | 450 | 0.4% |
| Panamanian | 47 | 0.0% |
| Peruvian | 137 | 0.1% |
| Polish | 2,306 | 2.0% |
| Portuguese | 143 | 0.1% |
| Pueblo | 2 | 0.0% |
| Puerto Rican | 814 | 0.7% |
| Puget Sound Salish | 10 | 0.0% |
| Romanian | 162 | 0.1% |
| Russian | 284 | 0.3% |
| Salvadoran | 875 | 0.8% |
| Scandinavian | 269 | 0.2% |
| Scotch-Irish | 1,093 | 1.0% |
| Scottish | 2,011 | 1.8% |
| Serbian | 35 | 0.0% |
| Shoshone | 6 | 0.0% |
| Sierra Leonean | 25 | 0.0% |
| Slovak | 13 | 0.0% |
| Slovene | 37 | 0.0% |
| South American | 1,102 | 1.0% |
| Spaniard | 179 | 0.2% |
| Spanish | 551 | 0.5% |
| Spanish American | 17 | 0.0% |
| Sri Lankan | 2,025 | 1.8% |
| Subsaharan African | 1,675 | 1.5% |
| Swedish | 637 | 0.6% |
| Swiss | 48 | 0.0% |
| Syrian | 13 | 0.0% |
| Thai | 2,710 | 2.4% |
| Trinidadian and Tobagonian | 120 | 0.1% |
| Turkish | 148 | 0.1% |
| Ugandan | 103 | 0.1% |
| Ukrainian | 1,155 | 1.0% |
| Ute | 2 | 0.0% |
| Venezuelan | 149 | 0.1% |
| Welsh | 539 | 0.5% |
| West Indian | 205 | 0.2% |
| Yugoslavian | 39 | 0.0% |
| Yup'ik | 10 | 0.0% | View All 120 Rows |
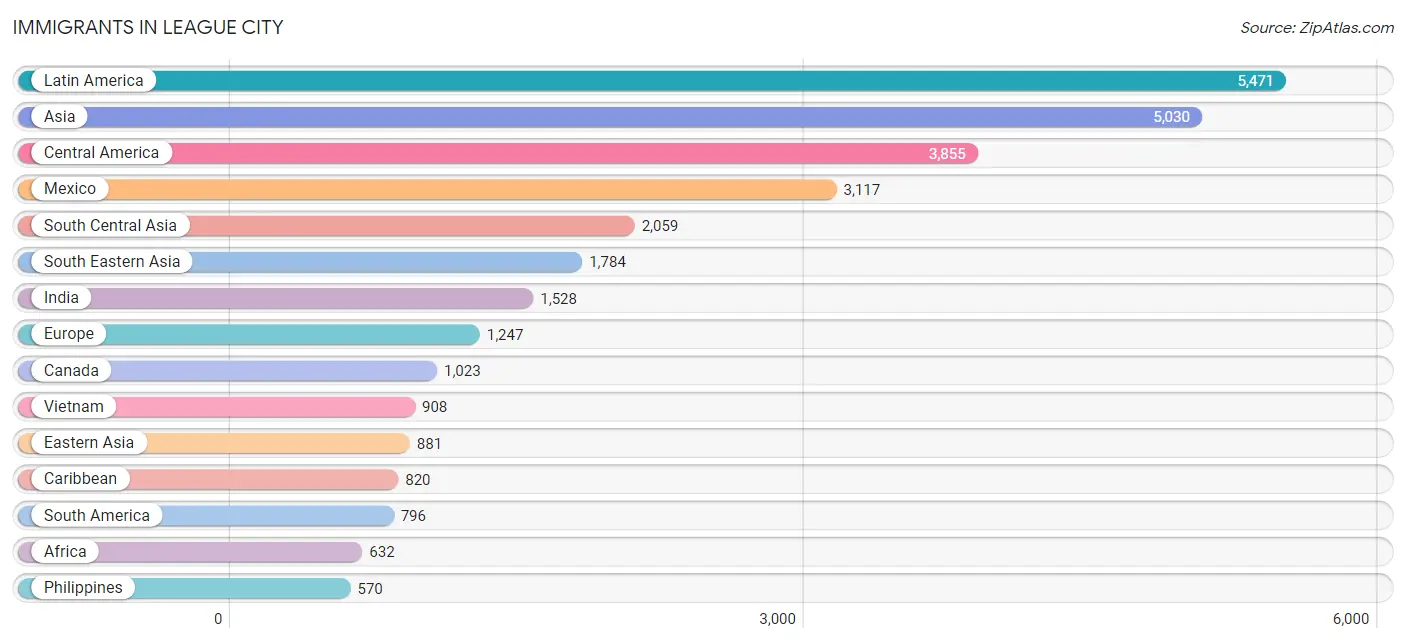
Immigrants in League City
The most numerous immigrant groups reported in League City came from Latin America (5,471 | 4.8%), Asia (5,030 | 4.4%), Central America (3,855 | 3.4%), Mexico (3,117 | 2.8%), and South Central Asia (2,059 | 1.8%), together accounting for 17.2% of all League City residents.
| Immigration Origin | # Population | % Population |
| Africa | 632 | 0.6% |
| Albania | 25 | 0.0% |
| Argentina | 36 | 0.0% |
| Armenia | 17 | 0.0% |
| Asia | 5,030 | 4.4% |
| Australia | 77 | 0.1% |
| Bahamas | 245 | 0.2% |
| Belarus | 29 | 0.0% |
| Bolivia | 8 | 0.0% |
| Brazil | 196 | 0.2% |
| Cameroon | 8 | 0.0% |
| Canada | 1,023 | 0.9% |
| Caribbean | 820 | 0.7% |
| Central America | 3,855 | 3.4% |
| China | 567 | 0.5% |
| Colombia | 325 | 0.3% |
| Cuba | 106 | 0.1% |
| Denmark | 18 | 0.0% |
| Dominican Republic | 26 | 0.0% |
| Eastern Africa | 47 | 0.0% |
| Eastern Asia | 881 | 0.8% |
| Eastern Europe | 443 | 0.4% |
| Ecuador | 20 | 0.0% |
| Egypt | 115 | 0.1% |
| El Salvador | 461 | 0.4% |
| England | 319 | 0.3% |
| Europe | 1,247 | 1.1% |
| Germany | 215 | 0.2% |
| Ghana | 23 | 0.0% |
| Greece | 29 | 0.0% |
| Guatemala | 194 | 0.2% |
| Haiti | 9 | 0.0% |
| Honduras | 9 | 0.0% |
| India | 1,528 | 1.3% |
| Indonesia | 74 | 0.1% |
| Iran | 75 | 0.1% |
| Iraq | 47 | 0.0% |
| Jamaica | 46 | 0.0% |
| Kazakhstan | 28 | 0.0% |
| Kenya | 47 | 0.0% |
| Korea | 314 | 0.3% |
| Kuwait | 3 | 0.0% |
| Laos | 63 | 0.1% |
| Latin America | 5,471 | 4.8% |
| Lebanon | 81 | 0.1% |
| Malaysia | 5 | 0.0% |
| Mexico | 3,117 | 2.8% |
| Middle Africa | 227 | 0.2% |
| Netherlands | 16 | 0.0% |
| Nicaragua | 27 | 0.0% |
| Nigeria | 164 | 0.1% |
| Northern Africa | 115 | 0.1% |
| Northern Europe | 544 | 0.5% |
| Oceania | 105 | 0.1% |
| Pakistan | 428 | 0.4% |
| Panama | 47 | 0.0% |
| Peru | 42 | 0.0% |
| Philippines | 570 | 0.5% |
| Poland | 8 | 0.0% |
| Romania | 118 | 0.1% |
| Russia | 84 | 0.1% |
| Scotland | 48 | 0.0% |
| Sierra Leone | 25 | 0.0% |
| Singapore | 69 | 0.1% |
| South Africa | 26 | 0.0% |
| South America | 796 | 0.7% |
| South Central Asia | 2,059 | 1.8% |
| South Eastern Asia | 1,784 | 1.6% |
| Southern Europe | 29 | 0.0% |
| Taiwan | 147 | 0.1% |
| Thailand | 95 | 0.1% |
| Trinidad and Tobago | 120 | 0.1% |
| Turkey | 24 | 0.0% |
| Ukraine | 179 | 0.2% |
| Venezuela | 169 | 0.2% |
| Vietnam | 908 | 0.8% |
| West Indies | 29 | 0.0% |
| Western Africa | 212 | 0.2% |
| Western Asia | 248 | 0.2% |
| Western Europe | 231 | 0.2% |
| Zaire | 219 | 0.2% | View All 81 Rows |
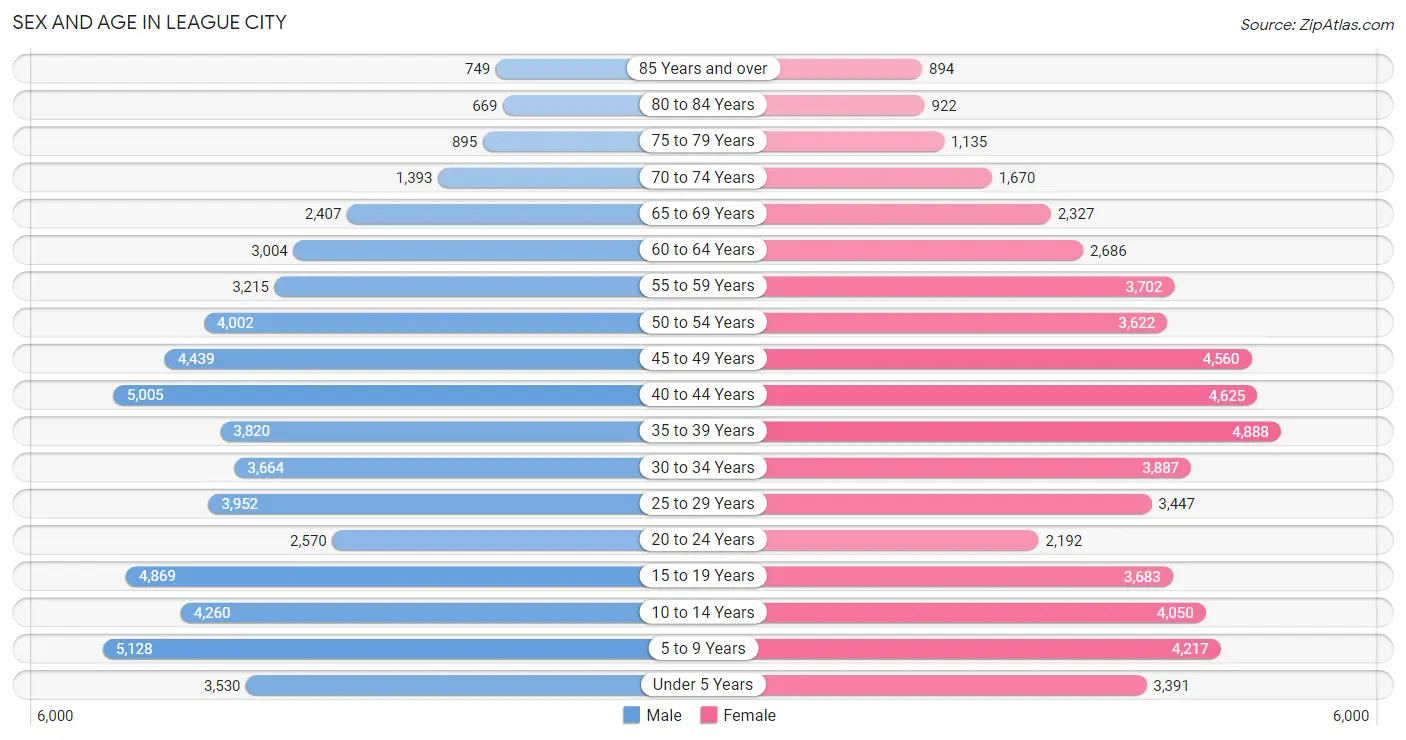
Sex and Age in League City
Sex and Age in League City
The most populous age groups in League City are 5 to 9 Years (5,128 | 8.9%) for men and 35 to 39 Years (4,888 | 8.7%) for women.
| Age Bracket | Male | Female |
| Under 5 Years | 3,530 (6.1%) | 3,391 (6.1%) |
| 5 to 9 Years | 5,128 (8.9%) | 4,217 (7.5%) |
| 10 to 14 Years | 4,260 (7.4%) | 4,050 (7.2%) |
| 15 to 19 Years | 4,869 (8.5%) | 3,683 (6.6%) |
| 20 to 24 Years | 2,570 (4.5%) | 2,192 (3.9%) |
| 25 to 29 Years | 3,952 (6.9%) | 3,447 (6.2%) |
| 30 to 34 Years | 3,664 (6.4%) | 3,887 (7.0%) |
| 35 to 39 Years | 3,820 (6.6%) | 4,888 (8.7%) |
| 40 to 44 Years | 5,005 (8.7%) | 4,625 (8.3%) |
| 45 to 49 Years | 4,439 (7.7%) | 4,560 (8.2%) |
| 50 to 54 Years | 4,002 (7.0%) | 3,622 (6.5%) |
| 55 to 59 Years | 3,215 (5.6%) | 3,702 (6.6%) |
| 60 to 64 Years | 3,004 (5.2%) | 2,686 (4.8%) |
| 65 to 69 Years | 2,407 (4.2%) | 2,327 (4.2%) |
| 70 to 74 Years | 1,393 (2.4%) | 1,670 (3.0%) |
| 75 to 79 Years | 895 (1.5%) | 1,135 (2.0%) |
| 80 to 84 Years | 669 (1.2%) | 922 (1.7%) |
| 85 Years and over | 749 (1.3%) | 894 (1.6%) |
| Total | 57,571 (100.0%) | 55,898 (100.0%) |
Families and Households in League City
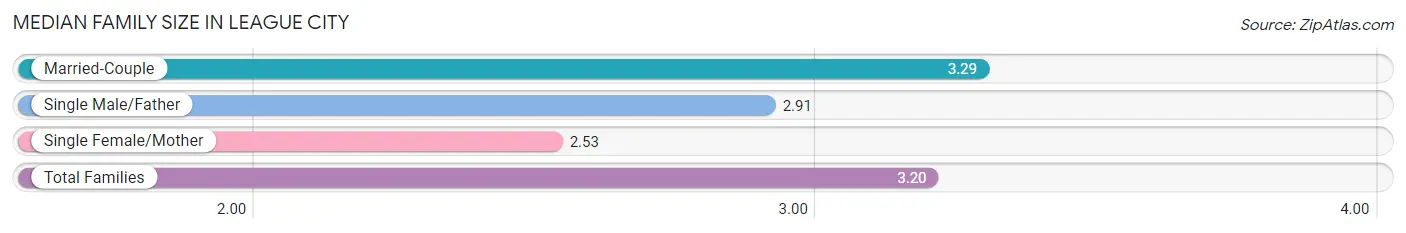
Median Family Size in League City
The median family size in League City is 3.20 persons per family, with married-couple families (26,339 | 85.4%) accounting for the largest median family size of 3.29 persons per family. On the other hand, single female/mother families (3,071 | 10.0%) represent the smallest median family size with 2.53 persons per family.
| Family Type | # Families | Family Size |
| Married-Couple | 26,339 (85.4%) | 3.29 |
| Single Male/Father | 1,425 (4.6%) | 2.91 |
| Single Female/Mother | 3,071 (10.0%) | 2.53 |
| Total Families | 30,835 (100.0%) | 3.20 |
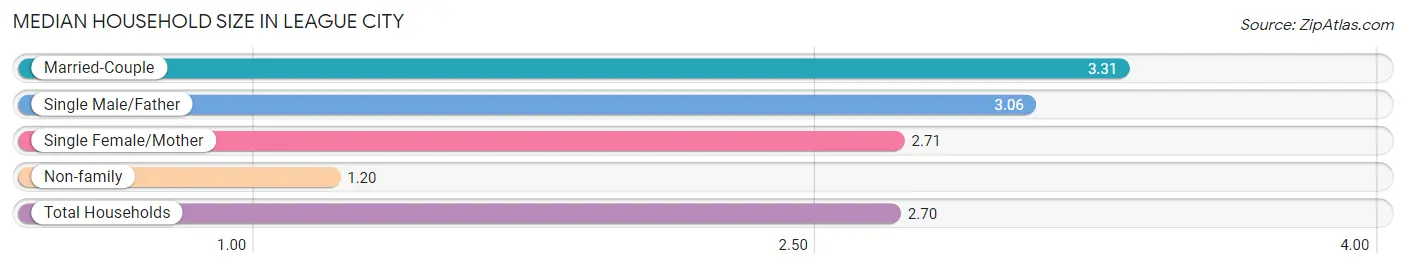
Median Household Size in League City
The median household size in League City is 2.70 persons per household, with married-couple households (26,339 | 62.9%) accounting for the largest median household size of 3.31 persons per household. non-family households (11,003 | 26.3%) represent the smallest median household size with 1.20 persons per household.
| Household Type | # Households | Household Size |
| Married-Couple | 26,339 (62.9%) | 3.31 |
| Single Male/Father | 1,425 (3.4%) | 3.06 |
| Single Female/Mother | 3,071 (7.3%) | 2.71 |
| Non-family | 11,003 (26.3%) | 1.20 |
| Total Households | 41,838 (100.0%) | 2.70 |
Household Size by Marriage Status in League City
Out of a total of 41,838 households in League City, 30,835 (73.7%) are family households, while 11,003 (26.3%) are nonfamily households. The most numerous type of family households are 2-person households, comprising 11,301, and the most common type of nonfamily households are 1-person households, comprising 9,217.
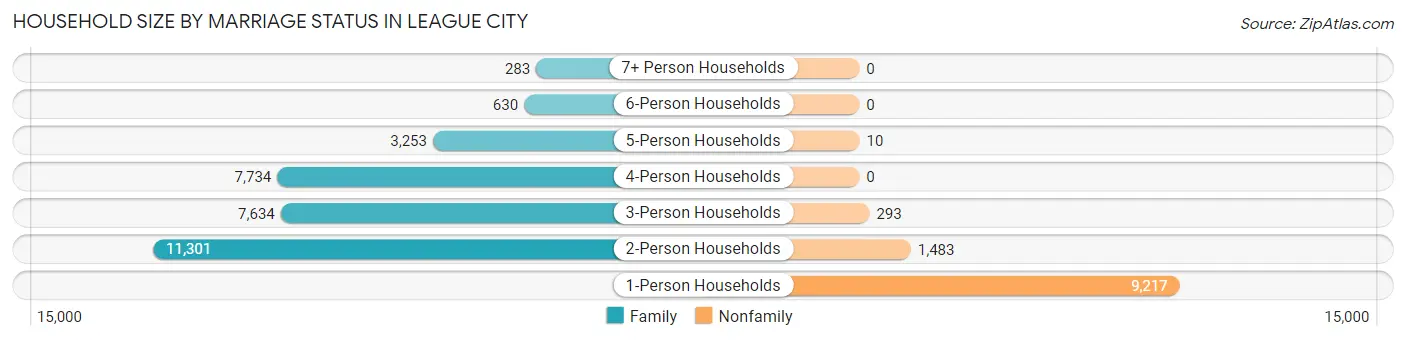
| Household Size | Family Households | Nonfamily Households |
| 1-Person Households | - | 9,217 (22.0%) |
| 2-Person Households | 11,301 (27.0%) | 1,483 (3.5%) |
| 3-Person Households | 7,634 (18.2%) | 293 (0.7%) |
| 4-Person Households | 7,734 (18.5%) | 0 (0.0%) |
| 5-Person Households | 3,253 (7.8%) | 10 (0.0%) |
| 6-Person Households | 630 (1.5%) | 0 (0.0%) |
| 7+ Person Households | 283 (0.7%) | 0 (0.0%) |
| Total | 30,835 (73.7%) | 11,003 (26.3%) |
Female Fertility in League City
Fertility by Age in League City
Average fertility rate in League City is 52.0 births per 1,000 women. Women in the age bracket of 20 to 34 years have the highest fertility rate with 114.0 births per 1,000 women. Women in the age bracket of 20 to 34 years acount for 73.8% of all women with births.
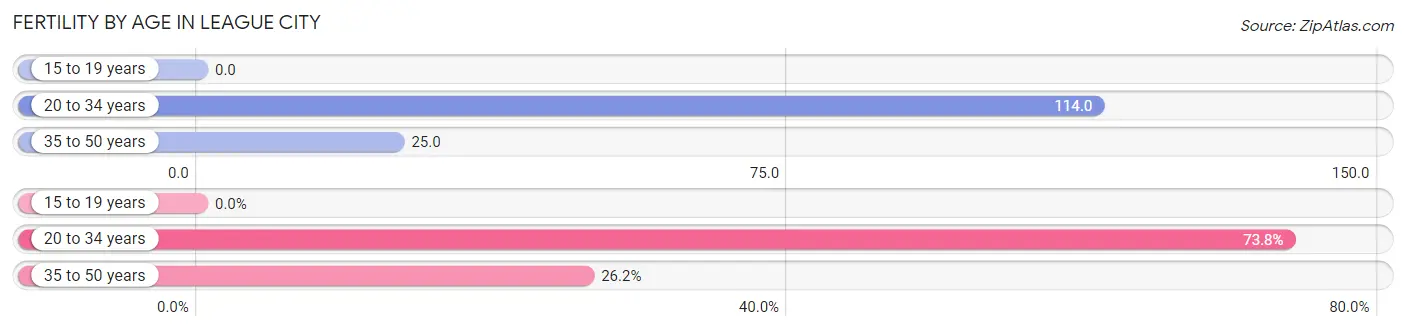
| Age Bracket | Women with Births | Births / 1,000 Women |
| 15 to 19 years | 0 (0.0%) | 0.0 |
| 20 to 34 years | 1,087 (73.8%) | 114.0 |
| 35 to 50 years | 386 (26.2%) | 25.0 |
| Total | 1,473 (100.0%) | 52.0 |
Fertility by Age by Marriage Status in League City
89.3% of women with births (1,473) in League City are married. The highest percentage of unmarried women with births falls into 20 to 34 years age bracket with 14.4% of them unmarried at the time of birth, while the lowest percentage of unmarried women with births belong to 35 to 50 years age bracket with 0.0% of them unmarried.
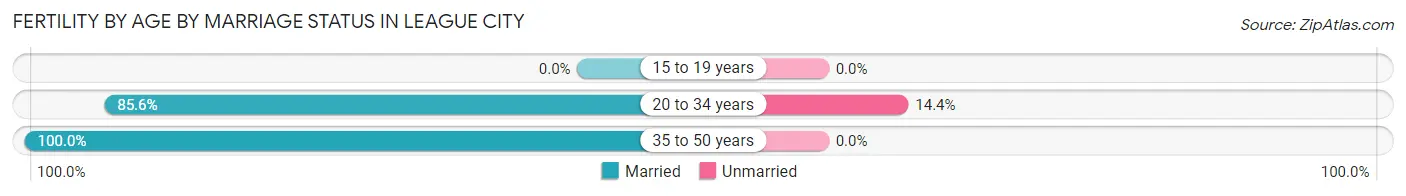
| Age Bracket | Married | Unmarried |
| 15 to 19 years | 0 (0.0%) | 0 (0.0%) |
| 20 to 34 years | 930 (85.6%) | 157 (14.4%) |
| 35 to 50 years | 386 (100.0%) | 0 (0.0%) |
| Total | 1,315 (89.3%) | 158 (10.7%) |
Fertility by Education in League City
Average fertility rate in League City is 52.0 births per 1,000 women. Women with the education attainment of bachelor's degree have the highest fertility rate of 73.0 births per 1,000 women, while women with the education attainment of less than high school have the lowest fertility at 3.0 births per 1,000 women. Women with the education attainment of bachelor's degree represent 47.9% of all women with births.
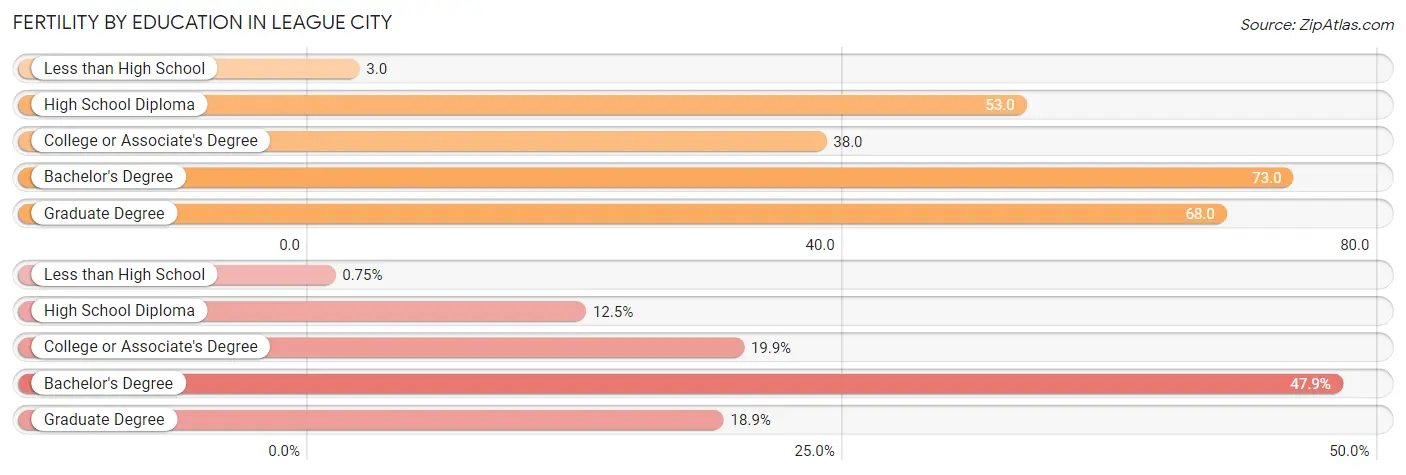
| Educational Attainment | Women with Births | Births / 1,000 Women |
| Less than High School | 11 (0.7%) | 3.0 |
| High School Diploma | 184 (12.5%) | 53.0 |
| College or Associate's Degree | 293 (19.9%) | 38.0 |
| Bachelor's Degree | 706 (47.9%) | 73.0 |
| Graduate Degree | 279 (18.9%) | 68.0 |
| Total | 1,473 (100.0%) | 52.0 |
Fertility by Education by Marriage Status in League City
10.7% of women with births in League City are unmarried. Women with the educational attainment of less than high school are most likely to be married with 100.0% of them married at childbirth, while women with the educational attainment of high school diploma are least likely to be married with 47.3% of them unmarried at childbirth.
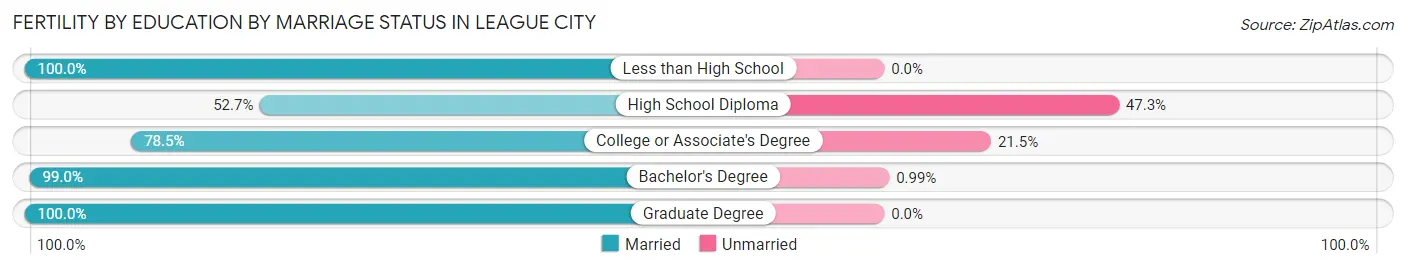
| Educational Attainment | Married | Unmarried |
| Less than High School | 11 (100.0%) | 0 (0.0%) |
| High School Diploma | 97 (52.7%) | 87 (47.3%) |
| College or Associate's Degree | 230 (78.5%) | 63 (21.5%) |
| Bachelor's Degree | 699 (99.0%) | 7 (1.0%) |
| Graduate Degree | 279 (100.0%) | 0 (0.0%) |
| Total | 1,315 (89.3%) | 158 (10.7%) |
Employment Characteristics in League City
Employment by Class of Employer in League City
Among the 57,591 employed individuals in League City, private company employees (38,094 | 66.1%), local government employees (5,191 | 9.0%), and not-for-profit organizations (4,378 | 7.6%) make up the most common classes of employment.
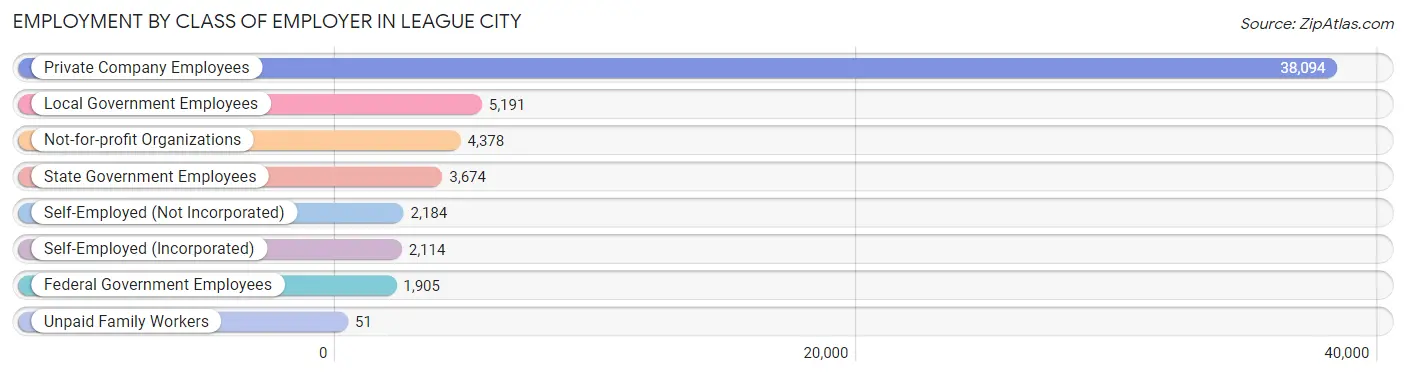
| Employer Class | # Employees | % Employees |
| Private Company Employees | 38,094 | 66.1% |
| Self-Employed (Incorporated) | 2,114 | 3.7% |
| Self-Employed (Not Incorporated) | 2,184 | 3.8% |
| Not-for-profit Organizations | 4,378 | 7.6% |
| Local Government Employees | 5,191 | 9.0% |
| State Government Employees | 3,674 | 6.4% |
| Federal Government Employees | 1,905 | 3.3% |
| Unpaid Family Workers | 51 | 0.1% |
| Total | 57,591 | 100.0% |
Employment Status by Age in League City
According to the labor force statistics for League City, out of the total population over 16 years of age (87,042), 70.2% or 61,103 individuals are in the labor force, with 4.2% or 2,566 of them unemployed. The age group with the highest labor force participation rate is 30 to 34 years, with 90.8% or 6,856 individuals in the labor force. Within the labor force, the 16 to 19 years age range has the highest percentage of unemployed individuals, with 11.9% or 232 of them being unemployed.
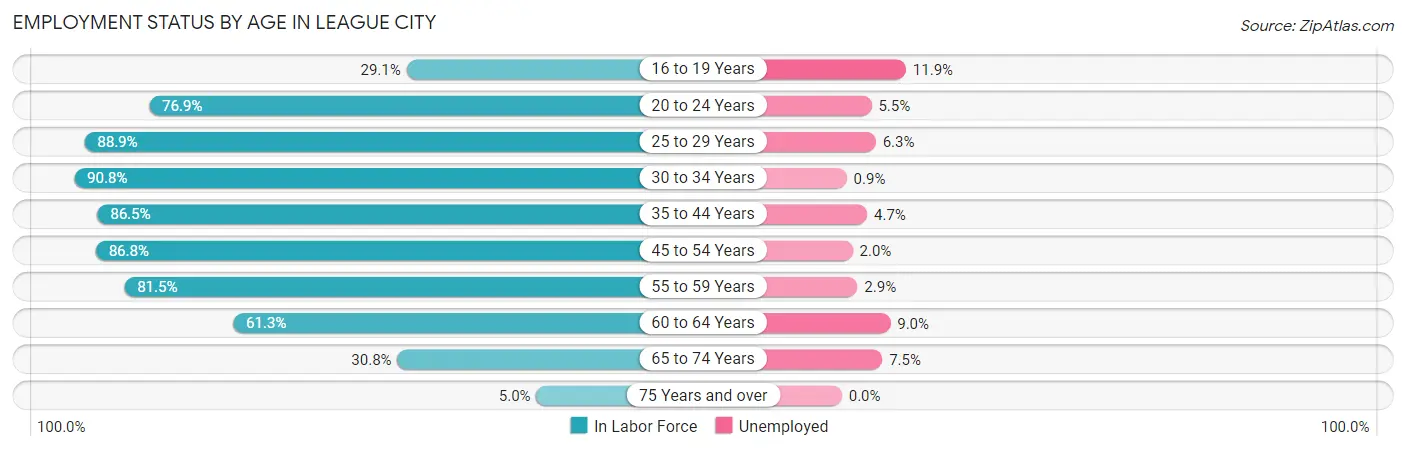
| Age Bracket | In Labor Force | Unemployed |
| 16 to 19 Years | 1,950 (29.1%) | 232 (11.9%) |
| 20 to 24 Years | 3,662 (76.9%) | 201 (5.5%) |
| 25 to 29 Years | 6,578 (88.9%) | 414 (6.3%) |
| 30 to 34 Years | 6,856 (90.8%) | 62 (0.9%) |
| 35 to 44 Years | 15,862 (86.5%) | 746 (4.7%) |
| 45 to 54 Years | 14,429 (86.8%) | 289 (2.0%) |
| 55 to 59 Years | 5,637 (81.5%) | 163 (2.9%) |
| 60 to 64 Years | 3,488 (61.3%) | 314 (9.0%) |
| 65 to 74 Years | 2,401 (30.8%) | 180 (7.5%) |
| 75 Years and over | 263 (5.0%) | 0 (0.0%) |
| Total | 61,103 (70.2%) | 2,566 (4.2%) |
Employment Status by Educational Attainment in League City
According to labor force statistics for League City, 84.5% of individuals (52,828) out of the total population between 25 and 64 years of age (62,518) are in the labor force, with 3.8% or 2,007 of them being unemployed. The group with the highest labor force participation rate are those with the educational attainment of bachelor's degree or higher, with 87.6% or 27,855 individuals in the labor force. Within the labor force, individuals with less than high school education have the highest percentage of unemployment, with 8.8% or 159 of them being unemployed.

| Educational Attainment | In Labor Force | Unemployed |
| Less than High School | 1,802 (73.9%) | 215 (8.8%) |
| High School Diploma | 6,822 (78.9%) | 553 (6.4%) |
| College / Associate Degree | 16,376 (83.4%) | 844 (4.3%) |
| Bachelor's Degree or higher | 27,855 (87.6%) | 795 (2.5%) |
| Total | 52,828 (84.5%) | 2,376 (3.8%) |
Employment Occupations by Sex in League City
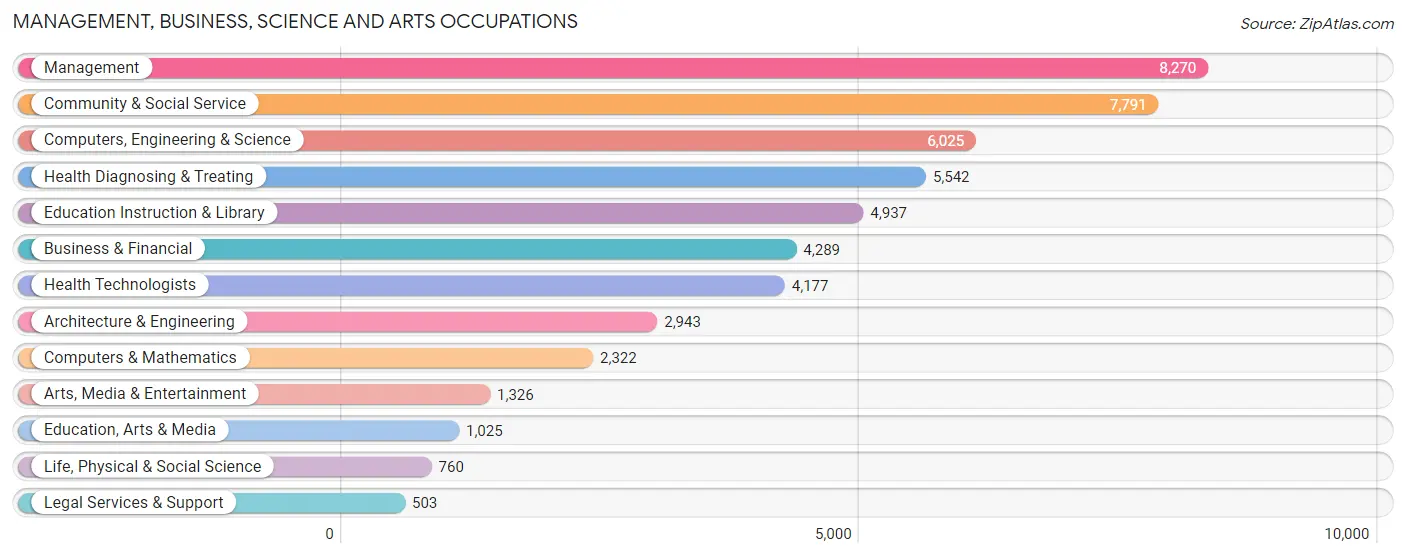
Management, Business, Science and Arts Occupations
The most common Management, Business, Science and Arts occupations in League City are Management (8,270 | 14.2%), Community & Social Service (7,791 | 13.3%), Computers, Engineering & Science (6,025 | 10.3%), Health Diagnosing & Treating (5,542 | 9.5%), and Education Instruction & Library (4,937 | 8.5%).
Management, Business, Science and Arts Occupations by Sex
Within the Management, Business, Science and Arts occupations in League City, the most male-oriented occupations are Architecture & Engineering (88.5%), Computers, Engineering & Science (84.0%), and Computers & Mathematics (83.6%), while the most female-oriented occupations are Health Technologists (73.3%), Education Instruction & Library (71.5%), and Health Diagnosing & Treating (71.1%).
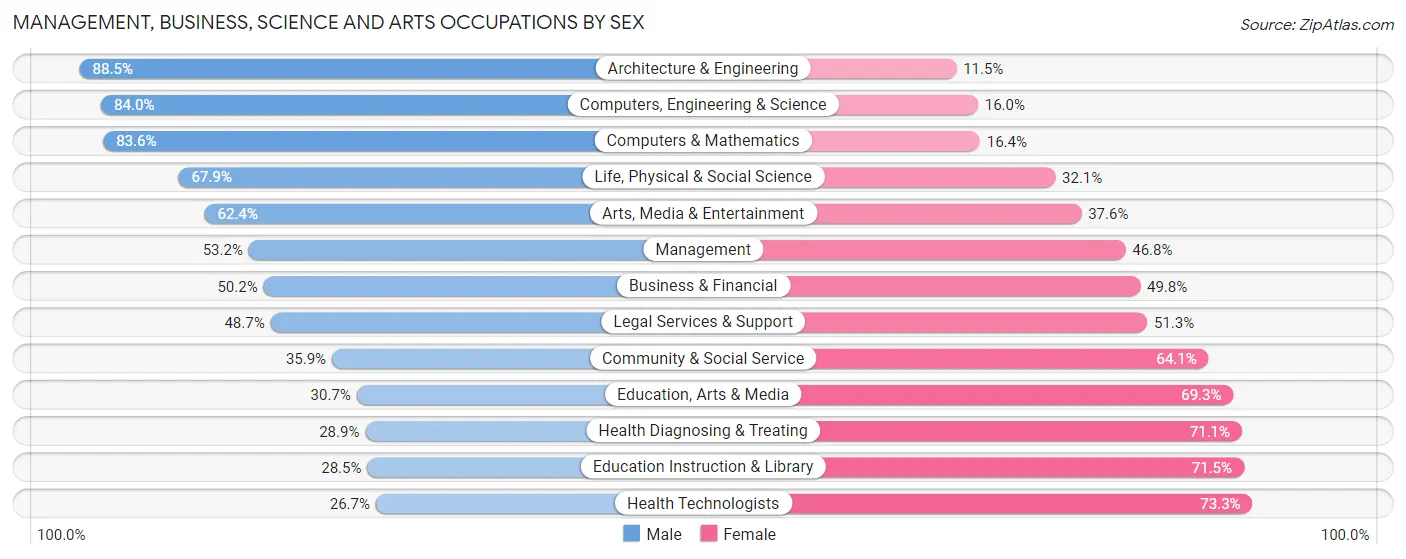
| Occupation | Male | Female |
| Management | 4,403 (53.2%) | 3,867 (46.8%) |
| Business & Financial | 2,152 (50.2%) | 2,137 (49.8%) |
| Computers, Engineering & Science | 5,062 (84.0%) | 963 (16.0%) |
| Computers & Mathematics | 1,941 (83.6%) | 381 (16.4%) |
| Architecture & Engineering | 2,605 (88.5%) | 338 (11.5%) |
| Life, Physical & Social Science | 516 (67.9%) | 244 (32.1%) |
| Community & Social Service | 2,796 (35.9%) | 4,995 (64.1%) |
| Education, Arts & Media | 315 (30.7%) | 710 (69.3%) |
| Legal Services & Support | 245 (48.7%) | 258 (51.3%) |
| Education Instruction & Library | 1,408 (28.5%) | 3,529 (71.5%) |
| Arts, Media & Entertainment | 828 (62.4%) | 498 (37.6%) |
| Health Diagnosing & Treating | 1,604 (28.9%) | 3,938 (71.1%) |
| Health Technologists | 1,117 (26.7%) | 3,060 (73.3%) |
| Total (Category) | 16,017 (50.2%) | 15,900 (49.8%) |
| Total (Overall) | 31,450 (53.8%) | 26,962 (46.2%) |
Services Occupations
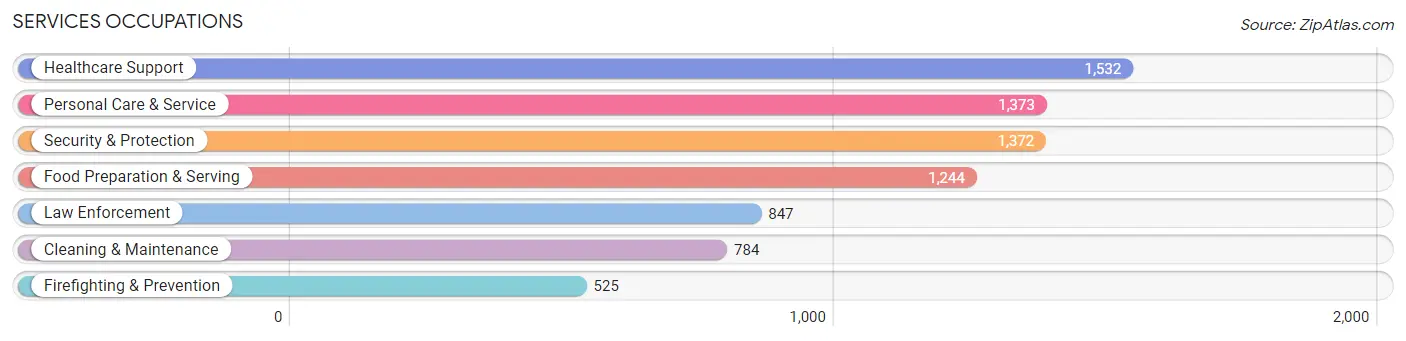
The most common Services occupations in League City are Healthcare Support (1,532 | 2.6%), Personal Care & Service (1,373 | 2.4%), Security & Protection (1,372 | 2.4%), Food Preparation & Serving (1,244 | 2.1%), and Law Enforcement (847 | 1.5%).
Services Occupations by Sex
Within the Services occupations in League City, the most male-oriented occupations are Law Enforcement (93.7%), Security & Protection (86.8%), and Firefighting & Prevention (75.6%), while the most female-oriented occupations are Healthcare Support (88.2%), Personal Care & Service (82.4%), and Food Preparation & Serving (57.2%).
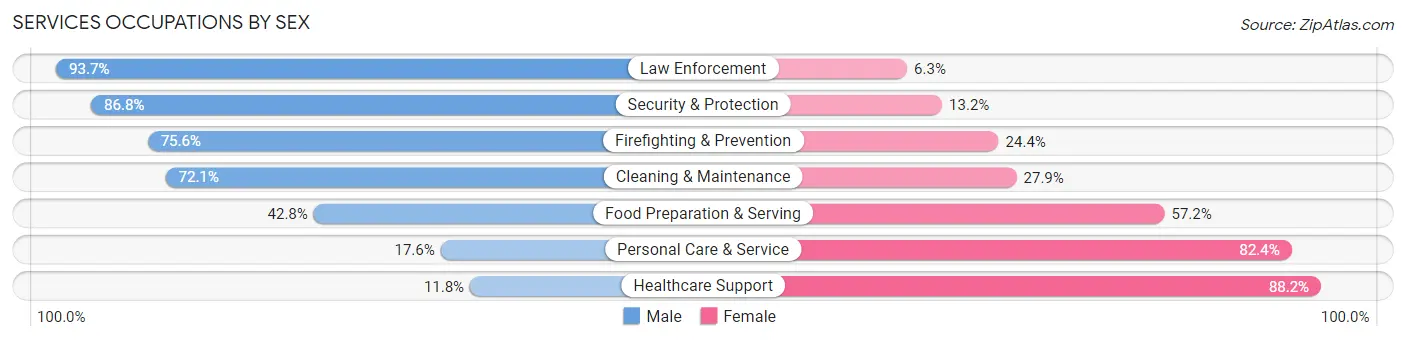
| Occupation | Male | Female |
| Healthcare Support | 181 (11.8%) | 1,351 (88.2%) |
| Security & Protection | 1,191 (86.8%) | 181 (13.2%) |
| Firefighting & Prevention | 397 (75.6%) | 128 (24.4%) |
| Law Enforcement | 794 (93.7%) | 53 (6.3%) |
| Food Preparation & Serving | 532 (42.8%) | 712 (57.2%) |
| Cleaning & Maintenance | 565 (72.1%) | 219 (27.9%) |
| Personal Care & Service | 242 (17.6%) | 1,131 (82.4%) |
| Total (Category) | 2,711 (43.0%) | 3,594 (57.0%) |
| Total (Overall) | 31,450 (53.8%) | 26,962 (46.2%) |
Sales and Office Occupations
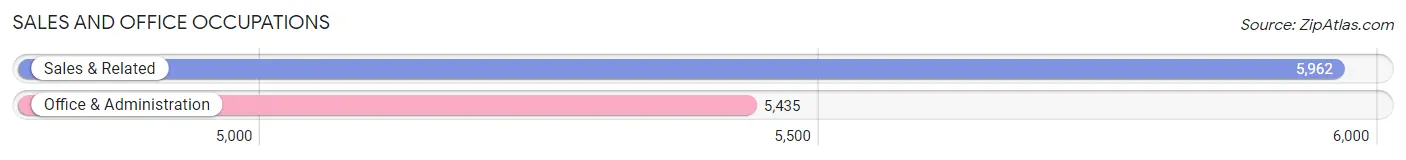
The most common Sales and Office occupations in League City are Sales & Related (5,962 | 10.2%), and Office & Administration (5,435 | 9.3%).
Sales and Office Occupations by Sex
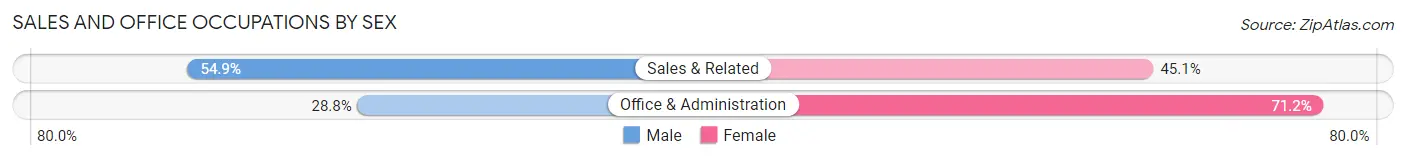
| Occupation | Male | Female |
| Sales & Related | 3,275 (54.9%) | 2,687 (45.1%) |
| Office & Administration | 1,564 (28.8%) | 3,871 (71.2%) |
| Total (Category) | 4,839 (42.5%) | 6,558 (57.5%) |
| Total (Overall) | 31,450 (53.8%) | 26,962 (46.2%) |
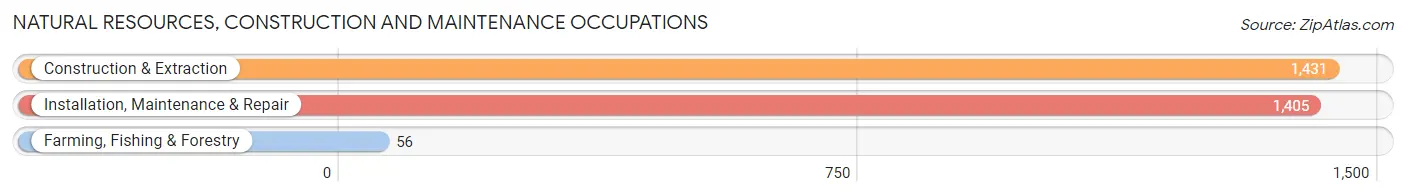
Natural Resources, Construction and Maintenance Occupations
The most common Natural Resources, Construction and Maintenance occupations in League City are Construction & Extraction (1,431 | 2.5%), Installation, Maintenance & Repair (1,405 | 2.4%), and Farming, Fishing & Forestry (56 | 0.1%).
Natural Resources, Construction and Maintenance Occupations by Sex
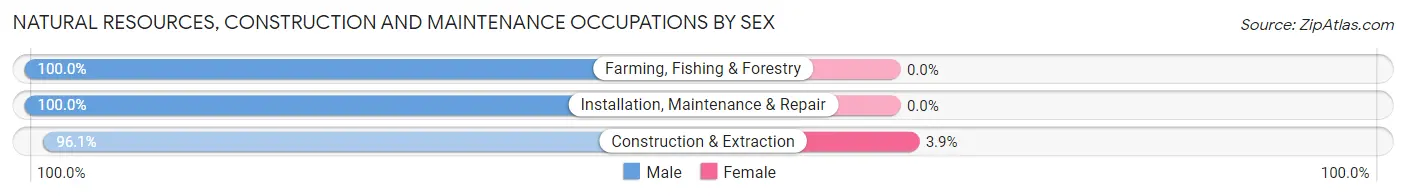
| Occupation | Male | Female |
| Farming, Fishing & Forestry | 56 (100.0%) | 0 (0.0%) |
| Construction & Extraction | 1,375 (96.1%) | 56 (3.9%) |
| Installation, Maintenance & Repair | 1,405 (100.0%) | 0 (0.0%) |
| Total (Category) | 2,836 (98.1%) | 56 (1.9%) |
| Total (Overall) | 31,450 (53.8%) | 26,962 (46.2%) |
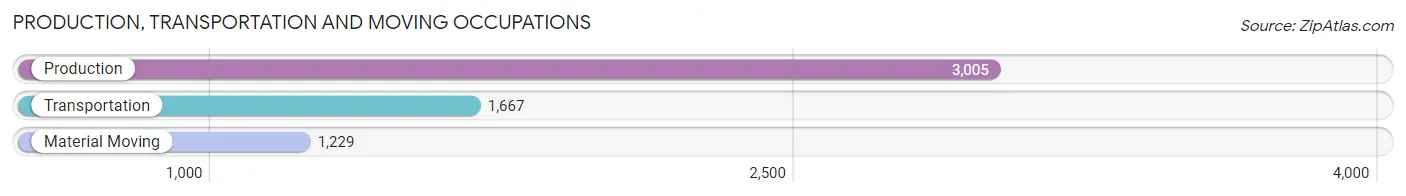
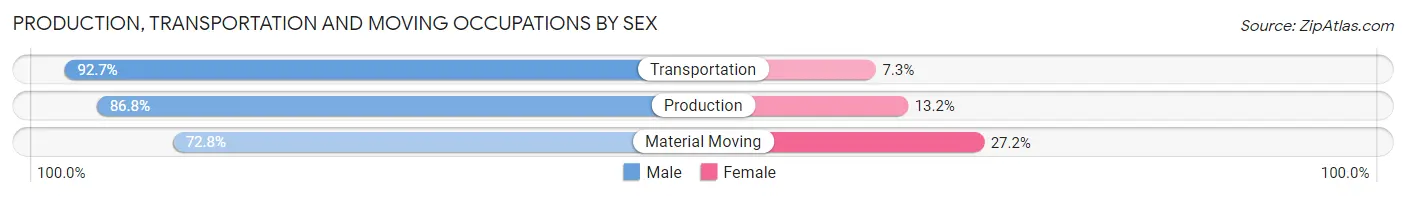
Production, Transportation and Moving Occupations
The most common Production, Transportation and Moving occupations in League City are Production (3,005 | 5.1%), Transportation (1,667 | 2.9%), and Material Moving (1,229 | 2.1%).
Production, Transportation and Moving Occupations by Sex
| Occupation | Male | Female |
| Production | 2,607 (86.8%) | 398 (13.2%) |
| Transportation | 1,545 (92.7%) | 122 (7.3%) |
| Material Moving | 895 (72.8%) | 334 (27.2%) |
| Total (Category) | 5,047 (85.5%) | 854 (14.5%) |
| Total (Overall) | 31,450 (53.8%) | 26,962 (46.2%) |
Employment Industries by Sex in League City
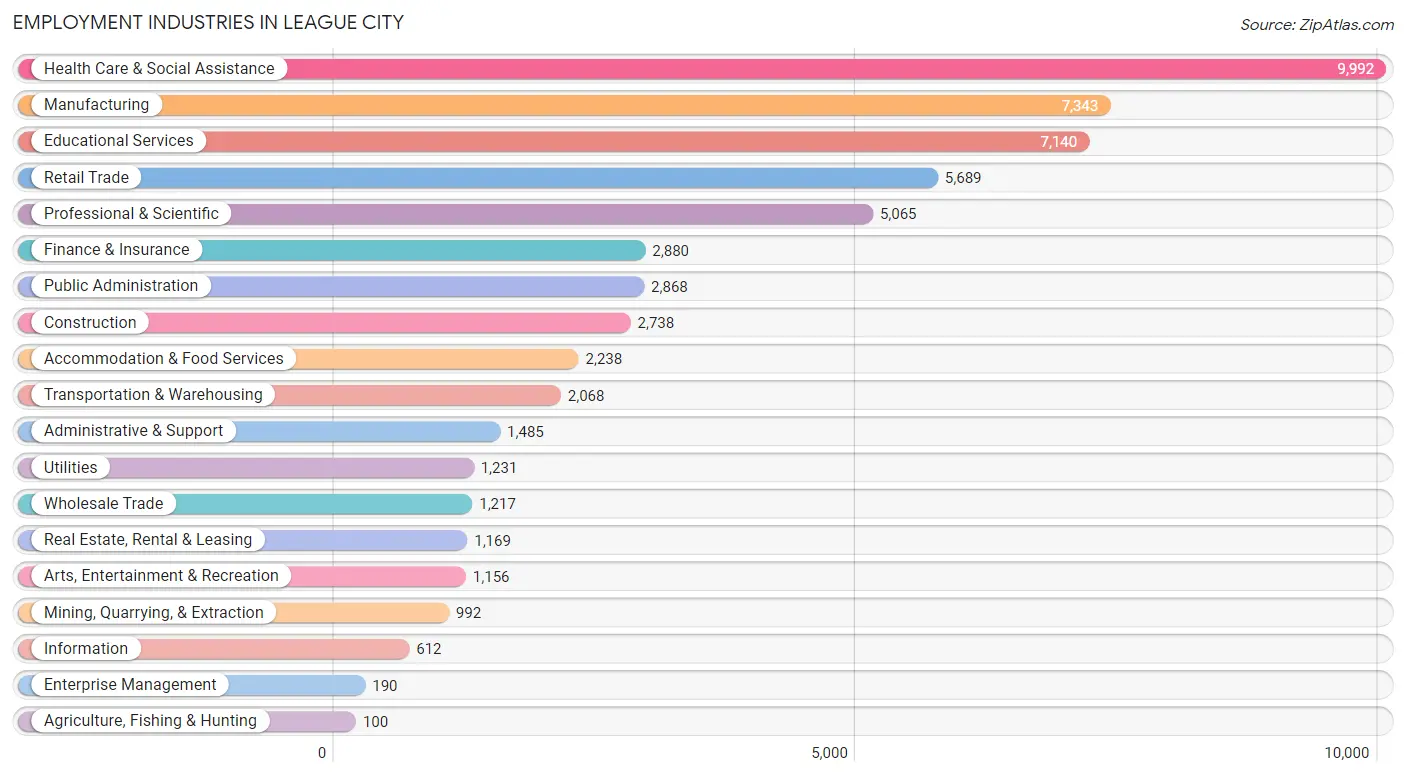
Employment Industries in League City
The major employment industries in League City include Health Care & Social Assistance (9,992 | 17.1%), Manufacturing (7,343 | 12.6%), Educational Services (7,140 | 12.2%), Retail Trade (5,689 | 9.7%), and Professional & Scientific (5,065 | 8.7%).
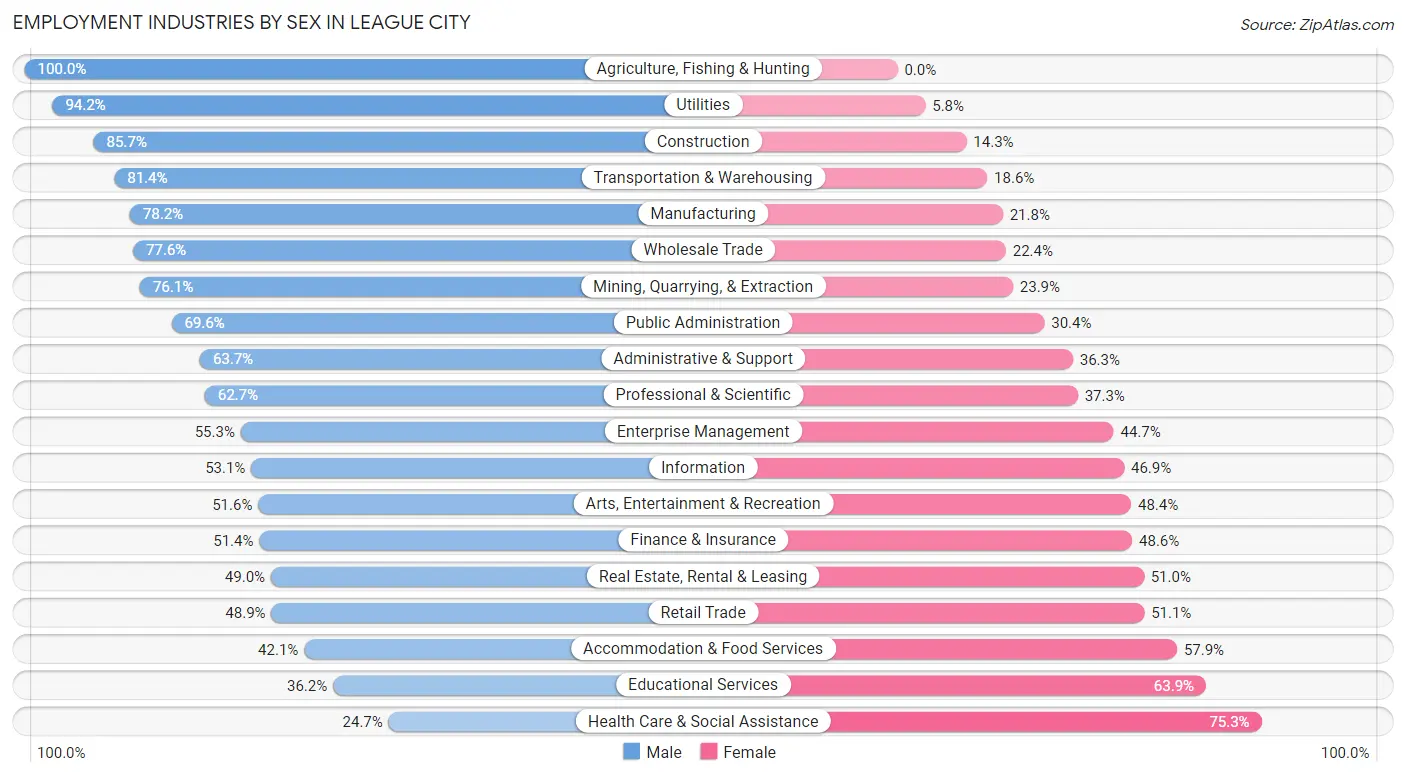
Employment Industries by Sex in League City
The League City industries that see more men than women are Agriculture, Fishing & Hunting (100.0%), Utilities (94.2%), and Construction (85.7%), whereas the industries that tend to have a higher number of women are Health Care & Social Assistance (75.3%), Educational Services (63.8%), and Accommodation & Food Services (57.9%).
| Industry | Male | Female |
| Agriculture, Fishing & Hunting | 100 (100.0%) | 0 (0.0%) |
| Mining, Quarrying, & Extraction | 755 (76.1%) | 237 (23.9%) |
| Construction | 2,347 (85.7%) | 391 (14.3%) |
| Manufacturing | 5,742 (78.2%) | 1,601 (21.8%) |
| Wholesale Trade | 944 (77.6%) | 273 (22.4%) |
| Retail Trade | 2,783 (48.9%) | 2,906 (51.1%) |
| Transportation & Warehousing | 1,684 (81.4%) | 384 (18.6%) |
| Utilities | 1,160 (94.2%) | 71 (5.8%) |
| Information | 325 (53.1%) | 287 (46.9%) |
| Finance & Insurance | 1,481 (51.4%) | 1,399 (48.6%) |
| Real Estate, Rental & Leasing | 573 (49.0%) | 596 (51.0%) |
| Professional & Scientific | 3,175 (62.7%) | 1,890 (37.3%) |
| Enterprise Management | 105 (55.3%) | 85 (44.7%) |
| Administrative & Support | 946 (63.7%) | 539 (36.3%) |
| Educational Services | 2,581 (36.1%) | 4,559 (63.8%) |
| Health Care & Social Assistance | 2,464 (24.7%) | 7,528 (75.3%) |
| Arts, Entertainment & Recreation | 597 (51.6%) | 559 (48.4%) |
| Accommodation & Food Services | 943 (42.1%) | 1,295 (57.9%) |
| Public Administration | 1,996 (69.6%) | 872 (30.4%) |
| Total | 31,450 (53.8%) | 26,962 (46.2%) |
Education in League City
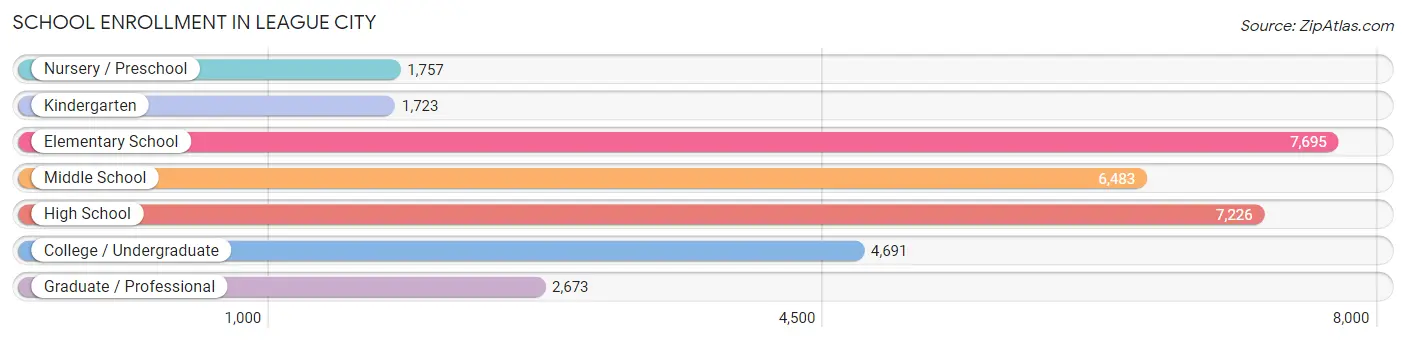
School Enrollment in League City
The most common levels of schooling among the 32,248 students in League City are elementary school (7,695 | 23.9%), high school (7,226 | 22.4%), and middle school (6,483 | 20.1%).
| School Level | # Students | % Students |
| Nursery / Preschool | 1,757 | 5.4% |
| Kindergarten | 1,723 | 5.3% |
| Elementary School | 7,695 | 23.9% |
| Middle School | 6,483 | 20.1% |
| High School | 7,226 | 22.4% |
| College / Undergraduate | 4,691 | 14.5% |
| Graduate / Professional | 2,673 | 8.3% |
| Total | 32,248 | 100.0% |
School Enrollment by Age by Funding Source in League City
Out of a total of 32,248 students who are enrolled in schools in League City, 4,676 (14.5%) attend a private institution, while the remaining 27,572 (85.5%) are enrolled in public schools. The age group of 3 to 4 year olds has the highest likelihood of being enrolled in private schools, with 1,011 (72.3% in the age bracket) enrolled. Conversely, the age group of 15 to 17 year olds has the lowest likelihood of being enrolled in a private school, with 5,362 (94.8% in the age bracket) attending a public institution.
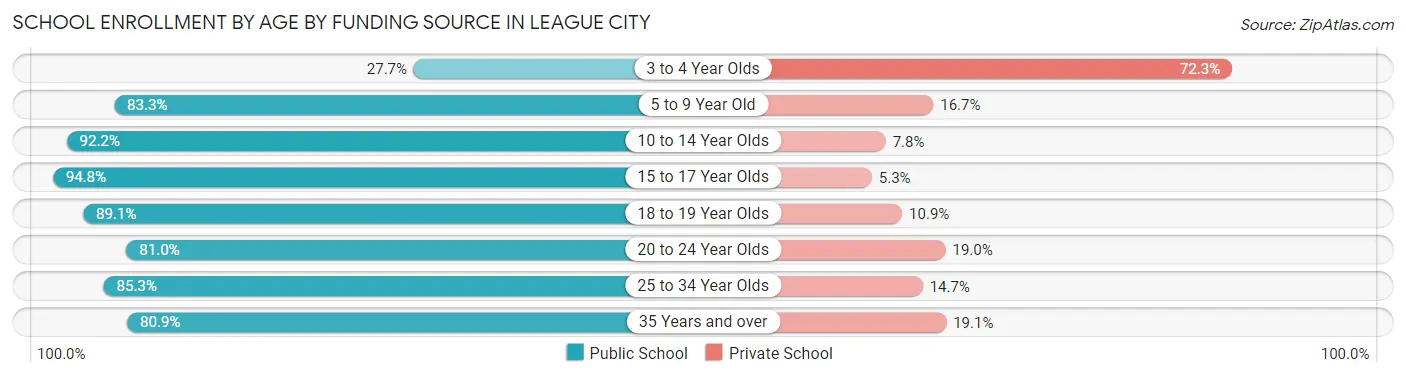
| Age Bracket | Public School | Private School |
| 3 to 4 Year Olds | 387 (27.7%) | 1,011 (72.3%) |
| 5 to 9 Year Old | 7,203 (83.3%) | 1,443 (16.7%) |
| 10 to 14 Year Olds | 7,508 (92.2%) | 638 (7.8%) |
| 15 to 17 Year Olds | 5,362 (94.8%) | 297 (5.2%) |
| 18 to 19 Year Olds | 2,143 (89.1%) | 262 (10.9%) |
| 20 to 24 Year Olds | 1,358 (81.0%) | 318 (19.0%) |
| 25 to 34 Year Olds | 2,057 (85.3%) | 355 (14.7%) |
| 35 Years and over | 1,542 (80.9%) | 364 (19.1%) |
| Total | 27,572 (85.5%) | 4,676 (14.5%) |
Educational Attainment by Field of Study in League City
Business (8,079 | 21.1%), engineering (5,121 | 13.4%), science & technology (4,289 | 11.2%), education (4,035 | 10.5%), and bio, nature & agricultural (3,056 | 8.0%) are the most common fields of study among 38,337 individuals in League City who have obtained a bachelor's degree or higher.
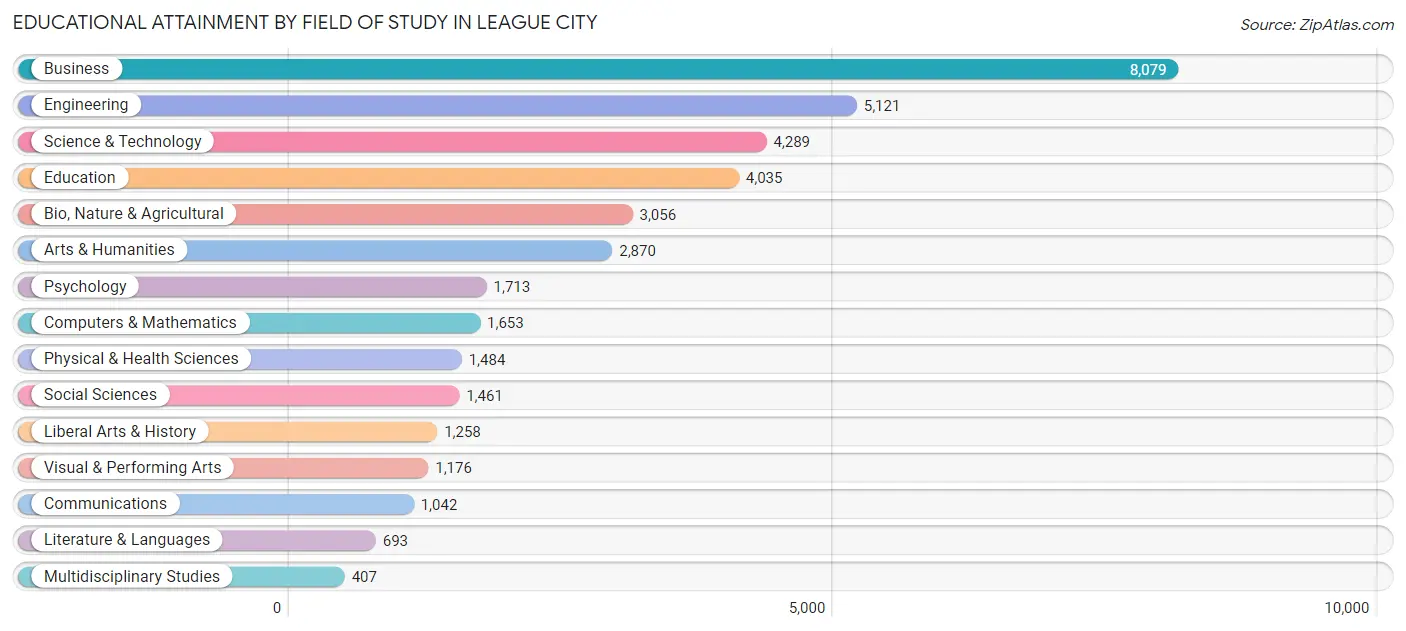
| Field of Study | # Graduates | % Graduates |
| Computers & Mathematics | 1,653 | 4.3% |
| Bio, Nature & Agricultural | 3,056 | 8.0% |
| Physical & Health Sciences | 1,484 | 3.9% |
| Psychology | 1,713 | 4.5% |
| Social Sciences | 1,461 | 3.8% |
| Engineering | 5,121 | 13.4% |
| Multidisciplinary Studies | 407 | 1.1% |
| Science & Technology | 4,289 | 11.2% |
| Business | 8,079 | 21.1% |
| Education | 4,035 | 10.5% |
| Literature & Languages | 693 | 1.8% |
| Liberal Arts & History | 1,258 | 3.3% |
| Visual & Performing Arts | 1,176 | 3.1% |
| Communications | 1,042 | 2.7% |
| Arts & Humanities | 2,870 | 7.5% |
| Total | 38,337 | 100.0% |
Transportation & Commute in League City
Vehicle Availability by Sex in League City
The most prevalent vehicle ownership categories in League City are males with 2 vehicles (15,704, accounting for 50.1%) and females with 2 vehicles (11,792, making up 59.8%).
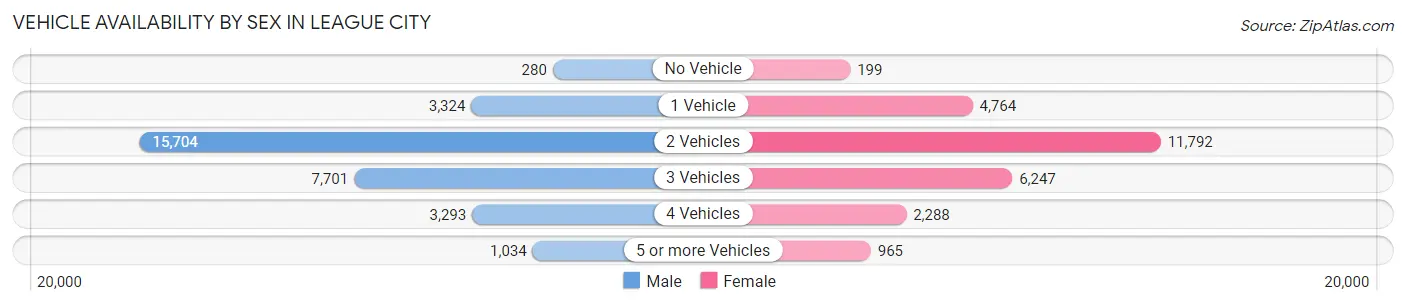
| Vehicles Available | Male | Female |
| No Vehicle | 280 (0.9%) | 199 (0.8%) |
| 1 Vehicle | 3,324 (10.6%) | 4,764 (18.1%) |
| 2 Vehicles | 15,704 (50.1%) | 11,792 (44.9%) |
| 3 Vehicles | 7,701 (24.6%) | 6,247 (23.8%) |
| 4 Vehicles | 3,293 (10.5%) | 2,288 (8.7%) |
| 5 or more Vehicles | 1,034 (3.3%) | 965 (3.7%) |
| Total | 31,336 (100.0%) | 26,255 (100.0%) |
Commute Time in League City
The most frequently occuring commute durations in League City are 30 to 34 minutes (7,544 commuters, 14.8%), 20 to 24 minutes (7,382 commuters, 14.5%), and 15 to 19 minutes (6,852 commuters, 13.4%).
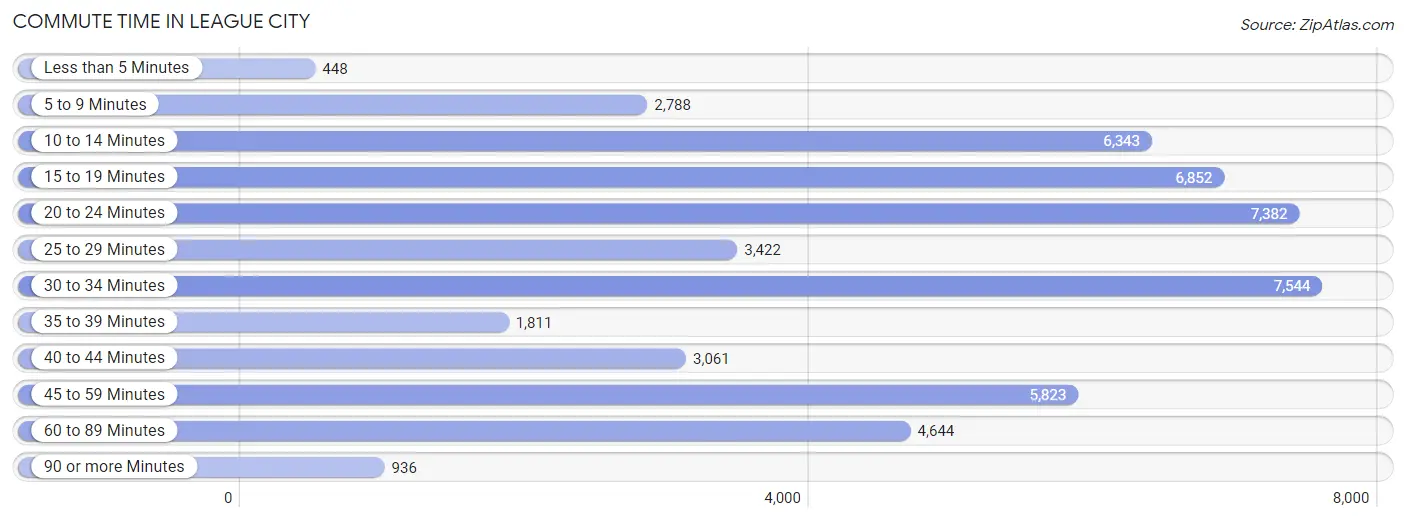
| Commute Time | # Commuters | % Commuters |
| Less than 5 Minutes | 448 | 0.9% |
| 5 to 9 Minutes | 2,788 | 5.5% |
| 10 to 14 Minutes | 6,343 | 12.4% |
| 15 to 19 Minutes | 6,852 | 13.4% |
| 20 to 24 Minutes | 7,382 | 14.5% |
| 25 to 29 Minutes | 3,422 | 6.7% |
| 30 to 34 Minutes | 7,544 | 14.8% |
| 35 to 39 Minutes | 1,811 | 3.5% |
| 40 to 44 Minutes | 3,061 | 6.0% |
| 45 to 59 Minutes | 5,823 | 11.4% |
| 60 to 89 Minutes | 4,644 | 9.1% |
| 90 or more Minutes | 936 | 1.8% |
Commute Time by Sex in League City
The most common commute times in League City are 30 to 34 minutes (5,040 commuters, 18.0%) for males and 10 to 14 minutes (4,069 commuters, 17.6%) for females.
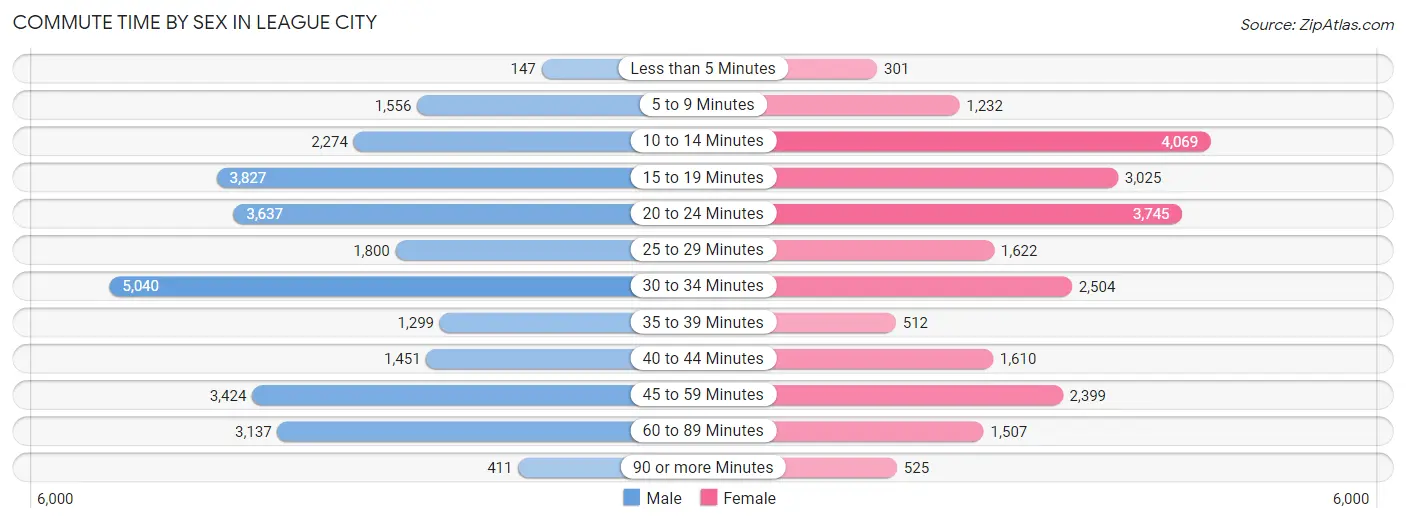
| Commute Time | Male | Female |
| Less than 5 Minutes | 147 (0.5%) | 301 (1.3%) |
| 5 to 9 Minutes | 1,556 (5.6%) | 1,232 (5.3%) |
| 10 to 14 Minutes | 2,274 (8.1%) | 4,069 (17.6%) |
| 15 to 19 Minutes | 3,827 (13.7%) | 3,025 (13.1%) |
| 20 to 24 Minutes | 3,637 (13.0%) | 3,745 (16.3%) |
| 25 to 29 Minutes | 1,800 (6.4%) | 1,622 (7.0%) |
| 30 to 34 Minutes | 5,040 (18.0%) | 2,504 (10.9%) |
| 35 to 39 Minutes | 1,299 (4.6%) | 512 (2.2%) |
| 40 to 44 Minutes | 1,451 (5.2%) | 1,610 (7.0%) |
| 45 to 59 Minutes | 3,424 (12.2%) | 2,399 (10.4%) |
| 60 to 89 Minutes | 3,137 (11.2%) | 1,507 (6.5%) |
| 90 or more Minutes | 411 (1.5%) | 525 (2.3%) |
Time of Departure to Work by Sex in League City
The most frequent times of departure to work in League City are 6:00 AM to 6:29 AM (4,123, 14.7%) for males and 7:00 AM to 7:29 AM (4,843, 21.0%) for females.
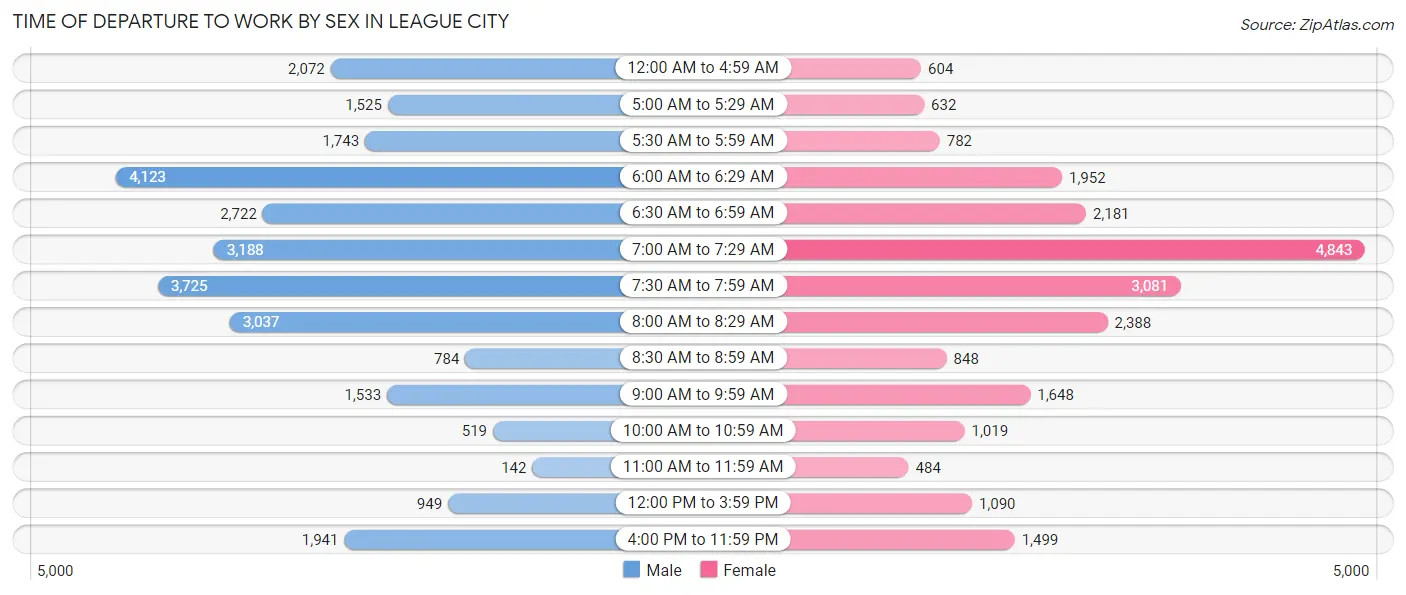
| Time of Departure | Male | Female |
| 12:00 AM to 4:59 AM | 2,072 (7.4%) | 604 (2.6%) |
| 5:00 AM to 5:29 AM | 1,525 (5.4%) | 632 (2.7%) |
| 5:30 AM to 5:59 AM | 1,743 (6.2%) | 782 (3.4%) |
| 6:00 AM to 6:29 AM | 4,123 (14.7%) | 1,952 (8.5%) |
| 6:30 AM to 6:59 AM | 2,722 (9.7%) | 2,181 (9.5%) |
| 7:00 AM to 7:29 AM | 3,188 (11.4%) | 4,843 (21.0%) |
| 7:30 AM to 7:59 AM | 3,725 (13.3%) | 3,081 (13.4%) |
| 8:00 AM to 8:29 AM | 3,037 (10.8%) | 2,388 (10.4%) |
| 8:30 AM to 8:59 AM | 784 (2.8%) | 848 (3.7%) |
| 9:00 AM to 9:59 AM | 1,533 (5.5%) | 1,648 (7.1%) |
| 10:00 AM to 10:59 AM | 519 (1.8%) | 1,019 (4.4%) |
| 11:00 AM to 11:59 AM | 142 (0.5%) | 484 (2.1%) |
| 12:00 PM to 3:59 PM | 949 (3.4%) | 1,090 (4.7%) |
| 4:00 PM to 11:59 PM | 1,941 (6.9%) | 1,499 (6.5%) |
| Total | 28,003 (100.0%) | 23,051 (100.0%) |
Housing Occupancy in League City
Occupancy by Ownership in League City
Of the total 41,838 dwellings in League City, owner-occupied units account for 30,749 (73.5%), while renter-occupied units make up 11,089 (26.5%).
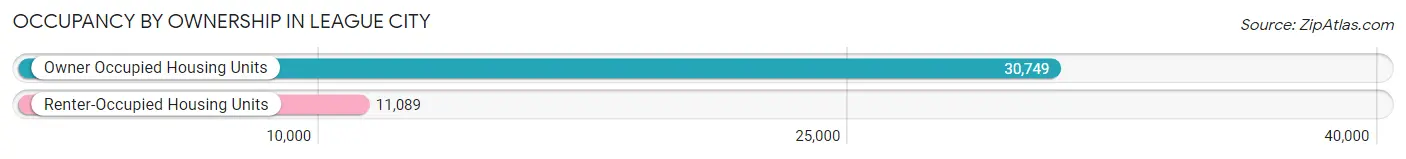
| Occupancy | # Housing Units | % Housing Units |
| Owner Occupied Housing Units | 30,749 | 73.5% |
| Renter-Occupied Housing Units | 11,089 | 26.5% |
| Total Occupied Housing Units | 41,838 | 100.0% |
Occupancy by Household Size in League City
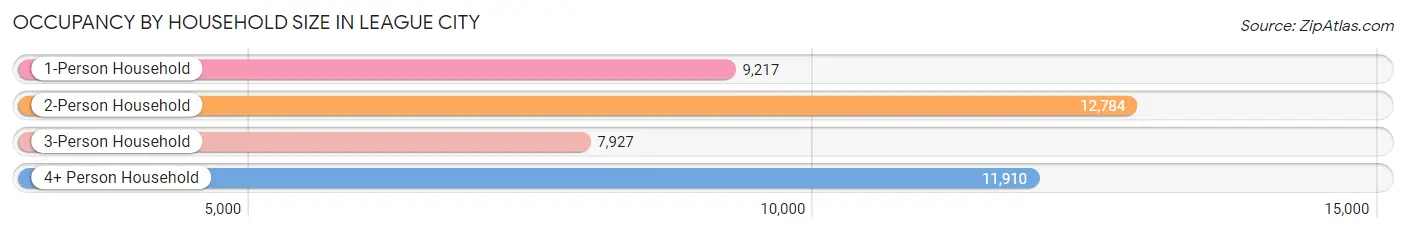
| Household Size | # Housing Units | % Housing Units |
| 1-Person Household | 9,217 | 22.0% |
| 2-Person Household | 12,784 | 30.6% |
| 3-Person Household | 7,927 | 19.0% |
| 4+ Person Household | 11,910 | 28.5% |
| Total Housing Units | 41,838 | 100.0% |
Occupancy by Ownership by Household Size in League City
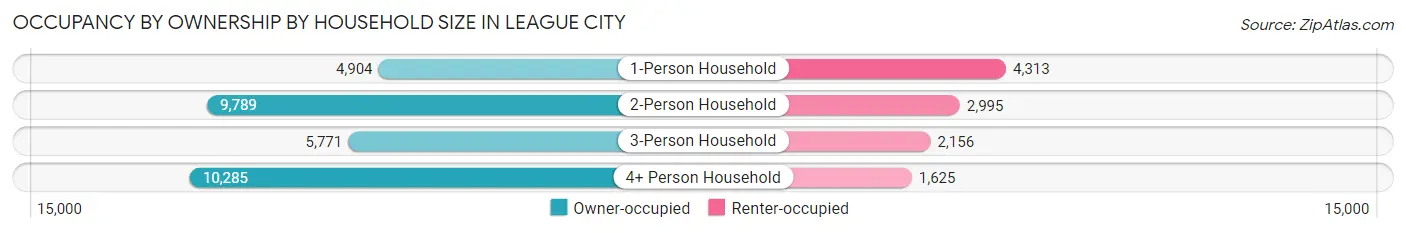
| Household Size | Owner-occupied | Renter-occupied |
| 1-Person Household | 4,904 (53.2%) | 4,313 (46.8%) |
| 2-Person Household | 9,789 (76.6%) | 2,995 (23.4%) |
| 3-Person Household | 5,771 (72.8%) | 2,156 (27.2%) |
| 4+ Person Household | 10,285 (86.4%) | 1,625 (13.6%) |
| Total Housing Units | 30,749 (73.5%) | 11,089 (26.5%) |
Occupancy by Educational Attainment in League City
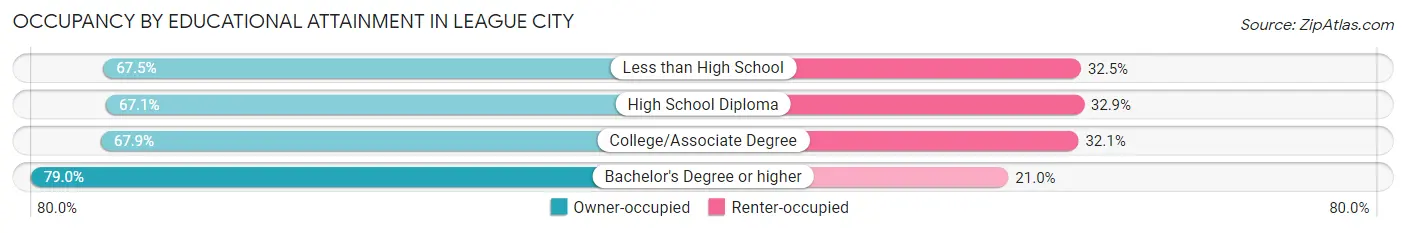
| Household Size | Owner-occupied | Renter-occupied |
| Less than High School | 1,006 (67.5%) | 484 (32.5%) |
| High School Diploma | 3,801 (67.1%) | 1,867 (32.9%) |
| College/Associate Degree | 8,944 (67.9%) | 4,227 (32.1%) |
| Bachelor's Degree or higher | 16,998 (79.0%) | 4,511 (21.0%) |
Occupancy by Age of Householder in League City
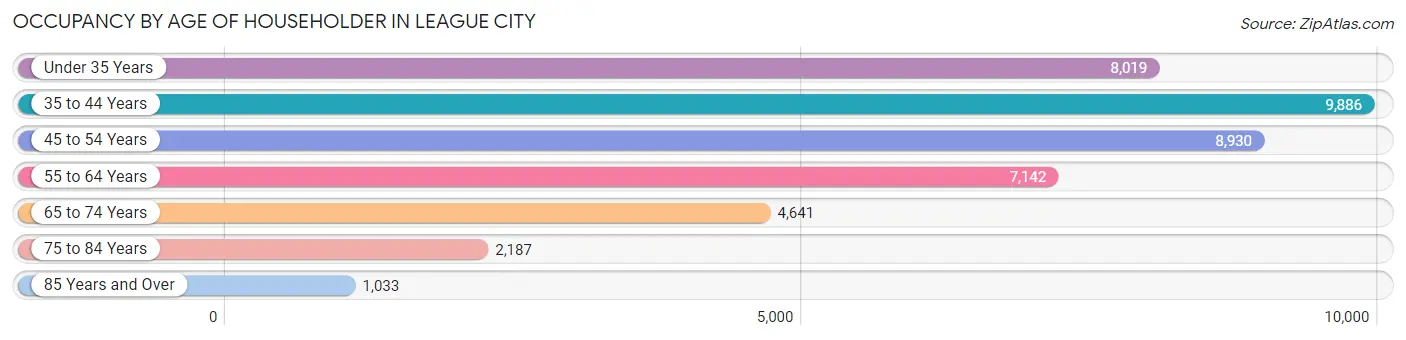
| Age Bracket | # Households | % Households |
| Under 35 Years | 8,019 | 19.2% |
| 35 to 44 Years | 9,886 | 23.6% |
| 45 to 54 Years | 8,930 | 21.3% |
| 55 to 64 Years | 7,142 | 17.1% |
| 65 to 74 Years | 4,641 | 11.1% |
| 75 to 84 Years | 2,187 | 5.2% |
| 85 Years and Over | 1,033 | 2.5% |
| Total | 41,838 | 100.0% |
Housing Finances in League City
Median Income by Occupancy in League City
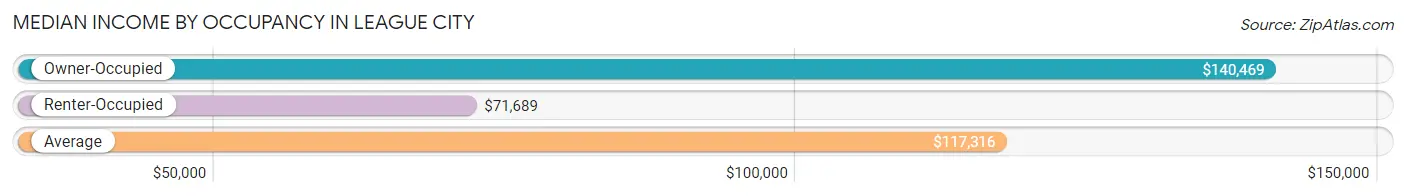
| Occupancy Type | # Households | Median Income |
| Owner-Occupied | 30,749 (73.5%) | $140,469 |
| Renter-Occupied | 11,089 (26.5%) | $71,689 |
| Average | 41,838 (100.0%) | $117,316 |
Occupancy by Householder Income Bracket in League City
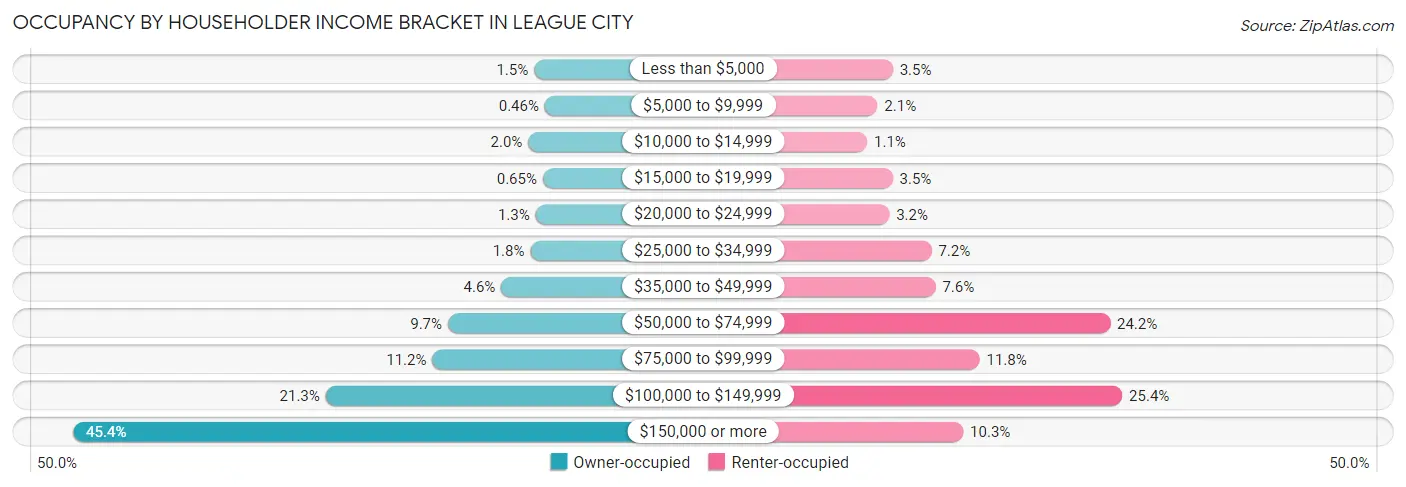
| Income Bracket | Owner-occupied | Renter-occupied |
| Less than $5,000 | 455 (1.5%) | 392 (3.5%) |
| $5,000 to $9,999 | 142 (0.5%) | 231 (2.1%) |
| $10,000 to $14,999 | 626 (2.0%) | 122 (1.1%) |
| $15,000 to $19,999 | 199 (0.6%) | 391 (3.5%) |
| $20,000 to $24,999 | 411 (1.3%) | 356 (3.2%) |
| $25,000 to $34,999 | 566 (1.8%) | 802 (7.2%) |
| $35,000 to $49,999 | 1,419 (4.6%) | 844 (7.6%) |
| $50,000 to $74,999 | 2,979 (9.7%) | 2,688 (24.2%) |
| $75,000 to $99,999 | 3,435 (11.2%) | 1,310 (11.8%) |
| $100,000 to $149,999 | 6,560 (21.3%) | 2,816 (25.4%) |
| $150,000 or more | 13,957 (45.4%) | 1,137 (10.2%) |
| Total | 30,749 (100.0%) | 11,089 (100.0%) |
Monthly Housing Cost Tiers in League City
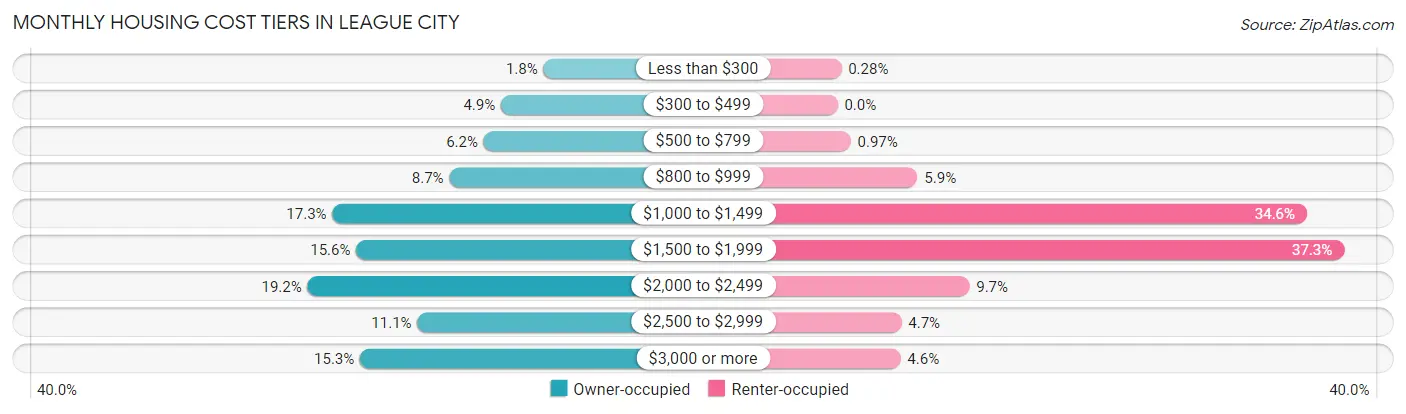
| Monthly Cost | Owner-occupied | Renter-occupied |
| Less than $300 | 547 (1.8%) | 31 (0.3%) |
| $300 to $499 | 1,509 (4.9%) | 0 (0.0%) |
| $500 to $799 | 1,901 (6.2%) | 108 (1.0%) |
| $800 to $999 | 2,677 (8.7%) | 653 (5.9%) |
| $1,000 to $1,499 | 5,328 (17.3%) | 3,833 (34.6%) |
| $1,500 to $1,999 | 4,789 (15.6%) | 4,137 (37.3%) |
| $2,000 to $2,499 | 5,892 (19.2%) | 1,077 (9.7%) |
| $2,500 to $2,999 | 3,405 (11.1%) | 522 (4.7%) |
| $3,000 or more | 4,701 (15.3%) | 515 (4.6%) |
| Total | 30,749 (100.0%) | 11,089 (100.0%) |
Physical Housing Characteristics in League City
Housing Structures in League City
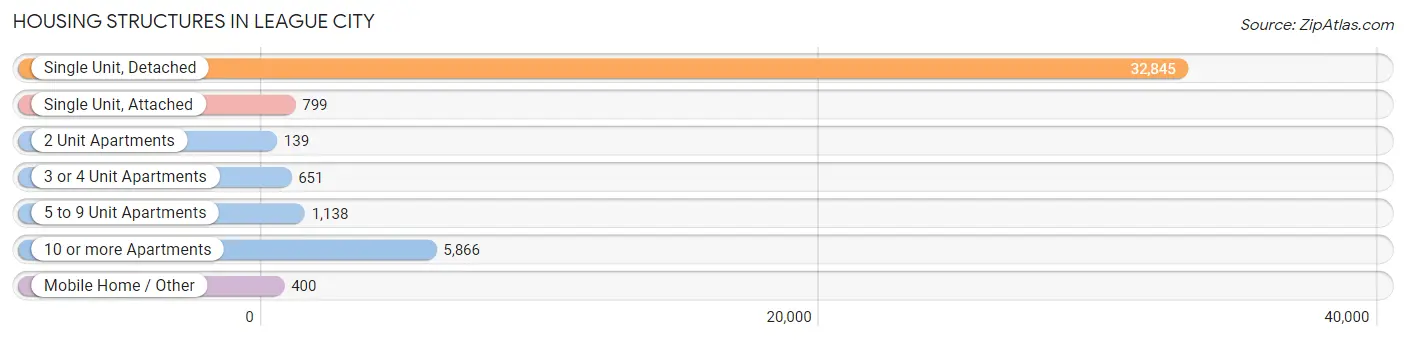
| Structure Type | # Housing Units | % Housing Units |
| Single Unit, Detached | 32,845 | 78.5% |
| Single Unit, Attached | 799 | 1.9% |
| 2 Unit Apartments | 139 | 0.3% |
| 3 or 4 Unit Apartments | 651 | 1.6% |
| 5 to 9 Unit Apartments | 1,138 | 2.7% |
| 10 or more Apartments | 5,866 | 14.0% |
| Mobile Home / Other | 400 | 1.0% |
| Total | 41,838 | 100.0% |
Housing Structures by Occupancy in League City
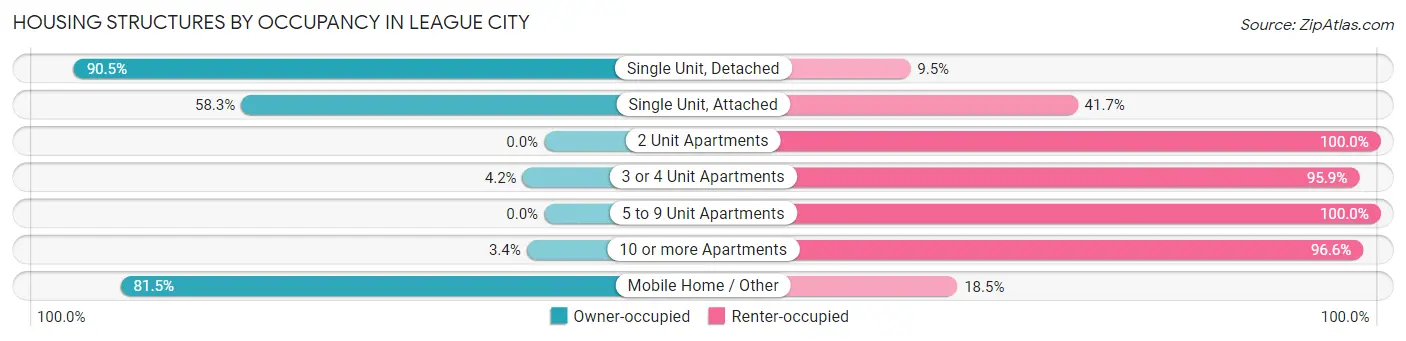
| Structure Type | Owner-occupied | Renter-occupied |
| Single Unit, Detached | 29,733 (90.5%) | 3,112 (9.5%) |
| Single Unit, Attached | 466 (58.3%) | 333 (41.7%) |
| 2 Unit Apartments | 0 (0.0%) | 139 (100.0%) |
| 3 or 4 Unit Apartments | 27 (4.2%) | 624 (95.9%) |
| 5 to 9 Unit Apartments | 0 (0.0%) | 1,138 (100.0%) |
| 10 or more Apartments | 197 (3.4%) | 5,669 (96.6%) |
| Mobile Home / Other | 326 (81.5%) | 74 (18.5%) |
| Total | 30,749 (73.5%) | 11,089 (26.5%) |
Housing Structures by Number of Rooms in League City
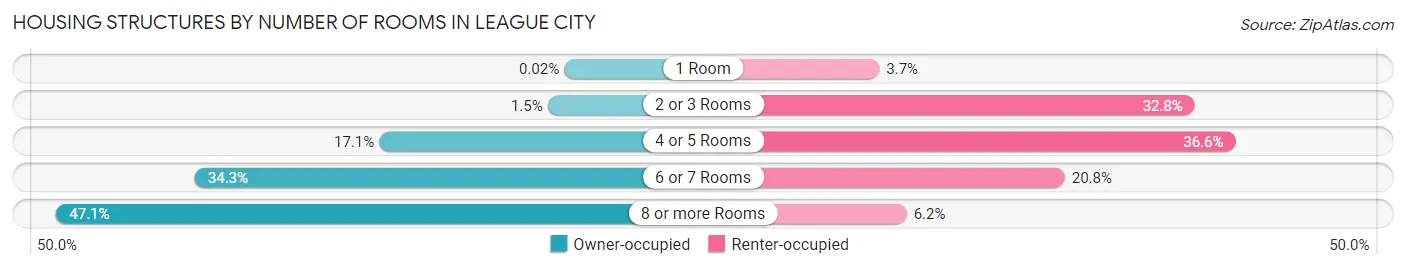
| Number of Rooms | Owner-occupied | Renter-occupied |
| 1 Room | 5 (0.0%) | 405 (3.6%) |
| 2 or 3 Rooms | 475 (1.5%) | 3,638 (32.8%) |
| 4 or 5 Rooms | 5,265 (17.1%) | 4,054 (36.6%) |
| 6 or 7 Rooms | 10,532 (34.3%) | 2,307 (20.8%) |
| 8 or more Rooms | 14,472 (47.1%) | 685 (6.2%) |
| Total | 30,749 (100.0%) | 11,089 (100.0%) |
Housing Structure by Heating Type in League City
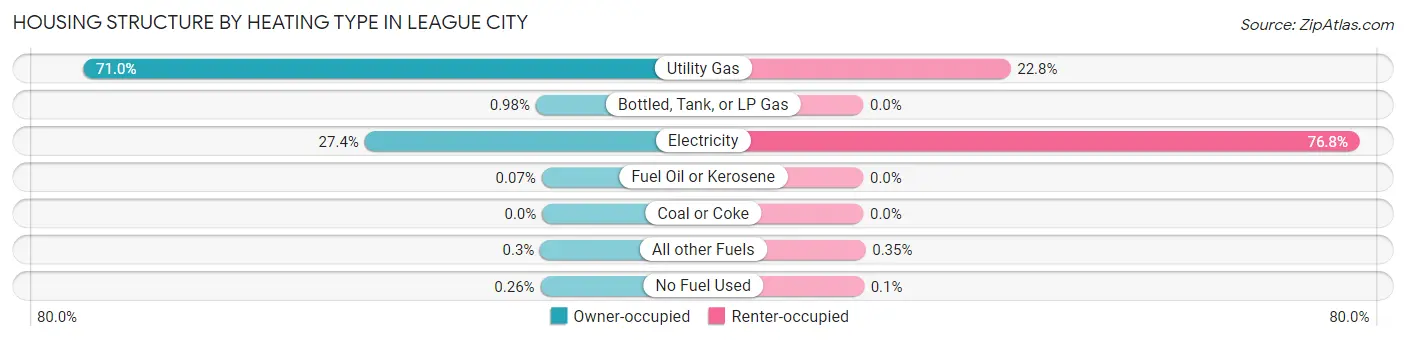
| Heating Type | Owner-occupied | Renter-occupied |
| Utility Gas | 21,820 (71.0%) | 2,524 (22.8%) |
| Bottled, Tank, or LP Gas | 302 (1.0%) | 0 (0.0%) |
| Electricity | 8,433 (27.4%) | 8,515 (76.8%) |
| Fuel Oil or Kerosene | 22 (0.1%) | 0 (0.0%) |
| Coal or Coke | 0 (0.0%) | 0 (0.0%) |
| All other Fuels | 92 (0.3%) | 39 (0.4%) |
| No Fuel Used | 80 (0.3%) | 11 (0.1%) |
| Total | 30,749 (100.0%) | 11,089 (100.0%) |
Household Vehicle Usage in League City
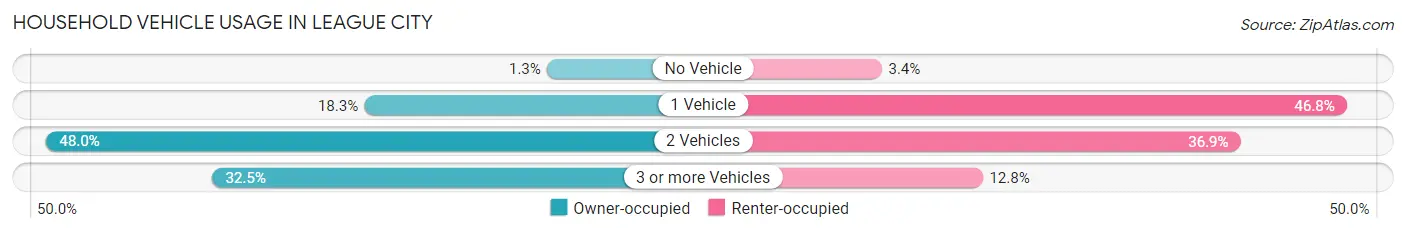
| Vehicles per Household | Owner-occupied | Renter-occupied |
| No Vehicle | 390 (1.3%) | 379 (3.4%) |
| 1 Vehicle | 5,632 (18.3%) | 5,193 (46.8%) |
| 2 Vehicles | 14,747 (48.0%) | 4,093 (36.9%) |
| 3 or more Vehicles | 9,980 (32.5%) | 1,424 (12.8%) |
| Total | 30,749 (100.0%) | 11,089 (100.0%) |
Real Estate & Mortgages in League City
Real Estate and Mortgage Overview in League City
| Characteristic | Without Mortgage | With Mortgage |
| Housing Units | 9,555 | 21,194 |
| Median Property Value | $291,100 | $321,300 |
| Median Household Income | $112,068 | $10,810 |
| Monthly Housing Costs | $892 | $4,675 |
| Real Estate Taxes | $4,633 | $1,207 |
Property Value by Mortgage Status in League City
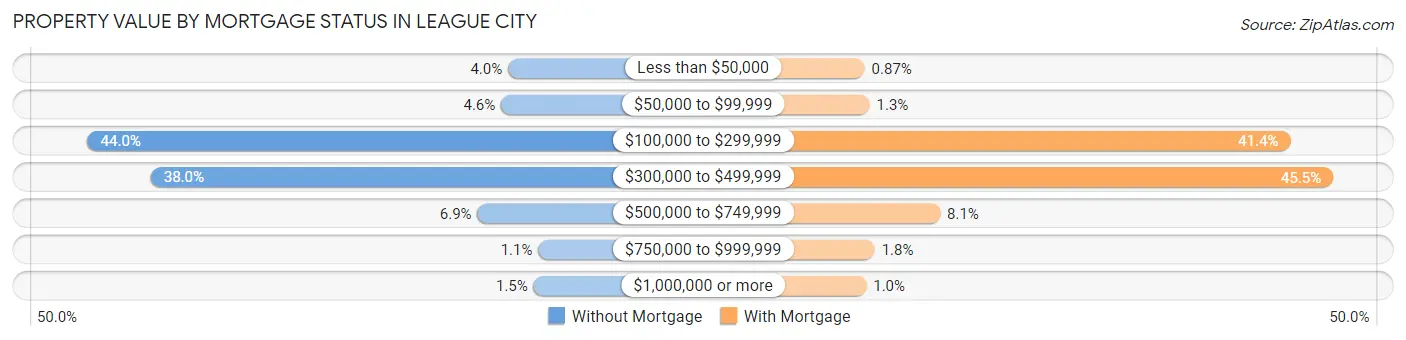
| Property Value | Without Mortgage | With Mortgage |
| Less than $50,000 | 378 (4.0%) | 185 (0.9%) |
| $50,000 to $99,999 | 441 (4.6%) | 283 (1.3%) |
| $100,000 to $299,999 | 4,203 (44.0%) | 8,777 (41.4%) |
| $300,000 to $499,999 | 3,629 (38.0%) | 9,638 (45.5%) |
| $500,000 to $749,999 | 656 (6.9%) | 1,706 (8.1%) |
| $750,000 to $999,999 | 103 (1.1%) | 388 (1.8%) |
| $1,000,000 or more | 145 (1.5%) | 217 (1.0%) |
| Total | 9,555 (100.0%) | 21,194 (100.0%) |
Household Income by Mortgage Status in League City
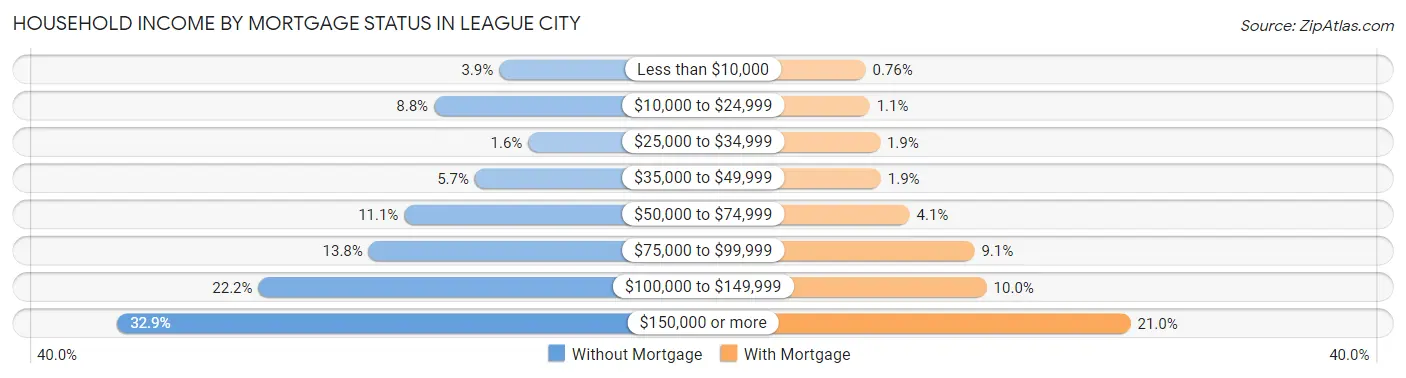
| Household Income | Without Mortgage | With Mortgage |
| Less than $10,000 | 368 (3.8%) | 162 (0.8%) |
| $10,000 to $24,999 | 842 (8.8%) | 229 (1.1%) |
| $25,000 to $34,999 | 156 (1.6%) | 394 (1.9%) |
| $35,000 to $49,999 | 545 (5.7%) | 410 (1.9%) |
| $50,000 to $74,999 | 1,059 (11.1%) | 874 (4.1%) |
| $75,000 to $99,999 | 1,318 (13.8%) | 1,920 (9.1%) |
| $100,000 to $149,999 | 2,120 (22.2%) | 2,117 (10.0%) |
| $150,000 or more | 3,147 (32.9%) | 4,440 (20.9%) |
| Total | 9,555 (100.0%) | 21,194 (100.0%) |
Property Value to Household Income Ratio in League City
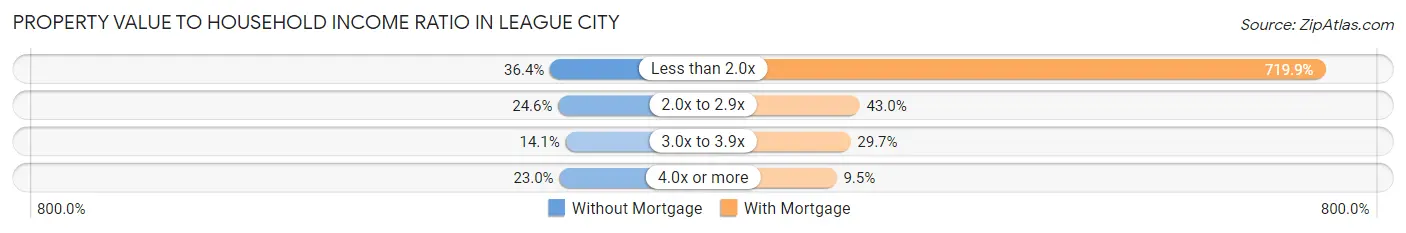
| Value-to-Income Ratio | Without Mortgage | With Mortgage |
| Less than 2.0x | 3,479 (36.4%) | 152,569 (719.9%) |
| 2.0x to 2.9x | 2,346 (24.5%) | 9,110 (43.0%) |
| 3.0x to 3.9x | 1,348 (14.1%) | 6,294 (29.7%) |
| 4.0x or more | 2,193 (23.0%) | 2,022 (9.5%) |
| Total | 9,555 (100.0%) | 21,194 (100.0%) |
Real Estate Taxes by Mortgage Status in League City
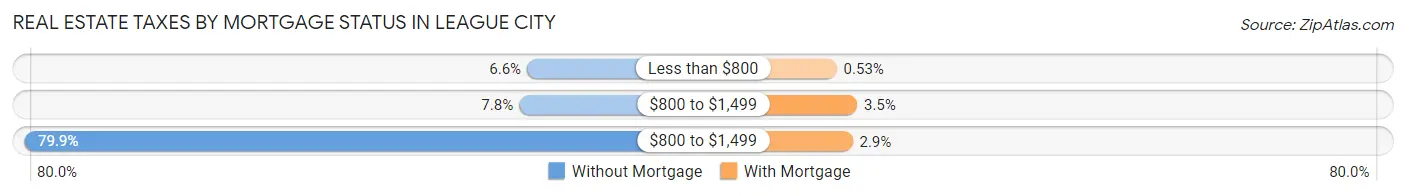
| Property Taxes | Without Mortgage | With Mortgage |
| Less than $800 | 631 (6.6%) | 112 (0.5%) |
| $800 to $1,499 | 741 (7.8%) | 743 (3.5%) |
| $800 to $1,499 | 7,636 (79.9%) | 605 (2.9%) |
| Total | 9,555 (100.0%) | 21,194 (100.0%) |
Health & Disability in League City
Health Insurance Coverage by Age in League City
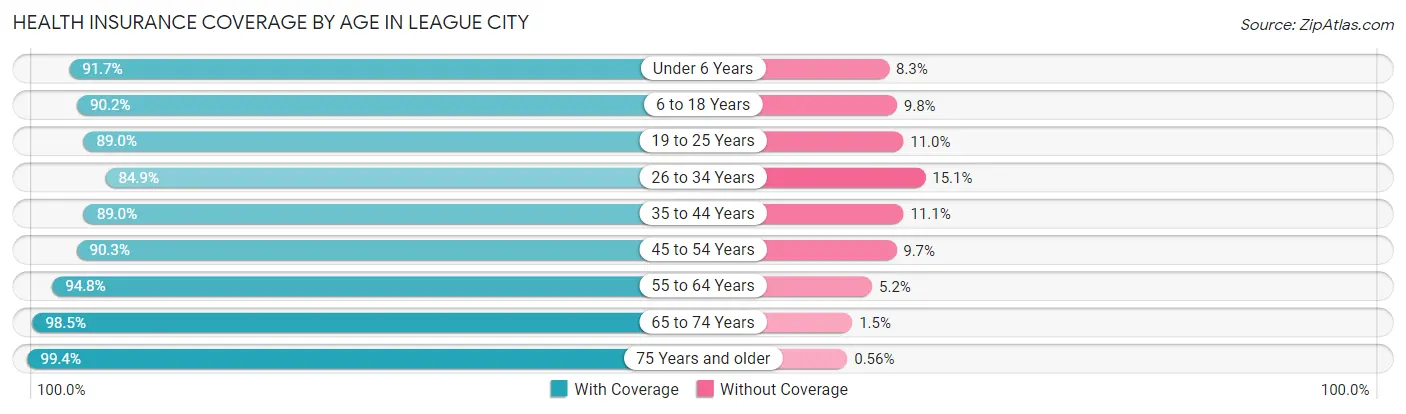
| Age Bracket | With Coverage | Without Coverage |
| Under 6 Years | 8,132 (91.7%) | 740 (8.3%) |
| 6 to 18 Years | 20,911 (90.2%) | 2,271 (9.8%) |
| 19 to 25 Years | 6,518 (89.0%) | 806 (11.0%) |
| 26 to 34 Years | 11,353 (84.9%) | 2,019 (15.1%) |
| 35 to 44 Years | 16,280 (88.9%) | 2,022 (11.1%) |
| 45 to 54 Years | 14,982 (90.3%) | 1,608 (9.7%) |
| 55 to 64 Years | 11,898 (94.8%) | 650 (5.2%) |
| 65 to 74 Years | 7,548 (98.5%) | 113 (1.5%) |
| 75 Years and older | 4,951 (99.4%) | 28 (0.6%) |
| Total | 102,573 (90.9%) | 10,257 (9.1%) |
Health Insurance Coverage by Citizenship Status in League City
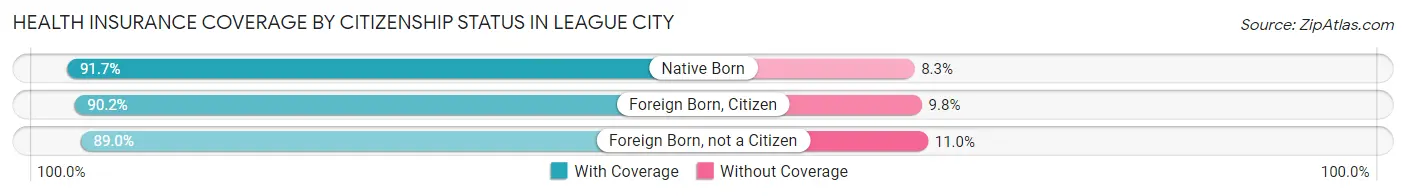
| Citizenship Status | With Coverage | Without Coverage |
| Native Born | 8,132 (91.7%) | 740 (8.3%) |
| Foreign Born, Citizen | 20,911 (90.2%) | 2,271 (9.8%) |
| Foreign Born, not a Citizen | 6,518 (89.0%) | 806 (11.0%) |
Health Insurance Coverage by Household Income in League City
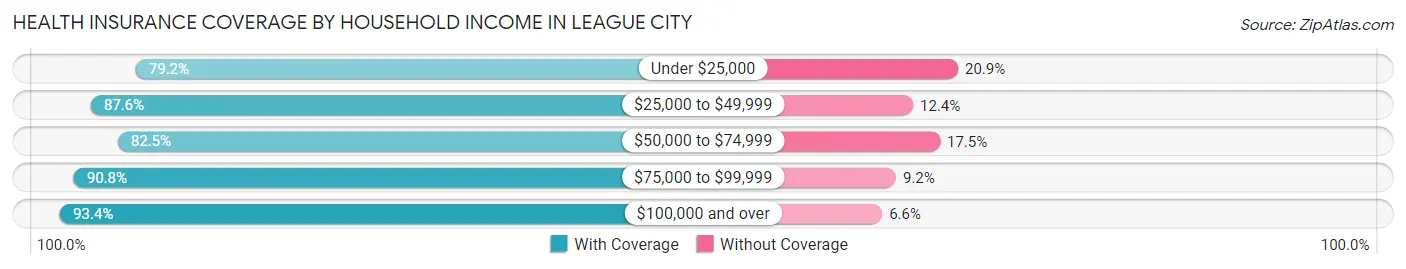
| Household Income | With Coverage | Without Coverage |
| Under $25,000 | 4,240 (79.1%) | 1,117 (20.8%) |
| $25,000 to $49,999 | 5,216 (87.6%) | 739 (12.4%) |
| $50,000 to $74,999 | 10,250 (82.5%) | 2,169 (17.5%) |
| $75,000 to $99,999 | 11,140 (90.8%) | 1,131 (9.2%) |
| $100,000 and over | 71,718 (93.4%) | 5,098 (6.6%) |
Public vs Private Health Insurance Coverage by Age in League City
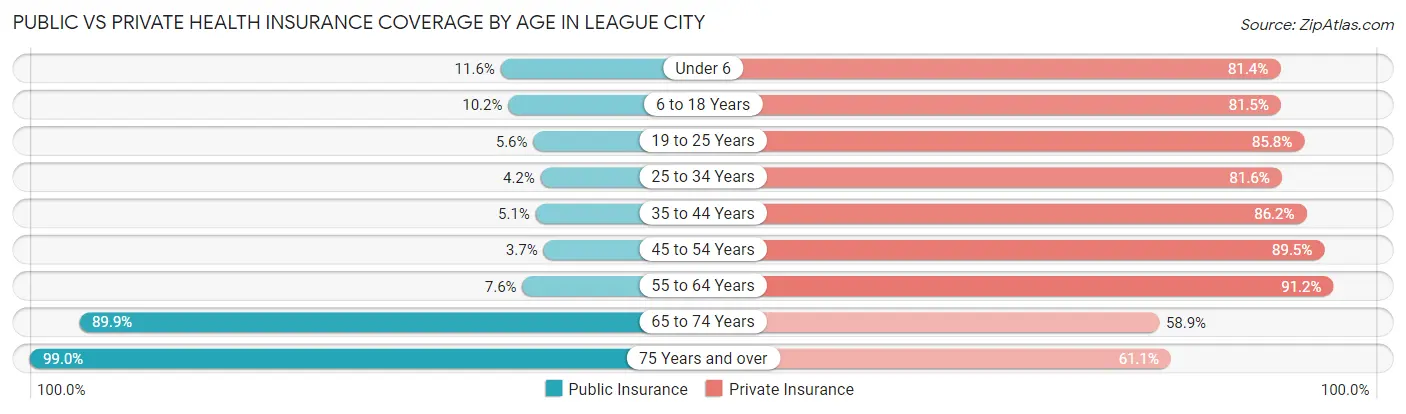
| Age Bracket | Public Insurance | Private Insurance |
| Under 6 | 1,033 (11.6%) | 7,217 (81.4%) |
| 6 to 18 Years | 2,370 (10.2%) | 18,888 (81.5%) |
| 19 to 25 Years | 408 (5.6%) | 6,284 (85.8%) |
| 25 to 34 Years | 564 (4.2%) | 10,917 (81.6%) |
| 35 to 44 Years | 940 (5.1%) | 15,779 (86.2%) |
| 45 to 54 Years | 613 (3.7%) | 14,852 (89.5%) |
| 55 to 64 Years | 954 (7.6%) | 11,447 (91.2%) |
| 65 to 74 Years | 6,888 (89.9%) | 4,510 (58.9%) |
| 75 Years and over | 4,929 (99.0%) | 3,040 (61.1%) |
| Total | 18,699 (16.6%) | 92,934 (82.4%) |
Disability Status by Sex by Age in League City
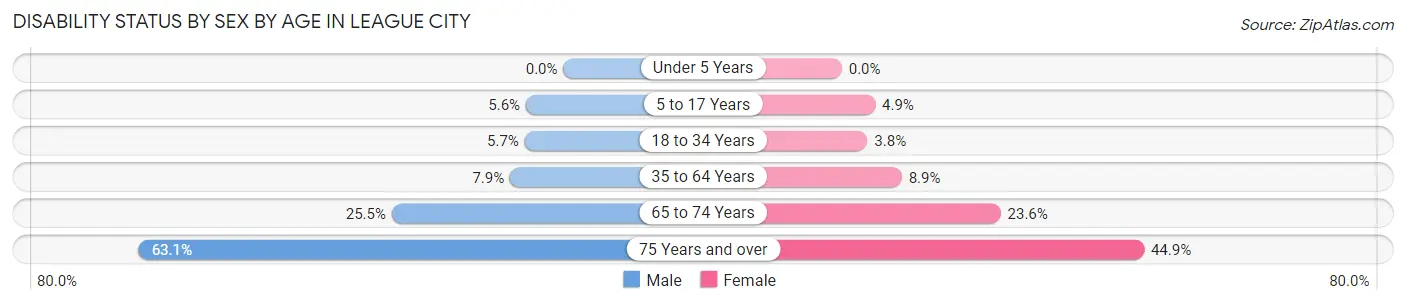
| Age Bracket | Male | Female |
| Under 5 Years | 0 (0.0%) | 0 (0.0%) |
| 5 to 17 Years | 706 (5.6%) | 522 (4.9%) |
| 18 to 34 Years | 669 (5.7%) | 414 (3.8%) |
| 35 to 64 Years | 1,854 (7.9%) | 2,135 (8.9%) |
| 65 to 74 Years | 950 (25.5%) | 927 (23.6%) |
| 75 Years and over | 1,411 (63.0%) | 1,230 (44.9%) |
Disability Class by Sex by Age in League City
Disability Class: Hearing Difficulty
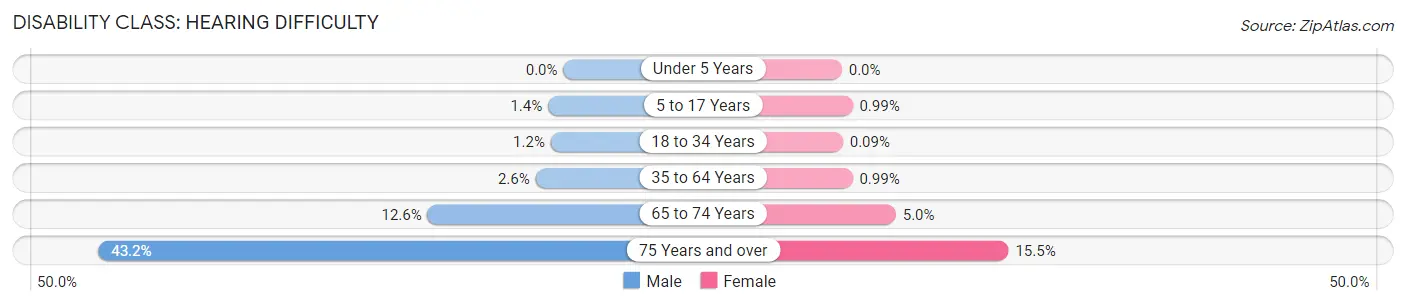
| Age Bracket | Male | Female |
| Under 5 Years | 0 (0.0%) | 0 (0.0%) |
| 5 to 17 Years | 181 (1.4%) | 105 (1.0%) |
| 18 to 34 Years | 137 (1.2%) | 10 (0.1%) |
| 35 to 64 Years | 605 (2.6%) | 237 (1.0%) |
| 65 to 74 Years | 470 (12.6%) | 197 (5.0%) |
| 75 Years and over | 966 (43.2%) | 424 (15.5%) |
Disability Class: Vision Difficulty
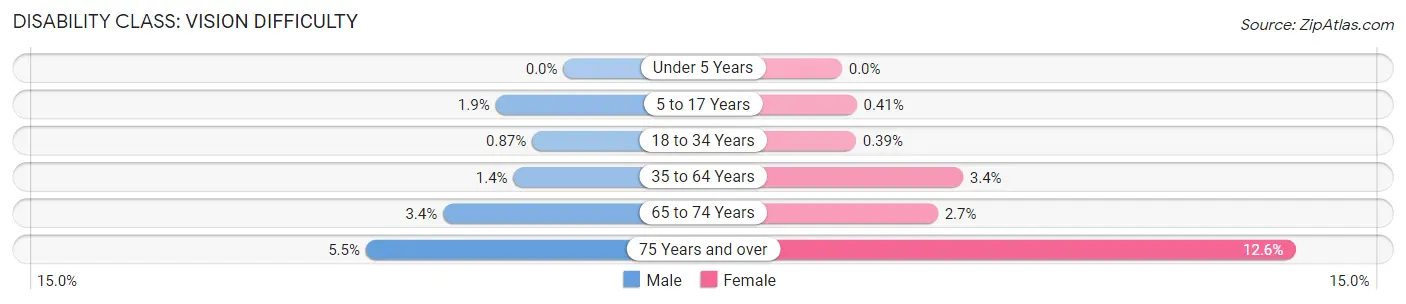
| Age Bracket | Male | Female |
| Under 5 Years | 0 (0.0%) | 0 (0.0%) |
| 5 to 17 Years | 240 (1.9%) | 43 (0.4%) |
| 18 to 34 Years | 101 (0.9%) | 43 (0.4%) |
| 35 to 64 Years | 326 (1.4%) | 808 (3.4%) |
| 65 to 74 Years | 125 (3.4%) | 105 (2.7%) |
| 75 Years and over | 123 (5.5%) | 346 (12.6%) |
Disability Class: Cognitive Difficulty
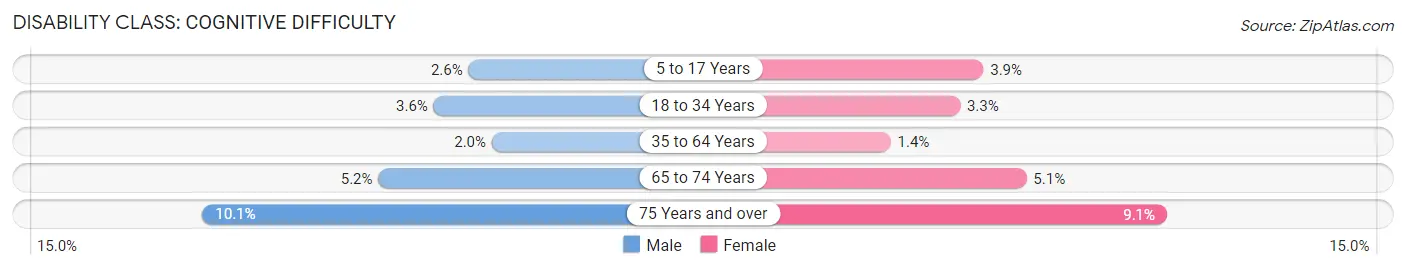
| Age Bracket | Male | Female |
| 5 to 17 Years | 336 (2.6%) | 417 (3.9%) |
| 18 to 34 Years | 421 (3.6%) | 358 (3.3%) |
| 35 to 64 Years | 466 (2.0%) | 327 (1.4%) |
| 65 to 74 Years | 192 (5.1%) | 202 (5.1%) |
| 75 Years and over | 225 (10.1%) | 248 (9.0%) |
Disability Class: Ambulatory Difficulty
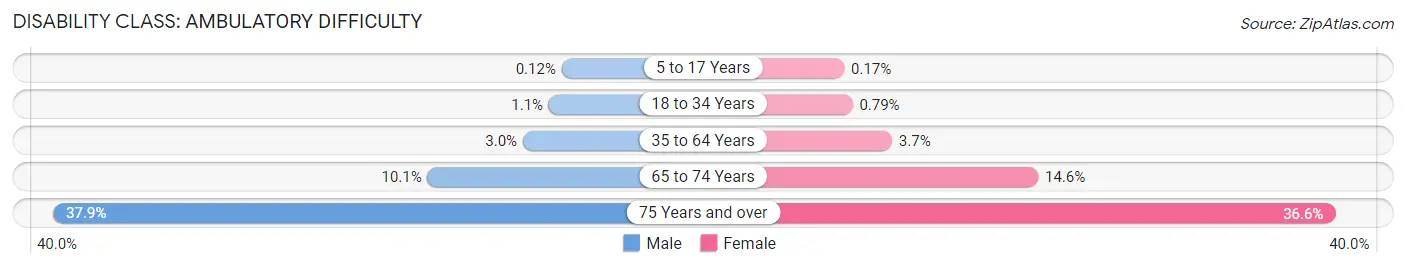
| Age Bracket | Male | Female |
| 5 to 17 Years | 15 (0.1%) | 18 (0.2%) |
| 18 to 34 Years | 125 (1.1%) | 86 (0.8%) |
| 35 to 64 Years | 703 (3.0%) | 894 (3.7%) |
| 65 to 74 Years | 376 (10.1%) | 573 (14.6%) |
| 75 Years and over | 848 (37.9%) | 1,004 (36.6%) |
Disability Class: Self-Care Difficulty
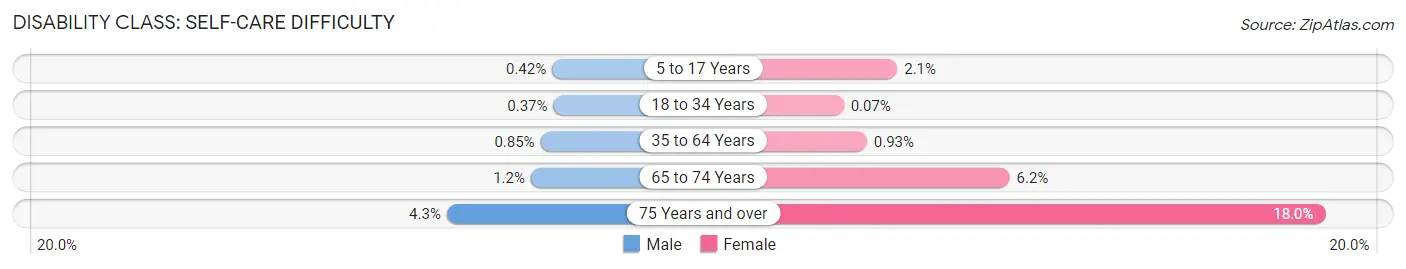
| Age Bracket | Male | Female |
| 5 to 17 Years | 54 (0.4%) | 218 (2.1%) |
| 18 to 34 Years | 43 (0.4%) | 8 (0.1%) |
| 35 to 64 Years | 200 (0.9%) | 223 (0.9%) |
| 65 to 74 Years | 45 (1.2%) | 245 (6.2%) |
| 75 Years and over | 97 (4.3%) | 492 (17.9%) |
Technology Access in League City
Computing Device Access in League City
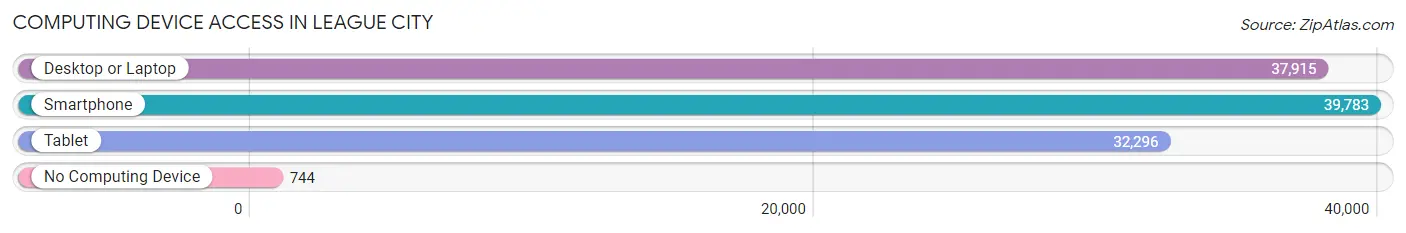
| Device Type | # Households | % Households |
| Desktop or Laptop | 37,915 | 90.6% |
| Smartphone | 39,783 | 95.1% |
| Tablet | 32,296 | 77.2% |
| No Computing Device | 744 | 1.8% |
| Total | 41,838 | 100.0% |
Internet Access in League City
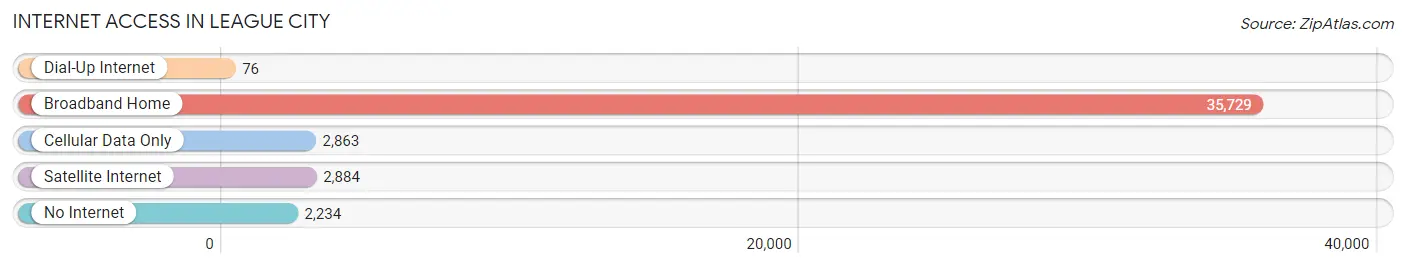
| Internet Type | # Households | % Households |
| Dial-Up Internet | 76 | 0.2% |
| Broadband Home | 35,729 | 85.4% |
| Cellular Data Only | 2,863 | 6.8% |
| Satellite Internet | 2,884 | 6.9% |
| No Internet | 2,234 | 5.3% |
| Total | 41,838 | 100.0% |
League City Summary
City History
League City, Texas is a city located in Galveston County, Texas, United States, within the Greater Houston metropolitan area. The city is located in the Clear Lake area, about 30 miles southeast of downtown Houston. The city was founded in the late 19th century by a group of investors from the League of the Southwest, hence the name.
The area was originally inhabited by the Karankawa Indians, who were later displaced by settlers from the United States. The first settlers in the area were the Orcoquisac Indians, who were later displaced by the Karankawa. The first permanent settlement in the area was established in 1873 by a group of investors from the League of the Southwest, who purchased land from the Orcoquisac Indians. The settlement was named League City after the League of the Southwest.
The city was incorporated in 1916 and has since grown to become one of the largest cities in Galveston County. The city has a population of over 100,000 people and is home to several large employers, including NASA, the University of Texas Medical Branch, and the Johnson Space Center.
Geography
League City is located in Galveston County, Texas, in the Clear Lake area, about 30 miles southeast of downtown Houston. The city is situated on the Galveston Bay, and is bordered by Clear Lake to the north, Dickinson Bayou to the east, and Clear Creek to the south. The city covers an area of approximately 33 square miles, and has a population of over 100,000 people.
The city is divided into several distinct neighborhoods, including Bay Colony, Clear Creek, Clear Lake, and League City. The city is also home to several parks, including Clear Creek Park, Clear Lake Park, and League City Park.
Economy
League City is home to several large employers, including NASA, the University of Texas Medical Branch, and the Johnson Space Center. The city is also home to several large retail and commercial businesses, including Walmart, Target, and Home Depot.
The city is also home to several large industrial and manufacturing companies, including Dow Chemical, BASF, and Chevron Phillips. The city is also home to several large medical centers, including the University of Texas Medical Branch and the Clear Lake Regional Medical Center.
Demographics
As of the 2010 census, the population of League City was 83,560. The racial makeup of the city was 75.3% White, 11.2% African American, 0.7% Native American, 5.2% Asian, 0.1% Pacific Islander, 5.2% from other races, and 2.5% from two or more races. Hispanic or Latino of any race were 17.2% of the population.
The median income for a household in the city was $63,945, and the median income for a family was $76,945. The per capita income for the city was $30,945. About 8.2% of families and 10.3% of the population were below the poverty line, including 14.2% of those under age 18 and 6.2% of those age 65 or over.
Common Questions
What is Per Capita Income in League City?
Per Capita income in League City is $51,636.
What is the Median Family Income in League City?
Median Family Income in League City is $139,892.
What is the Median Household income in League City?
Median Household Income in League City is $117,316.
What is Income or Wage Gap in League City?
Income or Wage Gap in League City is 32.5%.
Women in League City earn 67.5 cents for every dollar earned by a man.
What is Inequality or Gini Index in League City?
Inequality or Gini Index in League City is 0.40.
What is the Total Population of League City?
Total Population of League City is 113,469.
What is the Total Male Population of League City?
Total Male Population of League City is 57,571.
What is the Total Female Population of League City?
Total Female Population of League City is 55,898.
What is the Ratio of Males per 100 Females in League City?
There are 102.99 Males per 100 Females in League City.
What is the Ratio of Females per 100 Males in League City?
There are 97.09 Females per 100 Males in League City.
What is the Median Population Age in League City?
Median Population Age in League City is 37.1 Years.
What is the Average Family Size in League City
Average Family Size in League City is 3.2 People.
What is the Average Household Size in League City
Average Household Size in League City is 2.7 People.
How Large is the Labor Force in League City?
There are 61,103 People in the Labor Forcein in League City.
What is the Percentage of People in the Labor Force in League City?
70.2% of People are in the Labor Force in League City.
What is the Unemployment Rate in League City?
Unemployment Rate in League City is 4.2%.