Redondo Beach, CA Map & Demographics
Redondo Beach Map
Redondo Beach Overview
$73,285
PER CAPITA INCOME
$172,955
AVG FAMILY INCOME
$134,033
AVG HOUSEHOLD INCOME
25.7%
WAGE / INCOME GAP [ % ]
74.3¢/ $1
WAGE / INCOME GAP [ $ ]
0.43
INEQUALITY / GINI INDEX
70,620
TOTAL POPULATION
35,524
MALE POPULATION
35,096
FEMALE POPULATION
101.22
MALES / 100 FEMALES
98.80
FEMALES / 100 MALES
40.1
MEDIAN AGE
3.1
AVG FAMILY SIZE
2.5
AVG HOUSEHOLD SIZE
40,417
LABOR FORCE [ PEOPLE ]
72.3%
PERCENT IN LABOR FORCE
5.0%
UNEMPLOYMENT RATE
Income in Redondo Beach
Income Overview in Redondo Beach
Per Capita Income in Redondo Beach is $73,285, while median incomes of families and households are $172,955 and $134,033 respectively.
| Characteristic | Number | Measure |
| Per Capita Income | 70,620 | $73,285 |
| Median Family Income | 16,910 | $172,955 |
| Mean Family Income | 16,910 | $209,298 |
| Median Household Income | 28,562 | $134,033 |
| Mean Household Income | 28,562 | $177,901 |
| Income Deficit | 16,910 | $0 |
| Wage / Income Gap (%) | 70,620 | 25.68% |
| Wage / Income Gap ($) | 70,620 | 74.32¢ per $1 |
| Gini / Inequality Index | 70,620 | 0.43 |
Earnings by Sex in Redondo Beach
Average Earnings in Redondo Beach are $82,971, $92,482 for men and $68,734 for women, a difference of 25.7%.
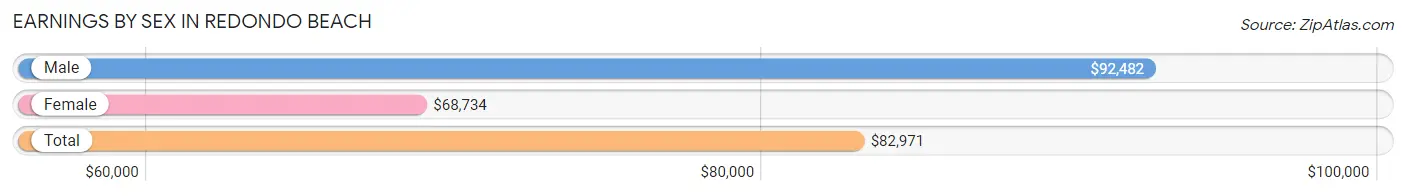
| Sex | Number | Average Earnings |
| Male | 22,053 (53.5%) | $92,482 |
| Female | 19,174 (46.5%) | $68,734 |
| Total | 41,227 (100.0%) | $82,971 |
Earnings by Sex by Income Bracket in Redondo Beach
The most common earnings brackets in Redondo Beach are $100,000+ for men (10,453 | 47.4%) and $100,000+ for women (6,225 | 32.5%).
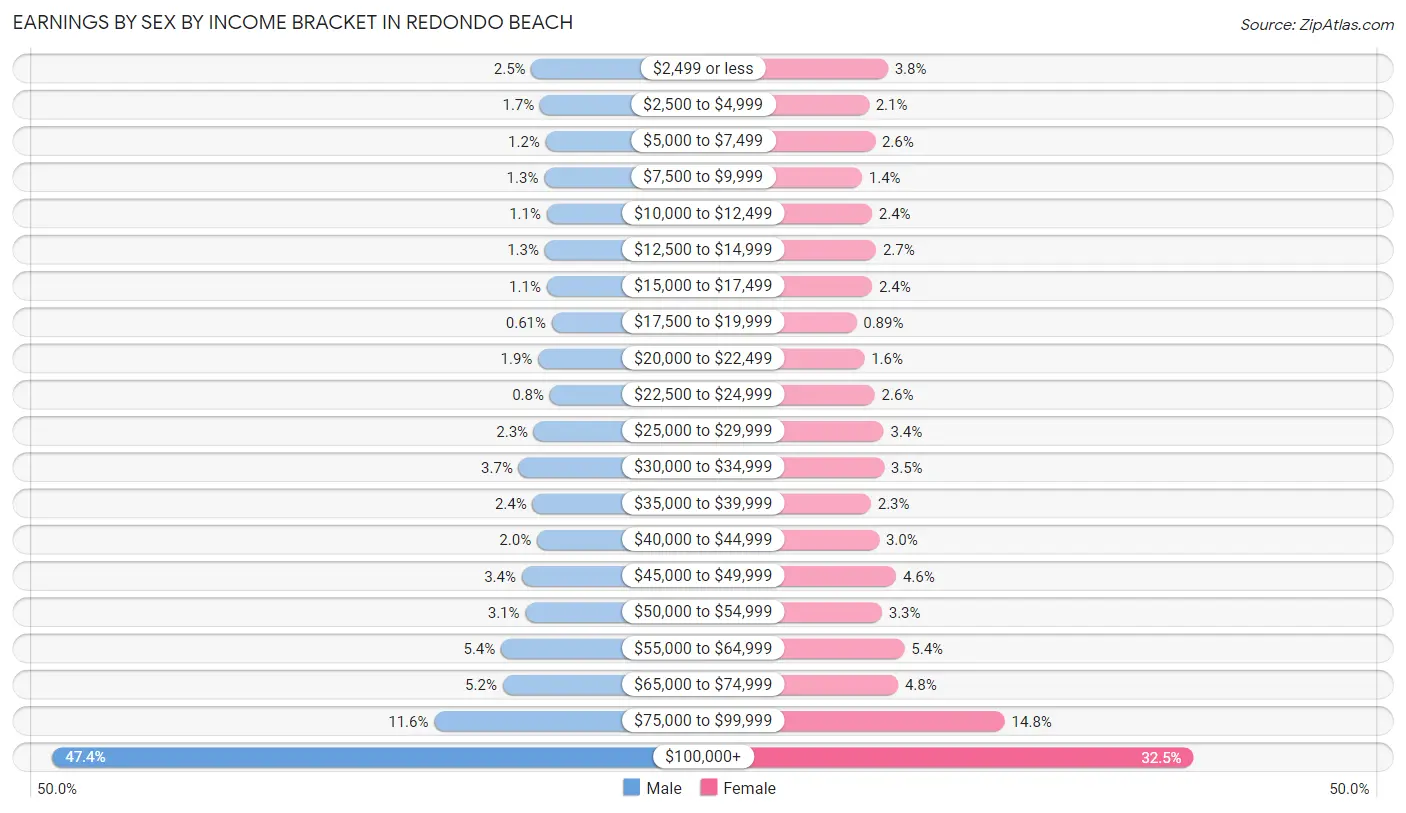
| Income | Male | Female |
| $2,499 or less | 555 (2.5%) | 734 (3.8%) |
| $2,500 to $4,999 | 377 (1.7%) | 393 (2.1%) |
| $5,000 to $7,499 | 263 (1.2%) | 506 (2.6%) |
| $7,500 to $9,999 | 291 (1.3%) | 270 (1.4%) |
| $10,000 to $12,499 | 238 (1.1%) | 450 (2.4%) |
| $12,500 to $14,999 | 281 (1.3%) | 524 (2.7%) |
| $15,000 to $17,499 | 241 (1.1%) | 453 (2.4%) |
| $17,500 to $19,999 | 134 (0.6%) | 171 (0.9%) |
| $20,000 to $22,499 | 416 (1.9%) | 313 (1.6%) |
| $22,500 to $24,999 | 177 (0.8%) | 500 (2.6%) |
| $25,000 to $29,999 | 505 (2.3%) | 660 (3.4%) |
| $30,000 to $34,999 | 819 (3.7%) | 666 (3.5%) |
| $35,000 to $39,999 | 534 (2.4%) | 432 (2.2%) |
| $40,000 to $44,999 | 440 (2.0%) | 577 (3.0%) |
| $45,000 to $49,999 | 755 (3.4%) | 884 (4.6%) |
| $50,000 to $54,999 | 681 (3.1%) | 628 (3.3%) |
| $55,000 to $64,999 | 1,181 (5.4%) | 1,034 (5.4%) |
| $65,000 to $74,999 | 1,149 (5.2%) | 919 (4.8%) |
| $75,000 to $99,999 | 2,563 (11.6%) | 2,835 (14.8%) |
| $100,000+ | 10,453 (47.4%) | 6,225 (32.5%) |
| Total | 22,053 (100.0%) | 19,174 (100.0%) |
Earnings by Sex by Educational Attainment in Redondo Beach
Average earnings in Redondo Beach are $102,215 for men and $75,149 for women, a difference of 26.5%. Men with an educational attainment of graduate degree enjoy the highest average annual earnings of $131,429, while those with less than high school education earn the least with $47,176. Women with an educational attainment of graduate degree earn the most with the average annual earnings of $100,460, while those with high school diploma education have the smallest earnings of $30,136.
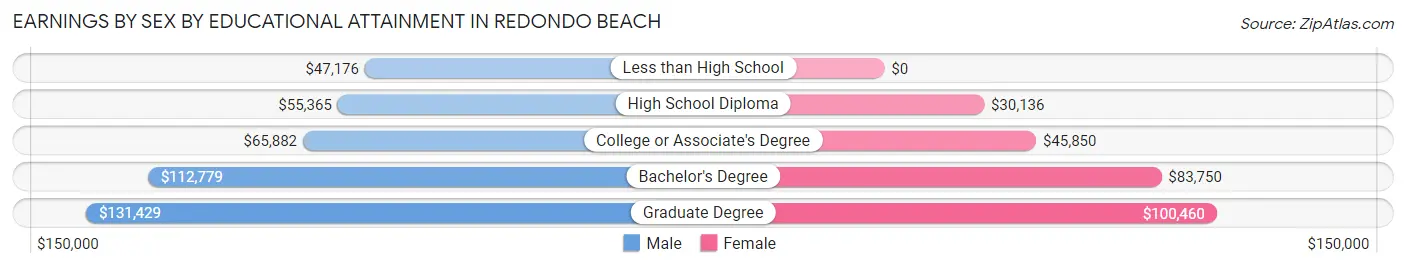
| Educational Attainment | Male Income | Female Income |
| Less than High School | $47,176 | $0 |
| High School Diploma | $55,365 | $30,136 |
| College or Associate's Degree | $65,882 | $45,850 |
| Bachelor's Degree | $112,779 | $83,750 |
| Graduate Degree | $131,429 | $100,460 |
| Total | $102,215 | $75,149 |
Family Income in Redondo Beach
Family Income Brackets in Redondo Beach
According to the Redondo Beach family income data, there are 6,849 families falling into the $200,000+ income range, which is the most common income bracket and makes up 40.5% of all families. Conversely, the $10,000 to $14,999 income bracket is the least frequent group with only 85 families (0.5%) belonging to this category.
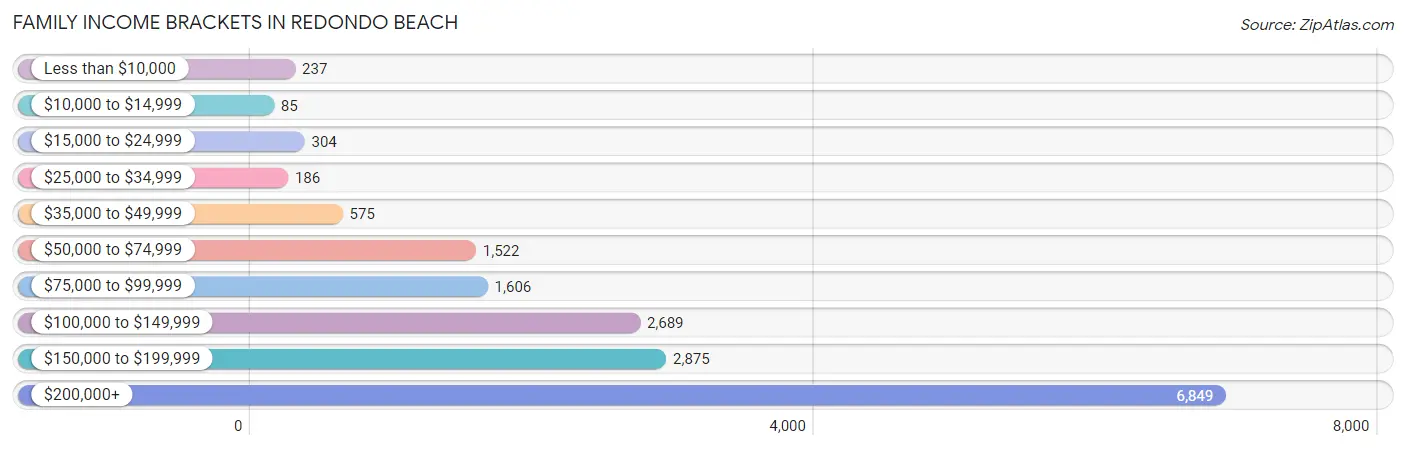
| Income Bracket | # Families | % Families |
| Less than $10,000 | 237 | 1.4% |
| $10,000 to $14,999 | 85 | 0.5% |
| $15,000 to $24,999 | 304 | 1.8% |
| $25,000 to $34,999 | 186 | 1.1% |
| $35,000 to $49,999 | 575 | 3.4% |
| $50,000 to $74,999 | 1,522 | 9.0% |
| $75,000 to $99,999 | 1,606 | 9.5% |
| $100,000 to $149,999 | 2,689 | 15.9% |
| $150,000 to $199,999 | 2,875 | 17.0% |
| $200,000+ | 6,849 | 40.5% |
Family Income by Famaliy Size in Redondo Beach
6-person families (97 | 0.6%) account for the highest median family income in Redondo Beach with $250,001 per family, while 2-person families (7,567 | 44.8%) have the highest median income of $72,704 per family member.
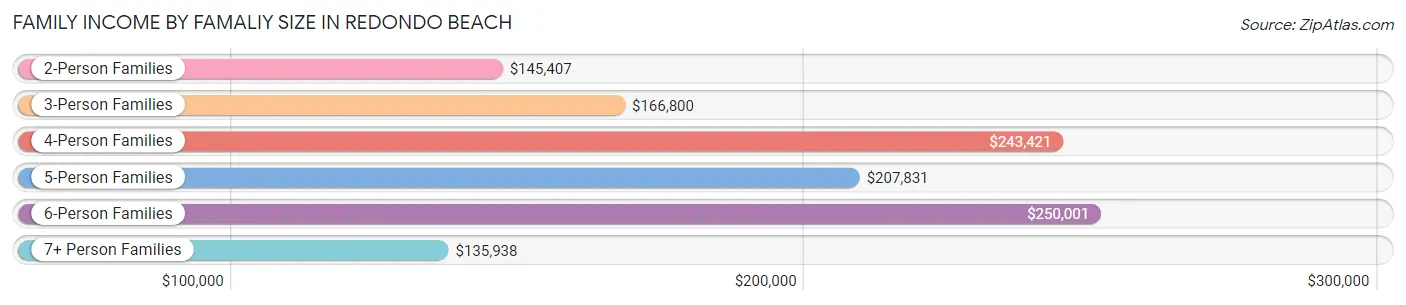
| Income Bracket | # Families | Median Income |
| 2-Person Families | 7,567 (44.8%) | $145,407 |
| 3-Person Families | 3,624 (21.4%) | $166,800 |
| 4-Person Families | 4,300 (25.4%) | $243,421 |
| 5-Person Families | 1,218 (7.2%) | $207,831 |
| 6-Person Families | 97 (0.6%) | $250,001 |
| 7+ Person Families | 104 (0.6%) | $135,938 |
| Total | 16,910 (100.0%) | $172,955 |
Family Income by Number of Earners in Redondo Beach
The median family income in Redondo Beach is $172,955, with families comprising 2 earners (9,327) having the highest median family income of $204,720, while families with no earners (1,508) have the lowest median family income of $71,442, accounting for 55.2% and 8.9% of families, respectively.
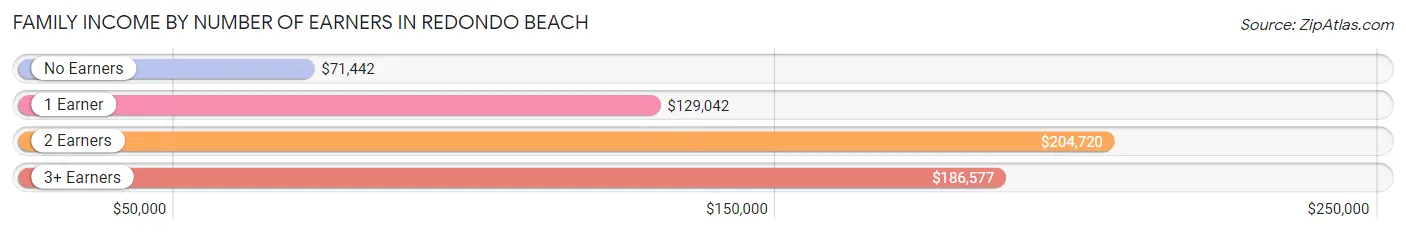
| Number of Earners | # Families | Median Income |
| No Earners | 1,508 (8.9%) | $71,442 |
| 1 Earner | 4,874 (28.8%) | $129,042 |
| 2 Earners | 9,327 (55.2%) | $204,720 |
| 3+ Earners | 1,201 (7.1%) | $186,577 |
| Total | 16,910 (100.0%) | $172,955 |
Household Income in Redondo Beach
Household Income Brackets in Redondo Beach
With 8,769 households falling in the category, the $200,000+ income range is the most frequent in Redondo Beach, accounting for 30.7% of all households. In contrast, only 400 households (1.4%) fall into the $10,000 to $14,999 income bracket, making it the least populous group.
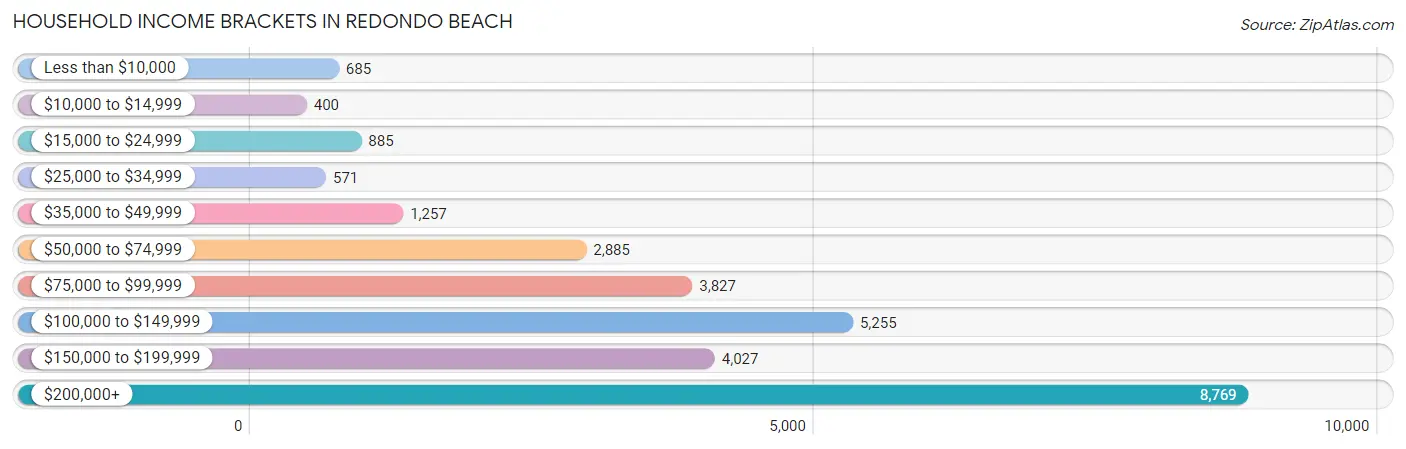
| Income Bracket | # Households | % Households |
| Less than $10,000 | 685 | 2.4% |
| $10,000 to $14,999 | 400 | 1.4% |
| $15,000 to $24,999 | 885 | 3.1% |
| $25,000 to $34,999 | 571 | 2.0% |
| $35,000 to $49,999 | 1,257 | 4.4% |
| $50,000 to $74,999 | 2,885 | 10.1% |
| $75,000 to $99,999 | 3,827 | 13.4% |
| $100,000 to $149,999 | 5,255 | 18.4% |
| $150,000 to $199,999 | 4,027 | 14.1% |
| $200,000+ | 8,769 | 30.7% |
Household Income by Householder Age in Redondo Beach
The median household income in Redondo Beach is $134,033, with the highest median household income of $157,103 found in the 25 to 44 years age bracket for the primary householder. A total of 10,328 households (36.2%) fall into this category. Meanwhile, the 15 to 24 years age bracket for the primary householder has the lowest median household income of $0, with 249 households (0.9%) in this group.
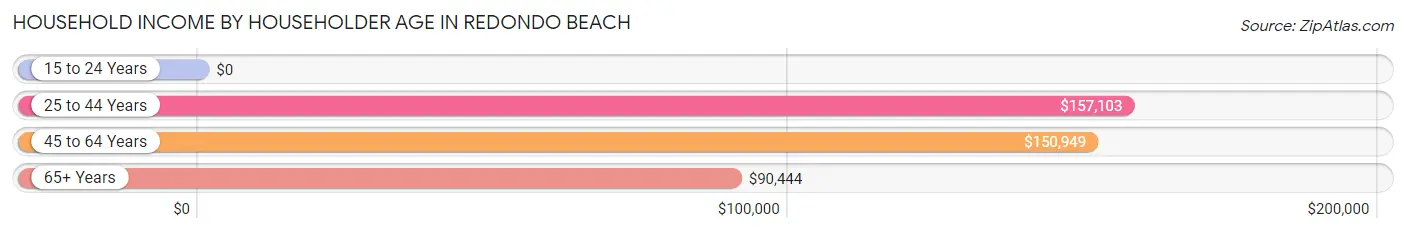
| Income Bracket | # Households | Median Income |
| 15 to 24 Years | 249 (0.9%) | $0 |
| 25 to 44 Years | 10,328 (36.2%) | $157,103 |
| 45 to 64 Years | 11,606 (40.6%) | $150,949 |
| 65+ Years | 6,379 (22.3%) | $90,444 |
| Total | 28,562 (100.0%) | $134,033 |
Poverty in Redondo Beach
Income Below Poverty by Sex and Age in Redondo Beach
With 5.5% poverty level for males and 5.2% for females among the residents of Redondo Beach, 18 to 24 year old males and 18 to 24 year old females are the most vulnerable to poverty, with 332 males (16.1%) and 137 females (9.3%) in their respective age groups living below the poverty level.
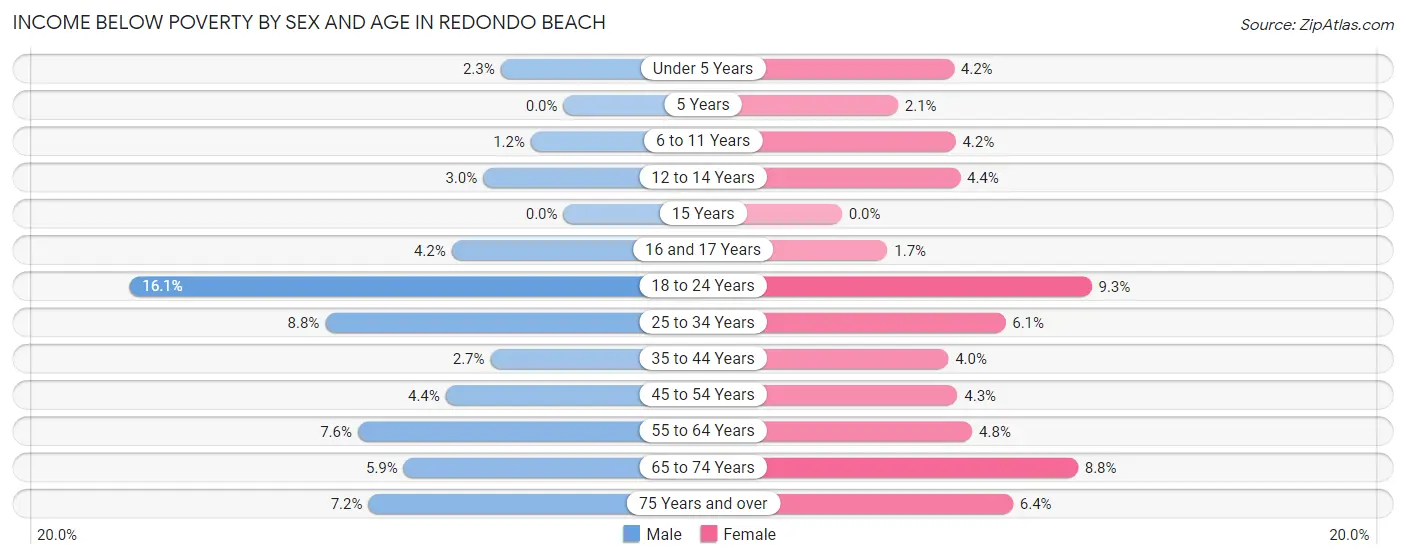
| Age Bracket | Male | Female |
| Under 5 Years | 58 (2.3%) | 104 (4.2%) |
| 5 Years | 0 (0.0%) | 13 (2.1%) |
| 6 to 11 Years | 29 (1.2%) | 124 (4.2%) |
| 12 to 14 Years | 34 (3.0%) | 64 (4.4%) |
| 15 Years | 0 (0.0%) | 0 (0.0%) |
| 16 and 17 Years | 44 (4.2%) | 7 (1.7%) |
| 18 to 24 Years | 332 (16.1%) | 137 (9.3%) |
| 25 to 34 Years | 413 (8.8%) | 295 (6.1%) |
| 35 to 44 Years | 159 (2.7%) | 226 (4.0%) |
| 45 to 54 Years | 262 (4.4%) | 196 (4.3%) |
| 55 to 64 Years | 328 (7.6%) | 243 (4.8%) |
| 65 to 74 Years | 190 (5.9%) | 266 (8.8%) |
| 75 Years and over | 107 (7.2%) | 130 (6.4%) |
| Total | 1,956 (5.5%) | 1,805 (5.2%) |
Income Above Poverty by Sex and Age in Redondo Beach
According to the poverty statistics in Redondo Beach, males aged 5 years and females aged 15 years are the age groups that are most secure financially, with 100.0% of males and 100.0% of females in these age groups living above the poverty line.
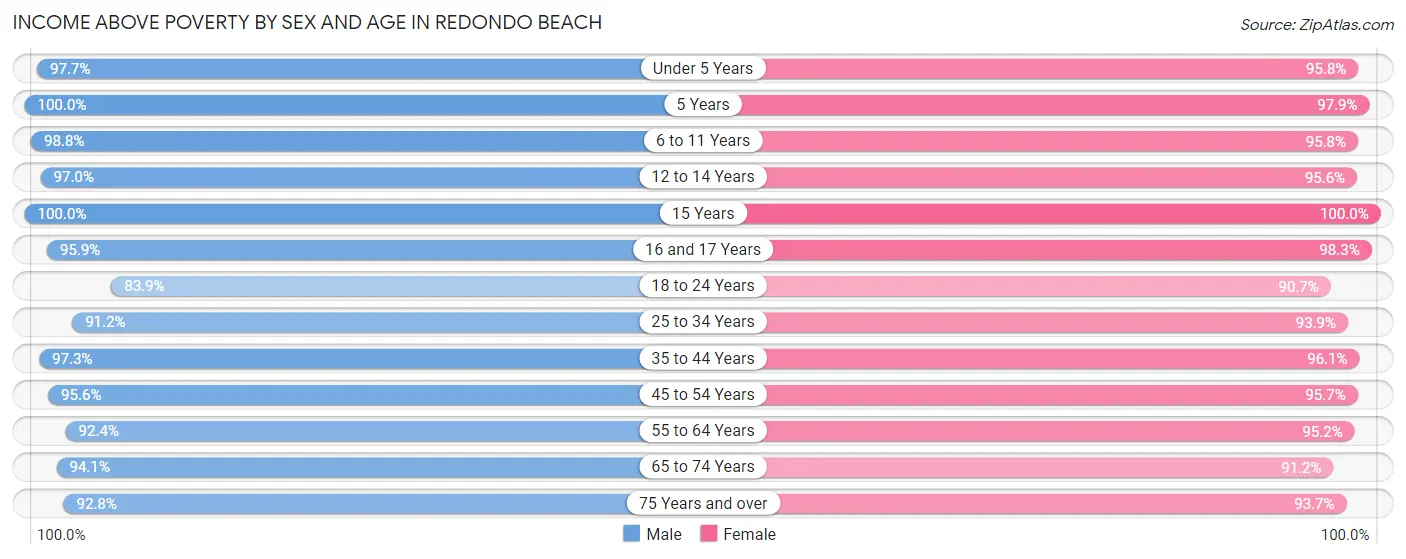
| Age Bracket | Male | Female |
| Under 5 Years | 2,431 (97.7%) | 2,395 (95.8%) |
| 5 Years | 498 (100.0%) | 612 (97.9%) |
| 6 to 11 Years | 2,369 (98.8%) | 2,815 (95.8%) |
| 12 to 14 Years | 1,107 (97.0%) | 1,393 (95.6%) |
| 15 Years | 340 (100.0%) | 322 (100.0%) |
| 16 and 17 Years | 1,017 (95.9%) | 407 (98.3%) |
| 18 to 24 Years | 1,729 (83.9%) | 1,341 (90.7%) |
| 25 to 34 Years | 4,259 (91.2%) | 4,567 (93.9%) |
| 35 to 44 Years | 5,705 (97.3%) | 5,502 (96.1%) |
| 45 to 54 Years | 5,733 (95.6%) | 4,370 (95.7%) |
| 55 to 64 Years | 3,973 (92.4%) | 4,777 (95.2%) |
| 65 to 74 Years | 3,013 (94.1%) | 2,771 (91.2%) |
| 75 Years and over | 1,371 (92.8%) | 1,917 (93.6%) |
| Total | 33,545 (94.5%) | 33,189 (94.8%) |
Income Below Poverty Among Married-Couple Families in Redondo Beach
The poverty statistics for married-couple families in Redondo Beach show that 1.5% or 201 of the total 13,622 families live below the poverty line. Families with 1 or 2 children have the highest poverty rate of 1.8%, comprising of 110 families. On the other hand, families with 3 or 4 children have the lowest poverty rate of 0.0%, which includes 0 families.
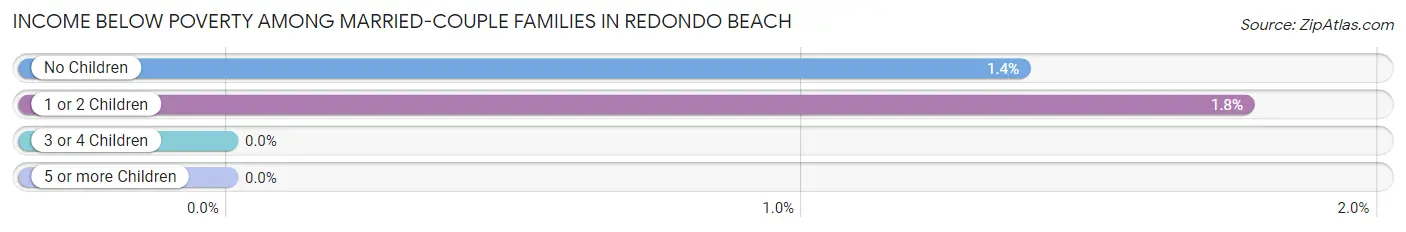
| Children | Above Poverty | Below Poverty |
| No Children | 6,501 (98.6%) | 91 (1.4%) |
| 1 or 2 Children | 6,096 (98.2%) | 110 (1.8%) |
| 3 or 4 Children | 758 (100.0%) | 0 (0.0%) |
| 5 or more Children | 66 (100.0%) | 0 (0.0%) |
| Total | 13,421 (98.5%) | 201 (1.5%) |
Income Below Poverty Among Single-Parent Households in Redondo Beach
According to the poverty data in Redondo Beach, 2.2% or 21 single-father households and 10.6% or 247 single-mother households are living below the poverty line. Among single-father households, those with no children have the highest poverty rate, with 21 households (5.3%) experiencing poverty. Likewise, among single-mother households, those with 5 or more children have the highest poverty rate, with 12 households (100.0%) falling below the poverty line.
| Children | Single Father | Single Mother |
| No Children | 21 (5.3%) | 127 (10.1%) |
| 1 or 2 Children | 0 (0.0%) | 108 (10.5%) |
| 3 or 4 Children | 0 (0.0%) | 0 (0.0%) |
| 5 or more Children | 0 (0.0%) | 12 (100.0%) |
| Total | 21 (2.2%) | 247 (10.6%) |
Income Below Poverty Among Married-Couple vs Single-Parent Households in Redondo Beach
The poverty data for Redondo Beach shows that 201 of the married-couple family households (1.5%) and 268 of the single-parent households (8.2%) are living below the poverty level. Within the married-couple family households, those with 1 or 2 children have the highest poverty rate, with 110 households (1.8%) falling below the poverty line. Among the single-parent households, those with 5 or more children have the highest poverty rate, with 12 household (100.0%) living below poverty.
| Children | Married-Couple Families | Single-Parent Households |
| No Children | 91 (1.4%) | 148 (8.9%) |
| 1 or 2 Children | 110 (1.8%) | 108 (6.9%) |
| 3 or 4 Children | 0 (0.0%) | 0 (0.0%) |
| 5 or more Children | 0 (0.0%) | 12 (100.0%) |
| Total | 201 (1.5%) | 268 (8.2%) |
Race in Redondo Beach
The most populous races in Redondo Beach are White / Caucasian (44,019 | 62.3%), Asian (11,800 | 16.7%), and Hispanic or Latino (11,193 | 15.9%).
| Race | # Population | % Population |
| Asian | 11,800 | 16.7% |
| Black / African American | 2,205 | 3.1% |
| Hawaiian / Pacific | 195 | 0.3% |
| Hispanic or Latino | 11,193 | 15.9% |
| Native / Alaskan | 205 | 0.3% |
| White / Caucasian | 44,019 | 62.3% |
| Two or more Races | 9,455 | 13.4% |
| Some other Race | 2,741 | 3.9% |
| Total | 70,620 | 100.0% |
Ancestry in Redondo Beach
The most populous ancestries reported in Redondo Beach are German (8,759 | 12.4%), Irish (8,117 | 11.5%), English (7,328 | 10.4%), Mexican (7,074 | 10.0%), and Italian (5,161 | 7.3%), together accounting for 51.6% of all Redondo Beach residents.
| Ancestry | # Population | % Population |
| Afghan | 371 | 0.5% |
| African | 35 | 0.1% |
| Albanian | 82 | 0.1% |
| American | 2,460 | 3.5% |
| Apache | 82 | 0.1% |
| Arab | 1,047 | 1.5% |
| Argentinean | 410 | 0.6% |
| Armenian | 381 | 0.5% |
| Assyrian / Chaldean / Syriac | 57 | 0.1% |
| Australian | 63 | 0.1% |
| Austrian | 261 | 0.4% |
| Belgian | 117 | 0.2% |
| Belizean | 18 | 0.0% |
| Bhutanese | 3,407 | 4.8% |
| Blackfeet | 13 | 0.0% |
| Bolivian | 23 | 0.0% |
| Brazilian | 397 | 0.6% |
| British | 722 | 1.0% |
| Bulgarian | 7 | 0.0% |
| Burmese | 2,315 | 3.3% |
| Cambodian | 142 | 0.2% |
| Canadian | 421 | 0.6% |
| Central American | 1,077 | 1.5% |
| Central American Indian | 29 | 0.0% |
| Cherokee | 100 | 0.1% |
| Chilean | 42 | 0.1% |
| Chippewa | 25 | 0.0% |
| Choctaw | 44 | 0.1% |
| Colombian | 232 | 0.3% |
| Comanche | 23 | 0.0% |
| Costa Rican | 110 | 0.2% |
| Cree | 36 | 0.1% |
| Croatian | 301 | 0.4% |
| Cuban | 331 | 0.5% |
| Czech | 359 | 0.5% |
| Czechoslovakian | 117 | 0.2% |
| Danish | 338 | 0.5% |
| Delaware | 134 | 0.2% |
| Dominican | 78 | 0.1% |
| Dutch | 757 | 1.1% |
| Eastern European | 551 | 0.8% |
| Ecuadorian | 175 | 0.3% |
| Egyptian | 132 | 0.2% |
| English | 7,328 | 10.4% |
| Ethiopian | 23 | 0.0% |
| European | 2,159 | 3.1% |
| Filipino | 562 | 0.8% |
| Finnish | 191 | 0.3% |
| French | 1,696 | 2.4% |
| French Canadian | 621 | 0.9% |
| German | 8,759 | 12.4% |
| German Russian | 38 | 0.1% |
| Greek | 817 | 1.2% |
| Guamanian / Chamorro | 42 | 0.1% |
| Guatemalan | 301 | 0.4% |
| Guyanese | 37 | 0.1% |
| Haitian | 159 | 0.2% |
| Hungarian | 664 | 0.9% |
| Icelander | 18 | 0.0% |
| Indian (Asian) | 3,361 | 4.8% |
| Indonesian | 88 | 0.1% |
| Iranian | 488 | 0.7% |
| Irish | 8,117 | 11.5% |
| Israeli | 101 | 0.1% |
| Italian | 5,161 | 7.3% |
| Jamaican | 33 | 0.1% |
| Japanese | 70 | 0.1% |
| Jordanian | 46 | 0.1% |
| Kenyan | 23 | 0.0% |
| Korean | 2,868 | 4.1% |
| Laotian | 103 | 0.2% |
| Latvian | 10 | 0.0% |
| Lebanese | 294 | 0.4% |
| Lithuanian | 393 | 0.6% |
| Malaysian | 43 | 0.1% |
| Mexican | 7,074 | 10.0% |
| Mexican American Indian | 79 | 0.1% |
| Mongolian | 9 | 0.0% |
| Moroccan | 3 | 0.0% |
| Native Hawaiian | 287 | 0.4% |
| Nicaraguan | 54 | 0.1% |
| Nigerian | 78 | 0.1% |
| Northern European | 76 | 0.1% |
| Norwegian | 857 | 1.2% |
| Pakistani | 137 | 0.2% |
| Palestinian | 239 | 0.3% |
| Peruvian | 390 | 0.5% |
| Polish | 1,699 | 2.4% |
| Portuguese | 404 | 0.6% |
| Pueblo | 16 | 0.0% |
| Puerto Rican | 320 | 0.4% |
| Romanian | 155 | 0.2% |
| Russian | 1,661 | 2.4% |
| Salvadoran | 612 | 0.9% |
| Samoan | 97 | 0.1% |
| Scandinavian | 108 | 0.2% |
| Scotch-Irish | 360 | 0.5% |
| Scottish | 1,467 | 2.1% |
| Serbian | 60 | 0.1% |
| Slavic | 37 | 0.1% |
| Slovak | 124 | 0.2% |
| Slovene | 74 | 0.1% |
| South African | 27 | 0.0% |
| South American | 1,308 | 1.8% |
| South American Indian | 1 | 0.0% |
| Spaniard | 163 | 0.2% |
| Spanish | 511 | 0.7% |
| Spanish American | 19 | 0.0% |
| Sri Lankan | 588 | 0.8% |
| Subsaharan African | 243 | 0.3% |
| Sudanese | 23 | 0.0% |
| Swedish | 729 | 1.0% |
| Swiss | 293 | 0.4% |
| Syrian | 91 | 0.1% |
| Thai | 2,240 | 3.2% |
| Trinidadian and Tobagonian | 78 | 0.1% |
| Turkish | 40 | 0.1% |
| Ukrainian | 324 | 0.5% |
| Venezuelan | 36 | 0.1% |
| Vietnamese | 22 | 0.0% |
| Welsh | 446 | 0.6% |
| West Indian | 7 | 0.0% |
| Yugoslavian | 154 | 0.2% |
| Zimbabwean | 11 | 0.0% | View All 124 Rows |
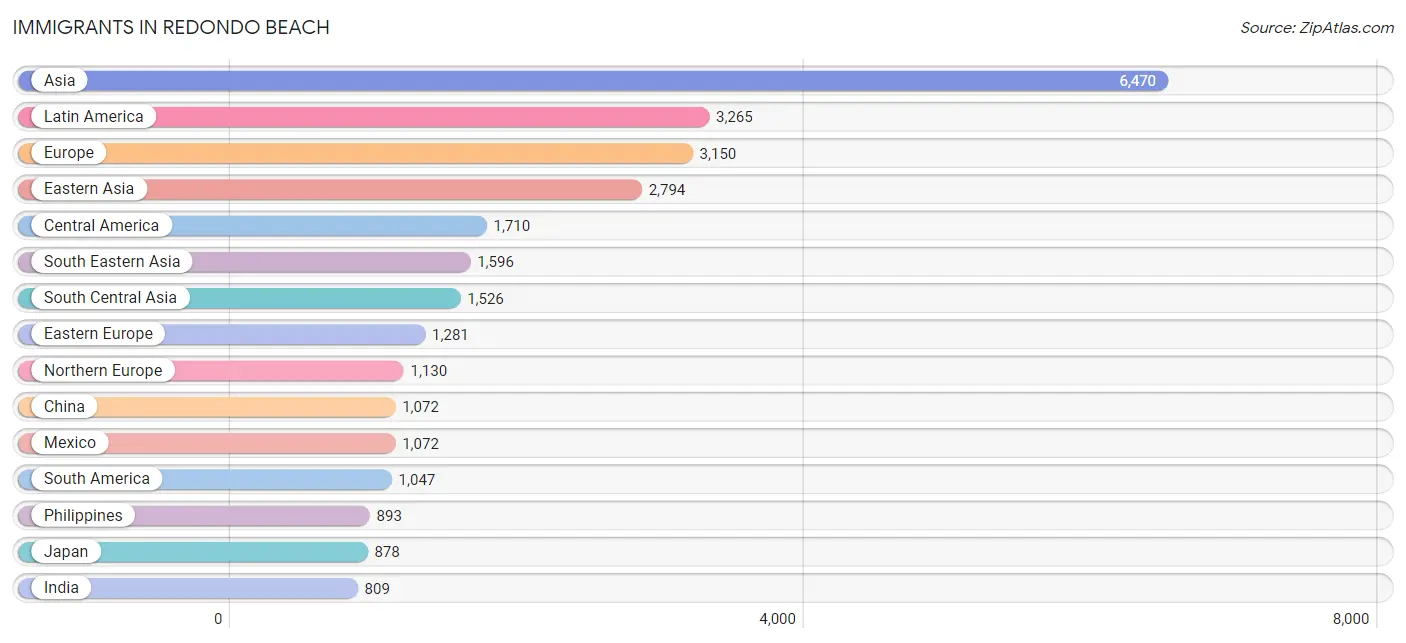
Immigrants in Redondo Beach
The most numerous immigrant groups reported in Redondo Beach came from Asia (6,470 | 9.2%), Latin America (3,265 | 4.6%), Europe (3,150 | 4.5%), Eastern Asia (2,794 | 4.0%), and Central America (1,710 | 2.4%), together accounting for 24.6% of all Redondo Beach residents.
| Immigration Origin | # Population | % Population |
| Afghanistan | 171 | 0.2% |
| Africa | 418 | 0.6% |
| Albania | 63 | 0.1% |
| Argentina | 400 | 0.6% |
| Armenia | 2 | 0.0% |
| Asia | 6,470 | 9.2% |
| Australia | 59 | 0.1% |
| Bangladesh | 17 | 0.0% |
| Belarus | 33 | 0.1% |
| Belgium | 10 | 0.0% |
| Belize | 50 | 0.1% |
| Bosnia and Herzegovina | 16 | 0.0% |
| Brazil | 300 | 0.4% |
| Bulgaria | 7 | 0.0% |
| Cambodia | 36 | 0.1% |
| Canada | 741 | 1.1% |
| Caribbean | 508 | 0.7% |
| Central America | 1,710 | 2.4% |
| Chile | 19 | 0.0% |
| China | 1,072 | 1.5% |
| Colombia | 74 | 0.1% |
| Costa Rica | 53 | 0.1% |
| Croatia | 73 | 0.1% |
| Cuba | 336 | 0.5% |
| Czechoslovakia | 50 | 0.1% |
| Eastern Africa | 144 | 0.2% |
| Eastern Asia | 2,794 | 4.0% |
| Eastern Europe | 1,281 | 1.8% |
| Ecuador | 25 | 0.0% |
| Egypt | 109 | 0.2% |
| El Salvador | 327 | 0.5% |
| England | 482 | 0.7% |
| Ethiopia | 48 | 0.1% |
| Europe | 3,150 | 4.5% |
| France | 171 | 0.2% |
| Germany | 243 | 0.3% |
| Greece | 90 | 0.1% |
| Guatemala | 148 | 0.2% |
| Haiti | 102 | 0.1% |
| Honduras | 9 | 0.0% |
| Hong Kong | 161 | 0.2% |
| Hungary | 123 | 0.2% |
| India | 809 | 1.1% |
| Indonesia | 122 | 0.2% |
| Iran | 402 | 0.6% |
| Iraq | 23 | 0.0% |
| Ireland | 92 | 0.1% |
| Israel | 118 | 0.2% |
| Italy | 141 | 0.2% |
| Jamaica | 32 | 0.1% |
| Japan | 878 | 1.2% |
| Jordan | 152 | 0.2% |
| Kenya | 23 | 0.0% |
| Korea | 753 | 1.1% |
| Kuwait | 16 | 0.0% |
| Laos | 35 | 0.1% |
| Latin America | 3,265 | 4.6% |
| Latvia | 10 | 0.0% |
| Lebanon | 104 | 0.2% |
| Lithuania | 176 | 0.3% |
| Malaysia | 66 | 0.1% |
| Mexico | 1,072 | 1.5% |
| Moldova | 15 | 0.0% |
| Morocco | 3 | 0.0% |
| Netherlands | 25 | 0.0% |
| Nicaragua | 51 | 0.1% |
| Nigeria | 59 | 0.1% |
| Northern Africa | 122 | 0.2% |
| Northern Europe | 1,130 | 1.6% |
| Oceania | 90 | 0.1% |
| Pakistan | 121 | 0.2% |
| Peru | 222 | 0.3% |
| Philippines | 893 | 1.3% |
| Poland | 27 | 0.0% |
| Romania | 44 | 0.1% |
| Russia | 362 | 0.5% |
| Scotland | 71 | 0.1% |
| Serbia | 13 | 0.0% |
| Singapore | 107 | 0.2% |
| South Africa | 93 | 0.1% |
| South America | 1,047 | 1.5% |
| South Central Asia | 1,526 | 2.2% |
| South Eastern Asia | 1,596 | 2.3% |
| Southern Europe | 249 | 0.4% |
| Spain | 18 | 0.0% |
| Sweden | 39 | 0.1% |
| Switzerland | 2 | 0.0% |
| Syria | 66 | 0.1% |
| Taiwan | 398 | 0.6% |
| Thailand | 29 | 0.0% |
| Trinidad and Tobago | 38 | 0.1% |
| Turkey | 38 | 0.1% |
| Ukraine | 212 | 0.3% |
| Uzbekistan | 6 | 0.0% |
| Venezuela | 7 | 0.0% |
| Vietnam | 239 | 0.3% |
| Western Africa | 59 | 0.1% |
| Western Asia | 538 | 0.8% |
| Western Europe | 451 | 0.6% | View All 99 Rows |
Sex and Age in Redondo Beach
Sex and Age in Redondo Beach
The most populous age groups in Redondo Beach are 45 to 49 Years (3,164 | 8.9%) for men and 40 to 44 Years (2,947 | 8.4%) for women.
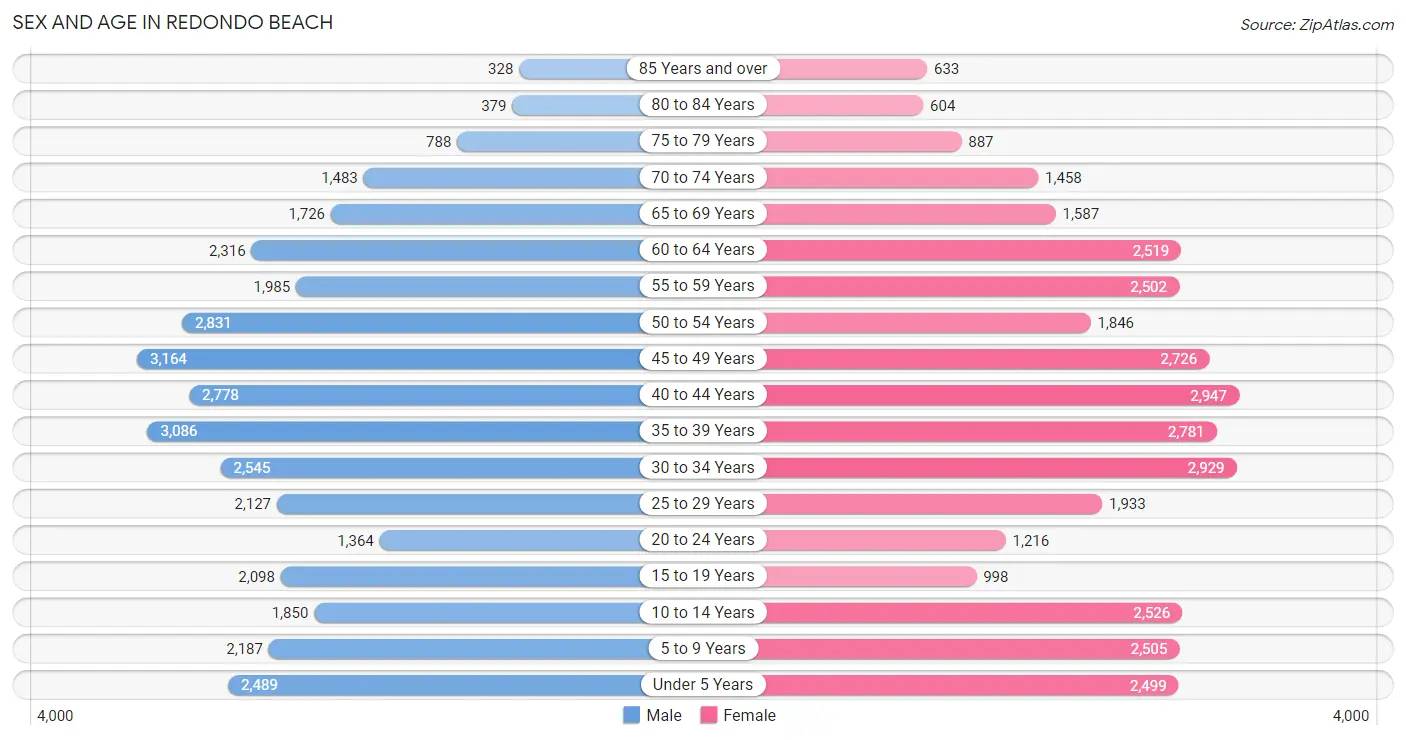
| Age Bracket | Male | Female |
| Under 5 Years | 2,489 (7.0%) | 2,499 (7.1%) |
| 5 to 9 Years | 2,187 (6.2%) | 2,505 (7.1%) |
| 10 to 14 Years | 1,850 (5.2%) | 2,526 (7.2%) |
| 15 to 19 Years | 2,098 (5.9%) | 998 (2.8%) |
| 20 to 24 Years | 1,364 (3.8%) | 1,216 (3.5%) |
| 25 to 29 Years | 2,127 (6.0%) | 1,933 (5.5%) |
| 30 to 34 Years | 2,545 (7.2%) | 2,929 (8.4%) |
| 35 to 39 Years | 3,086 (8.7%) | 2,781 (7.9%) |
| 40 to 44 Years | 2,778 (7.8%) | 2,947 (8.4%) |
| 45 to 49 Years | 3,164 (8.9%) | 2,726 (7.8%) |
| 50 to 54 Years | 2,831 (8.0%) | 1,846 (5.3%) |
| 55 to 59 Years | 1,985 (5.6%) | 2,502 (7.1%) |
| 60 to 64 Years | 2,316 (6.5%) | 2,519 (7.2%) |
| 65 to 69 Years | 1,726 (4.9%) | 1,587 (4.5%) |
| 70 to 74 Years | 1,483 (4.2%) | 1,458 (4.2%) |
| 75 to 79 Years | 788 (2.2%) | 887 (2.5%) |
| 80 to 84 Years | 379 (1.1%) | 604 (1.7%) |
| 85 Years and over | 328 (0.9%) | 633 (1.8%) |
| Total | 35,524 (100.0%) | 35,096 (100.0%) |
Families and Households in Redondo Beach
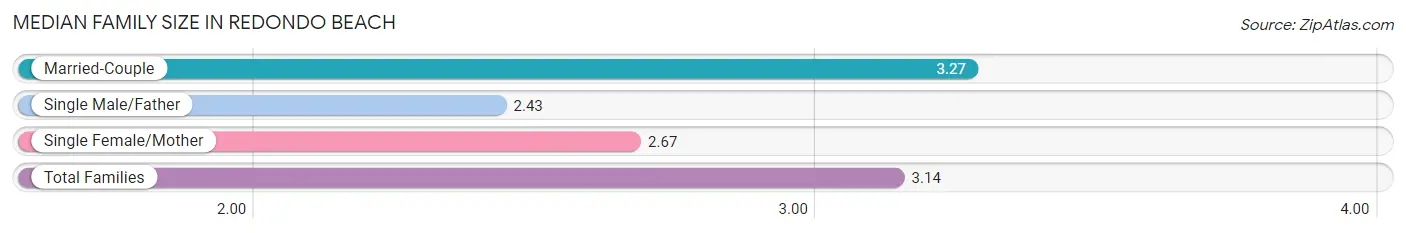
Median Family Size in Redondo Beach
The median family size in Redondo Beach is 3.14 persons per family, with married-couple families (13,622 | 80.6%) accounting for the largest median family size of 3.27 persons per family. On the other hand, single male/father families (962 | 5.7%) represent the smallest median family size with 2.43 persons per family.
| Family Type | # Families | Family Size |
| Married-Couple | 13,622 (80.6%) | 3.27 |
| Single Male/Father | 962 (5.7%) | 2.43 |
| Single Female/Mother | 2,326 (13.8%) | 2.67 |
| Total Families | 16,910 (100.0%) | 3.14 |
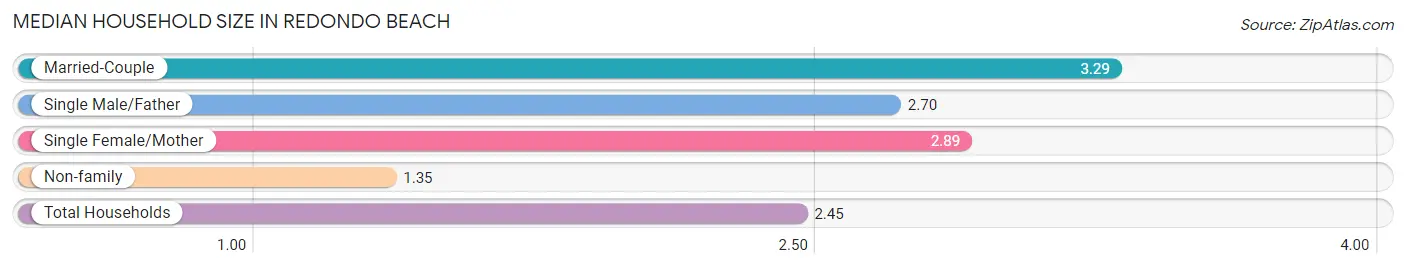
Median Household Size in Redondo Beach
The median household size in Redondo Beach is 2.45 persons per household, with married-couple households (13,622 | 47.7%) accounting for the largest median household size of 3.29 persons per household. non-family households (11,652 | 40.8%) represent the smallest median household size with 1.35 persons per household.
| Household Type | # Households | Household Size |
| Married-Couple | 13,622 (47.7%) | 3.29 |
| Single Male/Father | 962 (3.4%) | 2.70 |
| Single Female/Mother | 2,326 (8.1%) | 2.89 |
| Non-family | 11,652 (40.8%) | 1.35 |
| Total Households | 28,562 (100.0%) | 2.45 |
Household Size by Marriage Status in Redondo Beach
Out of a total of 28,562 households in Redondo Beach, 16,910 (59.2%) are family households, while 11,652 (40.8%) are nonfamily households. The most numerous type of family households are 2-person households, comprising 7,005, and the most common type of nonfamily households are 1-person households, comprising 8,412.
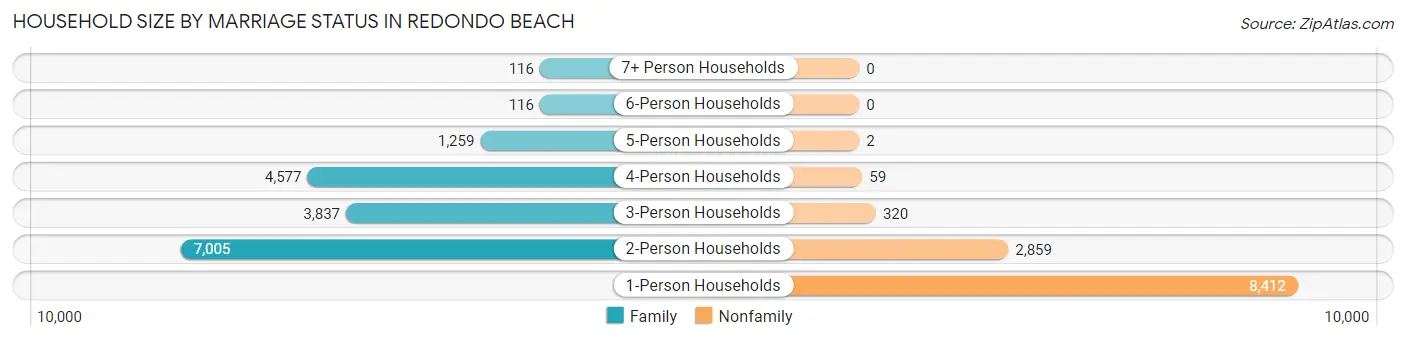
| Household Size | Family Households | Nonfamily Households |
| 1-Person Households | - | 8,412 (29.4%) |
| 2-Person Households | 7,005 (24.5%) | 2,859 (10.0%) |
| 3-Person Households | 3,837 (13.4%) | 320 (1.1%) |
| 4-Person Households | 4,577 (16.0%) | 59 (0.2%) |
| 5-Person Households | 1,259 (4.4%) | 2 (0.0%) |
| 6-Person Households | 116 (0.4%) | 0 (0.0%) |
| 7+ Person Households | 116 (0.4%) | 0 (0.0%) |
| Total | 16,910 (59.2%) | 11,652 (40.8%) |
Female Fertility in Redondo Beach
Fertility by Age in Redondo Beach
Average fertility rate in Redondo Beach is 49.0 births per 1,000 women. Women in the age bracket of 20 to 34 years have the highest fertility rate with 51.0 births per 1,000 women. Women in the age bracket of 35 to 50 years acount for 53.9% of all women with births.
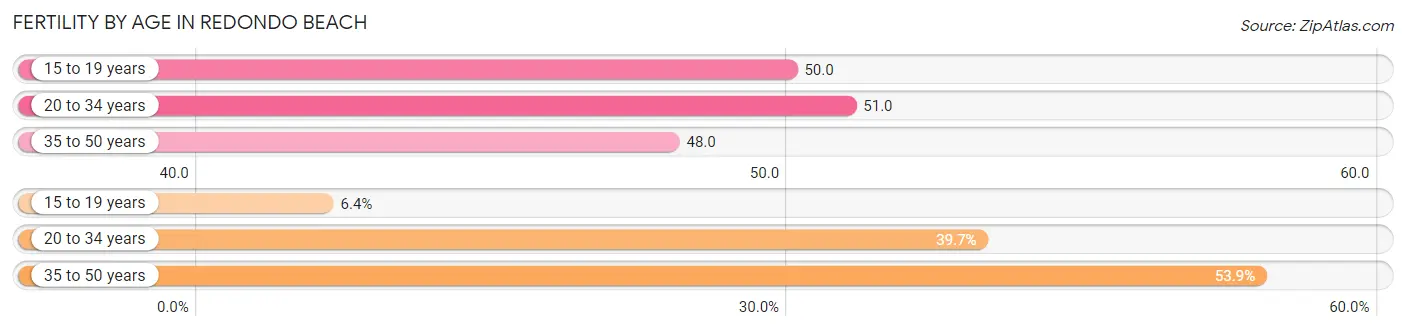
| Age Bracket | Women with Births | Births / 1,000 Women |
| 15 to 19 years | 50 (6.4%) | 50.0 |
| 20 to 34 years | 311 (39.7%) | 51.0 |
| 35 to 50 years | 422 (53.9%) | 48.0 |
| Total | 783 (100.0%) | 49.0 |
Fertility by Age by Marriage Status in Redondo Beach
91.4% of women with births (783) in Redondo Beach are married. The highest percentage of unmarried women with births falls into 20 to 34 years age bracket with 13.5% of them unmarried at the time of birth, while the lowest percentage of unmarried women with births belong to 15 to 19 years age bracket with 0.0% of them unmarried.
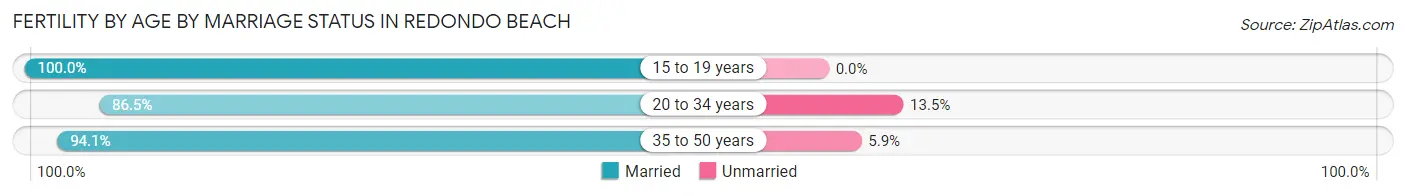
| Age Bracket | Married | Unmarried |
| 15 to 19 years | 50 (100.0%) | 0 (0.0%) |
| 20 to 34 years | 269 (86.5%) | 42 (13.5%) |
| 35 to 50 years | 397 (94.1%) | 25 (5.9%) |
| Total | 716 (91.4%) | 67 (8.6%) |
Fertility by Education in Redondo Beach
Average fertility rate in Redondo Beach is 49.0 births per 1,000 women. Women with the education attainment of graduate degree have the highest fertility rate of 65.0 births per 1,000 women, while women with the education attainment of less than high school have the lowest fertility at 3.0 births per 1,000 women. Women with the education attainment of bachelor's degree represent 45.5% of all women with births.
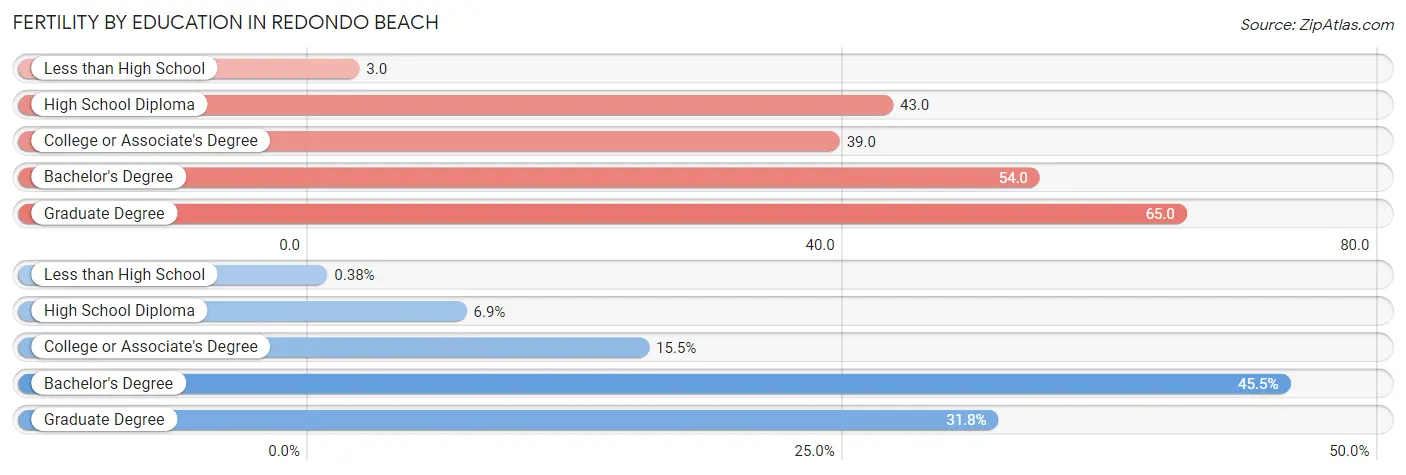
| Educational Attainment | Women with Births | Births / 1,000 Women |
| Less than High School | 3 (0.4%) | 3.0 |
| High School Diploma | 54 (6.9%) | 43.0 |
| College or Associate's Degree | 121 (15.4%) | 39.0 |
| Bachelor's Degree | 356 (45.5%) | 54.0 |
| Graduate Degree | 249 (31.8%) | 65.0 |
| Total | 783 (100.0%) | 49.0 |
Fertility by Education by Marriage Status in Redondo Beach
8.6% of women with births in Redondo Beach are unmarried. Women with the educational attainment of graduate degree are most likely to be married with 100.0% of them married at childbirth, while women with the educational attainment of less than high school are least likely to be married with 100.0% of them unmarried at childbirth.
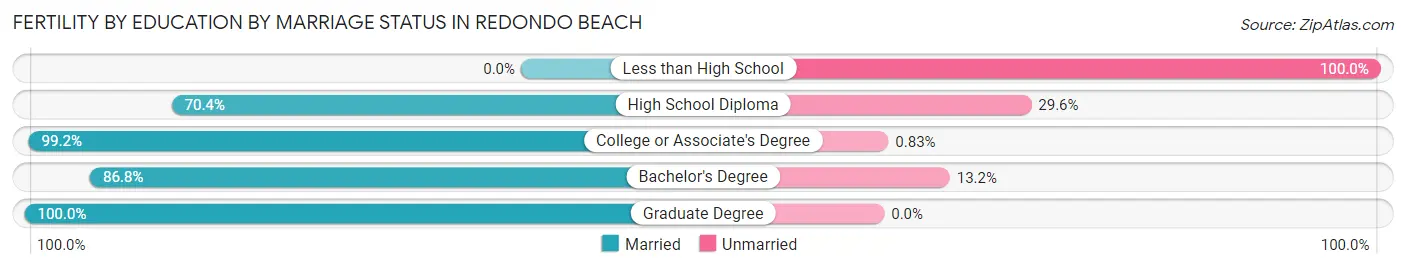
| Educational Attainment | Married | Unmarried |
| Less than High School | 0 (0.0%) | 3 (100.0%) |
| High School Diploma | 38 (70.4%) | 16 (29.6%) |
| College or Associate's Degree | 120 (99.2%) | 1 (0.8%) |
| Bachelor's Degree | 309 (86.8%) | 47 (13.2%) |
| Graduate Degree | 249 (100.0%) | 0 (0.0%) |
| Total | 716 (91.4%) | 67 (8.6%) |
Employment Characteristics in Redondo Beach
Employment by Class of Employer in Redondo Beach
Among the 37,350 employed individuals in Redondo Beach, private company employees (24,869 | 66.6%), self-employed (not incorporated) (3,147 | 8.4%), and not-for-profit organizations (3,046 | 8.2%) make up the most common classes of employment.
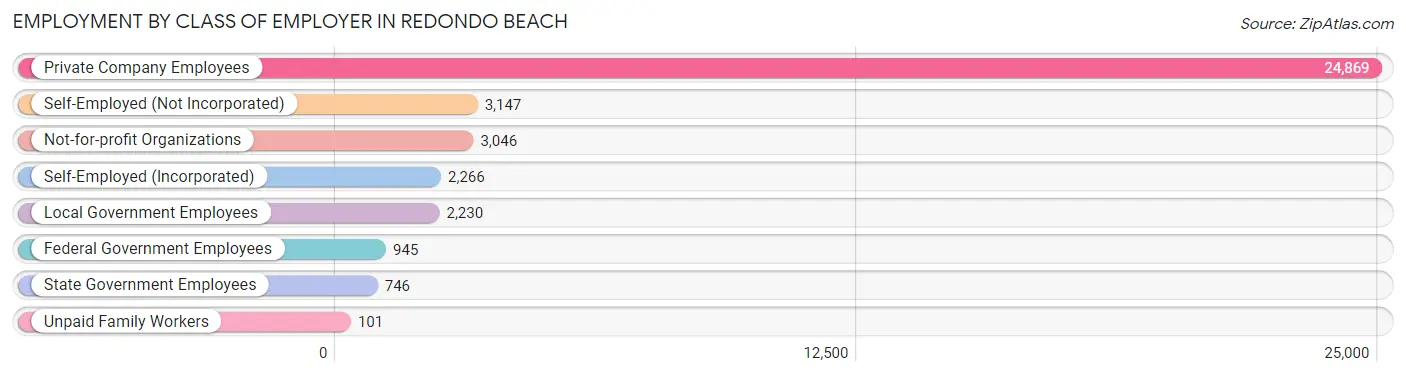
| Employer Class | # Employees | % Employees |
| Private Company Employees | 24,869 | 66.6% |
| Self-Employed (Incorporated) | 2,266 | 6.1% |
| Self-Employed (Not Incorporated) | 3,147 | 8.4% |
| Not-for-profit Organizations | 3,046 | 8.2% |
| Local Government Employees | 2,230 | 6.0% |
| State Government Employees | 746 | 2.0% |
| Federal Government Employees | 945 | 2.5% |
| Unpaid Family Workers | 101 | 0.3% |
| Total | 37,350 | 100.0% |
Employment Status by Age in Redondo Beach
According to the labor force statistics for Redondo Beach, out of the total population over 16 years of age (55,902), 72.3% or 40,417 individuals are in the labor force, with 5.0% or 2,021 of them unemployed. The age group with the highest labor force participation rate is 30 to 34 years, with 94.1% or 5,151 individuals in the labor force. Within the labor force, the 16 to 19 years age range has the highest percentage of unemployed individuals, with 26.4% or 150 of them being unemployed.
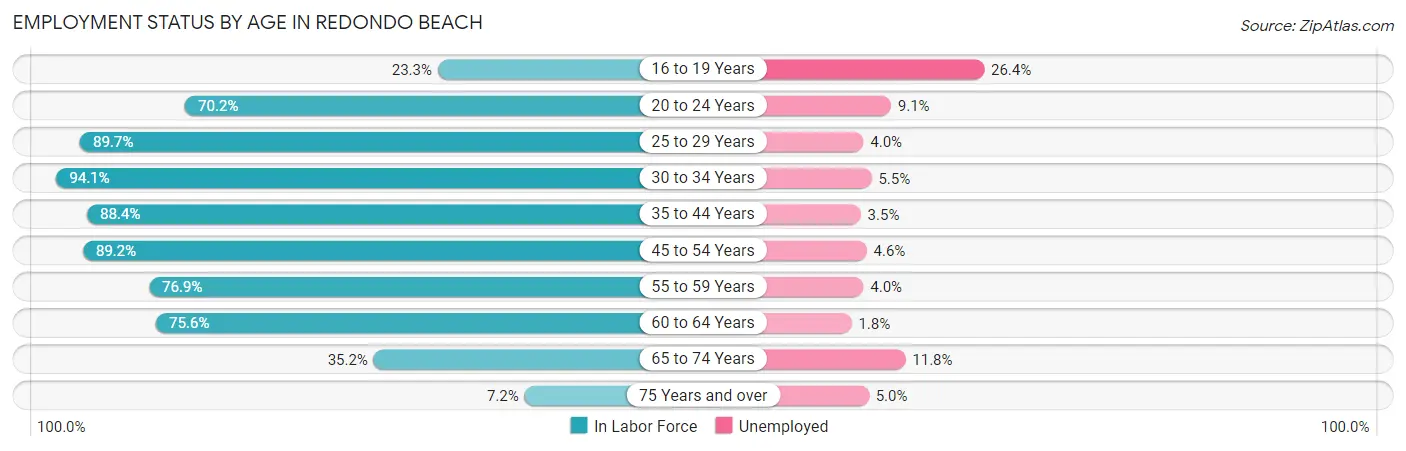
| Age Bracket | In Labor Force | Unemployed |
| 16 to 19 Years | 567 (23.3%) | 150 (26.4%) |
| 20 to 24 Years | 1,811 (70.2%) | 165 (9.1%) |
| 25 to 29 Years | 3,642 (89.7%) | 146 (4.0%) |
| 30 to 34 Years | 5,151 (94.1%) | 283 (5.5%) |
| 35 to 44 Years | 10,247 (88.4%) | 359 (3.5%) |
| 45 to 54 Years | 9,426 (89.2%) | 434 (4.6%) |
| 55 to 59 Years | 3,451 (76.9%) | 138 (4.0%) |
| 60 to 64 Years | 3,655 (75.6%) | 66 (1.8%) |
| 65 to 74 Years | 2,201 (35.2%) | 260 (11.8%) |
| 75 Years and over | 261 (7.2%) | 13 (5.0%) |
| Total | 40,417 (72.3%) | 2,021 (5.0%) |
Employment Status by Educational Attainment in Redondo Beach
According to labor force statistics for Redondo Beach, 86.7% of individuals (35,560) out of the total population between 25 and 64 years of age (41,015) are in the labor force, with 4.0% or 1,422 of them being unemployed. The group with the highest labor force participation rate are those with the educational attainment of bachelor's degree or higher, with 90.4% or 25,270 individuals in the labor force. Within the labor force, individuals with high school diploma education have the highest percentage of unemployment, with 6.7% or 196 of them being unemployed.
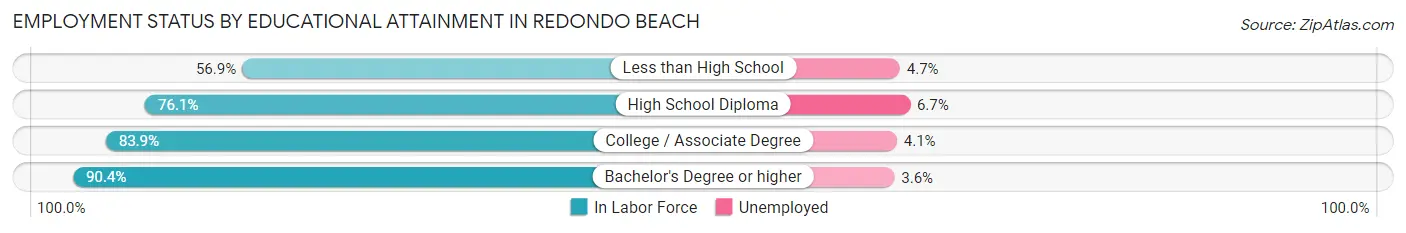
| Educational Attainment | In Labor Force | Unemployed |
| Less than High School | 764 (56.9%) | 63 (4.7%) |
| High School Diploma | 2,925 (76.1%) | 257 (6.7%) |
| College / Associate Degree | 6,607 (83.9%) | 323 (4.1%) |
| Bachelor's Degree or higher | 25,270 (90.4%) | 1,006 (3.6%) |
| Total | 35,560 (86.7%) | 1,641 (4.0%) |
Employment Occupations by Sex in Redondo Beach
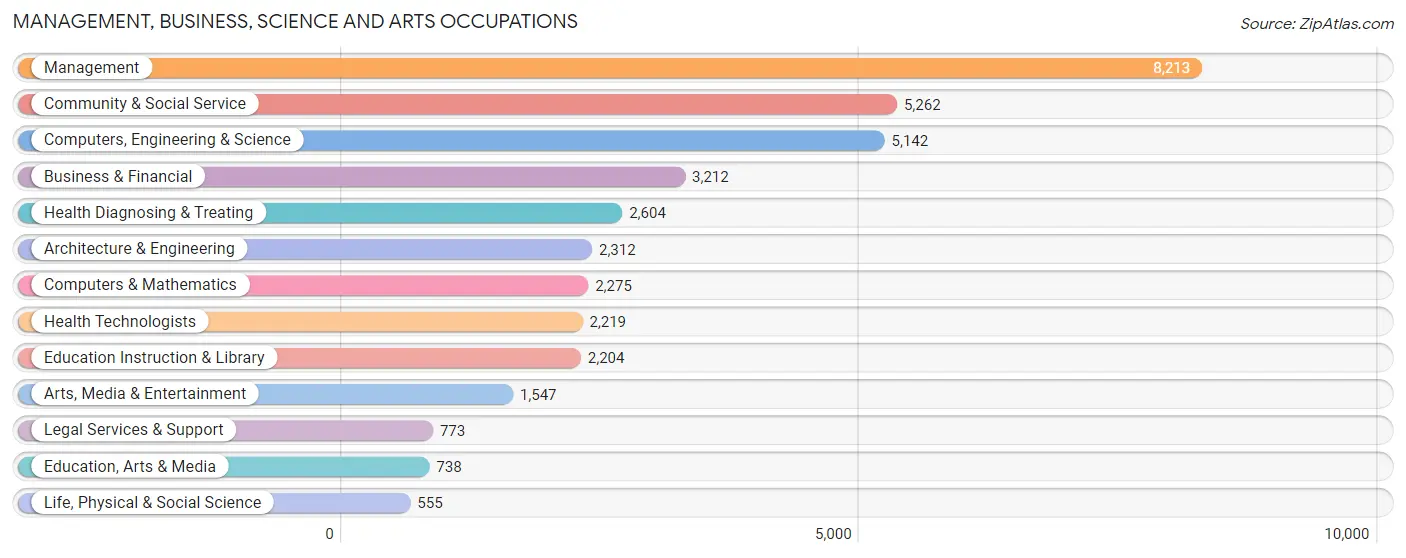
Management, Business, Science and Arts Occupations
The most common Management, Business, Science and Arts occupations in Redondo Beach are Management (8,213 | 21.5%), Community & Social Service (5,262 | 13.8%), Computers, Engineering & Science (5,142 | 13.5%), Business & Financial (3,212 | 8.4%), and Health Diagnosing & Treating (2,604 | 6.8%).
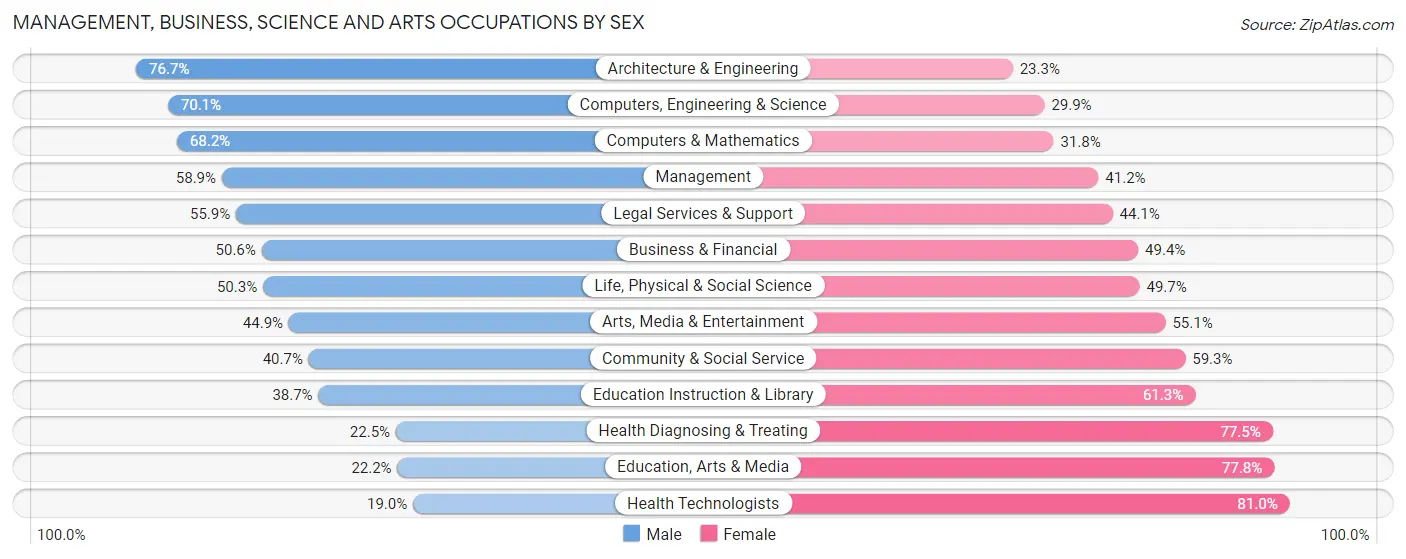
Management, Business, Science and Arts Occupations by Sex
Within the Management, Business, Science and Arts occupations in Redondo Beach, the most male-oriented occupations are Architecture & Engineering (76.7%), Computers, Engineering & Science (70.1%), and Computers & Mathematics (68.2%), while the most female-oriented occupations are Health Technologists (81.0%), Education, Arts & Media (77.8%), and Health Diagnosing & Treating (77.5%).
| Occupation | Male | Female |
| Management | 4,833 (58.9%) | 3,380 (41.1%) |
| Business & Financial | 1,624 (50.6%) | 1,588 (49.4%) |
| Computers, Engineering & Science | 3,605 (70.1%) | 1,537 (29.9%) |
| Computers & Mathematics | 1,552 (68.2%) | 723 (31.8%) |
| Architecture & Engineering | 1,774 (76.7%) | 538 (23.3%) |
| Life, Physical & Social Science | 279 (50.3%) | 276 (49.7%) |
| Community & Social Service | 2,143 (40.7%) | 3,119 (59.3%) |
| Education, Arts & Media | 164 (22.2%) | 574 (77.8%) |
| Legal Services & Support | 432 (55.9%) | 341 (44.1%) |
| Education Instruction & Library | 853 (38.7%) | 1,351 (61.3%) |
| Arts, Media & Entertainment | 694 (44.9%) | 853 (55.1%) |
| Health Diagnosing & Treating | 587 (22.5%) | 2,017 (77.5%) |
| Health Technologists | 421 (19.0%) | 1,798 (81.0%) |
| Total (Category) | 12,792 (52.4%) | 11,641 (47.6%) |
| Total (Overall) | 20,584 (53.9%) | 17,623 (46.1%) |
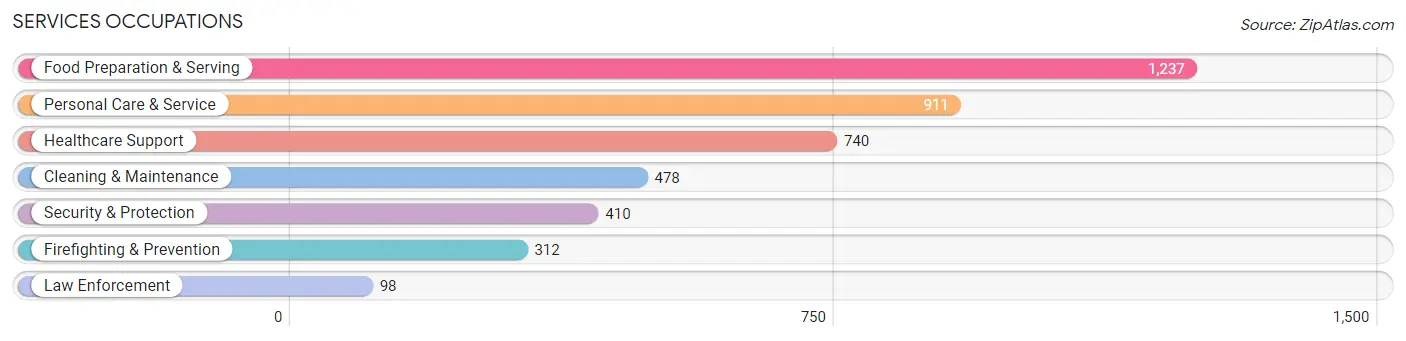
Services Occupations
The most common Services occupations in Redondo Beach are Food Preparation & Serving (1,237 | 3.2%), Personal Care & Service (911 | 2.4%), Healthcare Support (740 | 1.9%), Cleaning & Maintenance (478 | 1.3%), and Security & Protection (410 | 1.1%).
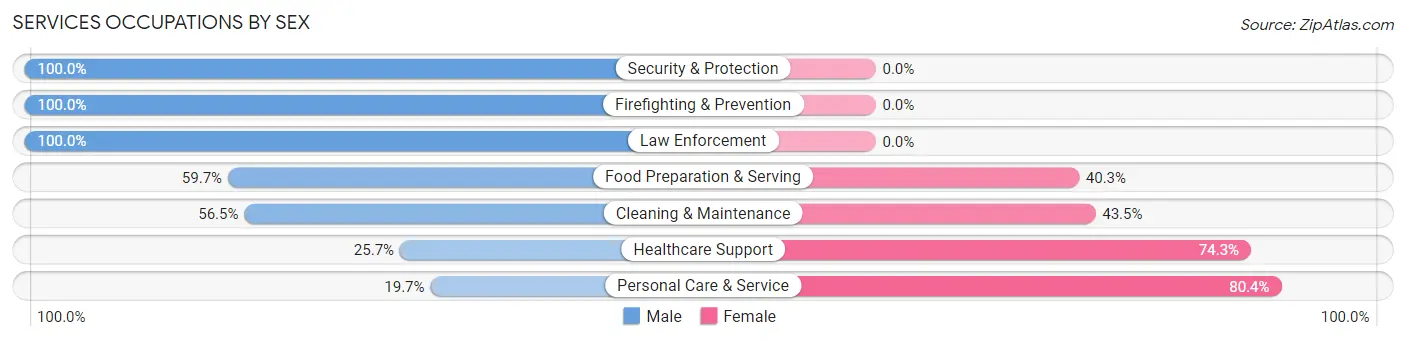
Services Occupations by Sex
Within the Services occupations in Redondo Beach, the most male-oriented occupations are Security & Protection (100.0%), Firefighting & Prevention (100.0%), and Law Enforcement (100.0%), while the most female-oriented occupations are Personal Care & Service (80.3%), Healthcare Support (74.3%), and Cleaning & Maintenance (43.5%).
| Occupation | Male | Female |
| Healthcare Support | 190 (25.7%) | 550 (74.3%) |
| Security & Protection | 410 (100.0%) | 0 (0.0%) |
| Firefighting & Prevention | 312 (100.0%) | 0 (0.0%) |
| Law Enforcement | 98 (100.0%) | 0 (0.0%) |
| Food Preparation & Serving | 739 (59.7%) | 498 (40.3%) |
| Cleaning & Maintenance | 270 (56.5%) | 208 (43.5%) |
| Personal Care & Service | 179 (19.7%) | 732 (80.3%) |
| Total (Category) | 1,788 (47.3%) | 1,988 (52.6%) |
| Total (Overall) | 20,584 (53.9%) | 17,623 (46.1%) |
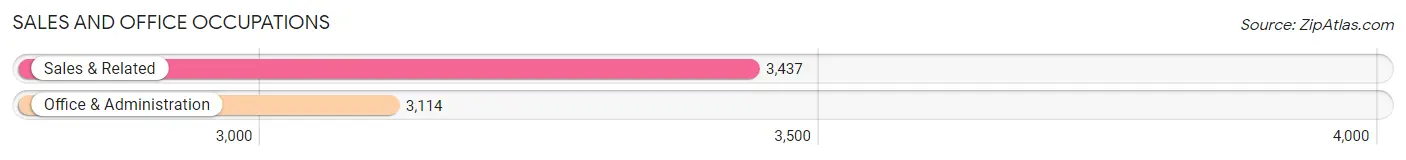
Sales and Office Occupations
The most common Sales and Office occupations in Redondo Beach are Sales & Related (3,437 | 9.0%), and Office & Administration (3,114 | 8.2%).
Sales and Office Occupations by Sex
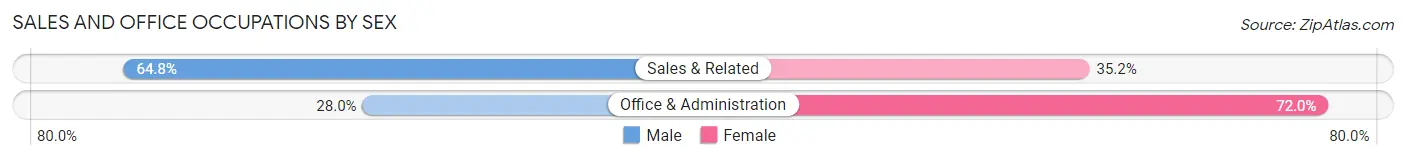
| Occupation | Male | Female |
| Sales & Related | 2,226 (64.8%) | 1,211 (35.2%) |
| Office & Administration | 873 (28.0%) | 2,241 (72.0%) |
| Total (Category) | 3,099 (47.3%) | 3,452 (52.7%) |
| Total (Overall) | 20,584 (53.9%) | 17,623 (46.1%) |
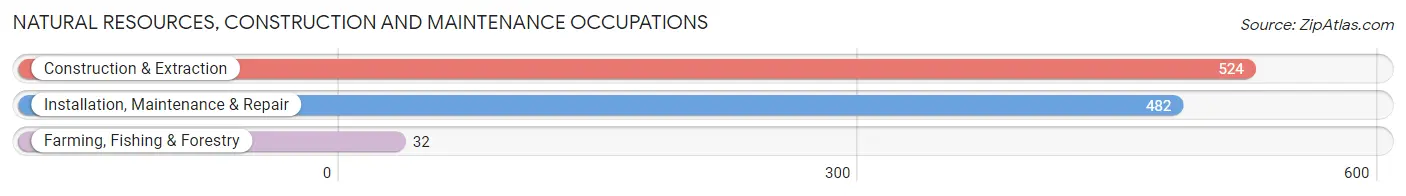
Natural Resources, Construction and Maintenance Occupations
The most common Natural Resources, Construction and Maintenance occupations in Redondo Beach are Construction & Extraction (524 | 1.4%), Installation, Maintenance & Repair (482 | 1.3%), and Farming, Fishing & Forestry (32 | 0.1%).
Natural Resources, Construction and Maintenance Occupations by Sex
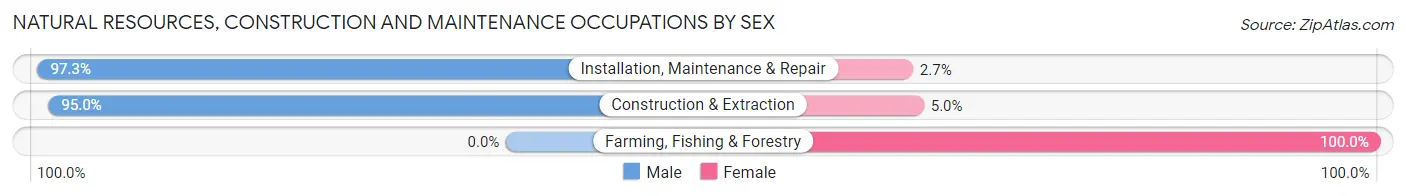
| Occupation | Male | Female |
| Farming, Fishing & Forestry | 0 (0.0%) | 32 (100.0%) |
| Construction & Extraction | 498 (95.0%) | 26 (5.0%) |
| Installation, Maintenance & Repair | 469 (97.3%) | 13 (2.7%) |
| Total (Category) | 967 (93.2%) | 71 (6.8%) |
| Total (Overall) | 20,584 (53.9%) | 17,623 (46.1%) |
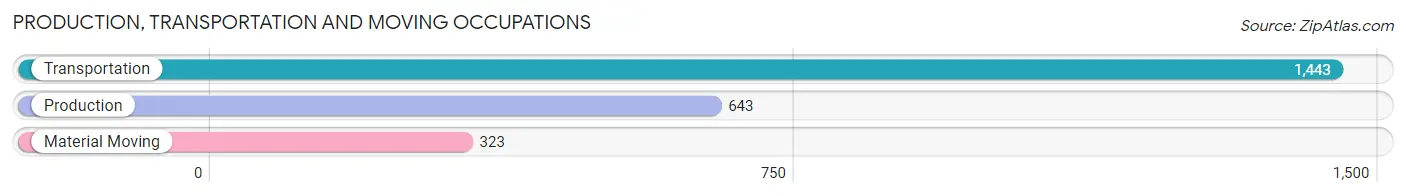
Production, Transportation and Moving Occupations
The most common Production, Transportation and Moving occupations in Redondo Beach are Transportation (1,443 | 3.8%), Production (643 | 1.7%), and Material Moving (323 | 0.9%).
Production, Transportation and Moving Occupations by Sex
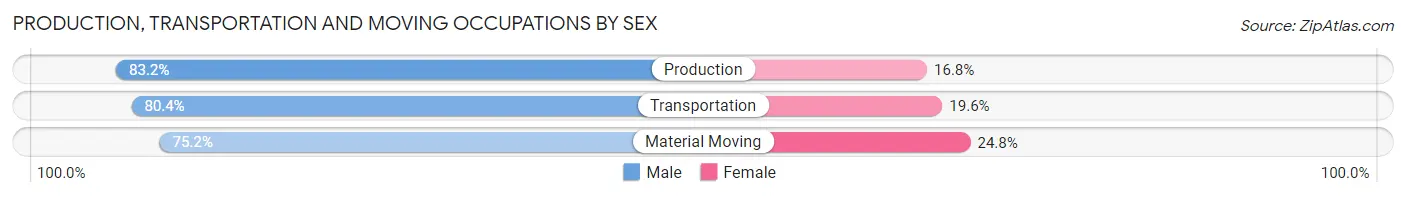
| Occupation | Male | Female |
| Production | 535 (83.2%) | 108 (16.8%) |
| Transportation | 1,160 (80.4%) | 283 (19.6%) |
| Material Moving | 243 (75.2%) | 80 (24.8%) |
| Total (Category) | 1,938 (80.4%) | 471 (19.6%) |
| Total (Overall) | 20,584 (53.9%) | 17,623 (46.1%) |
Employment Industries by Sex in Redondo Beach
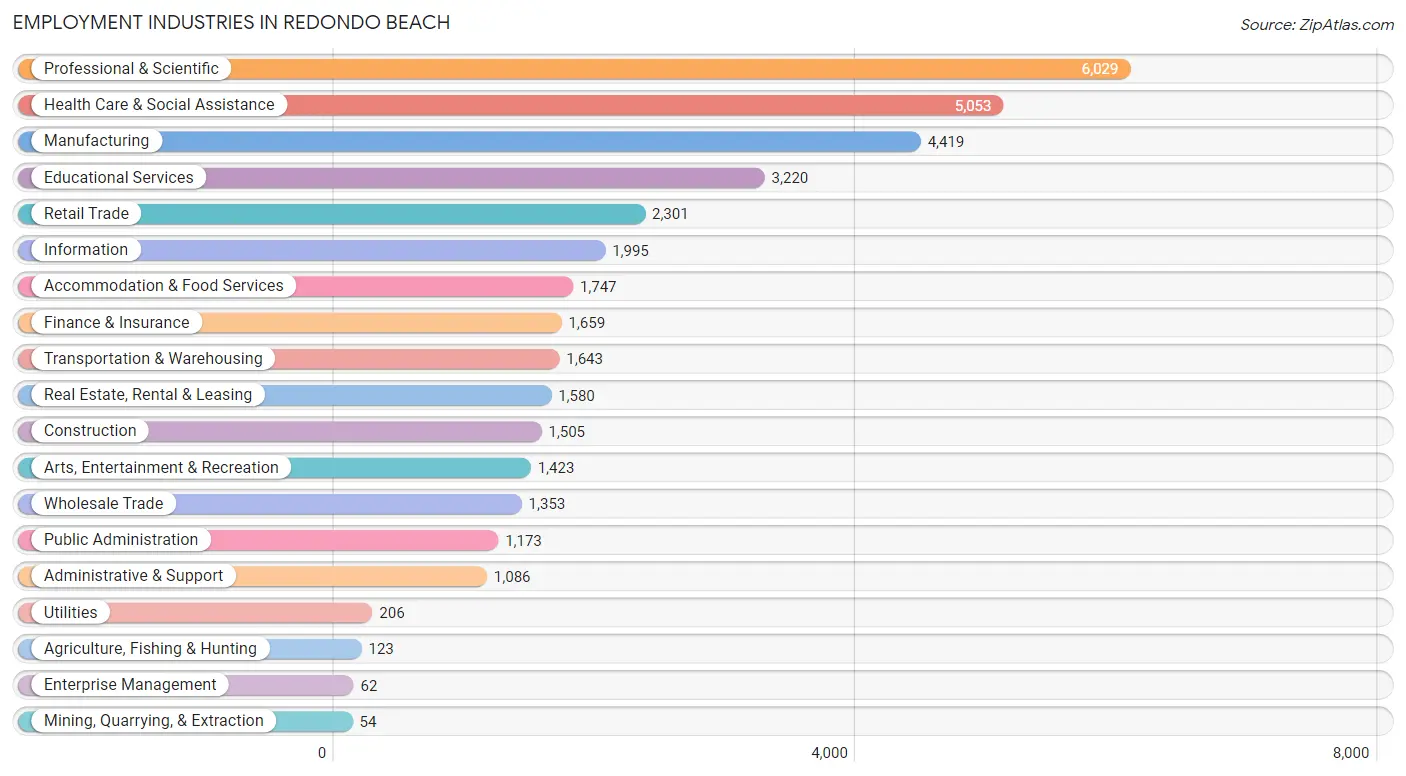
Employment Industries in Redondo Beach
The major employment industries in Redondo Beach include Professional & Scientific (6,029 | 15.8%), Health Care & Social Assistance (5,053 | 13.2%), Manufacturing (4,419 | 11.6%), Educational Services (3,220 | 8.4%), and Retail Trade (2,301 | 6.0%).
Employment Industries by Sex in Redondo Beach
The Redondo Beach industries that see more men than women are Mining, Quarrying, & Extraction (100.0%), Construction (90.6%), and Utilities (87.9%), whereas the industries that tend to have a higher number of women are Health Care & Social Assistance (76.2%), Enterprise Management (74.2%), and Educational Services (64.9%).
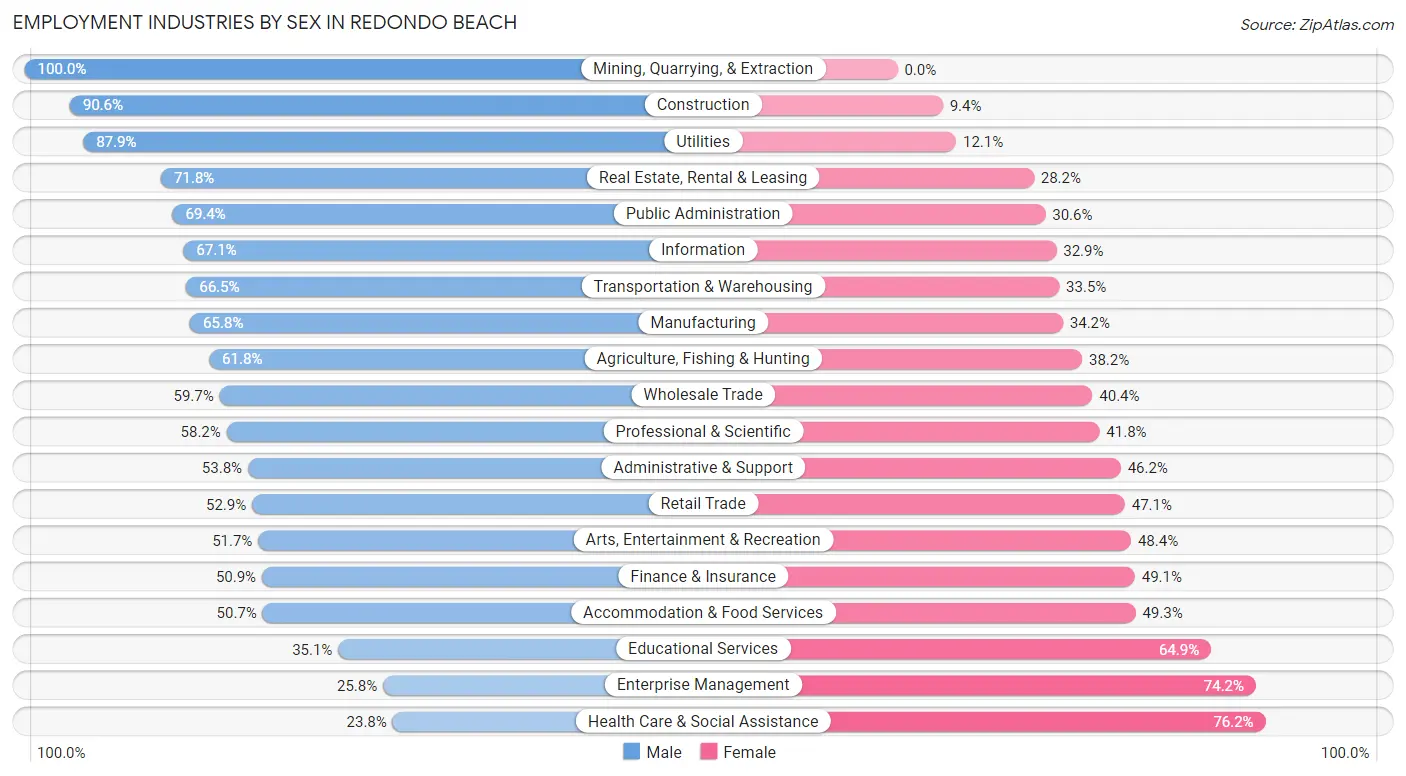
| Industry | Male | Female |
| Agriculture, Fishing & Hunting | 76 (61.8%) | 47 (38.2%) |
| Mining, Quarrying, & Extraction | 54 (100.0%) | 0 (0.0%) |
| Construction | 1,364 (90.6%) | 141 (9.4%) |
| Manufacturing | 2,906 (65.8%) | 1,513 (34.2%) |
| Wholesale Trade | 807 (59.7%) | 546 (40.4%) |
| Retail Trade | 1,218 (52.9%) | 1,083 (47.1%) |
| Transportation & Warehousing | 1,093 (66.5%) | 550 (33.5%) |
| Utilities | 181 (87.9%) | 25 (12.1%) |
| Information | 1,339 (67.1%) | 656 (32.9%) |
| Finance & Insurance | 844 (50.9%) | 815 (49.1%) |
| Real Estate, Rental & Leasing | 1,134 (71.8%) | 446 (28.2%) |
| Professional & Scientific | 3,508 (58.2%) | 2,521 (41.8%) |
| Enterprise Management | 16 (25.8%) | 46 (74.2%) |
| Administrative & Support | 584 (53.8%) | 502 (46.2%) |
| Educational Services | 1,130 (35.1%) | 2,090 (64.9%) |
| Health Care & Social Assistance | 1,204 (23.8%) | 3,849 (76.2%) |
| Arts, Entertainment & Recreation | 735 (51.6%) | 688 (48.3%) |
| Accommodation & Food Services | 886 (50.7%) | 861 (49.3%) |
| Public Administration | 814 (69.4%) | 359 (30.6%) |
| Total | 20,584 (53.9%) | 17,623 (46.1%) |
Education in Redondo Beach
School Enrollment in Redondo Beach
The most common levels of schooling among the 16,090 students in Redondo Beach are elementary school (3,498 | 21.7%), middle school (3,299 | 20.5%), and high school (2,889 | 18.0%).
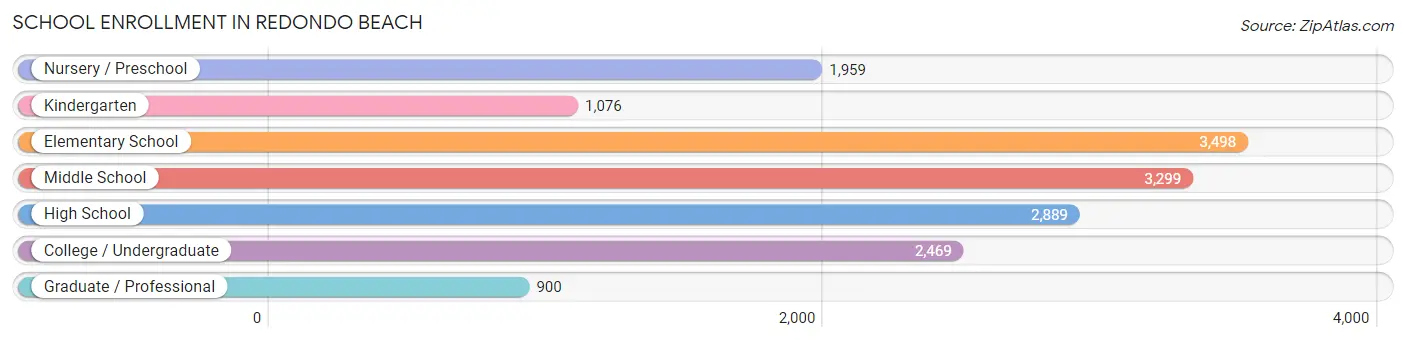
| School Level | # Students | % Students |
| Nursery / Preschool | 1,959 | 12.2% |
| Kindergarten | 1,076 | 6.7% |
| Elementary School | 3,498 | 21.7% |
| Middle School | 3,299 | 20.5% |
| High School | 2,889 | 18.0% |
| College / Undergraduate | 2,469 | 15.3% |
| Graduate / Professional | 900 | 5.6% |
| Total | 16,090 | 100.0% |
School Enrollment by Age by Funding Source in Redondo Beach
Out of a total of 16,090 students who are enrolled in schools in Redondo Beach, 3,685 (22.9%) attend a private institution, while the remaining 12,405 (77.1%) are enrolled in public schools. The age group of 3 to 4 year olds has the highest likelihood of being enrolled in private schools, with 1,274 (83.2% in the age bracket) enrolled. Conversely, the age group of 15 to 17 year olds has the lowest likelihood of being enrolled in a private school, with 1,913 (89.5% in the age bracket) attending a public institution.
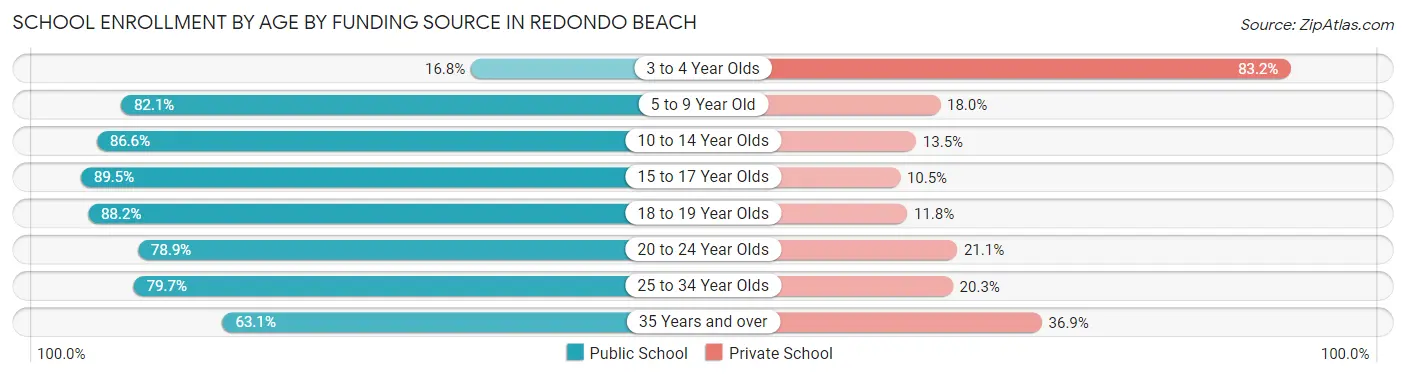
| Age Bracket | Public School | Private School |
| 3 to 4 Year Olds | 258 (16.8%) | 1,274 (83.2%) |
| 5 to 9 Year Old | 3,731 (82.1%) | 816 (17.9%) |
| 10 to 14 Year Olds | 3,713 (86.6%) | 577 (13.5%) |
| 15 to 17 Year Olds | 1,913 (89.5%) | 224 (10.5%) |
| 18 to 19 Year Olds | 747 (88.2%) | 100 (11.8%) |
| 20 to 24 Year Olds | 837 (78.9%) | 224 (21.1%) |
| 25 to 34 Year Olds | 683 (79.7%) | 174 (20.3%) |
| 35 Years and over | 517 (63.1%) | 302 (36.9%) |
| Total | 12,405 (77.1%) | 3,685 (22.9%) |
Educational Attainment by Field of Study in Redondo Beach
Business (7,107 | 20.0%), engineering (4,559 | 12.8%), social sciences (3,800 | 10.7%), visual & performing arts (2,725 | 7.7%), and communications (2,225 | 6.2%) are the most common fields of study among 35,578 individuals in Redondo Beach who have obtained a bachelor's degree or higher.
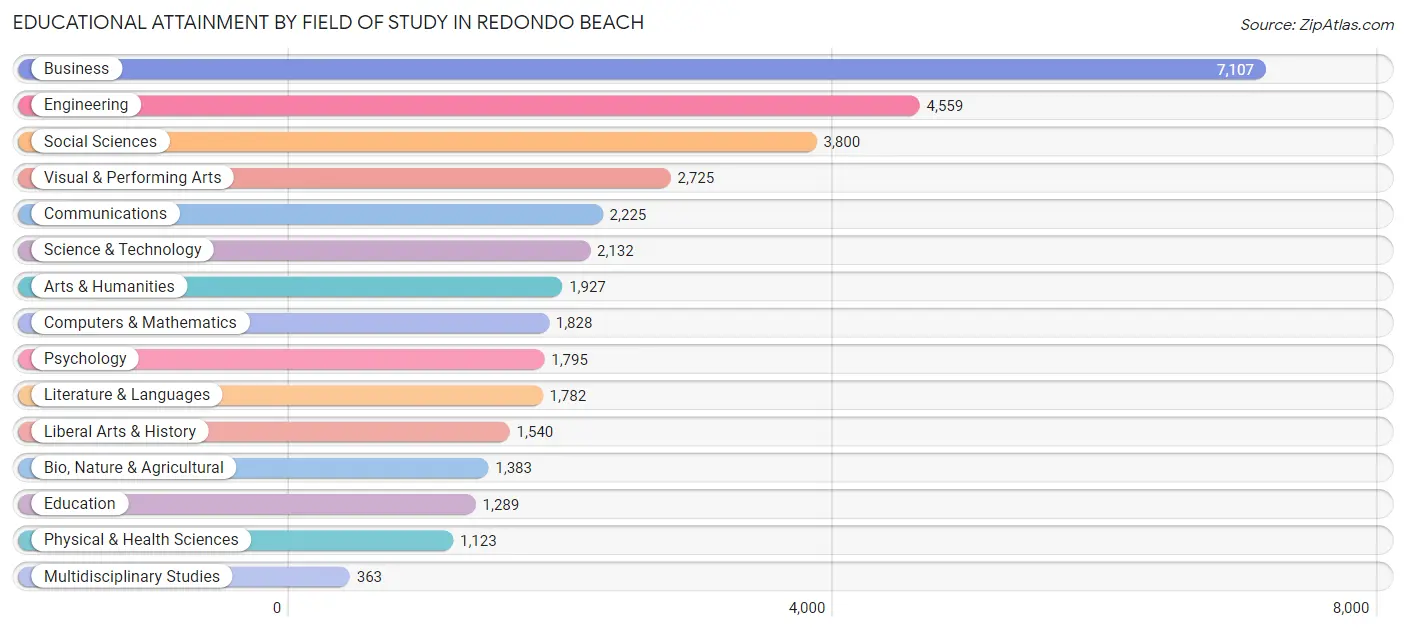
| Field of Study | # Graduates | % Graduates |
| Computers & Mathematics | 1,828 | 5.1% |
| Bio, Nature & Agricultural | 1,383 | 3.9% |
| Physical & Health Sciences | 1,123 | 3.2% |
| Psychology | 1,795 | 5.1% |
| Social Sciences | 3,800 | 10.7% |
| Engineering | 4,559 | 12.8% |
| Multidisciplinary Studies | 363 | 1.0% |
| Science & Technology | 2,132 | 6.0% |
| Business | 7,107 | 20.0% |
| Education | 1,289 | 3.6% |
| Literature & Languages | 1,782 | 5.0% |
| Liberal Arts & History | 1,540 | 4.3% |
| Visual & Performing Arts | 2,725 | 7.7% |
| Communications | 2,225 | 6.2% |
| Arts & Humanities | 1,927 | 5.4% |
| Total | 35,578 | 100.0% |
Transportation & Commute in Redondo Beach
Vehicle Availability by Sex in Redondo Beach
The most prevalent vehicle ownership categories in Redondo Beach are males with 2 vehicles (11,260, accounting for 55.4%) and females with 2 vehicles (9,706, making up 66.2%).
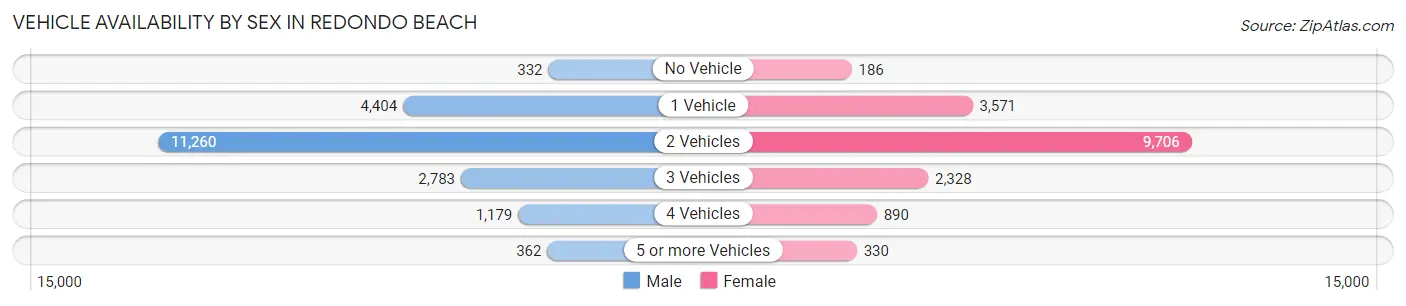
| Vehicles Available | Male | Female |
| No Vehicle | 332 (1.6%) | 186 (1.1%) |
| 1 Vehicle | 4,404 (21.7%) | 3,571 (21.0%) |
| 2 Vehicles | 11,260 (55.4%) | 9,706 (57.1%) |
| 3 Vehicles | 2,783 (13.7%) | 2,328 (13.7%) |
| 4 Vehicles | 1,179 (5.8%) | 890 (5.2%) |
| 5 or more Vehicles | 362 (1.8%) | 330 (1.9%) |
| Total | 20,320 (100.0%) | 17,011 (100.0%) |
Commute Time in Redondo Beach
The most frequently occuring commute durations in Redondo Beach are 15 to 19 minutes (5,995 commuters, 21.0%), 20 to 24 minutes (3,875 commuters, 13.6%), and 10 to 14 minutes (3,516 commuters, 12.3%).
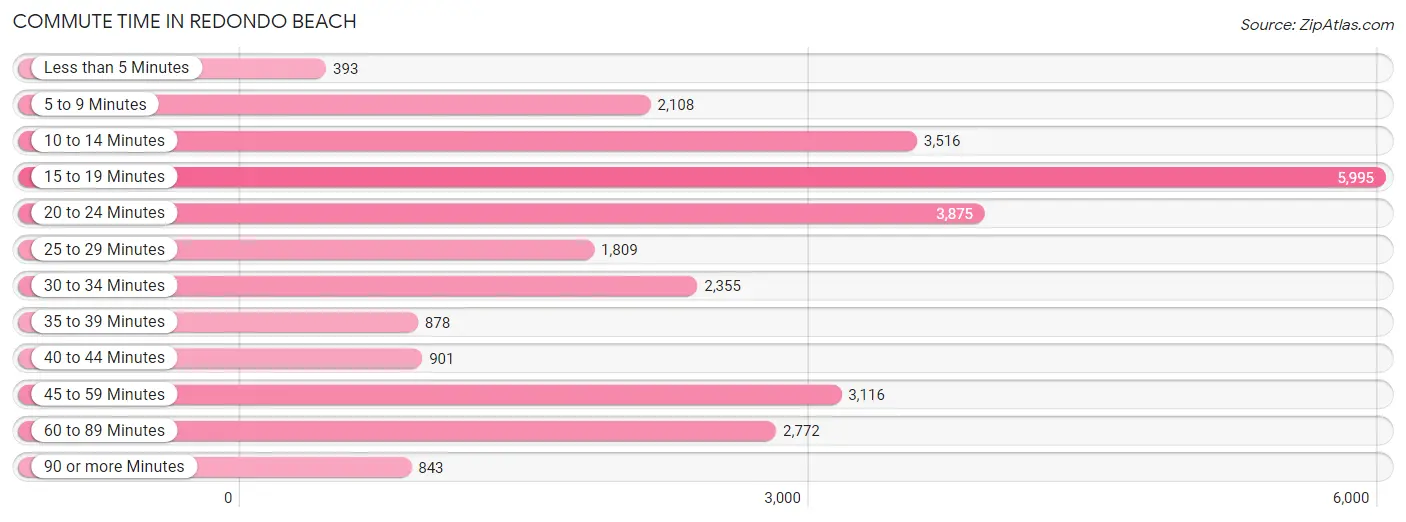
| Commute Time | # Commuters | % Commuters |
| Less than 5 Minutes | 393 | 1.4% |
| 5 to 9 Minutes | 2,108 | 7.4% |
| 10 to 14 Minutes | 3,516 | 12.3% |
| 15 to 19 Minutes | 5,995 | 21.0% |
| 20 to 24 Minutes | 3,875 | 13.6% |
| 25 to 29 Minutes | 1,809 | 6.3% |
| 30 to 34 Minutes | 2,355 | 8.3% |
| 35 to 39 Minutes | 878 | 3.1% |
| 40 to 44 Minutes | 901 | 3.2% |
| 45 to 59 Minutes | 3,116 | 10.9% |
| 60 to 89 Minutes | 2,772 | 9.7% |
| 90 or more Minutes | 843 | 2.9% |
Commute Time by Sex in Redondo Beach
The most common commute times in Redondo Beach are 15 to 19 minutes (3,282 commuters, 20.7%) for males and 15 to 19 minutes (2,713 commuters, 21.4%) for females.
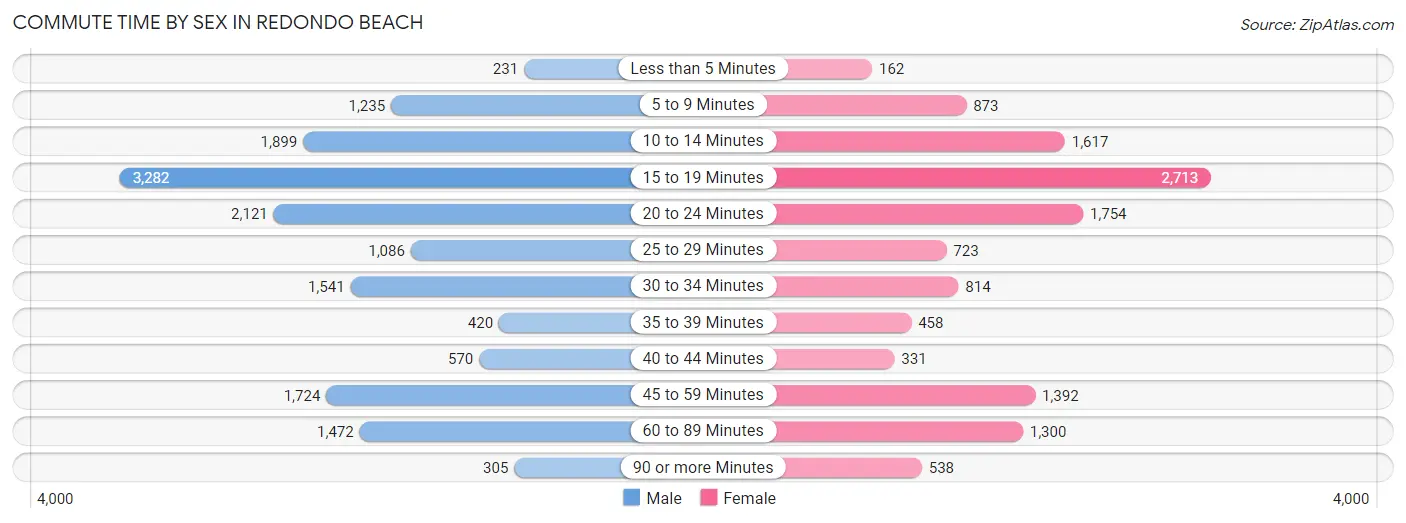
| Commute Time | Male | Female |
| Less than 5 Minutes | 231 (1.5%) | 162 (1.3%) |
| 5 to 9 Minutes | 1,235 (7.8%) | 873 (6.9%) |
| 10 to 14 Minutes | 1,899 (11.9%) | 1,617 (12.8%) |
| 15 to 19 Minutes | 3,282 (20.7%) | 2,713 (21.4%) |
| 20 to 24 Minutes | 2,121 (13.4%) | 1,754 (13.8%) |
| 25 to 29 Minutes | 1,086 (6.8%) | 723 (5.7%) |
| 30 to 34 Minutes | 1,541 (9.7%) | 814 (6.4%) |
| 35 to 39 Minutes | 420 (2.6%) | 458 (3.6%) |
| 40 to 44 Minutes | 570 (3.6%) | 331 (2.6%) |
| 45 to 59 Minutes | 1,724 (10.8%) | 1,392 (11.0%) |
| 60 to 89 Minutes | 1,472 (9.3%) | 1,300 (10.3%) |
| 90 or more Minutes | 305 (1.9%) | 538 (4.2%) |
Time of Departure to Work by Sex in Redondo Beach
The most frequent times of departure to work in Redondo Beach are 8:00 AM to 8:29 AM (2,847, 17.9%) for males and 8:00 AM to 8:29 AM (2,023, 16.0%) for females.
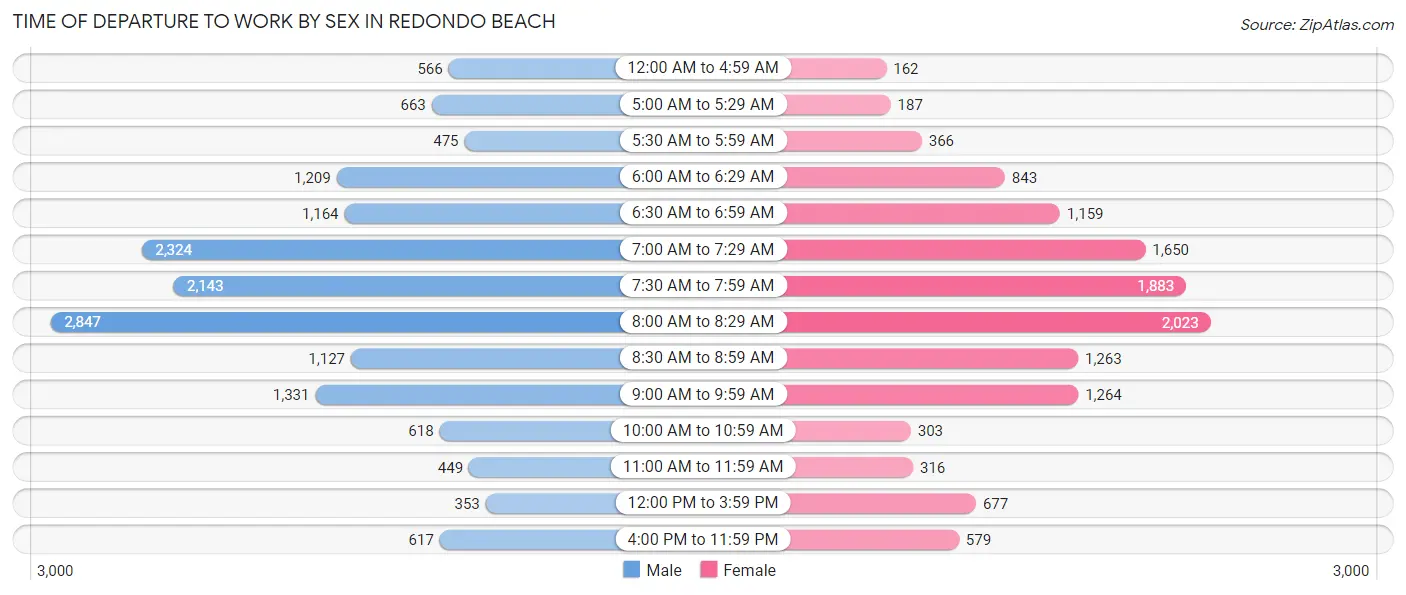
| Time of Departure | Male | Female |
| 12:00 AM to 4:59 AM | 566 (3.6%) | 162 (1.3%) |
| 5:00 AM to 5:29 AM | 663 (4.2%) | 187 (1.5%) |
| 5:30 AM to 5:59 AM | 475 (3.0%) | 366 (2.9%) |
| 6:00 AM to 6:29 AM | 1,209 (7.6%) | 843 (6.7%) |
| 6:30 AM to 6:59 AM | 1,164 (7.3%) | 1,159 (9.1%) |
| 7:00 AM to 7:29 AM | 2,324 (14.6%) | 1,650 (13.0%) |
| 7:30 AM to 7:59 AM | 2,143 (13.5%) | 1,883 (14.9%) |
| 8:00 AM to 8:29 AM | 2,847 (17.9%) | 2,023 (16.0%) |
| 8:30 AM to 8:59 AM | 1,127 (7.1%) | 1,263 (10.0%) |
| 9:00 AM to 9:59 AM | 1,331 (8.4%) | 1,264 (10.0%) |
| 10:00 AM to 10:59 AM | 618 (3.9%) | 303 (2.4%) |
| 11:00 AM to 11:59 AM | 449 (2.8%) | 316 (2.5%) |
| 12:00 PM to 3:59 PM | 353 (2.2%) | 677 (5.3%) |
| 4:00 PM to 11:59 PM | 617 (3.9%) | 579 (4.6%) |
| Total | 15,886 (100.0%) | 12,675 (100.0%) |
Housing Occupancy in Redondo Beach
Occupancy by Ownership in Redondo Beach
Of the total 28,562 dwellings in Redondo Beach, owner-occupied units account for 14,990 (52.5%), while renter-occupied units make up 13,572 (47.5%).
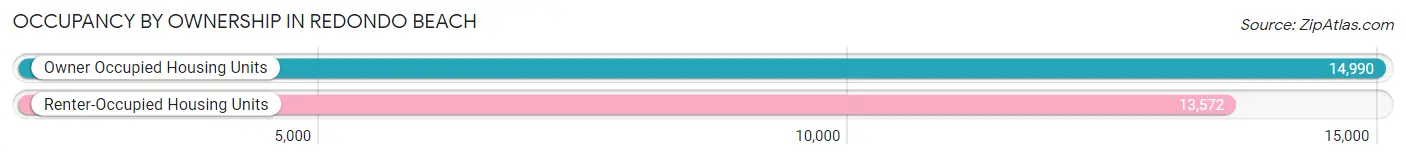
| Occupancy | # Housing Units | % Housing Units |
| Owner Occupied Housing Units | 14,990 | 52.5% |
| Renter-Occupied Housing Units | 13,572 | 47.5% |
| Total Occupied Housing Units | 28,562 | 100.0% |
Occupancy by Household Size in Redondo Beach
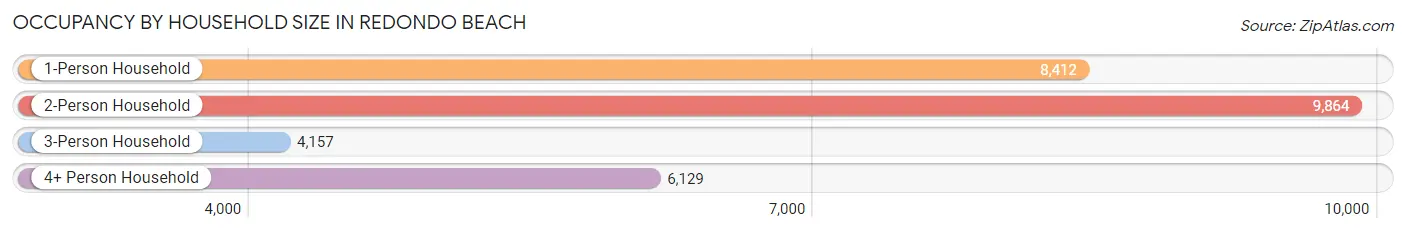
| Household Size | # Housing Units | % Housing Units |
| 1-Person Household | 8,412 | 29.4% |
| 2-Person Household | 9,864 | 34.5% |
| 3-Person Household | 4,157 | 14.5% |
| 4+ Person Household | 6,129 | 21.5% |
| Total Housing Units | 28,562 | 100.0% |
Occupancy by Ownership by Household Size in Redondo Beach
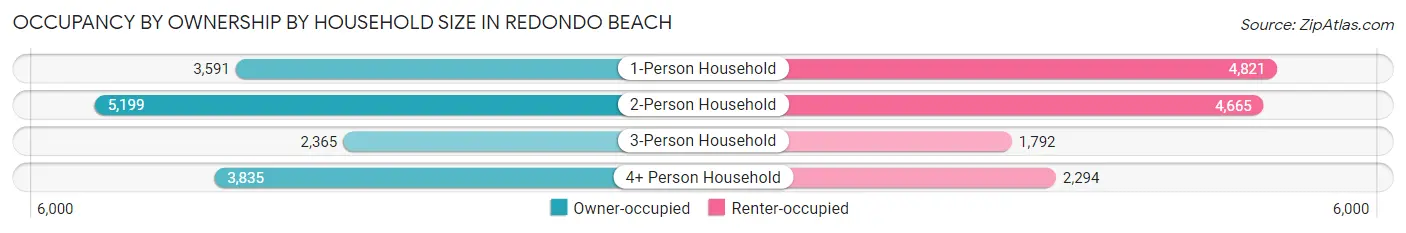
| Household Size | Owner-occupied | Renter-occupied |
| 1-Person Household | 3,591 (42.7%) | 4,821 (57.3%) |
| 2-Person Household | 5,199 (52.7%) | 4,665 (47.3%) |
| 3-Person Household | 2,365 (56.9%) | 1,792 (43.1%) |
| 4+ Person Household | 3,835 (62.6%) | 2,294 (37.4%) |
| Total Housing Units | 14,990 (52.5%) | 13,572 (47.5%) |
Occupancy by Educational Attainment in Redondo Beach
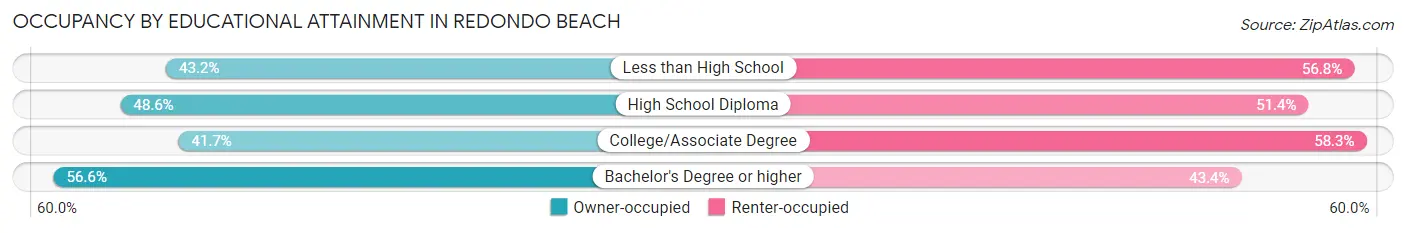
| Household Size | Owner-occupied | Renter-occupied |
| Less than High School | 309 (43.2%) | 407 (56.8%) |
| High School Diploma | 1,253 (48.6%) | 1,325 (51.4%) |
| College/Associate Degree | 2,425 (41.7%) | 3,391 (58.3%) |
| Bachelor's Degree or higher | 11,003 (56.6%) | 8,449 (43.4%) |
Occupancy by Age of Householder in Redondo Beach
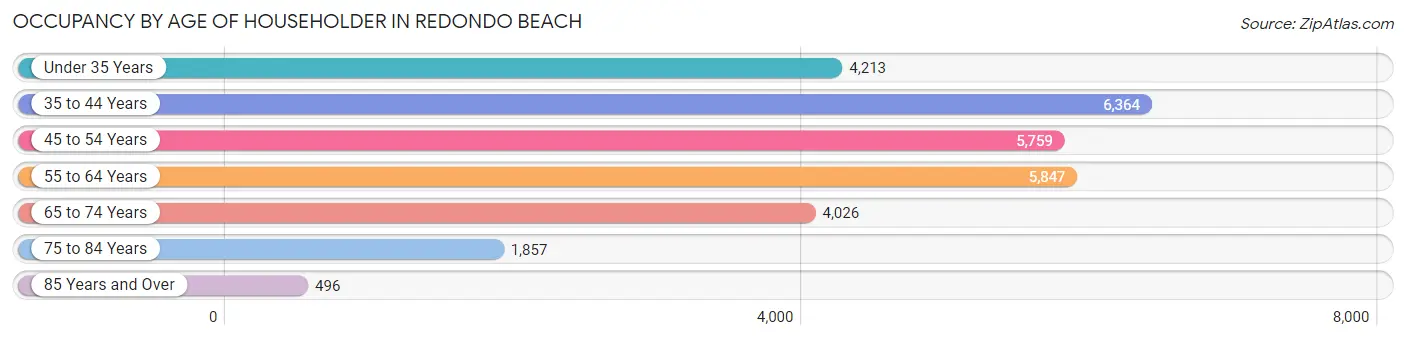
| Age Bracket | # Households | % Households |
| Under 35 Years | 4,213 | 14.7% |
| 35 to 44 Years | 6,364 | 22.3% |
| 45 to 54 Years | 5,759 | 20.2% |
| 55 to 64 Years | 5,847 | 20.5% |
| 65 to 74 Years | 4,026 | 14.1% |
| 75 to 84 Years | 1,857 | 6.5% |
| 85 Years and Over | 496 | 1.7% |
| Total | 28,562 | 100.0% |
Housing Finances in Redondo Beach
Median Income by Occupancy in Redondo Beach
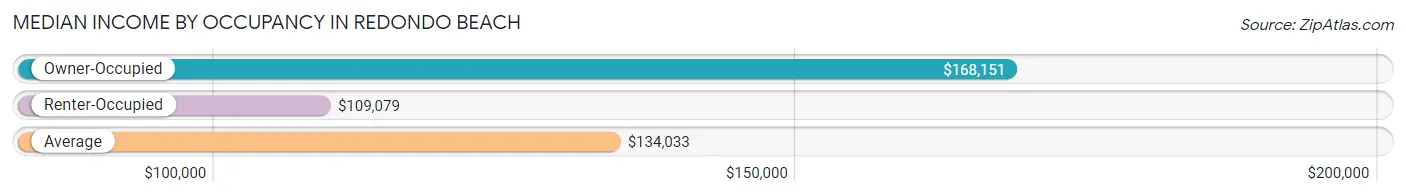
| Occupancy Type | # Households | Median Income |
| Owner-Occupied | 14,990 (52.5%) | $168,151 |
| Renter-Occupied | 13,572 (47.5%) | $109,079 |
| Average | 28,562 (100.0%) | $134,033 |
Occupancy by Householder Income Bracket in Redondo Beach
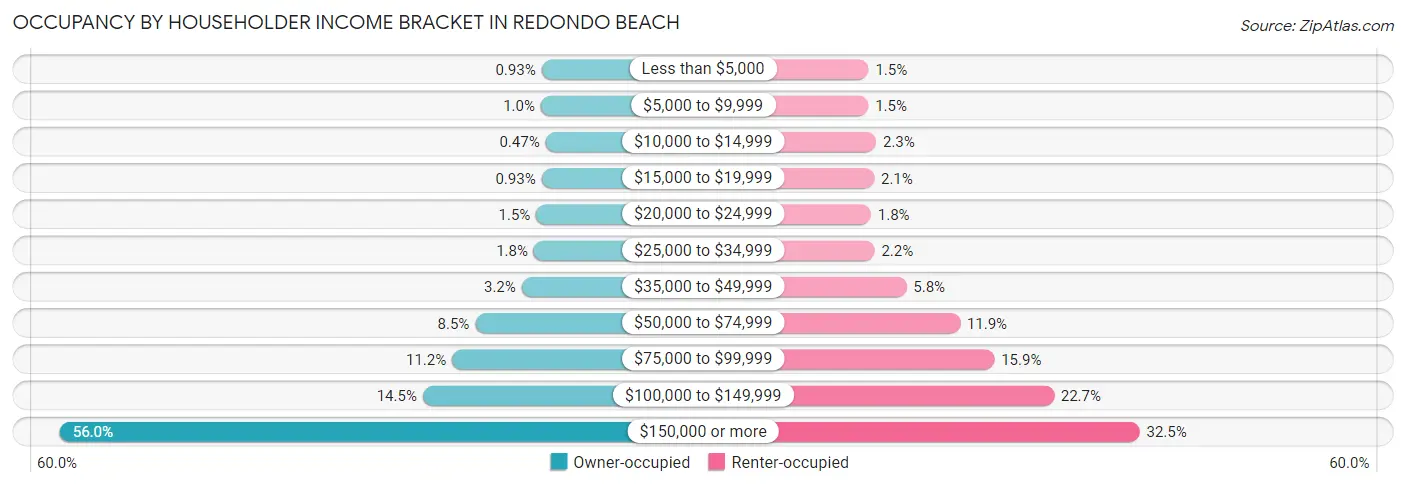
| Income Bracket | Owner-occupied | Renter-occupied |
| Less than $5,000 | 139 (0.9%) | 201 (1.5%) |
| $5,000 to $9,999 | 152 (1.0%) | 197 (1.5%) |
| $10,000 to $14,999 | 70 (0.5%) | 318 (2.3%) |
| $15,000 to $19,999 | 140 (0.9%) | 287 (2.1%) |
| $20,000 to $24,999 | 230 (1.5%) | 237 (1.8%) |
| $25,000 to $34,999 | 271 (1.8%) | 293 (2.2%) |
| $35,000 to $49,999 | 480 (3.2%) | 789 (5.8%) |
| $50,000 to $74,999 | 1,274 (8.5%) | 1,619 (11.9%) |
| $75,000 to $99,999 | 1,671 (11.2%) | 2,151 (15.9%) |
| $100,000 to $149,999 | 2,173 (14.5%) | 3,075 (22.7%) |
| $150,000 or more | 8,390 (56.0%) | 4,405 (32.5%) |
| Total | 14,990 (100.0%) | 13,572 (100.0%) |
Monthly Housing Cost Tiers in Redondo Beach
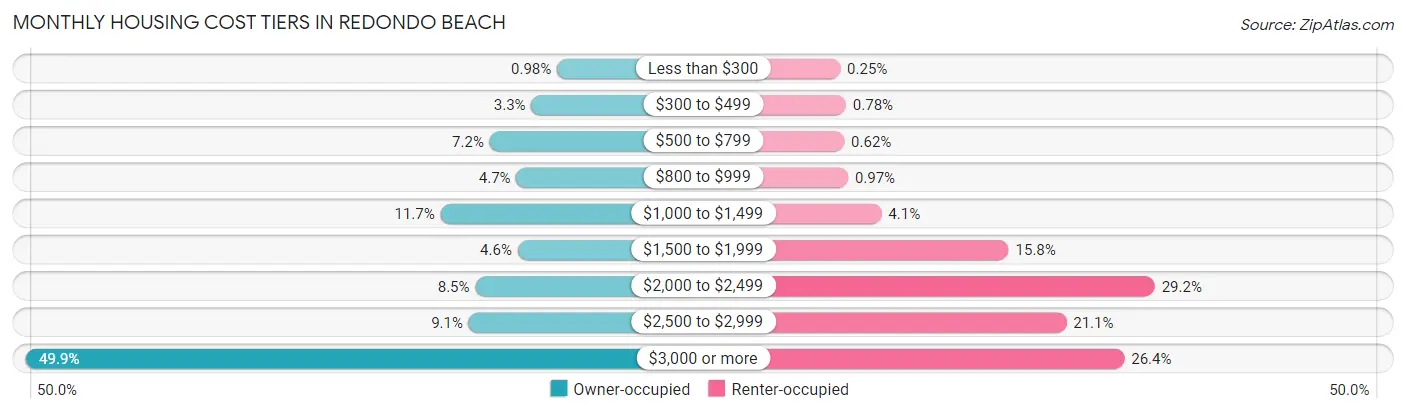
| Monthly Cost | Owner-occupied | Renter-occupied |
| Less than $300 | 147 (1.0%) | 34 (0.3%) |
| $300 to $499 | 500 (3.3%) | 106 (0.8%) |
| $500 to $799 | 1,077 (7.2%) | 84 (0.6%) |
| $800 to $999 | 707 (4.7%) | 132 (1.0%) |
| $1,000 to $1,499 | 1,755 (11.7%) | 549 (4.1%) |
| $1,500 to $1,999 | 690 (4.6%) | 2,139 (15.8%) |
| $2,000 to $2,499 | 1,274 (8.5%) | 3,965 (29.2%) |
| $2,500 to $2,999 | 1,365 (9.1%) | 2,860 (21.1%) |
| $3,000 or more | 7,475 (49.9%) | 3,584 (26.4%) |
| Total | 14,990 (100.0%) | 13,572 (100.0%) |
Physical Housing Characteristics in Redondo Beach
Housing Structures in Redondo Beach
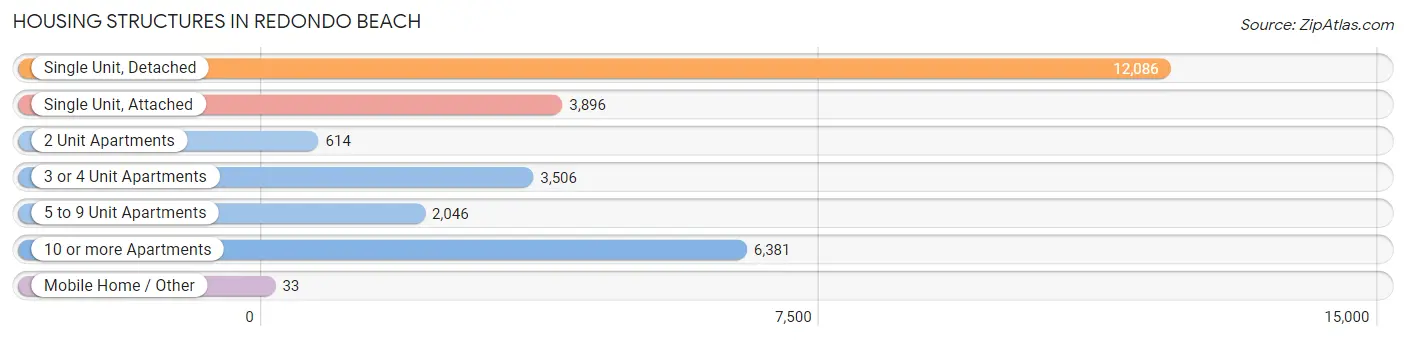
| Structure Type | # Housing Units | % Housing Units |
| Single Unit, Detached | 12,086 | 42.3% |
| Single Unit, Attached | 3,896 | 13.6% |
| 2 Unit Apartments | 614 | 2.1% |
| 3 or 4 Unit Apartments | 3,506 | 12.3% |
| 5 to 9 Unit Apartments | 2,046 | 7.2% |
| 10 or more Apartments | 6,381 | 22.3% |
| Mobile Home / Other | 33 | 0.1% |
| Total | 28,562 | 100.0% |
Housing Structures by Occupancy in Redondo Beach
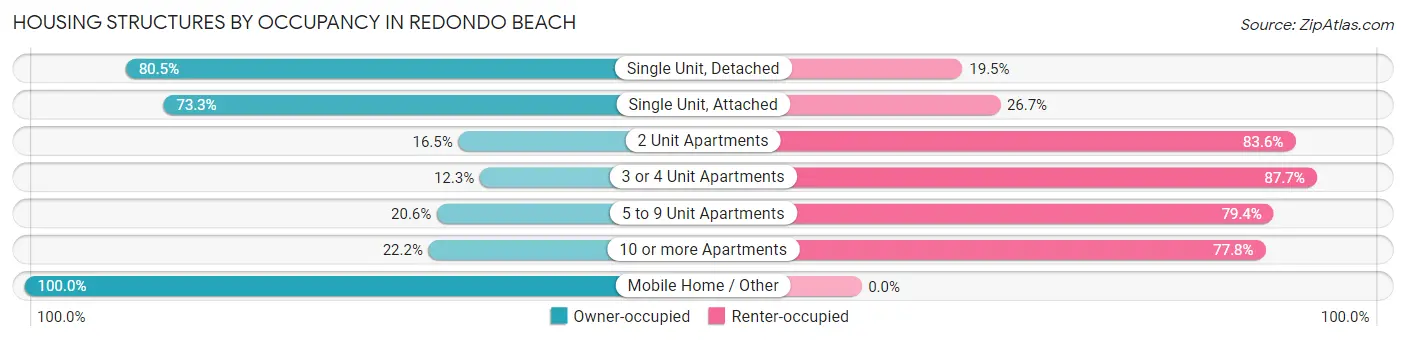
| Structure Type | Owner-occupied | Renter-occupied |
| Single Unit, Detached | 9,732 (80.5%) | 2,354 (19.5%) |
| Single Unit, Attached | 2,855 (73.3%) | 1,041 (26.7%) |
| 2 Unit Apartments | 101 (16.5%) | 513 (83.6%) |
| 3 or 4 Unit Apartments | 432 (12.3%) | 3,074 (87.7%) |
| 5 to 9 Unit Apartments | 421 (20.6%) | 1,625 (79.4%) |
| 10 or more Apartments | 1,416 (22.2%) | 4,965 (77.8%) |
| Mobile Home / Other | 33 (100.0%) | 0 (0.0%) |
| Total | 14,990 (52.5%) | 13,572 (47.5%) |
Housing Structures by Number of Rooms in Redondo Beach
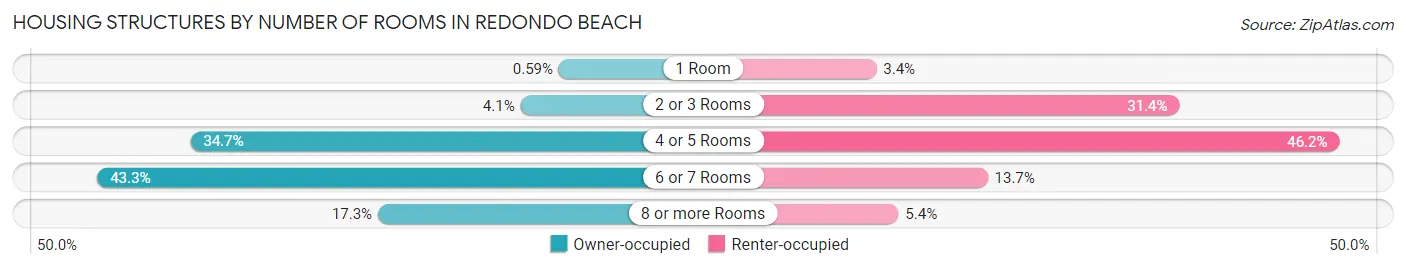
| Number of Rooms | Owner-occupied | Renter-occupied |
| 1 Room | 89 (0.6%) | 457 (3.4%) |
| 2 or 3 Rooms | 621 (4.1%) | 4,260 (31.4%) |
| 4 or 5 Rooms | 5,197 (34.7%) | 6,267 (46.2%) |
| 6 or 7 Rooms | 6,487 (43.3%) | 1,854 (13.7%) |
| 8 or more Rooms | 2,596 (17.3%) | 734 (5.4%) |
| Total | 14,990 (100.0%) | 13,572 (100.0%) |
Housing Structure by Heating Type in Redondo Beach
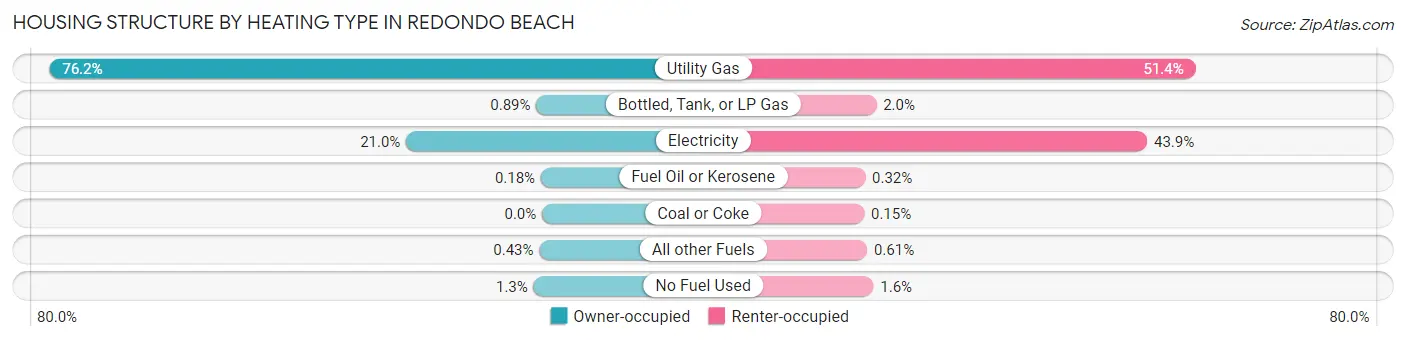
| Heating Type | Owner-occupied | Renter-occupied |
| Utility Gas | 11,420 (76.2%) | 6,975 (51.4%) |
| Bottled, Tank, or LP Gas | 133 (0.9%) | 276 (2.0%) |
| Electricity | 3,150 (21.0%) | 5,959 (43.9%) |
| Fuel Oil or Kerosene | 27 (0.2%) | 43 (0.3%) |
| Coal or Coke | 0 (0.0%) | 20 (0.2%) |
| All other Fuels | 64 (0.4%) | 83 (0.6%) |
| No Fuel Used | 196 (1.3%) | 216 (1.6%) |
| Total | 14,990 (100.0%) | 13,572 (100.0%) |
Household Vehicle Usage in Redondo Beach
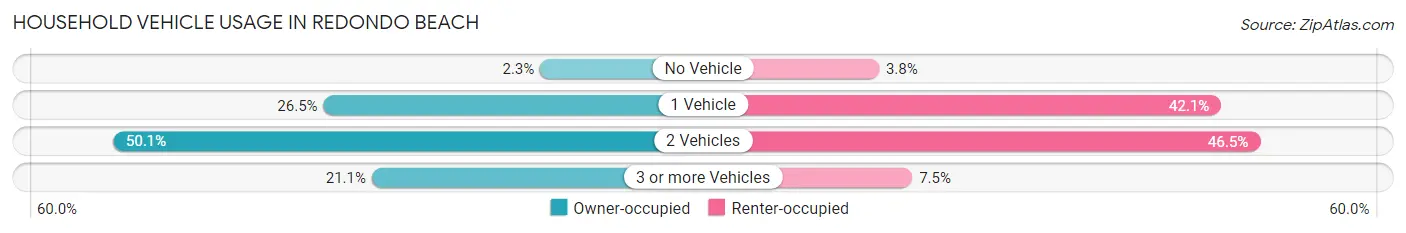
| Vehicles per Household | Owner-occupied | Renter-occupied |
| No Vehicle | 337 (2.2%) | 517 (3.8%) |
| 1 Vehicle | 3,977 (26.5%) | 5,719 (42.1%) |
| 2 Vehicles | 7,511 (50.1%) | 6,312 (46.5%) |
| 3 or more Vehicles | 3,165 (21.1%) | 1,024 (7.5%) |
| Total | 14,990 (100.0%) | 13,572 (100.0%) |
Real Estate & Mortgages in Redondo Beach
Real Estate and Mortgage Overview in Redondo Beach
| Characteristic | Without Mortgage | With Mortgage |
| Housing Units | 3,811 | 11,179 |
| Median Property Value | $1,111,700 | $1,229,300 |
| Median Household Income | $112,039 | $7,088 |
| Monthly Housing Costs | $886 | $7,435 |
| Real Estate Taxes | $5,604 | $71 |
Property Value by Mortgage Status in Redondo Beach
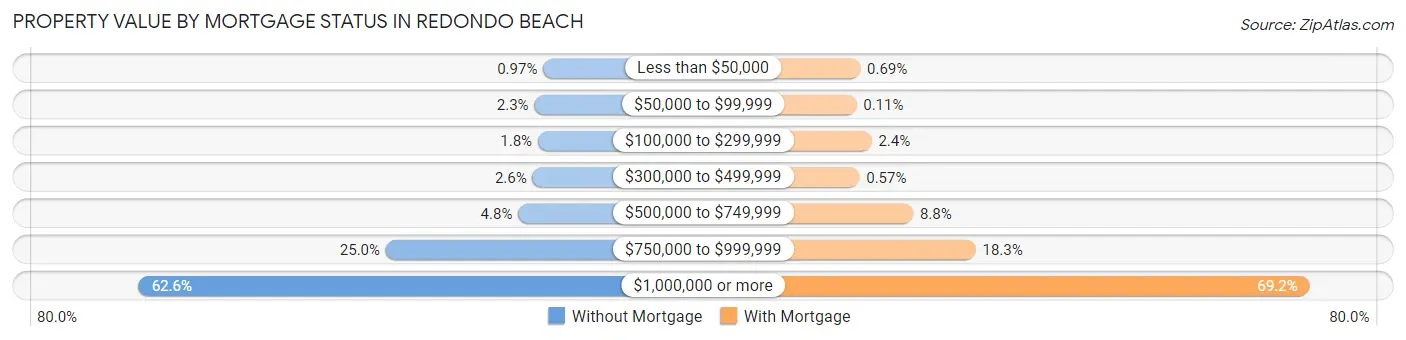
| Property Value | Without Mortgage | With Mortgage |
| Less than $50,000 | 37 (1.0%) | 77 (0.7%) |
| $50,000 to $99,999 | 88 (2.3%) | 12 (0.1%) |
| $100,000 to $299,999 | 68 (1.8%) | 270 (2.4%) |
| $300,000 to $499,999 | 99 (2.6%) | 64 (0.6%) |
| $500,000 to $749,999 | 182 (4.8%) | 978 (8.7%) |
| $750,000 to $999,999 | 951 (24.9%) | 2,043 (18.3%) |
| $1,000,000 or more | 2,386 (62.6%) | 7,735 (69.2%) |
| Total | 3,811 (100.0%) | 11,179 (100.0%) |
Household Income by Mortgage Status in Redondo Beach
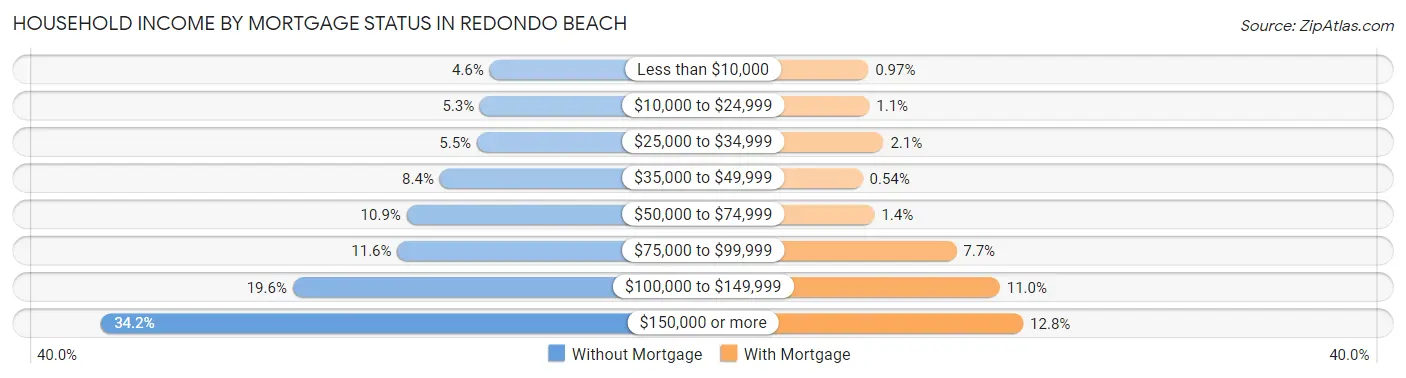
| Household Income | Without Mortgage | With Mortgage |
| Less than $10,000 | 174 (4.6%) | 108 (1.0%) |
| $10,000 to $24,999 | 202 (5.3%) | 117 (1.1%) |
| $25,000 to $34,999 | 211 (5.5%) | 238 (2.1%) |
| $35,000 to $49,999 | 319 (8.4%) | 60 (0.5%) |
| $50,000 to $74,999 | 415 (10.9%) | 161 (1.4%) |
| $75,000 to $99,999 | 442 (11.6%) | 859 (7.7%) |
| $100,000 to $149,999 | 746 (19.6%) | 1,229 (11.0%) |
| $150,000 or more | 1,302 (34.2%) | 1,427 (12.8%) |
| Total | 3,811 (100.0%) | 11,179 (100.0%) |
Property Value to Household Income Ratio in Redondo Beach
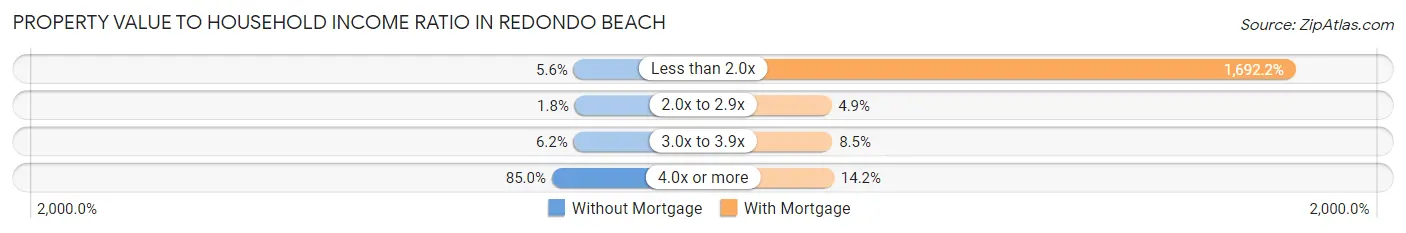
| Value-to-Income Ratio | Without Mortgage | With Mortgage |
| Less than 2.0x | 214 (5.6%) | 189,171 (1,692.2%) |
| 2.0x to 2.9x | 69 (1.8%) | 542 (4.9%) |
| 3.0x to 3.9x | 237 (6.2%) | 946 (8.5%) |
| 4.0x or more | 3,241 (85.0%) | 1,588 (14.2%) |
| Total | 3,811 (100.0%) | 11,179 (100.0%) |
Real Estate Taxes by Mortgage Status in Redondo Beach
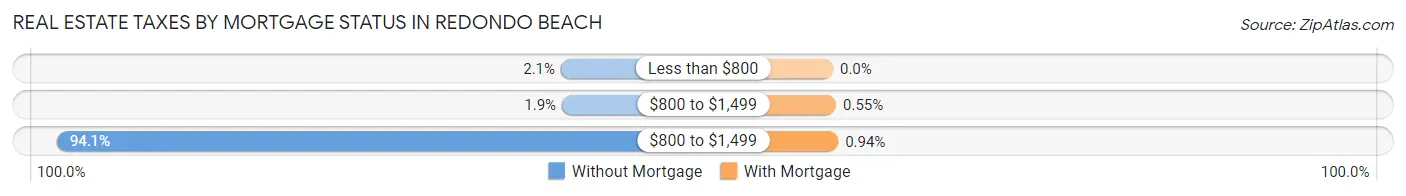
| Property Taxes | Without Mortgage | With Mortgage |
| Less than $800 | 78 (2.1%) | 0 (0.0%) |
| $800 to $1,499 | 71 (1.9%) | 61 (0.5%) |
| $800 to $1,499 | 3,586 (94.1%) | 105 (0.9%) |
| Total | 3,811 (100.0%) | 11,179 (100.0%) |
Health & Disability in Redondo Beach
Health Insurance Coverage by Age in Redondo Beach
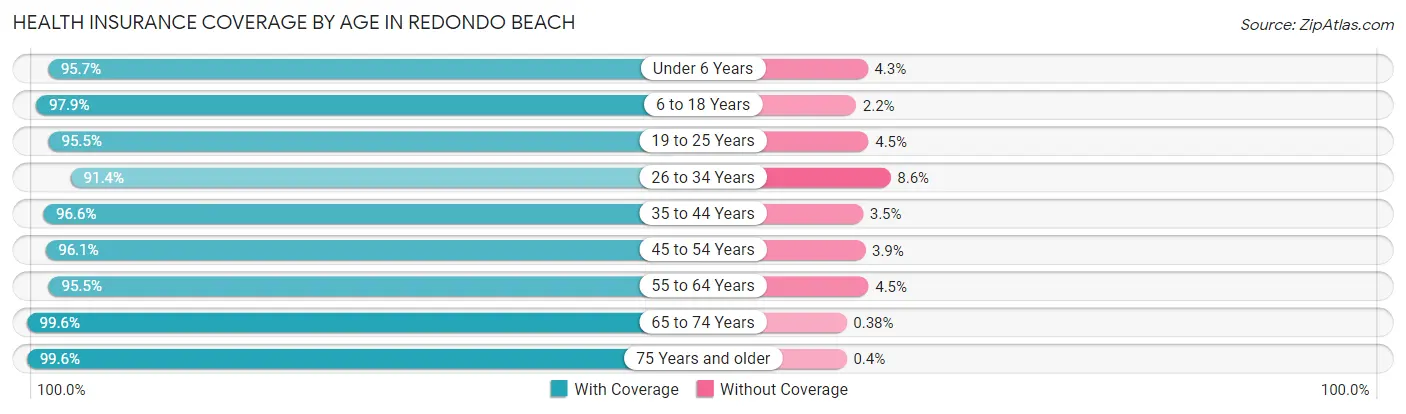
| Age Bracket | With Coverage | Without Coverage |
| Under 6 Years | 5,847 (95.7%) | 264 (4.3%) |
| 6 to 18 Years | 10,285 (97.9%) | 226 (2.1%) |
| 19 to 25 Years | 3,402 (95.5%) | 159 (4.5%) |
| 26 to 34 Years | 8,282 (91.4%) | 778 (8.6%) |
| 35 to 44 Years | 11,040 (96.6%) | 395 (3.5%) |
| 45 to 54 Years | 10,131 (96.1%) | 408 (3.9%) |
| 55 to 64 Years | 8,904 (95.5%) | 417 (4.5%) |
| 65 to 74 Years | 6,216 (99.6%) | 24 (0.4%) |
| 75 Years and older | 3,511 (99.6%) | 14 (0.4%) |
| Total | 67,618 (96.2%) | 2,685 (3.8%) |
Health Insurance Coverage by Citizenship Status in Redondo Beach
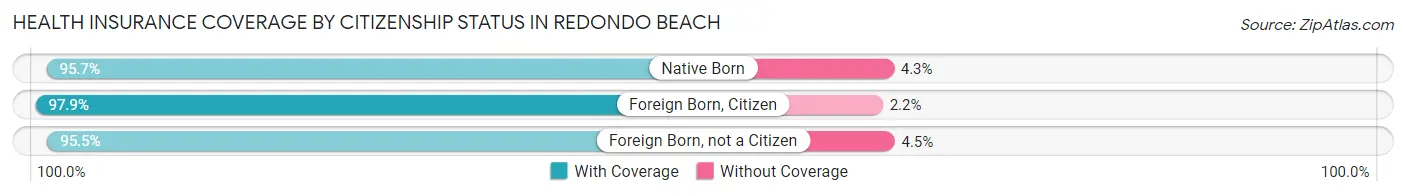
| Citizenship Status | With Coverage | Without Coverage |
| Native Born | 5,847 (95.7%) | 264 (4.3%) |
| Foreign Born, Citizen | 10,285 (97.9%) | 226 (2.1%) |
| Foreign Born, not a Citizen | 3,402 (95.5%) | 159 (4.5%) |
Health Insurance Coverage by Household Income in Redondo Beach
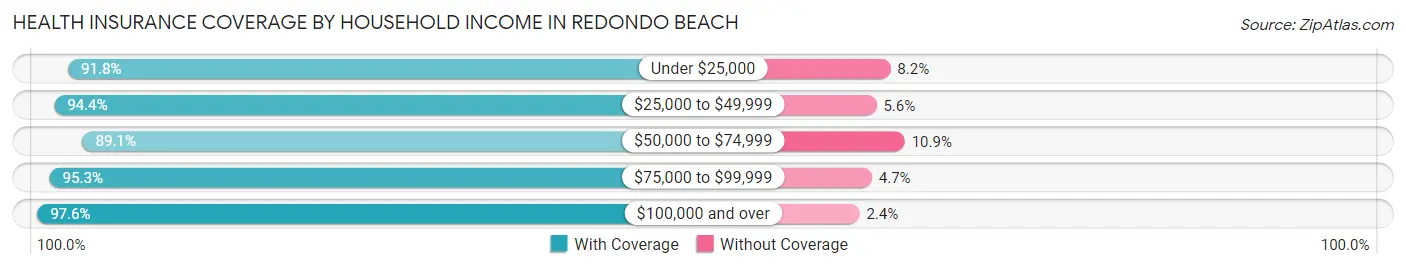
| Household Income | With Coverage | Without Coverage |
| Under $25,000 | 2,721 (91.8%) | 242 (8.2%) |
| $25,000 to $49,999 | 2,971 (94.4%) | 175 (5.6%) |
| $50,000 to $74,999 | 5,540 (89.1%) | 675 (10.9%) |
| $75,000 to $99,999 | 7,181 (95.3%) | 354 (4.7%) |
| $100,000 and over | 48,622 (97.6%) | 1,181 (2.4%) |
Public vs Private Health Insurance Coverage by Age in Redondo Beach
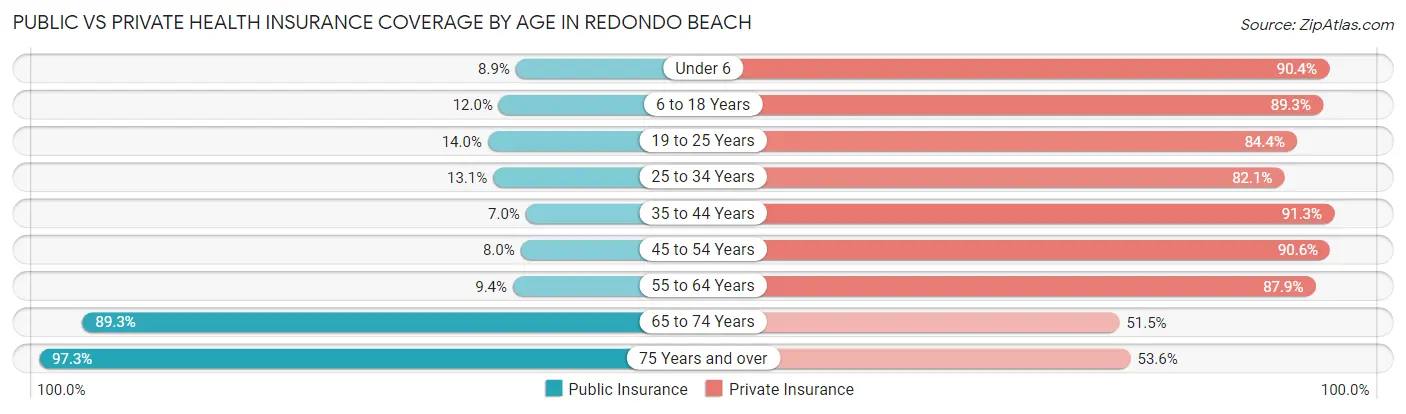
| Age Bracket | Public Insurance | Private Insurance |
| Under 6 | 541 (8.8%) | 5,524 (90.4%) |
| 6 to 18 Years | 1,260 (12.0%) | 9,383 (89.3%) |
| 19 to 25 Years | 500 (14.0%) | 3,007 (84.4%) |
| 25 to 34 Years | 1,182 (13.1%) | 7,439 (82.1%) |
| 35 to 44 Years | 799 (7.0%) | 10,444 (91.3%) |
| 45 to 54 Years | 838 (8.0%) | 9,548 (90.6%) |
| 55 to 64 Years | 873 (9.4%) | 8,190 (87.9%) |
| 65 to 74 Years | 5,570 (89.3%) | 3,216 (51.5%) |
| 75 Years and over | 3,431 (97.3%) | 1,889 (53.6%) |
| Total | 14,994 (21.3%) | 58,640 (83.4%) |
Disability Status by Sex by Age in Redondo Beach
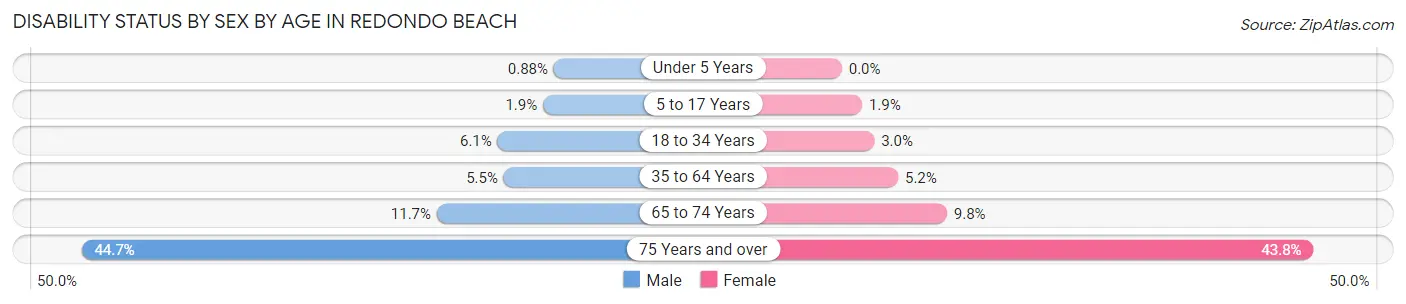
| Age Bracket | Male | Female |
| Under 5 Years | 22 (0.9%) | 0 (0.0%) |
| 5 to 17 Years | 102 (1.9%) | 108 (1.9%) |
| 18 to 34 Years | 409 (6.1%) | 191 (3.0%) |
| 35 to 64 Years | 891 (5.5%) | 792 (5.2%) |
| 65 to 74 Years | 376 (11.7%) | 296 (9.8%) |
| 75 Years and over | 661 (44.7%) | 896 (43.8%) |
Disability Class by Sex by Age in Redondo Beach
Disability Class: Hearing Difficulty
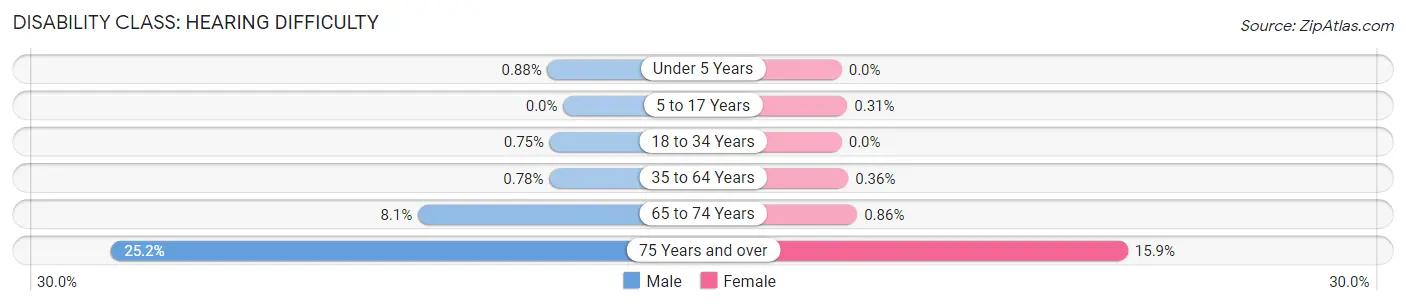
| Age Bracket | Male | Female |
| Under 5 Years | 22 (0.9%) | 0 (0.0%) |
| 5 to 17 Years | 0 (0.0%) | 18 (0.3%) |
| 18 to 34 Years | 50 (0.7%) | 0 (0.0%) |
| 35 to 64 Years | 126 (0.8%) | 54 (0.4%) |
| 65 to 74 Years | 259 (8.1%) | 26 (0.9%) |
| 75 Years and over | 372 (25.2%) | 326 (15.9%) |
Disability Class: Vision Difficulty
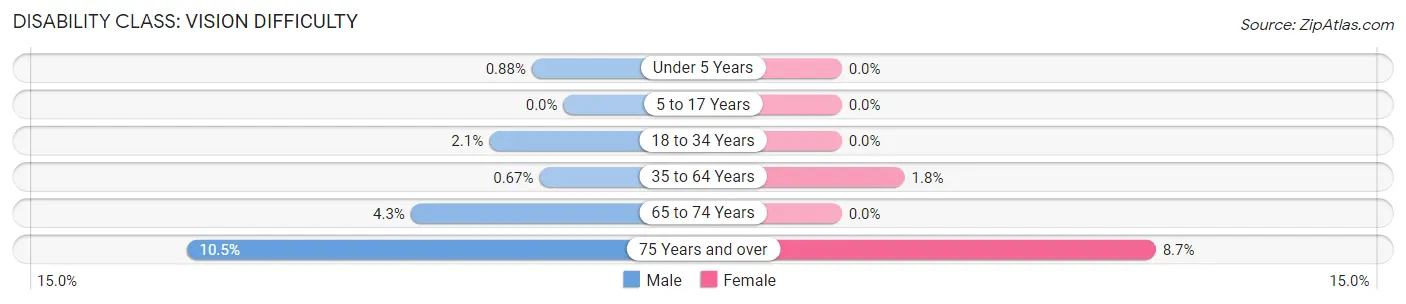
| Age Bracket | Male | Female |
| Under 5 Years | 22 (0.9%) | 0 (0.0%) |
| 5 to 17 Years | 0 (0.0%) | 0 (0.0%) |
| 18 to 34 Years | 139 (2.1%) | 0 (0.0%) |
| 35 to 64 Years | 108 (0.7%) | 266 (1.8%) |
| 65 to 74 Years | 136 (4.3%) | 0 (0.0%) |
| 75 Years and over | 155 (10.5%) | 179 (8.7%) |
Disability Class: Cognitive Difficulty
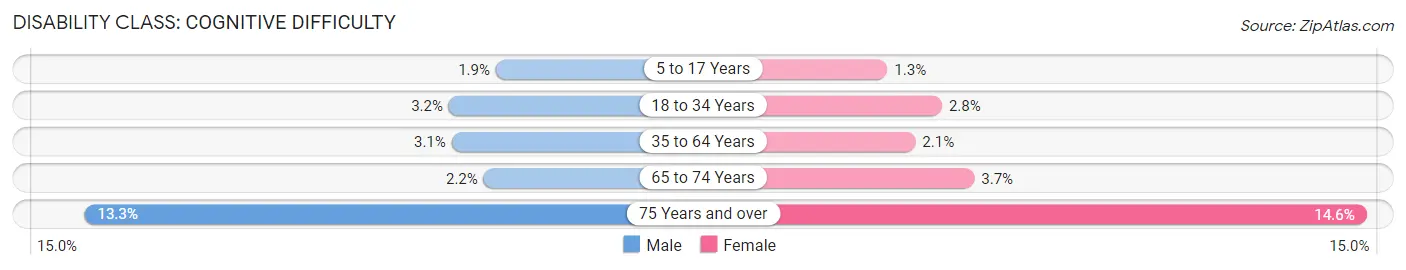
| Age Bracket | Male | Female |
| 5 to 17 Years | 102 (1.9%) | 73 (1.3%) |
| 18 to 34 Years | 214 (3.2%) | 177 (2.8%) |
| 35 to 64 Years | 501 (3.1%) | 311 (2.1%) |
| 65 to 74 Years | 71 (2.2%) | 112 (3.7%) |
| 75 Years and over | 197 (13.3%) | 299 (14.6%) |
Disability Class: Ambulatory Difficulty
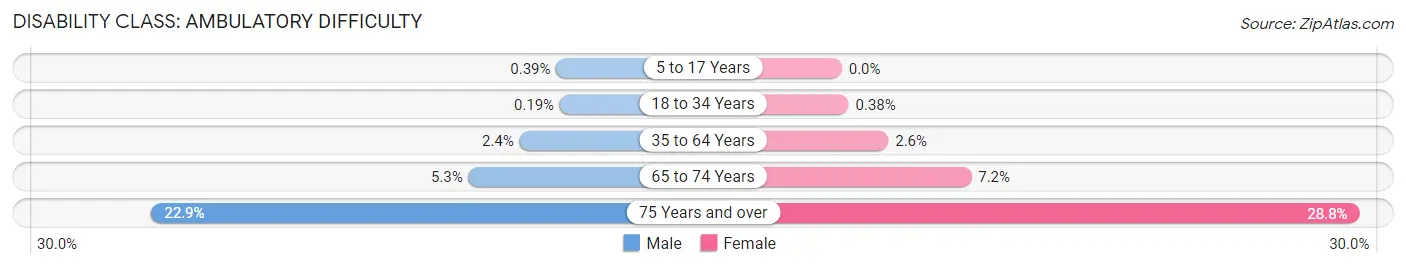
| Age Bracket | Male | Female |
| 5 to 17 Years | 21 (0.4%) | 0 (0.0%) |
| 18 to 34 Years | 13 (0.2%) | 24 (0.4%) |
| 35 to 64 Years | 393 (2.4%) | 393 (2.6%) |
| 65 to 74 Years | 169 (5.3%) | 219 (7.2%) |
| 75 Years and over | 339 (22.9%) | 590 (28.8%) |
Disability Class: Self-Care Difficulty
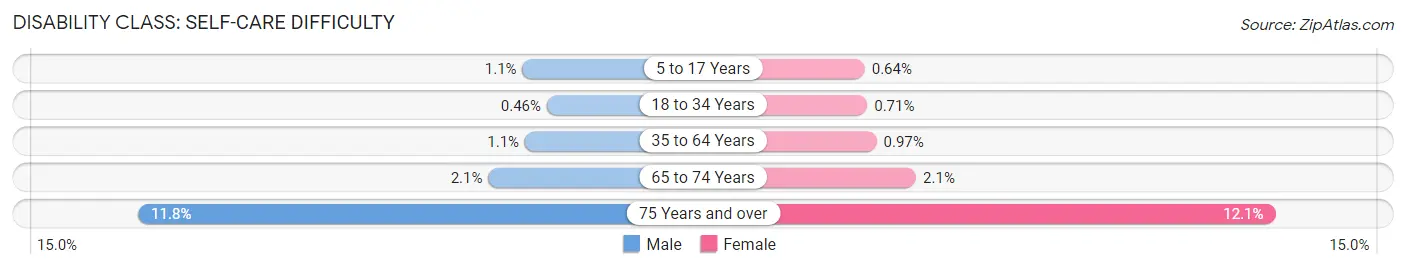
| Age Bracket | Male | Female |
| 5 to 17 Years | 62 (1.1%) | 37 (0.6%) |
| 18 to 34 Years | 31 (0.5%) | 45 (0.7%) |
| 35 to 64 Years | 173 (1.1%) | 147 (1.0%) |
| 65 to 74 Years | 67 (2.1%) | 63 (2.1%) |
| 75 Years and over | 175 (11.8%) | 247 (12.1%) |
Technology Access in Redondo Beach
Computing Device Access in Redondo Beach
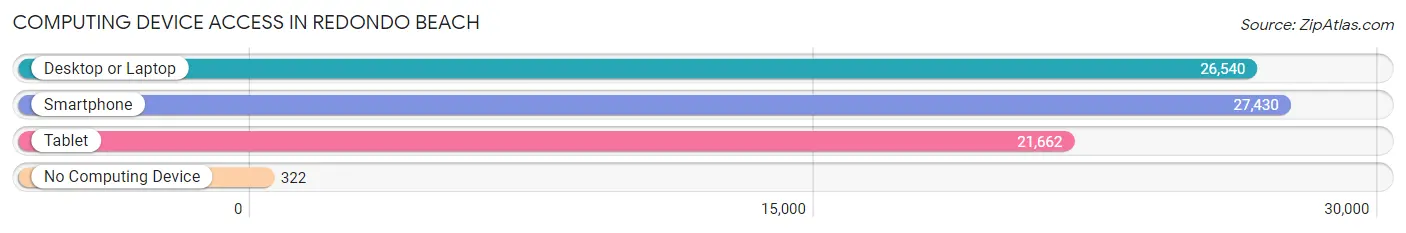
| Device Type | # Households | % Households |
| Desktop or Laptop | 26,540 | 92.9% |
| Smartphone | 27,430 | 96.0% |
| Tablet | 21,662 | 75.8% |
| No Computing Device | 322 | 1.1% |
| Total | 28,562 | 100.0% |
Internet Access in Redondo Beach
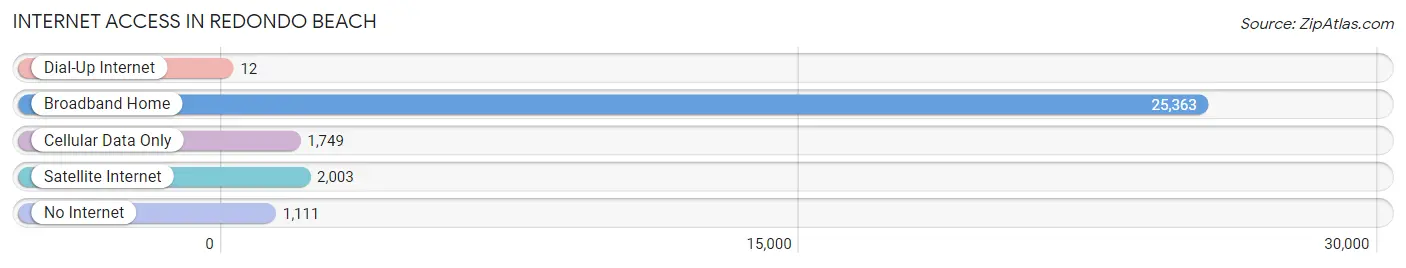
| Internet Type | # Households | % Households |
| Dial-Up Internet | 12 | 0.0% |
| Broadband Home | 25,363 | 88.8% |
| Cellular Data Only | 1,749 | 6.1% |
| Satellite Internet | 2,003 | 7.0% |
| No Internet | 1,111 | 3.9% |
| Total | 28,562 | 100.0% |
Redondo Beach Summary
Redondo Beach is a city located in Los Angeles County, California, United States. It is one of the three Beach Cities located in the South Bay region of the greater Los Angeles area. Redondo Beach is bordered by the Pacific Ocean on the southwest, by Hermosa Beach on the northwest, by Manhattan Beach on the north, and by Torrance on the east and southeast.
Geography
Redondo Beach is located at 33°51'25" North, 118°21'39" West (33.856944, -118.360833). According to the United States Census Bureau, the city has a total area of 6.2 square miles (16.1 km²), of which, 5.7 square miles (14.8 km²) of it is land and 0.5 square miles (1.3 km²) of it (7.90%) is water.
Redondo Beach is a popular beach city in the South Bay region of Los Angeles County. It is known for its 2.1 miles of oceanfront property, popular pier and marina, and its beachfront promenade. The city is home to a variety of businesses, including a large aerospace industry, as well as a variety of restaurants, shops, and entertainment venues.
Redondo Beach is divided into several distinct neighborhoods, including North Redondo, South Redondo, Hollywood Riviera, and the Hollywood Riviera Village. The city is also home to a number of parks, including Veterans Park, Seaside Lagoon, and the Redondo Beach Pier.
History
The area that is now Redondo Beach was originally inhabited by the Tongva Native American tribe. The area was first explored by Spanish explorer Gaspar de Portola in 1769. The area was later settled by the Spanish in 1784, and the city was officially incorporated in 1892.
Redondo Beach was originally a fishing village, and the city's economy was largely based on the fishing industry. In the late 19th century, the city began to develop as a resort town, and the city's economy shifted to tourism. The city's pier and marina were built in the early 20th century, and the city's economy continued to be based on tourism and recreation.
Economy
Redondo Beach has a diverse economy, with a variety of industries represented. The city's largest employers are aerospace and defense companies, including Northrop Grumman, Boeing, and Raytheon. Other major employers include the Redondo Beach Unified School District, the City of Redondo Beach, and the South Bay Galleria.
The city is also home to a variety of small businesses, including restaurants, shops, and entertainment venues. The city's pier and marina are popular tourist attractions, and the city's beachfront promenade is a popular destination for locals and visitors alike.
Demographics
As of the 2010 United States Census, Redondo Beach had a population of 66,748. The racial makeup of the city was 63.3% White, 11.2% African American, 0.4% Native American, 11.7% Asian, 0.2% Pacific Islander, 8.2% from other races, and 5.2% from two or more races. Hispanic or Latino of any race were 20.6% of the population.
The median household income in Redondo Beach was $77,890 in 2019. The median age of the city's population was 40.3 years. The city's population was spread out, with 24.3% under the age of 18, 8.2% from 18 to 24, 33.2% from 25 to 44, 24.3% from 45 to 64, and 9.9% who were 65 years of age or older.
Conclusion
Redondo Beach is a vibrant city located in Los Angeles County, California. It is known for its 2.1 miles of oceanfront property, popular pier and marina, and its beachfront promenade. The city has a diverse economy, with a variety of industries represented, and is home to a variety of businesses, including a large aerospace industry, as well as a variety of restaurants, shops, and entertainment venues. The city's population was 66,748 as of the 2010 United States Census, and the median household income was $77,890 in 2019. Redondo Beach is a popular beach city in the South Bay region of Los Angeles County, and is a popular destination for locals and visitors alike.
Common Questions
What is Per Capita Income in Redondo Beach?
Per Capita income in Redondo Beach is $73,285.
What is the Median Family Income in Redondo Beach?
Median Family Income in Redondo Beach is $172,955.
What is the Median Household income in Redondo Beach?
Median Household Income in Redondo Beach is $134,033.
What is Income or Wage Gap in Redondo Beach?
Income or Wage Gap in Redondo Beach is 25.7%.
Women in Redondo Beach earn 74.3 cents for every dollar earned by a man.
What is Inequality or Gini Index in Redondo Beach?
Inequality or Gini Index in Redondo Beach is 0.43.
What is the Total Population of Redondo Beach?
Total Population of Redondo Beach is 70,620.
What is the Total Male Population of Redondo Beach?
Total Male Population of Redondo Beach is 35,524.
What is the Total Female Population of Redondo Beach?
Total Female Population of Redondo Beach is 35,096.
What is the Ratio of Males per 100 Females in Redondo Beach?
There are 101.22 Males per 100 Females in Redondo Beach.
What is the Ratio of Females per 100 Males in Redondo Beach?
There are 98.80 Females per 100 Males in Redondo Beach.
What is the Median Population Age in Redondo Beach?
Median Population Age in Redondo Beach is 40.1 Years.
What is the Average Family Size in Redondo Beach
Average Family Size in Redondo Beach is 3.1 People.
What is the Average Household Size in Redondo Beach
Average Household Size in Redondo Beach is 2.5 People.
How Large is the Labor Force in Redondo Beach?
There are 40,417 People in the Labor Forcein in Redondo Beach.
What is the Percentage of People in the Labor Force in Redondo Beach?
72.3% of People are in the Labor Force in Redondo Beach.
What is the Unemployment Rate in Redondo Beach?
Unemployment Rate in Redondo Beach is 5.0%.