Palm Bay, FL Map & Demographics
Palm Bay Map
Palm Bay Overview
$31,589
PER CAPITA INCOME
$70,509
AVG FAMILY INCOME
$62,538
AVG HOUSEHOLD INCOME
22.3%
WAGE / INCOME GAP [ % ]
77.7¢/ $1
WAGE / INCOME GAP [ $ ]
$8,701
FAMILY INCOME DEFICIT
0.44
INEQUALITY / GINI INDEX
121,513
TOTAL POPULATION
59,884
MALE POPULATION
61,629
FEMALE POPULATION
97.17
MALES / 100 FEMALES
102.91
FEMALES / 100 MALES
41.8
MEDIAN AGE
3.3
AVG FAMILY SIZE
2.8
AVG HOUSEHOLD SIZE
58,037
LABOR FORCE [ PEOPLE ]
59.0%
PERCENT IN LABOR FORCE
5.7%
UNEMPLOYMENT RATE
Palm Bay Area Codes
Income in Palm Bay
Income Overview in Palm Bay
Per Capita Income in Palm Bay is $31,589, while median incomes of families and households are $70,509 and $62,538 respectively.
| Characteristic | Number | Measure |
| Per Capita Income | 121,513 | $31,589 |
| Median Family Income | 29,982 | $70,509 |
| Mean Family Income | 29,982 | $92,004 |
| Median Household Income | 42,865 | $62,538 |
| Mean Household Income | 42,865 | $83,976 |
| Income Deficit | 29,982 | $8,701 |
| Wage / Income Gap (%) | 121,513 | 22.27% |
| Wage / Income Gap ($) | 121,513 | 77.73¢ per $1 |
| Gini / Inequality Index | 121,513 | 0.44 |
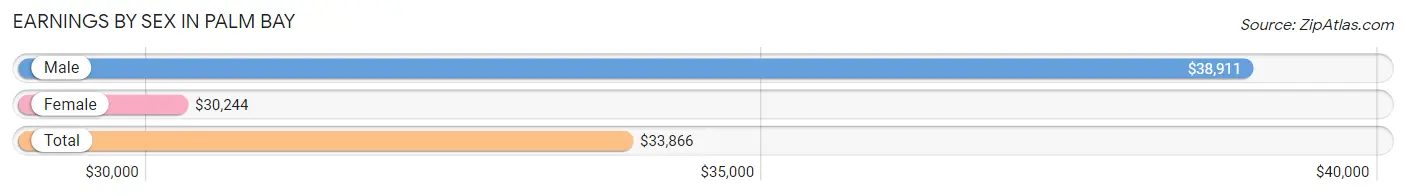
Earnings by Sex in Palm Bay
Average Earnings in Palm Bay are $33,866, $38,911 for men and $30,244 for women, a difference of 22.3%.
| Sex | Number | Average Earnings |
| Male | 30,512 (51.3%) | $38,911 |
| Female | 28,958 (48.7%) | $30,244 |
| Total | 59,470 (100.0%) | $33,866 |
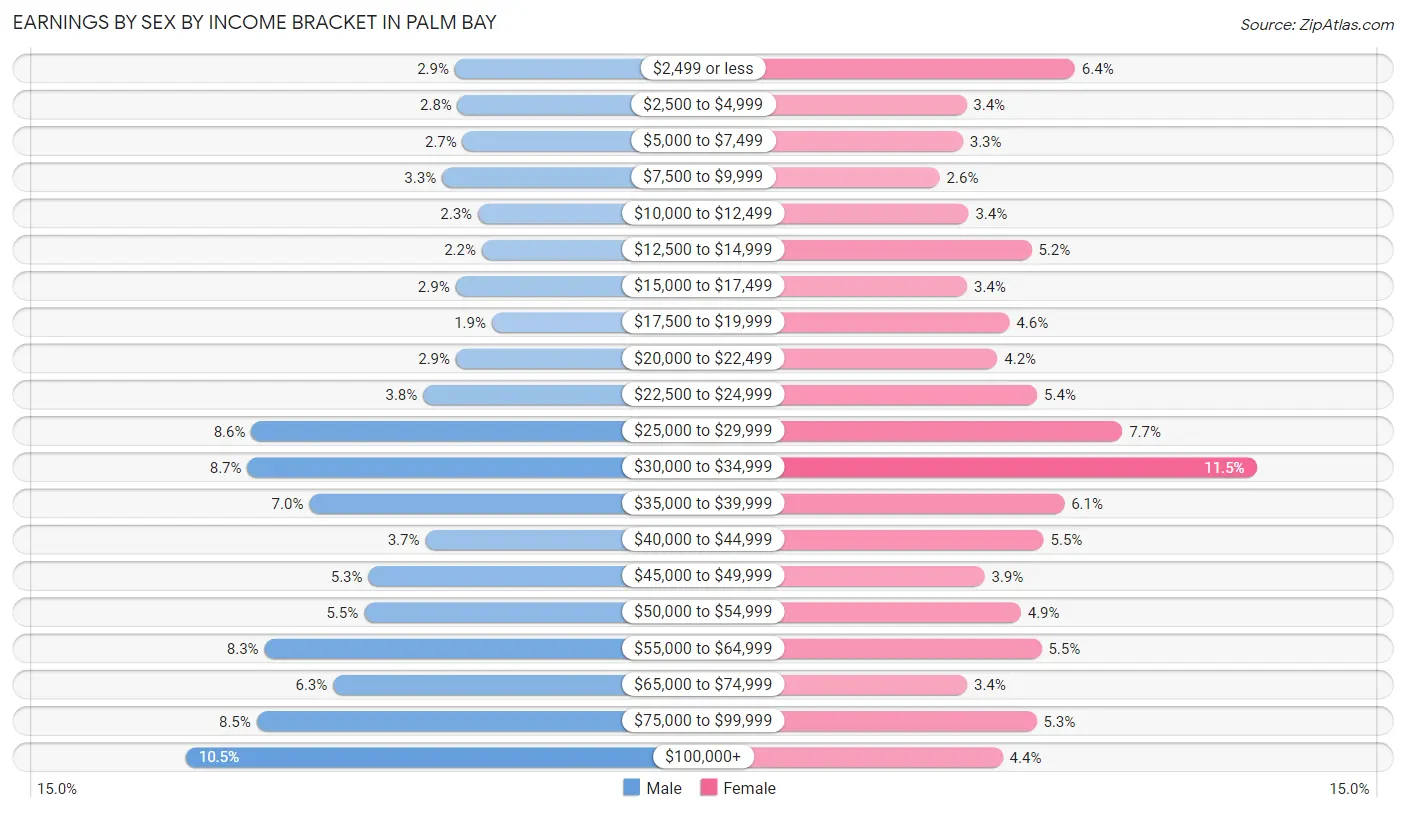
Earnings by Sex by Income Bracket in Palm Bay
The most common earnings brackets in Palm Bay are $100,000+ for men (3,196 | 10.5%) and $30,000 to $34,999 for women (3,333 | 11.5%).
| Income | Male | Female |
| $2,499 or less | 888 (2.9%) | 1,857 (6.4%) |
| $2,500 to $4,999 | 862 (2.8%) | 972 (3.4%) |
| $5,000 to $7,499 | 821 (2.7%) | 944 (3.3%) |
| $7,500 to $9,999 | 998 (3.3%) | 756 (2.6%) |
| $10,000 to $12,499 | 691 (2.3%) | 989 (3.4%) |
| $12,500 to $14,999 | 657 (2.1%) | 1,504 (5.2%) |
| $15,000 to $17,499 | 882 (2.9%) | 978 (3.4%) |
| $17,500 to $19,999 | 571 (1.9%) | 1,323 (4.6%) |
| $20,000 to $22,499 | 879 (2.9%) | 1,226 (4.2%) |
| $22,500 to $24,999 | 1,159 (3.8%) | 1,550 (5.3%) |
| $25,000 to $29,999 | 2,634 (8.6%) | 2,241 (7.7%) |
| $30,000 to $34,999 | 2,666 (8.7%) | 3,333 (11.5%) |
| $35,000 to $39,999 | 2,135 (7.0%) | 1,770 (6.1%) |
| $40,000 to $44,999 | 1,141 (3.7%) | 1,601 (5.5%) |
| $45,000 to $49,999 | 1,630 (5.3%) | 1,122 (3.9%) |
| $50,000 to $54,999 | 1,665 (5.5%) | 1,417 (4.9%) |
| $55,000 to $64,999 | 2,520 (8.3%) | 1,585 (5.5%) |
| $65,000 to $74,999 | 1,931 (6.3%) | 978 (3.4%) |
| $75,000 to $99,999 | 2,586 (8.5%) | 1,543 (5.3%) |
| $100,000+ | 3,196 (10.5%) | 1,269 (4.4%) |
| Total | 30,512 (100.0%) | 28,958 (100.0%) |
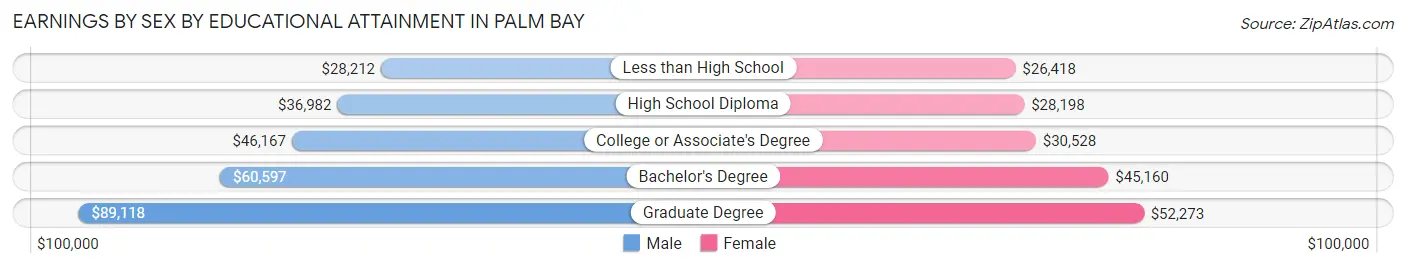
Earnings by Sex by Educational Attainment in Palm Bay
Average earnings in Palm Bay are $44,165 for men and $32,987 for women, a difference of 25.3%. Men with an educational attainment of graduate degree enjoy the highest average annual earnings of $89,118, while those with less than high school education earn the least with $28,212. Women with an educational attainment of graduate degree earn the most with the average annual earnings of $52,273, while those with less than high school education have the smallest earnings of $26,418.
| Educational Attainment | Male Income | Female Income |
| Less than High School | $28,212 | $26,418 |
| High School Diploma | $36,982 | $28,198 |
| College or Associate's Degree | $46,167 | $30,528 |
| Bachelor's Degree | $60,597 | $45,160 |
| Graduate Degree | $89,118 | $52,273 |
| Total | $44,165 | $32,987 |
Family Income in Palm Bay
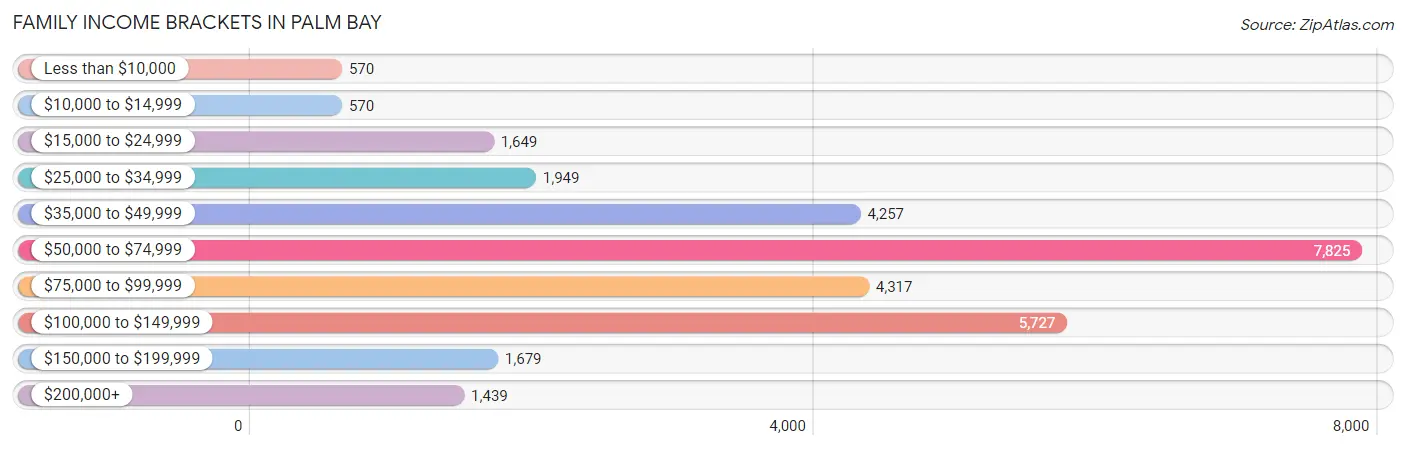
Family Income Brackets in Palm Bay
According to the Palm Bay family income data, there are 7,825 families falling into the $50,000 to $74,999 income range, which is the most common income bracket and makes up 26.1% of all families. Conversely, the less than $10,000 income bracket is the least frequent group with only 570 families (1.9%) belonging to this category.
| Income Bracket | # Families | % Families |
| Less than $10,000 | 570 | 1.9% |
| $10,000 to $14,999 | 570 | 1.9% |
| $15,000 to $24,999 | 1,649 | 5.5% |
| $25,000 to $34,999 | 1,949 | 6.5% |
| $35,000 to $49,999 | 4,257 | 14.2% |
| $50,000 to $74,999 | 7,825 | 26.1% |
| $75,000 to $99,999 | 4,317 | 14.4% |
| $100,000 to $149,999 | 5,727 | 19.1% |
| $150,000 to $199,999 | 1,679 | 5.6% |
| $200,000+ | 1,439 | 4.8% |
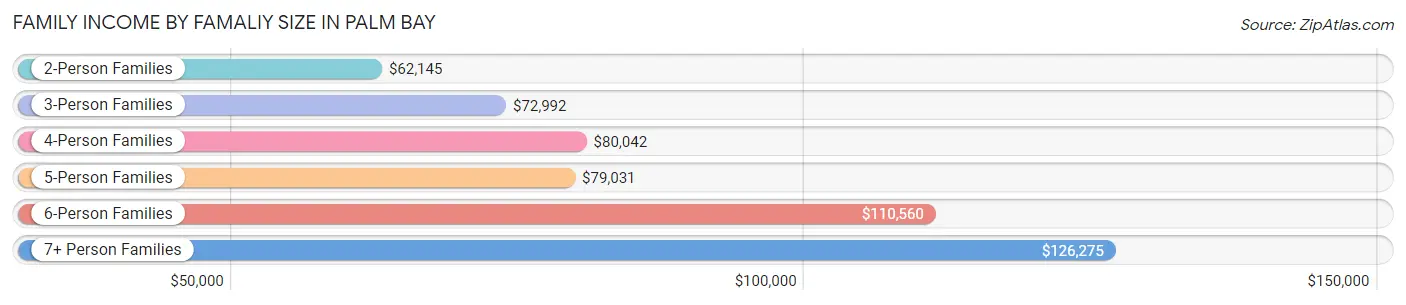
Family Income by Famaliy Size in Palm Bay
7+ person families (301 | 1.0%) account for the highest median family income in Palm Bay with $126,275 per family, while 2-person families (13,681 | 45.6%) have the highest median income of $31,072 per family member.
| Income Bracket | # Families | Median Income |
| 2-Person Families | 13,681 (45.6%) | $62,145 |
| 3-Person Families | 7,559 (25.2%) | $72,992 |
| 4-Person Families | 4,749 (15.8%) | $80,042 |
| 5-Person Families | 2,282 (7.6%) | $79,031 |
| 6-Person Families | 1,410 (4.7%) | $110,560 |
| 7+ Person Families | 301 (1.0%) | $126,275 |
| Total | 29,982 (100.0%) | $70,509 |
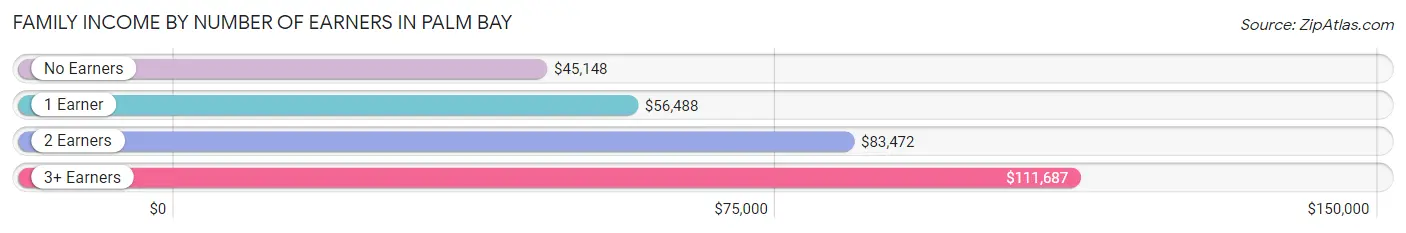
Family Income by Number of Earners in Palm Bay
The median family income in Palm Bay is $70,509, with families comprising 3+ earners (2,846) having the highest median family income of $111,687, while families with no earners (4,949) have the lowest median family income of $45,148, accounting for 9.5% and 16.5% of families, respectively.
| Number of Earners | # Families | Median Income |
| No Earners | 4,949 (16.5%) | $45,148 |
| 1 Earner | 10,893 (36.3%) | $56,488 |
| 2 Earners | 11,294 (37.7%) | $83,472 |
| 3+ Earners | 2,846 (9.5%) | $111,687 |
| Total | 29,982 (100.0%) | $70,509 |
Household Income in Palm Bay
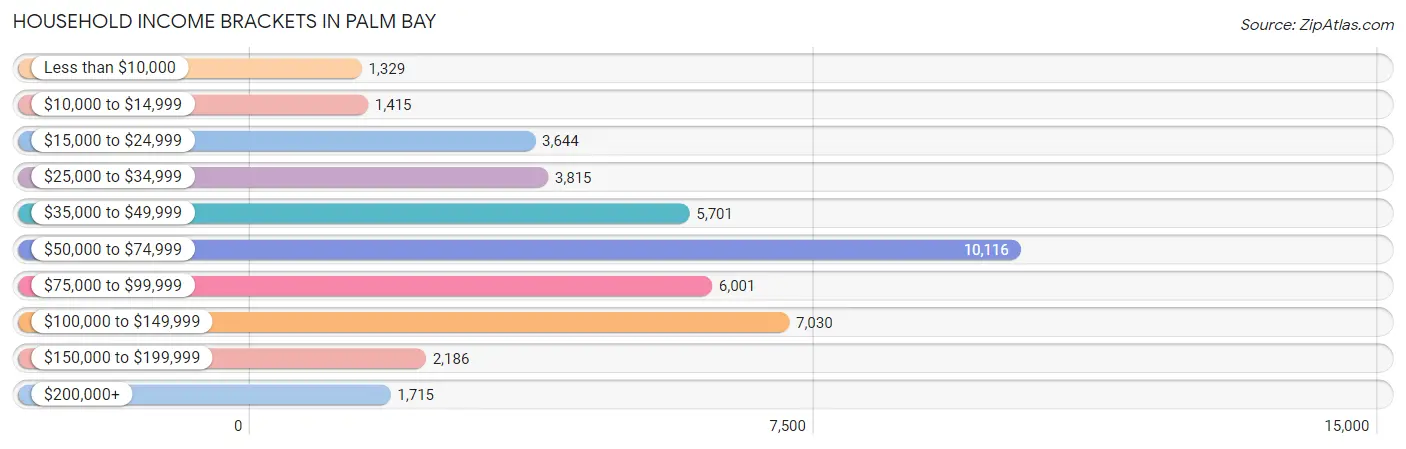
Household Income Brackets in Palm Bay
With 10,116 households falling in the category, the $50,000 to $74,999 income range is the most frequent in Palm Bay, accounting for 23.6% of all households. In contrast, only 1,329 households (3.1%) fall into the less than $10,000 income bracket, making it the least populous group.
| Income Bracket | # Households | % Households |
| Less than $10,000 | 1,329 | 3.1% |
| $10,000 to $14,999 | 1,415 | 3.3% |
| $15,000 to $24,999 | 3,644 | 8.5% |
| $25,000 to $34,999 | 3,815 | 8.9% |
| $35,000 to $49,999 | 5,701 | 13.3% |
| $50,000 to $74,999 | 10,116 | 23.6% |
| $75,000 to $99,999 | 6,001 | 14.0% |
| $100,000 to $149,999 | 7,030 | 16.4% |
| $150,000 to $199,999 | 2,186 | 5.1% |
| $200,000+ | 1,715 | 4.0% |
Household Income by Householder Age in Palm Bay
The median household income in Palm Bay is $62,538, with the highest median household income of $73,312 found in the 45 to 64 years age bracket for the primary householder. A total of 16,501 households (38.5%) fall into this category. Meanwhile, the 15 to 24 years age bracket for the primary householder has the lowest median household income of $39,696, with 793 households (1.8%) in this group.
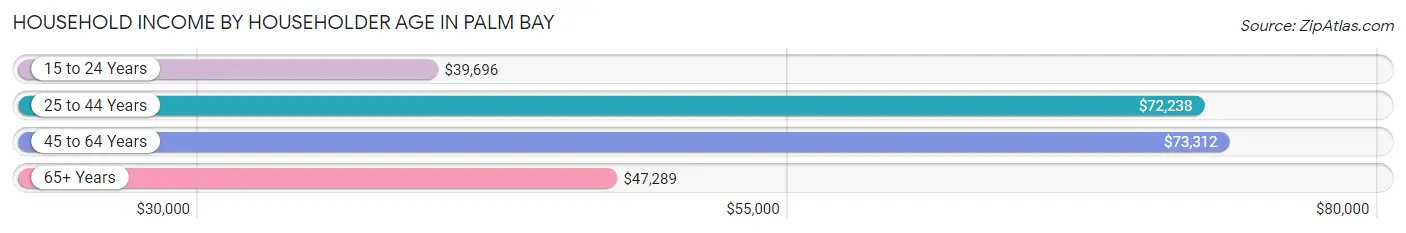
| Income Bracket | # Households | Median Income |
| 15 to 24 Years | 793 (1.8%) | $39,696 |
| 25 to 44 Years | 11,836 (27.6%) | $72,238 |
| 45 to 64 Years | 16,501 (38.5%) | $73,312 |
| 65+ Years | 13,735 (32.0%) | $47,289 |
| Total | 42,865 (100.0%) | $62,538 |
Poverty in Palm Bay
Income Below Poverty by Sex and Age in Palm Bay
With 11.7% poverty level for males and 13.5% for females among the residents of Palm Bay, 6 to 11 year old males and under 5 year old females are the most vulnerable to poverty, with 1,192 males (28.6%) and 716 females (23.6%) in their respective age groups living below the poverty level.
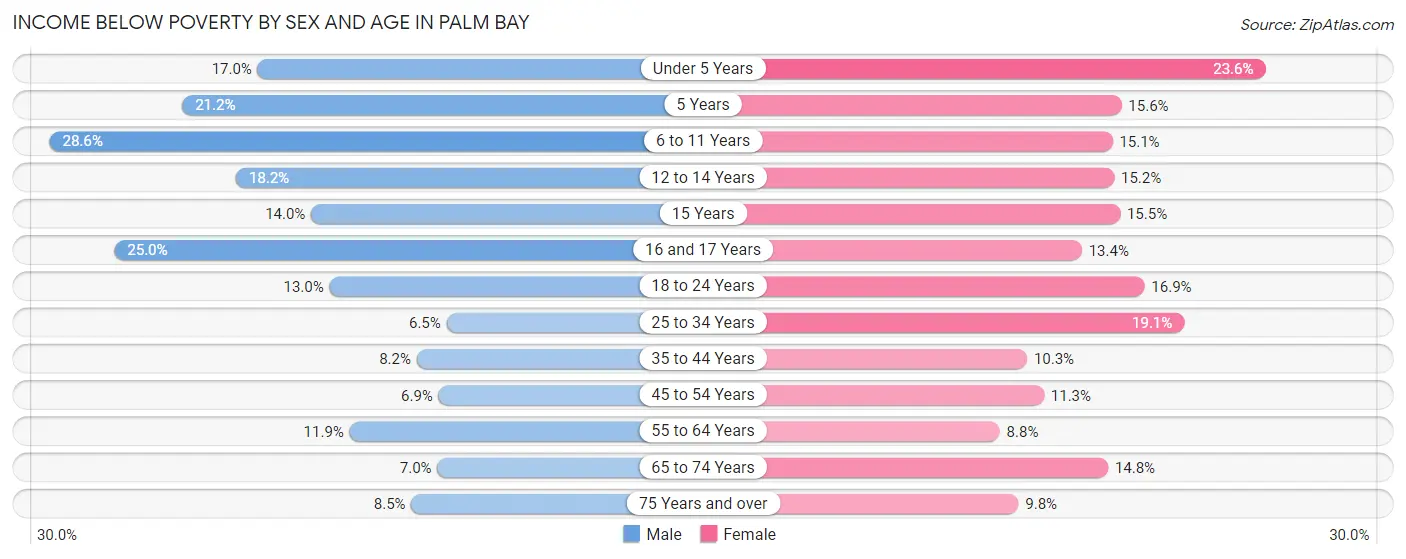
| Age Bracket | Male | Female |
| Under 5 Years | 652 (17.0%) | 716 (23.6%) |
| 5 Years | 188 (21.2%) | 71 (15.6%) |
| 6 to 11 Years | 1,192 (28.6%) | 690 (15.1%) |
| 12 to 14 Years | 370 (18.2%) | 378 (15.2%) |
| 15 Years | 136 (14.0%) | 79 (15.5%) |
| 16 and 17 Years | 363 (25.0%) | 273 (13.4%) |
| 18 to 24 Years | 619 (13.0%) | 731 (16.9%) |
| 25 to 34 Years | 513 (6.5%) | 1,312 (19.1%) |
| 35 to 44 Years | 601 (8.2%) | 806 (10.3%) |
| 45 to 54 Years | 442 (6.9%) | 802 (11.3%) |
| 55 to 64 Years | 1,060 (11.9%) | 853 (8.8%) |
| 65 to 74 Years | 482 (7.0%) | 957 (14.8%) |
| 75 Years and over | 346 (8.5%) | 562 (9.8%) |
| Total | 6,964 (11.7%) | 8,230 (13.5%) |
Income Above Poverty by Sex and Age in Palm Bay
According to the poverty statistics in Palm Bay, males aged 25 to 34 years and females aged 55 to 64 years are the age groups that are most secure financially, with 93.5% of males and 91.2% of females in these age groups living above the poverty line.
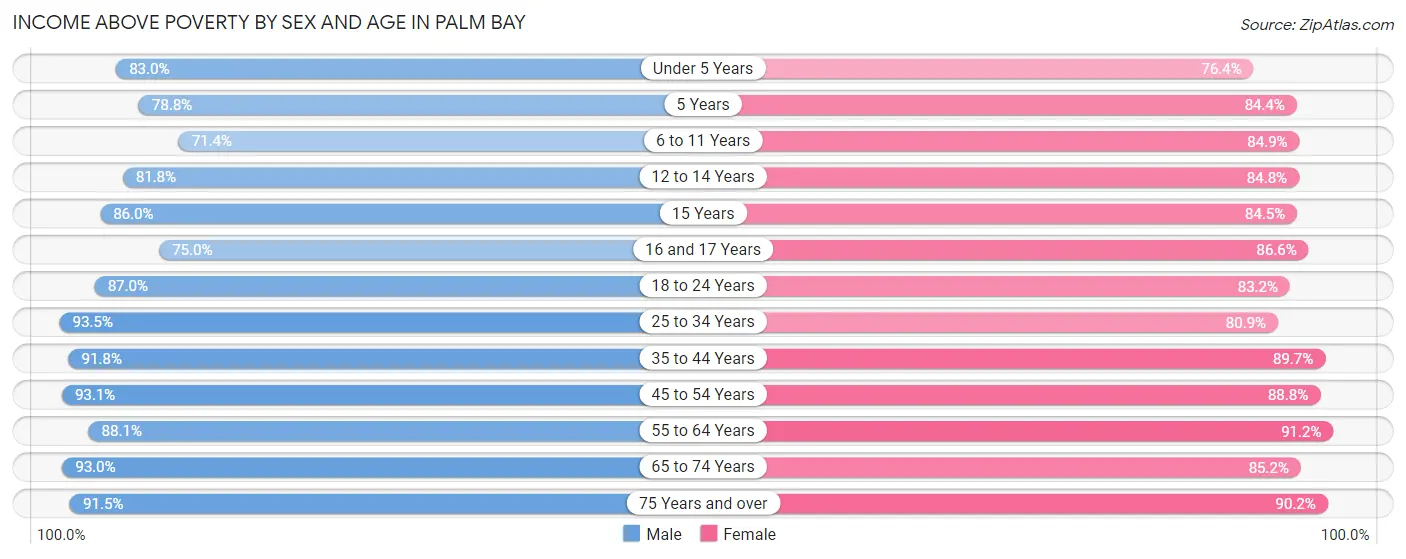
| Age Bracket | Male | Female |
| Under 5 Years | 3,178 (83.0%) | 2,321 (76.4%) |
| 5 Years | 698 (78.8%) | 385 (84.4%) |
| 6 to 11 Years | 2,974 (71.4%) | 3,888 (84.9%) |
| 12 to 14 Years | 1,660 (81.8%) | 2,116 (84.8%) |
| 15 Years | 833 (86.0%) | 431 (84.5%) |
| 16 and 17 Years | 1,089 (75.0%) | 1,770 (86.6%) |
| 18 to 24 Years | 4,134 (87.0%) | 3,607 (83.2%) |
| 25 to 34 Years | 7,383 (93.5%) | 5,573 (80.9%) |
| 35 to 44 Years | 6,763 (91.8%) | 7,010 (89.7%) |
| 45 to 54 Years | 5,924 (93.1%) | 6,327 (88.7%) |
| 55 to 64 Years | 7,847 (88.1%) | 8,850 (91.2%) |
| 65 to 74 Years | 6,396 (93.0%) | 5,500 (85.2%) |
| 75 Years and over | 3,744 (91.5%) | 5,156 (90.2%) |
| Total | 52,623 (88.3%) | 52,934 (86.5%) |
Income Below Poverty Among Married-Couple Families in Palm Bay
The poverty statistics for married-couple families in Palm Bay show that 5.9% or 1,254 of the total 21,451 families live below the poverty line. Families with 3 or 4 children have the highest poverty rate of 18.7%, comprising of 336 families. On the other hand, families with 5 or more children have the lowest poverty rate of 0.0%, which includes 0 families.
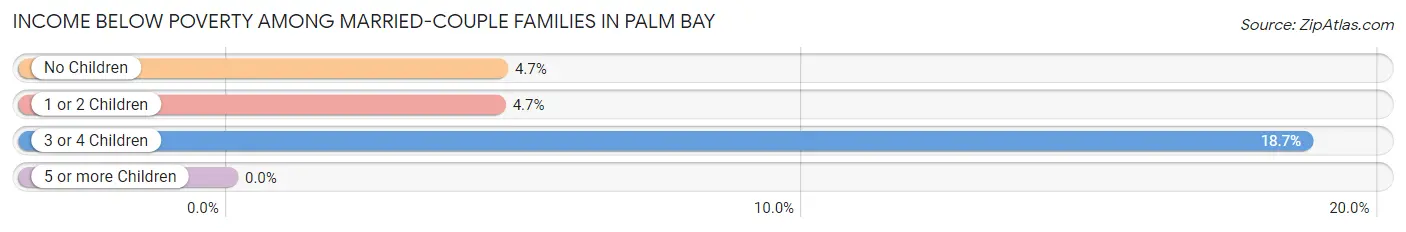
| Children | Above Poverty | Below Poverty |
| No Children | 12,914 (95.3%) | 637 (4.7%) |
| 1 or 2 Children | 5,754 (95.3%) | 281 (4.7%) |
| 3 or 4 Children | 1,460 (81.3%) | 336 (18.7%) |
| 5 or more Children | 69 (100.0%) | 0 (0.0%) |
| Total | 20,197 (94.2%) | 1,254 (5.9%) |
Income Below Poverty Among Single-Parent Households in Palm Bay
According to the poverty data in Palm Bay, 5.4% or 115 single-father households and 22.8% or 1,463 single-mother households are living below the poverty line. Among single-father households, those with 1 or 2 children have the highest poverty rate, with 82 households (10.2%) experiencing poverty. Likewise, among single-mother households, those with 5 or more children have the highest poverty rate, with 61 households (100.0%) falling below the poverty line.
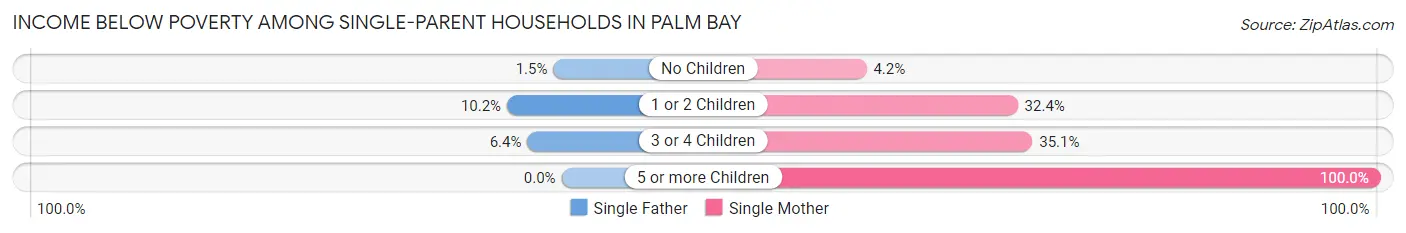
| Children | Single Father | Single Mother |
| No Children | 16 (1.5%) | 103 (4.2%) |
| 1 or 2 Children | 82 (10.2%) | 936 (32.4%) |
| 3 or 4 Children | 17 (6.4%) | 363 (35.1%) |
| 5 or more Children | 0 (0.0%) | 61 (100.0%) |
| Total | 115 (5.4%) | 1,463 (22.8%) |
Income Below Poverty Among Married-Couple vs Single-Parent Households in Palm Bay
The poverty data for Palm Bay shows that 1,254 of the married-couple family households (5.9%) and 1,578 of the single-parent households (18.5%) are living below the poverty level. Within the married-couple family households, those with 3 or 4 children have the highest poverty rate, with 336 households (18.7%) falling below the poverty line. Among the single-parent households, those with 5 or more children have the highest poverty rate, with 61 household (100.0%) living below poverty.
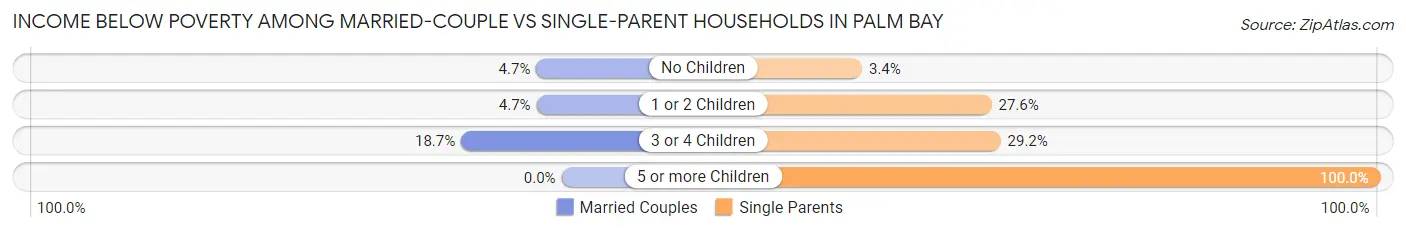
| Children | Married-Couple Families | Single-Parent Households |
| No Children | 637 (4.7%) | 119 (3.4%) |
| 1 or 2 Children | 281 (4.7%) | 1,018 (27.6%) |
| 3 or 4 Children | 336 (18.7%) | 380 (29.2%) |
| 5 or more Children | 0 (0.0%) | 61 (100.0%) |
| Total | 1,254 (5.9%) | 1,578 (18.5%) |
Race in Palm Bay
The most populous races in Palm Bay are White / Caucasian (76,112 | 62.6%), Black / African American (22,732 | 18.7%), and Hispanic or Latino (22,163 | 18.2%).
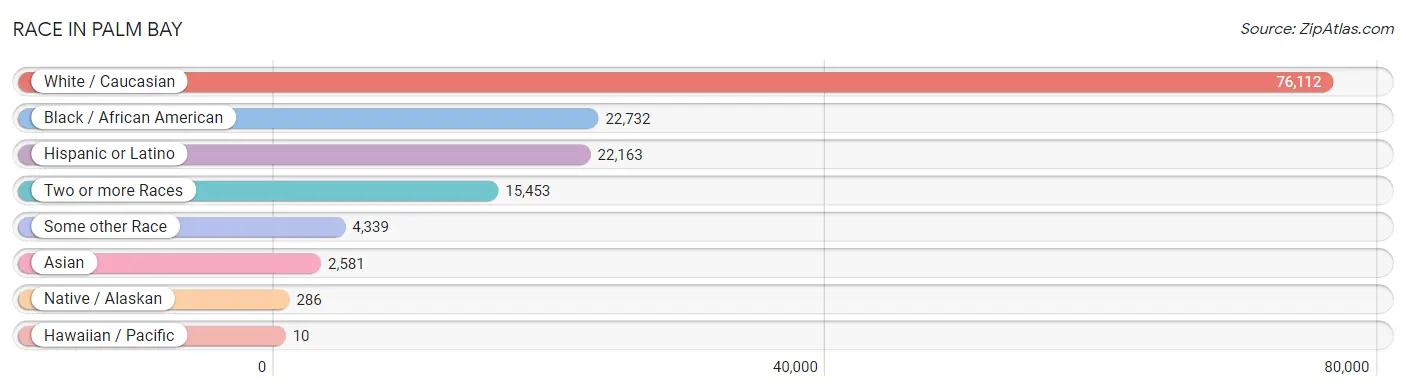
| Race | # Population | % Population |
| Asian | 2,581 | 2.1% |
| Black / African American | 22,732 | 18.7% |
| Hawaiian / Pacific | 10 | 0.0% |
| Hispanic or Latino | 22,163 | 18.2% |
| Native / Alaskan | 286 | 0.2% |
| White / Caucasian | 76,112 | 62.6% |
| Two or more Races | 15,453 | 12.7% |
| Some other Race | 4,339 | 3.6% |
| Total | 121,513 | 100.0% |
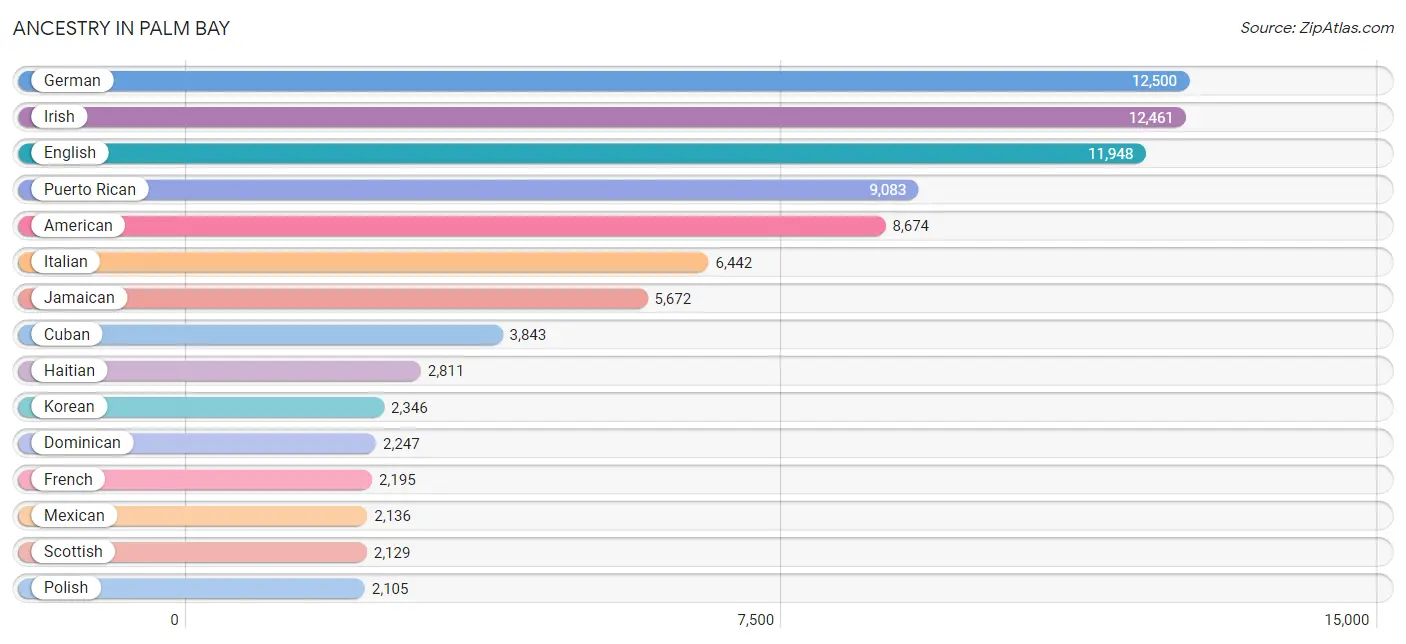
Ancestry in Palm Bay
The most populous ancestries reported in Palm Bay are German (12,500 | 10.3%), Irish (12,461 | 10.2%), English (11,948 | 9.8%), Puerto Rican (9,083 | 7.5%), and American (8,674 | 7.1%), together accounting for 45.0% of all Palm Bay residents.
| Ancestry | # Population | % Population |
| African | 481 | 0.4% |
| Albanian | 138 | 0.1% |
| Alsatian | 10 | 0.0% |
| American | 8,674 | 7.1% |
| Arab | 395 | 0.3% |
| Argentinean | 91 | 0.1% |
| Armenian | 66 | 0.1% |
| Australian | 32 | 0.0% |
| Austrian | 264 | 0.2% |
| Bahamian | 14 | 0.0% |
| Barbadian | 478 | 0.4% |
| Basque | 29 | 0.0% |
| Belgian | 64 | 0.1% |
| Belizean | 77 | 0.1% |
| Bhutanese | 854 | 0.7% |
| Blackfeet | 78 | 0.1% |
| Brazilian | 562 | 0.5% |
| British | 827 | 0.7% |
| British West Indian | 117 | 0.1% |
| Burmese | 121 | 0.1% |
| Cajun | 43 | 0.0% |
| Canadian | 562 | 0.5% |
| Cape Verdean | 58 | 0.1% |
| Celtic | 46 | 0.0% |
| Central American | 1,962 | 1.6% |
| Central American Indian | 259 | 0.2% |
| Cherokee | 542 | 0.4% |
| Chilean | 127 | 0.1% |
| Choctaw | 5 | 0.0% |
| Colombian | 1,395 | 1.1% |
| Comanche | 9 | 0.0% |
| Costa Rican | 355 | 0.3% |
| Creek | 10 | 0.0% |
| Croatian | 29 | 0.0% |
| Cuban | 3,843 | 3.2% |
| Czech | 227 | 0.2% |
| Czechoslovakian | 171 | 0.1% |
| Danish | 177 | 0.2% |
| Dominican | 2,247 | 1.8% |
| Dutch | 1,238 | 1.0% |
| Dutch West Indian | 13 | 0.0% |
| Eastern European | 166 | 0.1% |
| Ecuadorian | 22 | 0.0% |
| Egyptian | 19 | 0.0% |
| English | 11,948 | 9.8% |
| European | 1,299 | 1.1% |
| Filipino | 9 | 0.0% |
| Finnish | 159 | 0.1% |
| French | 2,195 | 1.8% |
| French Canadian | 1,397 | 1.1% |
| German | 12,500 | 10.3% |
| Ghanaian | 148 | 0.1% |
| Greek | 349 | 0.3% |
| Guatemalan | 362 | 0.3% |
| Guyanese | 91 | 0.1% |
| Haitian | 2,811 | 2.3% |
| Honduran | 482 | 0.4% |
| Hungarian | 637 | 0.5% |
| Indian (Asian) | 1,336 | 1.1% |
| Inupiat | 27 | 0.0% |
| Iraqi | 5 | 0.0% |
| Irish | 12,461 | 10.2% |
| Iroquois | 8 | 0.0% |
| Italian | 6,442 | 5.3% |
| Jamaican | 5,672 | 4.7% |
| Japanese | 8 | 0.0% |
| Korean | 2,346 | 1.9% |
| Laotian | 5 | 0.0% |
| Latvian | 20 | 0.0% |
| Lebanese | 99 | 0.1% |
| Lithuanian | 91 | 0.1% |
| Malaysian | 9 | 0.0% |
| Mexican | 2,136 | 1.8% |
| Mexican American Indian | 134 | 0.1% |
| Moroccan | 79 | 0.1% |
| Native Hawaiian | 102 | 0.1% |
| Nicaraguan | 58 | 0.1% |
| Nigerian | 27 | 0.0% |
| Northern European | 92 | 0.1% |
| Norwegian | 637 | 0.5% |
| Pakistani | 241 | 0.2% |
| Palestinian | 87 | 0.1% |
| Panamanian | 367 | 0.3% |
| Pennsylvania German | 27 | 0.0% |
| Peruvian | 229 | 0.2% |
| Polish | 2,105 | 1.7% |
| Portuguese | 783 | 0.6% |
| Puerto Rican | 9,083 | 7.5% |
| Romanian | 108 | 0.1% |
| Russian | 434 | 0.4% |
| Salvadoran | 338 | 0.3% |
| Samoan | 66 | 0.1% |
| Scandinavian | 269 | 0.2% |
| Scotch-Irish | 1,005 | 0.8% |
| Scottish | 2,129 | 1.8% |
| Seminole | 30 | 0.0% |
| Slavic | 46 | 0.0% |
| Slovak | 212 | 0.2% |
| Slovene | 105 | 0.1% |
| South African | 29 | 0.0% |
| South American | 1,977 | 1.6% |
| South American Indian | 15 | 0.0% |
| Spaniard | 206 | 0.2% |
| Spanish | 159 | 0.1% |
| Sri Lankan | 173 | 0.1% |
| Subsaharan African | 848 | 0.7% |
| Swedish | 1,272 | 1.1% |
| Swiss | 81 | 0.1% |
| Syrian | 57 | 0.1% |
| Thai | 787 | 0.6% |
| Trinidadian and Tobagonian | 1,115 | 0.9% |
| U.S. Virgin Islander | 23 | 0.0% |
| Ukrainian | 308 | 0.3% |
| Venezuelan | 113 | 0.1% |
| Vietnamese | 19 | 0.0% |
| Welsh | 1,240 | 1.0% |
| West Indian | 311 | 0.3% |
| Yugoslavian | 37 | 0.0% | View All 118 Rows |
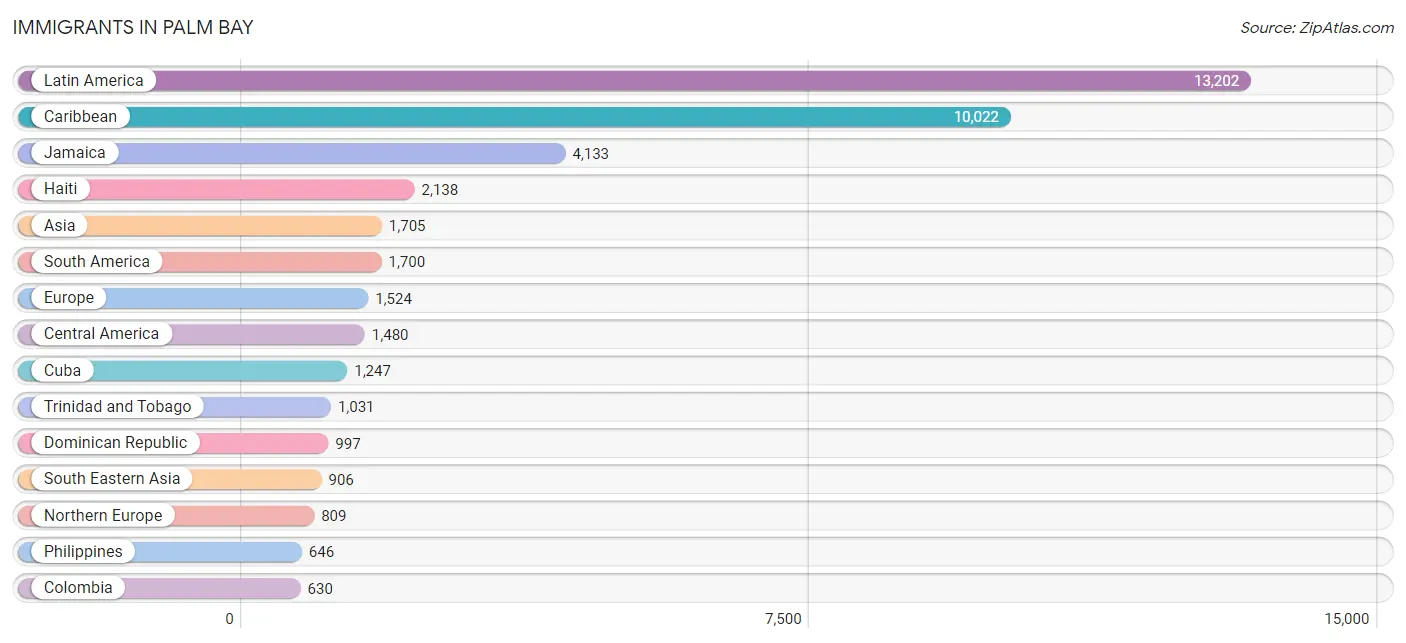
Immigrants in Palm Bay
The most numerous immigrant groups reported in Palm Bay came from Latin America (13,202 | 10.9%), Caribbean (10,022 | 8.3%), Jamaica (4,133 | 3.4%), Haiti (2,138 | 1.8%), and Asia (1,705 | 1.4%), together accounting for 25.7% of all Palm Bay residents.
| Immigration Origin | # Population | % Population |
| Africa | 512 | 0.4% |
| Albania | 40 | 0.0% |
| Argentina | 32 | 0.0% |
| Asia | 1,705 | 1.4% |
| Australia | 37 | 0.0% |
| Bahamas | 47 | 0.0% |
| Bangladesh | 39 | 0.0% |
| Barbados | 136 | 0.1% |
| Belgium | 19 | 0.0% |
| Belize | 77 | 0.1% |
| Brazil | 566 | 0.5% |
| Cabo Verde | 54 | 0.0% |
| Canada | 205 | 0.2% |
| Caribbean | 10,022 | 8.3% |
| Central America | 1,480 | 1.2% |
| Chile | 81 | 0.1% |
| China | 359 | 0.3% |
| Colombia | 630 | 0.5% |
| Costa Rica | 194 | 0.2% |
| Cuba | 1,247 | 1.0% |
| Czechoslovakia | 18 | 0.0% |
| Denmark | 15 | 0.0% |
| Dominican Republic | 997 | 0.8% |
| Eastern Africa | 13 | 0.0% |
| Eastern Asia | 483 | 0.4% |
| Eastern Europe | 189 | 0.2% |
| Ecuador | 10 | 0.0% |
| Egypt | 19 | 0.0% |
| El Salvador | 267 | 0.2% |
| England | 338 | 0.3% |
| Ethiopia | 13 | 0.0% |
| Europe | 1,524 | 1.3% |
| France | 33 | 0.0% |
| Germany | 230 | 0.2% |
| Ghana | 279 | 0.2% |
| Grenada | 212 | 0.2% |
| Guatemala | 212 | 0.2% |
| Guyana | 193 | 0.2% |
| Haiti | 2,138 | 1.8% |
| Honduras | 88 | 0.1% |
| Hungary | 42 | 0.0% |
| India | 98 | 0.1% |
| Indonesia | 5 | 0.0% |
| Iraq | 52 | 0.0% |
| Ireland | 104 | 0.1% |
| Italy | 91 | 0.1% |
| Jamaica | 4,133 | 3.4% |
| Japan | 47 | 0.0% |
| Korea | 77 | 0.1% |
| Latin America | 13,202 | 10.9% |
| Lebanon | 48 | 0.0% |
| Mexico | 501 | 0.4% |
| Morocco | 82 | 0.1% |
| Nicaragua | 40 | 0.0% |
| Nigeria | 36 | 0.0% |
| Northern Africa | 101 | 0.1% |
| Northern Europe | 809 | 0.7% |
| Oceania | 37 | 0.0% |
| Pakistan | 22 | 0.0% |
| Panama | 101 | 0.1% |
| Peru | 70 | 0.1% |
| Philippines | 646 | 0.5% |
| Poland | 59 | 0.1% |
| Russia | 30 | 0.0% |
| Scotland | 27 | 0.0% |
| South Africa | 29 | 0.0% |
| South America | 1,700 | 1.4% |
| South Central Asia | 159 | 0.1% |
| South Eastern Asia | 906 | 0.7% |
| Southern Europe | 244 | 0.2% |
| Spain | 153 | 0.1% |
| St. Vincent and the Grenadines | 30 | 0.0% |
| Taiwan | 27 | 0.0% |
| Thailand | 105 | 0.1% |
| Trinidad and Tobago | 1,031 | 0.9% |
| Venezuela | 110 | 0.1% |
| Vietnam | 150 | 0.1% |
| West Indies | 20 | 0.0% |
| Western Africa | 369 | 0.3% |
| Western Asia | 157 | 0.1% |
| Western Europe | 282 | 0.2% | View All 81 Rows |
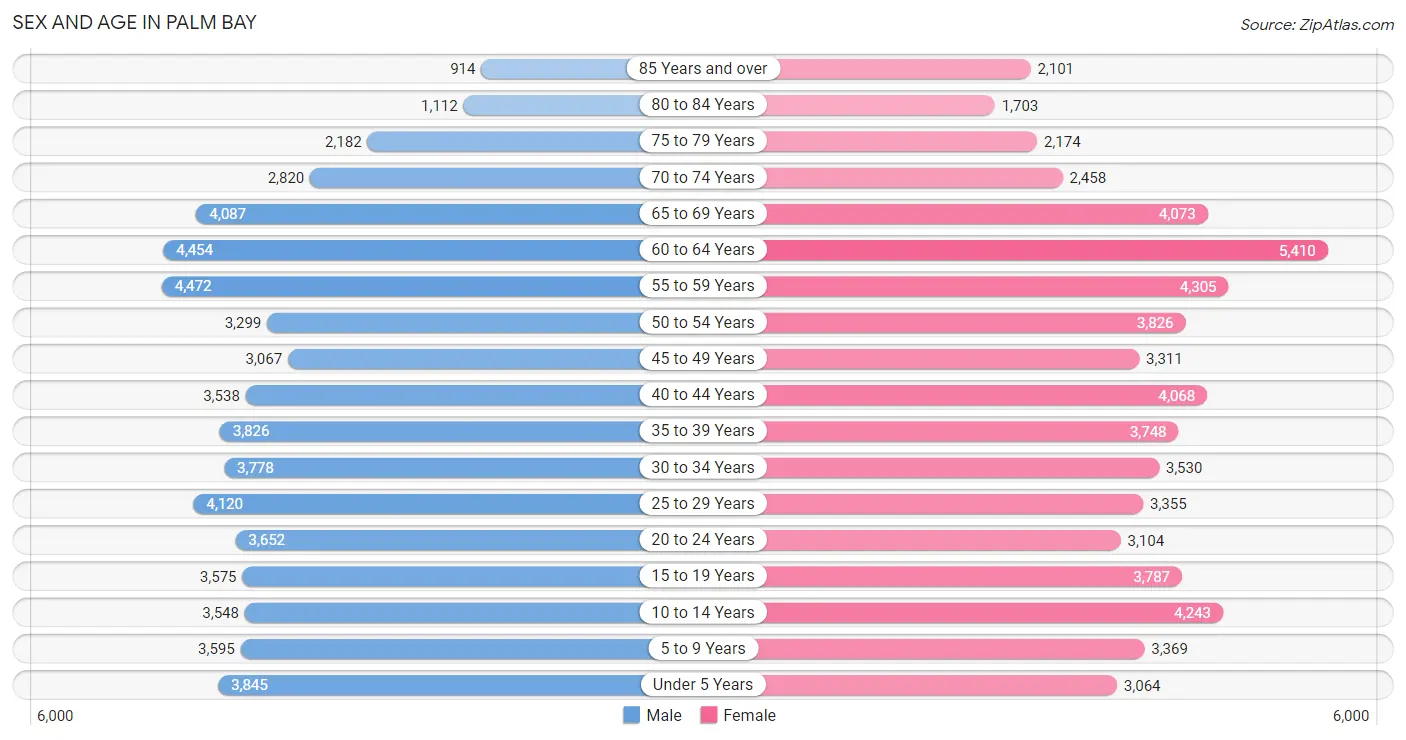
Sex and Age in Palm Bay
Sex and Age in Palm Bay
The most populous age groups in Palm Bay are 55 to 59 Years (4,472 | 7.5%) for men and 60 to 64 Years (5,410 | 8.8%) for women.
| Age Bracket | Male | Female |
| Under 5 Years | 3,845 (6.4%) | 3,064 (5.0%) |
| 5 to 9 Years | 3,595 (6.0%) | 3,369 (5.5%) |
| 10 to 14 Years | 3,548 (5.9%) | 4,243 (6.9%) |
| 15 to 19 Years | 3,575 (6.0%) | 3,787 (6.1%) |
| 20 to 24 Years | 3,652 (6.1%) | 3,104 (5.0%) |
| 25 to 29 Years | 4,120 (6.9%) | 3,355 (5.4%) |
| 30 to 34 Years | 3,778 (6.3%) | 3,530 (5.7%) |
| 35 to 39 Years | 3,826 (6.4%) | 3,748 (6.1%) |
| 40 to 44 Years | 3,538 (5.9%) | 4,068 (6.6%) |
| 45 to 49 Years | 3,067 (5.1%) | 3,311 (5.4%) |
| 50 to 54 Years | 3,299 (5.5%) | 3,826 (6.2%) |
| 55 to 59 Years | 4,472 (7.5%) | 4,305 (7.0%) |
| 60 to 64 Years | 4,454 (7.4%) | 5,410 (8.8%) |
| 65 to 69 Years | 4,087 (6.8%) | 4,073 (6.6%) |
| 70 to 74 Years | 2,820 (4.7%) | 2,458 (4.0%) |
| 75 to 79 Years | 2,182 (3.6%) | 2,174 (3.5%) |
| 80 to 84 Years | 1,112 (1.9%) | 1,703 (2.8%) |
| 85 Years and over | 914 (1.5%) | 2,101 (3.4%) |
| Total | 59,884 (100.0%) | 61,629 (100.0%) |
Families and Households in Palm Bay
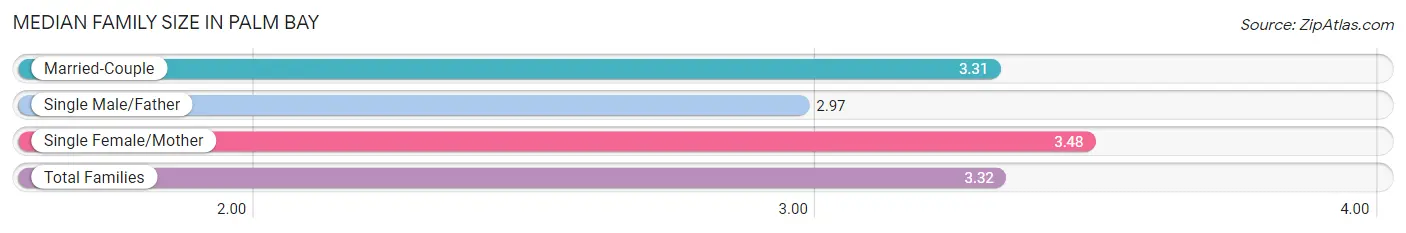
Median Family Size in Palm Bay
The median family size in Palm Bay is 3.32 persons per family, with single female/mother families (6,410 | 21.4%) accounting for the largest median family size of 3.48 persons per family. On the other hand, single male/father families (2,121 | 7.1%) represent the smallest median family size with 2.97 persons per family.
| Family Type | # Families | Family Size |
| Married-Couple | 21,451 (71.6%) | 3.31 |
| Single Male/Father | 2,121 (7.1%) | 2.97 |
| Single Female/Mother | 6,410 (21.4%) | 3.48 |
| Total Families | 29,982 (100.0%) | 3.32 |
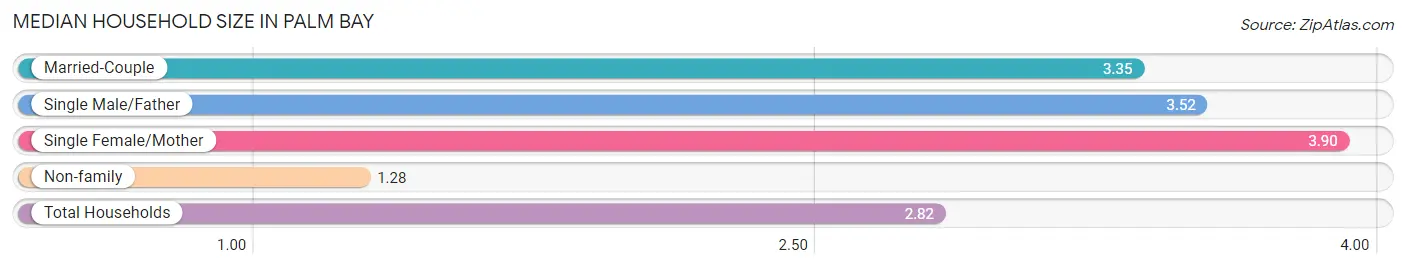
Median Household Size in Palm Bay
The median household size in Palm Bay is 2.82 persons per household, with single female/mother households (6,410 | 14.9%) accounting for the largest median household size of 3.9 persons per household. non-family households (12,883 | 30.0%) represent the smallest median household size with 1.28 persons per household.
| Household Type | # Households | Household Size |
| Married-Couple | 21,451 (50.0%) | 3.35 |
| Single Male/Father | 2,121 (5.0%) | 3.52 |
| Single Female/Mother | 6,410 (14.9%) | 3.90 |
| Non-family | 12,883 (30.0%) | 1.28 |
| Total Households | 42,865 (100.0%) | 2.82 |
Household Size by Marriage Status in Palm Bay
Out of a total of 42,865 households in Palm Bay, 29,982 (70.0%) are family households, while 12,883 (30.0%) are nonfamily households. The most numerous type of family households are 2-person households, comprising 12,413, and the most common type of nonfamily households are 1-person households, comprising 10,469.
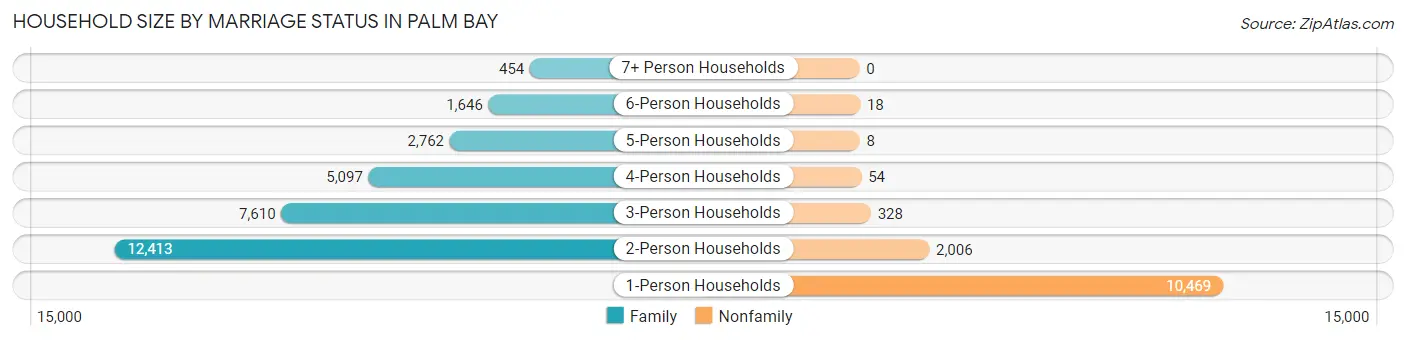
| Household Size | Family Households | Nonfamily Households |
| 1-Person Households | - | 10,469 (24.4%) |
| 2-Person Households | 12,413 (29.0%) | 2,006 (4.7%) |
| 3-Person Households | 7,610 (17.7%) | 328 (0.8%) |
| 4-Person Households | 5,097 (11.9%) | 54 (0.1%) |
| 5-Person Households | 2,762 (6.4%) | 8 (0.0%) |
| 6-Person Households | 1,646 (3.8%) | 18 (0.0%) |
| 7+ Person Households | 454 (1.1%) | 0 (0.0%) |
| Total | 29,982 (70.0%) | 12,883 (30.0%) |
Female Fertility in Palm Bay
Fertility by Age in Palm Bay
Average fertility rate in Palm Bay is 51.0 births per 1,000 women. Women in the age bracket of 20 to 34 years have the highest fertility rate with 92.0 births per 1,000 women. Women in the age bracket of 20 to 34 years acount for 71.2% of all women with births.
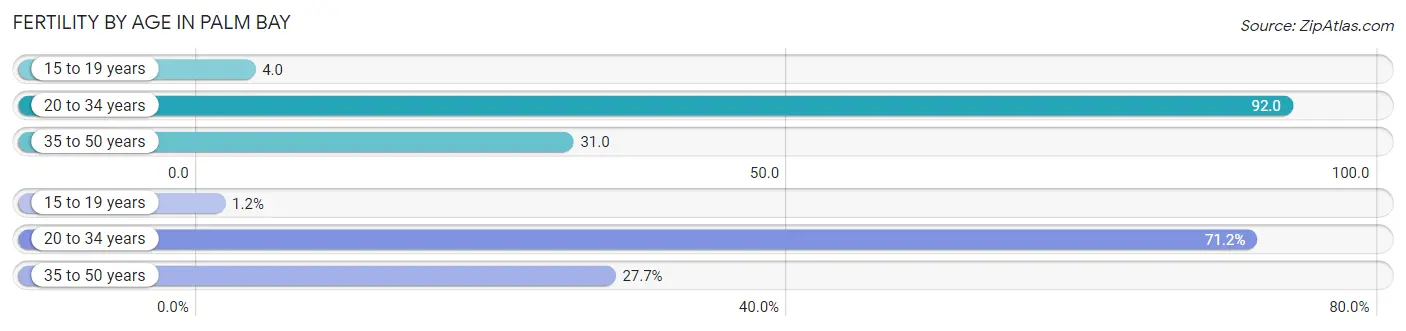
| Age Bracket | Women with Births | Births / 1,000 Women |
| 15 to 19 years | 15 (1.2%) | 4.0 |
| 20 to 34 years | 919 (71.2%) | 92.0 |
| 35 to 50 years | 357 (27.7%) | 31.0 |
| Total | 1,291 (100.0%) | 51.0 |
Fertility by Age by Marriage Status in Palm Bay
51.1% of women with births (1,291) in Palm Bay are married. The highest percentage of unmarried women with births falls into 20 to 34 years age bracket with 61.9% of them unmarried at the time of birth, while the lowest percentage of unmarried women with births belong to 15 to 19 years age bracket with 0.0% of them unmarried.
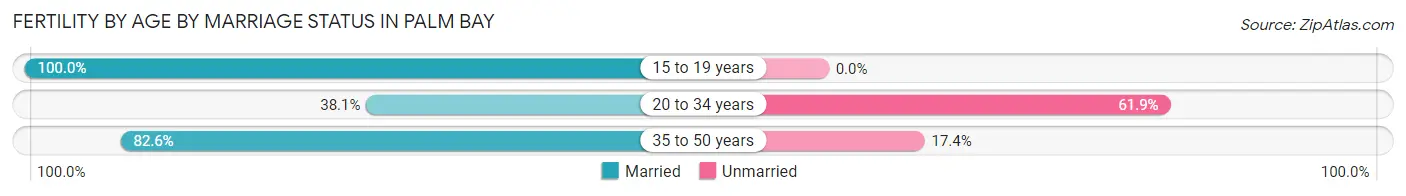
| Age Bracket | Married | Unmarried |
| 15 to 19 years | 15 (100.0%) | 0 (0.0%) |
| 20 to 34 years | 350 (38.1%) | 569 (61.9%) |
| 35 to 50 years | 295 (82.6%) | 62 (17.4%) |
| Total | 660 (51.1%) | 631 (48.9%) |
Fertility by Education in Palm Bay
Average fertility rate in Palm Bay is 51.0 births per 1,000 women. Women with the education attainment of college or associate's degree have the highest fertility rate of 73.0 births per 1,000 women, while women with the education attainment of less than high school have the lowest fertility at 13.0 births per 1,000 women. Women with the education attainment of college or associate's degree represent 56.2% of all women with births.
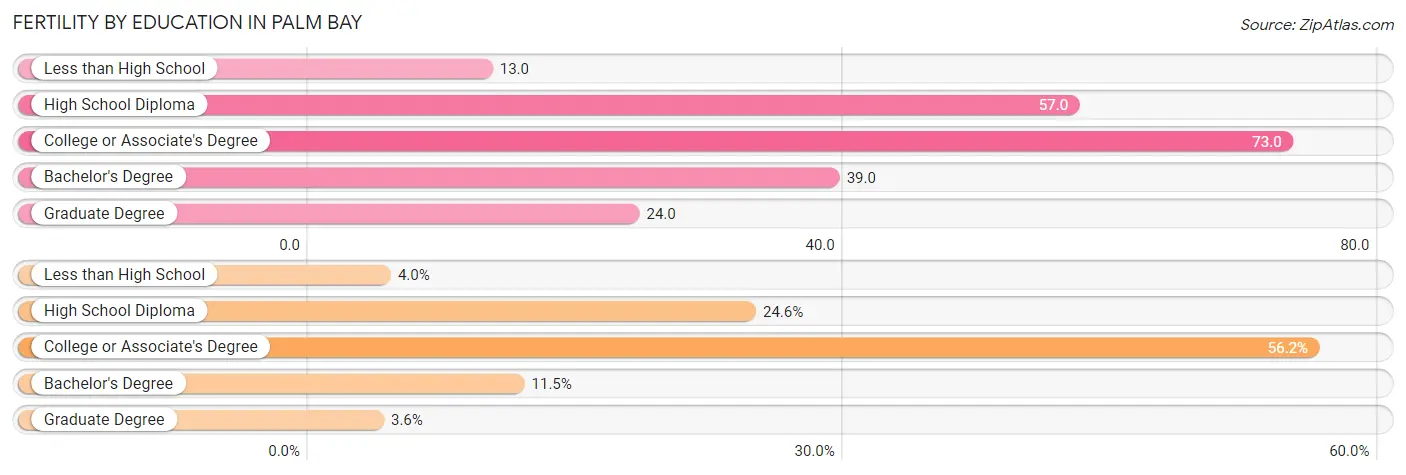
| Educational Attainment | Women with Births | Births / 1,000 Women |
| Less than High School | 52 (4.0%) | 13.0 |
| High School Diploma | 317 (24.5%) | 57.0 |
| College or Associate's Degree | 726 (56.2%) | 73.0 |
| Bachelor's Degree | 149 (11.5%) | 39.0 |
| Graduate Degree | 47 (3.6%) | 24.0 |
| Total | 1,291 (100.0%) | 51.0 |
Fertility by Education by Marriage Status in Palm Bay
48.9% of women with births in Palm Bay are unmarried. Women with the educational attainment of less than high school are most likely to be married with 100.0% of them married at childbirth, while women with the educational attainment of high school diploma are least likely to be married with 79.8% of them unmarried at childbirth.
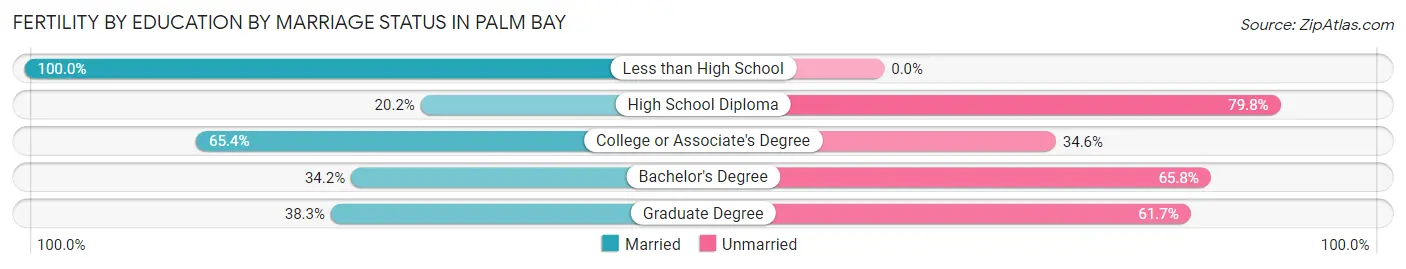
| Educational Attainment | Married | Unmarried |
| Less than High School | 52 (100.0%) | 0 (0.0%) |
| High School Diploma | 64 (20.2%) | 253 (79.8%) |
| College or Associate's Degree | 475 (65.4%) | 251 (34.6%) |
| Bachelor's Degree | 51 (34.2%) | 98 (65.8%) |
| Graduate Degree | 18 (38.3%) | 29 (61.7%) |
| Total | 660 (51.1%) | 631 (48.9%) |
Employment Characteristics in Palm Bay
Employment by Class of Employer in Palm Bay
Among the 53,227 employed individuals in Palm Bay, private company employees (37,774 | 71.0%), not-for-profit organizations (4,342 | 8.2%), and local government employees (3,620 | 6.8%) make up the most common classes of employment.
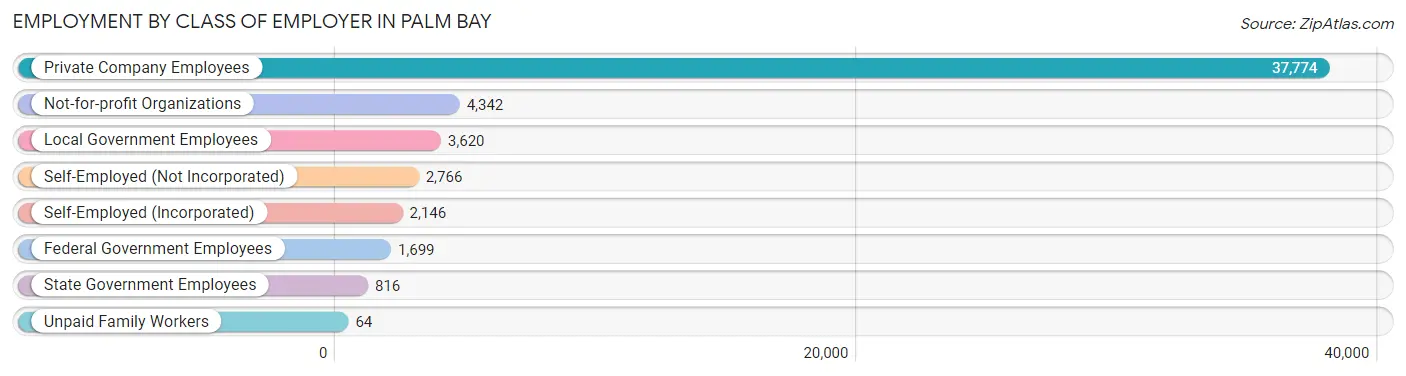
| Employer Class | # Employees | % Employees |
| Private Company Employees | 37,774 | 71.0% |
| Self-Employed (Incorporated) | 2,146 | 4.0% |
| Self-Employed (Not Incorporated) | 2,766 | 5.2% |
| Not-for-profit Organizations | 4,342 | 8.2% |
| Local Government Employees | 3,620 | 6.8% |
| State Government Employees | 816 | 1.5% |
| Federal Government Employees | 1,699 | 3.2% |
| Unpaid Family Workers | 64 | 0.1% |
| Total | 53,227 | 100.0% |
Employment Status by Age in Palm Bay
According to the labor force statistics for Palm Bay, out of the total population over 16 years of age (98,367), 59.0% or 58,037 individuals are in the labor force, with 5.7% or 3,308 of them unemployed. The age group with the highest labor force participation rate is 35 to 44 years, with 86.9% or 13,191 individuals in the labor force. Within the labor force, the 16 to 19 years age range has the highest percentage of unemployed individuals, with 23.6% or 609 of them being unemployed.
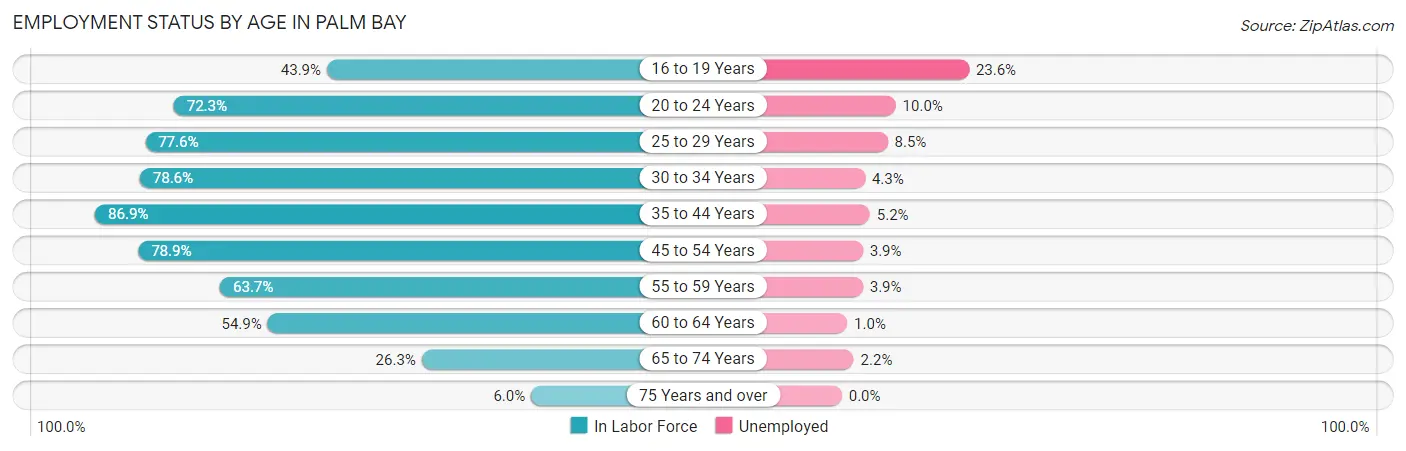
| Age Bracket | In Labor Force | Unemployed |
| 16 to 19 Years | 2,581 (43.9%) | 609 (23.6%) |
| 20 to 24 Years | 4,885 (72.3%) | 488 (10.0%) |
| 25 to 29 Years | 5,801 (77.6%) | 493 (8.5%) |
| 30 to 34 Years | 5,744 (78.6%) | 247 (4.3%) |
| 35 to 44 Years | 13,191 (86.9%) | 686 (5.2%) |
| 45 to 54 Years | 10,654 (78.9%) | 416 (3.9%) |
| 55 to 59 Years | 5,591 (63.7%) | 218 (3.9%) |
| 60 to 64 Years | 5,415 (54.9%) | 54 (1.0%) |
| 65 to 74 Years | 3,534 (26.3%) | 78 (2.2%) |
| 75 Years and over | 611 (6.0%) | 0 (0.0%) |
| Total | 58,037 (59.0%) | 3,308 (5.7%) |
Employment Status by Educational Attainment in Palm Bay
According to labor force statistics for Palm Bay, 74.7% of individuals (46,394) out of the total population between 25 and 64 years of age (62,107) are in the labor force, with 4.6% or 2,134 of them being unemployed. The group with the highest labor force participation rate are those with the educational attainment of bachelor's degree or higher, with 84.8% or 12,143 individuals in the labor force. Within the labor force, individuals with high school diploma education have the highest percentage of unemployment, with 6.8% or 866 of them being unemployed.
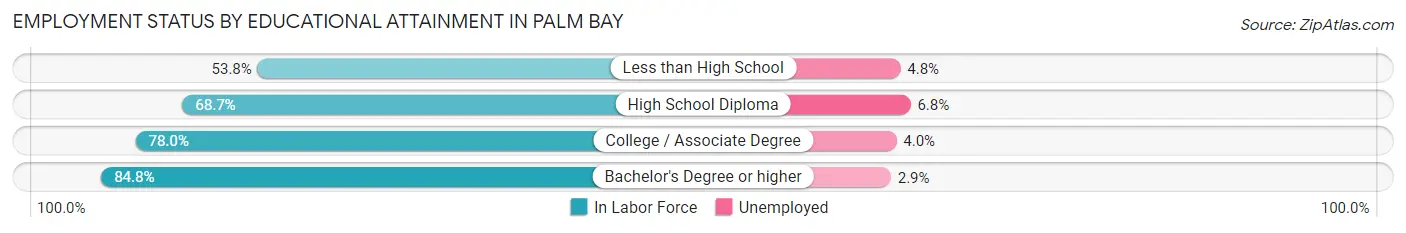
| Educational Attainment | In Labor Force | Unemployed |
| Less than High School | 2,903 (53.8%) | 259 (4.8%) |
| High School Diploma | 12,734 (68.7%) | 1,260 (6.8%) |
| College / Associate Degree | 18,608 (78.0%) | 954 (4.0%) |
| Bachelor's Degree or higher | 12,143 (84.8%) | 415 (2.9%) |
| Total | 46,394 (74.7%) | 2,857 (4.6%) |
Employment Occupations by Sex in Palm Bay
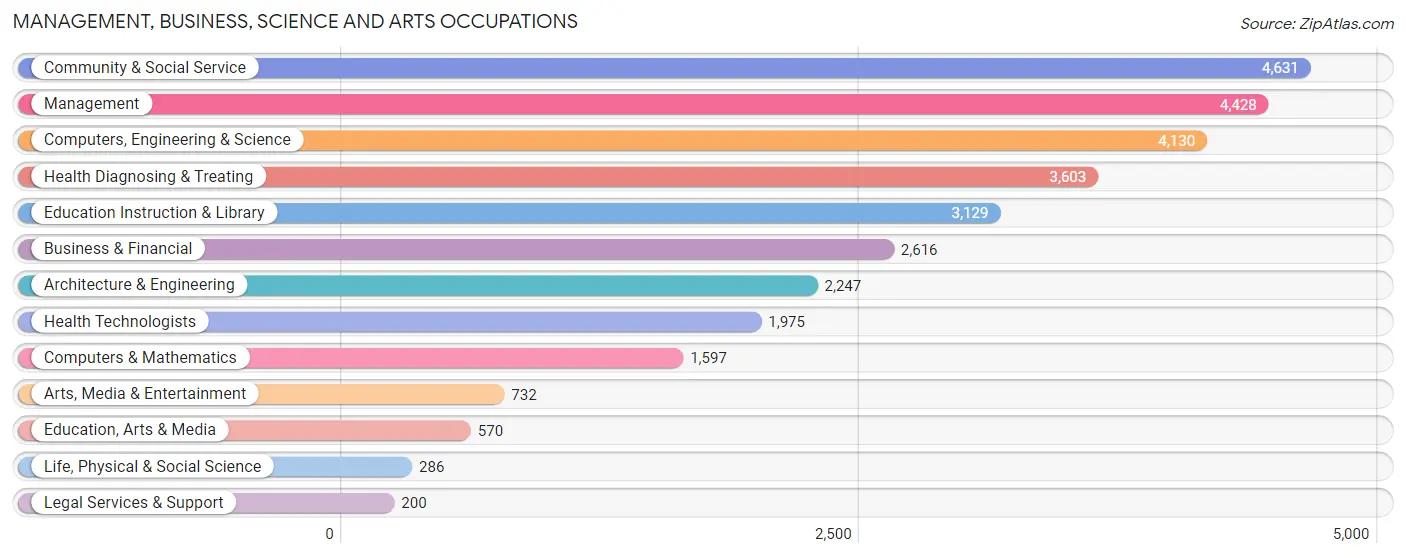
Management, Business, Science and Arts Occupations
The most common Management, Business, Science and Arts occupations in Palm Bay are Community & Social Service (4,631 | 8.5%), Management (4,428 | 8.2%), Computers, Engineering & Science (4,130 | 7.6%), Health Diagnosing & Treating (3,603 | 6.7%), and Education Instruction & Library (3,129 | 5.8%).
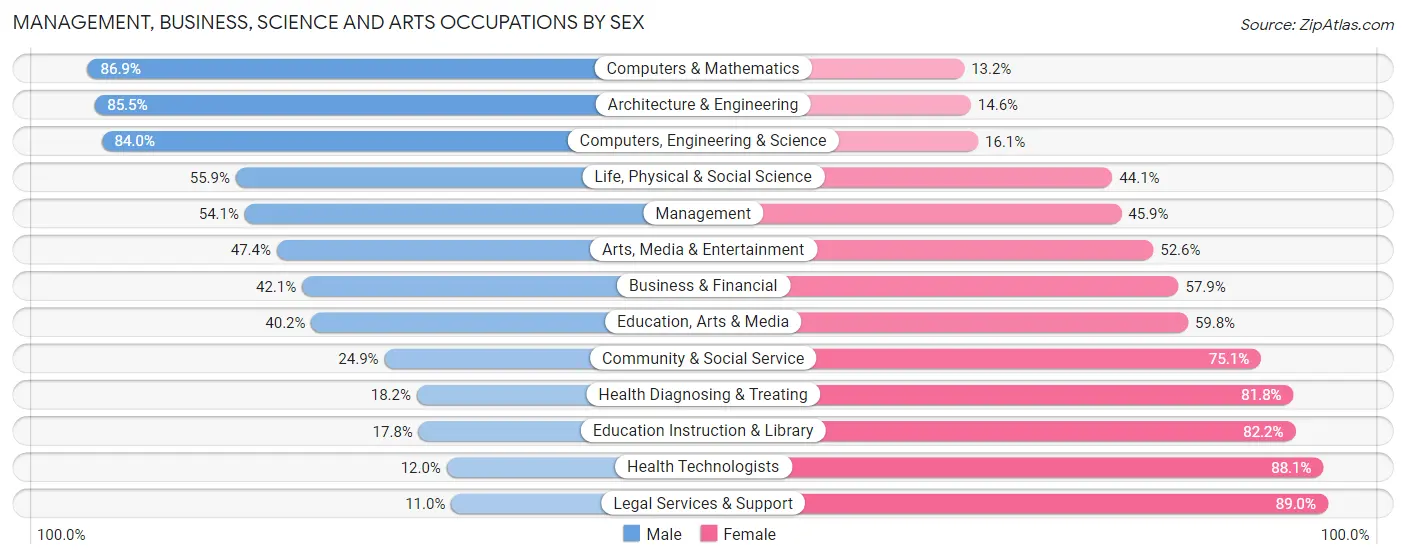
Management, Business, Science and Arts Occupations by Sex
Within the Management, Business, Science and Arts occupations in Palm Bay, the most male-oriented occupations are Computers & Mathematics (86.9%), Architecture & Engineering (85.5%), and Computers, Engineering & Science (84.0%), while the most female-oriented occupations are Legal Services & Support (89.0%), Health Technologists (88.0%), and Education Instruction & Library (82.2%).
| Occupation | Male | Female |
| Management | 2,394 (54.1%) | 2,034 (45.9%) |
| Business & Financial | 1,102 (42.1%) | 1,514 (57.9%) |
| Computers, Engineering & Science | 3,467 (84.0%) | 663 (16.1%) |
| Computers & Mathematics | 1,387 (86.9%) | 210 (13.2%) |
| Architecture & Engineering | 1,920 (85.5%) | 327 (14.5%) |
| Life, Physical & Social Science | 160 (55.9%) | 126 (44.1%) |
| Community & Social Service | 1,155 (24.9%) | 3,476 (75.1%) |
| Education, Arts & Media | 229 (40.2%) | 341 (59.8%) |
| Legal Services & Support | 22 (11.0%) | 178 (89.0%) |
| Education Instruction & Library | 557 (17.8%) | 2,572 (82.2%) |
| Arts, Media & Entertainment | 347 (47.4%) | 385 (52.6%) |
| Health Diagnosing & Treating | 655 (18.2%) | 2,948 (81.8%) |
| Health Technologists | 236 (11.9%) | 1,739 (88.0%) |
| Total (Category) | 8,773 (45.2%) | 10,635 (54.8%) |
| Total (Overall) | 28,002 (51.6%) | 26,212 (48.3%) |
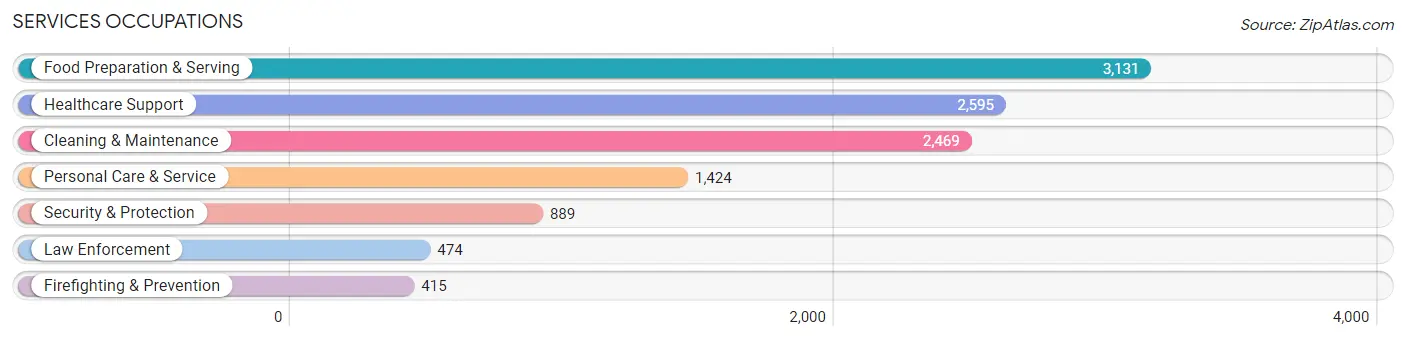
Services Occupations
The most common Services occupations in Palm Bay are Food Preparation & Serving (3,131 | 5.8%), Healthcare Support (2,595 | 4.8%), Cleaning & Maintenance (2,469 | 4.5%), Personal Care & Service (1,424 | 2.6%), and Security & Protection (889 | 1.6%).
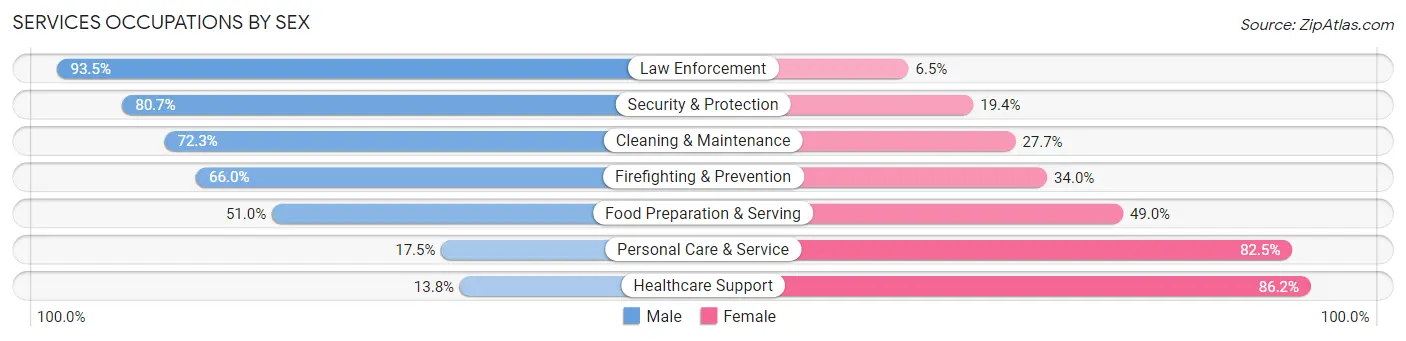
Services Occupations by Sex
Within the Services occupations in Palm Bay, the most male-oriented occupations are Law Enforcement (93.5%), Security & Protection (80.6%), and Cleaning & Maintenance (72.3%), while the most female-oriented occupations are Healthcare Support (86.2%), Personal Care & Service (82.5%), and Food Preparation & Serving (49.0%).
| Occupation | Male | Female |
| Healthcare Support | 358 (13.8%) | 2,237 (86.2%) |
| Security & Protection | 717 (80.6%) | 172 (19.4%) |
| Firefighting & Prevention | 274 (66.0%) | 141 (34.0%) |
| Law Enforcement | 443 (93.5%) | 31 (6.5%) |
| Food Preparation & Serving | 1,597 (51.0%) | 1,534 (49.0%) |
| Cleaning & Maintenance | 1,785 (72.3%) | 684 (27.7%) |
| Personal Care & Service | 249 (17.5%) | 1,175 (82.5%) |
| Total (Category) | 4,706 (44.8%) | 5,802 (55.2%) |
| Total (Overall) | 28,002 (51.6%) | 26,212 (48.3%) |
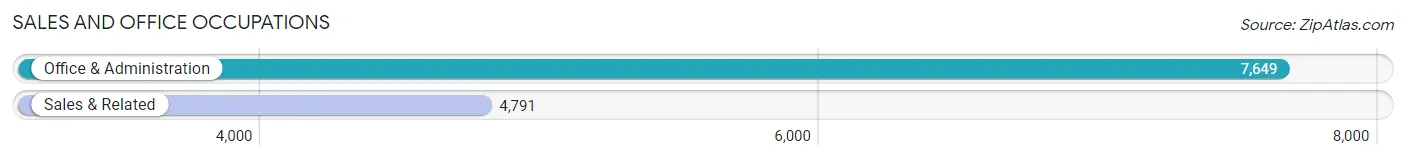
Sales and Office Occupations
The most common Sales and Office occupations in Palm Bay are Office & Administration (7,649 | 14.1%), and Sales & Related (4,791 | 8.8%).
Sales and Office Occupations by Sex
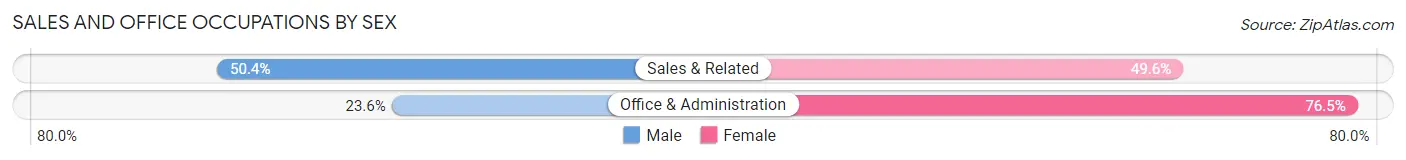
| Occupation | Male | Female |
| Sales & Related | 2,414 (50.4%) | 2,377 (49.6%) |
| Office & Administration | 1,801 (23.5%) | 5,848 (76.4%) |
| Total (Category) | 4,215 (33.9%) | 8,225 (66.1%) |
| Total (Overall) | 28,002 (51.6%) | 26,212 (48.3%) |
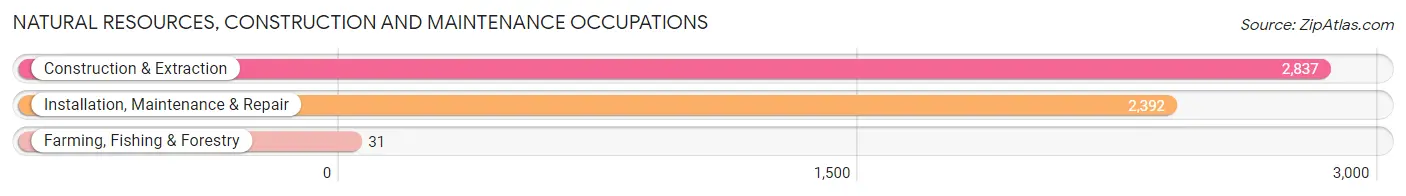
Natural Resources, Construction and Maintenance Occupations
The most common Natural Resources, Construction and Maintenance occupations in Palm Bay are Construction & Extraction (2,837 | 5.2%), Installation, Maintenance & Repair (2,392 | 4.4%), and Farming, Fishing & Forestry (31 | 0.1%).
Natural Resources, Construction and Maintenance Occupations by Sex
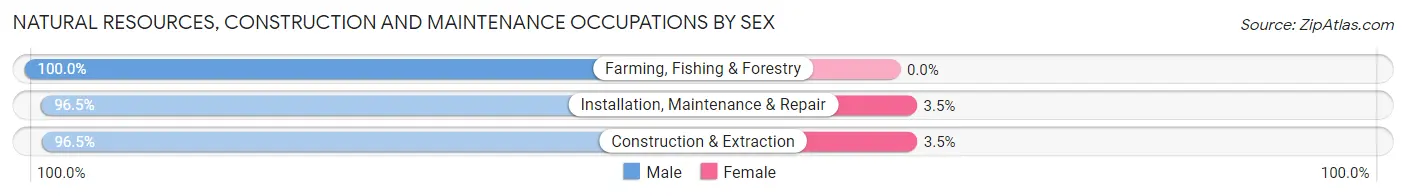
| Occupation | Male | Female |
| Farming, Fishing & Forestry | 31 (100.0%) | 0 (0.0%) |
| Construction & Extraction | 2,737 (96.5%) | 100 (3.5%) |
| Installation, Maintenance & Repair | 2,309 (96.5%) | 83 (3.5%) |
| Total (Category) | 5,077 (96.5%) | 183 (3.5%) |
| Total (Overall) | 28,002 (51.6%) | 26,212 (48.3%) |
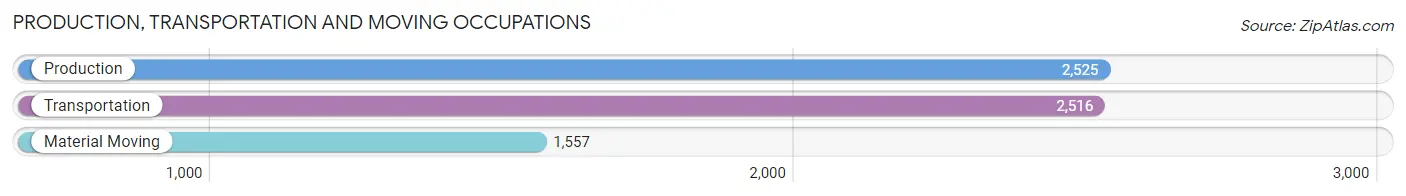
Production, Transportation and Moving Occupations
The most common Production, Transportation and Moving occupations in Palm Bay are Production (2,525 | 4.7%), Transportation (2,516 | 4.6%), and Material Moving (1,557 | 2.9%).
Production, Transportation and Moving Occupations by Sex
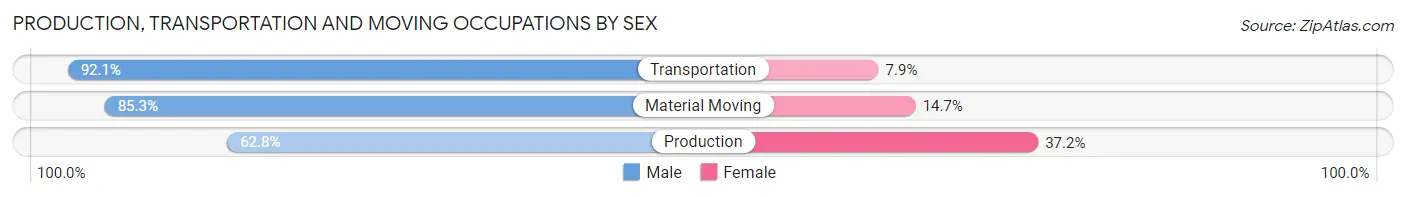
| Occupation | Male | Female |
| Production | 1,586 (62.8%) | 939 (37.2%) |
| Transportation | 2,317 (92.1%) | 199 (7.9%) |
| Material Moving | 1,328 (85.3%) | 229 (14.7%) |
| Total (Category) | 5,231 (79.3%) | 1,367 (20.7%) |
| Total (Overall) | 28,002 (51.6%) | 26,212 (48.3%) |
Employment Industries by Sex in Palm Bay
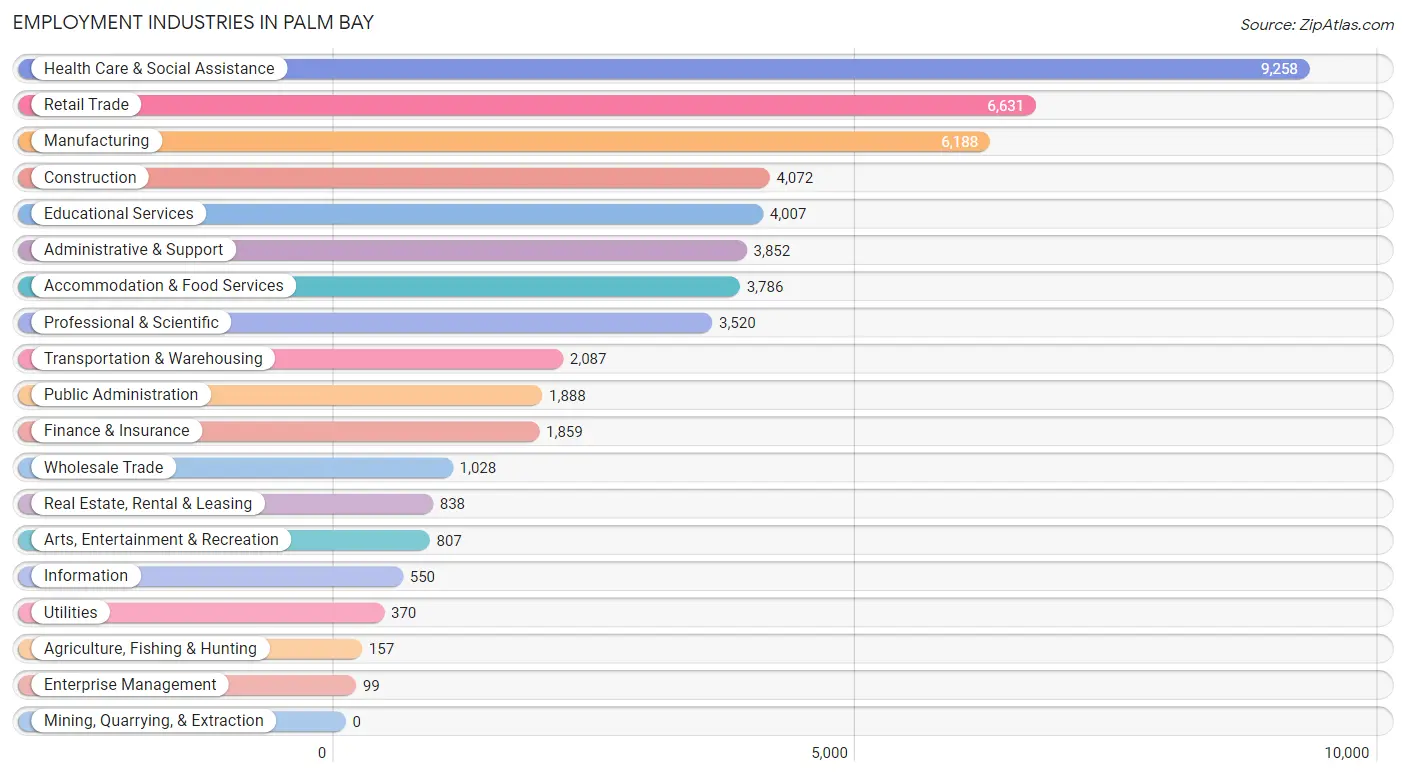
Employment Industries in Palm Bay
The major employment industries in Palm Bay include Health Care & Social Assistance (9,258 | 17.1%), Retail Trade (6,631 | 12.2%), Manufacturing (6,188 | 11.4%), Construction (4,072 | 7.5%), and Educational Services (4,007 | 7.4%).
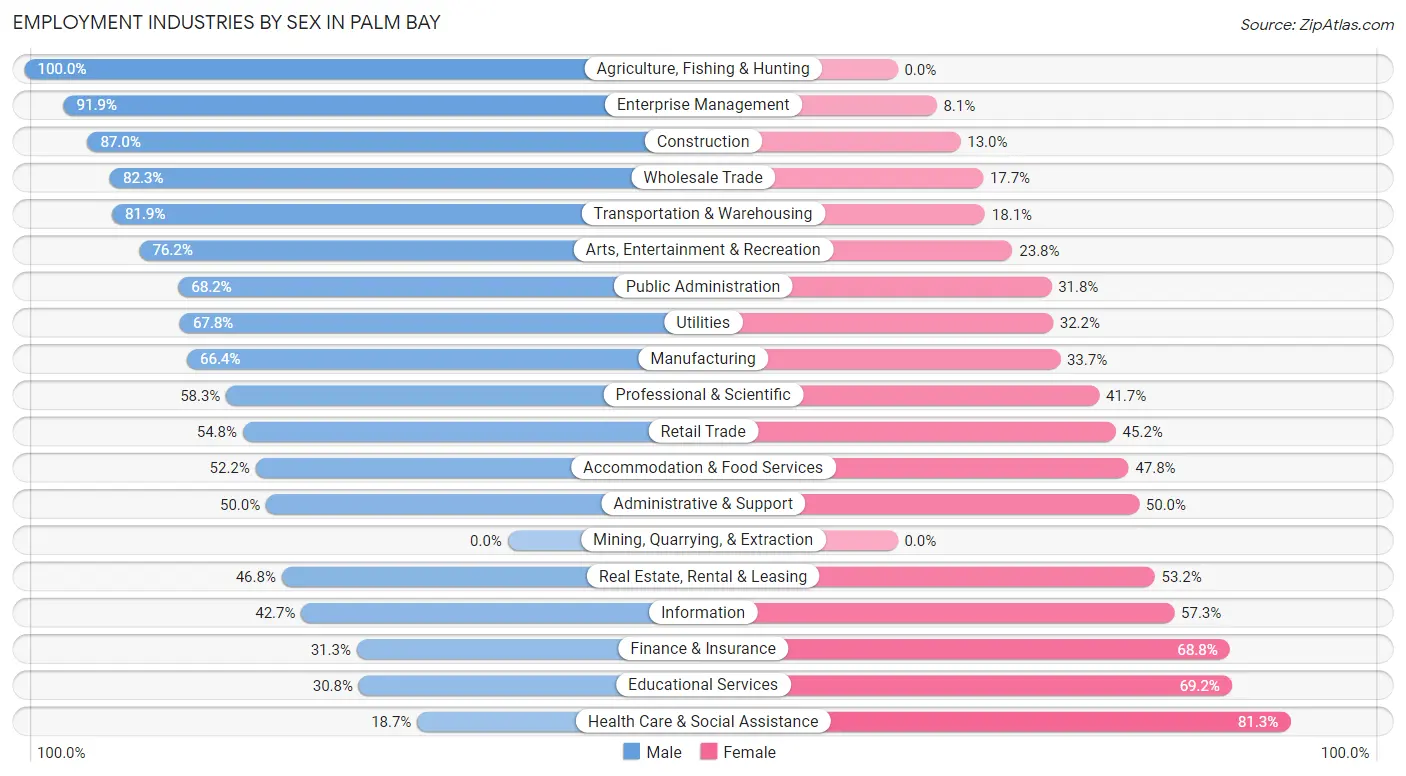
Employment Industries by Sex in Palm Bay
The Palm Bay industries that see more men than women are Agriculture, Fishing & Hunting (100.0%), Enterprise Management (91.9%), and Construction (87.0%), whereas the industries that tend to have a higher number of women are Health Care & Social Assistance (81.3%), Educational Services (69.2%), and Finance & Insurance (68.8%).
| Industry | Male | Female |
| Agriculture, Fishing & Hunting | 157 (100.0%) | 0 (0.0%) |
| Mining, Quarrying, & Extraction | 0 (0.0%) | 0 (0.0%) |
| Construction | 3,542 (87.0%) | 530 (13.0%) |
| Manufacturing | 4,106 (66.3%) | 2,082 (33.7%) |
| Wholesale Trade | 846 (82.3%) | 182 (17.7%) |
| Retail Trade | 3,636 (54.8%) | 2,995 (45.2%) |
| Transportation & Warehousing | 1,709 (81.9%) | 378 (18.1%) |
| Utilities | 251 (67.8%) | 119 (32.2%) |
| Information | 235 (42.7%) | 315 (57.3%) |
| Finance & Insurance | 581 (31.2%) | 1,278 (68.8%) |
| Real Estate, Rental & Leasing | 392 (46.8%) | 446 (53.2%) |
| Professional & Scientific | 2,051 (58.3%) | 1,469 (41.7%) |
| Enterprise Management | 91 (91.9%) | 8 (8.1%) |
| Administrative & Support | 1,927 (50.0%) | 1,925 (50.0%) |
| Educational Services | 1,235 (30.8%) | 2,772 (69.2%) |
| Health Care & Social Assistance | 1,735 (18.7%) | 7,523 (81.3%) |
| Arts, Entertainment & Recreation | 615 (76.2%) | 192 (23.8%) |
| Accommodation & Food Services | 1,976 (52.2%) | 1,810 (47.8%) |
| Public Administration | 1,287 (68.2%) | 601 (31.8%) |
| Total | 28,002 (51.6%) | 26,212 (48.3%) |
Education in Palm Bay
School Enrollment in Palm Bay
The most common levels of schooling among the 28,875 students in Palm Bay are middle school (6,283 | 21.8%), high school (6,093 | 21.1%), and college / undergraduate (5,936 | 20.6%).
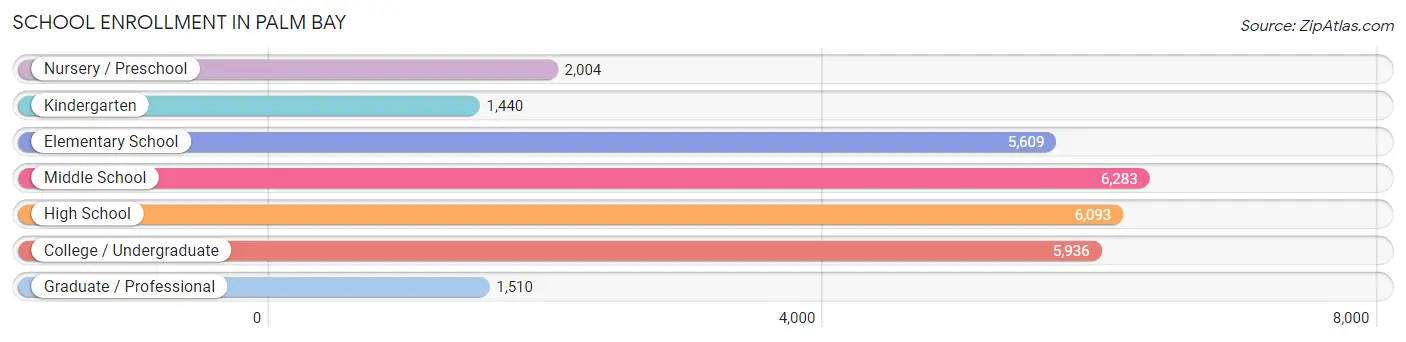
| School Level | # Students | % Students |
| Nursery / Preschool | 2,004 | 6.9% |
| Kindergarten | 1,440 | 5.0% |
| Elementary School | 5,609 | 19.4% |
| Middle School | 6,283 | 21.8% |
| High School | 6,093 | 21.1% |
| College / Undergraduate | 5,936 | 20.6% |
| Graduate / Professional | 1,510 | 5.2% |
| Total | 28,875 | 100.0% |
School Enrollment by Age by Funding Source in Palm Bay
Out of a total of 28,875 students who are enrolled in schools in Palm Bay, 5,919 (20.5%) attend a private institution, while the remaining 22,956 (79.5%) are enrolled in public schools. The age group of 35 years and over has the highest likelihood of being enrolled in private schools, with 1,277 (44.6% in the age bracket) enrolled. Conversely, the age group of 18 to 19 year olds has the lowest likelihood of being enrolled in a private school, with 1,403 (94.1% in the age bracket) attending a public institution.
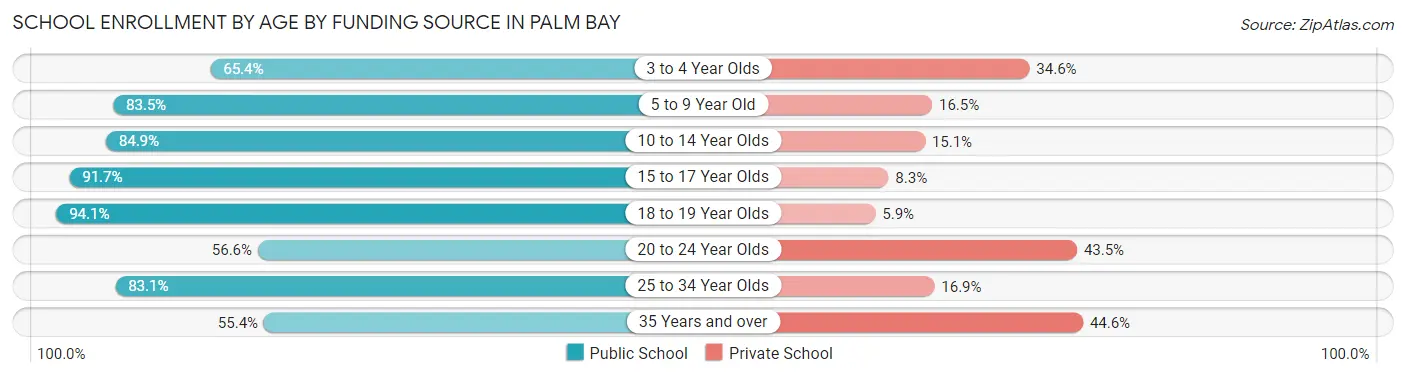
| Age Bracket | Public School | Private School |
| 3 to 4 Year Olds | 979 (65.4%) | 518 (34.6%) |
| 5 to 9 Year Old | 5,595 (83.5%) | 1,102 (16.5%) |
| 10 to 14 Year Olds | 6,461 (84.9%) | 1,153 (15.1%) |
| 15 to 17 Year Olds | 4,272 (91.7%) | 388 (8.3%) |
| 18 to 19 Year Olds | 1,403 (94.1%) | 88 (5.9%) |
| 20 to 24 Year Olds | 1,484 (56.6%) | 1,140 (43.4%) |
| 25 to 34 Year Olds | 1,186 (83.1%) | 241 (16.9%) |
| 35 Years and over | 1,588 (55.4%) | 1,277 (44.6%) |
| Total | 22,956 (79.5%) | 5,919 (20.5%) |
Educational Attainment by Field of Study in Palm Bay
Business (4,932 | 24.4%), education (2,771 | 13.7%), science & technology (2,748 | 13.6%), engineering (2,082 | 10.3%), and arts & humanities (1,253 | 6.2%) are the most common fields of study among 20,209 individuals in Palm Bay who have obtained a bachelor's degree or higher.
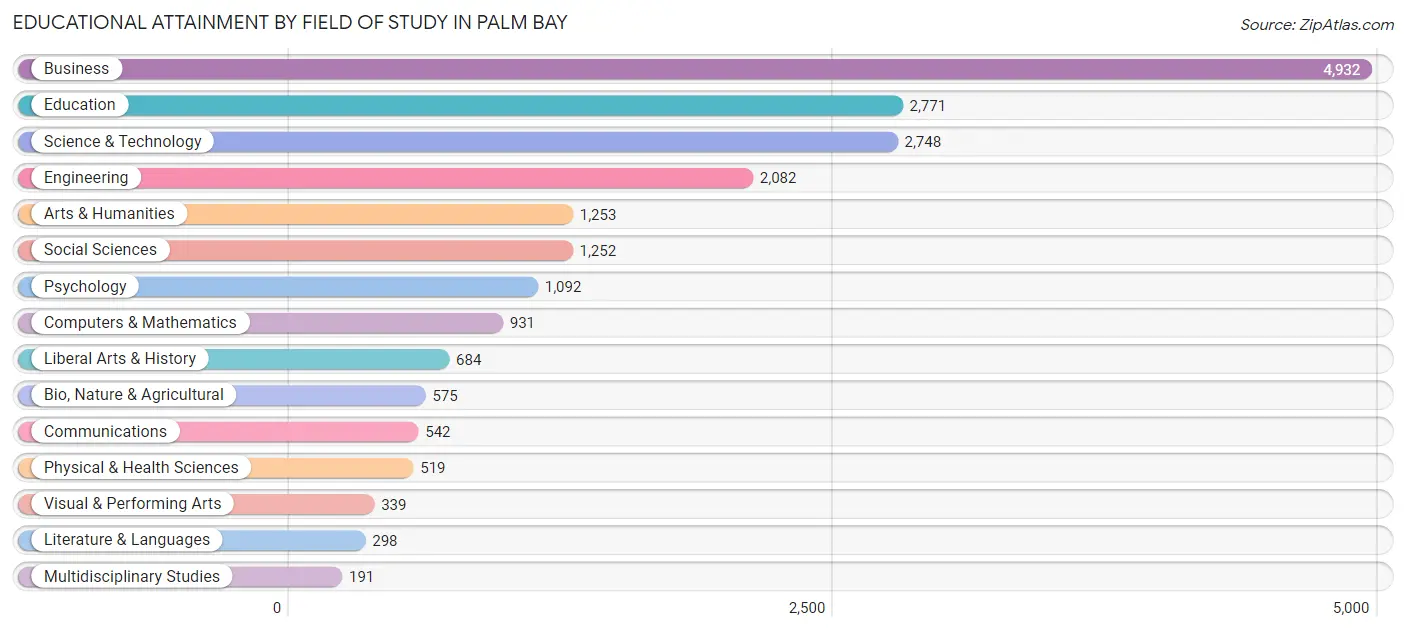
| Field of Study | # Graduates | % Graduates |
| Computers & Mathematics | 931 | 4.6% |
| Bio, Nature & Agricultural | 575 | 2.9% |
| Physical & Health Sciences | 519 | 2.6% |
| Psychology | 1,092 | 5.4% |
| Social Sciences | 1,252 | 6.2% |
| Engineering | 2,082 | 10.3% |
| Multidisciplinary Studies | 191 | 0.9% |
| Science & Technology | 2,748 | 13.6% |
| Business | 4,932 | 24.4% |
| Education | 2,771 | 13.7% |
| Literature & Languages | 298 | 1.5% |
| Liberal Arts & History | 684 | 3.4% |
| Visual & Performing Arts | 339 | 1.7% |
| Communications | 542 | 2.7% |
| Arts & Humanities | 1,253 | 6.2% |
| Total | 20,209 | 100.0% |
Transportation & Commute in Palm Bay
Vehicle Availability by Sex in Palm Bay
The most prevalent vehicle ownership categories in Palm Bay are males with 2 vehicles (12,807, accounting for 46.0%) and females with 2 vehicles (10,993, making up 50.5%).
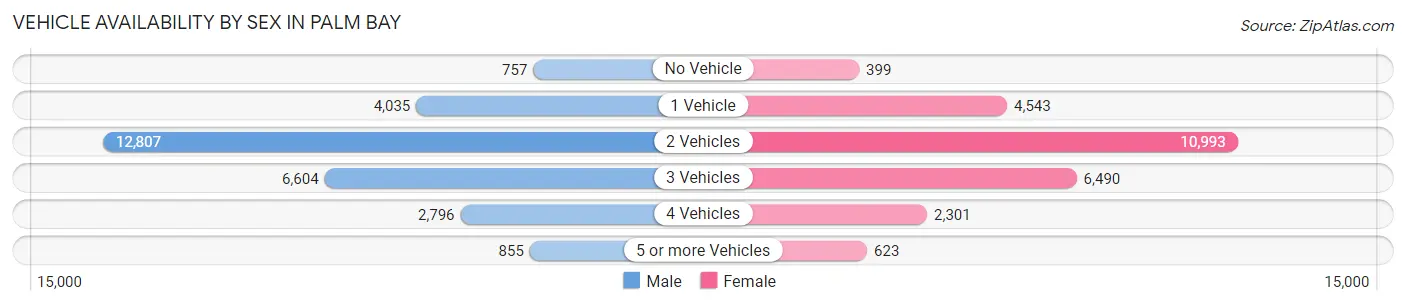
| Vehicles Available | Male | Female |
| No Vehicle | 757 (2.7%) | 399 (1.6%) |
| 1 Vehicle | 4,035 (14.5%) | 4,543 (17.9%) |
| 2 Vehicles | 12,807 (46.0%) | 10,993 (43.4%) |
| 3 Vehicles | 6,604 (23.7%) | 6,490 (25.6%) |
| 4 Vehicles | 2,796 (10.0%) | 2,301 (9.1%) |
| 5 or more Vehicles | 855 (3.1%) | 623 (2.5%) |
| Total | 27,854 (100.0%) | 25,349 (100.0%) |
Commute Time in Palm Bay
The most frequently occuring commute durations in Palm Bay are 20 to 24 minutes (9,135 commuters, 18.6%), 30 to 34 minutes (9,071 commuters, 18.5%), and 15 to 19 minutes (7,364 commuters, 15.0%).
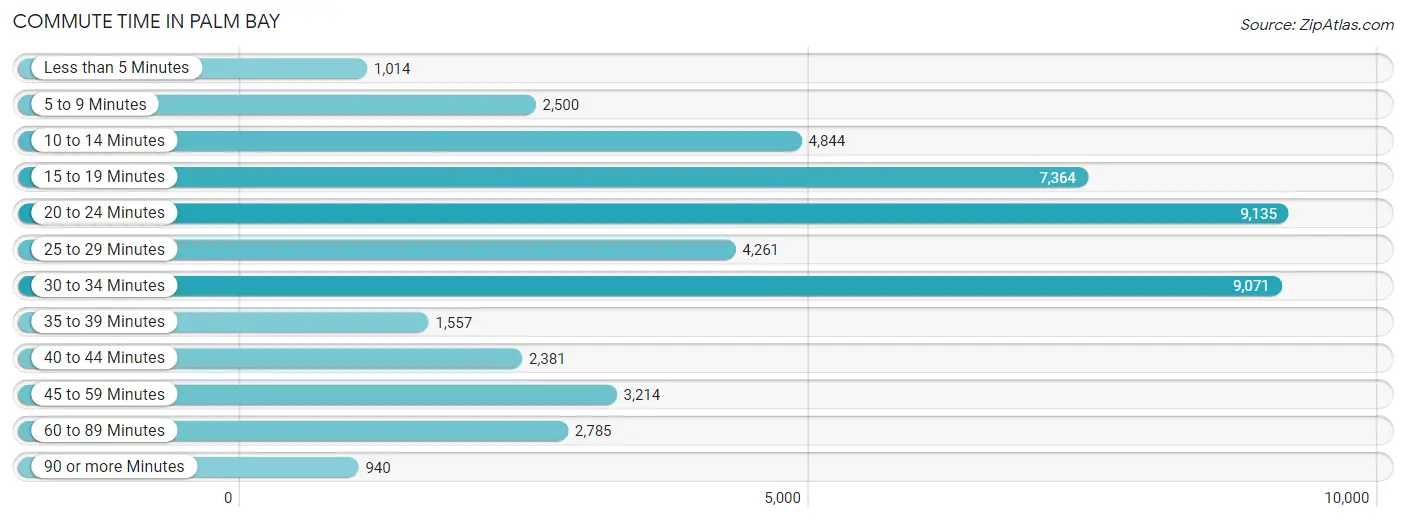
| Commute Time | # Commuters | % Commuters |
| Less than 5 Minutes | 1,014 | 2.1% |
| 5 to 9 Minutes | 2,500 | 5.1% |
| 10 to 14 Minutes | 4,844 | 9.9% |
| 15 to 19 Minutes | 7,364 | 15.0% |
| 20 to 24 Minutes | 9,135 | 18.6% |
| 25 to 29 Minutes | 4,261 | 8.7% |
| 30 to 34 Minutes | 9,071 | 18.5% |
| 35 to 39 Minutes | 1,557 | 3.2% |
| 40 to 44 Minutes | 2,381 | 4.9% |
| 45 to 59 Minutes | 3,214 | 6.6% |
| 60 to 89 Minutes | 2,785 | 5.7% |
| 90 or more Minutes | 940 | 1.9% |
Commute Time by Sex in Palm Bay
The most common commute times in Palm Bay are 20 to 24 minutes (4,959 commuters, 19.0%) for males and 30 to 34 minutes (4,671 commuters, 20.3%) for females.
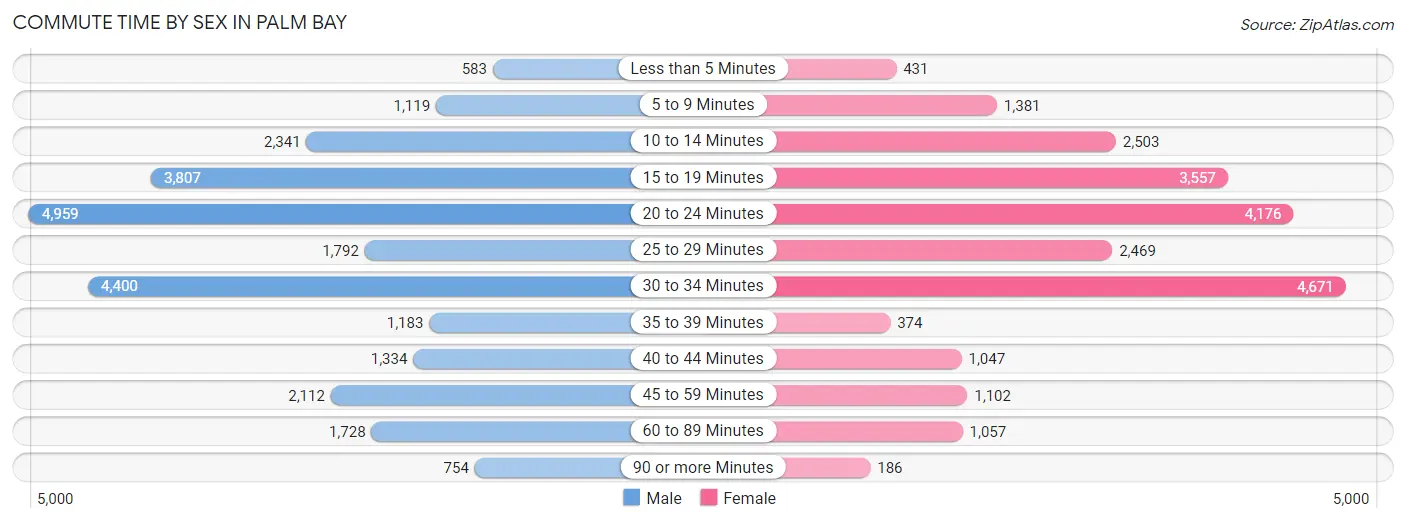
| Commute Time | Male | Female |
| Less than 5 Minutes | 583 (2.2%) | 431 (1.9%) |
| 5 to 9 Minutes | 1,119 (4.3%) | 1,381 (6.0%) |
| 10 to 14 Minutes | 2,341 (9.0%) | 2,503 (10.9%) |
| 15 to 19 Minutes | 3,807 (14.6%) | 3,557 (15.5%) |
| 20 to 24 Minutes | 4,959 (19.0%) | 4,176 (18.2%) |
| 25 to 29 Minutes | 1,792 (6.9%) | 2,469 (10.8%) |
| 30 to 34 Minutes | 4,400 (16.9%) | 4,671 (20.3%) |
| 35 to 39 Minutes | 1,183 (4.5%) | 374 (1.6%) |
| 40 to 44 Minutes | 1,334 (5.1%) | 1,047 (4.6%) |
| 45 to 59 Minutes | 2,112 (8.1%) | 1,102 (4.8%) |
| 60 to 89 Minutes | 1,728 (6.6%) | 1,057 (4.6%) |
| 90 or more Minutes | 754 (2.9%) | 186 (0.8%) |
Time of Departure to Work by Sex in Palm Bay
The most frequent times of departure to work in Palm Bay are 6:00 AM to 6:29 AM (4,111, 15.7%) for males and 7:00 AM to 7:29 AM (3,603, 15.7%) for females.
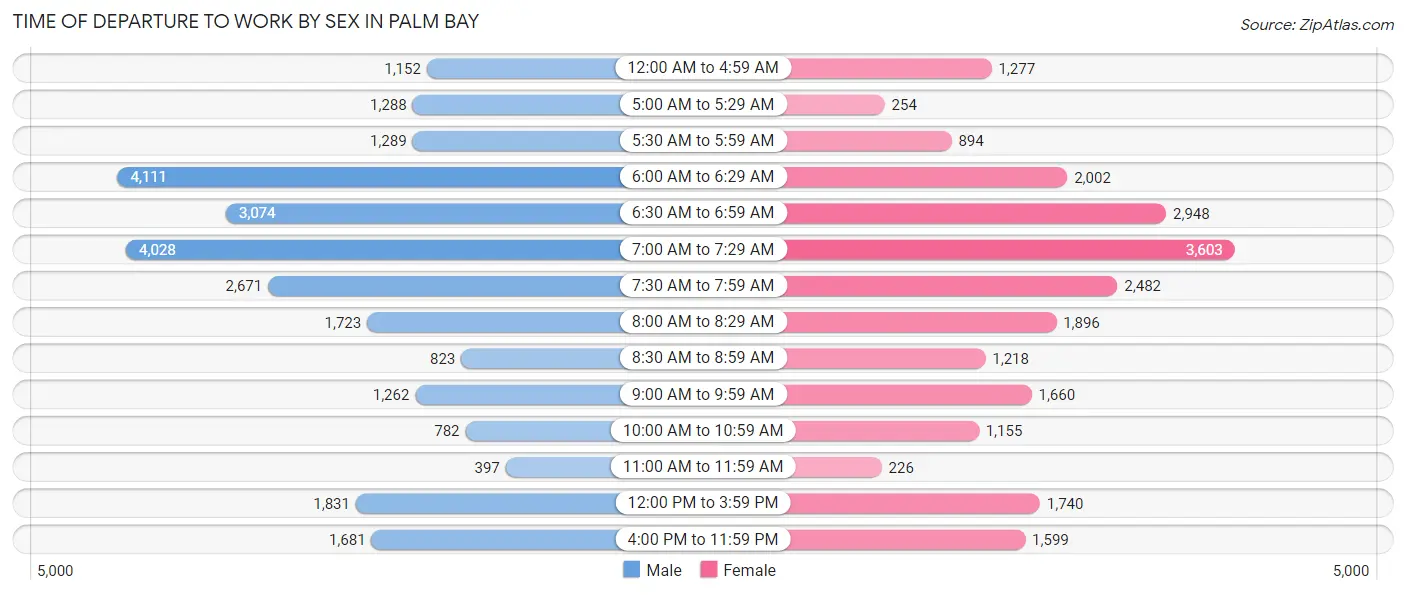
| Time of Departure | Male | Female |
| 12:00 AM to 4:59 AM | 1,152 (4.4%) | 1,277 (5.6%) |
| 5:00 AM to 5:29 AM | 1,288 (4.9%) | 254 (1.1%) |
| 5:30 AM to 5:59 AM | 1,289 (4.9%) | 894 (3.9%) |
| 6:00 AM to 6:29 AM | 4,111 (15.7%) | 2,002 (8.7%) |
| 6:30 AM to 6:59 AM | 3,074 (11.8%) | 2,948 (12.8%) |
| 7:00 AM to 7:29 AM | 4,028 (15.4%) | 3,603 (15.7%) |
| 7:30 AM to 7:59 AM | 2,671 (10.2%) | 2,482 (10.8%) |
| 8:00 AM to 8:29 AM | 1,723 (6.6%) | 1,896 (8.3%) |
| 8:30 AM to 8:59 AM | 823 (3.2%) | 1,218 (5.3%) |
| 9:00 AM to 9:59 AM | 1,262 (4.8%) | 1,660 (7.2%) |
| 10:00 AM to 10:59 AM | 782 (3.0%) | 1,155 (5.0%) |
| 11:00 AM to 11:59 AM | 397 (1.5%) | 226 (1.0%) |
| 12:00 PM to 3:59 PM | 1,831 (7.0%) | 1,740 (7.6%) |
| 4:00 PM to 11:59 PM | 1,681 (6.4%) | 1,599 (7.0%) |
| Total | 26,112 (100.0%) | 22,954 (100.0%) |
Housing Occupancy in Palm Bay
Occupancy by Ownership in Palm Bay
Of the total 42,865 dwellings in Palm Bay, owner-occupied units account for 34,254 (79.9%), while renter-occupied units make up 8,611 (20.1%).
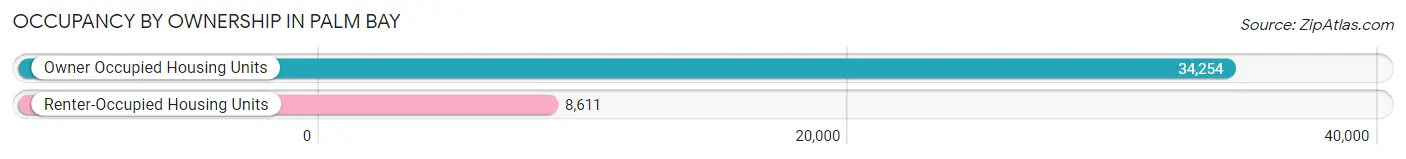
| Occupancy | # Housing Units | % Housing Units |
| Owner Occupied Housing Units | 34,254 | 79.9% |
| Renter-Occupied Housing Units | 8,611 | 20.1% |
| Total Occupied Housing Units | 42,865 | 100.0% |
Occupancy by Household Size in Palm Bay
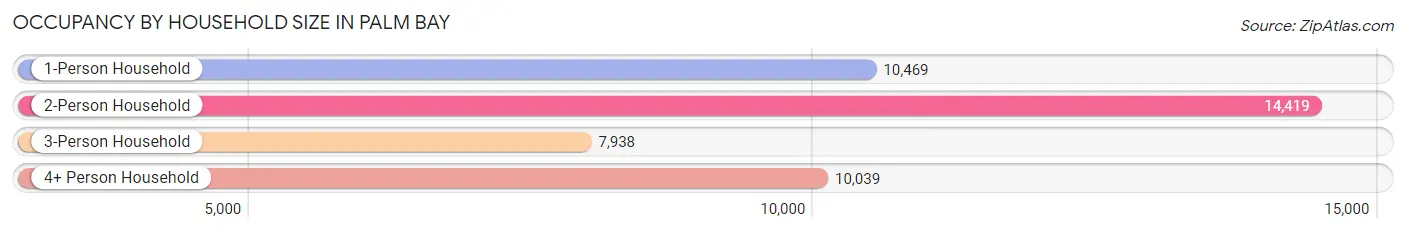
| Household Size | # Housing Units | % Housing Units |
| 1-Person Household | 10,469 | 24.4% |
| 2-Person Household | 14,419 | 33.6% |
| 3-Person Household | 7,938 | 18.5% |
| 4+ Person Household | 10,039 | 23.4% |
| Total Housing Units | 42,865 | 100.0% |
Occupancy by Ownership by Household Size in Palm Bay
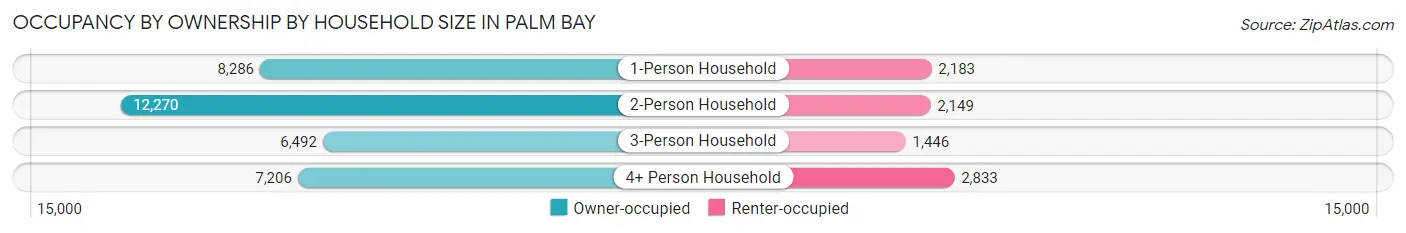
| Household Size | Owner-occupied | Renter-occupied |
| 1-Person Household | 8,286 (79.1%) | 2,183 (20.8%) |
| 2-Person Household | 12,270 (85.1%) | 2,149 (14.9%) |
| 3-Person Household | 6,492 (81.8%) | 1,446 (18.2%) |
| 4+ Person Household | 7,206 (71.8%) | 2,833 (28.2%) |
| Total Housing Units | 34,254 (79.9%) | 8,611 (20.1%) |
Occupancy by Educational Attainment in Palm Bay
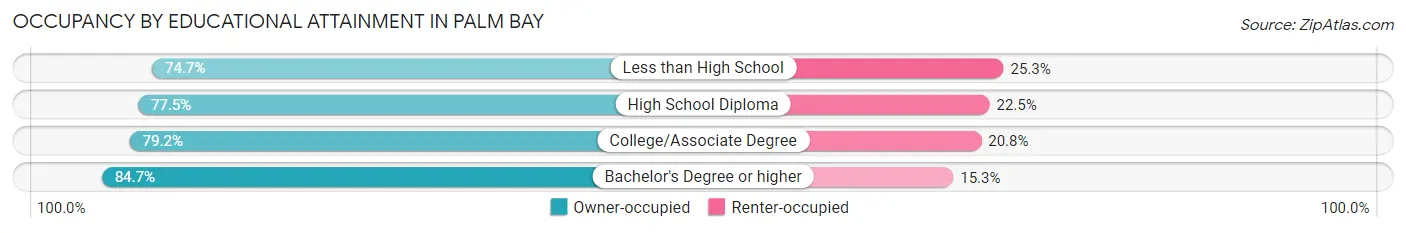
| Household Size | Owner-occupied | Renter-occupied |
| Less than High School | 2,321 (74.7%) | 785 (25.3%) |
| High School Diploma | 8,642 (77.5%) | 2,506 (22.5%) |
| College/Associate Degree | 13,470 (79.2%) | 3,547 (20.8%) |
| Bachelor's Degree or higher | 9,821 (84.7%) | 1,773 (15.3%) |
Occupancy by Age of Householder in Palm Bay
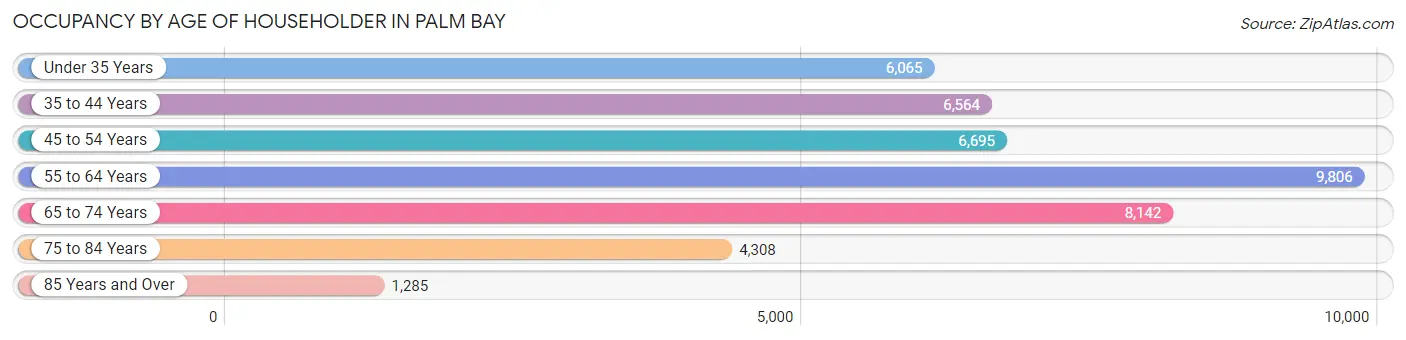
| Age Bracket | # Households | % Households |
| Under 35 Years | 6,065 | 14.1% |
| 35 to 44 Years | 6,564 | 15.3% |
| 45 to 54 Years | 6,695 | 15.6% |
| 55 to 64 Years | 9,806 | 22.9% |
| 65 to 74 Years | 8,142 | 19.0% |
| 75 to 84 Years | 4,308 | 10.1% |
| 85 Years and Over | 1,285 | 3.0% |
| Total | 42,865 | 100.0% |
Housing Finances in Palm Bay
Median Income by Occupancy in Palm Bay
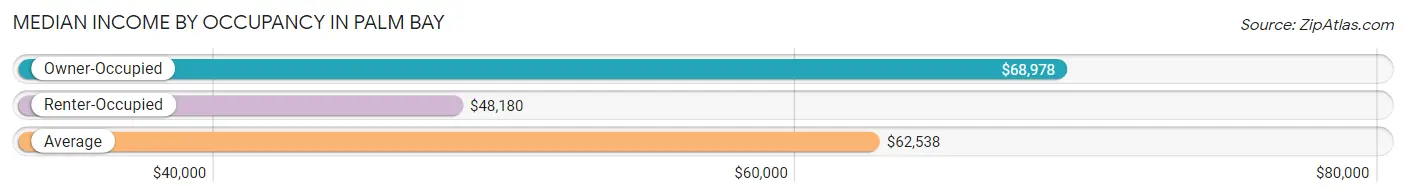
| Occupancy Type | # Households | Median Income |
| Owner-Occupied | 34,254 (79.9%) | $68,978 |
| Renter-Occupied | 8,611 (20.1%) | $48,180 |
| Average | 42,865 (100.0%) | $62,538 |
Occupancy by Householder Income Bracket in Palm Bay
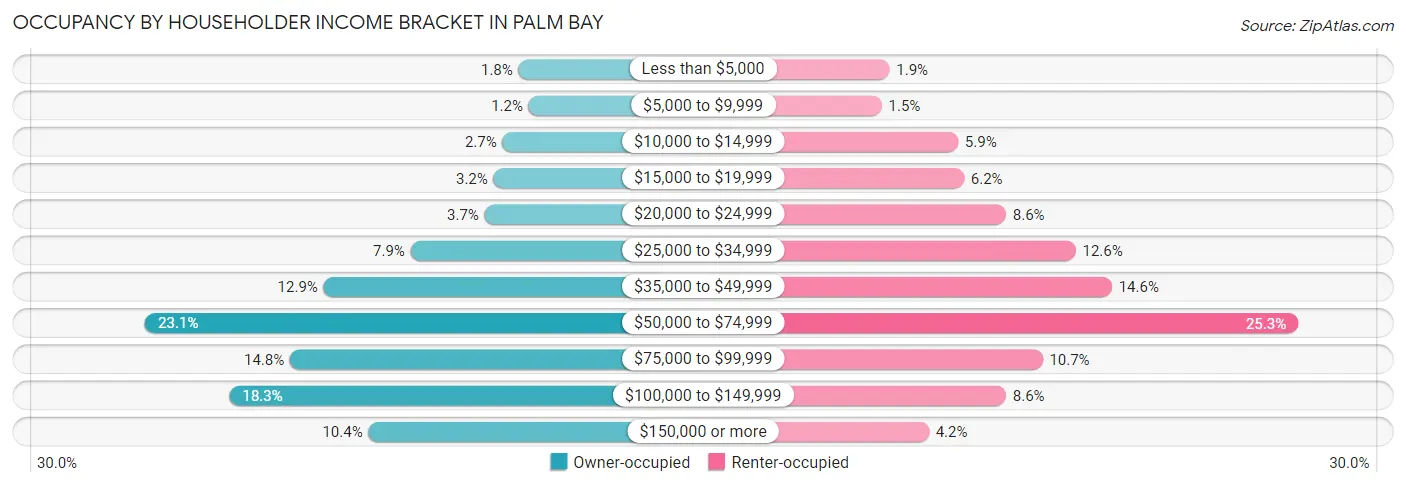
| Income Bracket | Owner-occupied | Renter-occupied |
| Less than $5,000 | 607 (1.8%) | 166 (1.9%) |
| $5,000 to $9,999 | 407 (1.2%) | 128 (1.5%) |
| $10,000 to $14,999 | 920 (2.7%) | 504 (5.9%) |
| $15,000 to $19,999 | 1,095 (3.2%) | 533 (6.2%) |
| $20,000 to $24,999 | 1,270 (3.7%) | 740 (8.6%) |
| $25,000 to $34,999 | 2,719 (7.9%) | 1,082 (12.6%) |
| $35,000 to $49,999 | 4,422 (12.9%) | 1,261 (14.6%) |
| $50,000 to $74,999 | 7,920 (23.1%) | 2,177 (25.3%) |
| $75,000 to $99,999 | 5,079 (14.8%) | 920 (10.7%) |
| $100,000 to $149,999 | 6,269 (18.3%) | 740 (8.6%) |
| $150,000 or more | 3,546 (10.3%) | 360 (4.2%) |
| Total | 34,254 (100.0%) | 8,611 (100.0%) |
Monthly Housing Cost Tiers in Palm Bay
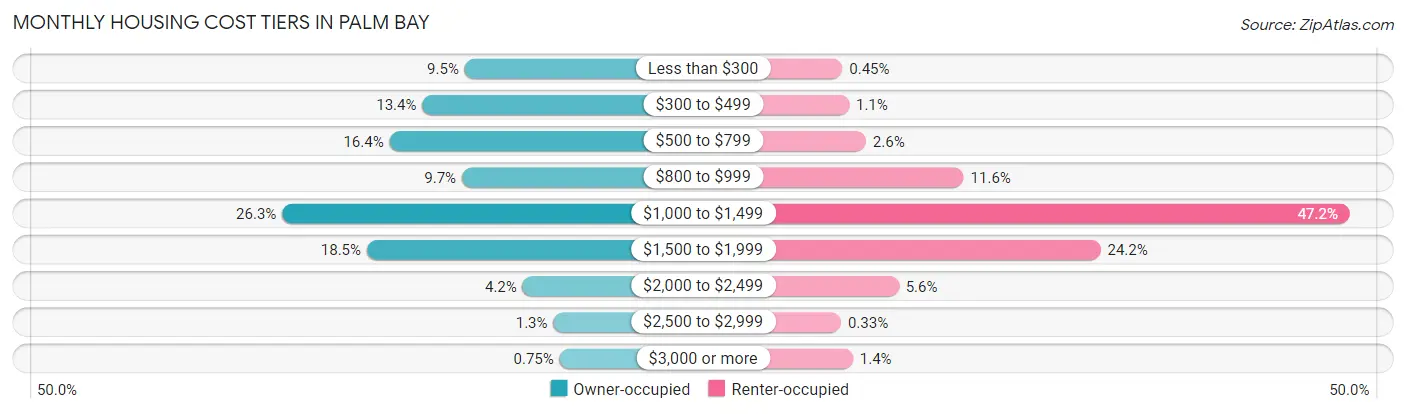
| Monthly Cost | Owner-occupied | Renter-occupied |
| Less than $300 | 3,248 (9.5%) | 39 (0.4%) |
| $300 to $499 | 4,585 (13.4%) | 92 (1.1%) |
| $500 to $799 | 5,622 (16.4%) | 226 (2.6%) |
| $800 to $999 | 3,335 (9.7%) | 1,001 (11.6%) |
| $1,000 to $1,499 | 9,004 (26.3%) | 4,061 (47.2%) |
| $1,500 to $1,999 | 6,333 (18.5%) | 2,086 (24.2%) |
| $2,000 to $2,499 | 1,420 (4.2%) | 486 (5.6%) |
| $2,500 to $2,999 | 451 (1.3%) | 28 (0.3%) |
| $3,000 or more | 256 (0.7%) | 122 (1.4%) |
| Total | 34,254 (100.0%) | 8,611 (100.0%) |
Physical Housing Characteristics in Palm Bay
Housing Structures in Palm Bay
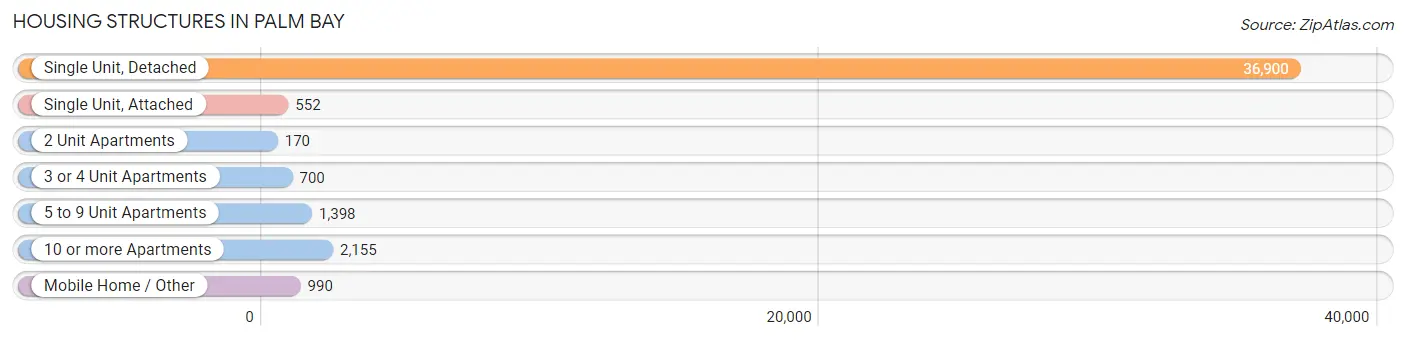
| Structure Type | # Housing Units | % Housing Units |
| Single Unit, Detached | 36,900 | 86.1% |
| Single Unit, Attached | 552 | 1.3% |
| 2 Unit Apartments | 170 | 0.4% |
| 3 or 4 Unit Apartments | 700 | 1.6% |
| 5 to 9 Unit Apartments | 1,398 | 3.3% |
| 10 or more Apartments | 2,155 | 5.0% |
| Mobile Home / Other | 990 | 2.3% |
| Total | 42,865 | 100.0% |
Housing Structures by Occupancy in Palm Bay
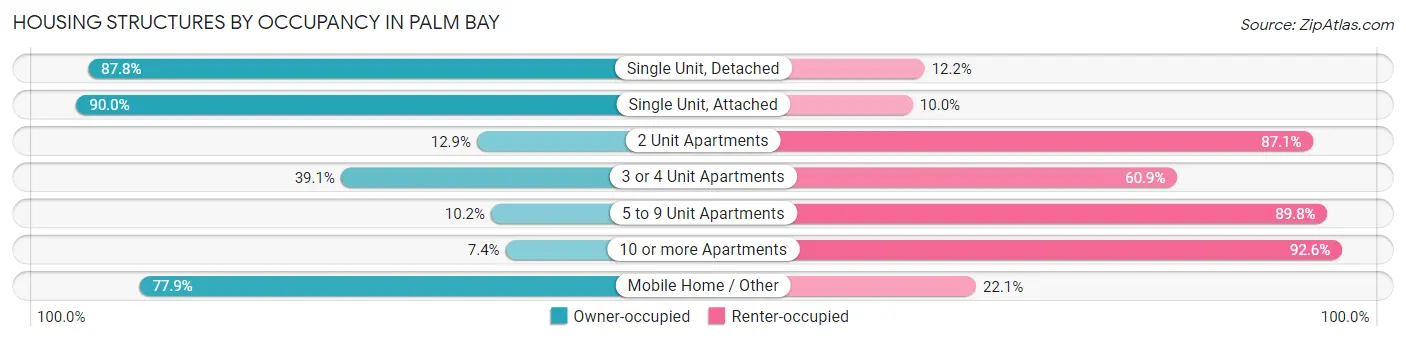
| Structure Type | Owner-occupied | Renter-occupied |
| Single Unit, Detached | 32,387 (87.8%) | 4,513 (12.2%) |
| Single Unit, Attached | 497 (90.0%) | 55 (10.0%) |
| 2 Unit Apartments | 22 (12.9%) | 148 (87.1%) |
| 3 or 4 Unit Apartments | 274 (39.1%) | 426 (60.9%) |
| 5 to 9 Unit Apartments | 143 (10.2%) | 1,255 (89.8%) |
| 10 or more Apartments | 160 (7.4%) | 1,995 (92.6%) |
| Mobile Home / Other | 771 (77.9%) | 219 (22.1%) |
| Total | 34,254 (79.9%) | 8,611 (20.1%) |
Housing Structures by Number of Rooms in Palm Bay
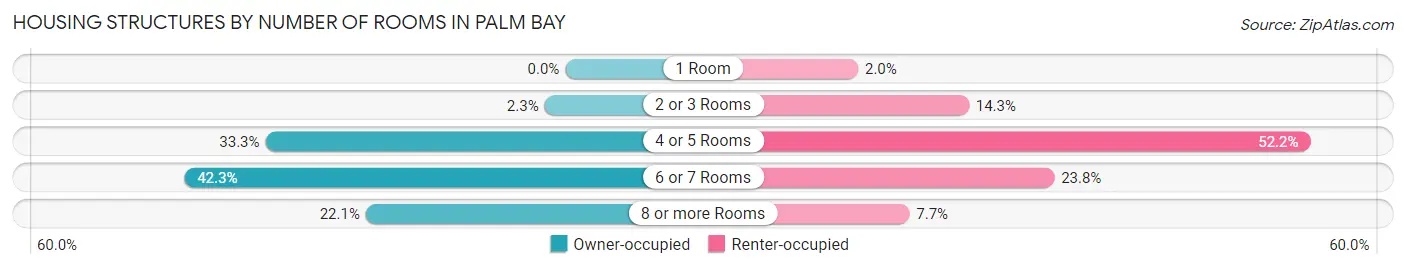
| Number of Rooms | Owner-occupied | Renter-occupied |
| 1 Room | 0 (0.0%) | 173 (2.0%) |
| 2 or 3 Rooms | 788 (2.3%) | 1,231 (14.3%) |
| 4 or 5 Rooms | 11,401 (33.3%) | 4,495 (52.2%) |
| 6 or 7 Rooms | 14,481 (42.3%) | 2,048 (23.8%) |
| 8 or more Rooms | 7,584 (22.1%) | 664 (7.7%) |
| Total | 34,254 (100.0%) | 8,611 (100.0%) |
Housing Structure by Heating Type in Palm Bay
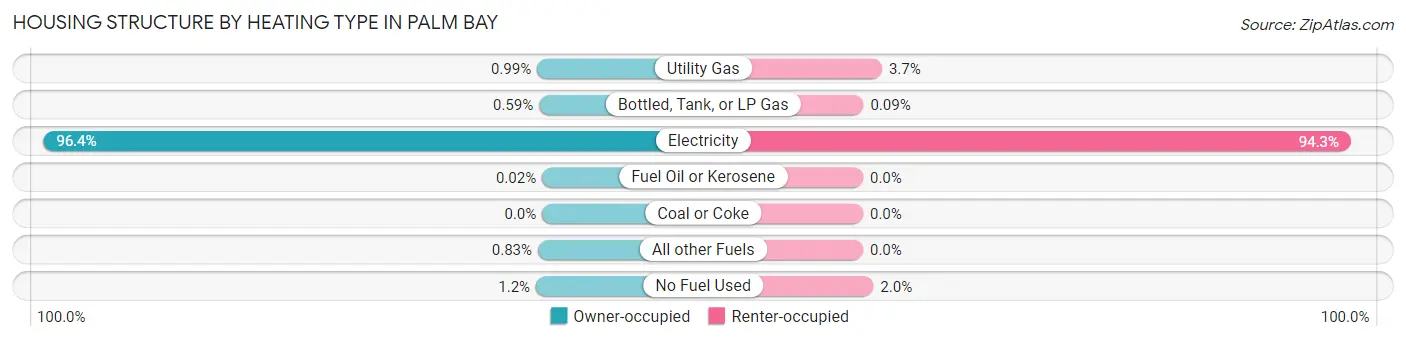
| Heating Type | Owner-occupied | Renter-occupied |
| Utility Gas | 340 (1.0%) | 314 (3.6%) |
| Bottled, Tank, or LP Gas | 202 (0.6%) | 8 (0.1%) |
| Electricity | 33,013 (96.4%) | 8,117 (94.3%) |
| Fuel Oil or Kerosene | 8 (0.0%) | 0 (0.0%) |
| Coal or Coke | 0 (0.0%) | 0 (0.0%) |
| All other Fuels | 283 (0.8%) | 0 (0.0%) |
| No Fuel Used | 408 (1.2%) | 172 (2.0%) |
| Total | 34,254 (100.0%) | 8,611 (100.0%) |
Household Vehicle Usage in Palm Bay
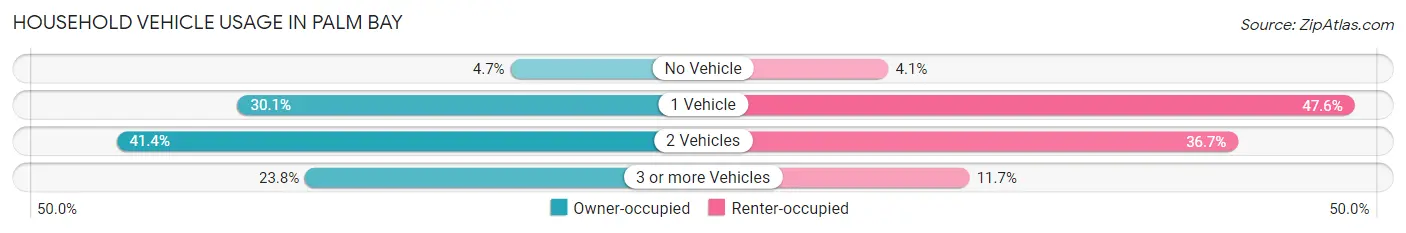
| Vehicles per Household | Owner-occupied | Renter-occupied |
| No Vehicle | 1,593 (4.6%) | 351 (4.1%) |
| 1 Vehicle | 10,315 (30.1%) | 4,096 (47.6%) |
| 2 Vehicles | 14,187 (41.4%) | 3,161 (36.7%) |
| 3 or more Vehicles | 8,159 (23.8%) | 1,003 (11.7%) |
| Total | 34,254 (100.0%) | 8,611 (100.0%) |
Real Estate & Mortgages in Palm Bay
Real Estate and Mortgage Overview in Palm Bay
| Characteristic | Without Mortgage | With Mortgage |
| Housing Units | 12,139 | 22,115 |
| Median Property Value | $212,900 | $231,200 |
| Median Household Income | $54,826 | $2,511 |
| Monthly Housing Costs | $453 | $240 |
| Real Estate Taxes | $1,152 | $706 |
Property Value by Mortgage Status in Palm Bay
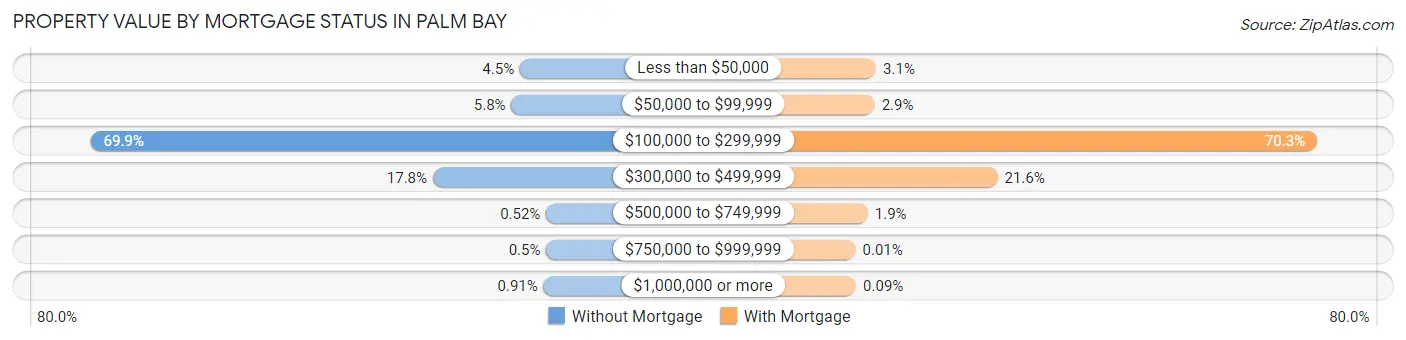
| Property Value | Without Mortgage | With Mortgage |
| Less than $50,000 | 548 (4.5%) | 695 (3.1%) |
| $50,000 to $99,999 | 707 (5.8%) | 646 (2.9%) |
| $100,000 to $299,999 | 8,490 (69.9%) | 15,549 (70.3%) |
| $300,000 to $499,999 | 2,160 (17.8%) | 4,786 (21.6%) |
| $500,000 to $749,999 | 63 (0.5%) | 416 (1.9%) |
| $750,000 to $999,999 | 61 (0.5%) | 2 (0.0%) |
| $1,000,000 or more | 110 (0.9%) | 21 (0.1%) |
| Total | 12,139 (100.0%) | 22,115 (100.0%) |
Household Income by Mortgage Status in Palm Bay
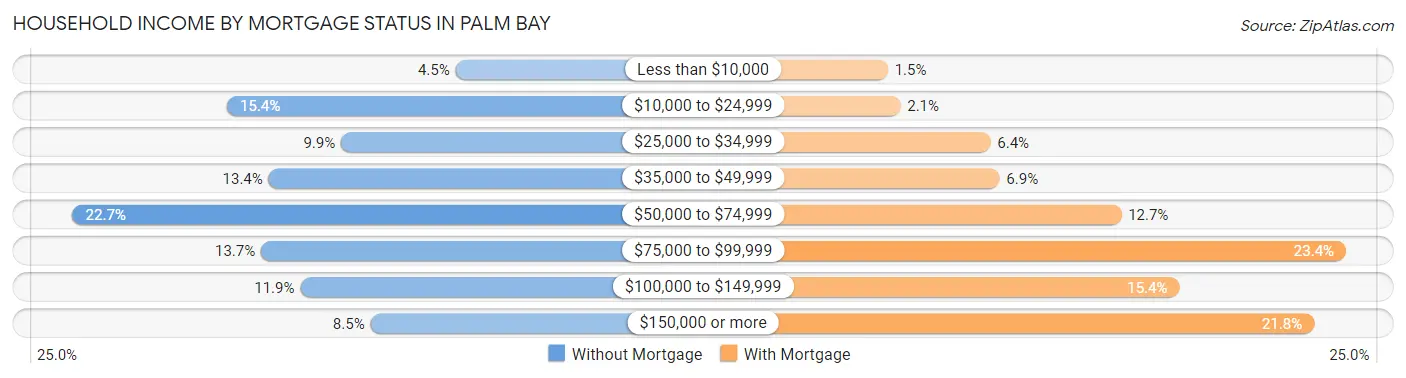
| Household Income | Without Mortgage | With Mortgage |
| Less than $10,000 | 544 (4.5%) | 339 (1.5%) |
| $10,000 to $24,999 | 1,865 (15.4%) | 470 (2.1%) |
| $25,000 to $34,999 | 1,205 (9.9%) | 1,420 (6.4%) |
| $35,000 to $49,999 | 1,624 (13.4%) | 1,514 (6.9%) |
| $50,000 to $74,999 | 2,757 (22.7%) | 2,798 (12.7%) |
| $75,000 to $99,999 | 1,668 (13.7%) | 5,163 (23.4%) |
| $100,000 to $149,999 | 1,441 (11.9%) | 3,411 (15.4%) |
| $150,000 or more | 1,035 (8.5%) | 4,828 (21.8%) |
| Total | 12,139 (100.0%) | 22,115 (100.0%) |
Property Value to Household Income Ratio in Palm Bay
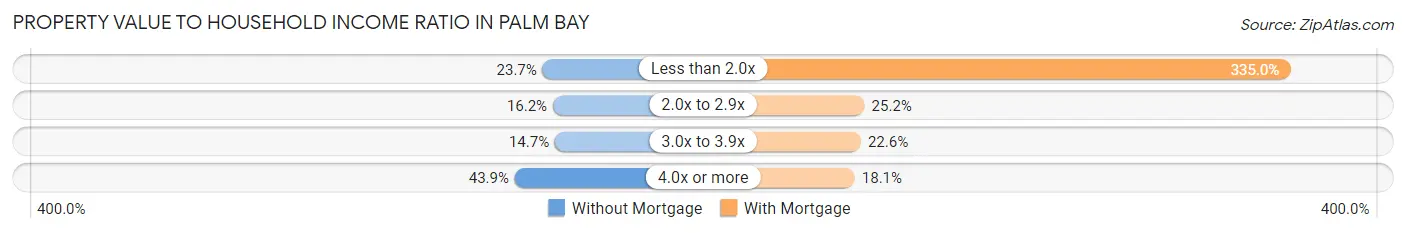
| Value-to-Income Ratio | Without Mortgage | With Mortgage |
| Less than 2.0x | 2,876 (23.7%) | 74,095 (335.0%) |
| 2.0x to 2.9x | 1,967 (16.2%) | 5,578 (25.2%) |
| 3.0x to 3.9x | 1,785 (14.7%) | 4,988 (22.6%) |
| 4.0x or more | 5,331 (43.9%) | 4,004 (18.1%) |
| Total | 12,139 (100.0%) | 22,115 (100.0%) |
Real Estate Taxes by Mortgage Status in Palm Bay
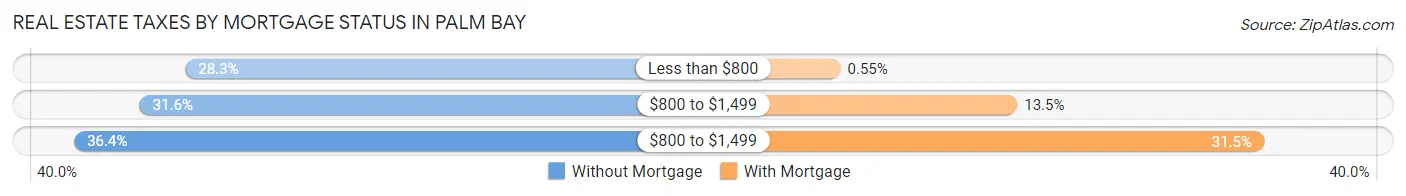
| Property Taxes | Without Mortgage | With Mortgage |
| Less than $800 | 3,431 (28.3%) | 121 (0.5%) |
| $800 to $1,499 | 3,835 (31.6%) | 2,976 (13.5%) |
| $800 to $1,499 | 4,417 (36.4%) | 6,960 (31.5%) |
| Total | 12,139 (100.0%) | 22,115 (100.0%) |
Health & Disability in Palm Bay
Health Insurance Coverage by Age in Palm Bay
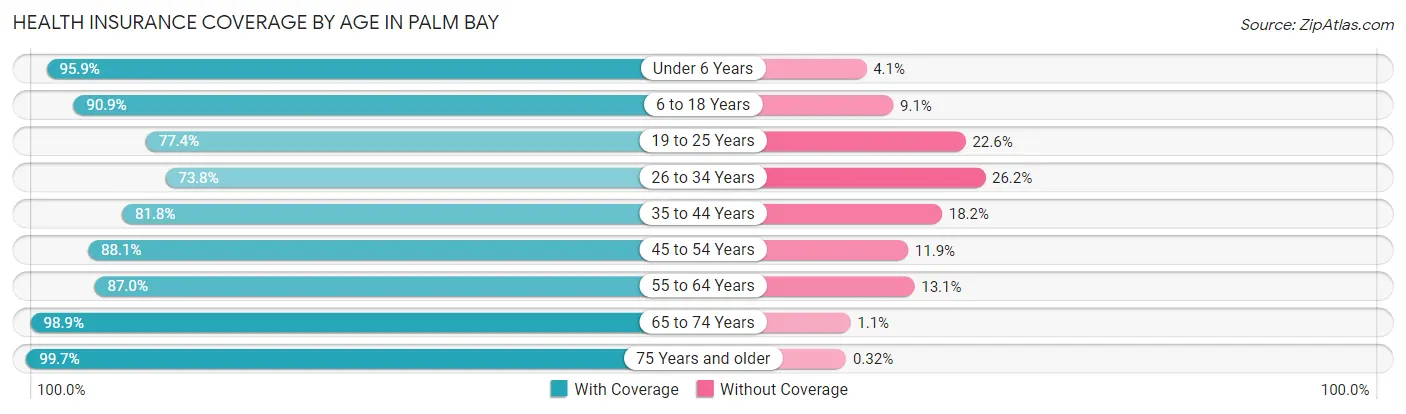
| Age Bracket | With Coverage | Without Coverage |
| Under 6 Years | 7,928 (95.9%) | 337 (4.1%) |
| 6 to 18 Years | 17,861 (90.9%) | 1,789 (9.1%) |
| 19 to 25 Years | 7,173 (77.4%) | 2,095 (22.6%) |
| 26 to 34 Years | 9,756 (73.8%) | 3,471 (26.2%) |
| 35 to 44 Years | 12,198 (81.8%) | 2,711 (18.2%) |
| 45 to 54 Years | 11,789 (88.1%) | 1,586 (11.9%) |
| 55 to 64 Years | 16,182 (87.0%) | 2,428 (13.1%) |
| 65 to 74 Years | 13,184 (98.9%) | 151 (1.1%) |
| 75 Years and older | 9,777 (99.7%) | 31 (0.3%) |
| Total | 105,848 (87.9%) | 14,599 (12.1%) |
Health Insurance Coverage by Citizenship Status in Palm Bay
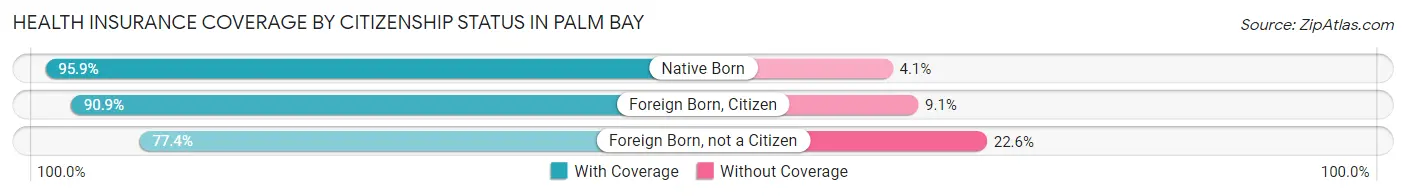
| Citizenship Status | With Coverage | Without Coverage |
| Native Born | 7,928 (95.9%) | 337 (4.1%) |
| Foreign Born, Citizen | 17,861 (90.9%) | 1,789 (9.1%) |
| Foreign Born, not a Citizen | 7,173 (77.4%) | 2,095 (22.6%) |
Health Insurance Coverage by Household Income in Palm Bay
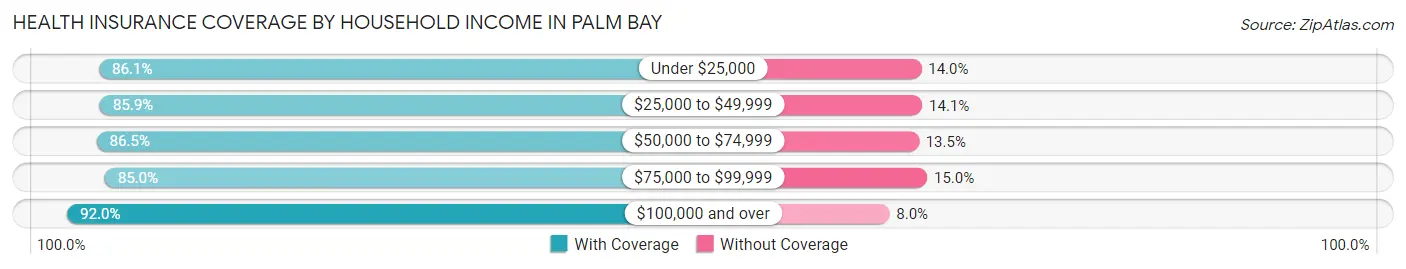
| Household Income | With Coverage | Without Coverage |
| Under $25,000 | 10,433 (86.1%) | 1,691 (14.0%) |
| $25,000 to $49,999 | 18,906 (85.9%) | 3,109 (14.1%) |
| $50,000 to $74,999 | 25,593 (86.5%) | 3,988 (13.5%) |
| $75,000 to $99,999 | 15,350 (85.0%) | 2,715 (15.0%) |
| $100,000 and over | 35,377 (92.0%) | 3,062 (8.0%) |
Public vs Private Health Insurance Coverage by Age in Palm Bay
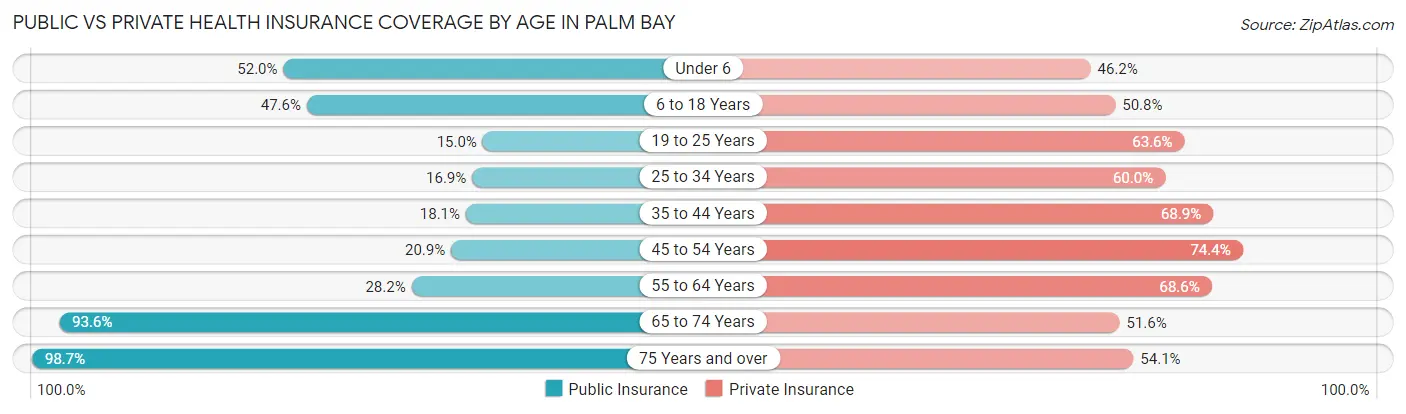
| Age Bracket | Public Insurance | Private Insurance |
| Under 6 | 4,295 (52.0%) | 3,817 (46.2%) |
| 6 to 18 Years | 9,357 (47.6%) | 9,976 (50.8%) |
| 19 to 25 Years | 1,387 (15.0%) | 5,893 (63.6%) |
| 25 to 34 Years | 2,241 (16.9%) | 7,936 (60.0%) |
| 35 to 44 Years | 2,699 (18.1%) | 10,276 (68.9%) |
| 45 to 54 Years | 2,789 (20.8%) | 9,947 (74.4%) |
| 55 to 64 Years | 5,246 (28.2%) | 12,772 (68.6%) |
| 65 to 74 Years | 12,482 (93.6%) | 6,876 (51.6%) |
| 75 Years and over | 9,677 (98.7%) | 5,309 (54.1%) |
| Total | 50,173 (41.7%) | 72,802 (60.4%) |
Disability Status by Sex by Age in Palm Bay
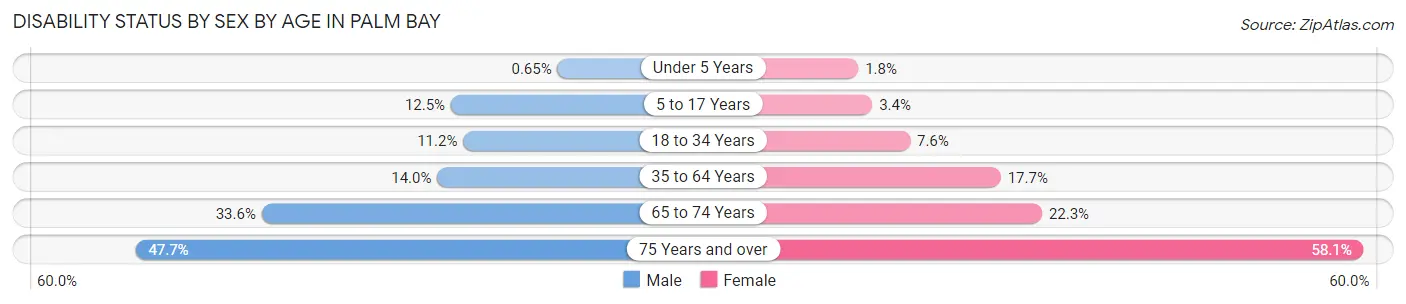
| Age Bracket | Male | Female |
| Under 5 Years | 25 (0.6%) | 56 (1.8%) |
| 5 to 17 Years | 1,197 (12.5%) | 345 (3.4%) |
| 18 to 34 Years | 1,402 (11.2%) | 851 (7.6%) |
| 35 to 64 Years | 3,125 (14.0%) | 4,359 (17.7%) |
| 65 to 74 Years | 2,310 (33.6%) | 1,439 (22.3%) |
| 75 Years and over | 1,949 (47.6%) | 3,323 (58.1%) |
Disability Class by Sex by Age in Palm Bay
Disability Class: Hearing Difficulty
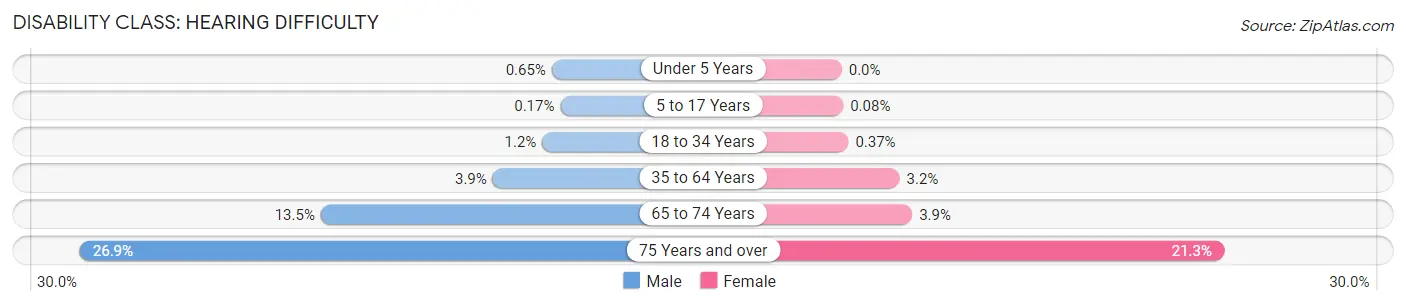
| Age Bracket | Male | Female |
| Under 5 Years | 25 (0.6%) | 0 (0.0%) |
| 5 to 17 Years | 16 (0.2%) | 8 (0.1%) |
| 18 to 34 Years | 148 (1.2%) | 41 (0.4%) |
| 35 to 64 Years | 877 (3.9%) | 794 (3.2%) |
| 65 to 74 Years | 929 (13.5%) | 253 (3.9%) |
| 75 Years and over | 1,101 (26.9%) | 1,216 (21.3%) |
Disability Class: Vision Difficulty
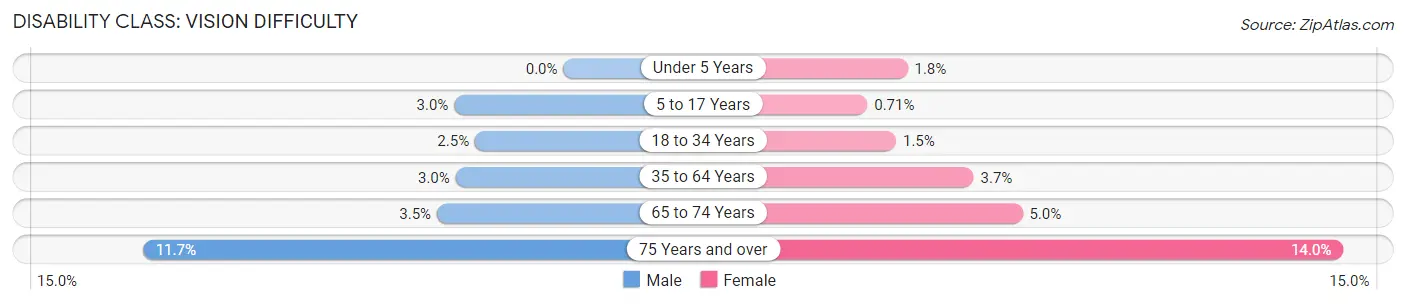
| Age Bracket | Male | Female |
| Under 5 Years | 0 (0.0%) | 56 (1.8%) |
| 5 to 17 Years | 291 (3.0%) | 72 (0.7%) |
| 18 to 34 Years | 309 (2.5%) | 169 (1.5%) |
| 35 to 64 Years | 667 (3.0%) | 903 (3.7%) |
| 65 to 74 Years | 242 (3.5%) | 325 (5.0%) |
| 75 Years and over | 479 (11.7%) | 798 (14.0%) |
Disability Class: Cognitive Difficulty
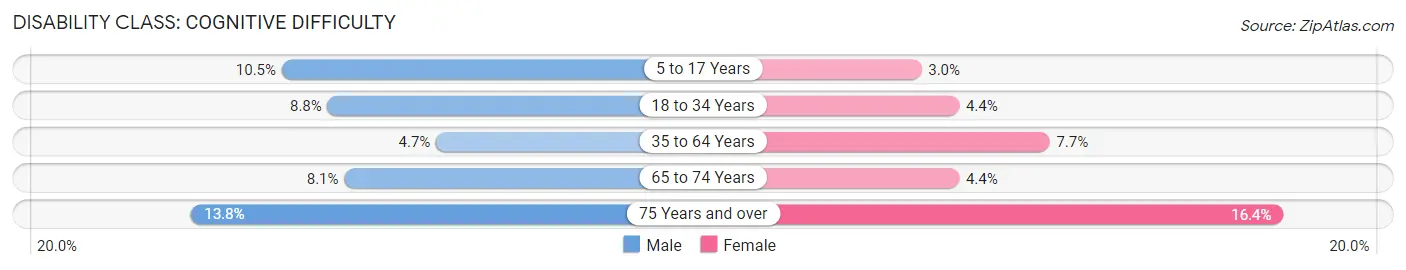
| Age Bracket | Male | Female |
| 5 to 17 Years | 999 (10.4%) | 300 (2.9%) |
| 18 to 34 Years | 1,100 (8.7%) | 487 (4.3%) |
| 35 to 64 Years | 1,050 (4.7%) | 1,900 (7.7%) |
| 65 to 74 Years | 559 (8.1%) | 281 (4.3%) |
| 75 Years and over | 565 (13.8%) | 937 (16.4%) |
Disability Class: Ambulatory Difficulty
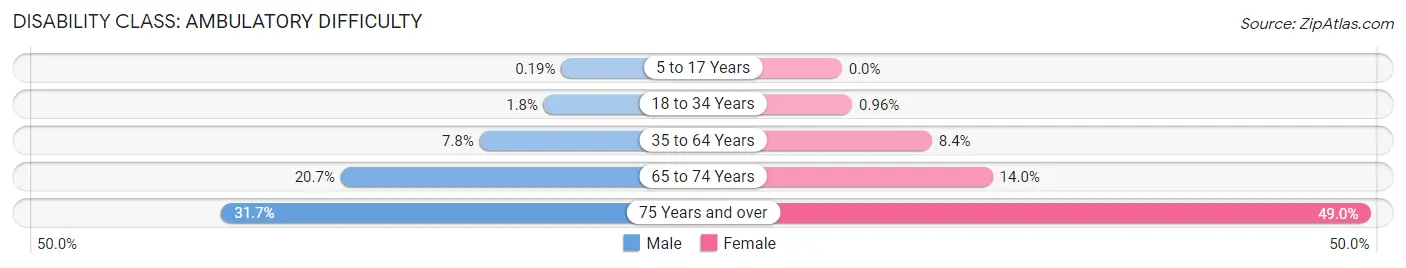
| Age Bracket | Male | Female |
| 5 to 17 Years | 18 (0.2%) | 0 (0.0%) |
| 18 to 34 Years | 227 (1.8%) | 108 (1.0%) |
| 35 to 64 Years | 1,731 (7.8%) | 2,060 (8.4%) |
| 65 to 74 Years | 1,421 (20.7%) | 904 (14.0%) |
| 75 Years and over | 1,298 (31.7%) | 2,804 (49.0%) |
Disability Class: Self-Care Difficulty
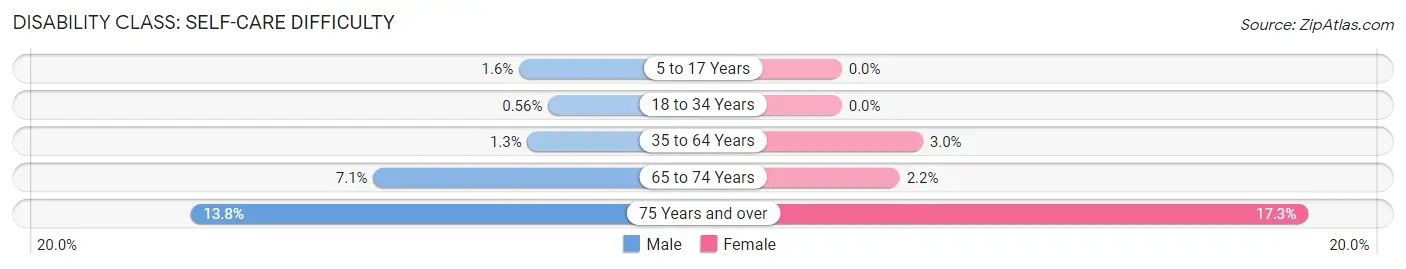
| Age Bracket | Male | Female |
| 5 to 17 Years | 157 (1.6%) | 0 (0.0%) |
| 18 to 34 Years | 70 (0.6%) | 0 (0.0%) |
| 35 to 64 Years | 295 (1.3%) | 741 (3.0%) |
| 65 to 74 Years | 485 (7.0%) | 139 (2.1%) |
| 75 Years and over | 566 (13.8%) | 990 (17.3%) |
Technology Access in Palm Bay
Computing Device Access in Palm Bay
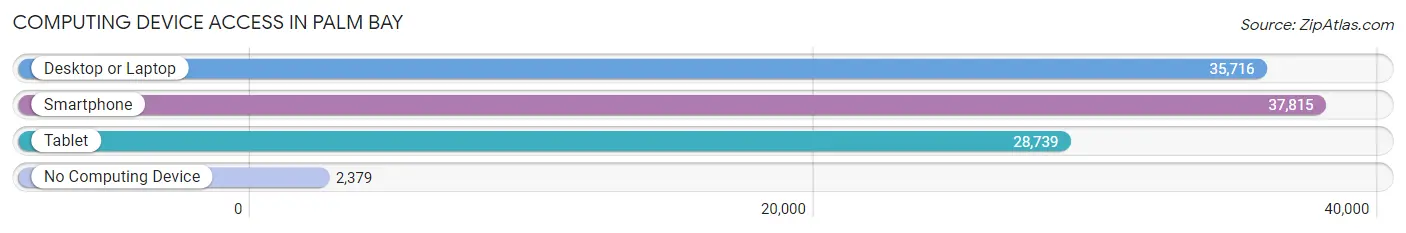
| Device Type | # Households | % Households |
| Desktop or Laptop | 35,716 | 83.3% |
| Smartphone | 37,815 | 88.2% |
| Tablet | 28,739 | 67.0% |
| No Computing Device | 2,379 | 5.6% |
| Total | 42,865 | 100.0% |
Internet Access in Palm Bay
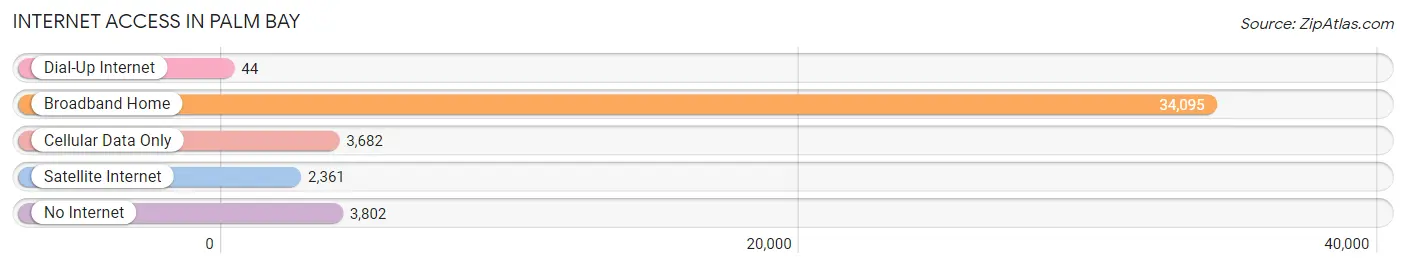
| Internet Type | # Households | % Households |
| Dial-Up Internet | 44 | 0.1% |
| Broadband Home | 34,095 | 79.5% |
| Cellular Data Only | 3,682 | 8.6% |
| Satellite Internet | 2,361 | 5.5% |
| No Internet | 3,802 | 8.9% |
| Total | 42,865 | 100.0% |
Palm Bay Summary
Palm Bay is a city located in Brevard County, Florida, United States. It is the most populous city in the county with a population of 103,190 as of the 2010 United States Census. The city is a principal city of the Palm Bay–Melbourne–Titusville Metropolitan Statistical Area, which had a population of 543,376 at the 2010 census.
Geography
Palm Bay is located in east-central Florida, approximately 50 miles southeast of Orlando and 80 miles northeast of Tampa. It is situated on the Indian River Lagoon, which is part of the Atlantic Intracoastal Waterway. The city is bordered by the cities of Melbourne and Titusville to the north, and by the unincorporated areas of Port St. John and Malabar to the south.
The city covers an area of approximately 115 square miles, of which about half is land and the other half is water. The city is divided into four distinct geographic regions: the mainland, the barrier islands, the mainland's western shore, and the mainland's eastern shore. The mainland is located on the western side of the Indian River Lagoon and is home to most of the city's population. The barrier islands are located on the eastern side of the lagoon and are home to a variety of wildlife, including manatees, dolphins, and sea turtles. The mainland's western shore is located along the Indian River and is home to a variety of residential neighborhoods and commercial areas. The mainland's eastern shore is located along the Atlantic Ocean and is home to a variety of residential neighborhoods and commercial areas.
Economy
Palm Bay is home to a variety of industries, including manufacturing, technology, aerospace, and defense. The city is home to several major employers, including Harris Corporation, Northrop Grumman, and Embraer. The city is also home to a variety of small businesses, including restaurants, retail stores, and service providers.
The city's economy is largely driven by tourism, with visitors coming to the area to enjoy the city's beaches, parks, and other attractions. The city is also home to a variety of events, including the annual Space Coast Birding and Wildlife Festival, the annual Space Coast State Fair, and the annual Space Coast Marathon.
Demographics
As of the 2010 United States Census, there were 103,190 people, 41,845 households, and 28,845 families residing in the city. The population density was 890.3 people per square mile. There were 46,945 housing units at an average density of 405.3 per square mile. The racial makeup of the city was 75.2% White, 15.3% African American, 0.4% Native American, 2.2% Asian, 0.1% Pacific Islander, 4.3% from other races, and 2.5% from two or more races. Hispanic or Latino of any race were 11.3% of the population.
There were 41,845 households, out of which 28.2% had children under the age of 18 living with them, 48.2% were married couples living together, 14.2% had a female householder with no husband present, and 32.7% were non-families. 25.7% of all households were made up of individuals, and 9.2% had someone living alone who was 65 years of age or older. The average household size was 2.45 and the average family size was 2.94.
In the city, the population was spread out, with 23.2% under the age of 18, 8.2% from 18 to 24, 28.2% from 25 to 44, 26.2% from 45 to 64, and 14.2% who were 65 years of age or older. The median age was 38.4 years. For every 100 females, there were 95.2 males. For every 100 females age 18 and over, there were 92.3 males.
The median income for a household in the city was $45,890, and the median income for a family was $53,890. Males had a median income of $41,890 versus $30,890 for females. The per capita income for the city was $23,890. About 10.2% of families and 13.2% of the population were below the poverty line, including 19.2% of those under age 18 and 8.2% of those age 65 or over.
Common Questions
What is Per Capita Income in Palm Bay?
Per Capita income in Palm Bay is $31,589.
What is the Median Family Income in Palm Bay?
Median Family Income in Palm Bay is $70,509.
What is the Median Household income in Palm Bay?
Median Household Income in Palm Bay is $62,538.
What is Income or Wage Gap in Palm Bay?
Income or Wage Gap in Palm Bay is 22.3%.
Women in Palm Bay earn 77.7 cents for every dollar earned by a man.
What is Family Income Deficit in Palm Bay?
Family Income Deficit in Palm Bay is $8,701.
Families that are below poverty line in Palm Bay earn $8,701 less on average than the poverty threshold level.
What is Inequality or Gini Index in Palm Bay?
Inequality or Gini Index in Palm Bay is 0.44.
What is the Total Population of Palm Bay?
Total Population of Palm Bay is 121,513.
What is the Total Male Population of Palm Bay?
Total Male Population of Palm Bay is 59,884.
What is the Total Female Population of Palm Bay?
Total Female Population of Palm Bay is 61,629.
What is the Ratio of Males per 100 Females in Palm Bay?
There are 97.17 Males per 100 Females in Palm Bay.
What is the Ratio of Females per 100 Males in Palm Bay?
There are 102.91 Females per 100 Males in Palm Bay.
What is the Median Population Age in Palm Bay?
Median Population Age in Palm Bay is 41.8 Years.
What is the Average Family Size in Palm Bay
Average Family Size in Palm Bay is 3.3 People.
What is the Average Household Size in Palm Bay
Average Household Size in Palm Bay is 2.8 People.
How Large is the Labor Force in Palm Bay?
There are 58,037 People in the Labor Forcein in Palm Bay.
What is the Percentage of People in the Labor Force in Palm Bay?
59.0% of People are in the Labor Force in Palm Bay.
What is the Unemployment Rate in Palm Bay?
Unemployment Rate in Palm Bay is 5.7%.