Cary, NC Map & Demographics
Cary Map
Cary Overview
$61,933
PER CAPITA INCOME
$153,798
AVG FAMILY INCOME
$125,317
AVG HOUSEHOLD INCOME
44.0%
WAGE / INCOME GAP [ % ]
56.0¢/ $1
WAGE / INCOME GAP [ $ ]
$12,078
FAMILY INCOME DEFICIT
0.43
INEQUALITY / GINI INDEX
174,880
TOTAL POPULATION
86,405
MALE POPULATION
88,475
FEMALE POPULATION
97.66
MALES / 100 FEMALES
102.40
FEMALES / 100 MALES
39.4
MEDIAN AGE
3.1
AVG FAMILY SIZE
2.6
AVG HOUSEHOLD SIZE
96,629
LABOR FORCE [ PEOPLE ]
70.1%
PERCENT IN LABOR FORCE
3.4%
UNEMPLOYMENT RATE
Cary Area Codes
Income in Cary
Income Overview in Cary
Per Capita Income in Cary is $61,933, while median incomes of families and households are $153,798 and $125,317 respectively.
| Characteristic | Number | Measure |
| Per Capita Income | 174,880 | $61,933 |
| Median Family Income | 47,580 | $153,798 |
| Mean Family Income | 47,580 | $187,962 |
| Median Household Income | 66,120 | $125,317 |
| Mean Household Income | 66,120 | $160,438 |
| Income Deficit | 47,580 | $12,078 |
| Wage / Income Gap (%) | 174,880 | 43.96% |
| Wage / Income Gap ($) | 174,880 | 56.04¢ per $1 |
| Gini / Inequality Index | 174,880 | 0.43 |
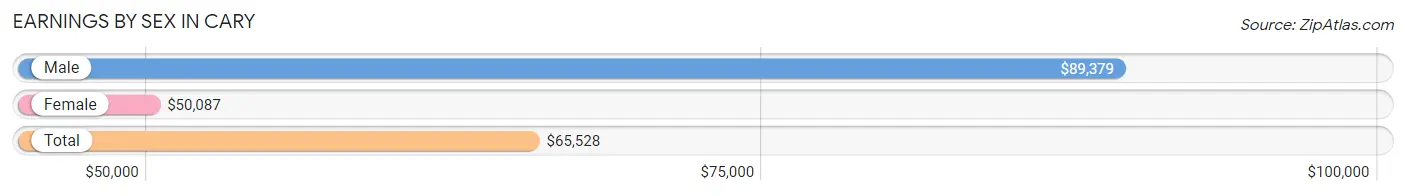
Earnings by Sex in Cary
Average Earnings in Cary are $65,528, $89,379 for men and $50,087 for women, a difference of 44.0%.
| Sex | Number | Average Earnings |
| Male | 54,637 (54.4%) | $89,379 |
| Female | 45,774 (45.6%) | $50,087 |
| Total | 100,411 (100.0%) | $65,528 |
Earnings by Sex by Income Bracket in Cary
The most common earnings brackets in Cary are $100,000+ for men (24,882 | 45.5%) and $100,000+ for women (9,683 | 21.1%).
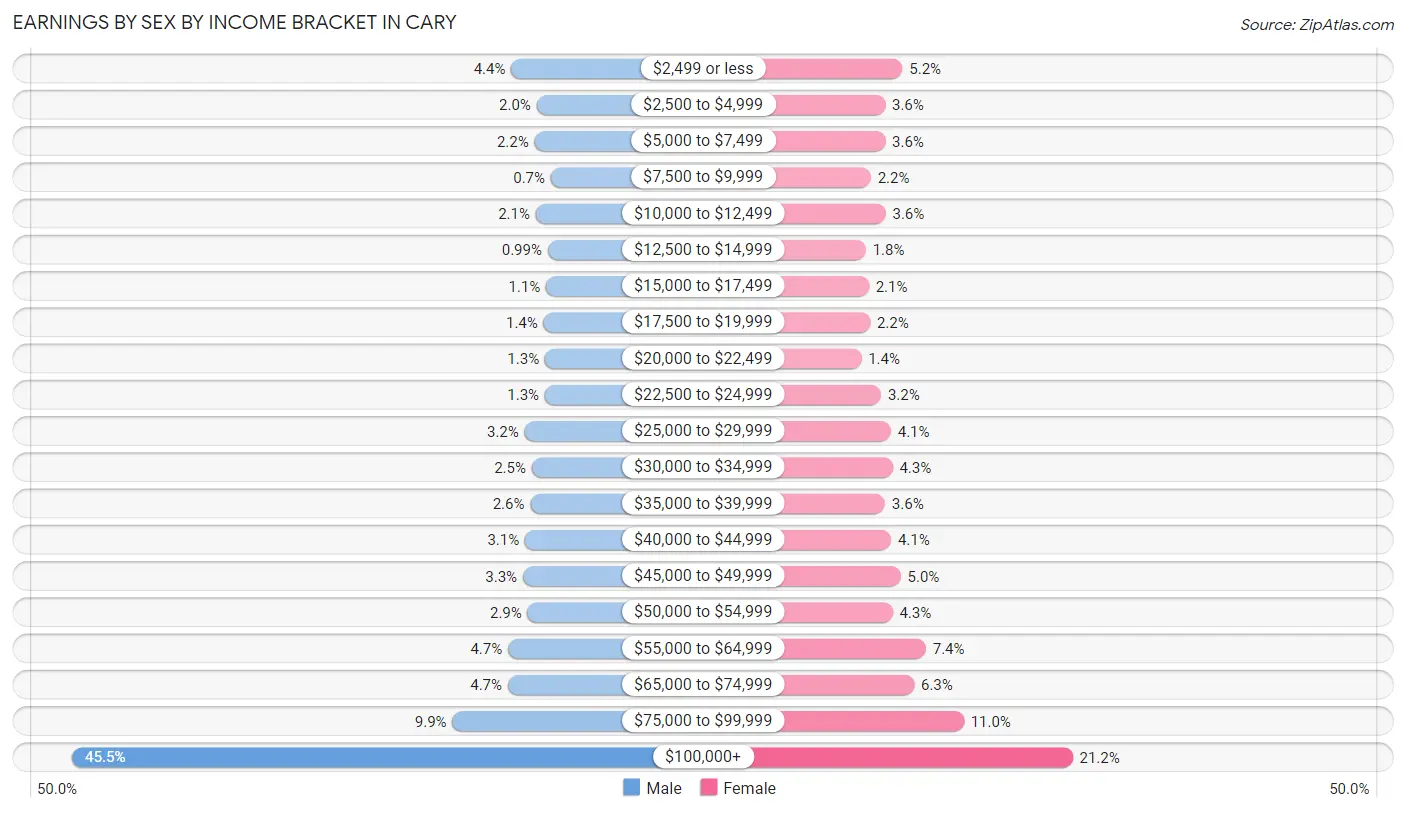
| Income | Male | Female |
| $2,499 or less | 2,412 (4.4%) | 2,382 (5.2%) |
| $2,500 to $4,999 | 1,109 (2.0%) | 1,638 (3.6%) |
| $5,000 to $7,499 | 1,221 (2.2%) | 1,641 (3.6%) |
| $7,500 to $9,999 | 381 (0.7%) | 1,026 (2.2%) |
| $10,000 to $12,499 | 1,153 (2.1%) | 1,662 (3.6%) |
| $12,500 to $14,999 | 539 (1.0%) | 811 (1.8%) |
| $15,000 to $17,499 | 624 (1.1%) | 937 (2.1%) |
| $17,500 to $19,999 | 753 (1.4%) | 993 (2.2%) |
| $20,000 to $22,499 | 685 (1.3%) | 616 (1.3%) |
| $22,500 to $24,999 | 690 (1.3%) | 1,464 (3.2%) |
| $25,000 to $29,999 | 1,727 (3.2%) | 1,885 (4.1%) |
| $30,000 to $34,999 | 1,360 (2.5%) | 1,957 (4.3%) |
| $35,000 to $39,999 | 1,435 (2.6%) | 1,634 (3.6%) |
| $40,000 to $44,999 | 1,705 (3.1%) | 1,893 (4.1%) |
| $45,000 to $49,999 | 1,814 (3.3%) | 2,308 (5.0%) |
| $50,000 to $54,999 | 1,572 (2.9%) | 1,961 (4.3%) |
| $55,000 to $64,999 | 2,571 (4.7%) | 3,389 (7.4%) |
| $65,000 to $74,999 | 2,582 (4.7%) | 2,882 (6.3%) |
| $75,000 to $99,999 | 5,422 (9.9%) | 5,012 (11.0%) |
| $100,000+ | 24,882 (45.5%) | 9,683 (21.1%) |
| Total | 54,637 (100.0%) | 45,774 (100.0%) |
Earnings by Sex by Educational Attainment in Cary
Average earnings in Cary are $101,973 for men and $56,746 for women, a difference of 44.4%. Men with an educational attainment of graduate degree enjoy the highest average annual earnings of $131,394, while those with less than high school education earn the least with $32,578. Women with an educational attainment of graduate degree earn the most with the average annual earnings of $82,054, while those with less than high school education have the smallest earnings of $18,355.
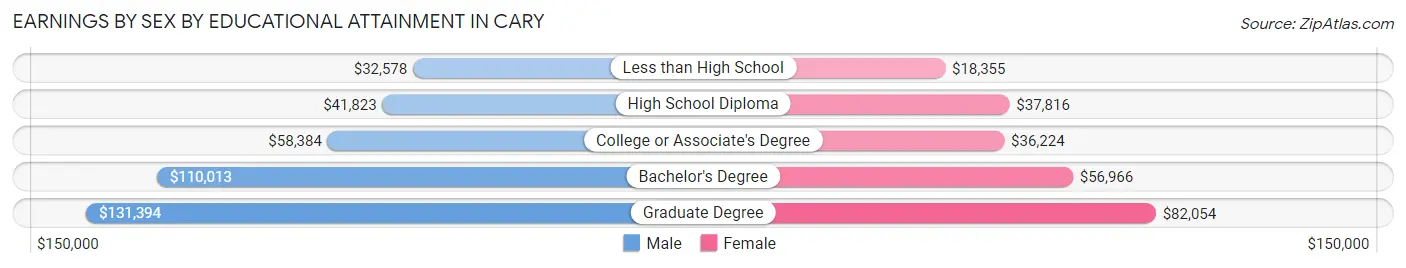
| Educational Attainment | Male Income | Female Income |
| Less than High School | $32,578 | $18,355 |
| High School Diploma | $41,823 | $37,816 |
| College or Associate's Degree | $58,384 | $36,224 |
| Bachelor's Degree | $110,013 | $56,966 |
| Graduate Degree | $131,394 | $82,054 |
| Total | $101,973 | $56,746 |
Family Income in Cary
Family Income Brackets in Cary
According to the Cary family income data, there are 15,987 families falling into the $200,000+ income range, which is the most common income bracket and makes up 33.6% of all families. Conversely, the $10,000 to $14,999 income bracket is the least frequent group with only 381 families (0.8%) belonging to this category.
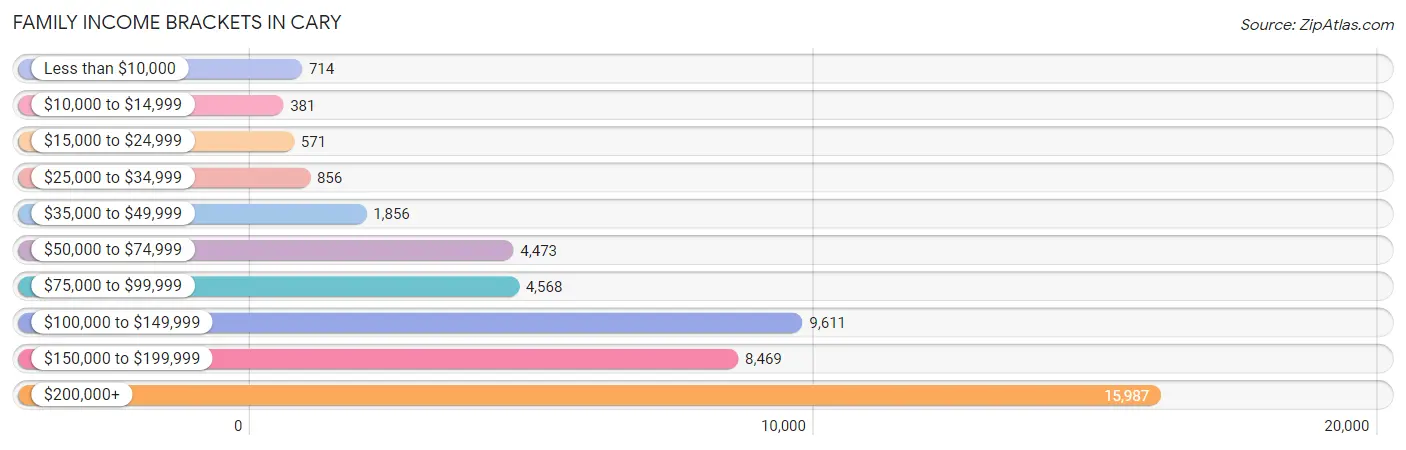
| Income Bracket | # Families | % Families |
| Less than $10,000 | 714 | 1.5% |
| $10,000 to $14,999 | 381 | 0.8% |
| $15,000 to $24,999 | 571 | 1.2% |
| $25,000 to $34,999 | 856 | 1.8% |
| $35,000 to $49,999 | 1,856 | 3.9% |
| $50,000 to $74,999 | 4,473 | 9.4% |
| $75,000 to $99,999 | 4,568 | 9.6% |
| $100,000 to $149,999 | 9,611 | 20.2% |
| $150,000 to $199,999 | 8,469 | 17.8% |
| $200,000+ | 15,987 | 33.6% |
Family Income by Famaliy Size in Cary
6-person families (838 | 1.8%) account for the highest median family income in Cary with $192,250 per family, while 2-person families (21,096 | 44.3%) have the highest median income of $61,771 per family member.
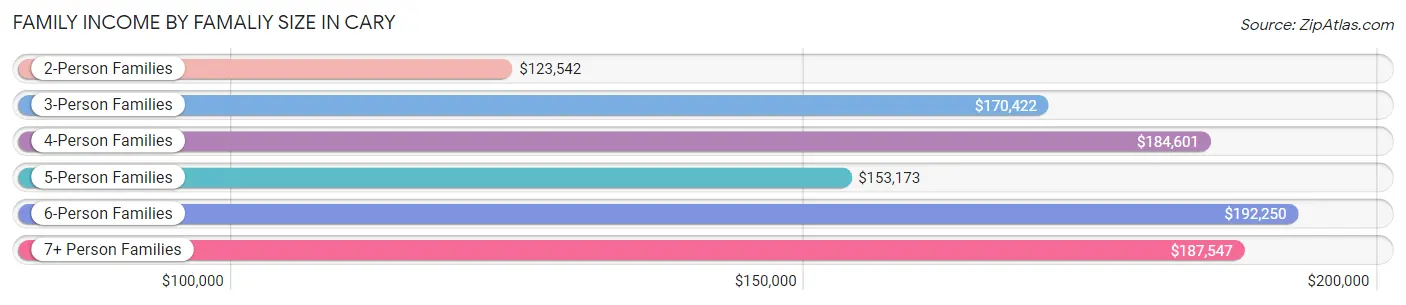
| Income Bracket | # Families | Median Income |
| 2-Person Families | 21,096 (44.3%) | $123,542 |
| 3-Person Families | 10,416 (21.9%) | $170,422 |
| 4-Person Families | 11,526 (24.2%) | $184,601 |
| 5-Person Families | 3,271 (6.9%) | $153,173 |
| 6-Person Families | 838 (1.8%) | $192,250 |
| 7+ Person Families | 433 (0.9%) | $187,547 |
| Total | 47,580 (100.0%) | $153,798 |
Family Income by Number of Earners in Cary
The median family income in Cary is $153,798, with families comprising 3+ earners (5,116) having the highest median family income of $184,070, while families with no earners (4,739) have the lowest median family income of $81,264, accounting for 10.7% and 10.0% of families, respectively.
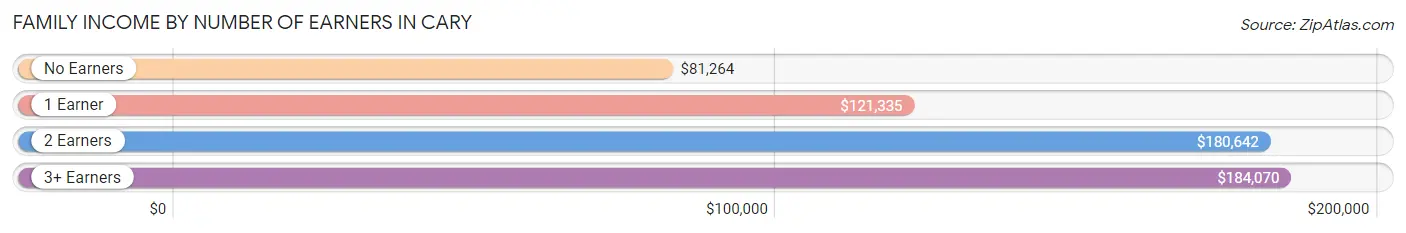
| Number of Earners | # Families | Median Income |
| No Earners | 4,739 (10.0%) | $81,264 |
| 1 Earner | 13,964 (29.3%) | $121,335 |
| 2 Earners | 23,761 (49.9%) | $180,642 |
| 3+ Earners | 5,116 (10.7%) | $184,070 |
| Total | 47,580 (100.0%) | $153,798 |
Household Income in Cary
Household Income Brackets in Cary
With 17,390 households falling in the category, the $200,000+ income range is the most frequent in Cary, accounting for 26.3% of all households. In contrast, only 860 households (1.3%) fall into the $10,000 to $14,999 income bracket, making it the least populous group.
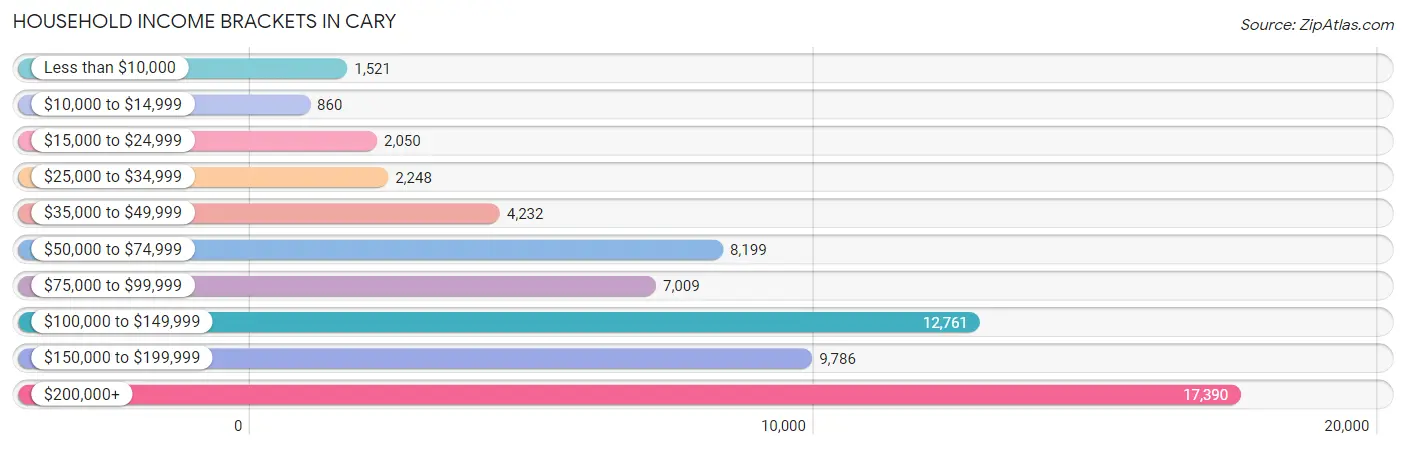
| Income Bracket | # Households | % Households |
| Less than $10,000 | 1,521 | 2.3% |
| $10,000 to $14,999 | 860 | 1.3% |
| $15,000 to $24,999 | 2,050 | 3.1% |
| $25,000 to $34,999 | 2,248 | 3.4% |
| $35,000 to $49,999 | 4,232 | 6.4% |
| $50,000 to $74,999 | 8,199 | 12.4% |
| $75,000 to $99,999 | 7,009 | 10.6% |
| $100,000 to $149,999 | 12,761 | 19.3% |
| $150,000 to $199,999 | 9,786 | 14.8% |
| $200,000+ | 17,390 | 26.3% |
Household Income by Householder Age in Cary
The median household income in Cary is $125,317, with the highest median household income of $157,242 found in the 45 to 64 years age bracket for the primary householder. A total of 27,478 households (41.6%) fall into this category. Meanwhile, the 15 to 24 years age bracket for the primary householder has the lowest median household income of $52,218, with 1,978 households (3.0%) in this group.
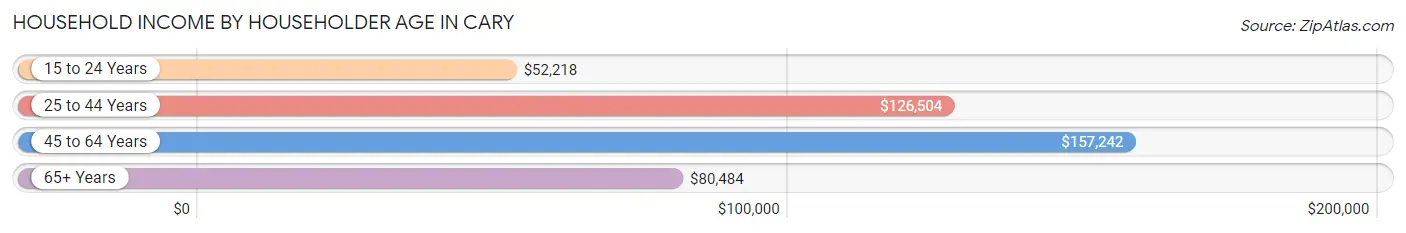
| Income Bracket | # Households | Median Income |
| 15 to 24 Years | 1,978 (3.0%) | $52,218 |
| 25 to 44 Years | 23,632 (35.7%) | $126,504 |
| 45 to 64 Years | 27,478 (41.6%) | $157,242 |
| 65+ Years | 13,032 (19.7%) | $80,484 |
| Total | 66,120 (100.0%) | $125,317 |
Poverty in Cary
Income Below Poverty by Sex and Age in Cary
With 4.4% poverty level for males and 5.9% for females among the residents of Cary, 18 to 24 year old males and 5 year old females are the most vulnerable to poverty, with 566 males (9.4%) and 198 females (14.7%) in their respective age groups living below the poverty level.
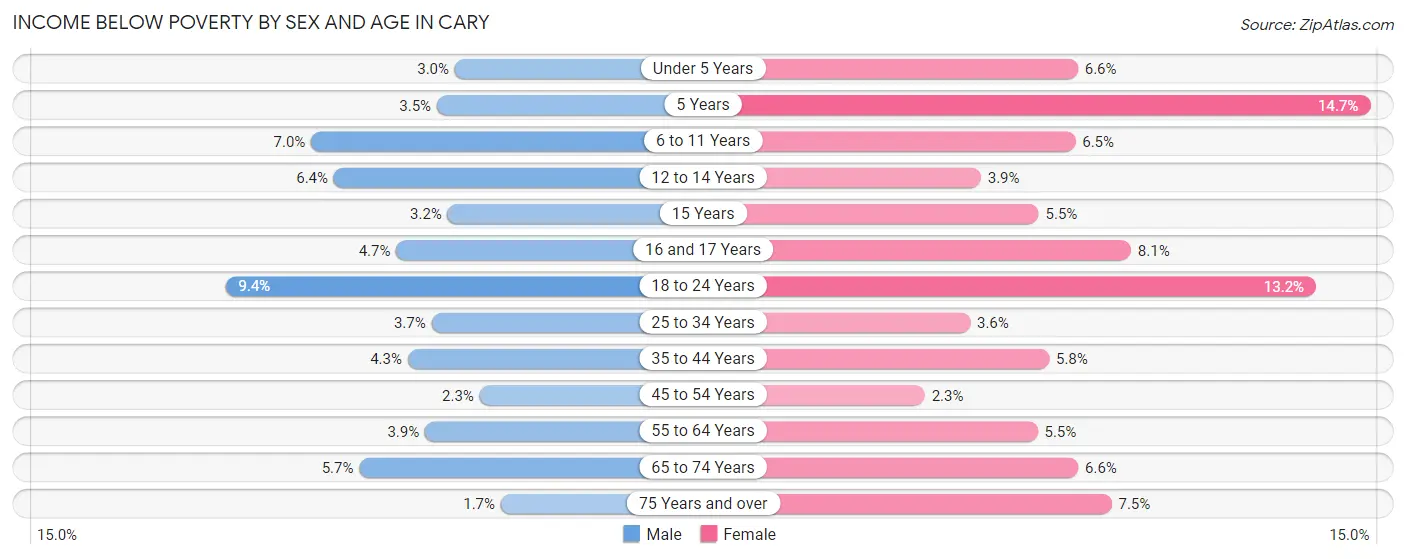
| Age Bracket | Male | Female |
| Under 5 Years | 148 (3.0%) | 288 (6.6%) |
| 5 Years | 43 (3.5%) | 198 (14.7%) |
| 6 to 11 Years | 544 (7.0%) | 470 (6.5%) |
| 12 to 14 Years | 237 (6.4%) | 137 (3.9%) |
| 15 Years | 43 (3.2%) | 77 (5.5%) |
| 16 and 17 Years | 138 (4.6%) | 235 (8.1%) |
| 18 to 24 Years | 566 (9.4%) | 840 (13.2%) |
| 25 to 34 Years | 366 (3.7%) | 379 (3.6%) |
| 35 to 44 Years | 595 (4.3%) | 782 (5.8%) |
| 45 to 54 Years | 333 (2.3%) | 297 (2.3%) |
| 55 to 64 Years | 398 (3.8%) | 608 (5.4%) |
| 65 to 74 Years | 365 (5.7%) | 502 (6.6%) |
| 75 Years and over | 63 (1.7%) | 390 (7.5%) |
| Total | 3,839 (4.4%) | 5,203 (5.9%) |
Income Above Poverty by Sex and Age in Cary
According to the poverty statistics in Cary, males aged 75 years and over and females aged 45 to 54 years are the age groups that are most secure financially, with 98.3% of males and 97.7% of females in these age groups living above the poverty line.
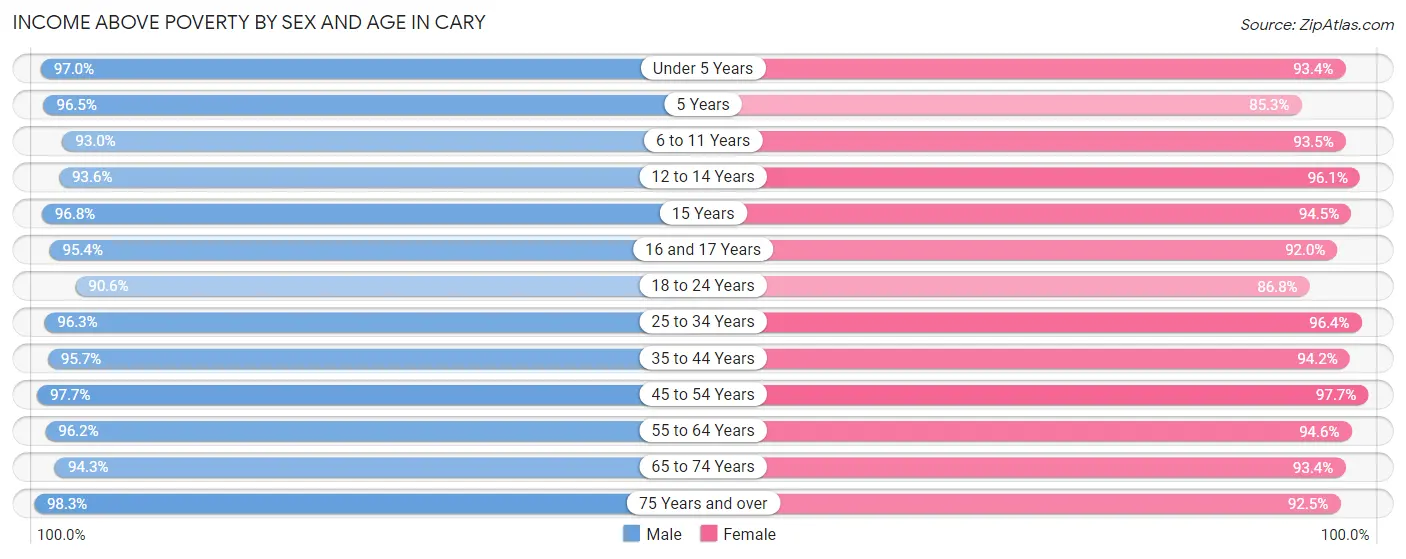
| Age Bracket | Male | Female |
| Under 5 Years | 4,755 (97.0%) | 4,097 (93.4%) |
| 5 Years | 1,178 (96.5%) | 1,148 (85.3%) |
| 6 to 11 Years | 7,202 (93.0%) | 6,764 (93.5%) |
| 12 to 14 Years | 3,470 (93.6%) | 3,400 (96.1%) |
| 15 Years | 1,294 (96.8%) | 1,328 (94.5%) |
| 16 and 17 Years | 2,829 (95.4%) | 2,686 (91.9%) |
| 18 to 24 Years | 5,452 (90.6%) | 5,523 (86.8%) |
| 25 to 34 Years | 9,618 (96.3%) | 10,248 (96.4%) |
| 35 to 44 Years | 13,139 (95.7%) | 12,776 (94.2%) |
| 45 to 54 Years | 13,938 (97.7%) | 12,565 (97.7%) |
| 55 to 64 Years | 9,936 (96.2%) | 10,548 (94.6%) |
| 65 to 74 Years | 6,056 (94.3%) | 7,128 (93.4%) |
| 75 Years and over | 3,550 (98.3%) | 4,802 (92.5%) |
| Total | 82,417 (95.6%) | 83,013 (94.1%) |
Income Below Poverty Among Married-Couple Families in Cary
The poverty statistics for married-couple families in Cary show that 2.1% or 849 of the total 40,195 families live below the poverty line. Families with 3 or 4 children have the highest poverty rate of 3.3%, comprising of 83 families. On the other hand, families with 5 or more children have the lowest poverty rate of 0.0%, which includes 0 families.
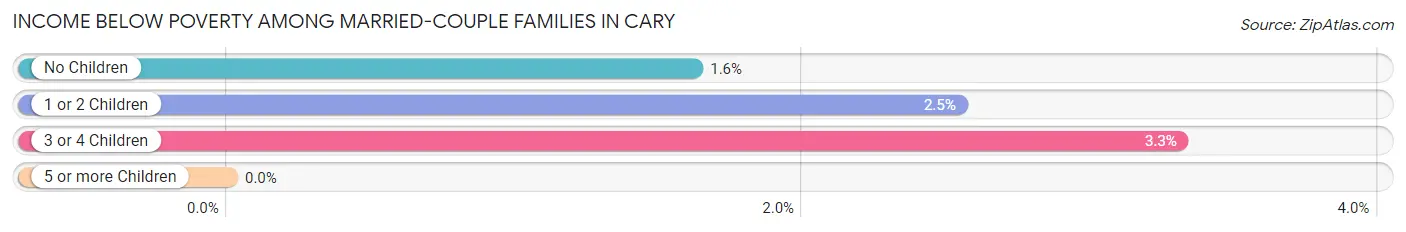
| Children | Above Poverty | Below Poverty |
| No Children | 20,034 (98.4%) | 329 (1.6%) |
| 1 or 2 Children | 16,768 (97.5%) | 437 (2.5%) |
| 3 or 4 Children | 2,428 (96.7%) | 83 (3.3%) |
| 5 or more Children | 116 (100.0%) | 0 (0.0%) |
| Total | 39,346 (97.9%) | 849 (2.1%) |
Income Below Poverty Among Single-Parent Households in Cary
According to the poverty data in Cary, 8.3% or 210 single-father households and 12.7% or 617 single-mother households are living below the poverty line. Among single-father households, those with 1 or 2 children have the highest poverty rate, with 176 households (12.1%) experiencing poverty. Likewise, among single-mother households, those with 5 or more children have the highest poverty rate, with 9 households (100.0%) falling below the poverty line.
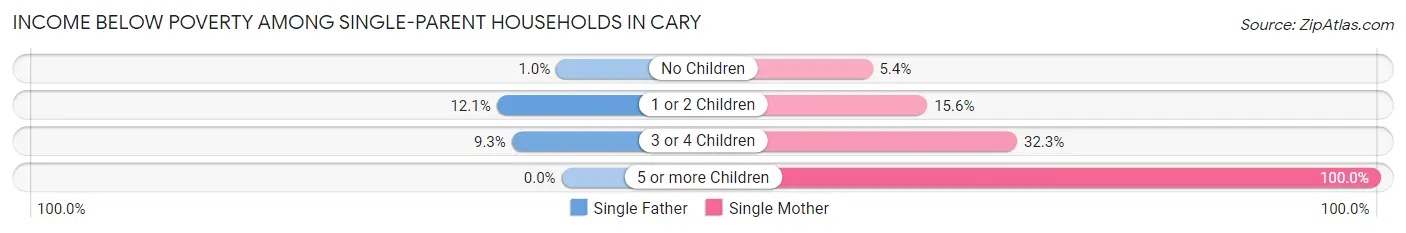
| Children | Single Father | Single Mother |
| No Children | 8 (1.0%) | 105 (5.4%) |
| 1 or 2 Children | 176 (12.1%) | 400 (15.6%) |
| 3 or 4 Children | 26 (9.3%) | 103 (32.3%) |
| 5 or more Children | 0 (0.0%) | 9 (100.0%) |
| Total | 210 (8.3%) | 617 (12.7%) |
Income Below Poverty Among Married-Couple vs Single-Parent Households in Cary
The poverty data for Cary shows that 849 of the married-couple family households (2.1%) and 827 of the single-parent households (11.2%) are living below the poverty level. Within the married-couple family households, those with 3 or 4 children have the highest poverty rate, with 83 households (3.3%) falling below the poverty line. Among the single-parent households, those with 5 or more children have the highest poverty rate, with 9 household (100.0%) living below poverty.
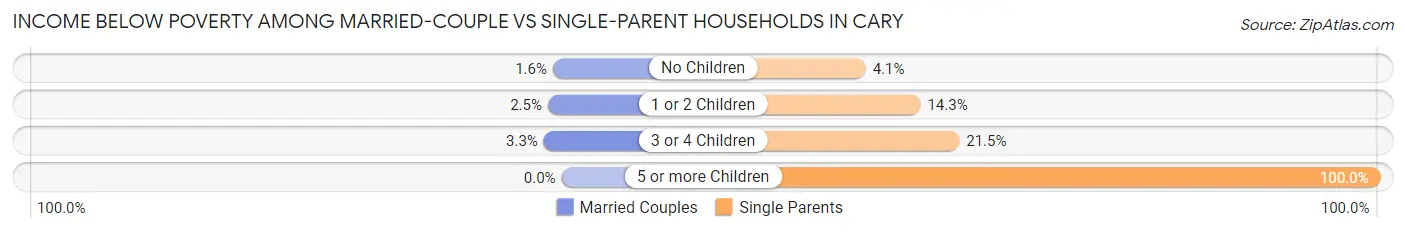
| Children | Married-Couple Families | Single-Parent Households |
| No Children | 329 (1.6%) | 113 (4.1%) |
| 1 or 2 Children | 437 (2.5%) | 576 (14.3%) |
| 3 or 4 Children | 83 (3.3%) | 129 (21.5%) |
| 5 or more Children | 0 (0.0%) | 9 (100.0%) |
| Total | 849 (2.1%) | 827 (11.2%) |
Race in Cary
The most populous races in Cary are White / Caucasian (107,467 | 61.5%), Asian (36,530 | 20.9%), and Black / African American (14,477 | 8.3%).
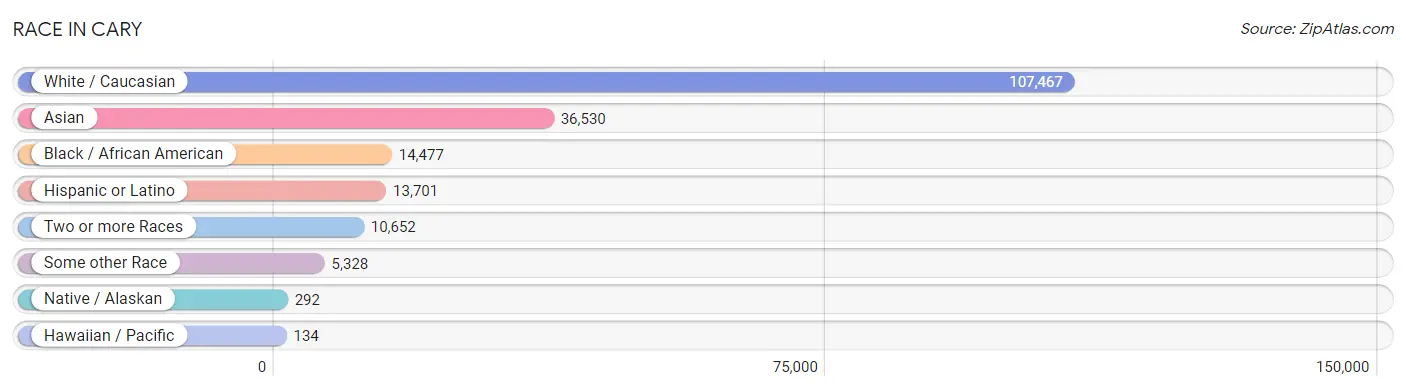
| Race | # Population | % Population |
| Asian | 36,530 | 20.9% |
| Black / African American | 14,477 | 8.3% |
| Hawaiian / Pacific | 134 | 0.1% |
| Hispanic or Latino | 13,701 | 7.8% |
| Native / Alaskan | 292 | 0.2% |
| White / Caucasian | 107,467 | 61.5% |
| Two or more Races | 10,652 | 6.1% |
| Some other Race | 5,328 | 3.0% |
| Total | 174,880 | 100.0% |
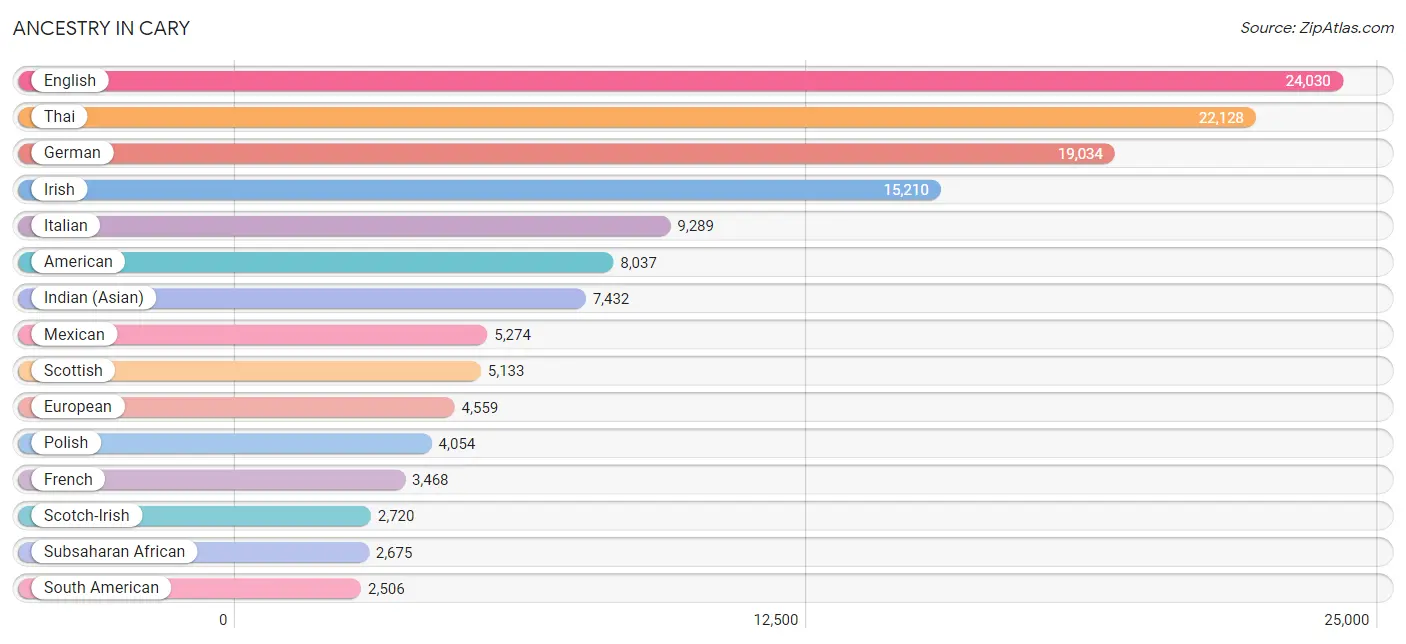
Ancestry in Cary
The most populous ancestries reported in Cary are English (24,030 | 13.7%), Thai (22,128 | 12.7%), German (19,034 | 10.9%), Irish (15,210 | 8.7%), and Italian (9,289 | 5.3%), together accounting for 51.3% of all Cary residents.
| Ancestry | # Population | % Population |
| Afghan | 183 | 0.1% |
| African | 796 | 0.5% |
| Albanian | 51 | 0.0% |
| Alsatian | 16 | 0.0% |
| American | 8,037 | 4.6% |
| Arab | 1,926 | 1.1% |
| Argentinean | 182 | 0.1% |
| Armenian | 86 | 0.1% |
| Assyrian / Chaldean / Syriac | 7 | 0.0% |
| Australian | 9 | 0.0% |
| Austrian | 355 | 0.2% |
| Bahamian | 8 | 0.0% |
| Bangladeshi | 67 | 0.0% |
| Barbadian | 10 | 0.0% |
| Belgian | 207 | 0.1% |
| Bhutanese | 967 | 0.5% |
| Blackfeet | 13 | 0.0% |
| Bolivian | 11 | 0.0% |
| Brazilian | 137 | 0.1% |
| British | 1,656 | 0.9% |
| British West Indian | 107 | 0.1% |
| Bulgarian | 65 | 0.0% |
| Burmese | 2,171 | 1.2% |
| Cajun | 118 | 0.1% |
| Cambodian | 86 | 0.1% |
| Canadian | 618 | 0.4% |
| Carpatho Rusyn | 6 | 0.0% |
| Celtic | 33 | 0.0% |
| Central American | 1,791 | 1.0% |
| Central American Indian | 97 | 0.1% |
| Cherokee | 130 | 0.1% |
| Chickasaw | 32 | 0.0% |
| Chilean | 96 | 0.1% |
| Chippewa | 12 | 0.0% |
| Colombian | 943 | 0.5% |
| Costa Rican | 52 | 0.0% |
| Cree | 29 | 0.0% |
| Croatian | 211 | 0.1% |
| Cuban | 503 | 0.3% |
| Cypriot | 69 | 0.0% |
| Czech | 1,300 | 0.7% |
| Czechoslovakian | 272 | 0.2% |
| Danish | 589 | 0.3% |
| Dominican | 851 | 0.5% |
| Dutch | 1,729 | 1.0% |
| Eastern European | 261 | 0.2% |
| Ecuadorian | 353 | 0.2% |
| Egyptian | 380 | 0.2% |
| English | 24,030 | 13.7% |
| Ethiopian | 454 | 0.3% |
| European | 4,559 | 2.6% |
| Filipino | 323 | 0.2% |
| Finnish | 278 | 0.2% |
| French | 3,468 | 2.0% |
| French American Indian | 7 | 0.0% |
| French Canadian | 942 | 0.5% |
| German | 19,034 | 10.9% |
| Ghanaian | 16 | 0.0% |
| Greek | 655 | 0.4% |
| Guamanian / Chamorro | 89 | 0.1% |
| Guatemalan | 302 | 0.2% |
| Guyanese | 23 | 0.0% |
| Haitian | 538 | 0.3% |
| Honduran | 310 | 0.2% |
| Houma | 27 | 0.0% |
| Hungarian | 847 | 0.5% |
| Icelander | 76 | 0.0% |
| Indian (Asian) | 7,432 | 4.3% |
| Iranian | 310 | 0.2% |
| Iraqi | 67 | 0.0% |
| Irish | 15,210 | 8.7% |
| Israeli | 25 | 0.0% |
| Italian | 9,289 | 5.3% |
| Jamaican | 605 | 0.4% |
| Japanese | 167 | 0.1% |
| Jordanian | 273 | 0.2% |
| Kenyan | 71 | 0.0% |
| Korean | 1,345 | 0.8% |
| Laotian | 100 | 0.1% |
| Lebanese | 408 | 0.2% |
| Liberian | 122 | 0.1% |
| Lithuanian | 313 | 0.2% |
| Lumbee | 63 | 0.0% |
| Luxembourger | 47 | 0.0% |
| Malaysian | 65 | 0.0% |
| Mexican | 5,274 | 3.0% |
| Mexican American Indian | 86 | 0.1% |
| Moroccan | 167 | 0.1% |
| Native Hawaiian | 79 | 0.1% |
| Nicaraguan | 124 | 0.1% |
| Nigerian | 652 | 0.4% |
| Northern European | 1,141 | 0.6% |
| Norwegian | 1,340 | 0.8% |
| Osage | 11 | 0.0% |
| Pakistani | 180 | 0.1% |
| Palestinian | 187 | 0.1% |
| Panamanian | 54 | 0.0% |
| Paraguayan | 6 | 0.0% |
| Pennsylvania German | 24 | 0.0% |
| Peruvian | 157 | 0.1% |
| Polish | 4,054 | 2.3% |
| Portuguese | 449 | 0.3% |
| Puerto Rican | 1,569 | 0.9% |
| Romanian | 391 | 0.2% |
| Russian | 1,673 | 1.0% |
| Salvadoran | 949 | 0.5% |
| Samoan | 30 | 0.0% |
| Scandinavian | 510 | 0.3% |
| Scotch-Irish | 2,720 | 1.6% |
| Scottish | 5,133 | 2.9% |
| Seminole | 4 | 0.0% |
| Senegalese | 28 | 0.0% |
| Serbian | 79 | 0.1% |
| Sioux | 2 | 0.0% |
| Slavic | 28 | 0.0% |
| Slovak | 465 | 0.3% |
| Slovene | 53 | 0.0% |
| Somali | 233 | 0.1% |
| South African | 56 | 0.0% |
| South American | 2,506 | 1.4% |
| South American Indian | 2 | 0.0% |
| Spaniard | 236 | 0.1% |
| Spanish | 643 | 0.4% |
| Sri Lankan | 1,597 | 0.9% |
| Subsaharan African | 2,675 | 1.5% |
| Sudanese | 67 | 0.0% |
| Swedish | 1,884 | 1.1% |
| Swiss | 680 | 0.4% |
| Syrian | 155 | 0.1% |
| Thai | 22,128 | 12.7% |
| Trinidadian and Tobagonian | 77 | 0.0% |
| Turkish | 442 | 0.3% |
| U.S. Virgin Islander | 78 | 0.0% |
| Ukrainian | 523 | 0.3% |
| Uruguayan | 31 | 0.0% |
| Venezuelan | 701 | 0.4% |
| Vietnamese | 688 | 0.4% |
| Welsh | 1,649 | 0.9% |
| West Indian | 25 | 0.0% |
| Yugoslavian | 234 | 0.1% | View All 140 Rows |
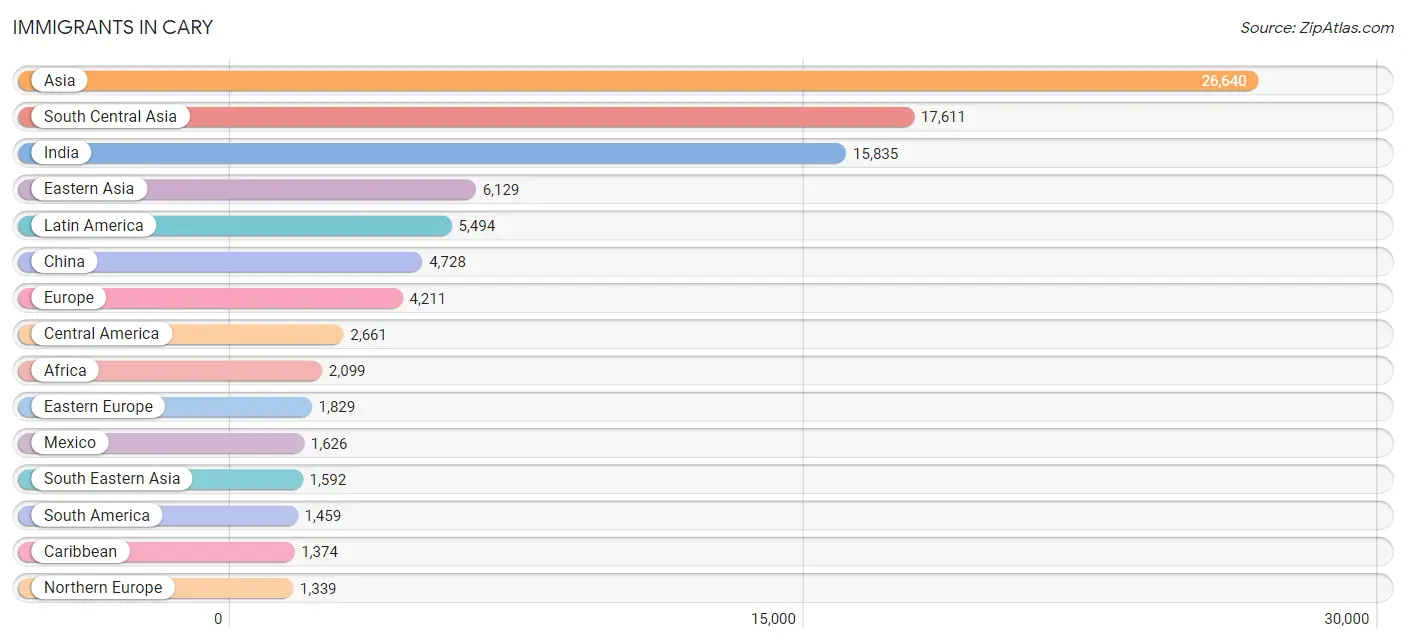
Immigrants in Cary
The most numerous immigrant groups reported in Cary came from Asia (26,640 | 15.2%), South Central Asia (17,611 | 10.1%), India (15,835 | 9.0%), Eastern Asia (6,129 | 3.5%), and Latin America (5,494 | 3.1%), together accounting for 41.0% of all Cary residents.
| Immigration Origin | # Population | % Population |
| Afghanistan | 67 | 0.0% |
| Africa | 2,099 | 1.2% |
| Albania | 19 | 0.0% |
| Argentina | 117 | 0.1% |
| Asia | 26,640 | 15.2% |
| Australia | 104 | 0.1% |
| Bahamas | 44 | 0.0% |
| Bangladesh | 347 | 0.2% |
| Barbados | 14 | 0.0% |
| Belarus | 182 | 0.1% |
| Belgium | 17 | 0.0% |
| Bolivia | 11 | 0.0% |
| Bosnia and Herzegovina | 9 | 0.0% |
| Brazil | 230 | 0.1% |
| Bulgaria | 61 | 0.0% |
| Cambodia | 29 | 0.0% |
| Cameroon | 113 | 0.1% |
| Canada | 1,215 | 0.7% |
| Caribbean | 1,374 | 0.8% |
| Central America | 2,661 | 1.5% |
| Chile | 80 | 0.1% |
| China | 4,728 | 2.7% |
| Colombia | 272 | 0.2% |
| Costa Rica | 33 | 0.0% |
| Croatia | 36 | 0.0% |
| Cuba | 48 | 0.0% |
| Czechoslovakia | 61 | 0.0% |
| Denmark | 12 | 0.0% |
| Dominican Republic | 544 | 0.3% |
| Eastern Africa | 647 | 0.4% |
| Eastern Asia | 6,129 | 3.5% |
| Eastern Europe | 1,829 | 1.1% |
| Ecuador | 130 | 0.1% |
| Egypt | 215 | 0.1% |
| El Salvador | 545 | 0.3% |
| England | 354 | 0.2% |
| Eritrea | 13 | 0.0% |
| Ethiopia | 251 | 0.1% |
| Europe | 4,211 | 2.4% |
| Fiji | 9 | 0.0% |
| France | 188 | 0.1% |
| Germany | 448 | 0.3% |
| Ghana | 40 | 0.0% |
| Greece | 108 | 0.1% |
| Guatemala | 209 | 0.1% |
| Guyana | 5 | 0.0% |
| Haiti | 314 | 0.2% |
| Honduras | 147 | 0.1% |
| Hong Kong | 278 | 0.2% |
| Hungary | 66 | 0.0% |
| India | 15,835 | 9.0% |
| Indonesia | 143 | 0.1% |
| Iran | 248 | 0.1% |
| Iraq | 178 | 0.1% |
| Ireland | 92 | 0.1% |
| Israel | 66 | 0.0% |
| Italy | 88 | 0.1% |
| Jamaica | 258 | 0.2% |
| Japan | 292 | 0.2% |
| Jordan | 313 | 0.2% |
| Kazakhstan | 95 | 0.1% |
| Kenya | 127 | 0.1% |
| Korea | 1,109 | 0.6% |
| Laos | 39 | 0.0% |
| Latin America | 5,494 | 3.1% |
| Lebanon | 63 | 0.0% |
| Liberia | 42 | 0.0% |
| Lithuania | 51 | 0.0% |
| Malaysia | 60 | 0.0% |
| Mexico | 1,626 | 0.9% |
| Micronesia | 19 | 0.0% |
| Middle Africa | 142 | 0.1% |
| Moldova | 102 | 0.1% |
| Morocco | 160 | 0.1% |
| Nepal | 555 | 0.3% |
| Netherlands | 45 | 0.0% |
| Nicaragua | 27 | 0.0% |
| Nigeria | 306 | 0.2% |
| Northern Africa | 523 | 0.3% |
| Northern Europe | 1,339 | 0.8% |
| Oceania | 182 | 0.1% |
| Pakistan | 386 | 0.2% |
| Panama | 74 | 0.0% |
| Peru | 37 | 0.0% |
| Philippines | 485 | 0.3% |
| Poland | 165 | 0.1% |
| Portugal | 18 | 0.0% |
| Romania | 85 | 0.1% |
| Russia | 704 | 0.4% |
| Scotland | 119 | 0.1% |
| Senegal | 45 | 0.0% |
| Serbia | 15 | 0.0% |
| Sierra Leone | 40 | 0.0% |
| Singapore | 66 | 0.0% |
| Somalia | 85 | 0.1% |
| South Africa | 180 | 0.1% |
| South America | 1,459 | 0.8% |
| South Central Asia | 17,611 | 10.1% |
| South Eastern Asia | 1,592 | 0.9% |
| Southern Europe | 288 | 0.2% |
| Spain | 74 | 0.0% |
| Sri Lanka | 59 | 0.0% |
| Sudan | 67 | 0.0% |
| Sweden | 43 | 0.0% |
| Switzerland | 57 | 0.0% |
| Syria | 47 | 0.0% |
| Taiwan | 634 | 0.4% |
| Thailand | 83 | 0.1% |
| Trinidad and Tobago | 70 | 0.0% |
| Turkey | 246 | 0.1% |
| Uganda | 46 | 0.0% |
| Ukraine | 220 | 0.1% |
| Uruguay | 21 | 0.0% |
| Uzbekistan | 19 | 0.0% |
| Venezuela | 550 | 0.3% |
| Vietnam | 687 | 0.4% |
| Western Africa | 535 | 0.3% |
| Western Asia | 1,200 | 0.7% |
| Western Europe | 755 | 0.4% |
| Yemen | 167 | 0.1% |
| Zaire | 29 | 0.0% |
| Zimbabwe | 66 | 0.0% | View All 122 Rows |
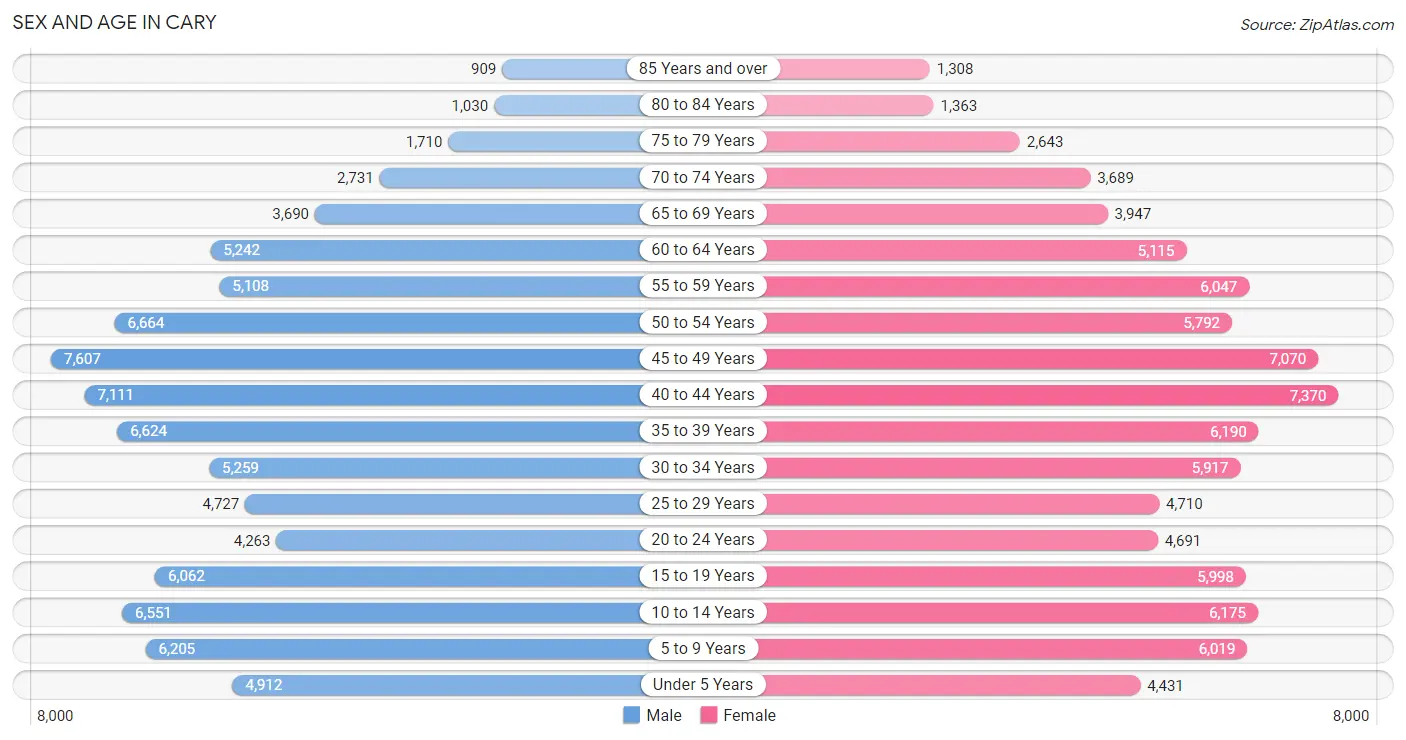
Sex and Age in Cary
Sex and Age in Cary
The most populous age groups in Cary are 45 to 49 Years (7,607 | 8.8%) for men and 40 to 44 Years (7,370 | 8.3%) for women.
| Age Bracket | Male | Female |
| Under 5 Years | 4,912 (5.7%) | 4,431 (5.0%) |
| 5 to 9 Years | 6,205 (7.2%) | 6,019 (6.8%) |
| 10 to 14 Years | 6,551 (7.6%) | 6,175 (7.0%) |
| 15 to 19 Years | 6,062 (7.0%) | 5,998 (6.8%) |
| 20 to 24 Years | 4,263 (4.9%) | 4,691 (5.3%) |
| 25 to 29 Years | 4,727 (5.5%) | 4,710 (5.3%) |
| 30 to 34 Years | 5,259 (6.1%) | 5,917 (6.7%) |
| 35 to 39 Years | 6,624 (7.7%) | 6,190 (7.0%) |
| 40 to 44 Years | 7,111 (8.2%) | 7,370 (8.3%) |
| 45 to 49 Years | 7,607 (8.8%) | 7,070 (8.0%) |
| 50 to 54 Years | 6,664 (7.7%) | 5,792 (6.6%) |
| 55 to 59 Years | 5,108 (5.9%) | 6,047 (6.8%) |
| 60 to 64 Years | 5,242 (6.1%) | 5,115 (5.8%) |
| 65 to 69 Years | 3,690 (4.3%) | 3,947 (4.5%) |
| 70 to 74 Years | 2,731 (3.2%) | 3,689 (4.2%) |
| 75 to 79 Years | 1,710 (2.0%) | 2,643 (3.0%) |
| 80 to 84 Years | 1,030 (1.2%) | 1,363 (1.5%) |
| 85 Years and over | 909 (1.1%) | 1,308 (1.5%) |
| Total | 86,405 (100.0%) | 88,475 (100.0%) |
Families and Households in Cary
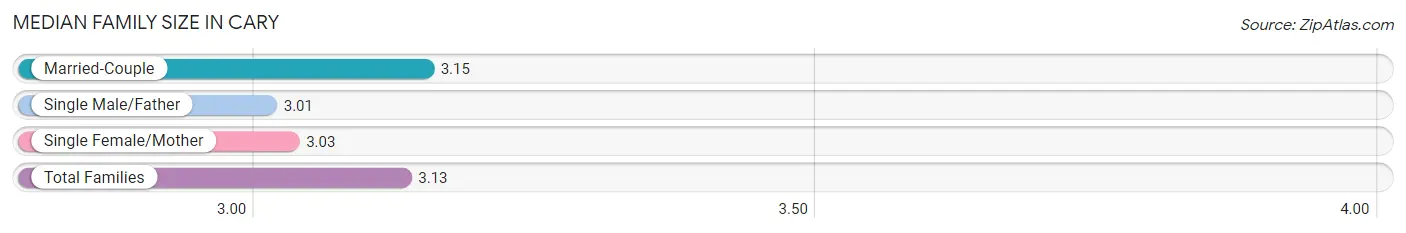
Median Family Size in Cary
The median family size in Cary is 3.13 persons per family, with married-couple families (40,195 | 84.5%) accounting for the largest median family size of 3.15 persons per family. On the other hand, single male/father families (2,527 | 5.3%) represent the smallest median family size with 3.01 persons per family.
| Family Type | # Families | Family Size |
| Married-Couple | 40,195 (84.5%) | 3.15 |
| Single Male/Father | 2,527 (5.3%) | 3.01 |
| Single Female/Mother | 4,858 (10.2%) | 3.03 |
| Total Families | 47,580 (100.0%) | 3.13 |
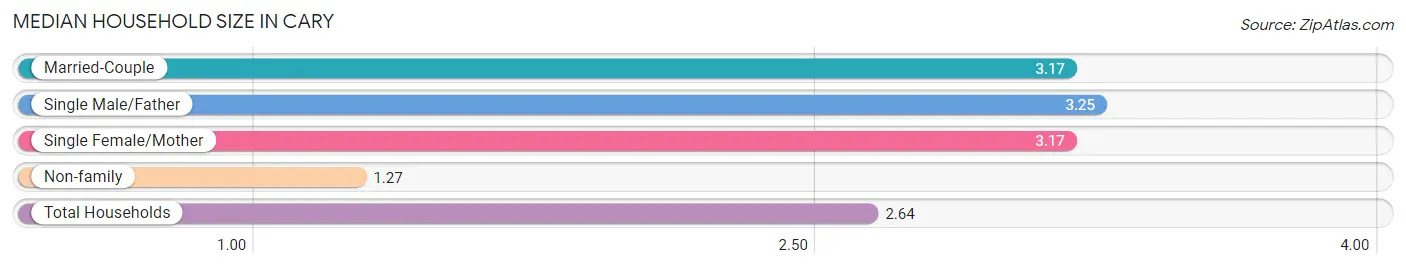
Median Household Size in Cary
The median household size in Cary is 2.64 persons per household, with single male/father households (2,527 | 3.8%) accounting for the largest median household size of 3.25 persons per household. non-family households (18,540 | 28.0%) represent the smallest median household size with 1.27 persons per household.
| Household Type | # Households | Household Size |
| Married-Couple | 40,195 (60.8%) | 3.17 |
| Single Male/Father | 2,527 (3.8%) | 3.25 |
| Single Female/Mother | 4,858 (7.3%) | 3.17 |
| Non-family | 18,540 (28.0%) | 1.27 |
| Total Households | 66,120 (100.0%) | 2.64 |
Household Size by Marriage Status in Cary
Out of a total of 66,120 households in Cary, 47,580 (72.0%) are family households, while 18,540 (28.0%) are nonfamily households. The most numerous type of family households are 2-person households, comprising 20,309, and the most common type of nonfamily households are 1-person households, comprising 14,646.
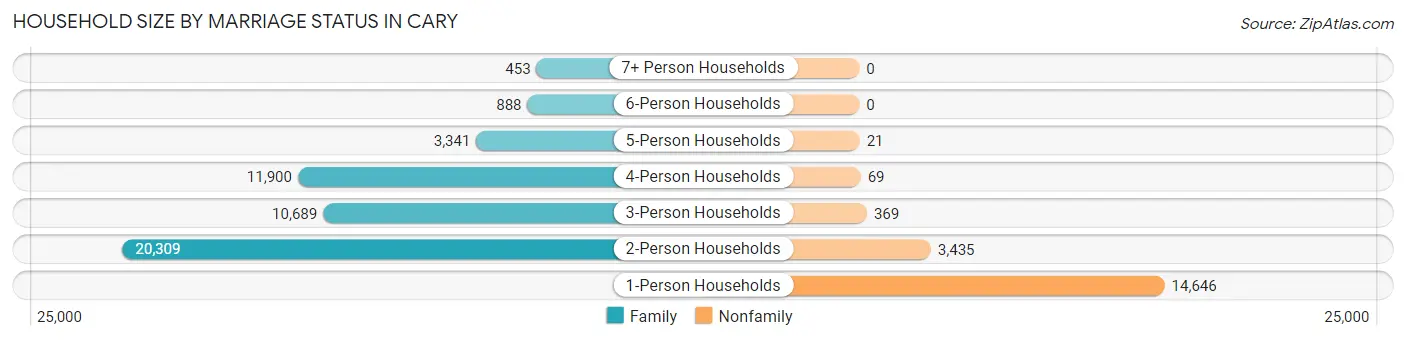
| Household Size | Family Households | Nonfamily Households |
| 1-Person Households | - | 14,646 (22.2%) |
| 2-Person Households | 20,309 (30.7%) | 3,435 (5.2%) |
| 3-Person Households | 10,689 (16.2%) | 369 (0.6%) |
| 4-Person Households | 11,900 (18.0%) | 69 (0.1%) |
| 5-Person Households | 3,341 (5.1%) | 21 (0.0%) |
| 6-Person Households | 888 (1.3%) | 0 (0.0%) |
| 7+ Person Households | 453 (0.7%) | 0 (0.0%) |
| Total | 47,580 (72.0%) | 18,540 (28.0%) |
Female Fertility in Cary
Fertility by Age in Cary
Average fertility rate in Cary is 47.0 births per 1,000 women. Women in the age bracket of 20 to 34 years have the highest fertility rate with 75.0 births per 1,000 women. Women in the age bracket of 20 to 34 years acount for 56.0% of all women with births.
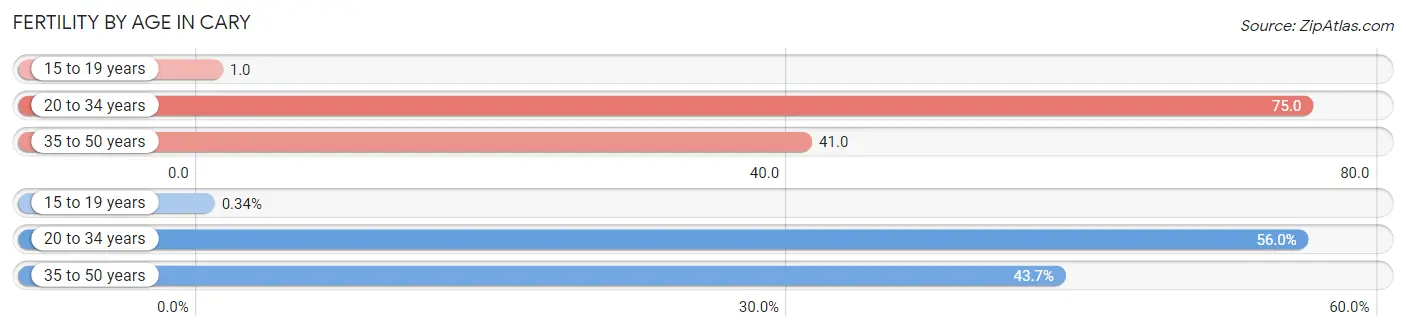
| Age Bracket | Women with Births | Births / 1,000 Women |
| 15 to 19 years | 7 (0.3%) | 1.0 |
| 20 to 34 years | 1,146 (56.0%) | 75.0 |
| 35 to 50 years | 893 (43.6%) | 41.0 |
| Total | 2,046 (100.0%) | 47.0 |
Fertility by Age by Marriage Status in Cary
91.1% of women with births (2,046) in Cary are married. The highest percentage of unmarried women with births falls into 15 to 19 years age bracket with 100.0% of them unmarried at the time of birth, while the lowest percentage of unmarried women with births belong to 35 to 50 years age bracket with 2.1% of them unmarried.
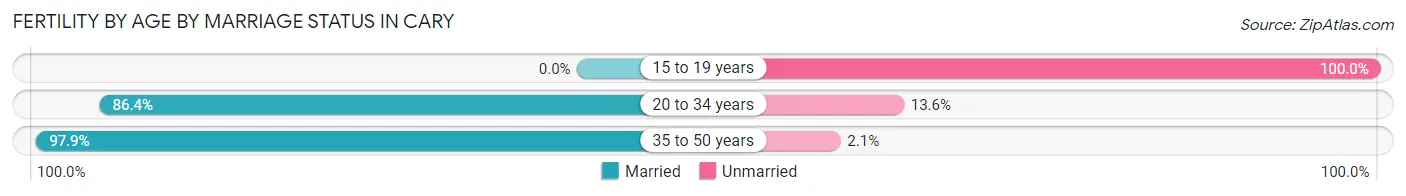
| Age Bracket | Married | Unmarried |
| 15 to 19 years | 0 (0.0%) | 7 (100.0%) |
| 20 to 34 years | 990 (86.4%) | 156 (13.6%) |
| 35 to 50 years | 874 (97.9%) | 19 (2.1%) |
| Total | 1,864 (91.1%) | 182 (8.9%) |
Fertility by Education in Cary
Average fertility rate in Cary is 47.0 births per 1,000 women. Women with the education attainment of high school diploma have the highest fertility rate of 87.0 births per 1,000 women, while women with the education attainment of less than high school have the lowest fertility at 5.0 births per 1,000 women. Women with the education attainment of graduate degree represent 34.9% of all women with births.
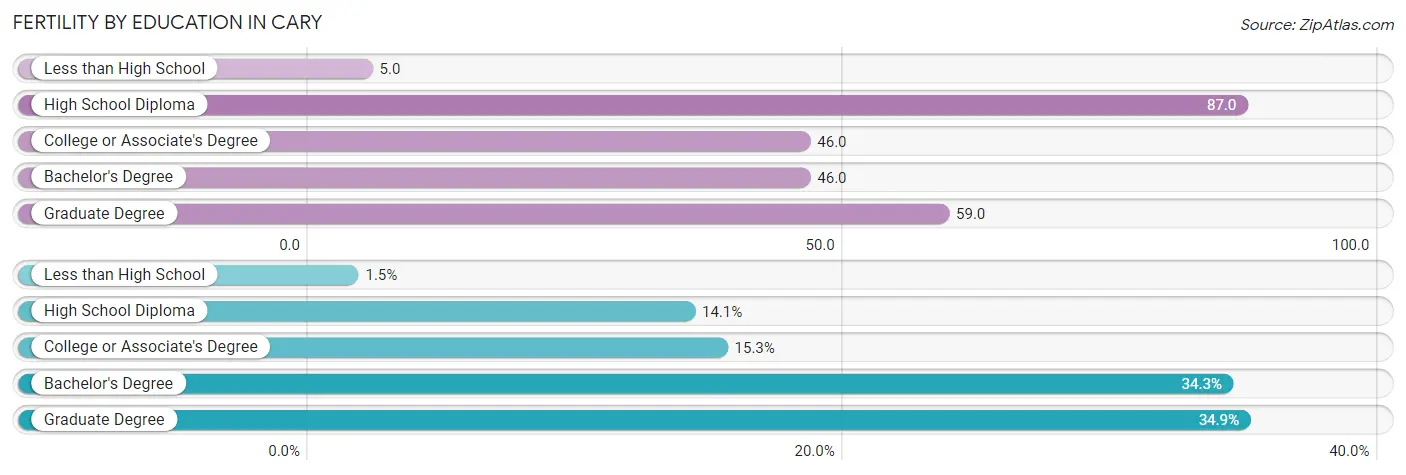
| Educational Attainment | Women with Births | Births / 1,000 Women |
| Less than High School | 30 (1.5%) | 5.0 |
| High School Diploma | 288 (14.1%) | 87.0 |
| College or Associate's Degree | 313 (15.3%) | 46.0 |
| Bachelor's Degree | 701 (34.3%) | 46.0 |
| Graduate Degree | 714 (34.9%) | 59.0 |
| Total | 2,046 (100.0%) | 47.0 |
Fertility by Education by Marriage Status in Cary
8.9% of women with births in Cary are unmarried. Women with the educational attainment of graduate degree are most likely to be married with 100.0% of them married at childbirth, while women with the educational attainment of less than high school are least likely to be married with 100.0% of them unmarried at childbirth.
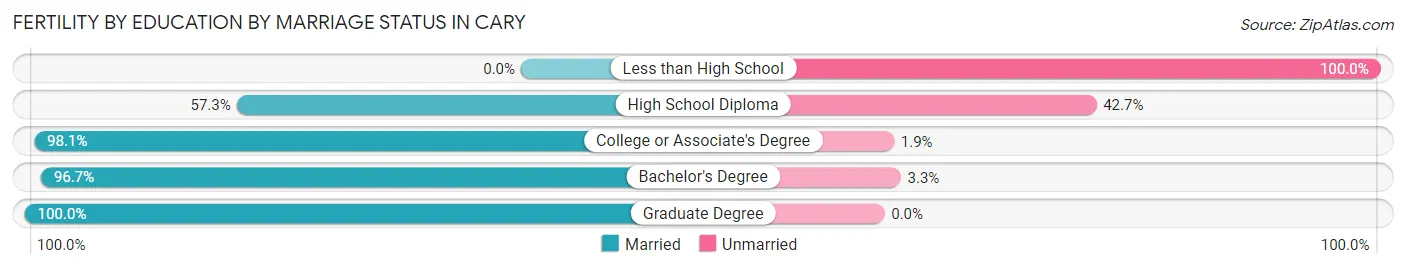
| Educational Attainment | Married | Unmarried |
| Less than High School | 0 (0.0%) | 30 (100.0%) |
| High School Diploma | 165 (57.3%) | 123 (42.7%) |
| College or Associate's Degree | 307 (98.1%) | 6 (1.9%) |
| Bachelor's Degree | 678 (96.7%) | 23 (3.3%) |
| Graduate Degree | 714 (100.0%) | 0 (0.0%) |
| Total | 1,864 (91.1%) | 182 (8.9%) |
Employment Characteristics in Cary
Employment by Class of Employer in Cary
Among the 91,695 employed individuals in Cary, private company employees (65,709 | 71.7%), not-for-profit organizations (6,974 | 7.6%), and state government employees (5,464 | 6.0%) make up the most common classes of employment.
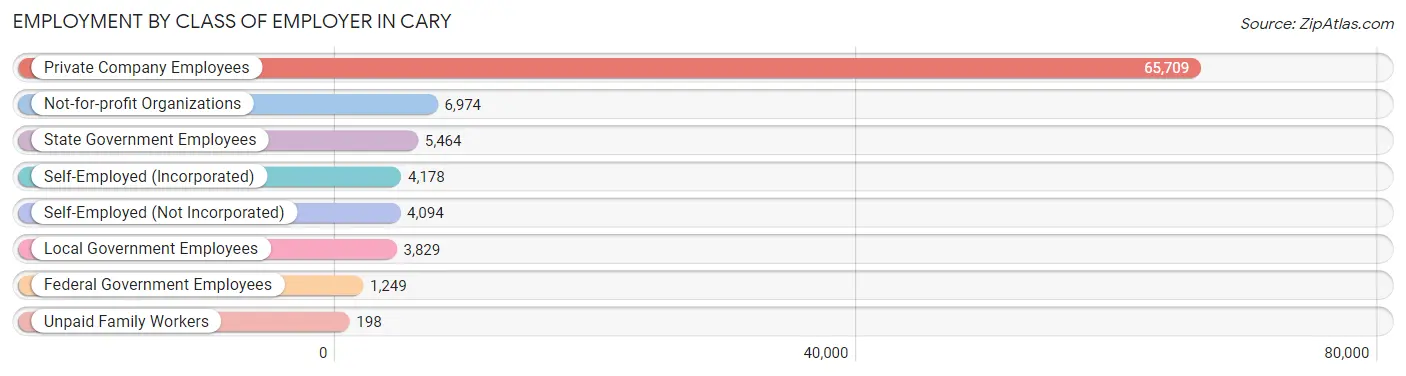
| Employer Class | # Employees | % Employees |
| Private Company Employees | 65,709 | 71.7% |
| Self-Employed (Incorporated) | 4,178 | 4.6% |
| Self-Employed (Not Incorporated) | 4,094 | 4.5% |
| Not-for-profit Organizations | 6,974 | 7.6% |
| Local Government Employees | 3,829 | 4.2% |
| State Government Employees | 5,464 | 6.0% |
| Federal Government Employees | 1,249 | 1.4% |
| Unpaid Family Workers | 198 | 0.2% |
| Total | 91,695 | 100.0% |
Employment Status by Age in Cary
According to the labor force statistics for Cary, out of the total population over 16 years of age (137,845), 70.1% or 96,629 individuals are in the labor force, with 3.4% or 3,285 of them unemployed. The age group with the highest labor force participation rate is 25 to 29 years, with 90.5% or 8,540 individuals in the labor force. Within the labor force, the 16 to 19 years age range has the highest percentage of unemployed individuals, with 10.3% or 358 of them being unemployed.
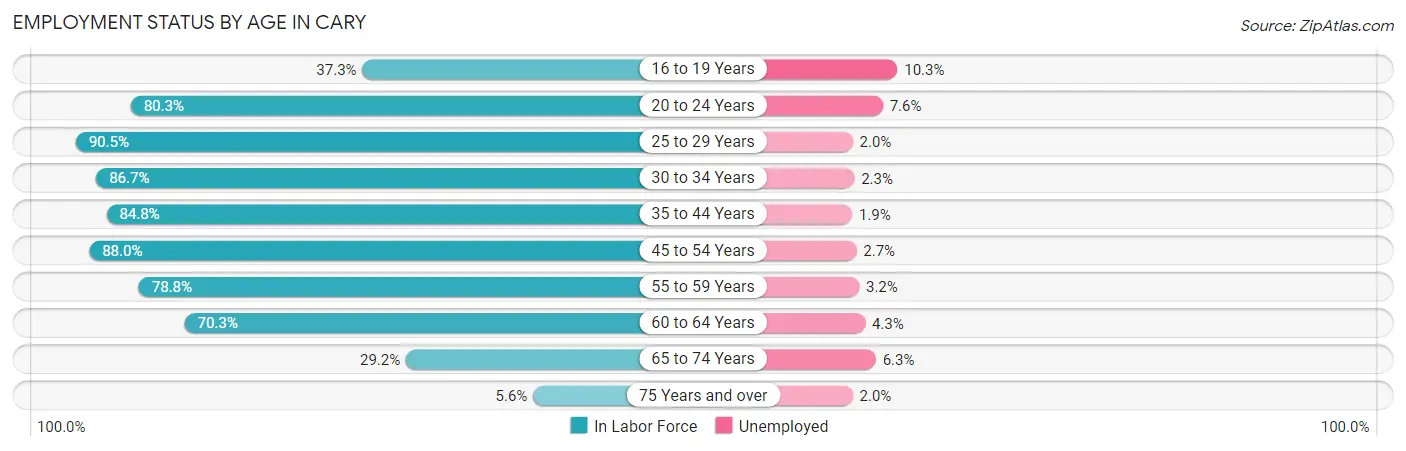
| Age Bracket | In Labor Force | Unemployed |
| 16 to 19 Years | 3,476 (37.3%) | 358 (10.3%) |
| 20 to 24 Years | 7,190 (80.3%) | 546 (7.6%) |
| 25 to 29 Years | 8,540 (90.5%) | 171 (2.0%) |
| 30 to 34 Years | 9,690 (86.7%) | 223 (2.3%) |
| 35 to 44 Years | 23,146 (84.8%) | 440 (1.9%) |
| 45 to 54 Years | 23,877 (88.0%) | 645 (2.7%) |
| 55 to 59 Years | 8,790 (78.8%) | 281 (3.2%) |
| 60 to 64 Years | 7,281 (70.3%) | 313 (4.3%) |
| 65 to 74 Years | 4,105 (29.2%) | 259 (6.3%) |
| 75 Years and over | 502 (5.6%) | 10 (2.0%) |
| Total | 96,629 (70.1%) | 3,285 (3.4%) |
Employment Status by Educational Attainment in Cary
According to labor force statistics for Cary, 84.2% of individuals (81,298) out of the total population between 25 and 64 years of age (96,553) are in the labor force, with 2.5% or 2,032 of them being unemployed. The group with the highest labor force participation rate are those with the educational attainment of bachelor's degree or higher, with 85.6% or 60,377 individuals in the labor force. Within the labor force, individuals with less than high school education have the highest percentage of unemployment, with 5.6% or 101 of them being unemployed.
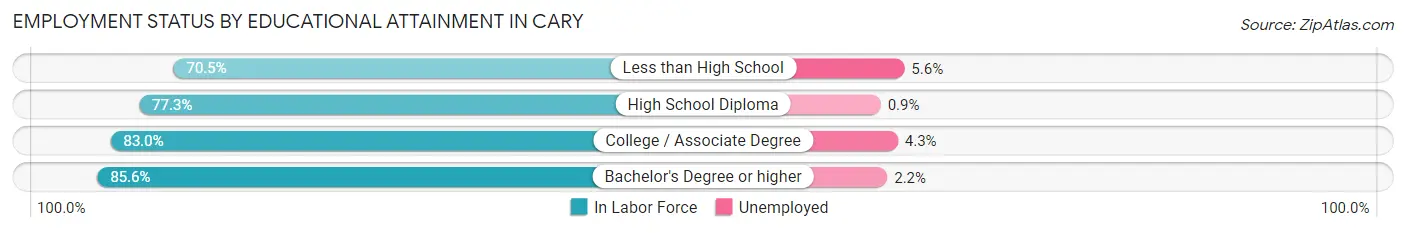
| Educational Attainment | In Labor Force | Unemployed |
| Less than High School | 1,808 (70.5%) | 144 (5.6%) |
| High School Diploma | 4,914 (77.3%) | 57 (0.9%) |
| College / Associate Degree | 14,191 (83.0%) | 735 (4.3%) |
| Bachelor's Degree or higher | 60,377 (85.6%) | 1,552 (2.2%) |
| Total | 81,298 (84.2%) | 2,414 (2.5%) |
Employment Occupations by Sex in Cary
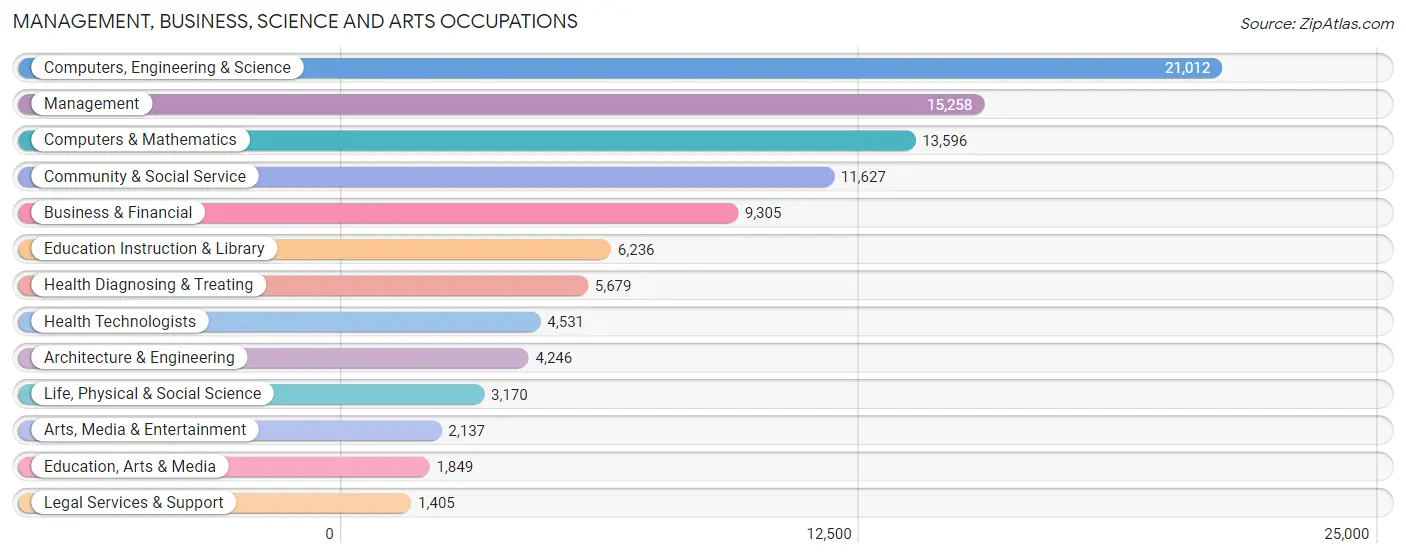
Management, Business, Science and Arts Occupations
The most common Management, Business, Science and Arts occupations in Cary are Computers, Engineering & Science (21,012 | 22.5%), Management (15,258 | 16.4%), Computers & Mathematics (13,596 | 14.6%), Community & Social Service (11,627 | 12.5%), and Business & Financial (9,305 | 10.0%).
Management, Business, Science and Arts Occupations by Sex
Within the Management, Business, Science and Arts occupations in Cary, the most male-oriented occupations are Architecture & Engineering (77.5%), Computers & Mathematics (72.7%), and Computers, Engineering & Science (70.0%), while the most female-oriented occupations are Health Diagnosing & Treating (75.6%), Health Technologists (73.7%), and Education, Arts & Media (71.6%).
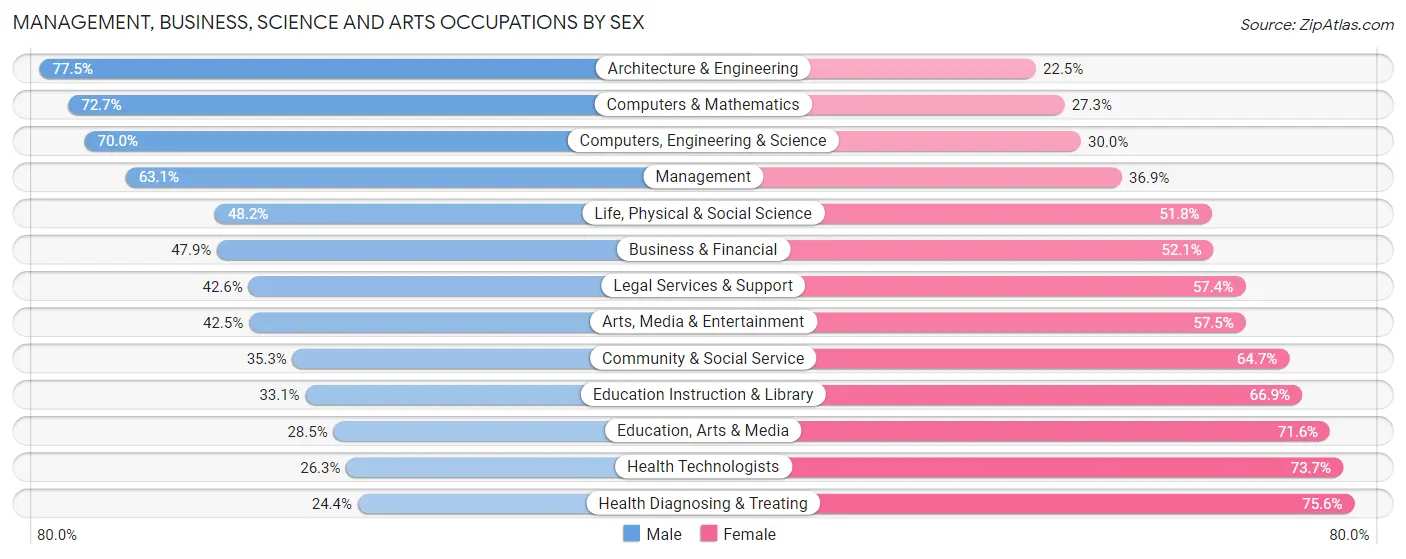
| Occupation | Male | Female |
| Management | 9,631 (63.1%) | 5,627 (36.9%) |
| Business & Financial | 4,453 (47.9%) | 4,852 (52.1%) |
| Computers, Engineering & Science | 14,703 (70.0%) | 6,309 (30.0%) |
| Computers & Mathematics | 9,884 (72.7%) | 3,712 (27.3%) |
| Architecture & Engineering | 3,290 (77.5%) | 956 (22.5%) |
| Life, Physical & Social Science | 1,529 (48.2%) | 1,641 (51.8%) |
| Community & Social Service | 4,100 (35.3%) | 7,527 (64.7%) |
| Education, Arts & Media | 526 (28.4%) | 1,323 (71.6%) |
| Legal Services & Support | 599 (42.6%) | 806 (57.4%) |
| Education Instruction & Library | 2,066 (33.1%) | 4,170 (66.9%) |
| Arts, Media & Entertainment | 909 (42.5%) | 1,228 (57.5%) |
| Health Diagnosing & Treating | 1,385 (24.4%) | 4,294 (75.6%) |
| Health Technologists | 1,192 (26.3%) | 3,339 (73.7%) |
| Total (Category) | 34,272 (54.5%) | 28,609 (45.5%) |
| Total (Overall) | 51,230 (54.9%) | 42,030 (45.1%) |
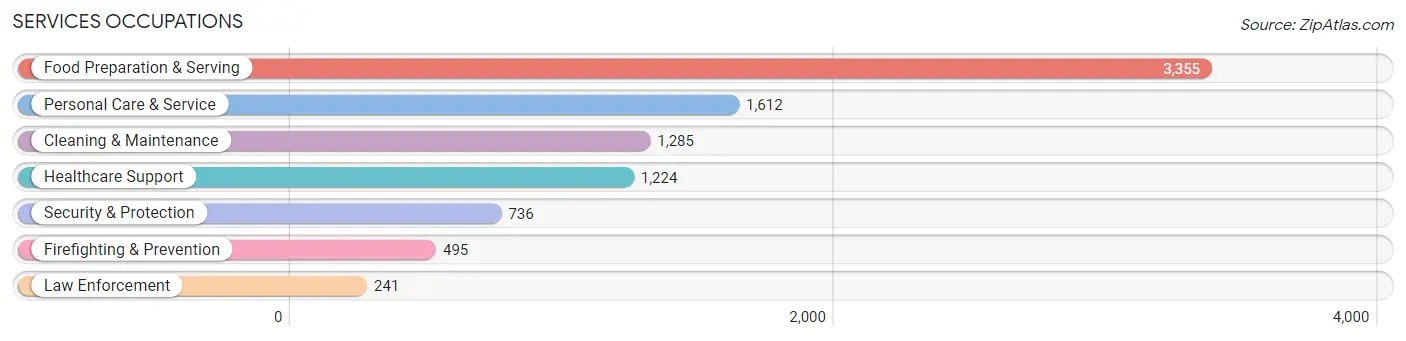
Services Occupations
The most common Services occupations in Cary are Food Preparation & Serving (3,355 | 3.6%), Personal Care & Service (1,612 | 1.7%), Cleaning & Maintenance (1,285 | 1.4%), Healthcare Support (1,224 | 1.3%), and Security & Protection (736 | 0.8%).
Services Occupations by Sex
Within the Services occupations in Cary, the most male-oriented occupations are Law Enforcement (95.4%), Security & Protection (69.7%), and Cleaning & Maintenance (63.6%), while the most female-oriented occupations are Healthcare Support (81.1%), Personal Care & Service (80.1%), and Food Preparation & Serving (48.3%).
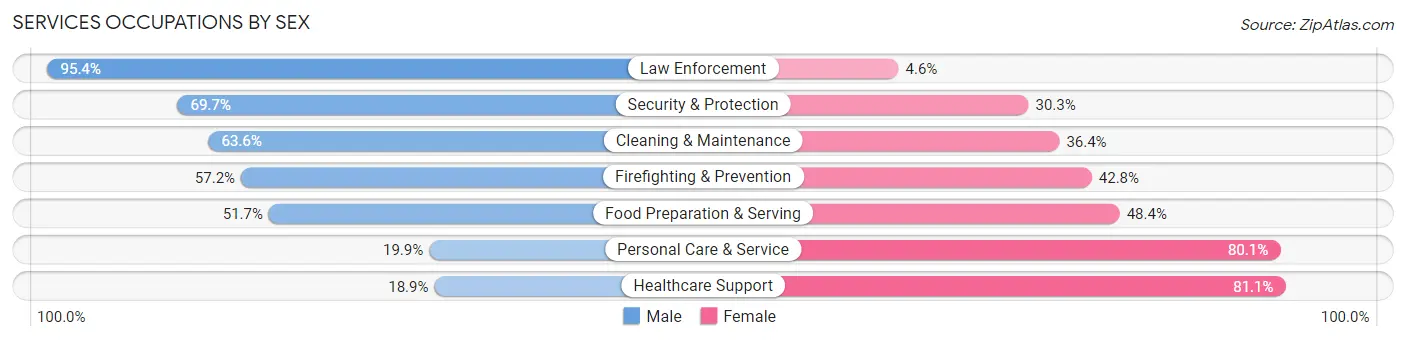
| Occupation | Male | Female |
| Healthcare Support | 231 (18.9%) | 993 (81.1%) |
| Security & Protection | 513 (69.7%) | 223 (30.3%) |
| Firefighting & Prevention | 283 (57.2%) | 212 (42.8%) |
| Law Enforcement | 230 (95.4%) | 11 (4.6%) |
| Food Preparation & Serving | 1,733 (51.6%) | 1,622 (48.3%) |
| Cleaning & Maintenance | 817 (63.6%) | 468 (36.4%) |
| Personal Care & Service | 321 (19.9%) | 1,291 (80.1%) |
| Total (Category) | 3,615 (44.0%) | 4,597 (56.0%) |
| Total (Overall) | 51,230 (54.9%) | 42,030 (45.1%) |
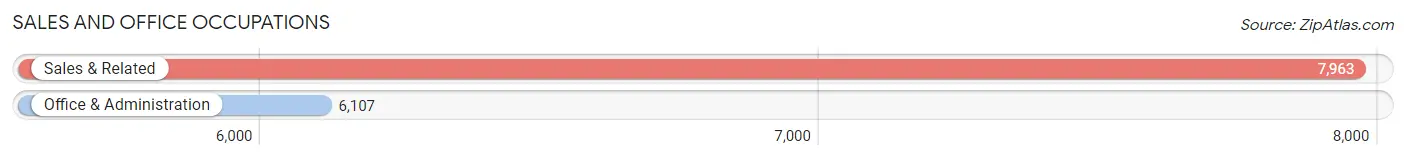
Sales and Office Occupations
The most common Sales and Office occupations in Cary are Sales & Related (7,963 | 8.5%), and Office & Administration (6,107 | 6.6%).
Sales and Office Occupations by Sex
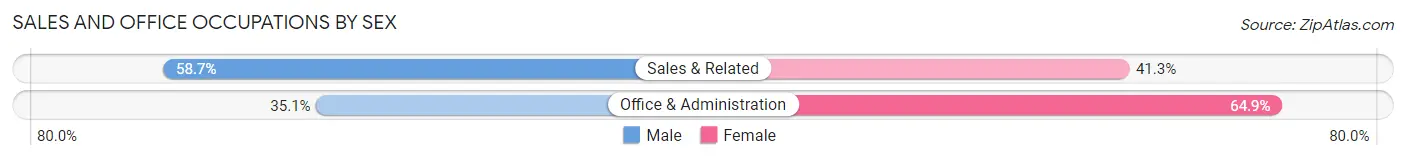
| Occupation | Male | Female |
| Sales & Related | 4,674 (58.7%) | 3,289 (41.3%) |
| Office & Administration | 2,144 (35.1%) | 3,963 (64.9%) |
| Total (Category) | 6,818 (48.5%) | 7,252 (51.5%) |
| Total (Overall) | 51,230 (54.9%) | 42,030 (45.1%) |
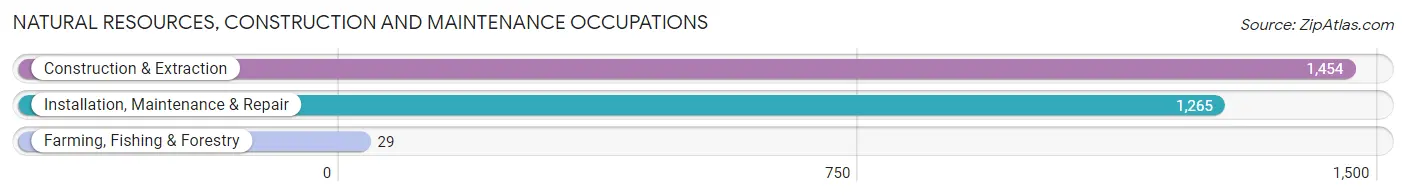
Natural Resources, Construction and Maintenance Occupations
The most common Natural Resources, Construction and Maintenance occupations in Cary are Construction & Extraction (1,454 | 1.6%), Installation, Maintenance & Repair (1,265 | 1.4%), and Farming, Fishing & Forestry (29 | 0.0%).
Natural Resources, Construction and Maintenance Occupations by Sex
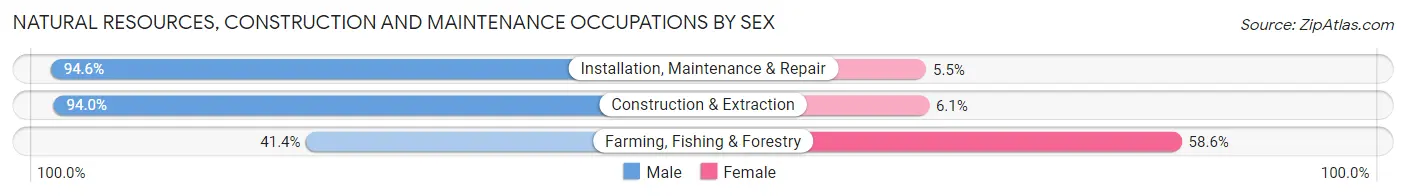
| Occupation | Male | Female |
| Farming, Fishing & Forestry | 12 (41.4%) | 17 (58.6%) |
| Construction & Extraction | 1,366 (94.0%) | 88 (6.0%) |
| Installation, Maintenance & Repair | 1,196 (94.6%) | 69 (5.4%) |
| Total (Category) | 2,574 (93.7%) | 174 (6.3%) |
| Total (Overall) | 51,230 (54.9%) | 42,030 (45.1%) |
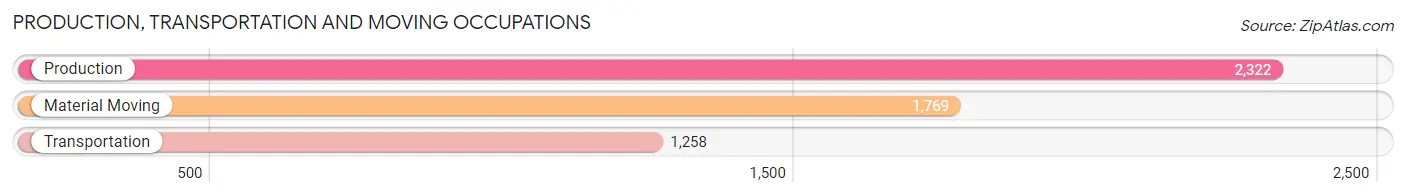
Production, Transportation and Moving Occupations
The most common Production, Transportation and Moving occupations in Cary are Production (2,322 | 2.5%), Material Moving (1,769 | 1.9%), and Transportation (1,258 | 1.3%).
Production, Transportation and Moving Occupations by Sex
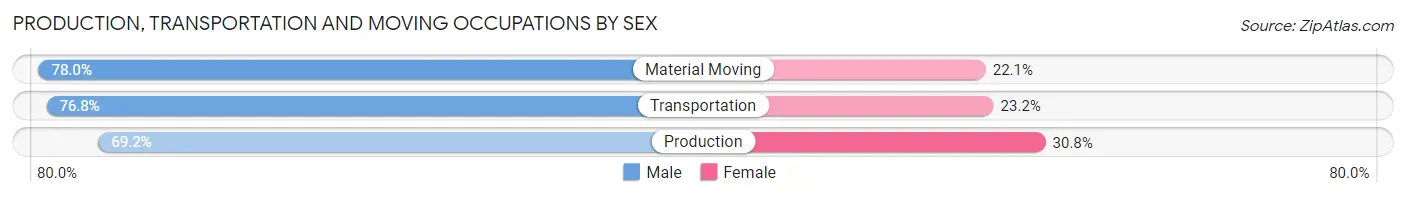
| Occupation | Male | Female |
| Production | 1,606 (69.2%) | 716 (30.8%) |
| Transportation | 966 (76.8%) | 292 (23.2%) |
| Material Moving | 1,379 (77.9%) | 390 (22.1%) |
| Total (Category) | 3,951 (73.9%) | 1,398 (26.1%) |
| Total (Overall) | 51,230 (54.9%) | 42,030 (45.1%) |
Employment Industries by Sex in Cary
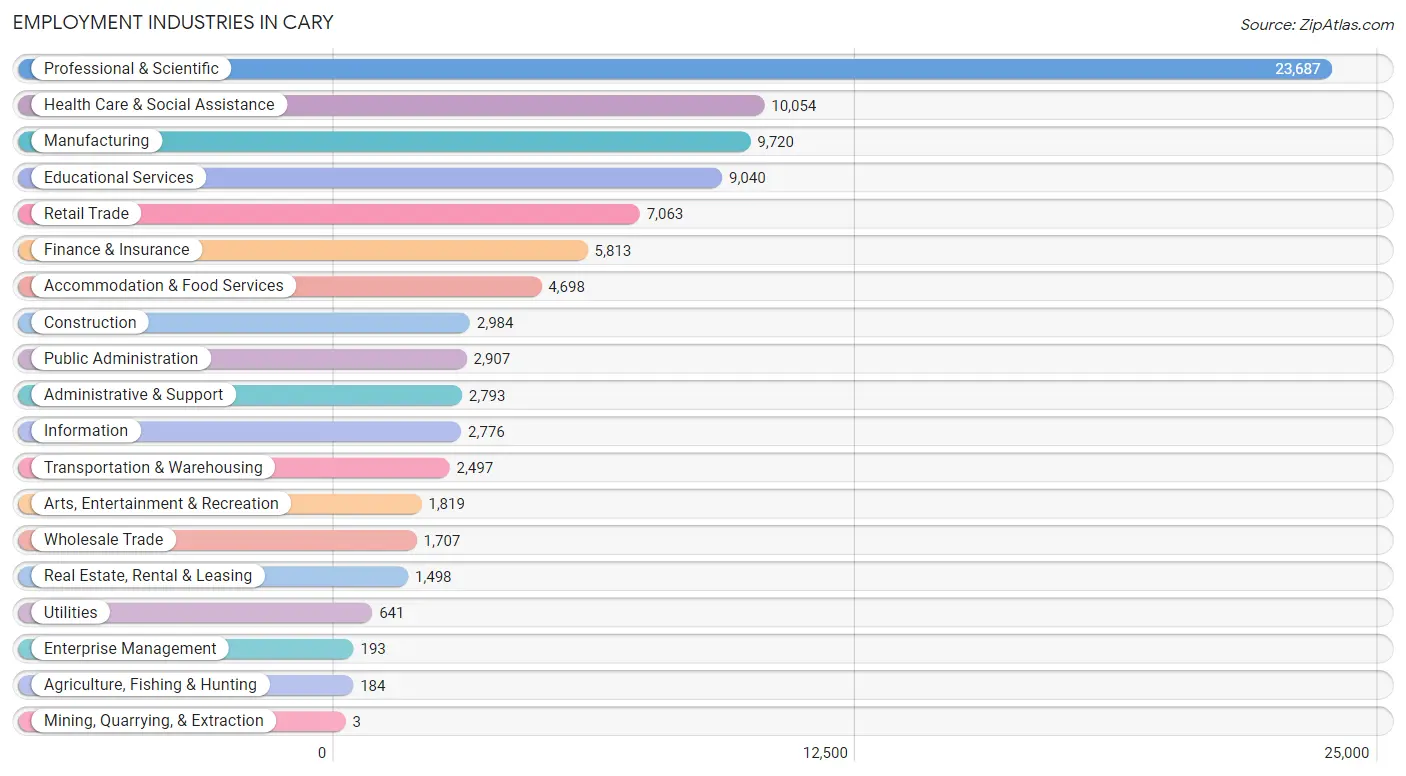
Employment Industries in Cary
The major employment industries in Cary include Professional & Scientific (23,687 | 25.4%), Health Care & Social Assistance (10,054 | 10.8%), Manufacturing (9,720 | 10.4%), Educational Services (9,040 | 9.7%), and Retail Trade (7,063 | 7.6%).
Employment Industries by Sex in Cary
The Cary industries that see more men than women are Mining, Quarrying, & Extraction (100.0%), Construction (81.4%), and Utilities (78.5%), whereas the industries that tend to have a higher number of women are Health Care & Social Assistance (73.7%), Educational Services (65.4%), and Public Administration (60.9%).
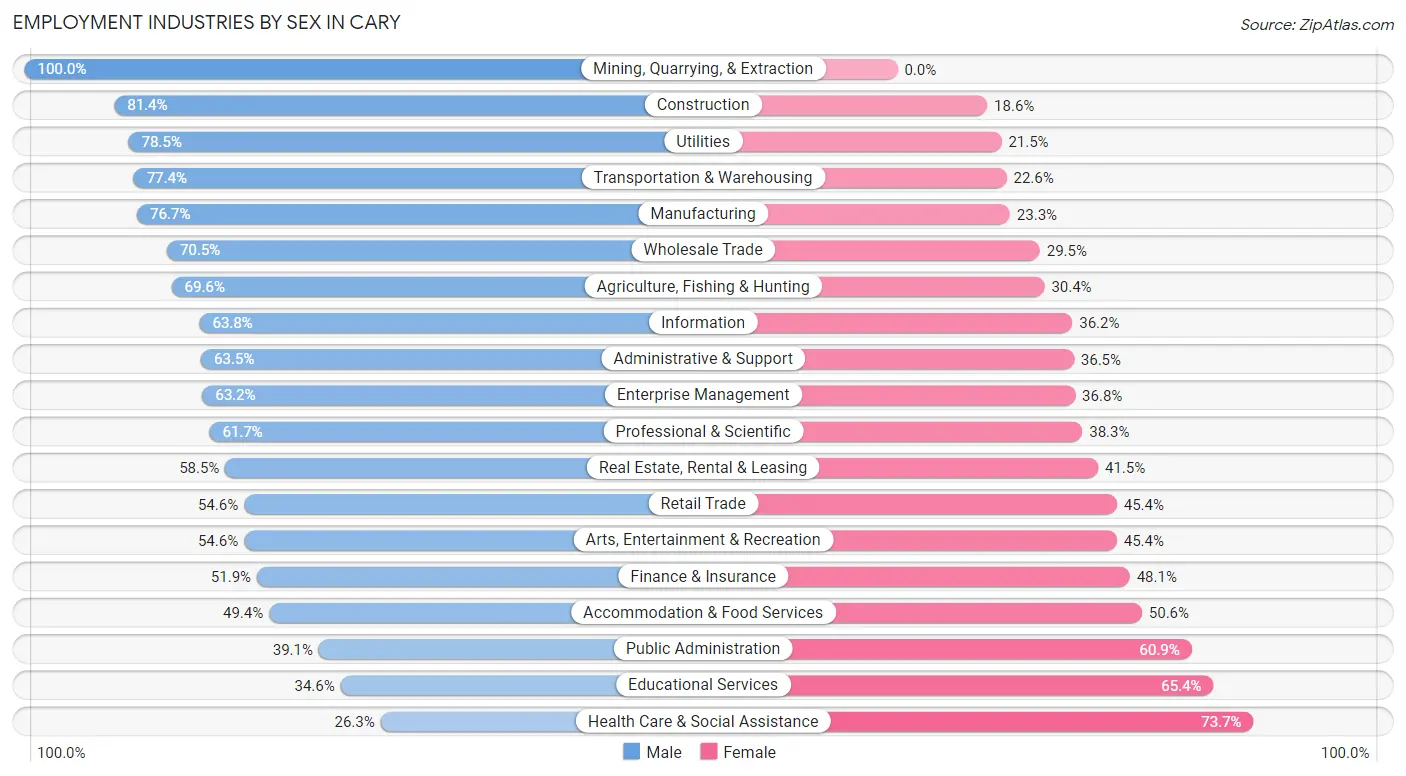
| Industry | Male | Female |
| Agriculture, Fishing & Hunting | 128 (69.6%) | 56 (30.4%) |
| Mining, Quarrying, & Extraction | 3 (100.0%) | 0 (0.0%) |
| Construction | 2,430 (81.4%) | 554 (18.6%) |
| Manufacturing | 7,457 (76.7%) | 2,263 (23.3%) |
| Wholesale Trade | 1,204 (70.5%) | 503 (29.5%) |
| Retail Trade | 3,856 (54.6%) | 3,207 (45.4%) |
| Transportation & Warehousing | 1,933 (77.4%) | 564 (22.6%) |
| Utilities | 503 (78.5%) | 138 (21.5%) |
| Information | 1,771 (63.8%) | 1,005 (36.2%) |
| Finance & Insurance | 3,018 (51.9%) | 2,795 (48.1%) |
| Real Estate, Rental & Leasing | 876 (58.5%) | 622 (41.5%) |
| Professional & Scientific | 14,621 (61.7%) | 9,066 (38.3%) |
| Enterprise Management | 122 (63.2%) | 71 (36.8%) |
| Administrative & Support | 1,773 (63.5%) | 1,020 (36.5%) |
| Educational Services | 3,128 (34.6%) | 5,912 (65.4%) |
| Health Care & Social Assistance | 2,646 (26.3%) | 7,408 (73.7%) |
| Arts, Entertainment & Recreation | 993 (54.6%) | 826 (45.4%) |
| Accommodation & Food Services | 2,321 (49.4%) | 2,377 (50.6%) |
| Public Administration | 1,137 (39.1%) | 1,770 (60.9%) |
| Total | 51,230 (54.9%) | 42,030 (45.1%) |
Education in Cary
School Enrollment in Cary
The most common levels of schooling among the 46,316 students in Cary are high school (11,150 | 24.1%), middle school (9,961 | 21.5%), and elementary school (9,491 | 20.5%).
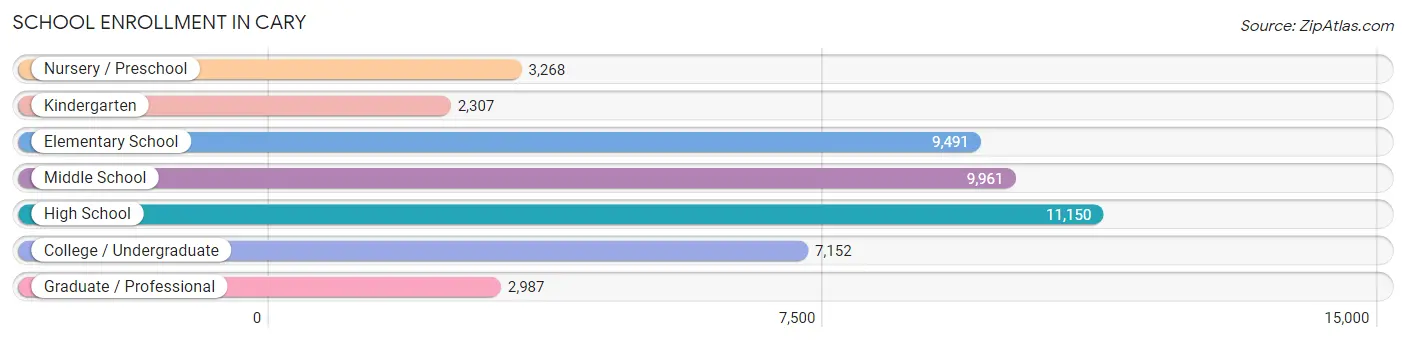
| School Level | # Students | % Students |
| Nursery / Preschool | 3,268 | 7.1% |
| Kindergarten | 2,307 | 5.0% |
| Elementary School | 9,491 | 20.5% |
| Middle School | 9,961 | 21.5% |
| High School | 11,150 | 24.1% |
| College / Undergraduate | 7,152 | 15.4% |
| Graduate / Professional | 2,987 | 6.5% |
| Total | 46,316 | 100.0% |
School Enrollment by Age by Funding Source in Cary
Out of a total of 46,316 students who are enrolled in schools in Cary, 8,568 (18.5%) attend a private institution, while the remaining 37,748 (81.5%) are enrolled in public schools. The age group of 3 to 4 year olds has the highest likelihood of being enrolled in private schools, with 1,893 (78.3% in the age bracket) enrolled. Conversely, the age group of 25 to 34 year olds has the lowest likelihood of being enrolled in a private school, with 2,205 (88.4% in the age bracket) attending a public institution.
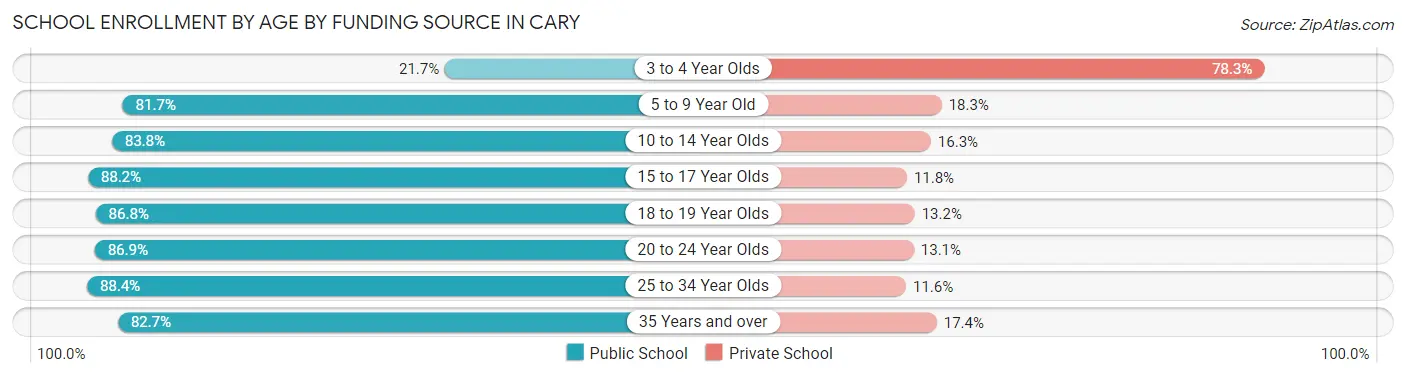
| Age Bracket | Public School | Private School |
| 3 to 4 Year Olds | 524 (21.7%) | 1,893 (78.3%) |
| 5 to 9 Year Old | 9,344 (81.7%) | 2,088 (18.3%) |
| 10 to 14 Year Olds | 10,520 (83.8%) | 2,041 (16.3%) |
| 15 to 17 Year Olds | 7,361 (88.2%) | 984 (11.8%) |
| 18 to 19 Year Olds | 2,582 (86.8%) | 394 (13.2%) |
| 20 to 24 Year Olds | 3,159 (86.9%) | 475 (13.1%) |
| 25 to 34 Year Olds | 2,205 (88.4%) | 290 (11.6%) |
| 35 Years and over | 2,030 (82.7%) | 426 (17.3%) |
| Total | 37,748 (81.5%) | 8,568 (18.5%) |
Educational Attainment by Field of Study in Cary
Business (15,980 | 17.6%), engineering (13,684 | 15.1%), computers & mathematics (9,346 | 10.3%), bio, nature & agricultural (7,835 | 8.6%), and social sciences (6,854 | 7.5%) are the most common fields of study among 90,735 individuals in Cary who have obtained a bachelor's degree or higher.
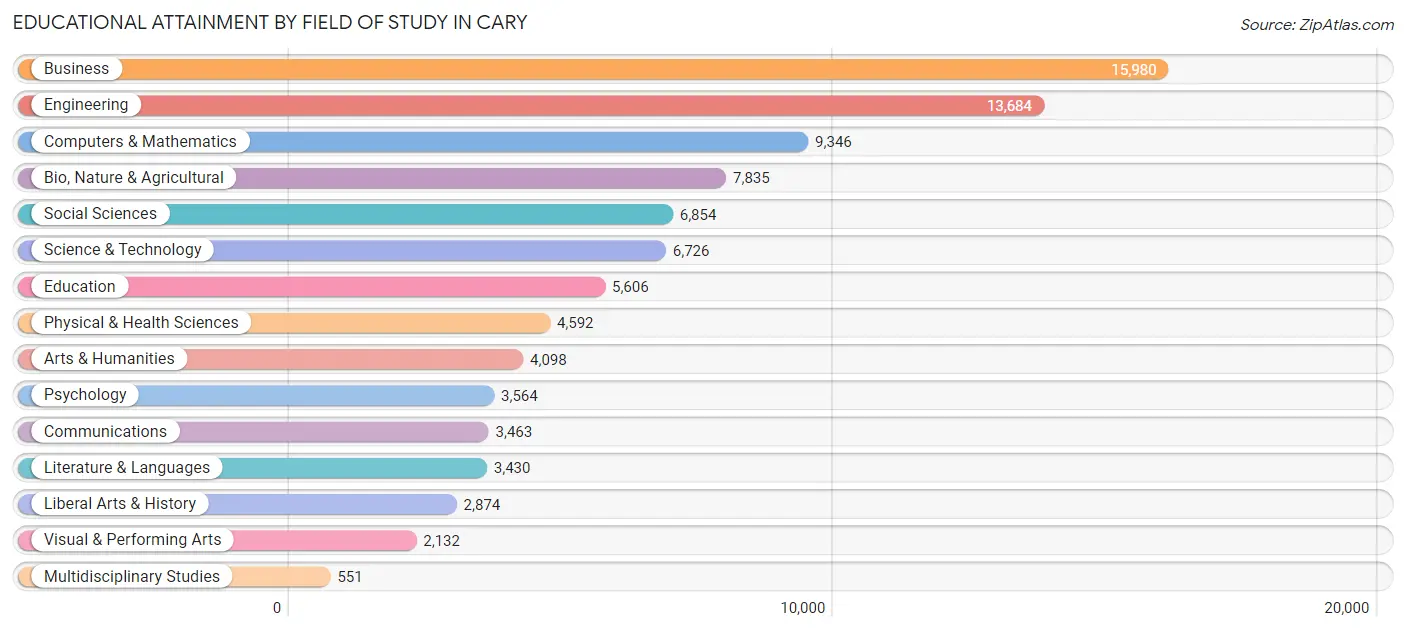
| Field of Study | # Graduates | % Graduates |
| Computers & Mathematics | 9,346 | 10.3% |
| Bio, Nature & Agricultural | 7,835 | 8.6% |
| Physical & Health Sciences | 4,592 | 5.1% |
| Psychology | 3,564 | 3.9% |
| Social Sciences | 6,854 | 7.5% |
| Engineering | 13,684 | 15.1% |
| Multidisciplinary Studies | 551 | 0.6% |
| Science & Technology | 6,726 | 7.4% |
| Business | 15,980 | 17.6% |
| Education | 5,606 | 6.2% |
| Literature & Languages | 3,430 | 3.8% |
| Liberal Arts & History | 2,874 | 3.2% |
| Visual & Performing Arts | 2,132 | 2.4% |
| Communications | 3,463 | 3.8% |
| Arts & Humanities | 4,098 | 4.5% |
| Total | 90,735 | 100.0% |
Transportation & Commute in Cary
Vehicle Availability by Sex in Cary
The most prevalent vehicle ownership categories in Cary are males with 2 vehicles (25,670, accounting for 50.9%) and females with 2 vehicles (20,927, making up 62.2%).
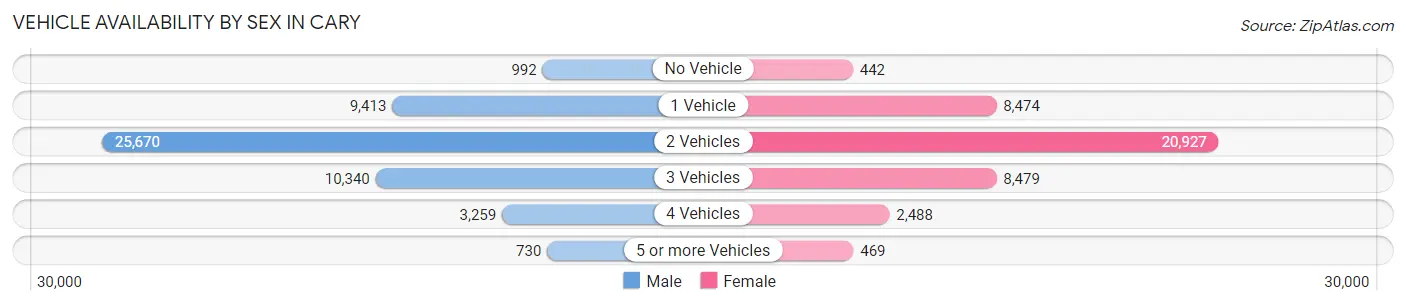
| Vehicles Available | Male | Female |
| No Vehicle | 992 (2.0%) | 442 (1.1%) |
| 1 Vehicle | 9,413 (18.7%) | 8,474 (20.5%) |
| 2 Vehicles | 25,670 (50.9%) | 20,927 (50.7%) |
| 3 Vehicles | 10,340 (20.5%) | 8,479 (20.5%) |
| 4 Vehicles | 3,259 (6.5%) | 2,488 (6.0%) |
| 5 or more Vehicles | 730 (1.5%) | 469 (1.1%) |
| Total | 50,404 (100.0%) | 41,279 (100.0%) |
Commute Time in Cary
The most frequently occuring commute durations in Cary are 15 to 19 minutes (13,514 commuters, 20.5%), 20 to 24 minutes (12,112 commuters, 18.4%), and 10 to 14 minutes (9,237 commuters, 14.1%).
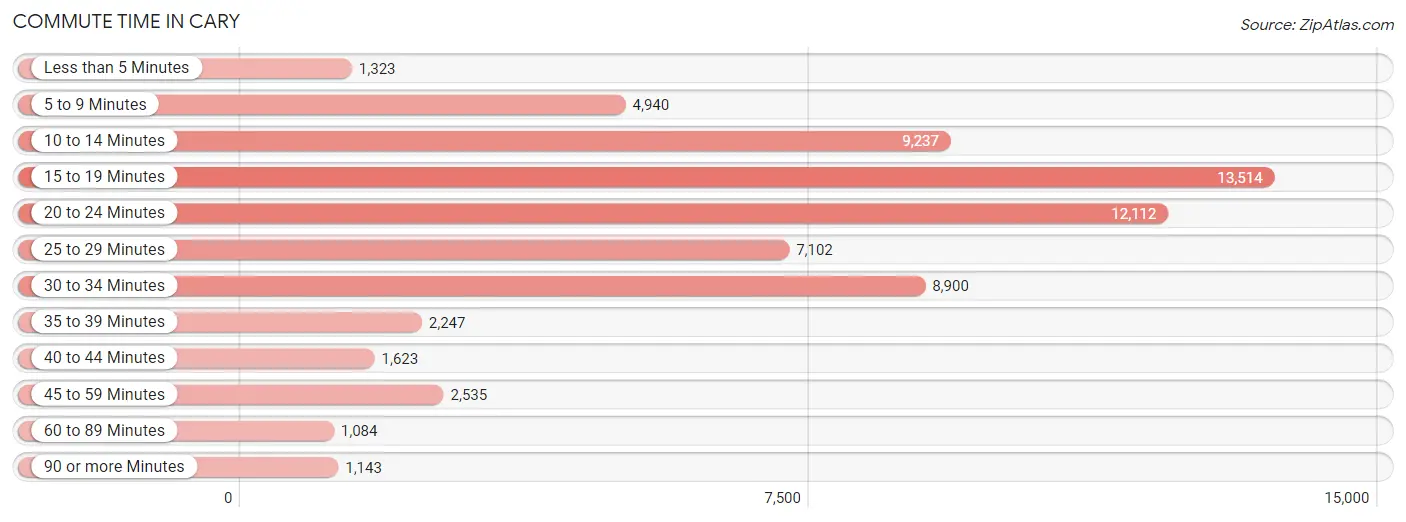
| Commute Time | # Commuters | % Commuters |
| Less than 5 Minutes | 1,323 | 2.0% |
| 5 to 9 Minutes | 4,940 | 7.5% |
| 10 to 14 Minutes | 9,237 | 14.1% |
| 15 to 19 Minutes | 13,514 | 20.5% |
| 20 to 24 Minutes | 12,112 | 18.4% |
| 25 to 29 Minutes | 7,102 | 10.8% |
| 30 to 34 Minutes | 8,900 | 13.5% |
| 35 to 39 Minutes | 2,247 | 3.4% |
| 40 to 44 Minutes | 1,623 | 2.5% |
| 45 to 59 Minutes | 2,535 | 3.8% |
| 60 to 89 Minutes | 1,084 | 1.7% |
| 90 or more Minutes | 1,143 | 1.7% |
Commute Time by Sex in Cary
The most common commute times in Cary are 15 to 19 minutes (7,540 commuters, 20.9%) for males and 15 to 19 minutes (5,974 commuters, 20.1%) for females.
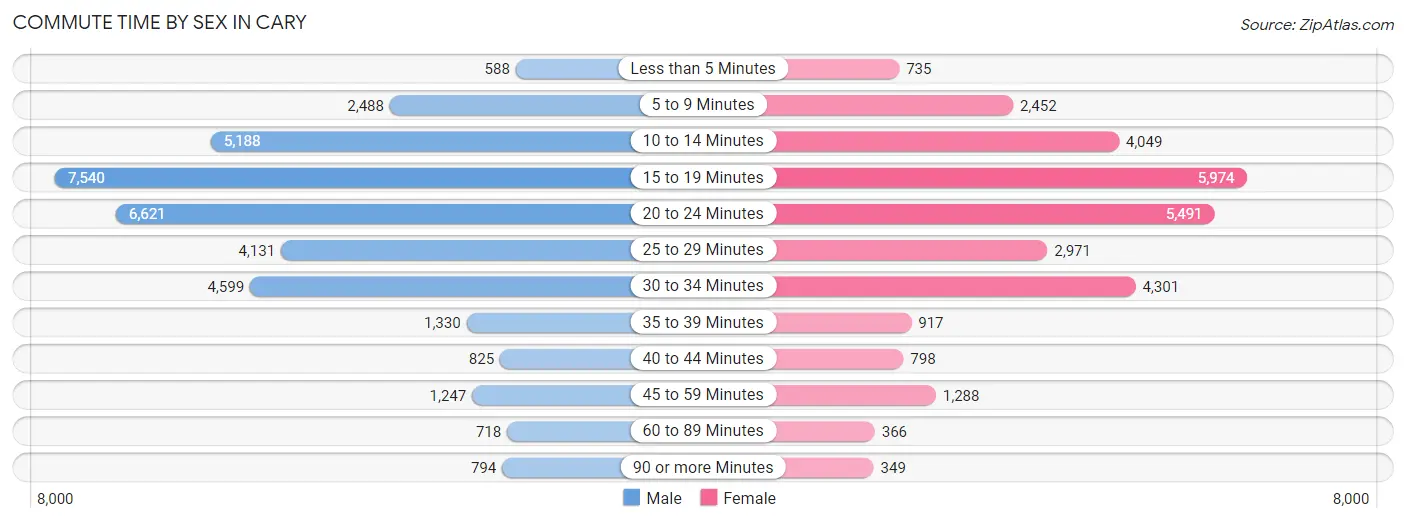
| Commute Time | Male | Female |
| Less than 5 Minutes | 588 (1.6%) | 735 (2.5%) |
| 5 to 9 Minutes | 2,488 (6.9%) | 2,452 (8.3%) |
| 10 to 14 Minutes | 5,188 (14.4%) | 4,049 (13.6%) |
| 15 to 19 Minutes | 7,540 (20.9%) | 5,974 (20.1%) |
| 20 to 24 Minutes | 6,621 (18.4%) | 5,491 (18.5%) |
| 25 to 29 Minutes | 4,131 (11.5%) | 2,971 (10.0%) |
| 30 to 34 Minutes | 4,599 (12.8%) | 4,301 (14.5%) |
| 35 to 39 Minutes | 1,330 (3.7%) | 917 (3.1%) |
| 40 to 44 Minutes | 825 (2.3%) | 798 (2.7%) |
| 45 to 59 Minutes | 1,247 (3.5%) | 1,288 (4.3%) |
| 60 to 89 Minutes | 718 (2.0%) | 366 (1.2%) |
| 90 or more Minutes | 794 (2.2%) | 349 (1.2%) |
Time of Departure to Work by Sex in Cary
The most frequent times of departure to work in Cary are 8:00 AM to 8:29 AM (6,660, 18.5%) for males and 8:00 AM to 8:29 AM (5,487, 18.5%) for females.
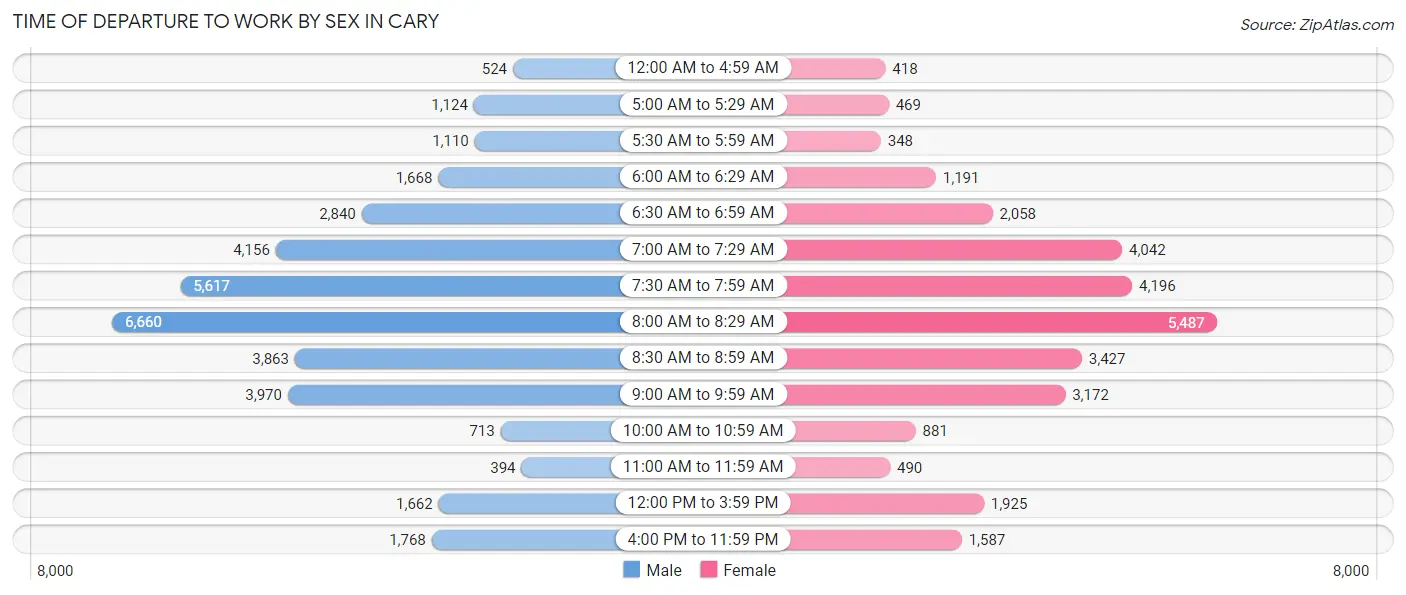
| Time of Departure | Male | Female |
| 12:00 AM to 4:59 AM | 524 (1.5%) | 418 (1.4%) |
| 5:00 AM to 5:29 AM | 1,124 (3.1%) | 469 (1.6%) |
| 5:30 AM to 5:59 AM | 1,110 (3.1%) | 348 (1.2%) |
| 6:00 AM to 6:29 AM | 1,668 (4.6%) | 1,191 (4.0%) |
| 6:30 AM to 6:59 AM | 2,840 (7.9%) | 2,058 (6.9%) |
| 7:00 AM to 7:29 AM | 4,156 (11.5%) | 4,042 (13.6%) |
| 7:30 AM to 7:59 AM | 5,617 (15.6%) | 4,196 (14.1%) |
| 8:00 AM to 8:29 AM | 6,660 (18.5%) | 5,487 (18.5%) |
| 8:30 AM to 8:59 AM | 3,863 (10.7%) | 3,427 (11.5%) |
| 9:00 AM to 9:59 AM | 3,970 (11.0%) | 3,172 (10.7%) |
| 10:00 AM to 10:59 AM | 713 (2.0%) | 881 (3.0%) |
| 11:00 AM to 11:59 AM | 394 (1.1%) | 490 (1.7%) |
| 12:00 PM to 3:59 PM | 1,662 (4.6%) | 1,925 (6.5%) |
| 4:00 PM to 11:59 PM | 1,768 (4.9%) | 1,587 (5.3%) |
| Total | 36,069 (100.0%) | 29,691 (100.0%) |
Housing Occupancy in Cary
Occupancy by Ownership in Cary
Of the total 66,120 dwellings in Cary, owner-occupied units account for 44,200 (66.8%), while renter-occupied units make up 21,920 (33.2%).
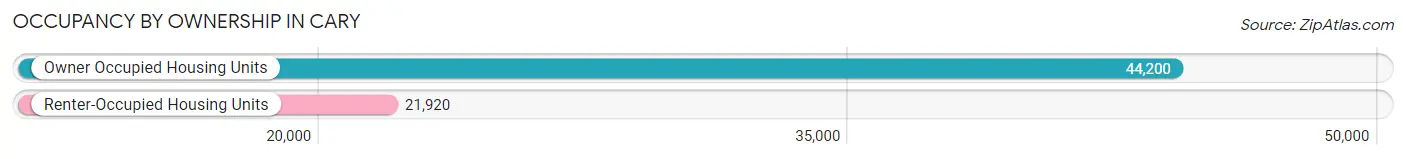
| Occupancy | # Housing Units | % Housing Units |
| Owner Occupied Housing Units | 44,200 | 66.8% |
| Renter-Occupied Housing Units | 21,920 | 33.2% |
| Total Occupied Housing Units | 66,120 | 100.0% |
Occupancy by Household Size in Cary
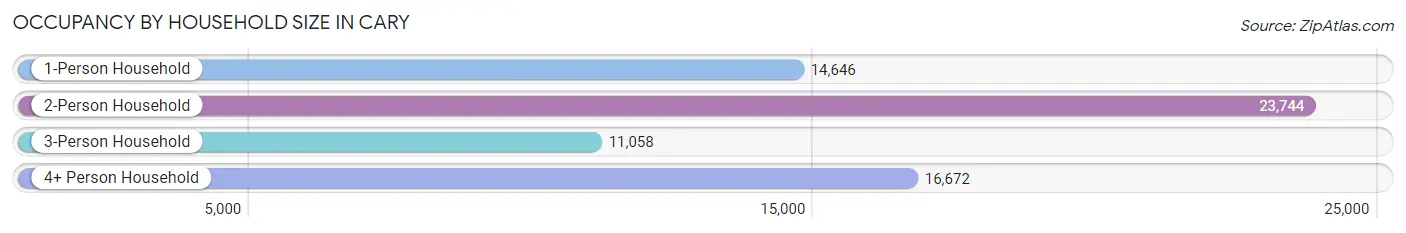
| Household Size | # Housing Units | % Housing Units |
| 1-Person Household | 14,646 | 22.2% |
| 2-Person Household | 23,744 | 35.9% |
| 3-Person Household | 11,058 | 16.7% |
| 4+ Person Household | 16,672 | 25.2% |
| Total Housing Units | 66,120 | 100.0% |
Occupancy by Ownership by Household Size in Cary
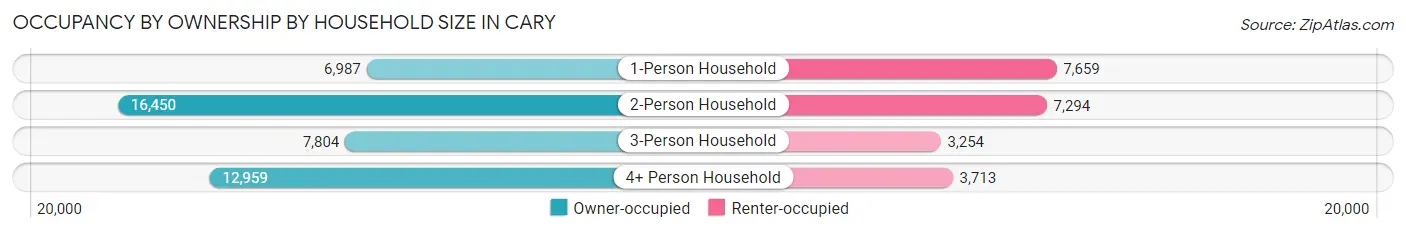
| Household Size | Owner-occupied | Renter-occupied |
| 1-Person Household | 6,987 (47.7%) | 7,659 (52.3%) |
| 2-Person Household | 16,450 (69.3%) | 7,294 (30.7%) |
| 3-Person Household | 7,804 (70.6%) | 3,254 (29.4%) |
| 4+ Person Household | 12,959 (77.7%) | 3,713 (22.3%) |
| Total Housing Units | 44,200 (66.8%) | 21,920 (33.2%) |
Occupancy by Educational Attainment in Cary
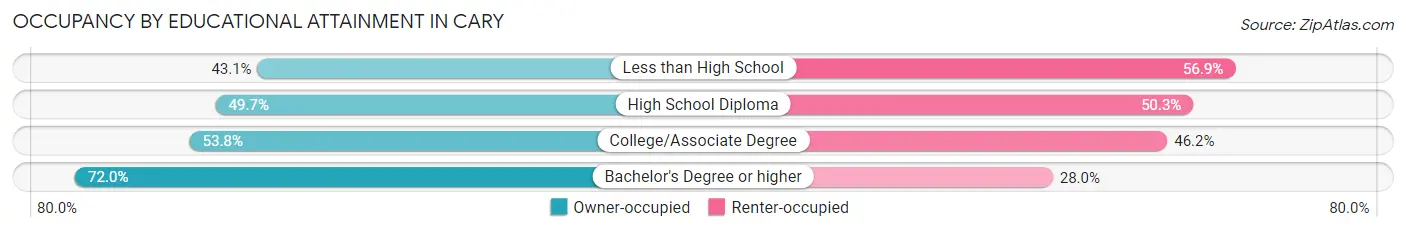
| Household Size | Owner-occupied | Renter-occupied |
| Less than High School | 513 (43.1%) | 678 (56.9%) |
| High School Diploma | 1,930 (49.7%) | 1,952 (50.3%) |
| College/Associate Degree | 6,487 (53.8%) | 5,567 (46.2%) |
| Bachelor's Degree or higher | 35,270 (72.0%) | 13,723 (28.0%) |
Occupancy by Age of Householder in Cary
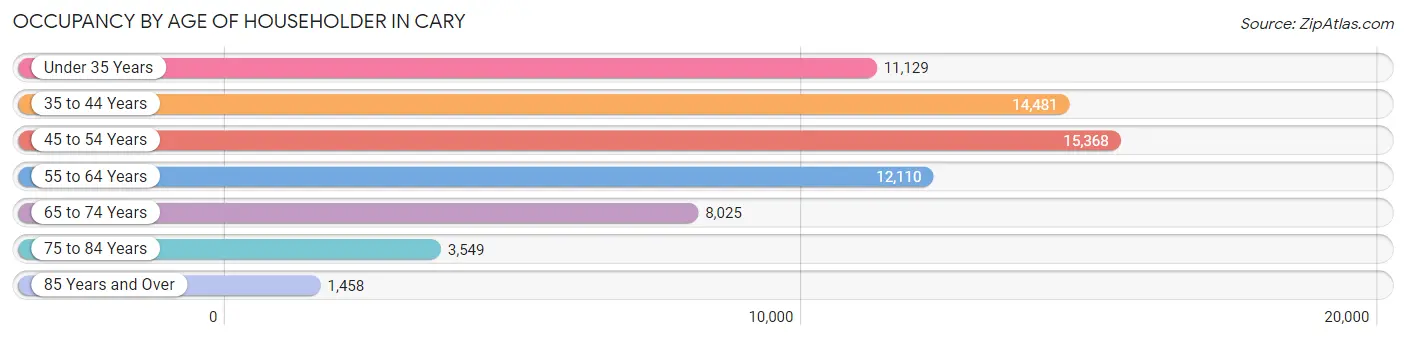
| Age Bracket | # Households | % Households |
| Under 35 Years | 11,129 | 16.8% |
| 35 to 44 Years | 14,481 | 21.9% |
| 45 to 54 Years | 15,368 | 23.2% |
| 55 to 64 Years | 12,110 | 18.3% |
| 65 to 74 Years | 8,025 | 12.1% |
| 75 to 84 Years | 3,549 | 5.4% |
| 85 Years and Over | 1,458 | 2.2% |
| Total | 66,120 | 100.0% |
Housing Finances in Cary
Median Income by Occupancy in Cary
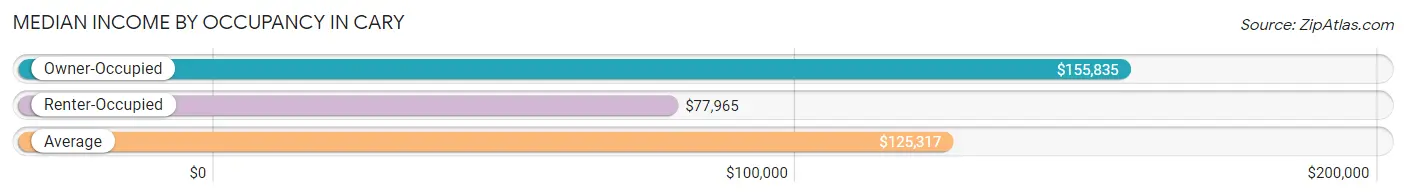
| Occupancy Type | # Households | Median Income |
| Owner-Occupied | 44,200 (66.8%) | $155,835 |
| Renter-Occupied | 21,920 (33.2%) | $77,965 |
| Average | 66,120 (100.0%) | $125,317 |
Occupancy by Householder Income Bracket in Cary
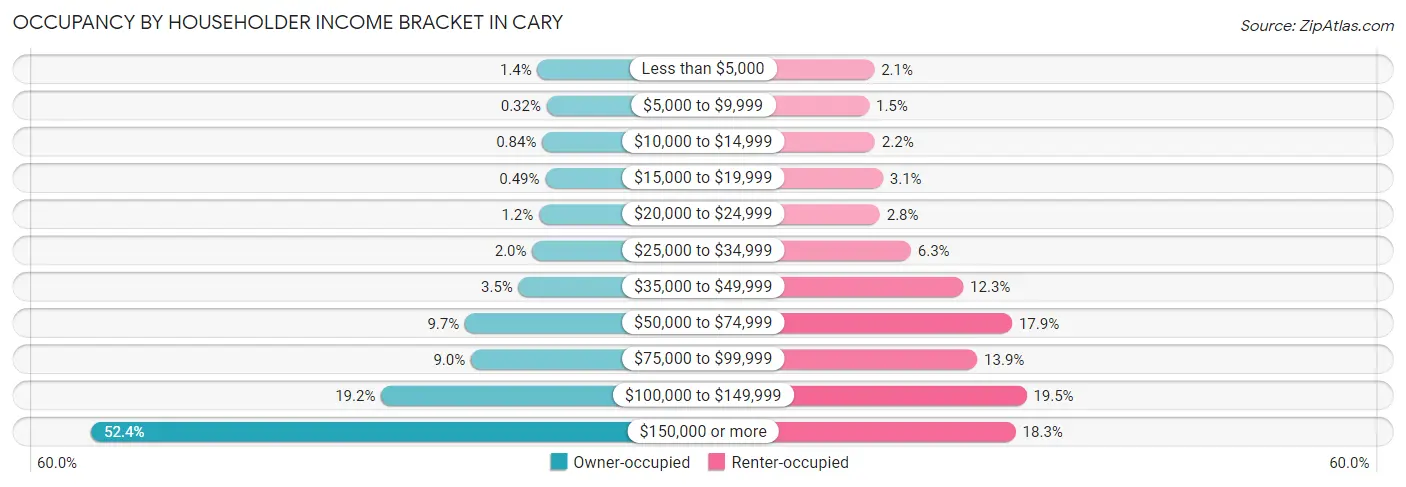
| Income Bracket | Owner-occupied | Renter-occupied |
| Less than $5,000 | 605 (1.4%) | 466 (2.1%) |
| $5,000 to $9,999 | 143 (0.3%) | 337 (1.5%) |
| $10,000 to $14,999 | 373 (0.8%) | 484 (2.2%) |
| $15,000 to $19,999 | 215 (0.5%) | 685 (3.1%) |
| $20,000 to $24,999 | 531 (1.2%) | 607 (2.8%) |
| $25,000 to $34,999 | 871 (2.0%) | 1,385 (6.3%) |
| $35,000 to $49,999 | 1,562 (3.5%) | 2,696 (12.3%) |
| $50,000 to $74,999 | 4,269 (9.7%) | 3,919 (17.9%) |
| $75,000 to $99,999 | 3,968 (9.0%) | 3,047 (13.9%) |
| $100,000 to $149,999 | 8,505 (19.2%) | 4,282 (19.5%) |
| $150,000 or more | 23,158 (52.4%) | 4,012 (18.3%) |
| Total | 44,200 (100.0%) | 21,920 (100.0%) |
Monthly Housing Cost Tiers in Cary
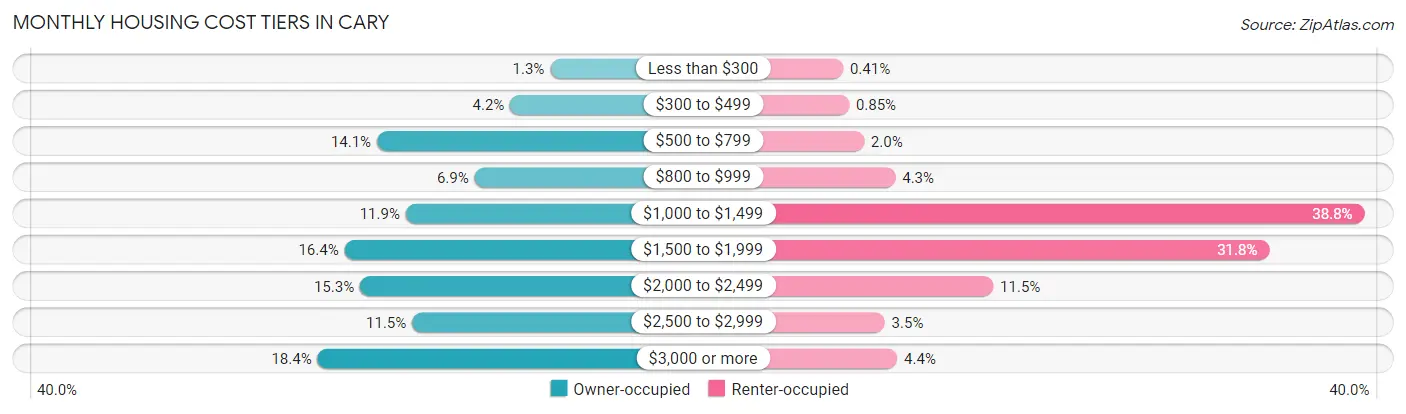
| Monthly Cost | Owner-occupied | Renter-occupied |
| Less than $300 | 570 (1.3%) | 89 (0.4%) |
| $300 to $499 | 1,876 (4.2%) | 187 (0.9%) |
| $500 to $799 | 6,212 (14.1%) | 428 (1.9%) |
| $800 to $999 | 3,033 (6.9%) | 933 (4.3%) |
| $1,000 to $1,499 | 5,271 (11.9%) | 8,508 (38.8%) |
| $1,500 to $1,999 | 7,265 (16.4%) | 6,971 (31.8%) |
| $2,000 to $2,499 | 6,761 (15.3%) | 2,514 (11.5%) |
| $2,500 to $2,999 | 5,065 (11.5%) | 762 (3.5%) |
| $3,000 or more | 8,147 (18.4%) | 964 (4.4%) |
| Total | 44,200 (100.0%) | 21,920 (100.0%) |
Physical Housing Characteristics in Cary
Housing Structures in Cary
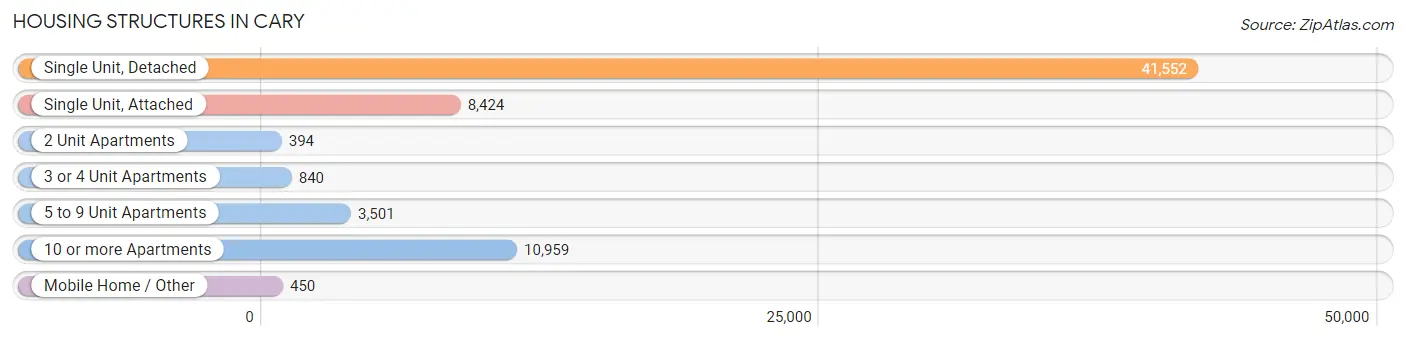
| Structure Type | # Housing Units | % Housing Units |
| Single Unit, Detached | 41,552 | 62.8% |
| Single Unit, Attached | 8,424 | 12.7% |
| 2 Unit Apartments | 394 | 0.6% |
| 3 or 4 Unit Apartments | 840 | 1.3% |
| 5 to 9 Unit Apartments | 3,501 | 5.3% |
| 10 or more Apartments | 10,959 | 16.6% |
| Mobile Home / Other | 450 | 0.7% |
| Total | 66,120 | 100.0% |
Housing Structures by Occupancy in Cary
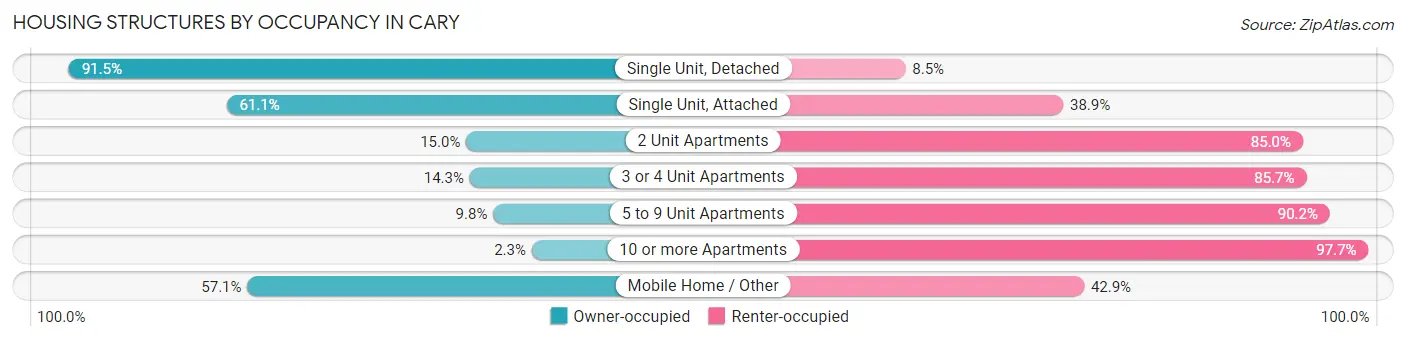
| Structure Type | Owner-occupied | Renter-occupied |
| Single Unit, Detached | 38,016 (91.5%) | 3,536 (8.5%) |
| Single Unit, Attached | 5,150 (61.1%) | 3,274 (38.9%) |
| 2 Unit Apartments | 59 (15.0%) | 335 (85.0%) |
| 3 or 4 Unit Apartments | 120 (14.3%) | 720 (85.7%) |
| 5 to 9 Unit Apartments | 342 (9.8%) | 3,159 (90.2%) |
| 10 or more Apartments | 256 (2.3%) | 10,703 (97.7%) |
| Mobile Home / Other | 257 (57.1%) | 193 (42.9%) |
| Total | 44,200 (66.8%) | 21,920 (33.2%) |
Housing Structures by Number of Rooms in Cary
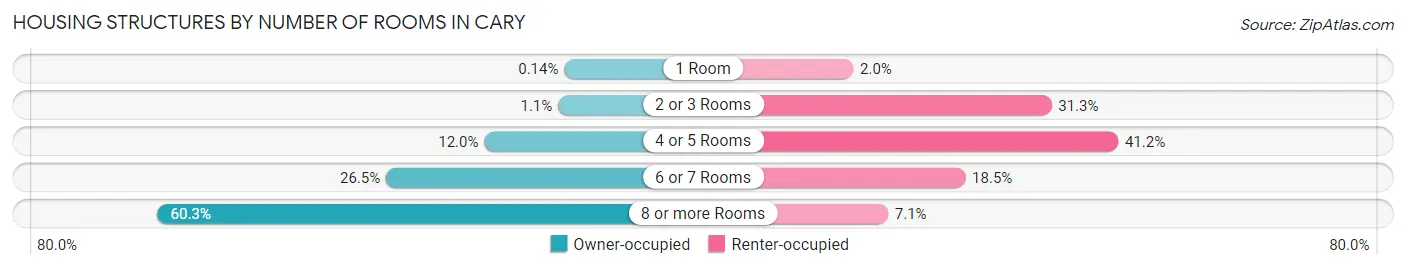
| Number of Rooms | Owner-occupied | Renter-occupied |
| 1 Room | 62 (0.1%) | 428 (1.9%) |
| 2 or 3 Rooms | 462 (1.1%) | 6,856 (31.3%) |
| 4 or 5 Rooms | 5,297 (12.0%) | 9,019 (41.1%) |
| 6 or 7 Rooms | 11,721 (26.5%) | 4,062 (18.5%) |
| 8 or more Rooms | 26,658 (60.3%) | 1,555 (7.1%) |
| Total | 44,200 (100.0%) | 21,920 (100.0%) |
Housing Structure by Heating Type in Cary
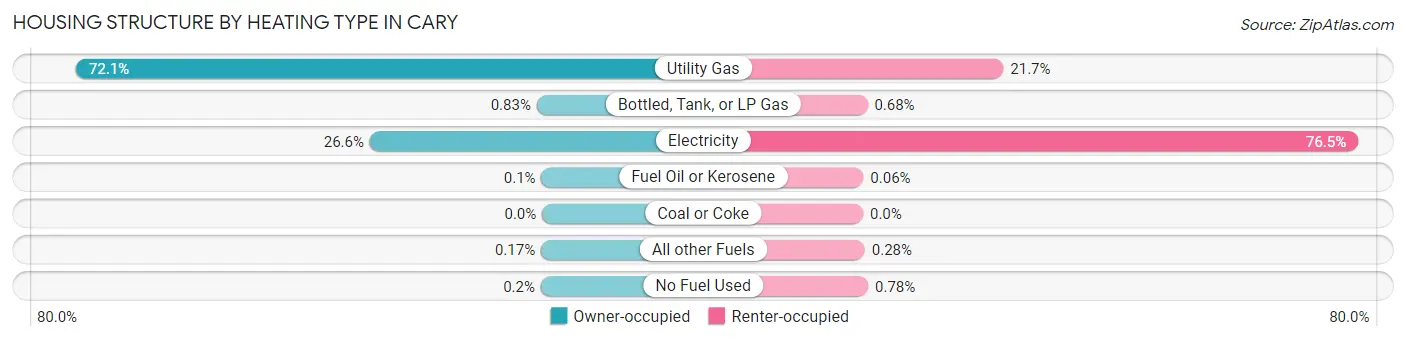
| Heating Type | Owner-occupied | Renter-occupied |
| Utility Gas | 31,851 (72.1%) | 4,754 (21.7%) |
| Bottled, Tank, or LP Gas | 368 (0.8%) | 149 (0.7%) |
| Electricity | 11,774 (26.6%) | 16,771 (76.5%) |
| Fuel Oil or Kerosene | 44 (0.1%) | 13 (0.1%) |
| Coal or Coke | 0 (0.0%) | 0 (0.0%) |
| All other Fuels | 74 (0.2%) | 61 (0.3%) |
| No Fuel Used | 89 (0.2%) | 172 (0.8%) |
| Total | 44,200 (100.0%) | 21,920 (100.0%) |
Household Vehicle Usage in Cary
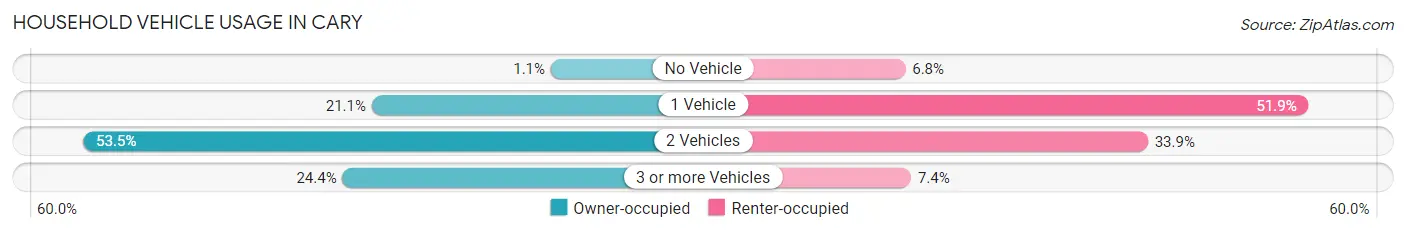
| Vehicles per Household | Owner-occupied | Renter-occupied |
| No Vehicle | 462 (1.1%) | 1,481 (6.8%) |
| 1 Vehicle | 9,331 (21.1%) | 11,382 (51.9%) |
| 2 Vehicles | 23,626 (53.4%) | 7,436 (33.9%) |
| 3 or more Vehicles | 10,781 (24.4%) | 1,621 (7.4%) |
| Total | 44,200 (100.0%) | 21,920 (100.0%) |
Real Estate & Mortgages in Cary
Real Estate and Mortgage Overview in Cary
| Characteristic | Without Mortgage | With Mortgage |
| Housing Units | 11,974 | 32,226 |
| Median Property Value | $454,000 | $485,300 |
| Median Household Income | $126,649 | $18,214 |
| Monthly Housing Costs | $680 | $8,128 |
| Real Estate Taxes | $3,662 | $185 |
Property Value by Mortgage Status in Cary
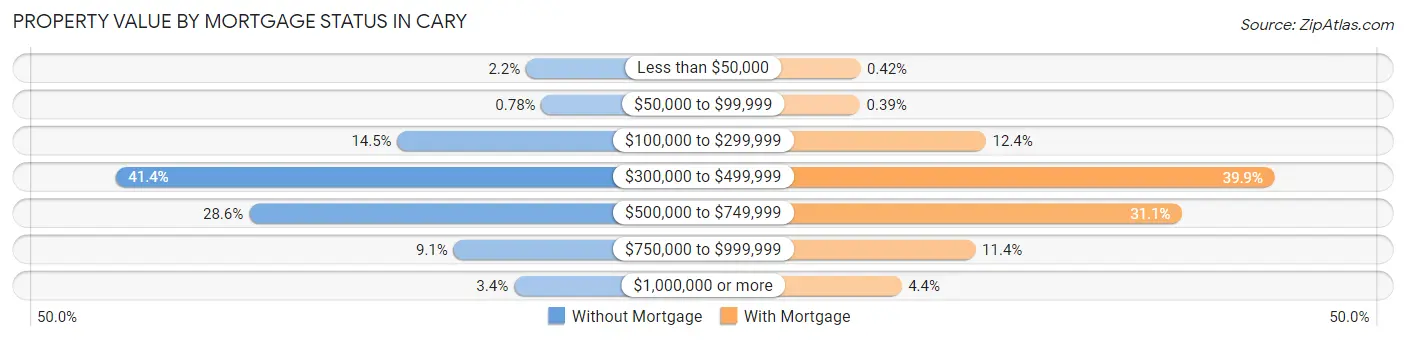
| Property Value | Without Mortgage | With Mortgage |
| Less than $50,000 | 268 (2.2%) | 135 (0.4%) |
| $50,000 to $99,999 | 93 (0.8%) | 125 (0.4%) |
| $100,000 to $299,999 | 1,735 (14.5%) | 3,993 (12.4%) |
| $300,000 to $499,999 | 4,951 (41.3%) | 12,868 (39.9%) |
| $500,000 to $749,999 | 3,427 (28.6%) | 10,032 (31.1%) |
| $750,000 to $999,999 | 1,094 (9.1%) | 3,670 (11.4%) |
| $1,000,000 or more | 406 (3.4%) | 1,403 (4.3%) |
| Total | 11,974 (100.0%) | 32,226 (100.0%) |
Household Income by Mortgage Status in Cary
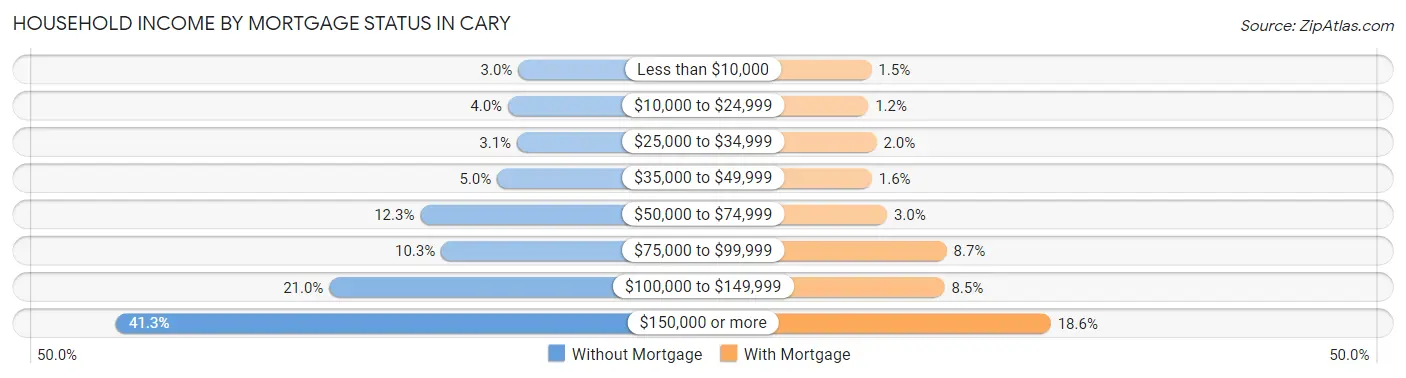
| Household Income | Without Mortgage | With Mortgage |
| Less than $10,000 | 358 (3.0%) | 486 (1.5%) |
| $10,000 to $24,999 | 475 (4.0%) | 390 (1.2%) |
| $25,000 to $34,999 | 372 (3.1%) | 644 (2.0%) |
| $35,000 to $49,999 | 599 (5.0%) | 499 (1.5%) |
| $50,000 to $74,999 | 1,475 (12.3%) | 963 (3.0%) |
| $75,000 to $99,999 | 1,238 (10.3%) | 2,794 (8.7%) |
| $100,000 to $149,999 | 2,513 (21.0%) | 2,730 (8.5%) |
| $150,000 or more | 4,944 (41.3%) | 5,992 (18.6%) |
| Total | 11,974 (100.0%) | 32,226 (100.0%) |
Property Value to Household Income Ratio in Cary
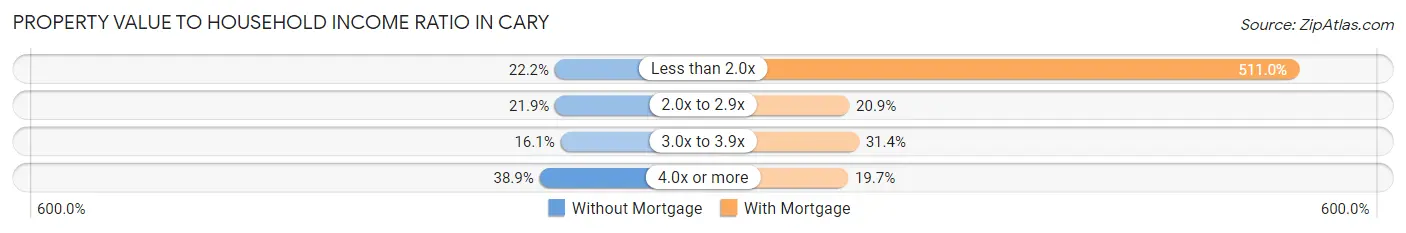
| Value-to-Income Ratio | Without Mortgage | With Mortgage |
| Less than 2.0x | 2,654 (22.2%) | 164,680 (511.0%) |
| 2.0x to 2.9x | 2,620 (21.9%) | 6,735 (20.9%) |
| 3.0x to 3.9x | 1,924 (16.1%) | 10,120 (31.4%) |
| 4.0x or more | 4,660 (38.9%) | 6,339 (19.7%) |
| Total | 11,974 (100.0%) | 32,226 (100.0%) |
Real Estate Taxes by Mortgage Status in Cary
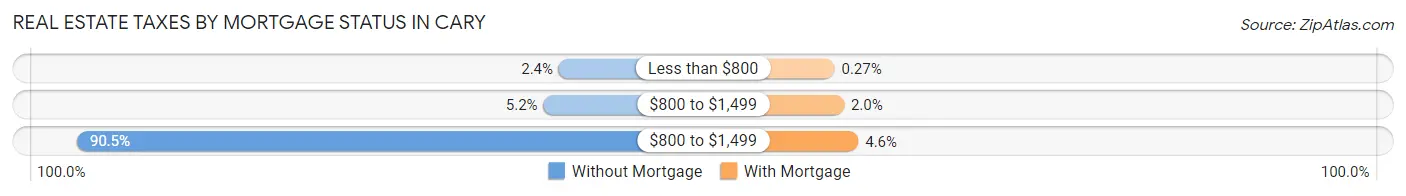
| Property Taxes | Without Mortgage | With Mortgage |
| Less than $800 | 290 (2.4%) | 88 (0.3%) |
| $800 to $1,499 | 626 (5.2%) | 646 (2.0%) |
| $800 to $1,499 | 10,832 (90.5%) | 1,487 (4.6%) |
| Total | 11,974 (100.0%) | 32,226 (100.0%) |
Health & Disability in Cary
Health Insurance Coverage by Age in Cary
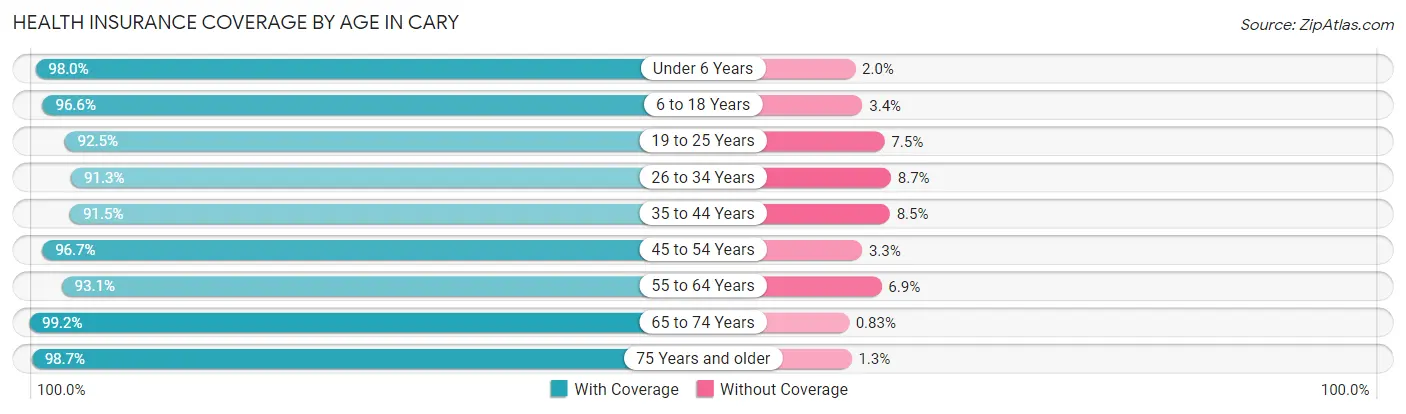
| Age Bracket | With Coverage | Without Coverage |
| Under 6 Years | 11,705 (98.0%) | 240 (2.0%) |
| 6 to 18 Years | 31,849 (96.6%) | 1,107 (3.4%) |
| 19 to 25 Years | 11,482 (92.5%) | 928 (7.5%) |
| 26 to 34 Years | 16,924 (91.3%) | 1,608 (8.7%) |
| 35 to 44 Years | 24,974 (91.5%) | 2,311 (8.5%) |
| 45 to 54 Years | 26,229 (96.7%) | 893 (3.3%) |
| 55 to 64 Years | 20,002 (93.1%) | 1,488 (6.9%) |
| 65 to 74 Years | 13,935 (99.2%) | 116 (0.8%) |
| 75 Years and older | 8,688 (98.7%) | 117 (1.3%) |
| Total | 165,788 (95.0%) | 8,808 (5.0%) |
Health Insurance Coverage by Citizenship Status in Cary
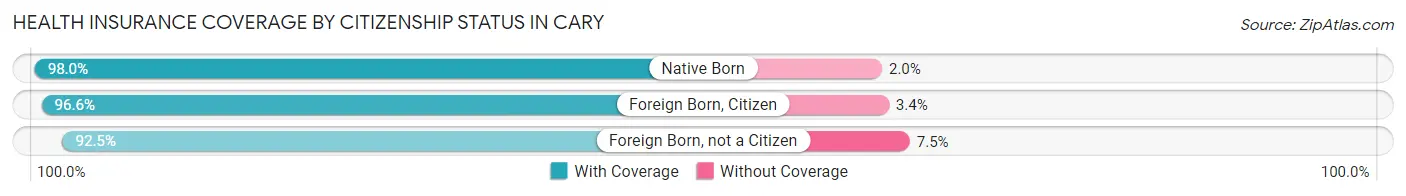
| Citizenship Status | With Coverage | Without Coverage |
| Native Born | 11,705 (98.0%) | 240 (2.0%) |
| Foreign Born, Citizen | 31,849 (96.6%) | 1,107 (3.4%) |
| Foreign Born, not a Citizen | 11,482 (92.5%) | 928 (7.5%) |
Health Insurance Coverage by Household Income in Cary
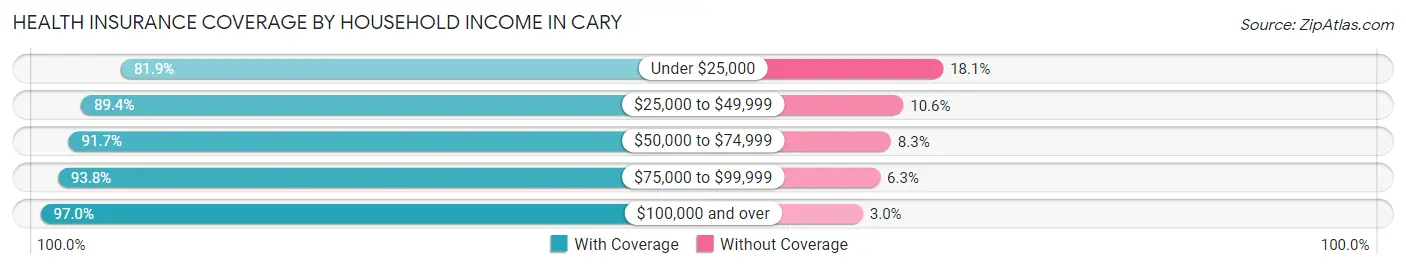
| Household Income | With Coverage | Without Coverage |
| Under $25,000 | 6,625 (81.9%) | 1,460 (18.1%) |
| $25,000 to $49,999 | 10,935 (89.4%) | 1,295 (10.6%) |
| $50,000 to $74,999 | 15,568 (91.7%) | 1,402 (8.3%) |
| $75,000 to $99,999 | 15,112 (93.8%) | 1,008 (6.2%) |
| $100,000 and over | 117,419 (97.0%) | 3,638 (3.0%) |
Public vs Private Health Insurance Coverage by Age in Cary
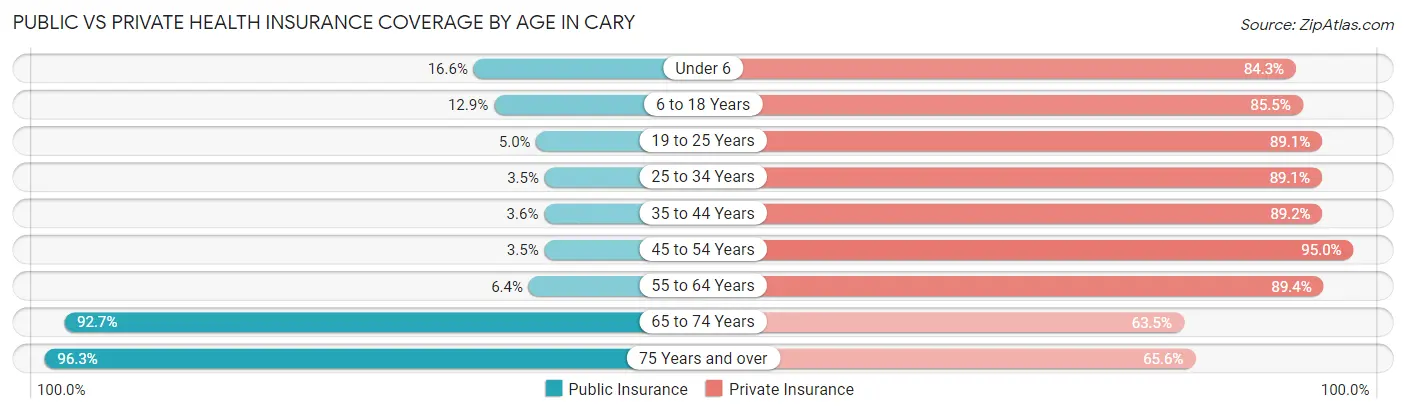
| Age Bracket | Public Insurance | Private Insurance |
| Under 6 | 1,986 (16.6%) | 10,069 (84.3%) |
| 6 to 18 Years | 4,240 (12.9%) | 28,186 (85.5%) |
| 19 to 25 Years | 621 (5.0%) | 11,062 (89.1%) |
| 25 to 34 Years | 640 (3.5%) | 16,508 (89.1%) |
| 35 to 44 Years | 968 (3.5%) | 24,342 (89.2%) |
| 45 to 54 Years | 948 (3.5%) | 25,755 (95.0%) |
| 55 to 64 Years | 1,379 (6.4%) | 19,214 (89.4%) |
| 65 to 74 Years | 13,021 (92.7%) | 8,920 (63.5%) |
| 75 Years and over | 8,481 (96.3%) | 5,775 (65.6%) |
| Total | 32,284 (18.5%) | 149,831 (85.8%) |
Disability Status by Sex by Age in Cary
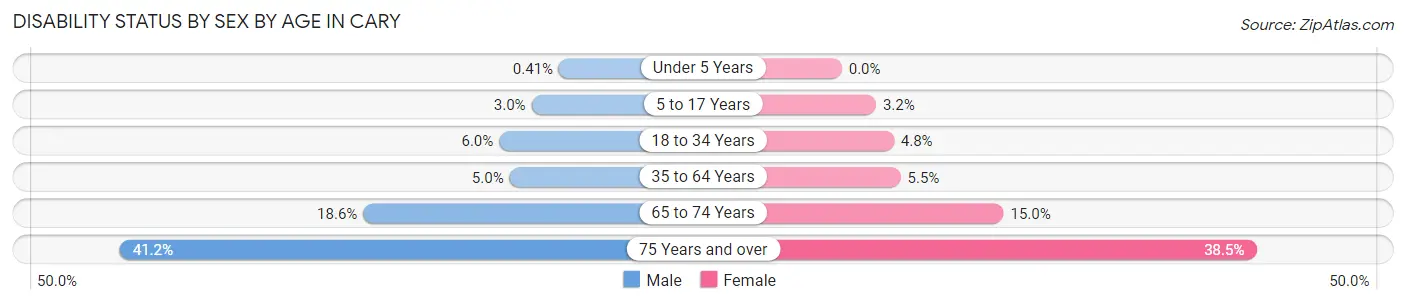
| Age Bracket | Male | Female |
| Under 5 Years | 20 (0.4%) | 0 (0.0%) |
| 5 to 17 Years | 505 (3.0%) | 523 (3.2%) |
| 18 to 34 Years | 949 (6.0%) | 820 (4.8%) |
| 35 to 64 Years | 1,917 (5.0%) | 2,052 (5.5%) |
| 65 to 74 Years | 1,193 (18.6%) | 1,145 (15.0%) |
| 75 Years and over | 1,487 (41.2%) | 1,997 (38.5%) |
Disability Class by Sex by Age in Cary
Disability Class: Hearing Difficulty
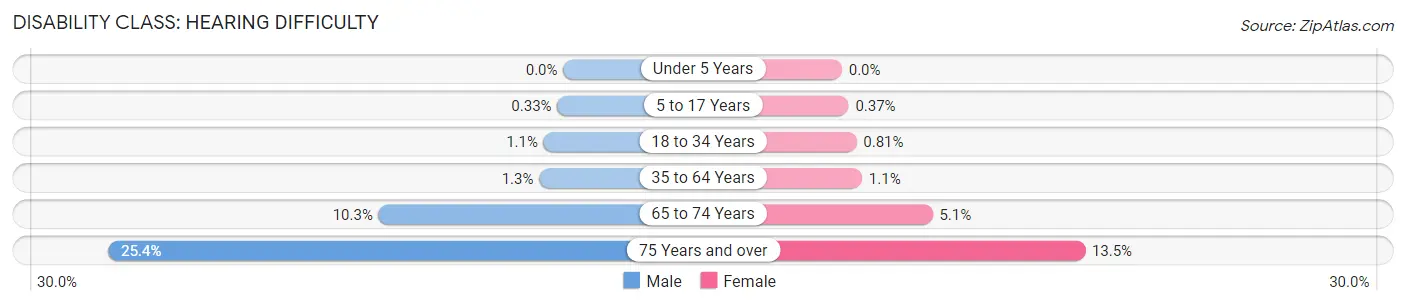
| Age Bracket | Male | Female |
| Under 5 Years | 0 (0.0%) | 0 (0.0%) |
| 5 to 17 Years | 57 (0.3%) | 61 (0.4%) |
| 18 to 34 Years | 173 (1.1%) | 138 (0.8%) |
| 35 to 64 Years | 512 (1.3%) | 422 (1.1%) |
| 65 to 74 Years | 660 (10.3%) | 385 (5.1%) |
| 75 Years and over | 916 (25.4%) | 703 (13.5%) |
Disability Class: Vision Difficulty
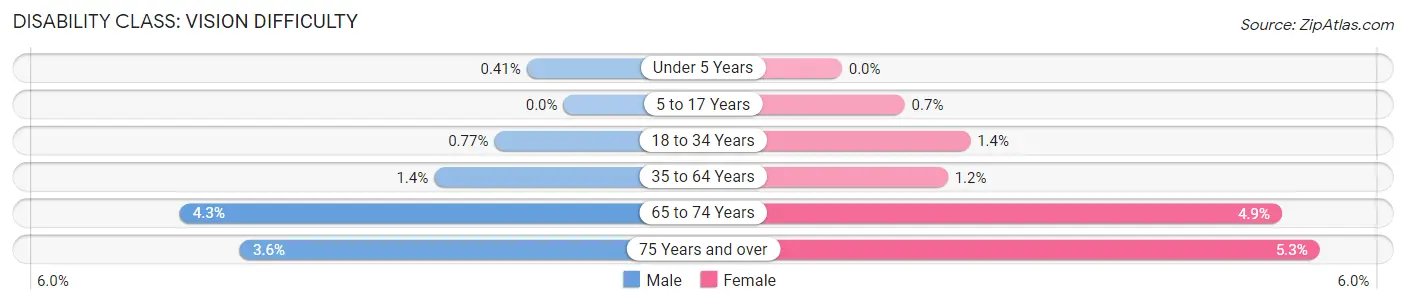
| Age Bracket | Male | Female |
| Under 5 Years | 20 (0.4%) | 0 (0.0%) |
| 5 to 17 Years | 0 (0.0%) | 116 (0.7%) |
| 18 to 34 Years | 123 (0.8%) | 243 (1.4%) |
| 35 to 64 Years | 550 (1.4%) | 443 (1.2%) |
| 65 to 74 Years | 274 (4.3%) | 374 (4.9%) |
| 75 Years and over | 130 (3.6%) | 276 (5.3%) |
Disability Class: Cognitive Difficulty
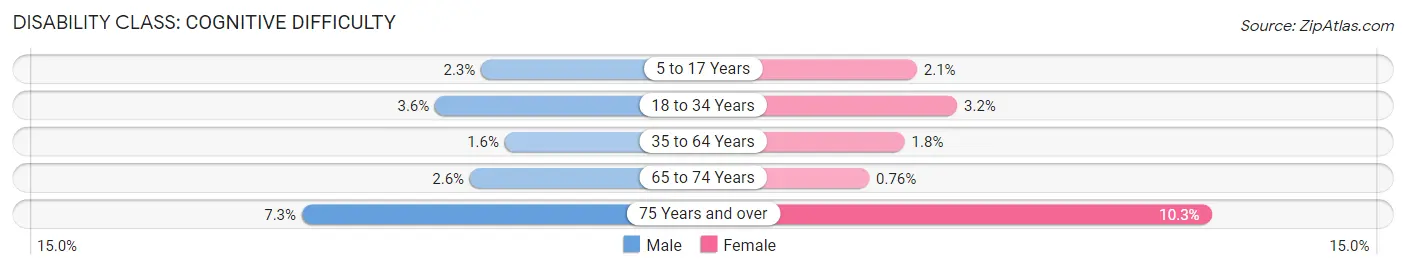
| Age Bracket | Male | Female |
| 5 to 17 Years | 391 (2.3%) | 346 (2.1%) |
| 18 to 34 Years | 569 (3.6%) | 545 (3.2%) |
| 35 to 64 Years | 623 (1.6%) | 658 (1.8%) |
| 65 to 74 Years | 167 (2.6%) | 58 (0.8%) |
| 75 Years and over | 263 (7.3%) | 534 (10.3%) |
Disability Class: Ambulatory Difficulty
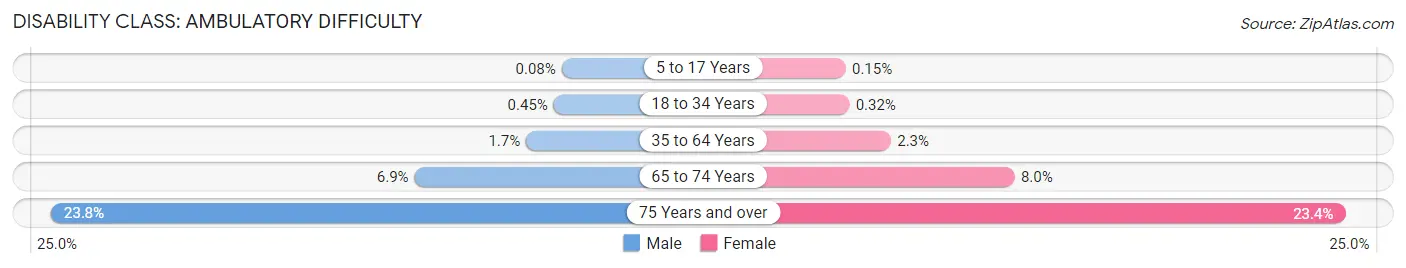
| Age Bracket | Male | Female |
| 5 to 17 Years | 13 (0.1%) | 25 (0.2%) |
| 18 to 34 Years | 72 (0.4%) | 55 (0.3%) |
| 35 to 64 Years | 662 (1.7%) | 846 (2.2%) |
| 65 to 74 Years | 444 (6.9%) | 610 (8.0%) |
| 75 Years and over | 859 (23.8%) | 1,213 (23.4%) |
Disability Class: Self-Care Difficulty
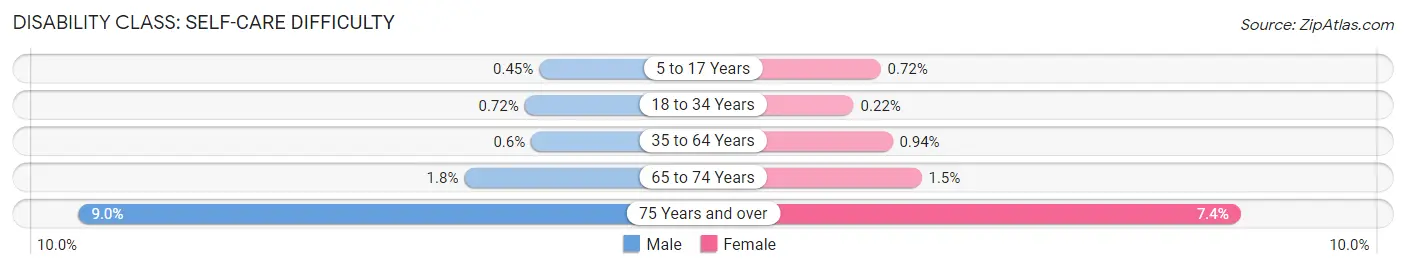
| Age Bracket | Male | Female |
| 5 to 17 Years | 77 (0.4%) | 119 (0.7%) |
| 18 to 34 Years | 114 (0.7%) | 38 (0.2%) |
| 35 to 64 Years | 231 (0.6%) | 354 (0.9%) |
| 65 to 74 Years | 118 (1.8%) | 113 (1.5%) |
| 75 Years and over | 325 (9.0%) | 384 (7.4%) |
Technology Access in Cary
Computing Device Access in Cary
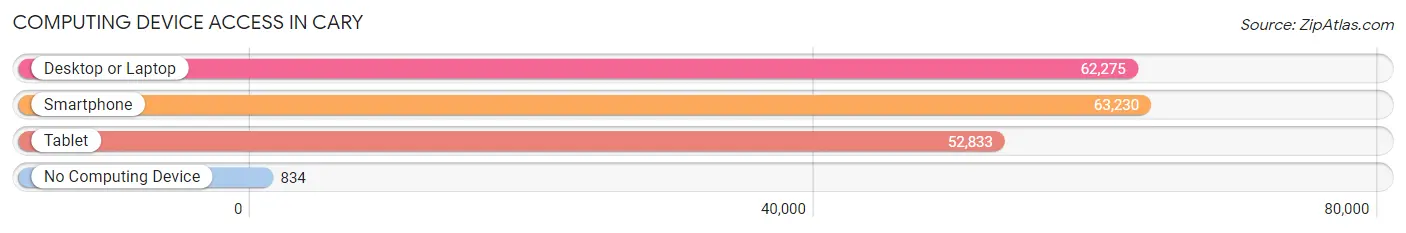
| Device Type | # Households | % Households |
| Desktop or Laptop | 62,275 | 94.2% |
| Smartphone | 63,230 | 95.6% |
| Tablet | 52,833 | 79.9% |
| No Computing Device | 834 | 1.3% |
| Total | 66,120 | 100.0% |
Internet Access in Cary
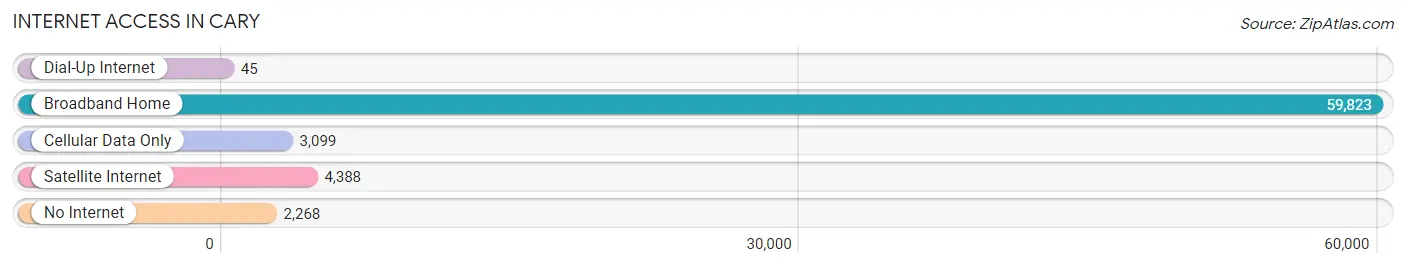
| Internet Type | # Households | % Households |
| Dial-Up Internet | 45 | 0.1% |
| Broadband Home | 59,823 | 90.5% |
| Cellular Data Only | 3,099 | 4.7% |
| Satellite Internet | 4,388 | 6.6% |
| No Internet | 2,268 | 3.4% |
| Total | 66,120 | 100.0% |
Cary Summary
Cary, North Carolina is a town located in Wake County, North Carolina. It is part of the Research Triangle region, which is home to three major research universities: Duke University, North Carolina State University, and the University of North Carolina at Chapel Hill. The town is located just west of Raleigh, the state capital, and is part of the Raleigh-Durham-Chapel Hill metropolitan area.
History
Cary was founded in 1750 by a group of settlers from the nearby town of Wake Forest. The town was originally known as Bradford’s Ordinary, named after the first settler, Francis Bradford. The town was renamed Cary in 1854 after Samuel Fenton Cary, a prominent lawyer and politician from Ohio.
Cary was incorporated as a town in 1871 and was officially designated as a city in 1947. The town experienced rapid growth in the late 20th century, becoming one of the fastest-growing cities in the United States.
Geography
Cary is located in the Piedmont region of North Carolina, about 10 miles west of Raleigh. The town is situated on the banks of the Neuse River and is surrounded by rolling hills and forests. The town covers an area of approximately 43 square miles and has an elevation of about 400 feet.
The climate in Cary is humid subtropical, with hot, humid summers and mild winters. The average annual temperature is around 60 degrees Fahrenheit, with an average high of around 80 degrees in the summer and an average low of around 40 degrees in the winter.
Economy
Cary’s economy is largely driven by the technology and research industries. The town is home to several major technology companies, including SAS Institute, Epic Games, and Red Hat. The town is also home to several research institutions, including the National Institute of Environmental Health Sciences and the National Institute of Standards and Technology.
Cary is also home to several major retail and entertainment venues, including the Crossroads Plaza shopping center and the Koka Booth Amphitheatre. The town is also home to several major employers, including WakeMed Health & Hospitals, Wake County Public Schools, and Wake Technical Community College.
Demographics
As of the 2010 census, Cary had a population of 135,234. The racial makeup of the town was 73.3% White, 11.2% African American, 0.3% Native American, 11.7% Asian, 0.1% Pacific Islander, and 3.4% from other races. The median household income was $87,811, and the median family income was $103,917.
Cary is a diverse and vibrant community, with a variety of cultural and recreational activities. The town is home to several museums, parks, and performing arts venues, as well as a variety of restaurants and shopping centers. The town is also home to several major universities and research institutions, making it an attractive destination for students and professionals alike.
Common Questions
What is Per Capita Income in Cary?
Per Capita income in Cary is $61,933.
What is the Median Family Income in Cary?
Median Family Income in Cary is $153,798.
What is the Median Household income in Cary?
Median Household Income in Cary is $125,317.
What is Income or Wage Gap in Cary?
Income or Wage Gap in Cary is 44.0%.
Women in Cary earn 56.0 cents for every dollar earned by a man.
What is Family Income Deficit in Cary?
Family Income Deficit in Cary is $12,078.
Families that are below poverty line in Cary earn $12,078 less on average than the poverty threshold level.
What is Inequality or Gini Index in Cary?
Inequality or Gini Index in Cary is 0.43.
What is the Total Population of Cary?
Total Population of Cary is 174,880.
What is the Total Male Population of Cary?
Total Male Population of Cary is 86,405.
What is the Total Female Population of Cary?
Total Female Population of Cary is 88,475.
What is the Ratio of Males per 100 Females in Cary?
There are 97.66 Males per 100 Females in Cary.
What is the Ratio of Females per 100 Males in Cary?
There are 102.40 Females per 100 Males in Cary.
What is the Median Population Age in Cary?
Median Population Age in Cary is 39.4 Years.
What is the Average Family Size in Cary
Average Family Size in Cary is 3.1 People.
What is the Average Household Size in Cary
Average Household Size in Cary is 2.6 People.
How Large is the Labor Force in Cary?
There are 96,629 People in the Labor Forcein in Cary.
What is the Percentage of People in the Labor Force in Cary?
70.1% of People are in the Labor Force in Cary.
What is the Unemployment Rate in Cary?
Unemployment Rate in Cary is 3.4%.