Knoxville, TN Map & Demographics
Knoxville Map
Knoxville Overview
$31,983
PER CAPITA INCOME
$67,233
AVG FAMILY INCOME
$48,309
AVG HOUSEHOLD INCOME
15.5%
WAGE / INCOME GAP [ % ]
84.5¢/ $1
WAGE / INCOME GAP [ $ ]
$10,526
FAMILY INCOME DEFICIT
0.49
INEQUALITY / GINI INDEX
191,857
TOTAL POPULATION
93,069
MALE POPULATION
98,788
FEMALE POPULATION
94.21
MALES / 100 FEMALES
106.14
FEMALES / 100 MALES
33.4
MEDIAN AGE
3.0
AVG FAMILY SIZE
2.2
AVG HOUSEHOLD SIZE
102,116
LABOR FORCE [ PEOPLE ]
63.4%
PERCENT IN LABOR FORCE
4.8%
UNEMPLOYMENT RATE
Knoxville Zip Codes
Knoxville Area Codes
Income in Knoxville
Income Overview in Knoxville
Per Capita Income in Knoxville is $31,983, while median incomes of families and households are $67,233 and $48,309 respectively.
| Characteristic | Number | Measure |
| Per Capita Income | 191,857 | $31,983 |
| Median Family Income | 39,616 | $67,233 |
| Mean Family Income | 39,616 | $91,341 |
| Median Household Income | 84,195 | $48,309 |
| Mean Household Income | 84,195 | $70,302 |
| Income Deficit | 39,616 | $10,526 |
| Wage / Income Gap (%) | 191,857 | 15.53% |
| Wage / Income Gap ($) | 191,857 | 84.47¢ per $1 |
| Gini / Inequality Index | 191,857 | 0.49 |
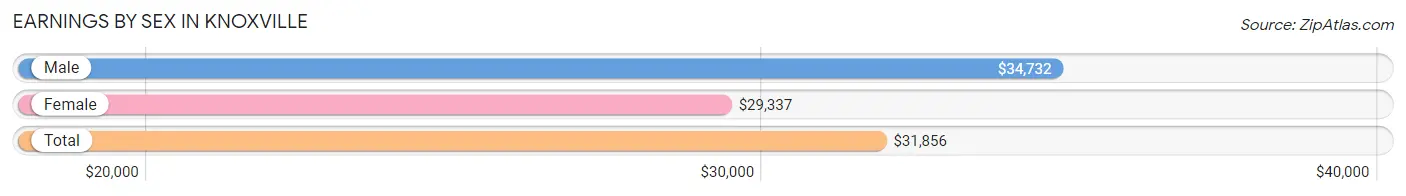
Earnings by Sex in Knoxville
Average Earnings in Knoxville are $31,856, $34,732 for men and $29,337 for women, a difference of 15.5%.
| Sex | Number | Average Earnings |
| Male | 55,229 (51.0%) | $34,732 |
| Female | 52,963 (48.9%) | $29,337 |
| Total | 108,192 (100.0%) | $31,856 |
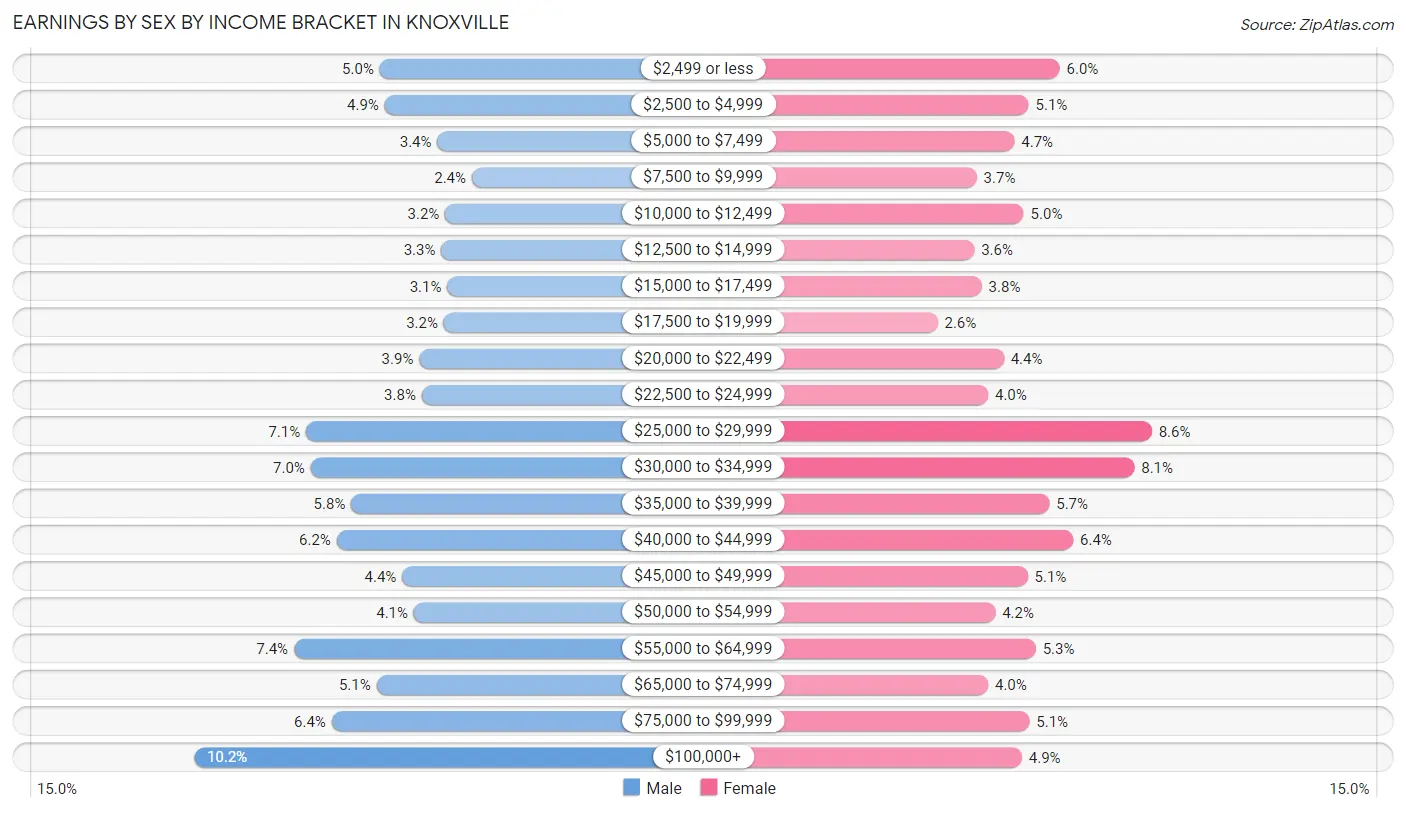
Earnings by Sex by Income Bracket in Knoxville
The most common earnings brackets in Knoxville are $100,000+ for men (5,658 | 10.2%) and $25,000 to $29,999 for women (4,540 | 8.6%).
| Income | Male | Female |
| $2,499 or less | 2,772 (5.0%) | 3,169 (6.0%) |
| $2,500 to $4,999 | 2,695 (4.9%) | 2,704 (5.1%) |
| $5,000 to $7,499 | 1,878 (3.4%) | 2,496 (4.7%) |
| $7,500 to $9,999 | 1,342 (2.4%) | 1,935 (3.6%) |
| $10,000 to $12,499 | 1,758 (3.2%) | 2,631 (5.0%) |
| $12,500 to $14,999 | 1,815 (3.3%) | 1,898 (3.6%) |
| $15,000 to $17,499 | 1,725 (3.1%) | 2,009 (3.8%) |
| $17,500 to $19,999 | 1,777 (3.2%) | 1,348 (2.5%) |
| $20,000 to $22,499 | 2,162 (3.9%) | 2,335 (4.4%) |
| $22,500 to $24,999 | 2,119 (3.8%) | 2,103 (4.0%) |
| $25,000 to $29,999 | 3,914 (7.1%) | 4,540 (8.6%) |
| $30,000 to $34,999 | 3,842 (7.0%) | 4,278 (8.1%) |
| $35,000 to $39,999 | 3,217 (5.8%) | 3,013 (5.7%) |
| $40,000 to $44,999 | 3,443 (6.2%) | 3,371 (6.4%) |
| $45,000 to $49,999 | 2,427 (4.4%) | 2,688 (5.1%) |
| $50,000 to $54,999 | 2,244 (4.1%) | 2,208 (4.2%) |
| $55,000 to $64,999 | 4,101 (7.4%) | 2,811 (5.3%) |
| $65,000 to $74,999 | 2,823 (5.1%) | 2,103 (4.0%) |
| $75,000 to $99,999 | 3,517 (6.4%) | 2,718 (5.1%) |
| $100,000+ | 5,658 (10.2%) | 2,605 (4.9%) |
| Total | 55,229 (100.0%) | 52,963 (100.0%) |
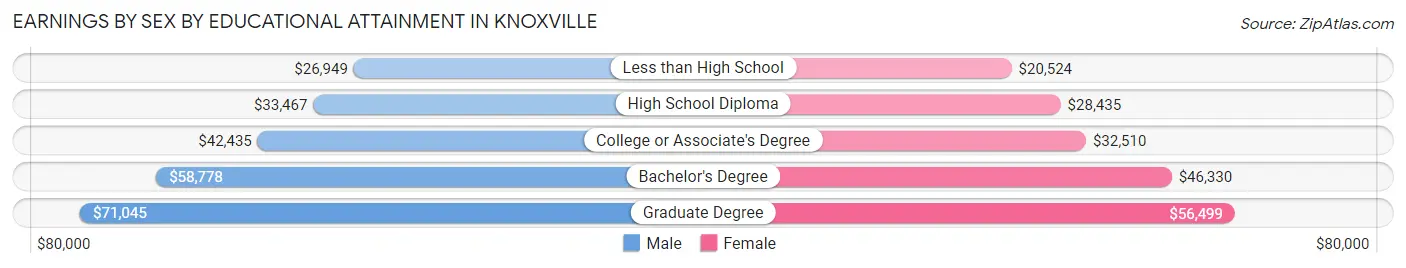
Earnings by Sex by Educational Attainment in Knoxville
Average earnings in Knoxville are $43,471 for men and $35,539 for women, a difference of 18.2%. Men with an educational attainment of graduate degree enjoy the highest average annual earnings of $71,045, while those with less than high school education earn the least with $26,949. Women with an educational attainment of graduate degree earn the most with the average annual earnings of $56,499, while those with less than high school education have the smallest earnings of $20,524.
| Educational Attainment | Male Income | Female Income |
| Less than High School | $26,949 | $20,524 |
| High School Diploma | $33,467 | $28,435 |
| College or Associate's Degree | $42,435 | $32,510 |
| Bachelor's Degree | $58,778 | $46,330 |
| Graduate Degree | $71,045 | $56,499 |
| Total | $43,471 | $35,539 |
Family Income in Knoxville
Family Income Brackets in Knoxville
According to the Knoxville family income data, there are 7,250 families falling into the $50,000 to $74,999 income range, which is the most common income bracket and makes up 18.3% of all families. Conversely, the $10,000 to $14,999 income bracket is the least frequent group with only 1,149 families (2.9%) belonging to this category.
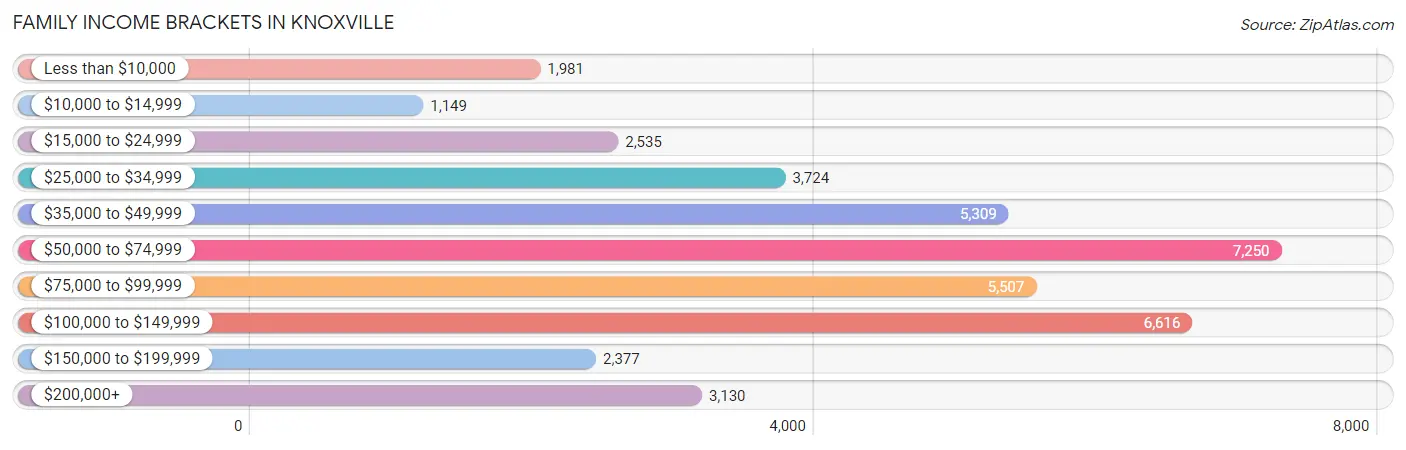
| Income Bracket | # Families | % Families |
| Less than $10,000 | 1,981 | 5.0% |
| $10,000 to $14,999 | 1,149 | 2.9% |
| $15,000 to $24,999 | 2,535 | 6.4% |
| $25,000 to $34,999 | 3,724 | 9.4% |
| $35,000 to $49,999 | 5,309 | 13.4% |
| $50,000 to $74,999 | 7,250 | 18.3% |
| $75,000 to $99,999 | 5,507 | 13.9% |
| $100,000 to $149,999 | 6,616 | 16.7% |
| $150,000 to $199,999 | 2,377 | 6.0% |
| $200,000+ | 3,130 | 7.9% |
Family Income by Famaliy Size in Knoxville
6-person families (783 | 2.0%) account for the highest median family income in Knoxville with $97,188 per family, while 2-person families (20,898 | 52.7%) have the highest median income of $32,280 per family member.
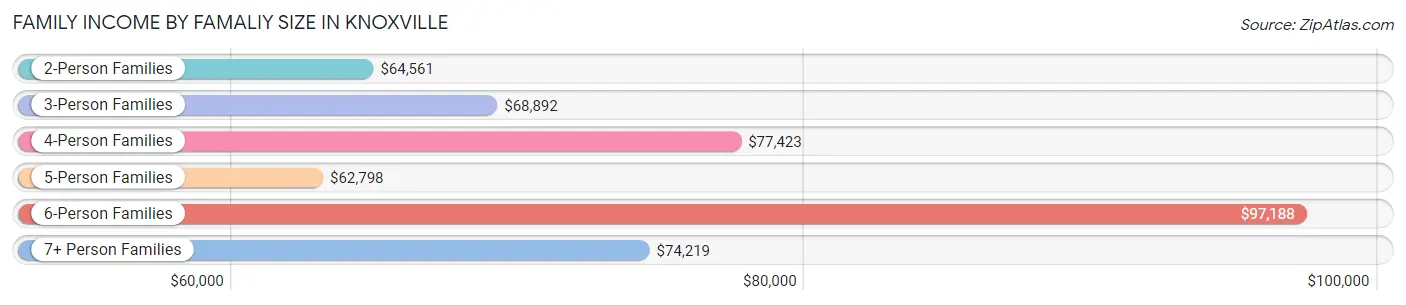
| Income Bracket | # Families | Median Income |
| 2-Person Families | 20,898 (52.7%) | $64,561 |
| 3-Person Families | 9,093 (23.0%) | $68,892 |
| 4-Person Families | 5,367 (13.6%) | $77,423 |
| 5-Person Families | 2,876 (7.3%) | $62,798 |
| 6-Person Families | 783 (2.0%) | $97,188 |
| 7+ Person Families | 599 (1.5%) | $74,219 |
| Total | 39,616 (100.0%) | $67,233 |
Family Income by Number of Earners in Knoxville
The median family income in Knoxville is $67,233, with families comprising 3+ earners (2,779) having the highest median family income of $113,546, while families with no earners (5,843) have the lowest median family income of $34,005, accounting for 7.0% and 14.7% of families, respectively.
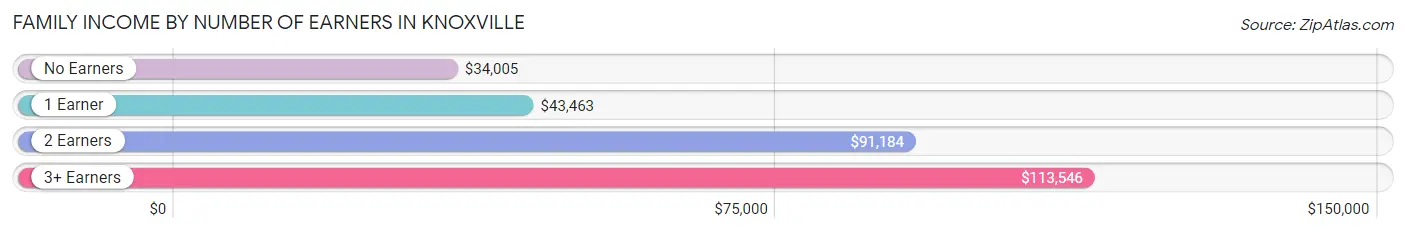
| Number of Earners | # Families | Median Income |
| No Earners | 5,843 (14.7%) | $34,005 |
| 1 Earner | 14,441 (36.4%) | $43,463 |
| 2 Earners | 16,553 (41.8%) | $91,184 |
| 3+ Earners | 2,779 (7.0%) | $113,546 |
| Total | 39,616 (100.0%) | $67,233 |
Household Income in Knoxville
Household Income Brackets in Knoxville
With 14,987 households falling in the category, the $50,000 to $74,999 income range is the most frequent in Knoxville, accounting for 17.8% of all households. In contrast, only 3,284 households (3.9%) fall into the $150,000 to $199,999 income bracket, making it the least populous group.
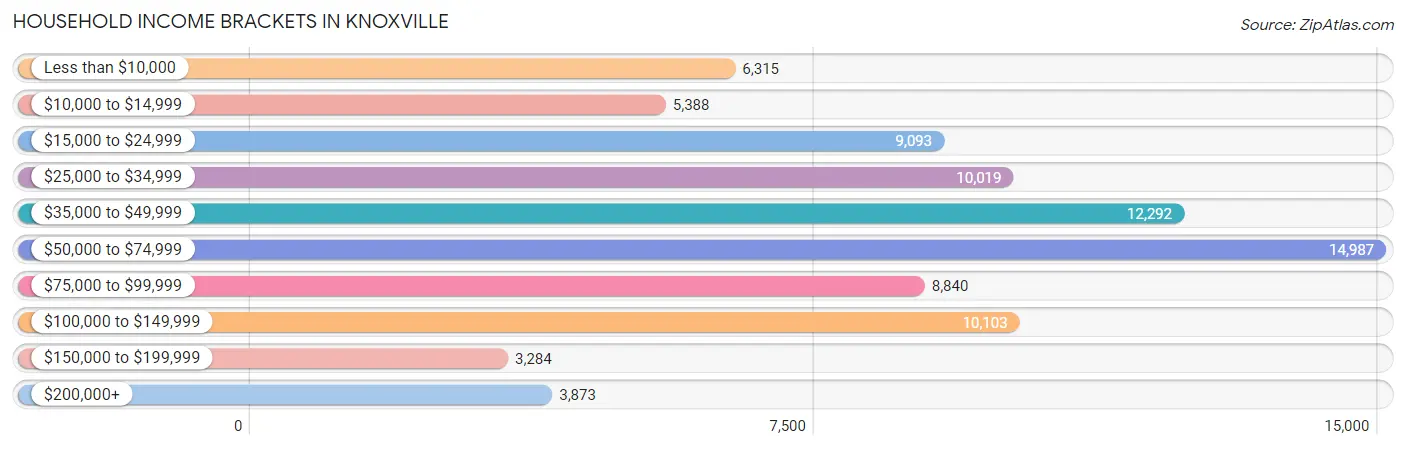
| Income Bracket | # Households | % Households |
| Less than $10,000 | 6,315 | 7.5% |
| $10,000 to $14,999 | 5,388 | 6.4% |
| $15,000 to $24,999 | 9,093 | 10.8% |
| $25,000 to $34,999 | 10,019 | 11.9% |
| $35,000 to $49,999 | 12,292 | 14.6% |
| $50,000 to $74,999 | 14,987 | 17.8% |
| $75,000 to $99,999 | 8,840 | 10.5% |
| $100,000 to $149,999 | 10,103 | 12.0% |
| $150,000 to $199,999 | 3,284 | 3.9% |
| $200,000+ | 3,873 | 4.6% |
Household Income by Householder Age in Knoxville
The median household income in Knoxville is $48,309, with the highest median household income of $56,693 found in the 25 to 44 years age bracket for the primary householder. A total of 29,921 households (35.5%) fall into this category. Meanwhile, the 15 to 24 years age bracket for the primary householder has the lowest median household income of $30,954, with 10,018 households (11.9%) in this group.
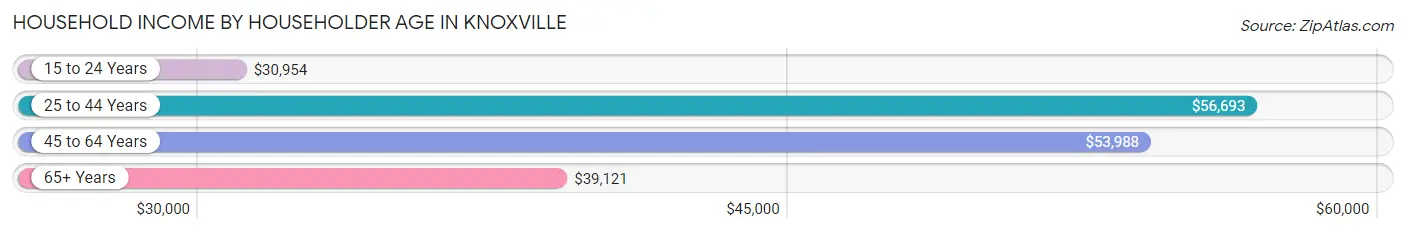
| Income Bracket | # Households | Median Income |
| 15 to 24 Years | 10,018 (11.9%) | $30,954 |
| 25 to 44 Years | 29,921 (35.5%) | $56,693 |
| 45 to 64 Years | 25,623 (30.4%) | $53,988 |
| 65+ Years | 18,633 (22.1%) | $39,121 |
| Total | 84,195 (100.0%) | $48,309 |
Poverty in Knoxville
Income Below Poverty by Sex and Age in Knoxville
With 20.6% poverty level for males and 20.8% for females among the residents of Knoxville, 18 to 24 year old males and 18 to 24 year old females are the most vulnerable to poverty, with 5,838 males (41.1%) and 5,341 females (38.5%) in their respective age groups living below the poverty level.
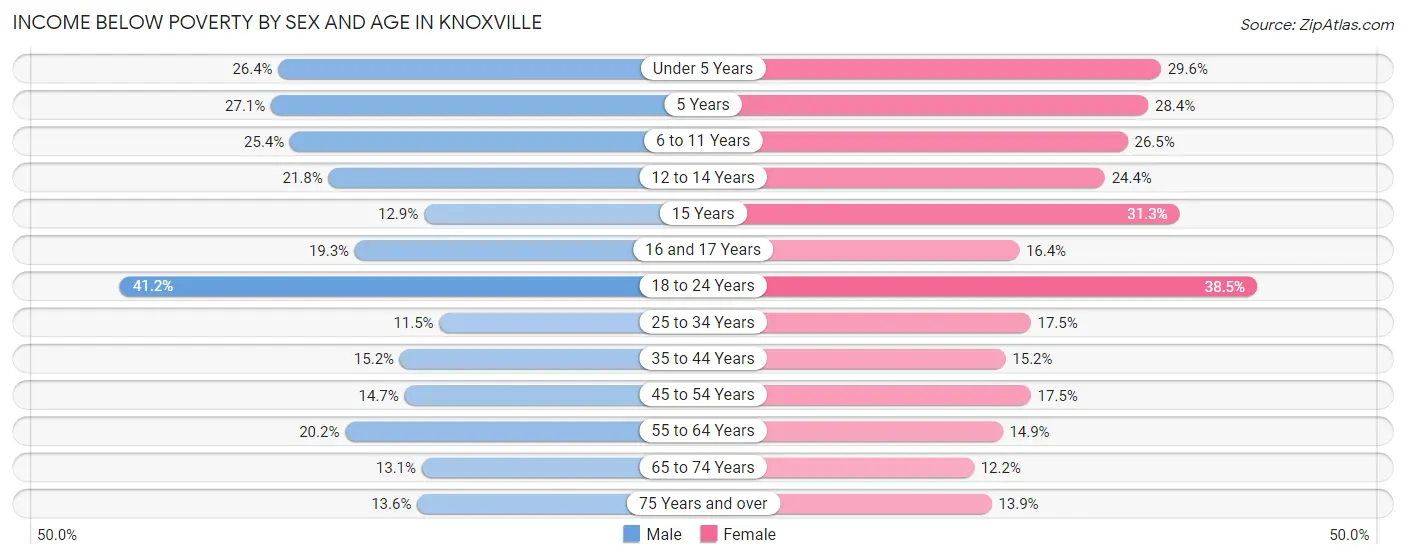
| Age Bracket | Male | Female |
| Under 5 Years | 1,279 (26.4%) | 1,391 (29.6%) |
| 5 Years | 269 (27.1%) | 260 (28.4%) |
| 6 to 11 Years | 1,481 (25.4%) | 1,412 (26.5%) |
| 12 to 14 Years | 616 (21.8%) | 700 (24.4%) |
| 15 Years | 136 (12.9%) | 287 (31.3%) |
| 16 and 17 Years | 342 (19.3%) | 364 (16.4%) |
| 18 to 24 Years | 5,838 (41.1%) | 5,341 (38.5%) |
| 25 to 34 Years | 1,786 (11.5%) | 2,644 (17.5%) |
| 35 to 44 Years | 1,688 (15.2%) | 1,779 (15.2%) |
| 45 to 54 Years | 1,446 (14.7%) | 1,835 (17.5%) |
| 55 to 64 Years | 2,111 (20.2%) | 1,582 (14.9%) |
| 65 to 74 Years | 906 (13.1%) | 1,065 (12.2%) |
| 75 Years and over | 544 (13.6%) | 928 (13.9%) |
| Total | 18,442 (20.6%) | 19,588 (20.8%) |
Income Above Poverty by Sex and Age in Knoxville
According to the poverty statistics in Knoxville, males aged 25 to 34 years and females aged 65 to 74 years are the age groups that are most secure financially, with 88.5% of males and 87.8% of females in these age groups living above the poverty line.
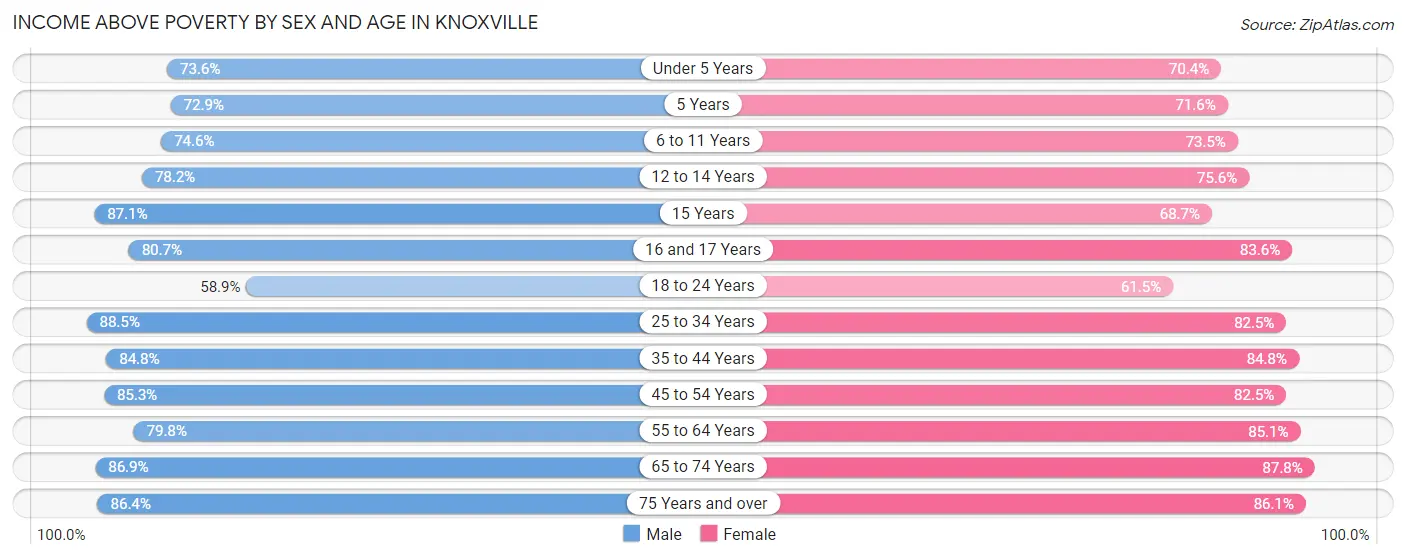
| Age Bracket | Male | Female |
| Under 5 Years | 3,559 (73.6%) | 3,308 (70.4%) |
| 5 Years | 723 (72.9%) | 655 (71.6%) |
| 6 to 11 Years | 4,360 (74.6%) | 3,913 (73.5%) |
| 12 to 14 Years | 2,211 (78.2%) | 2,169 (75.6%) |
| 15 Years | 916 (87.1%) | 629 (68.7%) |
| 16 and 17 Years | 1,426 (80.7%) | 1,850 (83.6%) |
| 18 to 24 Years | 8,350 (58.9%) | 8,525 (61.5%) |
| 25 to 34 Years | 13,740 (88.5%) | 12,445 (82.5%) |
| 35 to 44 Years | 9,436 (84.8%) | 9,941 (84.8%) |
| 45 to 54 Years | 8,373 (85.3%) | 8,633 (82.5%) |
| 55 to 64 Years | 8,319 (79.8%) | 9,030 (85.1%) |
| 65 to 74 Years | 5,992 (86.9%) | 7,634 (87.8%) |
| 75 Years and over | 3,468 (86.4%) | 5,755 (86.1%) |
| Total | 70,873 (79.3%) | 74,487 (79.2%) |
Income Below Poverty Among Married-Couple Families in Knoxville
The poverty statistics for married-couple families in Knoxville show that 5.9% or 1,487 of the total 25,310 families live below the poverty line. Families with 5 or more children have the highest poverty rate of 48.0%, comprising of 166 families. On the other hand, families with no children have the lowest poverty rate of 2.6%, which includes 412 families.
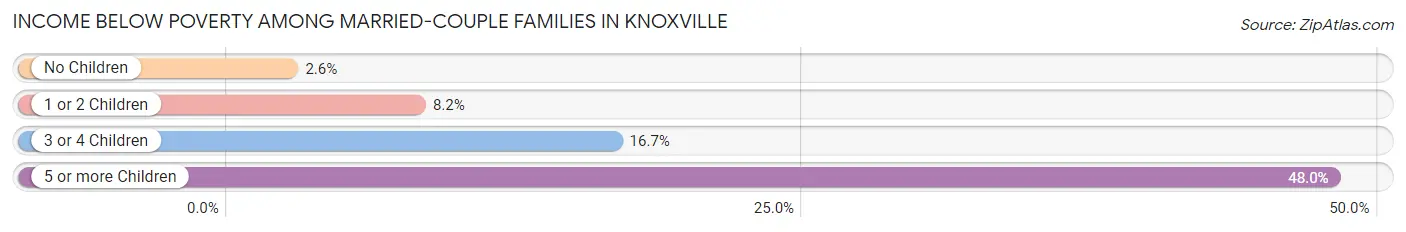
| Children | Above Poverty | Below Poverty |
| No Children | 15,231 (97.4%) | 412 (2.6%) |
| 1 or 2 Children | 6,990 (91.8%) | 623 (8.2%) |
| 3 or 4 Children | 1,422 (83.3%) | 286 (16.7%) |
| 5 or more Children | 180 (52.0%) | 166 (48.0%) |
| Total | 23,823 (94.1%) | 1,487 (5.9%) |
Income Below Poverty Among Single-Parent Households in Knoxville
According to the poverty data in Knoxville, 18.3% or 605 single-father households and 30.5% or 3,353 single-mother households are living below the poverty line. Among single-father households, those with 5 or more children have the highest poverty rate, with 19 households (100.0%) experiencing poverty. Likewise, among single-mother households, those with 5 or more children have the highest poverty rate, with 63 households (61.8%) falling below the poverty line.
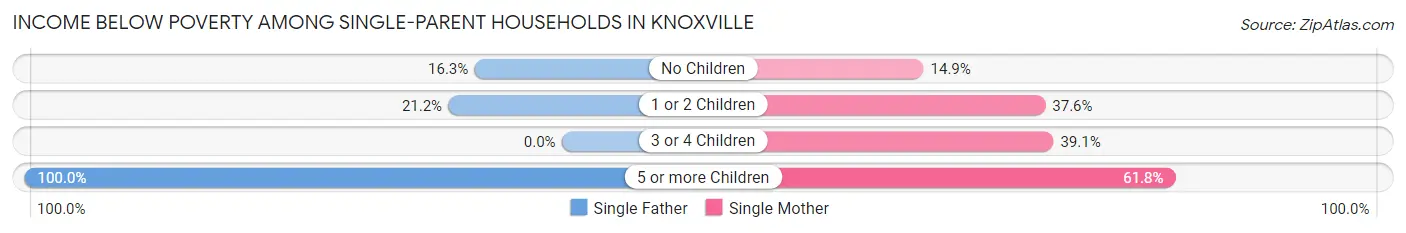
| Children | Single Father | Single Mother |
| No Children | 252 (16.3%) | 544 (14.9%) |
| 1 or 2 Children | 334 (21.1%) | 2,073 (37.6%) |
| 3 or 4 Children | 0 (0.0%) | 673 (39.1%) |
| 5 or more Children | 19 (100.0%) | 63 (61.8%) |
| Total | 605 (18.3%) | 3,353 (30.5%) |
Income Below Poverty Among Married-Couple vs Single-Parent Households in Knoxville
The poverty data for Knoxville shows that 1,487 of the married-couple family households (5.9%) and 3,958 of the single-parent households (27.7%) are living below the poverty level. Within the married-couple family households, those with 5 or more children have the highest poverty rate, with 166 households (48.0%) falling below the poverty line. Among the single-parent households, those with 5 or more children have the highest poverty rate, with 82 household (67.8%) living below poverty.
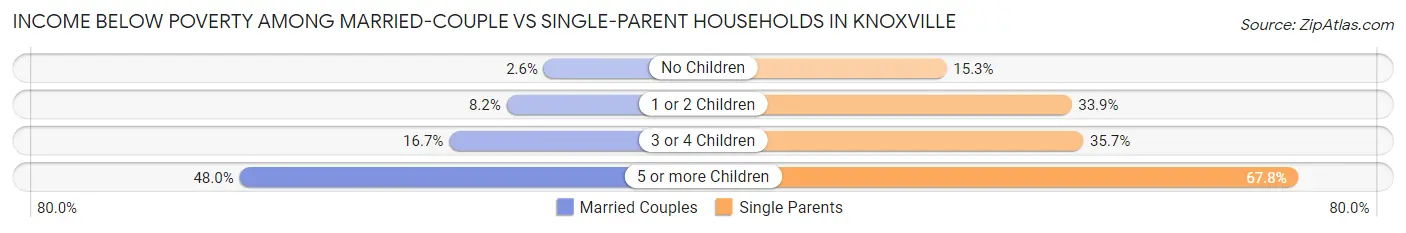
| Children | Married-Couple Families | Single-Parent Households |
| No Children | 412 (2.6%) | 796 (15.3%) |
| 1 or 2 Children | 623 (8.2%) | 2,407 (33.9%) |
| 3 or 4 Children | 286 (16.7%) | 673 (35.7%) |
| 5 or more Children | 166 (48.0%) | 82 (67.8%) |
| Total | 1,487 (5.9%) | 3,958 (27.7%) |
Race in Knoxville
The most populous races in Knoxville are White / Caucasian (141,791 | 73.9%), Black / African American (30,902 | 16.1%), and Two or more Races (12,336 | 6.4%).
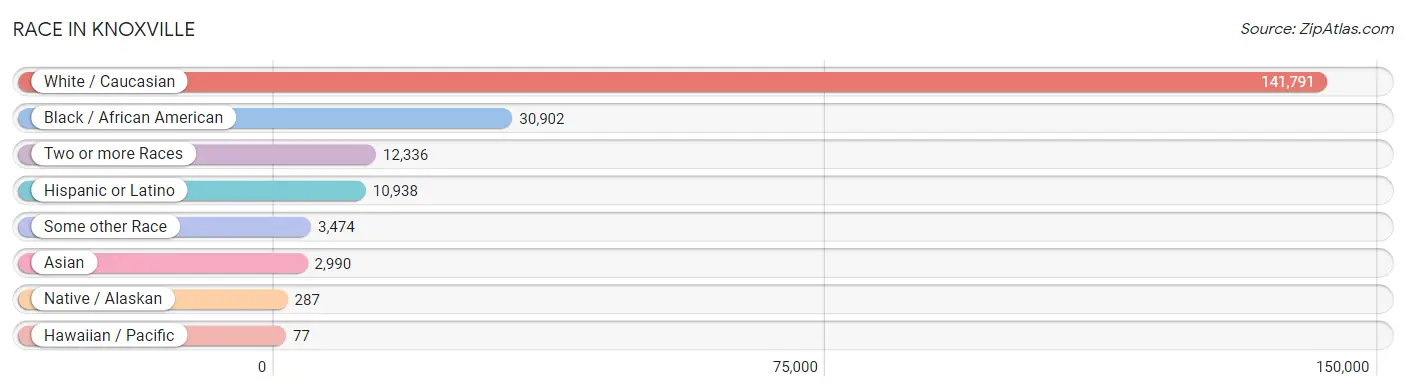
| Race | # Population | % Population |
| Asian | 2,990 | 1.6% |
| Black / African American | 30,902 | 16.1% |
| Hawaiian / Pacific | 77 | 0.0% |
| Hispanic or Latino | 10,938 | 5.7% |
| Native / Alaskan | 287 | 0.2% |
| White / Caucasian | 141,791 | 73.9% |
| Two or more Races | 12,336 | 6.4% |
| Some other Race | 3,474 | 1.8% |
| Total | 191,857 | 100.0% |
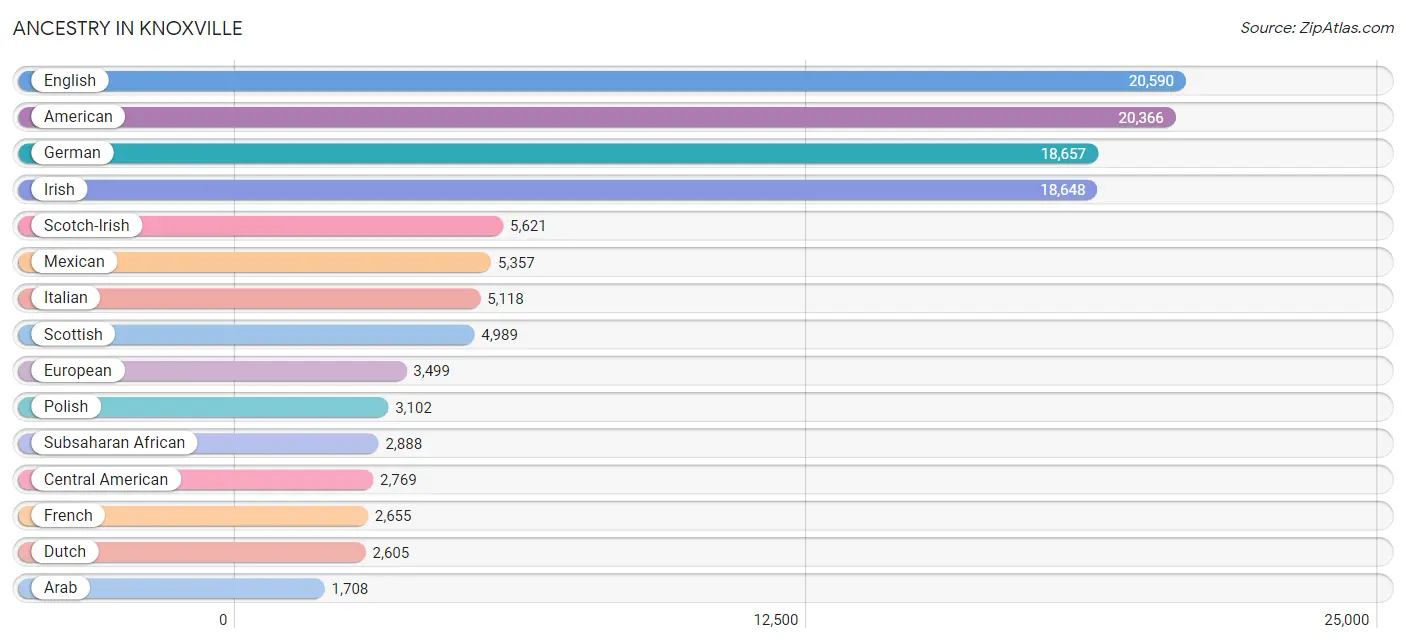
Ancestry in Knoxville
The most populous ancestries reported in Knoxville are English (20,590 | 10.7%), American (20,366 | 10.6%), German (18,657 | 9.7%), Irish (18,648 | 9.7%), and Scotch-Irish (5,621 | 2.9%), together accounting for 43.7% of all Knoxville residents.
| Ancestry | # Population | % Population |
| Afghan | 37 | 0.0% |
| African | 1,500 | 0.8% |
| Alaskan Athabascan | 5 | 0.0% |
| Albanian | 22 | 0.0% |
| Aleut | 8 | 0.0% |
| Alsatian | 9 | 0.0% |
| American | 20,366 | 10.6% |
| Apache | 19 | 0.0% |
| Arab | 1,708 | 0.9% |
| Argentinean | 272 | 0.1% |
| Armenian | 44 | 0.0% |
| Australian | 16 | 0.0% |
| Austrian | 325 | 0.2% |
| Bahamian | 48 | 0.0% |
| Belgian | 12 | 0.0% |
| Bhutanese | 302 | 0.2% |
| Blackfeet | 129 | 0.1% |
| Bolivian | 33 | 0.0% |
| Brazilian | 75 | 0.0% |
| British | 1,428 | 0.7% |
| British West Indian | 117 | 0.1% |
| Bulgarian | 48 | 0.0% |
| Burmese | 419 | 0.2% |
| Cajun | 46 | 0.0% |
| Canadian | 178 | 0.1% |
| Cape Verdean | 35 | 0.0% |
| Celtic | 109 | 0.1% |
| Central American | 2,769 | 1.4% |
| Central American Indian | 68 | 0.0% |
| Cherokee | 712 | 0.4% |
| Chickasaw | 43 | 0.0% |
| Chilean | 16 | 0.0% |
| Chippewa | 23 | 0.0% |
| Choctaw | 87 | 0.1% |
| Colombian | 332 | 0.2% |
| Costa Rican | 12 | 0.0% |
| Creek | 4 | 0.0% |
| Croatian | 47 | 0.0% |
| Cuban | 408 | 0.2% |
| Czech | 307 | 0.2% |
| Czechoslovakian | 22 | 0.0% |
| Danish | 283 | 0.2% |
| Delaware | 8 | 0.0% |
| Dominican | 44 | 0.0% |
| Dutch | 2,605 | 1.4% |
| Dutch West Indian | 68 | 0.0% |
| Eastern European | 327 | 0.2% |
| Ecuadorian | 25 | 0.0% |
| Egyptian | 215 | 0.1% |
| English | 20,590 | 10.7% |
| Estonian | 35 | 0.0% |
| Ethiopian | 66 | 0.0% |
| European | 3,499 | 1.8% |
| Filipino | 52 | 0.0% |
| Finnish | 109 | 0.1% |
| French | 2,655 | 1.4% |
| French American Indian | 21 | 0.0% |
| French Canadian | 562 | 0.3% |
| German | 18,657 | 9.7% |
| Ghanaian | 68 | 0.0% |
| Greek | 1,030 | 0.5% |
| Guamanian / Chamorro | 82 | 0.0% |
| Guatemalan | 1,630 | 0.9% |
| Guyanese | 104 | 0.1% |
| Haitian | 88 | 0.1% |
| Honduran | 560 | 0.3% |
| Hungarian | 515 | 0.3% |
| Icelander | 18 | 0.0% |
| Indian (Asian) | 865 | 0.4% |
| Indonesian | 1 | 0.0% |
| Inupiat | 9 | 0.0% |
| Iranian | 167 | 0.1% |
| Iraqi | 563 | 0.3% |
| Irish | 18,648 | 9.7% |
| Israeli | 24 | 0.0% |
| Italian | 5,118 | 2.7% |
| Jamaican | 161 | 0.1% |
| Japanese | 24 | 0.0% |
| Jordanian | 71 | 0.0% |
| Kenyan | 52 | 0.0% |
| Korean | 691 | 0.4% |
| Laotian | 70 | 0.0% |
| Latvian | 7 | 0.0% |
| Lebanese | 301 | 0.2% |
| Lithuanian | 111 | 0.1% |
| Luxembourger | 17 | 0.0% |
| Macedonian | 8 | 0.0% |
| Malaysian | 8 | 0.0% |
| Maltese | 12 | 0.0% |
| Mexican | 5,357 | 2.8% |
| Mexican American Indian | 10 | 0.0% |
| Mongolian | 87 | 0.1% |
| Native Hawaiian | 131 | 0.1% |
| Navajo | 36 | 0.0% |
| New Zealander | 35 | 0.0% |
| Nicaraguan | 77 | 0.0% |
| Nigerian | 171 | 0.1% |
| Northern European | 201 | 0.1% |
| Norwegian | 852 | 0.4% |
| Osage | 3 | 0.0% |
| Pakistani | 112 | 0.1% |
| Palestinian | 148 | 0.1% |
| Panamanian | 111 | 0.1% |
| Paraguayan | 1 | 0.0% |
| Pennsylvania German | 19 | 0.0% |
| Peruvian | 111 | 0.1% |
| Polish | 3,102 | 1.6% |
| Portuguese | 164 | 0.1% |
| Potawatomi | 22 | 0.0% |
| Puerto Rican | 934 | 0.5% |
| Romanian | 374 | 0.2% |
| Russian | 968 | 0.5% |
| Salvadoran | 379 | 0.2% |
| Samoan | 94 | 0.1% |
| Scandinavian | 247 | 0.1% |
| Scotch-Irish | 5,621 | 2.9% |
| Scottish | 4,989 | 2.6% |
| Seminole | 21 | 0.0% |
| Serbian | 16 | 0.0% |
| Sioux | 52 | 0.0% |
| Slavic | 78 | 0.0% |
| Slovak | 97 | 0.1% |
| Slovene | 33 | 0.0% |
| Somali | 34 | 0.0% |
| South African | 42 | 0.0% |
| South American | 876 | 0.5% |
| Spaniard | 146 | 0.1% |
| Spanish | 94 | 0.1% |
| Sri Lankan | 365 | 0.2% |
| Subsaharan African | 2,888 | 1.5% |
| Sudanese | 94 | 0.1% |
| Swedish | 1,051 | 0.5% |
| Swiss | 656 | 0.3% |
| Syrian | 74 | 0.0% |
| Thai | 901 | 0.5% |
| Turkish | 44 | 0.0% |
| Ukrainian | 505 | 0.3% |
| Uruguayan | 4 | 0.0% |
| Venezuelan | 82 | 0.0% |
| Vietnamese | 135 | 0.1% |
| Welsh | 1,589 | 0.8% |
| West Indian | 15 | 0.0% |
| Yugoslavian | 60 | 0.0% | View All 143 Rows |
Immigrants in Knoxville
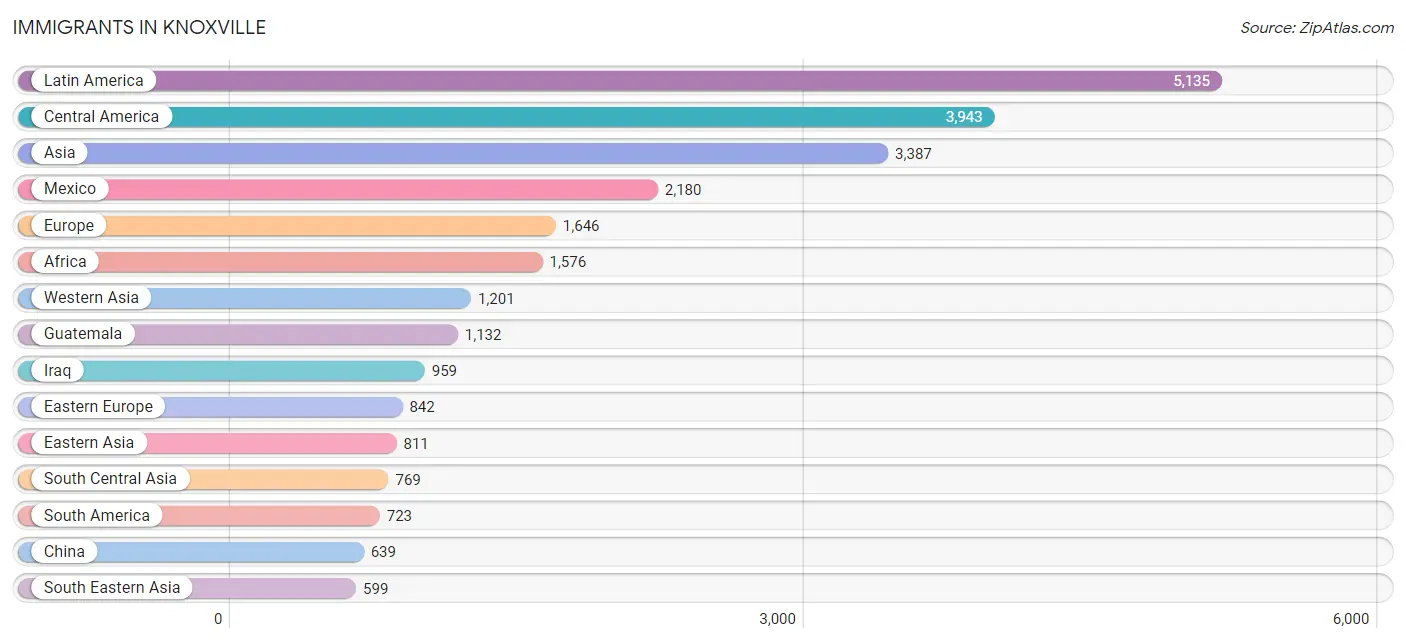
The most numerous immigrant groups reported in Knoxville came from Latin America (5,135 | 2.7%), Central America (3,943 | 2.1%), Asia (3,387 | 1.8%), Mexico (2,180 | 1.1%), and Europe (1,646 | 0.9%), together accounting for 8.5% of all Knoxville residents.
| Immigration Origin | # Population | % Population |
| Afghanistan | 37 | 0.0% |
| Africa | 1,576 | 0.8% |
| Argentina | 232 | 0.1% |
| Armenia | 19 | 0.0% |
| Asia | 3,387 | 1.8% |
| Bahamas | 7 | 0.0% |
| Bangladesh | 120 | 0.1% |
| Belize | 29 | 0.0% |
| Bolivia | 68 | 0.0% |
| Bosnia and Herzegovina | 11 | 0.0% |
| Brazil | 74 | 0.0% |
| Bulgaria | 21 | 0.0% |
| Cameroon | 94 | 0.1% |
| Canada | 249 | 0.1% |
| Caribbean | 469 | 0.2% |
| Central America | 3,943 | 2.1% |
| Chile | 5 | 0.0% |
| China | 639 | 0.3% |
| Colombia | 173 | 0.1% |
| Congo | 56 | 0.0% |
| Costa Rica | 12 | 0.0% |
| Cuba | 240 | 0.1% |
| Czechoslovakia | 16 | 0.0% |
| Denmark | 16 | 0.0% |
| Dominican Republic | 29 | 0.0% |
| Eastern Africa | 382 | 0.2% |
| Eastern Asia | 811 | 0.4% |
| Eastern Europe | 842 | 0.4% |
| Ecuador | 8 | 0.0% |
| Egypt | 56 | 0.0% |
| El Salvador | 172 | 0.1% |
| England | 99 | 0.1% |
| Ethiopia | 48 | 0.0% |
| Europe | 1,646 | 0.9% |
| France | 16 | 0.0% |
| Germany | 242 | 0.1% |
| Ghana | 52 | 0.0% |
| Greece | 207 | 0.1% |
| Guatemala | 1,132 | 0.6% |
| Guyana | 35 | 0.0% |
| Haiti | 44 | 0.0% |
| Honduras | 337 | 0.2% |
| Hong Kong | 24 | 0.0% |
| India | 324 | 0.2% |
| Indonesia | 47 | 0.0% |
| Iran | 169 | 0.1% |
| Iraq | 959 | 0.5% |
| Ireland | 5 | 0.0% |
| Israel | 51 | 0.0% |
| Italy | 52 | 0.0% |
| Jamaica | 99 | 0.1% |
| Japan | 44 | 0.0% |
| Jordan | 61 | 0.0% |
| Kazakhstan | 18 | 0.0% |
| Kenya | 40 | 0.0% |
| Korea | 128 | 0.1% |
| Kuwait | 14 | 0.0% |
| Latin America | 5,135 | 2.7% |
| Lebanon | 53 | 0.0% |
| Liberia | 36 | 0.0% |
| Malaysia | 58 | 0.0% |
| Mexico | 2,180 | 1.1% |
| Middle Africa | 340 | 0.2% |
| Moldova | 164 | 0.1% |
| Morocco | 25 | 0.0% |
| Nepal | 51 | 0.0% |
| Nicaragua | 34 | 0.0% |
| Nigeria | 80 | 0.0% |
| North Macedonia | 8 | 0.0% |
| Northern Africa | 291 | 0.2% |
| Northern Europe | 281 | 0.2% |
| Oceania | 43 | 0.0% |
| Pakistan | 9 | 0.0% |
| Panama | 47 | 0.0% |
| Peru | 45 | 0.0% |
| Philippines | 260 | 0.1% |
| Poland | 30 | 0.0% |
| Romania | 137 | 0.1% |
| Russia | 178 | 0.1% |
| Senegal | 108 | 0.1% |
| Sierra Leone | 16 | 0.0% |
| Somalia | 18 | 0.0% |
| South Africa | 121 | 0.1% |
| South America | 723 | 0.4% |
| South Central Asia | 769 | 0.4% |
| South Eastern Asia | 599 | 0.3% |
| Southern Europe | 259 | 0.1% |
| Sri Lanka | 35 | 0.0% |
| Sudan | 94 | 0.1% |
| Taiwan | 108 | 0.1% |
| Thailand | 80 | 0.0% |
| Trinidad and Tobago | 11 | 0.0% |
| Turkey | 44 | 0.0% |
| Uganda | 14 | 0.0% |
| Ukraine | 160 | 0.1% |
| Uruguay | 4 | 0.0% |
| Uzbekistan | 6 | 0.0% |
| Venezuela | 79 | 0.0% |
| Vietnam | 153 | 0.1% |
| West Indies | 38 | 0.0% |
| Western Africa | 372 | 0.2% |
| Western Asia | 1,201 | 0.6% |
| Western Europe | 264 | 0.1% |
| Zaire | 190 | 0.1% | View All 104 Rows |
Sex and Age in Knoxville
Sex and Age in Knoxville
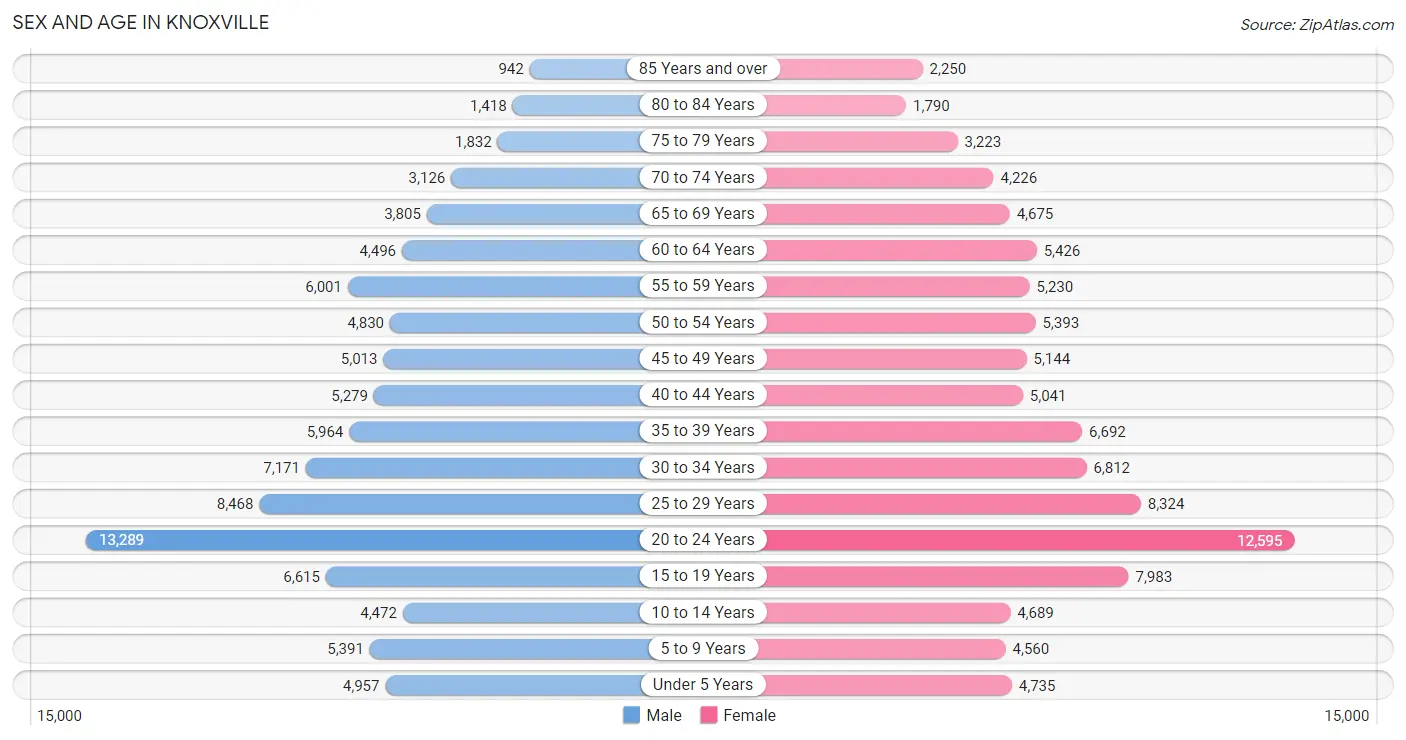
The most populous age groups in Knoxville are 20 to 24 Years (13,289 | 14.3%) for men and 20 to 24 Years (12,595 | 12.8%) for women.
| Age Bracket | Male | Female |
| Under 5 Years | 4,957 (5.3%) | 4,735 (4.8%) |
| 5 to 9 Years | 5,391 (5.8%) | 4,560 (4.6%) |
| 10 to 14 Years | 4,472 (4.8%) | 4,689 (4.8%) |
| 15 to 19 Years | 6,615 (7.1%) | 7,983 (8.1%) |
| 20 to 24 Years | 13,289 (14.3%) | 12,595 (12.8%) |
| 25 to 29 Years | 8,468 (9.1%) | 8,324 (8.4%) |
| 30 to 34 Years | 7,171 (7.7%) | 6,812 (6.9%) |
| 35 to 39 Years | 5,964 (6.4%) | 6,692 (6.8%) |
| 40 to 44 Years | 5,279 (5.7%) | 5,041 (5.1%) |
| 45 to 49 Years | 5,013 (5.4%) | 5,144 (5.2%) |
| 50 to 54 Years | 4,830 (5.2%) | 5,393 (5.5%) |
| 55 to 59 Years | 6,001 (6.5%) | 5,230 (5.3%) |
| 60 to 64 Years | 4,496 (4.8%) | 5,426 (5.5%) |
| 65 to 69 Years | 3,805 (4.1%) | 4,675 (4.7%) |
| 70 to 74 Years | 3,126 (3.4%) | 4,226 (4.3%) |
| 75 to 79 Years | 1,832 (2.0%) | 3,223 (3.3%) |
| 80 to 84 Years | 1,418 (1.5%) | 1,790 (1.8%) |
| 85 Years and over | 942 (1.0%) | 2,250 (2.3%) |
| Total | 93,069 (100.0%) | 98,788 (100.0%) |
Families and Households in Knoxville
Median Family Size in Knoxville
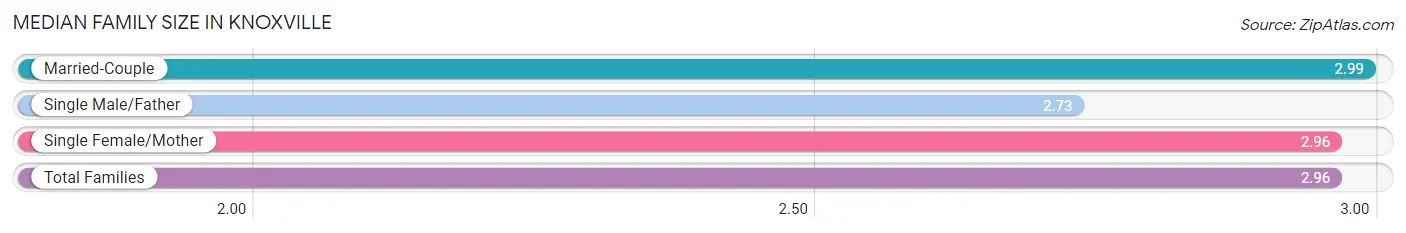
The median family size in Knoxville is 2.96 persons per family, with married-couple families (25,310 | 63.9%) accounting for the largest median family size of 2.99 persons per family. On the other hand, single male/father families (3,312 | 8.4%) represent the smallest median family size with 2.73 persons per family.
| Family Type | # Families | Family Size |
| Married-Couple | 25,310 (63.9%) | 2.99 |
| Single Male/Father | 3,312 (8.4%) | 2.73 |
| Single Female/Mother | 10,994 (27.8%) | 2.96 |
| Total Families | 39,616 (100.0%) | 2.96 |
Median Household Size in Knoxville
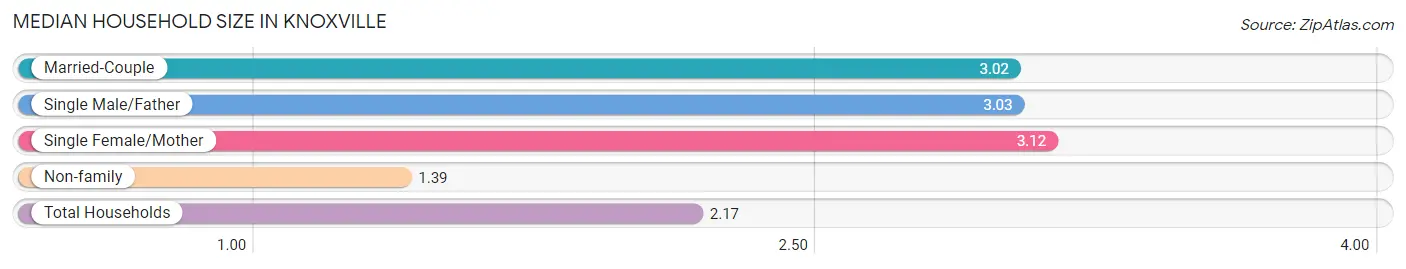
The median household size in Knoxville is 2.17 persons per household, with single female/mother households (10,994 | 13.1%) accounting for the largest median household size of 3.12 persons per household. non-family households (44,579 | 52.9%) represent the smallest median household size with 1.39 persons per household.
| Household Type | # Households | Household Size |
| Married-Couple | 25,310 (30.1%) | 3.02 |
| Single Male/Father | 3,312 (3.9%) | 3.03 |
| Single Female/Mother | 10,994 (13.1%) | 3.12 |
| Non-family | 44,579 (52.9%) | 1.39 |
| Total Households | 84,195 (100.0%) | 2.17 |
Household Size by Marriage Status in Knoxville
Out of a total of 84,195 households in Knoxville, 39,616 (47.0%) are family households, while 44,579 (52.9%) are nonfamily households. The most numerous type of family households are 2-person households, comprising 19,559, and the most common type of nonfamily households are 1-person households, comprising 34,254.
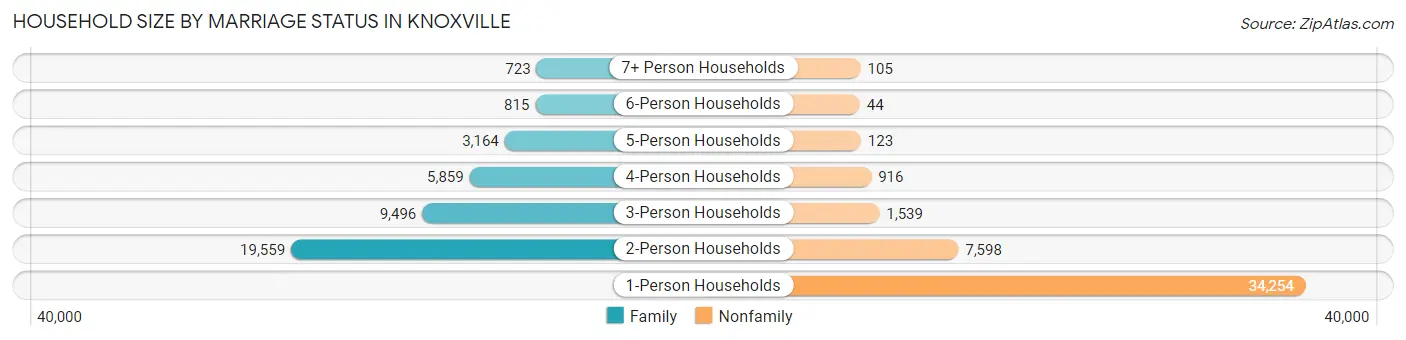
| Household Size | Family Households | Nonfamily Households |
| 1-Person Households | - | 34,254 (40.7%) |
| 2-Person Households | 19,559 (23.2%) | 7,598 (9.0%) |
| 3-Person Households | 9,496 (11.3%) | 1,539 (1.8%) |
| 4-Person Households | 5,859 (7.0%) | 916 (1.1%) |
| 5-Person Households | 3,164 (3.8%) | 123 (0.2%) |
| 6-Person Households | 815 (1.0%) | 44 (0.1%) |
| 7+ Person Households | 723 (0.9%) | 105 (0.1%) |
| Total | 39,616 (47.0%) | 44,579 (52.9%) |
Female Fertility in Knoxville
Fertility by Age in Knoxville
Average fertility rate in Knoxville is 36.0 births per 1,000 women. Women in the age bracket of 20 to 34 years have the highest fertility rate with 52.0 births per 1,000 women. Women in the age bracket of 20 to 34 years acount for 74.4% of all women with births.
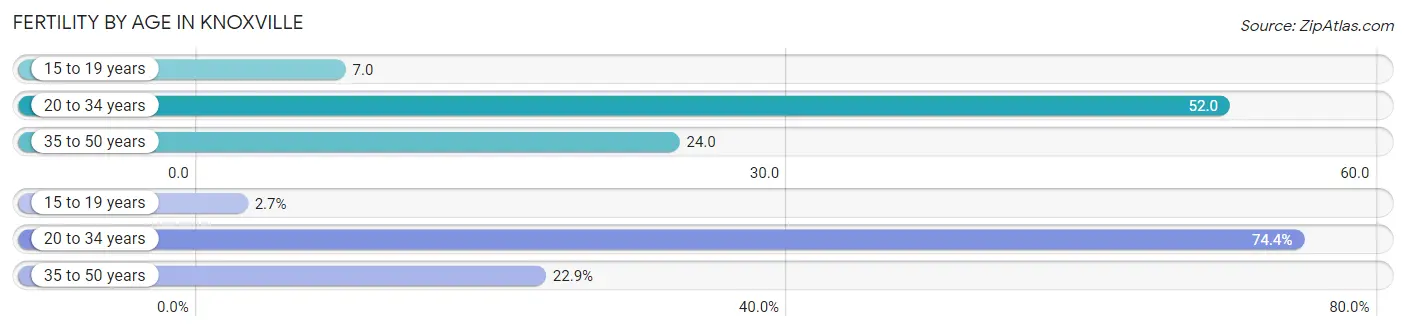
| Age Bracket | Women with Births | Births / 1,000 Women |
| 15 to 19 years | 52 (2.7%) | 7.0 |
| 20 to 34 years | 1,437 (74.4%) | 52.0 |
| 35 to 50 years | 443 (22.9%) | 24.0 |
| Total | 1,932 (100.0%) | 36.0 |
Fertility by Age by Marriage Status in Knoxville
63.6% of women with births (1,932) in Knoxville are married. The highest percentage of unmarried women with births falls into 15 to 19 years age bracket with 100.0% of them unmarried at the time of birth, while the lowest percentage of unmarried women with births belong to 35 to 50 years age bracket with 7.7% of them unmarried.
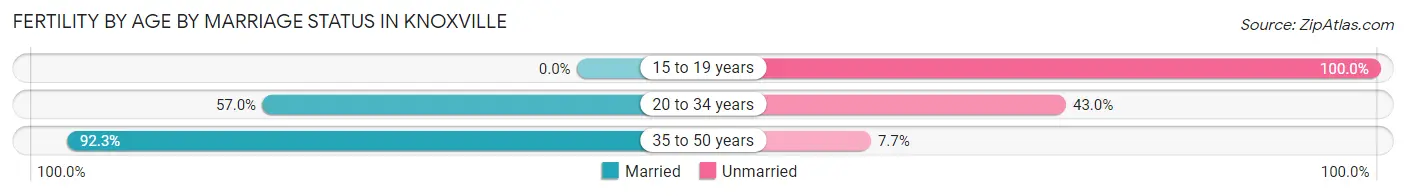
| Age Bracket | Married | Unmarried |
| 15 to 19 years | 0 (0.0%) | 52 (100.0%) |
| 20 to 34 years | 819 (57.0%) | 618 (43.0%) |
| 35 to 50 years | 409 (92.3%) | 34 (7.7%) |
| Total | 1,229 (63.6%) | 703 (36.4%) |
Fertility by Education in Knoxville
Average fertility rate in Knoxville is 36.0 births per 1,000 women. Women with the education attainment of graduate degree have the highest fertility rate of 64.0 births per 1,000 women, while women with the education attainment of less than high school have the lowest fertility at 25.0 births per 1,000 women. Women with the education attainment of college or associate's degree represent 30.8% of all women with births.
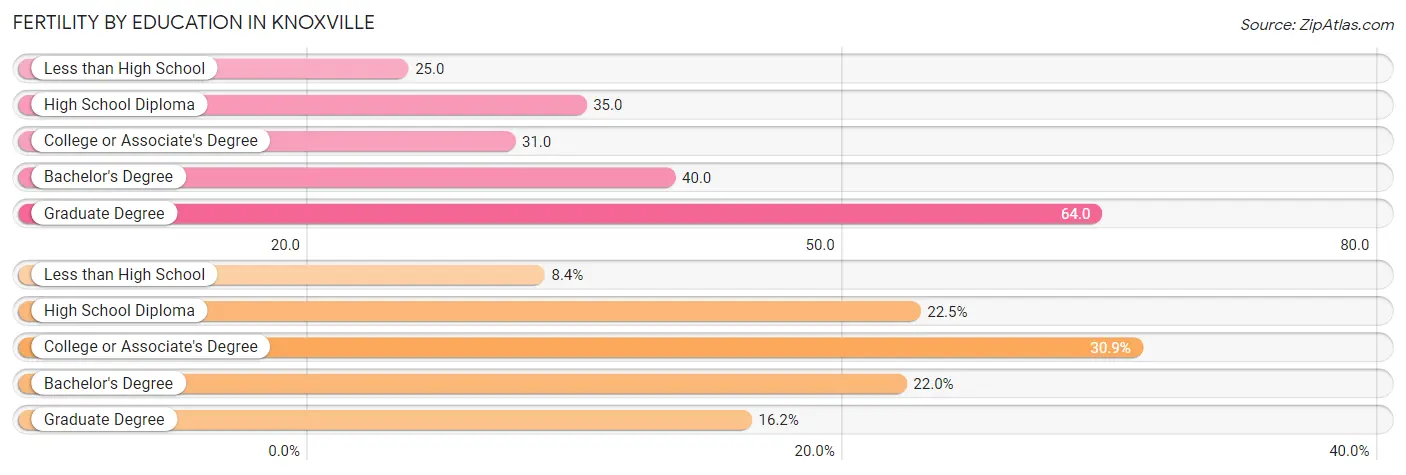
| Educational Attainment | Women with Births | Births / 1,000 Women |
| Less than High School | 163 (8.4%) | 25.0 |
| High School Diploma | 435 (22.5%) | 35.0 |
| College or Associate's Degree | 596 (30.8%) | 31.0 |
| Bachelor's Degree | 425 (22.0%) | 40.0 |
| Graduate Degree | 313 (16.2%) | 64.0 |
| Total | 1,932 (100.0%) | 36.0 |
Fertility by Education by Marriage Status in Knoxville
36.4% of women with births in Knoxville are unmarried. Women with the educational attainment of bachelor's degree are most likely to be married with 92.2% of them married at childbirth, while women with the educational attainment of high school diploma are least likely to be married with 69.2% of them unmarried at childbirth.
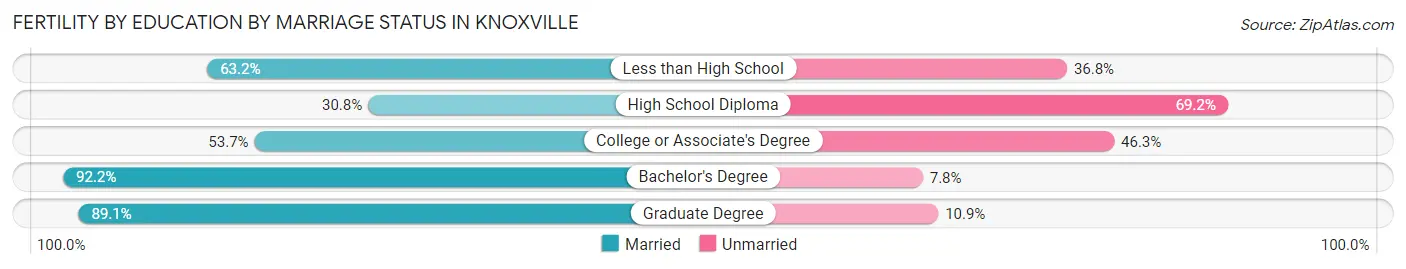
| Educational Attainment | Married | Unmarried |
| Less than High School | 103 (63.2%) | 60 (36.8%) |
| High School Diploma | 134 (30.8%) | 301 (69.2%) |
| College or Associate's Degree | 320 (53.7%) | 276 (46.3%) |
| Bachelor's Degree | 392 (92.2%) | 33 (7.8%) |
| Graduate Degree | 279 (89.1%) | 34 (10.9%) |
| Total | 1,229 (63.6%) | 703 (36.4%) |
Employment Characteristics in Knoxville
Employment by Class of Employer in Knoxville
Among the 95,251 employed individuals in Knoxville, private company employees (66,788 | 70.1%), not-for-profit organizations (8,272 | 8.7%), and state government employees (7,281 | 7.6%) make up the most common classes of employment.
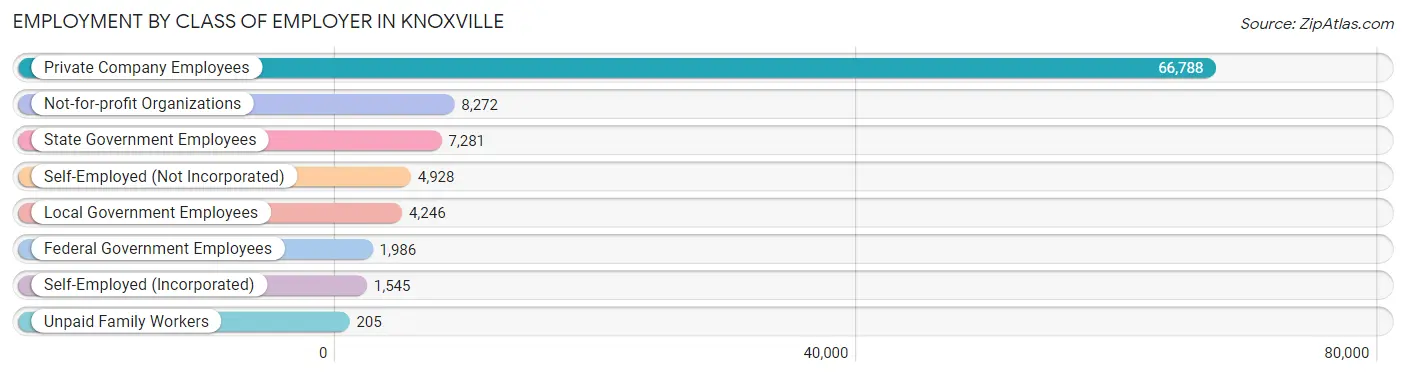
| Employer Class | # Employees | % Employees |
| Private Company Employees | 66,788 | 70.1% |
| Self-Employed (Incorporated) | 1,545 | 1.6% |
| Self-Employed (Not Incorporated) | 4,928 | 5.2% |
| Not-for-profit Organizations | 8,272 | 8.7% |
| Local Government Employees | 4,246 | 4.5% |
| State Government Employees | 7,281 | 7.6% |
| Federal Government Employees | 1,986 | 2.1% |
| Unpaid Family Workers | 205 | 0.2% |
| Total | 95,251 | 100.0% |
Employment Status by Age in Knoxville
According to the labor force statistics for Knoxville, out of the total population over 16 years of age (161,066), 63.4% or 102,116 individuals are in the labor force, with 4.8% or 4,902 of them unemployed. The age group with the highest labor force participation rate is 25 to 29 years, with 87.1% or 14,626 individuals in the labor force. Within the labor force, the 16 to 19 years age range has the highest percentage of unemployed individuals, with 11.7% or 601 of them being unemployed.
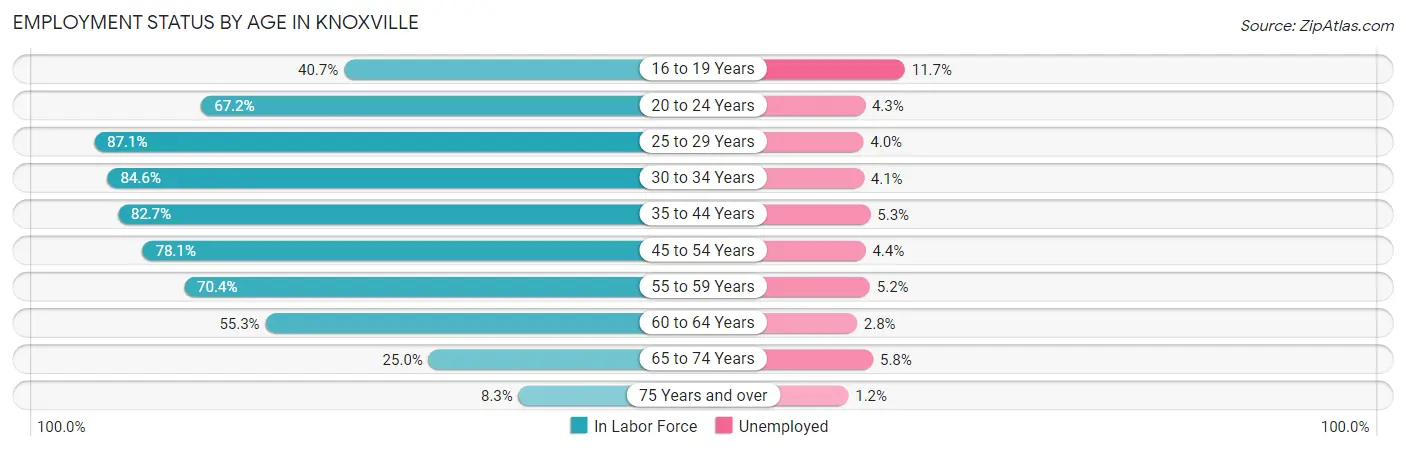
| Age Bracket | In Labor Force | Unemployed |
| 16 to 19 Years | 5,133 (40.7%) | 601 (11.7%) |
| 20 to 24 Years | 17,394 (67.2%) | 748 (4.3%) |
| 25 to 29 Years | 14,626 (87.1%) | 585 (4.0%) |
| 30 to 34 Years | 11,830 (84.6%) | 485 (4.1%) |
| 35 to 44 Years | 19,001 (82.7%) | 1,007 (5.3%) |
| 45 to 54 Years | 15,917 (78.1%) | 700 (4.4%) |
| 55 to 59 Years | 7,907 (70.4%) | 411 (5.2%) |
| 60 to 64 Years | 5,487 (55.3%) | 154 (2.8%) |
| 65 to 74 Years | 3,958 (25.0%) | 230 (5.8%) |
| 75 Years and over | 951 (8.3%) | 11 (1.2%) |
| Total | 102,116 (63.4%) | 4,902 (4.8%) |
Employment Status by Educational Attainment in Knoxville
According to labor force statistics for Knoxville, 78.5% of individuals (74,798) out of the total population between 25 and 64 years of age (95,284) are in the labor force, with 4.5% or 3,366 of them being unemployed. The group with the highest labor force participation rate are those with the educational attainment of bachelor's degree or higher, with 89.1% or 28,902 individuals in the labor force. Within the labor force, individuals with less than high school education have the highest percentage of unemployment, with 7.5% or 386 of them being unemployed.
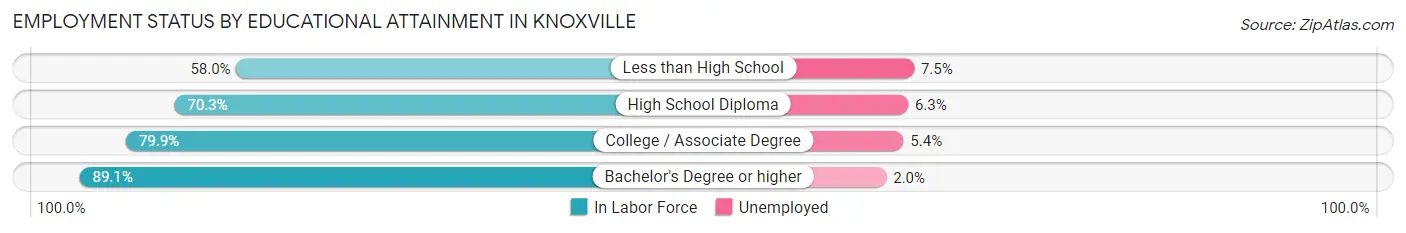
| Educational Attainment | In Labor Force | Unemployed |
| Less than High School | 5,142 (58.0%) | 665 (7.5%) |
| High School Diploma | 17,724 (70.3%) | 1,588 (6.3%) |
| College / Associate Degree | 22,986 (79.9%) | 1,553 (5.4%) |
| Bachelor's Degree or higher | 28,902 (89.1%) | 649 (2.0%) |
| Total | 74,798 (78.5%) | 4,288 (4.5%) |
Employment Occupations by Sex in Knoxville
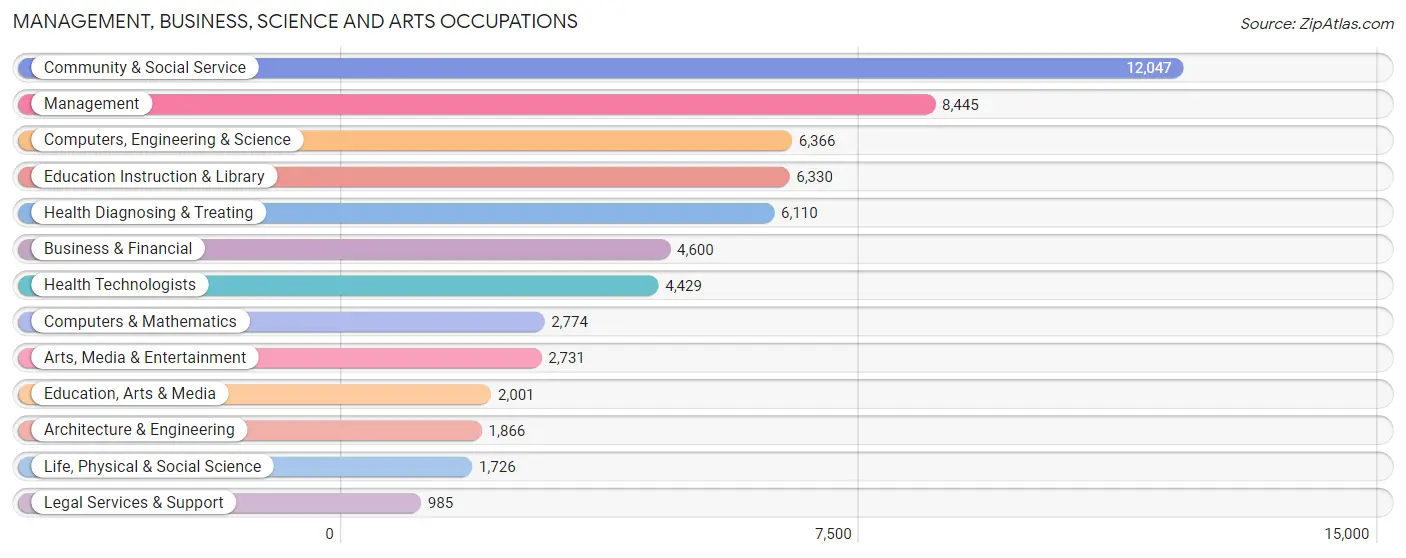
Management, Business, Science and Arts Occupations
The most common Management, Business, Science and Arts occupations in Knoxville are Community & Social Service (12,047 | 12.4%), Management (8,445 | 8.7%), Computers, Engineering & Science (6,366 | 6.6%), Education Instruction & Library (6,330 | 6.5%), and Health Diagnosing & Treating (6,110 | 6.3%).
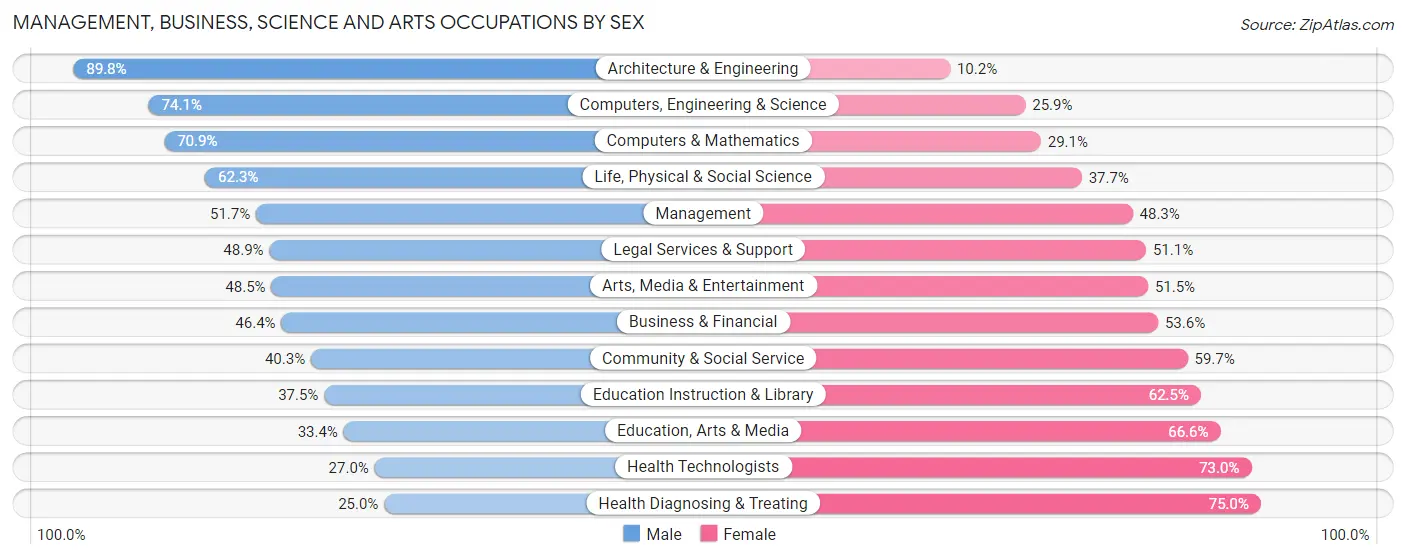
Management, Business, Science and Arts Occupations by Sex
Within the Management, Business, Science and Arts occupations in Knoxville, the most male-oriented occupations are Architecture & Engineering (89.8%), Computers, Engineering & Science (74.1%), and Computers & Mathematics (70.9%), while the most female-oriented occupations are Health Diagnosing & Treating (75.0%), Health Technologists (73.0%), and Education, Arts & Media (66.6%).
| Occupation | Male | Female |
| Management | 4,368 (51.7%) | 4,077 (48.3%) |
| Business & Financial | 2,136 (46.4%) | 2,464 (53.6%) |
| Computers, Engineering & Science | 4,718 (74.1%) | 1,648 (25.9%) |
| Computers & Mathematics | 1,966 (70.9%) | 808 (29.1%) |
| Architecture & Engineering | 1,676 (89.8%) | 190 (10.2%) |
| Life, Physical & Social Science | 1,076 (62.3%) | 650 (37.7%) |
| Community & Social Service | 4,850 (40.3%) | 7,197 (59.7%) |
| Education, Arts & Media | 669 (33.4%) | 1,332 (66.6%) |
| Legal Services & Support | 482 (48.9%) | 503 (51.1%) |
| Education Instruction & Library | 2,374 (37.5%) | 3,956 (62.5%) |
| Arts, Media & Entertainment | 1,325 (48.5%) | 1,406 (51.5%) |
| Health Diagnosing & Treating | 1,527 (25.0%) | 4,583 (75.0%) |
| Health Technologists | 1,195 (27.0%) | 3,234 (73.0%) |
| Total (Category) | 17,599 (46.9%) | 19,969 (53.1%) |
| Total (Overall) | 49,692 (51.1%) | 47,496 (48.9%) |
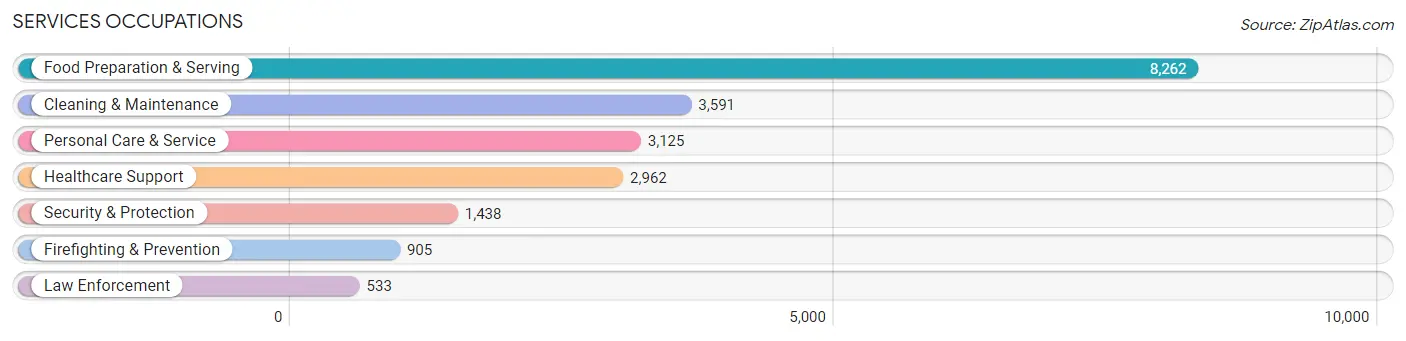
Services Occupations
The most common Services occupations in Knoxville are Food Preparation & Serving (8,262 | 8.5%), Cleaning & Maintenance (3,591 | 3.7%), Personal Care & Service (3,125 | 3.2%), Healthcare Support (2,962 | 3.0%), and Security & Protection (1,438 | 1.5%).
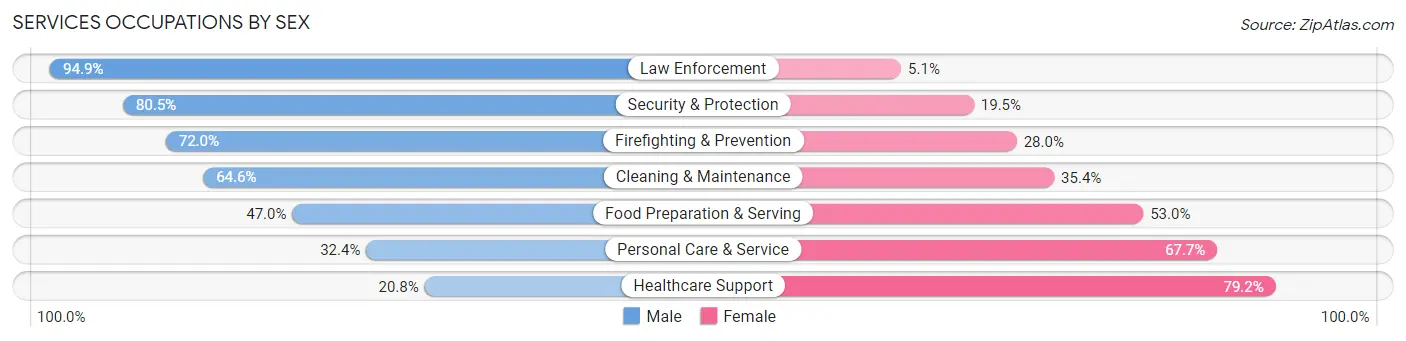
Services Occupations by Sex
Within the Services occupations in Knoxville, the most male-oriented occupations are Law Enforcement (94.9%), Security & Protection (80.5%), and Firefighting & Prevention (72.0%), while the most female-oriented occupations are Healthcare Support (79.2%), Personal Care & Service (67.6%), and Food Preparation & Serving (53.0%).
| Occupation | Male | Female |
| Healthcare Support | 616 (20.8%) | 2,346 (79.2%) |
| Security & Protection | 1,158 (80.5%) | 280 (19.5%) |
| Firefighting & Prevention | 652 (72.0%) | 253 (28.0%) |
| Law Enforcement | 506 (94.9%) | 27 (5.1%) |
| Food Preparation & Serving | 3,882 (47.0%) | 4,380 (53.0%) |
| Cleaning & Maintenance | 2,321 (64.6%) | 1,270 (35.4%) |
| Personal Care & Service | 1,011 (32.4%) | 2,114 (67.6%) |
| Total (Category) | 8,988 (46.4%) | 10,390 (53.6%) |
| Total (Overall) | 49,692 (51.1%) | 47,496 (48.9%) |
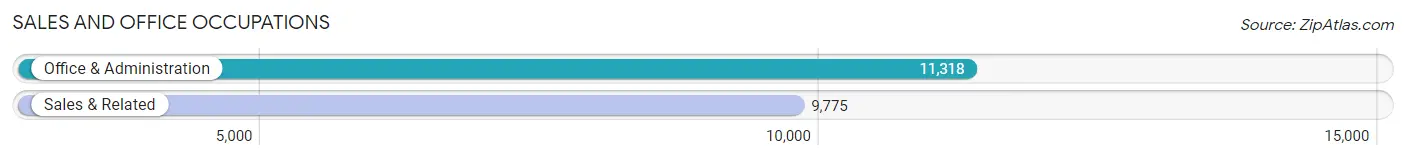
Sales and Office Occupations
The most common Sales and Office occupations in Knoxville are Office & Administration (11,318 | 11.7%), and Sales & Related (9,775 | 10.1%).
Sales and Office Occupations by Sex
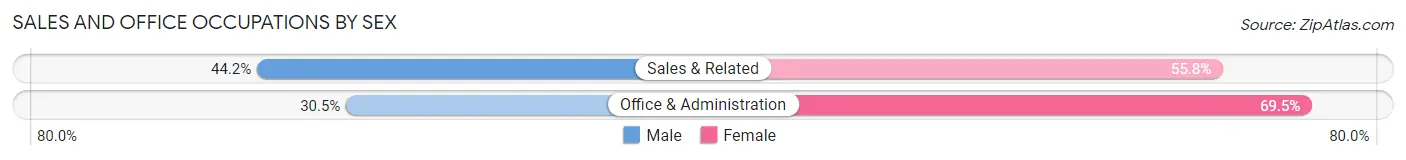
| Occupation | Male | Female |
| Sales & Related | 4,324 (44.2%) | 5,451 (55.8%) |
| Office & Administration | 3,454 (30.5%) | 7,864 (69.5%) |
| Total (Category) | 7,778 (36.9%) | 13,315 (63.1%) |
| Total (Overall) | 49,692 (51.1%) | 47,496 (48.9%) |
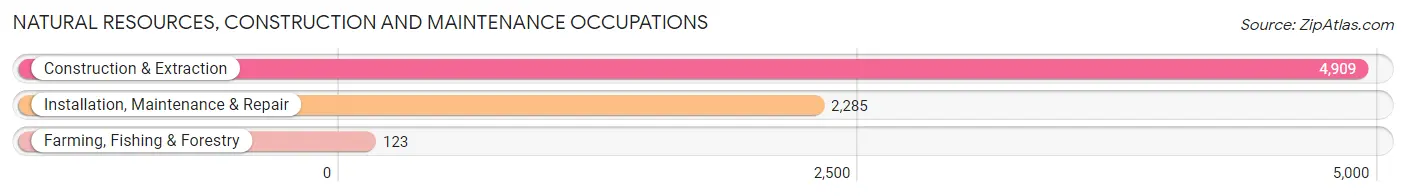
Natural Resources, Construction and Maintenance Occupations
The most common Natural Resources, Construction and Maintenance occupations in Knoxville are Construction & Extraction (4,909 | 5.1%), Installation, Maintenance & Repair (2,285 | 2.4%), and Farming, Fishing & Forestry (123 | 0.1%).
Natural Resources, Construction and Maintenance Occupations by Sex
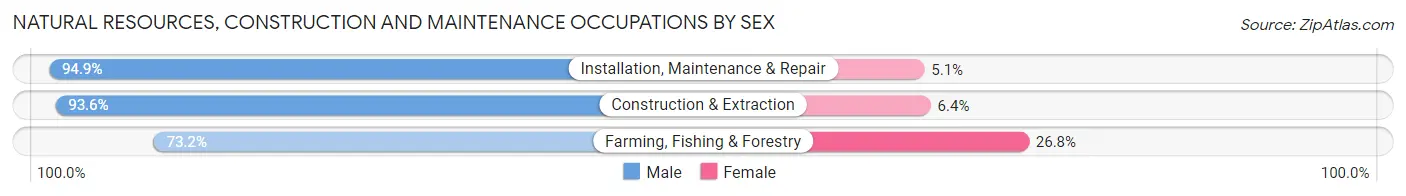
| Occupation | Male | Female |
| Farming, Fishing & Forestry | 90 (73.2%) | 33 (26.8%) |
| Construction & Extraction | 4,595 (93.6%) | 314 (6.4%) |
| Installation, Maintenance & Repair | 2,169 (94.9%) | 116 (5.1%) |
| Total (Category) | 6,854 (93.7%) | 463 (6.3%) |
| Total (Overall) | 49,692 (51.1%) | 47,496 (48.9%) |
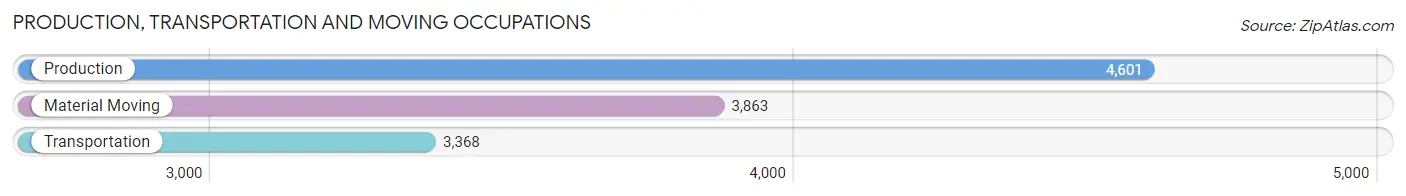
Production, Transportation and Moving Occupations
The most common Production, Transportation and Moving occupations in Knoxville are Production (4,601 | 4.7%), Material Moving (3,863 | 4.0%), and Transportation (3,368 | 3.5%).
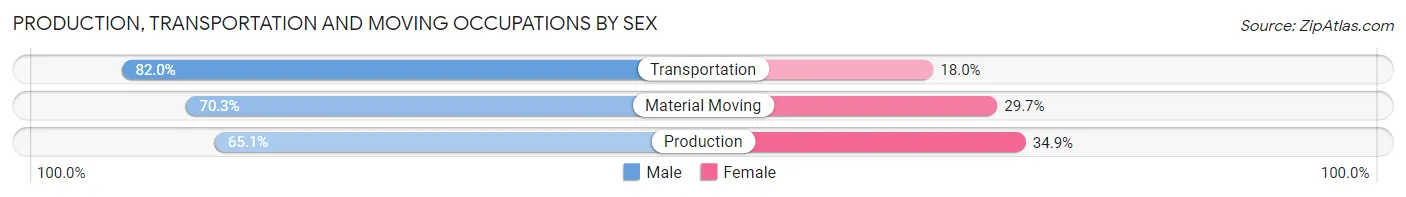
Production, Transportation and Moving Occupations by Sex
| Occupation | Male | Female |
| Production | 2,994 (65.1%) | 1,607 (34.9%) |
| Transportation | 2,763 (82.0%) | 605 (18.0%) |
| Material Moving | 2,716 (70.3%) | 1,147 (29.7%) |
| Total (Category) | 8,473 (71.6%) | 3,359 (28.4%) |
| Total (Overall) | 49,692 (51.1%) | 47,496 (48.9%) |
Employment Industries by Sex in Knoxville
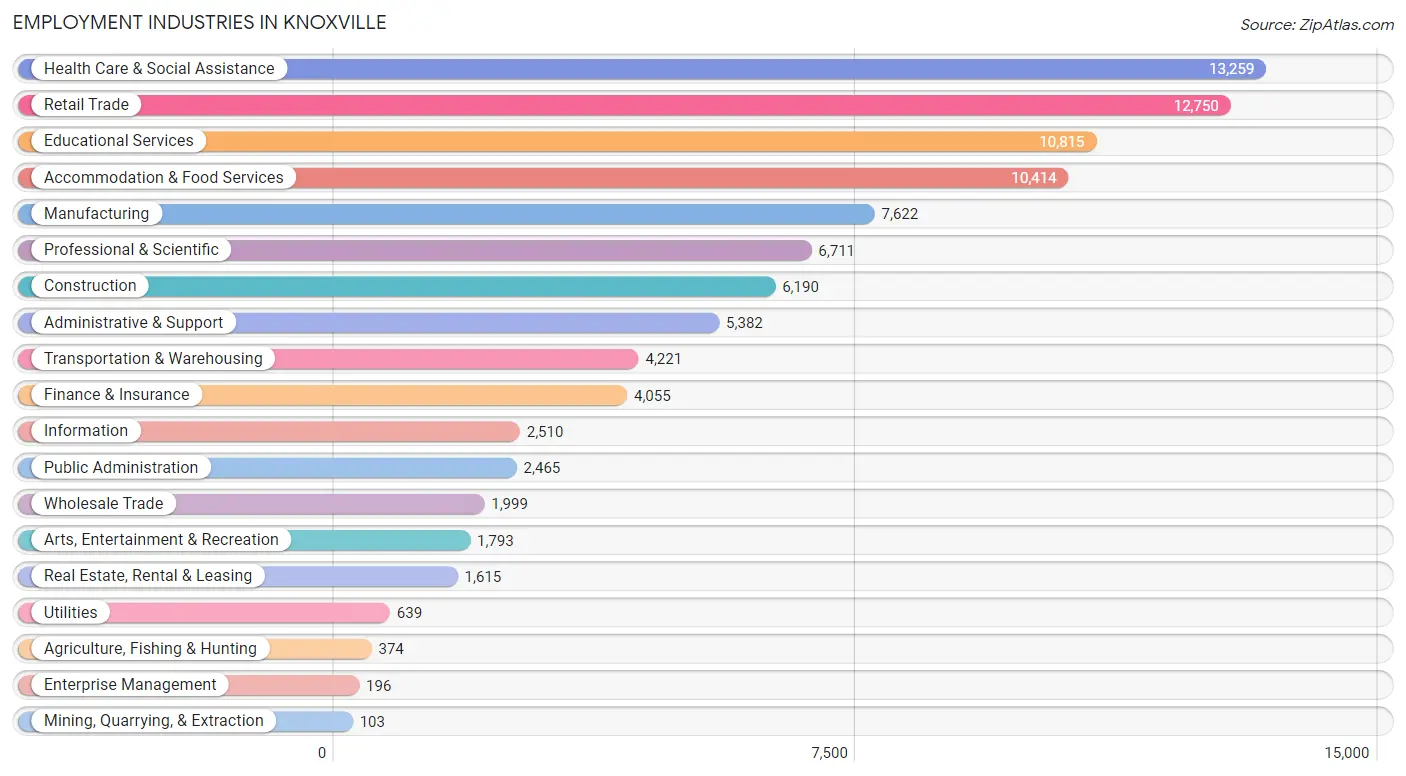
Employment Industries in Knoxville
The major employment industries in Knoxville include Health Care & Social Assistance (13,259 | 13.6%), Retail Trade (12,750 | 13.1%), Educational Services (10,815 | 11.1%), Accommodation & Food Services (10,414 | 10.7%), and Manufacturing (7,622 | 7.8%).
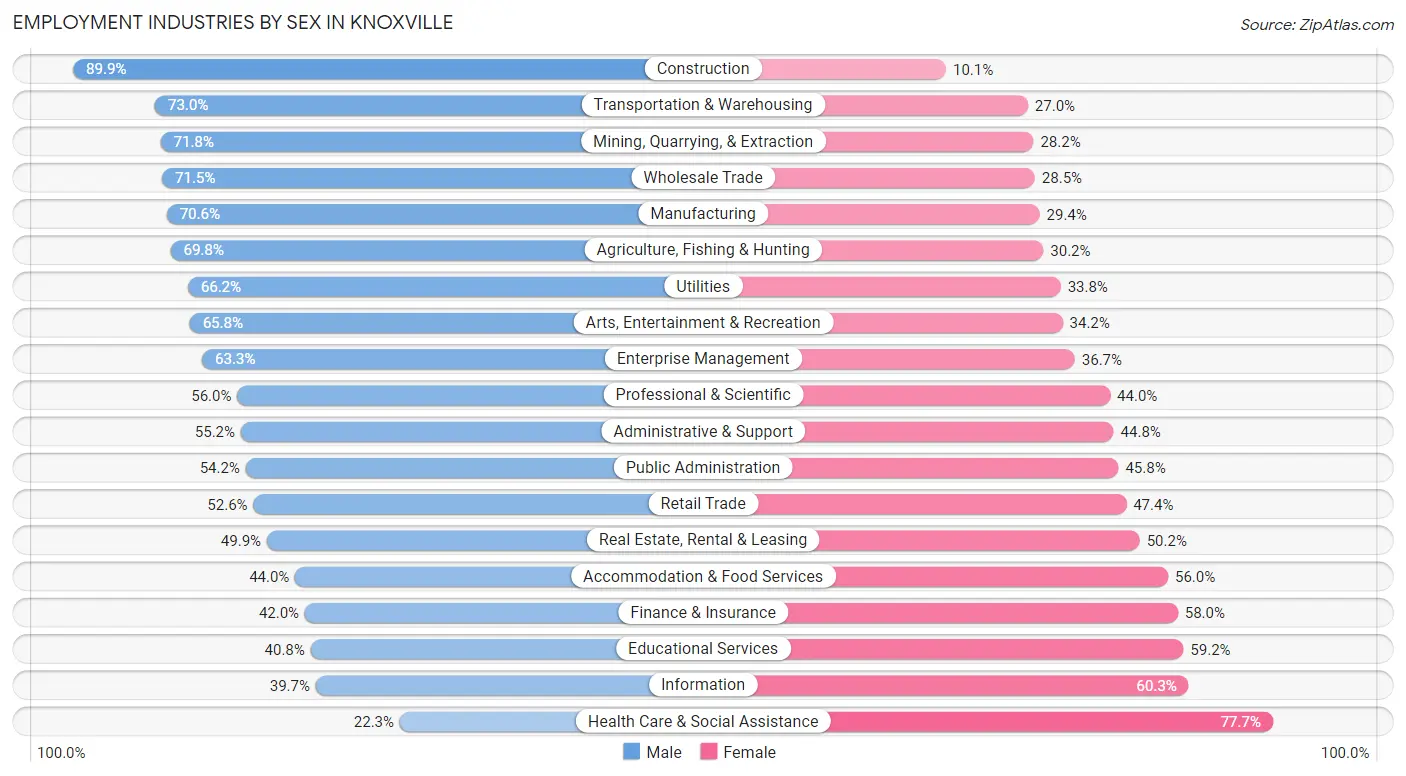
Employment Industries by Sex in Knoxville
The Knoxville industries that see more men than women are Construction (89.9%), Transportation & Warehousing (73.0%), and Mining, Quarrying, & Extraction (71.8%), whereas the industries that tend to have a higher number of women are Health Care & Social Assistance (77.7%), Information (60.3%), and Educational Services (59.2%).
| Industry | Male | Female |
| Agriculture, Fishing & Hunting | 261 (69.8%) | 113 (30.2%) |
| Mining, Quarrying, & Extraction | 74 (71.8%) | 29 (28.2%) |
| Construction | 5,567 (89.9%) | 623 (10.1%) |
| Manufacturing | 5,379 (70.6%) | 2,243 (29.4%) |
| Wholesale Trade | 1,430 (71.5%) | 569 (28.5%) |
| Retail Trade | 6,711 (52.6%) | 6,039 (47.4%) |
| Transportation & Warehousing | 3,081 (73.0%) | 1,140 (27.0%) |
| Utilities | 423 (66.2%) | 216 (33.8%) |
| Information | 997 (39.7%) | 1,513 (60.3%) |
| Finance & Insurance | 1,702 (42.0%) | 2,353 (58.0%) |
| Real Estate, Rental & Leasing | 805 (49.8%) | 810 (50.1%) |
| Professional & Scientific | 3,756 (56.0%) | 2,955 (44.0%) |
| Enterprise Management | 124 (63.3%) | 72 (36.7%) |
| Administrative & Support | 2,973 (55.2%) | 2,409 (44.8%) |
| Educational Services | 4,412 (40.8%) | 6,403 (59.2%) |
| Health Care & Social Assistance | 2,959 (22.3%) | 10,300 (77.7%) |
| Arts, Entertainment & Recreation | 1,180 (65.8%) | 613 (34.2%) |
| Accommodation & Food Services | 4,581 (44.0%) | 5,833 (56.0%) |
| Public Administration | 1,337 (54.2%) | 1,128 (45.8%) |
| Total | 49,692 (51.1%) | 47,496 (48.9%) |
Education in Knoxville
School Enrollment in Knoxville
The most common levels of schooling among the 54,254 students in Knoxville are college / undergraduate (22,770 | 42.0%), high school (7,873 | 14.5%), and elementary school (7,817 | 14.4%).
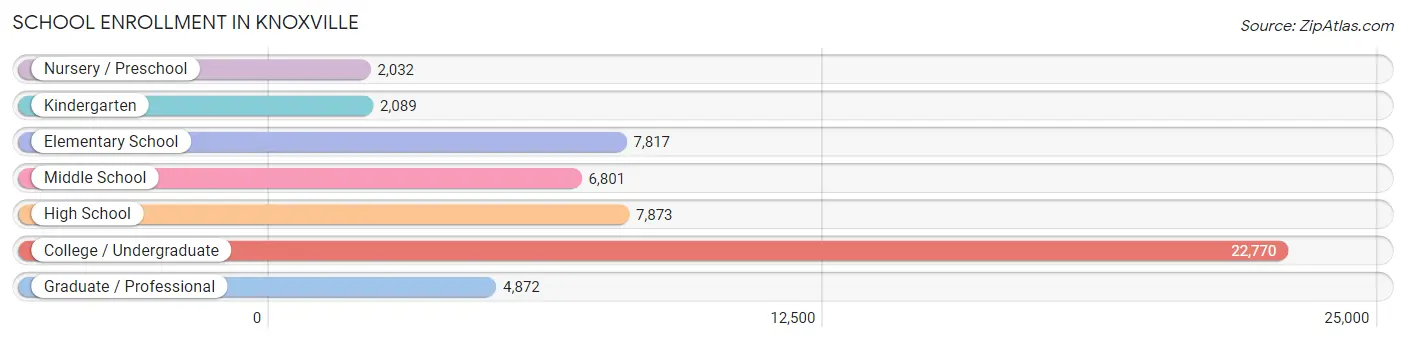
| School Level | # Students | % Students |
| Nursery / Preschool | 2,032 | 3.7% |
| Kindergarten | 2,089 | 3.8% |
| Elementary School | 7,817 | 14.4% |
| Middle School | 6,801 | 12.5% |
| High School | 7,873 | 14.5% |
| College / Undergraduate | 22,770 | 42.0% |
| Graduate / Professional | 4,872 | 9.0% |
| Total | 54,254 | 100.0% |
School Enrollment by Age by Funding Source in Knoxville
Out of a total of 54,254 students who are enrolled in schools in Knoxville, 6,076 (11.2%) attend a private institution, while the remaining 48,178 (88.8%) are enrolled in public schools. The age group of 3 to 4 year olds has the highest likelihood of being enrolled in private schools, with 738 (47.5% in the age bracket) enrolled. Conversely, the age group of 18 to 19 year olds has the lowest likelihood of being enrolled in a private school, with 6,803 (95.4% in the age bracket) attending a public institution.
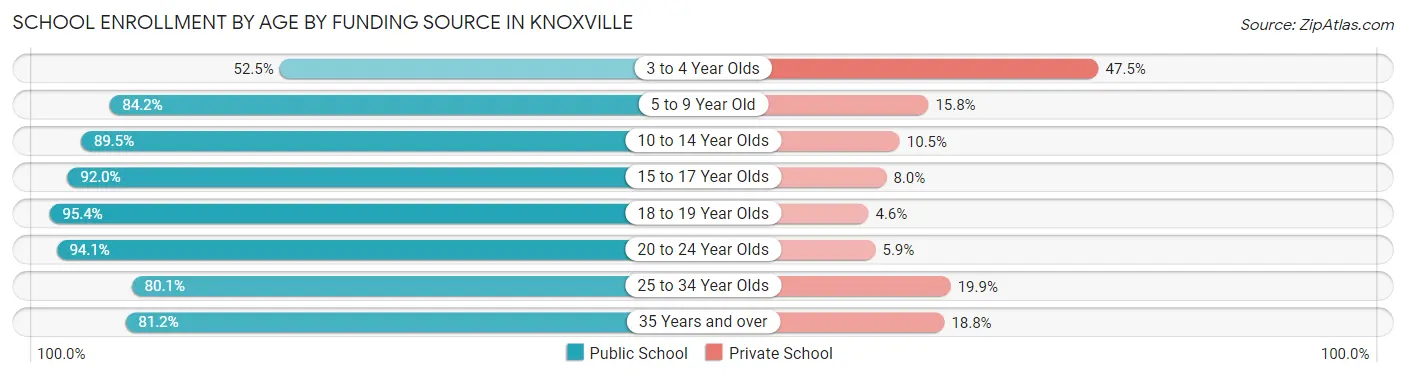
| Age Bracket | Public School | Private School |
| 3 to 4 Year Olds | 816 (52.5%) | 738 (47.5%) |
| 5 to 9 Year Old | 7,921 (84.2%) | 1,485 (15.8%) |
| 10 to 14 Year Olds | 7,951 (89.5%) | 930 (10.5%) |
| 15 to 17 Year Olds | 5,484 (92.0%) | 475 (8.0%) |
| 18 to 19 Year Olds | 6,803 (95.4%) | 330 (4.6%) |
| 20 to 24 Year Olds | 14,098 (94.1%) | 891 (5.9%) |
| 25 to 34 Year Olds | 3,461 (80.1%) | 862 (19.9%) |
| 35 Years and over | 1,632 (81.2%) | 377 (18.8%) |
| Total | 48,178 (88.8%) | 6,076 (11.2%) |
Educational Attainment by Field of Study in Knoxville
Business (6,987 | 15.7%), science & technology (4,606 | 10.3%), education (4,372 | 9.8%), social sciences (3,615 | 8.1%), and bio, nature & agricultural (3,327 | 7.5%) are the most common fields of study among 44,531 individuals in Knoxville who have obtained a bachelor's degree or higher.
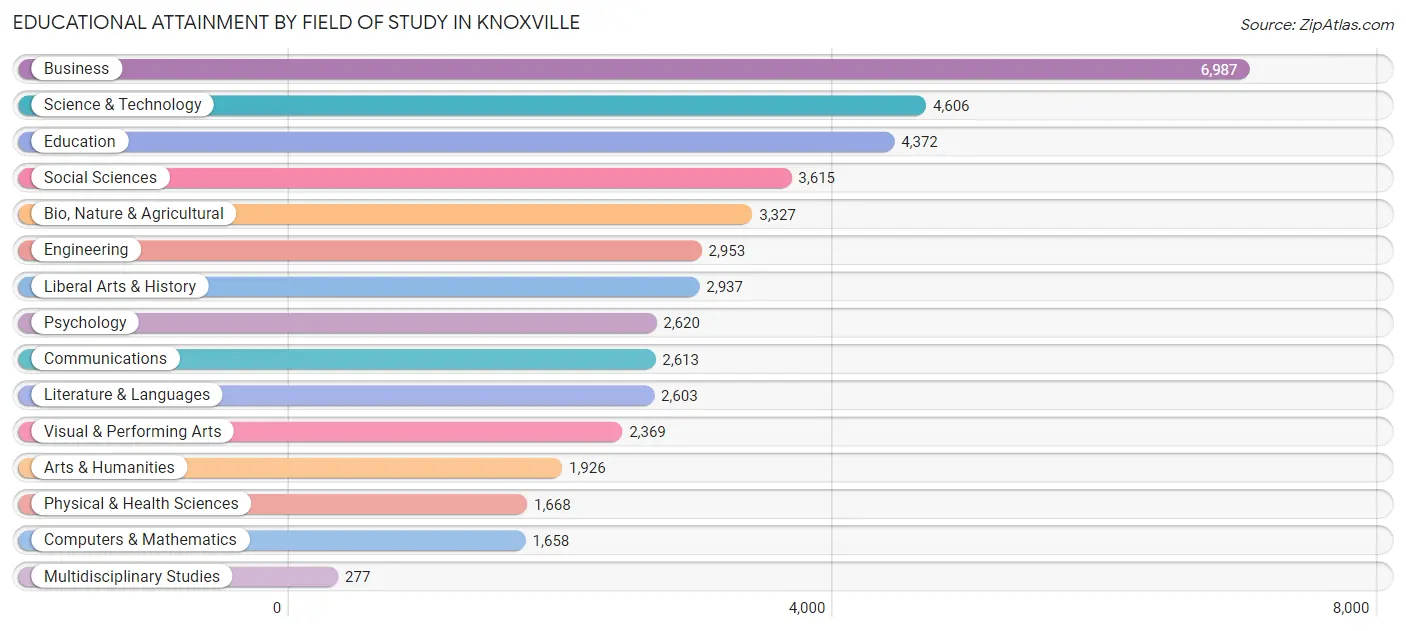
| Field of Study | # Graduates | % Graduates |
| Computers & Mathematics | 1,658 | 3.7% |
| Bio, Nature & Agricultural | 3,327 | 7.5% |
| Physical & Health Sciences | 1,668 | 3.7% |
| Psychology | 2,620 | 5.9% |
| Social Sciences | 3,615 | 8.1% |
| Engineering | 2,953 | 6.6% |
| Multidisciplinary Studies | 277 | 0.6% |
| Science & Technology | 4,606 | 10.3% |
| Business | 6,987 | 15.7% |
| Education | 4,372 | 9.8% |
| Literature & Languages | 2,603 | 5.9% |
| Liberal Arts & History | 2,937 | 6.6% |
| Visual & Performing Arts | 2,369 | 5.3% |
| Communications | 2,613 | 5.9% |
| Arts & Humanities | 1,926 | 4.3% |
| Total | 44,531 | 100.0% |
Transportation & Commute in Knoxville
Vehicle Availability by Sex in Knoxville
The most prevalent vehicle ownership categories in Knoxville are males with 2 vehicles (20,743, accounting for 43.3%) and females with 2 vehicles (19,845, making up 46.2%).
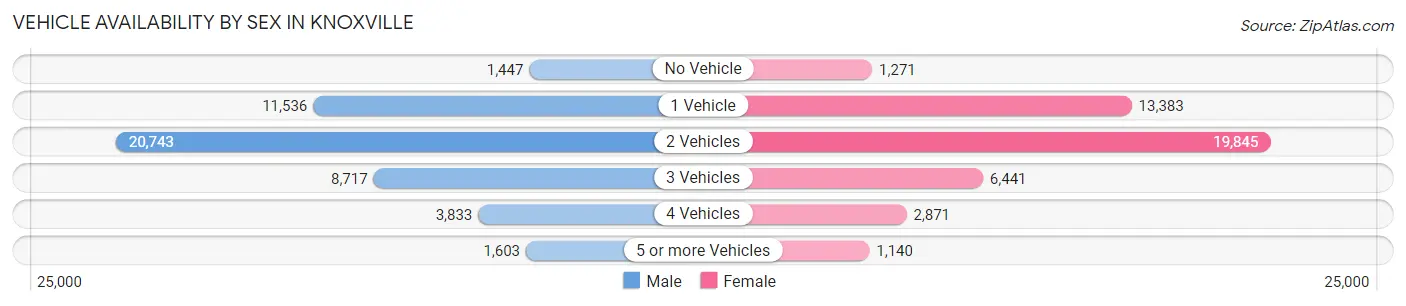
| Vehicles Available | Male | Female |
| No Vehicle | 1,447 (3.0%) | 1,271 (2.8%) |
| 1 Vehicle | 11,536 (24.1%) | 13,383 (29.8%) |
| 2 Vehicles | 20,743 (43.3%) | 19,845 (44.2%) |
| 3 Vehicles | 8,717 (18.2%) | 6,441 (14.3%) |
| 4 Vehicles | 3,833 (8.0%) | 2,871 (6.4%) |
| 5 or more Vehicles | 1,603 (3.4%) | 1,140 (2.5%) |
| Total | 47,879 (100.0%) | 44,951 (100.0%) |
Commute Time in Knoxville
The most frequently occuring commute durations in Knoxville are 15 to 19 minutes (19,488 commuters, 22.5%), 20 to 24 minutes (16,334 commuters, 18.9%), and 10 to 14 minutes (15,405 commuters, 17.8%).
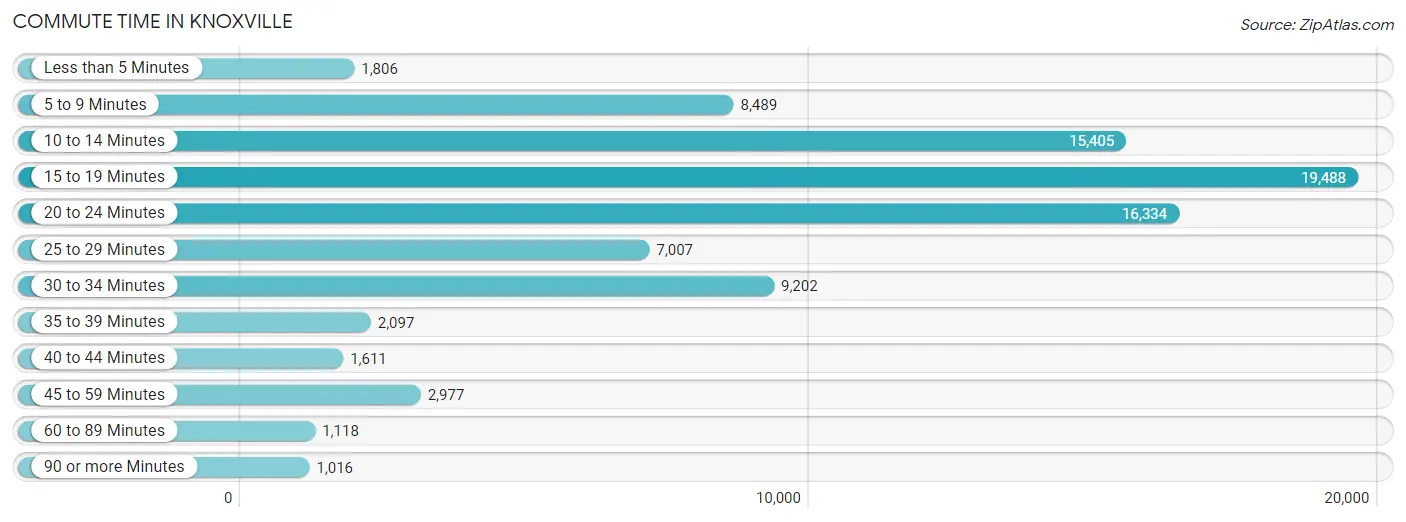
| Commute Time | # Commuters | % Commuters |
| Less than 5 Minutes | 1,806 | 2.1% |
| 5 to 9 Minutes | 8,489 | 9.8% |
| 10 to 14 Minutes | 15,405 | 17.8% |
| 15 to 19 Minutes | 19,488 | 22.5% |
| 20 to 24 Minutes | 16,334 | 18.9% |
| 25 to 29 Minutes | 7,007 | 8.1% |
| 30 to 34 Minutes | 9,202 | 10.6% |
| 35 to 39 Minutes | 2,097 | 2.4% |
| 40 to 44 Minutes | 1,611 | 1.9% |
| 45 to 59 Minutes | 2,977 | 3.4% |
| 60 to 89 Minutes | 1,118 | 1.3% |
| 90 or more Minutes | 1,016 | 1.2% |
Commute Time by Sex in Knoxville
The most common commute times in Knoxville are 15 to 19 minutes (10,122 commuters, 22.5%) for males and 15 to 19 minutes (9,366 commuters, 22.5%) for females.
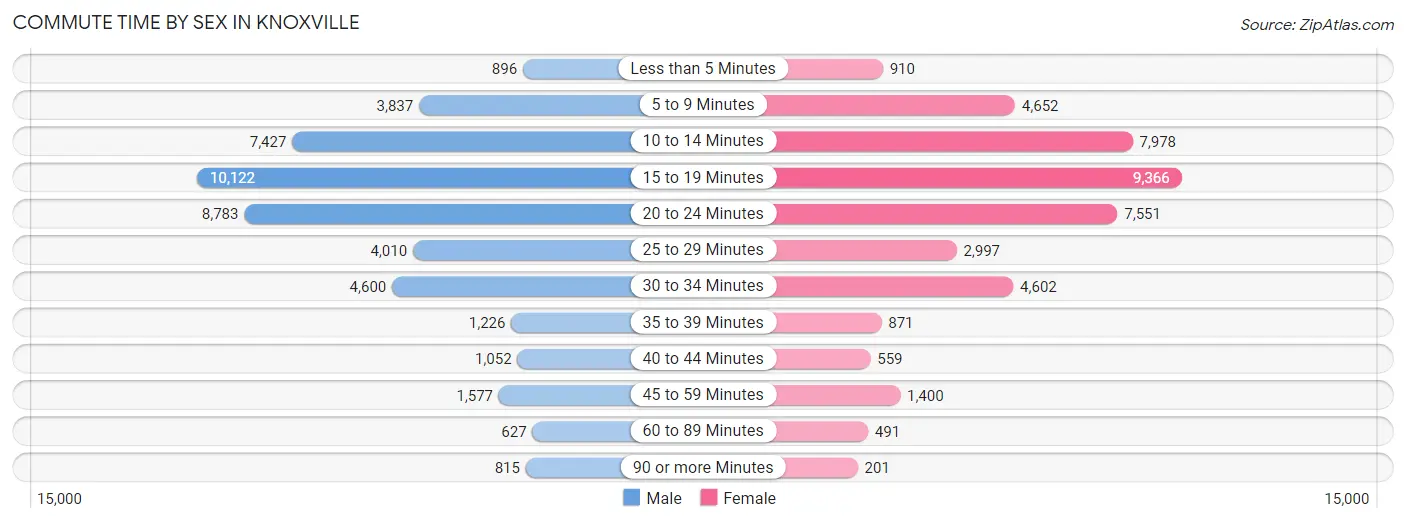
| Commute Time | Male | Female |
| Less than 5 Minutes | 896 (2.0%) | 910 (2.2%) |
| 5 to 9 Minutes | 3,837 (8.5%) | 4,652 (11.2%) |
| 10 to 14 Minutes | 7,427 (16.5%) | 7,978 (19.2%) |
| 15 to 19 Minutes | 10,122 (22.5%) | 9,366 (22.5%) |
| 20 to 24 Minutes | 8,783 (19.5%) | 7,551 (18.2%) |
| 25 to 29 Minutes | 4,010 (8.9%) | 2,997 (7.2%) |
| 30 to 34 Minutes | 4,600 (10.2%) | 4,602 (11.1%) |
| 35 to 39 Minutes | 1,226 (2.7%) | 871 (2.1%) |
| 40 to 44 Minutes | 1,052 (2.3%) | 559 (1.3%) |
| 45 to 59 Minutes | 1,577 (3.5%) | 1,400 (3.4%) |
| 60 to 89 Minutes | 627 (1.4%) | 491 (1.2%) |
| 90 or more Minutes | 815 (1.8%) | 201 (0.5%) |
Time of Departure to Work by Sex in Knoxville
The most frequent times of departure to work in Knoxville are 7:30 AM to 7:59 AM (5,900, 13.1%) for males and 7:30 AM to 7:59 AM (6,086, 14.6%) for females.
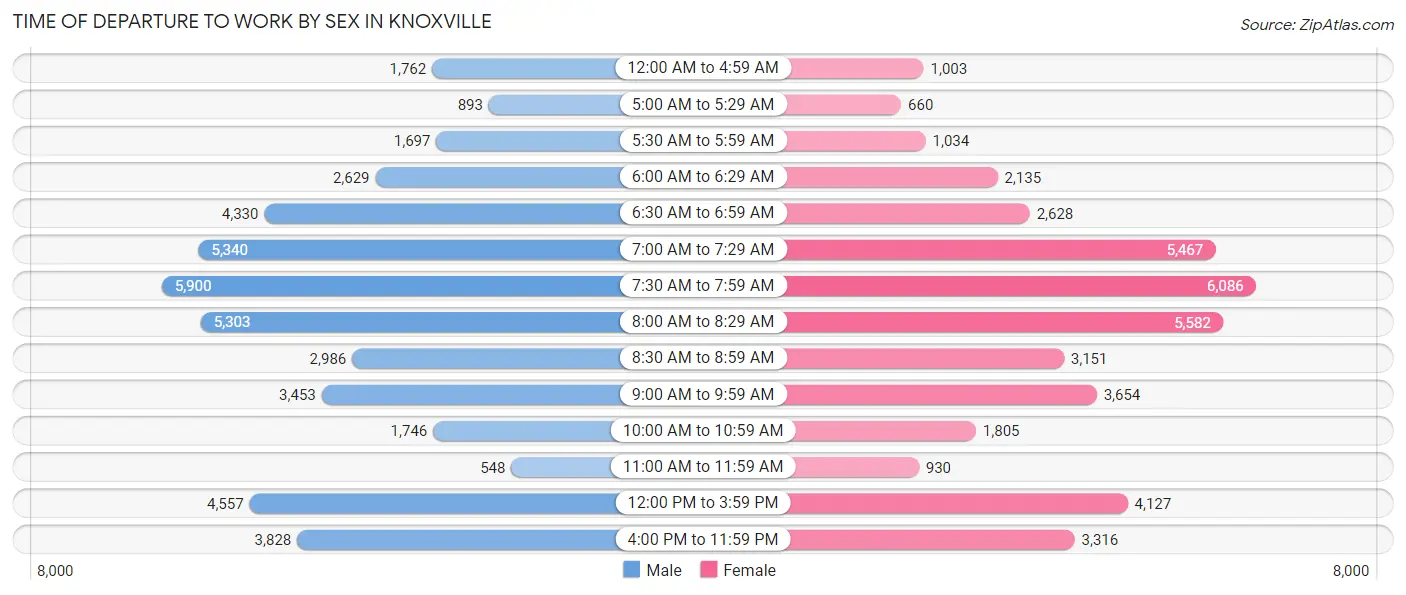
| Time of Departure | Male | Female |
| 12:00 AM to 4:59 AM | 1,762 (3.9%) | 1,003 (2.4%) |
| 5:00 AM to 5:29 AM | 893 (2.0%) | 660 (1.6%) |
| 5:30 AM to 5:59 AM | 1,697 (3.8%) | 1,034 (2.5%) |
| 6:00 AM to 6:29 AM | 2,629 (5.9%) | 2,135 (5.1%) |
| 6:30 AM to 6:59 AM | 4,330 (9.6%) | 2,628 (6.3%) |
| 7:00 AM to 7:29 AM | 5,340 (11.9%) | 5,467 (13.2%) |
| 7:30 AM to 7:59 AM | 5,900 (13.1%) | 6,086 (14.6%) |
| 8:00 AM to 8:29 AM | 5,303 (11.8%) | 5,582 (13.4%) |
| 8:30 AM to 8:59 AM | 2,986 (6.6%) | 3,151 (7.6%) |
| 9:00 AM to 9:59 AM | 3,453 (7.7%) | 3,654 (8.8%) |
| 10:00 AM to 10:59 AM | 1,746 (3.9%) | 1,805 (4.3%) |
| 11:00 AM to 11:59 AM | 548 (1.2%) | 930 (2.2%) |
| 12:00 PM to 3:59 PM | 4,557 (10.1%) | 4,127 (9.9%) |
| 4:00 PM to 11:59 PM | 3,828 (8.5%) | 3,316 (8.0%) |
| Total | 44,972 (100.0%) | 41,578 (100.0%) |
Housing Occupancy in Knoxville
Occupancy by Ownership in Knoxville
Of the total 84,195 dwellings in Knoxville, owner-occupied units account for 38,939 (46.3%), while renter-occupied units make up 45,256 (53.7%).
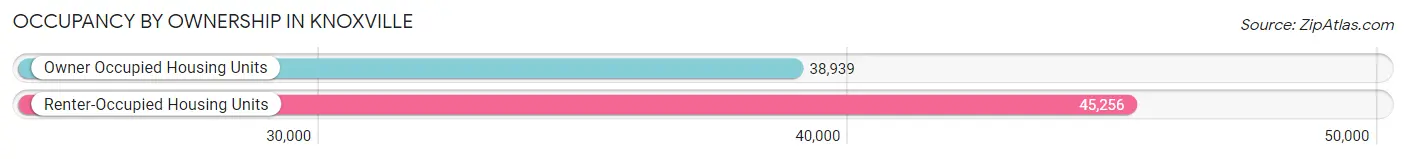
| Occupancy | # Housing Units | % Housing Units |
| Owner Occupied Housing Units | 38,939 | 46.3% |
| Renter-Occupied Housing Units | 45,256 | 53.7% |
| Total Occupied Housing Units | 84,195 | 100.0% |
Occupancy by Household Size in Knoxville
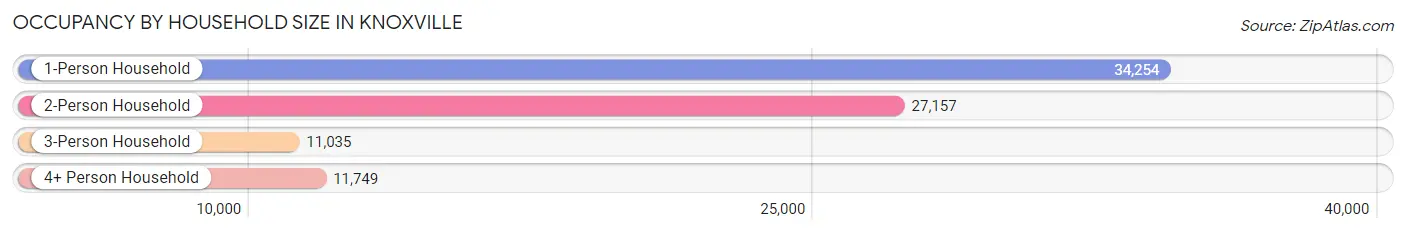
| Household Size | # Housing Units | % Housing Units |
| 1-Person Household | 34,254 | 40.7% |
| 2-Person Household | 27,157 | 32.3% |
| 3-Person Household | 11,035 | 13.1% |
| 4+ Person Household | 11,749 | 14.0% |
| Total Housing Units | 84,195 | 100.0% |
Occupancy by Ownership by Household Size in Knoxville
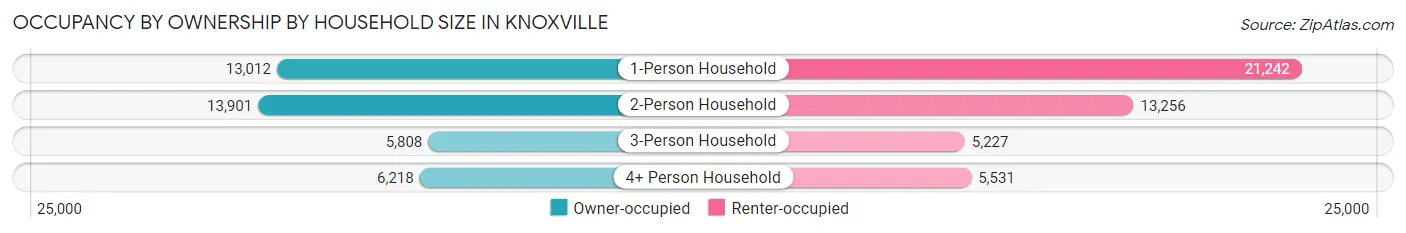
| Household Size | Owner-occupied | Renter-occupied |
| 1-Person Household | 13,012 (38.0%) | 21,242 (62.0%) |
| 2-Person Household | 13,901 (51.2%) | 13,256 (48.8%) |
| 3-Person Household | 5,808 (52.6%) | 5,227 (47.4%) |
| 4+ Person Household | 6,218 (52.9%) | 5,531 (47.1%) |
| Total Housing Units | 38,939 (46.3%) | 45,256 (53.7%) |
Occupancy by Educational Attainment in Knoxville
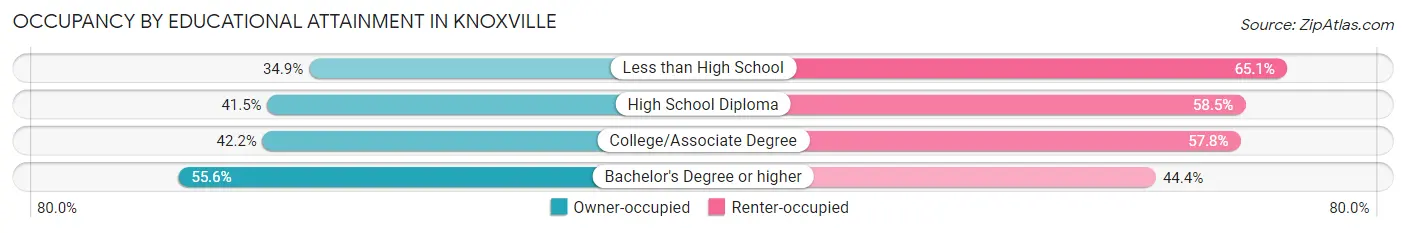
| Household Size | Owner-occupied | Renter-occupied |
| Less than High School | 2,291 (34.9%) | 4,275 (65.1%) |
| High School Diploma | 8,355 (41.5%) | 11,787 (58.5%) |
| College/Associate Degree | 11,630 (42.2%) | 15,900 (57.8%) |
| Bachelor's Degree or higher | 16,663 (55.6%) | 13,294 (44.4%) |
Occupancy by Age of Householder in Knoxville
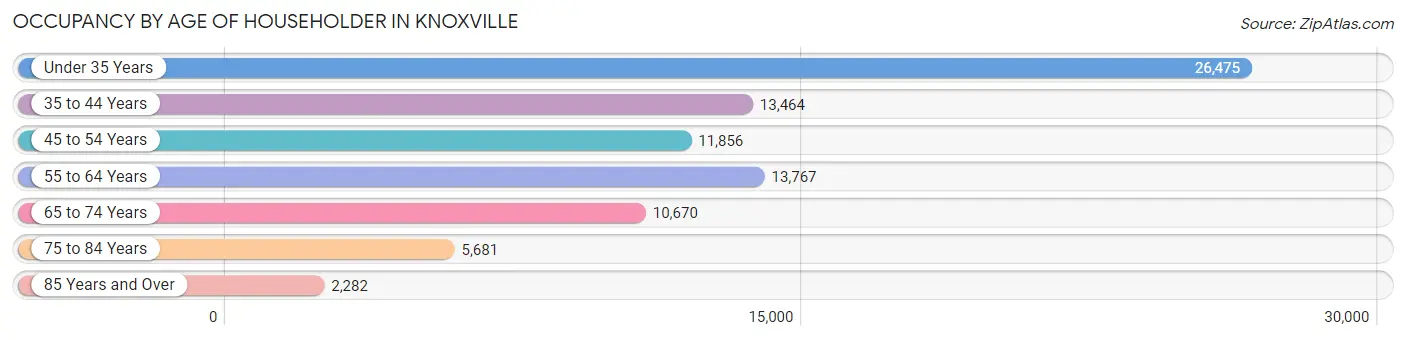
| Age Bracket | # Households | % Households |
| Under 35 Years | 26,475 | 31.4% |
| 35 to 44 Years | 13,464 | 16.0% |
| 45 to 54 Years | 11,856 | 14.1% |
| 55 to 64 Years | 13,767 | 16.4% |
| 65 to 74 Years | 10,670 | 12.7% |
| 75 to 84 Years | 5,681 | 6.8% |
| 85 Years and Over | 2,282 | 2.7% |
| Total | 84,195 | 100.0% |
Housing Finances in Knoxville
Median Income by Occupancy in Knoxville
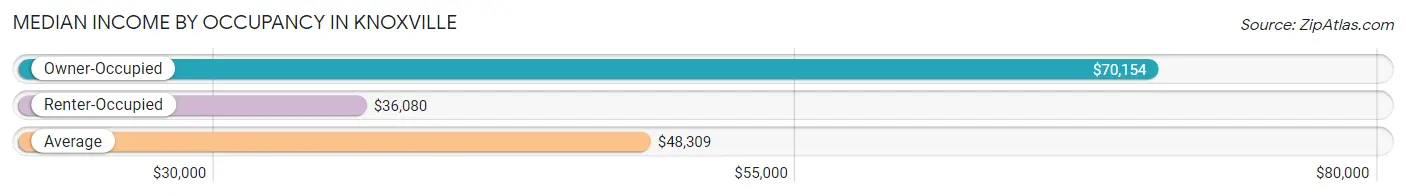
| Occupancy Type | # Households | Median Income |
| Owner-Occupied | 38,939 (46.3%) | $70,154 |
| Renter-Occupied | 45,256 (53.7%) | $36,080 |
| Average | 84,195 (100.0%) | $48,309 |
Occupancy by Householder Income Bracket in Knoxville
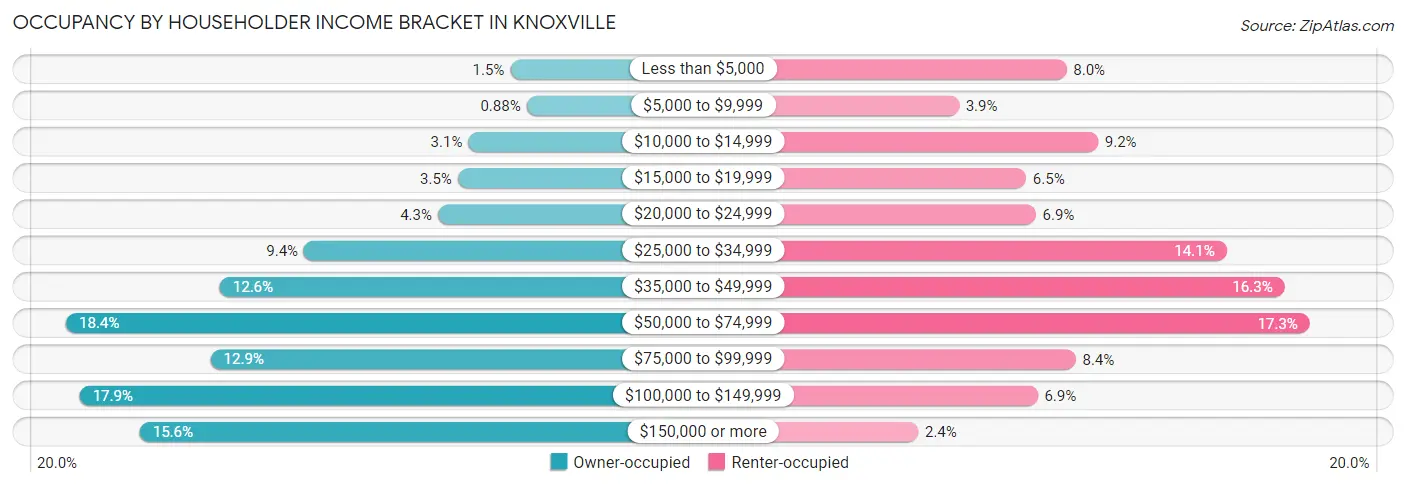
| Income Bracket | Owner-occupied | Renter-occupied |
| Less than $5,000 | 585 (1.5%) | 3,633 (8.0%) |
| $5,000 to $9,999 | 344 (0.9%) | 1,780 (3.9%) |
| $10,000 to $14,999 | 1,208 (3.1%) | 4,176 (9.2%) |
| $15,000 to $19,999 | 1,361 (3.5%) | 2,937 (6.5%) |
| $20,000 to $24,999 | 1,657 (4.3%) | 3,105 (6.9%) |
| $25,000 to $34,999 | 3,645 (9.4%) | 6,395 (14.1%) |
| $35,000 to $49,999 | 4,890 (12.6%) | 7,395 (16.3%) |
| $50,000 to $74,999 | 7,172 (18.4%) | 7,828 (17.3%) |
| $75,000 to $99,999 | 5,028 (12.9%) | 3,793 (8.4%) |
| $100,000 to $149,999 | 6,970 (17.9%) | 3,136 (6.9%) |
| $150,000 or more | 6,079 (15.6%) | 1,078 (2.4%) |
| Total | 38,939 (100.0%) | 45,256 (100.0%) |
Monthly Housing Cost Tiers in Knoxville
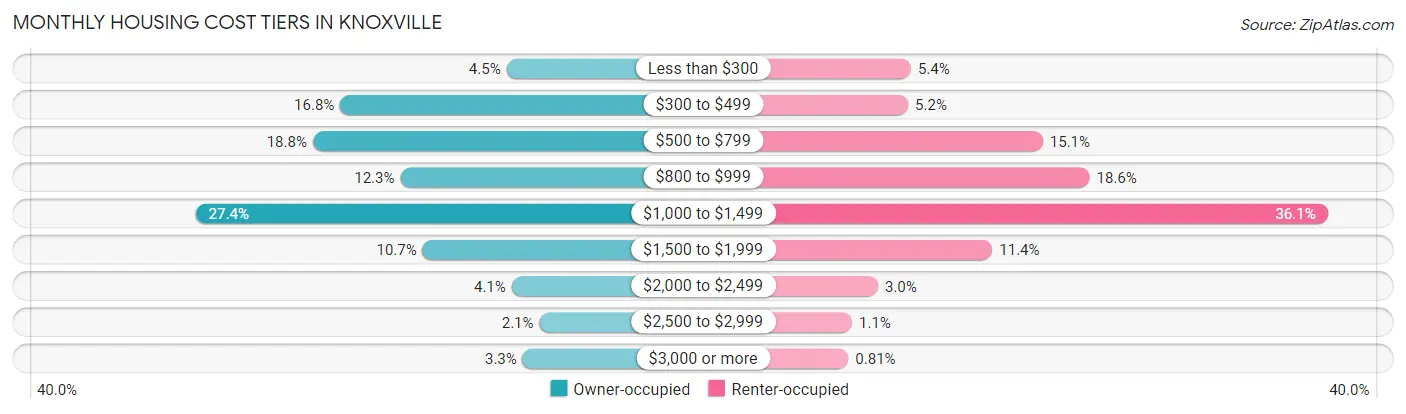
| Monthly Cost | Owner-occupied | Renter-occupied |
| Less than $300 | 1,757 (4.5%) | 2,453 (5.4%) |
| $300 to $499 | 6,526 (16.8%) | 2,357 (5.2%) |
| $500 to $799 | 7,314 (18.8%) | 6,848 (15.1%) |
| $800 to $999 | 4,800 (12.3%) | 8,403 (18.6%) |
| $1,000 to $1,499 | 10,668 (27.4%) | 16,331 (36.1%) |
| $1,500 to $1,999 | 4,162 (10.7%) | 5,164 (11.4%) |
| $2,000 to $2,499 | 1,607 (4.1%) | 1,354 (3.0%) |
| $2,500 to $2,999 | 814 (2.1%) | 488 (1.1%) |
| $3,000 or more | 1,291 (3.3%) | 365 (0.8%) |
| Total | 38,939 (100.0%) | 45,256 (100.0%) |
Physical Housing Characteristics in Knoxville
Housing Structures in Knoxville
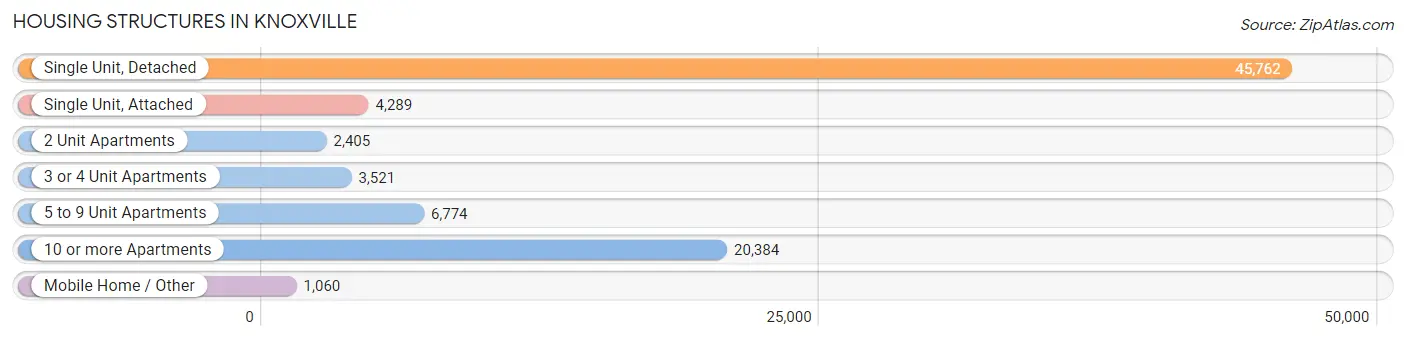
| Structure Type | # Housing Units | % Housing Units |
| Single Unit, Detached | 45,762 | 54.3% |
| Single Unit, Attached | 4,289 | 5.1% |
| 2 Unit Apartments | 2,405 | 2.9% |
| 3 or 4 Unit Apartments | 3,521 | 4.2% |
| 5 to 9 Unit Apartments | 6,774 | 8.1% |
| 10 or more Apartments | 20,384 | 24.2% |
| Mobile Home / Other | 1,060 | 1.3% |
| Total | 84,195 | 100.0% |
Housing Structures by Occupancy in Knoxville
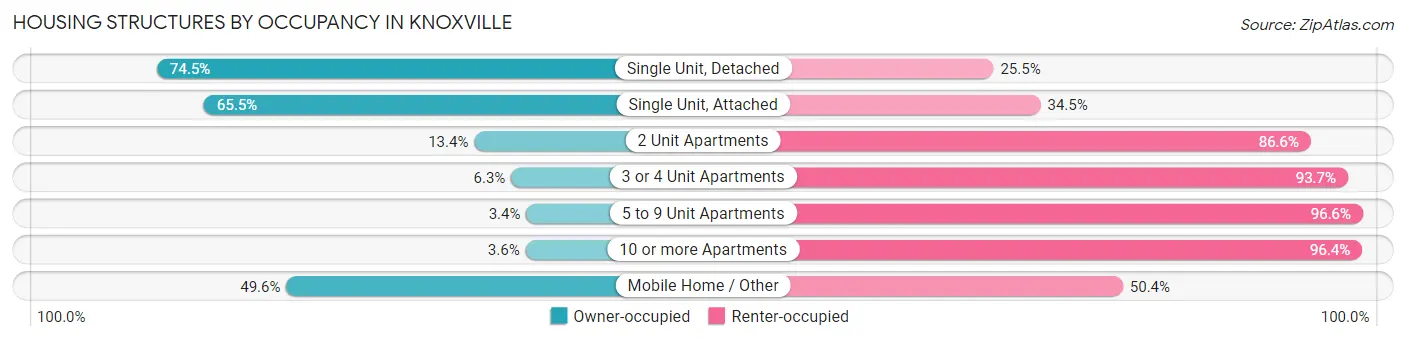
| Structure Type | Owner-occupied | Renter-occupied |
| Single Unit, Detached | 34,104 (74.5%) | 11,658 (25.5%) |
| Single Unit, Attached | 2,808 (65.5%) | 1,481 (34.5%) |
| 2 Unit Apartments | 323 (13.4%) | 2,082 (86.6%) |
| 3 or 4 Unit Apartments | 222 (6.3%) | 3,299 (93.7%) |
| 5 to 9 Unit Apartments | 231 (3.4%) | 6,543 (96.6%) |
| 10 or more Apartments | 725 (3.6%) | 19,659 (96.4%) |
| Mobile Home / Other | 526 (49.6%) | 534 (50.4%) |
| Total | 38,939 (46.3%) | 45,256 (53.7%) |
Housing Structures by Number of Rooms in Knoxville
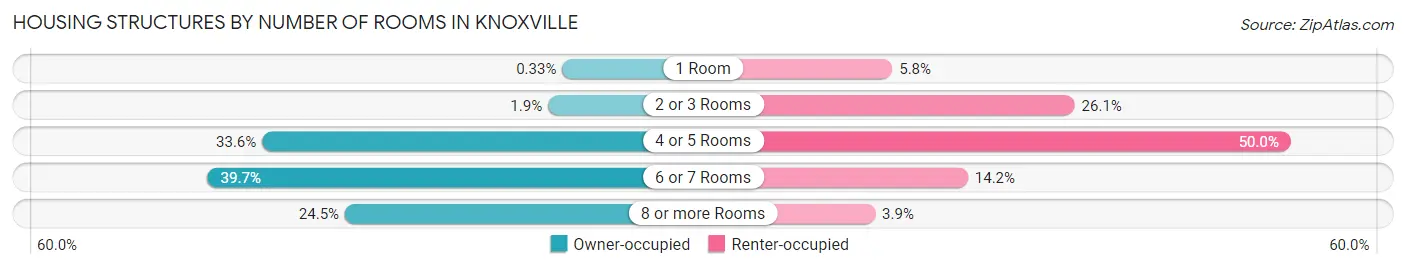
| Number of Rooms | Owner-occupied | Renter-occupied |
| 1 Room | 128 (0.3%) | 2,628 (5.8%) |
| 2 or 3 Rooms | 742 (1.9%) | 11,791 (26.1%) |
| 4 or 5 Rooms | 13,100 (33.6%) | 22,641 (50.0%) |
| 6 or 7 Rooms | 15,450 (39.7%) | 6,425 (14.2%) |
| 8 or more Rooms | 9,519 (24.4%) | 1,771 (3.9%) |
| Total | 38,939 (100.0%) | 45,256 (100.0%) |
Housing Structure by Heating Type in Knoxville
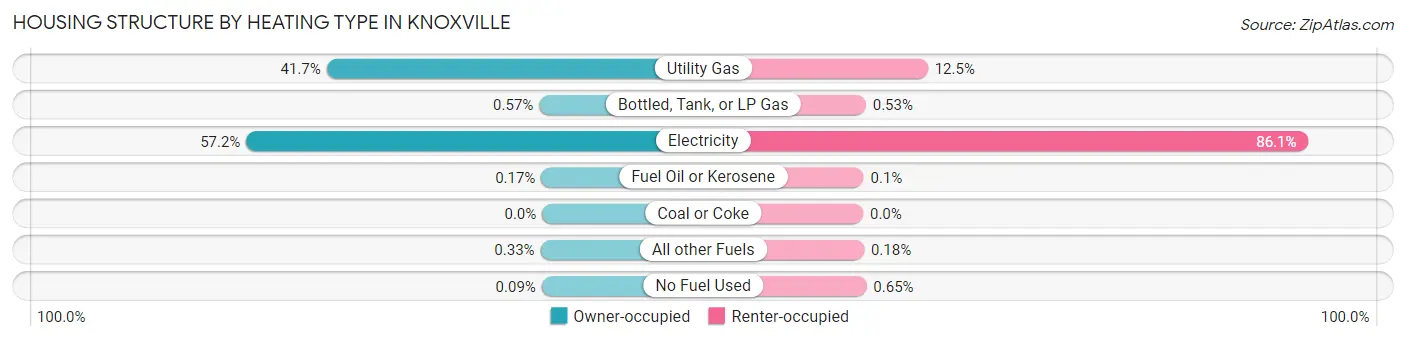
| Heating Type | Owner-occupied | Renter-occupied |
| Utility Gas | 16,217 (41.6%) | 5,656 (12.5%) |
| Bottled, Tank, or LP Gas | 221 (0.6%) | 238 (0.5%) |
| Electricity | 22,267 (57.2%) | 38,942 (86.1%) |
| Fuel Oil or Kerosene | 68 (0.2%) | 44 (0.1%) |
| Coal or Coke | 0 (0.0%) | 0 (0.0%) |
| All other Fuels | 130 (0.3%) | 82 (0.2%) |
| No Fuel Used | 36 (0.1%) | 294 (0.6%) |
| Total | 38,939 (100.0%) | 45,256 (100.0%) |
Household Vehicle Usage in Knoxville
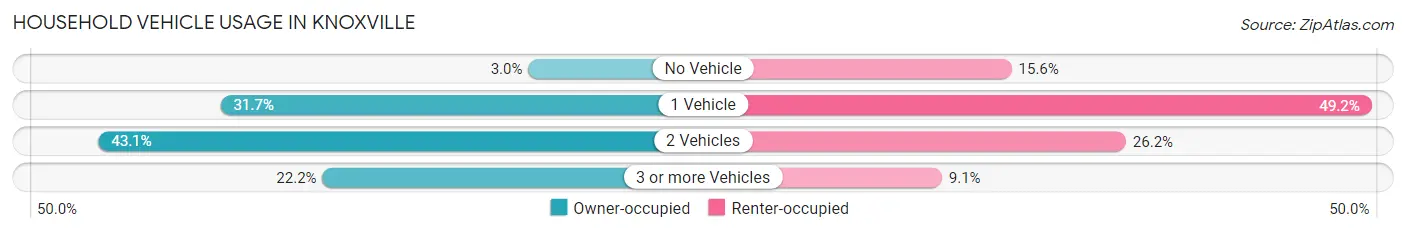
| Vehicles per Household | Owner-occupied | Renter-occupied |
| No Vehicle | 1,159 (3.0%) | 7,041 (15.6%) |
| 1 Vehicle | 12,349 (31.7%) | 22,247 (49.2%) |
| 2 Vehicles | 16,785 (43.1%) | 11,871 (26.2%) |
| 3 or more Vehicles | 8,646 (22.2%) | 4,097 (9.0%) |
| Total | 38,939 (100.0%) | 45,256 (100.0%) |
Real Estate & Mortgages in Knoxville
Real Estate and Mortgage Overview in Knoxville
| Characteristic | Without Mortgage | With Mortgage |
| Housing Units | 15,037 | 23,902 |
| Median Property Value | $171,300 | $191,700 |
| Median Household Income | $52,783 | $4,209 |
| Monthly Housing Costs | $482 | $1,241 |
| Real Estate Taxes | $1,383 | $669 |
Property Value by Mortgage Status in Knoxville
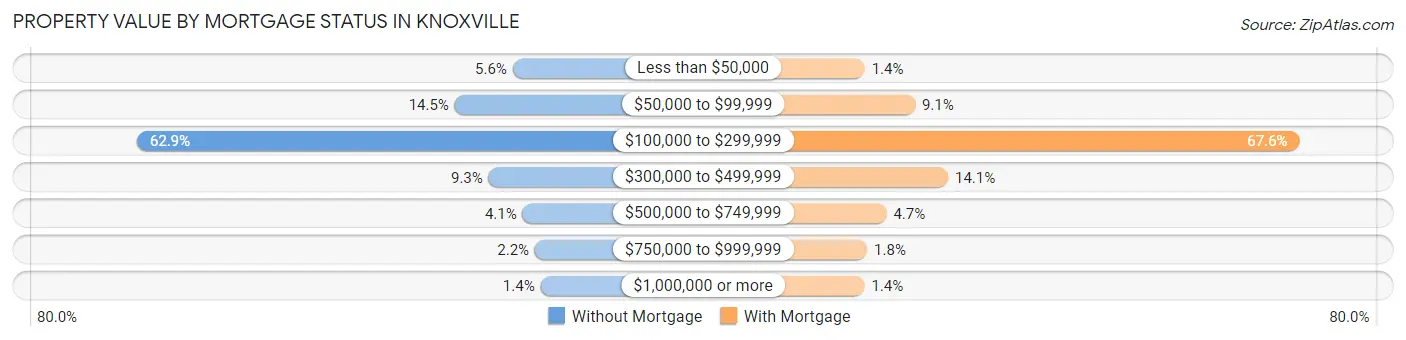
| Property Value | Without Mortgage | With Mortgage |
| Less than $50,000 | 845 (5.6%) | 335 (1.4%) |
| $50,000 to $99,999 | 2,174 (14.5%) | 2,162 (9.0%) |
| $100,000 to $299,999 | 9,457 (62.9%) | 16,164 (67.6%) |
| $300,000 to $499,999 | 1,397 (9.3%) | 3,367 (14.1%) |
| $500,000 to $749,999 | 620 (4.1%) | 1,125 (4.7%) |
| $750,000 to $999,999 | 335 (2.2%) | 424 (1.8%) |
| $1,000,000 or more | 209 (1.4%) | 325 (1.4%) |
| Total | 15,037 (100.0%) | 23,902 (100.0%) |
Household Income by Mortgage Status in Knoxville
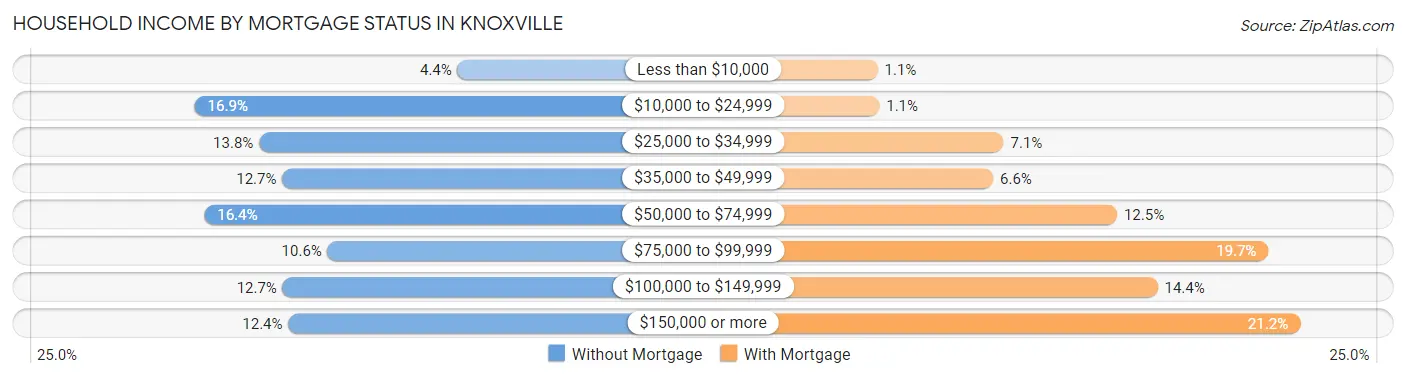
| Household Income | Without Mortgage | With Mortgage |
| Less than $10,000 | 659 (4.4%) | 250 (1.1%) |
| $10,000 to $24,999 | 2,542 (16.9%) | 270 (1.1%) |
| $25,000 to $34,999 | 2,079 (13.8%) | 1,684 (7.0%) |
| $35,000 to $49,999 | 1,914 (12.7%) | 1,566 (6.6%) |
| $50,000 to $74,999 | 2,472 (16.4%) | 2,976 (12.4%) |
| $75,000 to $99,999 | 1,590 (10.6%) | 4,700 (19.7%) |
| $100,000 to $149,999 | 1,911 (12.7%) | 3,438 (14.4%) |
| $150,000 or more | 1,870 (12.4%) | 5,059 (21.2%) |
| Total | 15,037 (100.0%) | 23,902 (100.0%) |
Property Value to Household Income Ratio in Knoxville
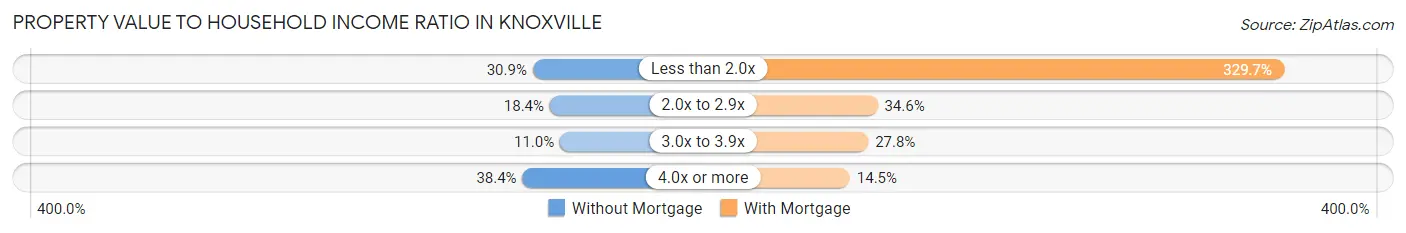
| Value-to-Income Ratio | Without Mortgage | With Mortgage |
| Less than 2.0x | 4,640 (30.9%) | 78,808 (329.7%) |
| 2.0x to 2.9x | 2,773 (18.4%) | 8,258 (34.5%) |
| 3.0x to 3.9x | 1,660 (11.0%) | 6,648 (27.8%) |
| 4.0x or more | 5,766 (38.4%) | 3,460 (14.5%) |
| Total | 15,037 (100.0%) | 23,902 (100.0%) |
Real Estate Taxes by Mortgage Status in Knoxville
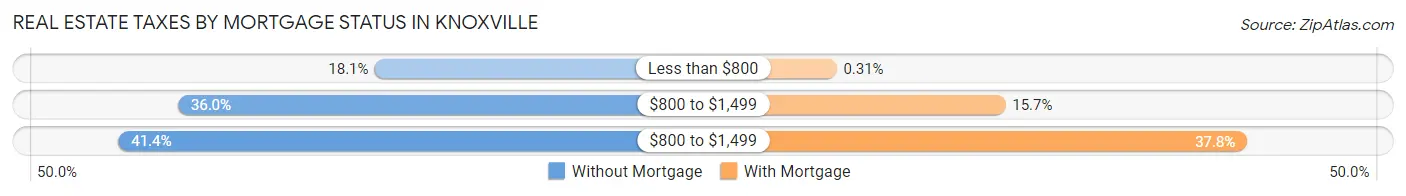
| Property Taxes | Without Mortgage | With Mortgage |
| Less than $800 | 2,716 (18.1%) | 73 (0.3%) |
| $800 to $1,499 | 5,414 (36.0%) | 3,760 (15.7%) |
| $800 to $1,499 | 6,231 (41.4%) | 9,039 (37.8%) |
| Total | 15,037 (100.0%) | 23,902 (100.0%) |
Health & Disability in Knoxville
Health Insurance Coverage by Age in Knoxville
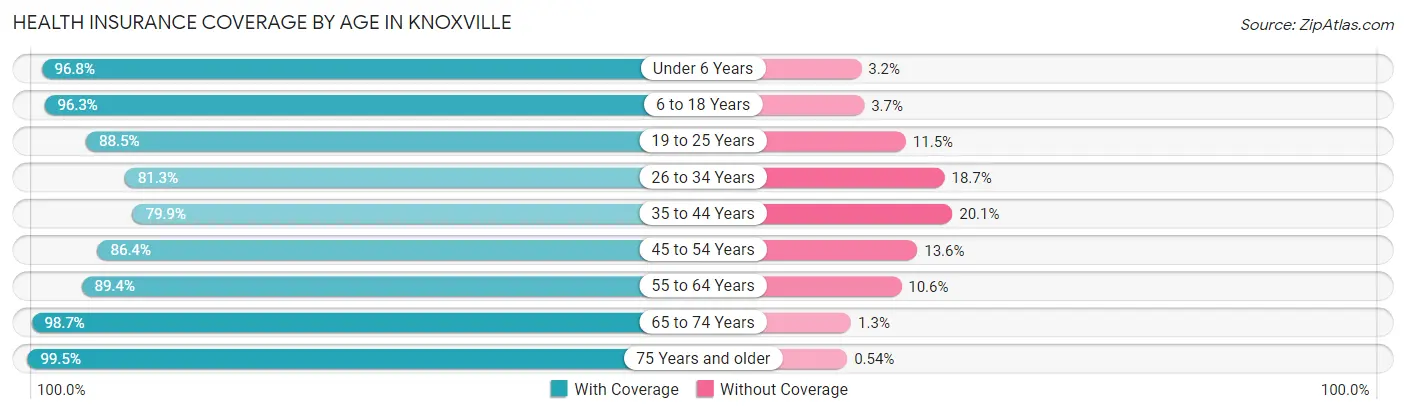
| Age Bracket | With Coverage | Without Coverage |
| Under 6 Years | 11,281 (96.8%) | 369 (3.2%) |
| 6 to 18 Years | 25,688 (96.3%) | 991 (3.7%) |
| 19 to 25 Years | 30,605 (88.5%) | 3,972 (11.5%) |
| 26 to 34 Years | 21,886 (81.3%) | 5,035 (18.7%) |
| 35 to 44 Years | 18,222 (79.9%) | 4,595 (20.1%) |
| 45 to 54 Years | 17,524 (86.4%) | 2,763 (13.6%) |
| 55 to 64 Years | 18,805 (89.4%) | 2,237 (10.6%) |
| 65 to 74 Years | 15,397 (98.7%) | 200 (1.3%) |
| 75 Years and older | 10,637 (99.5%) | 58 (0.5%) |
| Total | 170,045 (89.4%) | 20,220 (10.6%) |
Health Insurance Coverage by Citizenship Status in Knoxville
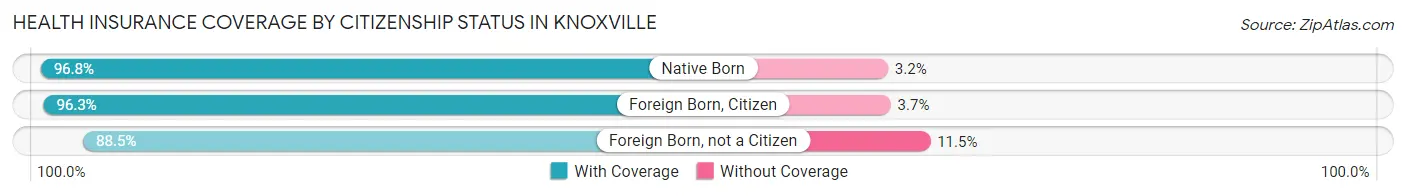
| Citizenship Status | With Coverage | Without Coverage |
| Native Born | 11,281 (96.8%) | 369 (3.2%) |
| Foreign Born, Citizen | 25,688 (96.3%) | 991 (3.7%) |
| Foreign Born, not a Citizen | 30,605 (88.5%) | 3,972 (11.5%) |
Health Insurance Coverage by Household Income in Knoxville
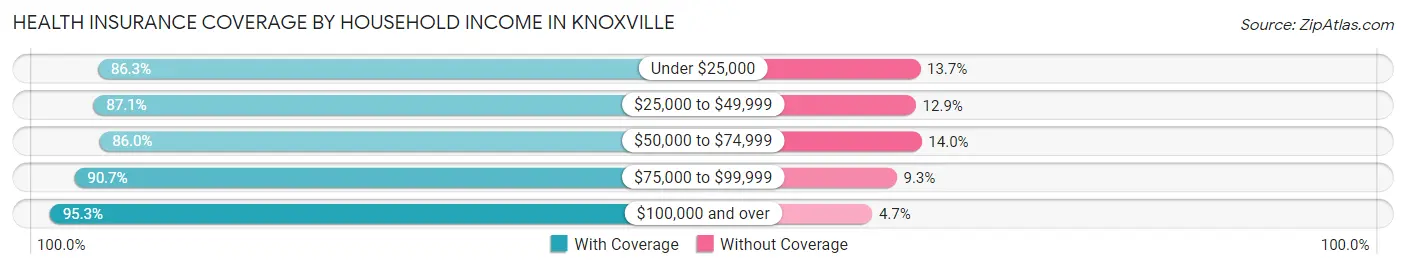
| Household Income | With Coverage | Without Coverage |
| Under $25,000 | 29,060 (86.3%) | 4,622 (13.7%) |
| $25,000 to $49,999 | 39,178 (87.1%) | 5,805 (12.9%) |
| $50,000 to $74,999 | 28,656 (86.0%) | 4,657 (14.0%) |
| $75,000 to $99,999 | 20,424 (90.7%) | 2,100 (9.3%) |
| $100,000 and over | 45,744 (95.3%) | 2,263 (4.7%) |
Public vs Private Health Insurance Coverage by Age in Knoxville
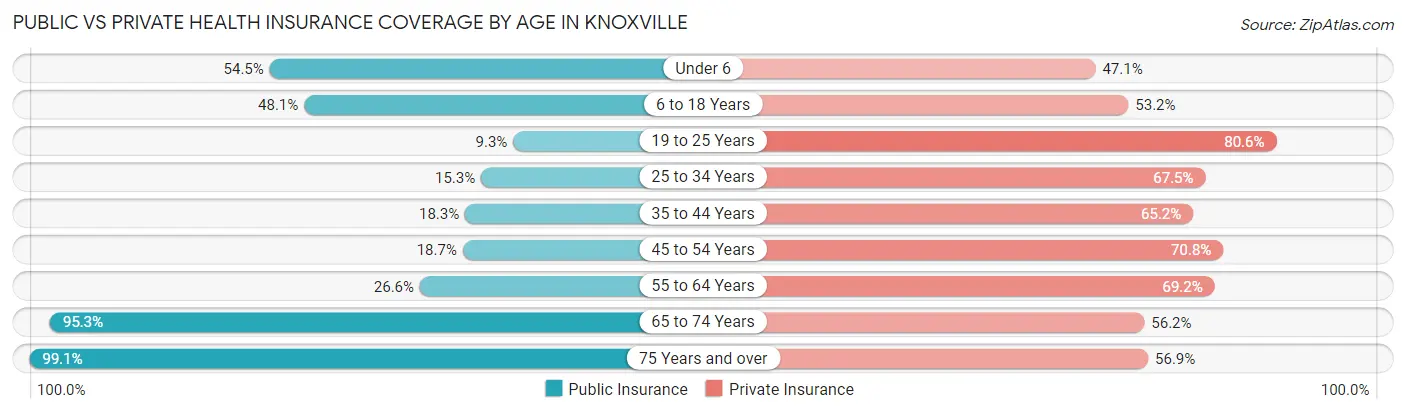
| Age Bracket | Public Insurance | Private Insurance |
| Under 6 | 6,351 (54.5%) | 5,486 (47.1%) |
| 6 to 18 Years | 12,838 (48.1%) | 14,191 (53.2%) |
| 19 to 25 Years | 3,224 (9.3%) | 27,882 (80.6%) |
| 25 to 34 Years | 4,114 (15.3%) | 18,165 (67.5%) |
| 35 to 44 Years | 4,165 (18.2%) | 14,877 (65.2%) |
| 45 to 54 Years | 3,789 (18.7%) | 14,359 (70.8%) |
| 55 to 64 Years | 5,603 (26.6%) | 14,557 (69.2%) |
| 65 to 74 Years | 14,865 (95.3%) | 8,759 (56.2%) |
| 75 Years and over | 10,601 (99.1%) | 6,081 (56.9%) |
| Total | 65,550 (34.4%) | 124,357 (65.4%) |
Disability Status by Sex by Age in Knoxville
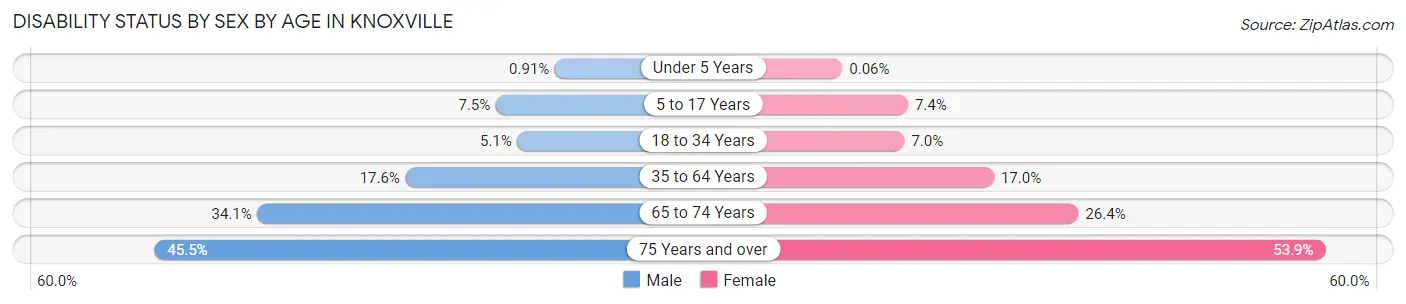
| Age Bracket | Male | Female |
| Under 5 Years | 45 (0.9%) | 3 (0.1%) |
| 5 to 17 Years | 950 (7.5%) | 913 (7.4%) |
| 18 to 34 Years | 1,657 (5.1%) | 2,267 (7.0%) |
| 35 to 64 Years | 5,505 (17.6%) | 5,560 (17.0%) |
| 65 to 74 Years | 2,349 (34.1%) | 2,293 (26.4%) |
| 75 Years and over | 1,827 (45.5%) | 3,599 (53.8%) |
Disability Class by Sex by Age in Knoxville
Disability Class: Hearing Difficulty
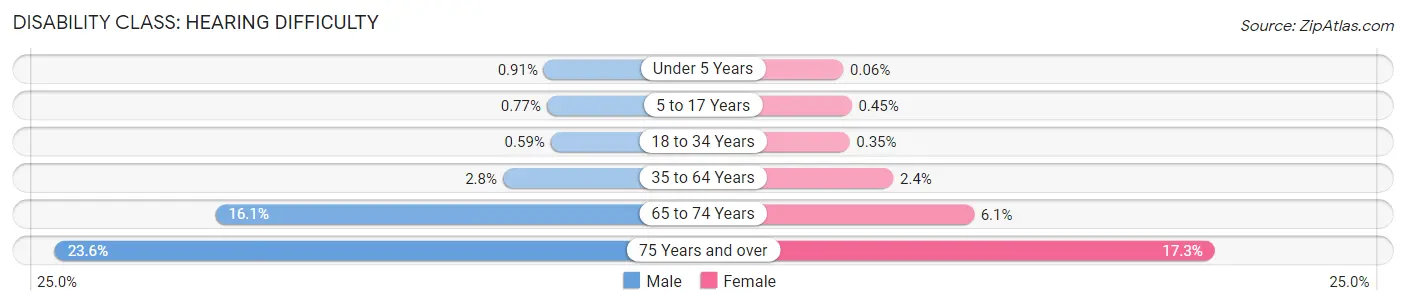
| Age Bracket | Male | Female |
| Under 5 Years | 45 (0.9%) | 3 (0.1%) |
| 5 to 17 Years | 98 (0.8%) | 56 (0.4%) |
| 18 to 34 Years | 191 (0.6%) | 114 (0.4%) |
| 35 to 64 Years | 880 (2.8%) | 781 (2.4%) |
| 65 to 74 Years | 1,113 (16.1%) | 532 (6.1%) |
| 75 Years and over | 947 (23.6%) | 1,156 (17.3%) |
Disability Class: Vision Difficulty

| Age Bracket | Male | Female |
| Under 5 Years | 0 (0.0%) | 3 (0.1%) |
| 5 to 17 Years | 6 (0.1%) | 56 (0.4%) |
| 18 to 34 Years | 114 (0.4%) | 391 (1.2%) |
| 35 to 64 Years | 1,158 (3.7%) | 1,022 (3.1%) |
| 65 to 74 Years | 487 (7.1%) | 444 (5.1%) |
| 75 Years and over | 302 (7.5%) | 699 (10.5%) |
Disability Class: Cognitive Difficulty
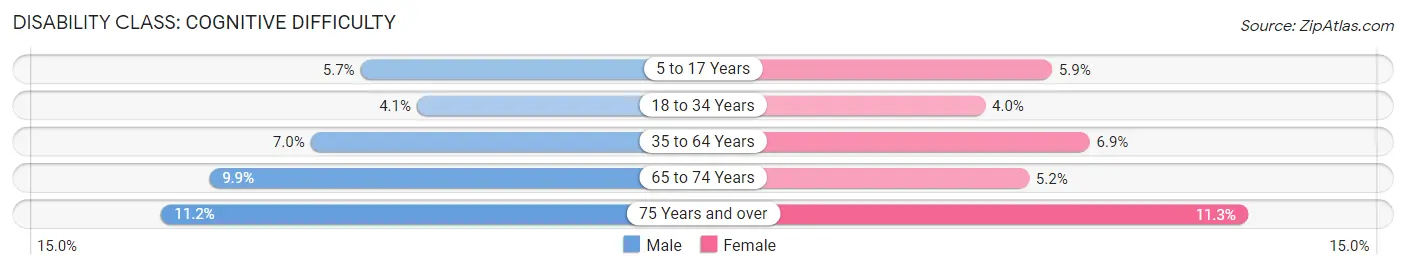
| Age Bracket | Male | Female |
| 5 to 17 Years | 717 (5.7%) | 724 (5.9%) |
| 18 to 34 Years | 1,328 (4.1%) | 1,298 (4.0%) |
| 35 to 64 Years | 2,207 (7.0%) | 2,263 (6.9%) |
| 65 to 74 Years | 680 (9.9%) | 453 (5.2%) |
| 75 Years and over | 449 (11.2%) | 755 (11.3%) |
Disability Class: Ambulatory Difficulty
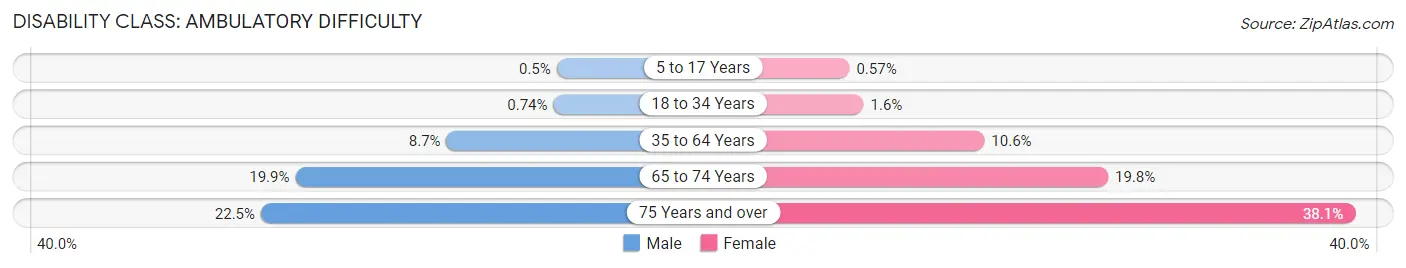
| Age Bracket | Male | Female |
| 5 to 17 Years | 64 (0.5%) | 70 (0.6%) |
| 18 to 34 Years | 241 (0.7%) | 527 (1.6%) |
| 35 to 64 Years | 2,721 (8.7%) | 3,474 (10.6%) |
| 65 to 74 Years | 1,373 (19.9%) | 1,720 (19.8%) |
| 75 Years and over | 901 (22.5%) | 2,546 (38.1%) |
Disability Class: Self-Care Difficulty
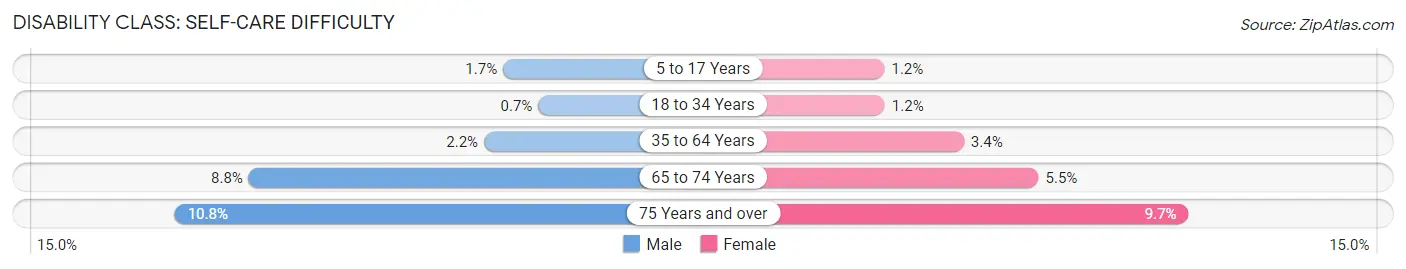
| Age Bracket | Male | Female |
| 5 to 17 Years | 213 (1.7%) | 147 (1.2%) |
| 18 to 34 Years | 227 (0.7%) | 391 (1.2%) |
| 35 to 64 Years | 692 (2.2%) | 1,116 (3.4%) |
| 65 to 74 Years | 604 (8.8%) | 477 (5.5%) |
| 75 Years and over | 434 (10.8%) | 645 (9.7%) |
Technology Access in Knoxville
Computing Device Access in Knoxville
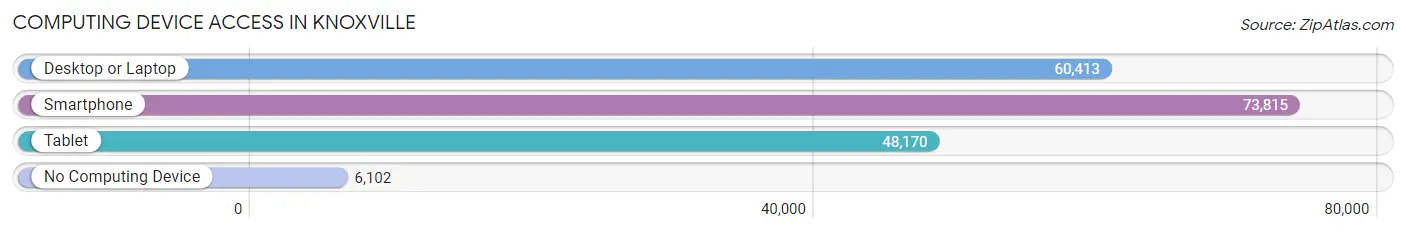
| Device Type | # Households | % Households |
| Desktop or Laptop | 60,413 | 71.8% |
| Smartphone | 73,815 | 87.7% |
| Tablet | 48,170 | 57.2% |
| No Computing Device | 6,102 | 7.2% |
| Total | 84,195 | 100.0% |
Internet Access in Knoxville
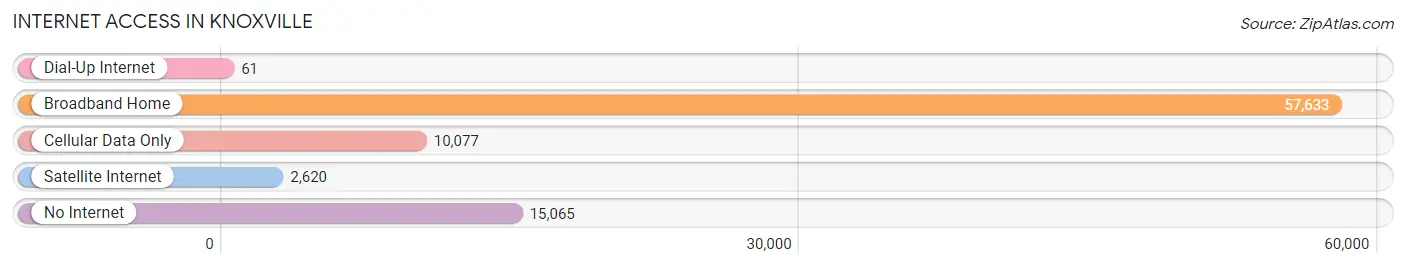
| Internet Type | # Households | % Households |
| Dial-Up Internet | 61 | 0.1% |
| Broadband Home | 57,633 | 68.4% |
| Cellular Data Only | 10,077 | 12.0% |
| Satellite Internet | 2,620 | 3.1% |
| No Internet | 15,065 | 17.9% |
| Total | 84,195 | 100.0% |
Knoxville Summary
Knoxville, Tennessee is a city located in the eastern part of the state, in the foothills of the Great Smoky Mountains. It is the third-largest city in the state, with a population of 187,000 people as of 2019. The city is the county seat of Knox County, and is the principal city of the Knoxville Metropolitan Statistical Area, which had an estimated population of 853,000 people in 2019.
History
Knoxville was founded in 1786 by James White, a Revolutionary War veteran and surveyor. The city was named after Henry Knox, a general in the Continental Army. Knoxville quickly grew to become an important regional center for trade and commerce, and was the first capital of Tennessee. During the Civil War, Knoxville was the site of a major battle in 1863, and the city was occupied by Union forces for the remainder of the war.
In the late 19th century, Knoxville became a major industrial center, with the establishment of several factories and mills. The city was also home to the first public university in the state, the University of Tennessee, which was founded in 1794.
Geography
Knoxville is located in the Appalachian region of the United States, in the foothills of the Great Smoky Mountains. The city is situated along the Tennessee River, and is surrounded by several smaller rivers and streams. The city has a total area of 105 square miles, and is located at an elevation of 860 feet above sea level.
Climate
Knoxville has a humid subtropical climate, with hot, humid summers and mild winters. The average annual temperature is 57°F, and the average annual precipitation is 48 inches.
Economy
Knoxville is a major economic center in the region, with a diverse economy that includes manufacturing, healthcare, education, and tourism. The city is home to several major corporations, including the Pilot Corporation, the Tennessee Valley Authority, and the Regal Entertainment Group.
The city is also home to the University of Tennessee, which is the state’s flagship university and one of the largest employers in the city. The university has an annual economic impact of over $2 billion.
Demographics
As of 2019, the population of Knoxville was 187,000 people, with a population density of 1,788 people per square mile. The median age of the population is 35.7 years, and the median household income is $45,000. The city is majority white (63.3%), with a significant African American population (27.2%). Other racial groups include Asian (3.2%), Hispanic (2.7%), and Native American (0.7%).
Knoxville is a diverse and vibrant city, with a rich history and a bright future. The city is home to a variety of industries, and is a major educational and cultural center in the region. With its diverse population and strong economy, Knoxville is an attractive destination for businesses and residents alike.
Common Questions
What is Per Capita Income in Knoxville?
Per Capita income in Knoxville is $31,983.
What is the Median Family Income in Knoxville?
Median Family Income in Knoxville is $67,233.
What is the Median Household income in Knoxville?
Median Household Income in Knoxville is $48,309.
What is Income or Wage Gap in Knoxville?
Income or Wage Gap in Knoxville is 15.5%.
Women in Knoxville earn 84.5 cents for every dollar earned by a man.
What is Family Income Deficit in Knoxville?
Family Income Deficit in Knoxville is $10,526.
Families that are below poverty line in Knoxville earn $10,526 less on average than the poverty threshold level.
What is Inequality or Gini Index in Knoxville?
Inequality or Gini Index in Knoxville is 0.49.
What is the Total Population of Knoxville?
Total Population of Knoxville is 191,857.
What is the Total Male Population of Knoxville?
Total Male Population of Knoxville is 93,069.
What is the Total Female Population of Knoxville?
Total Female Population of Knoxville is 98,788.
What is the Ratio of Males per 100 Females in Knoxville?
There are 94.21 Males per 100 Females in Knoxville.
What is the Ratio of Females per 100 Males in Knoxville?
There are 106.14 Females per 100 Males in Knoxville.
What is the Median Population Age in Knoxville?
Median Population Age in Knoxville is 33.4 Years.
What is the Average Family Size in Knoxville
Average Family Size in Knoxville is 3.0 People.
What is the Average Household Size in Knoxville
Average Household Size in Knoxville is 2.2 People.
How Large is the Labor Force in Knoxville?
There are 102,116 People in the Labor Forcein in Knoxville.
What is the Percentage of People in the Labor Force in Knoxville?
63.4% of People are in the Labor Force in Knoxville.
What is the Unemployment Rate in Knoxville?
Unemployment Rate in Knoxville is 4.8%.