Tacoma, WA Map & Demographics
Tacoma Map
Tacoma Overview
$41,788
PER CAPITA INCOME
$96,784
AVG FAMILY INCOME
$79,085
AVG HOUSEHOLD INCOME
19.3%
WAGE / INCOME GAP [ % ]
80.7¢/ $1
WAGE / INCOME GAP [ $ ]
$11,996
FAMILY INCOME DEFICIT
0.43
INEQUALITY / GINI INDEX
219,234
TOTAL POPULATION
110,127
MALE POPULATION
109,107
FEMALE POPULATION
100.93
MALES / 100 FEMALES
99.07
FEMALES / 100 MALES
36.9
MEDIAN AGE
3.0
AVG FAMILY SIZE
2.4
AVG HOUSEHOLD SIZE
120,087
LABOR FORCE [ PEOPLE ]
66.7%
PERCENT IN LABOR FORCE
5.4%
UNEMPLOYMENT RATE
Tacoma Zip Codes
Tacoma Area Codes
Income in Tacoma
Income Overview in Tacoma
Per Capita Income in Tacoma is $41,788, while median incomes of families and households are $96,784 and $79,085 respectively.
| Characteristic | Number | Measure |
| Per Capita Income | 219,234 | $41,788 |
| Median Family Income | 51,920 | $96,784 |
| Mean Family Income | 51,920 | $115,833 |
| Median Household Income | 89,228 | $79,085 |
| Mean Household Income | 89,228 | $100,055 |
| Income Deficit | 51,920 | $11,996 |
| Wage / Income Gap (%) | 219,234 | 19.34% |
| Wage / Income Gap ($) | 219,234 | 80.66¢ per $1 |
| Gini / Inequality Index | 219,234 | 0.43 |
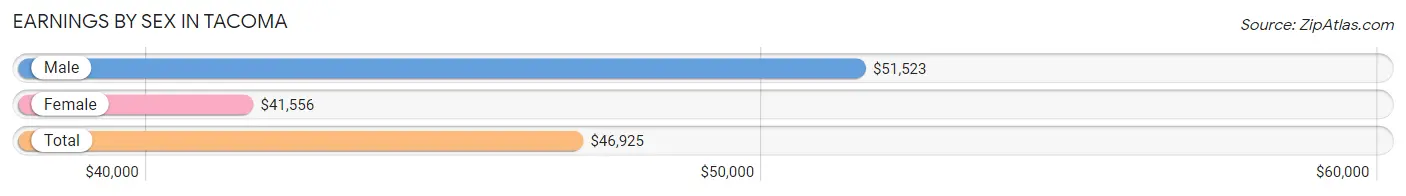
Earnings by Sex in Tacoma
Average Earnings in Tacoma are $46,925, $51,523 for men and $41,556 for women, a difference of 19.3%.
| Sex | Number | Average Earnings |
| Male | 65,316 (52.3%) | $51,523 |
| Female | 59,552 (47.7%) | $41,556 |
| Total | 124,868 (100.0%) | $46,925 |
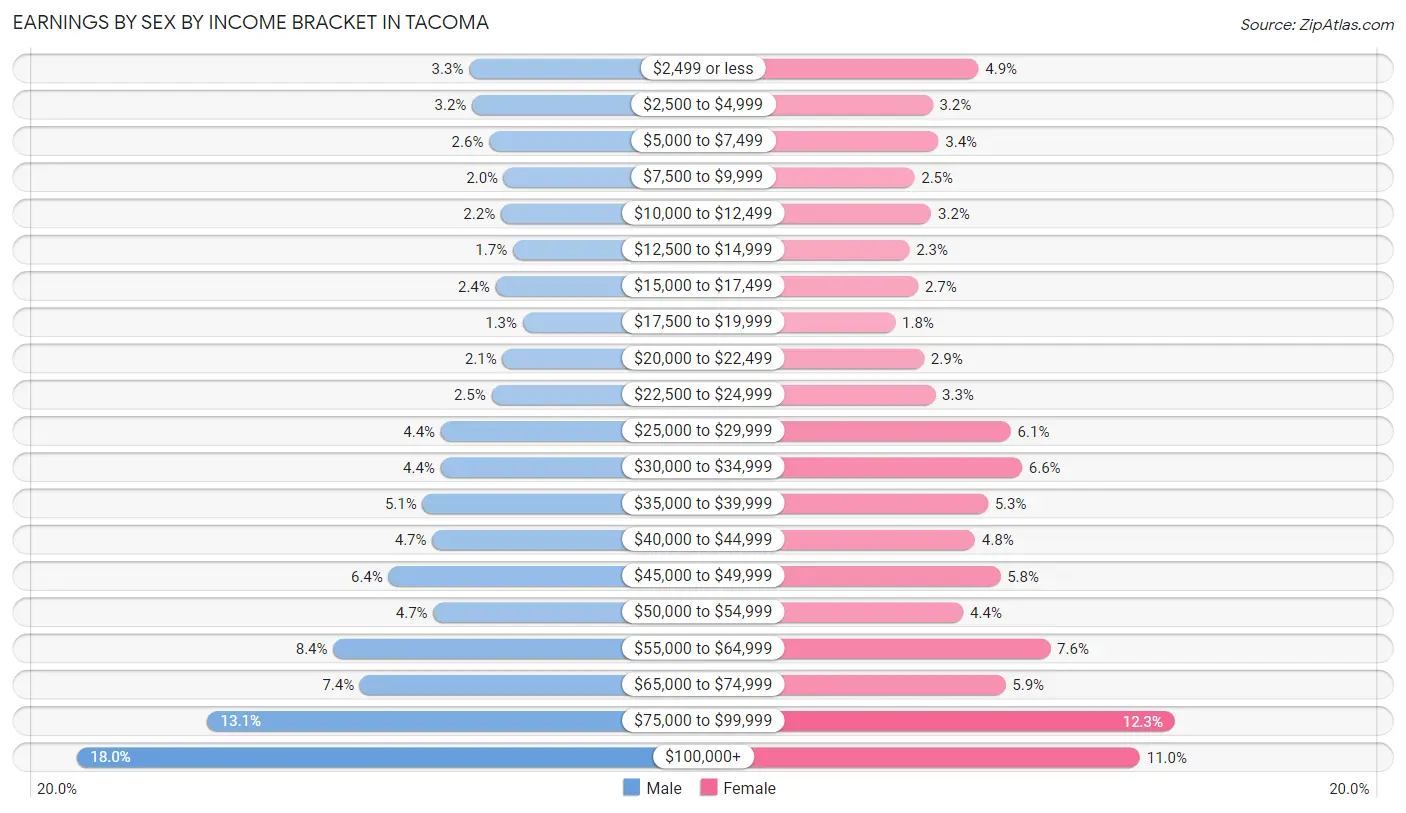
Earnings by Sex by Income Bracket in Tacoma
The most common earnings brackets in Tacoma are $100,000+ for men (11,769 | 18.0%) and $75,000 to $99,999 for women (7,317 | 12.3%).
| Income | Male | Female |
| $2,499 or less | 2,183 (3.3%) | 2,937 (4.9%) |
| $2,500 to $4,999 | 2,111 (3.2%) | 1,911 (3.2%) |
| $5,000 to $7,499 | 1,689 (2.6%) | 2,044 (3.4%) |
| $7,500 to $9,999 | 1,332 (2.0%) | 1,506 (2.5%) |
| $10,000 to $12,499 | 1,403 (2.1%) | 1,881 (3.2%) |
| $12,500 to $14,999 | 1,111 (1.7%) | 1,392 (2.3%) |
| $15,000 to $17,499 | 1,536 (2.4%) | 1,589 (2.7%) |
| $17,500 to $19,999 | 866 (1.3%) | 1,076 (1.8%) |
| $20,000 to $22,499 | 1,368 (2.1%) | 1,721 (2.9%) |
| $22,500 to $24,999 | 1,631 (2.5%) | 1,972 (3.3%) |
| $25,000 to $29,999 | 2,875 (4.4%) | 3,659 (6.1%) |
| $30,000 to $34,999 | 2,880 (4.4%) | 3,905 (6.6%) |
| $35,000 to $39,999 | 3,323 (5.1%) | 3,147 (5.3%) |
| $40,000 to $44,999 | 3,086 (4.7%) | 2,861 (4.8%) |
| $45,000 to $49,999 | 4,157 (6.4%) | 3,427 (5.8%) |
| $50,000 to $54,999 | 3,054 (4.7%) | 2,596 (4.4%) |
| $55,000 to $64,999 | 5,505 (8.4%) | 4,539 (7.6%) |
| $65,000 to $74,999 | 4,854 (7.4%) | 3,535 (5.9%) |
| $75,000 to $99,999 | 8,583 (13.1%) | 7,317 (12.3%) |
| $100,000+ | 11,769 (18.0%) | 6,537 (11.0%) |
| Total | 65,316 (100.0%) | 59,552 (100.0%) |
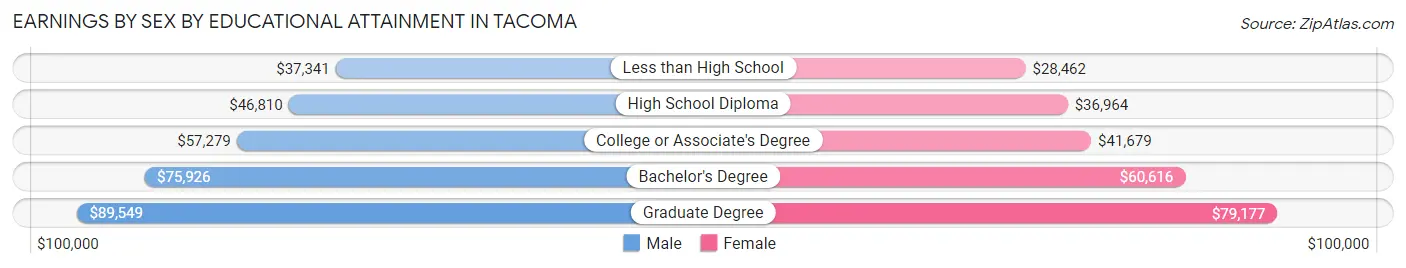
Earnings by Sex by Educational Attainment in Tacoma
Average earnings in Tacoma are $57,329 for men and $47,212 for women, a difference of 17.6%. Men with an educational attainment of graduate degree enjoy the highest average annual earnings of $89,549, while those with less than high school education earn the least with $37,341. Women with an educational attainment of graduate degree earn the most with the average annual earnings of $79,177, while those with less than high school education have the smallest earnings of $28,462.
| Educational Attainment | Male Income | Female Income |
| Less than High School | $37,341 | $28,462 |
| High School Diploma | $46,810 | $36,964 |
| College or Associate's Degree | $57,279 | $41,679 |
| Bachelor's Degree | $75,926 | $60,616 |
| Graduate Degree | $89,549 | $79,177 |
| Total | $57,329 | $47,212 |
Family Income in Tacoma
Family Income Brackets in Tacoma
According to the Tacoma family income data, there are 11,890 families falling into the $100,000 to $149,999 income range, which is the most common income bracket and makes up 22.9% of all families. Conversely, the $10,000 to $14,999 income bracket is the least frequent group with only 675 families (1.3%) belonging to this category.
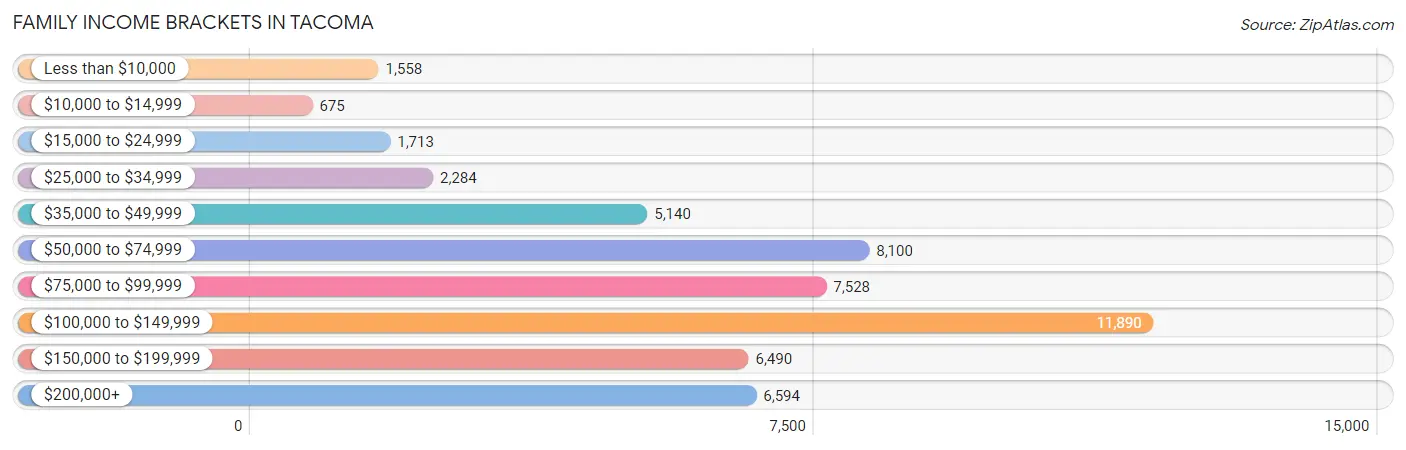
| Income Bracket | # Families | % Families |
| Less than $10,000 | 1,558 | 3.0% |
| $10,000 to $14,999 | 675 | 1.3% |
| $15,000 to $24,999 | 1,713 | 3.3% |
| $25,000 to $34,999 | 2,284 | 4.4% |
| $35,000 to $49,999 | 5,140 | 9.9% |
| $50,000 to $74,999 | 8,100 | 15.6% |
| $75,000 to $99,999 | 7,528 | 14.5% |
| $100,000 to $149,999 | 11,890 | 22.9% |
| $150,000 to $199,999 | 6,490 | 12.5% |
| $200,000+ | 6,594 | 12.7% |
Family Income by Famaliy Size in Tacoma
7+ person families (739 | 1.4%) account for the highest median family income in Tacoma with $141,146 per family, while 2-person families (25,812 | 49.7%) have the highest median income of $44,898 per family member.
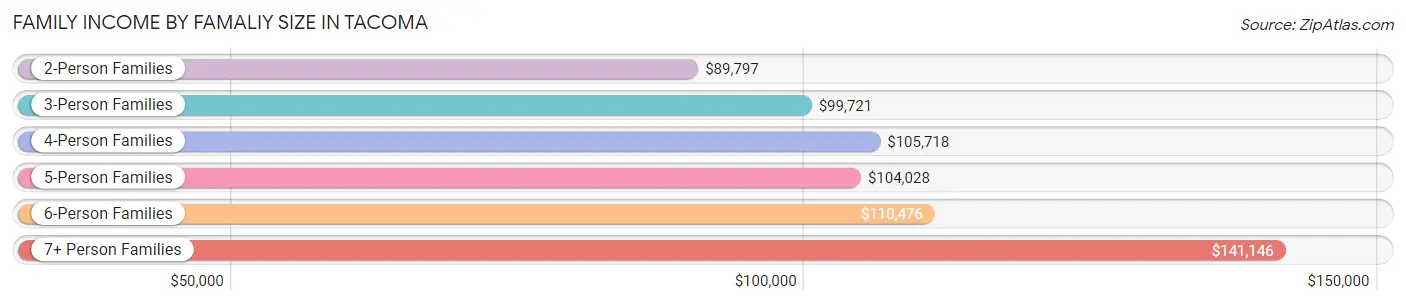
| Income Bracket | # Families | Median Income |
| 2-Person Families | 25,812 (49.7%) | $89,797 |
| 3-Person Families | 11,371 (21.9%) | $99,721 |
| 4-Person Families | 9,711 (18.7%) | $105,718 |
| 5-Person Families | 3,203 (6.2%) | $104,028 |
| 6-Person Families | 1,084 (2.1%) | $110,476 |
| 7+ Person Families | 739 (1.4%) | $141,146 |
| Total | 51,920 (100.0%) | $96,784 |
Family Income by Number of Earners in Tacoma
The median family income in Tacoma is $96,784, with families comprising 3+ earners (5,013) having the highest median family income of $149,830, while families with no earners (6,262) have the lowest median family income of $55,804, accounting for 9.7% and 12.1% of families, respectively.
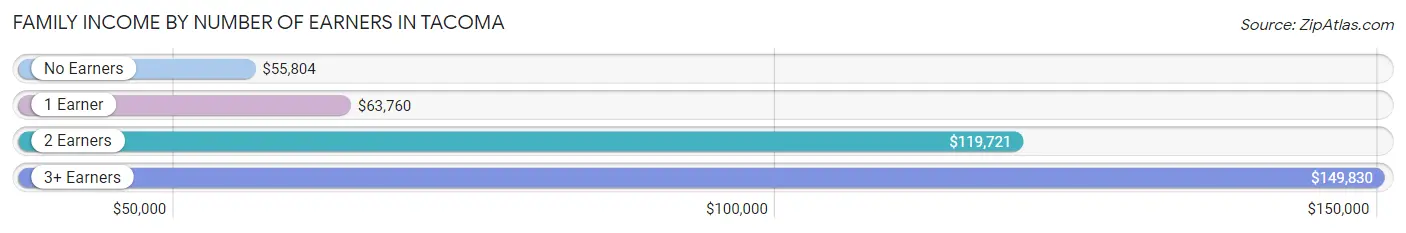
| Number of Earners | # Families | Median Income |
| No Earners | 6,262 (12.1%) | $55,804 |
| 1 Earner | 17,050 (32.8%) | $63,760 |
| 2 Earners | 23,595 (45.4%) | $119,721 |
| 3+ Earners | 5,013 (9.7%) | $149,830 |
| Total | 51,920 (100.0%) | $96,784 |
Household Income in Tacoma
Household Income Brackets in Tacoma
With 17,578 households falling in the category, the $100,000 to $149,999 income range is the most frequent in Tacoma, accounting for 19.7% of all households. In contrast, only 3,301 households (3.7%) fall into the $10,000 to $14,999 income bracket, making it the least populous group.
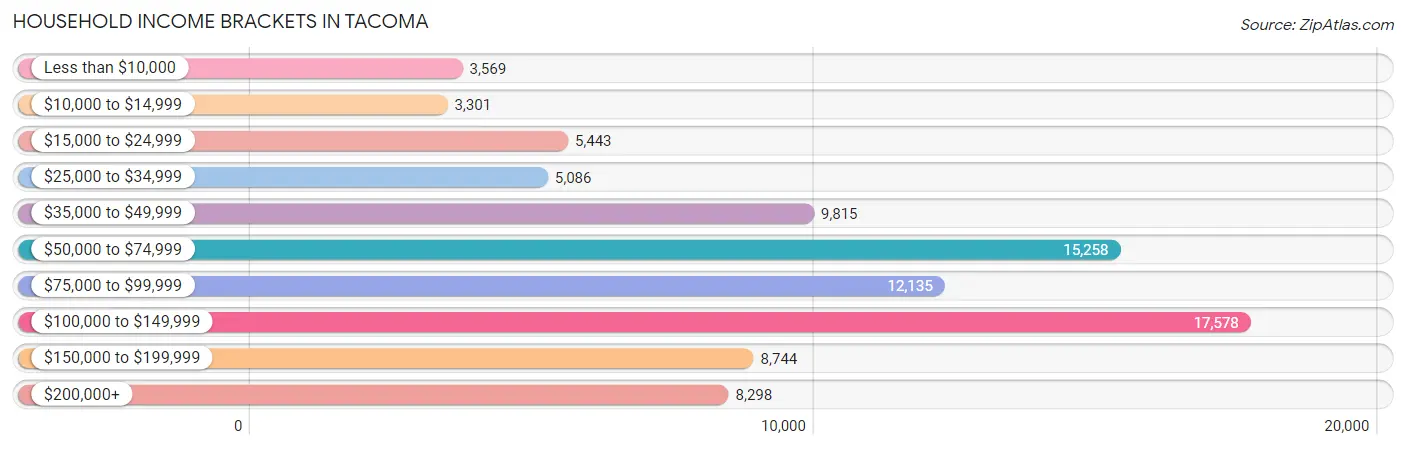
| Income Bracket | # Households | % Households |
| Less than $10,000 | 3,569 | 4.0% |
| $10,000 to $14,999 | 3,301 | 3.7% |
| $15,000 to $24,999 | 5,443 | 6.1% |
| $25,000 to $34,999 | 5,086 | 5.7% |
| $35,000 to $49,999 | 9,815 | 11.0% |
| $50,000 to $74,999 | 15,258 | 17.1% |
| $75,000 to $99,999 | 12,135 | 13.6% |
| $100,000 to $149,999 | 17,578 | 19.7% |
| $150,000 to $199,999 | 8,744 | 9.8% |
| $200,000+ | 8,298 | 9.3% |
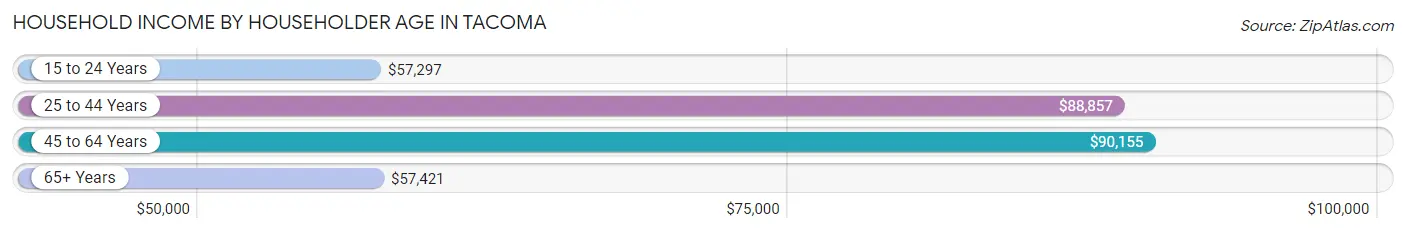
Household Income by Householder Age in Tacoma
The median household income in Tacoma is $79,085, with the highest median household income of $90,155 found in the 45 to 64 years age bracket for the primary householder. A total of 30,326 households (34.0%) fall into this category. Meanwhile, the 15 to 24 years age bracket for the primary householder has the lowest median household income of $57,297, with 4,860 households (5.4%) in this group.
| Income Bracket | # Households | Median Income |
| 15 to 24 Years | 4,860 (5.4%) | $57,297 |
| 25 to 44 Years | 34,949 (39.2%) | $88,857 |
| 45 to 64 Years | 30,326 (34.0%) | $90,155 |
| 65+ Years | 19,093 (21.4%) | $57,421 |
| Total | 89,228 (100.0%) | $79,085 |
Poverty in Tacoma
Income Below Poverty by Sex and Age in Tacoma
With 11.7% poverty level for males and 12.6% for females among the residents of Tacoma, 15 year old males and 12 to 14 year old females are the most vulnerable to poverty, with 254 males (20.7%) and 796 females (19.7%) in their respective age groups living below the poverty level.
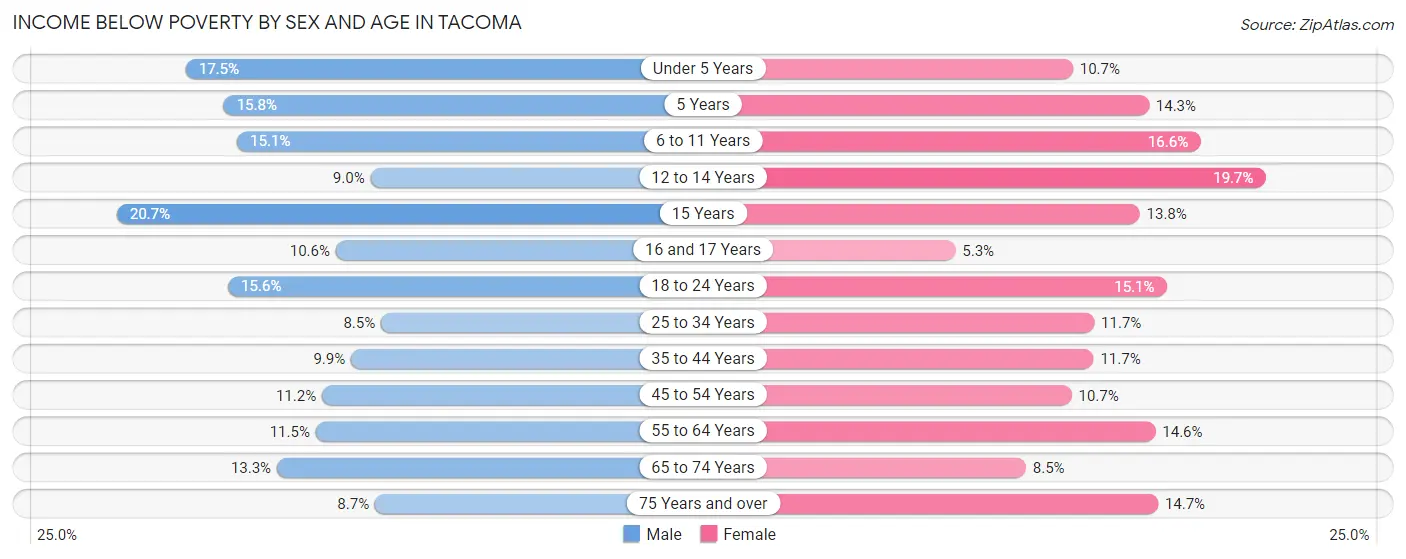
| Age Bracket | Male | Female |
| Under 5 Years | 1,127 (17.5%) | 677 (10.7%) |
| 5 Years | 223 (15.8%) | 154 (14.2%) |
| 6 to 11 Years | 1,048 (15.1%) | 1,015 (16.6%) |
| 12 to 14 Years | 334 (8.9%) | 796 (19.7%) |
| 15 Years | 254 (20.7%) | 145 (13.8%) |
| 16 and 17 Years | 202 (10.6%) | 114 (5.3%) |
| 18 to 24 Years | 1,502 (15.6%) | 1,453 (15.1%) |
| 25 to 34 Years | 1,659 (8.5%) | 2,171 (11.7%) |
| 35 to 44 Years | 1,662 (9.9%) | 1,865 (11.7%) |
| 45 to 54 Years | 1,513 (11.2%) | 1,349 (10.7%) |
| 55 to 64 Years | 1,522 (11.5%) | 1,844 (14.5%) |
| 65 to 74 Years | 1,184 (13.3%) | 838 (8.5%) |
| 75 Years and over | 398 (8.7%) | 999 (14.7%) |
| Total | 12,628 (11.7%) | 13,420 (12.6%) |
Income Above Poverty by Sex and Age in Tacoma
According to the poverty statistics in Tacoma, males aged 25 to 34 years and females aged 16 and 17 years are the age groups that are most secure financially, with 91.5% of males and 94.7% of females in these age groups living above the poverty line.
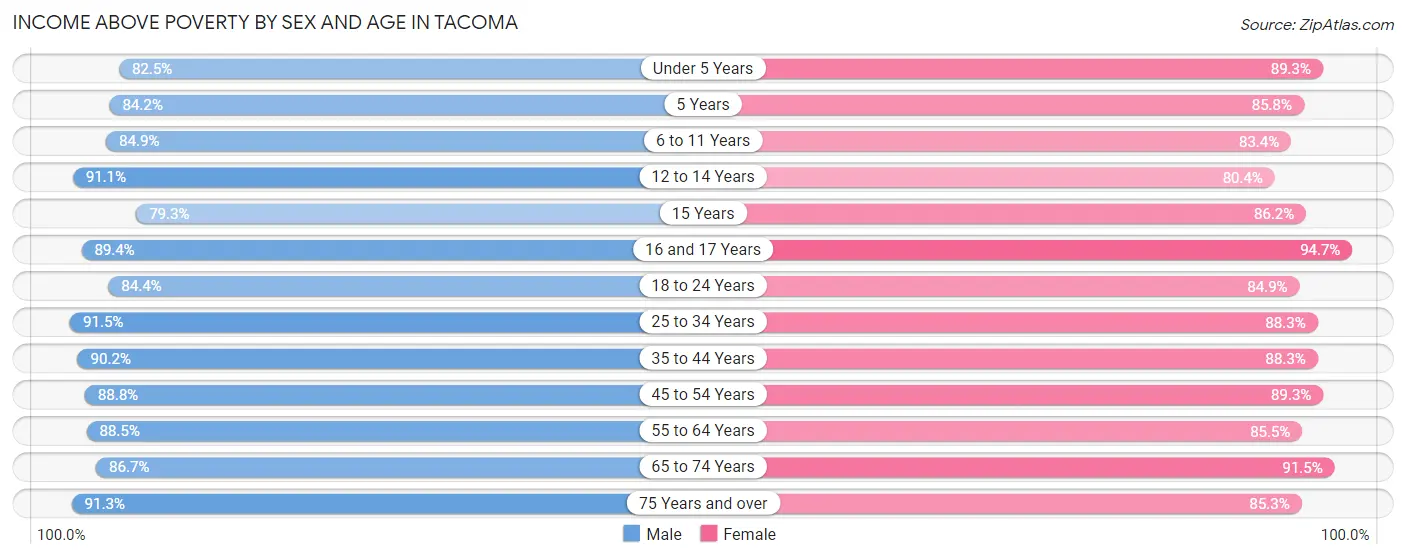
| Age Bracket | Male | Female |
| Under 5 Years | 5,307 (82.5%) | 5,637 (89.3%) |
| 5 Years | 1,192 (84.2%) | 927 (85.8%) |
| 6 to 11 Years | 5,876 (84.9%) | 5,093 (83.4%) |
| 12 to 14 Years | 3,398 (91.0%) | 3,255 (80.3%) |
| 15 Years | 972 (79.3%) | 904 (86.2%) |
| 16 and 17 Years | 1,711 (89.4%) | 2,049 (94.7%) |
| 18 to 24 Years | 8,151 (84.4%) | 8,194 (84.9%) |
| 25 to 34 Years | 17,962 (91.5%) | 16,376 (88.3%) |
| 35 to 44 Years | 15,214 (90.1%) | 14,100 (88.3%) |
| 45 to 54 Years | 11,998 (88.8%) | 11,302 (89.3%) |
| 55 to 64 Years | 11,724 (88.5%) | 10,828 (85.5%) |
| 65 to 74 Years | 7,723 (86.7%) | 8,975 (91.5%) |
| 75 Years and over | 4,158 (91.3%) | 5,809 (85.3%) |
| Total | 95,386 (88.3%) | 93,449 (87.4%) |
Income Below Poverty Among Married-Couple Families in Tacoma
The poverty statistics for married-couple families in Tacoma show that 3.7% or 1,350 of the total 36,026 families live below the poverty line. Families with 5 or more children have the highest poverty rate of 16.1%, comprising of 35 families. On the other hand, families with no children have the lowest poverty rate of 2.7%, which includes 594 families.
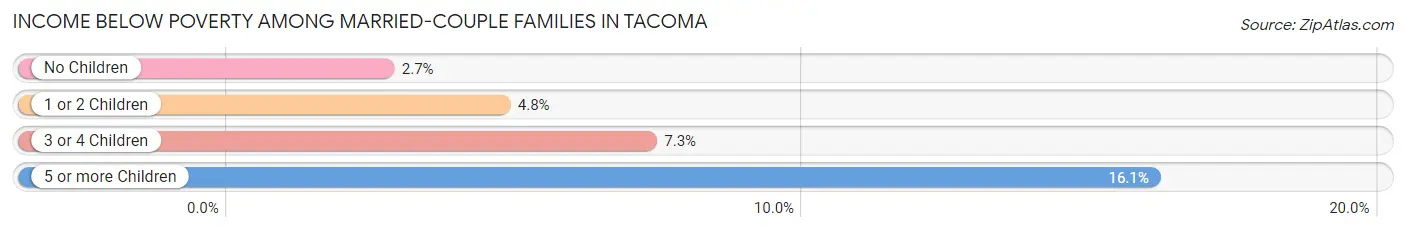
| Children | Above Poverty | Below Poverty |
| No Children | 21,155 (97.3%) | 594 (2.7%) |
| 1 or 2 Children | 11,395 (95.3%) | 568 (4.8%) |
| 3 or 4 Children | 1,943 (92.7%) | 153 (7.3%) |
| 5 or more Children | 183 (83.9%) | 35 (16.1%) |
| Total | 34,676 (96.3%) | 1,350 (3.7%) |
Income Below Poverty Among Single-Parent Households in Tacoma
According to the poverty data in Tacoma, 11.6% or 586 single-father households and 16.9% or 1,830 single-mother households are living below the poverty line. Among single-father households, those with 3 or 4 children have the highest poverty rate, with 183 households (47.2%) experiencing poverty. Likewise, among single-mother households, those with 5 or more children have the highest poverty rate, with 1 households (100.0%) falling below the poverty line.
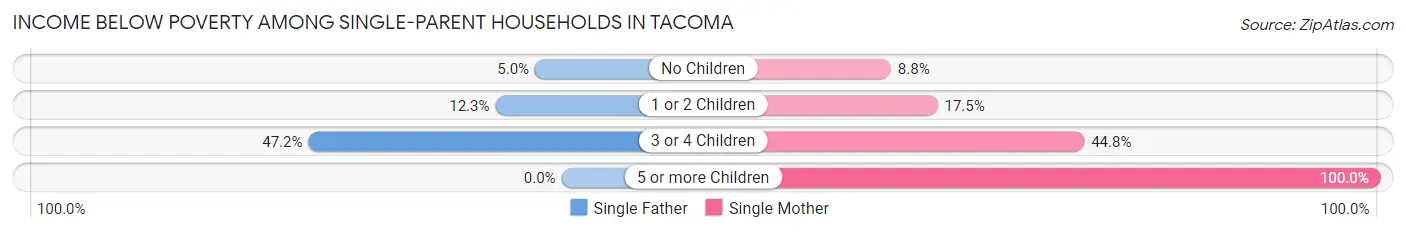
| Children | Single Father | Single Mother |
| No Children | 110 (5.0%) | 349 (8.8%) |
| 1 or 2 Children | 293 (12.3%) | 1,027 (17.5%) |
| 3 or 4 Children | 183 (47.2%) | 453 (44.8%) |
| 5 or more Children | 0 (0.0%) | 1 (100.0%) |
| Total | 586 (11.6%) | 1,830 (16.9%) |
Income Below Poverty Among Married-Couple vs Single-Parent Households in Tacoma
The poverty data for Tacoma shows that 1,350 of the married-couple family households (3.7%) and 2,416 of the single-parent households (15.2%) are living below the poverty level. Within the married-couple family households, those with 5 or more children have the highest poverty rate, with 35 households (16.1%) falling below the poverty line. Among the single-parent households, those with 3 or 4 children have the highest poverty rate, with 636 household (45.5%) living below poverty.
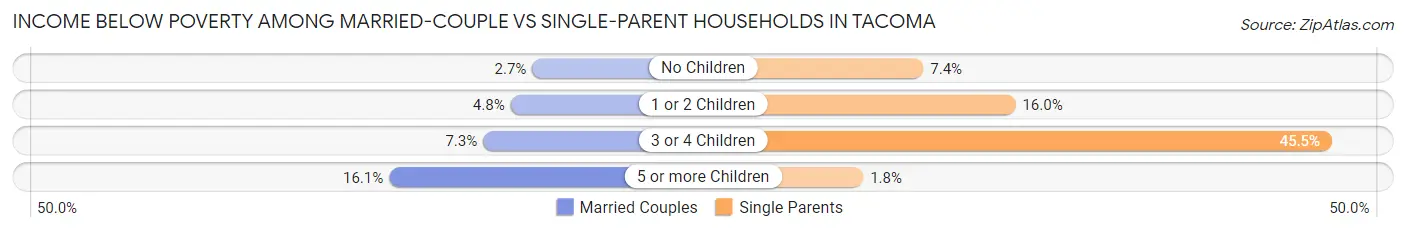
| Children | Married-Couple Families | Single-Parent Households |
| No Children | 594 (2.7%) | 459 (7.4%) |
| 1 or 2 Children | 568 (4.8%) | 1,320 (16.0%) |
| 3 or 4 Children | 153 (7.3%) | 636 (45.5%) |
| 5 or more Children | 35 (16.1%) | 1 (1.8%) |
| Total | 1,350 (3.7%) | 2,416 (15.2%) |
Race in Tacoma
The most populous races in Tacoma are White / Caucasian (134,439 | 61.3%), Two or more Races (27,972 | 12.8%), and Hispanic or Latino (26,947 | 12.3%).
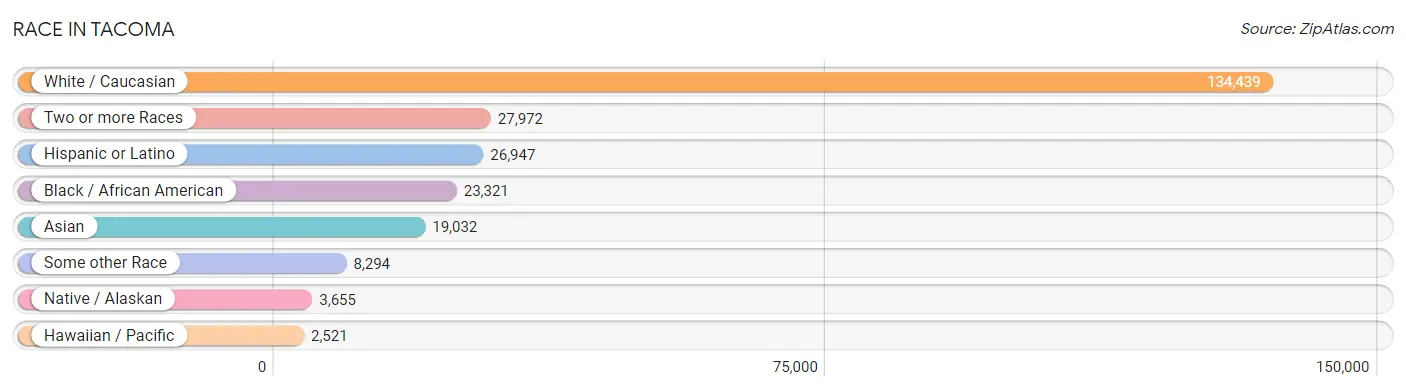
| Race | # Population | % Population |
| Asian | 19,032 | 8.7% |
| Black / African American | 23,321 | 10.6% |
| Hawaiian / Pacific | 2,521 | 1.1% |
| Hispanic or Latino | 26,947 | 12.3% |
| Native / Alaskan | 3,655 | 1.7% |
| White / Caucasian | 134,439 | 61.3% |
| Two or more Races | 27,972 | 12.8% |
| Some other Race | 8,294 | 3.8% |
| Total | 219,234 | 100.0% |
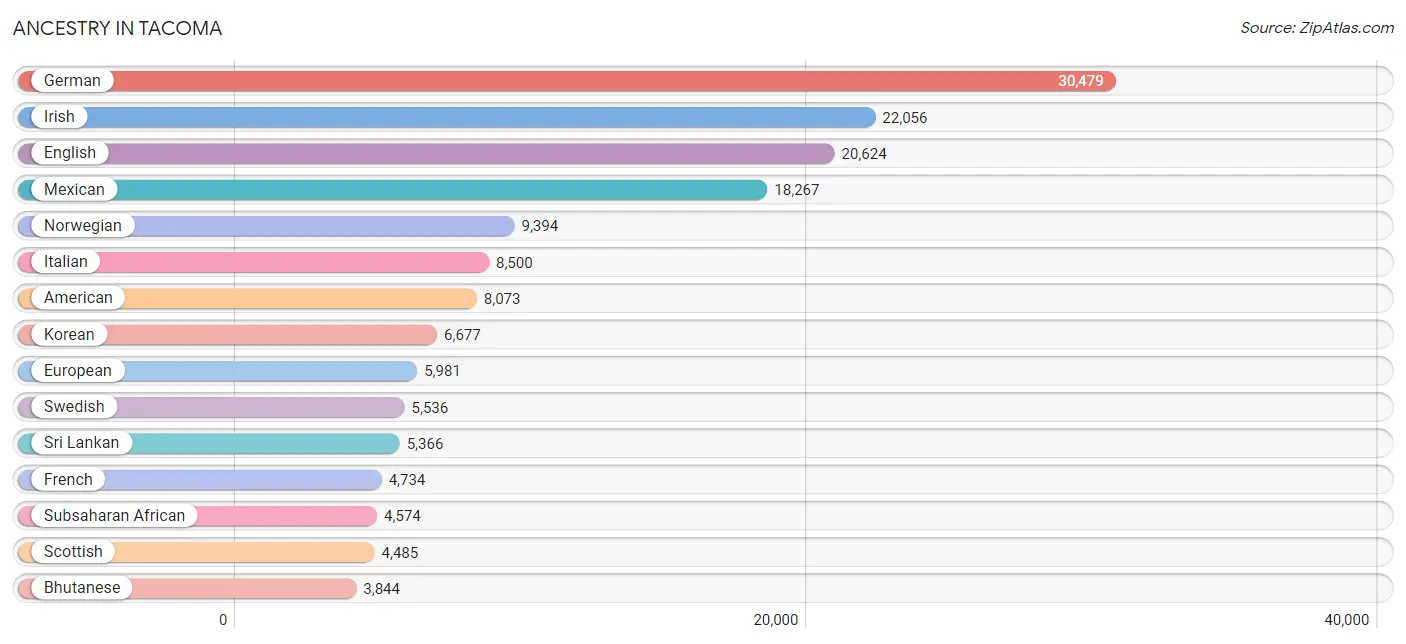
Ancestry in Tacoma
The most populous ancestries reported in Tacoma are German (30,479 | 13.9%), Irish (22,056 | 10.1%), English (20,624 | 9.4%), Mexican (18,267 | 8.3%), and Norwegian (9,394 | 4.3%), together accounting for 46.0% of all Tacoma residents.
| Ancestry | # Population | % Population |
| Afghan | 53 | 0.0% |
| African | 2,907 | 1.3% |
| Alaska Native | 149 | 0.1% |
| Alaskan Athabascan | 59 | 0.0% |
| Albanian | 48 | 0.0% |
| Aleut | 134 | 0.1% |
| American | 8,073 | 3.7% |
| Apache | 419 | 0.2% |
| Arab | 798 | 0.4% |
| Argentinean | 24 | 0.0% |
| Armenian | 73 | 0.0% |
| Assyrian / Chaldean / Syriac | 13 | 0.0% |
| Australian | 41 | 0.0% |
| Austrian | 351 | 0.2% |
| Bangladeshi | 54 | 0.0% |
| Barbadian | 16 | 0.0% |
| Basque | 70 | 0.0% |
| Belgian | 163 | 0.1% |
| Belizean | 91 | 0.0% |
| Bhutanese | 3,844 | 1.8% |
| Blackfeet | 941 | 0.4% |
| Bolivian | 9 | 0.0% |
| Brazilian | 86 | 0.0% |
| British | 1,641 | 0.7% |
| British West Indian | 66 | 0.0% |
| Bulgarian | 131 | 0.1% |
| Burmese | 3,676 | 1.7% |
| Canadian | 520 | 0.2% |
| Carpatho Rusyn | 19 | 0.0% |
| Celtic | 44 | 0.0% |
| Central American | 2,676 | 1.2% |
| Central American Indian | 269 | 0.1% |
| Cherokee | 1,820 | 0.8% |
| Chickasaw | 62 | 0.0% |
| Chilean | 77 | 0.0% |
| Chinese | 65 | 0.0% |
| Chippewa | 523 | 0.2% |
| Choctaw | 542 | 0.3% |
| Colombian | 217 | 0.1% |
| Colville | 148 | 0.1% |
| Comanche | 24 | 0.0% |
| Costa Rican | 83 | 0.0% |
| Cree | 28 | 0.0% |
| Creek | 56 | 0.0% |
| Croatian | 572 | 0.3% |
| Crow | 12 | 0.0% |
| Cuban | 541 | 0.3% |
| Czech | 702 | 0.3% |
| Czechoslovakian | 137 | 0.1% |
| Danish | 1,074 | 0.5% |
| Delaware | 30 | 0.0% |
| Dominican | 119 | 0.1% |
| Dutch | 2,498 | 1.1% |
| Dutch West Indian | 3 | 0.0% |
| Eastern European | 967 | 0.4% |
| Ecuadorian | 36 | 0.0% |
| Egyptian | 29 | 0.0% |
| English | 20,624 | 9.4% |
| Estonian | 19 | 0.0% |
| Ethiopian | 172 | 0.1% |
| European | 5,981 | 2.7% |
| Fijian | 29 | 0.0% |
| Filipino | 155 | 0.1% |
| Finnish | 916 | 0.4% |
| French | 4,734 | 2.2% |
| French American Indian | 170 | 0.1% |
| French Canadian | 1,209 | 0.5% |
| German | 30,479 | 13.9% |
| German Russian | 13 | 0.0% |
| Ghanaian | 3 | 0.0% |
| Greek | 734 | 0.3% |
| Guamanian / Chamorro | 813 | 0.4% |
| Guatemalan | 373 | 0.2% |
| Haitian | 60 | 0.0% |
| Honduran | 386 | 0.2% |
| Hopi | 5 | 0.0% |
| Houma | 39 | 0.0% |
| Hungarian | 382 | 0.2% |
| Icelander | 162 | 0.1% |
| Indian (Asian) | 2,646 | 1.2% |
| Indonesian | 205 | 0.1% |
| Inupiat | 23 | 0.0% |
| Iranian | 347 | 0.2% |
| Irish | 22,056 | 10.1% |
| Iroquois | 105 | 0.1% |
| Italian | 8,500 | 3.9% |
| Jamaican | 277 | 0.1% |
| Japanese | 3,790 | 1.7% |
| Jordanian | 18 | 0.0% |
| Kenyan | 674 | 0.3% |
| Korean | 6,677 | 3.0% |
| Laotian | 156 | 0.1% |
| Latvian | 65 | 0.0% |
| Lebanese | 266 | 0.1% |
| Liberian | 64 | 0.0% |
| Lithuanian | 273 | 0.1% |
| Macedonian | 48 | 0.0% |
| Malaysian | 1,119 | 0.5% |
| Mexican | 18,267 | 8.3% |
| Mexican American Indian | 768 | 0.4% |
| Moroccan | 17 | 0.0% |
| Native Hawaiian | 1,316 | 0.6% |
| Navajo | 718 | 0.3% |
| New Zealander | 24 | 0.0% |
| Nicaraguan | 115 | 0.1% |
| Nigerian | 173 | 0.1% |
| Northern European | 937 | 0.4% |
| Norwegian | 9,394 | 4.3% |
| Pakistani | 553 | 0.3% |
| Palestinian | 289 | 0.1% |
| Panamanian | 454 | 0.2% |
| Pennsylvania German | 15 | 0.0% |
| Peruvian | 152 | 0.1% |
| Polish | 2,862 | 1.3% |
| Portuguese | 566 | 0.3% |
| Pueblo | 117 | 0.1% |
| Puerto Rican | 2,598 | 1.2% |
| Puget Sound Salish | 1,492 | 0.7% |
| Romanian | 402 | 0.2% |
| Russian | 1,736 | 0.8% |
| Salvadoran | 1,247 | 0.6% |
| Samoan | 2,027 | 0.9% |
| Scandinavian | 1,824 | 0.8% |
| Scotch-Irish | 2,101 | 1.0% |
| Scottish | 4,485 | 2.1% |
| Serbian | 38 | 0.0% |
| Shoshone | 18 | 0.0% |
| Sioux | 361 | 0.2% |
| Slavic | 217 | 0.1% |
| Slovak | 240 | 0.1% |
| Slovene | 29 | 0.0% |
| Somali | 69 | 0.0% |
| South African | 28 | 0.0% |
| South American | 585 | 0.3% |
| South American Indian | 4 | 0.0% |
| Spaniard | 1,047 | 0.5% |
| Spanish | 567 | 0.3% |
| Sri Lankan | 5,366 | 2.5% |
| Subsaharan African | 4,574 | 2.1% |
| Swedish | 5,536 | 2.5% |
| Swiss | 603 | 0.3% |
| Syrian | 29 | 0.0% |
| Taiwanese | 26 | 0.0% |
| Thai | 947 | 0.4% |
| Tlingit-Haida | 314 | 0.1% |
| Tohono O'Odham | 35 | 0.0% |
| Tongan | 153 | 0.1% |
| Trinidadian and Tobagonian | 146 | 0.1% |
| Tsimshian | 48 | 0.0% |
| Turkish | 111 | 0.1% |
| Ugandan | 74 | 0.0% |
| Ukrainian | 2,331 | 1.1% |
| Venezuelan | 70 | 0.0% |
| Vietnamese | 76 | 0.0% |
| Welsh | 1,448 | 0.7% |
| West Indian | 102 | 0.1% |
| Yakama | 219 | 0.1% |
| Yaqui | 38 | 0.0% |
| Yugoslavian | 120 | 0.1% |
| Yup'ik | 77 | 0.0% | View All 160 Rows |
Immigrants in Tacoma
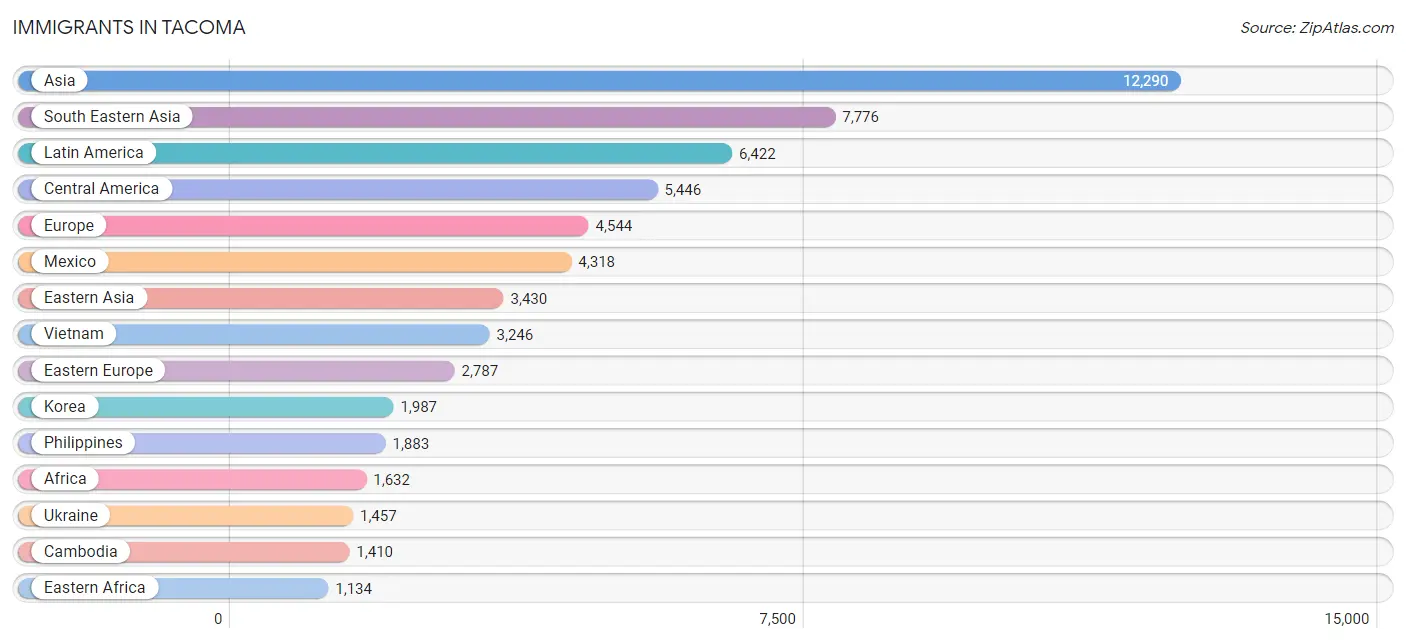
The most numerous immigrant groups reported in Tacoma came from Asia (12,290 | 5.6%), South Eastern Asia (7,776 | 3.5%), Latin America (6,422 | 2.9%), Central America (5,446 | 2.5%), and Europe (4,544 | 2.1%), together accounting for 16.6% of all Tacoma residents.
| Immigration Origin | # Population | % Population |
| Afghanistan | 25 | 0.0% |
| Africa | 1,632 | 0.7% |
| Argentina | 13 | 0.0% |
| Asia | 12,290 | 5.6% |
| Australia | 33 | 0.0% |
| Bangladesh | 46 | 0.0% |
| Barbados | 22 | 0.0% |
| Belarus | 21 | 0.0% |
| Belgium | 7 | 0.0% |
| Belize | 39 | 0.0% |
| Bosnia and Herzegovina | 5 | 0.0% |
| Brazil | 95 | 0.0% |
| Bulgaria | 22 | 0.0% |
| Cambodia | 1,410 | 0.6% |
| Cameroon | 22 | 0.0% |
| Canada | 889 | 0.4% |
| Caribbean | 595 | 0.3% |
| Central America | 5,446 | 2.5% |
| Chile | 23 | 0.0% |
| China | 942 | 0.4% |
| Colombia | 78 | 0.0% |
| Congo | 38 | 0.0% |
| Costa Rica | 25 | 0.0% |
| Cuba | 258 | 0.1% |
| Czechoslovakia | 36 | 0.0% |
| Denmark | 19 | 0.0% |
| Dominican Republic | 83 | 0.0% |
| Eastern Africa | 1,134 | 0.5% |
| Eastern Asia | 3,430 | 1.6% |
| Eastern Europe | 2,787 | 1.3% |
| Ecuador | 4 | 0.0% |
| Egypt | 34 | 0.0% |
| El Salvador | 537 | 0.2% |
| England | 226 | 0.1% |
| Ethiopia | 129 | 0.1% |
| Europe | 4,544 | 2.1% |
| Fiji | 166 | 0.1% |
| France | 65 | 0.0% |
| Germany | 659 | 0.3% |
| Ghana | 34 | 0.0% |
| Greece | 53 | 0.0% |
| Guatemala | 254 | 0.1% |
| Honduras | 185 | 0.1% |
| Hong Kong | 53 | 0.0% |
| Hungary | 13 | 0.0% |
| India | 442 | 0.2% |
| Indonesia | 199 | 0.1% |
| Iran | 285 | 0.1% |
| Iraq | 4 | 0.0% |
| Ireland | 3 | 0.0% |
| Israel | 38 | 0.0% |
| Italy | 74 | 0.0% |
| Jamaica | 93 | 0.0% |
| Japan | 501 | 0.2% |
| Kazakhstan | 36 | 0.0% |
| Kenya | 781 | 0.4% |
| Korea | 1,987 | 0.9% |
| Laos | 555 | 0.3% |
| Latin America | 6,422 | 2.9% |
| Latvia | 23 | 0.0% |
| Lebanon | 4 | 0.0% |
| Liberia | 37 | 0.0% |
| Malaysia | 8 | 0.0% |
| Mexico | 4,318 | 2.0% |
| Micronesia | 18 | 0.0% |
| Middle Africa | 128 | 0.1% |
| Moldova | 279 | 0.1% |
| Morocco | 5 | 0.0% |
| Nepal | 55 | 0.0% |
| Netherlands | 141 | 0.1% |
| Nicaragua | 27 | 0.0% |
| Nigeria | 65 | 0.0% |
| North Macedonia | 15 | 0.0% |
| Northern Africa | 60 | 0.0% |
| Northern Europe | 695 | 0.3% |
| Norway | 46 | 0.0% |
| Oceania | 844 | 0.4% |
| Pakistan | 20 | 0.0% |
| Panama | 61 | 0.0% |
| Peru | 98 | 0.0% |
| Philippines | 1,883 | 0.9% |
| Poland | 48 | 0.0% |
| Romania | 43 | 0.0% |
| Russia | 811 | 0.4% |
| Saudi Arabia | 4 | 0.0% |
| Scotland | 69 | 0.0% |
| Singapore | 10 | 0.0% |
| Somalia | 69 | 0.0% |
| South Africa | 55 | 0.0% |
| South America | 381 | 0.2% |
| South Central Asia | 937 | 0.4% |
| South Eastern Asia | 7,776 | 3.5% |
| Southern Europe | 182 | 0.1% |
| Spain | 55 | 0.0% |
| Switzerland | 8 | 0.0% |
| Taiwan | 80 | 0.0% |
| Thailand | 371 | 0.2% |
| Trinidad and Tobago | 84 | 0.0% |
| Turkey | 28 | 0.0% |
| Uganda | 130 | 0.1% |
| Ukraine | 1,457 | 0.7% |
| Uzbekistan | 15 | 0.0% |
| Venezuela | 70 | 0.0% |
| Vietnam | 3,246 | 1.5% |
| West Indies | 46 | 0.0% |
| Western Africa | 205 | 0.1% |
| Western Asia | 147 | 0.1% |
| Western Europe | 880 | 0.4% |
| Yemen | 64 | 0.0% |
| Zaire | 68 | 0.0% |
| Zimbabwe | 5 | 0.0% | View All 111 Rows |
Sex and Age in Tacoma
Sex and Age in Tacoma
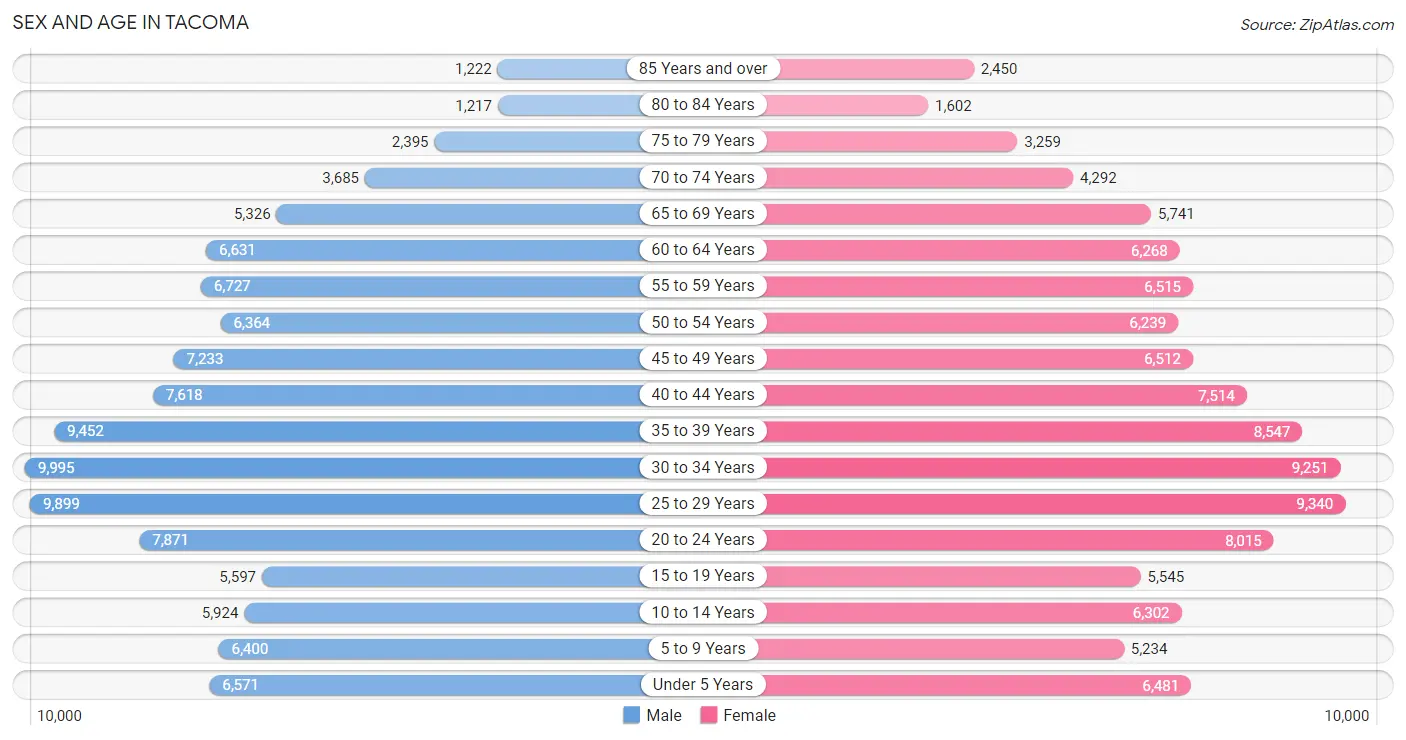
The most populous age groups in Tacoma are 30 to 34 Years (9,995 | 9.1%) for men and 25 to 29 Years (9,340 | 8.6%) for women.
| Age Bracket | Male | Female |
| Under 5 Years | 6,571 (6.0%) | 6,481 (5.9%) |
| 5 to 9 Years | 6,400 (5.8%) | 5,234 (4.8%) |
| 10 to 14 Years | 5,924 (5.4%) | 6,302 (5.8%) |
| 15 to 19 Years | 5,597 (5.1%) | 5,545 (5.1%) |
| 20 to 24 Years | 7,871 (7.1%) | 8,015 (7.3%) |
| 25 to 29 Years | 9,899 (9.0%) | 9,340 (8.6%) |
| 30 to 34 Years | 9,995 (9.1%) | 9,251 (8.5%) |
| 35 to 39 Years | 9,452 (8.6%) | 8,547 (7.8%) |
| 40 to 44 Years | 7,618 (6.9%) | 7,514 (6.9%) |
| 45 to 49 Years | 7,233 (6.6%) | 6,512 (6.0%) |
| 50 to 54 Years | 6,364 (5.8%) | 6,239 (5.7%) |
| 55 to 59 Years | 6,727 (6.1%) | 6,515 (6.0%) |
| 60 to 64 Years | 6,631 (6.0%) | 6,268 (5.7%) |
| 65 to 69 Years | 5,326 (4.8%) | 5,741 (5.3%) |
| 70 to 74 Years | 3,685 (3.4%) | 4,292 (3.9%) |
| 75 to 79 Years | 2,395 (2.2%) | 3,259 (3.0%) |
| 80 to 84 Years | 1,217 (1.1%) | 1,602 (1.5%) |
| 85 Years and over | 1,222 (1.1%) | 2,450 (2.2%) |
| Total | 110,127 (100.0%) | 109,107 (100.0%) |
Families and Households in Tacoma
Median Family Size in Tacoma
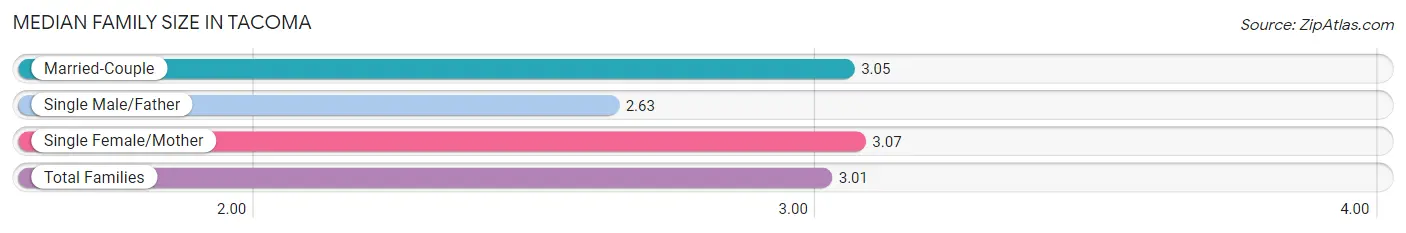
The median family size in Tacoma is 3.01 persons per family, with single female/mother families (10,852 | 20.9%) accounting for the largest median family size of 3.07 persons per family. On the other hand, single male/father families (5,042 | 9.7%) represent the smallest median family size with 2.63 persons per family.
| Family Type | # Families | Family Size |
| Married-Couple | 36,026 (69.4%) | 3.05 |
| Single Male/Father | 5,042 (9.7%) | 2.63 |
| Single Female/Mother | 10,852 (20.9%) | 3.07 |
| Total Families | 51,920 (100.0%) | 3.01 |
Median Household Size in Tacoma
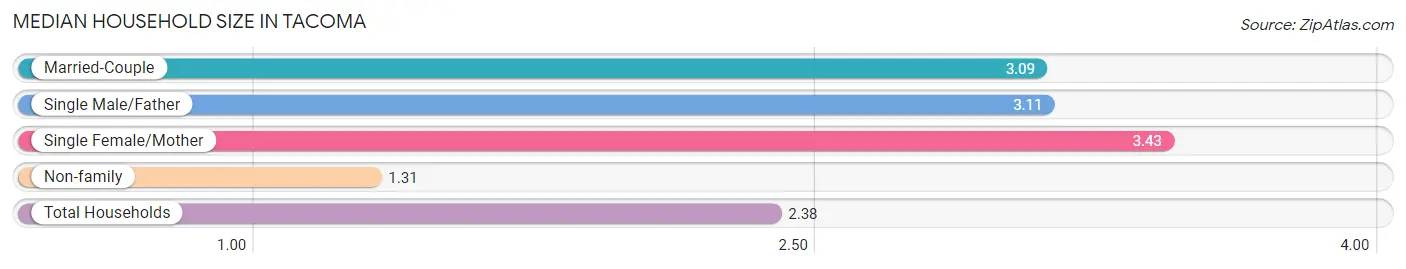
The median household size in Tacoma is 2.38 persons per household, with single female/mother households (10,852 | 12.2%) accounting for the largest median household size of 3.43 persons per household. non-family households (37,308 | 41.8%) represent the smallest median household size with 1.31 persons per household.
| Household Type | # Households | Household Size |
| Married-Couple | 36,026 (40.4%) | 3.09 |
| Single Male/Father | 5,042 (5.7%) | 3.11 |
| Single Female/Mother | 10,852 (12.2%) | 3.43 |
| Non-family | 37,308 (41.8%) | 1.31 |
| Total Households | 89,228 (100.0%) | 2.38 |
Household Size by Marriage Status in Tacoma
Out of a total of 89,228 households in Tacoma, 51,920 (58.2%) are family households, while 37,308 (41.8%) are nonfamily households. The most numerous type of family households are 2-person households, comprising 22,822, and the most common type of nonfamily households are 1-person households, comprising 28,315.
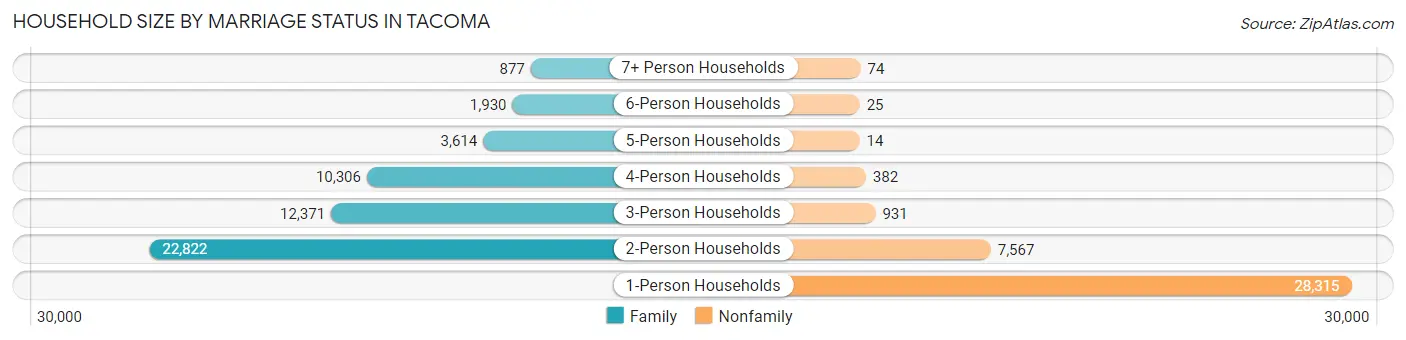
| Household Size | Family Households | Nonfamily Households |
| 1-Person Households | - | 28,315 (31.7%) |
| 2-Person Households | 22,822 (25.6%) | 7,567 (8.5%) |
| 3-Person Households | 12,371 (13.9%) | 931 (1.0%) |
| 4-Person Households | 10,306 (11.6%) | 382 (0.4%) |
| 5-Person Households | 3,614 (4.1%) | 14 (0.0%) |
| 6-Person Households | 1,930 (2.2%) | 25 (0.0%) |
| 7+ Person Households | 877 (1.0%) | 74 (0.1%) |
| Total | 51,920 (58.2%) | 37,308 (41.8%) |
Female Fertility in Tacoma
Fertility by Age in Tacoma
Average fertility rate in Tacoma is 61.0 births per 1,000 women. Women in the age bracket of 20 to 34 years have the highest fertility rate with 92.0 births per 1,000 women. Women in the age bracket of 20 to 34 years acount for 72.1% of all women with births.
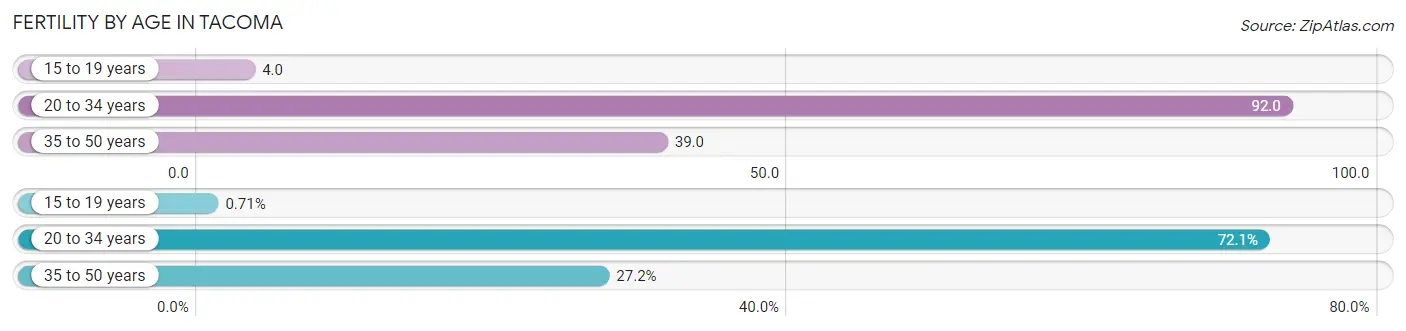
| Age Bracket | Women with Births | Births / 1,000 Women |
| 15 to 19 years | 24 (0.7%) | 4.0 |
| 20 to 34 years | 2,449 (72.1%) | 92.0 |
| 35 to 50 years | 926 (27.2%) | 39.0 |
| Total | 3,399 (100.0%) | 61.0 |
Fertility by Age by Marriage Status in Tacoma
73.5% of women with births (3,399) in Tacoma are married. The highest percentage of unmarried women with births falls into 20 to 34 years age bracket with 29.3% of them unmarried at the time of birth, while the lowest percentage of unmarried women with births belong to 15 to 19 years age bracket with 0.0% of them unmarried.
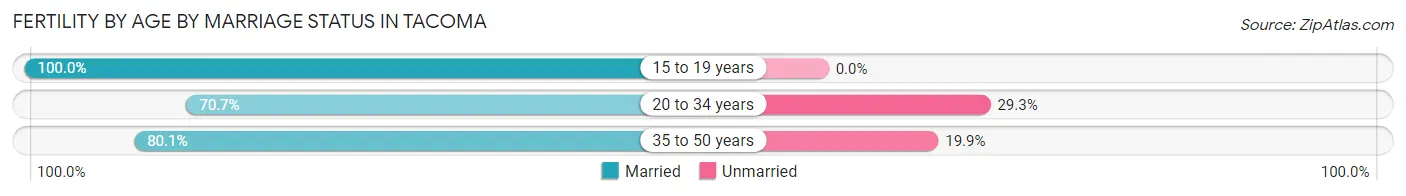
| Age Bracket | Married | Unmarried |
| 15 to 19 years | 24 (100.0%) | 0 (0.0%) |
| 20 to 34 years | 1,731 (70.7%) | 718 (29.3%) |
| 35 to 50 years | 742 (80.1%) | 184 (19.9%) |
| Total | 2,498 (73.5%) | 901 (26.5%) |
Fertility by Education in Tacoma
Average fertility rate in Tacoma is 61.0 births per 1,000 women. Women with the education attainment of high school diploma have the highest fertility rate of 67.0 births per 1,000 women, while women with the education attainment of less than high school have the lowest fertility at 23.0 births per 1,000 women. Women with the education attainment of college or associate's degree represent 36.7% of all women with births.
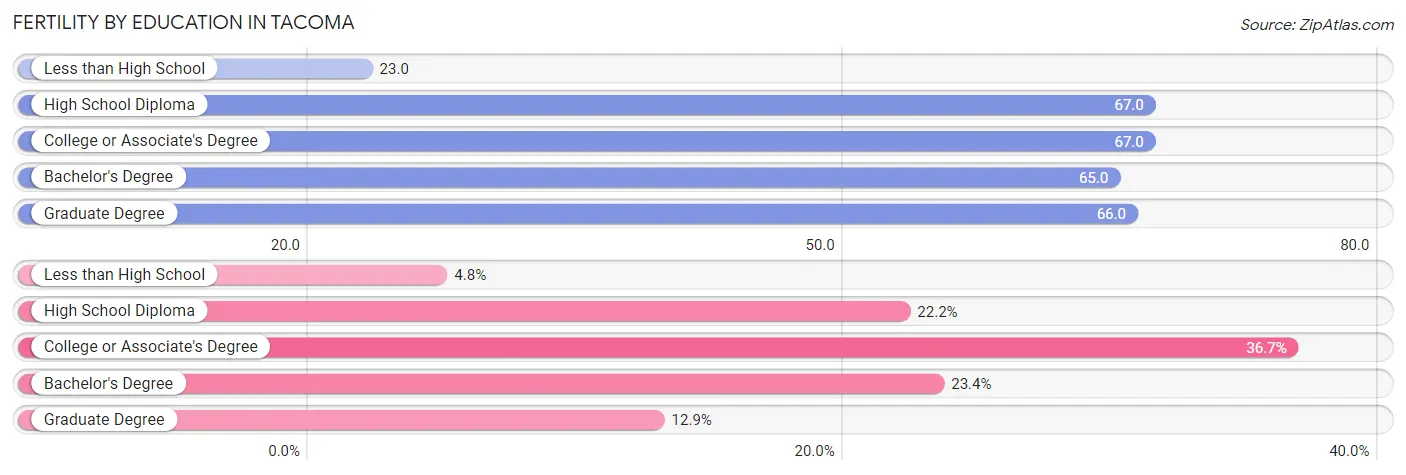
| Educational Attainment | Women with Births | Births / 1,000 Women |
| Less than High School | 163 (4.8%) | 23.0 |
| High School Diploma | 753 (22.2%) | 67.0 |
| College or Associate's Degree | 1,247 (36.7%) | 67.0 |
| Bachelor's Degree | 796 (23.4%) | 65.0 |
| Graduate Degree | 440 (12.9%) | 66.0 |
| Total | 3,399 (100.0%) | 61.0 |
Fertility by Education by Marriage Status in Tacoma
26.5% of women with births in Tacoma are unmarried. Women with the educational attainment of bachelor's degree are most likely to be married with 96.9% of them married at childbirth, while women with the educational attainment of high school diploma are least likely to be married with 68.3% of them unmarried at childbirth.
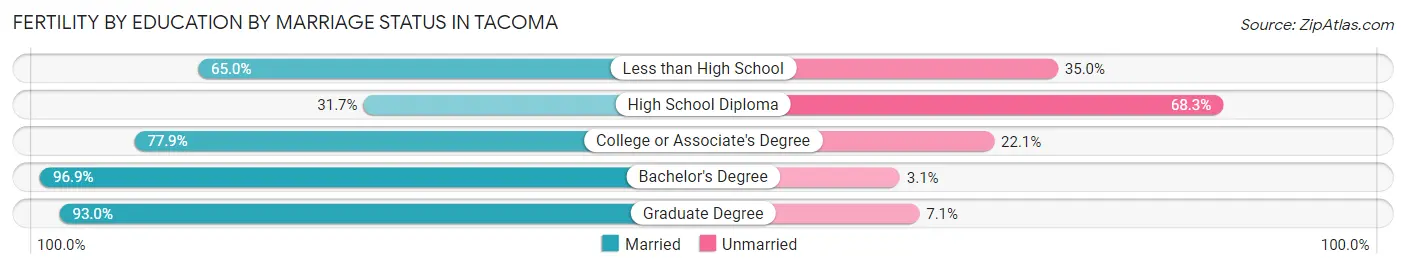
| Educational Attainment | Married | Unmarried |
| Less than High School | 106 (65.0%) | 57 (35.0%) |
| High School Diploma | 239 (31.7%) | 514 (68.3%) |
| College or Associate's Degree | 971 (77.9%) | 276 (22.1%) |
| Bachelor's Degree | 771 (96.9%) | 25 (3.1%) |
| Graduate Degree | 409 (92.9%) | 31 (7.0%) |
| Total | 2,498 (73.5%) | 901 (26.5%) |
Employment Characteristics in Tacoma
Employment by Class of Employer in Tacoma
Among the 110,738 employed individuals in Tacoma, private company employees (68,782 | 62.1%), not-for-profit organizations (11,912 | 10.8%), and local government employees (9,570 | 8.6%) make up the most common classes of employment.
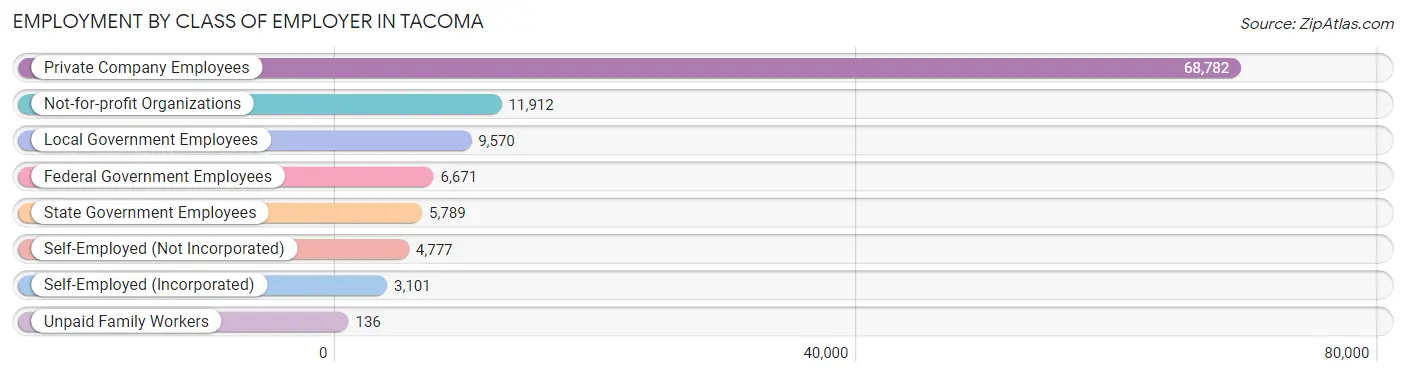
| Employer Class | # Employees | % Employees |
| Private Company Employees | 68,782 | 62.1% |
| Self-Employed (Incorporated) | 3,101 | 2.8% |
| Self-Employed (Not Incorporated) | 4,777 | 4.3% |
| Not-for-profit Organizations | 11,912 | 10.8% |
| Local Government Employees | 9,570 | 8.6% |
| State Government Employees | 5,789 | 5.2% |
| Federal Government Employees | 6,671 | 6.0% |
| Unpaid Family Workers | 136 | 0.1% |
| Total | 110,738 | 100.0% |
Employment Status by Age in Tacoma
According to the labor force statistics for Tacoma, out of the total population over 16 years of age (180,040), 66.7% or 120,087 individuals are in the labor force, with 5.4% or 6,485 of them unemployed. The age group with the highest labor force participation rate is 25 to 29 years, with 85.6% or 16,469 individuals in the labor force. Within the labor force, the 16 to 19 years age range has the highest percentage of unemployed individuals, with 16.6% or 599 of them being unemployed.
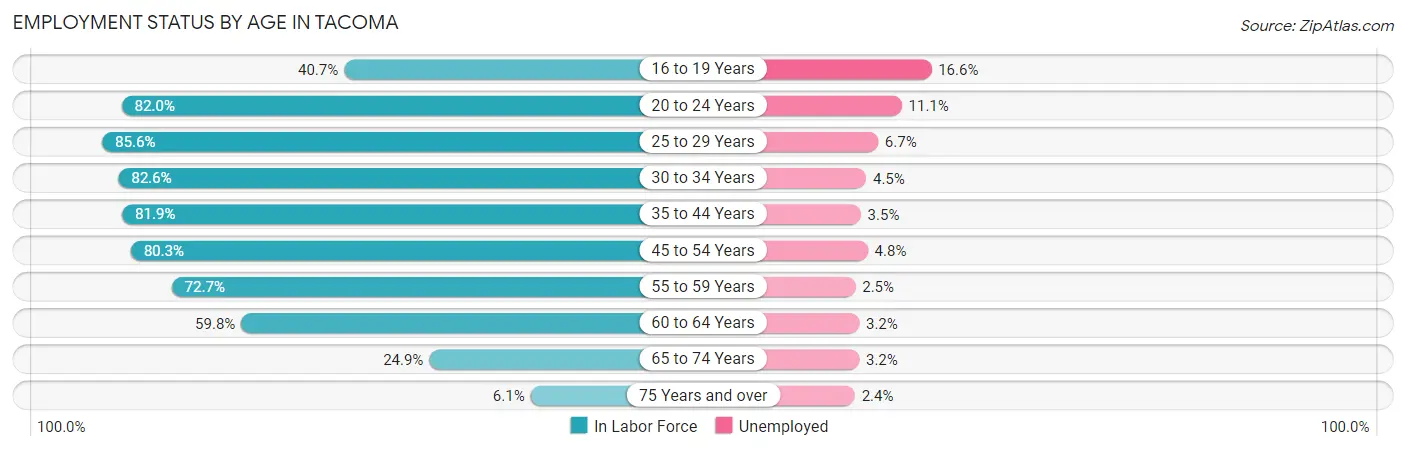
| Age Bracket | In Labor Force | Unemployed |
| 16 to 19 Years | 3,606 (40.7%) | 599 (16.6%) |
| 20 to 24 Years | 13,027 (82.0%) | 1,446 (11.1%) |
| 25 to 29 Years | 16,469 (85.6%) | 1,103 (6.7%) |
| 30 to 34 Years | 15,897 (82.6%) | 715 (4.5%) |
| 35 to 44 Years | 27,134 (81.9%) | 950 (3.5%) |
| 45 to 54 Years | 21,157 (80.3%) | 1,016 (4.8%) |
| 55 to 59 Years | 9,627 (72.7%) | 241 (2.5%) |
| 60 to 64 Years | 7,714 (59.8%) | 247 (3.2%) |
| 65 to 74 Years | 4,742 (24.9%) | 152 (3.2%) |
| 75 Years and over | 741 (6.1%) | 18 (2.4%) |
| Total | 120,087 (66.7%) | 6,485 (5.4%) |
Employment Status by Educational Attainment in Tacoma
According to labor force statistics for Tacoma, 79.0% of individuals (98,043) out of the total population between 25 and 64 years of age (124,105) are in the labor force, with 4.3% or 4,216 of them being unemployed. The group with the highest labor force participation rate are those with the educational attainment of bachelor's degree or higher, with 89.4% or 36,438 individuals in the labor force. Within the labor force, individuals with less than high school education have the highest percentage of unemployment, with 5.9% or 385 of them being unemployed.
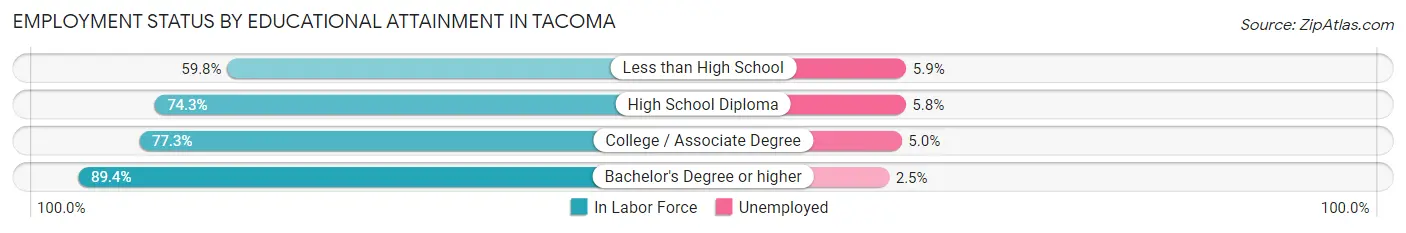
| Educational Attainment | In Labor Force | Unemployed |
| Less than High School | 6,526 (59.8%) | 644 (5.9%) |
| High School Diploma | 23,043 (74.3%) | 1,799 (5.8%) |
| College / Associate Degree | 32,018 (77.3%) | 2,071 (5.0%) |
| Bachelor's Degree or higher | 36,438 (89.4%) | 1,019 (2.5%) |
| Total | 98,043 (79.0%) | 5,337 (4.3%) |
Employment Occupations by Sex in Tacoma
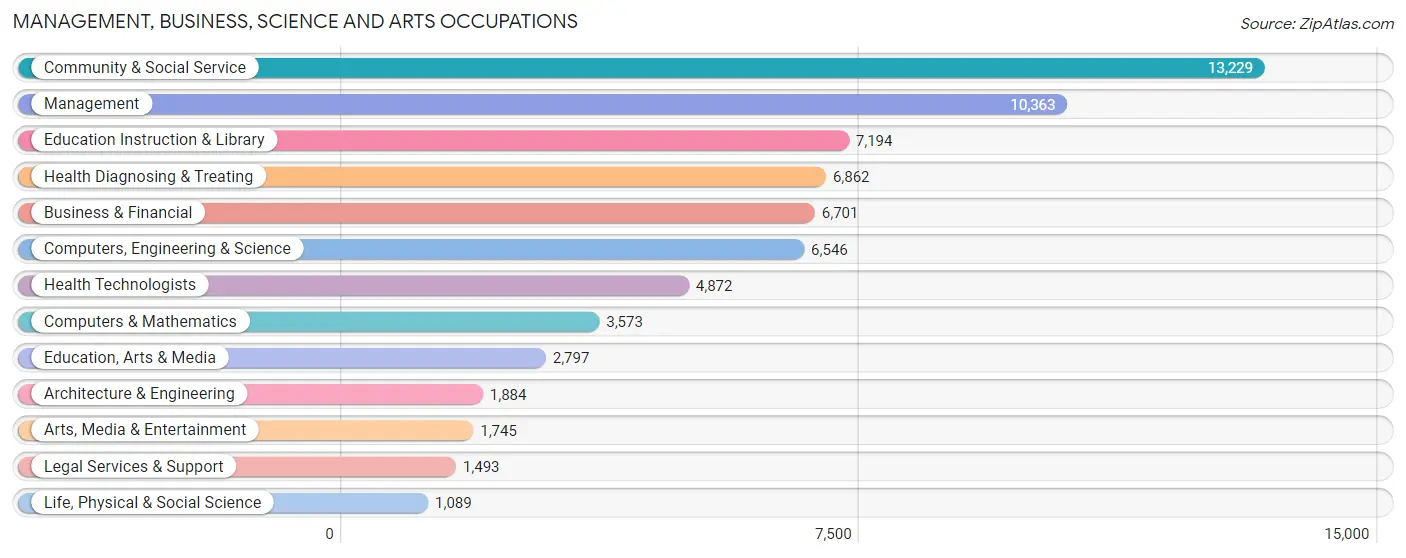
Management, Business, Science and Arts Occupations
The most common Management, Business, Science and Arts occupations in Tacoma are Community & Social Service (13,229 | 11.9%), Management (10,363 | 9.3%), Education Instruction & Library (7,194 | 6.5%), Health Diagnosing & Treating (6,862 | 6.1%), and Business & Financial (6,701 | 6.0%).
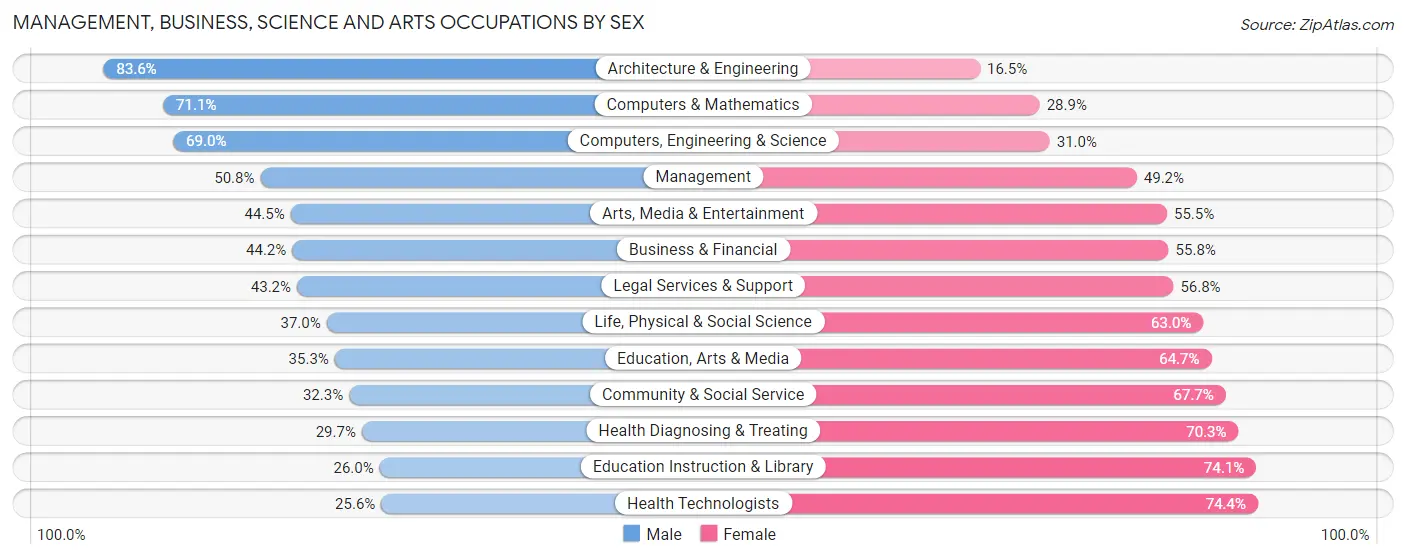
Management, Business, Science and Arts Occupations by Sex
Within the Management, Business, Science and Arts occupations in Tacoma, the most male-oriented occupations are Architecture & Engineering (83.6%), Computers & Mathematics (71.1%), and Computers, Engineering & Science (69.0%), while the most female-oriented occupations are Health Technologists (74.4%), Education Instruction & Library (74.1%), and Health Diagnosing & Treating (70.3%).
| Occupation | Male | Female |
| Management | 5,267 (50.8%) | 5,096 (49.2%) |
| Business & Financial | 2,962 (44.2%) | 3,739 (55.8%) |
| Computers, Engineering & Science | 4,517 (69.0%) | 2,029 (31.0%) |
| Computers & Mathematics | 2,540 (71.1%) | 1,033 (28.9%) |
| Architecture & Engineering | 1,574 (83.6%) | 310 (16.5%) |
| Life, Physical & Social Science | 403 (37.0%) | 686 (63.0%) |
| Community & Social Service | 4,277 (32.3%) | 8,952 (67.7%) |
| Education, Arts & Media | 988 (35.3%) | 1,809 (64.7%) |
| Legal Services & Support | 645 (43.2%) | 848 (56.8%) |
| Education Instruction & Library | 1,867 (26.0%) | 5,327 (74.1%) |
| Arts, Media & Entertainment | 777 (44.5%) | 968 (55.5%) |
| Health Diagnosing & Treating | 2,036 (29.7%) | 4,826 (70.3%) |
| Health Technologists | 1,248 (25.6%) | 3,624 (74.4%) |
| Total (Category) | 19,059 (43.6%) | 24,642 (56.4%) |
| Total (Overall) | 58,190 (52.2%) | 53,350 (47.8%) |
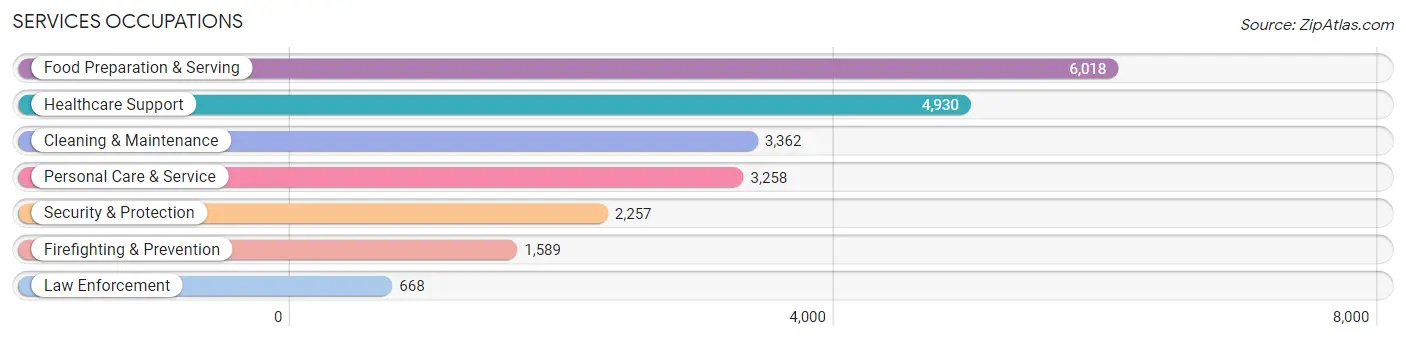
Services Occupations
The most common Services occupations in Tacoma are Food Preparation & Serving (6,018 | 5.4%), Healthcare Support (4,930 | 4.4%), Cleaning & Maintenance (3,362 | 3.0%), Personal Care & Service (3,258 | 2.9%), and Security & Protection (2,257 | 2.0%).
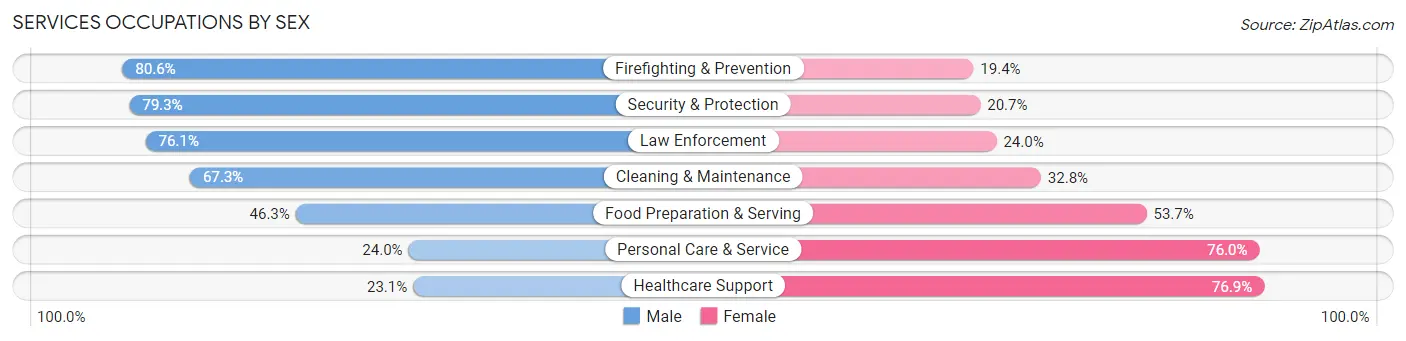
Services Occupations by Sex
Within the Services occupations in Tacoma, the most male-oriented occupations are Firefighting & Prevention (80.6%), Security & Protection (79.3%), and Law Enforcement (76.0%), while the most female-oriented occupations are Healthcare Support (76.9%), Personal Care & Service (76.0%), and Food Preparation & Serving (53.7%).
| Occupation | Male | Female |
| Healthcare Support | 1,138 (23.1%) | 3,792 (76.9%) |
| Security & Protection | 1,789 (79.3%) | 468 (20.7%) |
| Firefighting & Prevention | 1,281 (80.6%) | 308 (19.4%) |
| Law Enforcement | 508 (76.0%) | 160 (23.9%) |
| Food Preparation & Serving | 2,789 (46.3%) | 3,229 (53.7%) |
| Cleaning & Maintenance | 2,261 (67.2%) | 1,101 (32.8%) |
| Personal Care & Service | 782 (24.0%) | 2,476 (76.0%) |
| Total (Category) | 8,759 (44.2%) | 11,066 (55.8%) |
| Total (Overall) | 58,190 (52.2%) | 53,350 (47.8%) |
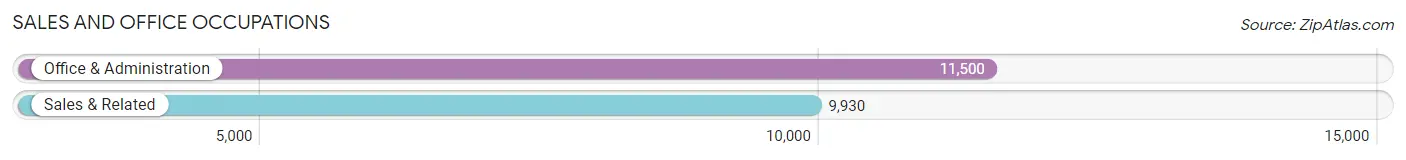
Sales and Office Occupations
The most common Sales and Office occupations in Tacoma are Office & Administration (11,500 | 10.3%), and Sales & Related (9,930 | 8.9%).
Sales and Office Occupations by Sex
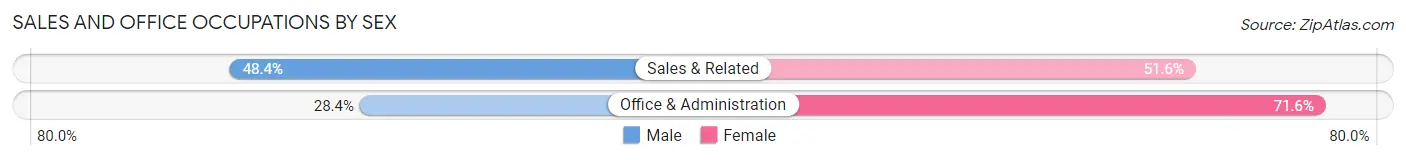
| Occupation | Male | Female |
| Sales & Related | 4,810 (48.4%) | 5,120 (51.6%) |
| Office & Administration | 3,269 (28.4%) | 8,231 (71.6%) |
| Total (Category) | 8,079 (37.7%) | 13,351 (62.3%) |
| Total (Overall) | 58,190 (52.2%) | 53,350 (47.8%) |
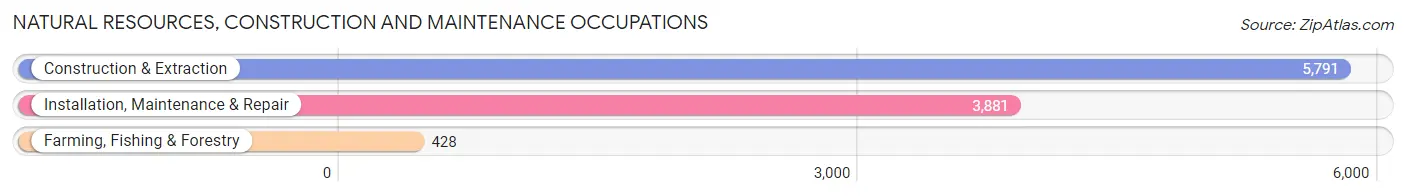
Natural Resources, Construction and Maintenance Occupations
The most common Natural Resources, Construction and Maintenance occupations in Tacoma are Construction & Extraction (5,791 | 5.2%), Installation, Maintenance & Repair (3,881 | 3.5%), and Farming, Fishing & Forestry (428 | 0.4%).
Natural Resources, Construction and Maintenance Occupations by Sex
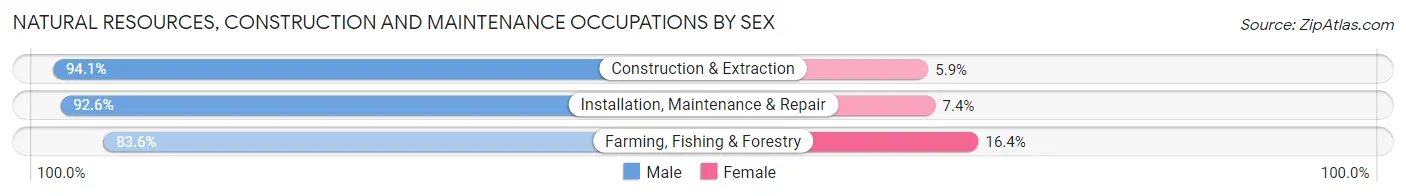
| Occupation | Male | Female |
| Farming, Fishing & Forestry | 358 (83.6%) | 70 (16.4%) |
| Construction & Extraction | 5,449 (94.1%) | 342 (5.9%) |
| Installation, Maintenance & Repair | 3,593 (92.6%) | 288 (7.4%) |
| Total (Category) | 9,400 (93.1%) | 700 (6.9%) |
| Total (Overall) | 58,190 (52.2%) | 53,350 (47.8%) |
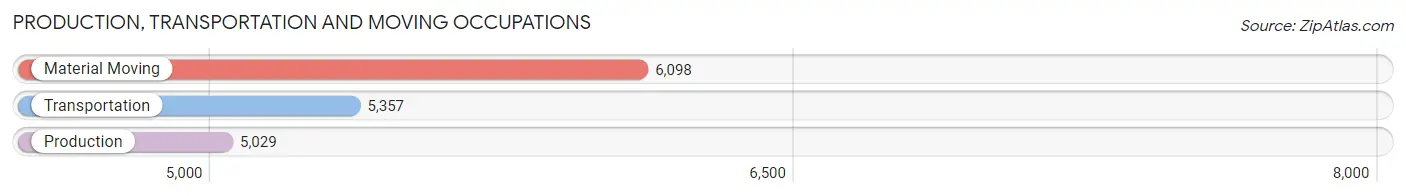
Production, Transportation and Moving Occupations
The most common Production, Transportation and Moving occupations in Tacoma are Material Moving (6,098 | 5.5%), Transportation (5,357 | 4.8%), and Production (5,029 | 4.5%).
Production, Transportation and Moving Occupations by Sex
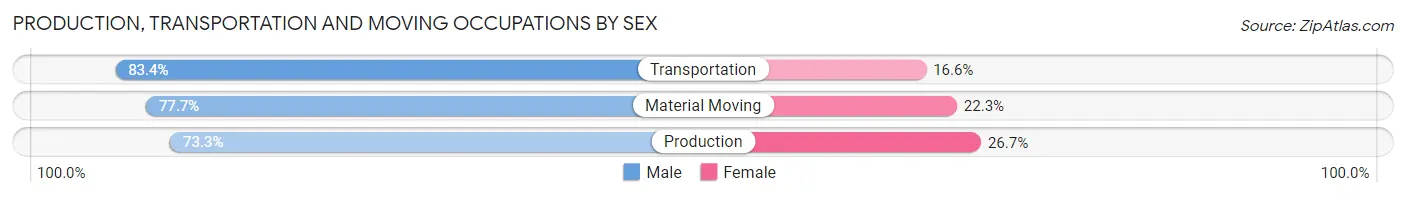
| Occupation | Male | Female |
| Production | 3,687 (73.3%) | 1,342 (26.7%) |
| Transportation | 4,466 (83.4%) | 891 (16.6%) |
| Material Moving | 4,740 (77.7%) | 1,358 (22.3%) |
| Total (Category) | 12,893 (78.2%) | 3,591 (21.8%) |
| Total (Overall) | 58,190 (52.2%) | 53,350 (47.8%) |
Employment Industries by Sex in Tacoma
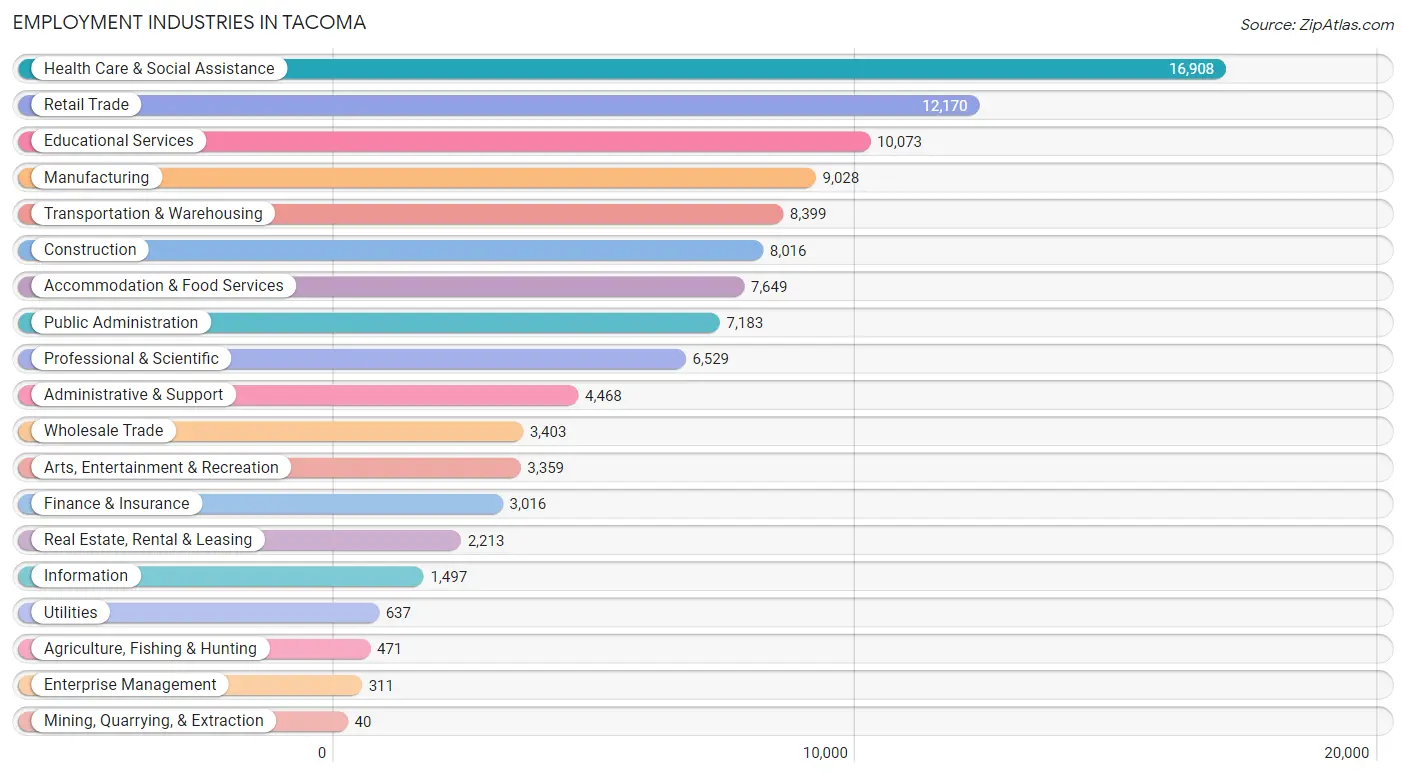
Employment Industries in Tacoma
The major employment industries in Tacoma include Health Care & Social Assistance (16,908 | 15.2%), Retail Trade (12,170 | 10.9%), Educational Services (10,073 | 9.0%), Manufacturing (9,028 | 8.1%), and Transportation & Warehousing (8,399 | 7.5%).
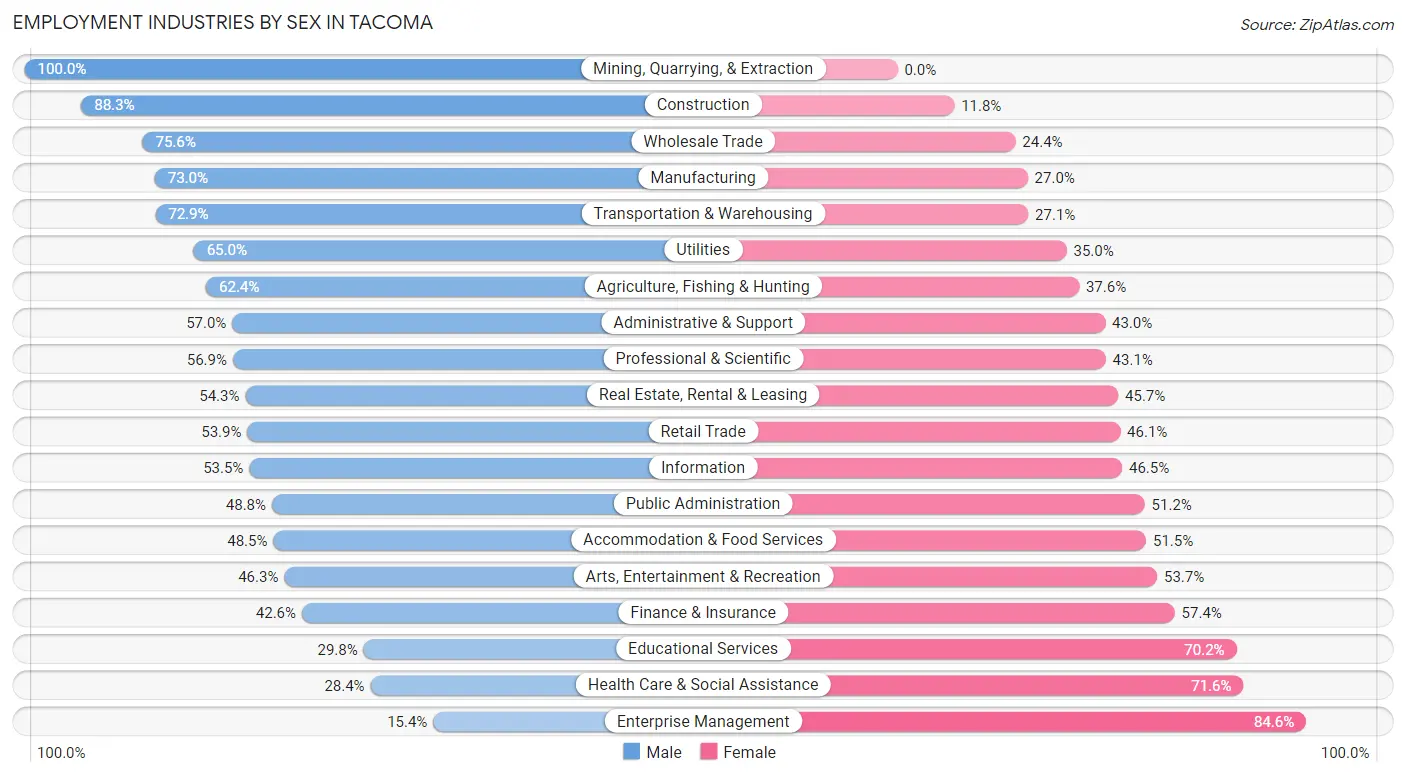
Employment Industries by Sex in Tacoma
The Tacoma industries that see more men than women are Mining, Quarrying, & Extraction (100.0%), Construction (88.2%), and Wholesale Trade (75.6%), whereas the industries that tend to have a higher number of women are Enterprise Management (84.6%), Health Care & Social Assistance (71.6%), and Educational Services (70.2%).
| Industry | Male | Female |
| Agriculture, Fishing & Hunting | 294 (62.4%) | 177 (37.6%) |
| Mining, Quarrying, & Extraction | 40 (100.0%) | 0 (0.0%) |
| Construction | 7,074 (88.2%) | 942 (11.7%) |
| Manufacturing | 6,594 (73.0%) | 2,434 (27.0%) |
| Wholesale Trade | 2,572 (75.6%) | 831 (24.4%) |
| Retail Trade | 6,560 (53.9%) | 5,610 (46.1%) |
| Transportation & Warehousing | 6,126 (72.9%) | 2,273 (27.1%) |
| Utilities | 414 (65.0%) | 223 (35.0%) |
| Information | 801 (53.5%) | 696 (46.5%) |
| Finance & Insurance | 1,285 (42.6%) | 1,731 (57.4%) |
| Real Estate, Rental & Leasing | 1,202 (54.3%) | 1,011 (45.7%) |
| Professional & Scientific | 3,715 (56.9%) | 2,814 (43.1%) |
| Enterprise Management | 48 (15.4%) | 263 (84.6%) |
| Administrative & Support | 2,548 (57.0%) | 1,920 (43.0%) |
| Educational Services | 3,006 (29.8%) | 7,067 (70.2%) |
| Health Care & Social Assistance | 4,806 (28.4%) | 12,102 (71.6%) |
| Arts, Entertainment & Recreation | 1,554 (46.3%) | 1,805 (53.7%) |
| Accommodation & Food Services | 3,712 (48.5%) | 3,937 (51.5%) |
| Public Administration | 3,507 (48.8%) | 3,676 (51.2%) |
| Total | 58,190 (52.2%) | 53,350 (47.8%) |
Education in Tacoma
School Enrollment in Tacoma
The most common levels of schooling among the 48,202 students in Tacoma are college / undergraduate (11,687 | 24.2%), middle school (9,766 | 20.3%), and high school (8,997 | 18.7%).
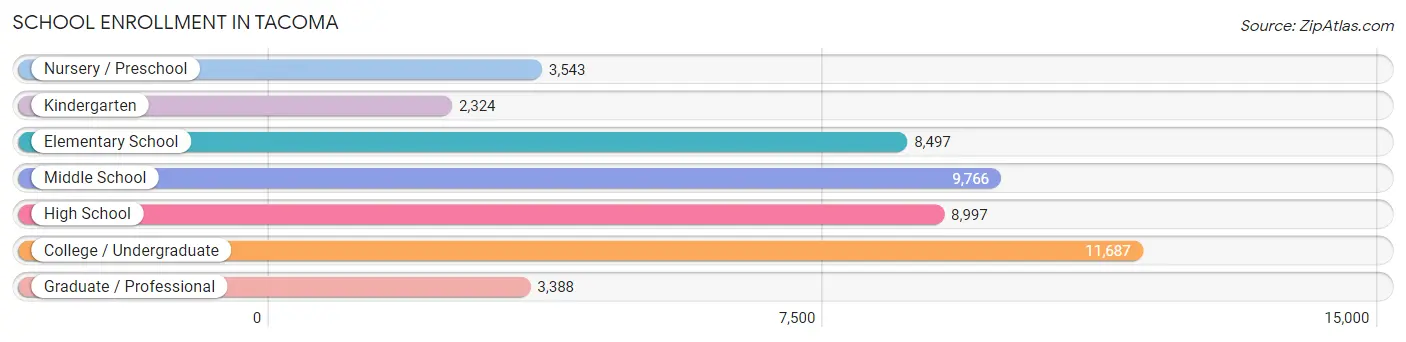
| School Level | # Students | % Students |
| Nursery / Preschool | 3,543 | 7.3% |
| Kindergarten | 2,324 | 4.8% |
| Elementary School | 8,497 | 17.6% |
| Middle School | 9,766 | 20.3% |
| High School | 8,997 | 18.7% |
| College / Undergraduate | 11,687 | 24.2% |
| Graduate / Professional | 3,388 | 7.0% |
| Total | 48,202 | 100.0% |
School Enrollment by Age by Funding Source in Tacoma
Out of a total of 48,202 students who are enrolled in schools in Tacoma, 10,026 (20.8%) attend a private institution, while the remaining 38,176 (79.2%) are enrolled in public schools. The age group of 3 to 4 year olds has the highest likelihood of being enrolled in private schools, with 1,029 (41.3% in the age bracket) enrolled. Conversely, the age group of 15 to 17 year olds has the lowest likelihood of being enrolled in a private school, with 5,628 (89.2% in the age bracket) attending a public institution.
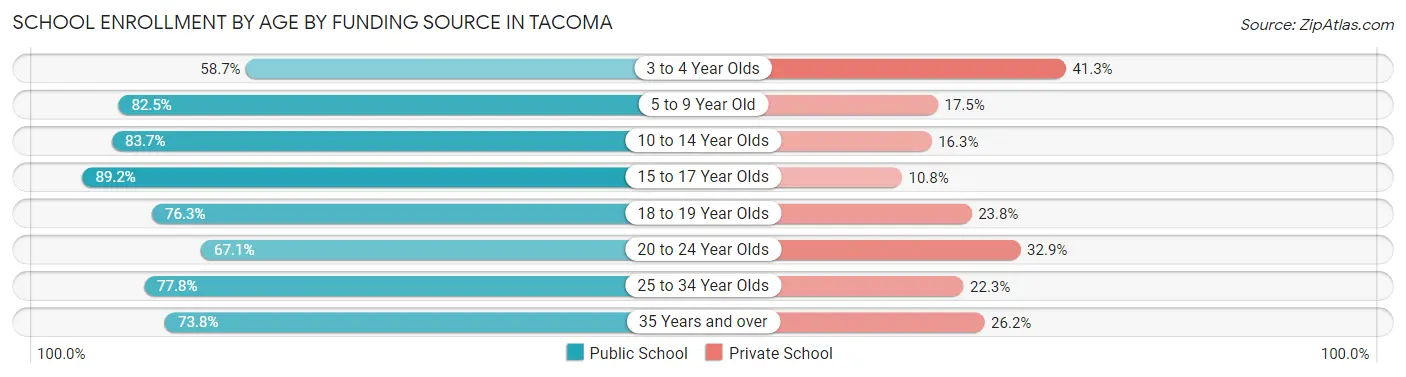
| Age Bracket | Public School | Private School |
| 3 to 4 Year Olds | 1,462 (58.7%) | 1,029 (41.3%) |
| 5 to 9 Year Old | 8,836 (82.5%) | 1,873 (17.5%) |
| 10 to 14 Year Olds | 9,913 (83.7%) | 1,932 (16.3%) |
| 15 to 17 Year Olds | 5,628 (89.2%) | 680 (10.8%) |
| 18 to 19 Year Olds | 2,382 (76.2%) | 742 (23.7%) |
| 20 to 24 Year Olds | 3,598 (67.1%) | 1,762 (32.9%) |
| 25 to 34 Year Olds | 3,910 (77.7%) | 1,119 (22.3%) |
| 35 Years and over | 2,463 (73.8%) | 873 (26.2%) |
| Total | 38,176 (79.2%) | 10,026 (20.8%) |
Educational Attainment by Field of Study in Tacoma
Business (7,916 | 14.2%), social sciences (6,674 | 12.0%), education (5,280 | 9.5%), science & technology (4,780 | 8.6%), and liberal arts & history (3,981 | 7.1%) are the most common fields of study among 55,778 individuals in Tacoma who have obtained a bachelor's degree or higher.
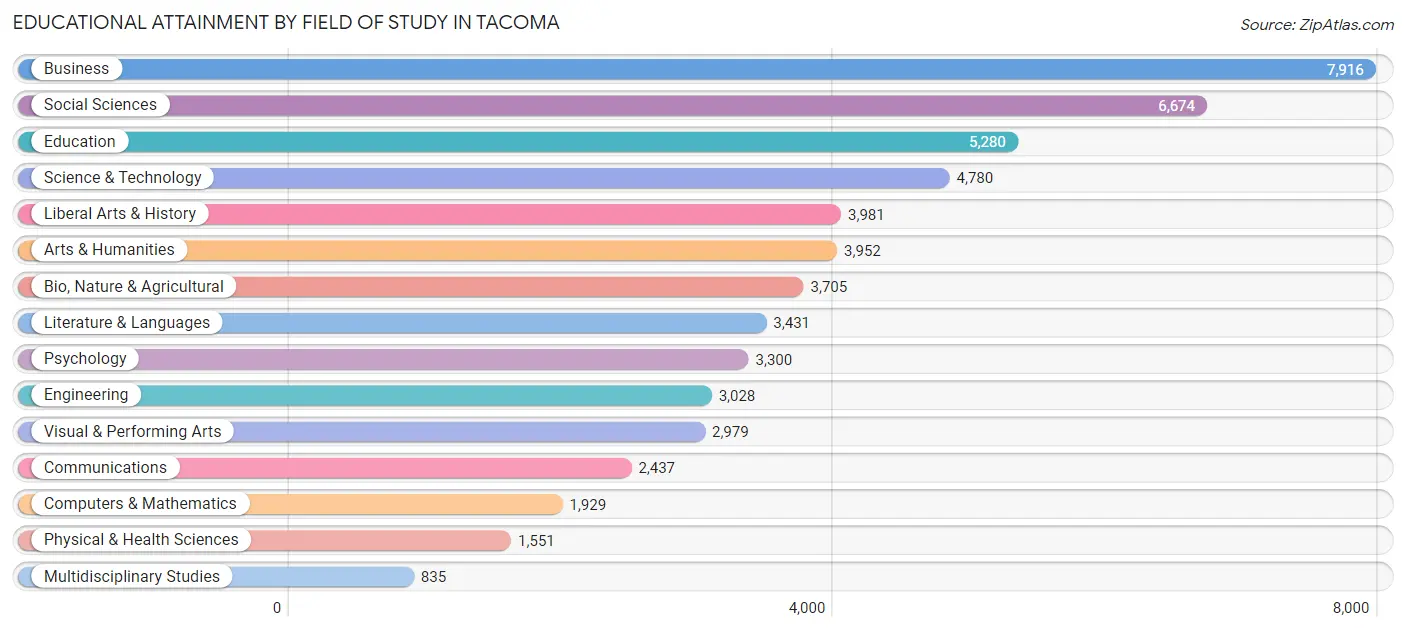
| Field of Study | # Graduates | % Graduates |
| Computers & Mathematics | 1,929 | 3.5% |
| Bio, Nature & Agricultural | 3,705 | 6.6% |
| Physical & Health Sciences | 1,551 | 2.8% |
| Psychology | 3,300 | 5.9% |
| Social Sciences | 6,674 | 12.0% |
| Engineering | 3,028 | 5.4% |
| Multidisciplinary Studies | 835 | 1.5% |
| Science & Technology | 4,780 | 8.6% |
| Business | 7,916 | 14.2% |
| Education | 5,280 | 9.5% |
| Literature & Languages | 3,431 | 6.1% |
| Liberal Arts & History | 3,981 | 7.1% |
| Visual & Performing Arts | 2,979 | 5.3% |
| Communications | 2,437 | 4.4% |
| Arts & Humanities | 3,952 | 7.1% |
| Total | 55,778 | 100.0% |
Transportation & Commute in Tacoma
Vehicle Availability by Sex in Tacoma
The most prevalent vehicle ownership categories in Tacoma are males with 2 vehicles (24,987, accounting for 42.8%) and females with 2 vehicles (20,971, making up 48.4%).
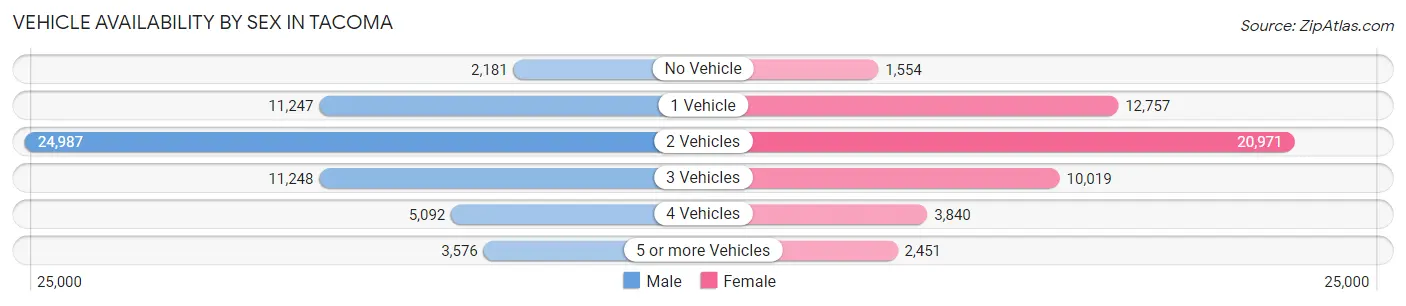
| Vehicles Available | Male | Female |
| No Vehicle | 2,181 (3.7%) | 1,554 (3.0%) |
| 1 Vehicle | 11,247 (19.3%) | 12,757 (24.7%) |
| 2 Vehicles | 24,987 (42.8%) | 20,971 (40.6%) |
| 3 Vehicles | 11,248 (19.3%) | 10,019 (19.4%) |
| 4 Vehicles | 5,092 (8.7%) | 3,840 (7.4%) |
| 5 or more Vehicles | 3,576 (6.1%) | 2,451 (4.8%) |
| Total | 58,331 (100.0%) | 51,592 (100.0%) |
Commute Time in Tacoma
The most frequently occuring commute durations in Tacoma are 15 to 19 minutes (15,962 commuters, 16.4%), 30 to 34 minutes (13,142 commuters, 13.5%), and 10 to 14 minutes (12,809 commuters, 13.2%).
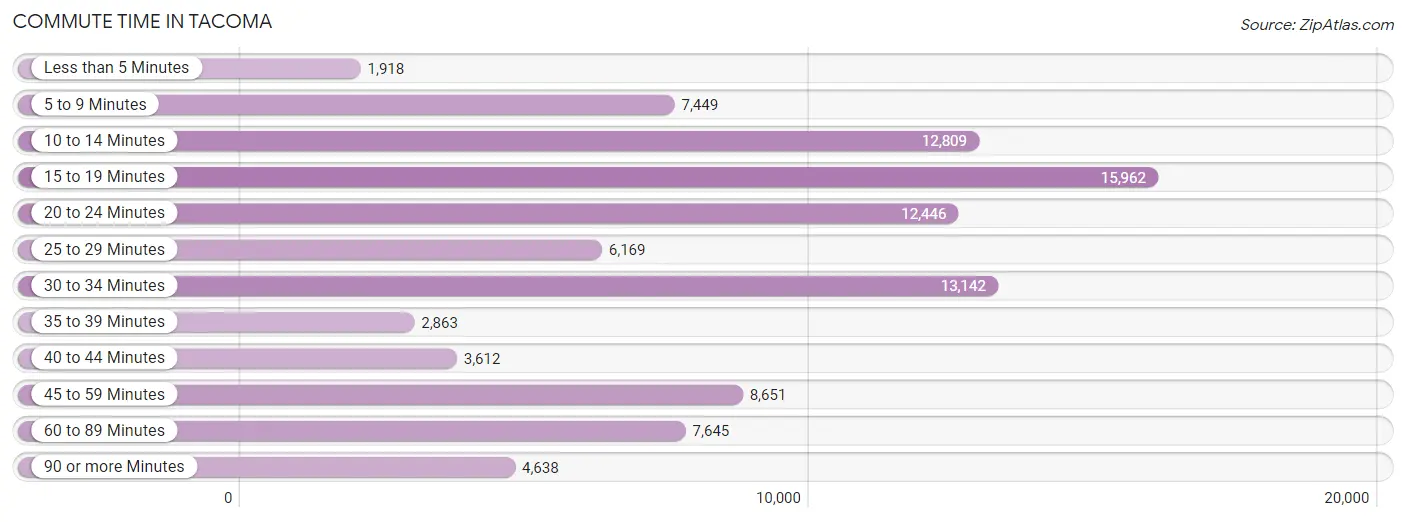
| Commute Time | # Commuters | % Commuters |
| Less than 5 Minutes | 1,918 | 2.0% |
| 5 to 9 Minutes | 7,449 | 7.7% |
| 10 to 14 Minutes | 12,809 | 13.2% |
| 15 to 19 Minutes | 15,962 | 16.4% |
| 20 to 24 Minutes | 12,446 | 12.8% |
| 25 to 29 Minutes | 6,169 | 6.3% |
| 30 to 34 Minutes | 13,142 | 13.5% |
| 35 to 39 Minutes | 2,863 | 2.9% |
| 40 to 44 Minutes | 3,612 | 3.7% |
| 45 to 59 Minutes | 8,651 | 8.9% |
| 60 to 89 Minutes | 7,645 | 7.9% |
| 90 or more Minutes | 4,638 | 4.8% |
Commute Time by Sex in Tacoma
The most common commute times in Tacoma are 30 to 34 minutes (8,262 commuters, 15.5%) for males and 15 to 19 minutes (8,227 commuters, 18.7%) for females.
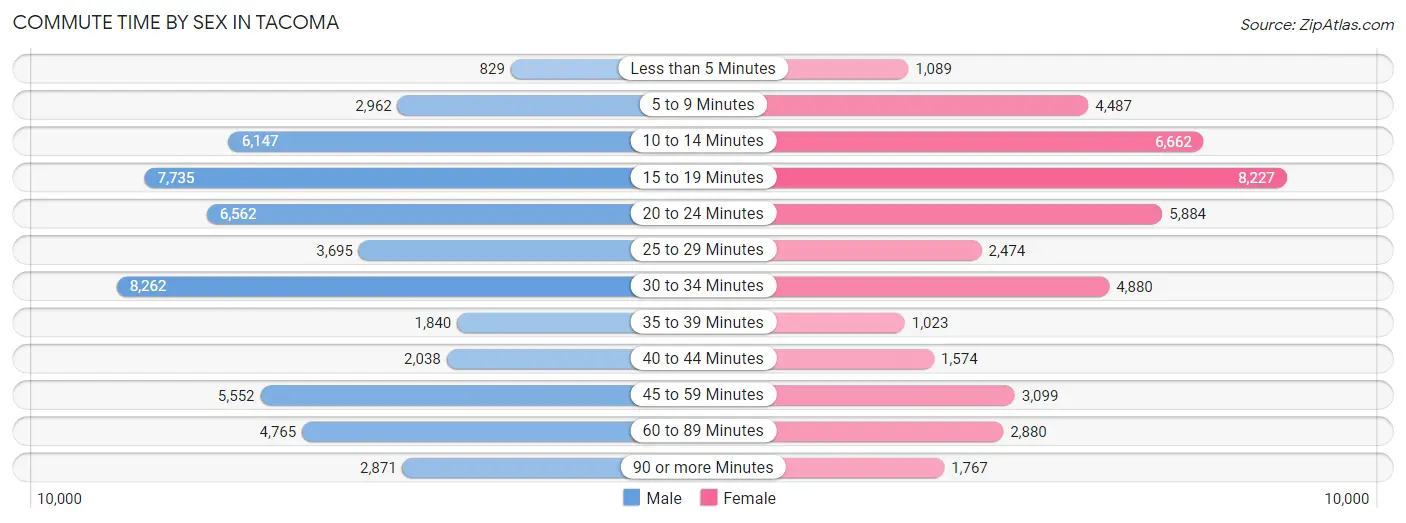
| Commute Time | Male | Female |
| Less than 5 Minutes | 829 (1.6%) | 1,089 (2.5%) |
| 5 to 9 Minutes | 2,962 (5.6%) | 4,487 (10.2%) |
| 10 to 14 Minutes | 6,147 (11.5%) | 6,662 (15.1%) |
| 15 to 19 Minutes | 7,735 (14.5%) | 8,227 (18.7%) |
| 20 to 24 Minutes | 6,562 (12.3%) | 5,884 (13.4%) |
| 25 to 29 Minutes | 3,695 (6.9%) | 2,474 (5.6%) |
| 30 to 34 Minutes | 8,262 (15.5%) | 4,880 (11.1%) |
| 35 to 39 Minutes | 1,840 (3.5%) | 1,023 (2.3%) |
| 40 to 44 Minutes | 2,038 (3.8%) | 1,574 (3.6%) |
| 45 to 59 Minutes | 5,552 (10.4%) | 3,099 (7.0%) |
| 60 to 89 Minutes | 4,765 (8.9%) | 2,880 (6.5%) |
| 90 or more Minutes | 2,871 (5.4%) | 1,767 (4.0%) |
Time of Departure to Work by Sex in Tacoma
The most frequent times of departure to work in Tacoma are 7:00 AM to 7:29 AM (6,043, 11.4%) for males and 8:00 AM to 8:29 AM (5,159, 11.7%) for females.
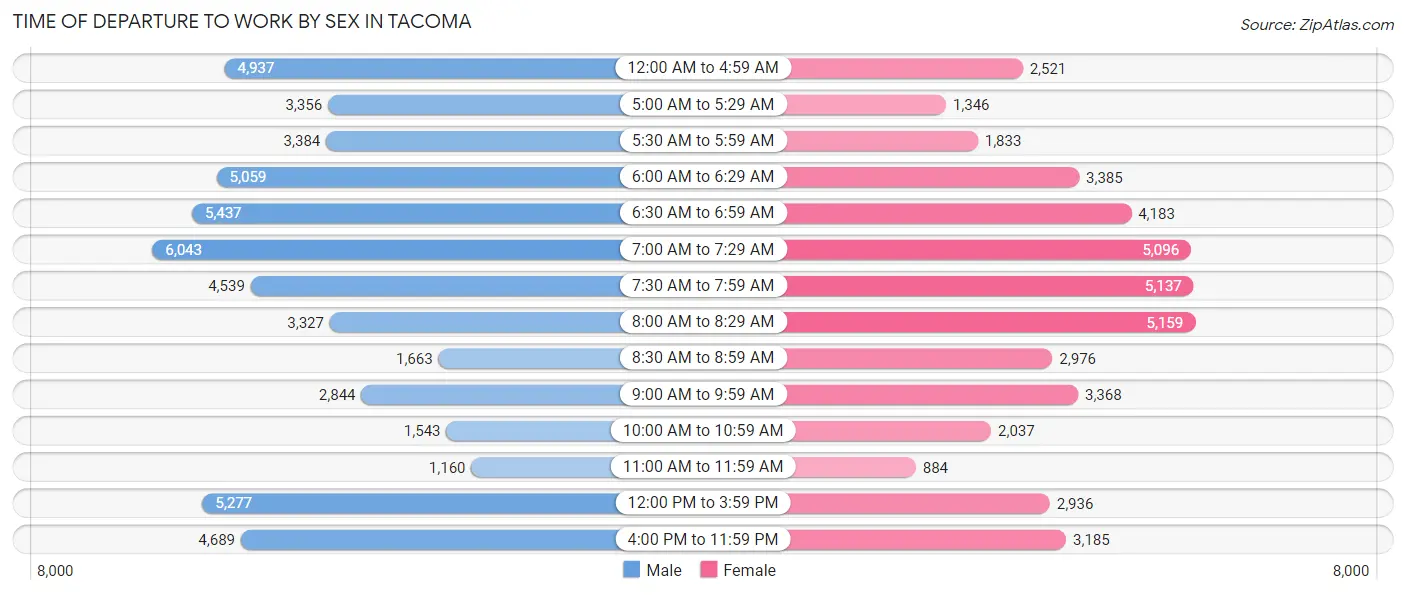
| Time of Departure | Male | Female |
| 12:00 AM to 4:59 AM | 4,937 (9.3%) | 2,521 (5.7%) |
| 5:00 AM to 5:29 AM | 3,356 (6.3%) | 1,346 (3.1%) |
| 5:30 AM to 5:59 AM | 3,384 (6.4%) | 1,833 (4.2%) |
| 6:00 AM to 6:29 AM | 5,059 (9.5%) | 3,385 (7.7%) |
| 6:30 AM to 6:59 AM | 5,437 (10.2%) | 4,183 (9.5%) |
| 7:00 AM to 7:29 AM | 6,043 (11.4%) | 5,096 (11.6%) |
| 7:30 AM to 7:59 AM | 4,539 (8.5%) | 5,137 (11.7%) |
| 8:00 AM to 8:29 AM | 3,327 (6.2%) | 5,159 (11.7%) |
| 8:30 AM to 8:59 AM | 1,663 (3.1%) | 2,976 (6.8%) |
| 9:00 AM to 9:59 AM | 2,844 (5.3%) | 3,368 (7.6%) |
| 10:00 AM to 10:59 AM | 1,543 (2.9%) | 2,037 (4.6%) |
| 11:00 AM to 11:59 AM | 1,160 (2.2%) | 884 (2.0%) |
| 12:00 PM to 3:59 PM | 5,277 (9.9%) | 2,936 (6.7%) |
| 4:00 PM to 11:59 PM | 4,689 (8.8%) | 3,185 (7.2%) |
| Total | 53,258 (100.0%) | 44,046 (100.0%) |
Housing Occupancy in Tacoma
Occupancy by Ownership in Tacoma
Of the total 89,228 dwellings in Tacoma, owner-occupied units account for 50,677 (56.8%), while renter-occupied units make up 38,551 (43.2%).
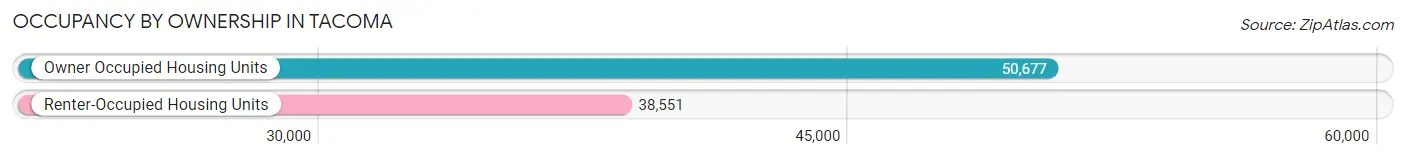
| Occupancy | # Housing Units | % Housing Units |
| Owner Occupied Housing Units | 50,677 | 56.8% |
| Renter-Occupied Housing Units | 38,551 | 43.2% |
| Total Occupied Housing Units | 89,228 | 100.0% |
Occupancy by Household Size in Tacoma
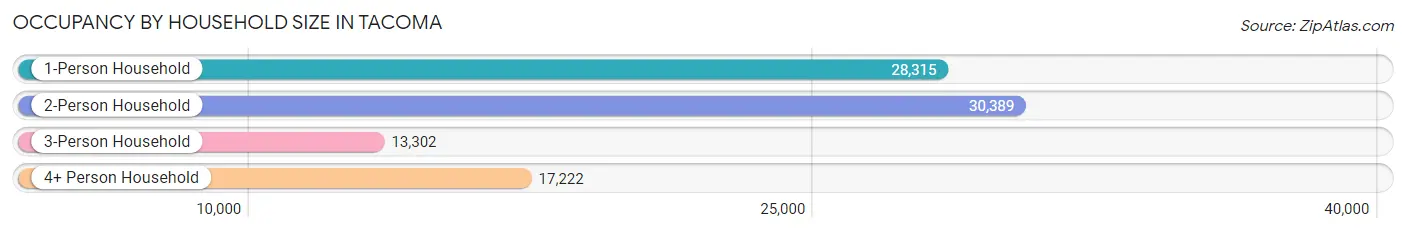
| Household Size | # Housing Units | % Housing Units |
| 1-Person Household | 28,315 | 31.7% |
| 2-Person Household | 30,389 | 34.1% |
| 3-Person Household | 13,302 | 14.9% |
| 4+ Person Household | 17,222 | 19.3% |
| Total Housing Units | 89,228 | 100.0% |
Occupancy by Ownership by Household Size in Tacoma
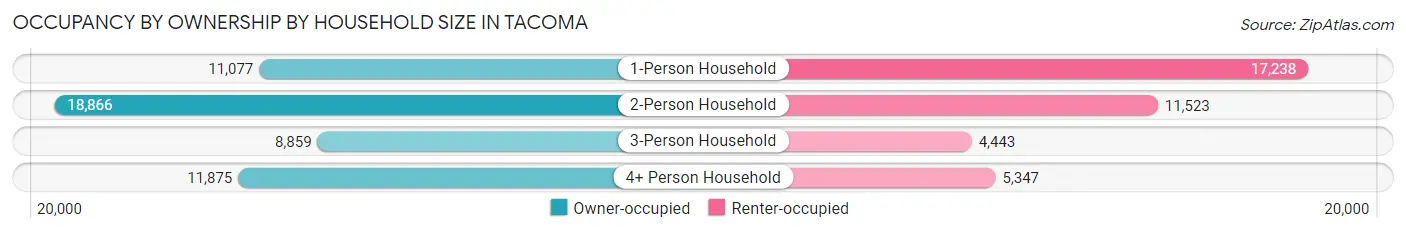
| Household Size | Owner-occupied | Renter-occupied |
| 1-Person Household | 11,077 (39.1%) | 17,238 (60.9%) |
| 2-Person Household | 18,866 (62.1%) | 11,523 (37.9%) |
| 3-Person Household | 8,859 (66.6%) | 4,443 (33.4%) |
| 4+ Person Household | 11,875 (69.0%) | 5,347 (31.0%) |
| Total Housing Units | 50,677 (56.8%) | 38,551 (43.2%) |
Occupancy by Educational Attainment in Tacoma
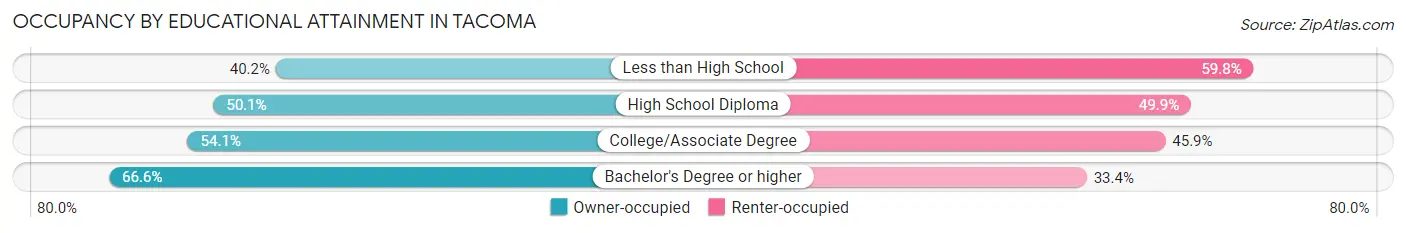
| Household Size | Owner-occupied | Renter-occupied |
| Less than High School | 2,504 (40.2%) | 3,731 (59.8%) |
| High School Diploma | 9,590 (50.1%) | 9,568 (49.9%) |
| College/Associate Degree | 17,058 (54.1%) | 14,457 (45.9%) |
| Bachelor's Degree or higher | 21,525 (66.6%) | 10,795 (33.4%) |
Occupancy by Age of Householder in Tacoma
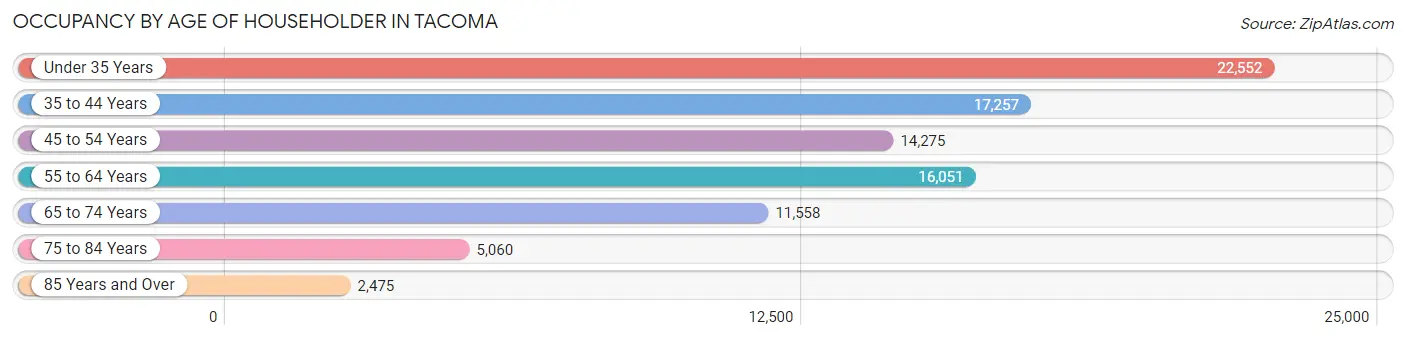
| Age Bracket | # Households | % Households |
| Under 35 Years | 22,552 | 25.3% |
| 35 to 44 Years | 17,257 | 19.3% |
| 45 to 54 Years | 14,275 | 16.0% |
| 55 to 64 Years | 16,051 | 18.0% |
| 65 to 74 Years | 11,558 | 13.0% |
| 75 to 84 Years | 5,060 | 5.7% |
| 85 Years and Over | 2,475 | 2.8% |
| Total | 89,228 | 100.0% |
Housing Finances in Tacoma
Median Income by Occupancy in Tacoma
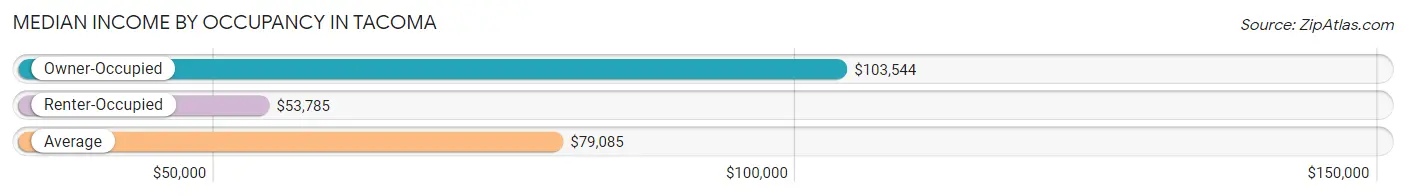
| Occupancy Type | # Households | Median Income |
| Owner-Occupied | 50,677 (56.8%) | $103,544 |
| Renter-Occupied | 38,551 (43.2%) | $53,785 |
| Average | 89,228 (100.0%) | $79,085 |
Occupancy by Householder Income Bracket in Tacoma
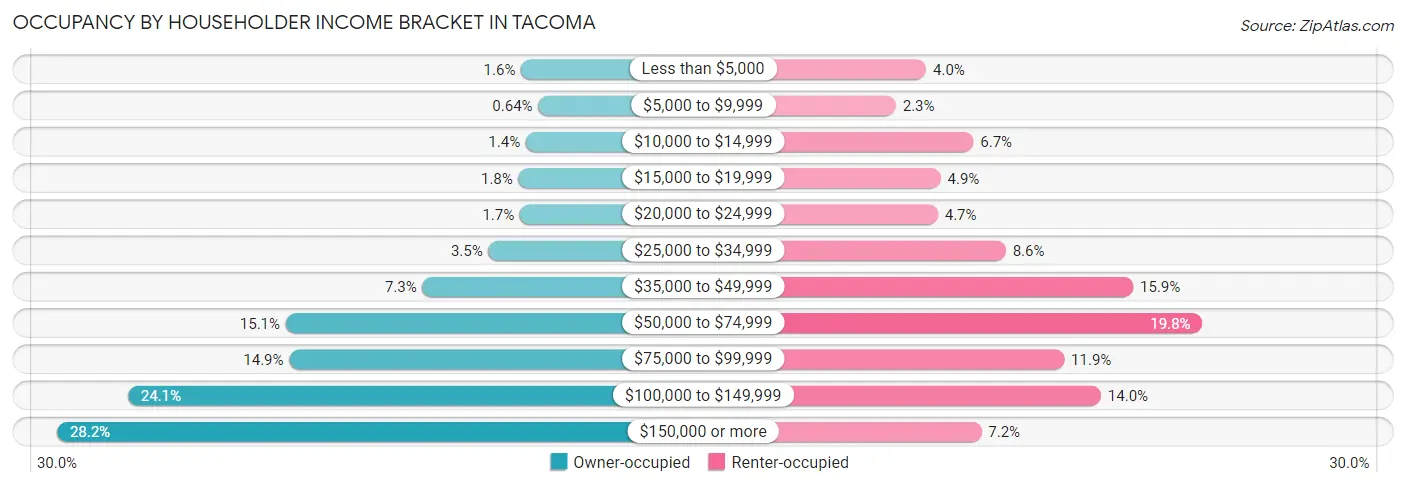
| Income Bracket | Owner-occupied | Renter-occupied |
| Less than $5,000 | 820 (1.6%) | 1,552 (4.0%) |
| $5,000 to $9,999 | 325 (0.6%) | 885 (2.3%) |
| $10,000 to $14,999 | 682 (1.3%) | 2,594 (6.7%) |
| $15,000 to $19,999 | 895 (1.8%) | 1,873 (4.9%) |
| $20,000 to $24,999 | 855 (1.7%) | 1,813 (4.7%) |
| $25,000 to $34,999 | 1,771 (3.5%) | 3,309 (8.6%) |
| $35,000 to $49,999 | 3,679 (7.3%) | 6,114 (15.9%) |
| $50,000 to $74,999 | 7,636 (15.1%) | 7,639 (19.8%) |
| $75,000 to $99,999 | 7,536 (14.9%) | 4,597 (11.9%) |
| $100,000 to $149,999 | 12,212 (24.1%) | 5,404 (14.0%) |
| $150,000 or more | 14,266 (28.1%) | 2,771 (7.2%) |
| Total | 50,677 (100.0%) | 38,551 (100.0%) |
Monthly Housing Cost Tiers in Tacoma
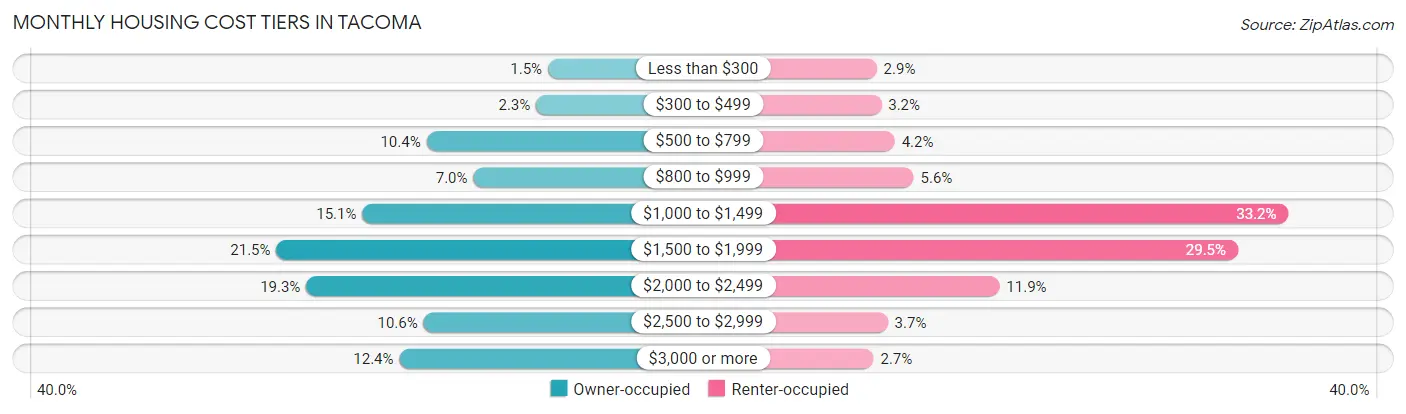
| Monthly Cost | Owner-occupied | Renter-occupied |
| Less than $300 | 740 (1.5%) | 1,116 (2.9%) |
| $300 to $499 | 1,183 (2.3%) | 1,245 (3.2%) |
| $500 to $799 | 5,269 (10.4%) | 1,626 (4.2%) |
| $800 to $999 | 3,521 (7.0%) | 2,162 (5.6%) |
| $1,000 to $1,499 | 7,666 (15.1%) | 12,804 (33.2%) |
| $1,500 to $1,999 | 10,875 (21.5%) | 11,367 (29.5%) |
| $2,000 to $2,499 | 9,760 (19.3%) | 4,598 (11.9%) |
| $2,500 to $2,999 | 5,381 (10.6%) | 1,427 (3.7%) |
| $3,000 or more | 6,282 (12.4%) | 1,026 (2.7%) |
| Total | 50,677 (100.0%) | 38,551 (100.0%) |
Physical Housing Characteristics in Tacoma
Housing Structures in Tacoma
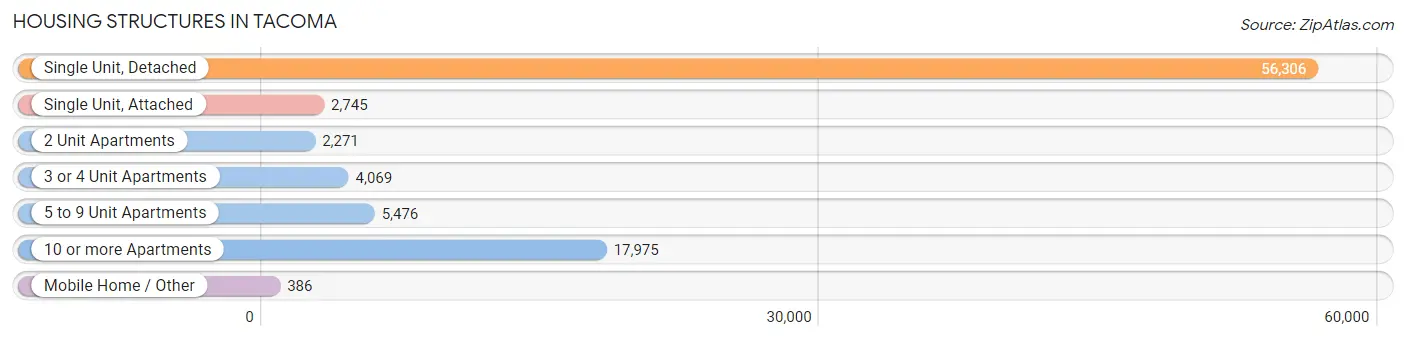
| Structure Type | # Housing Units | % Housing Units |
| Single Unit, Detached | 56,306 | 63.1% |
| Single Unit, Attached | 2,745 | 3.1% |
| 2 Unit Apartments | 2,271 | 2.5% |
| 3 or 4 Unit Apartments | 4,069 | 4.6% |
| 5 to 9 Unit Apartments | 5,476 | 6.1% |
| 10 or more Apartments | 17,975 | 20.2% |
| Mobile Home / Other | 386 | 0.4% |
| Total | 89,228 | 100.0% |
Housing Structures by Occupancy in Tacoma
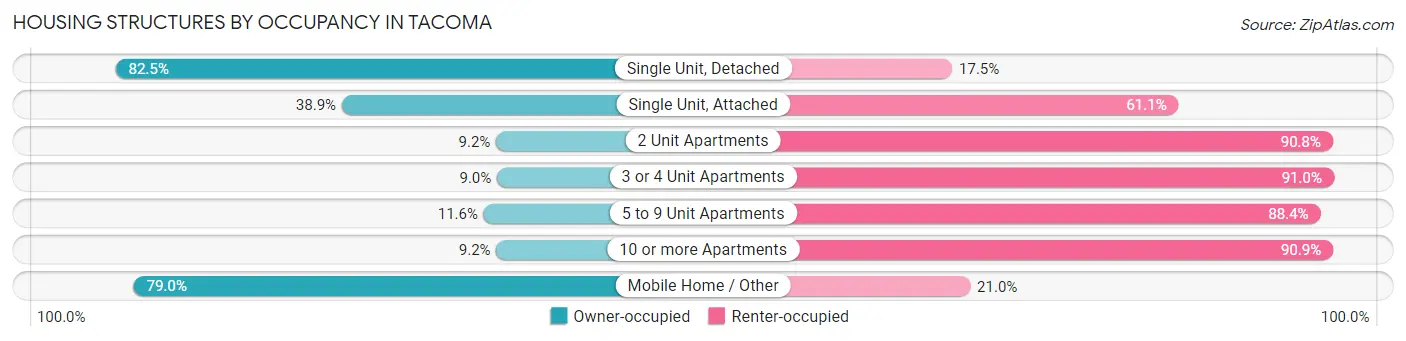
| Structure Type | Owner-occupied | Renter-occupied |
| Single Unit, Detached | 46,449 (82.5%) | 9,857 (17.5%) |
| Single Unit, Attached | 1,068 (38.9%) | 1,677 (61.1%) |
| 2 Unit Apartments | 209 (9.2%) | 2,062 (90.8%) |
| 3 or 4 Unit Apartments | 367 (9.0%) | 3,702 (91.0%) |
| 5 to 9 Unit Apartments | 634 (11.6%) | 4,842 (88.4%) |
| 10 or more Apartments | 1,645 (9.1%) | 16,330 (90.8%) |
| Mobile Home / Other | 305 (79.0%) | 81 (21.0%) |
| Total | 50,677 (56.8%) | 38,551 (43.2%) |
Housing Structures by Number of Rooms in Tacoma
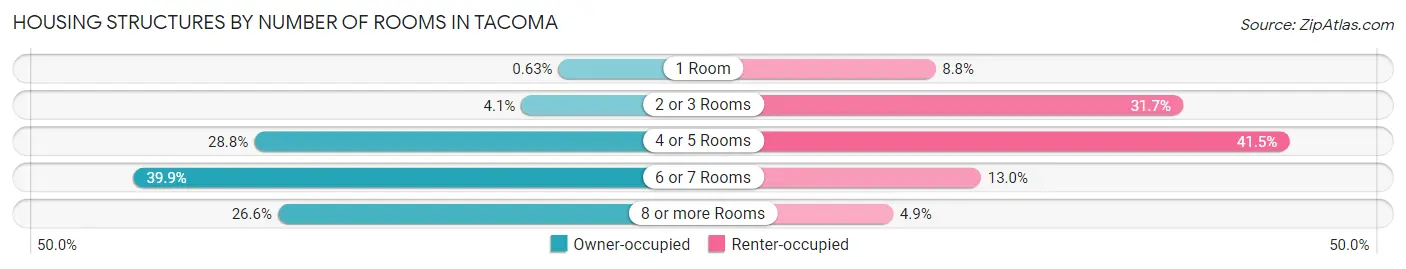
| Number of Rooms | Owner-occupied | Renter-occupied |
| 1 Room | 319 (0.6%) | 3,401 (8.8%) |
| 2 or 3 Rooms | 2,061 (4.1%) | 12,219 (31.7%) |
| 4 or 5 Rooms | 14,583 (28.8%) | 16,016 (41.5%) |
| 6 or 7 Rooms | 20,237 (39.9%) | 5,025 (13.0%) |
| 8 or more Rooms | 13,477 (26.6%) | 1,890 (4.9%) |
| Total | 50,677 (100.0%) | 38,551 (100.0%) |
Housing Structure by Heating Type in Tacoma
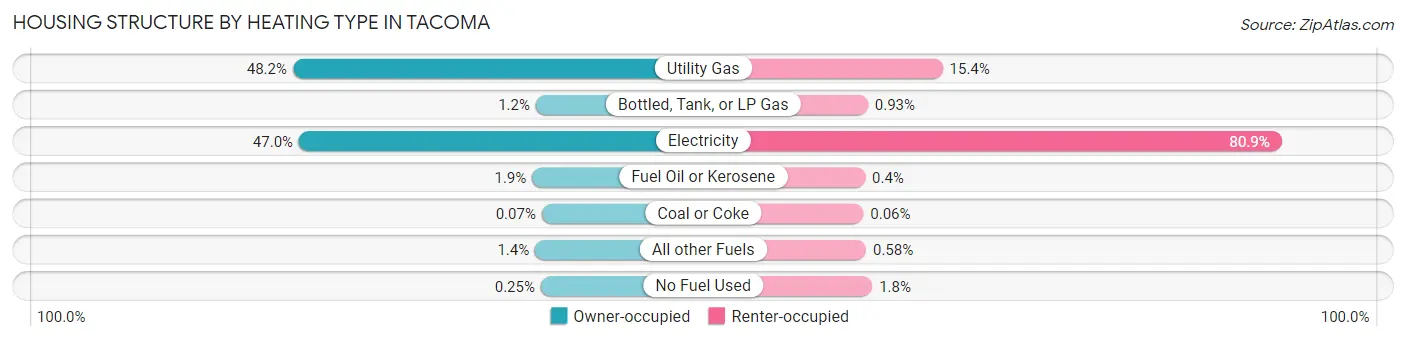
| Heating Type | Owner-occupied | Renter-occupied |
| Utility Gas | 24,414 (48.2%) | 5,926 (15.4%) |
| Bottled, Tank, or LP Gas | 619 (1.2%) | 359 (0.9%) |
| Electricity | 23,812 (47.0%) | 31,180 (80.9%) |
| Fuel Oil or Kerosene | 980 (1.9%) | 153 (0.4%) |
| Coal or Coke | 34 (0.1%) | 25 (0.1%) |
| All other Fuels | 693 (1.4%) | 225 (0.6%) |
| No Fuel Used | 125 (0.3%) | 683 (1.8%) |
| Total | 50,677 (100.0%) | 38,551 (100.0%) |
Household Vehicle Usage in Tacoma
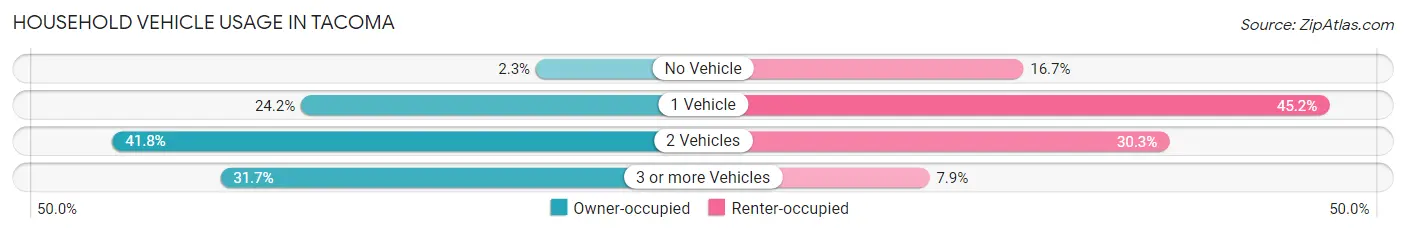
| Vehicles per Household | Owner-occupied | Renter-occupied |
| No Vehicle | 1,150 (2.3%) | 6,420 (16.7%) |
| 1 Vehicle | 12,266 (24.2%) | 17,423 (45.2%) |
| 2 Vehicles | 21,183 (41.8%) | 11,667 (30.3%) |
| 3 or more Vehicles | 16,078 (31.7%) | 3,041 (7.9%) |
| Total | 50,677 (100.0%) | 38,551 (100.0%) |
Real Estate & Mortgages in Tacoma
Real Estate and Mortgage Overview in Tacoma
| Characteristic | Without Mortgage | With Mortgage |
| Housing Units | 13,268 | 37,409 |
| Median Property Value | $418,700 | $414,200 |
| Median Household Income | $78,294 | $11,579 |
| Monthly Housing Costs | $802 | $6,262 |
| Real Estate Taxes | $4,277 | $1,036 |
Property Value by Mortgage Status in Tacoma
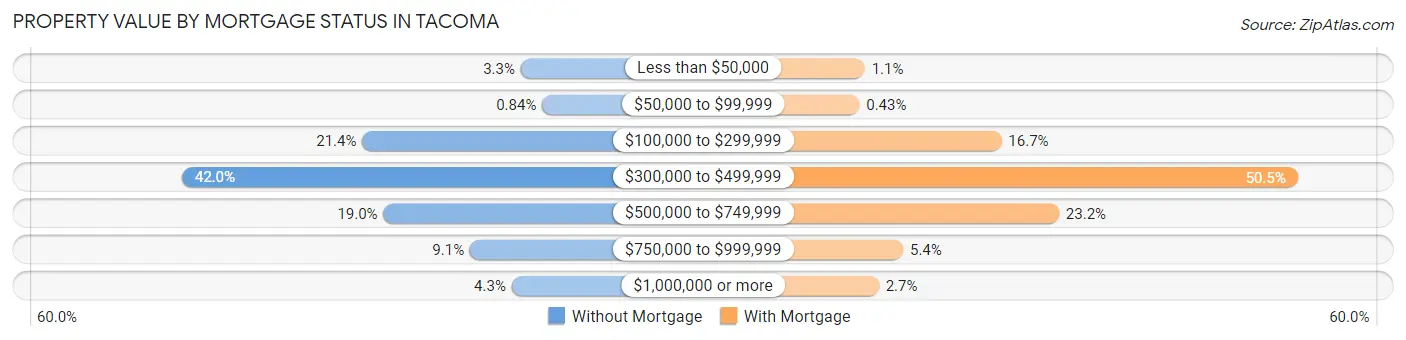
| Property Value | Without Mortgage | With Mortgage |
| Less than $50,000 | 436 (3.3%) | 391 (1.1%) |
| $50,000 to $99,999 | 111 (0.8%) | 160 (0.4%) |
| $100,000 to $299,999 | 2,841 (21.4%) | 6,236 (16.7%) |
| $300,000 to $499,999 | 5,577 (42.0%) | 18,903 (50.5%) |
| $500,000 to $749,999 | 2,520 (19.0%) | 8,695 (23.2%) |
| $750,000 to $999,999 | 1,208 (9.1%) | 2,033 (5.4%) |
| $1,000,000 or more | 575 (4.3%) | 991 (2.6%) |
| Total | 13,268 (100.0%) | 37,409 (100.0%) |
Household Income by Mortgage Status in Tacoma
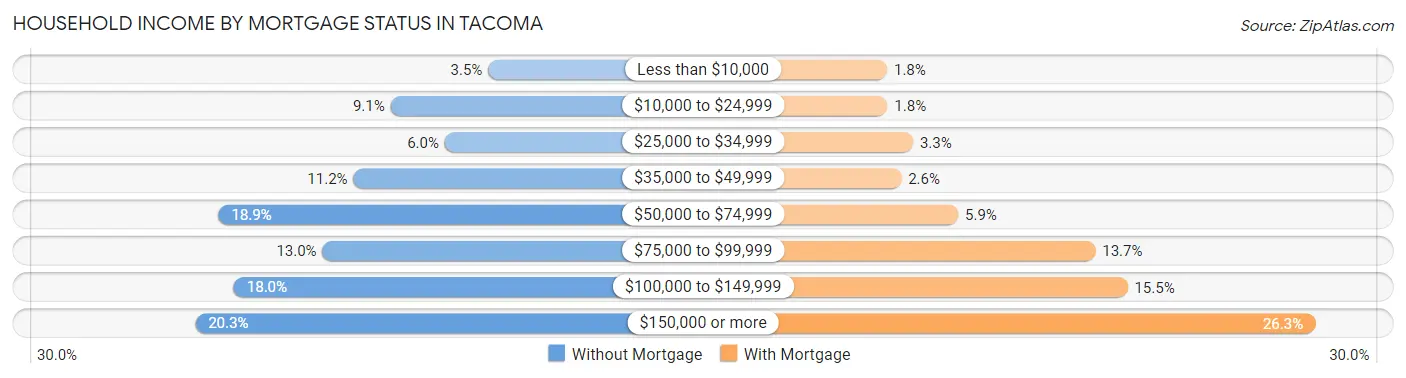
| Household Income | Without Mortgage | With Mortgage |
| Less than $10,000 | 466 (3.5%) | 672 (1.8%) |
| $10,000 to $24,999 | 1,206 (9.1%) | 679 (1.8%) |
| $25,000 to $34,999 | 795 (6.0%) | 1,226 (3.3%) |
| $35,000 to $49,999 | 1,488 (11.2%) | 976 (2.6%) |
| $50,000 to $74,999 | 2,510 (18.9%) | 2,191 (5.9%) |
| $75,000 to $99,999 | 1,722 (13.0%) | 5,126 (13.7%) |
| $100,000 to $149,999 | 2,394 (18.0%) | 5,814 (15.5%) |
| $150,000 or more | 2,687 (20.3%) | 9,818 (26.3%) |
| Total | 13,268 (100.0%) | 37,409 (100.0%) |
Property Value to Household Income Ratio in Tacoma
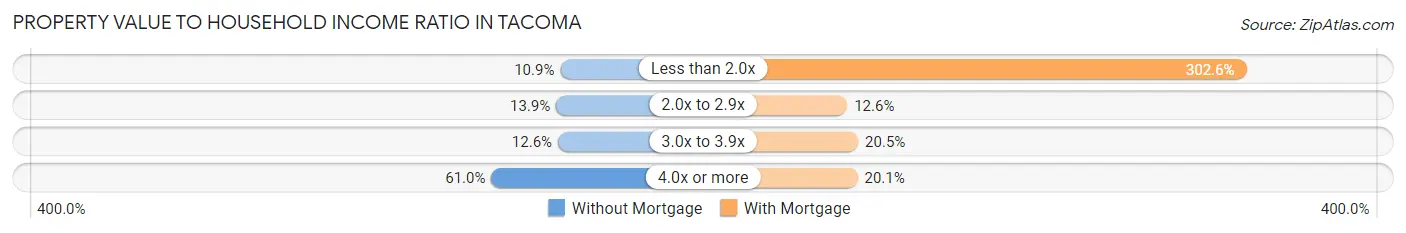
| Value-to-Income Ratio | Without Mortgage | With Mortgage |
| Less than 2.0x | 1,448 (10.9%) | 113,185 (302.6%) |
| 2.0x to 2.9x | 1,849 (13.9%) | 4,704 (12.6%) |
| 3.0x to 3.9x | 1,669 (12.6%) | 7,679 (20.5%) |
| 4.0x or more | 8,091 (61.0%) | 7,512 (20.1%) |
| Total | 13,268 (100.0%) | 37,409 (100.0%) |
Real Estate Taxes by Mortgage Status in Tacoma
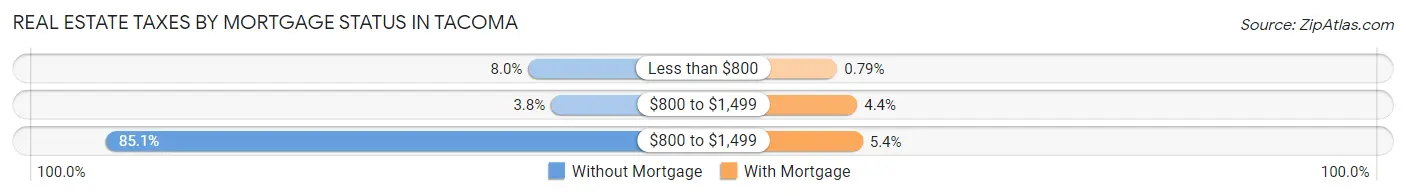
| Property Taxes | Without Mortgage | With Mortgage |
| Less than $800 | 1,064 (8.0%) | 297 (0.8%) |
| $800 to $1,499 | 509 (3.8%) | 1,658 (4.4%) |
| $800 to $1,499 | 11,297 (85.1%) | 2,033 (5.4%) |
| Total | 13,268 (100.0%) | 37,409 (100.0%) |
Health & Disability in Tacoma
Health Insurance Coverage by Age in Tacoma
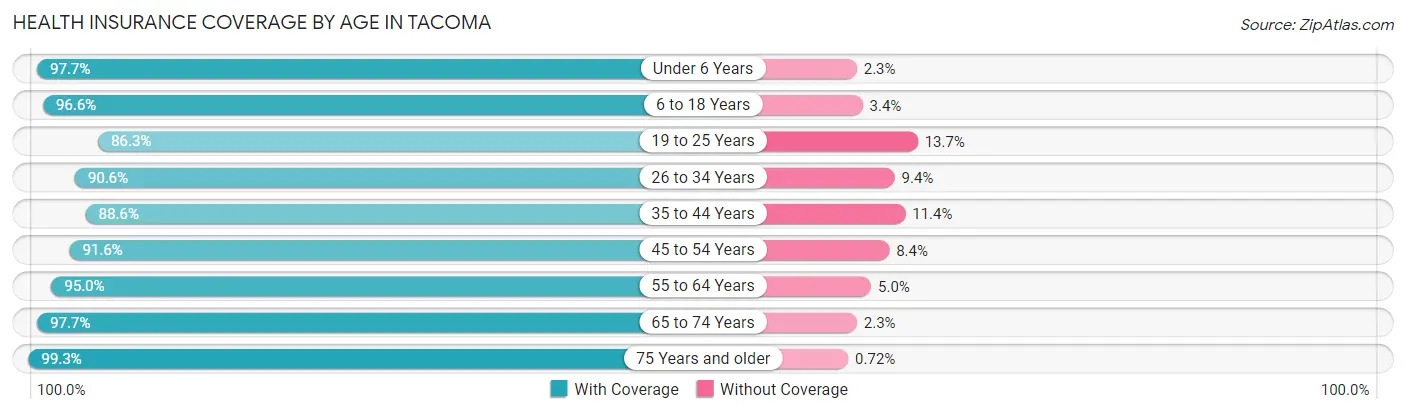
| Age Bracket | With Coverage | Without Coverage |
| Under 6 Years | 15,199 (97.7%) | 363 (2.3%) |
| 6 to 18 Years | 29,257 (96.6%) | 1,036 (3.4%) |
| 19 to 25 Years | 18,006 (86.3%) | 2,855 (13.7%) |
| 26 to 34 Years | 30,151 (90.6%) | 3,121 (9.4%) |
| 35 to 44 Years | 28,952 (88.6%) | 3,715 (11.4%) |
| 45 to 54 Years | 23,901 (91.6%) | 2,184 (8.4%) |
| 55 to 64 Years | 24,621 (95.0%) | 1,297 (5.0%) |
| 65 to 74 Years | 18,282 (97.7%) | 438 (2.3%) |
| 75 Years and older | 11,282 (99.3%) | 82 (0.7%) |
| Total | 199,651 (93.0%) | 15,091 (7.0%) |
Health Insurance Coverage by Citizenship Status in Tacoma
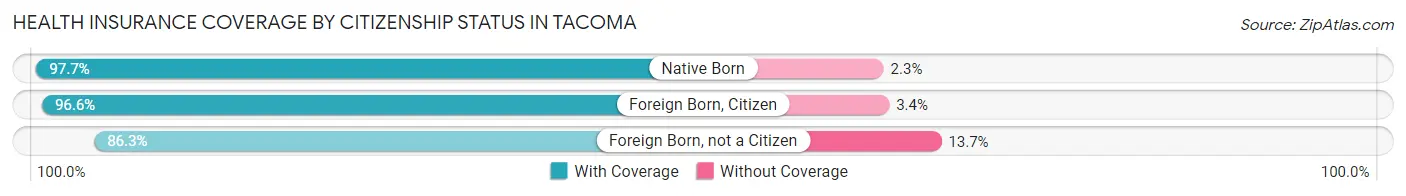
| Citizenship Status | With Coverage | Without Coverage |
| Native Born | 15,199 (97.7%) | 363 (2.3%) |
| Foreign Born, Citizen | 29,257 (96.6%) | 1,036 (3.4%) |
| Foreign Born, not a Citizen | 18,006 (86.3%) | 2,855 (13.7%) |
Health Insurance Coverage by Household Income in Tacoma
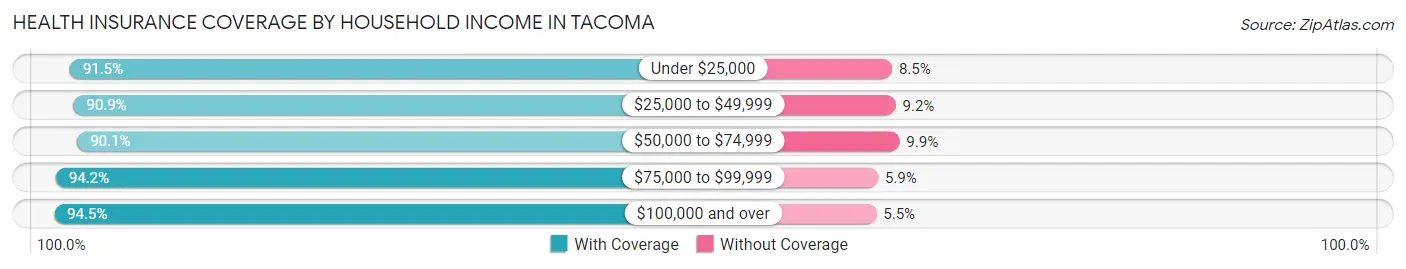
| Household Income | With Coverage | Without Coverage |
| Under $25,000 | 18,375 (91.5%) | 1,700 (8.5%) |
| $25,000 to $49,999 | 26,067 (90.8%) | 2,624 (9.1%) |
| $50,000 to $74,999 | 28,908 (90.1%) | 3,163 (9.9%) |
| $75,000 to $99,999 | 27,137 (94.2%) | 1,685 (5.9%) |
| $100,000 and over | 95,295 (94.5%) | 5,573 (5.5%) |
Public vs Private Health Insurance Coverage by Age in Tacoma
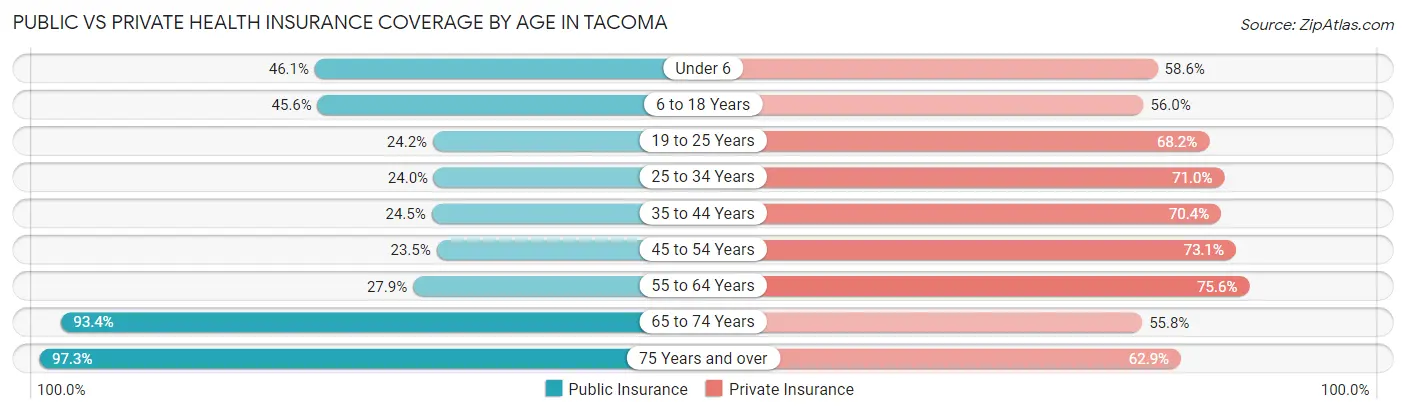
| Age Bracket | Public Insurance | Private Insurance |
| Under 6 | 7,178 (46.1%) | 9,124 (58.6%) |
| 6 to 18 Years | 13,818 (45.6%) | 16,964 (56.0%) |
| 19 to 25 Years | 5,051 (24.2%) | 14,219 (68.2%) |
| 25 to 34 Years | 7,996 (24.0%) | 23,621 (71.0%) |
| 35 to 44 Years | 7,989 (24.5%) | 22,992 (70.4%) |
| 45 to 54 Years | 6,138 (23.5%) | 19,075 (73.1%) |
| 55 to 64 Years | 7,235 (27.9%) | 19,600 (75.6%) |
| 65 to 74 Years | 17,475 (93.3%) | 10,438 (55.8%) |
| 75 Years and over | 11,060 (97.3%) | 7,152 (62.9%) |
| Total | 83,940 (39.1%) | 143,185 (66.7%) |
Disability Status by Sex by Age in Tacoma
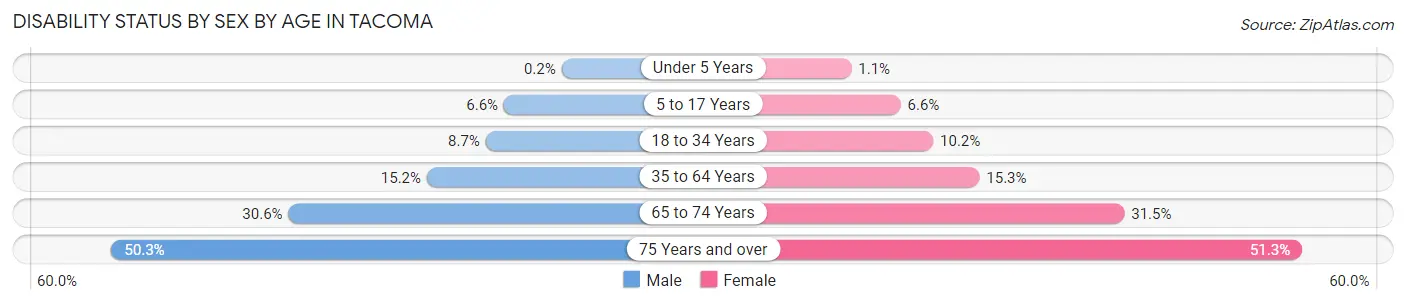
| Age Bracket | Male | Female |
| Under 5 Years | 13 (0.2%) | 69 (1.1%) |
| 5 to 17 Years | 1,024 (6.6%) | 966 (6.6%) |
| 18 to 34 Years | 2,446 (8.6%) | 2,894 (10.2%) |
| 35 to 64 Years | 6,595 (15.2%) | 6,321 (15.3%) |
| 65 to 74 Years | 2,727 (30.6%) | 3,087 (31.5%) |
| 75 Years and over | 2,293 (50.3%) | 3,489 (51.2%) |
Disability Class by Sex by Age in Tacoma
Disability Class: Hearing Difficulty
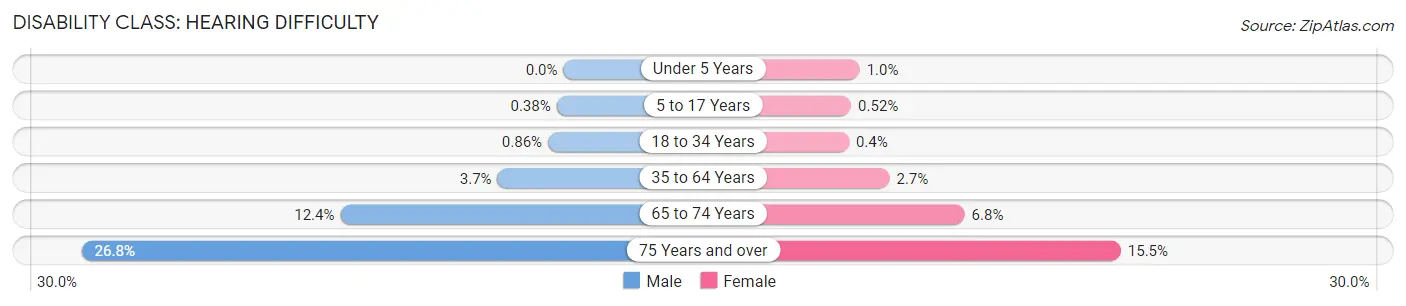
| Age Bracket | Male | Female |
| Under 5 Years | 0 (0.0%) | 65 (1.0%) |
| 5 to 17 Years | 59 (0.4%) | 77 (0.5%) |
| 18 to 34 Years | 244 (0.9%) | 113 (0.4%) |
| 35 to 64 Years | 1,594 (3.7%) | 1,098 (2.7%) |
| 65 to 74 Years | 1,106 (12.4%) | 671 (6.8%) |
| 75 Years and over | 1,222 (26.8%) | 1,058 (15.5%) |
Disability Class: Vision Difficulty
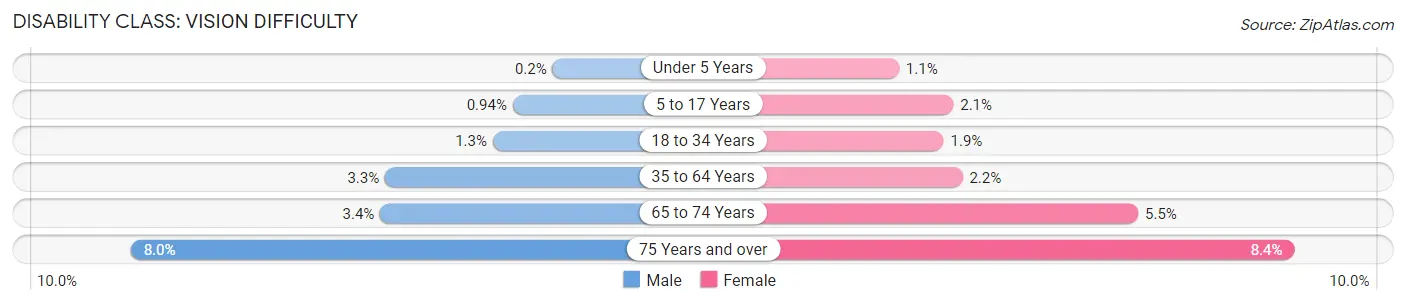
| Age Bracket | Male | Female |
| Under 5 Years | 13 (0.2%) | 69 (1.1%) |
| 5 to 17 Years | 145 (0.9%) | 305 (2.1%) |
| 18 to 34 Years | 369 (1.3%) | 537 (1.9%) |
| 35 to 64 Years | 1,435 (3.3%) | 923 (2.2%) |
| 65 to 74 Years | 303 (3.4%) | 540 (5.5%) |
| 75 Years and over | 366 (8.0%) | 572 (8.4%) |
Disability Class: Cognitive Difficulty
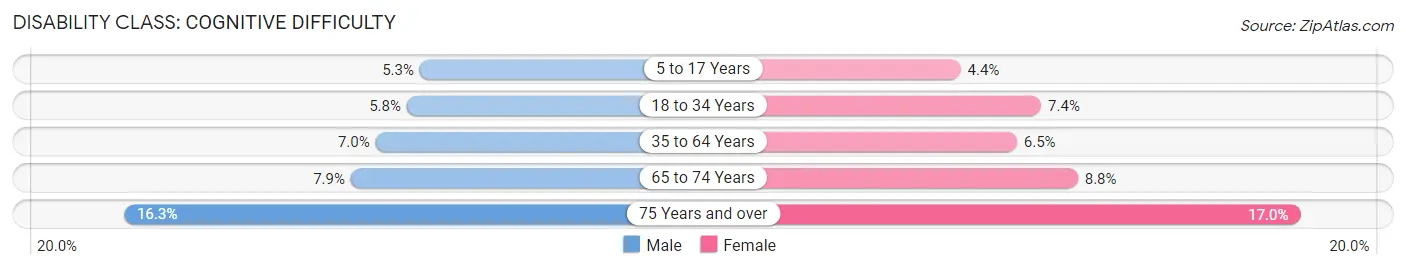
| Age Bracket | Male | Female |
| 5 to 17 Years | 824 (5.3%) | 651 (4.4%) |
| 18 to 34 Years | 1,642 (5.8%) | 2,106 (7.4%) |
| 35 to 64 Years | 3,024 (7.0%) | 2,681 (6.5%) |
| 65 to 74 Years | 703 (7.9%) | 860 (8.8%) |
| 75 Years and over | 743 (16.3%) | 1,159 (17.0%) |
Disability Class: Ambulatory Difficulty
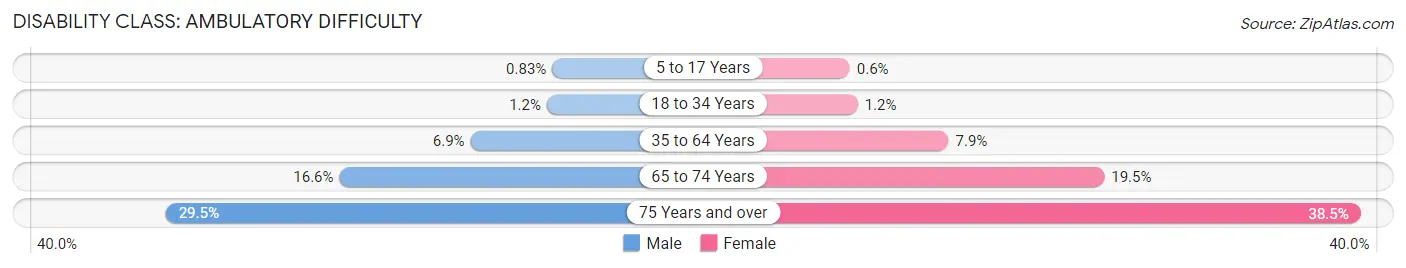
| Age Bracket | Male | Female |
| 5 to 17 Years | 129 (0.8%) | 89 (0.6%) |
| 18 to 34 Years | 348 (1.2%) | 336 (1.2%) |
| 35 to 64 Years | 2,993 (6.9%) | 3,273 (7.9%) |
| 65 to 74 Years | 1,481 (16.6%) | 1,913 (19.5%) |
| 75 Years and over | 1,345 (29.5%) | 2,622 (38.5%) |
Disability Class: Self-Care Difficulty
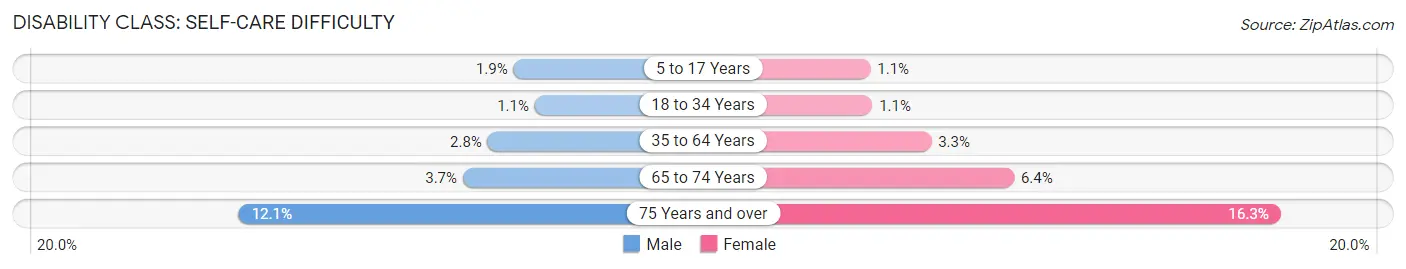
| Age Bracket | Male | Female |
| 5 to 17 Years | 286 (1.8%) | 156 (1.1%) |
| 18 to 34 Years | 301 (1.1%) | 321 (1.1%) |
| 35 to 64 Years | 1,220 (2.8%) | 1,369 (3.3%) |
| 65 to 74 Years | 332 (3.7%) | 627 (6.4%) |
| 75 Years and over | 549 (12.0%) | 1,109 (16.3%) |
Technology Access in Tacoma
Computing Device Access in Tacoma
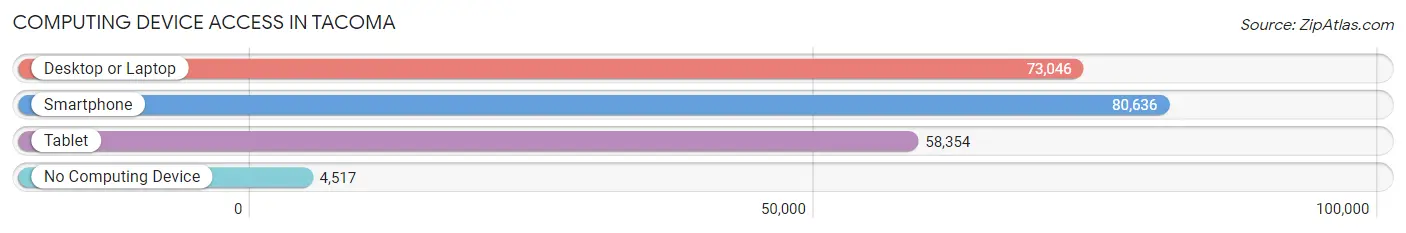
| Device Type | # Households | % Households |
| Desktop or Laptop | 73,046 | 81.9% |
| Smartphone | 80,636 | 90.4% |
| Tablet | 58,354 | 65.4% |
| No Computing Device | 4,517 | 5.1% |
| Total | 89,228 | 100.0% |
Internet Access in Tacoma
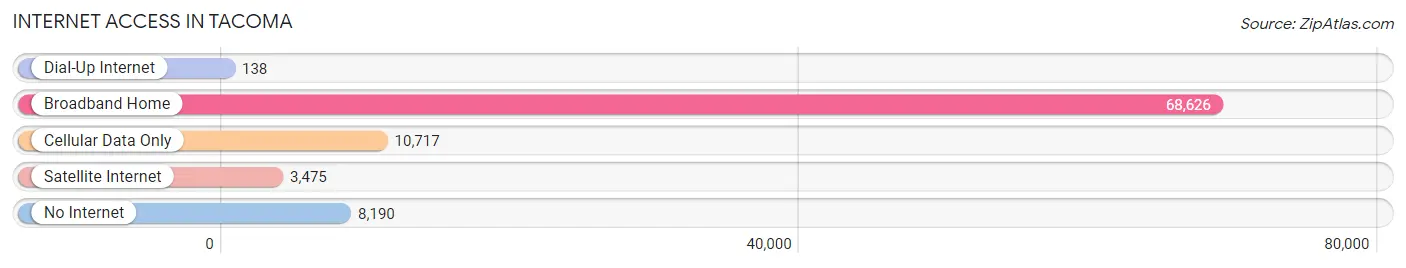
| Internet Type | # Households | % Households |
| Dial-Up Internet | 138 | 0.2% |
| Broadband Home | 68,626 | 76.9% |
| Cellular Data Only | 10,717 | 12.0% |
| Satellite Internet | 3,475 | 3.9% |
| No Internet | 8,190 | 9.2% |
| Total | 89,228 | 100.0% |
Tacoma Summary
Tacoma, Washington is a city located in Pierce County, Washington, United States. It is the county seat and the third-largest city in the state, with a population of approximately 200,000 people. Tacoma is located along the Puget Sound, approximately 32 miles south of Seattle and 31 miles northeast of Olympia, the state capital. Tacoma is a major port city, with a deep-water seaport that serves as a major gateway for trade with Asia and other parts of the world.
History
Tacoma was first inhabited by the Puyallup Tribe of Native Americans, who lived in the area for thousands of years before the arrival of European settlers. The first European settlers arrived in the area in 1852, and the city was officially incorporated in 1875. Tacoma quickly grew in size and importance, becoming a major port city and a hub for the lumber and coal industries. In the late 19th century, Tacoma was known as the “City of Destiny” due to its rapid growth and development.
In the early 20th century, Tacoma was a major center for the shipbuilding industry, and the city was home to several large shipyards. During World War II, Tacoma was a major center for the production of military ships and equipment. After the war, Tacoma experienced a period of economic decline, but the city has since rebounded and is now a major center for technology, healthcare, and education.
Geography
Tacoma is located in western Washington, along the Puget Sound. The city is situated on a narrow strip of land between Commencement Bay and the Puyallup River. The city is surrounded by several mountain ranges, including the Cascade Range to the east and the Olympic Mountains to the west. The city has a total area of 62.3 square miles, of which 59.3 square miles is land and 3.0 square miles is water.
Tacoma has a mild, temperate climate, with warm summers and mild winters. The average annual temperature is approximately 54°F, and the average annual precipitation is approximately 37 inches.
Economy
Tacoma’s economy is largely based on the port, which is the largest in the state and the third-largest in the country. The port is a major gateway for trade with Asia and other parts of the world, and it is home to several major shipping companies. The port also serves as a major hub for the fishing industry, and it is home to several large seafood processing plants.
In addition to the port, Tacoma is home to several major industries, including healthcare, technology, manufacturing, and education. The city is home to several major employers, including MultiCare Health System, the University of Washington Tacoma, and the Joint Base Lewis-McChord.
Demographics
As of the 2010 census, Tacoma had a population of 198,397 people. The racial makeup of the city was 68.7% White, 13.2% African American, 8.3% Asian, 0.7% Native American, 0.3% Pacific Islander, and 8.1% from other races. The median household income was $45,837, and the median family income was $54,837.
Tacoma is a diverse city, with a large population of immigrants from all over the world. The city is home to a large number of refugees from Southeast Asia, the Middle East, and Africa. The city is also home to a large number of Native Americans, and the Puyallup Tribe is the largest Native American tribe in the area.
Common Questions
What is Per Capita Income in Tacoma?
Per Capita income in Tacoma is $41,788.
What is the Median Family Income in Tacoma?
Median Family Income in Tacoma is $96,784.
What is the Median Household income in Tacoma?
Median Household Income in Tacoma is $79,085.
What is Income or Wage Gap in Tacoma?
Income or Wage Gap in Tacoma is 19.3%.
Women in Tacoma earn 80.7 cents for every dollar earned by a man.
What is Family Income Deficit in Tacoma?
Family Income Deficit in Tacoma is $11,996.
Families that are below poverty line in Tacoma earn $11,996 less on average than the poverty threshold level.
What is Inequality or Gini Index in Tacoma?
Inequality or Gini Index in Tacoma is 0.43.
What is the Total Population of Tacoma?
Total Population of Tacoma is 219,234.
What is the Total Male Population of Tacoma?
Total Male Population of Tacoma is 110,127.
What is the Total Female Population of Tacoma?
Total Female Population of Tacoma is 109,107.
What is the Ratio of Males per 100 Females in Tacoma?
There are 100.93 Males per 100 Females in Tacoma.
What is the Ratio of Females per 100 Males in Tacoma?
There are 99.07 Females per 100 Males in Tacoma.
What is the Median Population Age in Tacoma?
Median Population Age in Tacoma is 36.9 Years.
What is the Average Family Size in Tacoma
Average Family Size in Tacoma is 3.0 People.
What is the Average Household Size in Tacoma
Average Household Size in Tacoma is 2.4 People.
How Large is the Labor Force in Tacoma?
There are 120,087 People in the Labor Forcein in Tacoma.
What is the Percentage of People in the Labor Force in Tacoma?
66.7% of People are in the Labor Force in Tacoma.
What is the Unemployment Rate in Tacoma?
Unemployment Rate in Tacoma is 5.4%.