Peoria, AZ Map & Demographics
Peoria Map
Peoria Overview
$42,627
PER CAPITA INCOME
$102,661
AVG FAMILY INCOME
$86,759
AVG HOUSEHOLD INCOME
22.6%
WAGE / INCOME GAP [ % ]
77.4¢/ $1
WAGE / INCOME GAP [ $ ]
$11,829
FAMILY INCOME DEFICIT
0.43
INEQUALITY / GINI INDEX
191,292
TOTAL POPULATION
92,807
MALE POPULATION
98,485
FEMALE POPULATION
94.23
MALES / 100 FEMALES
106.12
FEMALES / 100 MALES
41.4
MEDIAN AGE
3.1
AVG FAMILY SIZE
2.6
AVG HOUSEHOLD SIZE
94,209
LABOR FORCE [ PEOPLE ]
61.5%
PERCENT IN LABOR FORCE
3.9%
UNEMPLOYMENT RATE
Income in Peoria
Income Overview in Peoria
Per Capita Income in Peoria is $42,627, while median incomes of families and households are $102,661 and $86,759 respectively.
| Characteristic | Number | Measure |
| Per Capita Income | 191,292 | $42,627 |
| Median Family Income | 51,402 | $102,661 |
| Mean Family Income | 51,402 | $125,876 |
| Median Household Income | 71,733 | $86,759 |
| Mean Household Income | 71,733 | $111,786 |
| Income Deficit | 51,402 | $11,829 |
| Wage / Income Gap (%) | 191,292 | 22.58% |
| Wage / Income Gap ($) | 191,292 | 77.42¢ per $1 |
| Gini / Inequality Index | 191,292 | 0.43 |
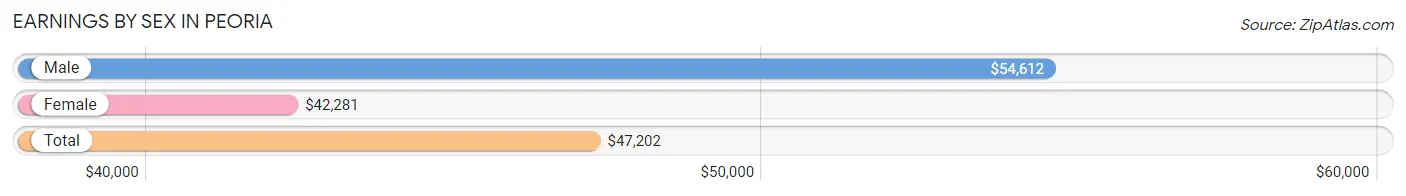
Earnings by Sex in Peoria
Average Earnings in Peoria are $47,202, $54,612 for men and $42,281 for women, a difference of 22.6%.
| Sex | Number | Average Earnings |
| Male | 51,503 (52.6%) | $54,612 |
| Female | 46,311 (47.3%) | $42,281 |
| Total | 97,814 (100.0%) | $47,202 |
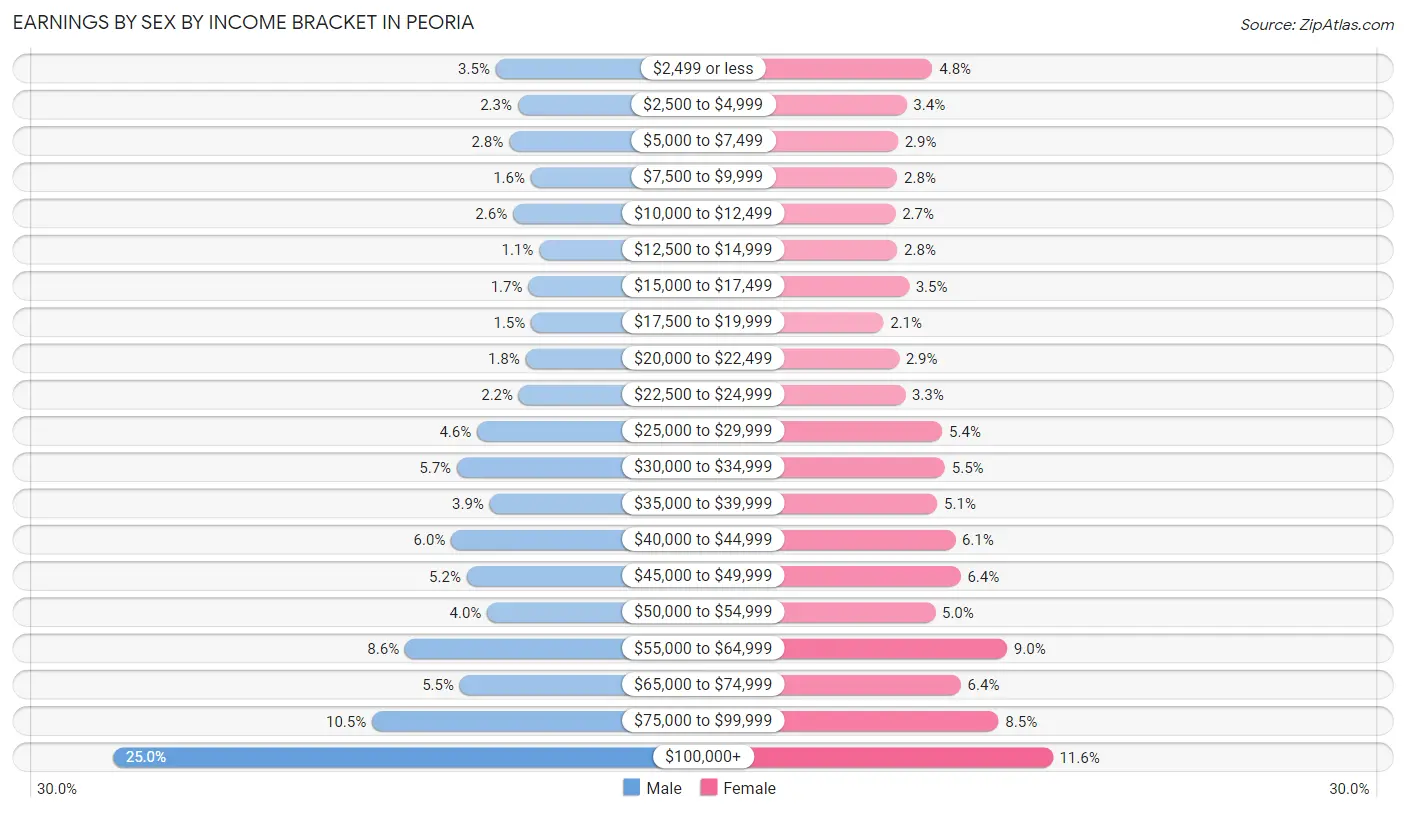
Earnings by Sex by Income Bracket in Peoria
The most common earnings brackets in Peoria are $100,000+ for men (12,897 | 25.0%) and $100,000+ for women (5,353 | 11.6%).
| Income | Male | Female |
| $2,499 or less | 1,812 (3.5%) | 2,229 (4.8%) |
| $2,500 to $4,999 | 1,173 (2.3%) | 1,550 (3.4%) |
| $5,000 to $7,499 | 1,428 (2.8%) | 1,324 (2.9%) |
| $7,500 to $9,999 | 798 (1.5%) | 1,311 (2.8%) |
| $10,000 to $12,499 | 1,313 (2.5%) | 1,261 (2.7%) |
| $12,500 to $14,999 | 558 (1.1%) | 1,311 (2.8%) |
| $15,000 to $17,499 | 868 (1.7%) | 1,613 (3.5%) |
| $17,500 to $19,999 | 789 (1.5%) | 948 (2.1%) |
| $20,000 to $22,499 | 947 (1.8%) | 1,352 (2.9%) |
| $22,500 to $24,999 | 1,141 (2.2%) | 1,515 (3.3%) |
| $25,000 to $29,999 | 2,352 (4.6%) | 2,484 (5.4%) |
| $30,000 to $34,999 | 2,936 (5.7%) | 2,554 (5.5%) |
| $35,000 to $39,999 | 1,990 (3.9%) | 2,352 (5.1%) |
| $40,000 to $44,999 | 3,103 (6.0%) | 2,814 (6.1%) |
| $45,000 to $49,999 | 2,652 (5.1%) | 2,960 (6.4%) |
| $50,000 to $54,999 | 2,060 (4.0%) | 2,299 (5.0%) |
| $55,000 to $64,999 | 4,440 (8.6%) | 4,170 (9.0%) |
| $65,000 to $74,999 | 2,852 (5.5%) | 2,966 (6.4%) |
| $75,000 to $99,999 | 5,394 (10.5%) | 3,945 (8.5%) |
| $100,000+ | 12,897 (25.0%) | 5,353 (11.6%) |
| Total | 51,503 (100.0%) | 46,311 (100.0%) |
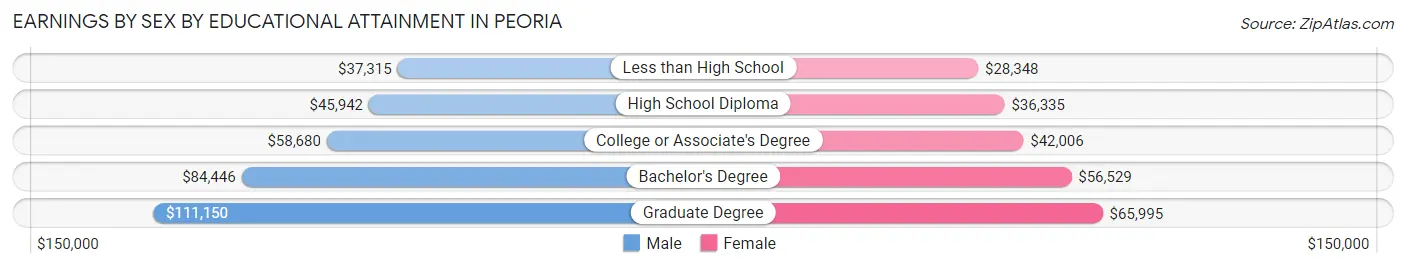
Earnings by Sex by Educational Attainment in Peoria
Average earnings in Peoria are $60,441 for men and $47,043 for women, a difference of 22.2%. Men with an educational attainment of graduate degree enjoy the highest average annual earnings of $111,150, while those with less than high school education earn the least with $37,315. Women with an educational attainment of graduate degree earn the most with the average annual earnings of $65,995, while those with less than high school education have the smallest earnings of $28,348.
| Educational Attainment | Male Income | Female Income |
| Less than High School | $37,315 | $28,348 |
| High School Diploma | $45,942 | $36,335 |
| College or Associate's Degree | $58,680 | $42,006 |
| Bachelor's Degree | $84,446 | $56,529 |
| Graduate Degree | $111,150 | $65,995 |
| Total | $60,441 | $47,043 |
Family Income in Peoria
Family Income Brackets in Peoria
According to the Peoria family income data, there are 11,668 families falling into the $100,000 to $149,999 income range, which is the most common income bracket and makes up 22.7% of all families. Conversely, the $10,000 to $14,999 income bracket is the least frequent group with only 463 families (0.9%) belonging to this category.
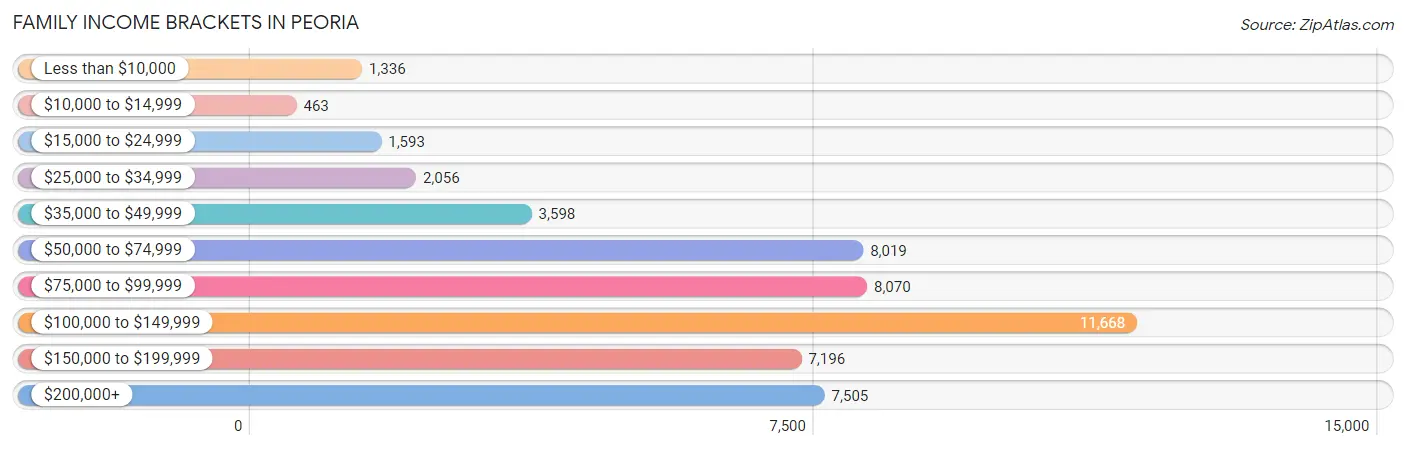
| Income Bracket | # Families | % Families |
| Less than $10,000 | 1,336 | 2.6% |
| $10,000 to $14,999 | 463 | 0.9% |
| $15,000 to $24,999 | 1,593 | 3.1% |
| $25,000 to $34,999 | 2,056 | 4.0% |
| $35,000 to $49,999 | 3,598 | 7.0% |
| $50,000 to $74,999 | 8,019 | 15.6% |
| $75,000 to $99,999 | 8,070 | 15.7% |
| $100,000 to $149,999 | 11,668 | 22.7% |
| $150,000 to $199,999 | 7,196 | 14.0% |
| $200,000+ | 7,505 | 14.6% |
Family Income by Famaliy Size in Peoria
7+ person families (938 | 1.8%) account for the highest median family income in Peoria with $167,143 per family, while 2-person families (24,494 | 47.6%) have the highest median income of $43,600 per family member.
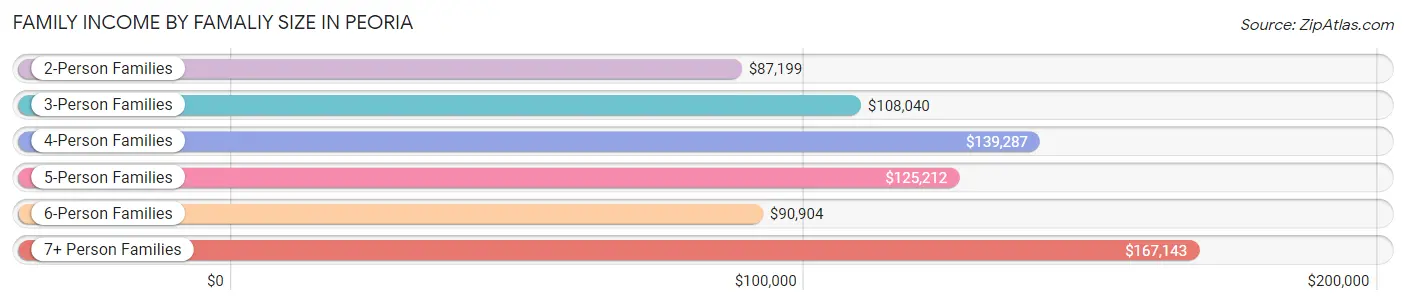
| Income Bracket | # Families | Median Income |
| 2-Person Families | 24,494 (47.6%) | $87,199 |
| 3-Person Families | 11,189 (21.8%) | $108,040 |
| 4-Person Families | 8,901 (17.3%) | $139,287 |
| 5-Person Families | 4,297 (8.4%) | $125,212 |
| 6-Person Families | 1,583 (3.1%) | $90,904 |
| 7+ Person Families | 938 (1.8%) | $167,143 |
| Total | 51,402 (100.0%) | $102,661 |
Family Income by Number of Earners in Peoria
The median family income in Peoria is $102,661, with families comprising 3+ earners (6,314) having the highest median family income of $151,095, while families with no earners (8,364) have the lowest median family income of $61,259, accounting for 12.3% and 16.3% of families, respectively.
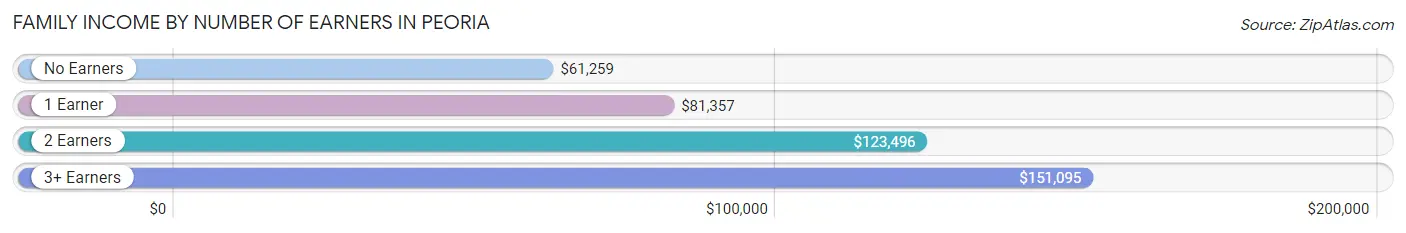
| Number of Earners | # Families | Median Income |
| No Earners | 8,364 (16.3%) | $61,259 |
| 1 Earner | 15,708 (30.6%) | $81,357 |
| 2 Earners | 21,016 (40.9%) | $123,496 |
| 3+ Earners | 6,314 (12.3%) | $151,095 |
| Total | 51,402 (100.0%) | $102,661 |
Household Income in Peoria
Household Income Brackets in Peoria
With 14,131 households falling in the category, the $100,000 to $149,999 income range is the most frequent in Peoria, accounting for 19.7% of all households. In contrast, only 1,219 households (1.7%) fall into the $10,000 to $14,999 income bracket, making it the least populous group.
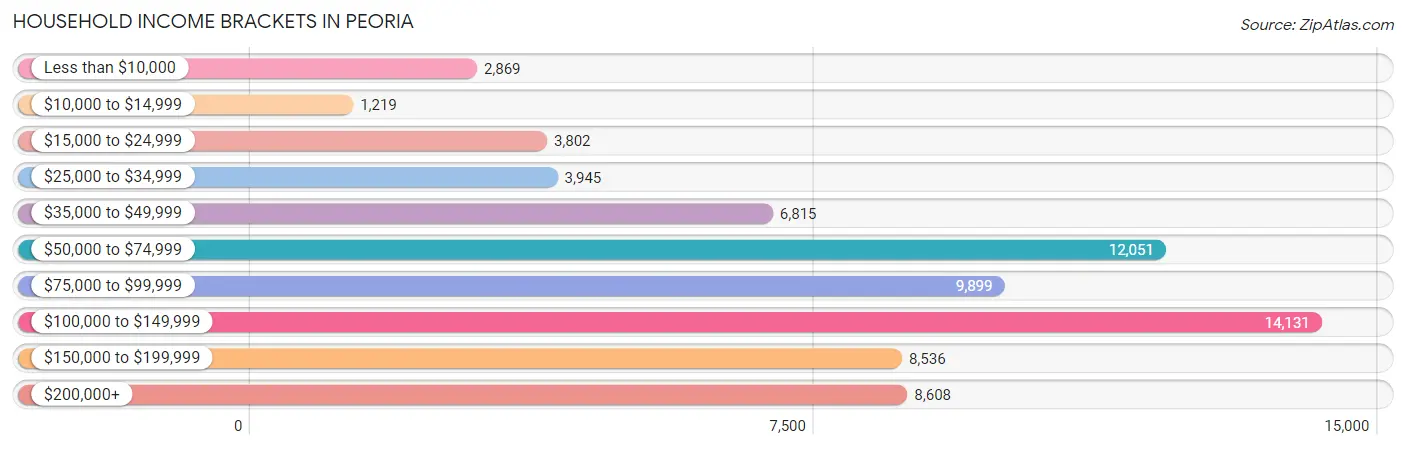
| Income Bracket | # Households | % Households |
| Less than $10,000 | 2,869 | 4.0% |
| $10,000 to $14,999 | 1,219 | 1.7% |
| $15,000 to $24,999 | 3,802 | 5.3% |
| $25,000 to $34,999 | 3,945 | 5.5% |
| $35,000 to $49,999 | 6,815 | 9.5% |
| $50,000 to $74,999 | 12,051 | 16.8% |
| $75,000 to $99,999 | 9,899 | 13.8% |
| $100,000 to $149,999 | 14,131 | 19.7% |
| $150,000 to $199,999 | 8,536 | 11.9% |
| $200,000+ | 8,608 | 12.0% |
Household Income by Householder Age in Peoria
The median household income in Peoria is $86,759, with the highest median household income of $106,611 found in the 45 to 64 years age bracket for the primary householder. A total of 27,403 households (38.2%) fall into this category. Meanwhile, the 15 to 24 years age bracket for the primary householder has the lowest median household income of $59,260, with 1,565 households (2.2%) in this group.
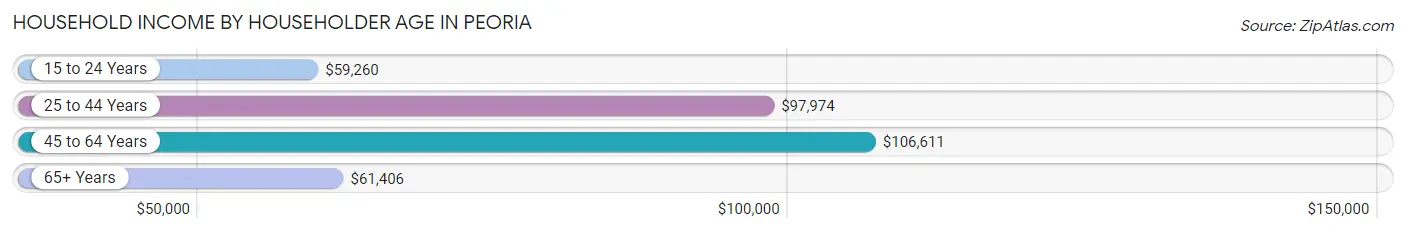
| Income Bracket | # Households | Median Income |
| 15 to 24 Years | 1,565 (2.2%) | $59,260 |
| 25 to 44 Years | 22,144 (30.9%) | $97,974 |
| 45 to 64 Years | 27,403 (38.2%) | $106,611 |
| 65+ Years | 20,621 (28.7%) | $61,406 |
| Total | 71,733 (100.0%) | $86,759 |
Poverty in Peoria
Income Below Poverty by Sex and Age in Peoria
With 7.6% poverty level for males and 9.2% for females among the residents of Peoria, 5 year old males and under 5 year old females are the most vulnerable to poverty, with 233 males (25.4%) and 649 females (14.1%) in their respective age groups living below the poverty level.
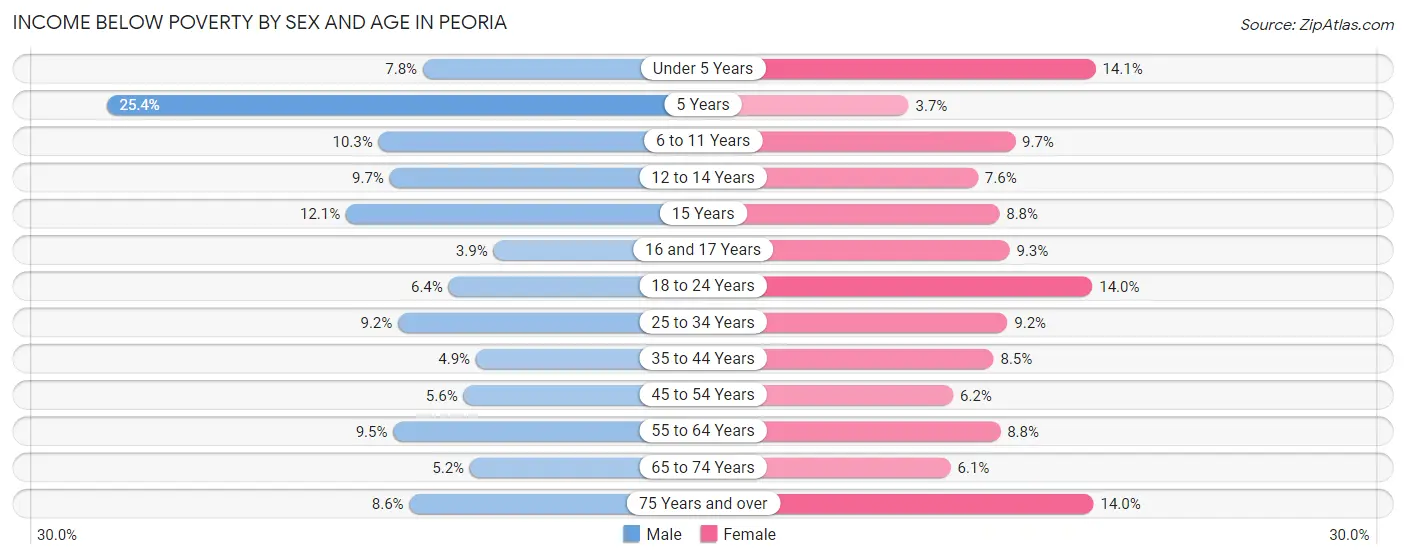
| Age Bracket | Male | Female |
| Under 5 Years | 391 (7.8%) | 649 (14.1%) |
| 5 Years | 233 (25.4%) | 48 (3.7%) |
| 6 to 11 Years | 797 (10.3%) | 677 (9.7%) |
| 12 to 14 Years | 363 (9.7%) | 292 (7.6%) |
| 15 Years | 174 (12.1%) | 161 (8.8%) |
| 16 and 17 Years | 102 (3.9%) | 241 (9.3%) |
| 18 to 24 Years | 435 (6.4%) | 975 (14.0%) |
| 25 to 34 Years | 988 (9.2%) | 997 (9.2%) |
| 35 to 44 Years | 620 (4.9%) | 1,094 (8.5%) |
| 45 to 54 Years | 655 (5.6%) | 740 (6.2%) |
| 55 to 64 Years | 1,186 (9.5%) | 1,250 (8.8%) |
| 65 to 74 Years | 508 (5.2%) | 685 (6.1%) |
| 75 Years and over | 515 (8.6%) | 1,128 (14.0%) |
| Total | 6,967 (7.6%) | 8,937 (9.2%) |
Income Above Poverty by Sex and Age in Peoria
According to the poverty statistics in Peoria, males aged 16 and 17 years and females aged 5 years are the age groups that are most secure financially, with 96.1% of males and 96.3% of females in these age groups living above the poverty line.
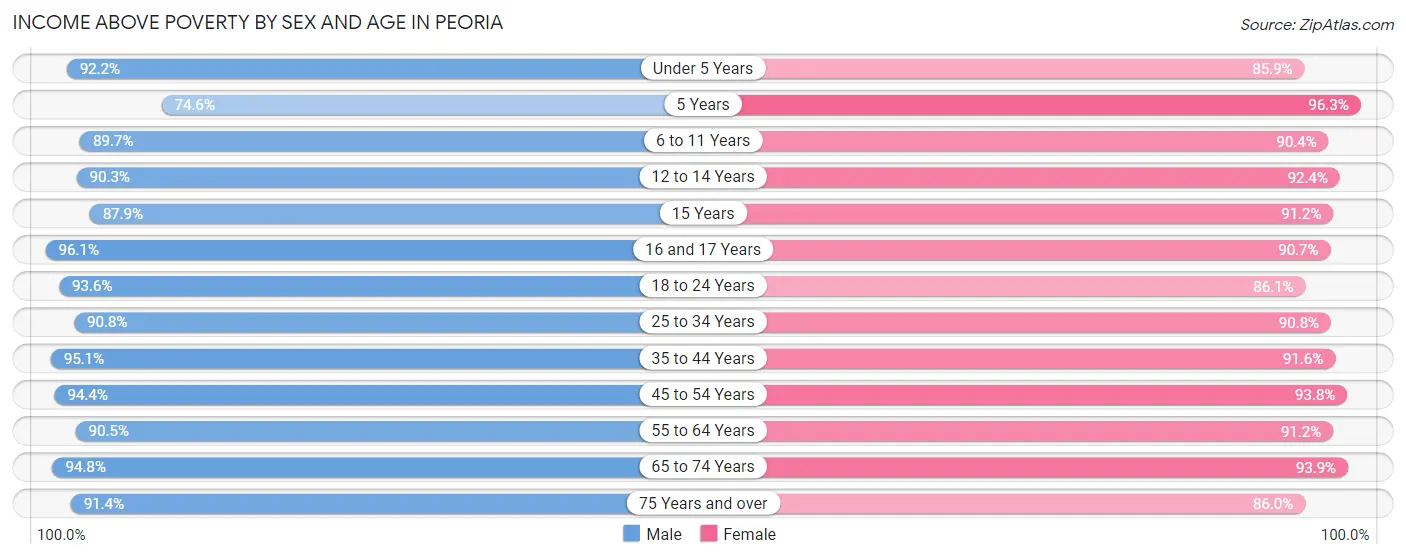
| Age Bracket | Male | Female |
| Under 5 Years | 4,612 (92.2%) | 3,944 (85.9%) |
| 5 Years | 683 (74.6%) | 1,242 (96.3%) |
| 6 to 11 Years | 6,949 (89.7%) | 6,338 (90.3%) |
| 12 to 14 Years | 3,392 (90.3%) | 3,558 (92.4%) |
| 15 Years | 1,264 (87.9%) | 1,674 (91.2%) |
| 16 and 17 Years | 2,523 (96.1%) | 2,339 (90.7%) |
| 18 to 24 Years | 6,376 (93.6%) | 6,015 (86.1%) |
| 25 to 34 Years | 9,751 (90.8%) | 9,816 (90.8%) |
| 35 to 44 Years | 12,118 (95.1%) | 11,850 (91.5%) |
| 45 to 54 Years | 11,133 (94.4%) | 11,200 (93.8%) |
| 55 to 64 Years | 11,342 (90.5%) | 12,917 (91.2%) |
| 65 to 74 Years | 9,268 (94.8%) | 10,622 (93.9%) |
| 75 Years and over | 5,497 (91.4%) | 6,916 (86.0%) |
| Total | 84,908 (92.4%) | 88,431 (90.8%) |
Income Below Poverty Among Married-Couple Families in Peoria
The poverty statistics for married-couple families in Peoria show that 4.2% or 1,644 of the total 39,647 families live below the poverty line. Families with 5 or more children have the highest poverty rate of 12.9%, comprising of 31 families. On the other hand, families with 1 or 2 children have the lowest poverty rate of 3.7%, which includes 467 families.
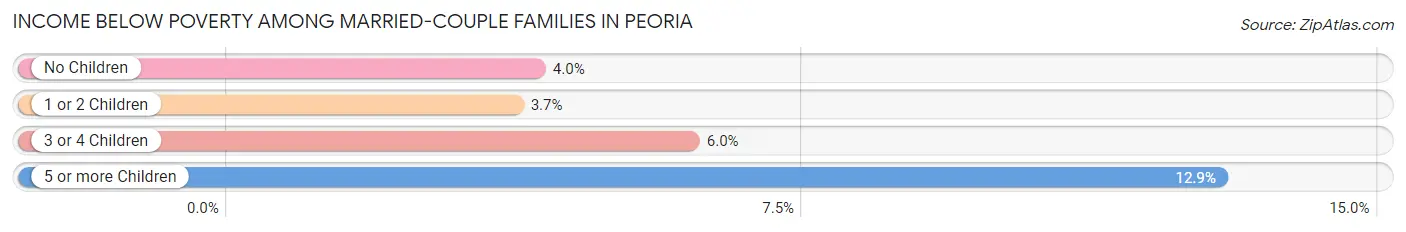
| Children | Above Poverty | Below Poverty |
| No Children | 22,685 (96.0%) | 949 (4.0%) |
| 1 or 2 Children | 12,037 (96.3%) | 467 (3.7%) |
| 3 or 4 Children | 3,072 (94.0%) | 197 (6.0%) |
| 5 or more Children | 209 (87.1%) | 31 (12.9%) |
| Total | 38,003 (95.9%) | 1,644 (4.2%) |
Income Below Poverty Among Single-Parent Households in Peoria
According to the poverty data in Peoria, 8.6% or 305 single-father households and 14.4% or 1,177 single-mother households are living below the poverty line. Among single-father households, those with 5 or more children have the highest poverty rate, with 18 households (47.4%) experiencing poverty. Likewise, among single-mother households, those with 5 or more children have the highest poverty rate, with 59 households (62.8%) falling below the poverty line.
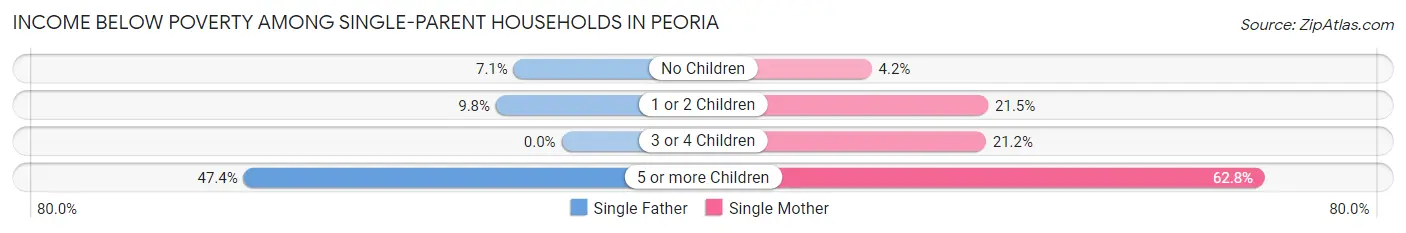
| Children | Single Father | Single Mother |
| No Children | 115 (7.1%) | 149 (4.2%) |
| 1 or 2 Children | 172 (9.8%) | 786 (21.5%) |
| 3 or 4 Children | 0 (0.0%) | 183 (21.2%) |
| 5 or more Children | 18 (47.4%) | 59 (62.8%) |
| Total | 305 (8.6%) | 1,177 (14.4%) |
Income Below Poverty Among Married-Couple vs Single-Parent Households in Peoria
The poverty data for Peoria shows that 1,644 of the married-couple family households (4.2%) and 1,482 of the single-parent households (12.6%) are living below the poverty level. Within the married-couple family households, those with 5 or more children have the highest poverty rate, with 31 households (12.9%) falling below the poverty line. Among the single-parent households, those with 5 or more children have the highest poverty rate, with 77 household (58.3%) living below poverty.
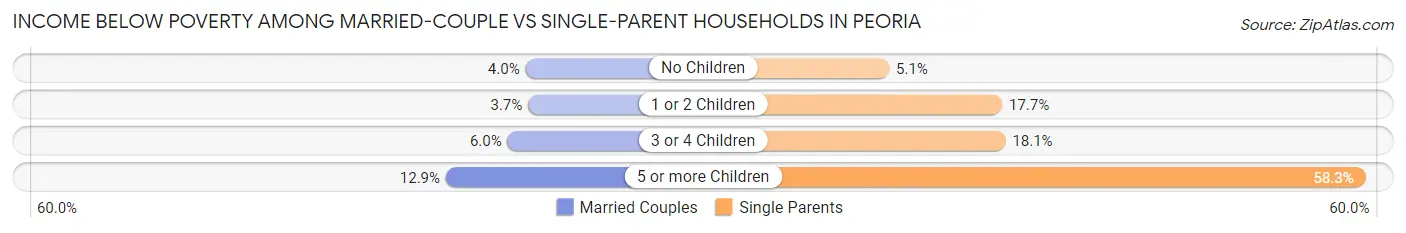
| Children | Married-Couple Families | Single-Parent Households |
| No Children | 949 (4.0%) | 264 (5.1%) |
| 1 or 2 Children | 467 (3.7%) | 958 (17.7%) |
| 3 or 4 Children | 197 (6.0%) | 183 (18.1%) |
| 5 or more Children | 31 (12.9%) | 77 (58.3%) |
| Total | 1,644 (4.2%) | 1,482 (12.6%) |
Race in Peoria
The most populous races in Peoria are White / Caucasian (140,822 | 73.6%), Hispanic or Latino (41,004 | 21.4%), and Two or more Races (20,058 | 10.5%).
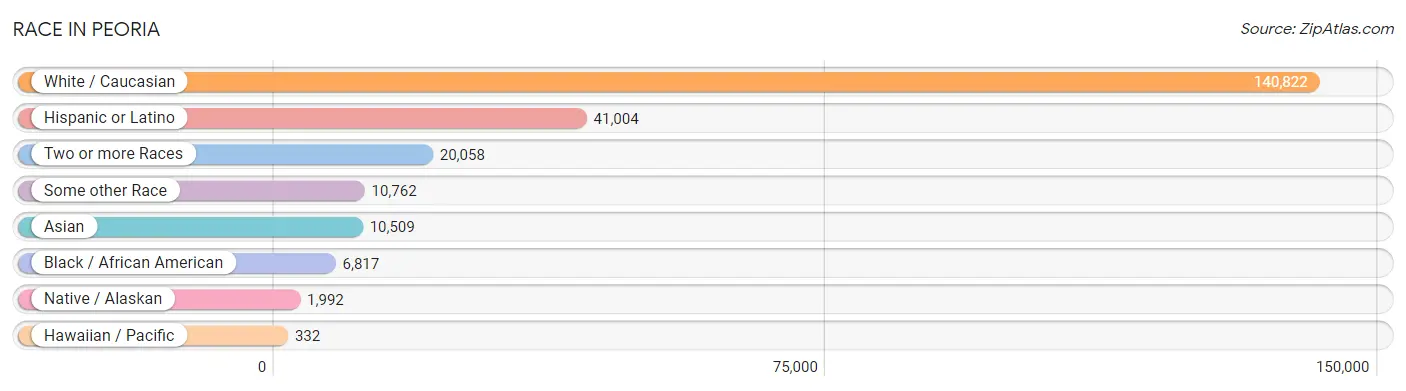
| Race | # Population | % Population |
| Asian | 10,509 | 5.5% |
| Black / African American | 6,817 | 3.6% |
| Hawaiian / Pacific | 332 | 0.2% |
| Hispanic or Latino | 41,004 | 21.4% |
| Native / Alaskan | 1,992 | 1.0% |
| White / Caucasian | 140,822 | 73.6% |
| Two or more Races | 20,058 | 10.5% |
| Some other Race | 10,762 | 5.6% |
| Total | 191,292 | 100.0% |
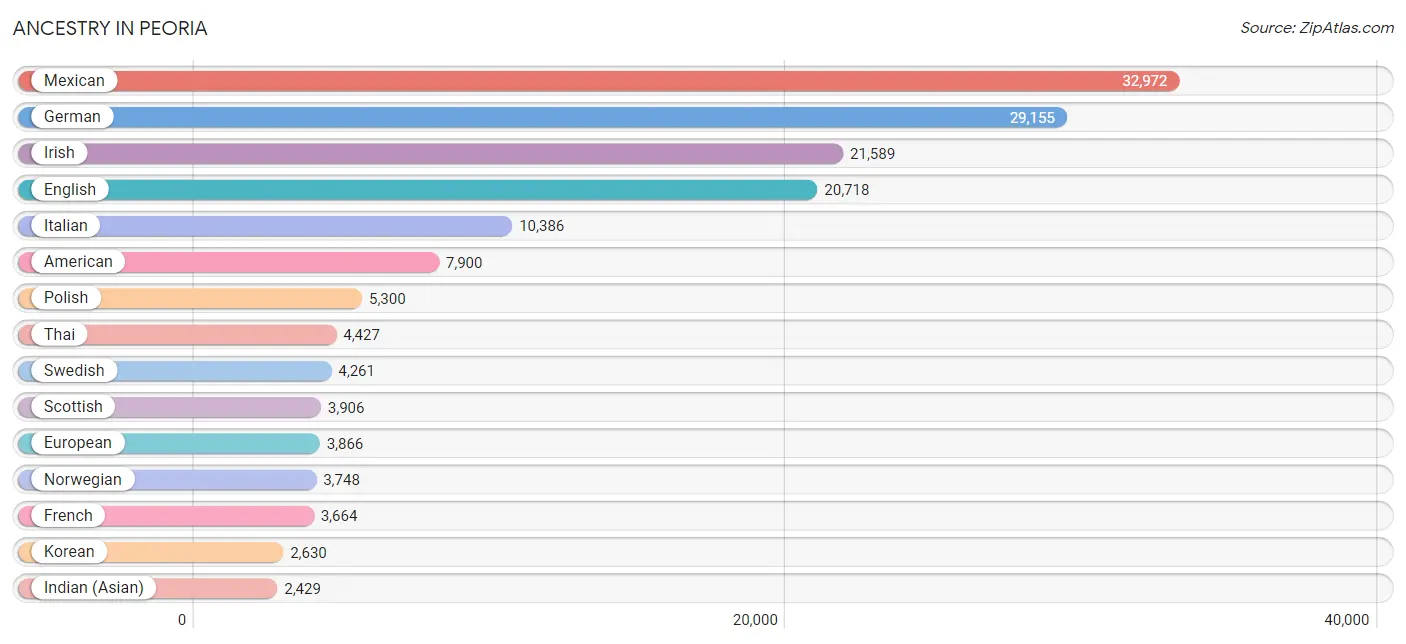
Ancestry in Peoria
The most populous ancestries reported in Peoria are Mexican (32,972 | 17.2%), German (29,155 | 15.2%), Irish (21,589 | 11.3%), English (20,718 | 10.8%), and Italian (10,386 | 5.4%), together accounting for 60.0% of all Peoria residents.
| Ancestry | # Population | % Population |
| Afghan | 233 | 0.1% |
| African | 272 | 0.1% |
| Albanian | 62 | 0.0% |
| Aleut | 47 | 0.0% |
| Alsatian | 18 | 0.0% |
| American | 7,900 | 4.1% |
| Apache | 295 | 0.2% |
| Arab | 1,912 | 1.0% |
| Argentinean | 137 | 0.1% |
| Armenian | 435 | 0.2% |
| Assyrian / Chaldean / Syriac | 629 | 0.3% |
| Australian | 18 | 0.0% |
| Austrian | 384 | 0.2% |
| Bangladeshi | 7 | 0.0% |
| Basque | 22 | 0.0% |
| Belgian | 149 | 0.1% |
| Bhutanese | 1,084 | 0.6% |
| Blackfeet | 219 | 0.1% |
| Brazilian | 24 | 0.0% |
| British | 1,166 | 0.6% |
| Bulgarian | 63 | 0.0% |
| Burmese | 958 | 0.5% |
| Canadian | 767 | 0.4% |
| Cape Verdean | 153 | 0.1% |
| Carpatho Rusyn | 57 | 0.0% |
| Central American | 972 | 0.5% |
| Central American Indian | 201 | 0.1% |
| Cherokee | 714 | 0.4% |
| Chickasaw | 5 | 0.0% |
| Chilean | 17 | 0.0% |
| Chinese | 38 | 0.0% |
| Chippewa | 41 | 0.0% |
| Choctaw | 174 | 0.1% |
| Colombian | 209 | 0.1% |
| Colville | 7 | 0.0% |
| Costa Rican | 8 | 0.0% |
| Cree | 44 | 0.0% |
| Creek | 69 | 0.0% |
| Croatian | 165 | 0.1% |
| Cuban | 708 | 0.4% |
| Czech | 755 | 0.4% |
| Czechoslovakian | 203 | 0.1% |
| Danish | 945 | 0.5% |
| Dominican | 252 | 0.1% |
| Dutch | 2,151 | 1.1% |
| Eastern European | 362 | 0.2% |
| Ecuadorian | 158 | 0.1% |
| Egyptian | 195 | 0.1% |
| English | 20,718 | 10.8% |
| Estonian | 78 | 0.0% |
| Ethiopian | 133 | 0.1% |
| European | 3,866 | 2.0% |
| Filipino | 95 | 0.1% |
| Finnish | 536 | 0.3% |
| French | 3,664 | 1.9% |
| French Canadian | 1,026 | 0.5% |
| German | 29,155 | 15.2% |
| Ghanaian | 23 | 0.0% |
| Greek | 1,207 | 0.6% |
| Guamanian / Chamorro | 241 | 0.1% |
| Guatemalan | 443 | 0.2% |
| Haitian | 159 | 0.1% |
| Hmong | 7 | 0.0% |
| Honduran | 36 | 0.0% |
| Hopi | 91 | 0.1% |
| Hungarian | 825 | 0.4% |
| Icelander | 43 | 0.0% |
| Indian (Asian) | 2,429 | 1.3% |
| Indonesian | 29 | 0.0% |
| Iranian | 49 | 0.0% |
| Iraqi | 748 | 0.4% |
| Irish | 21,589 | 11.3% |
| Iroquois | 114 | 0.1% |
| Israeli | 23 | 0.0% |
| Italian | 10,386 | 5.4% |
| Jamaican | 343 | 0.2% |
| Japanese | 549 | 0.3% |
| Jordanian | 381 | 0.2% |
| Kiowa | 47 | 0.0% |
| Korean | 2,630 | 1.4% |
| Laotian | 122 | 0.1% |
| Latvian | 10 | 0.0% |
| Lebanese | 165 | 0.1% |
| Lithuanian | 199 | 0.1% |
| Luxembourger | 67 | 0.0% |
| Macedonian | 99 | 0.1% |
| Malaysian | 92 | 0.1% |
| Maltese | 16 | 0.0% |
| Mexican | 32,972 | 17.2% |
| Mexican American Indian | 609 | 0.3% |
| Moroccan | 41 | 0.0% |
| Native Hawaiian | 234 | 0.1% |
| Navajo | 473 | 0.3% |
| Nicaraguan | 35 | 0.0% |
| Nigerian | 354 | 0.2% |
| Northern European | 221 | 0.1% |
| Norwegian | 3,748 | 2.0% |
| Osage | 195 | 0.1% |
| Paiute | 28 | 0.0% |
| Pakistani | 373 | 0.2% |
| Palestinian | 25 | 0.0% |
| Panamanian | 46 | 0.0% |
| Pennsylvania German | 68 | 0.0% |
| Peruvian | 205 | 0.1% |
| Pima | 43 | 0.0% |
| Polish | 5,300 | 2.8% |
| Portuguese | 537 | 0.3% |
| Pueblo | 121 | 0.1% |
| Puerto Rican | 2,100 | 1.1% |
| Romanian | 1,123 | 0.6% |
| Russian | 1,028 | 0.5% |
| Salvadoran | 404 | 0.2% |
| Samoan | 407 | 0.2% |
| Scandinavian | 1,232 | 0.6% |
| Scotch-Irish | 1,562 | 0.8% |
| Scottish | 3,906 | 2.0% |
| Serbian | 196 | 0.1% |
| Shoshone | 26 | 0.0% |
| Sioux | 165 | 0.1% |
| Slavic | 98 | 0.1% |
| Slovak | 327 | 0.2% |
| Slovene | 46 | 0.0% |
| Somali | 10 | 0.0% |
| South African | 104 | 0.1% |
| South American | 784 | 0.4% |
| Spaniard | 1,346 | 0.7% |
| Spanish | 743 | 0.4% |
| Sri Lankan | 1,599 | 0.8% |
| Subsaharan African | 1,211 | 0.6% |
| Sudanese | 33 | 0.0% |
| Swedish | 4,261 | 2.2% |
| Swiss | 470 | 0.3% |
| Syrian | 146 | 0.1% |
| Thai | 4,427 | 2.3% |
| Trinidadian and Tobagonian | 92 | 0.1% |
| Turkish | 126 | 0.1% |
| Ukrainian | 324 | 0.2% |
| Uruguayan | 22 | 0.0% |
| Venezuelan | 36 | 0.0% |
| Welsh | 1,633 | 0.9% |
| West Indian | 19 | 0.0% |
| Yaqui | 173 | 0.1% |
| Yugoslavian | 255 | 0.1% |
| Zimbabwean | 13 | 0.0% | View All 144 Rows |
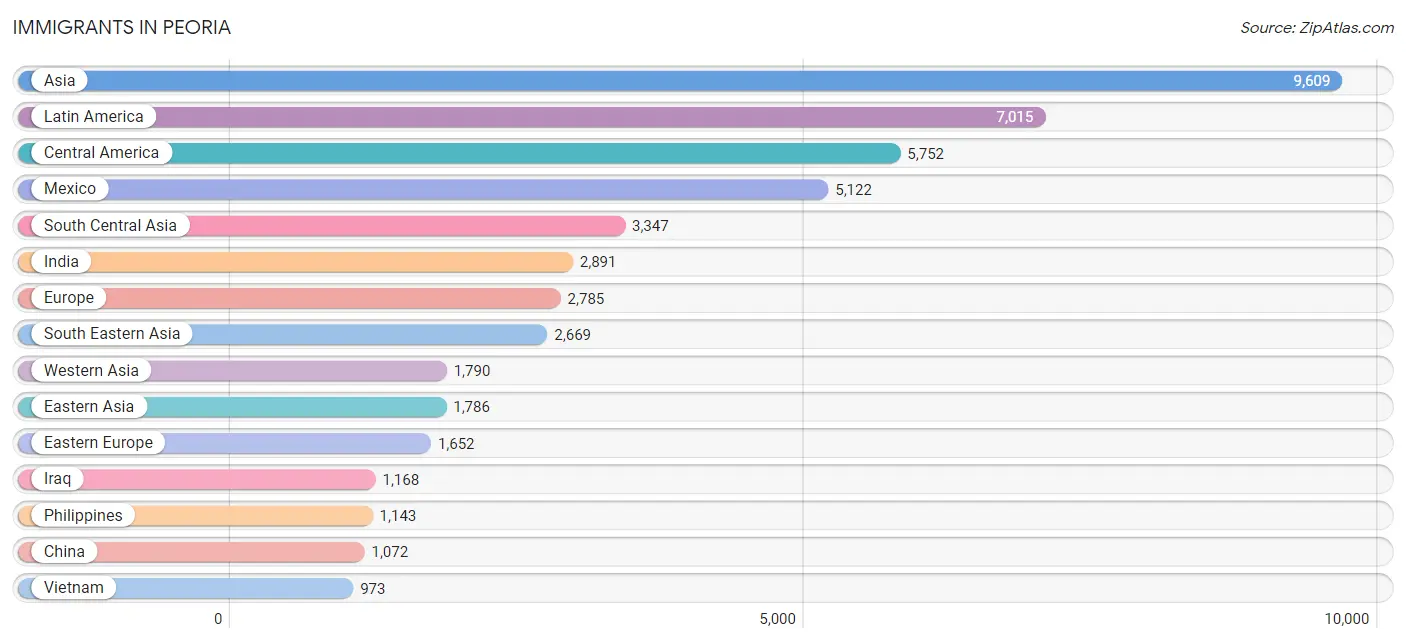
Immigrants in Peoria
The most numerous immigrant groups reported in Peoria came from Asia (9,609 | 5.0%), Latin America (7,015 | 3.7%), Central America (5,752 | 3.0%), Mexico (5,122 | 2.7%), and South Central Asia (3,347 | 1.8%), together accounting for 16.1% of all Peoria residents.
| Immigration Origin | # Population | % Population |
| Afghanistan | 216 | 0.1% |
| Africa | 627 | 0.3% |
| Albania | 45 | 0.0% |
| Argentina | 68 | 0.0% |
| Armenia | 8 | 0.0% |
| Asia | 9,609 | 5.0% |
| Azores | 13 | 0.0% |
| Bangladesh | 14 | 0.0% |
| Barbados | 46 | 0.0% |
| Belarus | 54 | 0.0% |
| Belgium | 17 | 0.0% |
| Bosnia and Herzegovina | 171 | 0.1% |
| Brazil | 25 | 0.0% |
| Bulgaria | 63 | 0.0% |
| Cabo Verde | 15 | 0.0% |
| Cambodia | 237 | 0.1% |
| Canada | 915 | 0.5% |
| Caribbean | 874 | 0.5% |
| Central America | 5,752 | 3.0% |
| Chile | 9 | 0.0% |
| China | 1,072 | 0.6% |
| Colombia | 177 | 0.1% |
| Croatia | 17 | 0.0% |
| Cuba | 496 | 0.3% |
| Czechoslovakia | 11 | 0.0% |
| Denmark | 3 | 0.0% |
| Dominican Republic | 93 | 0.1% |
| Eastern Africa | 168 | 0.1% |
| Eastern Asia | 1,786 | 0.9% |
| Eastern Europe | 1,652 | 0.9% |
| Egypt | 103 | 0.1% |
| El Salvador | 409 | 0.2% |
| England | 243 | 0.1% |
| Ethiopia | 100 | 0.1% |
| Europe | 2,785 | 1.5% |
| France | 86 | 0.0% |
| Germany | 393 | 0.2% |
| Ghana | 18 | 0.0% |
| Greece | 56 | 0.0% |
| Guatemala | 134 | 0.1% |
| Haiti | 130 | 0.1% |
| Honduras | 36 | 0.0% |
| Hong Kong | 353 | 0.2% |
| Hungary | 25 | 0.0% |
| India | 2,891 | 1.5% |
| Indonesia | 15 | 0.0% |
| Iran | 63 | 0.0% |
| Iraq | 1,168 | 0.6% |
| Ireland | 19 | 0.0% |
| Israel | 12 | 0.0% |
| Italy | 126 | 0.1% |
| Jamaica | 11 | 0.0% |
| Japan | 280 | 0.2% |
| Jordan | 45 | 0.0% |
| Korea | 434 | 0.2% |
| Kuwait | 51 | 0.0% |
| Latin America | 7,015 | 3.7% |
| Lebanon | 129 | 0.1% |
| Malaysia | 116 | 0.1% |
| Mexico | 5,122 | 2.7% |
| Middle Africa | 12 | 0.0% |
| Morocco | 41 | 0.0% |
| Nepal | 16 | 0.0% |
| Netherlands | 9 | 0.0% |
| Nigeria | 82 | 0.0% |
| North Macedonia | 47 | 0.0% |
| Northern Africa | 158 | 0.1% |
| Northern Europe | 423 | 0.2% |
| Norway | 7 | 0.0% |
| Oceania | 41 | 0.0% |
| Pakistan | 59 | 0.0% |
| Panama | 31 | 0.0% |
| Peru | 62 | 0.0% |
| Philippines | 1,143 | 0.6% |
| Poland | 123 | 0.1% |
| Portugal | 13 | 0.0% |
| Romania | 672 | 0.4% |
| Russia | 64 | 0.0% |
| Saudi Arabia | 21 | 0.0% |
| Scotland | 11 | 0.0% |
| Serbia | 97 | 0.1% |
| Singapore | 16 | 0.0% |
| Somalia | 10 | 0.0% |
| South Africa | 104 | 0.1% |
| South America | 389 | 0.2% |
| South Central Asia | 3,347 | 1.8% |
| South Eastern Asia | 2,669 | 1.4% |
| Southern Europe | 195 | 0.1% |
| Sri Lanka | 54 | 0.0% |
| Sweden | 28 | 0.0% |
| Switzerland | 10 | 0.0% |
| Syria | 90 | 0.1% |
| Taiwan | 135 | 0.1% |
| Thailand | 135 | 0.1% |
| Trinidad and Tobago | 71 | 0.0% |
| Turkey | 75 | 0.0% |
| Uruguay | 9 | 0.0% |
| Venezuela | 39 | 0.0% |
| Vietnam | 973 | 0.5% |
| West Indies | 8 | 0.0% |
| Western Africa | 157 | 0.1% |
| Western Asia | 1,790 | 0.9% |
| Western Europe | 515 | 0.3% |
| Zaire | 12 | 0.0% | View All 104 Rows |
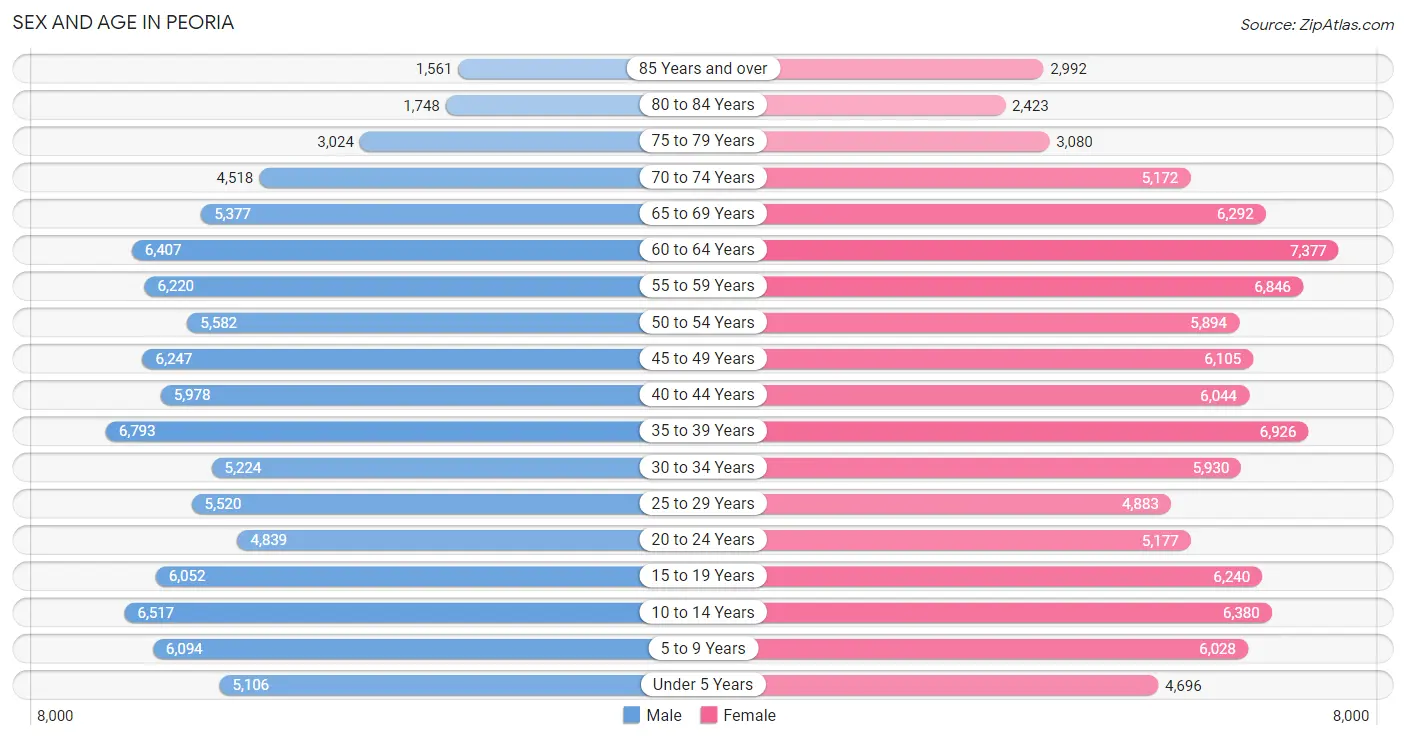
Sex and Age in Peoria
Sex and Age in Peoria
The most populous age groups in Peoria are 35 to 39 Years (6,793 | 7.3%) for men and 60 to 64 Years (7,377 | 7.5%) for women.
| Age Bracket | Male | Female |
| Under 5 Years | 5,106 (5.5%) | 4,696 (4.8%) |
| 5 to 9 Years | 6,094 (6.6%) | 6,028 (6.1%) |
| 10 to 14 Years | 6,517 (7.0%) | 6,380 (6.5%) |
| 15 to 19 Years | 6,052 (6.5%) | 6,240 (6.3%) |
| 20 to 24 Years | 4,839 (5.2%) | 5,177 (5.3%) |
| 25 to 29 Years | 5,520 (5.9%) | 4,883 (5.0%) |
| 30 to 34 Years | 5,224 (5.6%) | 5,930 (6.0%) |
| 35 to 39 Years | 6,793 (7.3%) | 6,926 (7.0%) |
| 40 to 44 Years | 5,978 (6.4%) | 6,044 (6.1%) |
| 45 to 49 Years | 6,247 (6.7%) | 6,105 (6.2%) |
| 50 to 54 Years | 5,582 (6.0%) | 5,894 (6.0%) |
| 55 to 59 Years | 6,220 (6.7%) | 6,846 (7.0%) |
| 60 to 64 Years | 6,407 (6.9%) | 7,377 (7.5%) |
| 65 to 69 Years | 5,377 (5.8%) | 6,292 (6.4%) |
| 70 to 74 Years | 4,518 (4.9%) | 5,172 (5.2%) |
| 75 to 79 Years | 3,024 (3.3%) | 3,080 (3.1%) |
| 80 to 84 Years | 1,748 (1.9%) | 2,423 (2.5%) |
| 85 Years and over | 1,561 (1.7%) | 2,992 (3.0%) |
| Total | 92,807 (100.0%) | 98,485 (100.0%) |
Families and Households in Peoria
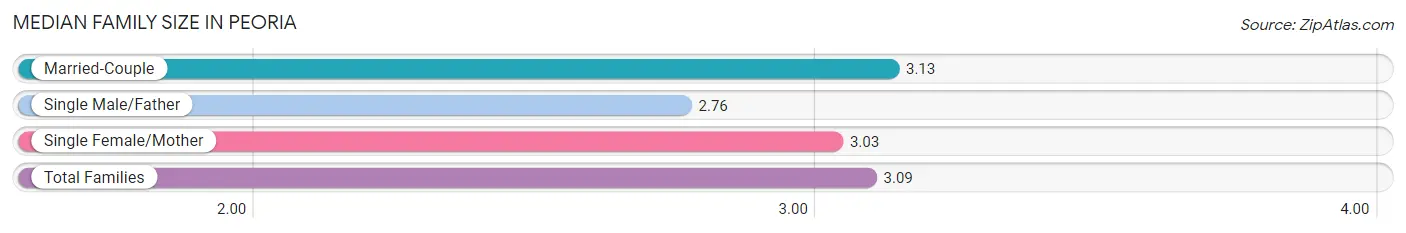
Median Family Size in Peoria
The median family size in Peoria is 3.09 persons per family, with married-couple families (39,647 | 77.1%) accounting for the largest median family size of 3.13 persons per family. On the other hand, single male/father families (3,559 | 6.9%) represent the smallest median family size with 2.76 persons per family.
| Family Type | # Families | Family Size |
| Married-Couple | 39,647 (77.1%) | 3.13 |
| Single Male/Father | 3,559 (6.9%) | 2.76 |
| Single Female/Mother | 8,196 (15.9%) | 3.03 |
| Total Families | 51,402 (100.0%) | 3.09 |
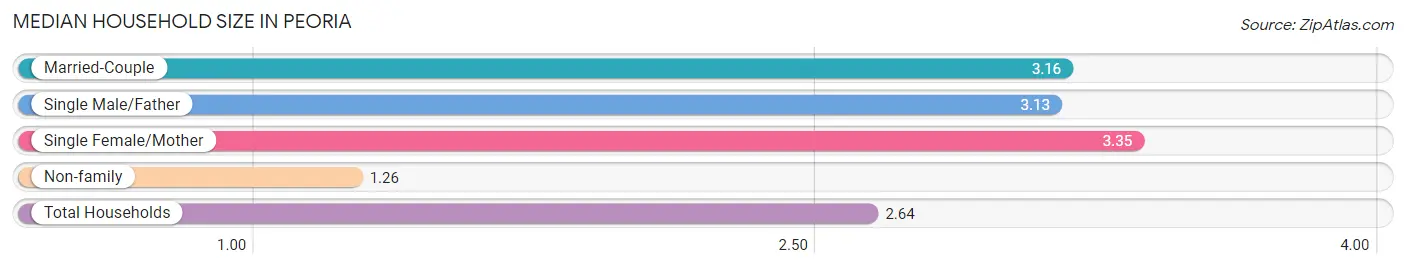
Median Household Size in Peoria
The median household size in Peoria is 2.64 persons per household, with single female/mother households (8,196 | 11.4%) accounting for the largest median household size of 3.35 persons per household. non-family households (20,331 | 28.3%) represent the smallest median household size with 1.26 persons per household.
| Household Type | # Households | Household Size |
| Married-Couple | 39,647 (55.3%) | 3.16 |
| Single Male/Father | 3,559 (5.0%) | 3.13 |
| Single Female/Mother | 8,196 (11.4%) | 3.35 |
| Non-family | 20,331 (28.3%) | 1.26 |
| Total Households | 71,733 (100.0%) | 2.64 |
Household Size by Marriage Status in Peoria
Out of a total of 71,733 households in Peoria, 51,402 (71.7%) are family households, while 20,331 (28.3%) are nonfamily households. The most numerous type of family households are 2-person households, comprising 22,732, and the most common type of nonfamily households are 1-person households, comprising 16,627.
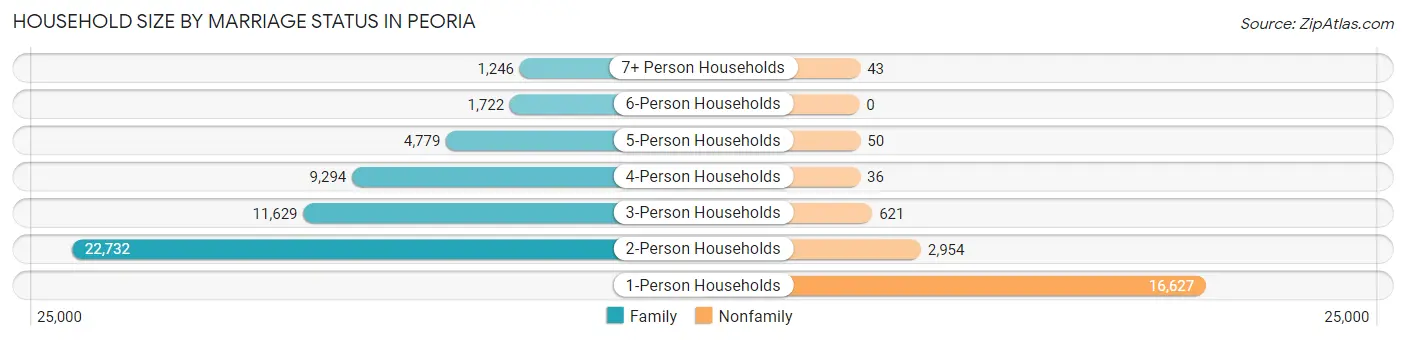
| Household Size | Family Households | Nonfamily Households |
| 1-Person Households | - | 16,627 (23.2%) |
| 2-Person Households | 22,732 (31.7%) | 2,954 (4.1%) |
| 3-Person Households | 11,629 (16.2%) | 621 (0.9%) |
| 4-Person Households | 9,294 (13.0%) | 36 (0.1%) |
| 5-Person Households | 4,779 (6.7%) | 50 (0.1%) |
| 6-Person Households | 1,722 (2.4%) | 0 (0.0%) |
| 7+ Person Households | 1,246 (1.7%) | 43 (0.1%) |
| Total | 51,402 (71.7%) | 20,331 (28.3%) |
Female Fertility in Peoria
Fertility by Age in Peoria
Average fertility rate in Peoria is 47.0 births per 1,000 women. Women in the age bracket of 20 to 34 years have the highest fertility rate with 81.0 births per 1,000 women. Women in the age bracket of 20 to 34 years acount for 66.0% of all women with births.
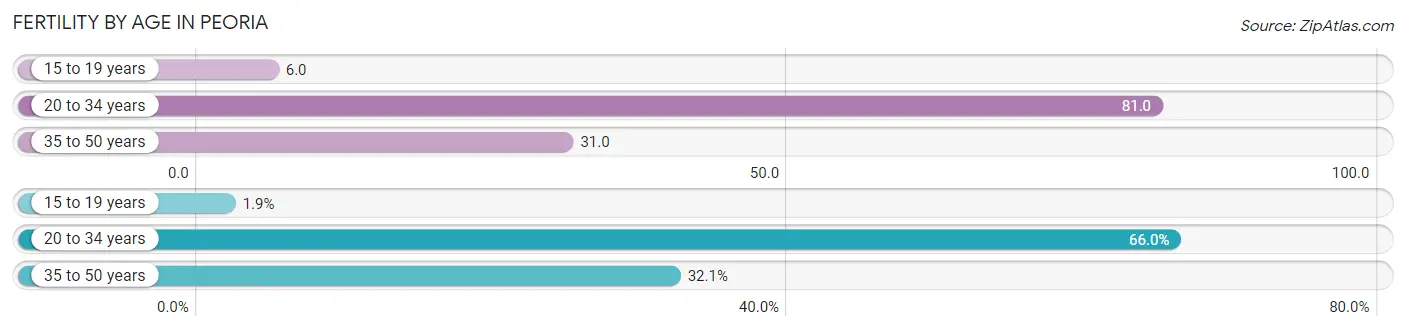
| Age Bracket | Women with Births | Births / 1,000 Women |
| 15 to 19 years | 37 (1.9%) | 6.0 |
| 20 to 34 years | 1,299 (66.0%) | 81.0 |
| 35 to 50 years | 631 (32.1%) | 31.0 |
| Total | 1,967 (100.0%) | 47.0 |
Fertility by Age by Marriage Status in Peoria
74.0% of women with births (1,967) in Peoria are married. The highest percentage of unmarried women with births falls into 15 to 19 years age bracket with 100.0% of them unmarried at the time of birth, while the lowest percentage of unmarried women with births belong to 35 to 50 years age bracket with 20.1% of them unmarried.
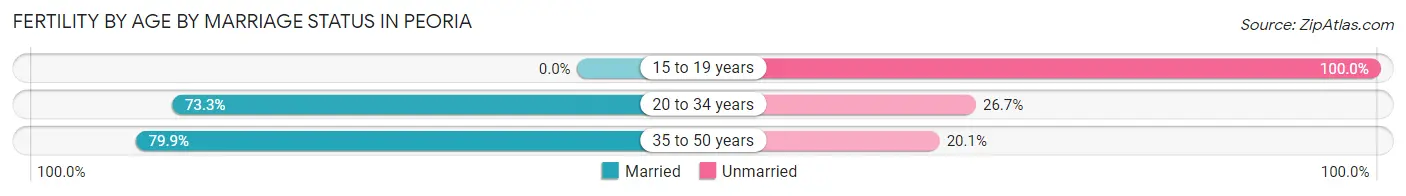
| Age Bracket | Married | Unmarried |
| 15 to 19 years | 0 (0.0%) | 37 (100.0%) |
| 20 to 34 years | 952 (73.3%) | 347 (26.7%) |
| 35 to 50 years | 504 (79.9%) | 127 (20.1%) |
| Total | 1,456 (74.0%) | 511 (26.0%) |
Fertility by Education in Peoria
Average fertility rate in Peoria is 47.0 births per 1,000 women. Women with the education attainment of bachelor's degree have the highest fertility rate of 55.0 births per 1,000 women, while women with the education attainment of less than high school have the lowest fertility at 23.0 births per 1,000 women. Women with the education attainment of college or associate's degree represent 34.3% of all women with births.
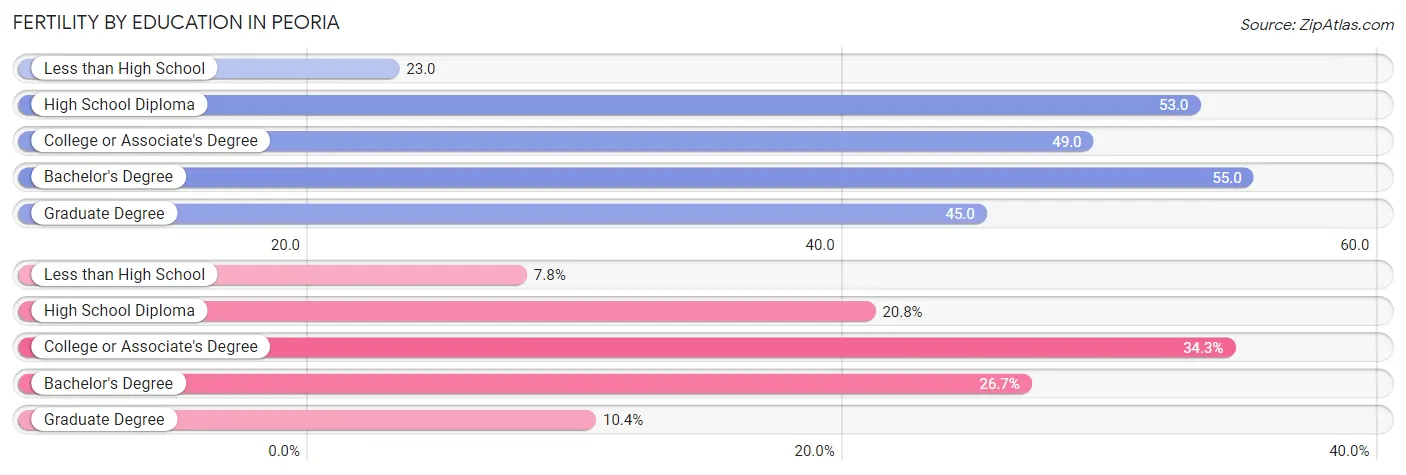
| Educational Attainment | Women with Births | Births / 1,000 Women |
| Less than High School | 153 (7.8%) | 23.0 |
| High School Diploma | 410 (20.8%) | 53.0 |
| College or Associate's Degree | 675 (34.3%) | 49.0 |
| Bachelor's Degree | 525 (26.7%) | 55.0 |
| Graduate Degree | 204 (10.4%) | 45.0 |
| Total | 1,967 (100.0%) | 47.0 |
Fertility by Education by Marriage Status in Peoria
26.0% of women with births in Peoria are unmarried. Women with the educational attainment of graduate degree are most likely to be married with 100.0% of them married at childbirth, while women with the educational attainment of high school diploma are least likely to be married with 61.2% of them unmarried at childbirth.
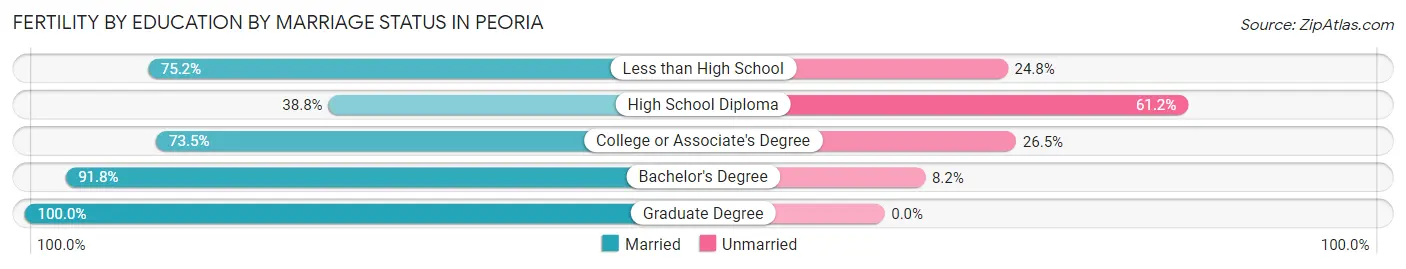
| Educational Attainment | Married | Unmarried |
| Less than High School | 115 (75.2%) | 38 (24.8%) |
| High School Diploma | 159 (38.8%) | 251 (61.2%) |
| College or Associate's Degree | 496 (73.5%) | 179 (26.5%) |
| Bachelor's Degree | 482 (91.8%) | 43 (8.2%) |
| Graduate Degree | 204 (100.0%) | 0 (0.0%) |
| Total | 1,456 (74.0%) | 511 (26.0%) |
Employment Characteristics in Peoria
Employment by Class of Employer in Peoria
Among the 89,055 employed individuals in Peoria, private company employees (61,760 | 69.4%), not-for-profit organizations (6,936 | 7.8%), and local government employees (6,789 | 7.6%) make up the most common classes of employment.
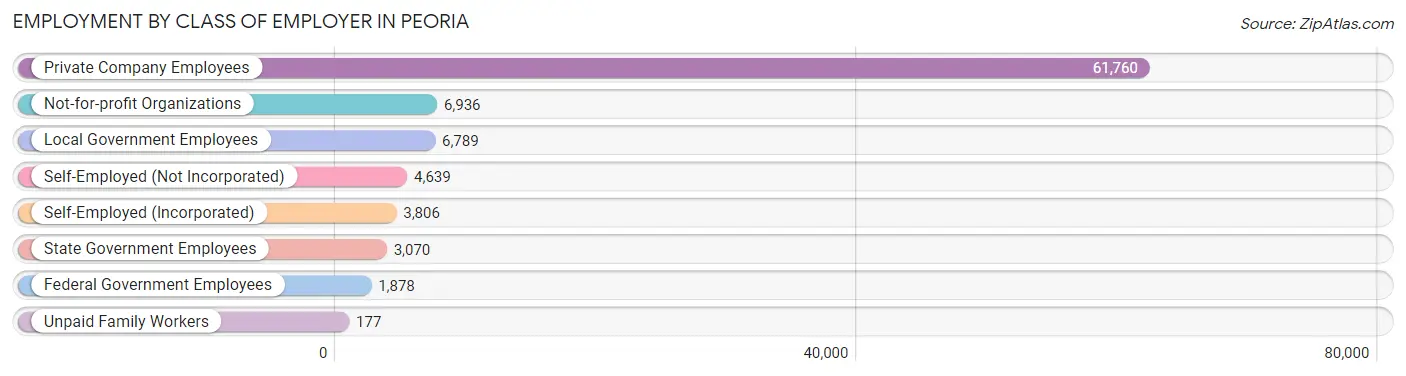
| Employer Class | # Employees | % Employees |
| Private Company Employees | 61,760 | 69.4% |
| Self-Employed (Incorporated) | 3,806 | 4.3% |
| Self-Employed (Not Incorporated) | 4,639 | 5.2% |
| Not-for-profit Organizations | 6,936 | 7.8% |
| Local Government Employees | 6,789 | 7.6% |
| State Government Employees | 3,070 | 3.5% |
| Federal Government Employees | 1,878 | 2.1% |
| Unpaid Family Workers | 177 | 0.2% |
| Total | 89,055 | 100.0% |
Employment Status by Age in Peoria
According to the labor force statistics for Peoria, out of the total population over 16 years of age (153,186), 61.5% or 94,209 individuals are in the labor force, with 3.9% or 3,674 of them unemployed. The age group with the highest labor force participation rate is 45 to 54 years, with 84.4% or 20,111 individuals in the labor force. Within the labor force, the 16 to 19 years age range has the highest percentage of unemployed individuals, with 14.5% or 581 of them being unemployed.
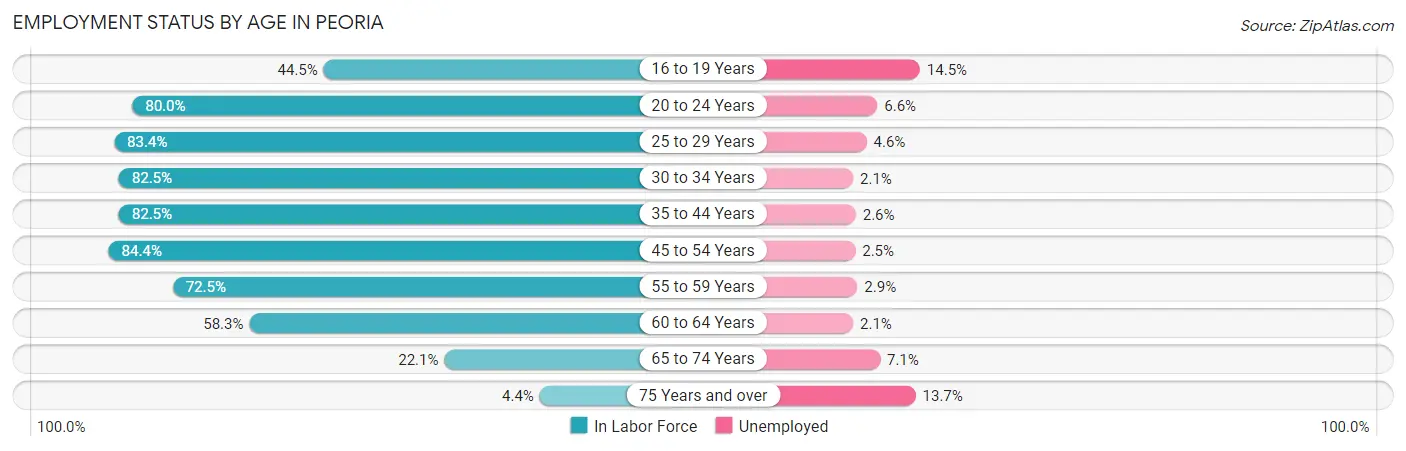
| Age Bracket | In Labor Force | Unemployed |
| 16 to 19 Years | 4,008 (44.5%) | 581 (14.5%) |
| 20 to 24 Years | 8,013 (80.0%) | 529 (6.6%) |
| 25 to 29 Years | 8,676 (83.4%) | 399 (4.6%) |
| 30 to 34 Years | 9,202 (82.5%) | 193 (2.1%) |
| 35 to 44 Years | 21,236 (82.5%) | 552 (2.6%) |
| 45 to 54 Years | 20,111 (84.4%) | 503 (2.5%) |
| 55 to 59 Years | 9,473 (72.5%) | 275 (2.9%) |
| 60 to 64 Years | 8,036 (58.3%) | 169 (2.1%) |
| 65 to 74 Years | 4,720 (22.1%) | 335 (7.1%) |
| 75 Years and over | 652 (4.4%) | 89 (13.7%) |
| Total | 94,209 (61.5%) | 3,674 (3.9%) |
Employment Status by Educational Attainment in Peoria
According to labor force statistics for Peoria, 78.3% of individuals (76,715) out of the total population between 25 and 64 years of age (97,976) are in the labor force, with 2.7% or 2,071 of them being unemployed. The group with the highest labor force participation rate are those with the educational attainment of bachelor's degree or higher, with 83.5% or 29,319 individuals in the labor force. Within the labor force, individuals with high school diploma education have the highest percentage of unemployment, with 4.0% or 605 of them being unemployed.
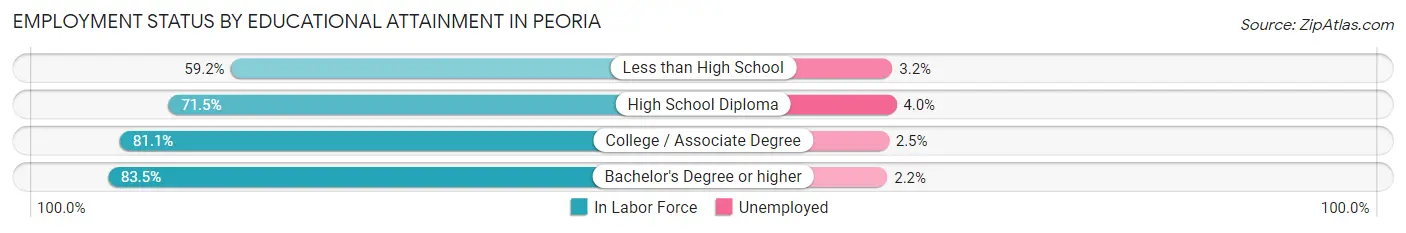
| Educational Attainment | In Labor Force | Unemployed |
| Less than High School | 4,166 (59.2%) | 225 (3.2%) |
| High School Diploma | 15,121 (71.5%) | 846 (4.0%) |
| College / Associate Degree | 28,123 (81.1%) | 867 (2.5%) |
| Bachelor's Degree or higher | 29,319 (83.5%) | 772 (2.2%) |
| Total | 76,715 (78.3%) | 2,645 (2.7%) |
Employment Occupations by Sex in Peoria
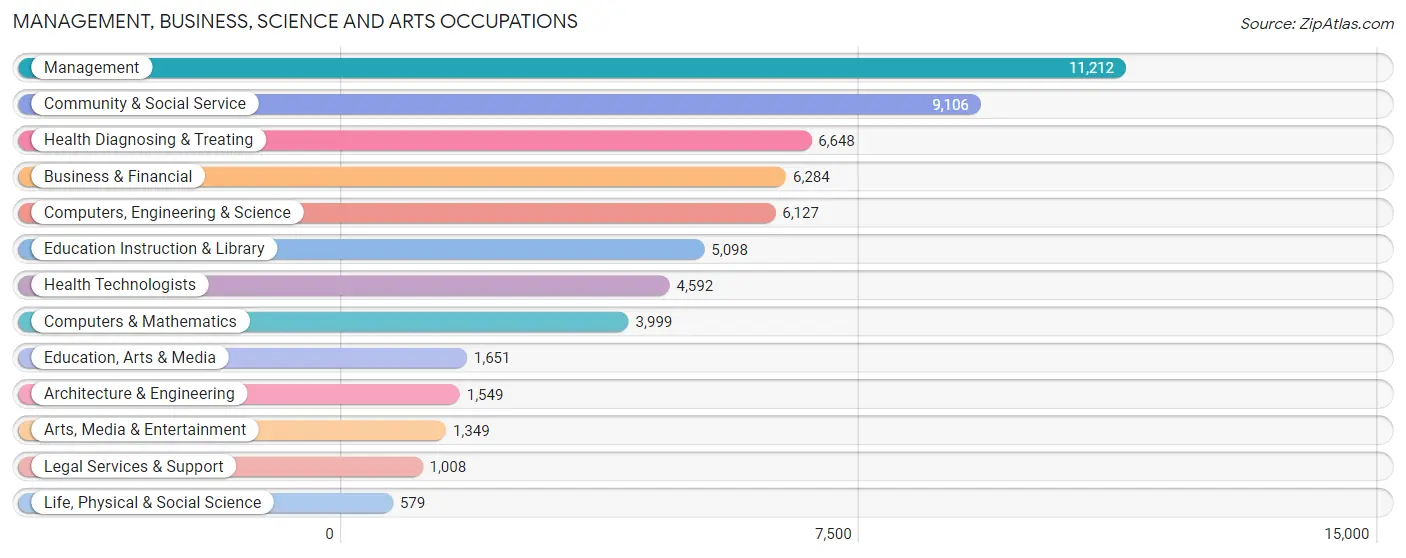
Management, Business, Science and Arts Occupations
The most common Management, Business, Science and Arts occupations in Peoria are Management (11,212 | 12.4%), Community & Social Service (9,106 | 10.1%), Health Diagnosing & Treating (6,648 | 7.4%), Business & Financial (6,284 | 7.0%), and Computers, Engineering & Science (6,127 | 6.8%).
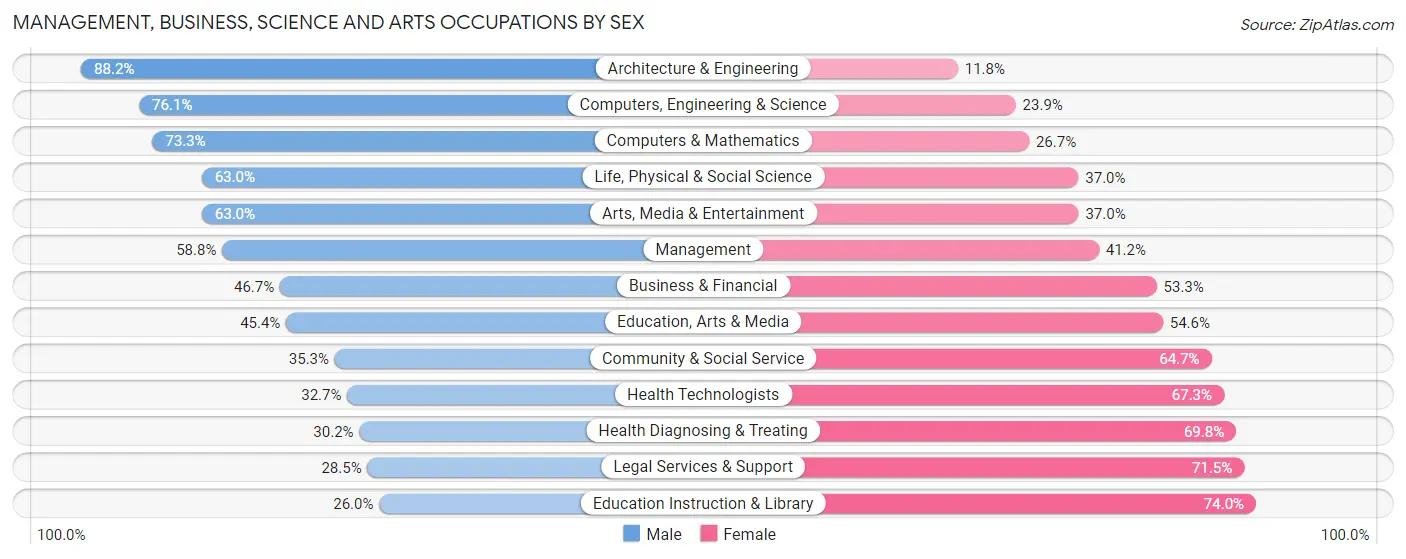
Management, Business, Science and Arts Occupations by Sex
Within the Management, Business, Science and Arts occupations in Peoria, the most male-oriented occupations are Architecture & Engineering (88.2%), Computers, Engineering & Science (76.1%), and Computers & Mathematics (73.3%), while the most female-oriented occupations are Education Instruction & Library (74.0%), Legal Services & Support (71.5%), and Health Diagnosing & Treating (69.8%).
| Occupation | Male | Female |
| Management | 6,589 (58.8%) | 4,623 (41.2%) |
| Business & Financial | 2,935 (46.7%) | 3,349 (53.3%) |
| Computers, Engineering & Science | 4,664 (76.1%) | 1,463 (23.9%) |
| Computers & Mathematics | 2,933 (73.3%) | 1,066 (26.7%) |
| Architecture & Engineering | 1,366 (88.2%) | 183 (11.8%) |
| Life, Physical & Social Science | 365 (63.0%) | 214 (37.0%) |
| Community & Social Service | 3,213 (35.3%) | 5,893 (64.7%) |
| Education, Arts & Media | 750 (45.4%) | 901 (54.6%) |
| Legal Services & Support | 287 (28.5%) | 721 (71.5%) |
| Education Instruction & Library | 1,326 (26.0%) | 3,772 (74.0%) |
| Arts, Media & Entertainment | 850 (63.0%) | 499 (37.0%) |
| Health Diagnosing & Treating | 2,005 (30.2%) | 4,643 (69.8%) |
| Health Technologists | 1,501 (32.7%) | 3,091 (67.3%) |
| Total (Category) | 19,406 (49.3%) | 19,971 (50.7%) |
| Total (Overall) | 47,461 (52.6%) | 42,842 (47.4%) |
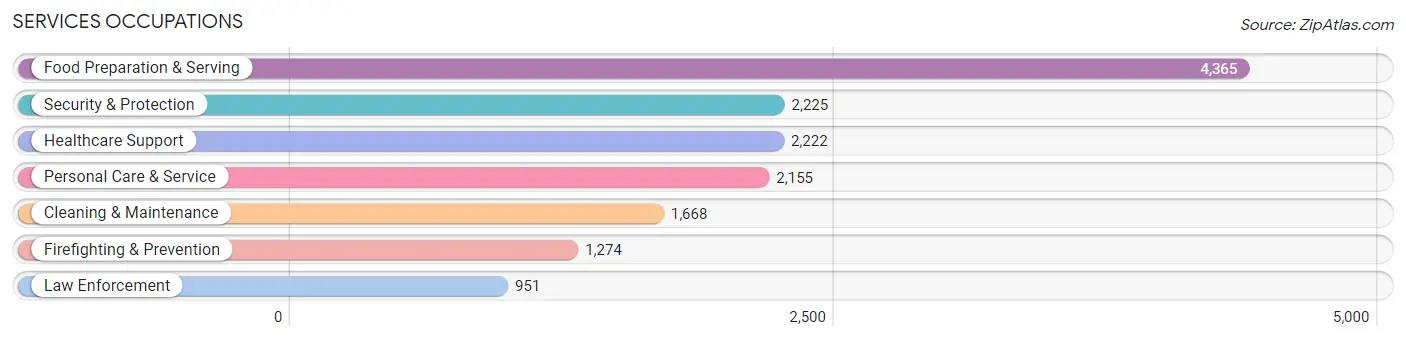
Services Occupations
The most common Services occupations in Peoria are Food Preparation & Serving (4,365 | 4.8%), Security & Protection (2,225 | 2.5%), Healthcare Support (2,222 | 2.5%), Personal Care & Service (2,155 | 2.4%), and Cleaning & Maintenance (1,668 | 1.8%).
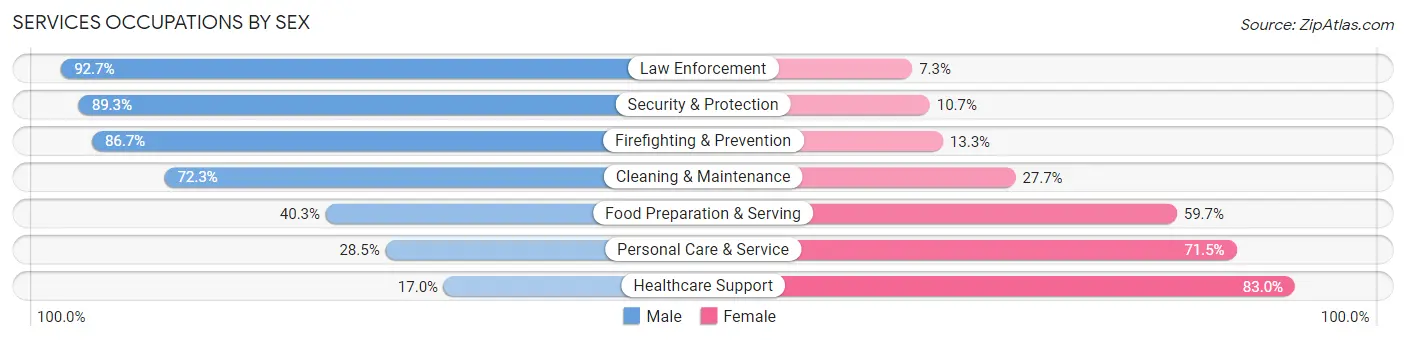
Services Occupations by Sex
Within the Services occupations in Peoria, the most male-oriented occupations are Law Enforcement (92.7%), Security & Protection (89.3%), and Firefighting & Prevention (86.7%), while the most female-oriented occupations are Healthcare Support (83.0%), Personal Care & Service (71.5%), and Food Preparation & Serving (59.7%).
| Occupation | Male | Female |
| Healthcare Support | 377 (17.0%) | 1,845 (83.0%) |
| Security & Protection | 1,986 (89.3%) | 239 (10.7%) |
| Firefighting & Prevention | 1,104 (86.7%) | 170 (13.3%) |
| Law Enforcement | 882 (92.7%) | 69 (7.3%) |
| Food Preparation & Serving | 1,761 (40.3%) | 2,604 (59.7%) |
| Cleaning & Maintenance | 1,206 (72.3%) | 462 (27.7%) |
| Personal Care & Service | 615 (28.5%) | 1,540 (71.5%) |
| Total (Category) | 5,945 (47.0%) | 6,690 (52.9%) |
| Total (Overall) | 47,461 (52.6%) | 42,842 (47.4%) |
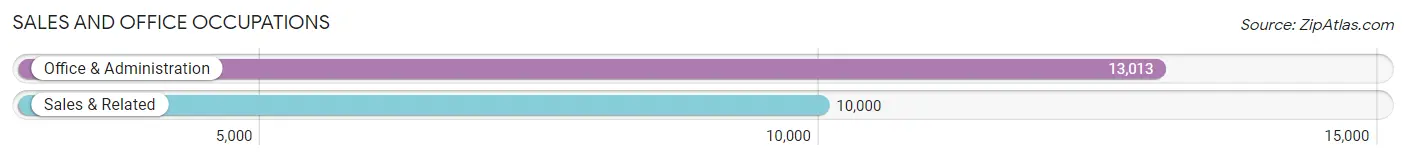
Sales and Office Occupations
The most common Sales and Office occupations in Peoria are Office & Administration (13,013 | 14.4%), and Sales & Related (10,000 | 11.1%).
Sales and Office Occupations by Sex
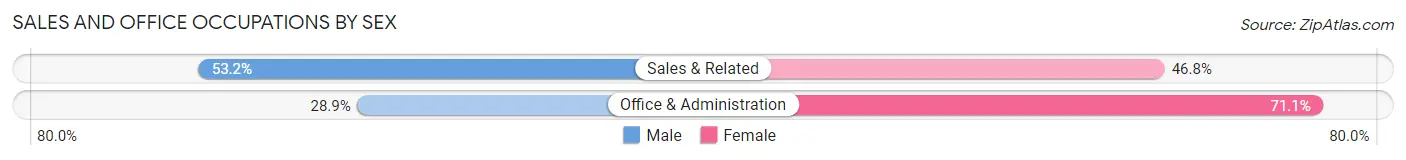
| Occupation | Male | Female |
| Sales & Related | 5,320 (53.2%) | 4,680 (46.8%) |
| Office & Administration | 3,765 (28.9%) | 9,248 (71.1%) |
| Total (Category) | 9,085 (39.5%) | 13,928 (60.5%) |
| Total (Overall) | 47,461 (52.6%) | 42,842 (47.4%) |
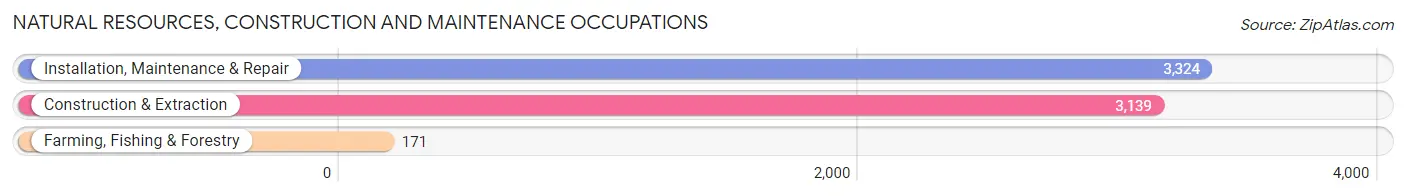
Natural Resources, Construction and Maintenance Occupations
The most common Natural Resources, Construction and Maintenance occupations in Peoria are Installation, Maintenance & Repair (3,324 | 3.7%), Construction & Extraction (3,139 | 3.5%), and Farming, Fishing & Forestry (171 | 0.2%).
Natural Resources, Construction and Maintenance Occupations by Sex
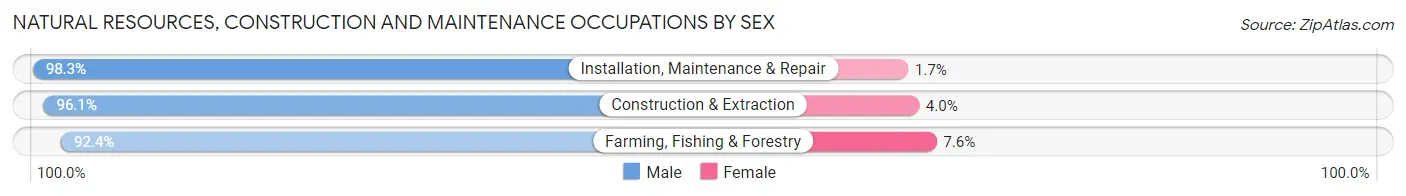
| Occupation | Male | Female |
| Farming, Fishing & Forestry | 158 (92.4%) | 13 (7.6%) |
| Construction & Extraction | 3,015 (96.1%) | 124 (4.0%) |
| Installation, Maintenance & Repair | 3,267 (98.3%) | 57 (1.7%) |
| Total (Category) | 6,440 (97.1%) | 194 (2.9%) |
| Total (Overall) | 47,461 (52.6%) | 42,842 (47.4%) |
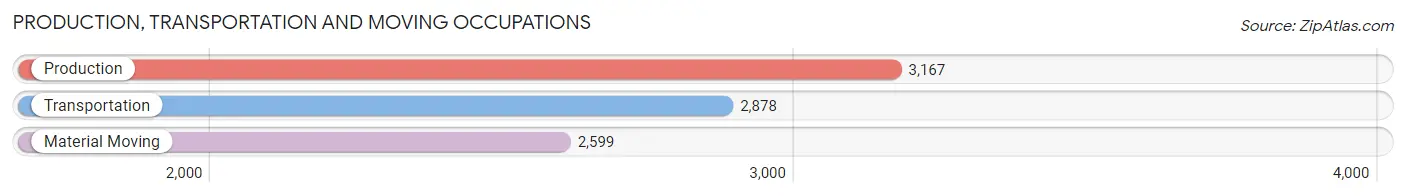
Production, Transportation and Moving Occupations
The most common Production, Transportation and Moving occupations in Peoria are Production (3,167 | 3.5%), Transportation (2,878 | 3.2%), and Material Moving (2,599 | 2.9%).
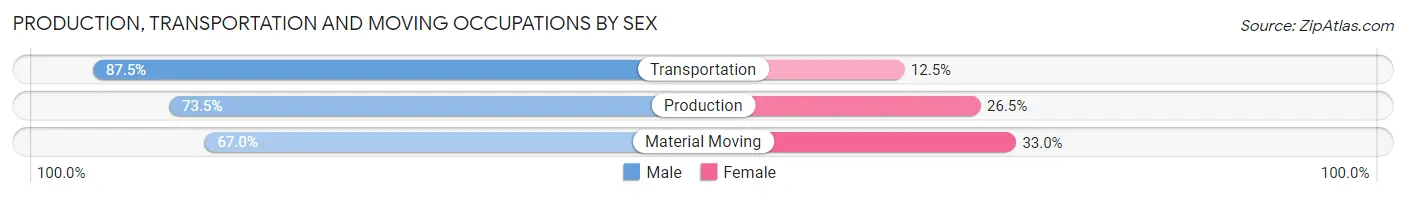
Production, Transportation and Moving Occupations by Sex
| Occupation | Male | Female |
| Production | 2,327 (73.5%) | 840 (26.5%) |
| Transportation | 2,517 (87.5%) | 361 (12.5%) |
| Material Moving | 1,741 (67.0%) | 858 (33.0%) |
| Total (Category) | 6,585 (76.2%) | 2,059 (23.8%) |
| Total (Overall) | 47,461 (52.6%) | 42,842 (47.4%) |
Employment Industries by Sex in Peoria
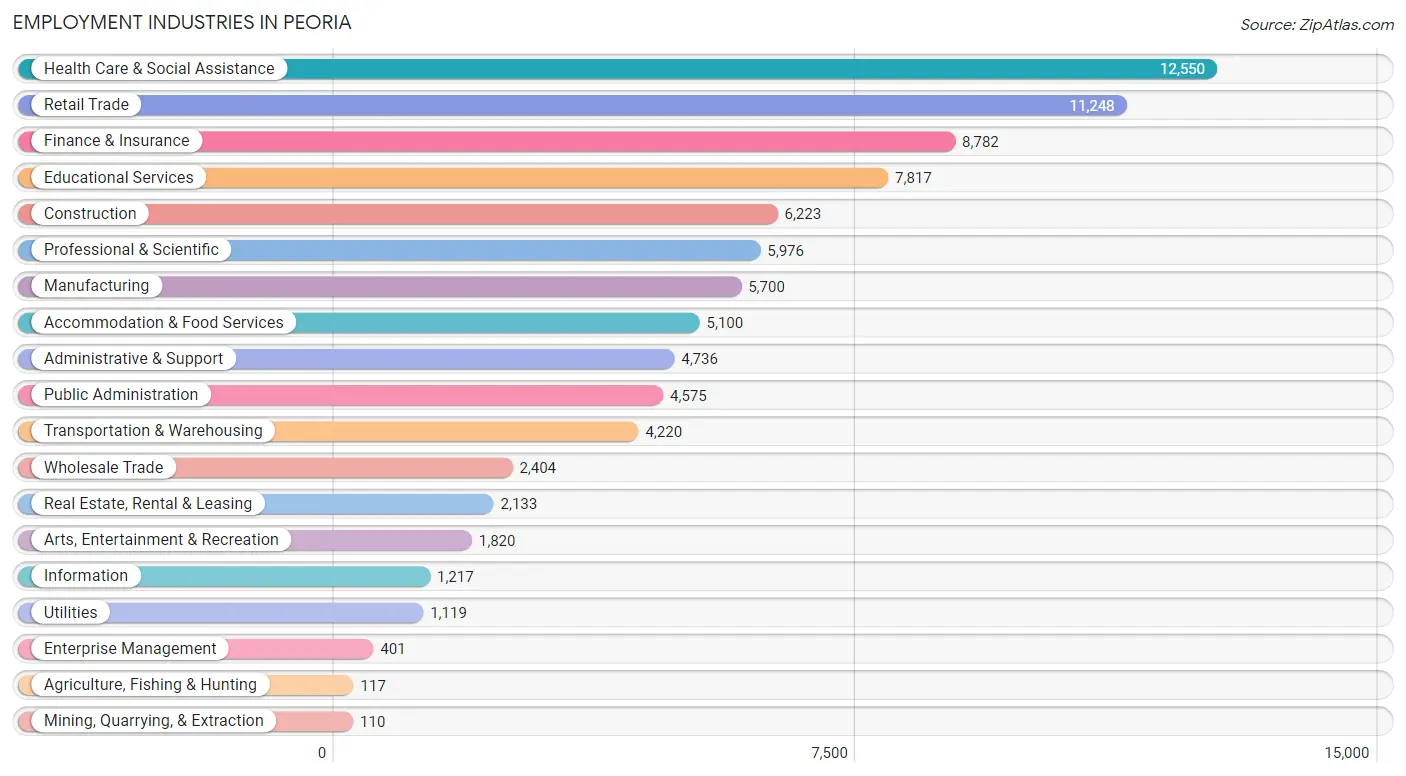
Employment Industries in Peoria
The major employment industries in Peoria include Health Care & Social Assistance (12,550 | 13.9%), Retail Trade (11,248 | 12.5%), Finance & Insurance (8,782 | 9.7%), Educational Services (7,817 | 8.7%), and Construction (6,223 | 6.9%).
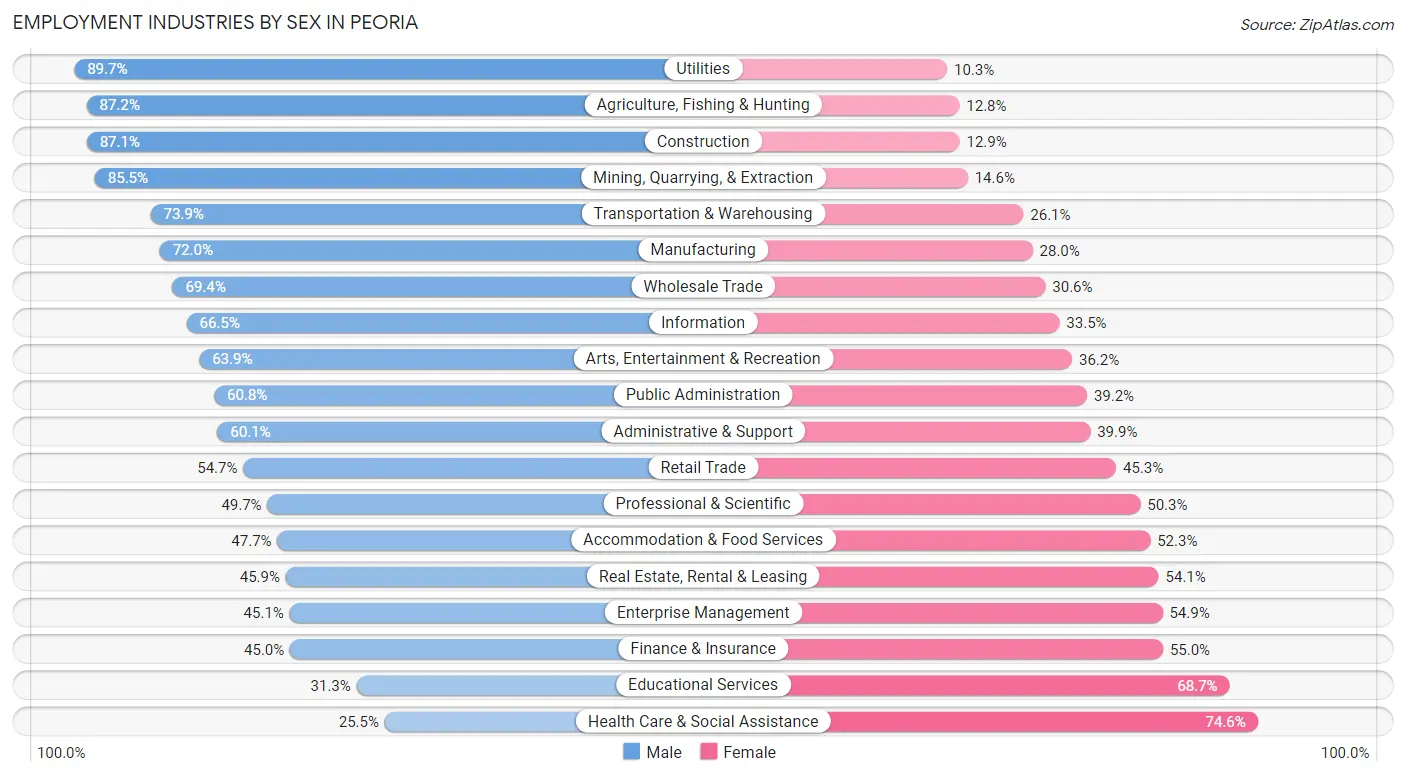
Employment Industries by Sex in Peoria
The Peoria industries that see more men than women are Utilities (89.7%), Agriculture, Fishing & Hunting (87.2%), and Construction (87.1%), whereas the industries that tend to have a higher number of women are Health Care & Social Assistance (74.6%), Educational Services (68.7%), and Finance & Insurance (55.0%).
| Industry | Male | Female |
| Agriculture, Fishing & Hunting | 102 (87.2%) | 15 (12.8%) |
| Mining, Quarrying, & Extraction | 94 (85.5%) | 16 (14.5%) |
| Construction | 5,423 (87.1%) | 800 (12.9%) |
| Manufacturing | 4,105 (72.0%) | 1,595 (28.0%) |
| Wholesale Trade | 1,668 (69.4%) | 736 (30.6%) |
| Retail Trade | 6,156 (54.7%) | 5,092 (45.3%) |
| Transportation & Warehousing | 3,120 (73.9%) | 1,100 (26.1%) |
| Utilities | 1,004 (89.7%) | 115 (10.3%) |
| Information | 809 (66.5%) | 408 (33.5%) |
| Finance & Insurance | 3,955 (45.0%) | 4,827 (55.0%) |
| Real Estate, Rental & Leasing | 980 (45.9%) | 1,153 (54.1%) |
| Professional & Scientific | 2,972 (49.7%) | 3,004 (50.3%) |
| Enterprise Management | 181 (45.1%) | 220 (54.9%) |
| Administrative & Support | 2,846 (60.1%) | 1,890 (39.9%) |
| Educational Services | 2,445 (31.3%) | 5,372 (68.7%) |
| Health Care & Social Assistance | 3,194 (25.5%) | 9,356 (74.6%) |
| Arts, Entertainment & Recreation | 1,162 (63.8%) | 658 (36.1%) |
| Accommodation & Food Services | 2,431 (47.7%) | 2,669 (52.3%) |
| Public Administration | 2,780 (60.8%) | 1,795 (39.2%) |
| Total | 47,461 (52.6%) | 42,842 (47.4%) |
Education in Peoria
School Enrollment in Peoria
The most common levels of schooling among the 45,870 students in Peoria are high school (10,732 | 23.4%), middle school (10,154 | 22.1%), and elementary school (9,539 | 20.8%).
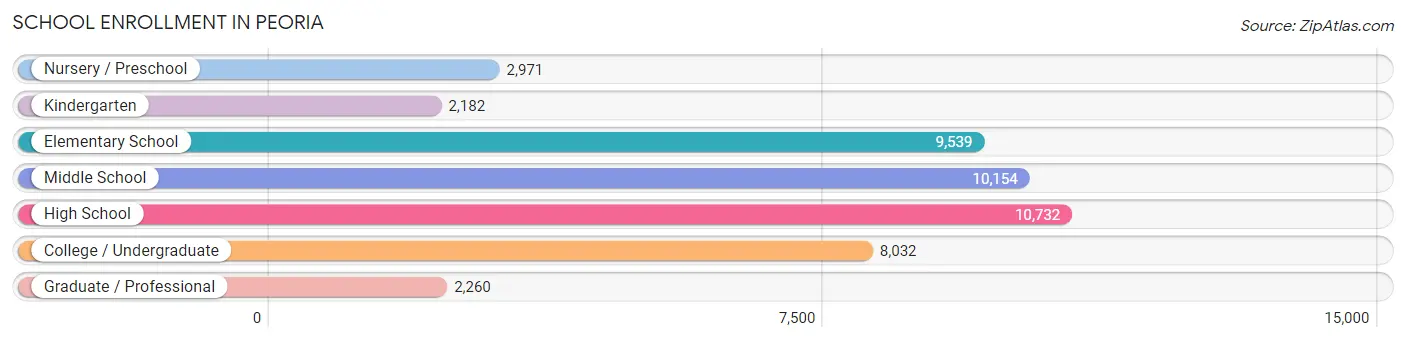
| School Level | # Students | % Students |
| Nursery / Preschool | 2,971 | 6.5% |
| Kindergarten | 2,182 | 4.8% |
| Elementary School | 9,539 | 20.8% |
| Middle School | 10,154 | 22.1% |
| High School | 10,732 | 23.4% |
| College / Undergraduate | 8,032 | 17.5% |
| Graduate / Professional | 2,260 | 4.9% |
| Total | 45,870 | 100.0% |
School Enrollment by Age by Funding Source in Peoria
Out of a total of 45,870 students who are enrolled in schools in Peoria, 6,789 (14.8%) attend a private institution, while the remaining 39,081 (85.2%) are enrolled in public schools. The age group of 3 to 4 year olds has the highest likelihood of being enrolled in private schools, with 790 (42.3% in the age bracket) enrolled. Conversely, the age group of 15 to 17 year olds has the lowest likelihood of being enrolled in a private school, with 7,870 (94.3% in the age bracket) attending a public institution.
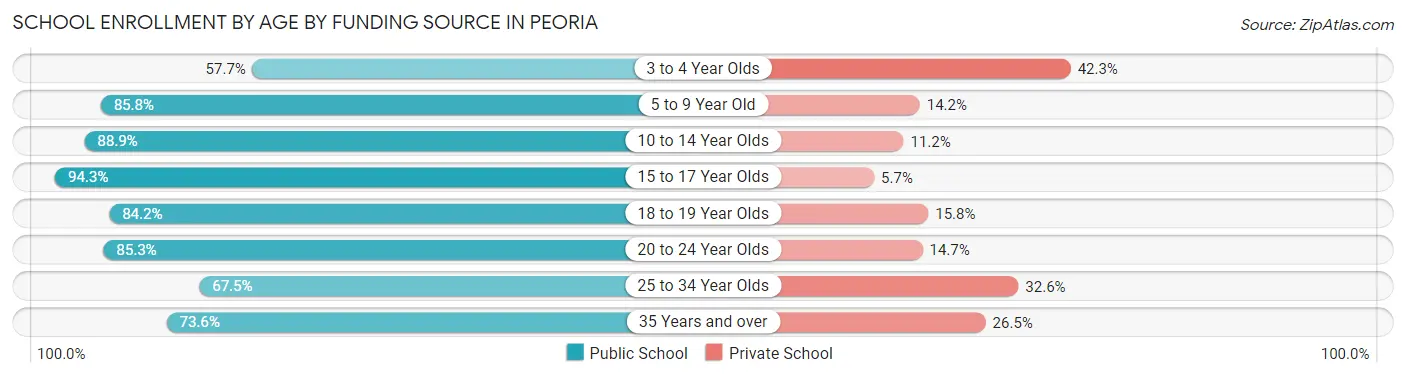
| Age Bracket | Public School | Private School |
| 3 to 4 Year Olds | 1,078 (57.7%) | 790 (42.3%) |
| 5 to 9 Year Old | 10,067 (85.8%) | 1,663 (14.2%) |
| 10 to 14 Year Olds | 11,282 (88.8%) | 1,416 (11.2%) |
| 15 to 17 Year Olds | 7,870 (94.3%) | 474 (5.7%) |
| 18 to 19 Year Olds | 2,093 (84.2%) | 392 (15.8%) |
| 20 to 24 Year Olds | 2,955 (85.3%) | 509 (14.7%) |
| 25 to 34 Year Olds | 1,573 (67.4%) | 759 (32.6%) |
| 35 Years and over | 2,169 (73.6%) | 780 (26.5%) |
| Total | 39,081 (85.2%) | 6,789 (14.8%) |
Educational Attainment by Field of Study in Peoria
Business (12,000 | 24.0%), education (7,549 | 15.1%), science & technology (4,820 | 9.6%), arts & humanities (3,051 | 6.1%), and engineering (2,941 | 5.9%) are the most common fields of study among 50,035 individuals in Peoria who have obtained a bachelor's degree or higher.
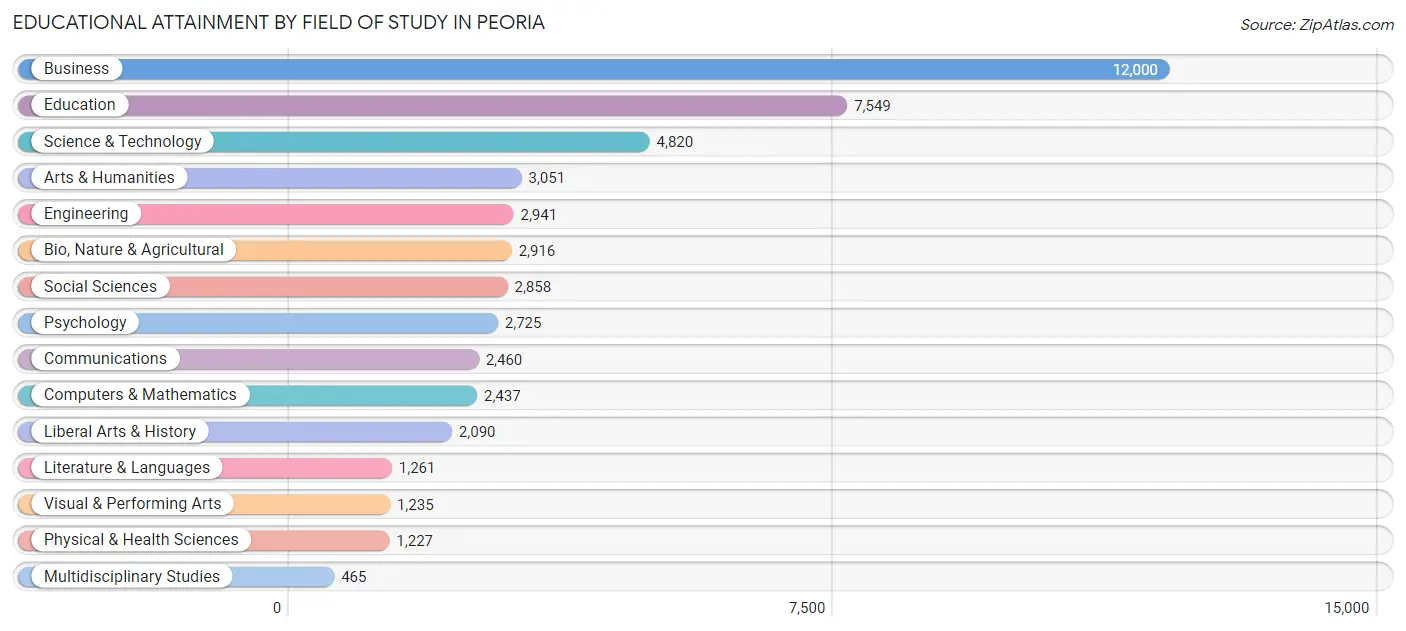
| Field of Study | # Graduates | % Graduates |
| Computers & Mathematics | 2,437 | 4.9% |
| Bio, Nature & Agricultural | 2,916 | 5.8% |
| Physical & Health Sciences | 1,227 | 2.5% |
| Psychology | 2,725 | 5.4% |
| Social Sciences | 2,858 | 5.7% |
| Engineering | 2,941 | 5.9% |
| Multidisciplinary Studies | 465 | 0.9% |
| Science & Technology | 4,820 | 9.6% |
| Business | 12,000 | 24.0% |
| Education | 7,549 | 15.1% |
| Literature & Languages | 1,261 | 2.5% |
| Liberal Arts & History | 2,090 | 4.2% |
| Visual & Performing Arts | 1,235 | 2.5% |
| Communications | 2,460 | 4.9% |
| Arts & Humanities | 3,051 | 6.1% |
| Total | 50,035 | 100.0% |
Transportation & Commute in Peoria
Vehicle Availability by Sex in Peoria
The most prevalent vehicle ownership categories in Peoria are males with 2 vehicles (21,624, accounting for 46.0%) and females with 2 vehicles (18,079, making up 51.5%).
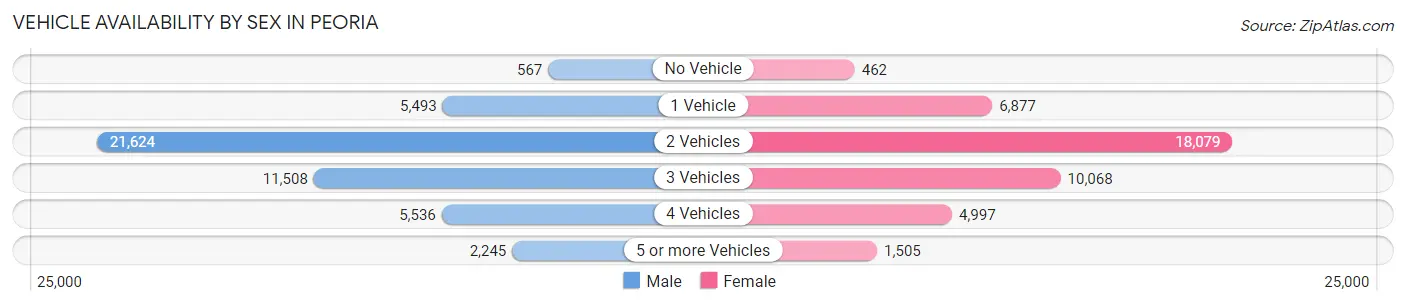
| Vehicles Available | Male | Female |
| No Vehicle | 567 (1.2%) | 462 (1.1%) |
| 1 Vehicle | 5,493 (11.7%) | 6,877 (16.4%) |
| 2 Vehicles | 21,624 (46.0%) | 18,079 (43.1%) |
| 3 Vehicles | 11,508 (24.5%) | 10,068 (24.0%) |
| 4 Vehicles | 5,536 (11.8%) | 4,997 (11.9%) |
| 5 or more Vehicles | 2,245 (4.8%) | 1,505 (3.6%) |
| Total | 46,973 (100.0%) | 41,988 (100.0%) |
Commute Time in Peoria
The most frequently occuring commute durations in Peoria are 20 to 24 minutes (12,504 commuters, 16.9%), 30 to 34 minutes (11,489 commuters, 15.6%), and 45 to 59 minutes (8,587 commuters, 11.6%).
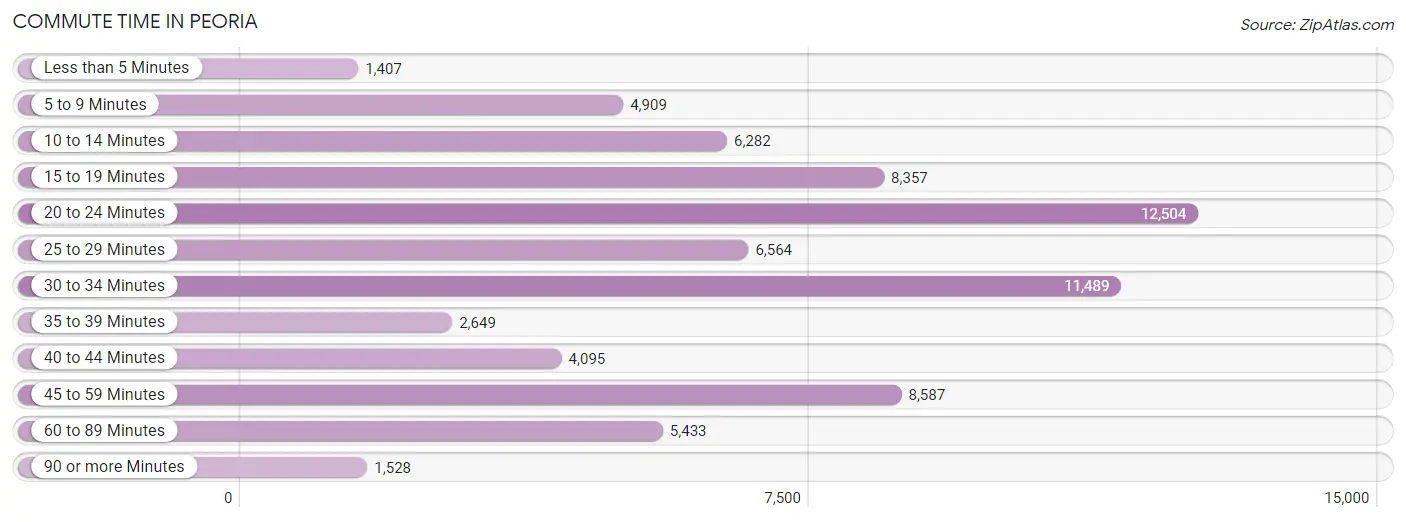
| Commute Time | # Commuters | % Commuters |
| Less than 5 Minutes | 1,407 | 1.9% |
| 5 to 9 Minutes | 4,909 | 6.7% |
| 10 to 14 Minutes | 6,282 | 8.5% |
| 15 to 19 Minutes | 8,357 | 11.3% |
| 20 to 24 Minutes | 12,504 | 16.9% |
| 25 to 29 Minutes | 6,564 | 8.9% |
| 30 to 34 Minutes | 11,489 | 15.6% |
| 35 to 39 Minutes | 2,649 | 3.6% |
| 40 to 44 Minutes | 4,095 | 5.6% |
| 45 to 59 Minutes | 8,587 | 11.6% |
| 60 to 89 Minutes | 5,433 | 7.4% |
| 90 or more Minutes | 1,528 | 2.1% |
Commute Time by Sex in Peoria
The most common commute times in Peoria are 30 to 34 minutes (6,970 commuters, 17.3%) for males and 20 to 24 minutes (5,621 commuters, 16.7%) for females.
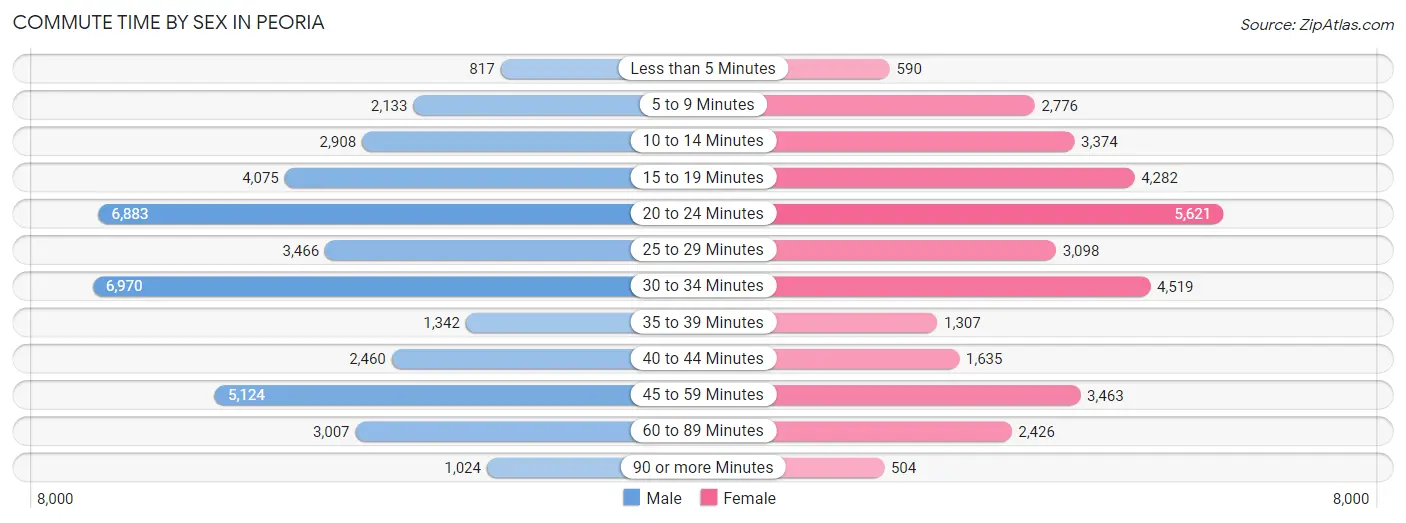
| Commute Time | Male | Female |
| Less than 5 Minutes | 817 (2.0%) | 590 (1.8%) |
| 5 to 9 Minutes | 2,133 (5.3%) | 2,776 (8.3%) |
| 10 to 14 Minutes | 2,908 (7.2%) | 3,374 (10.0%) |
| 15 to 19 Minutes | 4,075 (10.1%) | 4,282 (12.8%) |
| 20 to 24 Minutes | 6,883 (17.1%) | 5,621 (16.7%) |
| 25 to 29 Minutes | 3,466 (8.6%) | 3,098 (9.2%) |
| 30 to 34 Minutes | 6,970 (17.3%) | 4,519 (13.5%) |
| 35 to 39 Minutes | 1,342 (3.3%) | 1,307 (3.9%) |
| 40 to 44 Minutes | 2,460 (6.1%) | 1,635 (4.9%) |
| 45 to 59 Minutes | 5,124 (12.7%) | 3,463 (10.3%) |
| 60 to 89 Minutes | 3,007 (7.5%) | 2,426 (7.2%) |
| 90 or more Minutes | 1,024 (2.5%) | 504 (1.5%) |
Time of Departure to Work by Sex in Peoria
The most frequent times of departure to work in Peoria are 7:00 AM to 7:29 AM (5,166, 12.9%) for males and 7:00 AM to 7:29 AM (5,108, 15.2%) for females.
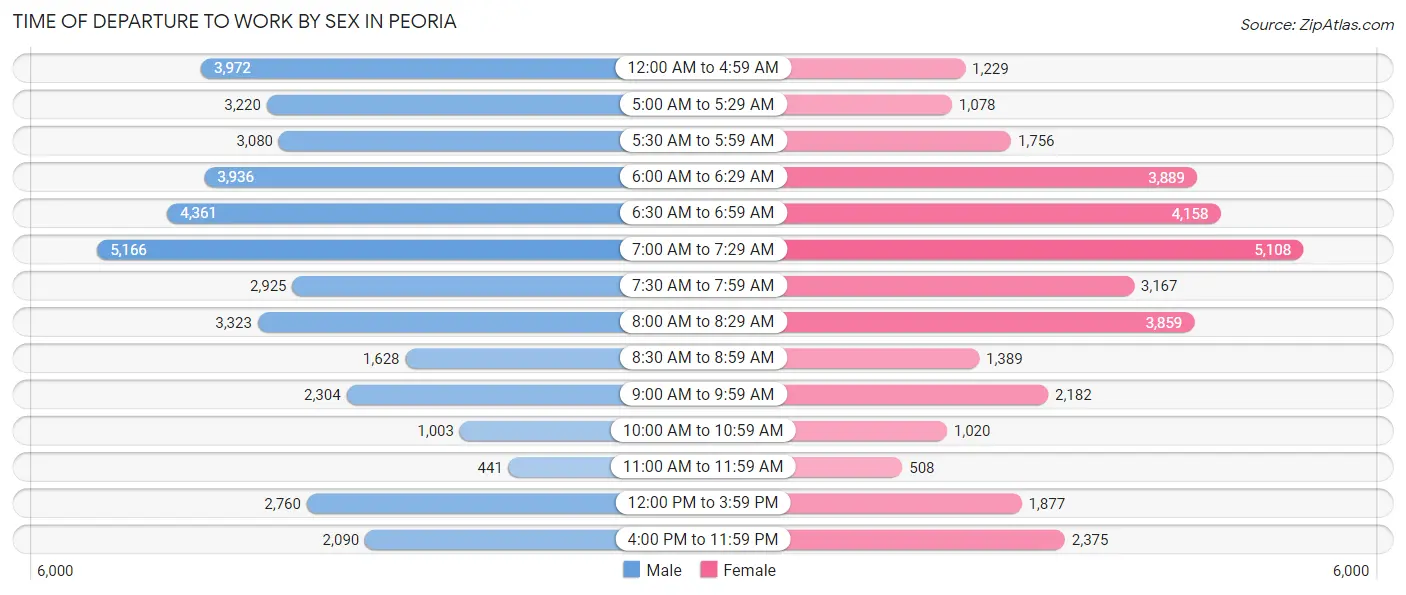
| Time of Departure | Male | Female |
| 12:00 AM to 4:59 AM | 3,972 (9.9%) | 1,229 (3.7%) |
| 5:00 AM to 5:29 AM | 3,220 (8.0%) | 1,078 (3.2%) |
| 5:30 AM to 5:59 AM | 3,080 (7.7%) | 1,756 (5.2%) |
| 6:00 AM to 6:29 AM | 3,936 (9.8%) | 3,889 (11.6%) |
| 6:30 AM to 6:59 AM | 4,361 (10.8%) | 4,158 (12.4%) |
| 7:00 AM to 7:29 AM | 5,166 (12.9%) | 5,108 (15.2%) |
| 7:30 AM to 7:59 AM | 2,925 (7.3%) | 3,167 (9.4%) |
| 8:00 AM to 8:29 AM | 3,323 (8.3%) | 3,859 (11.5%) |
| 8:30 AM to 8:59 AM | 1,628 (4.1%) | 1,389 (4.1%) |
| 9:00 AM to 9:59 AM | 2,304 (5.7%) | 2,182 (6.5%) |
| 10:00 AM to 10:59 AM | 1,003 (2.5%) | 1,020 (3.0%) |
| 11:00 AM to 11:59 AM | 441 (1.1%) | 508 (1.5%) |
| 12:00 PM to 3:59 PM | 2,760 (6.9%) | 1,877 (5.6%) |
| 4:00 PM to 11:59 PM | 2,090 (5.2%) | 2,375 (7.1%) |
| Total | 40,209 (100.0%) | 33,595 (100.0%) |
Housing Occupancy in Peoria
Occupancy by Ownership in Peoria
Of the total 71,733 dwellings in Peoria, owner-occupied units account for 53,796 (75.0%), while renter-occupied units make up 17,937 (25.0%).
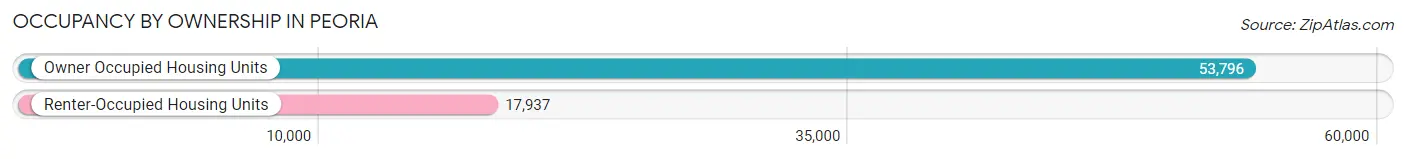
| Occupancy | # Housing Units | % Housing Units |
| Owner Occupied Housing Units | 53,796 | 75.0% |
| Renter-Occupied Housing Units | 17,937 | 25.0% |
| Total Occupied Housing Units | 71,733 | 100.0% |
Occupancy by Household Size in Peoria
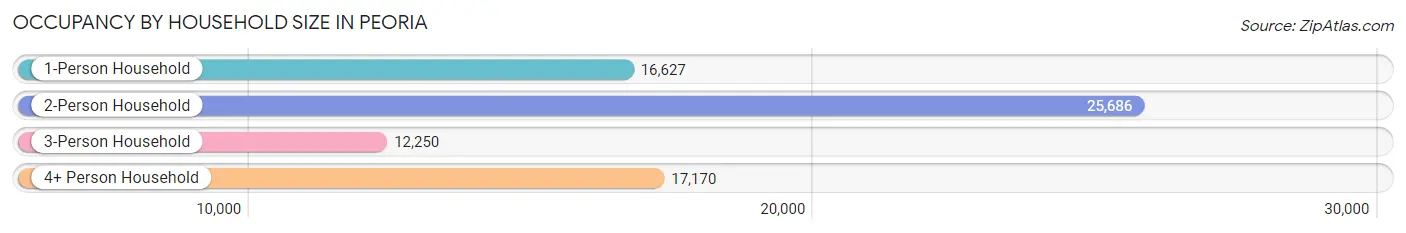
| Household Size | # Housing Units | % Housing Units |
| 1-Person Household | 16,627 | 23.2% |
| 2-Person Household | 25,686 | 35.8% |
| 3-Person Household | 12,250 | 17.1% |
| 4+ Person Household | 17,170 | 23.9% |
| Total Housing Units | 71,733 | 100.0% |
Occupancy by Ownership by Household Size in Peoria
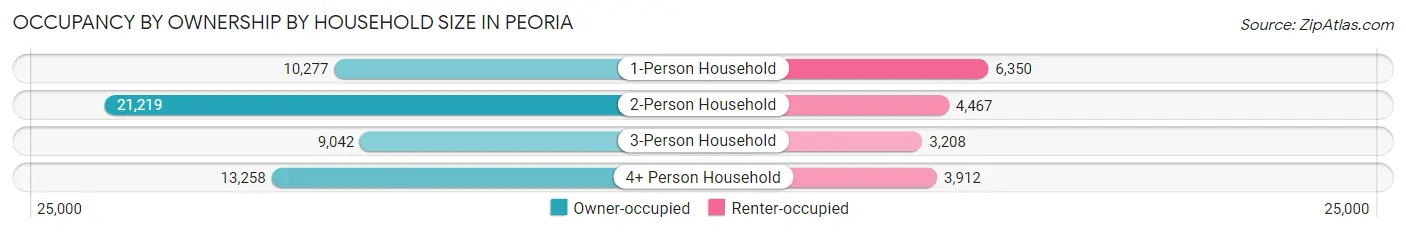
| Household Size | Owner-occupied | Renter-occupied |
| 1-Person Household | 10,277 (61.8%) | 6,350 (38.2%) |
| 2-Person Household | 21,219 (82.6%) | 4,467 (17.4%) |
| 3-Person Household | 9,042 (73.8%) | 3,208 (26.2%) |
| 4+ Person Household | 13,258 (77.2%) | 3,912 (22.8%) |
| Total Housing Units | 53,796 (75.0%) | 17,937 (25.0%) |
Occupancy by Educational Attainment in Peoria
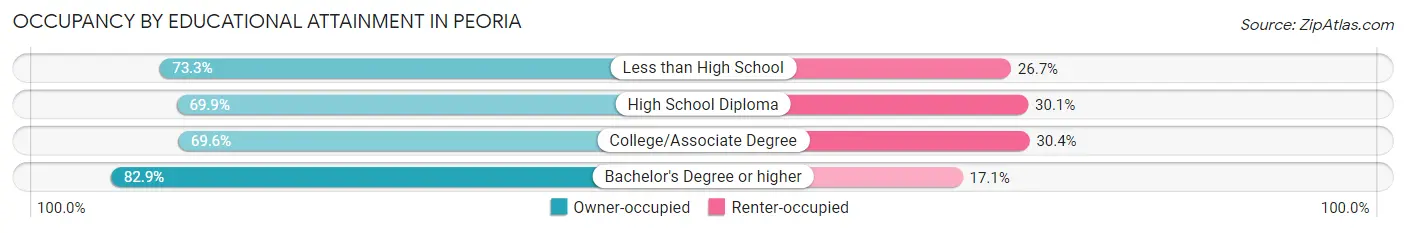
| Household Size | Owner-occupied | Renter-occupied |
| Less than High School | 2,621 (73.3%) | 955 (26.7%) |
| High School Diploma | 9,458 (69.9%) | 4,076 (30.1%) |
| College/Associate Degree | 18,639 (69.6%) | 8,138 (30.4%) |
| Bachelor's Degree or higher | 23,078 (82.9%) | 4,768 (17.1%) |
Occupancy by Age of Householder in Peoria
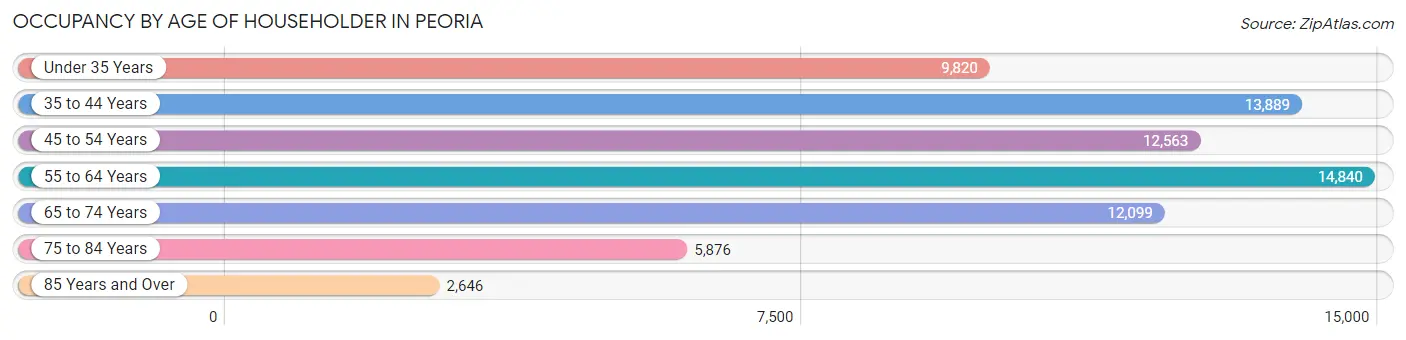
| Age Bracket | # Households | % Households |
| Under 35 Years | 9,820 | 13.7% |
| 35 to 44 Years | 13,889 | 19.4% |
| 45 to 54 Years | 12,563 | 17.5% |
| 55 to 64 Years | 14,840 | 20.7% |
| 65 to 74 Years | 12,099 | 16.9% |
| 75 to 84 Years | 5,876 | 8.2% |
| 85 Years and Over | 2,646 | 3.7% |
| Total | 71,733 | 100.0% |
Housing Finances in Peoria
Median Income by Occupancy in Peoria
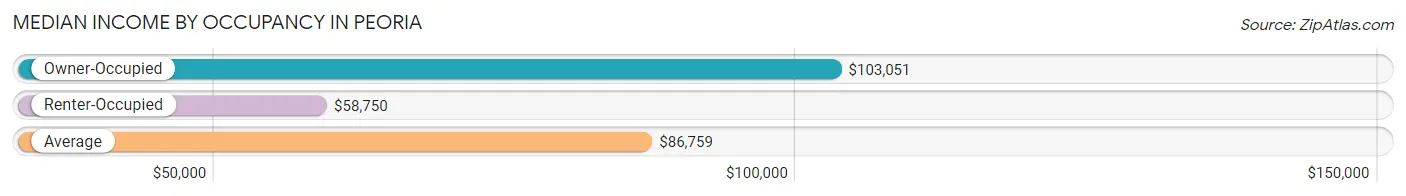
| Occupancy Type | # Households | Median Income |
| Owner-Occupied | 53,796 (75.0%) | $103,051 |
| Renter-Occupied | 17,937 (25.0%) | $58,750 |
| Average | 71,733 (100.0%) | $86,759 |
Occupancy by Householder Income Bracket in Peoria
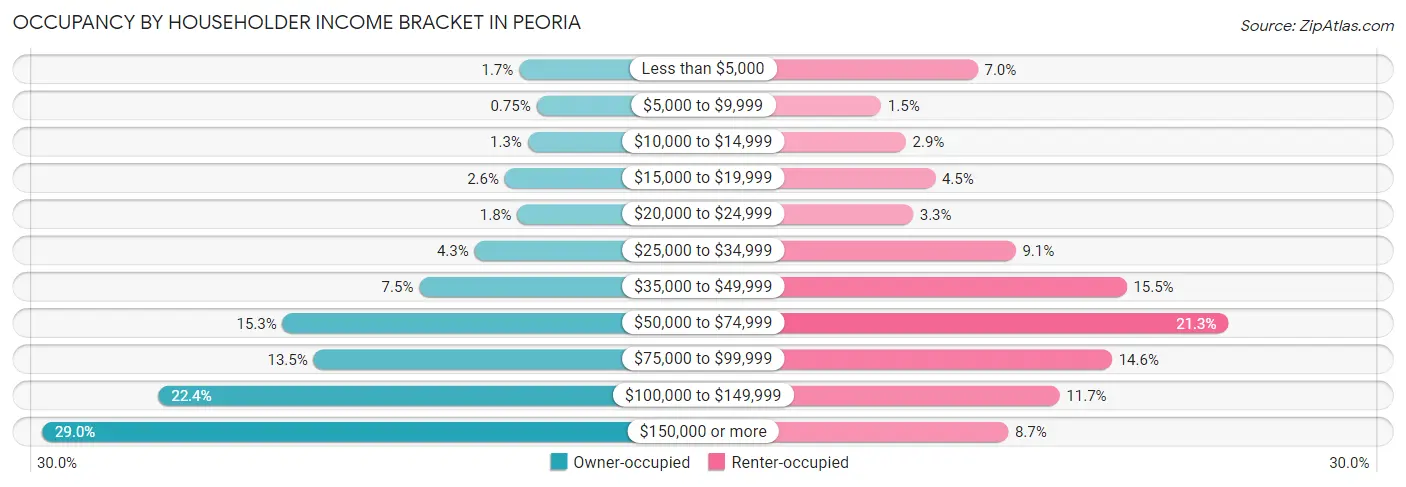
| Income Bracket | Owner-occupied | Renter-occupied |
| Less than $5,000 | 934 (1.7%) | 1,250 (7.0%) |
| $5,000 to $9,999 | 405 (0.7%) | 260 (1.5%) |
| $10,000 to $14,999 | 673 (1.3%) | 513 (2.9%) |
| $15,000 to $19,999 | 1,376 (2.6%) | 814 (4.5%) |
| $20,000 to $24,999 | 989 (1.8%) | 587 (3.3%) |
| $25,000 to $34,999 | 2,310 (4.3%) | 1,639 (9.1%) |
| $35,000 to $49,999 | 4,009 (7.4%) | 2,776 (15.5%) |
| $50,000 to $74,999 | 8,207 (15.3%) | 3,820 (21.3%) |
| $75,000 to $99,999 | 7,256 (13.5%) | 2,626 (14.6%) |
| $100,000 to $149,999 | 12,030 (22.4%) | 2,089 (11.7%) |
| $150,000 or more | 15,607 (29.0%) | 1,563 (8.7%) |
| Total | 53,796 (100.0%) | 17,937 (100.0%) |
Monthly Housing Cost Tiers in Peoria
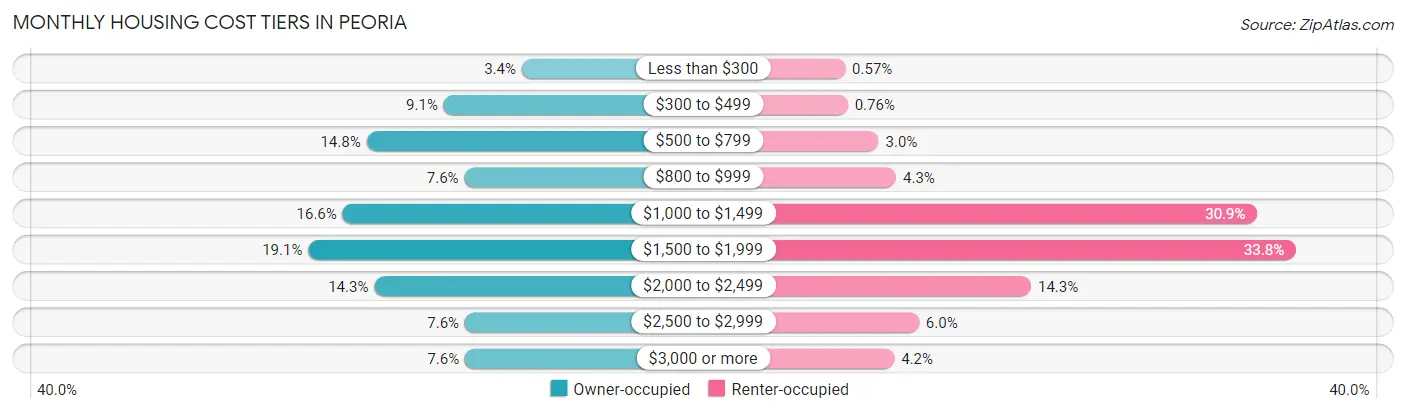
| Monthly Cost | Owner-occupied | Renter-occupied |
| Less than $300 | 1,816 (3.4%) | 102 (0.6%) |
| $300 to $499 | 4,911 (9.1%) | 136 (0.8%) |
| $500 to $799 | 7,972 (14.8%) | 543 (3.0%) |
| $800 to $999 | 4,094 (7.6%) | 774 (4.3%) |
| $1,000 to $1,499 | 8,918 (16.6%) | 5,546 (30.9%) |
| $1,500 to $1,999 | 10,281 (19.1%) | 6,058 (33.8%) |
| $2,000 to $2,499 | 7,668 (14.2%) | 2,557 (14.3%) |
| $2,500 to $2,999 | 4,070 (7.6%) | 1,076 (6.0%) |
| $3,000 or more | 4,066 (7.6%) | 751 (4.2%) |
| Total | 53,796 (100.0%) | 17,937 (100.0%) |
Physical Housing Characteristics in Peoria
Housing Structures in Peoria
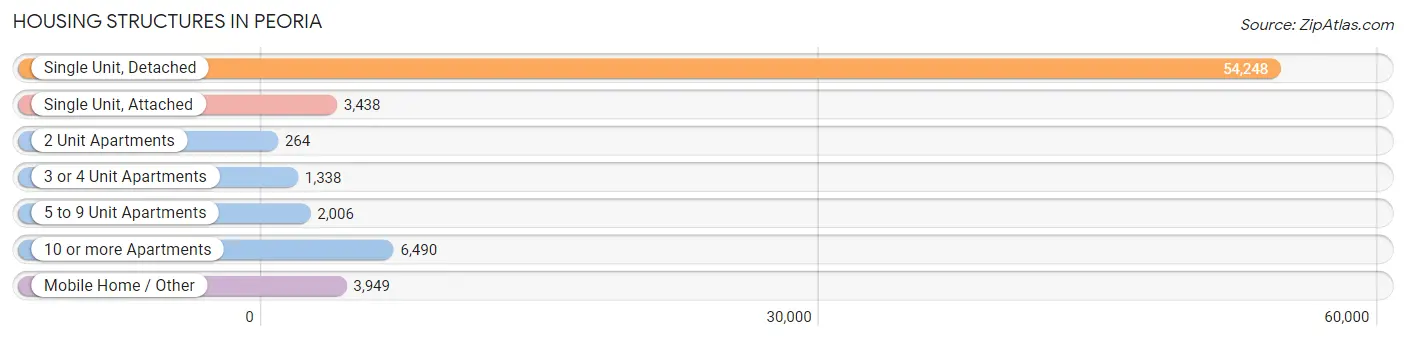
| Structure Type | # Housing Units | % Housing Units |
| Single Unit, Detached | 54,248 | 75.6% |
| Single Unit, Attached | 3,438 | 4.8% |
| 2 Unit Apartments | 264 | 0.4% |
| 3 or 4 Unit Apartments | 1,338 | 1.9% |
| 5 to 9 Unit Apartments | 2,006 | 2.8% |
| 10 or more Apartments | 6,490 | 9.0% |
| Mobile Home / Other | 3,949 | 5.5% |
| Total | 71,733 | 100.0% |
Housing Structures by Occupancy in Peoria
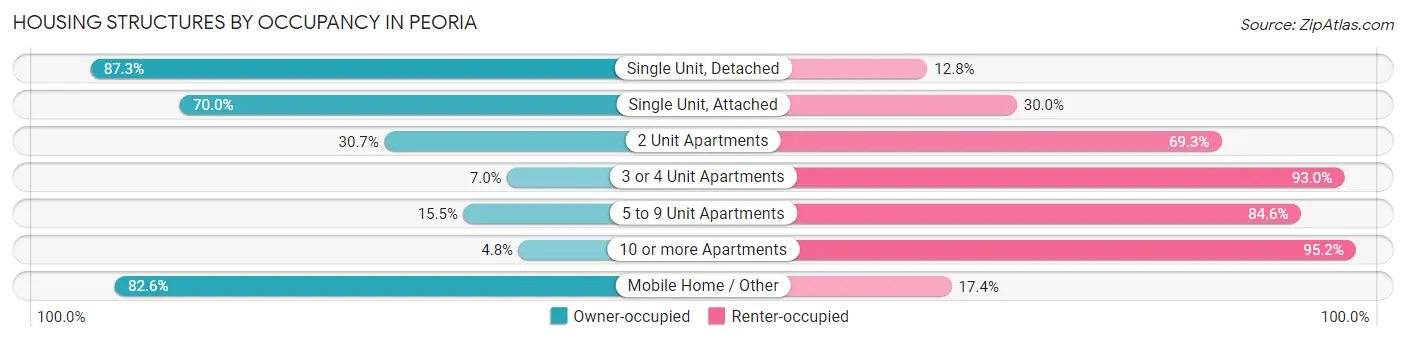
| Structure Type | Owner-occupied | Renter-occupied |
| Single Unit, Detached | 47,329 (87.3%) | 6,919 (12.8%) |
| Single Unit, Attached | 2,408 (70.0%) | 1,030 (30.0%) |
| 2 Unit Apartments | 81 (30.7%) | 183 (69.3%) |
| 3 or 4 Unit Apartments | 94 (7.0%) | 1,244 (93.0%) |
| 5 to 9 Unit Apartments | 310 (15.4%) | 1,696 (84.6%) |
| 10 or more Apartments | 313 (4.8%) | 6,177 (95.2%) |
| Mobile Home / Other | 3,261 (82.6%) | 688 (17.4%) |
| Total | 53,796 (75.0%) | 17,937 (25.0%) |
Housing Structures by Number of Rooms in Peoria
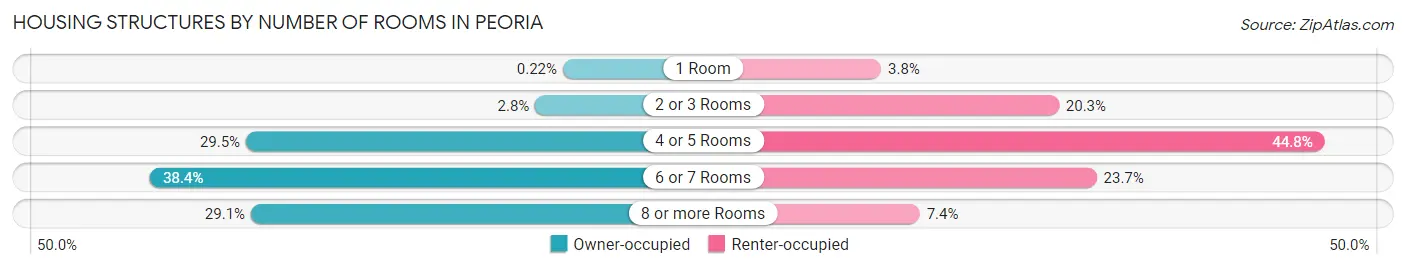
| Number of Rooms | Owner-occupied | Renter-occupied |
| 1 Room | 117 (0.2%) | 683 (3.8%) |
| 2 or 3 Rooms | 1,495 (2.8%) | 3,633 (20.3%) |
| 4 or 5 Rooms | 15,888 (29.5%) | 8,040 (44.8%) |
| 6 or 7 Rooms | 20,657 (38.4%) | 4,258 (23.7%) |
| 8 or more Rooms | 15,639 (29.1%) | 1,323 (7.4%) |
| Total | 53,796 (100.0%) | 17,937 (100.0%) |
Housing Structure by Heating Type in Peoria
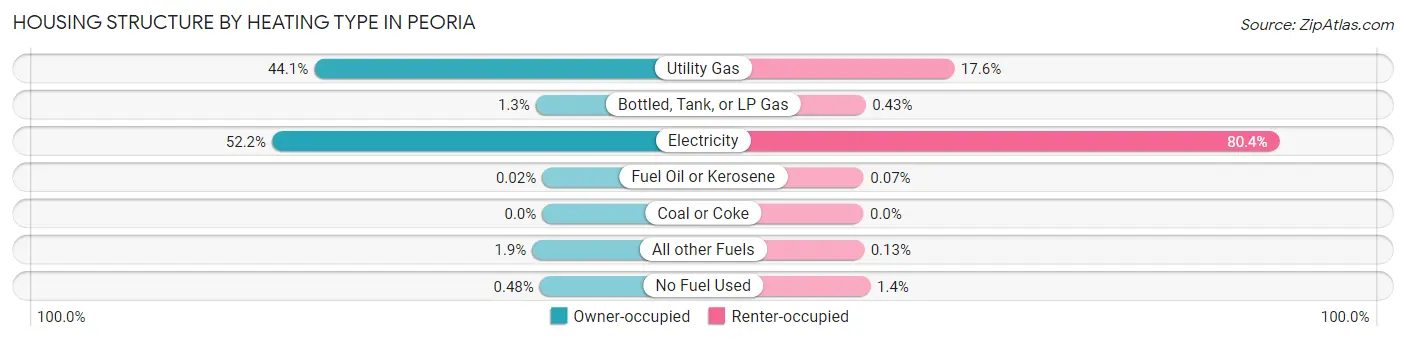
| Heating Type | Owner-occupied | Renter-occupied |
| Utility Gas | 23,713 (44.1%) | 3,152 (17.6%) |
| Bottled, Tank, or LP Gas | 683 (1.3%) | 77 (0.4%) |
| Electricity | 28,090 (52.2%) | 14,428 (80.4%) |
| Fuel Oil or Kerosene | 10 (0.0%) | 12 (0.1%) |
| Coal or Coke | 0 (0.0%) | 0 (0.0%) |
| All other Fuels | 1,040 (1.9%) | 24 (0.1%) |
| No Fuel Used | 260 (0.5%) | 244 (1.4%) |
| Total | 53,796 (100.0%) | 17,937 (100.0%) |
Household Vehicle Usage in Peoria
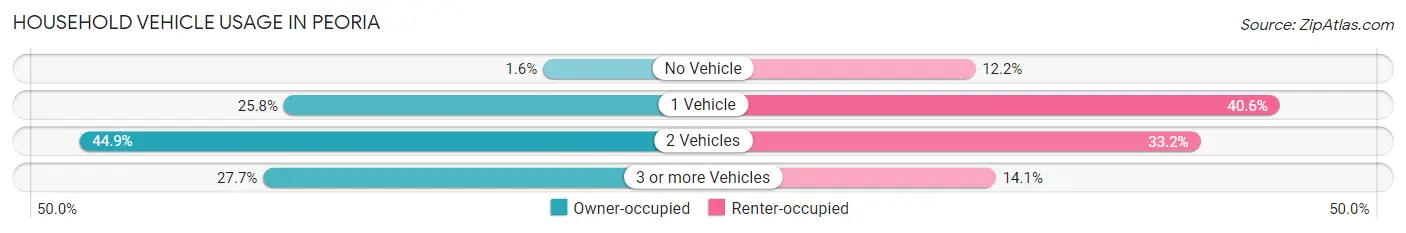
| Vehicles per Household | Owner-occupied | Renter-occupied |
| No Vehicle | 859 (1.6%) | 2,181 (12.2%) |
| 1 Vehicle | 13,878 (25.8%) | 7,279 (40.6%) |
| 2 Vehicles | 24,142 (44.9%) | 5,951 (33.2%) |
| 3 or more Vehicles | 14,917 (27.7%) | 2,526 (14.1%) |
| Total | 53,796 (100.0%) | 17,937 (100.0%) |
Real Estate & Mortgages in Peoria
Real Estate and Mortgage Overview in Peoria
| Characteristic | Without Mortgage | With Mortgage |
| Housing Units | 16,678 | 37,118 |
| Median Property Value | $354,400 | $392,300 |
| Median Household Income | $74,476 | $12,746 |
| Monthly Housing Costs | $564 | $4,059 |
| Real Estate Taxes | $2,030 | $1,074 |
Property Value by Mortgage Status in Peoria
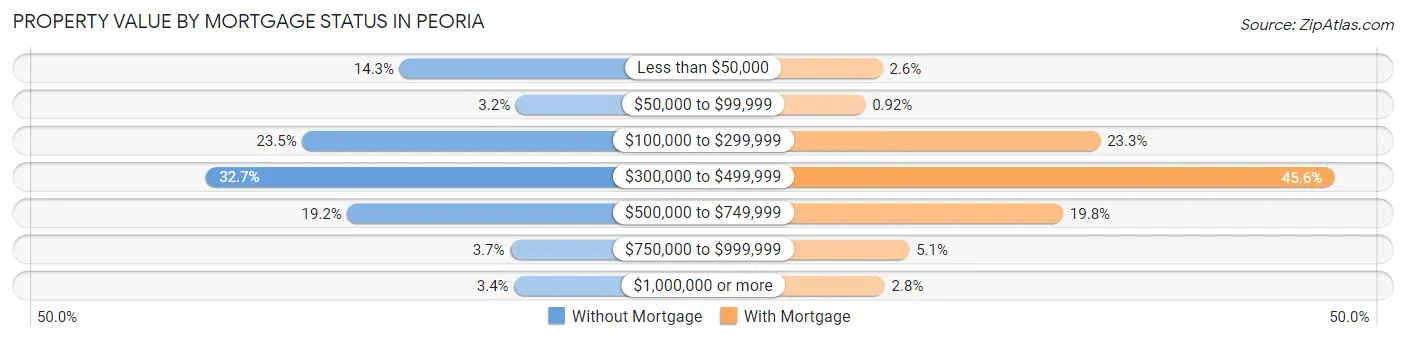
| Property Value | Without Mortgage | With Mortgage |
| Less than $50,000 | 2,379 (14.3%) | 949 (2.6%) |
| $50,000 to $99,999 | 533 (3.2%) | 343 (0.9%) |
| $100,000 to $299,999 | 3,924 (23.5%) | 8,650 (23.3%) |
| $300,000 to $499,999 | 5,454 (32.7%) | 16,918 (45.6%) |
| $500,000 to $749,999 | 3,207 (19.2%) | 7,332 (19.8%) |
| $750,000 to $999,999 | 623 (3.7%) | 1,897 (5.1%) |
| $1,000,000 or more | 558 (3.4%) | 1,029 (2.8%) |
| Total | 16,678 (100.0%) | 37,118 (100.0%) |
Household Income by Mortgage Status in Peoria
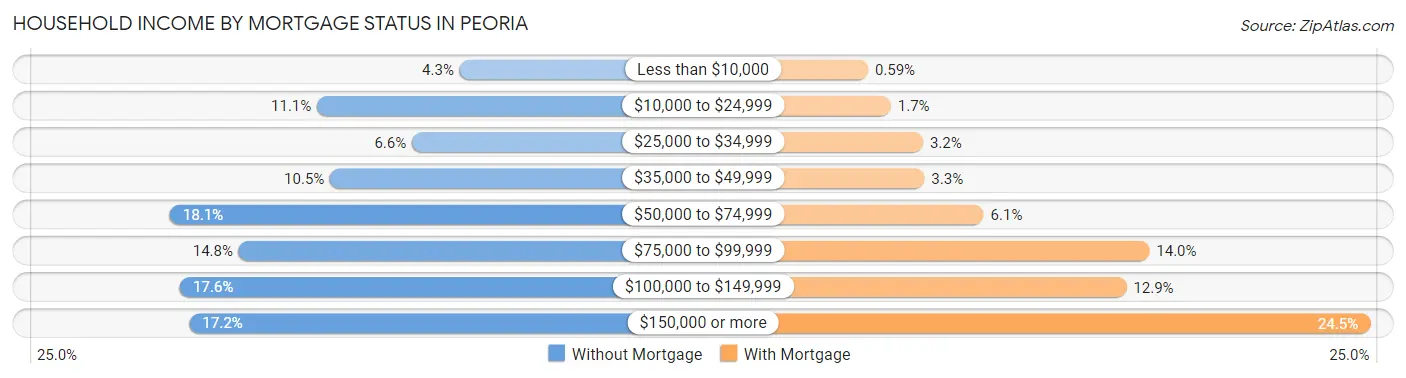
| Household Income | Without Mortgage | With Mortgage |
| Less than $10,000 | 714 (4.3%) | 218 (0.6%) |
| $10,000 to $24,999 | 1,847 (11.1%) | 625 (1.7%) |
| $25,000 to $34,999 | 1,093 (6.6%) | 1,191 (3.2%) |
| $35,000 to $49,999 | 1,743 (10.4%) | 1,217 (3.3%) |
| $50,000 to $74,999 | 3,015 (18.1%) | 2,266 (6.1%) |
| $75,000 to $99,999 | 2,469 (14.8%) | 5,192 (14.0%) |
| $100,000 to $149,999 | 2,936 (17.6%) | 4,787 (12.9%) |
| $150,000 or more | 2,861 (17.2%) | 9,094 (24.5%) |
| Total | 16,678 (100.0%) | 37,118 (100.0%) |
Property Value to Household Income Ratio in Peoria
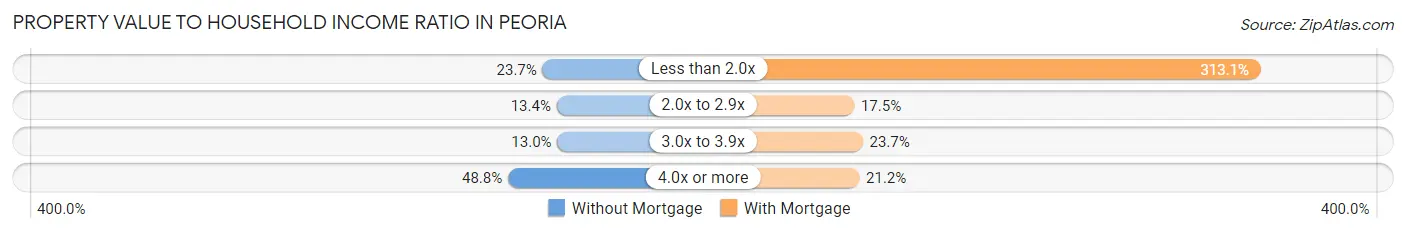
| Value-to-Income Ratio | Without Mortgage | With Mortgage |
| Less than 2.0x | 3,951 (23.7%) | 116,212 (313.1%) |
| 2.0x to 2.9x | 2,242 (13.4%) | 6,483 (17.5%) |
| 3.0x to 3.9x | 2,160 (13.0%) | 8,803 (23.7%) |
| 4.0x or more | 8,139 (48.8%) | 7,871 (21.2%) |
| Total | 16,678 (100.0%) | 37,118 (100.0%) |
Real Estate Taxes by Mortgage Status in Peoria
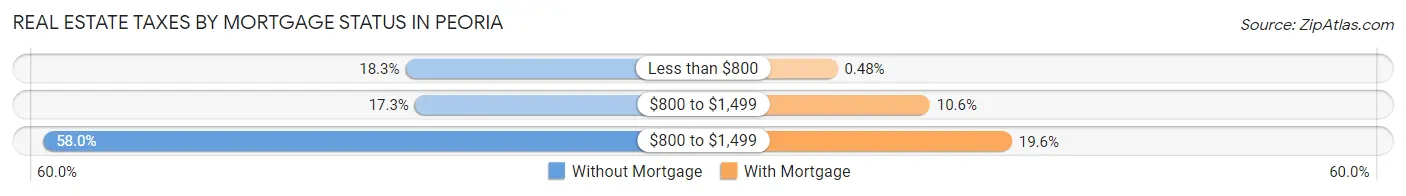
| Property Taxes | Without Mortgage | With Mortgage |
| Less than $800 | 3,048 (18.3%) | 179 (0.5%) |
| $800 to $1,499 | 2,877 (17.2%) | 3,935 (10.6%) |
| $800 to $1,499 | 9,667 (58.0%) | 7,271 (19.6%) |
| Total | 16,678 (100.0%) | 37,118 (100.0%) |
Health & Disability in Peoria
Health Insurance Coverage by Age in Peoria
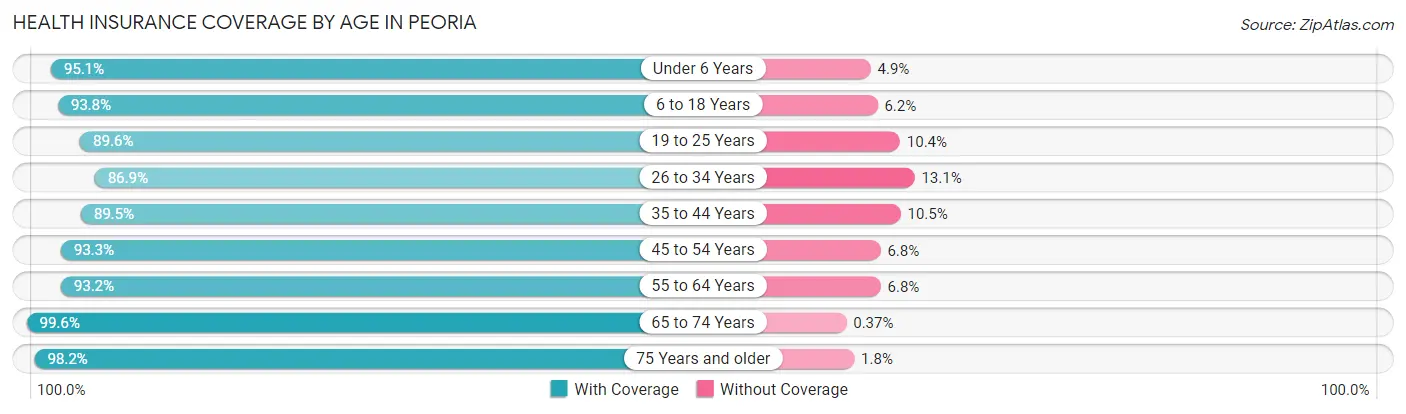
| Age Bracket | With Coverage | Without Coverage |
| Under 6 Years | 11,459 (95.1%) | 591 (4.9%) |
| 6 to 18 Years | 31,109 (93.8%) | 2,052 (6.2%) |
| 19 to 25 Years | 12,318 (89.6%) | 1,424 (10.4%) |
| 26 to 34 Years | 16,977 (86.9%) | 2,558 (13.1%) |
| 35 to 44 Years | 22,929 (89.5%) | 2,688 (10.5%) |
| 45 to 54 Years | 22,117 (93.2%) | 1,600 (6.8%) |
| 55 to 64 Years | 24,887 (93.2%) | 1,808 (6.8%) |
| 65 to 74 Years | 21,005 (99.6%) | 78 (0.4%) |
| 75 Years and older | 13,797 (98.2%) | 259 (1.8%) |
| Total | 176,598 (93.1%) | 13,058 (6.9%) |
Health Insurance Coverage by Citizenship Status in Peoria
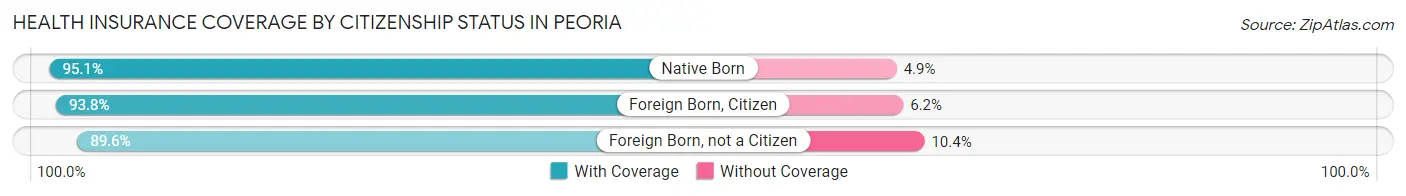
| Citizenship Status | With Coverage | Without Coverage |
| Native Born | 11,459 (95.1%) | 591 (4.9%) |
| Foreign Born, Citizen | 31,109 (93.8%) | 2,052 (6.2%) |
| Foreign Born, not a Citizen | 12,318 (89.6%) | 1,424 (10.4%) |
Health Insurance Coverage by Household Income in Peoria
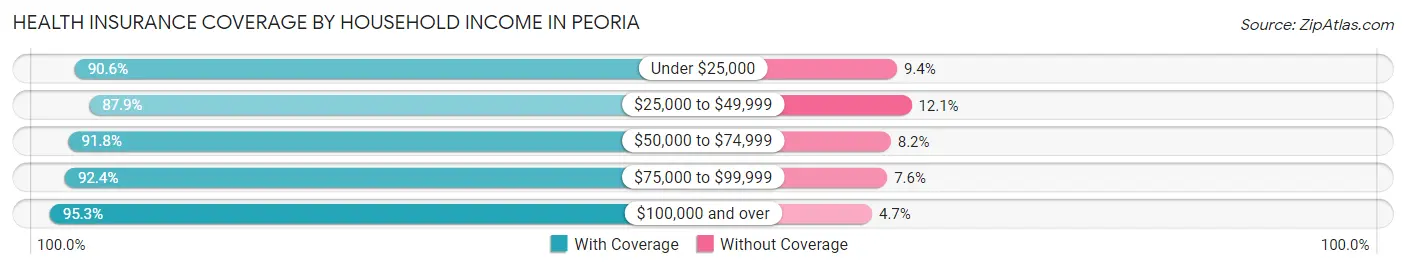
| Household Income | With Coverage | Without Coverage |
| Under $25,000 | 12,154 (90.6%) | 1,261 (9.4%) |
| $25,000 to $49,999 | 20,248 (87.9%) | 2,791 (12.1%) |
| $50,000 to $74,999 | 26,045 (91.8%) | 2,339 (8.2%) |
| $75,000 to $99,999 | 23,965 (92.4%) | 1,963 (7.6%) |
| $100,000 and over | 93,751 (95.3%) | 4,653 (4.7%) |
Public vs Private Health Insurance Coverage by Age in Peoria
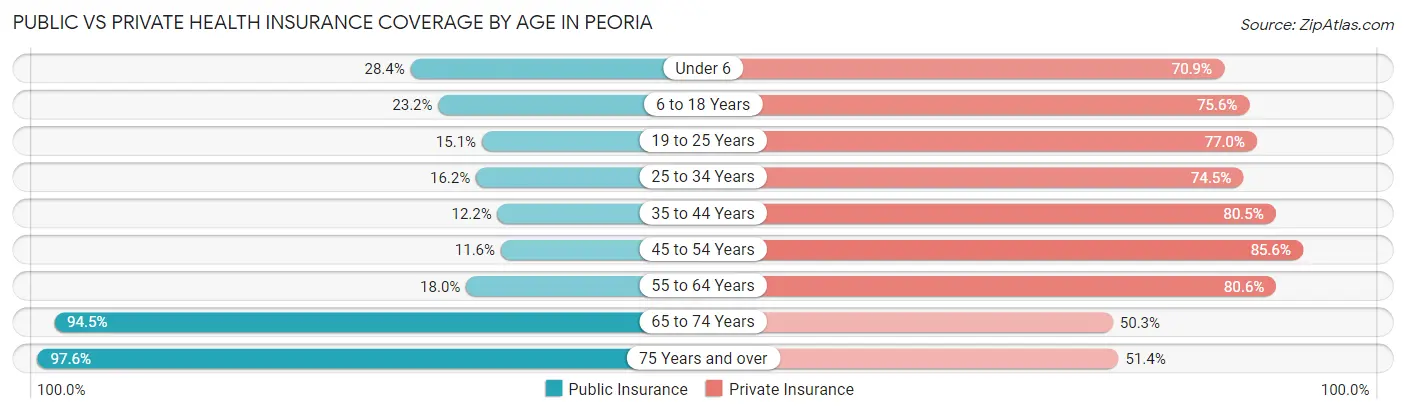
| Age Bracket | Public Insurance | Private Insurance |
| Under 6 | 3,418 (28.4%) | 8,545 (70.9%) |
| 6 to 18 Years | 7,695 (23.2%) | 25,074 (75.6%) |
| 19 to 25 Years | 2,078 (15.1%) | 10,585 (77.0%) |
| 25 to 34 Years | 3,165 (16.2%) | 14,549 (74.5%) |
| 35 to 44 Years | 3,127 (12.2%) | 20,621 (80.5%) |
| 45 to 54 Years | 2,750 (11.6%) | 20,289 (85.6%) |
| 55 to 64 Years | 4,816 (18.0%) | 21,521 (80.6%) |
| 65 to 74 Years | 19,926 (94.5%) | 10,607 (50.3%) |
| 75 Years and over | 13,714 (97.6%) | 7,221 (51.4%) |
| Total | 60,689 (32.0%) | 139,012 (73.3%) |
Disability Status by Sex by Age in Peoria
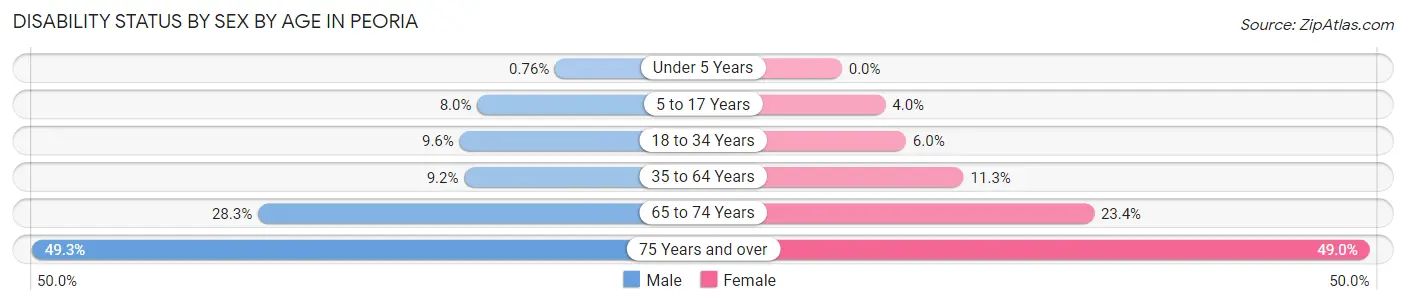
| Age Bracket | Male | Female |
| Under 5 Years | 39 (0.8%) | 0 (0.0%) |
| 5 to 17 Years | 1,331 (8.0%) | 680 (4.0%) |
| 18 to 34 Years | 1,676 (9.6%) | 1,060 (5.9%) |
| 35 to 64 Years | 3,400 (9.2%) | 4,413 (11.3%) |
| 65 to 74 Years | 2,771 (28.3%) | 2,646 (23.4%) |
| 75 Years and over | 2,965 (49.3%) | 3,940 (49.0%) |
Disability Class by Sex by Age in Peoria
Disability Class: Hearing Difficulty
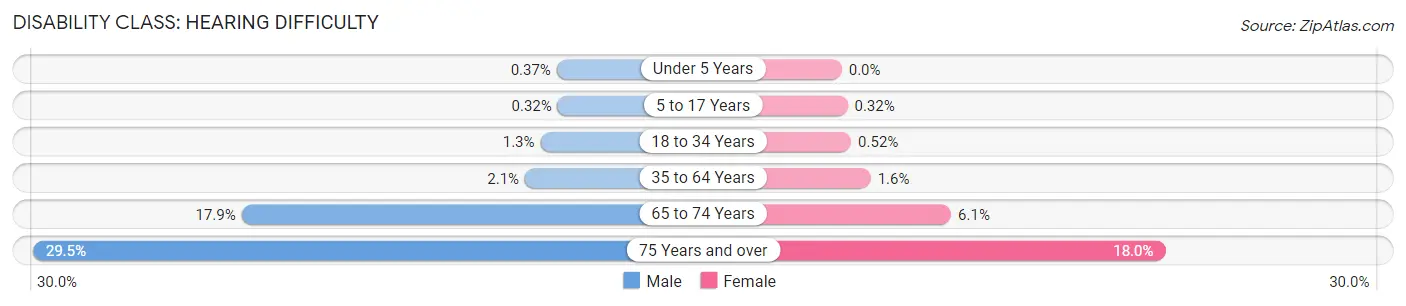
| Age Bracket | Male | Female |
| Under 5 Years | 19 (0.4%) | 0 (0.0%) |
| 5 to 17 Years | 54 (0.3%) | 54 (0.3%) |
| 18 to 34 Years | 223 (1.3%) | 93 (0.5%) |
| 35 to 64 Years | 793 (2.1%) | 630 (1.6%) |
| 65 to 74 Years | 1,752 (17.9%) | 689 (6.1%) |
| 75 Years and over | 1,776 (29.5%) | 1,449 (18.0%) |
Disability Class: Vision Difficulty
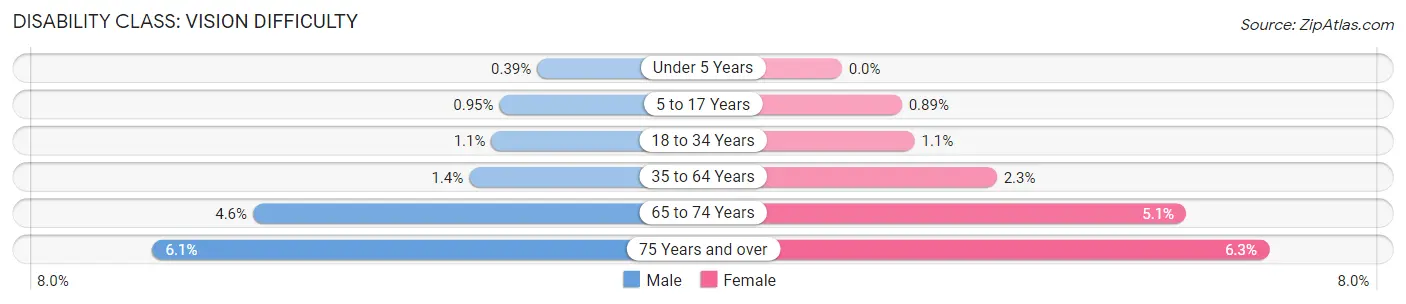
| Age Bracket | Male | Female |
| Under 5 Years | 20 (0.4%) | 0 (0.0%) |
| 5 to 17 Years | 158 (0.9%) | 149 (0.9%) |
| 18 to 34 Years | 187 (1.1%) | 192 (1.1%) |
| 35 to 64 Years | 520 (1.4%) | 898 (2.3%) |
| 65 to 74 Years | 451 (4.6%) | 578 (5.1%) |
| 75 Years and over | 367 (6.1%) | 510 (6.3%) |
Disability Class: Cognitive Difficulty
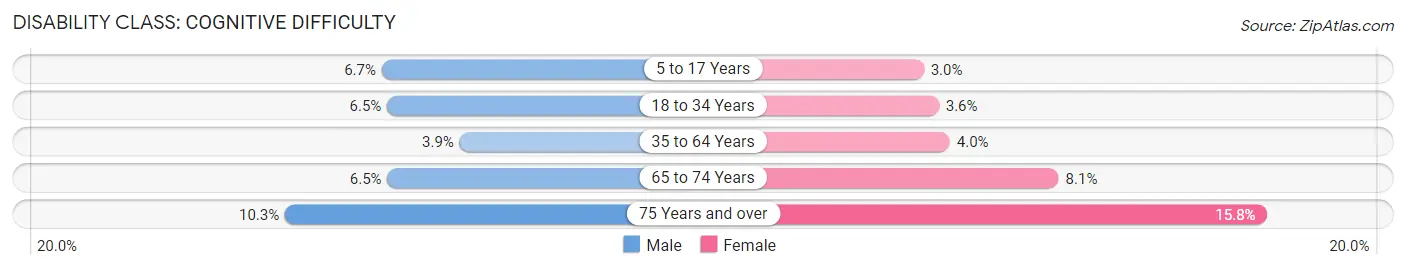
| Age Bracket | Male | Female |
| 5 to 17 Years | 1,122 (6.7%) | 511 (3.0%) |
| 18 to 34 Years | 1,139 (6.5%) | 641 (3.6%) |
| 35 to 64 Years | 1,426 (3.8%) | 1,563 (4.0%) |
| 65 to 74 Years | 638 (6.5%) | 910 (8.1%) |
| 75 Years and over | 621 (10.3%) | 1,271 (15.8%) |
Disability Class: Ambulatory Difficulty
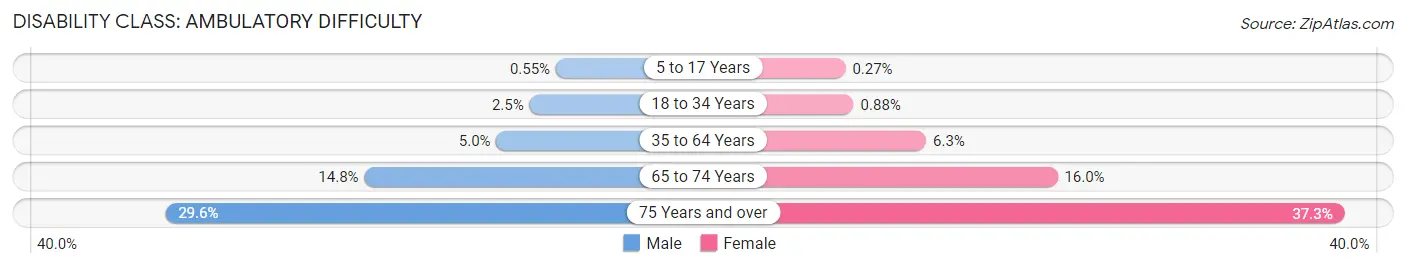
| Age Bracket | Male | Female |
| 5 to 17 Years | 91 (0.5%) | 46 (0.3%) |
| 18 to 34 Years | 437 (2.5%) | 156 (0.9%) |
| 35 to 64 Years | 1,840 (5.0%) | 2,444 (6.3%) |
| 65 to 74 Years | 1,444 (14.8%) | 1,810 (16.0%) |
| 75 Years and over | 1,777 (29.6%) | 3,002 (37.3%) |
Disability Class: Self-Care Difficulty
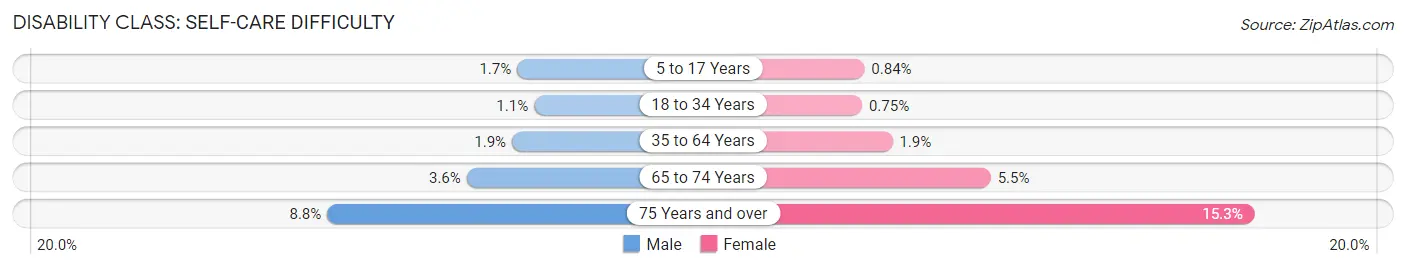
| Age Bracket | Male | Female |
| 5 to 17 Years | 286 (1.7%) | 142 (0.8%) |
| 18 to 34 Years | 189 (1.1%) | 133 (0.7%) |
| 35 to 64 Years | 708 (1.9%) | 732 (1.9%) |
| 65 to 74 Years | 351 (3.6%) | 625 (5.5%) |
| 75 Years and over | 527 (8.8%) | 1,232 (15.3%) |
Technology Access in Peoria
Computing Device Access in Peoria
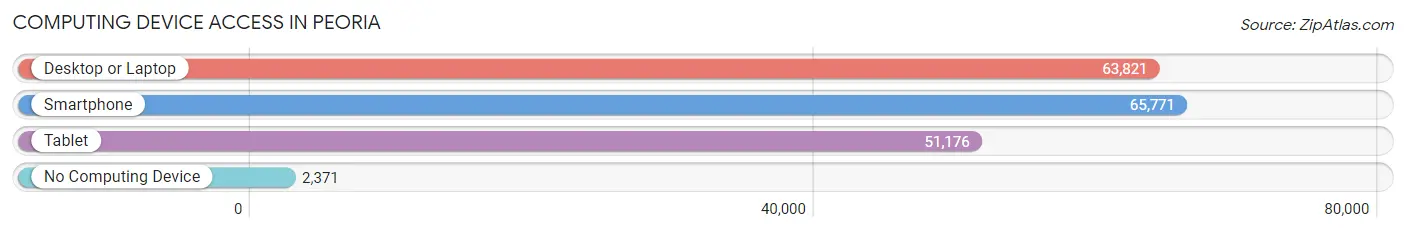
| Device Type | # Households | % Households |
| Desktop or Laptop | 63,821 | 89.0% |
| Smartphone | 65,771 | 91.7% |
| Tablet | 51,176 | 71.3% |
| No Computing Device | 2,371 | 3.3% |
| Total | 71,733 | 100.0% |
Internet Access in Peoria
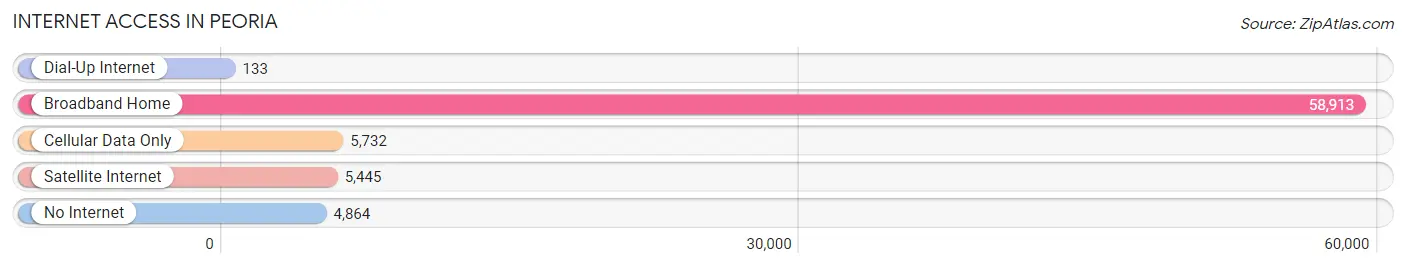
| Internet Type | # Households | % Households |
| Dial-Up Internet | 133 | 0.2% |
| Broadband Home | 58,913 | 82.1% |
| Cellular Data Only | 5,732 | 8.0% |
| Satellite Internet | 5,445 | 7.6% |
| No Internet | 4,864 | 6.8% |
| Total | 71,733 | 100.0% |
Peoria Summary
Peoria, Arizona is a city located in Maricopa County, Arizona, United States. It is a suburb of Phoenix and is the sixth-largest city in the state. Peoria is located in the northwest part of the Phoenix metropolitan area and is bordered by Glendale to the west, Sun City to the south, Surprise to the north, and Phoenix to the east. The population of Peoria was 154,065 as of the 2019 census, making it the ninth-largest city in Arizona.
Geography
Peoria is located in the northwest corner of Maricopa County, Arizona, and is bordered by Glendale to the west, Sun City to the south, Surprise to the north, and Phoenix to the east. The city covers an area of about 137 square miles and is located at an elevation of 1,100 feet. The city is situated in the Sonoran Desert and is characterized by hot, dry summers and mild winters. The city is located in the Salt River Valley and is surrounded by the White Tank Mountains to the west and the Sierra Estrella Mountains to the south.
History
Peoria was founded in 1886 by William John Murphy, who was a settler from Illinois. Murphy named the city after Peoria, Illinois, which was his hometown. The city was incorporated in 1954 and has since grown to become the sixth-largest city in Arizona.
Economy
Peoria has a diverse economy that is driven by a variety of industries. The city is home to a number of corporate headquarters, including Banner Health, Apollo Education Group, and the Peoria Unified School District. The city is also home to a number of manufacturing and technology companies, including Honeywell, Intel, and Boeing. The city is also home to a number of retail and service businesses, including Walmart, Target, and Best Buy.
Demographics
As of the 2019 census, the population of Peoria was 154,065. The racial makeup of the city was 73.3% White, 5.3% Black or African American, 1.3% Native American, 4.2% Asian, 0.2% Pacific Islander, 11.7% from other races, and 4.2% from two or more races. The median household income in Peoria was $63,945, and the median family income was $71,845. The per capita income in Peoria was $27,945.
Conclusion
Peoria, Arizona is a city located in Maricopa County, Arizona, United States. It is a suburb of Phoenix and is the sixth-largest city in the state. Peoria was founded in 1886 by William John Murphy and has since grown to become the sixth-largest city in Arizona. The city has a diverse economy that is driven by a variety of industries, including corporate headquarters, manufacturing and technology companies, and retail and service businesses. As of the 2019 census, the population of Peoria was 154,065, with a median household income of $63,945 and a median family income of $71,845.
Common Questions
What is Per Capita Income in Peoria?
Per Capita income in Peoria is $42,627.
What is the Median Family Income in Peoria?
Median Family Income in Peoria is $102,661.
What is the Median Household income in Peoria?
Median Household Income in Peoria is $86,759.
What is Income or Wage Gap in Peoria?
Income or Wage Gap in Peoria is 22.6%.
Women in Peoria earn 77.4 cents for every dollar earned by a man.
What is Family Income Deficit in Peoria?
Family Income Deficit in Peoria is $11,829.
Families that are below poverty line in Peoria earn $11,829 less on average than the poverty threshold level.
What is Inequality or Gini Index in Peoria?
Inequality or Gini Index in Peoria is 0.43.
What is the Total Population of Peoria?
Total Population of Peoria is 191,292.
What is the Total Male Population of Peoria?
Total Male Population of Peoria is 92,807.
What is the Total Female Population of Peoria?
Total Female Population of Peoria is 98,485.
What is the Ratio of Males per 100 Females in Peoria?
There are 94.23 Males per 100 Females in Peoria.
What is the Ratio of Females per 100 Males in Peoria?
There are 106.12 Females per 100 Males in Peoria.
What is the Median Population Age in Peoria?
Median Population Age in Peoria is 41.4 Years.
What is the Average Family Size in Peoria
Average Family Size in Peoria is 3.1 People.
What is the Average Household Size in Peoria
Average Household Size in Peoria is 2.6 People.
How Large is the Labor Force in Peoria?
There are 94,209 People in the Labor Forcein in Peoria.
What is the Percentage of People in the Labor Force in Peoria?
61.5% of People are in the Labor Force in Peoria.
What is the Unemployment Rate in Peoria?
Unemployment Rate in Peoria is 3.9%.