Sioux Falls, SD Map & Demographics
Sioux Falls Map
Sioux Falls Overview
$40,198
PER CAPITA INCOME
$93,682
AVG FAMILY INCOME
$71,785
AVG HOUSEHOLD INCOME
23.2%
WAGE / INCOME GAP [ % ]
76.8¢/ $1
WAGE / INCOME GAP [ $ ]
$9,641
FAMILY INCOME DEFICIT
0.44
INEQUALITY / GINI INDEX
193,401
TOTAL POPULATION
97,620
MALE POPULATION
95,781
FEMALE POPULATION
101.92
MALES / 100 FEMALES
98.12
FEMALES / 100 MALES
34.9
MEDIAN AGE
3.0
AVG FAMILY SIZE
2.4
AVG HOUSEHOLD SIZE
111,781
LABOR FORCE [ PEOPLE ]
74.2%
PERCENT IN LABOR FORCE
2.3%
UNEMPLOYMENT RATE
Sioux Falls Area Codes
Income in Sioux Falls
Income Overview in Sioux Falls
Per Capita Income in Sioux Falls is $40,198, while median incomes of families and households are $93,682 and $71,785 respectively.
| Characteristic | Number | Measure |
| Per Capita Income | 193,401 | $40,198 |
| Median Family Income | 46,986 | $93,682 |
| Mean Family Income | 46,986 | $117,563 |
| Median Household Income | 79,753 | $71,785 |
| Mean Household Income | 79,753 | $95,726 |
| Income Deficit | 46,986 | $9,641 |
| Wage / Income Gap (%) | 193,401 | 23.16% |
| Wage / Income Gap ($) | 193,401 | 76.84¢ per $1 |
| Gini / Inequality Index | 193,401 | 0.44 |
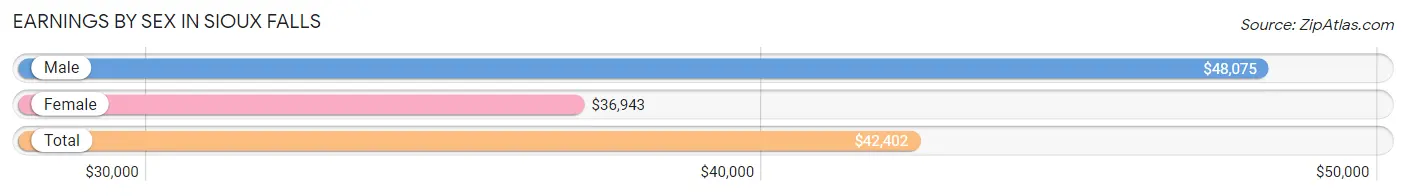
Earnings by Sex in Sioux Falls
Average Earnings in Sioux Falls are $42,402, $48,075 for men and $36,943 for women, a difference of 23.2%.
| Sex | Number | Average Earnings |
| Male | 61,861 (52.6%) | $48,075 |
| Female | 55,769 (47.4%) | $36,943 |
| Total | 117,630 (100.0%) | $42,402 |
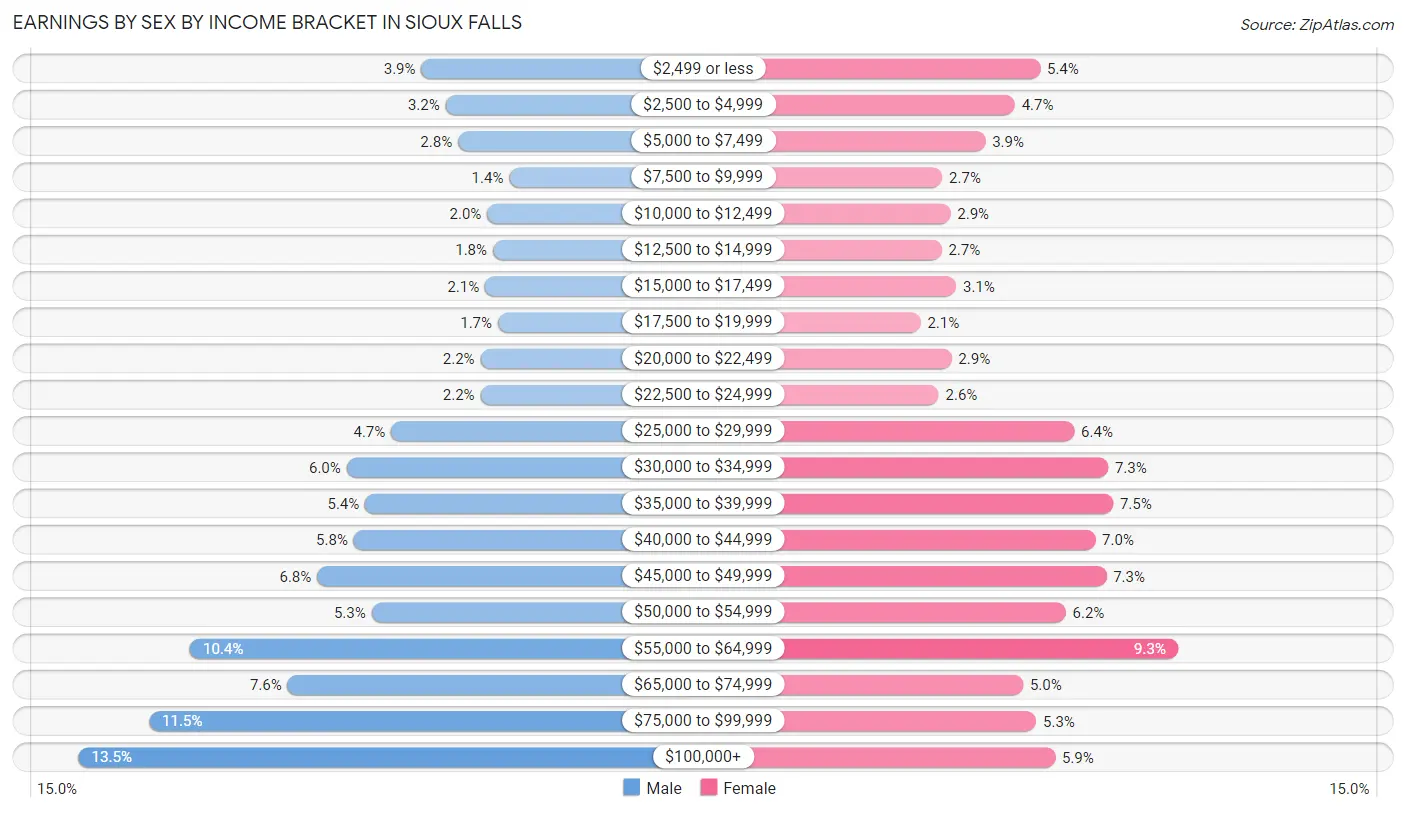
Earnings by Sex by Income Bracket in Sioux Falls
The most common earnings brackets in Sioux Falls are $100,000+ for men (8,341 | 13.5%) and $55,000 to $64,999 for women (5,187 | 9.3%).
| Income | Male | Female |
| $2,499 or less | 2,382 (3.8%) | 3,030 (5.4%) |
| $2,500 to $4,999 | 1,962 (3.2%) | 2,631 (4.7%) |
| $5,000 to $7,499 | 1,743 (2.8%) | 2,168 (3.9%) |
| $7,500 to $9,999 | 854 (1.4%) | 1,496 (2.7%) |
| $10,000 to $12,499 | 1,235 (2.0%) | 1,622 (2.9%) |
| $12,500 to $14,999 | 1,139 (1.8%) | 1,482 (2.7%) |
| $15,000 to $17,499 | 1,277 (2.1%) | 1,711 (3.1%) |
| $17,500 to $19,999 | 1,051 (1.7%) | 1,155 (2.1%) |
| $20,000 to $22,499 | 1,357 (2.2%) | 1,638 (2.9%) |
| $22,500 to $24,999 | 1,352 (2.2%) | 1,440 (2.6%) |
| $25,000 to $29,999 | 2,908 (4.7%) | 3,564 (6.4%) |
| $30,000 to $34,999 | 3,679 (5.9%) | 4,093 (7.3%) |
| $35,000 to $39,999 | 3,361 (5.4%) | 4,174 (7.5%) |
| $40,000 to $44,999 | 3,555 (5.8%) | 3,891 (7.0%) |
| $45,000 to $49,999 | 4,196 (6.8%) | 4,065 (7.3%) |
| $50,000 to $54,999 | 3,248 (5.2%) | 3,431 (6.1%) |
| $55,000 to $64,999 | 6,402 (10.3%) | 5,187 (9.3%) |
| $65,000 to $74,999 | 4,708 (7.6%) | 2,763 (5.0%) |
| $75,000 to $99,999 | 7,111 (11.5%) | 2,968 (5.3%) |
| $100,000+ | 8,341 (13.5%) | 3,260 (5.9%) |
| Total | 61,861 (100.0%) | 55,769 (100.0%) |
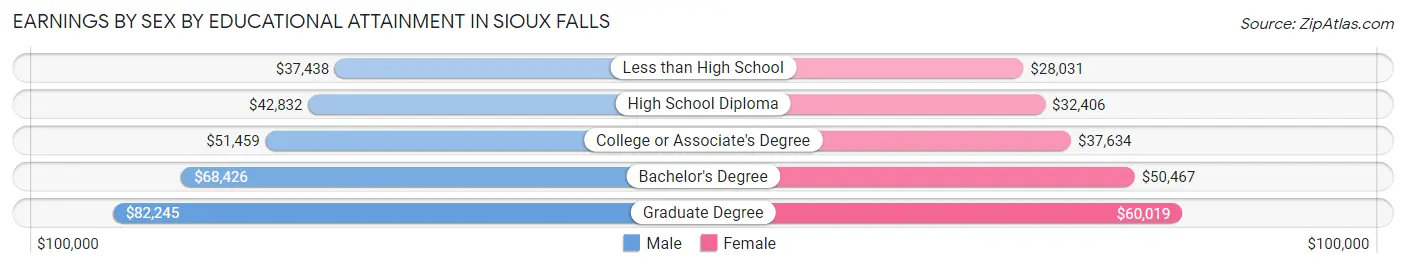
Earnings by Sex by Educational Attainment in Sioux Falls
Average earnings in Sioux Falls are $53,967 for men and $41,625 for women, a difference of 22.9%. Men with an educational attainment of graduate degree enjoy the highest average annual earnings of $82,245, while those with less than high school education earn the least with $37,438. Women with an educational attainment of graduate degree earn the most with the average annual earnings of $60,019, while those with less than high school education have the smallest earnings of $28,031.
| Educational Attainment | Male Income | Female Income |
| Less than High School | $37,438 | $28,031 |
| High School Diploma | $42,832 | $32,406 |
| College or Associate's Degree | $51,459 | $37,634 |
| Bachelor's Degree | $68,426 | $50,467 |
| Graduate Degree | $82,245 | $60,019 |
| Total | $53,967 | $41,625 |
Family Income in Sioux Falls
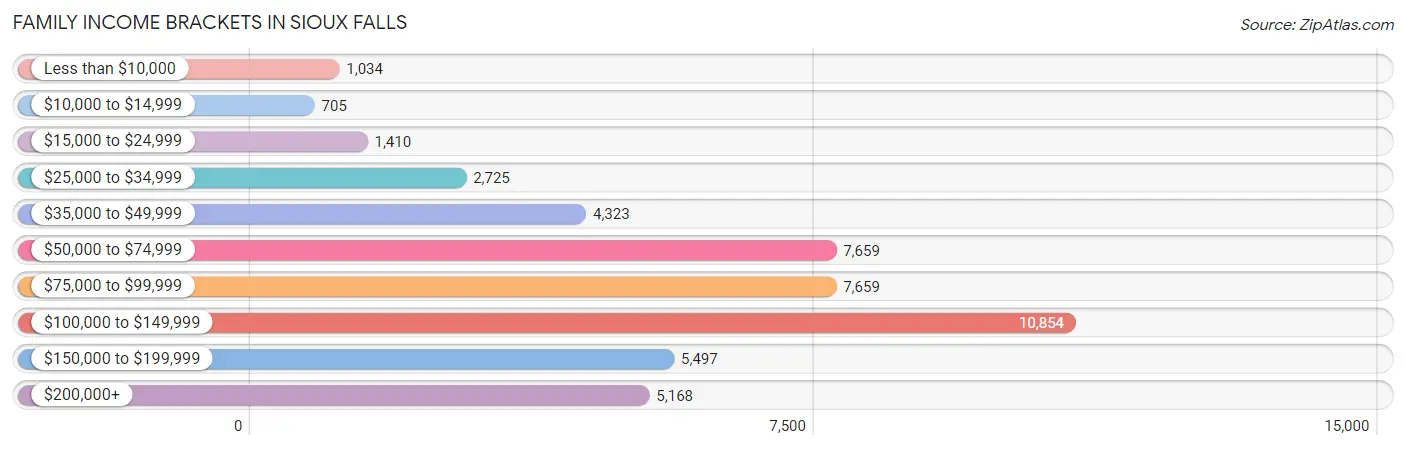
Family Income Brackets in Sioux Falls
According to the Sioux Falls family income data, there are 10,854 families falling into the $100,000 to $149,999 income range, which is the most common income bracket and makes up 23.1% of all families. Conversely, the $10,000 to $14,999 income bracket is the least frequent group with only 705 families (1.5%) belonging to this category.
| Income Bracket | # Families | % Families |
| Less than $10,000 | 1,034 | 2.2% |
| $10,000 to $14,999 | 705 | 1.5% |
| $15,000 to $24,999 | 1,410 | 3.0% |
| $25,000 to $34,999 | 2,725 | 5.8% |
| $35,000 to $49,999 | 4,323 | 9.2% |
| $50,000 to $74,999 | 7,659 | 16.3% |
| $75,000 to $99,999 | 7,659 | 16.3% |
| $100,000 to $149,999 | 10,854 | 23.1% |
| $150,000 to $199,999 | 5,497 | 11.7% |
| $200,000+ | 5,168 | 11.0% |
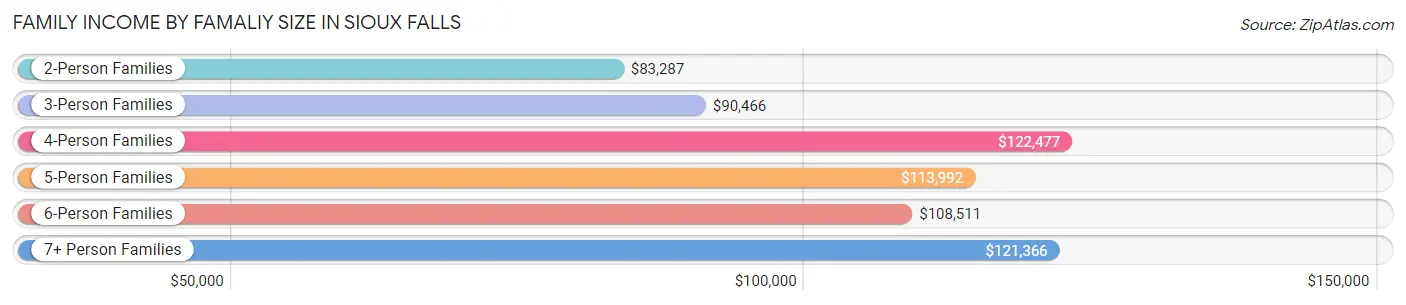
Family Income by Famaliy Size in Sioux Falls
4-person families (8,265 | 17.6%) account for the highest median family income in Sioux Falls with $122,477 per family, while 2-person families (22,624 | 48.1%) have the highest median income of $41,644 per family member.
| Income Bracket | # Families | Median Income |
| 2-Person Families | 22,624 (48.1%) | $83,287 |
| 3-Person Families | 9,316 (19.8%) | $90,466 |
| 4-Person Families | 8,265 (17.6%) | $122,477 |
| 5-Person Families | 4,782 (10.2%) | $113,992 |
| 6-Person Families | 1,255 (2.7%) | $108,511 |
| 7+ Person Families | 744 (1.6%) | $121,366 |
| Total | 46,986 (100.0%) | $93,682 |
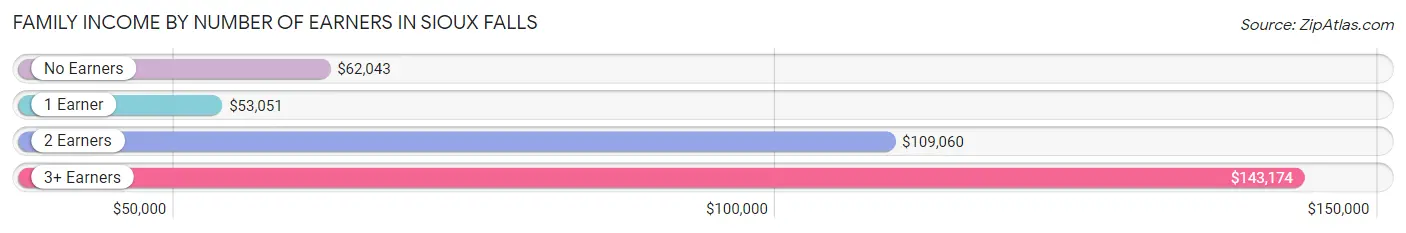
Family Income by Number of Earners in Sioux Falls
The median family income in Sioux Falls is $93,682, with families comprising 3+ earners (5,414) having the highest median family income of $143,174, while families with 1 earner (12,978) have the lowest median family income of $53,051, accounting for 11.5% and 27.6% of families, respectively.
| Number of Earners | # Families | Median Income |
| No Earners | 4,522 (9.6%) | $62,043 |
| 1 Earner | 12,978 (27.6%) | $53,051 |
| 2 Earners | 24,072 (51.2%) | $109,060 |
| 3+ Earners | 5,414 (11.5%) | $143,174 |
| Total | 46,986 (100.0%) | $93,682 |
Household Income in Sioux Falls
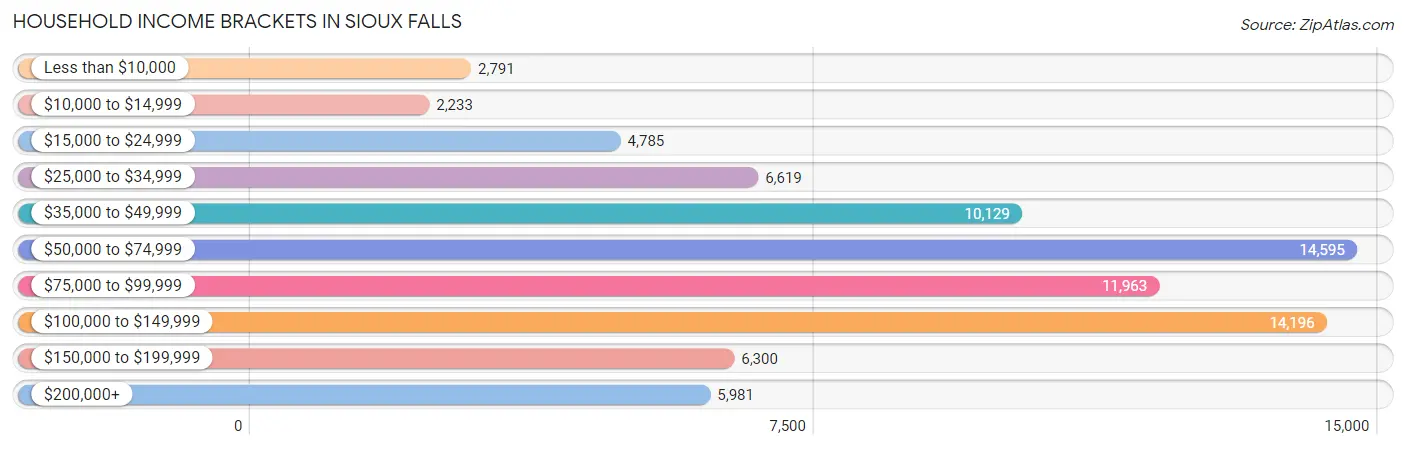
Household Income Brackets in Sioux Falls
With 14,595 households falling in the category, the $50,000 to $74,999 income range is the most frequent in Sioux Falls, accounting for 18.3% of all households. In contrast, only 2,233 households (2.8%) fall into the $10,000 to $14,999 income bracket, making it the least populous group.
| Income Bracket | # Households | % Households |
| Less than $10,000 | 2,791 | 3.5% |
| $10,000 to $14,999 | 2,233 | 2.8% |
| $15,000 to $24,999 | 4,785 | 6.0% |
| $25,000 to $34,999 | 6,619 | 8.3% |
| $35,000 to $49,999 | 10,129 | 12.7% |
| $50,000 to $74,999 | 14,595 | 18.3% |
| $75,000 to $99,999 | 11,963 | 15.0% |
| $100,000 to $149,999 | 14,196 | 17.8% |
| $150,000 to $199,999 | 6,300 | 7.9% |
| $200,000+ | 5,981 | 7.5% |
Household Income by Householder Age in Sioux Falls
The median household income in Sioux Falls is $71,785, with the highest median household income of $80,880 found in the 45 to 64 years age bracket for the primary householder. A total of 25,434 households (31.9%) fall into this category. Meanwhile, the 15 to 24 years age bracket for the primary householder has the lowest median household income of $48,970, with 5,539 households (7.0%) in this group.
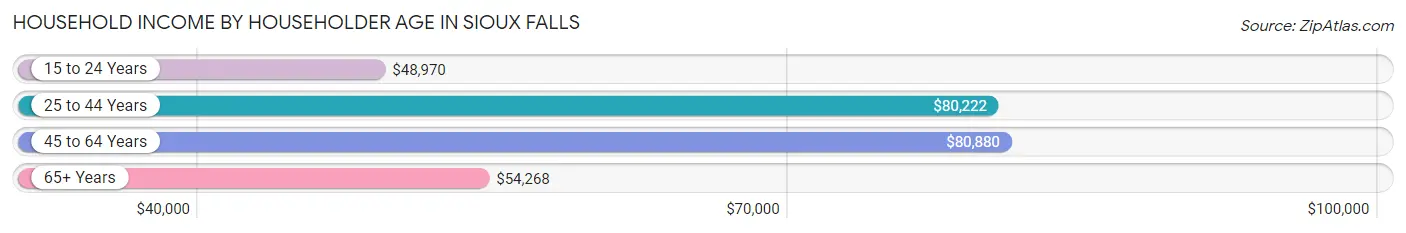
| Income Bracket | # Households | Median Income |
| 15 to 24 Years | 5,539 (7.0%) | $48,970 |
| 25 to 44 Years | 31,603 (39.6%) | $80,222 |
| 45 to 64 Years | 25,434 (31.9%) | $80,880 |
| 65+ Years | 17,177 (21.5%) | $54,268 |
| Total | 79,753 (100.0%) | $71,785 |
Poverty in Sioux Falls
Income Below Poverty by Sex and Age in Sioux Falls
With 8.9% poverty level for males and 10.5% for females among the residents of Sioux Falls, under 5 year old males and 18 to 24 year old females are the most vulnerable to poverty, with 1,261 males (18.1%) and 1,855 females (22.3%) in their respective age groups living below the poverty level.
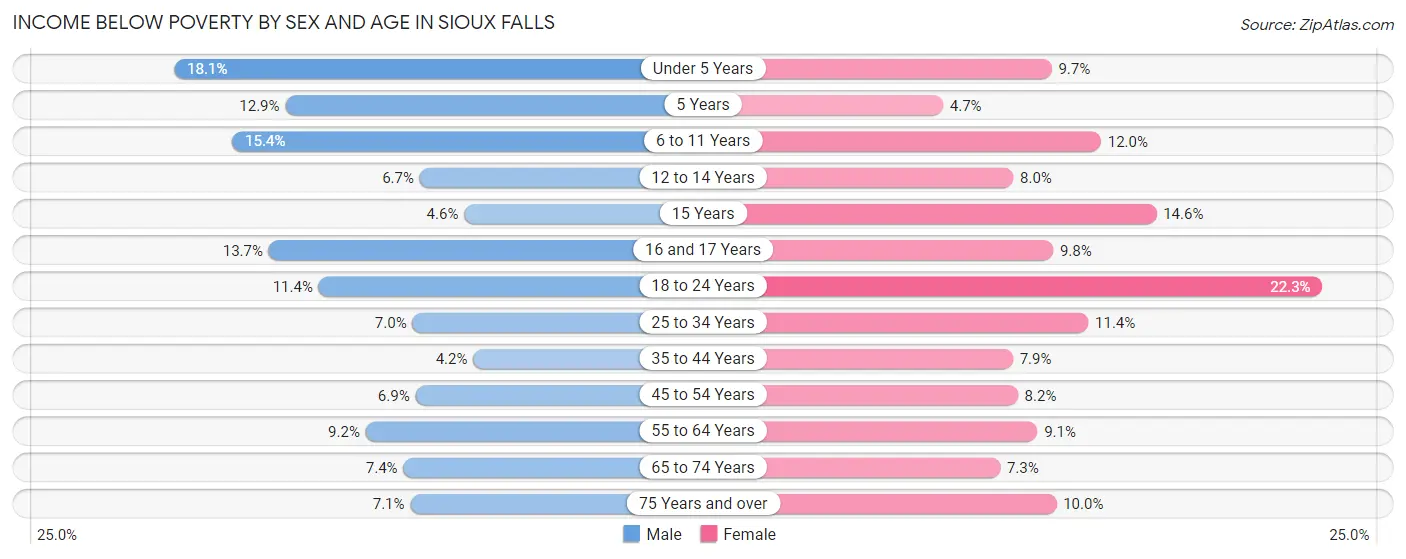
| Age Bracket | Male | Female |
| Under 5 Years | 1,261 (18.1%) | 646 (9.7%) |
| 5 Years | 152 (12.9%) | 60 (4.7%) |
| 6 to 11 Years | 1,190 (15.4%) | 946 (12.0%) |
| 12 to 14 Years | 283 (6.7%) | 277 (8.0%) |
| 15 Years | 57 (4.6%) | 151 (14.6%) |
| 16 and 17 Years | 349 (13.7%) | 254 (9.8%) |
| 18 to 24 Years | 938 (11.4%) | 1,855 (22.3%) |
| 25 to 34 Years | 1,097 (7.0%) | 1,645 (11.4%) |
| 35 to 44 Years | 581 (4.2%) | 1,030 (7.9%) |
| 45 to 54 Years | 735 (6.9%) | 825 (8.2%) |
| 55 to 64 Years | 980 (9.2%) | 1,017 (9.1%) |
| 65 to 74 Years | 592 (7.4%) | 611 (7.3%) |
| 75 Years and over | 253 (7.1%) | 538 (10.0%) |
| Total | 8,468 (8.9%) | 9,855 (10.5%) |
Income Above Poverty by Sex and Age in Sioux Falls
According to the poverty statistics in Sioux Falls, males aged 35 to 44 years and females aged 5 years are the age groups that are most secure financially, with 95.8% of males and 95.3% of females in these age groups living above the poverty line.
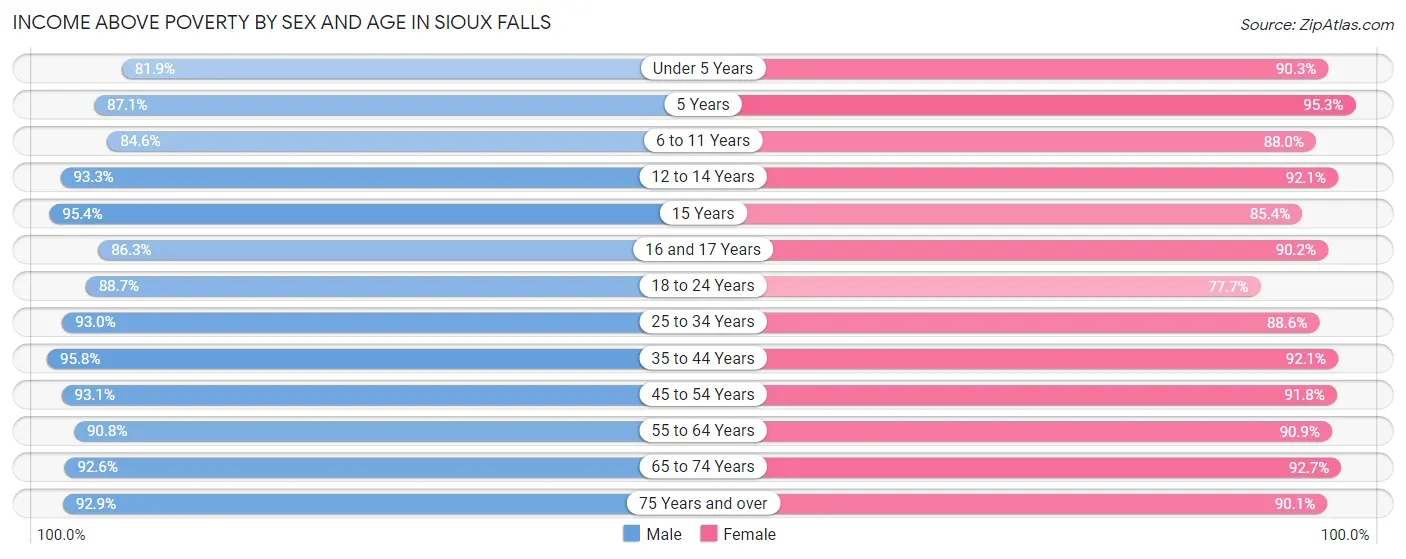
| Age Bracket | Male | Female |
| Under 5 Years | 5,721 (81.9%) | 5,990 (90.3%) |
| 5 Years | 1,026 (87.1%) | 1,218 (95.3%) |
| 6 to 11 Years | 6,551 (84.6%) | 6,926 (88.0%) |
| 12 to 14 Years | 3,964 (93.3%) | 3,207 (92.0%) |
| 15 Years | 1,181 (95.4%) | 884 (85.4%) |
| 16 and 17 Years | 2,204 (86.3%) | 2,339 (90.2%) |
| 18 to 24 Years | 7,327 (88.6%) | 6,464 (77.7%) |
| 25 to 34 Years | 14,577 (93.0%) | 12,745 (88.6%) |
| 35 to 44 Years | 13,324 (95.8%) | 11,962 (92.1%) |
| 45 to 54 Years | 9,972 (93.1%) | 9,282 (91.8%) |
| 55 to 64 Years | 9,704 (90.8%) | 10,191 (90.9%) |
| 65 to 74 Years | 7,383 (92.6%) | 7,714 (92.7%) |
| 75 Years and over | 3,311 (92.9%) | 4,868 (90.0%) |
| Total | 86,245 (91.1%) | 83,790 (89.5%) |
Income Below Poverty Among Married-Couple Families in Sioux Falls
The poverty statistics for married-couple families in Sioux Falls show that 2.9% or 1,027 of the total 35,669 families live below the poverty line. Families with 5 or more children have the highest poverty rate of 16.7%, comprising of 72 families. On the other hand, families with 1 or 2 children have the lowest poverty rate of 1.5%, which includes 183 families.
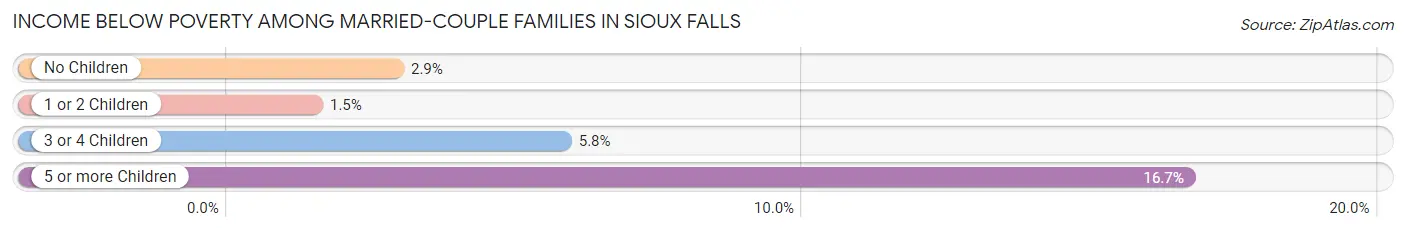
| Children | Above Poverty | Below Poverty |
| No Children | 18,509 (97.1%) | 550 (2.9%) |
| 1 or 2 Children | 12,171 (98.5%) | 183 (1.5%) |
| 3 or 4 Children | 3,602 (94.2%) | 222 (5.8%) |
| 5 or more Children | 360 (83.3%) | 72 (16.7%) |
| Total | 34,642 (97.1%) | 1,027 (2.9%) |
Income Below Poverty Among Single-Parent Households in Sioux Falls
According to the poverty data in Sioux Falls, 9.3% or 332 single-father households and 23.5% or 1,826 single-mother households are living below the poverty line. Among single-father households, those with 3 or 4 children have the highest poverty rate, with 99 households (34.4%) experiencing poverty. Likewise, among single-mother households, those with 5 or more children have the highest poverty rate, with 110 households (60.4%) falling below the poverty line.
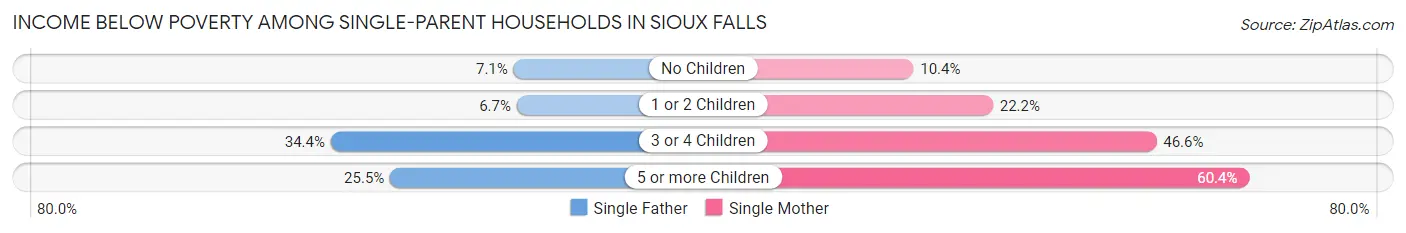
| Children | Single Father | Single Mother |
| No Children | 96 (7.1%) | 190 (10.4%) |
| 1 or 2 Children | 125 (6.7%) | 1,049 (22.2%) |
| 3 or 4 Children | 99 (34.4%) | 477 (46.6%) |
| 5 or more Children | 12 (25.5%) | 110 (60.4%) |
| Total | 332 (9.3%) | 1,826 (23.5%) |
Income Below Poverty Among Married-Couple vs Single-Parent Households in Sioux Falls
The poverty data for Sioux Falls shows that 1,027 of the married-couple family households (2.9%) and 2,158 of the single-parent households (19.1%) are living below the poverty level. Within the married-couple family households, those with 5 or more children have the highest poverty rate, with 72 households (16.7%) falling below the poverty line. Among the single-parent households, those with 5 or more children have the highest poverty rate, with 122 household (53.3%) living below poverty.
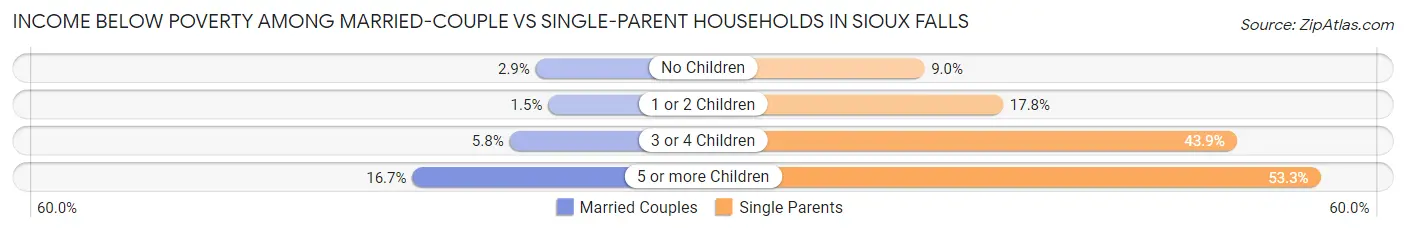
| Children | Married-Couple Families | Single-Parent Households |
| No Children | 550 (2.9%) | 286 (9.0%) |
| 1 or 2 Children | 183 (1.5%) | 1,174 (17.8%) |
| 3 or 4 Children | 222 (5.8%) | 576 (43.9%) |
| 5 or more Children | 72 (16.7%) | 122 (53.3%) |
| Total | 1,027 (2.9%) | 2,158 (19.1%) |
Race in Sioux Falls
The most populous races in Sioux Falls are White / Caucasian (157,122 | 81.2%), Black / African American (13,172 | 6.8%), and Two or more Races (11,869 | 6.1%).
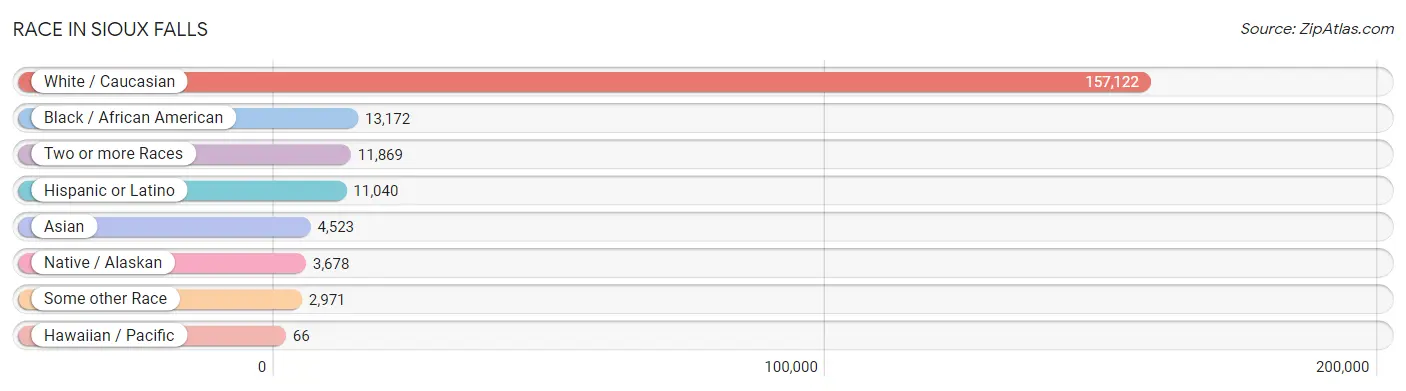
| Race | # Population | % Population |
| Asian | 4,523 | 2.3% |
| Black / African American | 13,172 | 6.8% |
| Hawaiian / Pacific | 66 | 0.0% |
| Hispanic or Latino | 11,040 | 5.7% |
| Native / Alaskan | 3,678 | 1.9% |
| White / Caucasian | 157,122 | 81.2% |
| Two or more Races | 11,869 | 6.1% |
| Some other Race | 2,971 | 1.5% |
| Total | 193,401 | 100.0% |
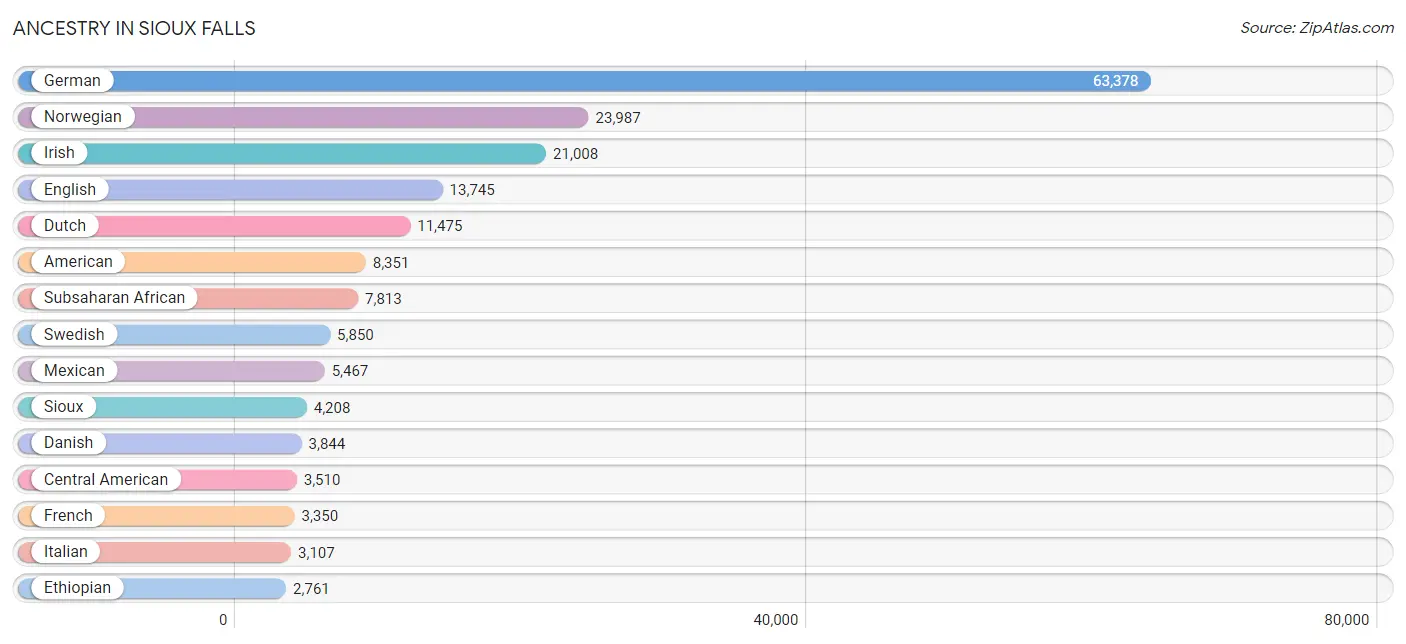
Ancestry in Sioux Falls
The most populous ancestries reported in Sioux Falls are German (63,378 | 32.8%), Norwegian (23,987 | 12.4%), Irish (21,008 | 10.9%), English (13,745 | 7.1%), and Dutch (11,475 | 5.9%), together accounting for 69.1% of all Sioux Falls residents.
| Ancestry | # Population | % Population |
| Afghan | 166 | 0.1% |
| African | 2,395 | 1.2% |
| Albanian | 126 | 0.1% |
| American | 8,351 | 4.3% |
| Apache | 31 | 0.0% |
| Arab | 930 | 0.5% |
| Armenian | 73 | 0.0% |
| Australian | 22 | 0.0% |
| Austrian | 354 | 0.2% |
| Basque | 13 | 0.0% |
| Belgian | 535 | 0.3% |
| Bermudan | 51 | 0.0% |
| Bhutanese | 398 | 0.2% |
| Blackfeet | 122 | 0.1% |
| Bolivian | 50 | 0.0% |
| British | 481 | 0.3% |
| Bulgarian | 8 | 0.0% |
| Burmese | 871 | 0.4% |
| Canadian | 129 | 0.1% |
| Carpatho Rusyn | 3 | 0.0% |
| Celtic | 52 | 0.0% |
| Central American | 3,510 | 1.8% |
| Central American Indian | 31 | 0.0% |
| Cherokee | 253 | 0.1% |
| Cheyenne | 31 | 0.0% |
| Chilean | 56 | 0.0% |
| Chippewa | 30 | 0.0% |
| Colombian | 105 | 0.1% |
| Costa Rican | 5 | 0.0% |
| Creek | 28 | 0.0% |
| Croatian | 114 | 0.1% |
| Cuban | 140 | 0.1% |
| Cypriot | 6 | 0.0% |
| Czech | 2,559 | 1.3% |
| Czechoslovakian | 85 | 0.0% |
| Danish | 3,844 | 2.0% |
| Dominican | 198 | 0.1% |
| Dutch | 11,475 | 5.9% |
| Eastern European | 208 | 0.1% |
| Ecuadorian | 7 | 0.0% |
| Egyptian | 52 | 0.0% |
| English | 13,745 | 7.1% |
| Ethiopian | 2,761 | 1.4% |
| European | 2,226 | 1.1% |
| Finnish | 615 | 0.3% |
| French | 3,350 | 1.7% |
| French American Indian | 40 | 0.0% |
| French Canadian | 400 | 0.2% |
| German | 63,378 | 32.8% |
| German Russian | 15 | 0.0% |
| Greek | 452 | 0.2% |
| Guamanian / Chamorro | 69 | 0.0% |
| Guatemalan | 1,606 | 0.8% |
| Haitian | 30 | 0.0% |
| Honduran | 148 | 0.1% |
| Hungarian | 93 | 0.1% |
| Icelander | 24 | 0.0% |
| Indian (Asian) | 464 | 0.2% |
| Indonesian | 25 | 0.0% |
| Inupiat | 44 | 0.0% |
| Iranian | 15 | 0.0% |
| Iraqi | 86 | 0.0% |
| Irish | 21,008 | 10.9% |
| Iroquois | 54 | 0.0% |
| Italian | 3,107 | 1.6% |
| Jamaican | 36 | 0.0% |
| Japanese | 138 | 0.1% |
| Jordanian | 13 | 0.0% |
| Kenyan | 18 | 0.0% |
| Korean | 599 | 0.3% |
| Laotian | 43 | 0.0% |
| Latvian | 21 | 0.0% |
| Lebanese | 303 | 0.2% |
| Liberian | 978 | 0.5% |
| Lithuanian | 21 | 0.0% |
| Luxembourger | 178 | 0.1% |
| Malaysian | 278 | 0.1% |
| Maltese | 10 | 0.0% |
| Menominee | 2 | 0.0% |
| Mexican | 5,467 | 2.8% |
| Mexican American Indian | 18 | 0.0% |
| Mongolian | 7 | 0.0% |
| Moroccan | 39 | 0.0% |
| Native Hawaiian | 130 | 0.1% |
| Navajo | 10 | 0.0% |
| Nicaraguan | 26 | 0.0% |
| Nigerian | 24 | 0.0% |
| Northern European | 504 | 0.3% |
| Norwegian | 23,987 | 12.4% |
| Pakistani | 125 | 0.1% |
| Palestinian | 13 | 0.0% |
| Pennsylvania German | 43 | 0.0% |
| Peruvian | 21 | 0.0% |
| Polish | 2,617 | 1.3% |
| Portuguese | 248 | 0.1% |
| Puerto Rican | 492 | 0.3% |
| Romanian | 15 | 0.0% |
| Russian | 1,228 | 0.6% |
| Salvadoran | 1,725 | 0.9% |
| Scandinavian | 2,404 | 1.2% |
| Scotch-Irish | 812 | 0.4% |
| Scottish | 1,585 | 0.8% |
| Serbian | 165 | 0.1% |
| Shoshone | 26 | 0.0% |
| Sioux | 4,208 | 2.2% |
| Slavic | 47 | 0.0% |
| Slovak | 223 | 0.1% |
| Slovene | 18 | 0.0% |
| Somali | 469 | 0.2% |
| South American | 276 | 0.1% |
| Spaniard | 116 | 0.1% |
| Spanish | 146 | 0.1% |
| Sri Lankan | 459 | 0.2% |
| Subsaharan African | 7,813 | 4.0% |
| Sudanese | 706 | 0.4% |
| Swedish | 5,850 | 3.0% |
| Swiss | 743 | 0.4% |
| Syrian | 18 | 0.0% |
| Thai | 1,635 | 0.9% |
| Ugandan | 7 | 0.0% |
| Ukrainian | 1,030 | 0.5% |
| Venezuelan | 37 | 0.0% |
| Welsh | 589 | 0.3% |
| West Indian | 423 | 0.2% |
| Yugoslavian | 406 | 0.2% | View All 125 Rows |
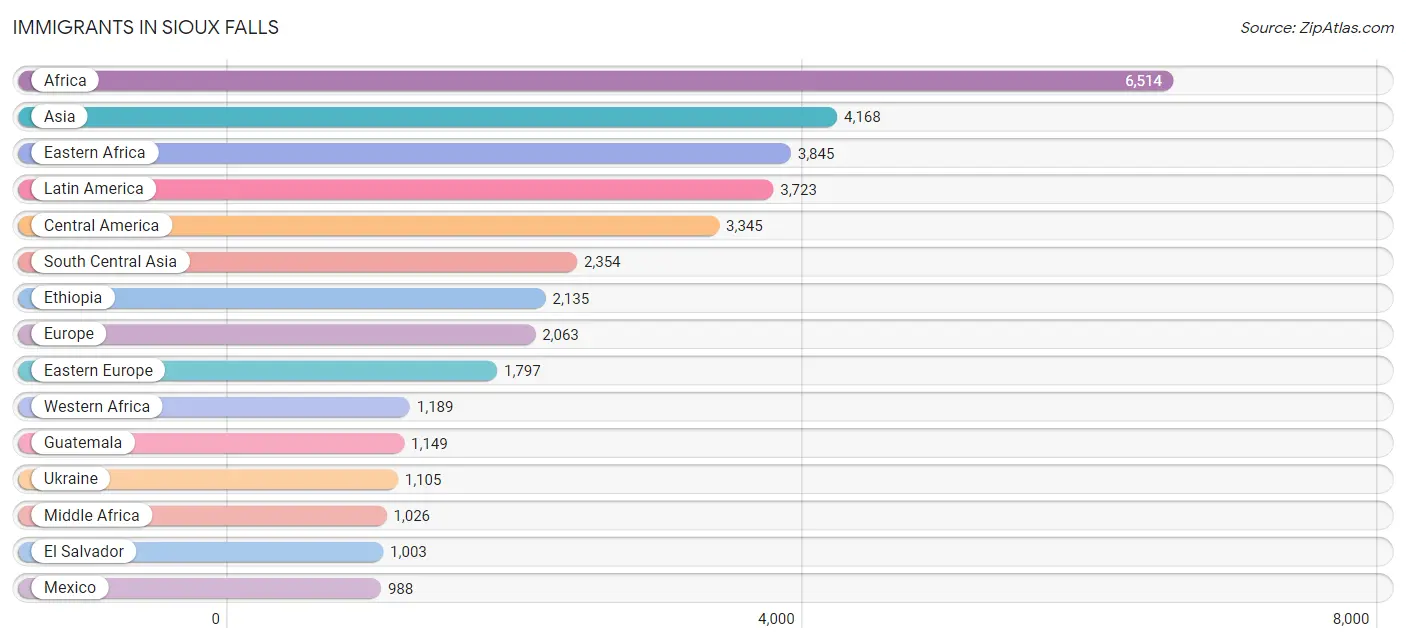
Immigrants in Sioux Falls
The most numerous immigrant groups reported in Sioux Falls came from Africa (6,514 | 3.4%), Asia (4,168 | 2.2%), Eastern Africa (3,845 | 2.0%), Latin America (3,723 | 1.9%), and Central America (3,345 | 1.7%), together accounting for 11.2% of all Sioux Falls residents.
| Immigration Origin | # Population | % Population |
| Afghanistan | 114 | 0.1% |
| Africa | 6,514 | 3.4% |
| Albania | 88 | 0.1% |
| Asia | 4,168 | 2.2% |
| Australia | 13 | 0.0% |
| Austria | 12 | 0.0% |
| Bangladesh | 22 | 0.0% |
| Belarus | 7 | 0.0% |
| Bolivia | 15 | 0.0% |
| Bosnia and Herzegovina | 70 | 0.0% |
| Brazil | 12 | 0.0% |
| Cambodia | 161 | 0.1% |
| Canada | 259 | 0.1% |
| Caribbean | 131 | 0.1% |
| Central America | 3,345 | 1.7% |
| Chile | 18 | 0.0% |
| China | 267 | 0.1% |
| Colombia | 53 | 0.0% |
| Congo | 405 | 0.2% |
| Costa Rica | 5 | 0.0% |
| Croatia | 119 | 0.1% |
| Cuba | 39 | 0.0% |
| Dominican Republic | 29 | 0.0% |
| Eastern Africa | 3,845 | 2.0% |
| Eastern Asia | 679 | 0.4% |
| Eastern Europe | 1,797 | 0.9% |
| Ecuador | 111 | 0.1% |
| Egypt | 114 | 0.1% |
| El Salvador | 1,003 | 0.5% |
| England | 17 | 0.0% |
| Eritrea | 856 | 0.4% |
| Ethiopia | 2,135 | 1.1% |
| Europe | 2,063 | 1.1% |
| France | 6 | 0.0% |
| Germany | 68 | 0.0% |
| Greece | 6 | 0.0% |
| Guatemala | 1,149 | 0.6% |
| Haiti | 11 | 0.0% |
| Honduras | 91 | 0.1% |
| Hong Kong | 14 | 0.0% |
| India | 791 | 0.4% |
| Indonesia | 31 | 0.0% |
| Iran | 15 | 0.0% |
| Iraq | 239 | 0.1% |
| Ireland | 5 | 0.0% |
| Israel | 13 | 0.0% |
| Japan | 75 | 0.0% |
| Jordan | 13 | 0.0% |
| Kazakhstan | 25 | 0.0% |
| Kenya | 117 | 0.1% |
| Korea | 337 | 0.2% |
| Laos | 137 | 0.1% |
| Latin America | 3,723 | 1.9% |
| Latvia | 4 | 0.0% |
| Lebanon | 19 | 0.0% |
| Liberia | 977 | 0.5% |
| Malaysia | 36 | 0.0% |
| Mexico | 988 | 0.5% |
| Middle Africa | 1,026 | 0.5% |
| Moldova | 30 | 0.0% |
| Morocco | 37 | 0.0% |
| Nepal | 925 | 0.5% |
| Netherlands | 16 | 0.0% |
| Nicaragua | 26 | 0.0% |
| Nigeria | 102 | 0.1% |
| Northern Africa | 424 | 0.2% |
| Northern Europe | 128 | 0.1% |
| Norway | 24 | 0.0% |
| Oceania | 35 | 0.0% |
| Pakistan | 26 | 0.0% |
| Panama | 83 | 0.0% |
| Peru | 17 | 0.0% |
| Philippines | 198 | 0.1% |
| Romania | 12 | 0.0% |
| Russia | 120 | 0.1% |
| Scotland | 18 | 0.0% |
| Serbia | 21 | 0.0% |
| Somalia | 124 | 0.1% |
| South Africa | 16 | 0.0% |
| South America | 247 | 0.1% |
| South Central Asia | 2,354 | 1.2% |
| South Eastern Asia | 827 | 0.4% |
| Southern Europe | 36 | 0.0% |
| Sudan | 254 | 0.1% |
| Thailand | 94 | 0.1% |
| Uganda | 56 | 0.0% |
| Ukraine | 1,105 | 0.6% |
| Venezuela | 21 | 0.0% |
| Vietnam | 81 | 0.0% |
| Western Africa | 1,189 | 0.6% |
| Western Asia | 295 | 0.2% |
| Western Europe | 102 | 0.1% |
| Zaire | 621 | 0.3% |
| Zimbabwe | 18 | 0.0% | View All 94 Rows |
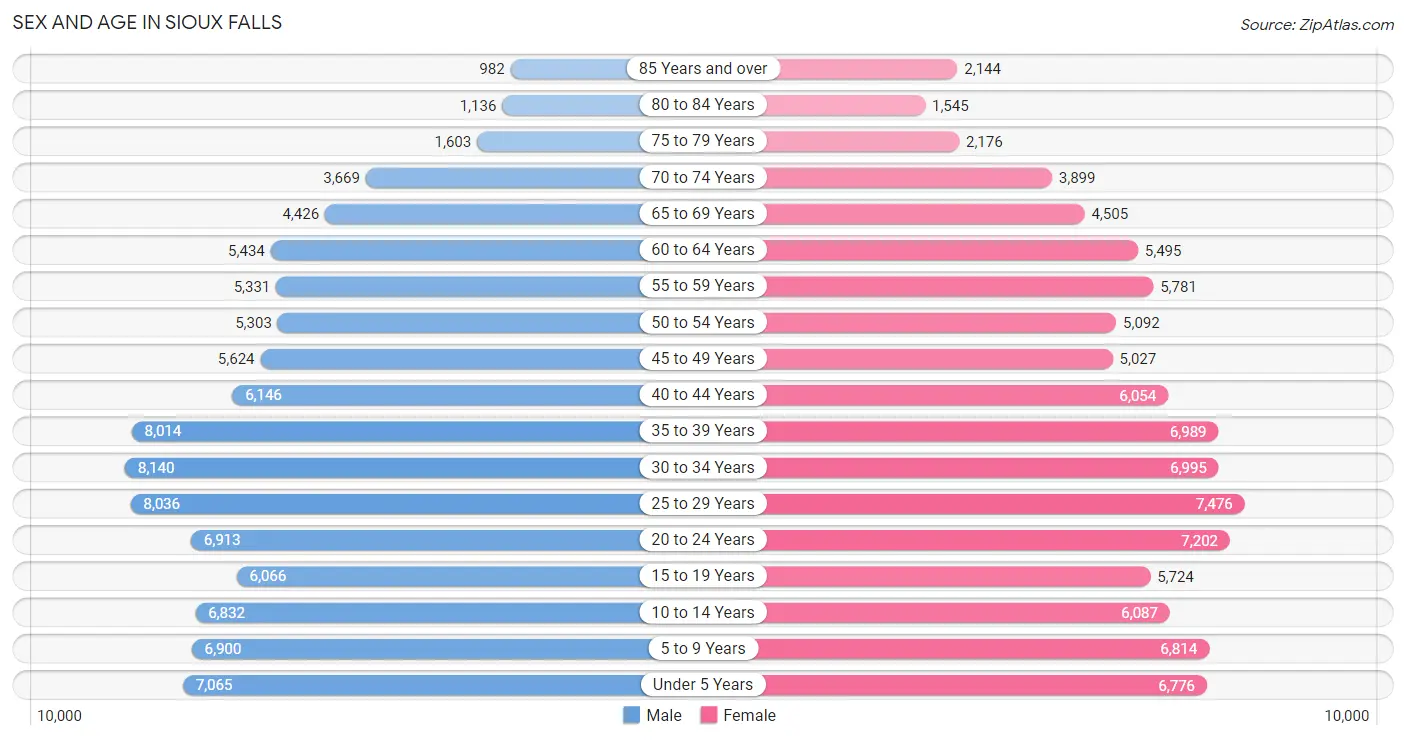
Sex and Age in Sioux Falls
Sex and Age in Sioux Falls
The most populous age groups in Sioux Falls are 30 to 34 Years (8,140 | 8.3%) for men and 25 to 29 Years (7,476 | 7.8%) for women.
| Age Bracket | Male | Female |
| Under 5 Years | 7,065 (7.2%) | 6,776 (7.1%) |
| 5 to 9 Years | 6,900 (7.1%) | 6,814 (7.1%) |
| 10 to 14 Years | 6,832 (7.0%) | 6,087 (6.4%) |
| 15 to 19 Years | 6,066 (6.2%) | 5,724 (6.0%) |
| 20 to 24 Years | 6,913 (7.1%) | 7,202 (7.5%) |
| 25 to 29 Years | 8,036 (8.2%) | 7,476 (7.8%) |
| 30 to 34 Years | 8,140 (8.3%) | 6,995 (7.3%) |
| 35 to 39 Years | 8,014 (8.2%) | 6,989 (7.3%) |
| 40 to 44 Years | 6,146 (6.3%) | 6,054 (6.3%) |
| 45 to 49 Years | 5,624 (5.8%) | 5,027 (5.2%) |
| 50 to 54 Years | 5,303 (5.4%) | 5,092 (5.3%) |
| 55 to 59 Years | 5,331 (5.5%) | 5,781 (6.0%) |
| 60 to 64 Years | 5,434 (5.6%) | 5,495 (5.7%) |
| 65 to 69 Years | 4,426 (4.5%) | 4,505 (4.7%) |
| 70 to 74 Years | 3,669 (3.8%) | 3,899 (4.1%) |
| 75 to 79 Years | 1,603 (1.6%) | 2,176 (2.3%) |
| 80 to 84 Years | 1,136 (1.2%) | 1,545 (1.6%) |
| 85 Years and over | 982 (1.0%) | 2,144 (2.2%) |
| Total | 97,620 (100.0%) | 95,781 (100.0%) |
Families and Households in Sioux Falls
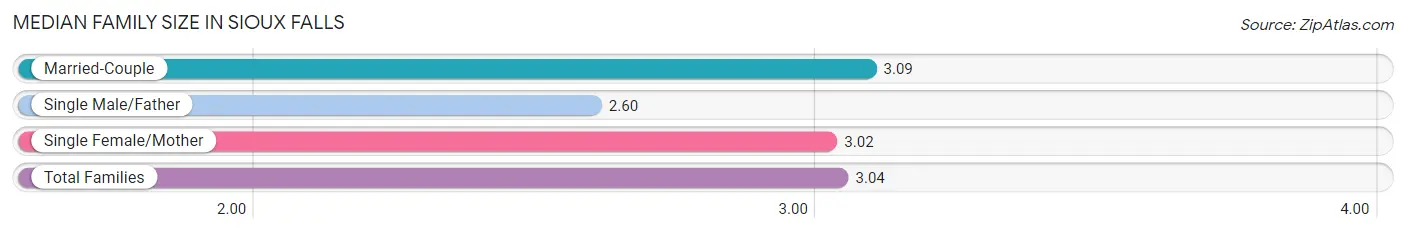
Median Family Size in Sioux Falls
The median family size in Sioux Falls is 3.04 persons per family, with married-couple families (35,669 | 75.9%) accounting for the largest median family size of 3.09 persons per family. On the other hand, single male/father families (3,559 | 7.6%) represent the smallest median family size with 2.60 persons per family.
| Family Type | # Families | Family Size |
| Married-Couple | 35,669 (75.9%) | 3.09 |
| Single Male/Father | 3,559 (7.6%) | 2.60 |
| Single Female/Mother | 7,758 (16.5%) | 3.02 |
| Total Families | 46,986 (100.0%) | 3.04 |
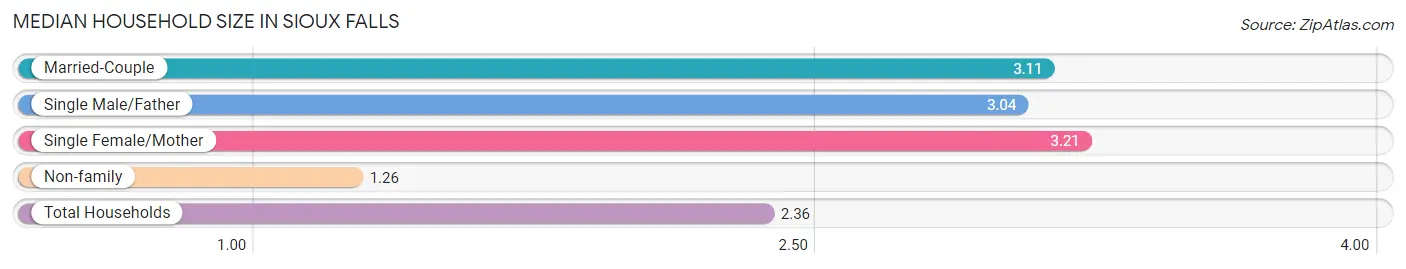
Median Household Size in Sioux Falls
The median household size in Sioux Falls is 2.36 persons per household, with single female/mother households (7,758 | 9.7%) accounting for the largest median household size of 3.21 persons per household. non-family households (32,767 | 41.1%) represent the smallest median household size with 1.26 persons per household.
| Household Type | # Households | Household Size |
| Married-Couple | 35,669 (44.7%) | 3.11 |
| Single Male/Father | 3,559 (4.5%) | 3.04 |
| Single Female/Mother | 7,758 (9.7%) | 3.21 |
| Non-family | 32,767 (41.1%) | 1.26 |
| Total Households | 79,753 (100.0%) | 2.36 |
Household Size by Marriage Status in Sioux Falls
Out of a total of 79,753 households in Sioux Falls, 46,986 (58.9%) are family households, while 32,767 (41.1%) are nonfamily households. The most numerous type of family households are 2-person households, comprising 21,205, and the most common type of nonfamily households are 1-person households, comprising 26,082.
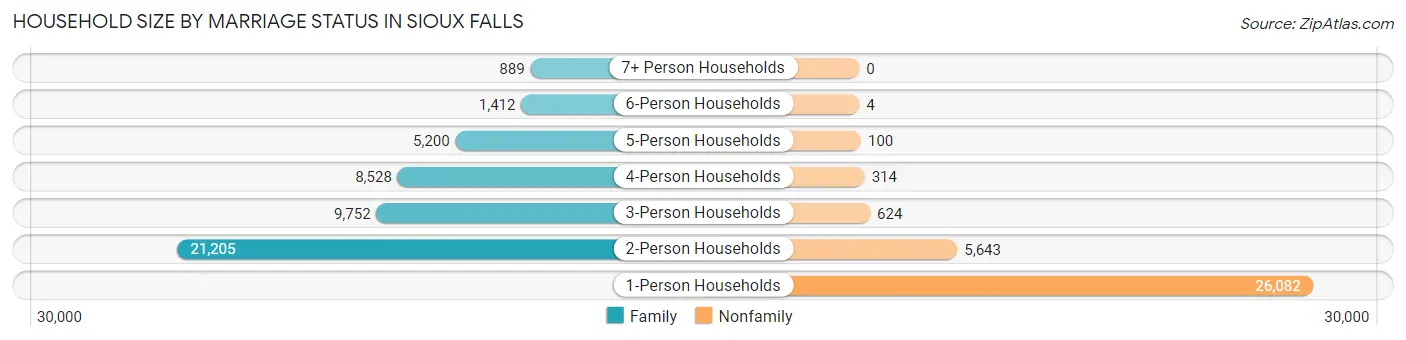
| Household Size | Family Households | Nonfamily Households |
| 1-Person Households | - | 26,082 (32.7%) |
| 2-Person Households | 21,205 (26.6%) | 5,643 (7.1%) |
| 3-Person Households | 9,752 (12.2%) | 624 (0.8%) |
| 4-Person Households | 8,528 (10.7%) | 314 (0.4%) |
| 5-Person Households | 5,200 (6.5%) | 100 (0.1%) |
| 6-Person Households | 1,412 (1.8%) | 4 (0.0%) |
| 7+ Person Households | 889 (1.1%) | 0 (0.0%) |
| Total | 46,986 (58.9%) | 32,767 (41.1%) |
Female Fertility in Sioux Falls
Fertility by Age in Sioux Falls
Average fertility rate in Sioux Falls is 66.0 births per 1,000 women. Women in the age bracket of 20 to 34 years have the highest fertility rate with 100.0 births per 1,000 women. Women in the age bracket of 20 to 34 years acount for 71.0% of all women with births.
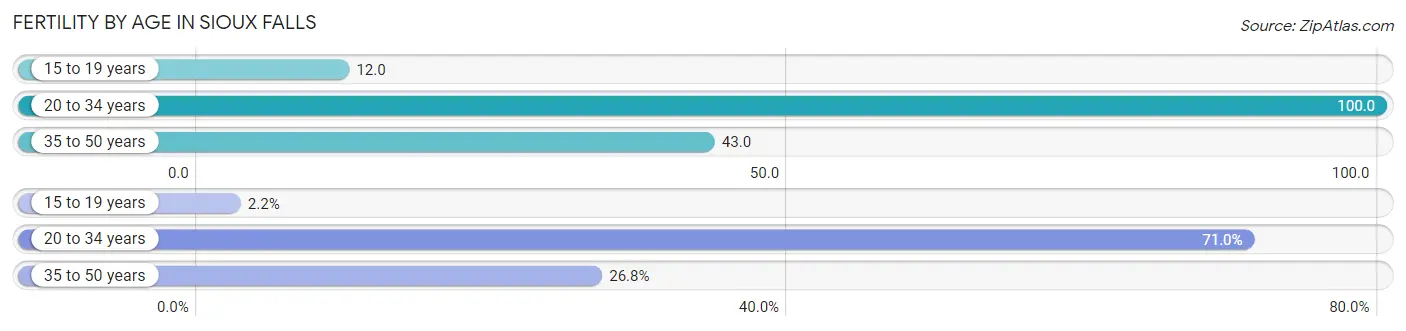
| Age Bracket | Women with Births | Births / 1,000 Women |
| 15 to 19 years | 68 (2.2%) | 12.0 |
| 20 to 34 years | 2,168 (71.0%) | 100.0 |
| 35 to 50 years | 817 (26.8%) | 43.0 |
| Total | 3,053 (100.0%) | 66.0 |
Fertility by Age by Marriage Status in Sioux Falls
76.6% of women with births (3,053) in Sioux Falls are married. The highest percentage of unmarried women with births falls into 15 to 19 years age bracket with 66.2% of them unmarried at the time of birth, while the lowest percentage of unmarried women with births belong to 35 to 50 years age bracket with 10.4% of them unmarried.
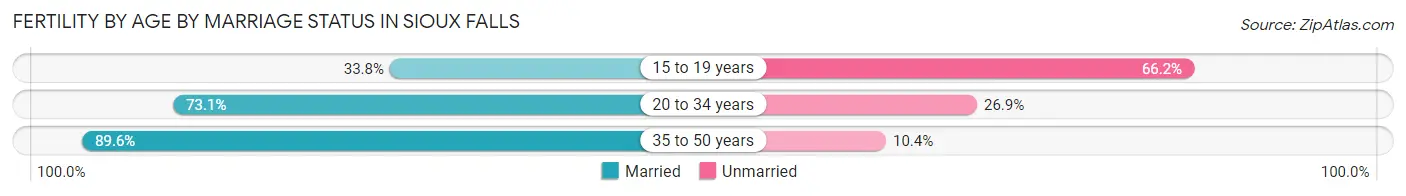
| Age Bracket | Married | Unmarried |
| 15 to 19 years | 23 (33.8%) | 45 (66.2%) |
| 20 to 34 years | 1,585 (73.1%) | 583 (26.9%) |
| 35 to 50 years | 732 (89.6%) | 85 (10.4%) |
| Total | 2,339 (76.6%) | 714 (23.4%) |
Fertility by Education in Sioux Falls
Average fertility rate in Sioux Falls is 66.0 births per 1,000 women. Women with the education attainment of bachelor's degree have the highest fertility rate of 84.0 births per 1,000 women, while women with the education attainment of less than high school have the lowest fertility at 39.0 births per 1,000 women. Women with the education attainment of bachelor's degree represent 32.7% of all women with births.
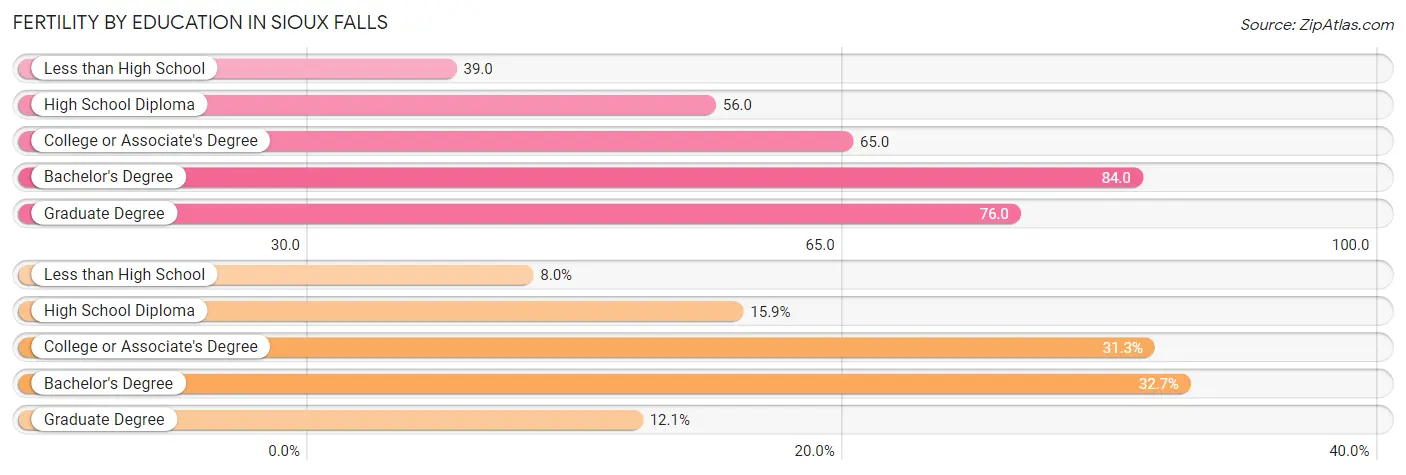
| Educational Attainment | Women with Births | Births / 1,000 Women |
| Less than High School | 245 (8.0%) | 39.0 |
| High School Diploma | 485 (15.9%) | 56.0 |
| College or Associate's Degree | 956 (31.3%) | 65.0 |
| Bachelor's Degree | 997 (32.7%) | 84.0 |
| Graduate Degree | 370 (12.1%) | 76.0 |
| Total | 3,053 (100.0%) | 66.0 |
Fertility by Education by Marriage Status in Sioux Falls
23.4% of women with births in Sioux Falls are unmarried. Women with the educational attainment of graduate degree are most likely to be married with 100.0% of them married at childbirth, while women with the educational attainment of less than high school are least likely to be married with 39.6% of them unmarried at childbirth.
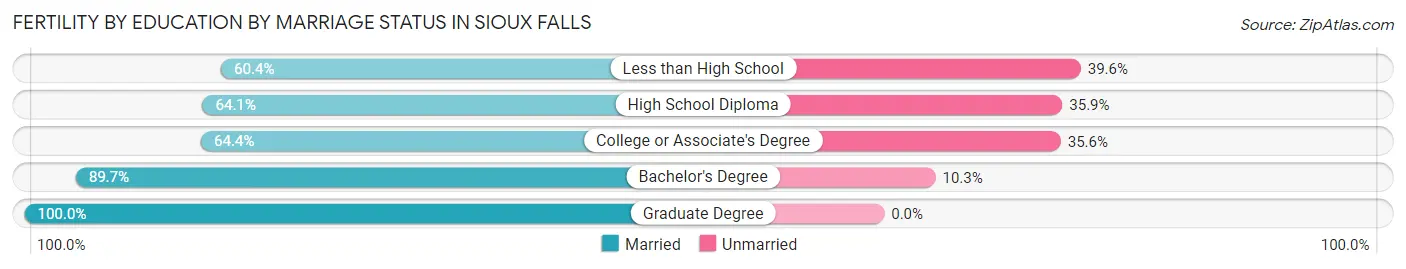
| Educational Attainment | Married | Unmarried |
| Less than High School | 148 (60.4%) | 97 (39.6%) |
| High School Diploma | 311 (64.1%) | 174 (35.9%) |
| College or Associate's Degree | 616 (64.4%) | 340 (35.6%) |
| Bachelor's Degree | 894 (89.7%) | 103 (10.3%) |
| Graduate Degree | 370 (100.0%) | 0 (0.0%) |
| Total | 2,339 (76.6%) | 714 (23.4%) |
Employment Characteristics in Sioux Falls
Employment by Class of Employer in Sioux Falls
Among the 107,288 employed individuals in Sioux Falls, private company employees (74,420 | 69.4%), not-for-profit organizations (16,358 | 15.2%), and local government employees (4,499 | 4.2%) make up the most common classes of employment.
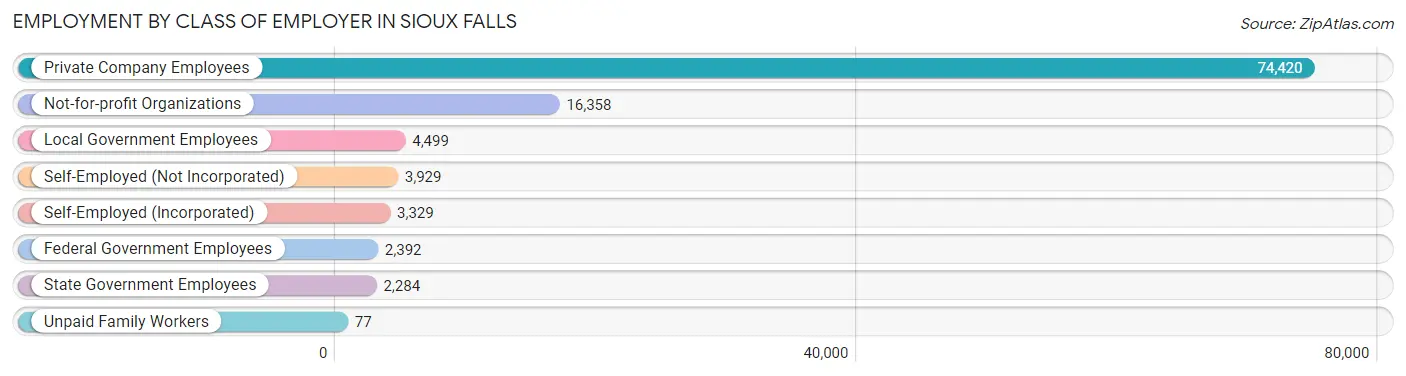
| Employer Class | # Employees | % Employees |
| Private Company Employees | 74,420 | 69.4% |
| Self-Employed (Incorporated) | 3,329 | 3.1% |
| Self-Employed (Not Incorporated) | 3,929 | 3.7% |
| Not-for-profit Organizations | 16,358 | 15.2% |
| Local Government Employees | 4,499 | 4.2% |
| State Government Employees | 2,284 | 2.1% |
| Federal Government Employees | 2,392 | 2.2% |
| Unpaid Family Workers | 77 | 0.1% |
| Total | 107,288 | 100.0% |
Employment Status by Age in Sioux Falls
According to the labor force statistics for Sioux Falls, out of the total population over 16 years of age (150,648), 74.2% or 111,781 individuals are in the labor force, with 2.3% or 2,571 of them unemployed. The age group with the highest labor force participation rate is 30 to 34 years, with 92.2% or 13,954 individuals in the labor force. Within the labor force, the 16 to 19 years age range has the highest percentage of unemployed individuals, with 7.5% or 394 of them being unemployed.
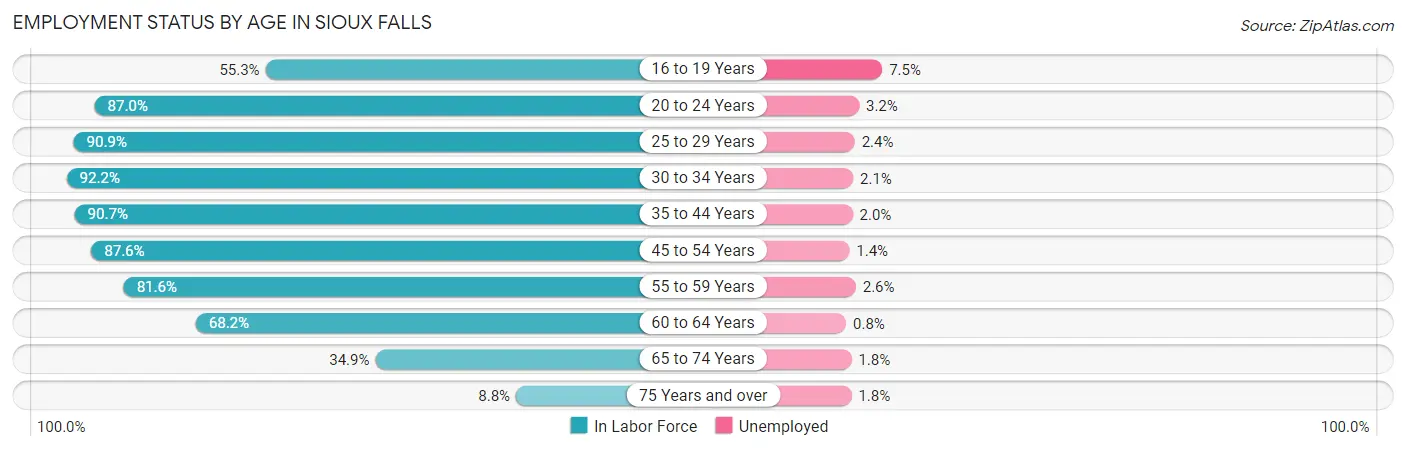
| Age Bracket | In Labor Force | Unemployed |
| 16 to 19 Years | 5,260 (55.3%) | 394 (7.5%) |
| 20 to 24 Years | 12,280 (87.0%) | 393 (3.2%) |
| 25 to 29 Years | 14,100 (90.9%) | 338 (2.4%) |
| 30 to 34 Years | 13,954 (92.2%) | 293 (2.1%) |
| 35 to 44 Years | 24,673 (90.7%) | 493 (2.0%) |
| 45 to 54 Years | 18,436 (87.6%) | 258 (1.4%) |
| 55 to 59 Years | 9,067 (81.6%) | 236 (2.6%) |
| 60 to 64 Years | 7,454 (68.2%) | 60 (0.8%) |
| 65 to 74 Years | 5,758 (34.9%) | 104 (1.8%) |
| 75 Years and over | 844 (8.8%) | 15 (1.8%) |
| Total | 111,781 (74.2%) | 2,571 (2.3%) |
Employment Status by Educational Attainment in Sioux Falls
According to labor force statistics for Sioux Falls, 86.9% of individuals (87,714) out of the total population between 25 and 64 years of age (100,937) are in the labor force, with 1.9% or 1,667 of them being unemployed. The group with the highest labor force participation rate are those with the educational attainment of bachelor's degree or higher, with 91.8% or 35,386 individuals in the labor force. Within the labor force, individuals with less than high school education have the highest percentage of unemployment, with 8.1% or 425 of them being unemployed.
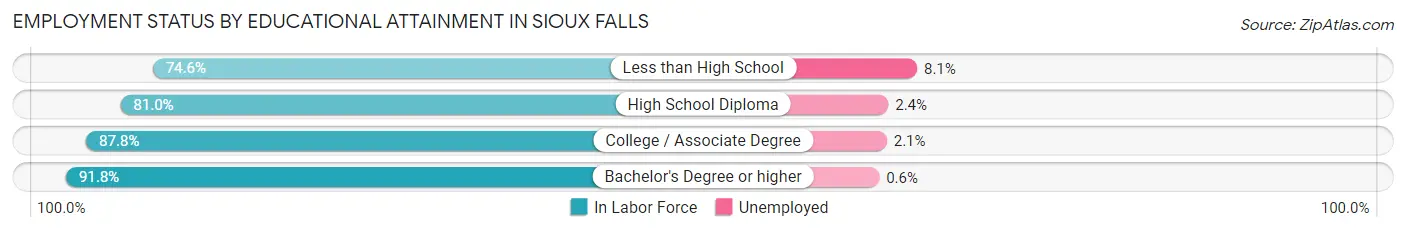
| Educational Attainment | In Labor Force | Unemployed |
| Less than High School | 5,241 (74.6%) | 569 (8.1%) |
| High School Diploma | 18,415 (81.0%) | 546 (2.4%) |
| College / Associate Degree | 28,649 (87.8%) | 685 (2.1%) |
| Bachelor's Degree or higher | 35,386 (91.8%) | 231 (0.6%) |
| Total | 87,714 (86.9%) | 1,918 (1.9%) |
Employment Occupations by Sex in Sioux Falls
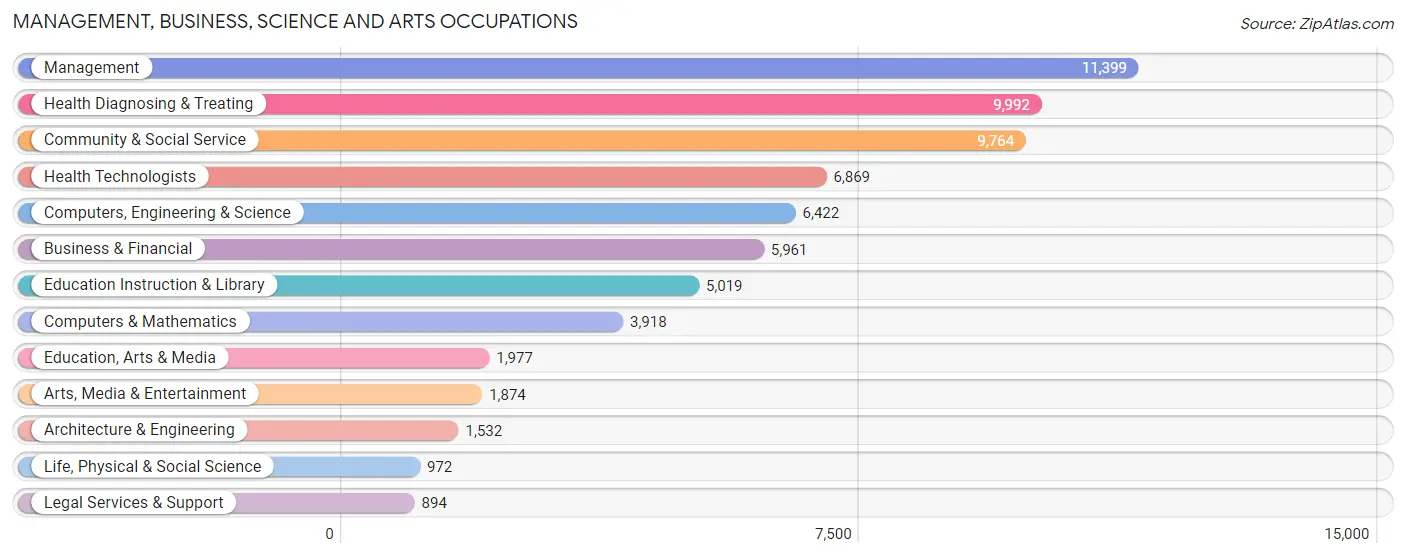
Management, Business, Science and Arts Occupations
The most common Management, Business, Science and Arts occupations in Sioux Falls are Management (11,399 | 10.5%), Health Diagnosing & Treating (9,992 | 9.2%), Community & Social Service (9,764 | 9.0%), Health Technologists (6,869 | 6.3%), and Computers, Engineering & Science (6,422 | 5.9%).
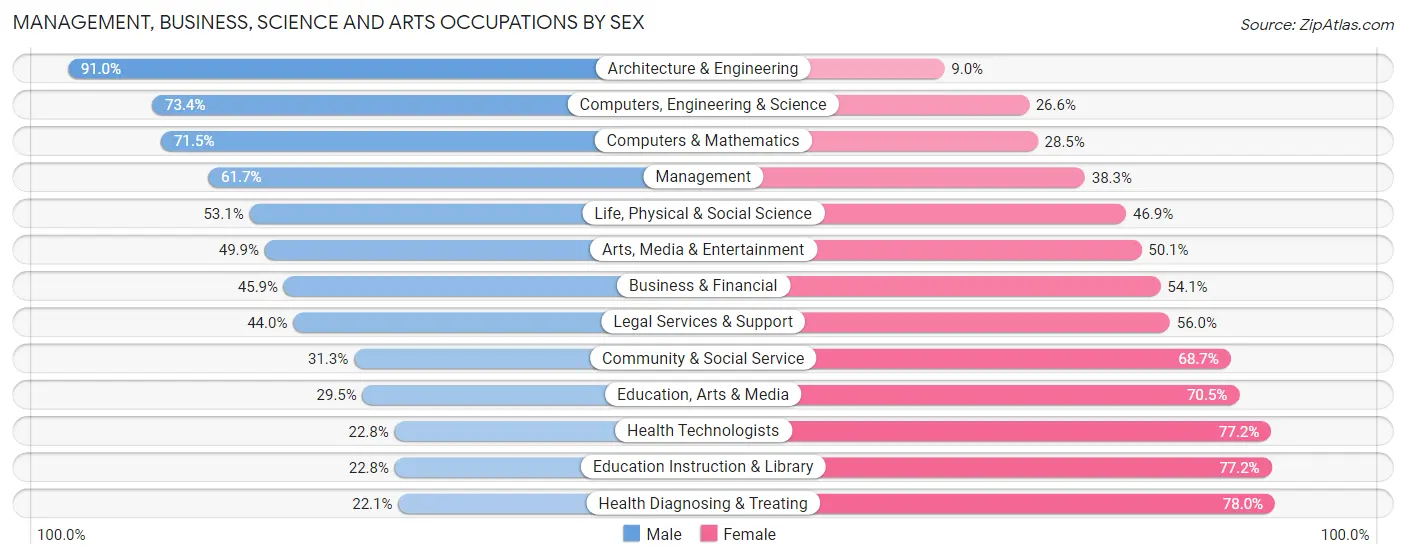
Management, Business, Science and Arts Occupations by Sex
Within the Management, Business, Science and Arts occupations in Sioux Falls, the most male-oriented occupations are Architecture & Engineering (91.0%), Computers, Engineering & Science (73.4%), and Computers & Mathematics (71.5%), while the most female-oriented occupations are Health Diagnosing & Treating (77.9%), Education Instruction & Library (77.2%), and Health Technologists (77.2%).
| Occupation | Male | Female |
| Management | 7,033 (61.7%) | 4,366 (38.3%) |
| Business & Financial | 2,737 (45.9%) | 3,224 (54.1%) |
| Computers, Engineering & Science | 4,713 (73.4%) | 1,709 (26.6%) |
| Computers & Mathematics | 2,803 (71.5%) | 1,115 (28.5%) |
| Architecture & Engineering | 1,394 (91.0%) | 138 (9.0%) |
| Life, Physical & Social Science | 516 (53.1%) | 456 (46.9%) |
| Community & Social Service | 3,054 (31.3%) | 6,710 (68.7%) |
| Education, Arts & Media | 583 (29.5%) | 1,394 (70.5%) |
| Legal Services & Support | 393 (44.0%) | 501 (56.0%) |
| Education Instruction & Library | 1,143 (22.8%) | 3,876 (77.2%) |
| Arts, Media & Entertainment | 935 (49.9%) | 939 (50.1%) |
| Health Diagnosing & Treating | 2,203 (22.1%) | 7,789 (77.9%) |
| Health Technologists | 1,568 (22.8%) | 5,301 (77.2%) |
| Total (Category) | 19,740 (45.3%) | 23,798 (54.7%) |
| Total (Overall) | 56,857 (52.2%) | 52,111 (47.8%) |
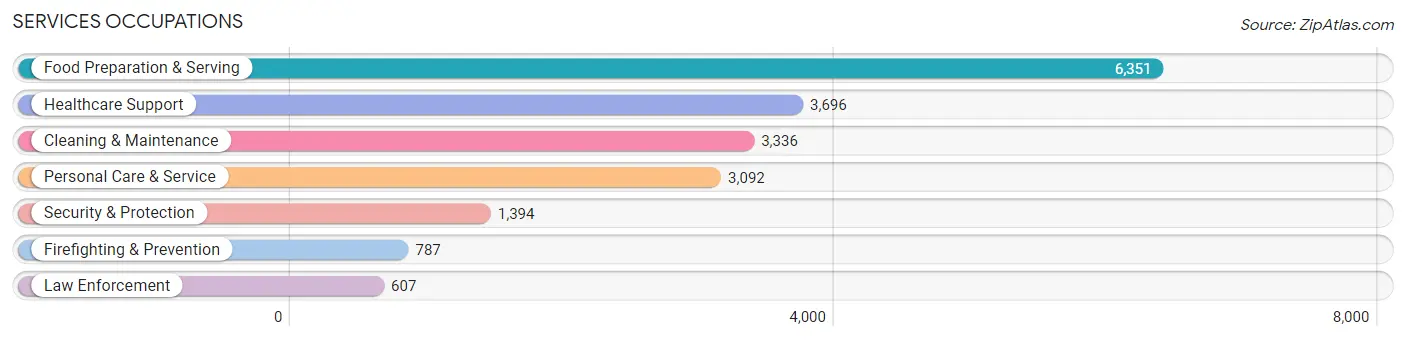
Services Occupations
The most common Services occupations in Sioux Falls are Food Preparation & Serving (6,351 | 5.8%), Healthcare Support (3,696 | 3.4%), Cleaning & Maintenance (3,336 | 3.1%), Personal Care & Service (3,092 | 2.8%), and Security & Protection (1,394 | 1.3%).
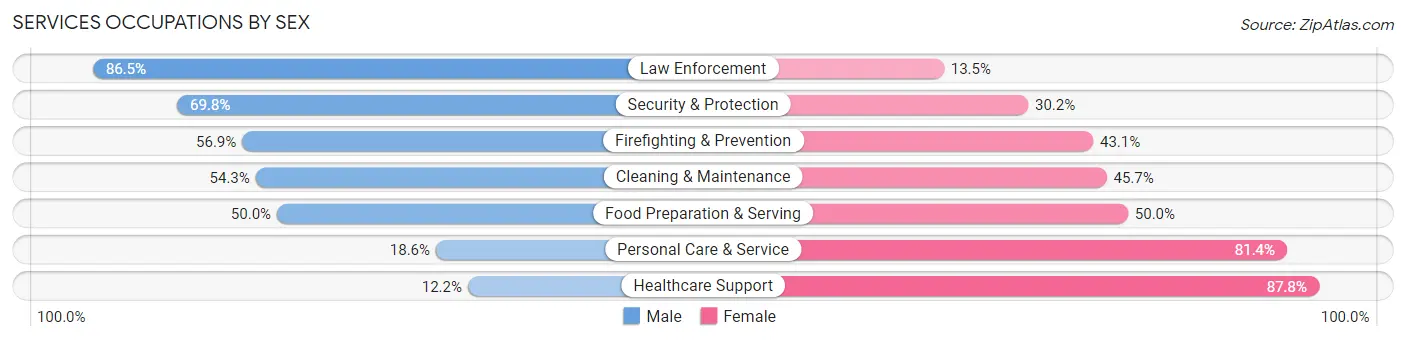
Services Occupations by Sex
Within the Services occupations in Sioux Falls, the most male-oriented occupations are Law Enforcement (86.5%), Security & Protection (69.8%), and Firefighting & Prevention (56.9%), while the most female-oriented occupations are Healthcare Support (87.8%), Personal Care & Service (81.4%), and Food Preparation & Serving (50.0%).
| Occupation | Male | Female |
| Healthcare Support | 452 (12.2%) | 3,244 (87.8%) |
| Security & Protection | 973 (69.8%) | 421 (30.2%) |
| Firefighting & Prevention | 448 (56.9%) | 339 (43.1%) |
| Law Enforcement | 525 (86.5%) | 82 (13.5%) |
| Food Preparation & Serving | 3,178 (50.0%) | 3,173 (50.0%) |
| Cleaning & Maintenance | 1,810 (54.3%) | 1,526 (45.7%) |
| Personal Care & Service | 574 (18.6%) | 2,518 (81.4%) |
| Total (Category) | 6,987 (39.1%) | 10,882 (60.9%) |
| Total (Overall) | 56,857 (52.2%) | 52,111 (47.8%) |
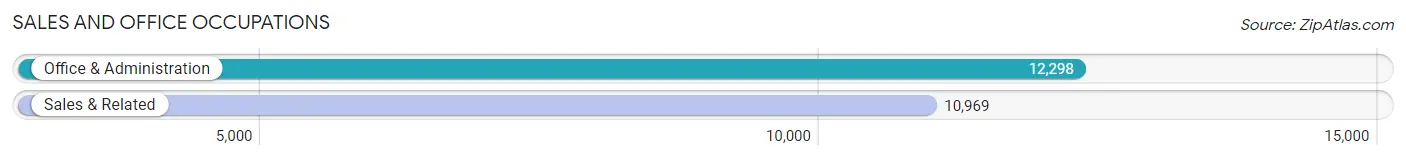
Sales and Office Occupations
The most common Sales and Office occupations in Sioux Falls are Office & Administration (12,298 | 11.3%), and Sales & Related (10,969 | 10.1%).
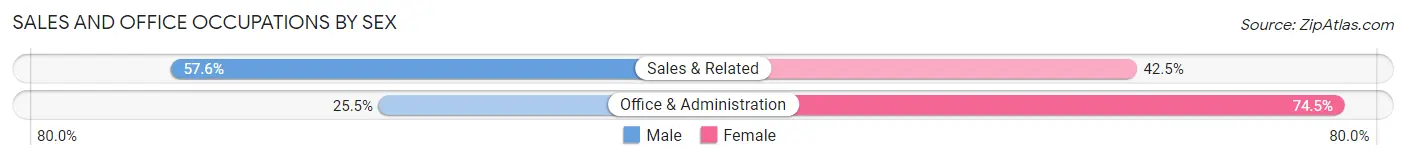
Sales and Office Occupations by Sex
| Occupation | Male | Female |
| Sales & Related | 6,313 (57.6%) | 4,656 (42.4%) |
| Office & Administration | 3,136 (25.5%) | 9,162 (74.5%) |
| Total (Category) | 9,449 (40.6%) | 13,818 (59.4%) |
| Total (Overall) | 56,857 (52.2%) | 52,111 (47.8%) |
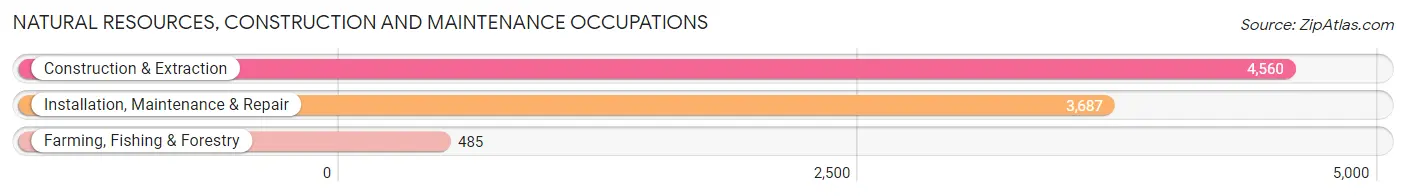
Natural Resources, Construction and Maintenance Occupations
The most common Natural Resources, Construction and Maintenance occupations in Sioux Falls are Construction & Extraction (4,560 | 4.2%), Installation, Maintenance & Repair (3,687 | 3.4%), and Farming, Fishing & Forestry (485 | 0.4%).
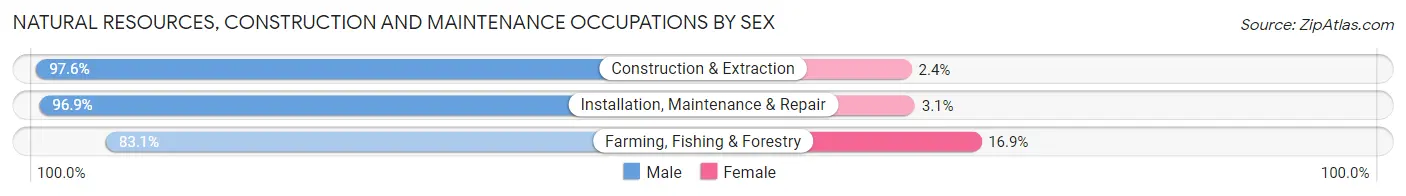
Natural Resources, Construction and Maintenance Occupations by Sex
| Occupation | Male | Female |
| Farming, Fishing & Forestry | 403 (83.1%) | 82 (16.9%) |
| Construction & Extraction | 4,449 (97.6%) | 111 (2.4%) |
| Installation, Maintenance & Repair | 3,573 (96.9%) | 114 (3.1%) |
| Total (Category) | 8,425 (96.5%) | 307 (3.5%) |
| Total (Overall) | 56,857 (52.2%) | 52,111 (47.8%) |
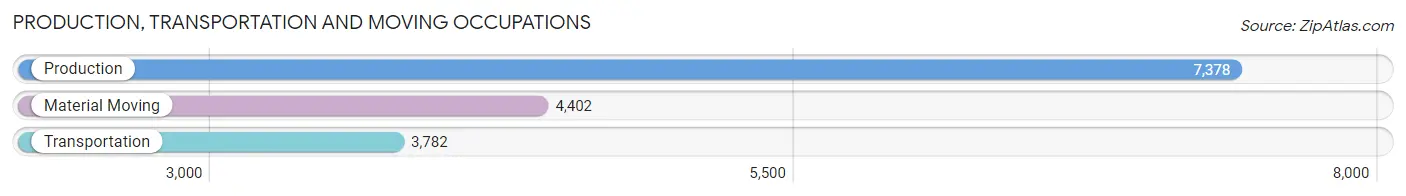
Production, Transportation and Moving Occupations
The most common Production, Transportation and Moving occupations in Sioux Falls are Production (7,378 | 6.8%), Material Moving (4,402 | 4.0%), and Transportation (3,782 | 3.5%).
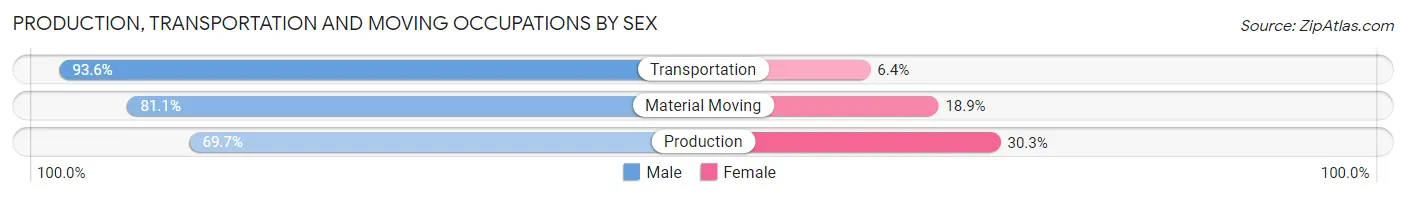
Production, Transportation and Moving Occupations by Sex
| Occupation | Male | Female |
| Production | 5,145 (69.7%) | 2,233 (30.3%) |
| Transportation | 3,540 (93.6%) | 242 (6.4%) |
| Material Moving | 3,571 (81.1%) | 831 (18.9%) |
| Total (Category) | 12,256 (78.8%) | 3,306 (21.2%) |
| Total (Overall) | 56,857 (52.2%) | 52,111 (47.8%) |
Employment Industries by Sex in Sioux Falls
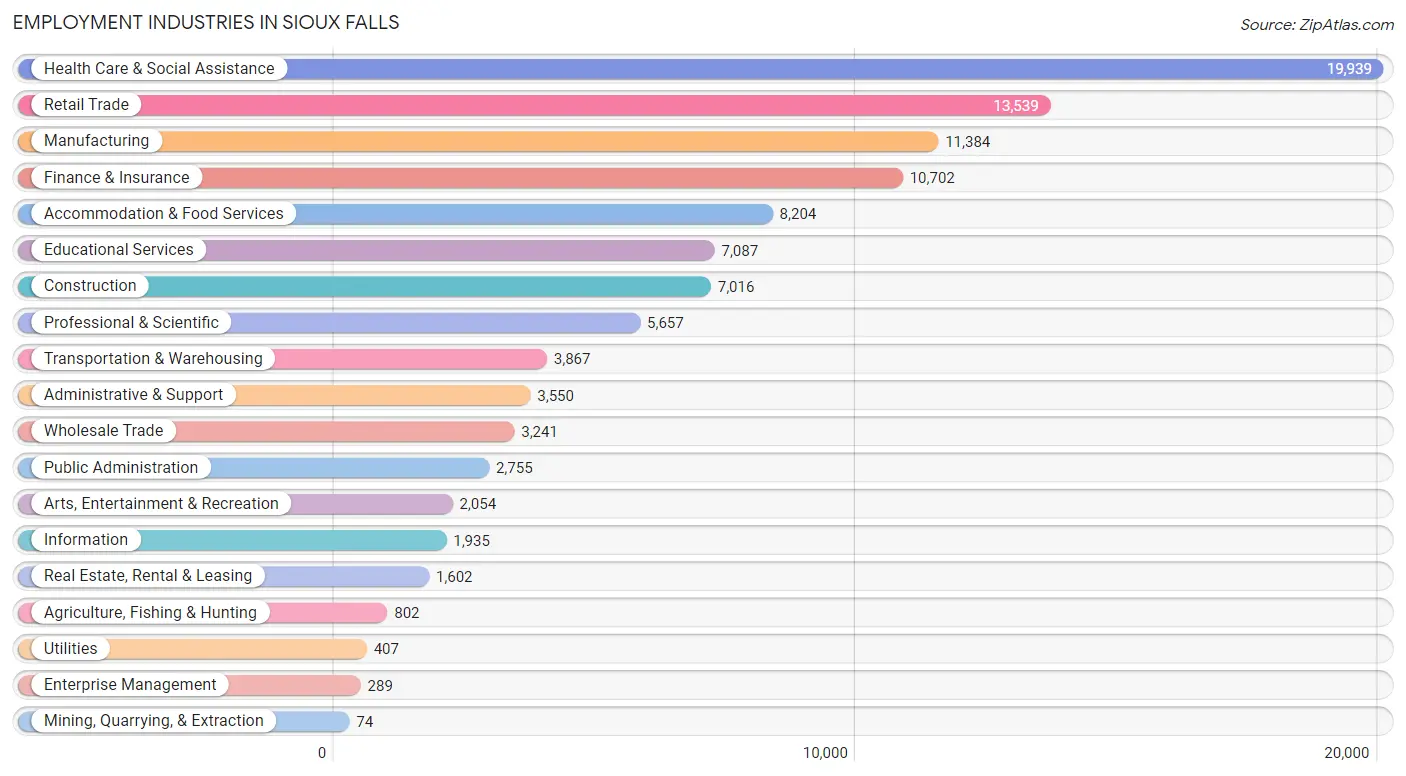
Employment Industries in Sioux Falls
The major employment industries in Sioux Falls include Health Care & Social Assistance (19,939 | 18.3%), Retail Trade (13,539 | 12.4%), Manufacturing (11,384 | 10.4%), Finance & Insurance (10,702 | 9.8%), and Accommodation & Food Services (8,204 | 7.5%).
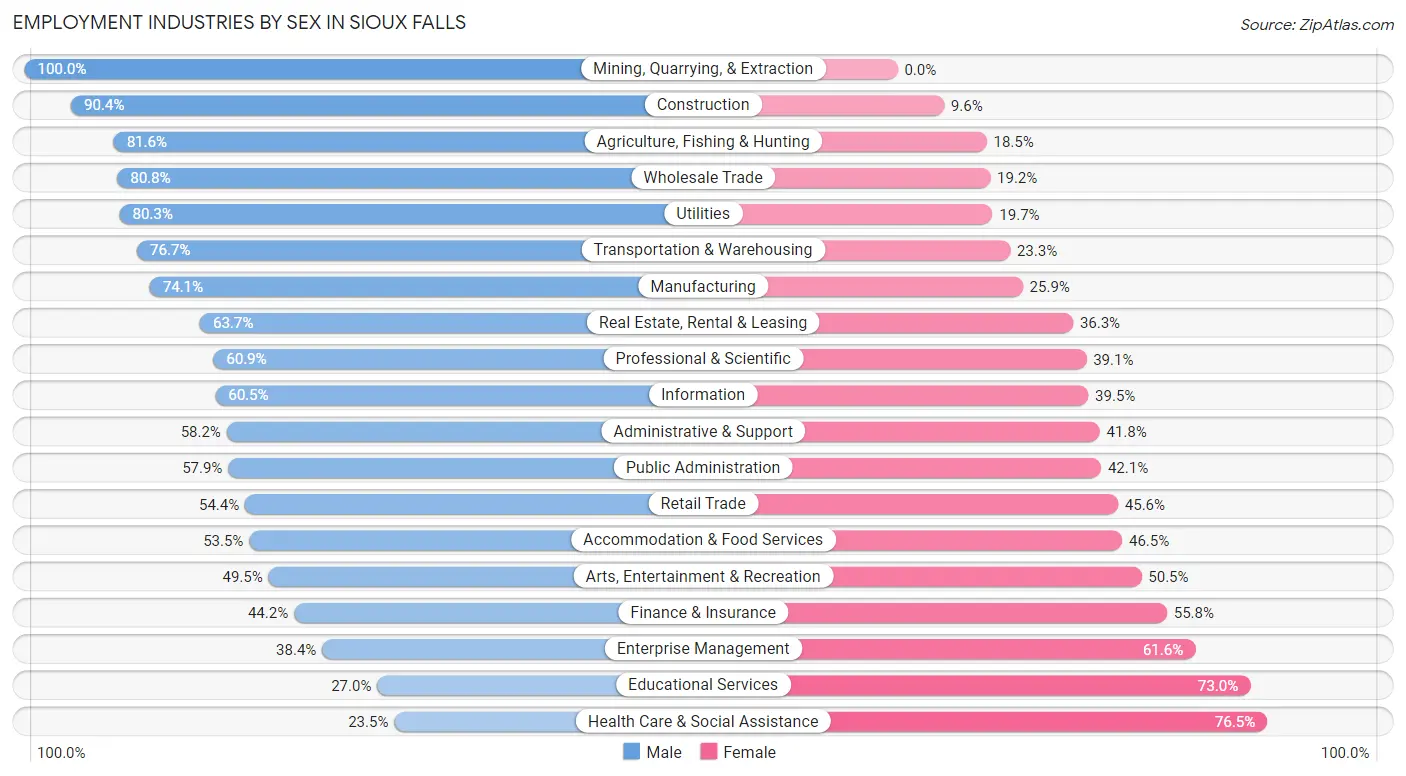
Employment Industries by Sex in Sioux Falls
The Sioux Falls industries that see more men than women are Mining, Quarrying, & Extraction (100.0%), Construction (90.4%), and Agriculture, Fishing & Hunting (81.6%), whereas the industries that tend to have a higher number of women are Health Care & Social Assistance (76.5%), Educational Services (73.0%), and Enterprise Management (61.6%).
| Industry | Male | Female |
| Agriculture, Fishing & Hunting | 654 (81.6%) | 148 (18.4%) |
| Mining, Quarrying, & Extraction | 74 (100.0%) | 0 (0.0%) |
| Construction | 6,341 (90.4%) | 675 (9.6%) |
| Manufacturing | 8,433 (74.1%) | 2,951 (25.9%) |
| Wholesale Trade | 2,619 (80.8%) | 622 (19.2%) |
| Retail Trade | 7,361 (54.4%) | 6,178 (45.6%) |
| Transportation & Warehousing | 2,966 (76.7%) | 901 (23.3%) |
| Utilities | 327 (80.3%) | 80 (19.7%) |
| Information | 1,171 (60.5%) | 764 (39.5%) |
| Finance & Insurance | 4,735 (44.2%) | 5,967 (55.8%) |
| Real Estate, Rental & Leasing | 1,020 (63.7%) | 582 (36.3%) |
| Professional & Scientific | 3,446 (60.9%) | 2,211 (39.1%) |
| Enterprise Management | 111 (38.4%) | 178 (61.6%) |
| Administrative & Support | 2,065 (58.2%) | 1,485 (41.8%) |
| Educational Services | 1,914 (27.0%) | 5,173 (73.0%) |
| Health Care & Social Assistance | 4,684 (23.5%) | 15,255 (76.5%) |
| Arts, Entertainment & Recreation | 1,017 (49.5%) | 1,037 (50.5%) |
| Accommodation & Food Services | 4,390 (53.5%) | 3,814 (46.5%) |
| Public Administration | 1,594 (57.9%) | 1,161 (42.1%) |
| Total | 56,857 (52.2%) | 52,111 (47.8%) |
Education in Sioux Falls
School Enrollment in Sioux Falls
The most common levels of schooling among the 46,387 students in Sioux Falls are elementary school (10,742 | 23.2%), middle school (10,001 | 21.6%), and high school (9,112 | 19.6%).
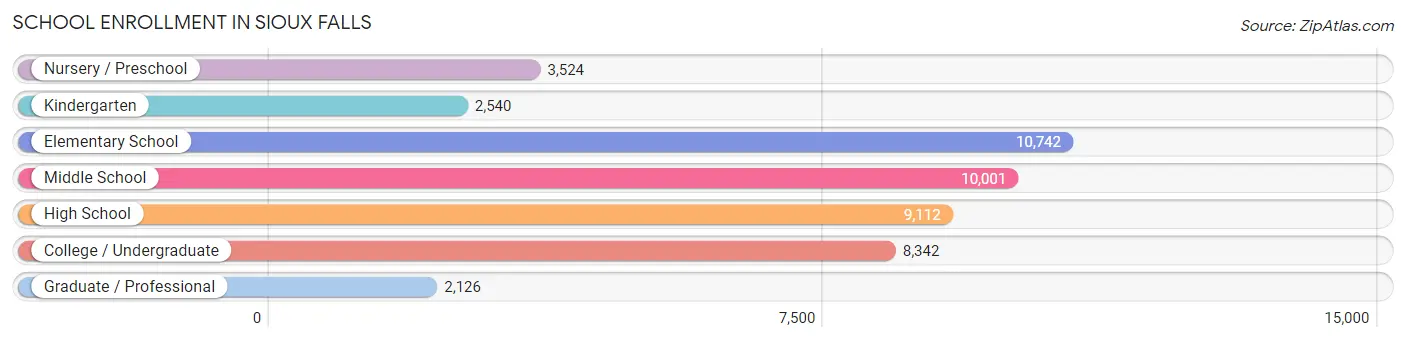
| School Level | # Students | % Students |
| Nursery / Preschool | 3,524 | 7.6% |
| Kindergarten | 2,540 | 5.5% |
| Elementary School | 10,742 | 23.2% |
| Middle School | 10,001 | 21.6% |
| High School | 9,112 | 19.6% |
| College / Undergraduate | 8,342 | 18.0% |
| Graduate / Professional | 2,126 | 4.6% |
| Total | 46,387 | 100.0% |
School Enrollment by Age by Funding Source in Sioux Falls
Out of a total of 46,387 students who are enrolled in schools in Sioux Falls, 9,231 (19.9%) attend a private institution, while the remaining 37,156 (80.1%) are enrolled in public schools. The age group of 3 to 4 year olds has the highest likelihood of being enrolled in private schools, with 817 (39.5% in the age bracket) enrolled. Conversely, the age group of 15 to 17 year olds has the lowest likelihood of being enrolled in a private school, with 6,288 (87.0% in the age bracket) attending a public institution.
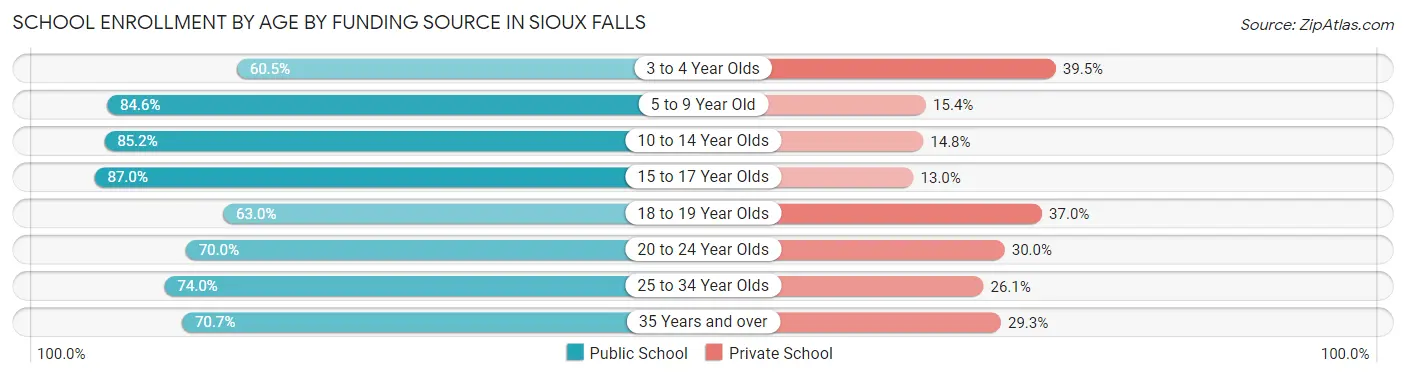
| Age Bracket | Public School | Private School |
| 3 to 4 Year Olds | 1,250 (60.5%) | 817 (39.5%) |
| 5 to 9 Year Old | 10,815 (84.6%) | 1,963 (15.4%) |
| 10 to 14 Year Olds | 10,653 (85.2%) | 1,857 (14.8%) |
| 15 to 17 Year Olds | 6,288 (87.0%) | 942 (13.0%) |
| 18 to 19 Year Olds | 1,915 (63.0%) | 1,123 (37.0%) |
| 20 to 24 Year Olds | 3,063 (70.0%) | 1,314 (30.0%) |
| 25 to 34 Year Olds | 1,842 (74.0%) | 649 (26.1%) |
| 35 Years and over | 1,340 (70.7%) | 556 (29.3%) |
| Total | 37,156 (80.1%) | 9,231 (19.9%) |
Educational Attainment by Field of Study in Sioux Falls
Business (11,027 | 21.0%), education (7,383 | 14.1%), science & technology (7,181 | 13.7%), bio, nature & agricultural (3,681 | 7.0%), and social sciences (3,578 | 6.8%) are the most common fields of study among 52,398 individuals in Sioux Falls who have obtained a bachelor's degree or higher.
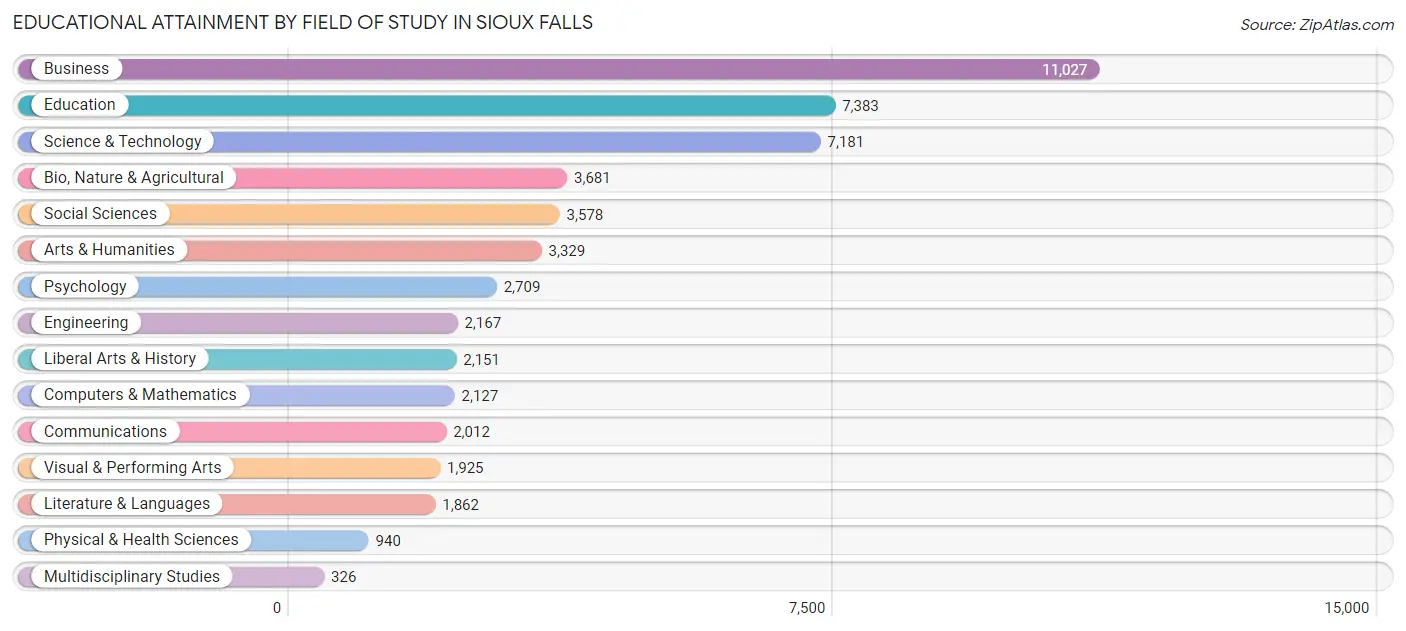
| Field of Study | # Graduates | % Graduates |
| Computers & Mathematics | 2,127 | 4.1% |
| Bio, Nature & Agricultural | 3,681 | 7.0% |
| Physical & Health Sciences | 940 | 1.8% |
| Psychology | 2,709 | 5.2% |
| Social Sciences | 3,578 | 6.8% |
| Engineering | 2,167 | 4.1% |
| Multidisciplinary Studies | 326 | 0.6% |
| Science & Technology | 7,181 | 13.7% |
| Business | 11,027 | 21.0% |
| Education | 7,383 | 14.1% |
| Literature & Languages | 1,862 | 3.5% |
| Liberal Arts & History | 2,151 | 4.1% |
| Visual & Performing Arts | 1,925 | 3.7% |
| Communications | 2,012 | 3.8% |
| Arts & Humanities | 3,329 | 6.4% |
| Total | 52,398 | 100.0% |
Transportation & Commute in Sioux Falls
Vehicle Availability by Sex in Sioux Falls
The most prevalent vehicle ownership categories in Sioux Falls are males with 2 vehicles (24,626, accounting for 44.5%) and females with 2 vehicles (21,466, making up 48.8%).
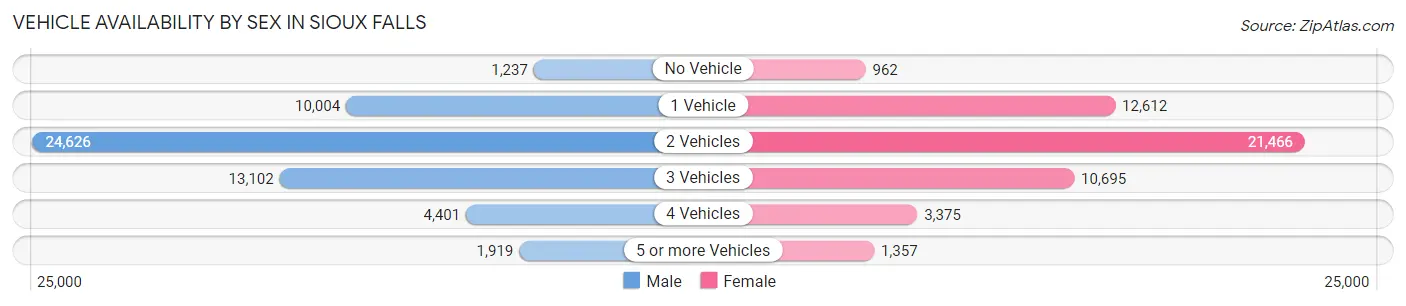
| Vehicles Available | Male | Female |
| No Vehicle | 1,237 (2.2%) | 962 (1.9%) |
| 1 Vehicle | 10,004 (18.1%) | 12,612 (25.0%) |
| 2 Vehicles | 24,626 (44.5%) | 21,466 (42.5%) |
| 3 Vehicles | 13,102 (23.7%) | 10,695 (21.2%) |
| 4 Vehicles | 4,401 (8.0%) | 3,375 (6.7%) |
| 5 or more Vehicles | 1,919 (3.5%) | 1,357 (2.7%) |
| Total | 55,289 (100.0%) | 50,467 (100.0%) |
Commute Time in Sioux Falls
The most frequently occuring commute durations in Sioux Falls are 15 to 19 minutes (27,917 commuters, 28.4%), 10 to 14 minutes (23,745 commuters, 24.1%), and 20 to 24 minutes (18,112 commuters, 18.4%).
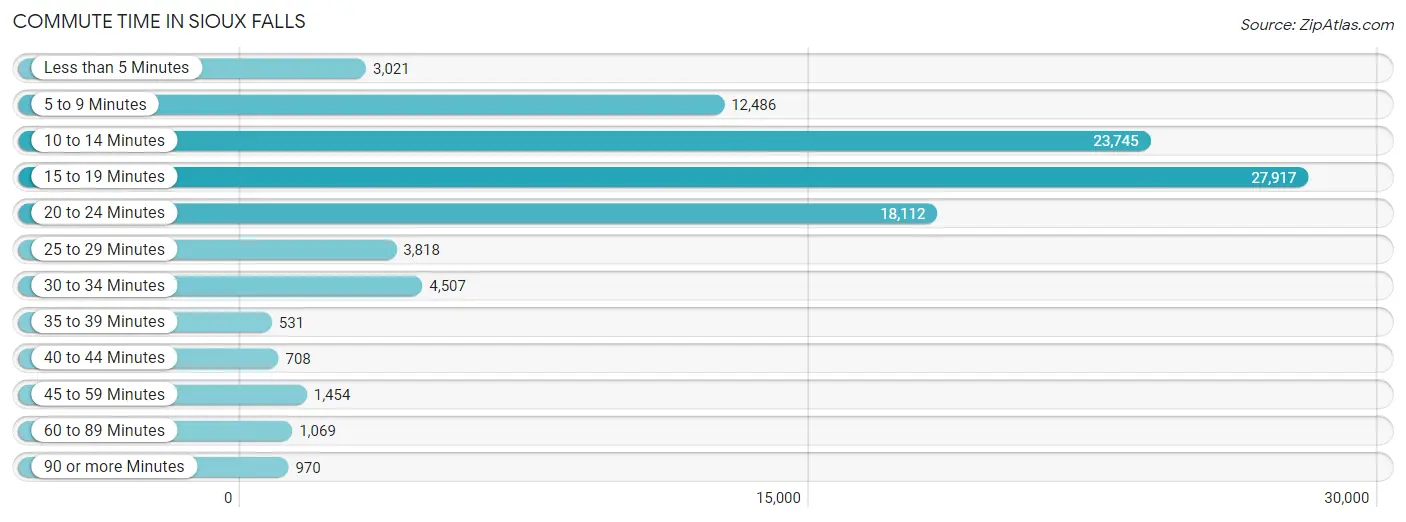
| Commute Time | # Commuters | % Commuters |
| Less than 5 Minutes | 3,021 | 3.1% |
| 5 to 9 Minutes | 12,486 | 12.7% |
| 10 to 14 Minutes | 23,745 | 24.1% |
| 15 to 19 Minutes | 27,917 | 28.4% |
| 20 to 24 Minutes | 18,112 | 18.4% |
| 25 to 29 Minutes | 3,818 | 3.9% |
| 30 to 34 Minutes | 4,507 | 4.6% |
| 35 to 39 Minutes | 531 | 0.5% |
| 40 to 44 Minutes | 708 | 0.7% |
| 45 to 59 Minutes | 1,454 | 1.5% |
| 60 to 89 Minutes | 1,069 | 1.1% |
| 90 or more Minutes | 970 | 1.0% |
Commute Time by Sex in Sioux Falls
The most common commute times in Sioux Falls are 15 to 19 minutes (15,084 commuters, 29.0%) for males and 15 to 19 minutes (12,833 commuters, 27.7%) for females.
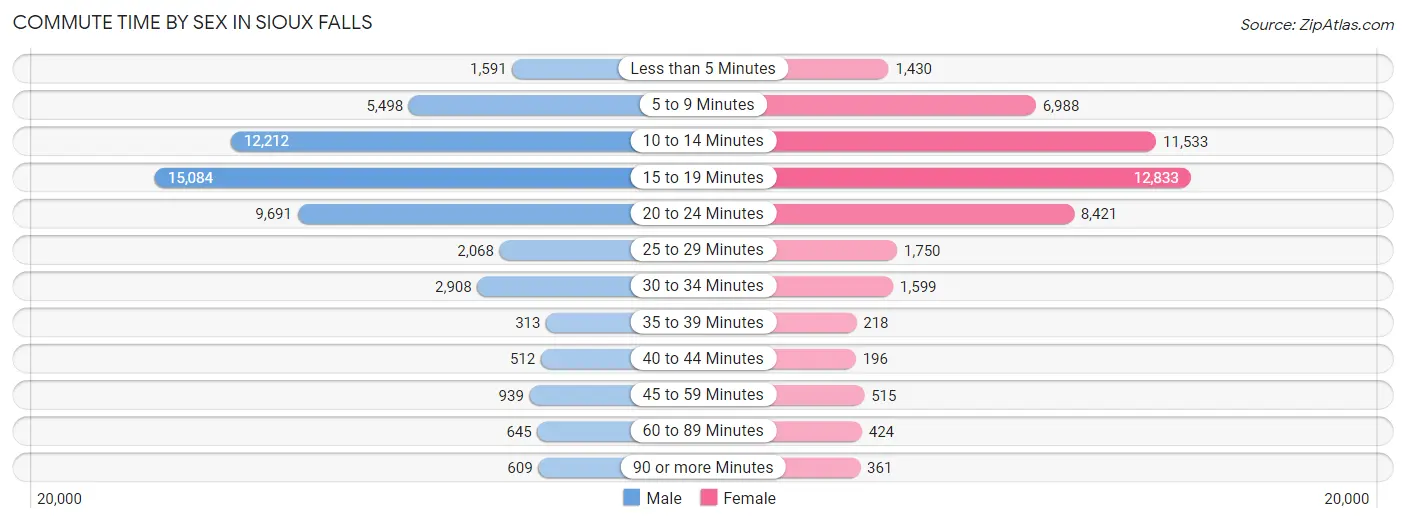
| Commute Time | Male | Female |
| Less than 5 Minutes | 1,591 (3.1%) | 1,430 (3.1%) |
| 5 to 9 Minutes | 5,498 (10.6%) | 6,988 (15.1%) |
| 10 to 14 Minutes | 12,212 (23.4%) | 11,533 (24.9%) |
| 15 to 19 Minutes | 15,084 (29.0%) | 12,833 (27.7%) |
| 20 to 24 Minutes | 9,691 (18.6%) | 8,421 (18.2%) |
| 25 to 29 Minutes | 2,068 (4.0%) | 1,750 (3.8%) |
| 30 to 34 Minutes | 2,908 (5.6%) | 1,599 (3.5%) |
| 35 to 39 Minutes | 313 (0.6%) | 218 (0.5%) |
| 40 to 44 Minutes | 512 (1.0%) | 196 (0.4%) |
| 45 to 59 Minutes | 939 (1.8%) | 515 (1.1%) |
| 60 to 89 Minutes | 645 (1.2%) | 424 (0.9%) |
| 90 or more Minutes | 609 (1.2%) | 361 (0.8%) |
Time of Departure to Work by Sex in Sioux Falls
The most frequent times of departure to work in Sioux Falls are 7:30 AM to 7:59 AM (10,456, 20.1%) for males and 7:30 AM to 7:59 AM (9,978, 21.6%) for females.
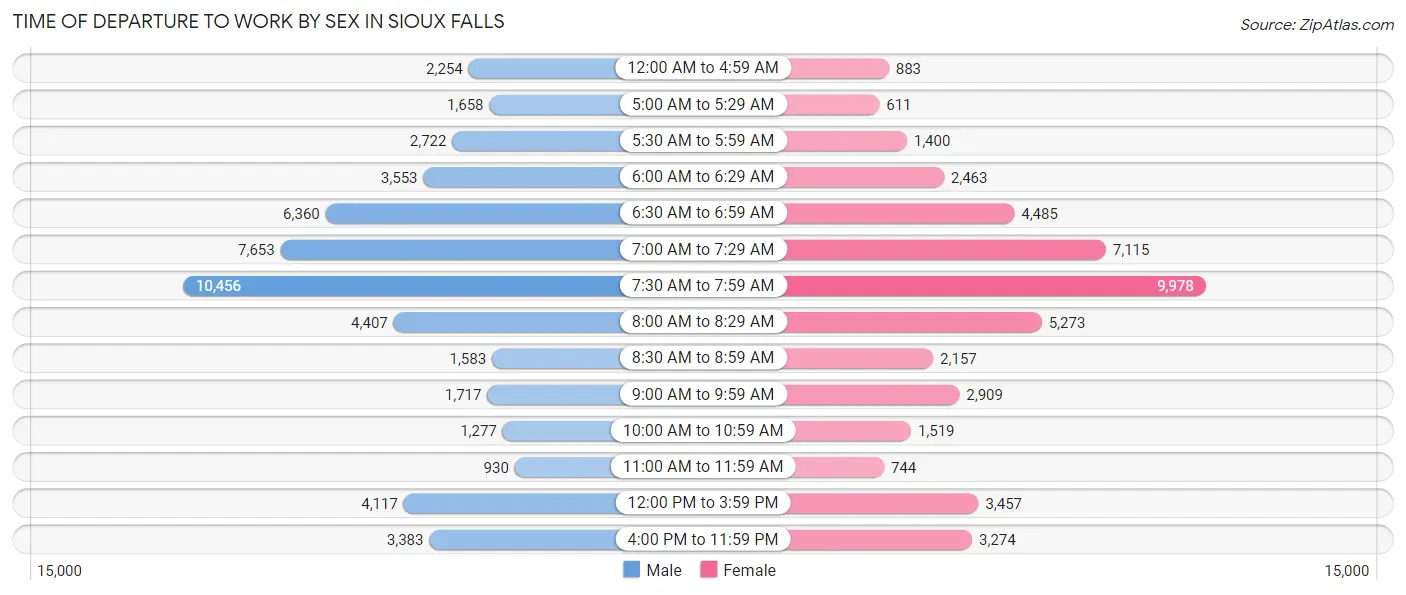
| Time of Departure | Male | Female |
| 12:00 AM to 4:59 AM | 2,254 (4.3%) | 883 (1.9%) |
| 5:00 AM to 5:29 AM | 1,658 (3.2%) | 611 (1.3%) |
| 5:30 AM to 5:59 AM | 2,722 (5.2%) | 1,400 (3.0%) |
| 6:00 AM to 6:29 AM | 3,553 (6.8%) | 2,463 (5.3%) |
| 6:30 AM to 6:59 AM | 6,360 (12.2%) | 4,485 (9.7%) |
| 7:00 AM to 7:29 AM | 7,653 (14.7%) | 7,115 (15.4%) |
| 7:30 AM to 7:59 AM | 10,456 (20.1%) | 9,978 (21.6%) |
| 8:00 AM to 8:29 AM | 4,407 (8.5%) | 5,273 (11.4%) |
| 8:30 AM to 8:59 AM | 1,583 (3.0%) | 2,157 (4.7%) |
| 9:00 AM to 9:59 AM | 1,717 (3.3%) | 2,909 (6.3%) |
| 10:00 AM to 10:59 AM | 1,277 (2.5%) | 1,519 (3.3%) |
| 11:00 AM to 11:59 AM | 930 (1.8%) | 744 (1.6%) |
| 12:00 PM to 3:59 PM | 4,117 (7.9%) | 3,457 (7.5%) |
| 4:00 PM to 11:59 PM | 3,383 (6.5%) | 3,274 (7.1%) |
| Total | 52,070 (100.0%) | 46,268 (100.0%) |
Housing Occupancy in Sioux Falls
Occupancy by Ownership in Sioux Falls
Of the total 79,753 dwellings in Sioux Falls, owner-occupied units account for 47,890 (60.1%), while renter-occupied units make up 31,863 (40.0%).
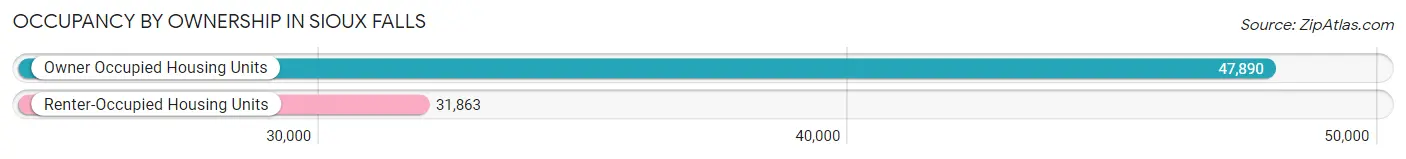
| Occupancy | # Housing Units | % Housing Units |
| Owner Occupied Housing Units | 47,890 | 60.1% |
| Renter-Occupied Housing Units | 31,863 | 40.0% |
| Total Occupied Housing Units | 79,753 | 100.0% |
Occupancy by Household Size in Sioux Falls
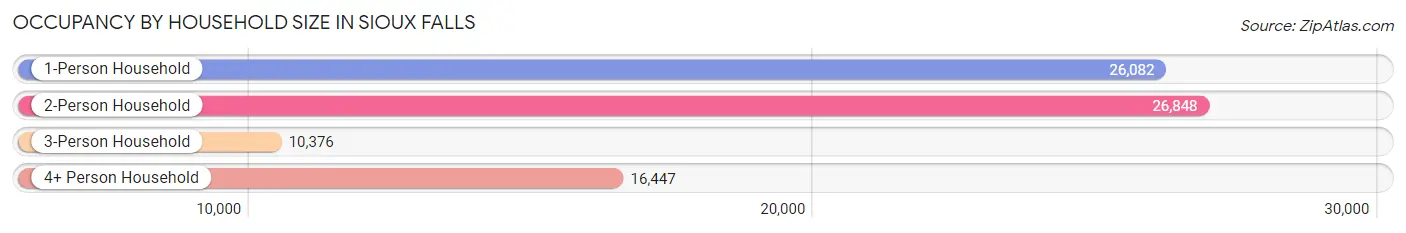
| Household Size | # Housing Units | % Housing Units |
| 1-Person Household | 26,082 | 32.7% |
| 2-Person Household | 26,848 | 33.7% |
| 3-Person Household | 10,376 | 13.0% |
| 4+ Person Household | 16,447 | 20.6% |
| Total Housing Units | 79,753 | 100.0% |
Occupancy by Ownership by Household Size in Sioux Falls
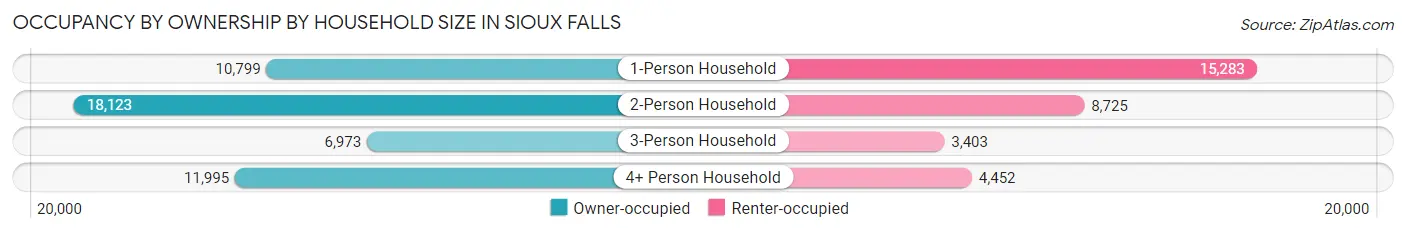
| Household Size | Owner-occupied | Renter-occupied |
| 1-Person Household | 10,799 (41.4%) | 15,283 (58.6%) |
| 2-Person Household | 18,123 (67.5%) | 8,725 (32.5%) |
| 3-Person Household | 6,973 (67.2%) | 3,403 (32.8%) |
| 4+ Person Household | 11,995 (72.9%) | 4,452 (27.1%) |
| Total Housing Units | 47,890 (60.1%) | 31,863 (40.0%) |
Occupancy by Educational Attainment in Sioux Falls
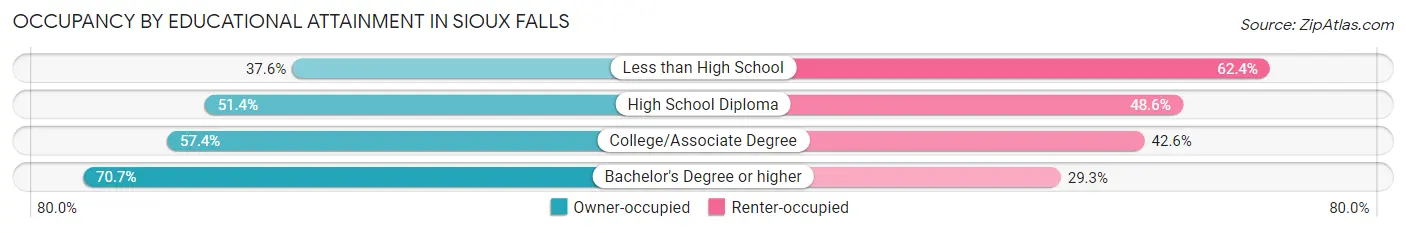
| Household Size | Owner-occupied | Renter-occupied |
| Less than High School | 1,614 (37.6%) | 2,680 (62.4%) |
| High School Diploma | 9,492 (51.4%) | 8,968 (48.6%) |
| College/Associate Degree | 15,227 (57.4%) | 11,291 (42.6%) |
| Bachelor's Degree or higher | 21,557 (70.7%) | 8,924 (29.3%) |
Occupancy by Age of Householder in Sioux Falls
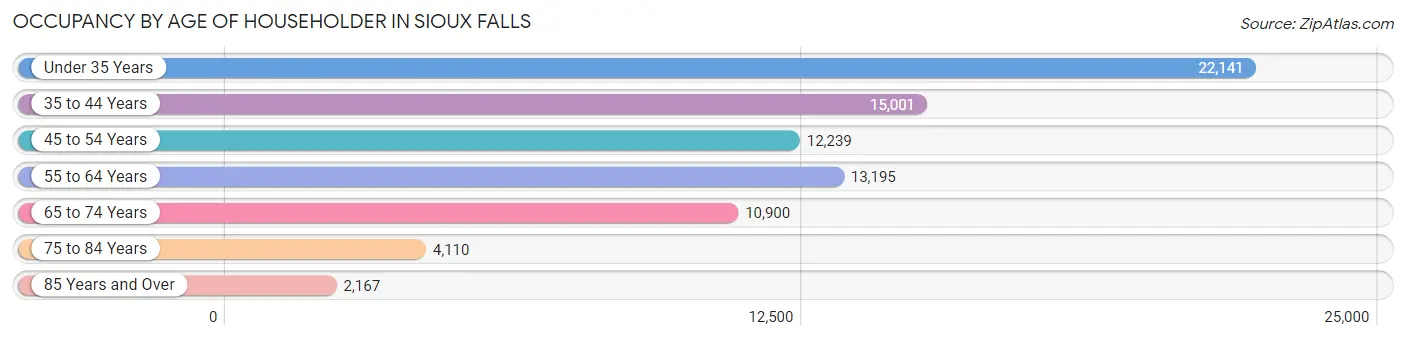
| Age Bracket | # Households | % Households |
| Under 35 Years | 22,141 | 27.8% |
| 35 to 44 Years | 15,001 | 18.8% |
| 45 to 54 Years | 12,239 | 15.3% |
| 55 to 64 Years | 13,195 | 16.5% |
| 65 to 74 Years | 10,900 | 13.7% |
| 75 to 84 Years | 4,110 | 5.1% |
| 85 Years and Over | 2,167 | 2.7% |
| Total | 79,753 | 100.0% |
Housing Finances in Sioux Falls
Median Income by Occupancy in Sioux Falls
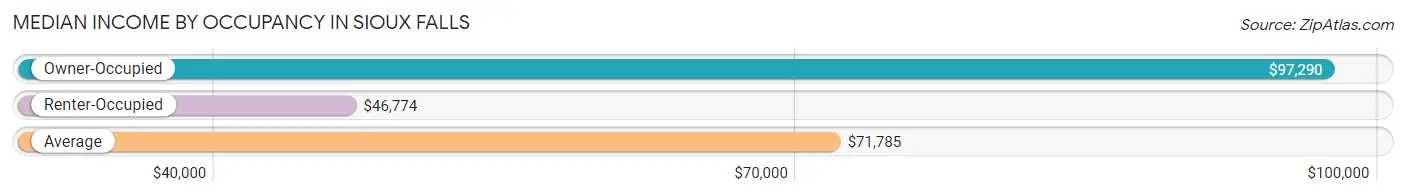
| Occupancy Type | # Households | Median Income |
| Owner-Occupied | 47,890 (60.1%) | $97,290 |
| Renter-Occupied | 31,863 (40.0%) | $46,774 |
| Average | 79,753 (100.0%) | $71,785 |
Occupancy by Householder Income Bracket in Sioux Falls
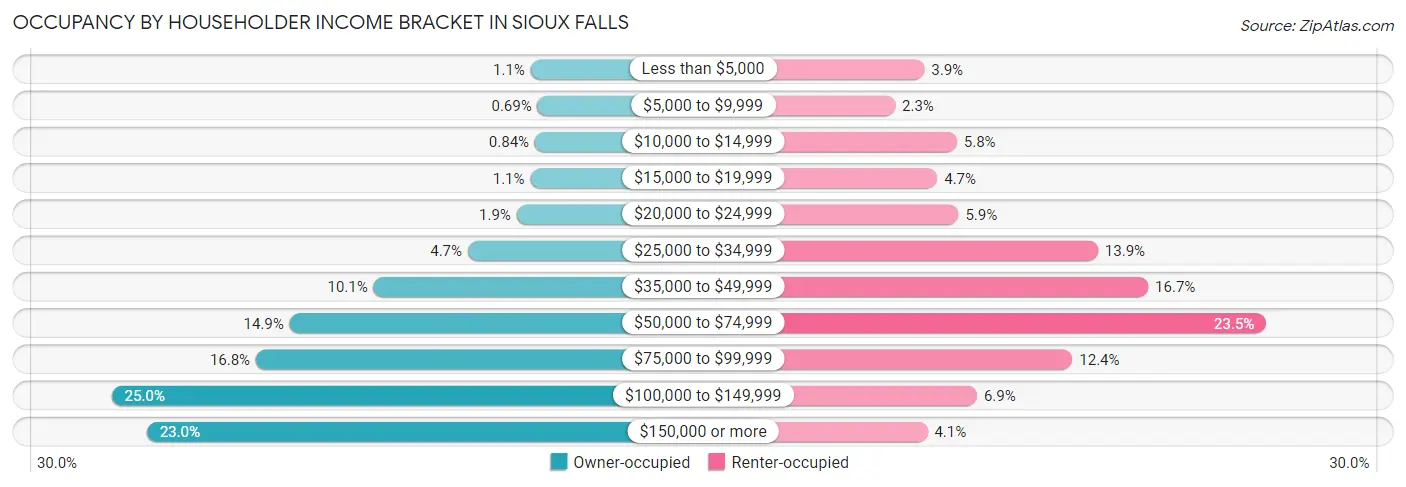
| Income Bracket | Owner-occupied | Renter-occupied |
| Less than $5,000 | 517 (1.1%) | 1,253 (3.9%) |
| $5,000 to $9,999 | 330 (0.7%) | 719 (2.3%) |
| $10,000 to $14,999 | 401 (0.8%) | 1,845 (5.8%) |
| $15,000 to $19,999 | 528 (1.1%) | 1,488 (4.7%) |
| $20,000 to $24,999 | 900 (1.9%) | 1,875 (5.9%) |
| $25,000 to $34,999 | 2,235 (4.7%) | 4,412 (13.9%) |
| $35,000 to $49,999 | 4,819 (10.1%) | 5,327 (16.7%) |
| $50,000 to $74,999 | 7,115 (14.9%) | 7,475 (23.5%) |
| $75,000 to $99,999 | 8,036 (16.8%) | 3,948 (12.4%) |
| $100,000 to $149,999 | 11,985 (25.0%) | 2,212 (6.9%) |
| $150,000 or more | 11,024 (23.0%) | 1,309 (4.1%) |
| Total | 47,890 (100.0%) | 31,863 (100.0%) |
Monthly Housing Cost Tiers in Sioux Falls
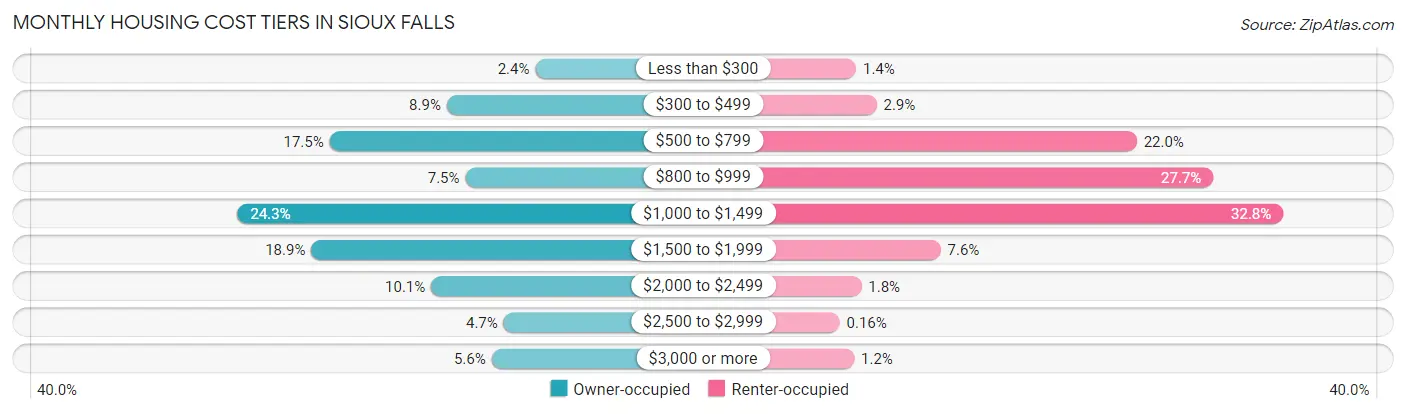
| Monthly Cost | Owner-occupied | Renter-occupied |
| Less than $300 | 1,146 (2.4%) | 435 (1.4%) |
| $300 to $499 | 4,269 (8.9%) | 918 (2.9%) |
| $500 to $799 | 8,399 (17.5%) | 7,023 (22.0%) |
| $800 to $999 | 3,610 (7.5%) | 8,817 (27.7%) |
| $1,000 to $1,499 | 11,653 (24.3%) | 10,458 (32.8%) |
| $1,500 to $1,999 | 9,045 (18.9%) | 2,420 (7.6%) |
| $2,000 to $2,499 | 4,817 (10.1%) | 561 (1.8%) |
| $2,500 to $2,999 | 2,262 (4.7%) | 52 (0.2%) |
| $3,000 or more | 2,689 (5.6%) | 392 (1.2%) |
| Total | 47,890 (100.0%) | 31,863 (100.0%) |
Physical Housing Characteristics in Sioux Falls
Housing Structures in Sioux Falls
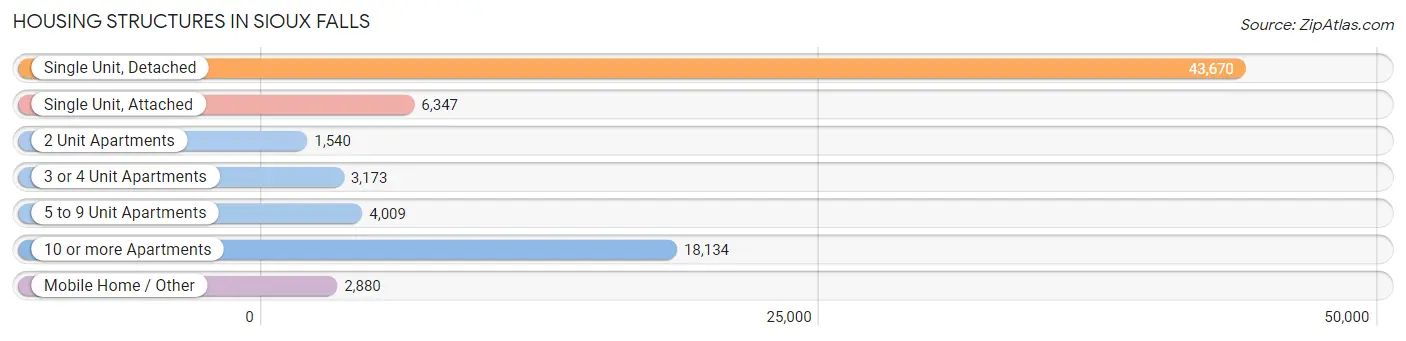
| Structure Type | # Housing Units | % Housing Units |
| Single Unit, Detached | 43,670 | 54.8% |
| Single Unit, Attached | 6,347 | 8.0% |
| 2 Unit Apartments | 1,540 | 1.9% |
| 3 or 4 Unit Apartments | 3,173 | 4.0% |
| 5 to 9 Unit Apartments | 4,009 | 5.0% |
| 10 or more Apartments | 18,134 | 22.7% |
| Mobile Home / Other | 2,880 | 3.6% |
| Total | 79,753 | 100.0% |
Housing Structures by Occupancy in Sioux Falls
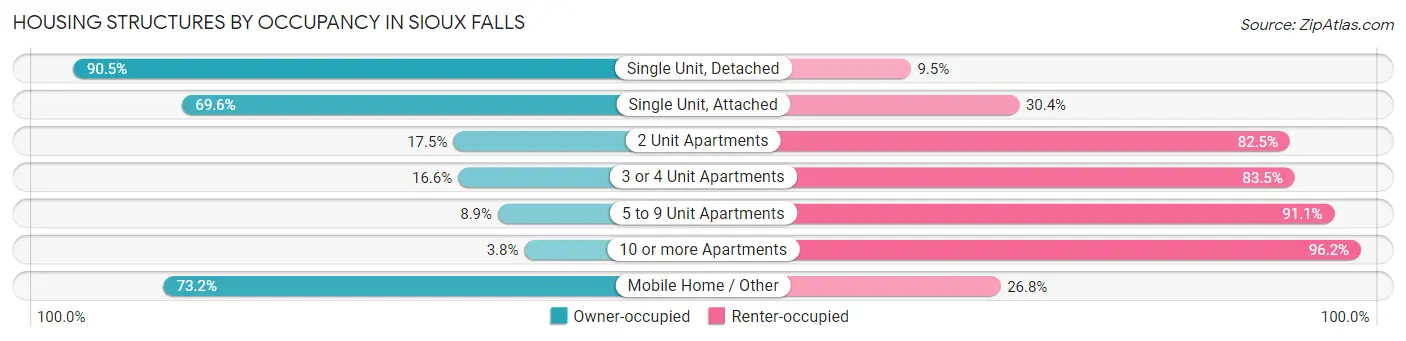
| Structure Type | Owner-occupied | Renter-occupied |
| Single Unit, Detached | 39,527 (90.5%) | 4,143 (9.5%) |
| Single Unit, Attached | 4,419 (69.6%) | 1,928 (30.4%) |
| 2 Unit Apartments | 269 (17.5%) | 1,271 (82.5%) |
| 3 or 4 Unit Apartments | 525 (16.6%) | 2,648 (83.5%) |
| 5 to 9 Unit Apartments | 356 (8.9%) | 3,653 (91.1%) |
| 10 or more Apartments | 685 (3.8%) | 17,449 (96.2%) |
| Mobile Home / Other | 2,109 (73.2%) | 771 (26.8%) |
| Total | 47,890 (60.1%) | 31,863 (40.0%) |
Housing Structures by Number of Rooms in Sioux Falls
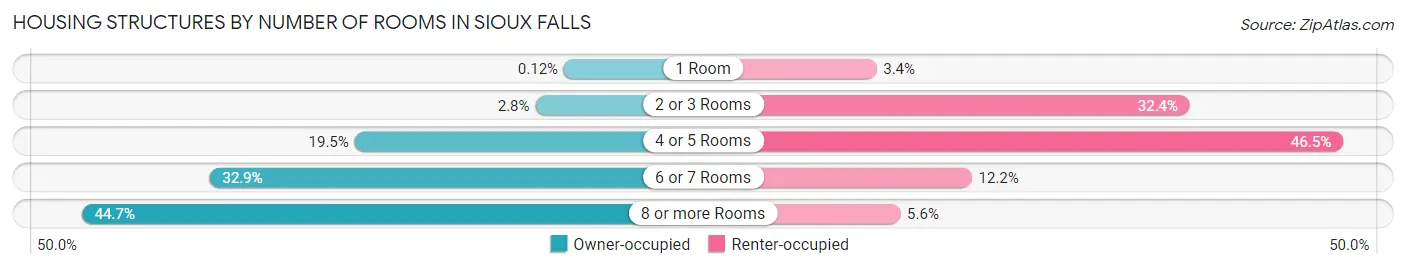
| Number of Rooms | Owner-occupied | Renter-occupied |
| 1 Room | 58 (0.1%) | 1,070 (3.4%) |
| 2 or 3 Rooms | 1,321 (2.8%) | 10,310 (32.4%) |
| 4 or 5 Rooms | 9,329 (19.5%) | 14,827 (46.5%) |
| 6 or 7 Rooms | 15,759 (32.9%) | 3,882 (12.2%) |
| 8 or more Rooms | 21,423 (44.7%) | 1,774 (5.6%) |
| Total | 47,890 (100.0%) | 31,863 (100.0%) |
Housing Structure by Heating Type in Sioux Falls
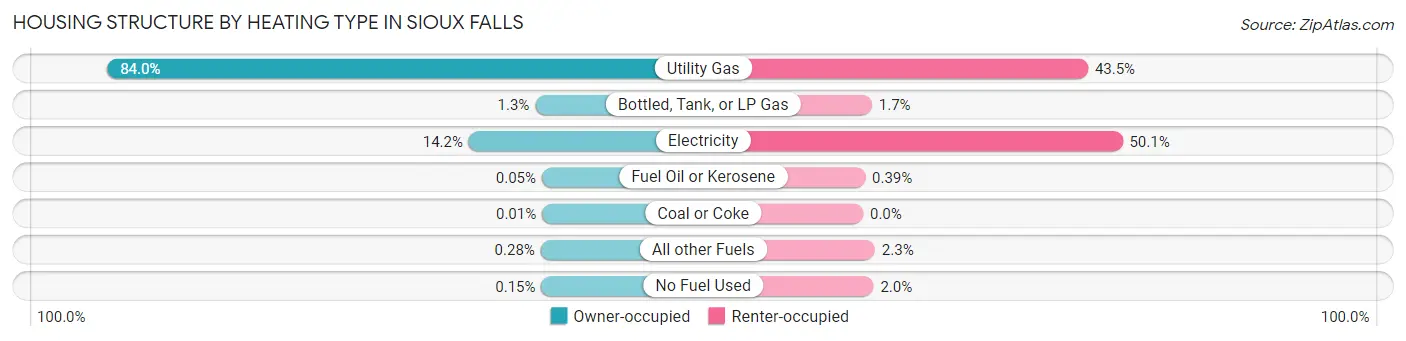
| Heating Type | Owner-occupied | Renter-occupied |
| Utility Gas | 40,241 (84.0%) | 13,848 (43.5%) |
| Bottled, Tank, or LP Gas | 638 (1.3%) | 541 (1.7%) |
| Electricity | 6,780 (14.2%) | 15,974 (50.1%) |
| Fuel Oil or Kerosene | 22 (0.1%) | 125 (0.4%) |
| Coal or Coke | 3 (0.0%) | 0 (0.0%) |
| All other Fuels | 132 (0.3%) | 731 (2.3%) |
| No Fuel Used | 74 (0.2%) | 644 (2.0%) |
| Total | 47,890 (100.0%) | 31,863 (100.0%) |
Household Vehicle Usage in Sioux Falls
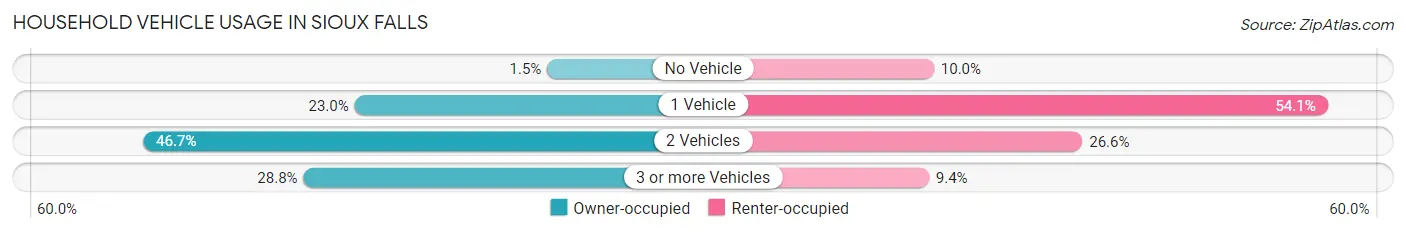
| Vehicles per Household | Owner-occupied | Renter-occupied |
| No Vehicle | 700 (1.5%) | 3,174 (10.0%) |
| 1 Vehicle | 11,036 (23.0%) | 17,221 (54.0%) |
| 2 Vehicles | 22,374 (46.7%) | 8,473 (26.6%) |
| 3 or more Vehicles | 13,780 (28.8%) | 2,995 (9.4%) |
| Total | 47,890 (100.0%) | 31,863 (100.0%) |
Real Estate & Mortgages in Sioux Falls
Real Estate and Mortgage Overview in Sioux Falls
| Characteristic | Without Mortgage | With Mortgage |
| Housing Units | 16,080 | 31,810 |
| Median Property Value | $233,900 | $260,300 |
| Median Household Income | $78,386 | $8,367 |
| Monthly Housing Costs | $583 | $2,685 |
| Real Estate Taxes | $2,905 | $695 |
Property Value by Mortgage Status in Sioux Falls
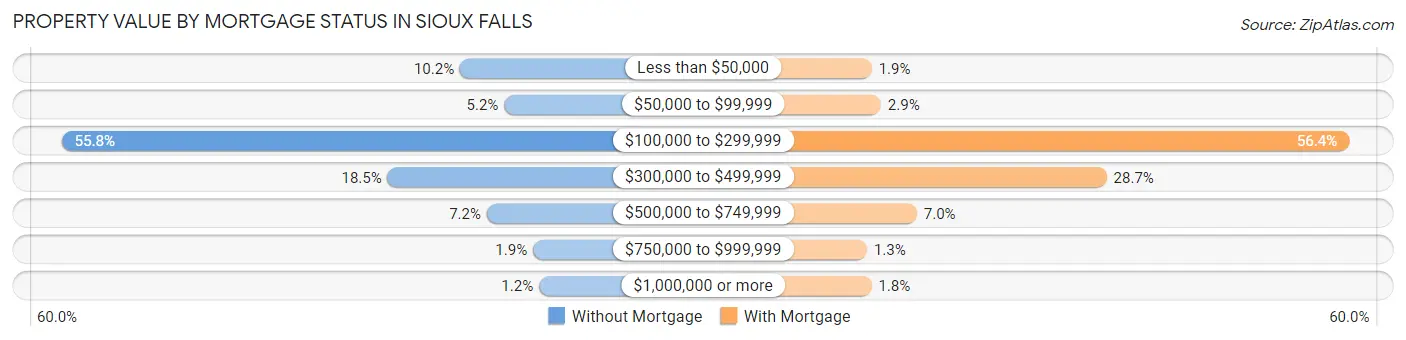
| Property Value | Without Mortgage | With Mortgage |
| Less than $50,000 | 1,647 (10.2%) | 589 (1.8%) |
| $50,000 to $99,999 | 834 (5.2%) | 924 (2.9%) |
| $100,000 to $299,999 | 8,966 (55.8%) | 17,940 (56.4%) |
| $300,000 to $499,999 | 2,978 (18.5%) | 9,131 (28.7%) |
| $500,000 to $749,999 | 1,154 (7.2%) | 2,230 (7.0%) |
| $750,000 to $999,999 | 306 (1.9%) | 416 (1.3%) |
| $1,000,000 or more | 195 (1.2%) | 580 (1.8%) |
| Total | 16,080 (100.0%) | 31,810 (100.0%) |
Household Income by Mortgage Status in Sioux Falls
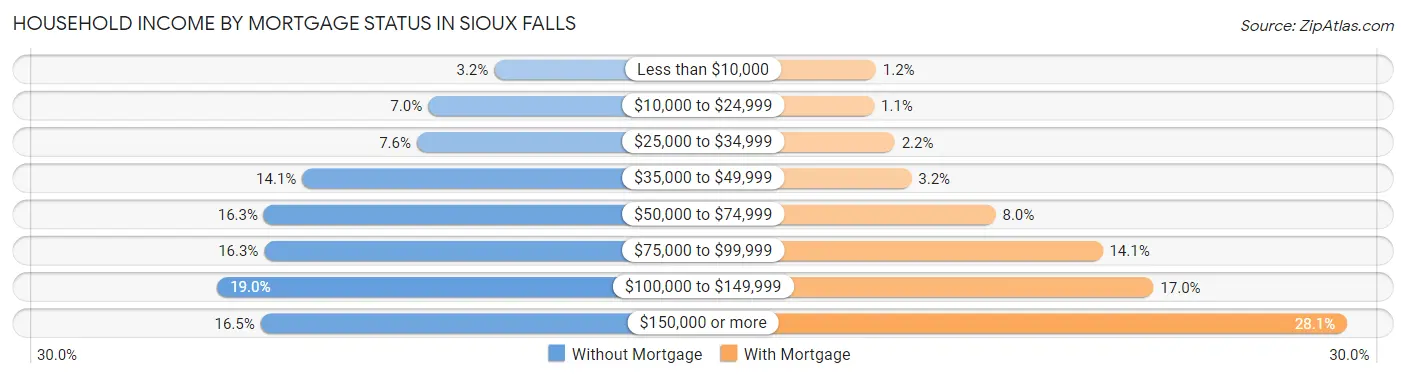
| Household Income | Without Mortgage | With Mortgage |
| Less than $10,000 | 510 (3.2%) | 369 (1.2%) |
| $10,000 to $24,999 | 1,117 (7.0%) | 337 (1.1%) |
| $25,000 to $34,999 | 1,221 (7.6%) | 712 (2.2%) |
| $35,000 to $49,999 | 2,273 (14.1%) | 1,014 (3.2%) |
| $50,000 to $74,999 | 2,626 (16.3%) | 2,546 (8.0%) |
| $75,000 to $99,999 | 2,622 (16.3%) | 4,489 (14.1%) |
| $100,000 to $149,999 | 3,054 (19.0%) | 5,414 (17.0%) |
| $150,000 or more | 2,657 (16.5%) | 8,931 (28.1%) |
| Total | 16,080 (100.0%) | 31,810 (100.0%) |
Property Value to Household Income Ratio in Sioux Falls
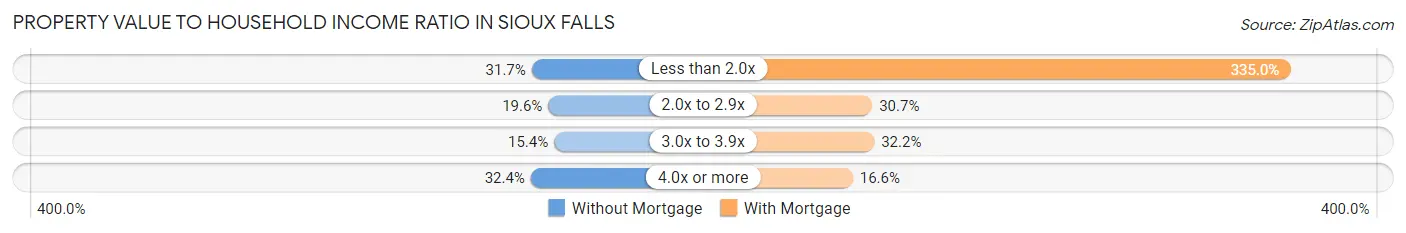
| Value-to-Income Ratio | Without Mortgage | With Mortgage |
| Less than 2.0x | 5,096 (31.7%) | 106,574 (335.0%) |
| 2.0x to 2.9x | 3,157 (19.6%) | 9,773 (30.7%) |
| 3.0x to 3.9x | 2,472 (15.4%) | 10,243 (32.2%) |
| 4.0x or more | 5,202 (32.4%) | 5,282 (16.6%) |
| Total | 16,080 (100.0%) | 31,810 (100.0%) |
Real Estate Taxes by Mortgage Status in Sioux Falls
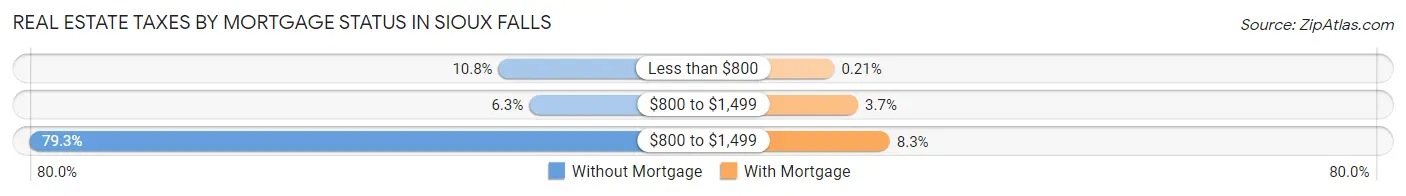
| Property Taxes | Without Mortgage | With Mortgage |
| Less than $800 | 1,731 (10.8%) | 66 (0.2%) |
| $800 to $1,499 | 1,012 (6.3%) | 1,169 (3.7%) |
| $800 to $1,499 | 12,758 (79.3%) | 2,641 (8.3%) |
| Total | 16,080 (100.0%) | 31,810 (100.0%) |
Health & Disability in Sioux Falls
Health Insurance Coverage by Age in Sioux Falls
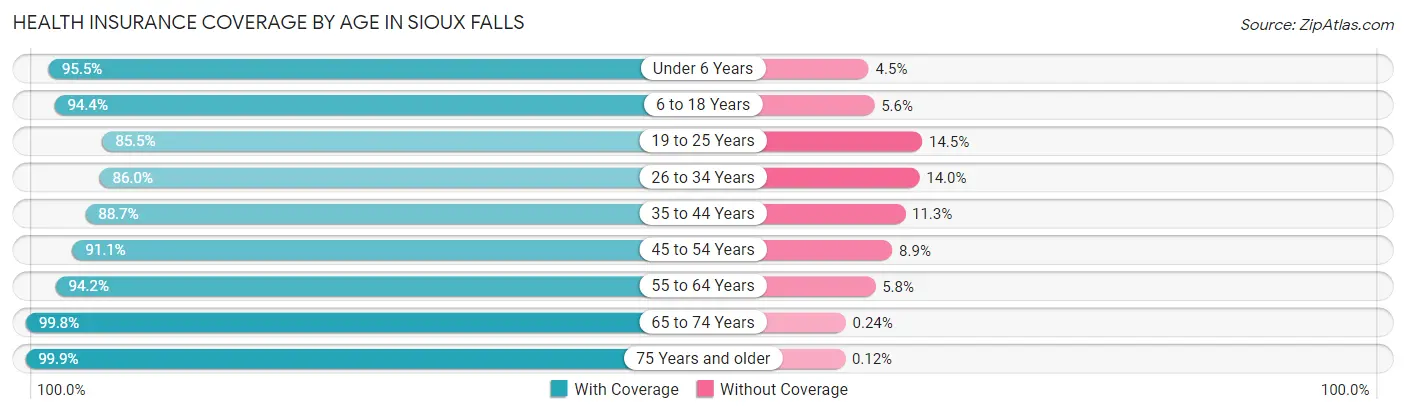
| Age Bracket | With Coverage | Without Coverage |
| Under 6 Years | 15,611 (95.5%) | 742 (4.5%) |
| 6 to 18 Years | 31,384 (94.4%) | 1,854 (5.6%) |
| 19 to 25 Years | 16,570 (85.5%) | 2,809 (14.5%) |
| 26 to 34 Years | 23,096 (86.0%) | 3,755 (14.0%) |
| 35 to 44 Years | 23,824 (88.7%) | 3,041 (11.3%) |
| 45 to 54 Years | 18,920 (91.1%) | 1,852 (8.9%) |
| 55 to 64 Years | 20,618 (94.2%) | 1,262 (5.8%) |
| 65 to 74 Years | 16,261 (99.8%) | 39 (0.2%) |
| 75 Years and older | 8,959 (99.9%) | 11 (0.1%) |
| Total | 175,243 (91.9%) | 15,365 (8.1%) |
Health Insurance Coverage by Citizenship Status in Sioux Falls
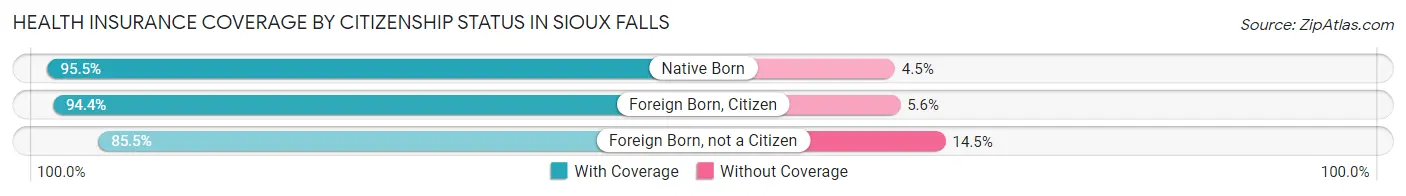
| Citizenship Status | With Coverage | Without Coverage |
| Native Born | 15,611 (95.5%) | 742 (4.5%) |
| Foreign Born, Citizen | 31,384 (94.4%) | 1,854 (5.6%) |
| Foreign Born, not a Citizen | 16,570 (85.5%) | 2,809 (14.5%) |
Health Insurance Coverage by Household Income in Sioux Falls
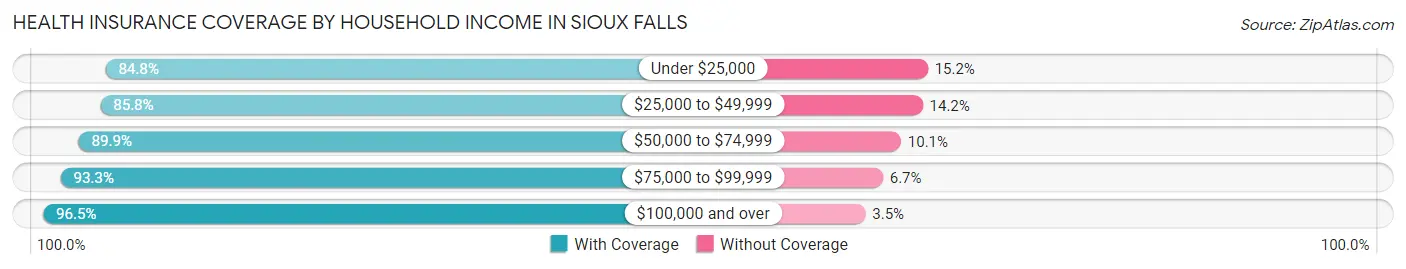
| Household Income | With Coverage | Without Coverage |
| Under $25,000 | 13,158 (84.8%) | 2,352 (15.2%) |
| $25,000 to $49,999 | 25,743 (85.8%) | 4,260 (14.2%) |
| $50,000 to $74,999 | 28,071 (89.9%) | 3,165 (10.1%) |
| $75,000 to $99,999 | 27,613 (93.3%) | 1,995 (6.7%) |
| $100,000 and over | 78,627 (96.5%) | 2,834 (3.5%) |
Public vs Private Health Insurance Coverage by Age in Sioux Falls
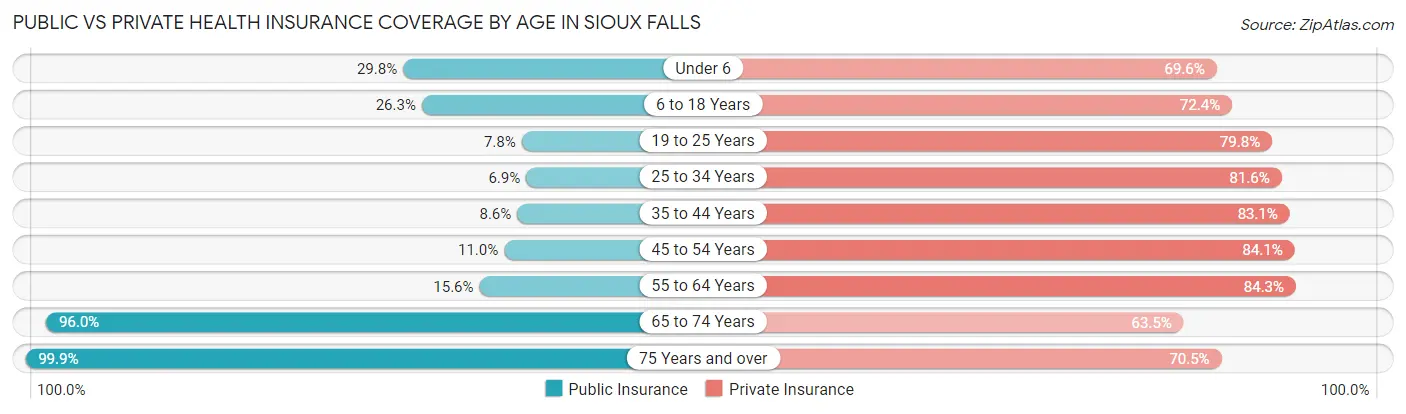
| Age Bracket | Public Insurance | Private Insurance |
| Under 6 | 4,869 (29.8%) | 11,375 (69.6%) |
| 6 to 18 Years | 8,737 (26.3%) | 24,077 (72.4%) |
| 19 to 25 Years | 1,504 (7.8%) | 15,473 (79.8%) |
| 25 to 34 Years | 1,858 (6.9%) | 21,918 (81.6%) |
| 35 to 44 Years | 2,304 (8.6%) | 22,332 (83.1%) |
| 45 to 54 Years | 2,284 (11.0%) | 17,458 (84.1%) |
| 55 to 64 Years | 3,412 (15.6%) | 18,441 (84.3%) |
| 65 to 74 Years | 15,653 (96.0%) | 10,342 (63.4%) |
| 75 Years and over | 8,959 (99.9%) | 6,320 (70.5%) |
| Total | 49,580 (26.0%) | 147,736 (77.5%) |
Disability Status by Sex by Age in Sioux Falls
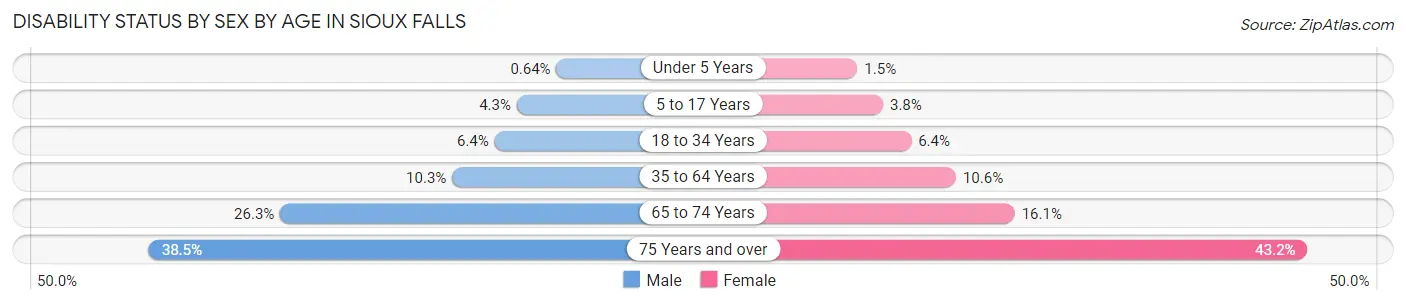
| Age Bracket | Male | Female |
| Under 5 Years | 45 (0.6%) | 98 (1.5%) |
| 5 to 17 Years | 754 (4.3%) | 632 (3.8%) |
| 18 to 34 Years | 1,557 (6.4%) | 1,523 (6.4%) |
| 35 to 64 Years | 3,637 (10.3%) | 3,633 (10.6%) |
| 65 to 74 Years | 2,096 (26.3%) | 1,336 (16.1%) |
| 75 Years and over | 1,371 (38.5%) | 2,336 (43.2%) |
Disability Class by Sex by Age in Sioux Falls
Disability Class: Hearing Difficulty
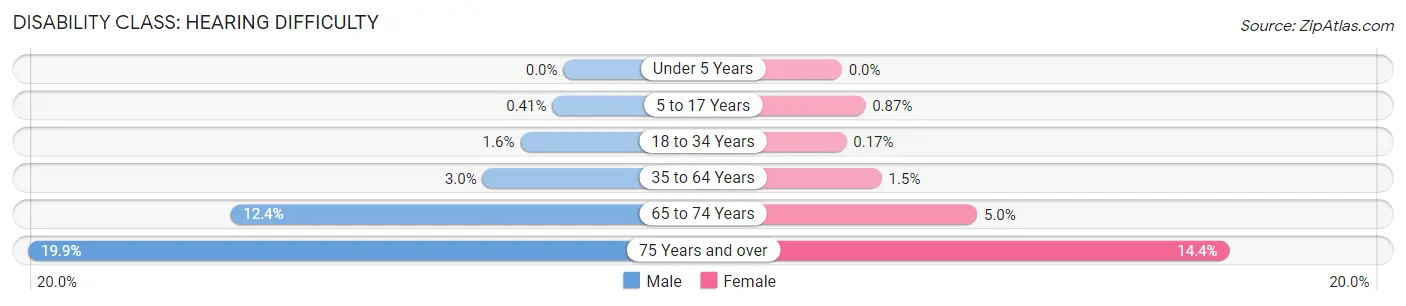
| Age Bracket | Male | Female |
| Under 5 Years | 0 (0.0%) | 0 (0.0%) |
| 5 to 17 Years | 71 (0.4%) | 143 (0.9%) |
| 18 to 34 Years | 391 (1.6%) | 41 (0.2%) |
| 35 to 64 Years | 1,057 (3.0%) | 506 (1.5%) |
| 65 to 74 Years | 986 (12.4%) | 418 (5.0%) |
| 75 Years and over | 708 (19.9%) | 778 (14.4%) |
Disability Class: Vision Difficulty
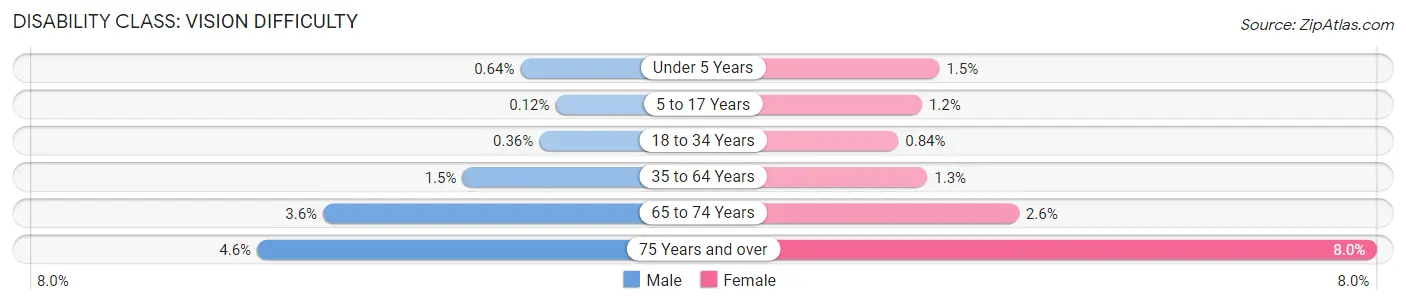
| Age Bracket | Male | Female |
| Under 5 Years | 45 (0.6%) | 98 (1.5%) |
| 5 to 17 Years | 21 (0.1%) | 196 (1.2%) |
| 18 to 34 Years | 87 (0.4%) | 199 (0.8%) |
| 35 to 64 Years | 527 (1.5%) | 435 (1.3%) |
| 65 to 74 Years | 285 (3.6%) | 219 (2.6%) |
| 75 Years and over | 162 (4.5%) | 430 (8.0%) |
Disability Class: Cognitive Difficulty
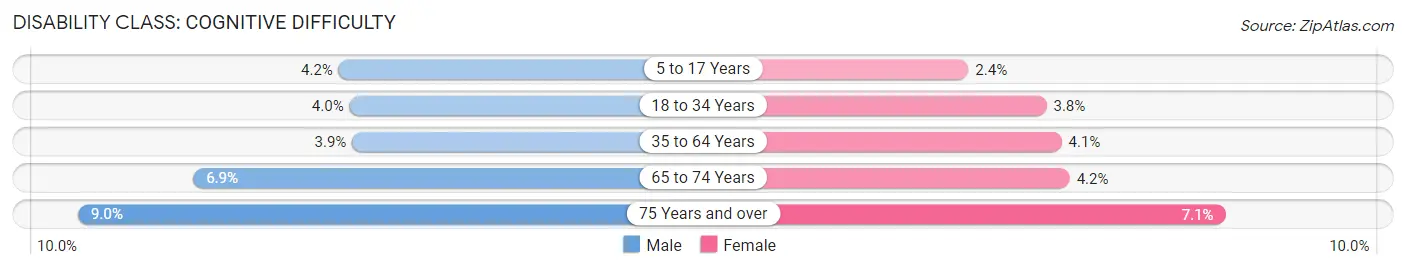
| Age Bracket | Male | Female |
| 5 to 17 Years | 727 (4.2%) | 388 (2.4%) |
| 18 to 34 Years | 968 (4.0%) | 898 (3.8%) |
| 35 to 64 Years | 1,380 (3.9%) | 1,399 (4.1%) |
| 65 to 74 Years | 548 (6.9%) | 352 (4.2%) |
| 75 Years and over | 321 (9.0%) | 385 (7.1%) |
Disability Class: Ambulatory Difficulty
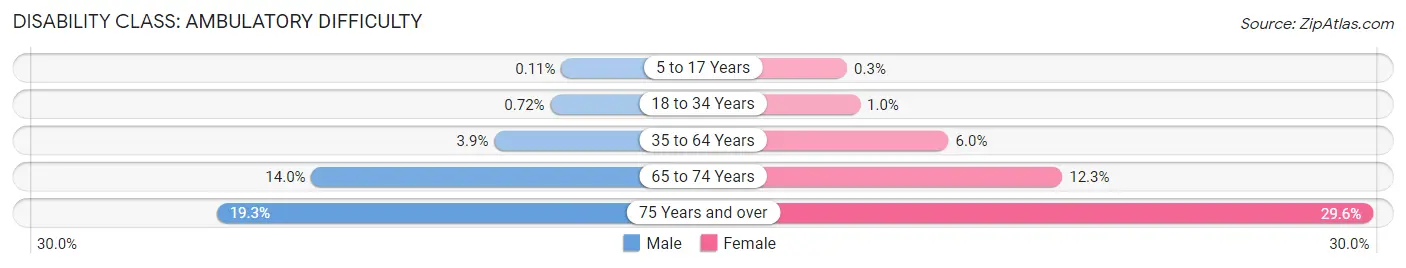
| Age Bracket | Male | Female |
| 5 to 17 Years | 20 (0.1%) | 50 (0.3%) |
| 18 to 34 Years | 175 (0.7%) | 242 (1.0%) |
| 35 to 64 Years | 1,355 (3.8%) | 2,040 (5.9%) |
| 65 to 74 Years | 1,119 (14.0%) | 1,022 (12.3%) |
| 75 Years and over | 688 (19.3%) | 1,599 (29.6%) |
Disability Class: Self-Care Difficulty
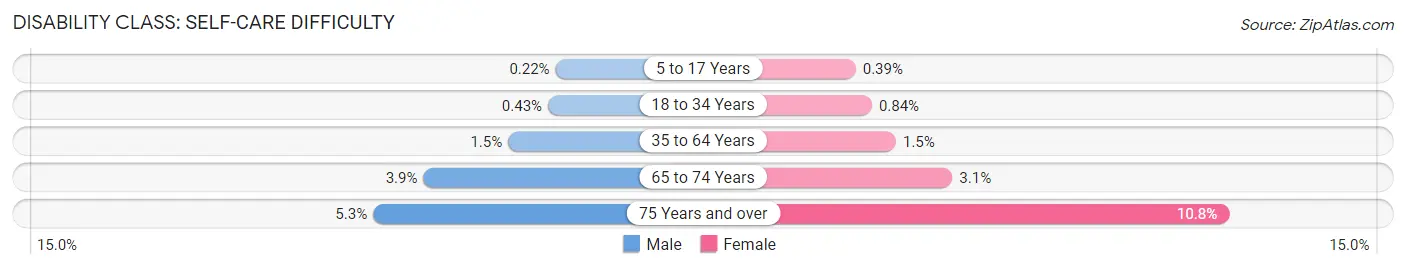
| Age Bracket | Male | Female |
| 5 to 17 Years | 39 (0.2%) | 65 (0.4%) |
| 18 to 34 Years | 106 (0.4%) | 198 (0.8%) |
| 35 to 64 Years | 542 (1.5%) | 516 (1.5%) |
| 65 to 74 Years | 311 (3.9%) | 256 (3.1%) |
| 75 Years and over | 189 (5.3%) | 583 (10.8%) |
Technology Access in Sioux Falls
Computing Device Access in Sioux Falls
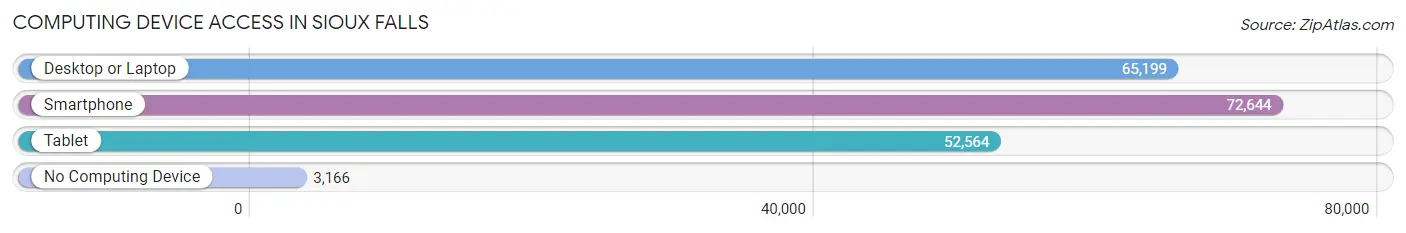
| Device Type | # Households | % Households |
| Desktop or Laptop | 65,199 | 81.8% |
| Smartphone | 72,644 | 91.1% |
| Tablet | 52,564 | 65.9% |
| No Computing Device | 3,166 | 4.0% |
| Total | 79,753 | 100.0% |
Internet Access in Sioux Falls
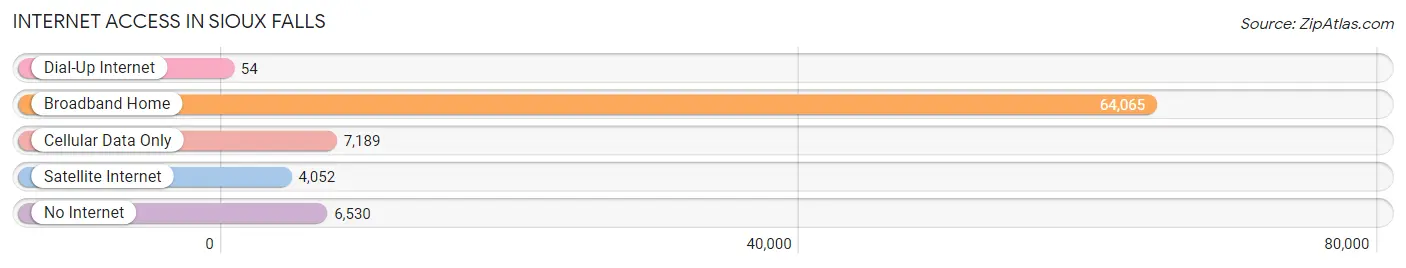
| Internet Type | # Households | % Households |
| Dial-Up Internet | 54 | 0.1% |
| Broadband Home | 64,065 | 80.3% |
| Cellular Data Only | 7,189 | 9.0% |
| Satellite Internet | 4,052 | 5.1% |
| No Internet | 6,530 | 8.2% |
| Total | 79,753 | 100.0% |
Sioux Falls Summary
Sioux Falls, South Dakota is the largest city in the state and the county seat of Minnehaha County. It is located in the southeastern corner of the state, along the Big Sioux River. The city has a population of about 178,500 people, making it the largest city in South Dakota and the 47th largest city in the United States.
Geography
Sioux Falls is located in the Great Plains region of the United States, in the southeastern corner of South Dakota. The city is situated on the banks of the Big Sioux River, which flows through the city and is a major source of water for the area. The city is surrounded by rolling hills and prairies, and is located near the Missouri River. The city is located at an elevation of 1,400 feet (427 m) above sea level.
The city has a total area of 73.2 square miles (189.6 km2), of which 72.9 square miles (188.9 km2) is land and 0.3 square miles (0.7 km2) is water. The city is divided into four quadrants: North, South, East, and West.
Climate
Sioux Falls has a humid continental climate, with cold winters and hot, humid summers. The average annual temperature is 48.3 °F (9.1 °C), with an average high of 66.2 °F (19.0 °C) in July and an average low of 30.2 °F (-1.0 °C) in January. The average annual precipitation is 22.7 inches (578 mm).
Demographics
As of the 2010 census, Sioux Falls had a population of 153,888 people. The racial makeup of the city was 87.2% White, 4.7% African American, 1.2% Native American, 2.7% Asian, 0.1% Pacific Islander, 2.3% from other races, and 2.0% from two or more races. Hispanic or Latino of any race were 5.3% of the population.
Economy
Sioux Falls is the economic and cultural center of South Dakota. The city is home to a variety of industries, including finance, healthcare, manufacturing, retail, and tourism. The city is also home to several major employers, including Sanford Health, Wells Fargo, Citibank, and the University of Sioux Falls.
The city's economy is largely driven by the service sector, which accounts for about 80% of the city's total employment. The city is also home to several major employers, including Sanford Health, Wells Fargo, Citibank, and the University of Sioux Falls.
The city's unemployment rate was 3.2% in 2019, lower than the national average of 3.7%. The median household income in Sioux Falls was $60,845 in 2019, higher than the national median of $61,937.
Conclusion
Sioux Falls is the largest city in South Dakota and the county seat of Minnehaha County. It is located in the southeastern corner of the state, along the Big Sioux River. The city has a population of about 178,500 people, making it the largest city in South Dakota and the 47th largest city in the United States. The city has a humid continental climate, with cold winters and hot, humid summers. The city's economy is largely driven by the service sector, which accounts for about 80% of the city's total employment. The city's unemployment rate was 3.2% in 2019, lower than the national average of 3.7%. The median household income in Sioux Falls was $60,845 in 2019, higher than the national median of $61,937. Sioux Falls is a vibrant city with a diverse economy and a strong sense of community.
Common Questions
What is Per Capita Income in Sioux Falls?
Per Capita income in Sioux Falls is $40,198.
What is the Median Family Income in Sioux Falls?
Median Family Income in Sioux Falls is $93,682.
What is the Median Household income in Sioux Falls?
Median Household Income in Sioux Falls is $71,785.
What is Income or Wage Gap in Sioux Falls?
Income or Wage Gap in Sioux Falls is 23.2%.
Women in Sioux Falls earn 76.8 cents for every dollar earned by a man.
What is Family Income Deficit in Sioux Falls?
Family Income Deficit in Sioux Falls is $9,641.
Families that are below poverty line in Sioux Falls earn $9,641 less on average than the poverty threshold level.
What is Inequality or Gini Index in Sioux Falls?
Inequality or Gini Index in Sioux Falls is 0.44.
What is the Total Population of Sioux Falls?
Total Population of Sioux Falls is 193,401.
What is the Total Male Population of Sioux Falls?
Total Male Population of Sioux Falls is 97,620.
What is the Total Female Population of Sioux Falls?
Total Female Population of Sioux Falls is 95,781.
What is the Ratio of Males per 100 Females in Sioux Falls?
There are 101.92 Males per 100 Females in Sioux Falls.
What is the Ratio of Females per 100 Males in Sioux Falls?
There are 98.12 Females per 100 Males in Sioux Falls.
What is the Median Population Age in Sioux Falls?
Median Population Age in Sioux Falls is 34.9 Years.
What is the Average Family Size in Sioux Falls
Average Family Size in Sioux Falls is 3.0 People.
What is the Average Household Size in Sioux Falls
Average Household Size in Sioux Falls is 2.4 People.
How Large is the Labor Force in Sioux Falls?
There are 111,781 People in the Labor Forcein in Sioux Falls.
What is the Percentage of People in the Labor Force in Sioux Falls?
74.2% of People are in the Labor Force in Sioux Falls.
What is the Unemployment Rate in Sioux Falls?
Unemployment Rate in Sioux Falls is 2.3%.