Warwick, RI Map & Demographics
Warwick Map
Warwick Overview
$44,193
PER CAPITA INCOME
$104,778
AVG FAMILY INCOME
$81,009
AVG HOUSEHOLD INCOME
19.6%
WAGE / INCOME GAP [ % ]
80.4¢/ $1
WAGE / INCOME GAP [ $ ]
$9,966
FAMILY INCOME DEFICIT
0.43
INEQUALITY / GINI INDEX
82,783
TOTAL POPULATION
39,750
MALE POPULATION
43,033
FEMALE POPULATION
92.37
MALES / 100 FEMALES
108.26
FEMALES / 100 MALES
44.5
MEDIAN AGE
3.0
AVG FAMILY SIZE
2.3
AVG HOUSEHOLD SIZE
45,361
LABOR FORCE [ PEOPLE ]
64.7%
PERCENT IN LABOR FORCE
5.1%
UNEMPLOYMENT RATE
Warwick Area Codes
Income in Warwick
Income Overview in Warwick
Per Capita Income in Warwick is $44,193, while median incomes of families and households are $104,778 and $81,009 respectively.
| Characteristic | Number | Measure |
| Per Capita Income | 82,783 | $44,193 |
| Median Family Income | 20,958 | $104,778 |
| Mean Family Income | 20,958 | $124,681 |
| Median Household Income | 36,143 | $81,009 |
| Mean Household Income | 36,143 | $100,381 |
| Income Deficit | 20,958 | $9,966 |
| Wage / Income Gap (%) | 82,783 | 19.65% |
| Wage / Income Gap ($) | 82,783 | 80.35¢ per $1 |
| Gini / Inequality Index | 82,783 | 0.43 |
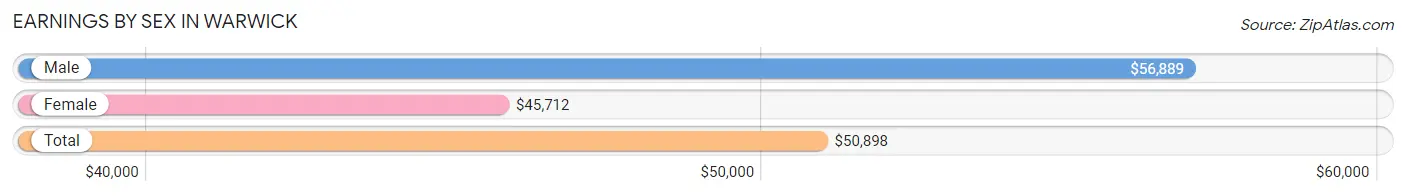
Earnings by Sex in Warwick
Average Earnings in Warwick are $50,898, $56,889 for men and $45,712 for women, a difference of 19.7%.
| Sex | Number | Average Earnings |
| Male | 24,021 (51.7%) | $56,889 |
| Female | 22,416 (48.3%) | $45,712 |
| Total | 46,437 (100.0%) | $50,898 |
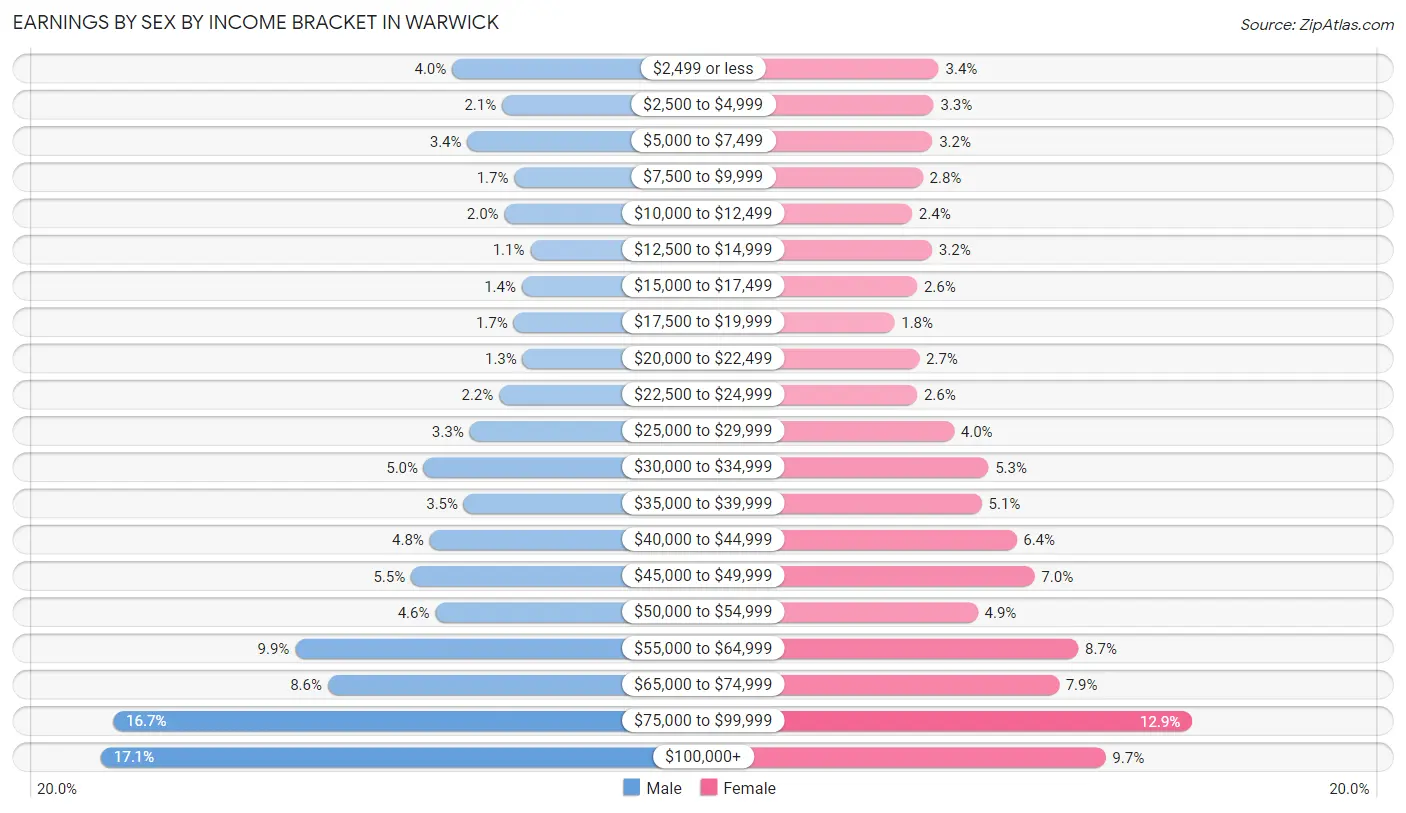
Earnings by Sex by Income Bracket in Warwick
The most common earnings brackets in Warwick are $100,000+ for men (4,117 | 17.1%) and $75,000 to $99,999 for women (2,900 | 12.9%).
| Income | Male | Female |
| $2,499 or less | 956 (4.0%) | 772 (3.4%) |
| $2,500 to $4,999 | 506 (2.1%) | 728 (3.3%) |
| $5,000 to $7,499 | 819 (3.4%) | 718 (3.2%) |
| $7,500 to $9,999 | 396 (1.7%) | 637 (2.8%) |
| $10,000 to $12,499 | 486 (2.0%) | 548 (2.4%) |
| $12,500 to $14,999 | 252 (1.1%) | 714 (3.2%) |
| $15,000 to $17,499 | 328 (1.4%) | 590 (2.6%) |
| $17,500 to $19,999 | 403 (1.7%) | 400 (1.8%) |
| $20,000 to $22,499 | 323 (1.3%) | 608 (2.7%) |
| $22,500 to $24,999 | 533 (2.2%) | 590 (2.6%) |
| $25,000 to $29,999 | 801 (3.3%) | 899 (4.0%) |
| $30,000 to $34,999 | 1,210 (5.0%) | 1,187 (5.3%) |
| $35,000 to $39,999 | 850 (3.5%) | 1,132 (5.1%) |
| $40,000 to $44,999 | 1,157 (4.8%) | 1,424 (6.4%) |
| $45,000 to $49,999 | 1,325 (5.5%) | 1,576 (7.0%) |
| $50,000 to $54,999 | 1,108 (4.6%) | 1,098 (4.9%) |
| $55,000 to $64,999 | 2,368 (9.9%) | 1,944 (8.7%) |
| $65,000 to $74,999 | 2,076 (8.6%) | 1,779 (7.9%) |
| $75,000 to $99,999 | 4,007 (16.7%) | 2,900 (12.9%) |
| $100,000+ | 4,117 (17.1%) | 2,172 (9.7%) |
| Total | 24,021 (100.0%) | 22,416 (100.0%) |
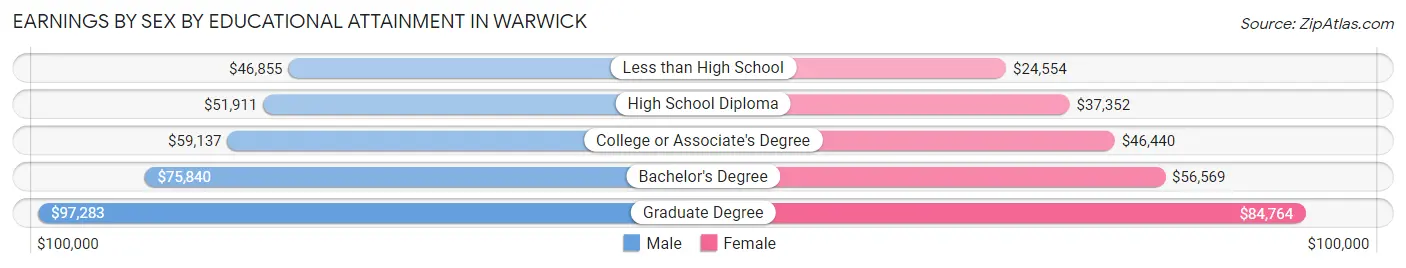
Earnings by Sex by Educational Attainment in Warwick
Average earnings in Warwick are $61,776 for men and $48,782 for women, a difference of 21.0%. Men with an educational attainment of graduate degree enjoy the highest average annual earnings of $97,283, while those with less than high school education earn the least with $46,855. Women with an educational attainment of graduate degree earn the most with the average annual earnings of $84,764, while those with less than high school education have the smallest earnings of $24,554.
| Educational Attainment | Male Income | Female Income |
| Less than High School | $46,855 | $24,554 |
| High School Diploma | $51,911 | $37,352 |
| College or Associate's Degree | $59,137 | $46,440 |
| Bachelor's Degree | $75,840 | $56,569 |
| Graduate Degree | $97,283 | $84,764 |
| Total | $61,776 | $48,782 |
Family Income in Warwick
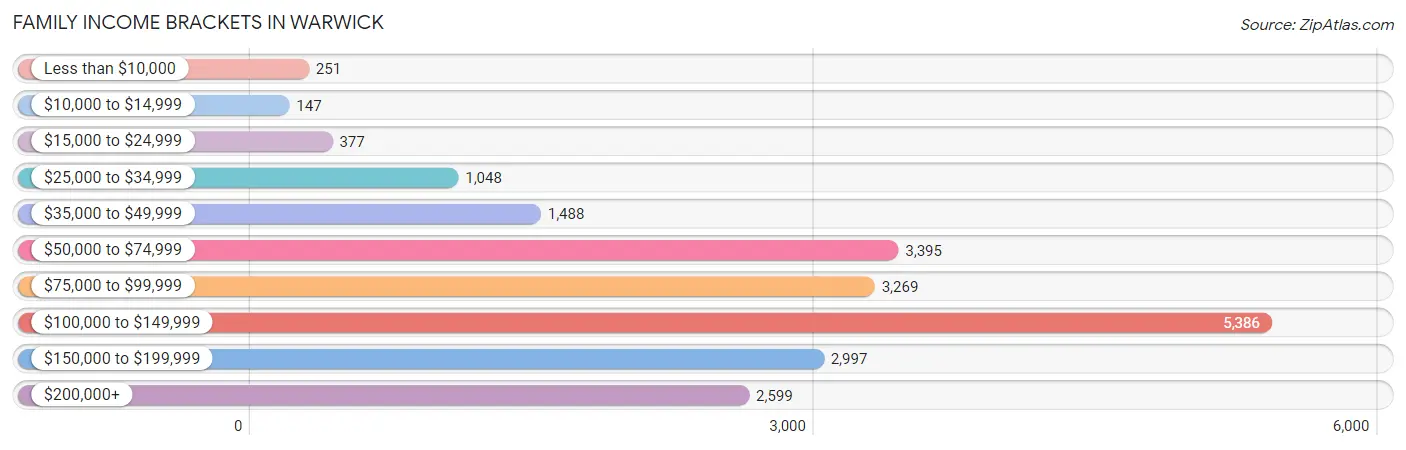
Family Income Brackets in Warwick
According to the Warwick family income data, there are 5,386 families falling into the $100,000 to $149,999 income range, which is the most common income bracket and makes up 25.7% of all families. Conversely, the $10,000 to $14,999 income bracket is the least frequent group with only 147 families (0.7%) belonging to this category.
| Income Bracket | # Families | % Families |
| Less than $10,000 | 251 | 1.2% |
| $10,000 to $14,999 | 147 | 0.7% |
| $15,000 to $24,999 | 377 | 1.8% |
| $25,000 to $34,999 | 1,048 | 5.0% |
| $35,000 to $49,999 | 1,488 | 7.1% |
| $50,000 to $74,999 | 3,395 | 16.2% |
| $75,000 to $99,999 | 3,269 | 15.6% |
| $100,000 to $149,999 | 5,386 | 25.7% |
| $150,000 to $199,999 | 2,997 | 14.3% |
| $200,000+ | 2,599 | 12.4% |
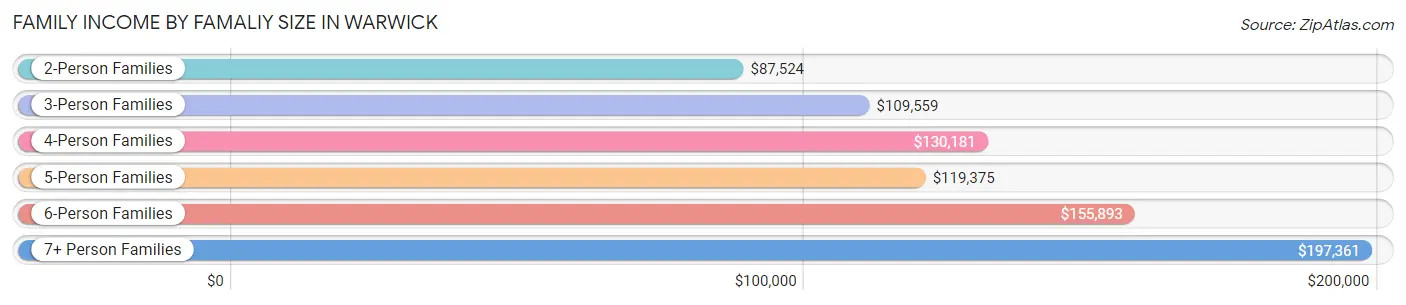
Family Income by Famaliy Size in Warwick
7+ person families (173 | 0.8%) account for the highest median family income in Warwick with $197,361 per family, while 2-person families (10,177 | 48.6%) have the highest median income of $43,762 per family member.
| Income Bracket | # Families | Median Income |
| 2-Person Families | 10,177 (48.6%) | $87,524 |
| 3-Person Families | 5,074 (24.2%) | $109,559 |
| 4-Person Families | 3,677 (17.5%) | $130,181 |
| 5-Person Families | 1,429 (6.8%) | $119,375 |
| 6-Person Families | 428 (2.0%) | $155,893 |
| 7+ Person Families | 173 (0.8%) | $197,361 |
| Total | 20,958 (100.0%) | $104,778 |
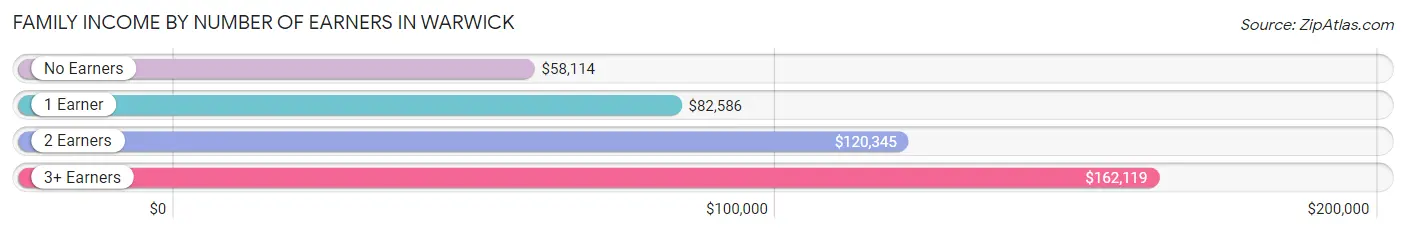
Family Income by Number of Earners in Warwick
The median family income in Warwick is $104,778, with families comprising 3+ earners (2,729) having the highest median family income of $162,119, while families with no earners (2,887) have the lowest median family income of $58,114, accounting for 13.0% and 13.8% of families, respectively.
| Number of Earners | # Families | Median Income |
| No Earners | 2,887 (13.8%) | $58,114 |
| 1 Earner | 6,414 (30.6%) | $82,586 |
| 2 Earners | 8,928 (42.6%) | $120,345 |
| 3+ Earners | 2,729 (13.0%) | $162,119 |
| Total | 20,958 (100.0%) | $104,778 |
Household Income in Warwick
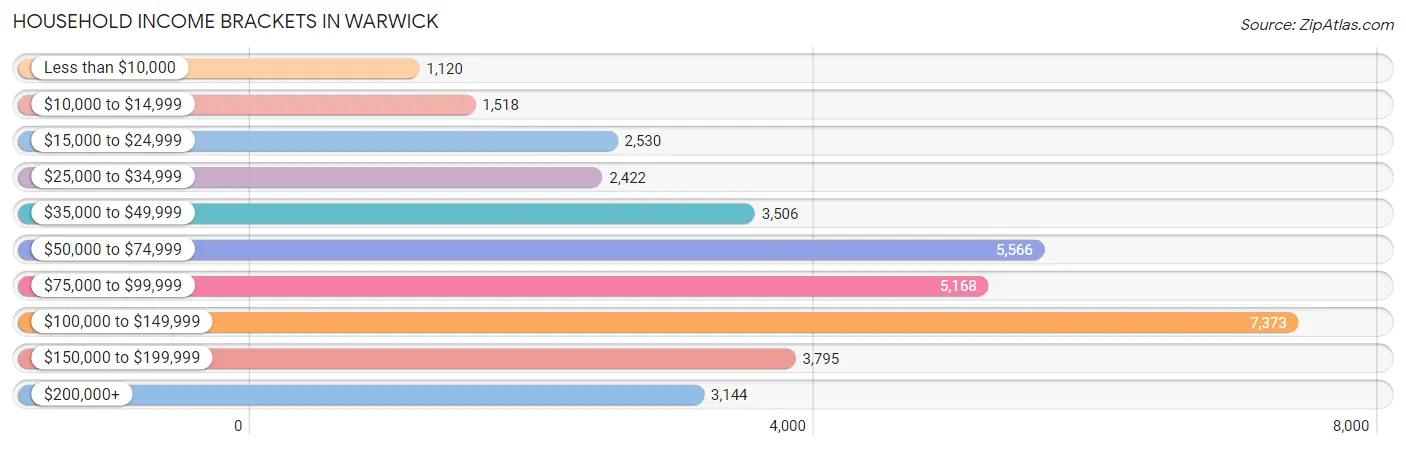
Household Income Brackets in Warwick
With 7,373 households falling in the category, the $100,000 to $149,999 income range is the most frequent in Warwick, accounting for 20.4% of all households. In contrast, only 1,120 households (3.1%) fall into the less than $10,000 income bracket, making it the least populous group.
| Income Bracket | # Households | % Households |
| Less than $10,000 | 1,120 | 3.1% |
| $10,000 to $14,999 | 1,518 | 4.2% |
| $15,000 to $24,999 | 2,530 | 7.0% |
| $25,000 to $34,999 | 2,422 | 6.7% |
| $35,000 to $49,999 | 3,506 | 9.7% |
| $50,000 to $74,999 | 5,566 | 15.4% |
| $75,000 to $99,999 | 5,168 | 14.3% |
| $100,000 to $149,999 | 7,373 | 20.4% |
| $150,000 to $199,999 | 3,795 | 10.5% |
| $200,000+ | 3,144 | 8.7% |
Household Income by Householder Age in Warwick
The median household income in Warwick is $81,009, with the highest median household income of $97,890 found in the 45 to 64 years age bracket for the primary householder. A total of 14,325 households (39.6%) fall into this category. Meanwhile, the 65+ years age bracket for the primary householder has the lowest median household income of $48,839, with 11,530 households (31.9%) in this group.
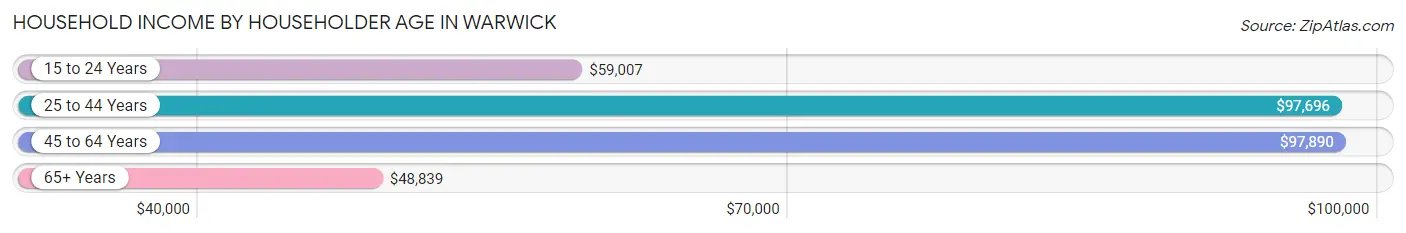
| Income Bracket | # Households | Median Income |
| 15 to 24 Years | 634 (1.8%) | $59,007 |
| 25 to 44 Years | 9,654 (26.7%) | $97,696 |
| 45 to 64 Years | 14,325 (39.6%) | $97,890 |
| 65+ Years | 11,530 (31.9%) | $48,839 |
| Total | 36,143 (100.0%) | $81,009 |
Poverty in Warwick
Income Below Poverty by Sex and Age in Warwick
With 6.2% poverty level for males and 8.2% for females among the residents of Warwick, 16 and 17 year old males and 75 year old and over females are the most vulnerable to poverty, with 106 males (9.2%) and 704 females (15.5%) in their respective age groups living below the poverty level.
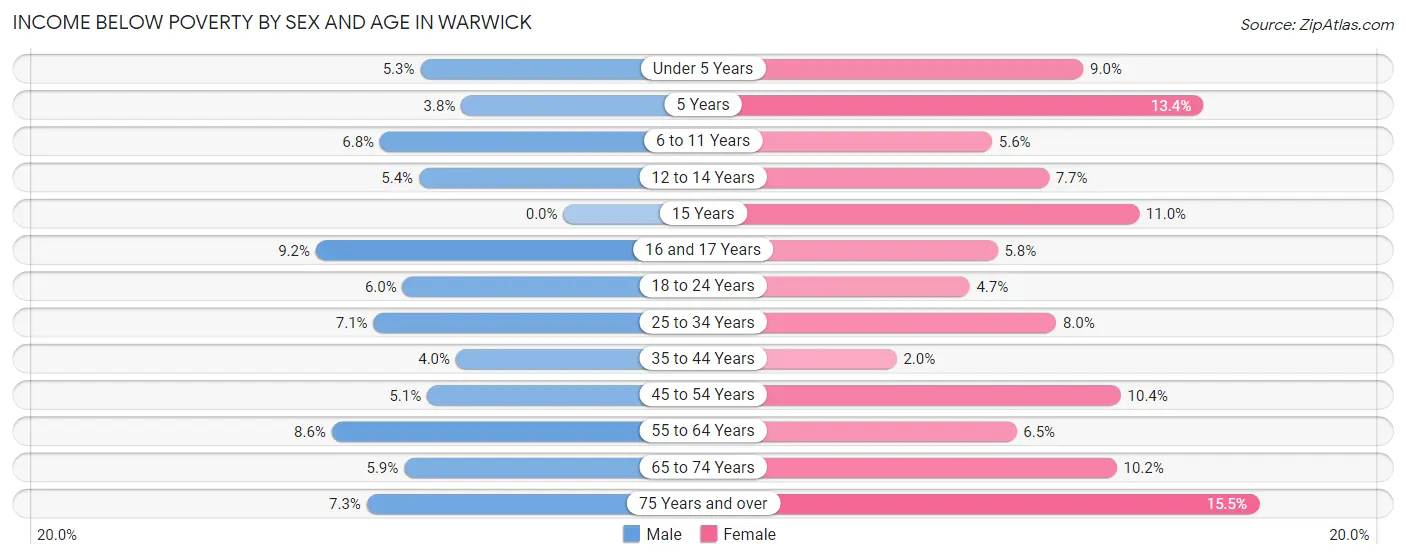
| Age Bracket | Male | Female |
| Under 5 Years | 106 (5.3%) | 132 (9.0%) |
| 5 Years | 14 (3.8%) | 101 (13.4%) |
| 6 to 11 Years | 157 (6.8%) | 140 (5.6%) |
| 12 to 14 Years | 65 (5.4%) | 83 (7.7%) |
| 15 Years | 0 (0.0%) | 45 (11.0%) |
| 16 and 17 Years | 106 (9.2%) | 38 (5.8%) |
| 18 to 24 Years | 190 (6.0%) | 138 (4.7%) |
| 25 to 34 Years | 396 (7.0%) | 415 (8.0%) |
| 35 to 44 Years | 218 (4.0%) | 101 (2.0%) |
| 45 to 54 Years | 234 (5.1%) | 574 (10.3%) |
| 55 to 64 Years | 536 (8.6%) | 443 (6.5%) |
| 65 to 74 Years | 278 (5.9%) | 586 (10.2%) |
| 75 Years and over | 169 (7.3%) | 704 (15.5%) |
| Total | 2,469 (6.2%) | 3,500 (8.2%) |
Income Above Poverty by Sex and Age in Warwick
According to the poverty statistics in Warwick, males aged 15 years and females aged 35 to 44 years are the age groups that are most secure financially, with 100.0% of males and 98.0% of females in these age groups living above the poverty line.
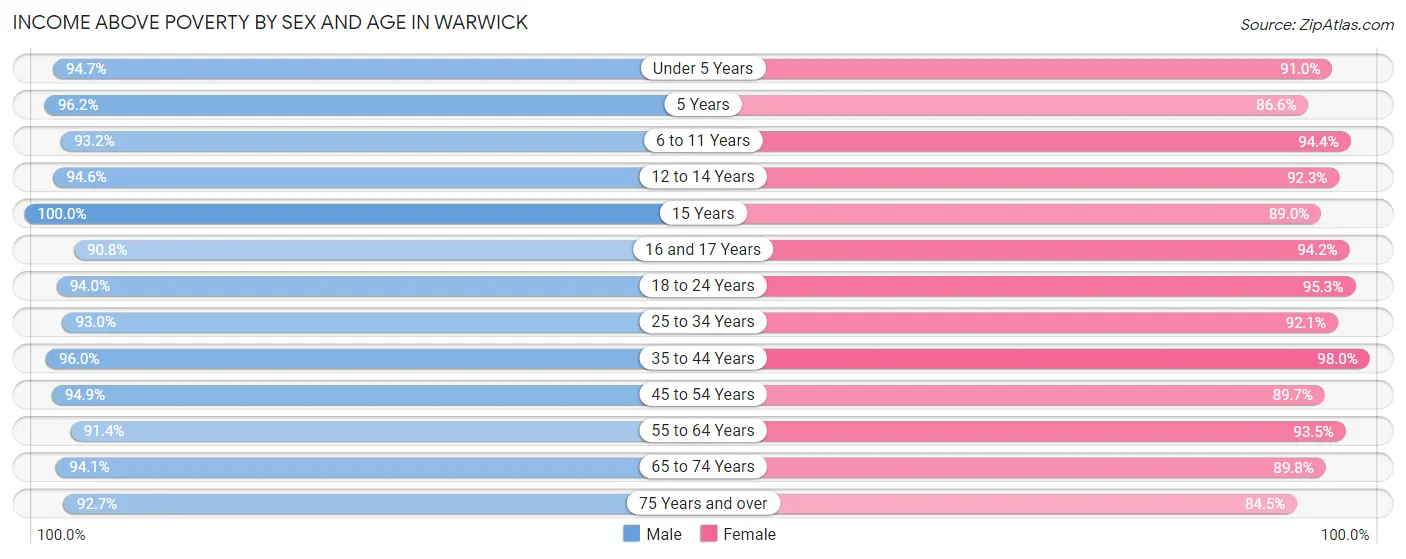
| Age Bracket | Male | Female |
| Under 5 Years | 1,889 (94.7%) | 1,341 (91.0%) |
| 5 Years | 355 (96.2%) | 652 (86.6%) |
| 6 to 11 Years | 2,148 (93.2%) | 2,375 (94.4%) |
| 12 to 14 Years | 1,147 (94.6%) | 998 (92.3%) |
| 15 Years | 362 (100.0%) | 363 (89.0%) |
| 16 and 17 Years | 1,048 (90.8%) | 619 (94.2%) |
| 18 to 24 Years | 2,990 (94.0%) | 2,772 (95.3%) |
| 25 to 34 Years | 5,220 (92.9%) | 4,804 (92.0%) |
| 35 to 44 Years | 5,248 (96.0%) | 4,865 (98.0%) |
| 45 to 54 Years | 4,392 (94.9%) | 4,971 (89.6%) |
| 55 to 64 Years | 5,697 (91.4%) | 6,395 (93.5%) |
| 65 to 74 Years | 4,426 (94.1%) | 5,161 (89.8%) |
| 75 Years and over | 2,145 (92.7%) | 3,845 (84.5%) |
| Total | 37,067 (93.8%) | 39,161 (91.8%) |
Income Below Poverty Among Married-Couple Families in Warwick
The poverty statistics for married-couple families in Warwick show that 2.6% or 414 of the total 15,674 families live below the poverty line. Families with 3 or 4 children have the highest poverty rate of 3.8%, comprising of 32 families. On the other hand, families with 5 or more children have the lowest poverty rate of 0.0%, which includes 0 families.
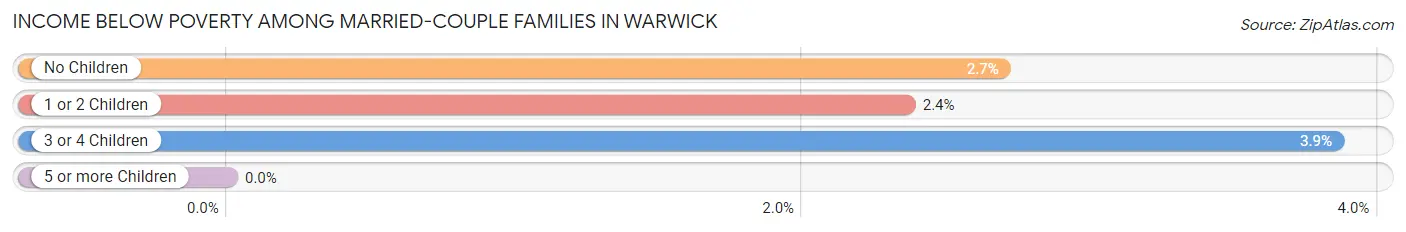
| Children | Above Poverty | Below Poverty |
| No Children | 9,658 (97.3%) | 267 (2.7%) |
| 1 or 2 Children | 4,764 (97.6%) | 115 (2.4%) |
| 3 or 4 Children | 799 (96.2%) | 32 (3.8%) |
| 5 or more Children | 39 (100.0%) | 0 (0.0%) |
| Total | 15,260 (97.4%) | 414 (2.6%) |
Income Below Poverty Among Single-Parent Households in Warwick
According to the poverty data in Warwick, 10.1% or 152 single-father households and 3.5% or 132 single-mother households are living below the poverty line. Among single-father households, those with 3 or 4 children have the highest poverty rate, with 94 households (89.5%) experiencing poverty. Likewise, among single-mother households, those with 3 or 4 children have the highest poverty rate, with 37 households (14.2%) falling below the poverty line.
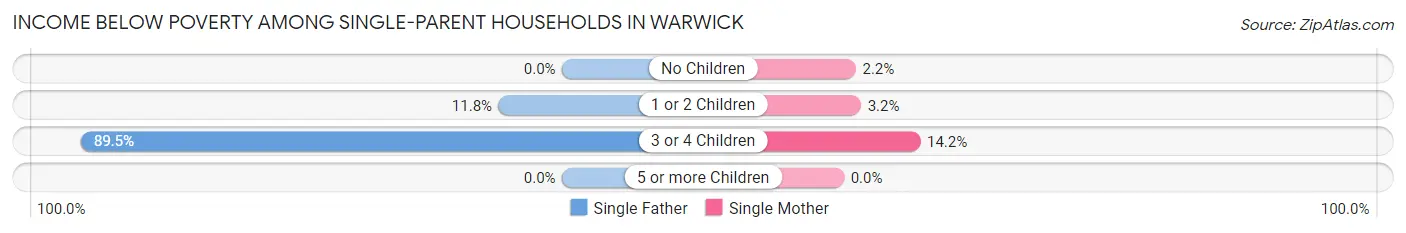
| Children | Single Father | Single Mother |
| No Children | 0 (0.0%) | 38 (2.2%) |
| 1 or 2 Children | 58 (11.8%) | 57 (3.2%) |
| 3 or 4 Children | 94 (89.5%) | 37 (14.2%) |
| 5 or more Children | 0 (0.0%) | 0 (0.0%) |
| Total | 152 (10.1%) | 132 (3.5%) |
Income Below Poverty Among Married-Couple vs Single-Parent Households in Warwick
The poverty data for Warwick shows that 414 of the married-couple family households (2.6%) and 284 of the single-parent households (5.4%) are living below the poverty level. Within the married-couple family households, those with 3 or 4 children have the highest poverty rate, with 32 households (3.8%) falling below the poverty line. Among the single-parent households, those with 3 or 4 children have the highest poverty rate, with 131 household (35.9%) living below poverty.
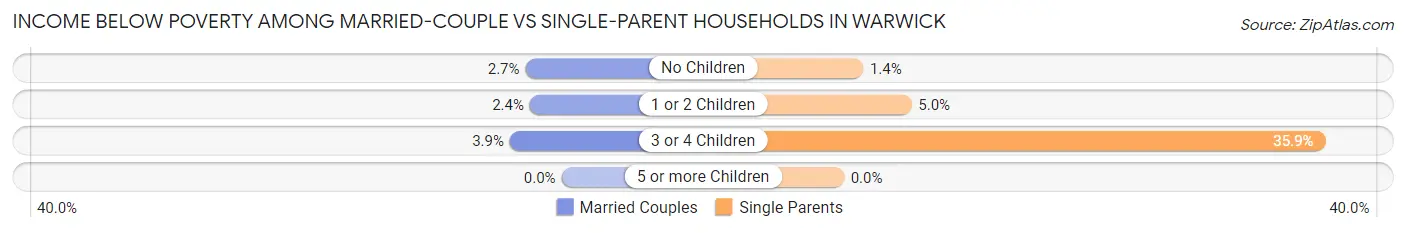
| Children | Married-Couple Families | Single-Parent Households |
| No Children | 267 (2.7%) | 38 (1.4%) |
| 1 or 2 Children | 115 (2.4%) | 115 (5.0%) |
| 3 or 4 Children | 32 (3.8%) | 131 (35.9%) |
| 5 or more Children | 0 (0.0%) | 0 (0.0%) |
| Total | 414 (2.6%) | 284 (5.4%) |
Race in Warwick
The most populous races in Warwick are White / Caucasian (72,417 | 87.5%), Hispanic or Latino (5,269 | 6.4%), and Two or more Races (4,080 | 4.9%).
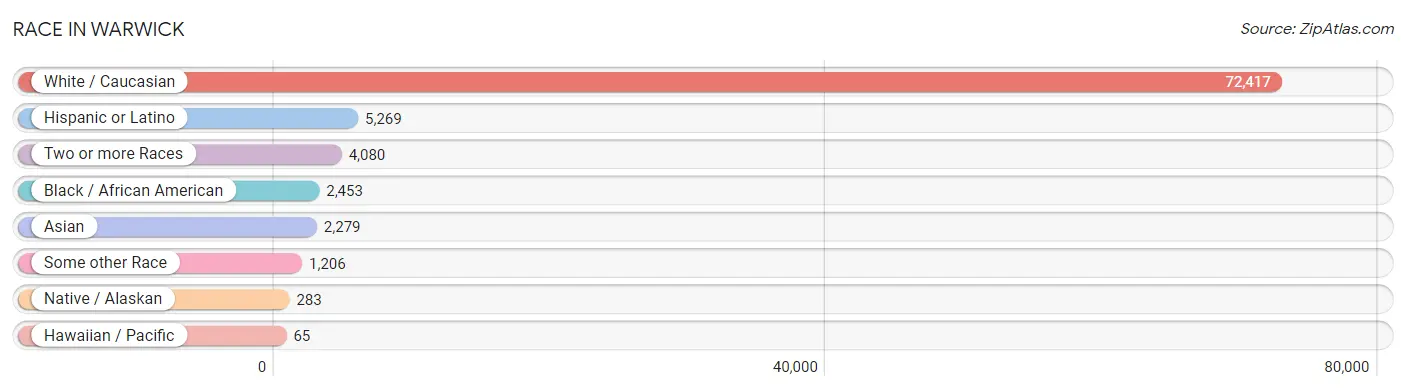
| Race | # Population | % Population |
| Asian | 2,279 | 2.8% |
| Black / African American | 2,453 | 3.0% |
| Hawaiian / Pacific | 65 | 0.1% |
| Hispanic or Latino | 5,269 | 6.4% |
| Native / Alaskan | 283 | 0.3% |
| White / Caucasian | 72,417 | 87.5% |
| Two or more Races | 4,080 | 4.9% |
| Some other Race | 1,206 | 1.5% |
| Total | 82,783 | 100.0% |
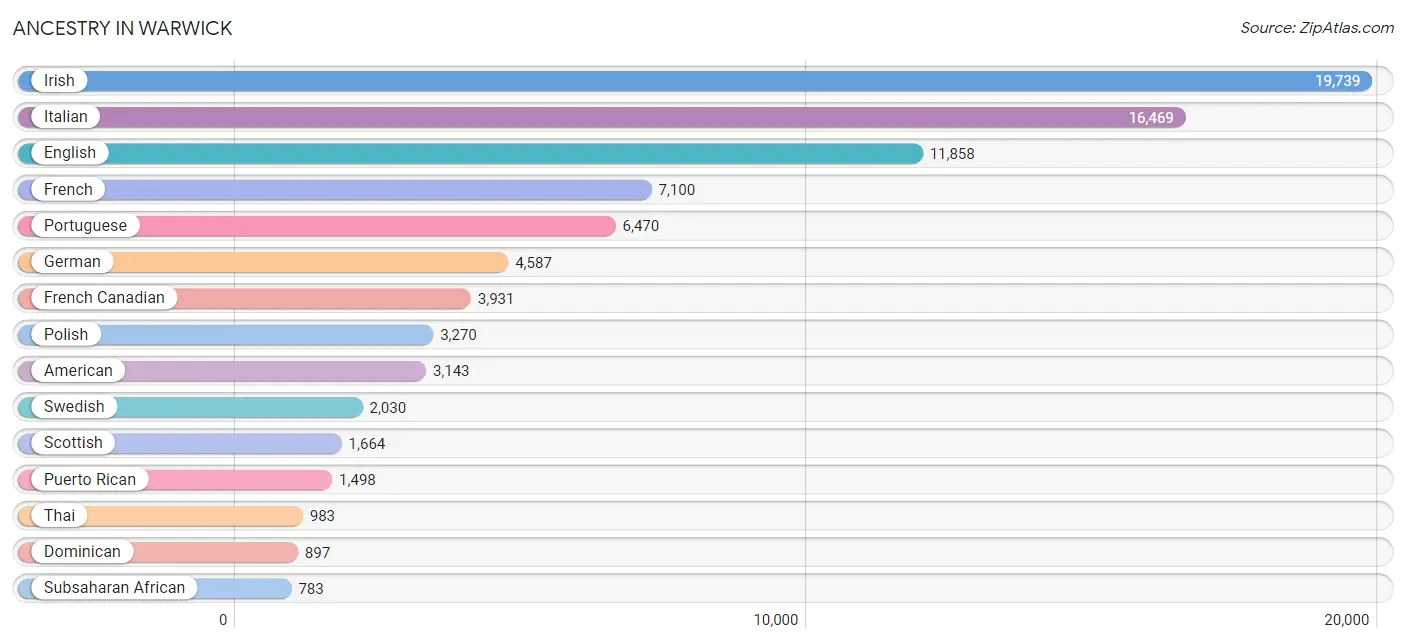
Ancestry in Warwick
The most populous ancestries reported in Warwick are Irish (19,739 | 23.8%), Italian (16,469 | 19.9%), English (11,858 | 14.3%), French (7,100 | 8.6%), and Portuguese (6,470 | 7.8%), together accounting for 74.5% of all Warwick residents.
| Ancestry | # Population | % Population |
| African | 64 | 0.1% |
| Albanian | 28 | 0.0% |
| American | 3,143 | 3.8% |
| Arab | 451 | 0.5% |
| Arapaho | 10 | 0.0% |
| Argentinean | 13 | 0.0% |
| Armenian | 487 | 0.6% |
| Austrian | 142 | 0.2% |
| Bahamian | 13 | 0.0% |
| Bangladeshi | 54 | 0.1% |
| Belgian | 47 | 0.1% |
| Bhutanese | 241 | 0.3% |
| Blackfeet | 14 | 0.0% |
| Bolivian | 126 | 0.2% |
| Brazilian | 141 | 0.2% |
| British | 215 | 0.3% |
| Burmese | 143 | 0.2% |
| Canadian | 190 | 0.2% |
| Cape Verdean | 444 | 0.5% |
| Celtic | 13 | 0.0% |
| Central American | 740 | 0.9% |
| Central American Indian | 114 | 0.1% |
| Cherokee | 67 | 0.1% |
| Chippewa | 14 | 0.0% |
| Choctaw | 5 | 0.0% |
| Colombian | 522 | 0.6% |
| Cree | 8 | 0.0% |
| Croatian | 83 | 0.1% |
| Cuban | 249 | 0.3% |
| Cypriot | 20 | 0.0% |
| Czech | 71 | 0.1% |
| Danish | 81 | 0.1% |
| Dominican | 897 | 1.1% |
| Dutch | 376 | 0.4% |
| Eastern European | 234 | 0.3% |
| Egyptian | 25 | 0.0% |
| English | 11,858 | 14.3% |
| Ethiopian | 4 | 0.0% |
| European | 550 | 0.7% |
| Finnish | 31 | 0.0% |
| French | 7,100 | 8.6% |
| French Canadian | 3,931 | 4.8% |
| German | 4,587 | 5.5% |
| Greek | 469 | 0.6% |
| Guatemalan | 510 | 0.6% |
| Haitian | 471 | 0.6% |
| Honduran | 9 | 0.0% |
| Hungarian | 295 | 0.4% |
| Icelander | 20 | 0.0% |
| Indian (Asian) | 231 | 0.3% |
| Iranian | 14 | 0.0% |
| Irish | 19,739 | 23.8% |
| Iroquois | 12 | 0.0% |
| Italian | 16,469 | 19.9% |
| Jamaican | 389 | 0.5% |
| Japanese | 313 | 0.4% |
| Korean | 434 | 0.5% |
| Lebanese | 72 | 0.1% |
| Liberian | 52 | 0.1% |
| Lithuanian | 325 | 0.4% |
| Malaysian | 133 | 0.2% |
| Mexican | 642 | 0.8% |
| Mexican American Indian | 42 | 0.1% |
| Moroccan | 146 | 0.2% |
| Navajo | 14 | 0.0% |
| Nigerian | 94 | 0.1% |
| Northern European | 48 | 0.1% |
| Norwegian | 209 | 0.3% |
| Pakistani | 118 | 0.1% |
| Palestinian | 10 | 0.0% |
| Panamanian | 44 | 0.1% |
| Pennsylvania German | 17 | 0.0% |
| Peruvian | 37 | 0.0% |
| Polish | 3,270 | 4.0% |
| Portuguese | 6,470 | 7.8% |
| Pueblo | 10 | 0.0% |
| Puerto Rican | 1,498 | 1.8% |
| Romanian | 89 | 0.1% |
| Russian | 468 | 0.6% |
| Salvadoran | 82 | 0.1% |
| Scandinavian | 68 | 0.1% |
| Scotch-Irish | 407 | 0.5% |
| Scottish | 1,664 | 2.0% |
| Senegalese | 96 | 0.1% |
| Slavic | 10 | 0.0% |
| Slovak | 106 | 0.1% |
| Slovene | 9 | 0.0% |
| South African | 15 | 0.0% |
| South American | 746 | 0.9% |
| Spaniard | 26 | 0.0% |
| Spanish | 295 | 0.4% |
| Sri Lankan | 83 | 0.1% |
| Subsaharan African | 783 | 0.9% |
| Swedish | 2,030 | 2.5% |
| Swiss | 56 | 0.1% |
| Syrian | 72 | 0.1% |
| Thai | 983 | 1.2% |
| Turkish | 11 | 0.0% |
| Ukrainian | 359 | 0.4% |
| Venezuelan | 48 | 0.1% |
| Welsh | 225 | 0.3% |
| West Indian | 27 | 0.0% | View All 102 Rows |
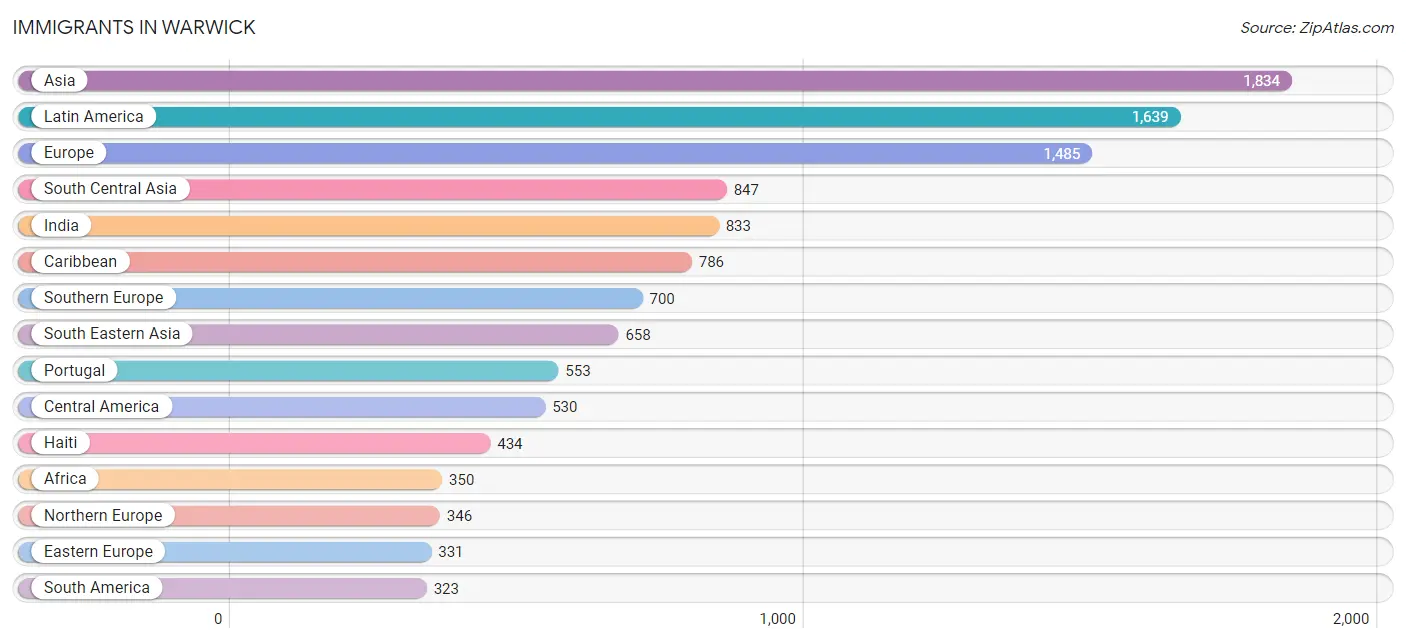
Immigrants in Warwick
The most numerous immigrant groups reported in Warwick came from Asia (1,834 | 2.2%), Latin America (1,639 | 2.0%), Europe (1,485 | 1.8%), South Central Asia (847 | 1.0%), and India (833 | 1.0%), together accounting for 8.0% of all Warwick residents.
| Immigration Origin | # Population | % Population |
| Africa | 350 | 0.4% |
| Albania | 20 | 0.0% |
| Argentina | 13 | 0.0% |
| Asia | 1,834 | 2.2% |
| Australia | 12 | 0.0% |
| Austria | 12 | 0.0% |
| Azores | 148 | 0.2% |
| Belarus | 13 | 0.0% |
| Belgium | 3 | 0.0% |
| Bolivia | 54 | 0.1% |
| Brazil | 90 | 0.1% |
| Cabo Verde | 53 | 0.1% |
| Cambodia | 110 | 0.1% |
| Cameroon | 31 | 0.0% |
| Canada | 91 | 0.1% |
| Caribbean | 786 | 0.9% |
| Central America | 530 | 0.6% |
| China | 76 | 0.1% |
| Colombia | 81 | 0.1% |
| Cuba | 24 | 0.0% |
| Denmark | 20 | 0.0% |
| Dominican Republic | 279 | 0.3% |
| Eastern Asia | 208 | 0.3% |
| Eastern Europe | 331 | 0.4% |
| Egypt | 25 | 0.0% |
| El Salvador | 108 | 0.1% |
| England | 102 | 0.1% |
| Europe | 1,485 | 1.8% |
| France | 20 | 0.0% |
| Germany | 60 | 0.1% |
| Greece | 41 | 0.1% |
| Guatemala | 245 | 0.3% |
| Haiti | 434 | 0.5% |
| Hungary | 11 | 0.0% |
| India | 833 | 1.0% |
| Iran | 14 | 0.0% |
| Ireland | 120 | 0.1% |
| Italy | 106 | 0.1% |
| Jamaica | 33 | 0.0% |
| Japan | 59 | 0.1% |
| Jordan | 45 | 0.1% |
| Korea | 73 | 0.1% |
| Laos | 171 | 0.2% |
| Latin America | 1,639 | 2.0% |
| Lebanon | 14 | 0.0% |
| Liberia | 22 | 0.0% |
| Mexico | 177 | 0.2% |
| Middle Africa | 31 | 0.0% |
| Morocco | 35 | 0.0% |
| Netherlands | 13 | 0.0% |
| Nigeria | 53 | 0.1% |
| Northern Africa | 60 | 0.1% |
| Northern Europe | 346 | 0.4% |
| Oceania | 12 | 0.0% |
| Peru | 37 | 0.0% |
| Philippines | 281 | 0.3% |
| Poland | 34 | 0.0% |
| Portugal | 553 | 0.7% |
| Romania | 28 | 0.0% |
| Russia | 130 | 0.2% |
| Scotland | 66 | 0.1% |
| Senegal | 106 | 0.1% |
| South Africa | 25 | 0.0% |
| South America | 323 | 0.4% |
| South Central Asia | 847 | 1.0% |
| South Eastern Asia | 658 | 0.8% |
| Southern Europe | 700 | 0.9% |
| Sweden | 5 | 0.0% |
| Syria | 62 | 0.1% |
| Thailand | 86 | 0.1% |
| Trinidad and Tobago | 16 | 0.0% |
| Ukraine | 95 | 0.1% |
| Venezuela | 48 | 0.1% |
| Vietnam | 10 | 0.0% |
| Western Africa | 234 | 0.3% |
| Western Asia | 121 | 0.2% |
| Western Europe | 108 | 0.1% | View All 77 Rows |
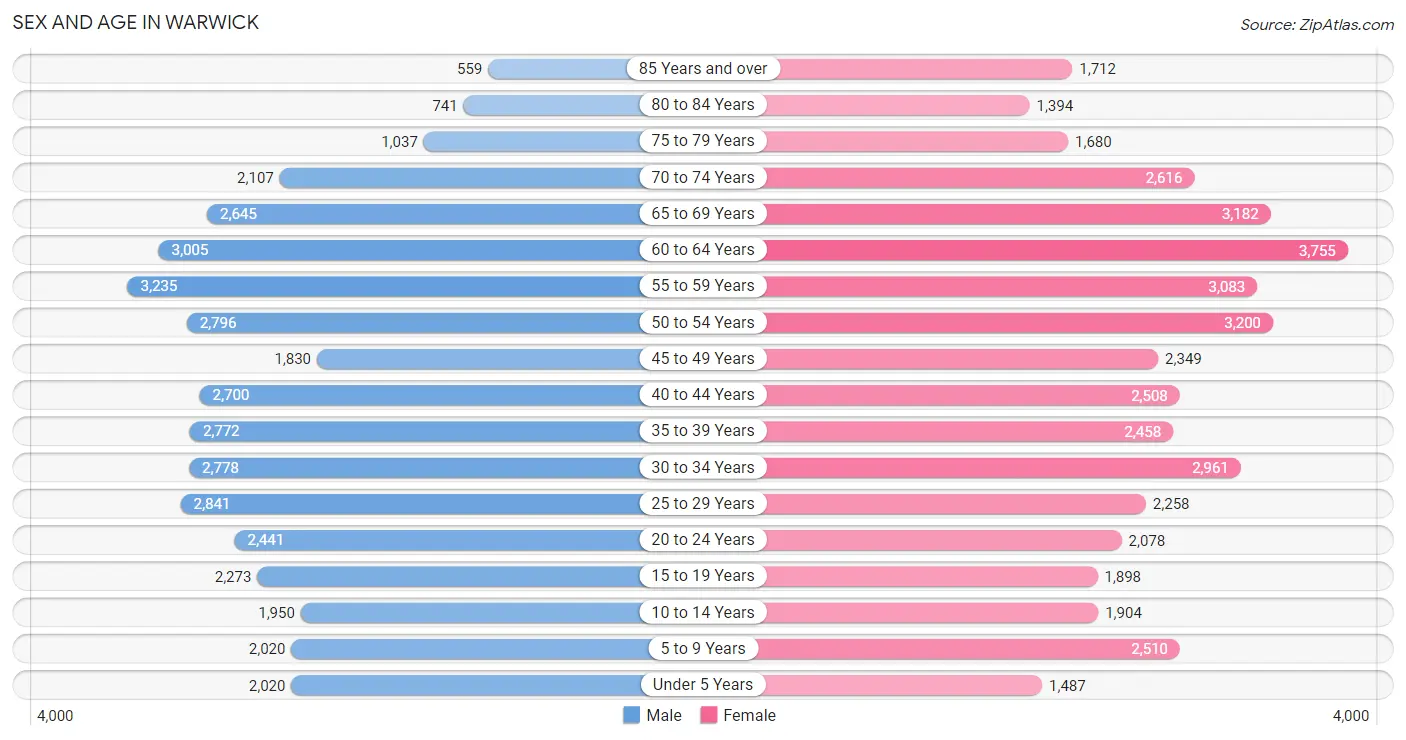
Sex and Age in Warwick
Sex and Age in Warwick
The most populous age groups in Warwick are 55 to 59 Years (3,235 | 8.1%) for men and 60 to 64 Years (3,755 | 8.7%) for women.
| Age Bracket | Male | Female |
| Under 5 Years | 2,020 (5.1%) | 1,487 (3.5%) |
| 5 to 9 Years | 2,020 (5.1%) | 2,510 (5.8%) |
| 10 to 14 Years | 1,950 (4.9%) | 1,904 (4.4%) |
| 15 to 19 Years | 2,273 (5.7%) | 1,898 (4.4%) |
| 20 to 24 Years | 2,441 (6.1%) | 2,078 (4.8%) |
| 25 to 29 Years | 2,841 (7.1%) | 2,258 (5.2%) |
| 30 to 34 Years | 2,778 (7.0%) | 2,961 (6.9%) |
| 35 to 39 Years | 2,772 (7.0%) | 2,458 (5.7%) |
| 40 to 44 Years | 2,700 (6.8%) | 2,508 (5.8%) |
| 45 to 49 Years | 1,830 (4.6%) | 2,349 (5.5%) |
| 50 to 54 Years | 2,796 (7.0%) | 3,200 (7.4%) |
| 55 to 59 Years | 3,235 (8.1%) | 3,083 (7.2%) |
| 60 to 64 Years | 3,005 (7.6%) | 3,755 (8.7%) |
| 65 to 69 Years | 2,645 (6.7%) | 3,182 (7.4%) |
| 70 to 74 Years | 2,107 (5.3%) | 2,616 (6.1%) |
| 75 to 79 Years | 1,037 (2.6%) | 1,680 (3.9%) |
| 80 to 84 Years | 741 (1.9%) | 1,394 (3.2%) |
| 85 Years and over | 559 (1.4%) | 1,712 (4.0%) |
| Total | 39,750 (100.0%) | 43,033 (100.0%) |
Families and Households in Warwick
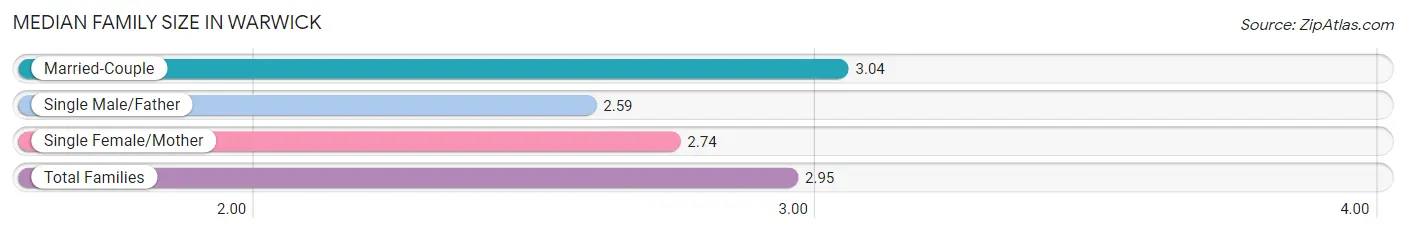
Median Family Size in Warwick
The median family size in Warwick is 2.95 persons per family, with married-couple families (15,674 | 74.8%) accounting for the largest median family size of 3.04 persons per family. On the other hand, single male/father families (1,508 | 7.2%) represent the smallest median family size with 2.59 persons per family.
| Family Type | # Families | Family Size |
| Married-Couple | 15,674 (74.8%) | 3.04 |
| Single Male/Father | 1,508 (7.2%) | 2.59 |
| Single Female/Mother | 3,776 (18.0%) | 2.74 |
| Total Families | 20,958 (100.0%) | 2.95 |
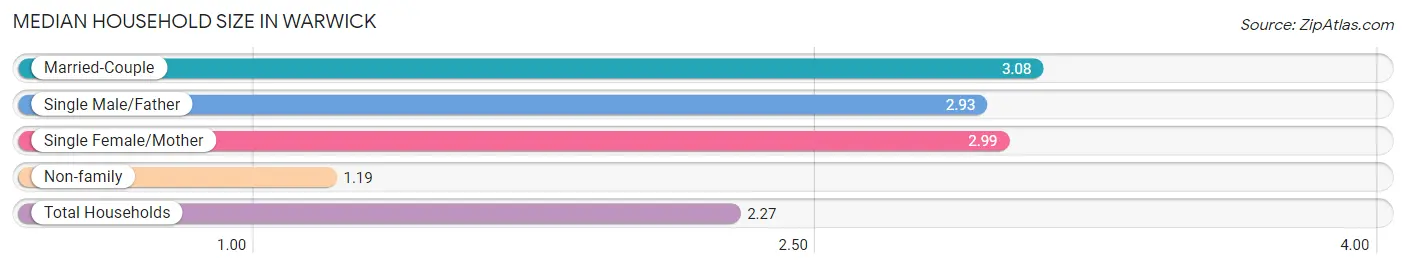
Median Household Size in Warwick
The median household size in Warwick is 2.27 persons per household, with married-couple households (15,674 | 43.4%) accounting for the largest median household size of 3.08 persons per household. non-family households (15,185 | 42.0%) represent the smallest median household size with 1.19 persons per household.
| Household Type | # Households | Household Size |
| Married-Couple | 15,674 (43.4%) | 3.08 |
| Single Male/Father | 1,508 (4.2%) | 2.93 |
| Single Female/Mother | 3,776 (10.4%) | 2.99 |
| Non-family | 15,185 (42.0%) | 1.19 |
| Total Households | 36,143 (100.0%) | 2.27 |
Household Size by Marriage Status in Warwick
Out of a total of 36,143 households in Warwick, 20,958 (58.0%) are family households, while 15,185 (42.0%) are nonfamily households. The most numerous type of family households are 2-person households, comprising 9,310, and the most common type of nonfamily households are 1-person households, comprising 12,381.
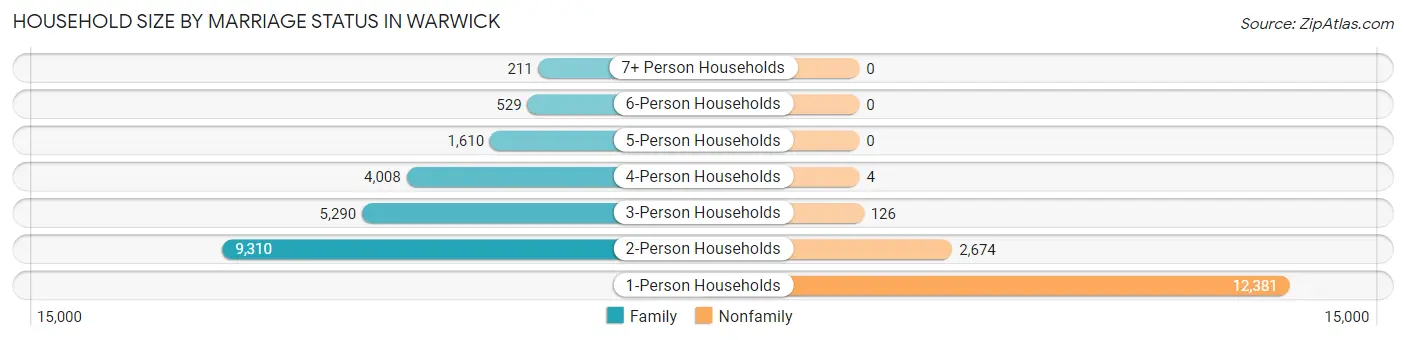
| Household Size | Family Households | Nonfamily Households |
| 1-Person Households | - | 12,381 (34.3%) |
| 2-Person Households | 9,310 (25.8%) | 2,674 (7.4%) |
| 3-Person Households | 5,290 (14.6%) | 126 (0.4%) |
| 4-Person Households | 4,008 (11.1%) | 4 (0.0%) |
| 5-Person Households | 1,610 (4.4%) | 0 (0.0%) |
| 6-Person Households | 529 (1.5%) | 0 (0.0%) |
| 7+ Person Households | 211 (0.6%) | 0 (0.0%) |
| Total | 20,958 (58.0%) | 15,185 (42.0%) |
Female Fertility in Warwick
Fertility by Age in Warwick
Average fertility rate in Warwick is 51.0 births per 1,000 women. Women in the age bracket of 20 to 34 years have the highest fertility rate with 92.0 births per 1,000 women. Women in the age bracket of 20 to 34 years acount for 77.0% of all women with births.
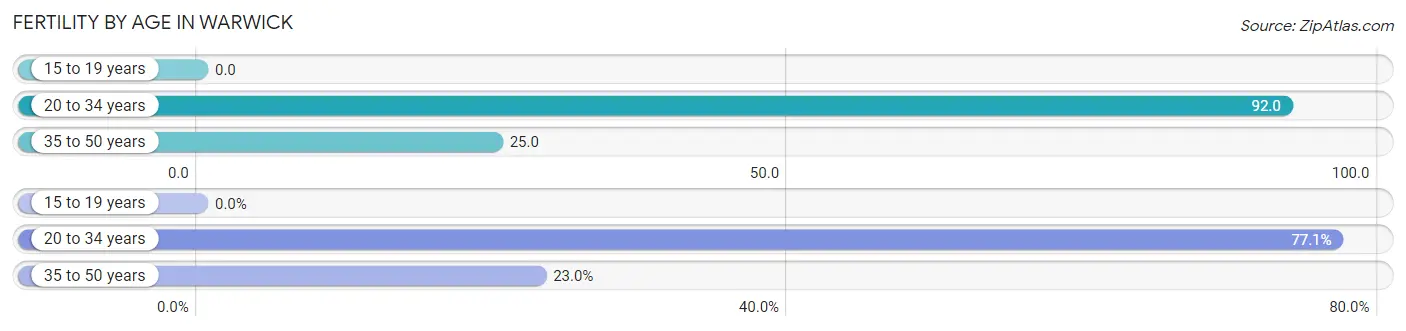
| Age Bracket | Women with Births | Births / 1,000 Women |
| 15 to 19 years | 0 (0.0%) | 0.0 |
| 20 to 34 years | 668 (77.0%) | 92.0 |
| 35 to 50 years | 199 (23.0%) | 25.0 |
| Total | 867 (100.0%) | 51.0 |
Fertility by Age by Marriage Status in Warwick
80.2% of women with births (867) in Warwick are married. The highest percentage of unmarried women with births falls into 35 to 50 years age bracket with 28.1% of them unmarried at the time of birth, while the lowest percentage of unmarried women with births belong to 20 to 34 years age bracket with 17.4% of them unmarried.
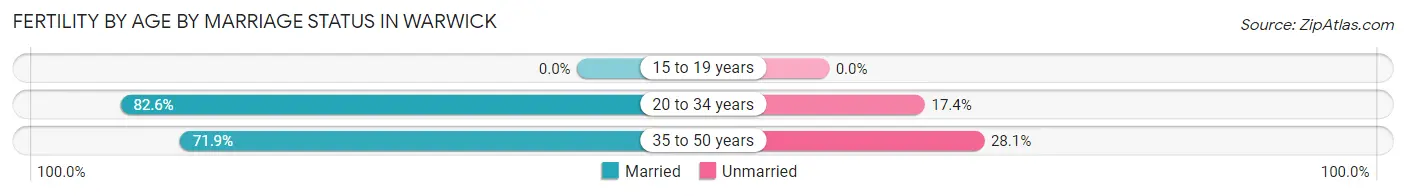
| Age Bracket | Married | Unmarried |
| 15 to 19 years | 0 (0.0%) | 0 (0.0%) |
| 20 to 34 years | 552 (82.6%) | 116 (17.4%) |
| 35 to 50 years | 143 (71.9%) | 56 (28.1%) |
| Total | 695 (80.2%) | 172 (19.8%) |
Fertility by Education in Warwick
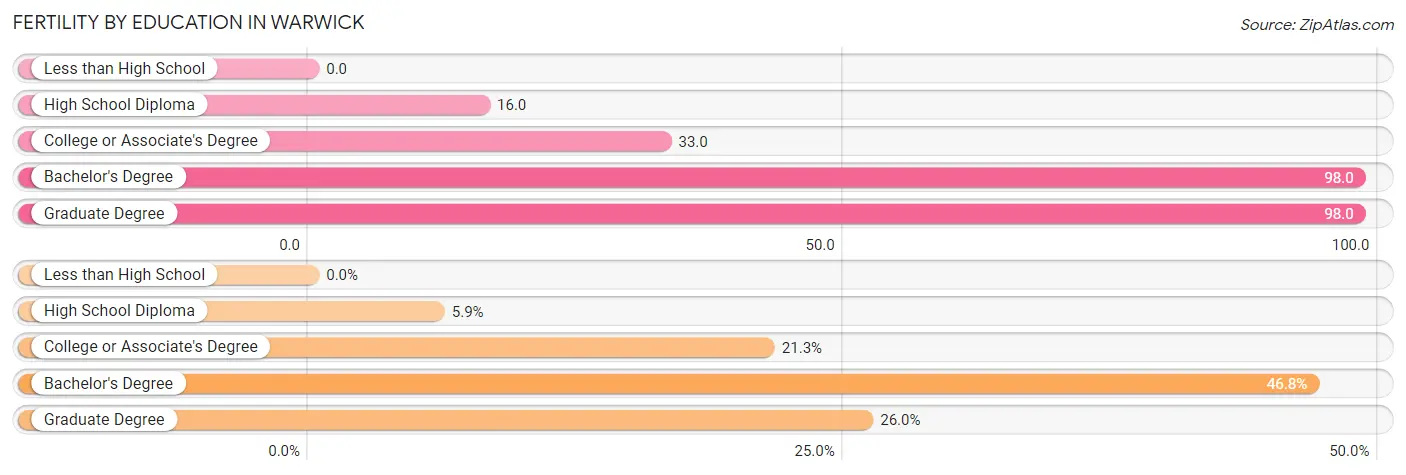
| Educational Attainment | Women with Births | Births / 1,000 Women |
| Less than High School | 0 (0.0%) | 0.0 |
| High School Diploma | 51 (5.9%) | 16.0 |
| College or Associate's Degree | 185 (21.3%) | 33.0 |
| Bachelor's Degree | 406 (46.8%) | 98.0 |
| Graduate Degree | 225 (26.0%) | 98.0 |
| Total | 867 (100.0%) | 51.0 |
Fertility by Education by Marriage Status in Warwick
19.8% of women with births in Warwick are unmarried. Women with the educational attainment of graduate degree are most likely to be married with 93.8% of them married at childbirth, while women with the educational attainment of high school diploma are least likely to be married with 92.2% of them unmarried at childbirth.
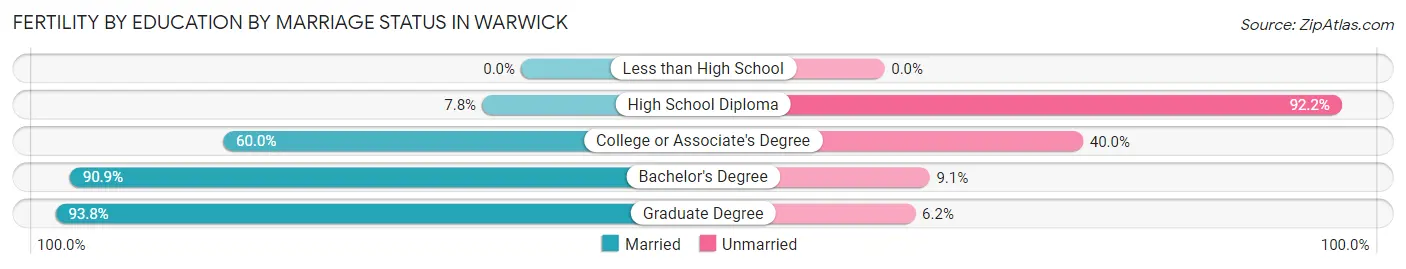
| Educational Attainment | Married | Unmarried |
| Less than High School | 0 (0.0%) | 0 (0.0%) |
| High School Diploma | 4 (7.8%) | 47 (92.2%) |
| College or Associate's Degree | 111 (60.0%) | 74 (40.0%) |
| Bachelor's Degree | 369 (90.9%) | 37 (9.1%) |
| Graduate Degree | 211 (93.8%) | 14 (6.2%) |
| Total | 695 (80.2%) | 172 (19.8%) |
Employment Characteristics in Warwick
Employment by Class of Employer in Warwick
Among the 41,953 employed individuals in Warwick, private company employees (27,434 | 65.4%), not-for-profit organizations (5,335 | 12.7%), and local government employees (2,827 | 6.7%) make up the most common classes of employment.
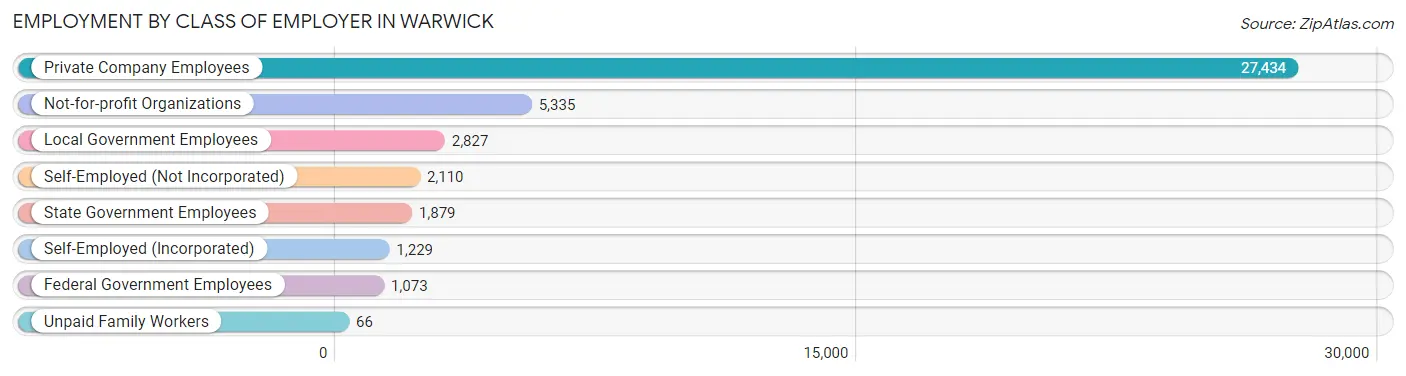
| Employer Class | # Employees | % Employees |
| Private Company Employees | 27,434 | 65.4% |
| Self-Employed (Incorporated) | 1,229 | 2.9% |
| Self-Employed (Not Incorporated) | 2,110 | 5.0% |
| Not-for-profit Organizations | 5,335 | 12.7% |
| Local Government Employees | 2,827 | 6.7% |
| State Government Employees | 1,879 | 4.5% |
| Federal Government Employees | 1,073 | 2.6% |
| Unpaid Family Workers | 66 | 0.2% |
| Total | 41,953 | 100.0% |
Employment Status by Age in Warwick
According to the labor force statistics for Warwick, out of the total population over 16 years of age (70,109), 64.7% or 45,361 individuals are in the labor force, with 5.1% or 2,313 of them unemployed. The age group with the highest labor force participation rate is 25 to 29 years, with 89.1% or 4,543 individuals in the labor force. Within the labor force, the 20 to 24 years age range has the highest percentage of unemployed individuals, with 11.9% or 412 of them being unemployed.
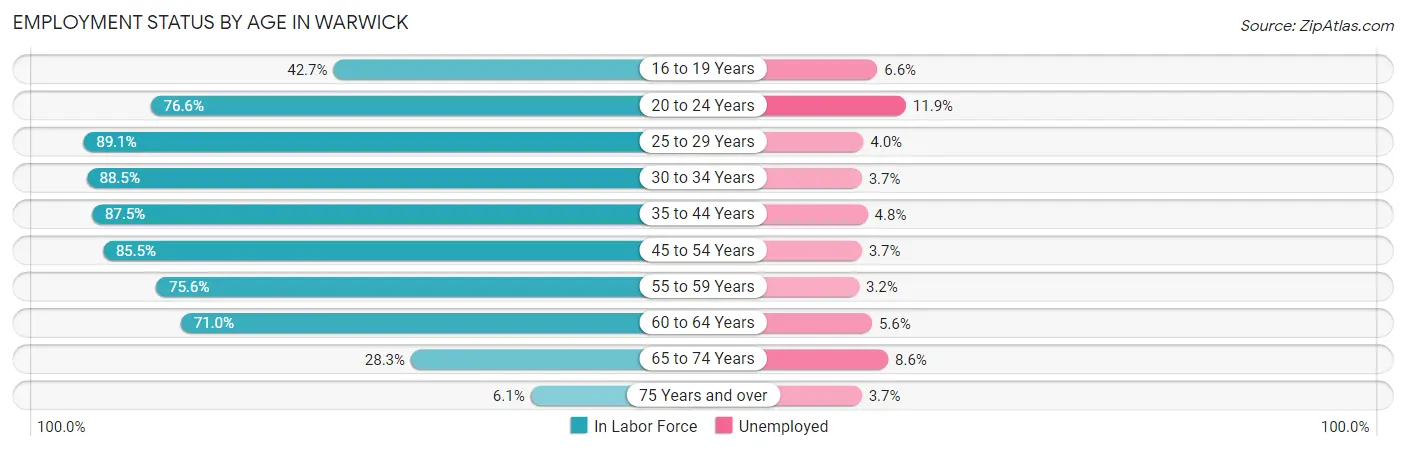
| Age Bracket | In Labor Force | Unemployed |
| 16 to 19 Years | 1,447 (42.7%) | 96 (6.6%) |
| 20 to 24 Years | 3,462 (76.6%) | 412 (11.9%) |
| 25 to 29 Years | 4,543 (89.1%) | 182 (4.0%) |
| 30 to 34 Years | 5,079 (88.5%) | 188 (3.7%) |
| 35 to 44 Years | 9,133 (87.5%) | 438 (4.8%) |
| 45 to 54 Years | 8,700 (85.5%) | 322 (3.7%) |
| 55 to 59 Years | 4,776 (75.6%) | 153 (3.2%) |
| 60 to 64 Years | 4,800 (71.0%) | 269 (5.6%) |
| 65 to 74 Years | 2,986 (28.3%) | 257 (8.6%) |
| 75 Years and over | 435 (6.1%) | 16 (3.7%) |
| Total | 45,361 (64.7%) | 2,313 (5.1%) |
Employment Status by Educational Attainment in Warwick
According to labor force statistics for Warwick, 83.2% of individuals (37,048) out of the total population between 25 and 64 years of age (44,529) are in the labor force, with 4.2% or 1,556 of them being unemployed. The group with the highest labor force participation rate are those with the educational attainment of bachelor's degree or higher, with 90.6% or 13,894 individuals in the labor force. Within the labor force, individuals with less than high school education have the highest percentage of unemployment, with 9.3% or 121 of them being unemployed.
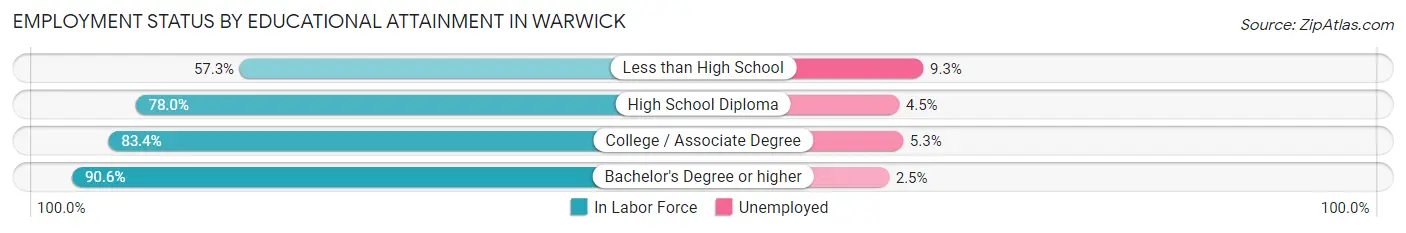
| Educational Attainment | In Labor Force | Unemployed |
| Less than High School | 1,297 (57.3%) | 211 (9.3%) |
| High School Diploma | 9,043 (78.0%) | 522 (4.5%) |
| College / Associate Degree | 12,789 (83.4%) | 813 (5.3%) |
| Bachelor's Degree or higher | 13,894 (90.6%) | 383 (2.5%) |
| Total | 37,048 (83.2%) | 1,870 (4.2%) |
Employment Occupations by Sex in Warwick
Management, Business, Science and Arts Occupations
The most common Management, Business, Science and Arts occupations in Warwick are Management (5,111 | 11.9%), Community & Social Service (4,743 | 11.1%), Business & Financial (3,397 | 7.9%), Computers, Engineering & Science (2,991 | 7.0%), and Health Diagnosing & Treating (2,862 | 6.7%).
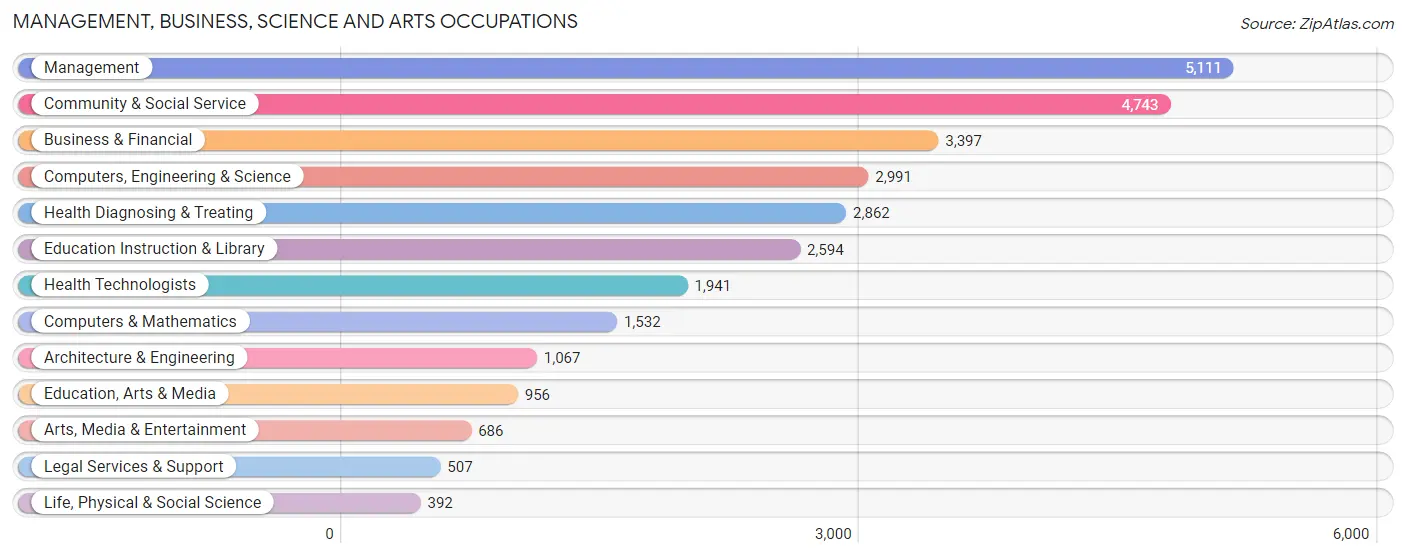
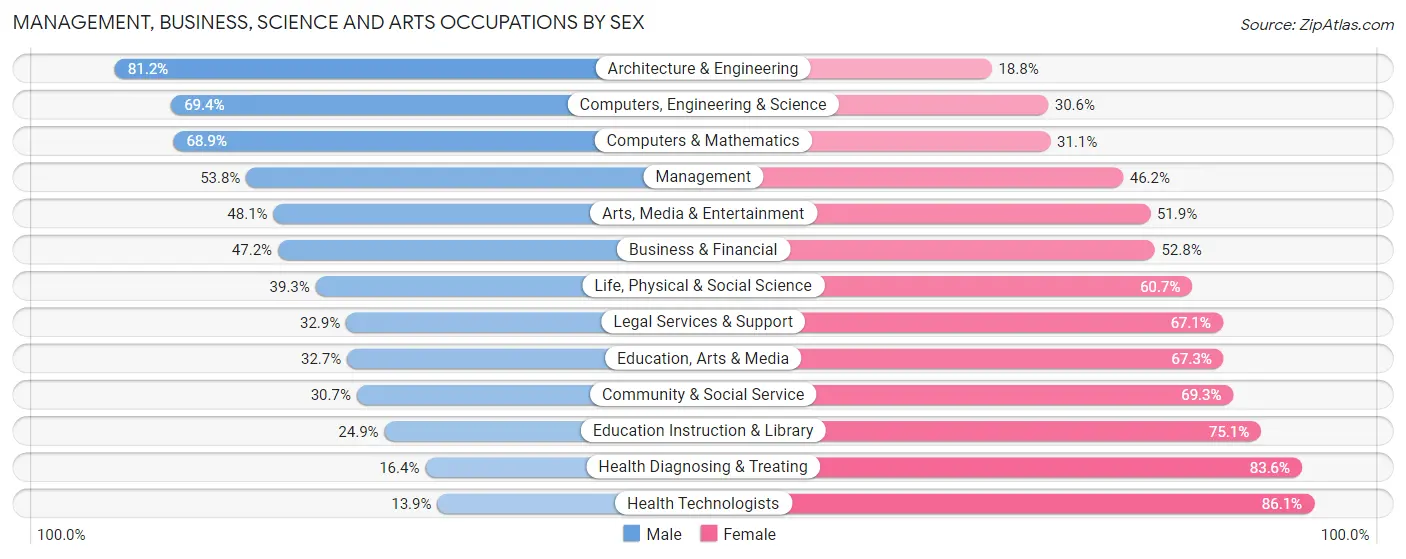
Management, Business, Science and Arts Occupations by Sex
Within the Management, Business, Science and Arts occupations in Warwick, the most male-oriented occupations are Architecture & Engineering (81.2%), Computers, Engineering & Science (69.4%), and Computers & Mathematics (68.9%), while the most female-oriented occupations are Health Technologists (86.1%), Health Diagnosing & Treating (83.6%), and Education Instruction & Library (75.1%).
| Occupation | Male | Female |
| Management | 2,748 (53.8%) | 2,363 (46.2%) |
| Business & Financial | 1,602 (47.2%) | 1,795 (52.8%) |
| Computers, Engineering & Science | 2,076 (69.4%) | 915 (30.6%) |
| Computers & Mathematics | 1,056 (68.9%) | 476 (31.1%) |
| Architecture & Engineering | 866 (81.2%) | 201 (18.8%) |
| Life, Physical & Social Science | 154 (39.3%) | 238 (60.7%) |
| Community & Social Service | 1,457 (30.7%) | 3,286 (69.3%) |
| Education, Arts & Media | 313 (32.7%) | 643 (67.3%) |
| Legal Services & Support | 167 (32.9%) | 340 (67.1%) |
| Education Instruction & Library | 647 (24.9%) | 1,947 (75.1%) |
| Arts, Media & Entertainment | 330 (48.1%) | 356 (51.9%) |
| Health Diagnosing & Treating | 470 (16.4%) | 2,392 (83.6%) |
| Health Technologists | 270 (13.9%) | 1,671 (86.1%) |
| Total (Category) | 8,353 (43.7%) | 10,751 (56.3%) |
| Total (Overall) | 22,242 (51.8%) | 20,686 (48.2%) |
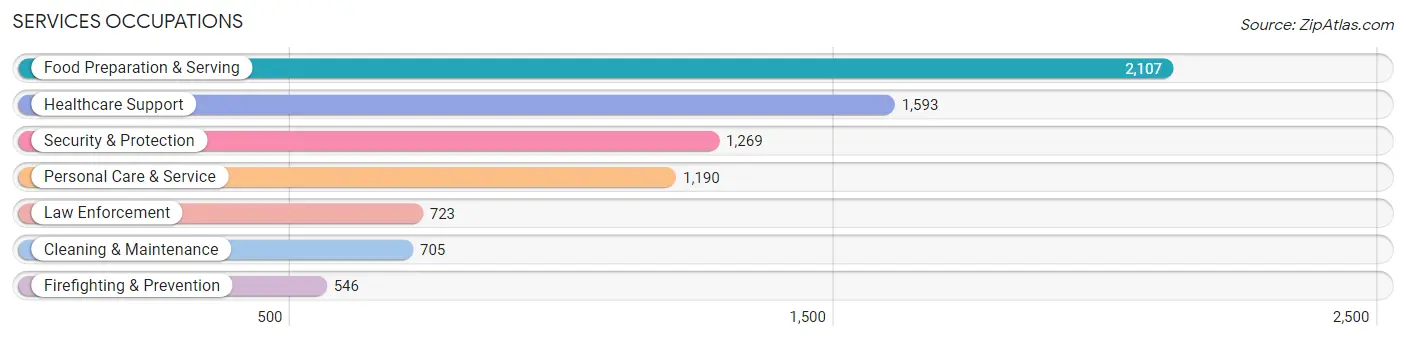
Services Occupations
The most common Services occupations in Warwick are Food Preparation & Serving (2,107 | 4.9%), Healthcare Support (1,593 | 3.7%), Security & Protection (1,269 | 3.0%), Personal Care & Service (1,190 | 2.8%), and Law Enforcement (723 | 1.7%).
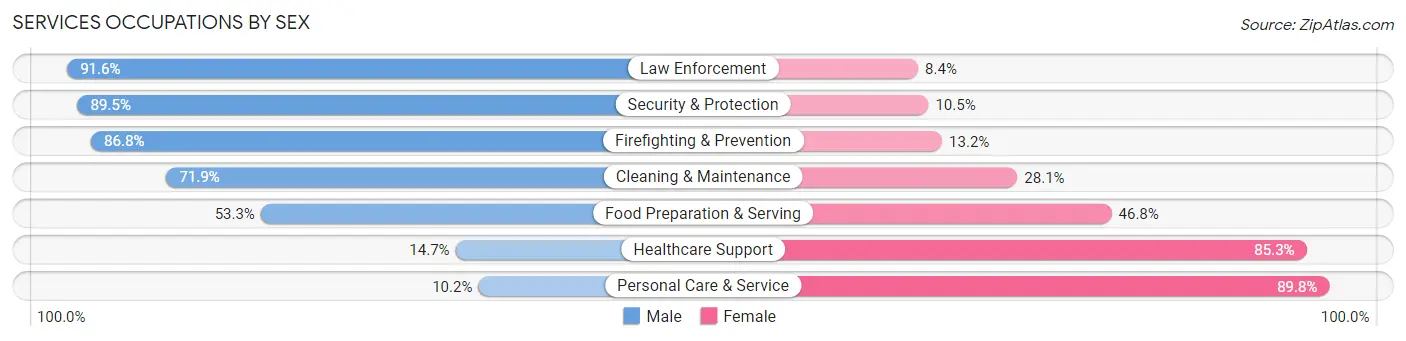
Services Occupations by Sex
Within the Services occupations in Warwick, the most male-oriented occupations are Law Enforcement (91.6%), Security & Protection (89.5%), and Firefighting & Prevention (86.8%), while the most female-oriented occupations are Personal Care & Service (89.8%), Healthcare Support (85.3%), and Food Preparation & Serving (46.8%).
| Occupation | Male | Female |
| Healthcare Support | 234 (14.7%) | 1,359 (85.3%) |
| Security & Protection | 1,136 (89.5%) | 133 (10.5%) |
| Firefighting & Prevention | 474 (86.8%) | 72 (13.2%) |
| Law Enforcement | 662 (91.6%) | 61 (8.4%) |
| Food Preparation & Serving | 1,122 (53.2%) | 985 (46.8%) |
| Cleaning & Maintenance | 507 (71.9%) | 198 (28.1%) |
| Personal Care & Service | 121 (10.2%) | 1,069 (89.8%) |
| Total (Category) | 3,120 (45.5%) | 3,744 (54.5%) |
| Total (Overall) | 22,242 (51.8%) | 20,686 (48.2%) |
Sales and Office Occupations
The most common Sales and Office occupations in Warwick are Office & Administration (4,910 | 11.4%), and Sales & Related (4,304 | 10.0%).

Sales and Office Occupations by Sex
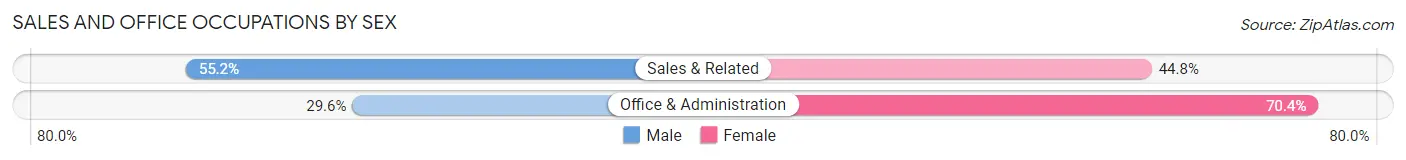
| Occupation | Male | Female |
| Sales & Related | 2,376 (55.2%) | 1,928 (44.8%) |
| Office & Administration | 1,453 (29.6%) | 3,457 (70.4%) |
| Total (Category) | 3,829 (41.6%) | 5,385 (58.4%) |
| Total (Overall) | 22,242 (51.8%) | 20,686 (48.2%) |
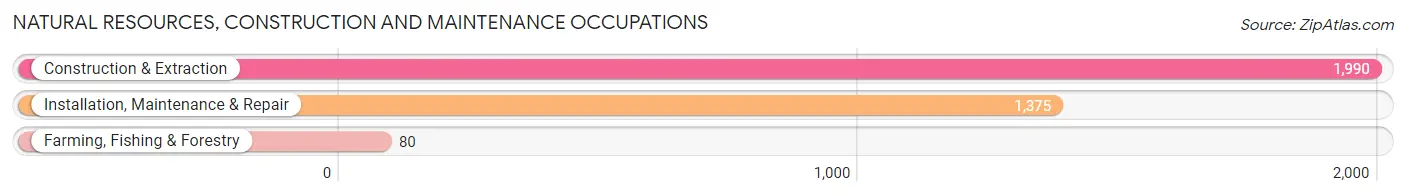
Natural Resources, Construction and Maintenance Occupations
The most common Natural Resources, Construction and Maintenance occupations in Warwick are Construction & Extraction (1,990 | 4.6%), Installation, Maintenance & Repair (1,375 | 3.2%), and Farming, Fishing & Forestry (80 | 0.2%).
Natural Resources, Construction and Maintenance Occupations by Sex
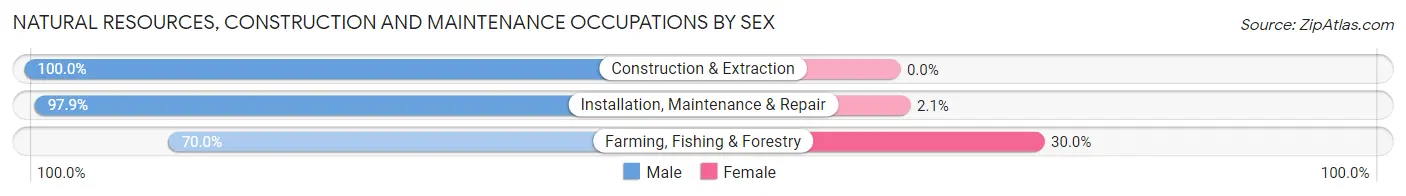
| Occupation | Male | Female |
| Farming, Fishing & Forestry | 56 (70.0%) | 24 (30.0%) |
| Construction & Extraction | 1,990 (100.0%) | 0 (0.0%) |
| Installation, Maintenance & Repair | 1,346 (97.9%) | 29 (2.1%) |
| Total (Category) | 3,392 (98.5%) | 53 (1.5%) |
| Total (Overall) | 22,242 (51.8%) | 20,686 (48.2%) |
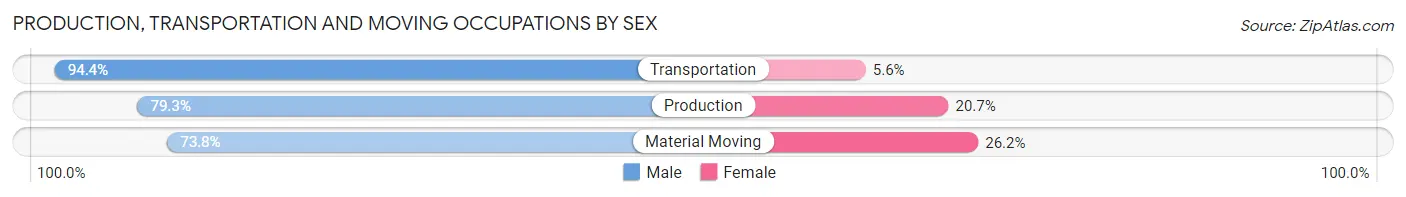
Production, Transportation and Moving Occupations
The most common Production, Transportation and Moving occupations in Warwick are Production (1,476 | 3.4%), Transportation (1,420 | 3.3%), and Material Moving (1,405 | 3.3%).
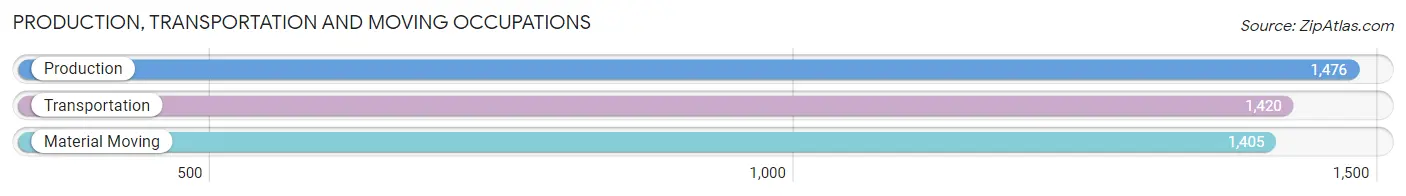
Production, Transportation and Moving Occupations by Sex
| Occupation | Male | Female |
| Production | 1,170 (79.3%) | 306 (20.7%) |
| Transportation | 1,341 (94.4%) | 79 (5.6%) |
| Material Moving | 1,037 (73.8%) | 368 (26.2%) |
| Total (Category) | 3,548 (82.5%) | 753 (17.5%) |
| Total (Overall) | 22,242 (51.8%) | 20,686 (48.2%) |
Employment Industries by Sex in Warwick
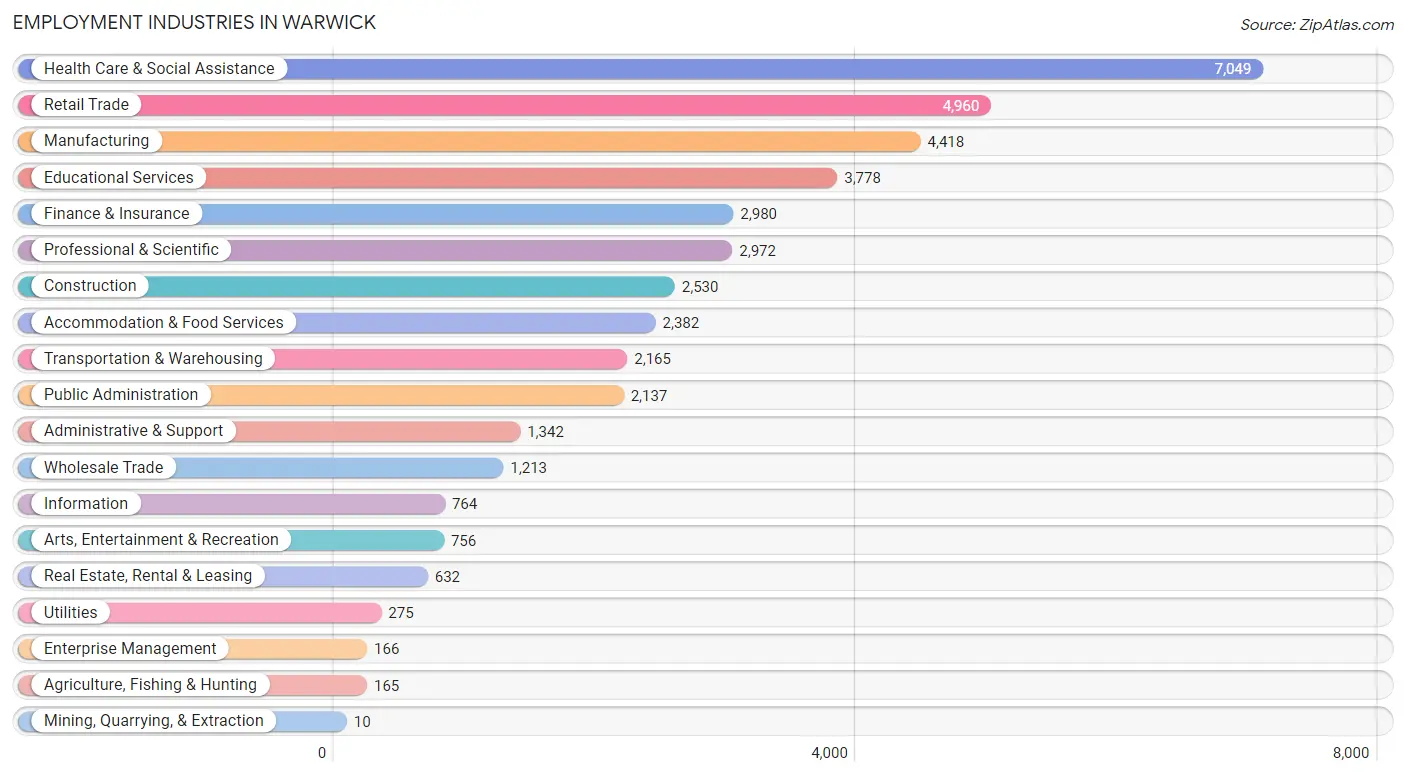
Employment Industries in Warwick
The major employment industries in Warwick include Health Care & Social Assistance (7,049 | 16.4%), Retail Trade (4,960 | 11.6%), Manufacturing (4,418 | 10.3%), Educational Services (3,778 | 8.8%), and Finance & Insurance (2,980 | 6.9%).
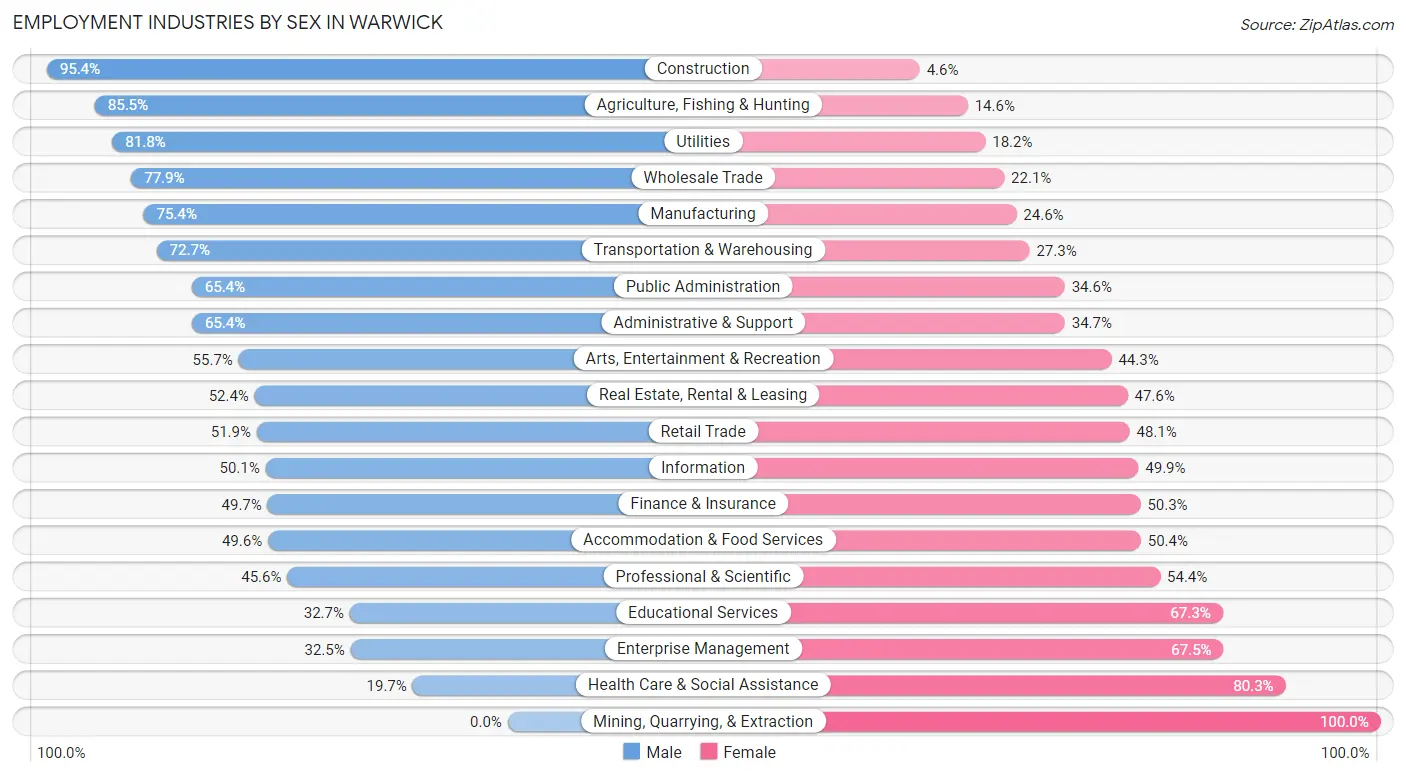
Employment Industries by Sex in Warwick
The Warwick industries that see more men than women are Construction (95.4%), Agriculture, Fishing & Hunting (85.5%), and Utilities (81.8%), whereas the industries that tend to have a higher number of women are Mining, Quarrying, & Extraction (100.0%), Health Care & Social Assistance (80.3%), and Enterprise Management (67.5%).
| Industry | Male | Female |
| Agriculture, Fishing & Hunting | 141 (85.5%) | 24 (14.5%) |
| Mining, Quarrying, & Extraction | 0 (0.0%) | 10 (100.0%) |
| Construction | 2,413 (95.4%) | 117 (4.6%) |
| Manufacturing | 3,330 (75.4%) | 1,088 (24.6%) |
| Wholesale Trade | 945 (77.9%) | 268 (22.1%) |
| Retail Trade | 2,576 (51.9%) | 2,384 (48.1%) |
| Transportation & Warehousing | 1,573 (72.7%) | 592 (27.3%) |
| Utilities | 225 (81.8%) | 50 (18.2%) |
| Information | 383 (50.1%) | 381 (49.9%) |
| Finance & Insurance | 1,481 (49.7%) | 1,499 (50.3%) |
| Real Estate, Rental & Leasing | 331 (52.4%) | 301 (47.6%) |
| Professional & Scientific | 1,356 (45.6%) | 1,616 (54.4%) |
| Enterprise Management | 54 (32.5%) | 112 (67.5%) |
| Administrative & Support | 877 (65.3%) | 465 (34.6%) |
| Educational Services | 1,235 (32.7%) | 2,543 (67.3%) |
| Health Care & Social Assistance | 1,388 (19.7%) | 5,661 (80.3%) |
| Arts, Entertainment & Recreation | 421 (55.7%) | 335 (44.3%) |
| Accommodation & Food Services | 1,182 (49.6%) | 1,200 (50.4%) |
| Public Administration | 1,397 (65.4%) | 740 (34.6%) |
| Total | 22,242 (51.8%) | 20,686 (48.2%) |
Education in Warwick
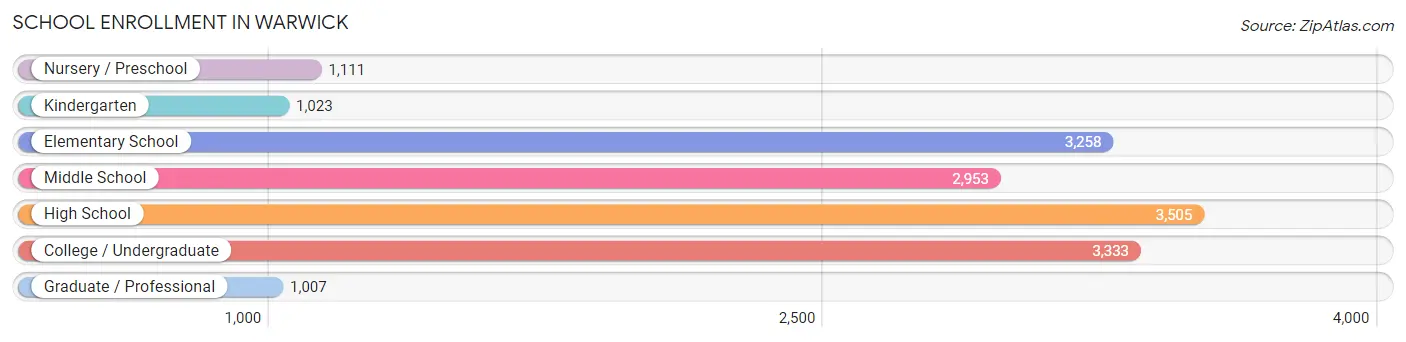
School Enrollment in Warwick
The most common levels of schooling among the 16,190 students in Warwick are high school (3,505 | 21.6%), college / undergraduate (3,333 | 20.6%), and elementary school (3,258 | 20.1%).
| School Level | # Students | % Students |
| Nursery / Preschool | 1,111 | 6.9% |
| Kindergarten | 1,023 | 6.3% |
| Elementary School | 3,258 | 20.1% |
| Middle School | 2,953 | 18.2% |
| High School | 3,505 | 21.6% |
| College / Undergraduate | 3,333 | 20.6% |
| Graduate / Professional | 1,007 | 6.2% |
| Total | 16,190 | 100.0% |
School Enrollment by Age by Funding Source in Warwick
Out of a total of 16,190 students who are enrolled in schools in Warwick, 3,659 (22.6%) attend a private institution, while the remaining 12,531 (77.4%) are enrolled in public schools. The age group of 3 to 4 year olds has the highest likelihood of being enrolled in private schools, with 396 (47.3% in the age bracket) enrolled. Conversely, the age group of 10 to 14 year olds has the lowest likelihood of being enrolled in a private school, with 3,238 (88.1% in the age bracket) attending a public institution.
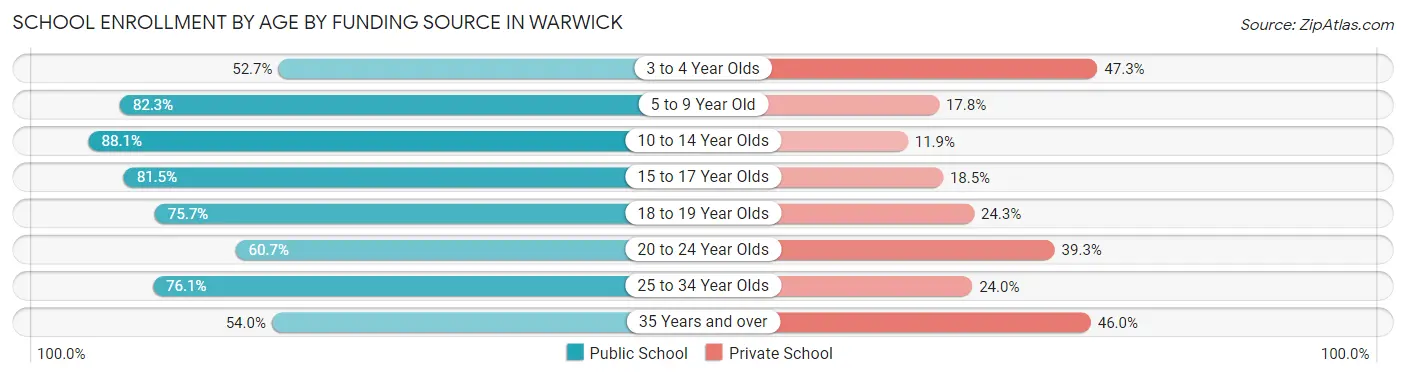
| Age Bracket | Public School | Private School |
| 3 to 4 Year Olds | 442 (52.7%) | 396 (47.3%) |
| 5 to 9 Year Old | 3,479 (82.3%) | 751 (17.7%) |
| 10 to 14 Year Olds | 3,238 (88.1%) | 439 (11.9%) |
| 15 to 17 Year Olds | 2,041 (81.5%) | 463 (18.5%) |
| 18 to 19 Year Olds | 951 (75.7%) | 305 (24.3%) |
| 20 to 24 Year Olds | 1,064 (60.7%) | 689 (39.3%) |
| 25 to 34 Year Olds | 924 (76.0%) | 291 (23.9%) |
| 35 Years and over | 387 (54.0%) | 330 (46.0%) |
| Total | 12,531 (77.4%) | 3,659 (22.6%) |
Educational Attainment by Field of Study in Warwick
Business (3,913 | 17.9%), science & technology (2,597 | 11.9%), education (2,589 | 11.8%), social sciences (1,720 | 7.9%), and psychology (1,661 | 7.6%) are the most common fields of study among 21,848 individuals in Warwick who have obtained a bachelor's degree or higher.
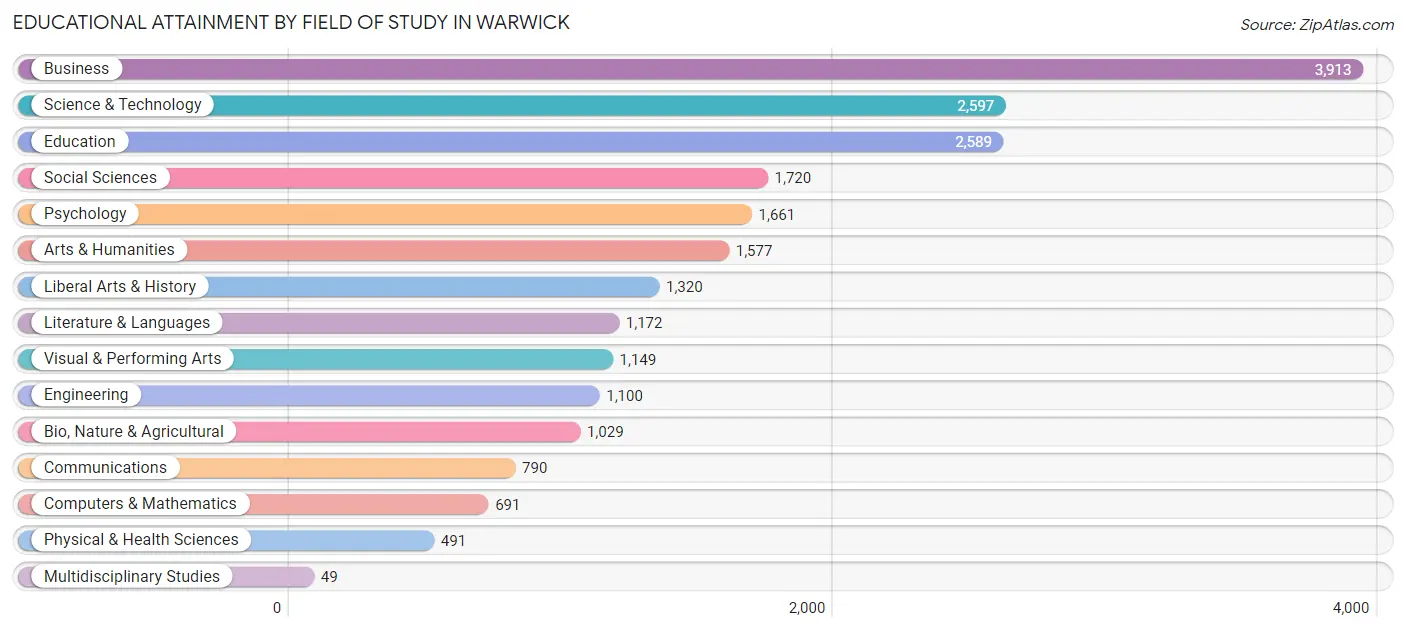
| Field of Study | # Graduates | % Graduates |
| Computers & Mathematics | 691 | 3.2% |
| Bio, Nature & Agricultural | 1,029 | 4.7% |
| Physical & Health Sciences | 491 | 2.2% |
| Psychology | 1,661 | 7.6% |
| Social Sciences | 1,720 | 7.9% |
| Engineering | 1,100 | 5.0% |
| Multidisciplinary Studies | 49 | 0.2% |
| Science & Technology | 2,597 | 11.9% |
| Business | 3,913 | 17.9% |
| Education | 2,589 | 11.8% |
| Literature & Languages | 1,172 | 5.4% |
| Liberal Arts & History | 1,320 | 6.0% |
| Visual & Performing Arts | 1,149 | 5.3% |
| Communications | 790 | 3.6% |
| Arts & Humanities | 1,577 | 7.2% |
| Total | 21,848 | 100.0% |
Transportation & Commute in Warwick
Vehicle Availability by Sex in Warwick
The most prevalent vehicle ownership categories in Warwick are males with 2 vehicles (10,126, accounting for 46.5%) and females with 2 vehicles (8,979, making up 50.3%).
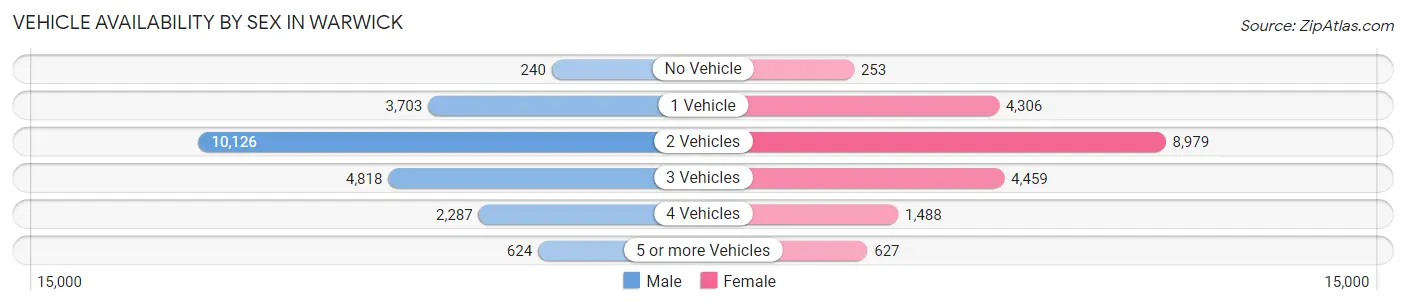
| Vehicles Available | Male | Female |
| No Vehicle | 240 (1.1%) | 253 (1.3%) |
| 1 Vehicle | 3,703 (17.0%) | 4,306 (21.4%) |
| 2 Vehicles | 10,126 (46.5%) | 8,979 (44.6%) |
| 3 Vehicles | 4,818 (22.1%) | 4,459 (22.2%) |
| 4 Vehicles | 2,287 (10.5%) | 1,488 (7.4%) |
| 5 or more Vehicles | 624 (2.9%) | 627 (3.1%) |
| Total | 21,798 (100.0%) | 20,112 (100.0%) |
Commute Time in Warwick
The most frequently occuring commute durations in Warwick are 20 to 24 minutes (7,165 commuters, 18.8%), 15 to 19 minutes (6,381 commuters, 16.7%), and 10 to 14 minutes (5,868 commuters, 15.4%).
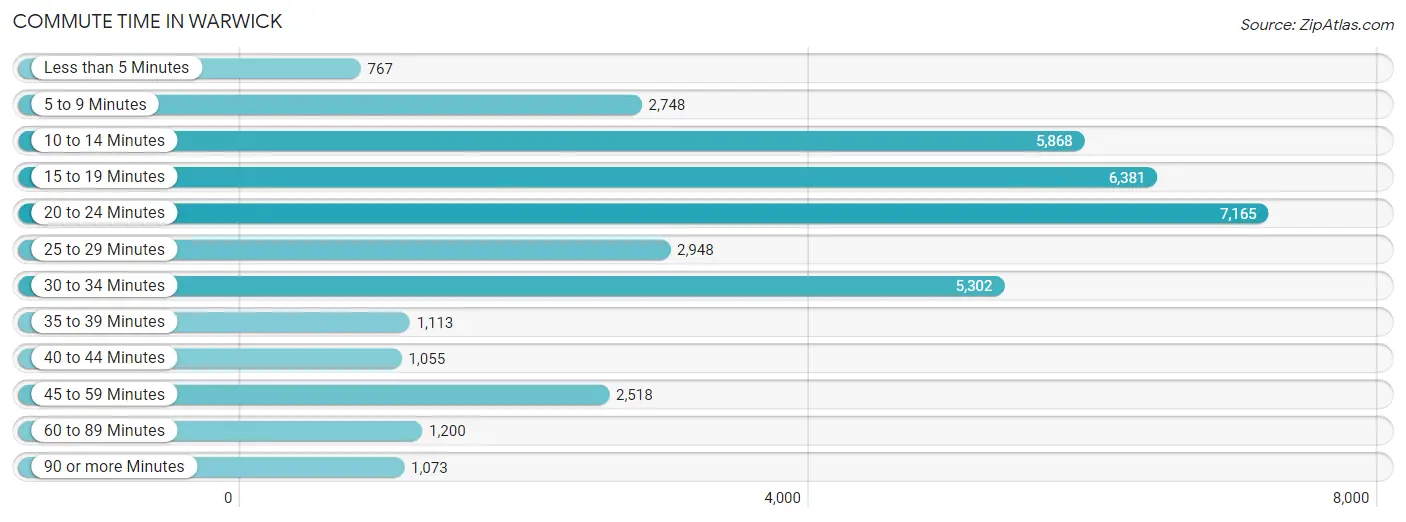
| Commute Time | # Commuters | % Commuters |
| Less than 5 Minutes | 767 | 2.0% |
| 5 to 9 Minutes | 2,748 | 7.2% |
| 10 to 14 Minutes | 5,868 | 15.4% |
| 15 to 19 Minutes | 6,381 | 16.7% |
| 20 to 24 Minutes | 7,165 | 18.8% |
| 25 to 29 Minutes | 2,948 | 7.7% |
| 30 to 34 Minutes | 5,302 | 13.9% |
| 35 to 39 Minutes | 1,113 | 2.9% |
| 40 to 44 Minutes | 1,055 | 2.8% |
| 45 to 59 Minutes | 2,518 | 6.6% |
| 60 to 89 Minutes | 1,200 | 3.2% |
| 90 or more Minutes | 1,073 | 2.8% |
Commute Time by Sex in Warwick
The most common commute times in Warwick are 20 to 24 minutes (3,290 commuters, 16.6%) for males and 20 to 24 minutes (3,875 commuters, 21.2%) for females.
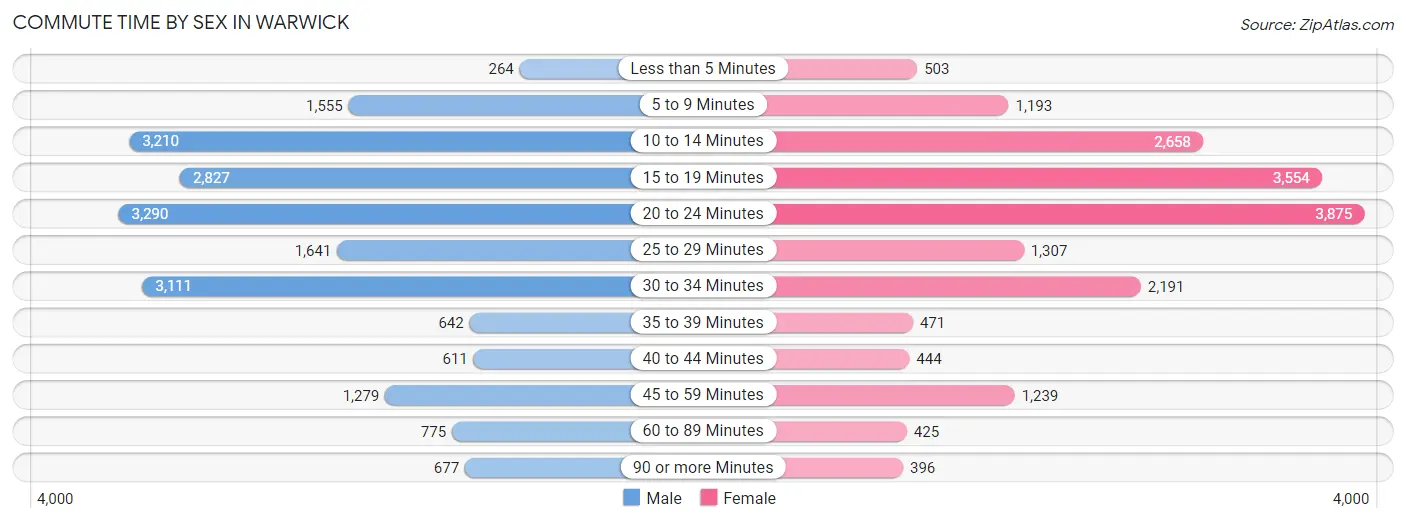
| Commute Time | Male | Female |
| Less than 5 Minutes | 264 (1.3%) | 503 (2.8%) |
| 5 to 9 Minutes | 1,555 (7.8%) | 1,193 (6.5%) |
| 10 to 14 Minutes | 3,210 (16.2%) | 2,658 (14.6%) |
| 15 to 19 Minutes | 2,827 (14.2%) | 3,554 (19.5%) |
| 20 to 24 Minutes | 3,290 (16.6%) | 3,875 (21.2%) |
| 25 to 29 Minutes | 1,641 (8.3%) | 1,307 (7.2%) |
| 30 to 34 Minutes | 3,111 (15.7%) | 2,191 (12.0%) |
| 35 to 39 Minutes | 642 (3.2%) | 471 (2.6%) |
| 40 to 44 Minutes | 611 (3.1%) | 444 (2.4%) |
| 45 to 59 Minutes | 1,279 (6.4%) | 1,239 (6.8%) |
| 60 to 89 Minutes | 775 (3.9%) | 425 (2.3%) |
| 90 or more Minutes | 677 (3.4%) | 396 (2.2%) |
Time of Departure to Work by Sex in Warwick
The most frequent times of departure to work in Warwick are 7:00 AM to 7:29 AM (2,714, 13.7%) for males and 7:00 AM to 7:29 AM (3,658, 20.0%) for females.
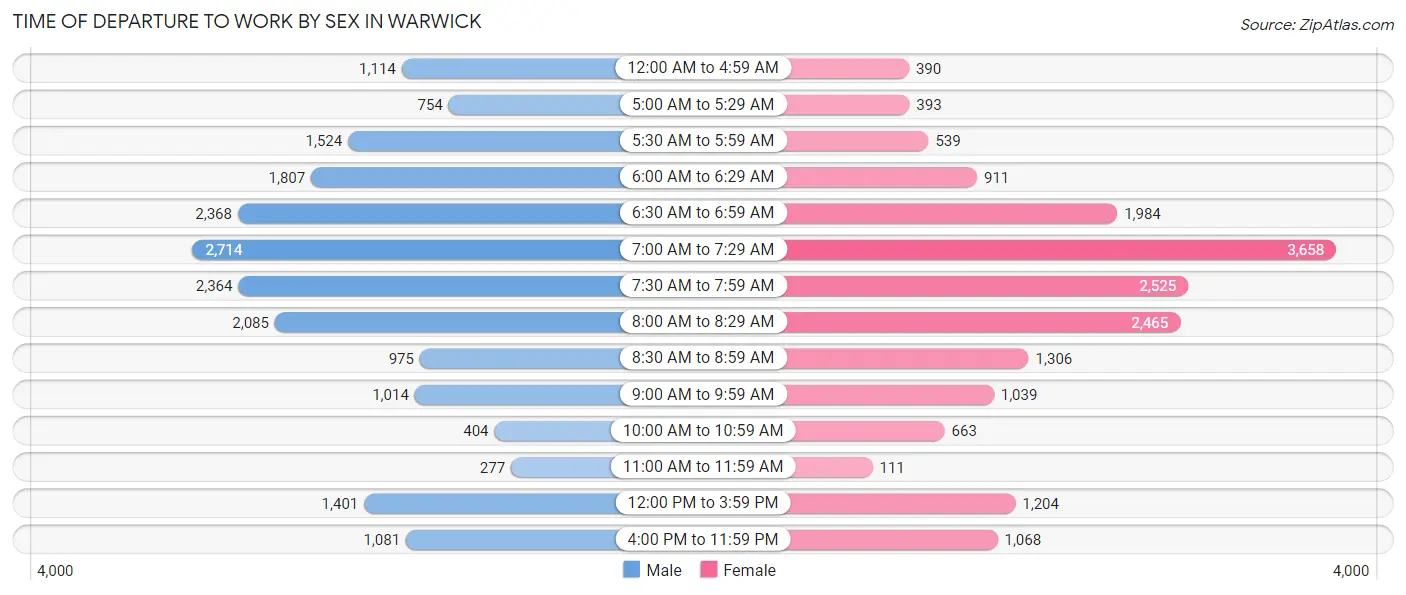
| Time of Departure | Male | Female |
| 12:00 AM to 4:59 AM | 1,114 (5.6%) | 390 (2.1%) |
| 5:00 AM to 5:29 AM | 754 (3.8%) | 393 (2.1%) |
| 5:30 AM to 5:59 AM | 1,524 (7.7%) | 539 (2.9%) |
| 6:00 AM to 6:29 AM | 1,807 (9.1%) | 911 (5.0%) |
| 6:30 AM to 6:59 AM | 2,368 (11.9%) | 1,984 (10.9%) |
| 7:00 AM to 7:29 AM | 2,714 (13.7%) | 3,658 (20.0%) |
| 7:30 AM to 7:59 AM | 2,364 (11.9%) | 2,525 (13.8%) |
| 8:00 AM to 8:29 AM | 2,085 (10.5%) | 2,465 (13.5%) |
| 8:30 AM to 8:59 AM | 975 (4.9%) | 1,306 (7.1%) |
| 9:00 AM to 9:59 AM | 1,014 (5.1%) | 1,039 (5.7%) |
| 10:00 AM to 10:59 AM | 404 (2.0%) | 663 (3.6%) |
| 11:00 AM to 11:59 AM | 277 (1.4%) | 111 (0.6%) |
| 12:00 PM to 3:59 PM | 1,401 (7.0%) | 1,204 (6.6%) |
| 4:00 PM to 11:59 PM | 1,081 (5.4%) | 1,068 (5.9%) |
| Total | 19,882 (100.0%) | 18,256 (100.0%) |
Housing Occupancy in Warwick
Occupancy by Ownership in Warwick
Of the total 36,143 dwellings in Warwick, owner-occupied units account for 26,201 (72.5%), while renter-occupied units make up 9,942 (27.5%).
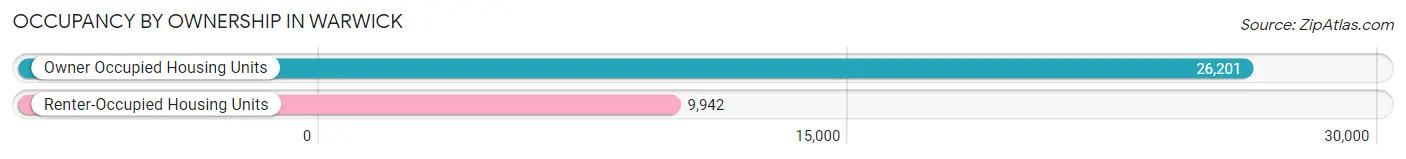
| Occupancy | # Housing Units | % Housing Units |
| Owner Occupied Housing Units | 26,201 | 72.5% |
| Renter-Occupied Housing Units | 9,942 | 27.5% |
| Total Occupied Housing Units | 36,143 | 100.0% |
Occupancy by Household Size in Warwick
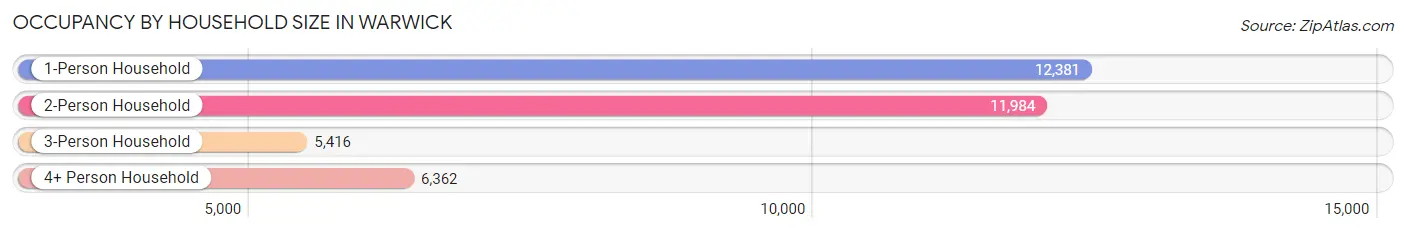
| Household Size | # Housing Units | % Housing Units |
| 1-Person Household | 12,381 | 34.3% |
| 2-Person Household | 11,984 | 33.2% |
| 3-Person Household | 5,416 | 15.0% |
| 4+ Person Household | 6,362 | 17.6% |
| Total Housing Units | 36,143 | 100.0% |
Occupancy by Ownership by Household Size in Warwick
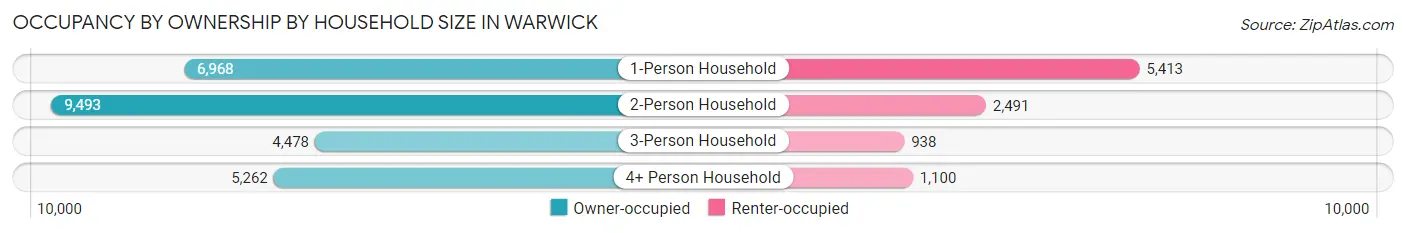
| Household Size | Owner-occupied | Renter-occupied |
| 1-Person Household | 6,968 (56.3%) | 5,413 (43.7%) |
| 2-Person Household | 9,493 (79.2%) | 2,491 (20.8%) |
| 3-Person Household | 4,478 (82.7%) | 938 (17.3%) |
| 4+ Person Household | 5,262 (82.7%) | 1,100 (17.3%) |
| Total Housing Units | 26,201 (72.5%) | 9,942 (27.5%) |
Occupancy by Educational Attainment in Warwick
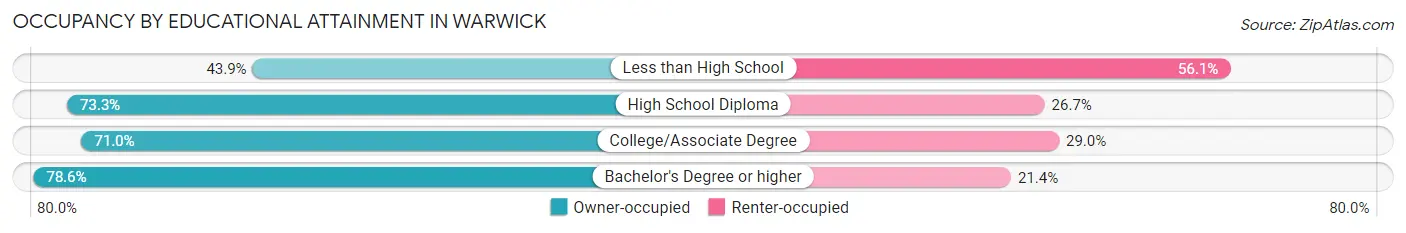
| Household Size | Owner-occupied | Renter-occupied |
| Less than High School | 968 (43.9%) | 1,239 (56.1%) |
| High School Diploma | 6,449 (73.3%) | 2,351 (26.7%) |
| College/Associate Degree | 9,088 (71.0%) | 3,713 (29.0%) |
| Bachelor's Degree or higher | 9,696 (78.6%) | 2,639 (21.4%) |
Occupancy by Age of Householder in Warwick
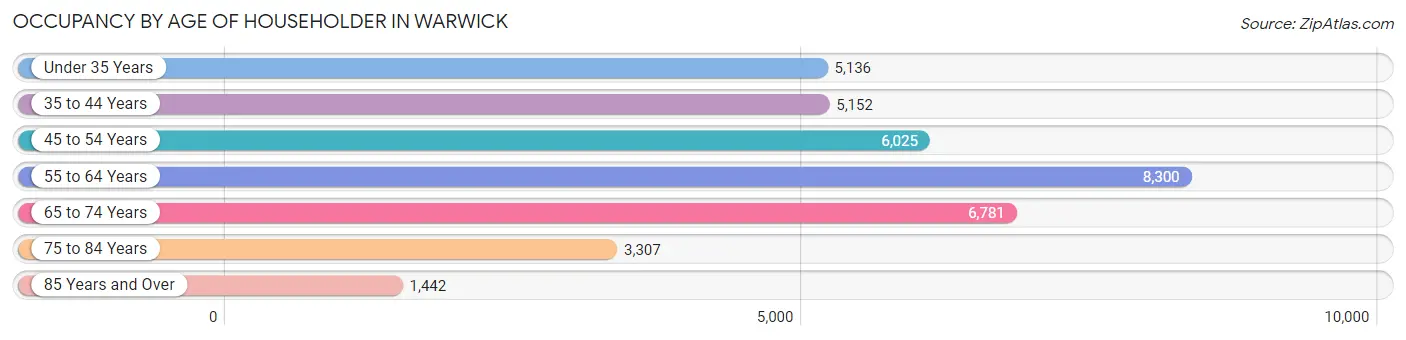
| Age Bracket | # Households | % Households |
| Under 35 Years | 5,136 | 14.2% |
| 35 to 44 Years | 5,152 | 14.2% |
| 45 to 54 Years | 6,025 | 16.7% |
| 55 to 64 Years | 8,300 | 23.0% |
| 65 to 74 Years | 6,781 | 18.8% |
| 75 to 84 Years | 3,307 | 9.1% |
| 85 Years and Over | 1,442 | 4.0% |
| Total | 36,143 | 100.0% |
Housing Finances in Warwick
Median Income by Occupancy in Warwick
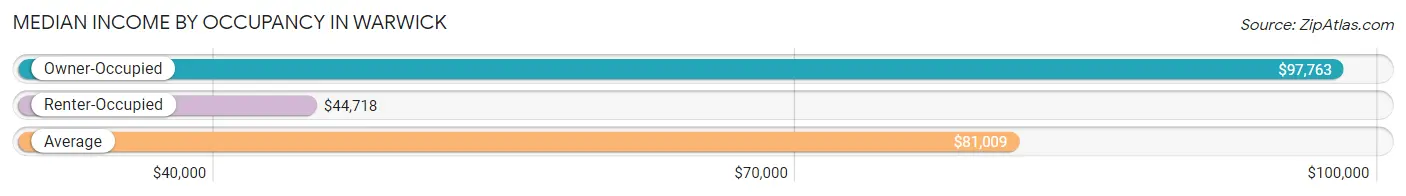
| Occupancy Type | # Households | Median Income |
| Owner-Occupied | 26,201 (72.5%) | $97,763 |
| Renter-Occupied | 9,942 (27.5%) | $44,718 |
| Average | 36,143 (100.0%) | $81,009 |
Occupancy by Householder Income Bracket in Warwick
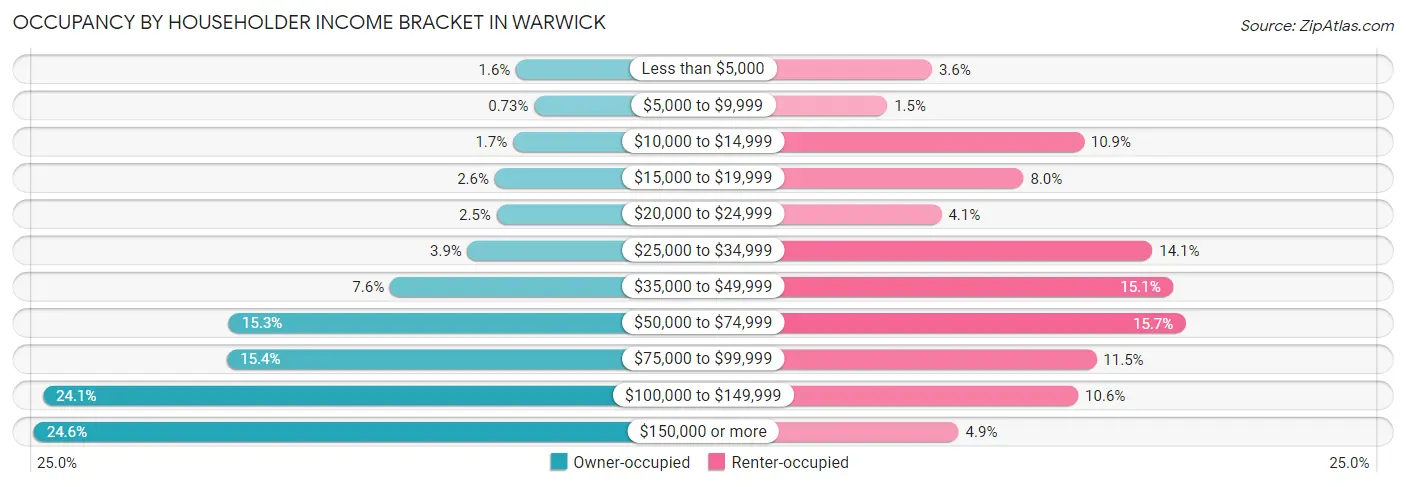
| Income Bracket | Owner-occupied | Renter-occupied |
| Less than $5,000 | 416 (1.6%) | 362 (3.6%) |
| $5,000 to $9,999 | 192 (0.7%) | 150 (1.5%) |
| $10,000 to $14,999 | 455 (1.7%) | 1,081 (10.9%) |
| $15,000 to $19,999 | 685 (2.6%) | 795 (8.0%) |
| $20,000 to $24,999 | 661 (2.5%) | 407 (4.1%) |
| $25,000 to $34,999 | 1,023 (3.9%) | 1,405 (14.1%) |
| $35,000 to $49,999 | 1,991 (7.6%) | 1,500 (15.1%) |
| $50,000 to $74,999 | 4,001 (15.3%) | 1,560 (15.7%) |
| $75,000 to $99,999 | 4,021 (15.3%) | 1,140 (11.5%) |
| $100,000 to $149,999 | 6,320 (24.1%) | 1,054 (10.6%) |
| $150,000 or more | 6,436 (24.6%) | 488 (4.9%) |
| Total | 26,201 (100.0%) | 9,942 (100.0%) |
Monthly Housing Cost Tiers in Warwick
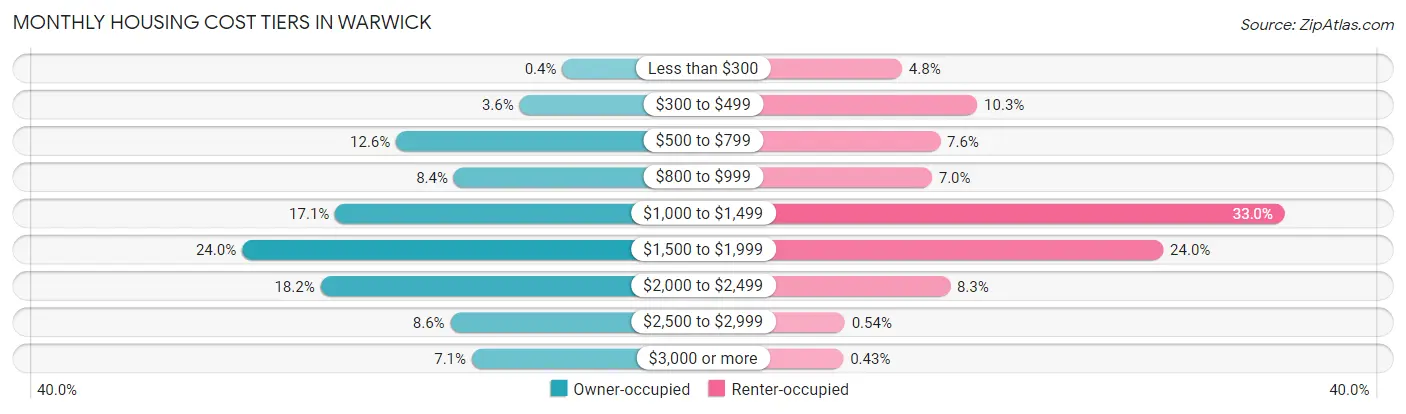
| Monthly Cost | Owner-occupied | Renter-occupied |
| Less than $300 | 104 (0.4%) | 472 (4.8%) |
| $300 to $499 | 929 (3.5%) | 1,023 (10.3%) |
| $500 to $799 | 3,313 (12.6%) | 752 (7.6%) |
| $800 to $999 | 2,198 (8.4%) | 691 (7.0%) |
| $1,000 to $1,499 | 4,487 (17.1%) | 3,276 (33.0%) |
| $1,500 to $1,999 | 6,285 (24.0%) | 2,385 (24.0%) |
| $2,000 to $2,499 | 4,771 (18.2%) | 824 (8.3%) |
| $2,500 to $2,999 | 2,265 (8.6%) | 54 (0.5%) |
| $3,000 or more | 1,849 (7.1%) | 43 (0.4%) |
| Total | 26,201 (100.0%) | 9,942 (100.0%) |
Physical Housing Characteristics in Warwick
Housing Structures in Warwick
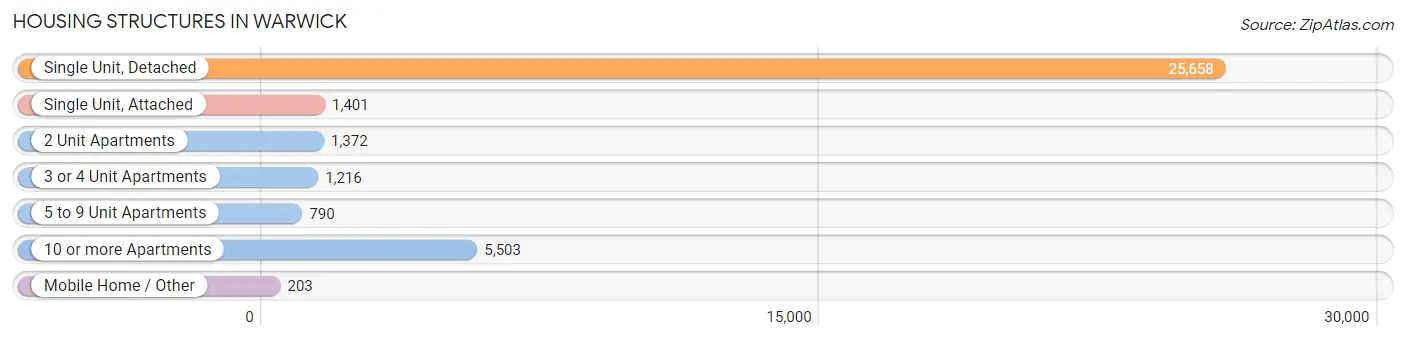
| Structure Type | # Housing Units | % Housing Units |
| Single Unit, Detached | 25,658 | 71.0% |
| Single Unit, Attached | 1,401 | 3.9% |
| 2 Unit Apartments | 1,372 | 3.8% |
| 3 or 4 Unit Apartments | 1,216 | 3.4% |
| 5 to 9 Unit Apartments | 790 | 2.2% |
| 10 or more Apartments | 5,503 | 15.2% |
| Mobile Home / Other | 203 | 0.6% |
| Total | 36,143 | 100.0% |
Housing Structures by Occupancy in Warwick
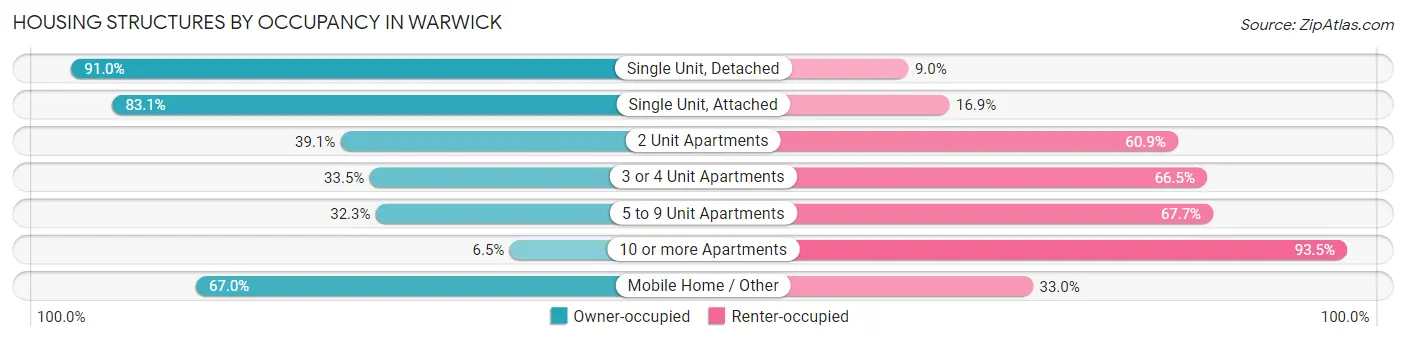
| Structure Type | Owner-occupied | Renter-occupied |
| Single Unit, Detached | 23,345 (91.0%) | 2,313 (9.0%) |
| Single Unit, Attached | 1,164 (83.1%) | 237 (16.9%) |
| 2 Unit Apartments | 536 (39.1%) | 836 (60.9%) |
| 3 or 4 Unit Apartments | 407 (33.5%) | 809 (66.5%) |
| 5 to 9 Unit Apartments | 255 (32.3%) | 535 (67.7%) |
| 10 or more Apartments | 358 (6.5%) | 5,145 (93.5%) |
| Mobile Home / Other | 136 (67.0%) | 67 (33.0%) |
| Total | 26,201 (72.5%) | 9,942 (27.5%) |
Housing Structures by Number of Rooms in Warwick
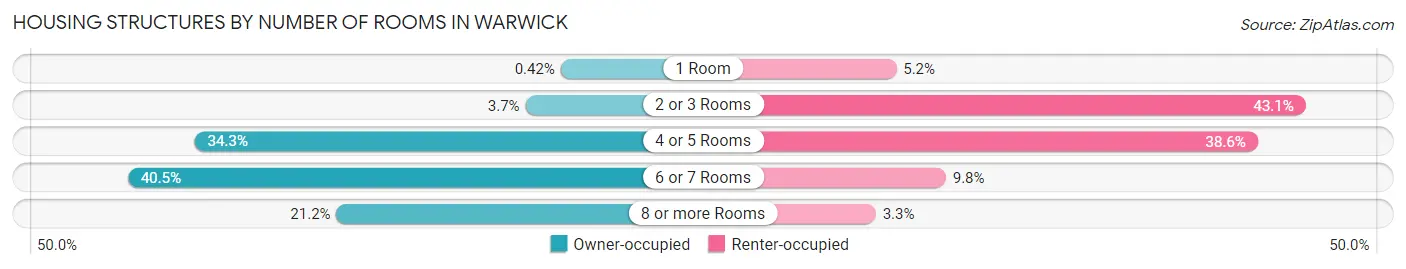
| Number of Rooms | Owner-occupied | Renter-occupied |
| 1 Room | 110 (0.4%) | 518 (5.2%) |
| 2 or 3 Rooms | 965 (3.7%) | 4,281 (43.1%) |
| 4 or 5 Rooms | 8,983 (34.3%) | 3,841 (38.6%) |
| 6 or 7 Rooms | 10,600 (40.5%) | 973 (9.8%) |
| 8 or more Rooms | 5,543 (21.2%) | 329 (3.3%) |
| Total | 26,201 (100.0%) | 9,942 (100.0%) |
Housing Structure by Heating Type in Warwick
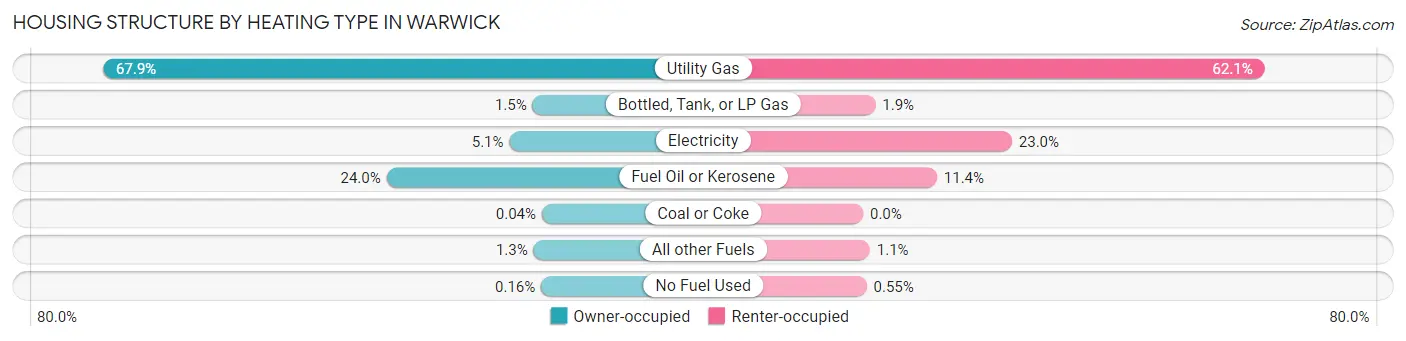
| Heating Type | Owner-occupied | Renter-occupied |
| Utility Gas | 17,788 (67.9%) | 6,172 (62.1%) |
| Bottled, Tank, or LP Gas | 389 (1.5%) | 189 (1.9%) |
| Electricity | 1,326 (5.1%) | 2,288 (23.0%) |
| Fuel Oil or Kerosene | 6,298 (24.0%) | 1,134 (11.4%) |
| Coal or Coke | 11 (0.0%) | 0 (0.0%) |
| All other Fuels | 346 (1.3%) | 104 (1.1%) |
| No Fuel Used | 43 (0.2%) | 55 (0.5%) |
| Total | 26,201 (100.0%) | 9,942 (100.0%) |
Household Vehicle Usage in Warwick
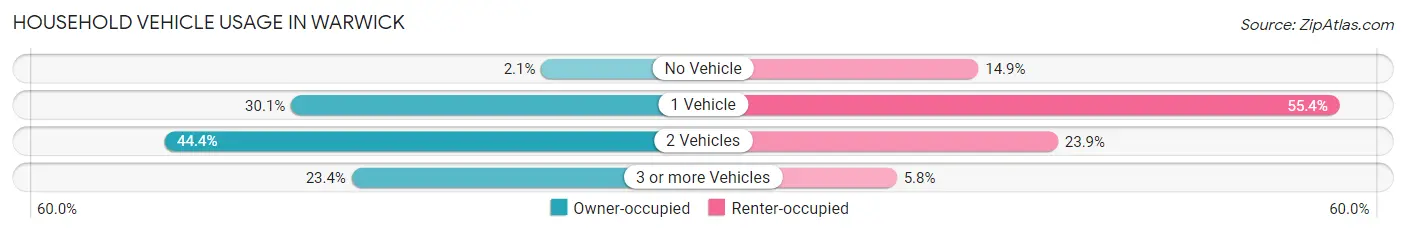
| Vehicles per Household | Owner-occupied | Renter-occupied |
| No Vehicle | 555 (2.1%) | 1,485 (14.9%) |
| 1 Vehicle | 7,897 (30.1%) | 5,509 (55.4%) |
| 2 Vehicles | 11,629 (44.4%) | 2,371 (23.8%) |
| 3 or more Vehicles | 6,120 (23.4%) | 577 (5.8%) |
| Total | 26,201 (100.0%) | 9,942 (100.0%) |
Real Estate & Mortgages in Warwick
Real Estate and Mortgage Overview in Warwick
| Characteristic | Without Mortgage | With Mortgage |
| Housing Units | 7,908 | 18,293 |
| Median Property Value | $289,400 | $296,100 |
| Median Household Income | $71,539 | $4,849 |
| Monthly Housing Costs | $797 | $1,790 |
| Real Estate Taxes | $4,450 | $172 |
Property Value by Mortgage Status in Warwick
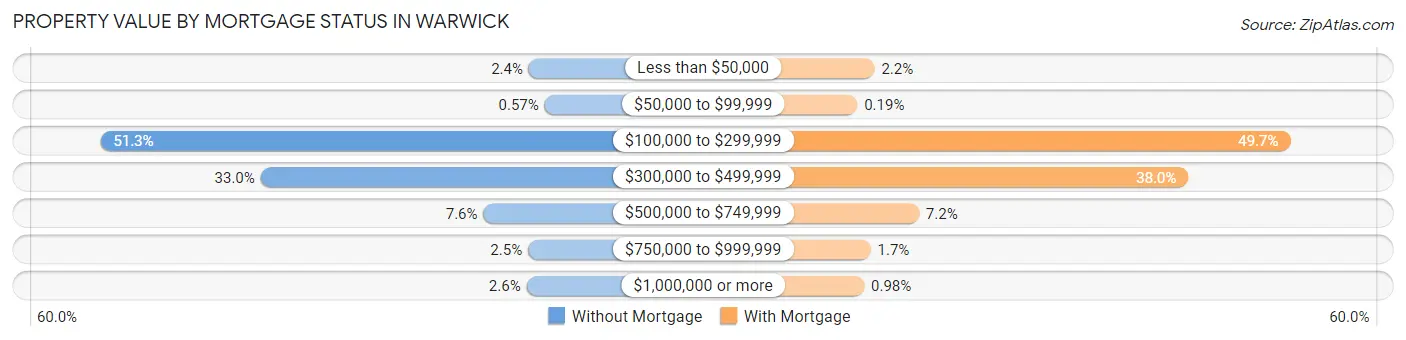
| Property Value | Without Mortgage | With Mortgage |
| Less than $50,000 | 188 (2.4%) | 396 (2.2%) |
| $50,000 to $99,999 | 45 (0.6%) | 34 (0.2%) |
| $100,000 to $299,999 | 4,060 (51.3%) | 9,089 (49.7%) |
| $300,000 to $499,999 | 2,612 (33.0%) | 6,956 (38.0%) |
| $500,000 to $749,999 | 599 (7.6%) | 1,324 (7.2%) |
| $750,000 to $999,999 | 195 (2.5%) | 315 (1.7%) |
| $1,000,000 or more | 209 (2.6%) | 179 (1.0%) |
| Total | 7,908 (100.0%) | 18,293 (100.0%) |
Household Income by Mortgage Status in Warwick
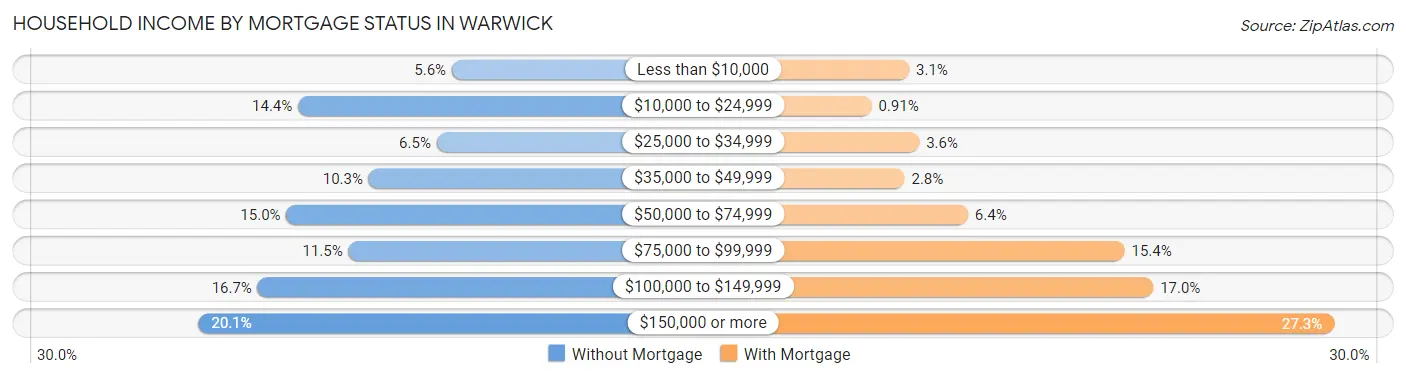
| Household Income | Without Mortgage | With Mortgage |
| Less than $10,000 | 441 (5.6%) | 559 (3.1%) |
| $10,000 to $24,999 | 1,136 (14.4%) | 167 (0.9%) |
| $25,000 to $34,999 | 510 (6.5%) | 665 (3.6%) |
| $35,000 to $49,999 | 817 (10.3%) | 513 (2.8%) |
| $50,000 to $74,999 | 1,189 (15.0%) | 1,174 (6.4%) |
| $75,000 to $99,999 | 909 (11.5%) | 2,812 (15.4%) |
| $100,000 to $149,999 | 1,319 (16.7%) | 3,112 (17.0%) |
| $150,000 or more | 1,587 (20.1%) | 5,001 (27.3%) |
| Total | 7,908 (100.0%) | 18,293 (100.0%) |
Property Value to Household Income Ratio in Warwick
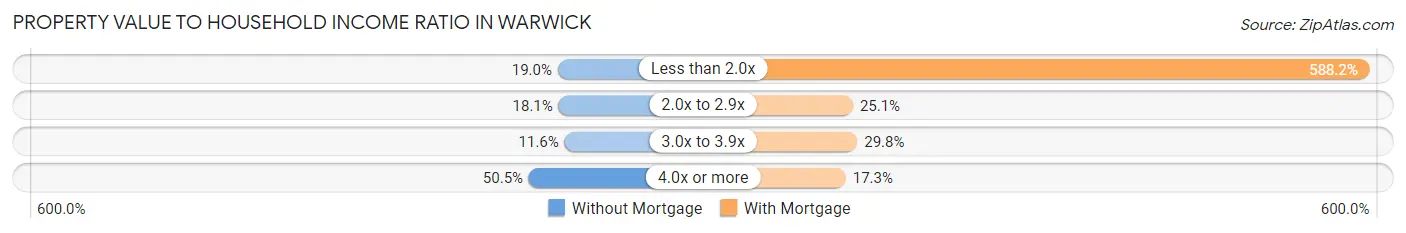
| Value-to-Income Ratio | Without Mortgage | With Mortgage |
| Less than 2.0x | 1,501 (19.0%) | 107,595 (588.2%) |
| 2.0x to 2.9x | 1,429 (18.1%) | 4,591 (25.1%) |
| 3.0x to 3.9x | 916 (11.6%) | 5,453 (29.8%) |
| 4.0x or more | 3,990 (50.5%) | 3,169 (17.3%) |
| Total | 7,908 (100.0%) | 18,293 (100.0%) |
Real Estate Taxes by Mortgage Status in Warwick
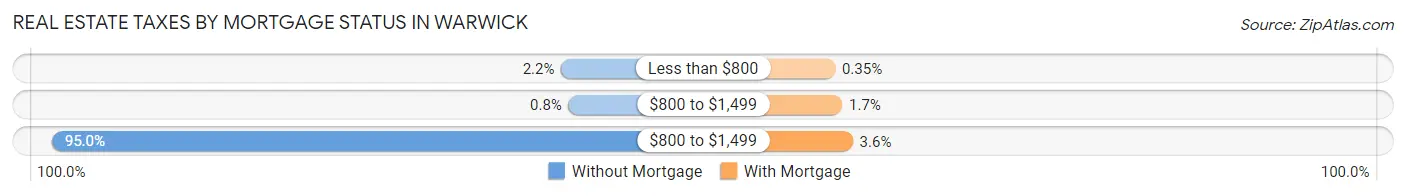
| Property Taxes | Without Mortgage | With Mortgage |
| Less than $800 | 171 (2.2%) | 64 (0.4%) |
| $800 to $1,499 | 63 (0.8%) | 302 (1.7%) |
| $800 to $1,499 | 7,515 (95.0%) | 655 (3.6%) |
| Total | 7,908 (100.0%) | 18,293 (100.0%) |
Health & Disability in Warwick
Health Insurance Coverage by Age in Warwick
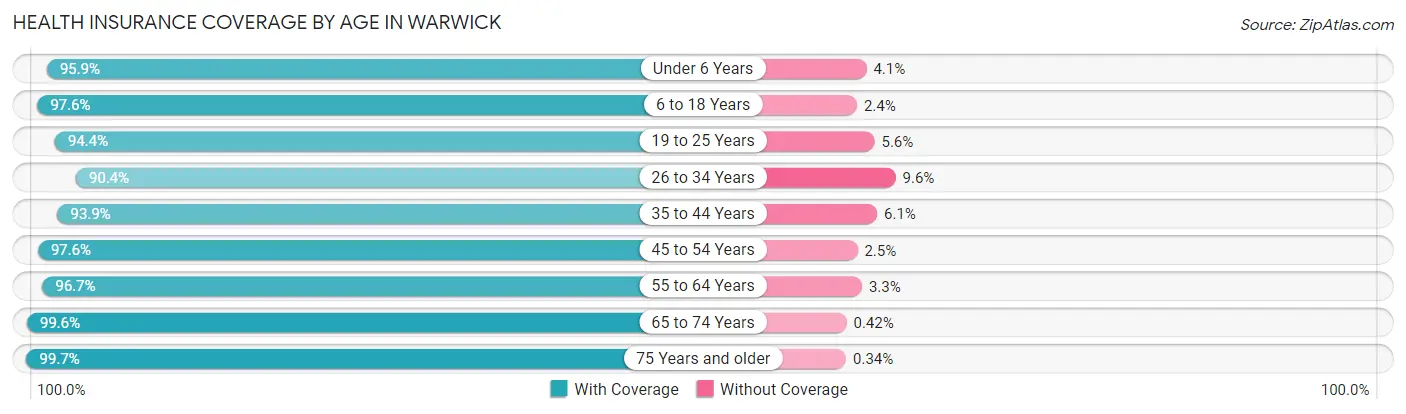
| Age Bracket | With Coverage | Without Coverage |
| Under 6 Years | 4,438 (95.9%) | 191 (4.1%) |
| 6 to 18 Years | 10,506 (97.6%) | 254 (2.4%) |
| 19 to 25 Years | 5,767 (94.4%) | 345 (5.6%) |
| 26 to 34 Years | 8,892 (90.4%) | 941 (9.6%) |
| 35 to 44 Years | 9,770 (93.9%) | 637 (6.1%) |
| 45 to 54 Years | 9,906 (97.6%) | 249 (2.5%) |
| 55 to 64 Years | 12,640 (96.7%) | 431 (3.3%) |
| 65 to 74 Years | 10,407 (99.6%) | 44 (0.4%) |
| 75 Years and older | 6,840 (99.7%) | 23 (0.3%) |
| Total | 79,166 (96.2%) | 3,115 (3.8%) |
Health Insurance Coverage by Citizenship Status in Warwick
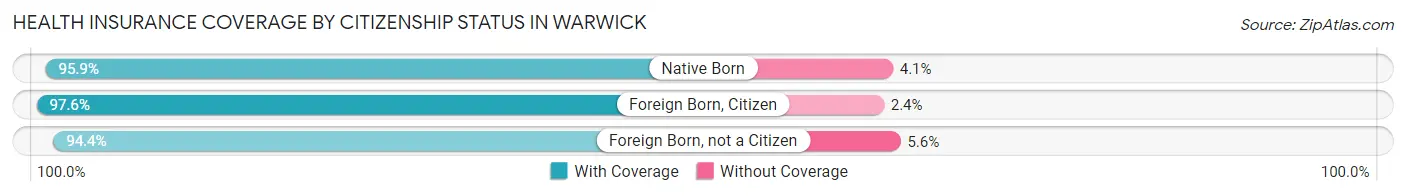
| Citizenship Status | With Coverage | Without Coverage |
| Native Born | 4,438 (95.9%) | 191 (4.1%) |
| Foreign Born, Citizen | 10,506 (97.6%) | 254 (2.4%) |
| Foreign Born, not a Citizen | 5,767 (94.4%) | 345 (5.6%) |
Health Insurance Coverage by Household Income in Warwick
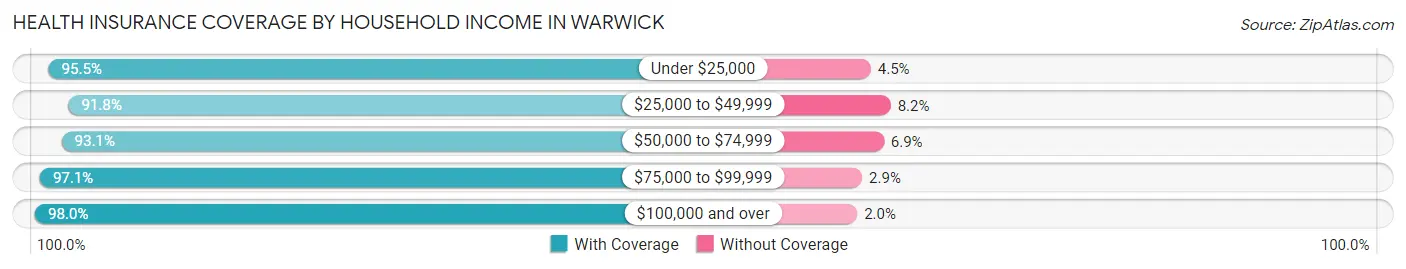
| Household Income | With Coverage | Without Coverage |
| Under $25,000 | 6,540 (95.5%) | 309 (4.5%) |
| $25,000 to $49,999 | 9,051 (91.8%) | 812 (8.2%) |
| $50,000 to $74,999 | 11,136 (93.1%) | 830 (6.9%) |
| $75,000 to $99,999 | 11,658 (97.1%) | 346 (2.9%) |
| $100,000 and over | 40,483 (98.0%) | 810 (2.0%) |
Public vs Private Health Insurance Coverage by Age in Warwick
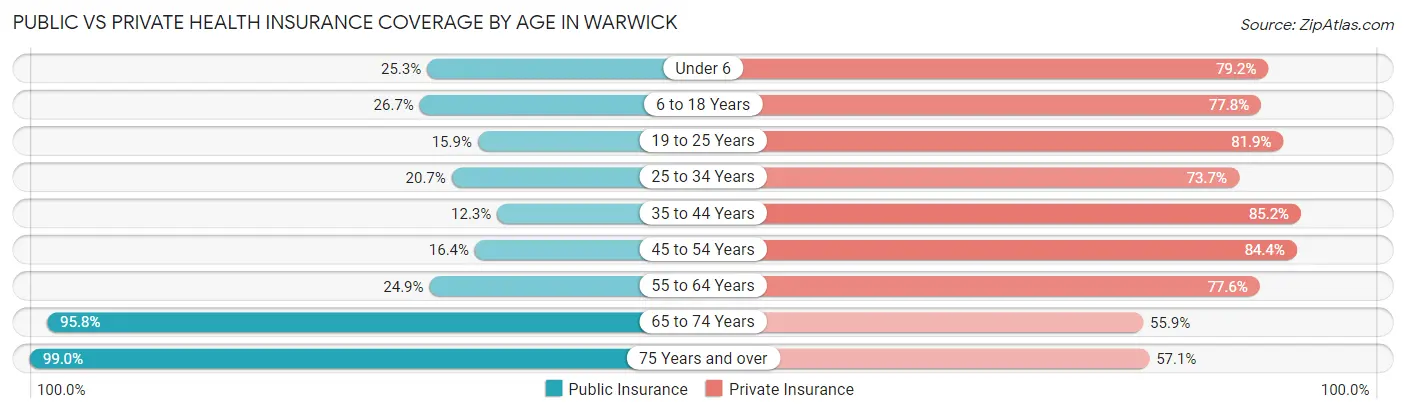
| Age Bracket | Public Insurance | Private Insurance |
| Under 6 | 1,171 (25.3%) | 3,664 (79.1%) |
| 6 to 18 Years | 2,870 (26.7%) | 8,372 (77.8%) |
| 19 to 25 Years | 971 (15.9%) | 5,008 (81.9%) |
| 25 to 34 Years | 2,039 (20.7%) | 7,244 (73.7%) |
| 35 to 44 Years | 1,279 (12.3%) | 8,869 (85.2%) |
| 45 to 54 Years | 1,667 (16.4%) | 8,575 (84.4%) |
| 55 to 64 Years | 3,251 (24.9%) | 10,138 (77.6%) |
| 65 to 74 Years | 10,014 (95.8%) | 5,845 (55.9%) |
| 75 Years and over | 6,796 (99.0%) | 3,916 (57.1%) |
| Total | 30,058 (36.5%) | 61,631 (74.9%) |
Disability Status by Sex by Age in Warwick
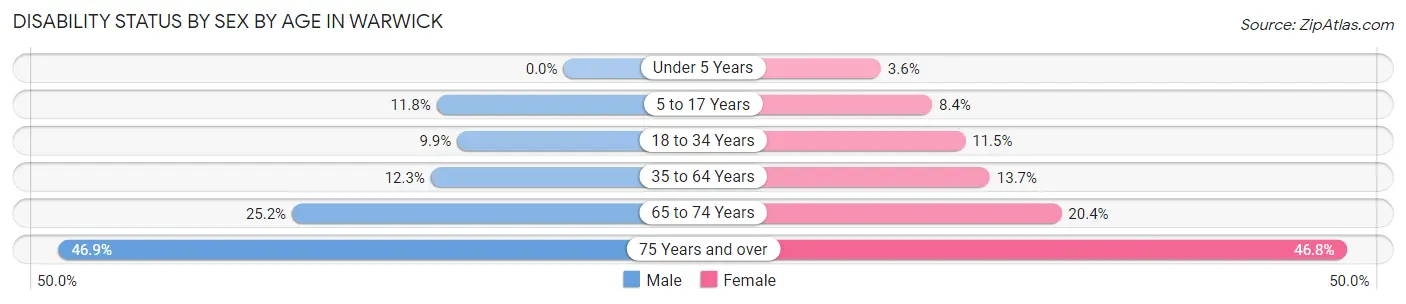
| Age Bracket | Male | Female |
| Under 5 Years | 0 (0.0%) | 54 (3.6%) |
| 5 to 17 Years | 645 (11.8%) | 459 (8.4%) |
| 18 to 34 Years | 863 (9.9%) | 930 (11.5%) |
| 35 to 64 Years | 2,005 (12.3%) | 2,384 (13.7%) |
| 65 to 74 Years | 1,185 (25.2%) | 1,171 (20.4%) |
| 75 Years and over | 1,084 (46.9%) | 2,130 (46.8%) |
Disability Class by Sex by Age in Warwick
Disability Class: Hearing Difficulty
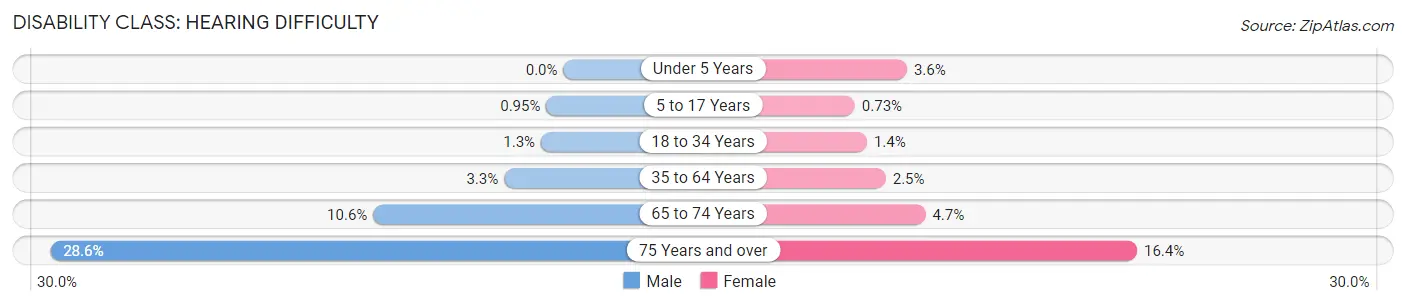
| Age Bracket | Male | Female |
| Under 5 Years | 0 (0.0%) | 54 (3.6%) |
| 5 to 17 Years | 52 (0.9%) | 40 (0.7%) |
| 18 to 34 Years | 109 (1.3%) | 114 (1.4%) |
| 35 to 64 Years | 537 (3.3%) | 425 (2.5%) |
| 65 to 74 Years | 498 (10.6%) | 268 (4.7%) |
| 75 Years and over | 661 (28.6%) | 748 (16.4%) |
Disability Class: Vision Difficulty
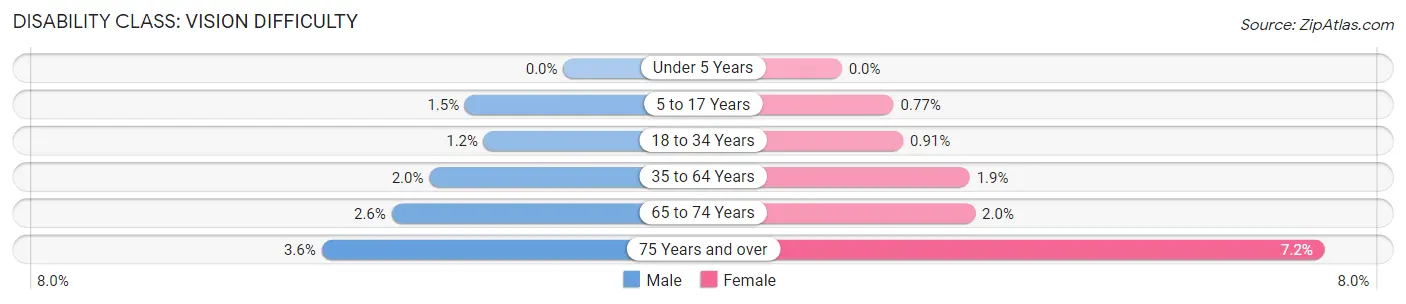
| Age Bracket | Male | Female |
| Under 5 Years | 0 (0.0%) | 0 (0.0%) |
| 5 to 17 Years | 80 (1.5%) | 42 (0.8%) |
| 18 to 34 Years | 103 (1.2%) | 74 (0.9%) |
| 35 to 64 Years | 324 (2.0%) | 329 (1.9%) |
| 65 to 74 Years | 120 (2.5%) | 114 (2.0%) |
| 75 Years and over | 83 (3.6%) | 326 (7.2%) |
Disability Class: Cognitive Difficulty
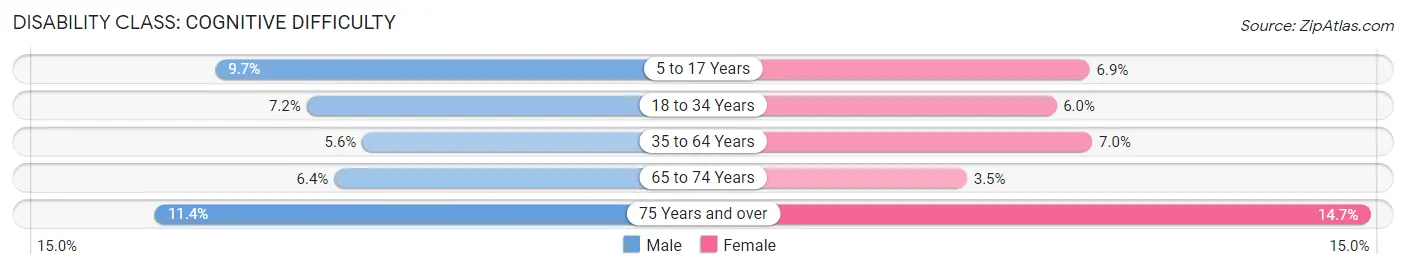
| Age Bracket | Male | Female |
| 5 to 17 Years | 531 (9.7%) | 378 (6.9%) |
| 18 to 34 Years | 626 (7.1%) | 485 (6.0%) |
| 35 to 64 Years | 912 (5.6%) | 1,209 (7.0%) |
| 65 to 74 Years | 300 (6.4%) | 200 (3.5%) |
| 75 Years and over | 263 (11.4%) | 669 (14.7%) |
Disability Class: Ambulatory Difficulty
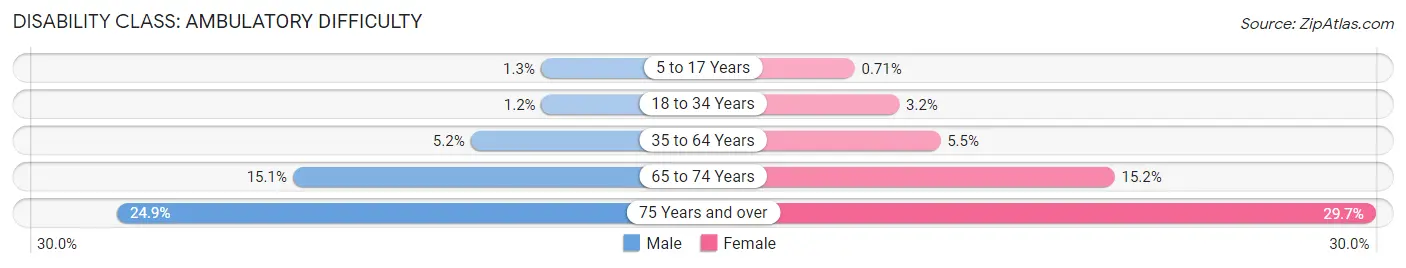
| Age Bracket | Male | Female |
| 5 to 17 Years | 69 (1.3%) | 39 (0.7%) |
| 18 to 34 Years | 107 (1.2%) | 259 (3.2%) |
| 35 to 64 Years | 842 (5.2%) | 951 (5.5%) |
| 65 to 74 Years | 709 (15.1%) | 873 (15.2%) |
| 75 Years and over | 575 (24.8%) | 1,352 (29.7%) |
Disability Class: Self-Care Difficulty
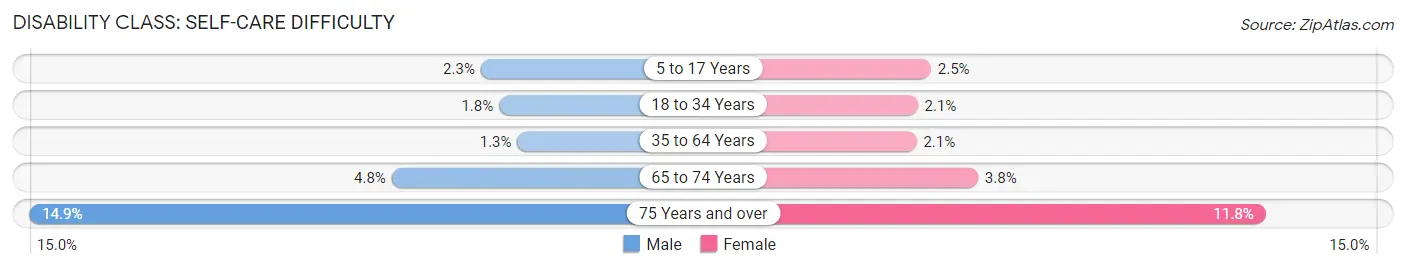
| Age Bracket | Male | Female |
| 5 to 17 Years | 126 (2.3%) | 136 (2.5%) |
| 18 to 34 Years | 157 (1.8%) | 171 (2.1%) |
| 35 to 64 Years | 208 (1.3%) | 361 (2.1%) |
| 65 to 74 Years | 225 (4.8%) | 218 (3.8%) |
| 75 Years and over | 344 (14.9%) | 537 (11.8%) |
Technology Access in Warwick
Computing Device Access in Warwick
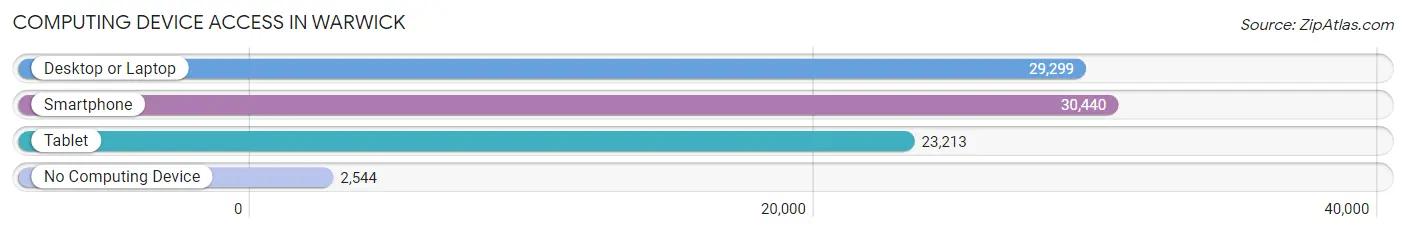
| Device Type | # Households | % Households |
| Desktop or Laptop | 29,299 | 81.1% |
| Smartphone | 30,440 | 84.2% |
| Tablet | 23,213 | 64.2% |
| No Computing Device | 2,544 | 7.0% |
| Total | 36,143 | 100.0% |
Internet Access in Warwick
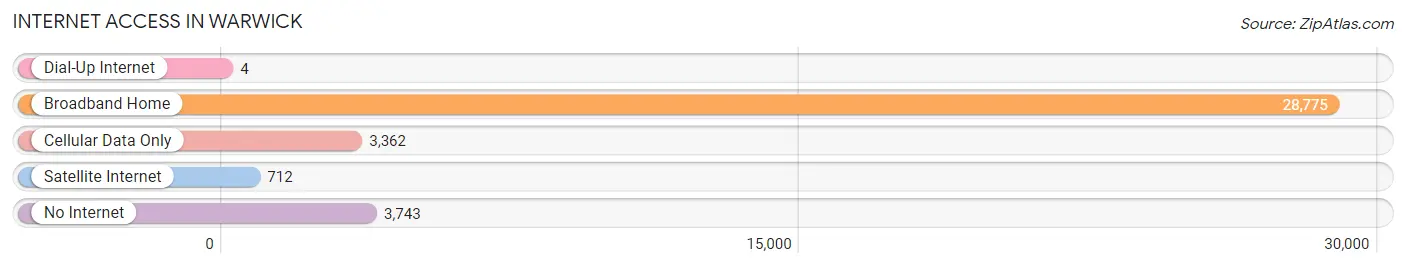
| Internet Type | # Households | % Households |
| Dial-Up Internet | 4 | 0.0% |
| Broadband Home | 28,775 | 79.6% |
| Cellular Data Only | 3,362 | 9.3% |
| Satellite Internet | 712 | 2.0% |
| No Internet | 3,743 | 10.4% |
| Total | 36,143 | 100.0% |
Warwick Summary
Warwick, Rhode Island is a city located in Kent County, Rhode Island. It is the second largest city in the state, with a population of 82,672 as of the 2010 census. The city is situated on the western shore of Narragansett Bay, approximately 12 miles south of Providence.
History
The area that is now Warwick was originally inhabited by the Narragansett Indians. The first European settlers arrived in the area in 1642, and the town was officially incorporated in 1643. The town was named after Robert Rich, the 2nd Earl of Warwick.
During the American Revolution, Warwick was the site of several battles, including the Battle of Rhode Island in 1778. The town was also the site of the first cotton mill in the United States, which was built in 1788.
Geography
Warwick is located in Kent County, Rhode Island. It is situated on the western shore of Narragansett Bay, approximately 12 miles south of Providence. The city covers an area of 24.4 square miles, of which 22.2 square miles is land and 2.2 square miles is water.
The city is bordered by the towns of West Warwick, Coventry, Cranston, and East Greenwich. The Pawtuxet River runs through the city, and there are several ponds and lakes in the area, including Warwick Pond, Buttonwoods Pond, and Apponaug Cove.
Economy
The economy of Warwick is largely based on the service industry. The city is home to several large companies, including Citizens Bank, Amica Insurance, and Hasbro. The city is also home to T.F. Green Airport, which is the largest airport in the state.
The city is also home to several educational institutions, including the University of Rhode Island, Rhode Island College, and the Community College of Rhode Island.
Demographics
As of the 2010 census, the population of Warwick was 82,672. The racial makeup of the city was 87.3% White, 5.2% African American, 0.5% Native American, 2.7% Asian, 0.1% Pacific Islander, 1.7% from other races, and 2.5% from two or more races. Hispanic or Latino of any race were 5.2% of the population.
The median household income in Warwick was $54,817, and the median family income was $63,945. The per capita income was $27,845. About 8.3% of the population was below the poverty line.
Common Questions
What is Per Capita Income in Warwick?
Per Capita income in Warwick is $44,193.
What is the Median Family Income in Warwick?
Median Family Income in Warwick is $104,778.
What is the Median Household income in Warwick?
Median Household Income in Warwick is $81,009.
What is Income or Wage Gap in Warwick?
Income or Wage Gap in Warwick is 19.6%.
Women in Warwick earn 80.4 cents for every dollar earned by a man.
What is Family Income Deficit in Warwick?
Family Income Deficit in Warwick is $9,966.
Families that are below poverty line in Warwick earn $9,966 less on average than the poverty threshold level.
What is Inequality or Gini Index in Warwick?
Inequality or Gini Index in Warwick is 0.43.
What is the Total Population of Warwick?
Total Population of Warwick is 82,783.
What is the Total Male Population of Warwick?
Total Male Population of Warwick is 39,750.
What is the Total Female Population of Warwick?
Total Female Population of Warwick is 43,033.
What is the Ratio of Males per 100 Females in Warwick?
There are 92.37 Males per 100 Females in Warwick.
What is the Ratio of Females per 100 Males in Warwick?
There are 108.26 Females per 100 Males in Warwick.
What is the Median Population Age in Warwick?
Median Population Age in Warwick is 44.5 Years.
What is the Average Family Size in Warwick
Average Family Size in Warwick is 3.0 People.
What is the Average Household Size in Warwick
Average Household Size in Warwick is 2.3 People.
How Large is the Labor Force in Warwick?
There are 45,361 People in the Labor Forcein in Warwick.
What is the Percentage of People in the Labor Force in Warwick?
64.7% of People are in the Labor Force in Warwick.
What is the Unemployment Rate in Warwick?
Unemployment Rate in Warwick is 5.1%.