Manchester, NH Map & Demographics
Manchester Map
Manchester Overview
$41,067
PER CAPITA INCOME
$90,282
AVG FAMILY INCOME
$74,040
AVG HOUSEHOLD INCOME
23.0%
WAGE / INCOME GAP [ % ]
77.0¢/ $1
WAGE / INCOME GAP [ $ ]
$11,030
FAMILY INCOME DEFICIT
0.43
INEQUALITY / GINI INDEX
115,037
TOTAL POPULATION
57,472
MALE POPULATION
57,565
FEMALE POPULATION
99.84
MALES / 100 FEMALES
100.16
FEMALES / 100 MALES
37.0
MEDIAN AGE
3.0
AVG FAMILY SIZE
2.3
AVG HOUSEHOLD SIZE
68,820
LABOR FORCE [ PEOPLE ]
71.4%
PERCENT IN LABOR FORCE
4.2%
UNEMPLOYMENT RATE
Manchester Area Codes
Income in Manchester
Income Overview in Manchester
Per Capita Income in Manchester is $41,067, while median incomes of families and households are $90,282 and $74,040 respectively.
| Characteristic | Number | Measure |
| Per Capita Income | 115,037 | $41,067 |
| Median Family Income | 26,348 | $90,282 |
| Mean Family Income | 26,348 | $113,416 |
| Median Household Income | 48,409 | $74,040 |
| Mean Household Income | 48,409 | $94,570 |
| Income Deficit | 26,348 | $11,030 |
| Wage / Income Gap (%) | 115,037 | 22.98% |
| Wage / Income Gap ($) | 115,037 | 77.02¢ per $1 |
| Gini / Inequality Index | 115,037 | 0.43 |
Earnings by Sex in Manchester
Average Earnings in Manchester are $43,414, $49,694 for men and $38,272 for women, a difference of 23.0%.
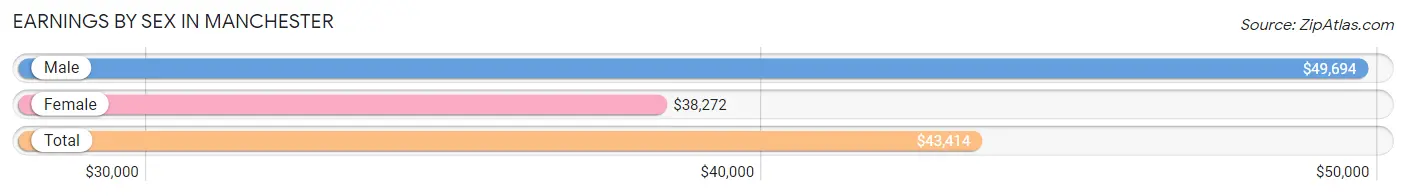
| Sex | Number | Average Earnings |
| Male | 37,354 (52.4%) | $49,694 |
| Female | 33,993 (47.6%) | $38,272 |
| Total | 71,347 (100.0%) | $43,414 |
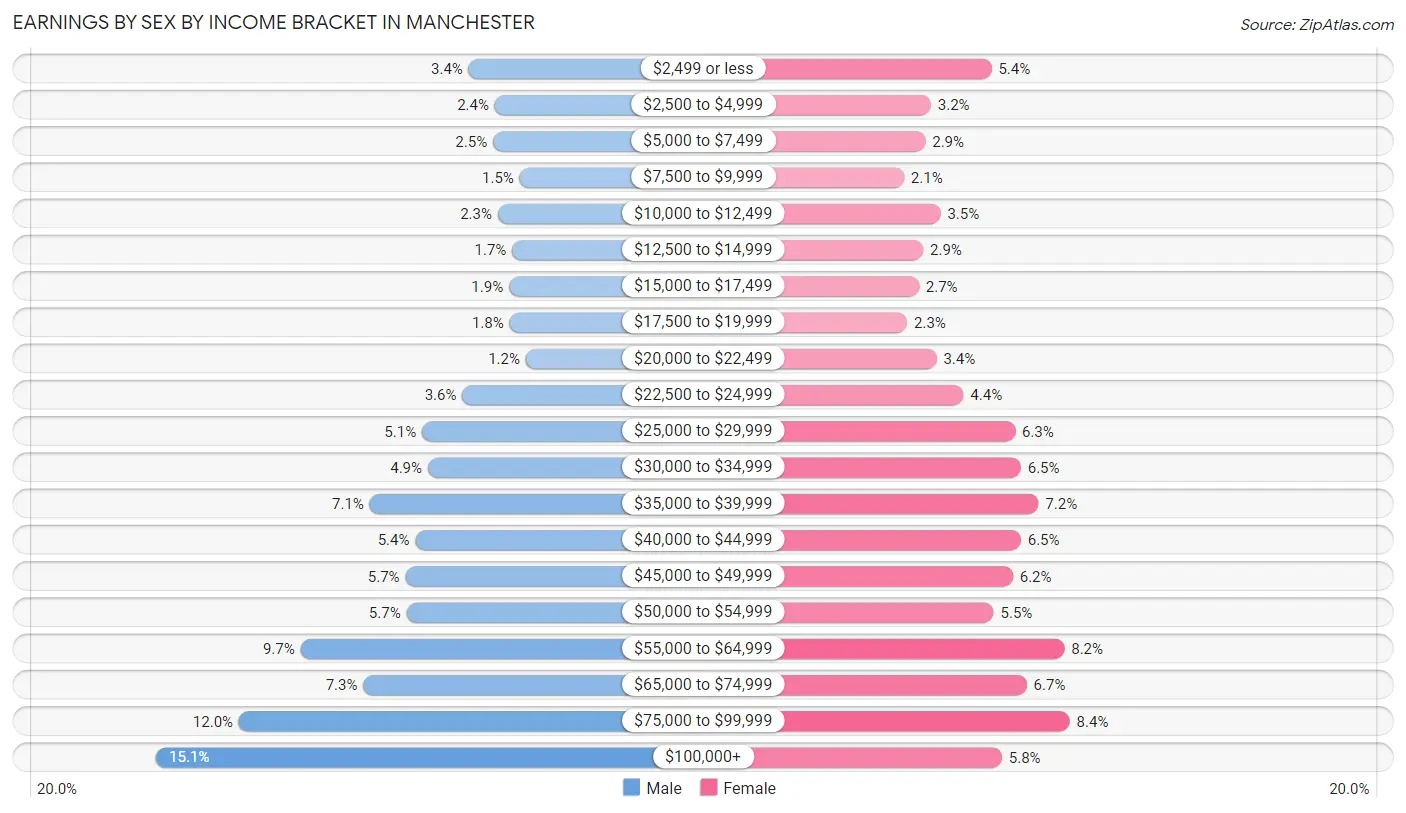
Earnings by Sex by Income Bracket in Manchester
The most common earnings brackets in Manchester are $100,000+ for men (5,631 | 15.1%) and $75,000 to $99,999 for women (2,838 | 8.4%).
| Income | Male | Female |
| $2,499 or less | 1,255 (3.4%) | 1,841 (5.4%) |
| $2,500 to $4,999 | 889 (2.4%) | 1,072 (3.2%) |
| $5,000 to $7,499 | 916 (2.5%) | 999 (2.9%) |
| $7,500 to $9,999 | 543 (1.5%) | 727 (2.1%) |
| $10,000 to $12,499 | 849 (2.3%) | 1,194 (3.5%) |
| $12,500 to $14,999 | 648 (1.7%) | 973 (2.9%) |
| $15,000 to $17,499 | 690 (1.8%) | 918 (2.7%) |
| $17,500 to $19,999 | 682 (1.8%) | 767 (2.3%) |
| $20,000 to $22,499 | 455 (1.2%) | 1,142 (3.4%) |
| $22,500 to $24,999 | 1,343 (3.6%) | 1,487 (4.4%) |
| $25,000 to $29,999 | 1,908 (5.1%) | 2,141 (6.3%) |
| $30,000 to $34,999 | 1,827 (4.9%) | 2,217 (6.5%) |
| $35,000 to $39,999 | 2,642 (7.1%) | 2,440 (7.2%) |
| $40,000 to $44,999 | 2,001 (5.4%) | 2,216 (6.5%) |
| $45,000 to $49,999 | 2,139 (5.7%) | 2,114 (6.2%) |
| $50,000 to $54,999 | 2,126 (5.7%) | 1,869 (5.5%) |
| $55,000 to $64,999 | 3,609 (9.7%) | 2,772 (8.2%) |
| $65,000 to $74,999 | 2,730 (7.3%) | 2,292 (6.7%) |
| $75,000 to $99,999 | 4,471 (12.0%) | 2,838 (8.4%) |
| $100,000+ | 5,631 (15.1%) | 1,974 (5.8%) |
| Total | 37,354 (100.0%) | 33,993 (100.0%) |
Earnings by Sex by Educational Attainment in Manchester
Average earnings in Manchester are $54,473 for men and $42,231 for women, a difference of 22.5%. Men with an educational attainment of graduate degree enjoy the highest average annual earnings of $82,855, while those with less than high school education earn the least with $38,674. Women with an educational attainment of graduate degree earn the most with the average annual earnings of $64,512, while those with less than high school education have the smallest earnings of $30,048.
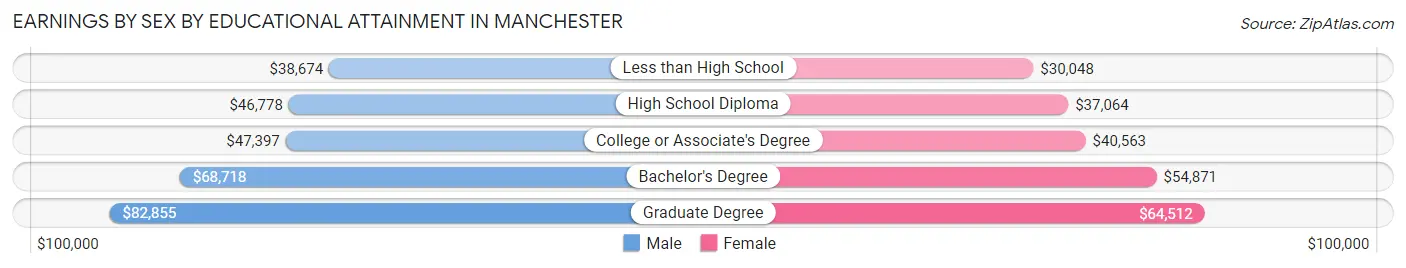
| Educational Attainment | Male Income | Female Income |
| Less than High School | $38,674 | $30,048 |
| High School Diploma | $46,778 | $37,064 |
| College or Associate's Degree | $47,397 | $40,563 |
| Bachelor's Degree | $68,718 | $54,871 |
| Graduate Degree | $82,855 | $64,512 |
| Total | $54,473 | $42,231 |
Family Income in Manchester
Family Income Brackets in Manchester
According to the Manchester family income data, there are 5,533 families falling into the $100,000 to $149,999 income range, which is the most common income bracket and makes up 21.0% of all families. Conversely, the $10,000 to $14,999 income bracket is the least frequent group with only 448 families (1.7%) belonging to this category.
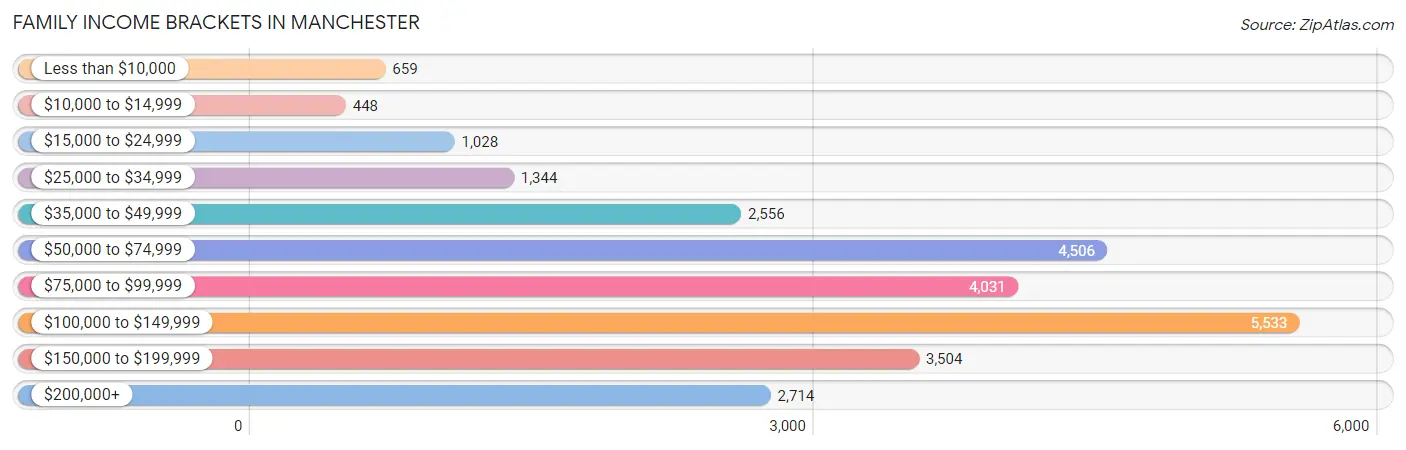
| Income Bracket | # Families | % Families |
| Less than $10,000 | 659 | 2.5% |
| $10,000 to $14,999 | 448 | 1.7% |
| $15,000 to $24,999 | 1,028 | 3.9% |
| $25,000 to $34,999 | 1,344 | 5.1% |
| $35,000 to $49,999 | 2,556 | 9.7% |
| $50,000 to $74,999 | 4,506 | 17.1% |
| $75,000 to $99,999 | 4,031 | 15.3% |
| $100,000 to $149,999 | 5,533 | 21.0% |
| $150,000 to $199,999 | 3,504 | 13.3% |
| $200,000+ | 2,714 | 10.3% |
Family Income by Famaliy Size in Manchester
3-person families (6,087 | 23.1%) account for the highest median family income in Manchester with $99,886 per family, while 2-person families (13,123 | 49.8%) have the highest median income of $43,561 per family member.
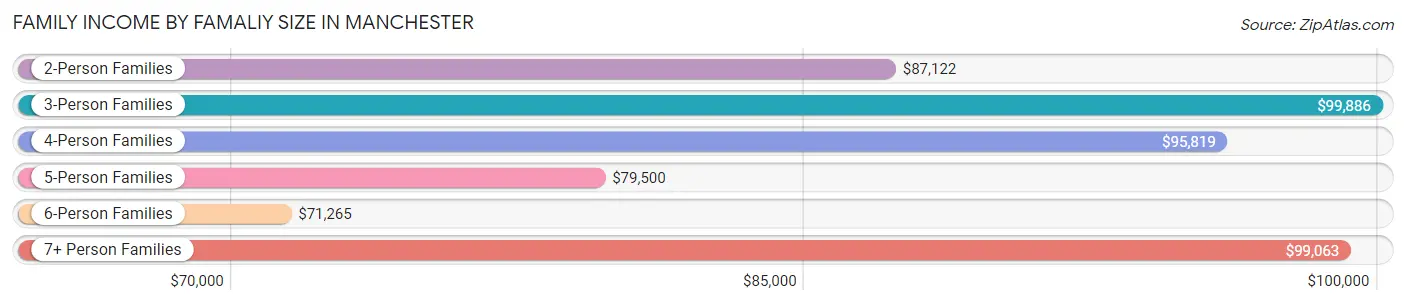
| Income Bracket | # Families | Median Income |
| 2-Person Families | 13,123 (49.8%) | $87,122 |
| 3-Person Families | 6,087 (23.1%) | $99,886 |
| 4-Person Families | 4,597 (17.4%) | $95,819 |
| 5-Person Families | 1,522 (5.8%) | $79,500 |
| 6-Person Families | 777 (2.9%) | $71,265 |
| 7+ Person Families | 242 (0.9%) | $99,063 |
| Total | 26,348 (100.0%) | $90,282 |
Family Income by Number of Earners in Manchester
The median family income in Manchester is $90,282, with families comprising 3+ earners (3,626) having the highest median family income of $150,700, while families with no earners (3,094) have the lowest median family income of $38,036, accounting for 13.8% and 11.7% of families, respectively.
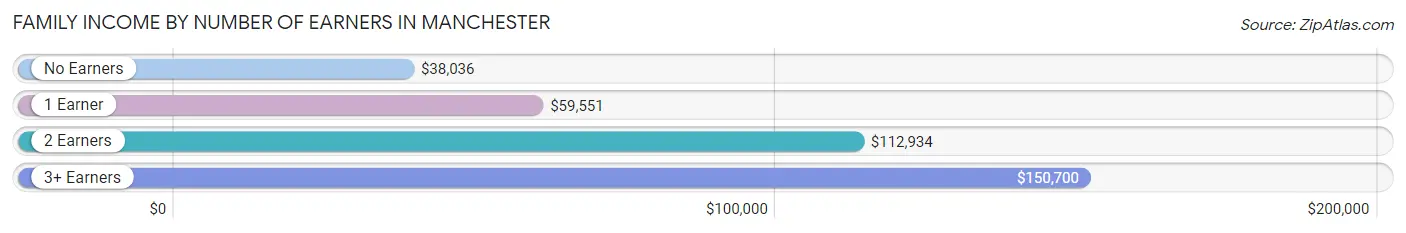
| Number of Earners | # Families | Median Income |
| No Earners | 3,094 (11.7%) | $38,036 |
| 1 Earner | 7,807 (29.6%) | $59,551 |
| 2 Earners | 11,821 (44.9%) | $112,934 |
| 3+ Earners | 3,626 (13.8%) | $150,700 |
| Total | 26,348 (100.0%) | $90,282 |
Household Income in Manchester
Household Income Brackets in Manchester
With 9,004 households falling in the category, the $50,000 to $74,999 income range is the most frequent in Manchester, accounting for 18.6% of all households. In contrast, only 1,549 households (3.2%) fall into the $10,000 to $14,999 income bracket, making it the least populous group.
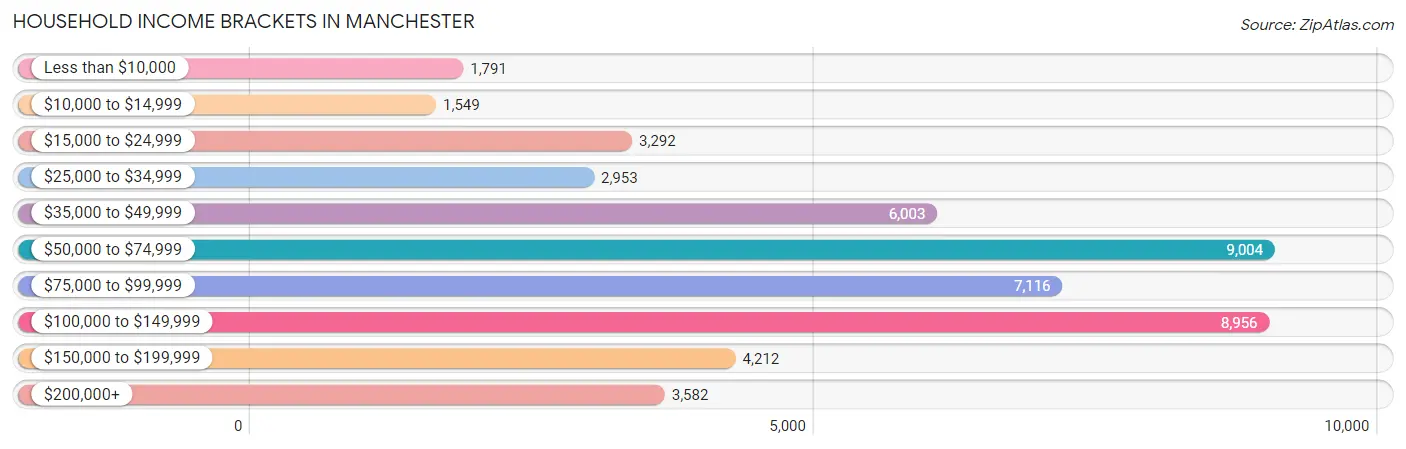
| Income Bracket | # Households | % Households |
| Less than $10,000 | 1,791 | 3.7% |
| $10,000 to $14,999 | 1,549 | 3.2% |
| $15,000 to $24,999 | 3,292 | 6.8% |
| $25,000 to $34,999 | 2,953 | 6.1% |
| $35,000 to $49,999 | 6,003 | 12.4% |
| $50,000 to $74,999 | 9,004 | 18.6% |
| $75,000 to $99,999 | 7,116 | 14.7% |
| $100,000 to $149,999 | 8,956 | 18.5% |
| $150,000 to $199,999 | 4,212 | 8.7% |
| $200,000+ | 3,582 | 7.4% |
Household Income by Householder Age in Manchester
The median household income in Manchester is $74,040, with the highest median household income of $88,142 found in the 45 to 64 years age bracket for the primary householder. A total of 17,308 households (35.7%) fall into this category. Meanwhile, the 65+ years age bracket for the primary householder has the lowest median household income of $49,496, with 10,315 households (21.3%) in this group.
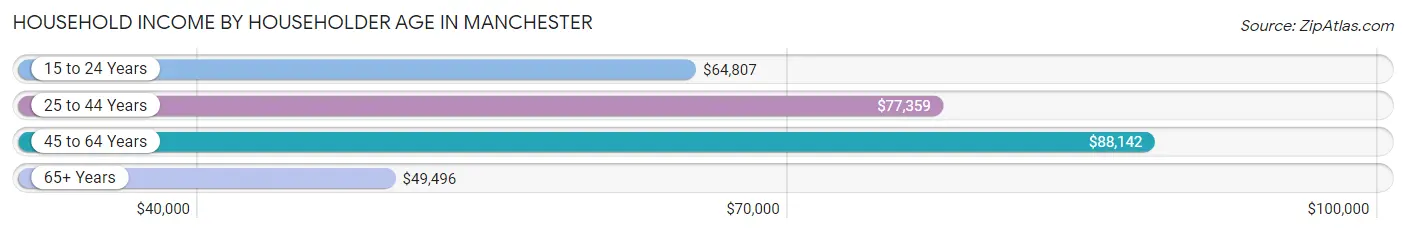
| Income Bracket | # Households | Median Income |
| 15 to 24 Years | 2,391 (4.9%) | $64,807 |
| 25 to 44 Years | 18,395 (38.0%) | $77,359 |
| 45 to 64 Years | 17,308 (35.7%) | $88,142 |
| 65+ Years | 10,315 (21.3%) | $49,496 |
| Total | 48,409 (100.0%) | $74,040 |
Poverty in Manchester
Income Below Poverty by Sex and Age in Manchester
With 9.4% poverty level for males and 13.7% for females among the residents of Manchester, 5 year old males and 5 year old females are the most vulnerable to poverty, with 161 males (24.1%) and 171 females (29.6%) in their respective age groups living below the poverty level.
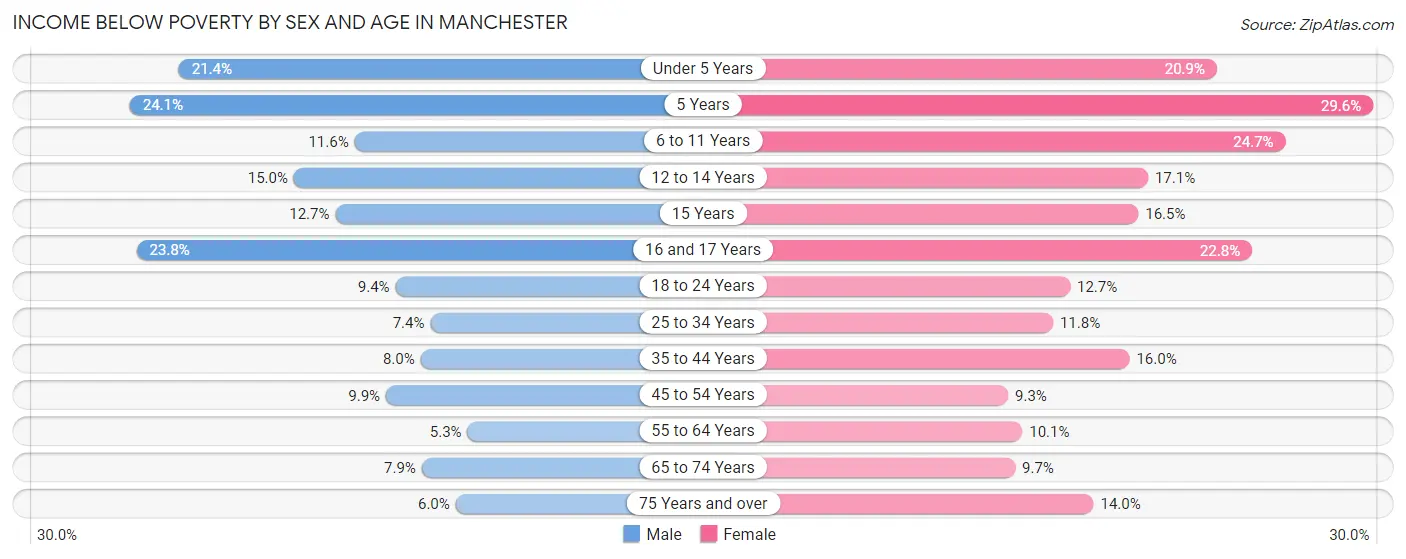
| Age Bracket | Male | Female |
| Under 5 Years | 624 (21.4%) | 637 (20.9%) |
| 5 Years | 161 (24.1%) | 171 (29.6%) |
| 6 to 11 Years | 410 (11.6%) | 819 (24.7%) |
| 12 to 14 Years | 228 (15.0%) | 240 (17.1%) |
| 15 Years | 71 (12.7%) | 103 (16.5%) |
| 16 and 17 Years | 289 (23.8%) | 235 (22.8%) |
| 18 to 24 Years | 503 (9.3%) | 712 (12.7%) |
| 25 to 34 Years | 797 (7.4%) | 1,215 (11.8%) |
| 35 to 44 Years | 631 (8.0%) | 1,203 (16.0%) |
| 45 to 54 Years | 624 (9.9%) | 652 (9.3%) |
| 55 to 64 Years | 433 (5.3%) | 749 (10.1%) |
| 65 to 74 Years | 357 (7.9%) | 425 (9.7%) |
| 75 Years and over | 168 (6.0%) | 539 (14.0%) |
| Total | 5,296 (9.4%) | 7,700 (13.7%) |
Income Above Poverty by Sex and Age in Manchester
According to the poverty statistics in Manchester, males aged 55 to 64 years and females aged 45 to 54 years are the age groups that are most secure financially, with 94.7% of males and 90.7% of females in these age groups living above the poverty line.
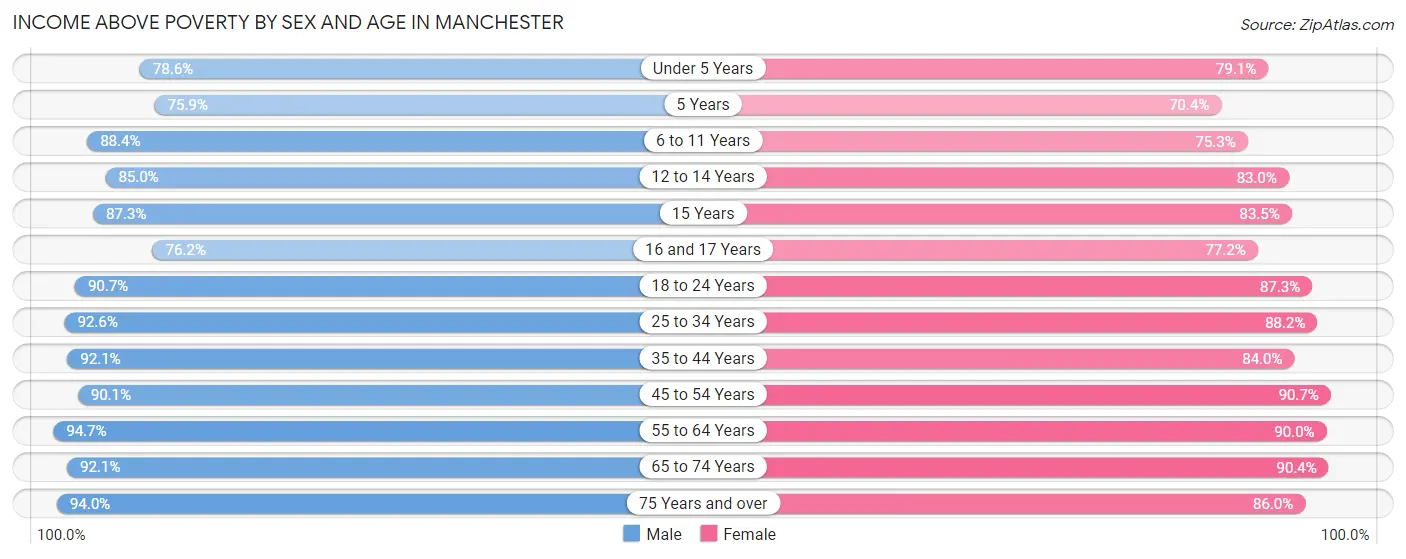
| Age Bracket | Male | Female |
| Under 5 Years | 2,290 (78.6%) | 2,414 (79.1%) |
| 5 Years | 506 (75.9%) | 407 (70.4%) |
| 6 to 11 Years | 3,114 (88.4%) | 2,497 (75.3%) |
| 12 to 14 Years | 1,291 (85.0%) | 1,168 (83.0%) |
| 15 Years | 488 (87.3%) | 521 (83.5%) |
| 16 and 17 Years | 927 (76.2%) | 794 (77.2%) |
| 18 to 24 Years | 4,878 (90.6%) | 4,890 (87.3%) |
| 25 to 34 Years | 9,958 (92.6%) | 9,119 (88.2%) |
| 35 to 44 Years | 7,302 (92.0%) | 6,307 (84.0%) |
| 45 to 54 Years | 5,690 (90.1%) | 6,392 (90.7%) |
| 55 to 64 Years | 7,672 (94.7%) | 6,706 (89.9%) |
| 65 to 74 Years | 4,169 (92.1%) | 3,979 (90.3%) |
| 75 Years and over | 2,634 (94.0%) | 3,305 (86.0%) |
| Total | 50,919 (90.6%) | 48,499 (86.3%) |
Income Below Poverty Among Married-Couple Families in Manchester
The poverty statistics for married-couple families in Manchester show that 2.7% or 494 of the total 18,174 families live below the poverty line. Families with 3 or 4 children have the highest poverty rate of 6.2%, comprising of 76 families. On the other hand, families with 5 or more children have the lowest poverty rate of 0.0%, which includes 0 families.
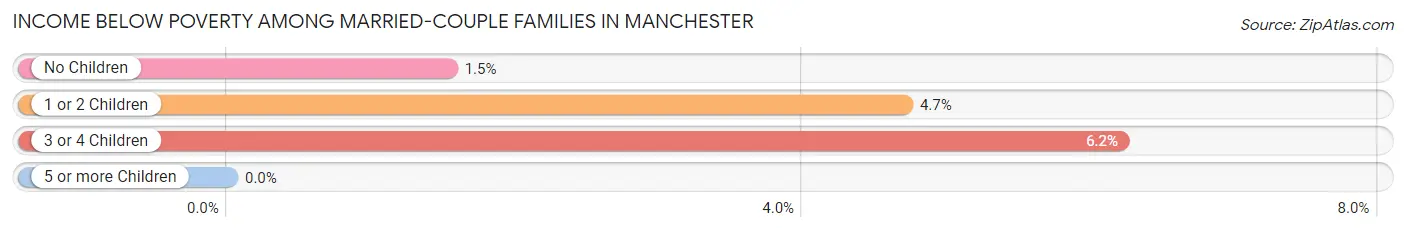
| Children | Above Poverty | Below Poverty |
| No Children | 11,755 (98.5%) | 183 (1.5%) |
| 1 or 2 Children | 4,765 (95.3%) | 235 (4.7%) |
| 3 or 4 Children | 1,148 (93.8%) | 76 (6.2%) |
| 5 or more Children | 12 (100.0%) | 0 (0.0%) |
| Total | 17,680 (97.3%) | 494 (2.7%) |
Income Below Poverty Among Single-Parent Households in Manchester
According to the poverty data in Manchester, 11.6% or 332 single-father households and 22.9% or 1,220 single-mother households are living below the poverty line. Among single-father households, those with 3 or 4 children have the highest poverty rate, with 106 households (40.6%) experiencing poverty. Likewise, among single-mother households, those with 5 or more children have the highest poverty rate, with 50 households (100.0%) falling below the poverty line.
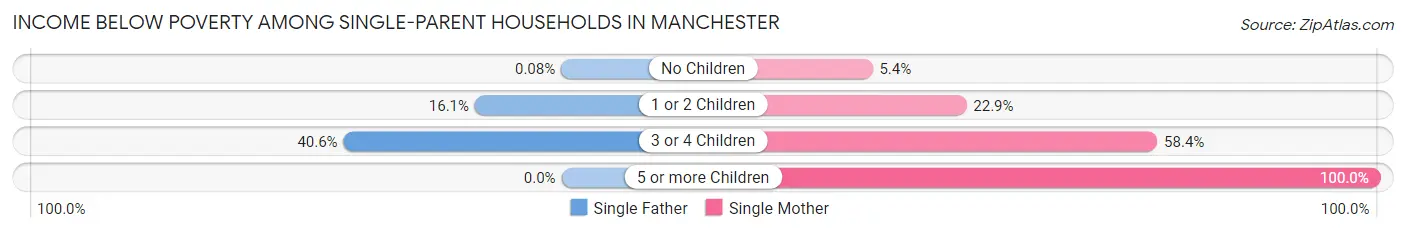
| Children | Single Father | Single Mother |
| No Children | 1 (0.1%) | 100 (5.4%) |
| 1 or 2 Children | 225 (16.1%) | 590 (22.9%) |
| 3 or 4 Children | 106 (40.6%) | 480 (58.4%) |
| 5 or more Children | 0 (0.0%) | 50 (100.0%) |
| Total | 332 (11.6%) | 1,220 (22.9%) |
Income Below Poverty Among Married-Couple vs Single-Parent Households in Manchester
The poverty data for Manchester shows that 494 of the married-couple family households (2.7%) and 1,552 of the single-parent households (19.0%) are living below the poverty level. Within the married-couple family households, those with 3 or 4 children have the highest poverty rate, with 76 households (6.2%) falling below the poverty line. Among the single-parent households, those with 5 or more children have the highest poverty rate, with 50 household (100.0%) living below poverty.
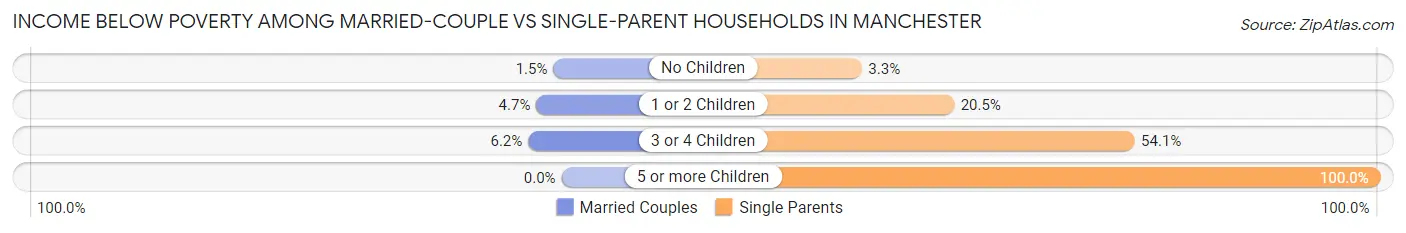
| Children | Married-Couple Families | Single-Parent Households |
| No Children | 183 (1.5%) | 101 (3.3%) |
| 1 or 2 Children | 235 (4.7%) | 815 (20.5%) |
| 3 or 4 Children | 76 (6.2%) | 586 (54.1%) |
| 5 or more Children | 0 (0.0%) | 50 (100.0%) |
| Total | 494 (2.7%) | 1,552 (19.0%) |
Race in Manchester
The most populous races in Manchester are White / Caucasian (89,027 | 77.4%), Hispanic or Latino (14,187 | 12.3%), and Two or more Races (9,843 | 8.6%).
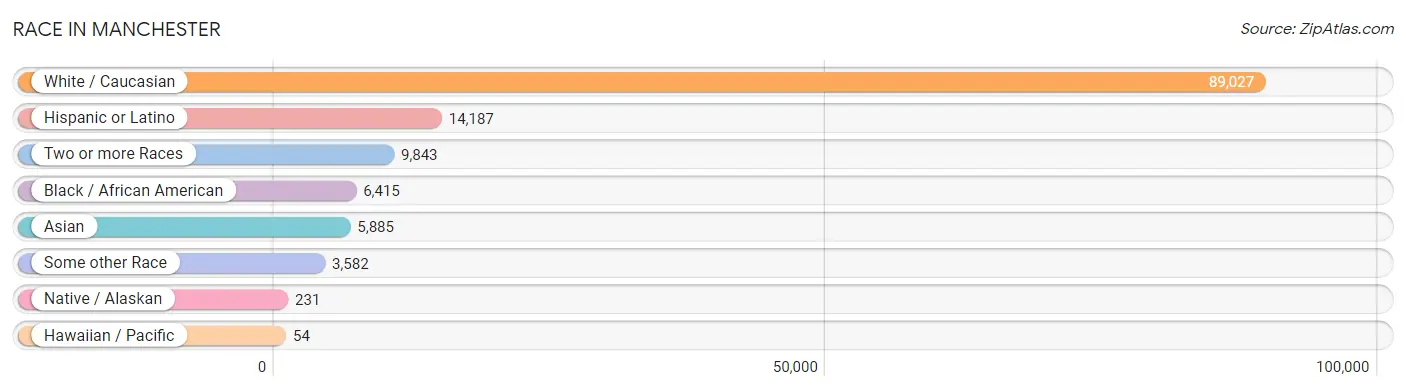
| Race | # Population | % Population |
| Asian | 5,885 | 5.1% |
| Black / African American | 6,415 | 5.6% |
| Hawaiian / Pacific | 54 | 0.1% |
| Hispanic or Latino | 14,187 | 12.3% |
| Native / Alaskan | 231 | 0.2% |
| White / Caucasian | 89,027 | 77.4% |
| Two or more Races | 9,843 | 8.6% |
| Some other Race | 3,582 | 3.1% |
| Total | 115,037 | 100.0% |
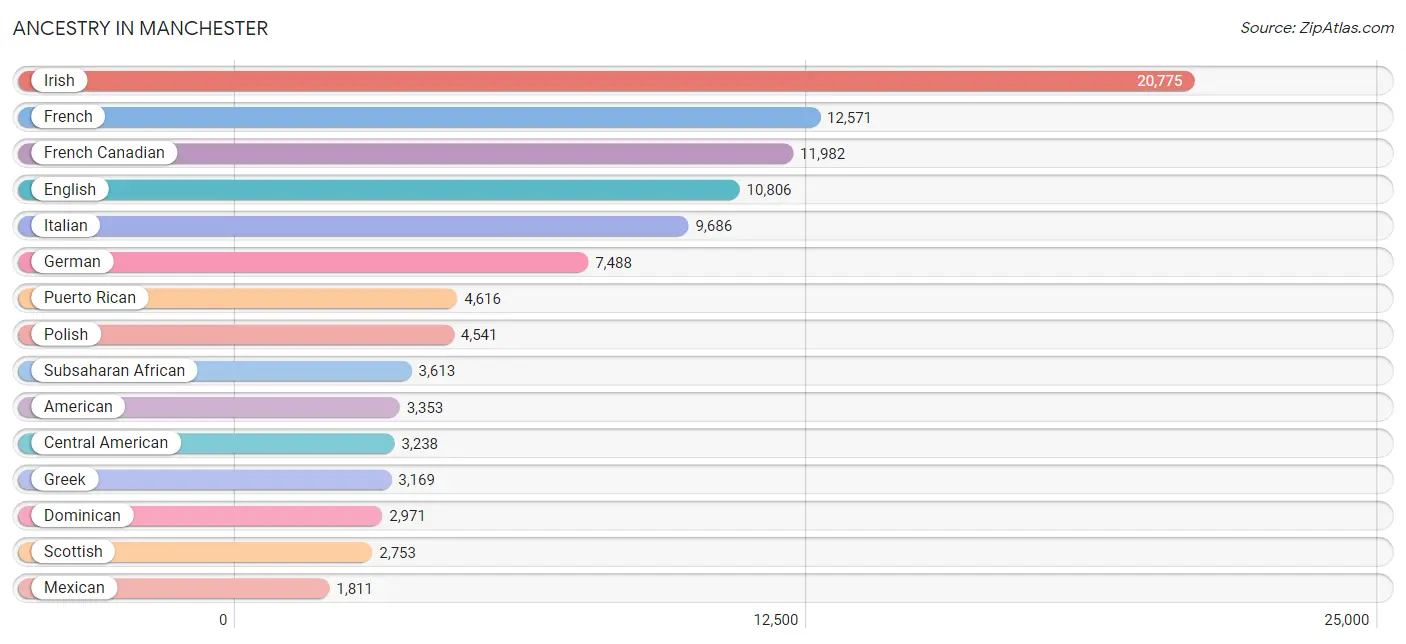
Ancestry in Manchester
The most populous ancestries reported in Manchester are Irish (20,775 | 18.1%), French (12,571 | 10.9%), French Canadian (11,982 | 10.4%), English (10,806 | 9.4%), and Italian (9,686 | 8.4%), together accounting for 57.2% of all Manchester residents.
| Ancestry | # Population | % Population |
| Afghan | 67 | 0.1% |
| African | 1,527 | 1.3% |
| Alaskan Athabascan | 29 | 0.0% |
| Albanian | 644 | 0.6% |
| Aleut | 29 | 0.0% |
| American | 3,353 | 2.9% |
| Arab | 937 | 0.8% |
| Argentinean | 6 | 0.0% |
| Armenian | 186 | 0.2% |
| Australian | 6 | 0.0% |
| Austrian | 95 | 0.1% |
| Barbadian | 44 | 0.0% |
| Belgian | 216 | 0.2% |
| Bhutanese | 165 | 0.1% |
| Blackfeet | 85 | 0.1% |
| Brazilian | 244 | 0.2% |
| British | 451 | 0.4% |
| British West Indian | 34 | 0.0% |
| Bulgarian | 44 | 0.0% |
| Burmese | 295 | 0.3% |
| Cajun | 10 | 0.0% |
| Canadian | 1,774 | 1.5% |
| Cape Verdean | 278 | 0.2% |
| Central American | 3,238 | 2.8% |
| Central American Indian | 40 | 0.0% |
| Cherokee | 111 | 0.1% |
| Colombian | 515 | 0.4% |
| Costa Rican | 18 | 0.0% |
| Cree | 3 | 0.0% |
| Creek | 8 | 0.0% |
| Croatian | 26 | 0.0% |
| Cuban | 97 | 0.1% |
| Czech | 69 | 0.1% |
| Czechoslovakian | 39 | 0.0% |
| Danish | 117 | 0.1% |
| Dominican | 2,971 | 2.6% |
| Dutch | 432 | 0.4% |
| Eastern European | 171 | 0.2% |
| Ecuadorian | 28 | 0.0% |
| Egyptian | 45 | 0.0% |
| English | 10,806 | 9.4% |
| European | 1,258 | 1.1% |
| Filipino | 4 | 0.0% |
| Finnish | 206 | 0.2% |
| French | 12,571 | 10.9% |
| French American Indian | 60 | 0.1% |
| French Canadian | 11,982 | 10.4% |
| German | 7,488 | 6.5% |
| Greek | 3,169 | 2.8% |
| Guamanian / Chamorro | 45 | 0.0% |
| Guatemalan | 625 | 0.5% |
| Guyanese | 37 | 0.0% |
| Haitian | 615 | 0.5% |
| Honduran | 1,235 | 1.1% |
| Hopi | 148 | 0.1% |
| Hungarian | 307 | 0.3% |
| Icelander | 97 | 0.1% |
| Indian (Asian) | 778 | 0.7% |
| Inupiat | 7 | 0.0% |
| Iranian | 120 | 0.1% |
| Iraqi | 176 | 0.2% |
| Irish | 20,775 | 18.1% |
| Iroquois | 73 | 0.1% |
| Italian | 9,686 | 8.4% |
| Jamaican | 320 | 0.3% |
| Japanese | 505 | 0.4% |
| Jordanian | 149 | 0.1% |
| Kenyan | 189 | 0.2% |
| Korean | 775 | 0.7% |
| Laotian | 100 | 0.1% |
| Latvian | 13 | 0.0% |
| Lebanese | 388 | 0.3% |
| Liberian | 53 | 0.1% |
| Lithuanian | 320 | 0.3% |
| Malaysian | 112 | 0.1% |
| Maltese | 12 | 0.0% |
| Mexican | 1,811 | 1.6% |
| Mexican American Indian | 73 | 0.1% |
| Moroccan | 93 | 0.1% |
| Native Hawaiian | 18 | 0.0% |
| Navajo | 12 | 0.0% |
| Nicaraguan | 377 | 0.3% |
| Nigerian | 25 | 0.0% |
| Northern European | 74 | 0.1% |
| Norwegian | 448 | 0.4% |
| Pakistani | 65 | 0.1% |
| Panamanian | 66 | 0.1% |
| Peruvian | 297 | 0.3% |
| Polish | 4,541 | 4.0% |
| Portuguese | 1,743 | 1.5% |
| Potawatomi | 29 | 0.0% |
| Puerto Rican | 4,616 | 4.0% |
| Romanian | 207 | 0.2% |
| Russian | 665 | 0.6% |
| Salvadoran | 917 | 0.8% |
| Scandinavian | 204 | 0.2% |
| Scotch-Irish | 1,270 | 1.1% |
| Scottish | 2,753 | 2.4% |
| Seminole | 3 | 0.0% |
| Serbian | 108 | 0.1% |
| Slavic | 27 | 0.0% |
| Slovak | 70 | 0.1% |
| Slovene | 29 | 0.0% |
| Somali | 271 | 0.2% |
| South American | 926 | 0.8% |
| Spaniard | 19 | 0.0% |
| Spanish | 403 | 0.4% |
| Sri Lankan | 1,279 | 1.1% |
| Subsaharan African | 3,613 | 3.1% |
| Sudanese | 589 | 0.5% |
| Swedish | 1,636 | 1.4% |
| Swiss | 104 | 0.1% |
| Syrian | 8 | 0.0% |
| Thai | 769 | 0.7% |
| Tlingit-Haida | 3 | 0.0% |
| Turkish | 118 | 0.1% |
| Ukrainian | 380 | 0.3% |
| Uruguayan | 33 | 0.0% |
| Venezuelan | 47 | 0.0% |
| Vietnamese | 99 | 0.1% |
| Welsh | 534 | 0.5% |
| West Indian | 324 | 0.3% |
| Yugoslavian | 718 | 0.6% |
| Yup'ik | 29 | 0.0% |
| Zimbabwean | 52 | 0.1% | View All 125 Rows |
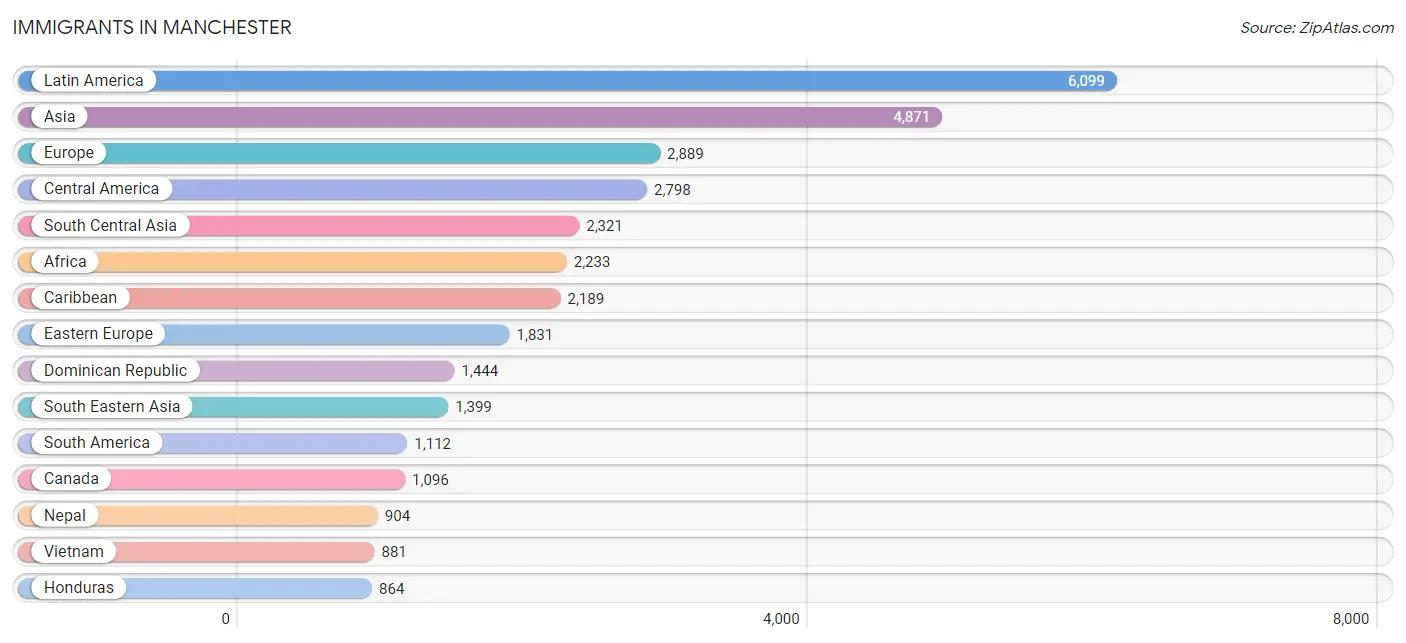
Immigrants in Manchester
The most numerous immigrant groups reported in Manchester came from Latin America (6,099 | 5.3%), Asia (4,871 | 4.2%), Europe (2,889 | 2.5%), Central America (2,798 | 2.4%), and South Central Asia (2,321 | 2.0%), together accounting for 16.5% of all Manchester residents.
| Immigration Origin | # Population | % Population |
| Afghanistan | 51 | 0.0% |
| Africa | 2,233 | 1.9% |
| Albania | 251 | 0.2% |
| Argentina | 6 | 0.0% |
| Armenia | 1 | 0.0% |
| Asia | 4,871 | 4.2% |
| Austria | 8 | 0.0% |
| Bangladesh | 34 | 0.0% |
| Belarus | 7 | 0.0% |
| Bosnia and Herzegovina | 577 | 0.5% |
| Brazil | 517 | 0.4% |
| Bulgaria | 44 | 0.0% |
| Cambodia | 15 | 0.0% |
| Cameroon | 7 | 0.0% |
| Canada | 1,096 | 0.9% |
| Caribbean | 2,189 | 1.9% |
| Central America | 2,798 | 2.4% |
| China | 461 | 0.4% |
| Colombia | 354 | 0.3% |
| Congo | 54 | 0.1% |
| Croatia | 114 | 0.1% |
| Cuba | 33 | 0.0% |
| Czechoslovakia | 17 | 0.0% |
| Dominica | 27 | 0.0% |
| Dominican Republic | 1,444 | 1.3% |
| Eastern Africa | 817 | 0.7% |
| Eastern Asia | 712 | 0.6% |
| Eastern Europe | 1,831 | 1.6% |
| Ecuador | 9 | 0.0% |
| Egypt | 138 | 0.1% |
| El Salvador | 549 | 0.5% |
| England | 106 | 0.1% |
| Europe | 2,889 | 2.5% |
| France | 10 | 0.0% |
| Germany | 196 | 0.2% |
| Ghana | 41 | 0.0% |
| Greece | 112 | 0.1% |
| Guatemala | 524 | 0.5% |
| Guyana | 26 | 0.0% |
| Haiti | 360 | 0.3% |
| Honduras | 864 | 0.7% |
| Hong Kong | 21 | 0.0% |
| Hungary | 24 | 0.0% |
| India | 706 | 0.6% |
| Indonesia | 75 | 0.1% |
| Iran | 46 | 0.0% |
| Iraq | 104 | 0.1% |
| Ireland | 139 | 0.1% |
| Italy | 41 | 0.0% |
| Jamaica | 164 | 0.1% |
| Japan | 29 | 0.0% |
| Jordan | 149 | 0.1% |
| Kenya | 151 | 0.1% |
| Korea | 222 | 0.2% |
| Laos | 78 | 0.1% |
| Latin America | 6,099 | 5.3% |
| Lebanon | 85 | 0.1% |
| Liberia | 177 | 0.2% |
| Lithuania | 18 | 0.0% |
| Malaysia | 39 | 0.0% |
| Mexico | 520 | 0.4% |
| Middle Africa | 491 | 0.4% |
| Morocco | 96 | 0.1% |
| Nepal | 904 | 0.8% |
| Netherlands | 36 | 0.0% |
| Nicaragua | 296 | 0.3% |
| Nigeria | 95 | 0.1% |
| Northern Africa | 378 | 0.3% |
| Northern Europe | 502 | 0.4% |
| Pakistan | 30 | 0.0% |
| Panama | 45 | 0.0% |
| Peru | 151 | 0.1% |
| Philippines | 271 | 0.2% |
| Poland | 198 | 0.2% |
| Portugal | 153 | 0.1% |
| Romania | 138 | 0.1% |
| Russia | 64 | 0.1% |
| Saudi Arabia | 40 | 0.0% |
| Scotland | 65 | 0.1% |
| Senegal | 12 | 0.0% |
| Serbia | 24 | 0.0% |
| Somalia | 62 | 0.1% |
| South America | 1,112 | 1.0% |
| South Central Asia | 2,321 | 2.0% |
| South Eastern Asia | 1,399 | 1.2% |
| Southern Europe | 306 | 0.3% |
| Sudan | 122 | 0.1% |
| Taiwan | 85 | 0.1% |
| Thailand | 40 | 0.0% |
| Turkey | 10 | 0.0% |
| Uganda | 51 | 0.0% |
| Ukraine | 175 | 0.2% |
| Uruguay | 9 | 0.0% |
| Uzbekistan | 66 | 0.1% |
| Venezuela | 40 | 0.0% |
| Vietnam | 881 | 0.8% |
| Western Africa | 325 | 0.3% |
| Western Asia | 432 | 0.4% |
| Western Europe | 250 | 0.2% |
| Yemen | 15 | 0.0% |
| Zaire | 384 | 0.3% |
| Zimbabwe | 52 | 0.1% | View All 102 Rows |
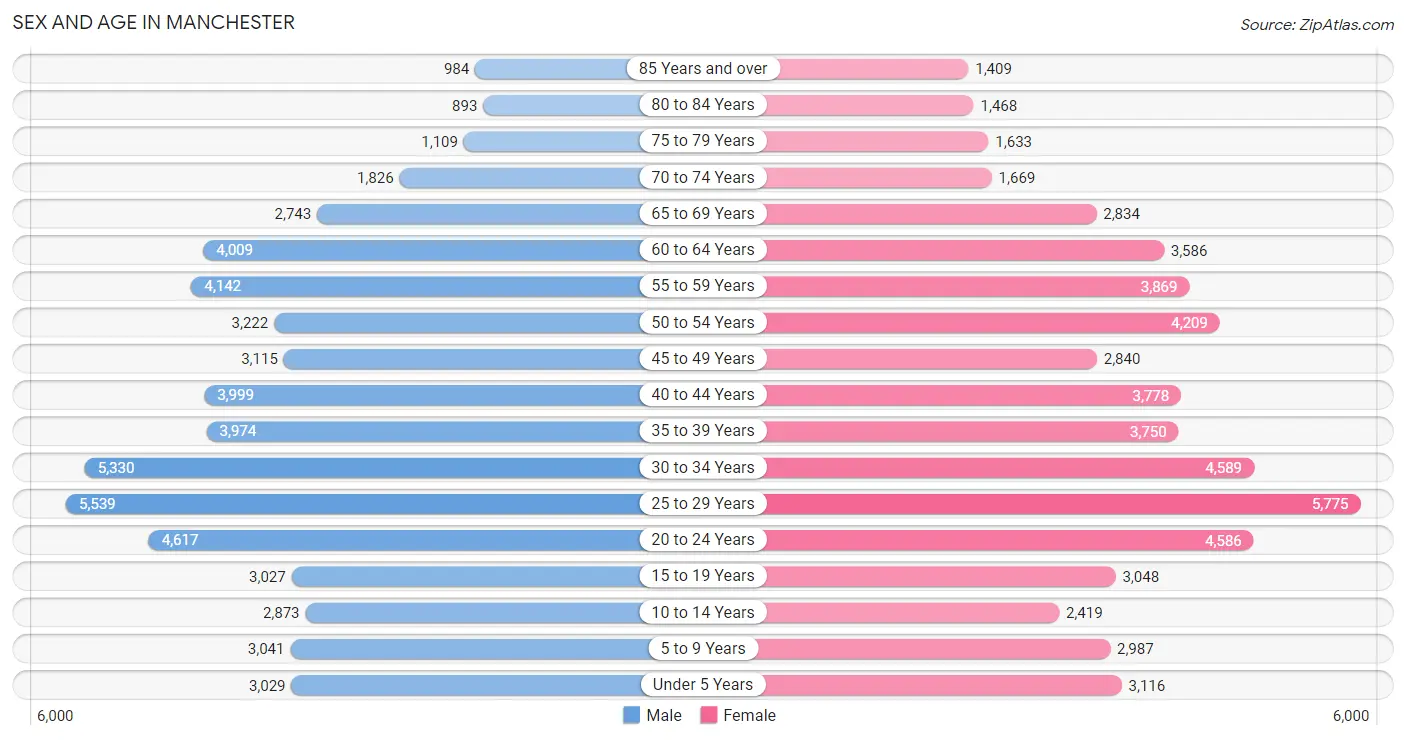
Sex and Age in Manchester
Sex and Age in Manchester
The most populous age groups in Manchester are 25 to 29 Years (5,539 | 9.6%) for men and 25 to 29 Years (5,775 | 10.0%) for women.
| Age Bracket | Male | Female |
| Under 5 Years | 3,029 (5.3%) | 3,116 (5.4%) |
| 5 to 9 Years | 3,041 (5.3%) | 2,987 (5.2%) |
| 10 to 14 Years | 2,873 (5.0%) | 2,419 (4.2%) |
| 15 to 19 Years | 3,027 (5.3%) | 3,048 (5.3%) |
| 20 to 24 Years | 4,617 (8.0%) | 4,586 (8.0%) |
| 25 to 29 Years | 5,539 (9.6%) | 5,775 (10.0%) |
| 30 to 34 Years | 5,330 (9.3%) | 4,589 (8.0%) |
| 35 to 39 Years | 3,974 (6.9%) | 3,750 (6.5%) |
| 40 to 44 Years | 3,999 (7.0%) | 3,778 (6.6%) |
| 45 to 49 Years | 3,115 (5.4%) | 2,840 (4.9%) |
| 50 to 54 Years | 3,222 (5.6%) | 4,209 (7.3%) |
| 55 to 59 Years | 4,142 (7.2%) | 3,869 (6.7%) |
| 60 to 64 Years | 4,009 (7.0%) | 3,586 (6.2%) |
| 65 to 69 Years | 2,743 (4.8%) | 2,834 (4.9%) |
| 70 to 74 Years | 1,826 (3.2%) | 1,669 (2.9%) |
| 75 to 79 Years | 1,109 (1.9%) | 1,633 (2.8%) |
| 80 to 84 Years | 893 (1.5%) | 1,468 (2.5%) |
| 85 Years and over | 984 (1.7%) | 1,409 (2.5%) |
| Total | 57,472 (100.0%) | 57,565 (100.0%) |
Families and Households in Manchester
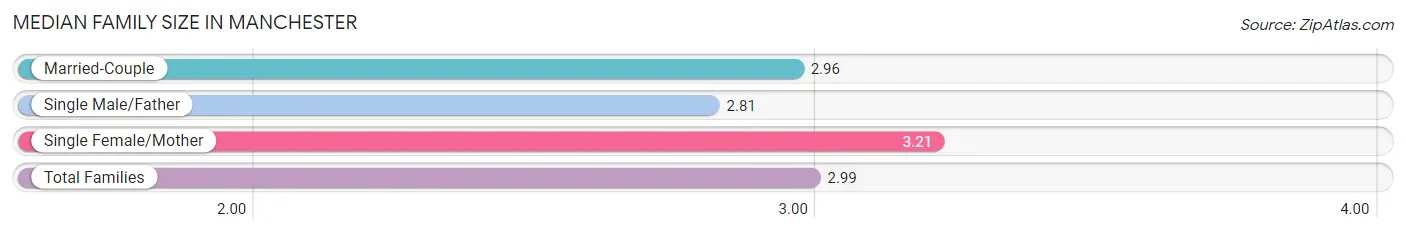
Median Family Size in Manchester
The median family size in Manchester is 2.99 persons per family, with single female/mother families (5,319 | 20.2%) accounting for the largest median family size of 3.21 persons per family. On the other hand, single male/father families (2,855 | 10.8%) represent the smallest median family size with 2.81 persons per family.
| Family Type | # Families | Family Size |
| Married-Couple | 18,174 (69.0%) | 2.96 |
| Single Male/Father | 2,855 (10.8%) | 2.81 |
| Single Female/Mother | 5,319 (20.2%) | 3.21 |
| Total Families | 26,348 (100.0%) | 2.99 |
Median Household Size in Manchester
The median household size in Manchester is 2.32 persons per household, with single female/mother households (5,319 | 11.0%) accounting for the largest median household size of 3.5 persons per household. non-family households (22,061 | 45.6%) represent the smallest median household size with 1.34 persons per household.

| Household Type | # Households | Household Size |
| Married-Couple | 18,174 (37.5%) | 3.00 |
| Single Male/Father | 2,855 (5.9%) | 3.38 |
| Single Female/Mother | 5,319 (11.0%) | 3.50 |
| Non-family | 22,061 (45.6%) | 1.34 |
| Total Households | 48,409 (100.0%) | 2.32 |
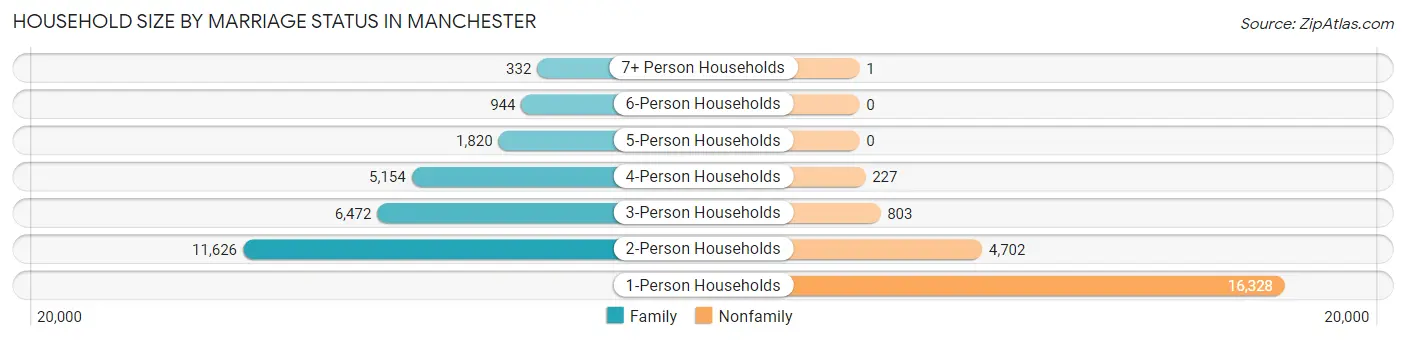
Household Size by Marriage Status in Manchester
Out of a total of 48,409 households in Manchester, 26,348 (54.4%) are family households, while 22,061 (45.6%) are nonfamily households. The most numerous type of family households are 2-person households, comprising 11,626, and the most common type of nonfamily households are 1-person households, comprising 16,328.
| Household Size | Family Households | Nonfamily Households |
| 1-Person Households | - | 16,328 (33.7%) |
| 2-Person Households | 11,626 (24.0%) | 4,702 (9.7%) |
| 3-Person Households | 6,472 (13.4%) | 803 (1.7%) |
| 4-Person Households | 5,154 (10.6%) | 227 (0.5%) |
| 5-Person Households | 1,820 (3.8%) | 0 (0.0%) |
| 6-Person Households | 944 (1.9%) | 0 (0.0%) |
| 7+ Person Households | 332 (0.7%) | 1 (0.0%) |
| Total | 26,348 (54.4%) | 22,061 (45.6%) |
Female Fertility in Manchester
Fertility by Age in Manchester
Average fertility rate in Manchester is 47.0 births per 1,000 women. Women in the age bracket of 20 to 34 years have the highest fertility rate with 68.0 births per 1,000 women. Women in the age bracket of 20 to 34 years acount for 72.4% of all women with births.
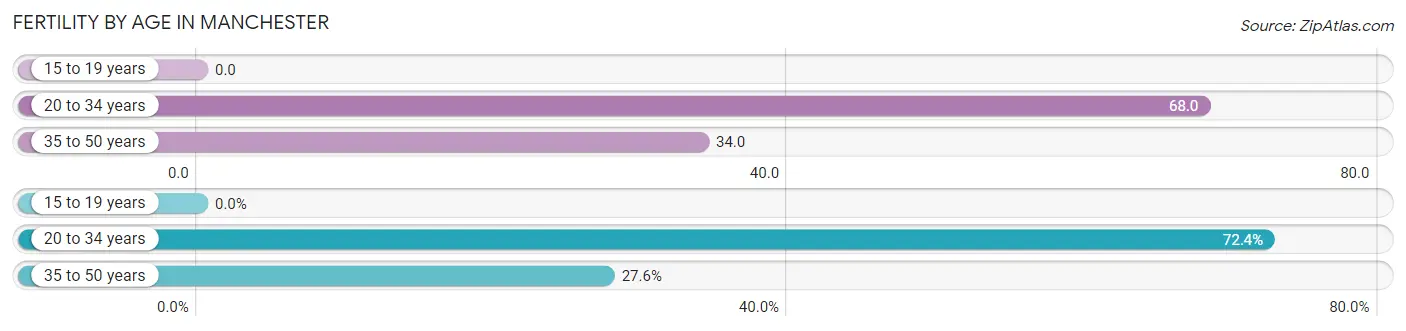
| Age Bracket | Women with Births | Births / 1,000 Women |
| 15 to 19 years | 0 (0.0%) | 0.0 |
| 20 to 34 years | 1,010 (72.4%) | 68.0 |
| 35 to 50 years | 385 (27.6%) | 34.0 |
| Total | 1,395 (100.0%) | 47.0 |
Fertility by Age by Marriage Status in Manchester
69.1% of women with births (1,395) in Manchester are married. The highest percentage of unmarried women with births falls into 20 to 34 years age bracket with 35.2% of them unmarried at the time of birth, while the lowest percentage of unmarried women with births belong to 35 to 50 years age bracket with 19.5% of them unmarried.
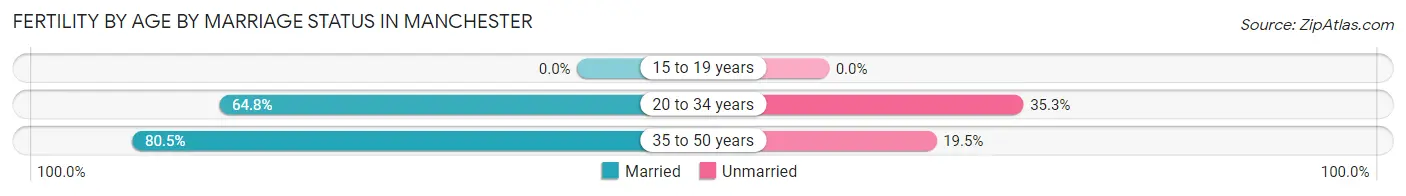
| Age Bracket | Married | Unmarried |
| 15 to 19 years | 0 (0.0%) | 0 (0.0%) |
| 20 to 34 years | 654 (64.7%) | 356 (35.2%) |
| 35 to 50 years | 310 (80.5%) | 75 (19.5%) |
| Total | 964 (69.1%) | 431 (30.9%) |
Fertility by Education in Manchester
Average fertility rate in Manchester is 47.0 births per 1,000 women. Women with the education attainment of graduate degree have the highest fertility rate of 66.0 births per 1,000 women, while women with the education attainment of high school diploma have the lowest fertility at 39.0 births per 1,000 women. Women with the education attainment of bachelor's degree represent 24.9% of all women with births.
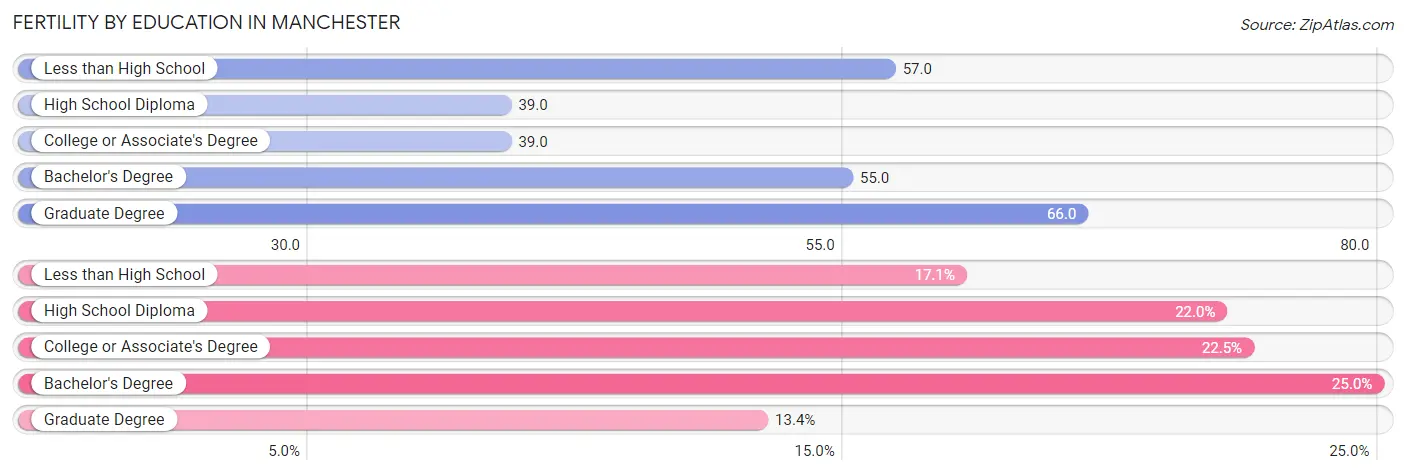
| Educational Attainment | Women with Births | Births / 1,000 Women |
| Less than High School | 239 (17.1%) | 57.0 |
| High School Diploma | 307 (22.0%) | 39.0 |
| College or Associate's Degree | 314 (22.5%) | 39.0 |
| Bachelor's Degree | 348 (24.9%) | 55.0 |
| Graduate Degree | 187 (13.4%) | 66.0 |
| Total | 1,395 (100.0%) | 47.0 |
Fertility by Education by Marriage Status in Manchester
30.9% of women with births in Manchester are unmarried. Women with the educational attainment of graduate degree are most likely to be married with 100.0% of them married at childbirth, while women with the educational attainment of high school diploma are least likely to be married with 55.7% of them unmarried at childbirth.
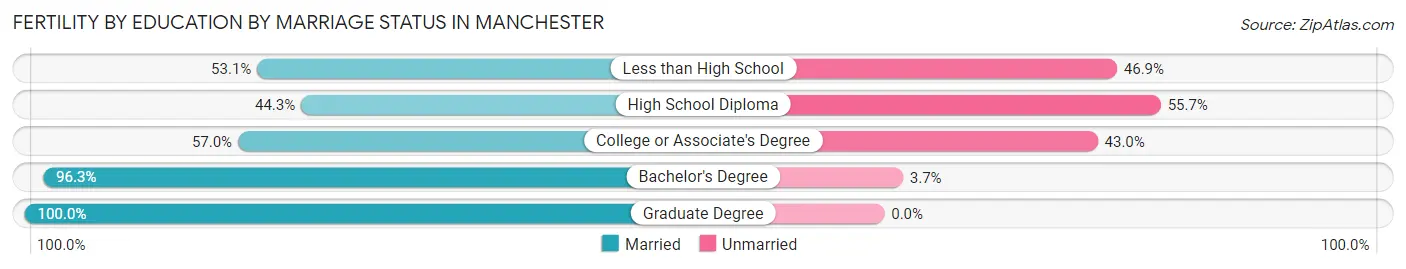
| Educational Attainment | Married | Unmarried |
| Less than High School | 127 (53.1%) | 112 (46.9%) |
| High School Diploma | 136 (44.3%) | 171 (55.7%) |
| College or Associate's Degree | 179 (57.0%) | 135 (43.0%) |
| Bachelor's Degree | 335 (96.3%) | 13 (3.7%) |
| Graduate Degree | 187 (100.0%) | 0 (0.0%) |
| Total | 964 (69.1%) | 431 (30.9%) |
Employment Characteristics in Manchester
Employment by Class of Employer in Manchester
Among the 64,569 employed individuals in Manchester, private company employees (46,481 | 72.0%), not-for-profit organizations (8,132 | 12.6%), and local government employees (3,354 | 5.2%) make up the most common classes of employment.
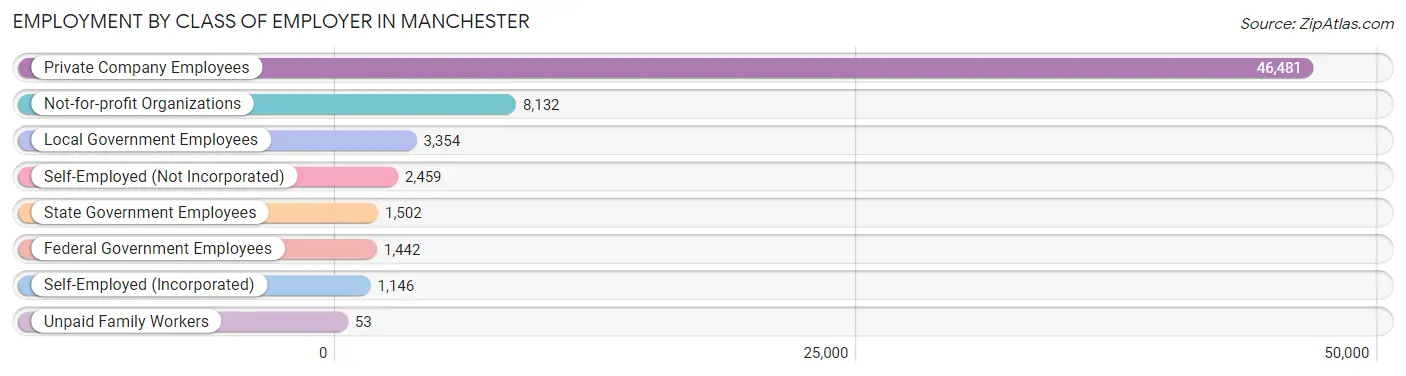
| Employer Class | # Employees | % Employees |
| Private Company Employees | 46,481 | 72.0% |
| Self-Employed (Incorporated) | 1,146 | 1.8% |
| Self-Employed (Not Incorporated) | 2,459 | 3.8% |
| Not-for-profit Organizations | 8,132 | 12.6% |
| Local Government Employees | 3,354 | 5.2% |
| State Government Employees | 1,502 | 2.3% |
| Federal Government Employees | 1,442 | 2.2% |
| Unpaid Family Workers | 53 | 0.1% |
| Total | 64,569 | 100.0% |
Employment Status by Age in Manchester
According to the labor force statistics for Manchester, out of the total population over 16 years of age (96,387), 71.4% or 68,820 individuals are in the labor force, with 4.2% or 2,890 of them unemployed. The age group with the highest labor force participation rate is 25 to 29 years, with 89.8% or 10,160 individuals in the labor force. Within the labor force, the 16 to 19 years age range has the highest percentage of unemployed individuals, with 20.5% or 510 of them being unemployed.
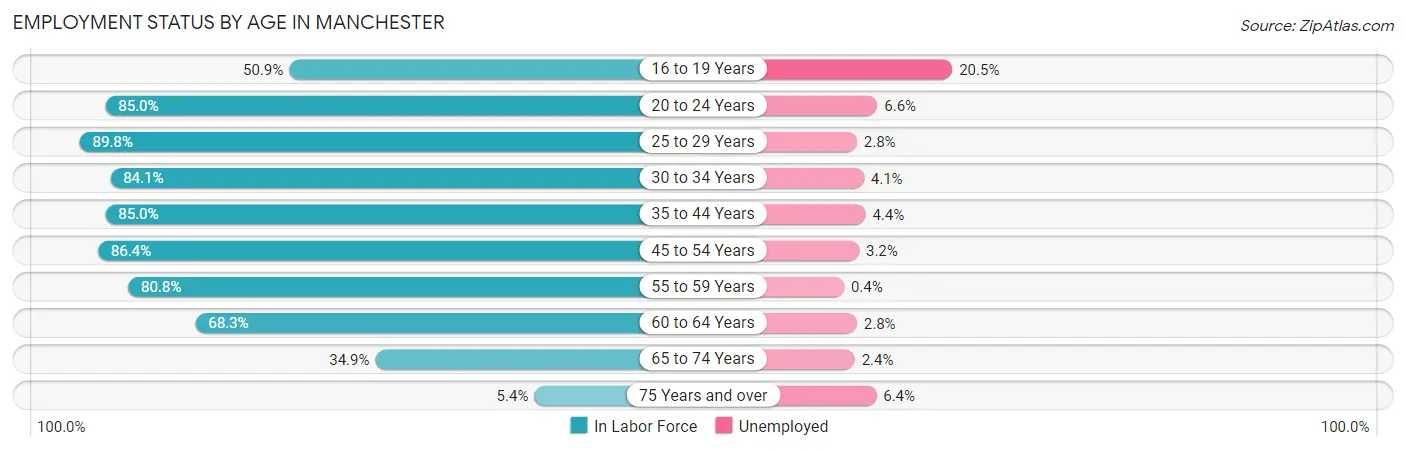
| Age Bracket | In Labor Force | Unemployed |
| 16 to 19 Years | 2,489 (50.9%) | 510 (20.5%) |
| 20 to 24 Years | 7,823 (85.0%) | 516 (6.6%) |
| 25 to 29 Years | 10,160 (89.8%) | 284 (2.8%) |
| 30 to 34 Years | 8,342 (84.1%) | 342 (4.1%) |
| 35 to 44 Years | 13,176 (85.0%) | 580 (4.4%) |
| 45 to 54 Years | 11,566 (86.4%) | 370 (3.2%) |
| 55 to 59 Years | 6,473 (80.8%) | 26 (0.4%) |
| 60 to 64 Years | 5,187 (68.3%) | 145 (2.8%) |
| 65 to 74 Years | 3,166 (34.9%) | 76 (2.4%) |
| 75 Years and over | 405 (5.4%) | 26 (6.4%) |
| Total | 68,820 (71.4%) | 2,890 (4.2%) |
Employment Status by Educational Attainment in Manchester
According to labor force statistics for Manchester, 83.5% of individuals (54,881) out of the total population between 25 and 64 years of age (65,726) are in the labor force, with 3.2% or 1,756 of them being unemployed. The group with the highest labor force participation rate are those with the educational attainment of bachelor's degree or higher, with 92.0% or 20,150 individuals in the labor force. Within the labor force, individuals with less than high school education have the highest percentage of unemployment, with 7.1% or 331 of them being unemployed.
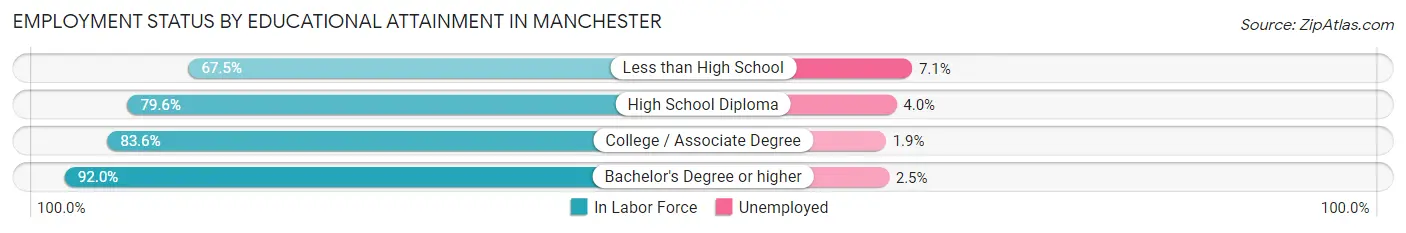
| Educational Attainment | In Labor Force | Unemployed |
| Less than High School | 4,662 (67.5%) | 490 (7.1%) |
| High School Diploma | 14,939 (79.6%) | 751 (4.0%) |
| College / Associate Degree | 15,173 (83.6%) | 345 (1.9%) |
| Bachelor's Degree or higher | 20,150 (92.0%) | 548 (2.5%) |
| Total | 54,881 (83.5%) | 2,103 (3.2%) |
Employment Occupations by Sex in Manchester
Management, Business, Science and Arts Occupations
The most common Management, Business, Science and Arts occupations in Manchester are Community & Social Service (6,839 | 10.4%), Management (5,516 | 8.4%), Computers, Engineering & Science (4,726 | 7.2%), Business & Financial (3,608 | 5.5%), and Health Diagnosing & Treating (3,140 | 4.8%).
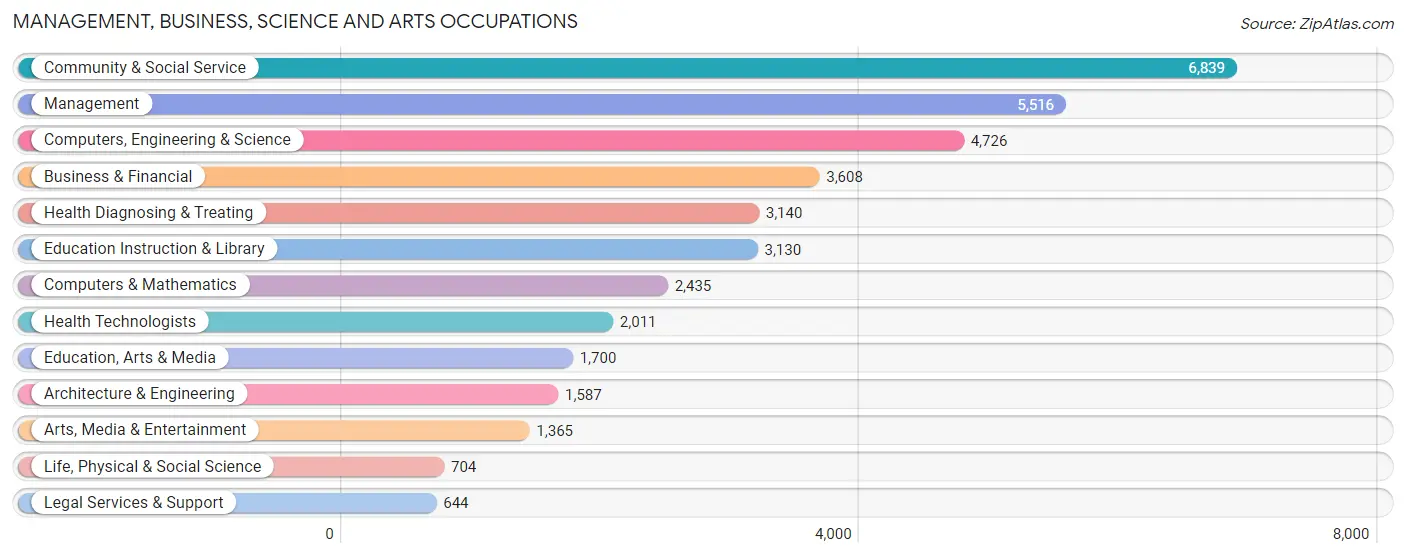
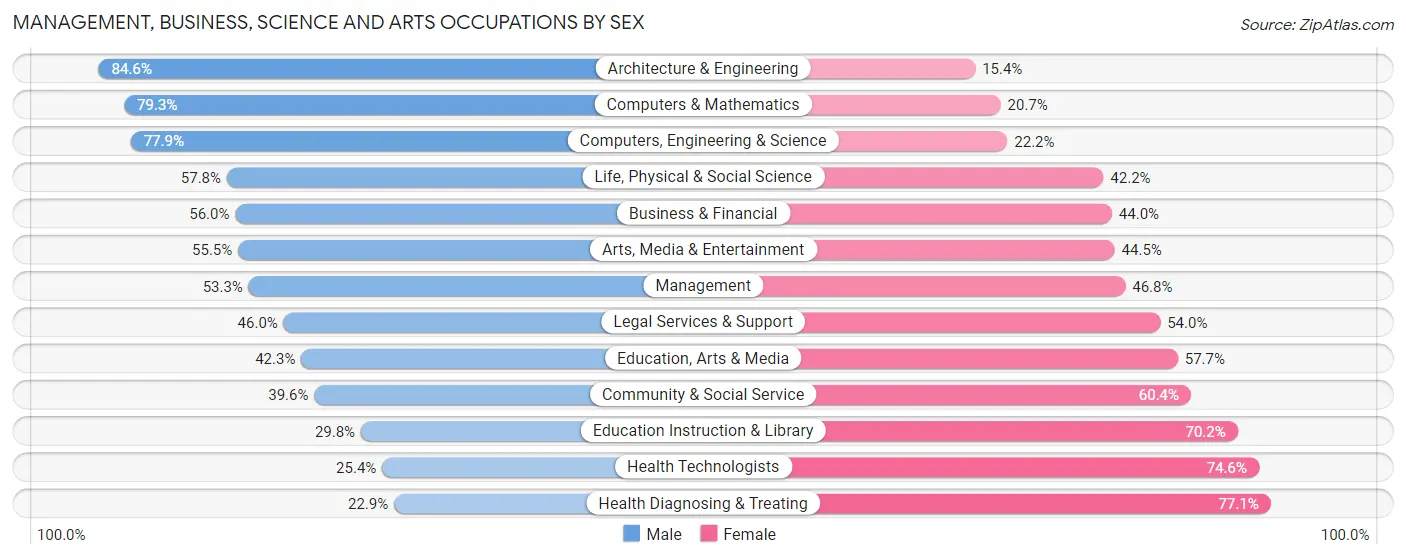
Management, Business, Science and Arts Occupations by Sex
Within the Management, Business, Science and Arts occupations in Manchester, the most male-oriented occupations are Architecture & Engineering (84.6%), Computers & Mathematics (79.3%), and Computers, Engineering & Science (77.8%), while the most female-oriented occupations are Health Diagnosing & Treating (77.1%), Health Technologists (74.6%), and Education Instruction & Library (70.2%).
| Occupation | Male | Female |
| Management | 2,937 (53.2%) | 2,579 (46.8%) |
| Business & Financial | 2,022 (56.0%) | 1,586 (44.0%) |
| Computers, Engineering & Science | 3,679 (77.8%) | 1,047 (22.2%) |
| Computers & Mathematics | 1,930 (79.3%) | 505 (20.7%) |
| Architecture & Engineering | 1,342 (84.6%) | 245 (15.4%) |
| Life, Physical & Social Science | 407 (57.8%) | 297 (42.2%) |
| Community & Social Service | 2,706 (39.6%) | 4,133 (60.4%) |
| Education, Arts & Media | 719 (42.3%) | 981 (57.7%) |
| Legal Services & Support | 296 (46.0%) | 348 (54.0%) |
| Education Instruction & Library | 934 (29.8%) | 2,196 (70.2%) |
| Arts, Media & Entertainment | 757 (55.5%) | 608 (44.5%) |
| Health Diagnosing & Treating | 720 (22.9%) | 2,420 (77.1%) |
| Health Technologists | 511 (25.4%) | 1,500 (74.6%) |
| Total (Category) | 12,064 (50.6%) | 11,765 (49.4%) |
| Total (Overall) | 34,534 (52.5%) | 31,270 (47.5%) |
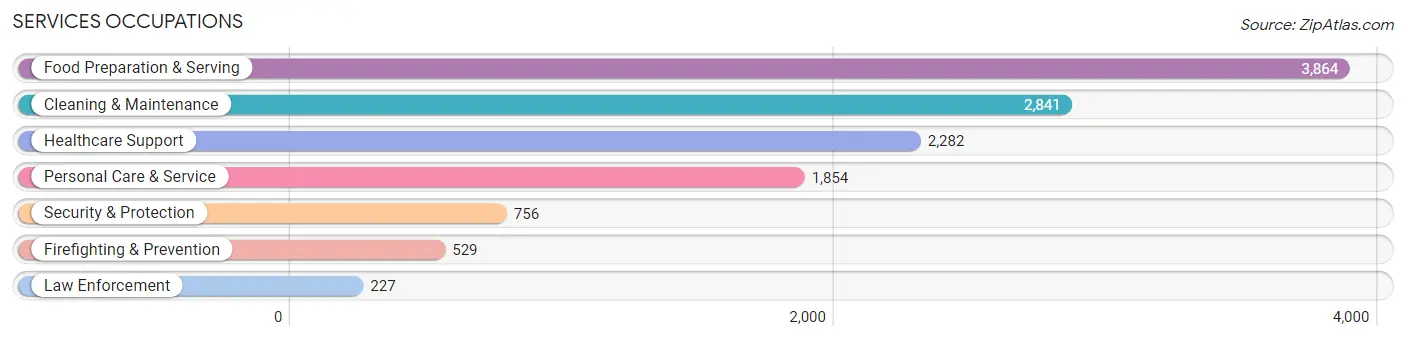
Services Occupations
The most common Services occupations in Manchester are Food Preparation & Serving (3,864 | 5.9%), Cleaning & Maintenance (2,841 | 4.3%), Healthcare Support (2,282 | 3.5%), Personal Care & Service (1,854 | 2.8%), and Security & Protection (756 | 1.1%).
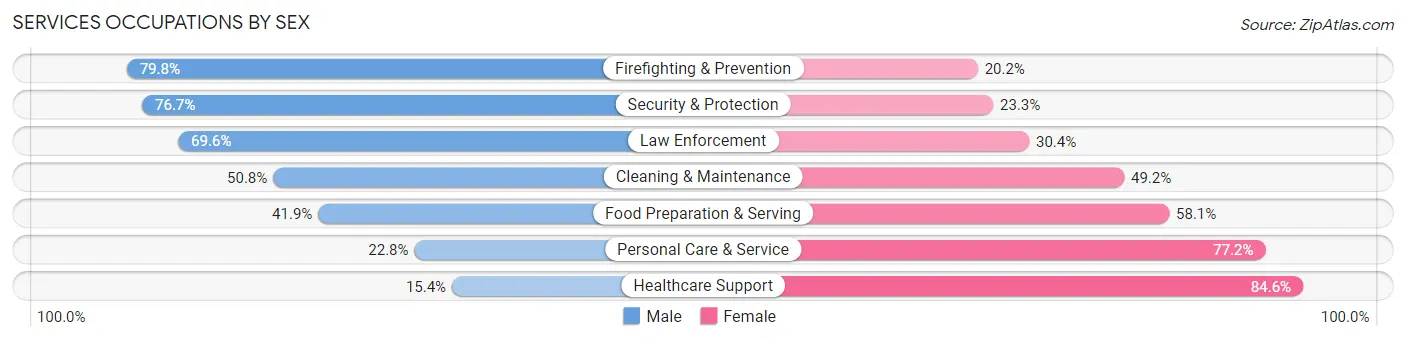
Services Occupations by Sex
Within the Services occupations in Manchester, the most male-oriented occupations are Firefighting & Prevention (79.8%), Security & Protection (76.7%), and Law Enforcement (69.6%), while the most female-oriented occupations are Healthcare Support (84.6%), Personal Care & Service (77.2%), and Food Preparation & Serving (58.1%).
| Occupation | Male | Female |
| Healthcare Support | 351 (15.4%) | 1,931 (84.6%) |
| Security & Protection | 580 (76.7%) | 176 (23.3%) |
| Firefighting & Prevention | 422 (79.8%) | 107 (20.2%) |
| Law Enforcement | 158 (69.6%) | 69 (30.4%) |
| Food Preparation & Serving | 1,618 (41.9%) | 2,246 (58.1%) |
| Cleaning & Maintenance | 1,443 (50.8%) | 1,398 (49.2%) |
| Personal Care & Service | 423 (22.8%) | 1,431 (77.2%) |
| Total (Category) | 4,415 (38.1%) | 7,182 (61.9%) |
| Total (Overall) | 34,534 (52.5%) | 31,270 (47.5%) |
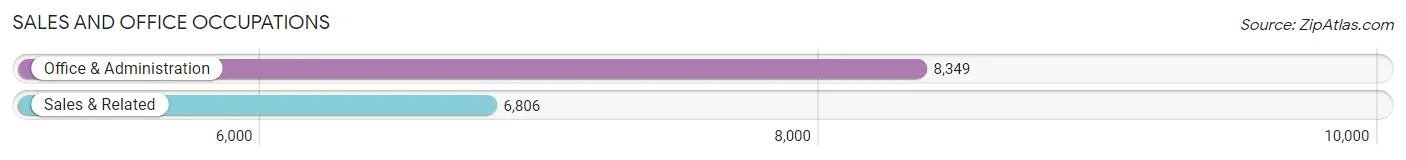
Sales and Office Occupations
The most common Sales and Office occupations in Manchester are Office & Administration (8,349 | 12.7%), and Sales & Related (6,806 | 10.3%).
Sales and Office Occupations by Sex
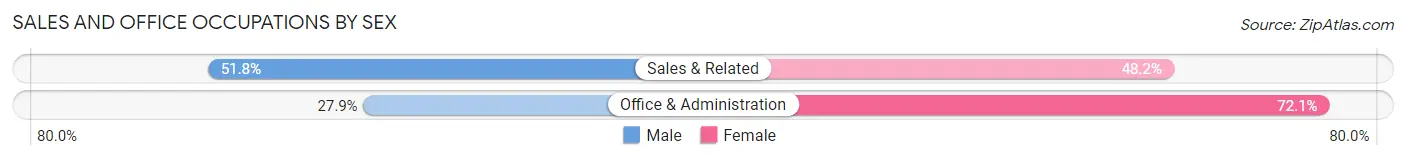
| Occupation | Male | Female |
| Sales & Related | 3,527 (51.8%) | 3,279 (48.2%) |
| Office & Administration | 2,327 (27.9%) | 6,022 (72.1%) |
| Total (Category) | 5,854 (38.6%) | 9,301 (61.4%) |
| Total (Overall) | 34,534 (52.5%) | 31,270 (47.5%) |
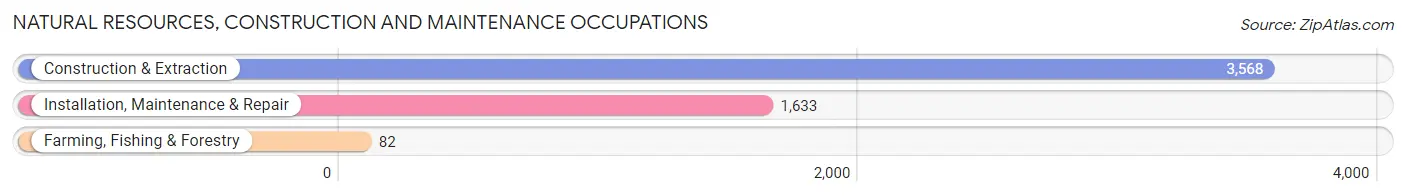
Natural Resources, Construction and Maintenance Occupations
The most common Natural Resources, Construction and Maintenance occupations in Manchester are Construction & Extraction (3,568 | 5.4%), Installation, Maintenance & Repair (1,633 | 2.5%), and Farming, Fishing & Forestry (82 | 0.1%).
Natural Resources, Construction and Maintenance Occupations by Sex
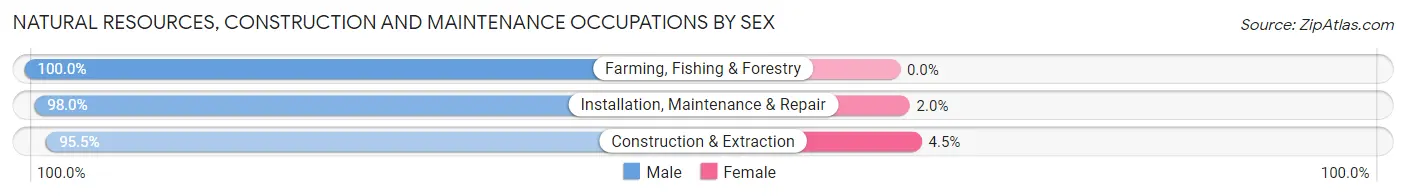
| Occupation | Male | Female |
| Farming, Fishing & Forestry | 82 (100.0%) | 0 (0.0%) |
| Construction & Extraction | 3,407 (95.5%) | 161 (4.5%) |
| Installation, Maintenance & Repair | 1,600 (98.0%) | 33 (2.0%) |
| Total (Category) | 5,089 (96.3%) | 194 (3.7%) |
| Total (Overall) | 34,534 (52.5%) | 31,270 (47.5%) |
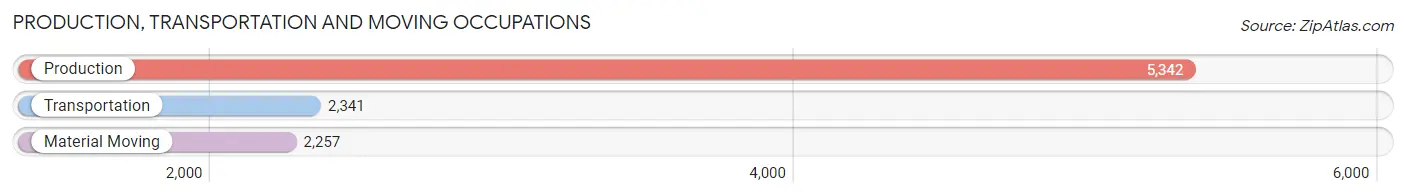
Production, Transportation and Moving Occupations
The most common Production, Transportation and Moving occupations in Manchester are Production (5,342 | 8.1%), Transportation (2,341 | 3.6%), and Material Moving (2,257 | 3.4%).
Production, Transportation and Moving Occupations by Sex
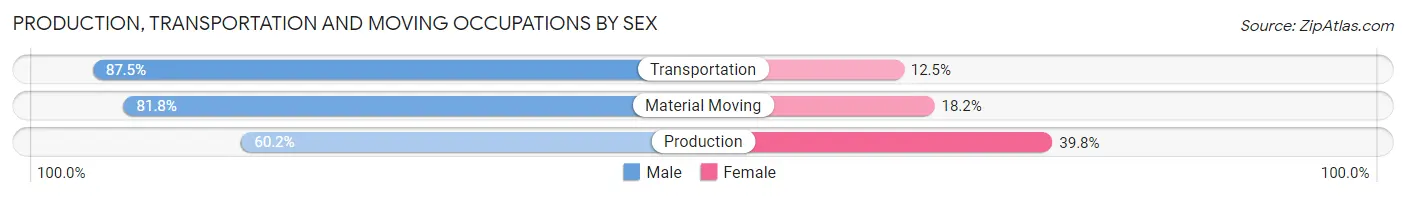
| Occupation | Male | Female |
| Production | 3,217 (60.2%) | 2,125 (39.8%) |
| Transportation | 2,048 (87.5%) | 293 (12.5%) |
| Material Moving | 1,847 (81.8%) | 410 (18.2%) |
| Total (Category) | 7,112 (71.6%) | 2,828 (28.4%) |
| Total (Overall) | 34,534 (52.5%) | 31,270 (47.5%) |
Employment Industries by Sex in Manchester
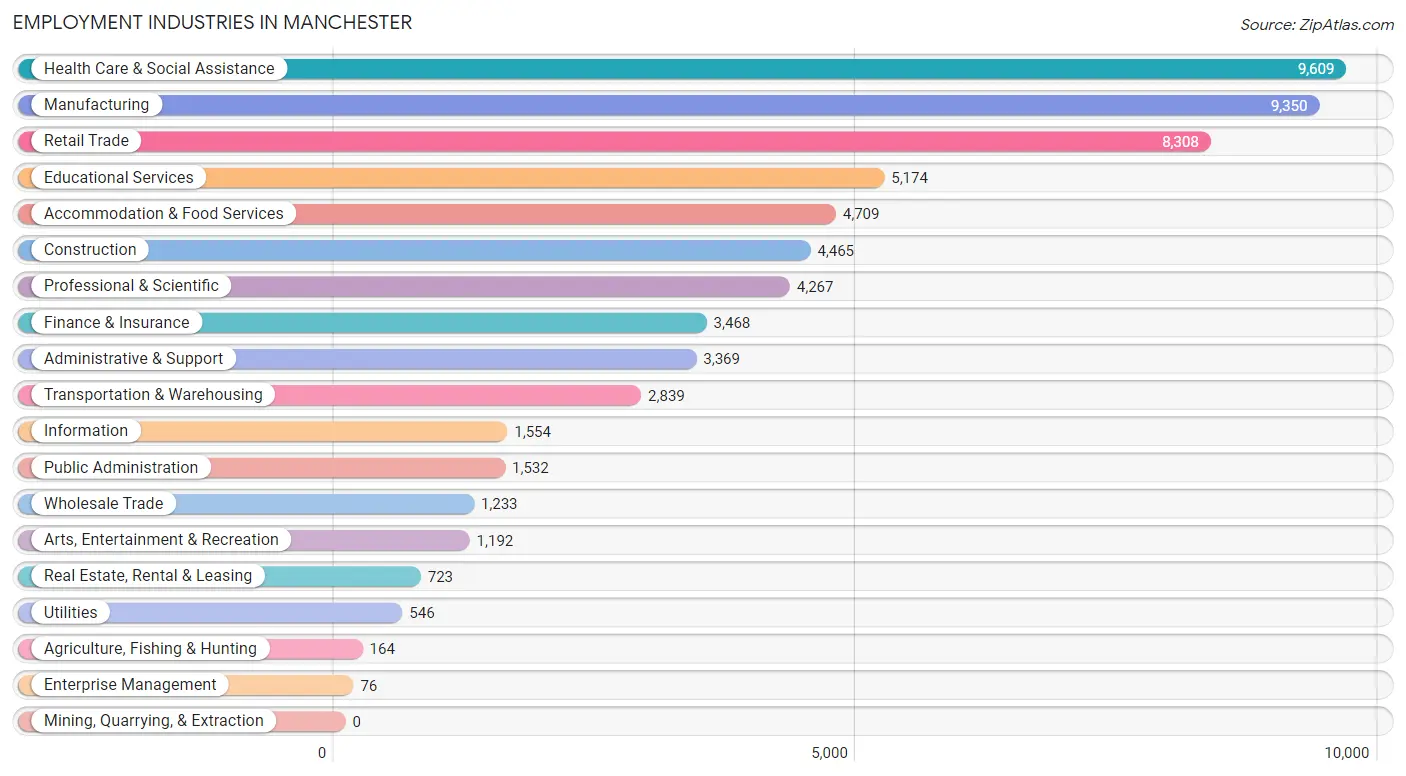
Employment Industries in Manchester
The major employment industries in Manchester include Health Care & Social Assistance (9,609 | 14.6%), Manufacturing (9,350 | 14.2%), Retail Trade (8,308 | 12.6%), Educational Services (5,174 | 7.9%), and Accommodation & Food Services (4,709 | 7.2%).
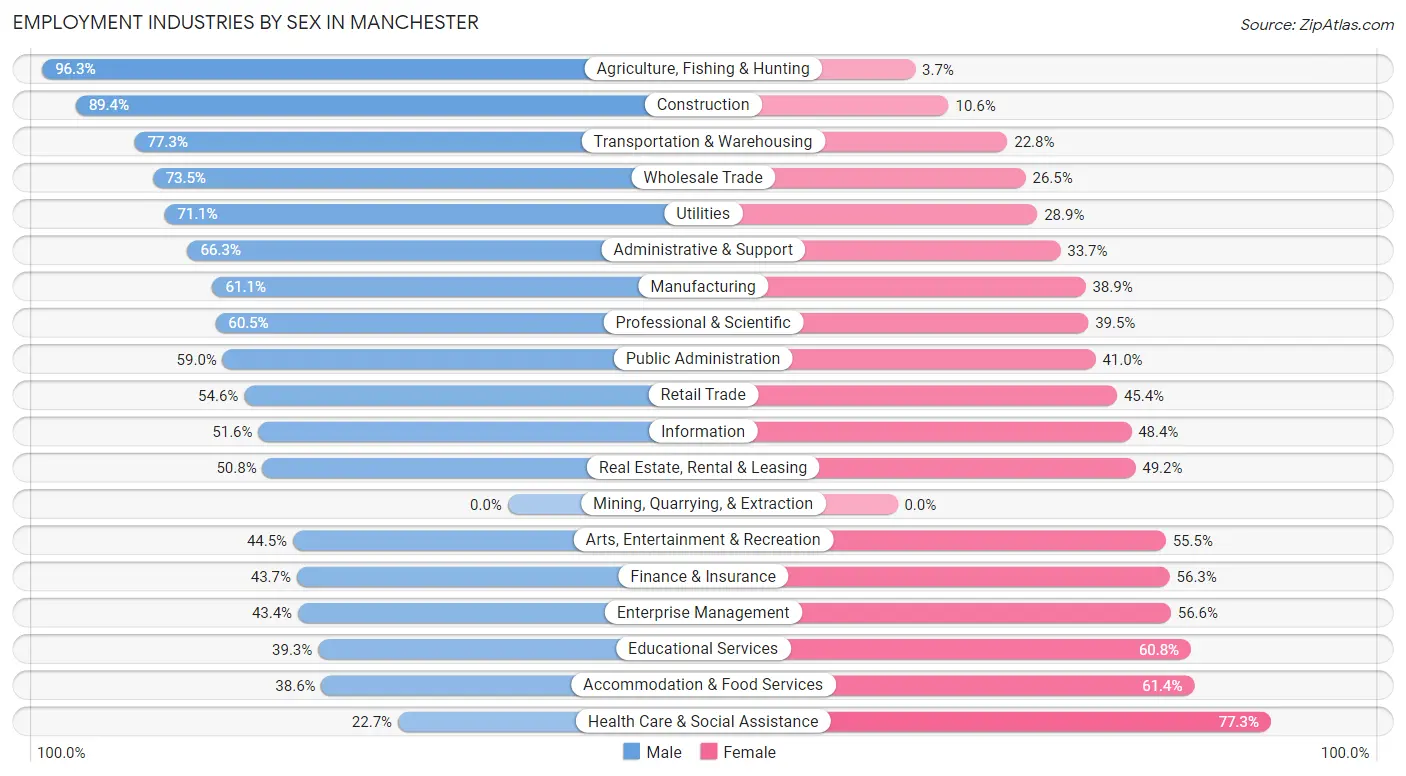
Employment Industries by Sex in Manchester
The Manchester industries that see more men than women are Agriculture, Fishing & Hunting (96.3%), Construction (89.4%), and Transportation & Warehousing (77.2%), whereas the industries that tend to have a higher number of women are Health Care & Social Assistance (77.3%), Accommodation & Food Services (61.4%), and Educational Services (60.8%).
| Industry | Male | Female |
| Agriculture, Fishing & Hunting | 158 (96.3%) | 6 (3.7%) |
| Mining, Quarrying, & Extraction | 0 (0.0%) | 0 (0.0%) |
| Construction | 3,992 (89.4%) | 473 (10.6%) |
| Manufacturing | 5,710 (61.1%) | 3,640 (38.9%) |
| Wholesale Trade | 906 (73.5%) | 327 (26.5%) |
| Retail Trade | 4,533 (54.6%) | 3,775 (45.4%) |
| Transportation & Warehousing | 2,193 (77.2%) | 646 (22.8%) |
| Utilities | 388 (71.1%) | 158 (28.9%) |
| Information | 802 (51.6%) | 752 (48.4%) |
| Finance & Insurance | 1,514 (43.7%) | 1,954 (56.3%) |
| Real Estate, Rental & Leasing | 367 (50.8%) | 356 (49.2%) |
| Professional & Scientific | 2,582 (60.5%) | 1,685 (39.5%) |
| Enterprise Management | 33 (43.4%) | 43 (56.6%) |
| Administrative & Support | 2,233 (66.3%) | 1,136 (33.7%) |
| Educational Services | 2,031 (39.3%) | 3,143 (60.8%) |
| Health Care & Social Assistance | 2,184 (22.7%) | 7,425 (77.3%) |
| Arts, Entertainment & Recreation | 530 (44.5%) | 662 (55.5%) |
| Accommodation & Food Services | 1,816 (38.6%) | 2,893 (61.4%) |
| Public Administration | 904 (59.0%) | 628 (41.0%) |
| Total | 34,534 (52.5%) | 31,270 (47.5%) |
Education in Manchester
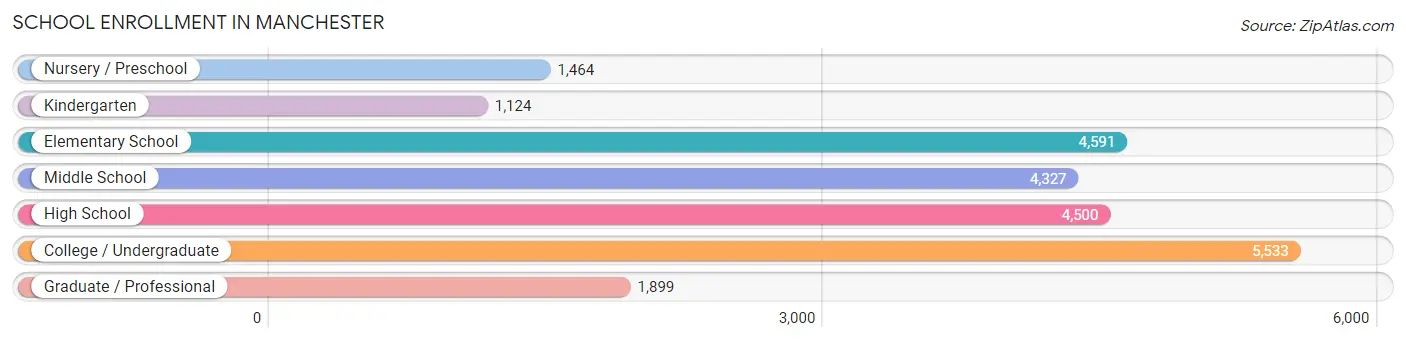
School Enrollment in Manchester
The most common levels of schooling among the 23,438 students in Manchester are college / undergraduate (5,533 | 23.6%), elementary school (4,591 | 19.6%), and high school (4,500 | 19.2%).
| School Level | # Students | % Students |
| Nursery / Preschool | 1,464 | 6.2% |
| Kindergarten | 1,124 | 4.8% |
| Elementary School | 4,591 | 19.6% |
| Middle School | 4,327 | 18.5% |
| High School | 4,500 | 19.2% |
| College / Undergraduate | 5,533 | 23.6% |
| Graduate / Professional | 1,899 | 8.1% |
| Total | 23,438 | 100.0% |
School Enrollment by Age by Funding Source in Manchester
Out of a total of 23,438 students who are enrolled in schools in Manchester, 5,484 (23.4%) attend a private institution, while the remaining 17,954 (76.6%) are enrolled in public schools. The age group of 20 to 24 year olds has the highest likelihood of being enrolled in private schools, with 1,346 (49.8% in the age bracket) enrolled. Conversely, the age group of 10 to 14 year olds has the lowest likelihood of being enrolled in a private school, with 4,873 (93.3% in the age bracket) attending a public institution.
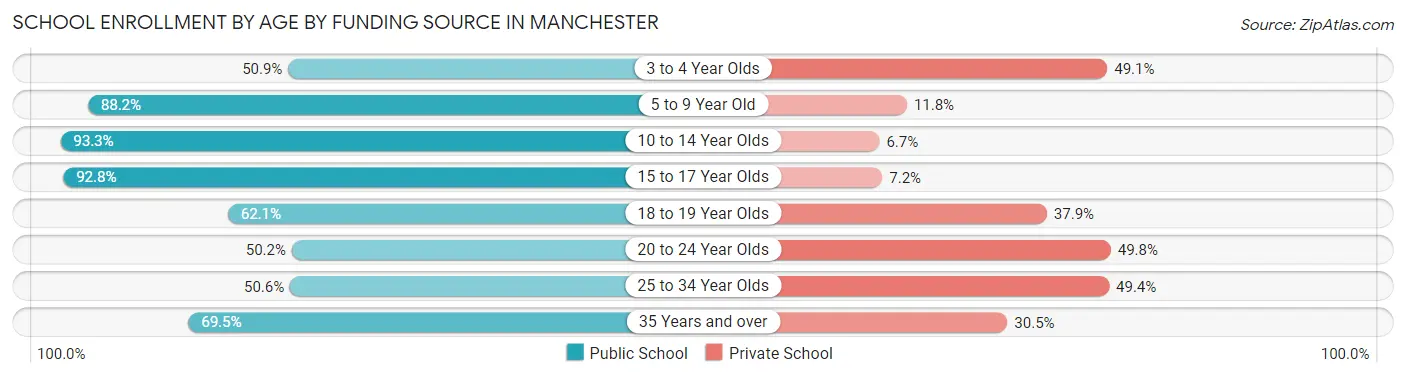
| Age Bracket | Public School | Private School |
| 3 to 4 Year Olds | 596 (50.9%) | 575 (49.1%) |
| 5 to 9 Year Old | 4,812 (88.2%) | 643 (11.8%) |
| 10 to 14 Year Olds | 4,873 (93.3%) | 348 (6.7%) |
| 15 to 17 Year Olds | 2,989 (92.8%) | 232 (7.2%) |
| 18 to 19 Year Olds | 1,126 (62.1%) | 686 (37.9%) |
| 20 to 24 Year Olds | 1,359 (50.2%) | 1,346 (49.8%) |
| 25 to 34 Year Olds | 1,265 (50.6%) | 1,237 (49.4%) |
| 35 Years and over | 939 (69.5%) | 412 (30.5%) |
| Total | 17,954 (76.6%) | 5,484 (23.4%) |
Educational Attainment by Field of Study in Manchester
Business (6,251 | 21.4%), education (2,857 | 9.8%), science & technology (2,283 | 7.8%), social sciences (2,134 | 7.3%), and arts & humanities (2,054 | 7.0%) are the most common fields of study among 29,230 individuals in Manchester who have obtained a bachelor's degree or higher.
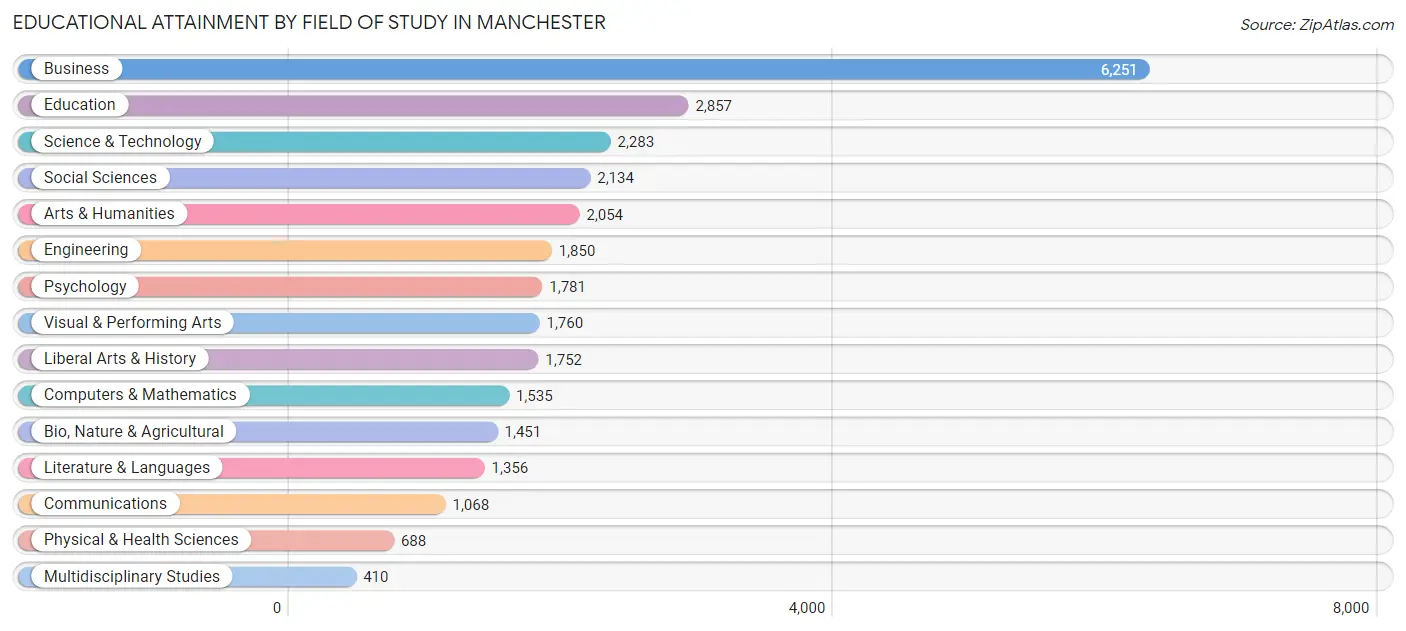
| Field of Study | # Graduates | % Graduates |
| Computers & Mathematics | 1,535 | 5.2% |
| Bio, Nature & Agricultural | 1,451 | 5.0% |
| Physical & Health Sciences | 688 | 2.4% |
| Psychology | 1,781 | 6.1% |
| Social Sciences | 2,134 | 7.3% |
| Engineering | 1,850 | 6.3% |
| Multidisciplinary Studies | 410 | 1.4% |
| Science & Technology | 2,283 | 7.8% |
| Business | 6,251 | 21.4% |
| Education | 2,857 | 9.8% |
| Literature & Languages | 1,356 | 4.6% |
| Liberal Arts & History | 1,752 | 6.0% |
| Visual & Performing Arts | 1,760 | 6.0% |
| Communications | 1,068 | 3.6% |
| Arts & Humanities | 2,054 | 7.0% |
| Total | 29,230 | 100.0% |
Transportation & Commute in Manchester
Vehicle Availability by Sex in Manchester
The most prevalent vehicle ownership categories in Manchester are males with 2 vehicles (16,590, accounting for 49.1%) and females with 2 vehicles (13,596, making up 54.5%).
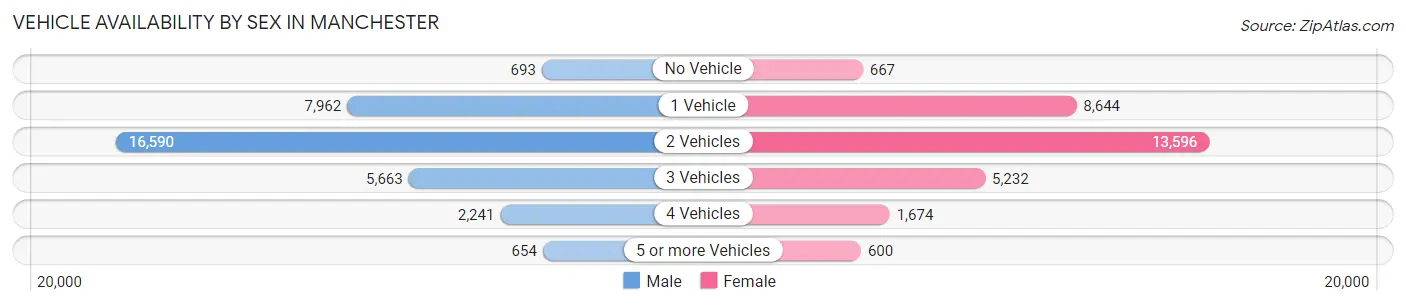
| Vehicles Available | Male | Female |
| No Vehicle | 693 (2.1%) | 667 (2.2%) |
| 1 Vehicle | 7,962 (23.5%) | 8,644 (28.4%) |
| 2 Vehicles | 16,590 (49.1%) | 13,596 (44.7%) |
| 3 Vehicles | 5,663 (16.8%) | 5,232 (17.2%) |
| 4 Vehicles | 2,241 (6.6%) | 1,674 (5.5%) |
| 5 or more Vehicles | 654 (1.9%) | 600 (2.0%) |
| Total | 33,803 (100.0%) | 30,413 (100.0%) |
Commute Time in Manchester
The most frequently occuring commute durations in Manchester are 10 to 14 minutes (10,666 commuters, 18.4%), 15 to 19 minutes (9,693 commuters, 16.8%), and 20 to 24 minutes (7,944 commuters, 13.7%).
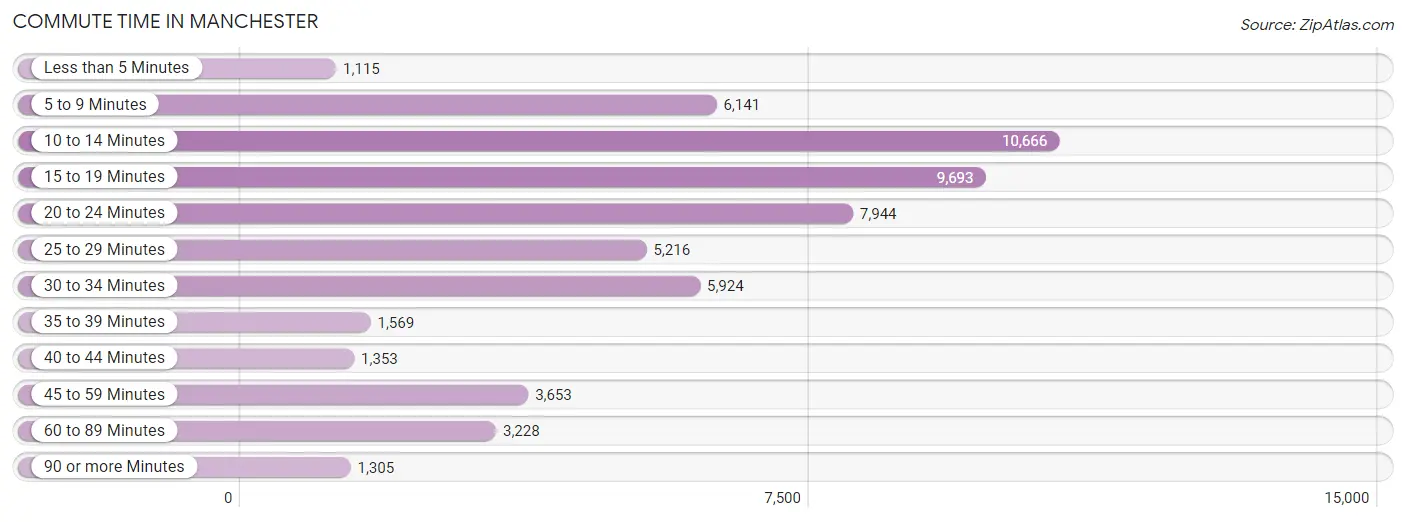
| Commute Time | # Commuters | % Commuters |
| Less than 5 Minutes | 1,115 | 1.9% |
| 5 to 9 Minutes | 6,141 | 10.6% |
| 10 to 14 Minutes | 10,666 | 18.4% |
| 15 to 19 Minutes | 9,693 | 16.8% |
| 20 to 24 Minutes | 7,944 | 13.7% |
| 25 to 29 Minutes | 5,216 | 9.0% |
| 30 to 34 Minutes | 5,924 | 10.2% |
| 35 to 39 Minutes | 1,569 | 2.7% |
| 40 to 44 Minutes | 1,353 | 2.3% |
| 45 to 59 Minutes | 3,653 | 6.3% |
| 60 to 89 Minutes | 3,228 | 5.6% |
| 90 or more Minutes | 1,305 | 2.3% |
Commute Time by Sex in Manchester
The most common commute times in Manchester are 10 to 14 minutes (5,361 commuters, 17.7%) for males and 10 to 14 minutes (5,305 commuters, 19.3%) for females.
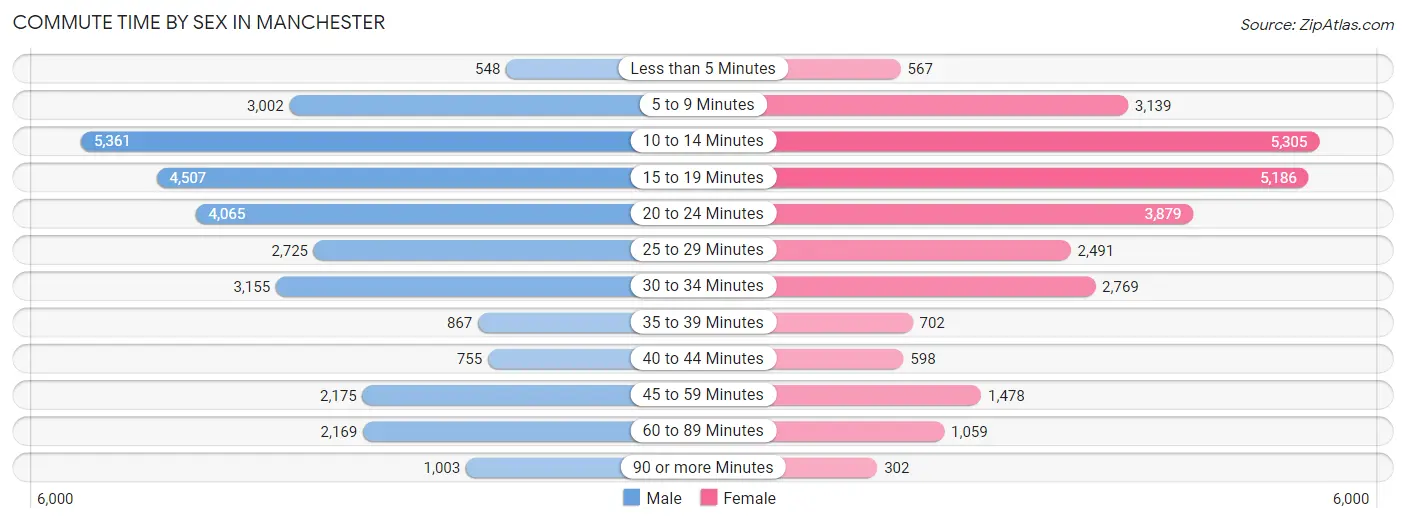
| Commute Time | Male | Female |
| Less than 5 Minutes | 548 (1.8%) | 567 (2.1%) |
| 5 to 9 Minutes | 3,002 (9.9%) | 3,139 (11.4%) |
| 10 to 14 Minutes | 5,361 (17.7%) | 5,305 (19.3%) |
| 15 to 19 Minutes | 4,507 (14.9%) | 5,186 (18.9%) |
| 20 to 24 Minutes | 4,065 (13.4%) | 3,879 (14.1%) |
| 25 to 29 Minutes | 2,725 (9.0%) | 2,491 (9.1%) |
| 30 to 34 Minutes | 3,155 (10.4%) | 2,769 (10.1%) |
| 35 to 39 Minutes | 867 (2.9%) | 702 (2.6%) |
| 40 to 44 Minutes | 755 (2.5%) | 598 (2.2%) |
| 45 to 59 Minutes | 2,175 (7.2%) | 1,478 (5.4%) |
| 60 to 89 Minutes | 2,169 (7.1%) | 1,059 (3.8%) |
| 90 or more Minutes | 1,003 (3.3%) | 302 (1.1%) |
Time of Departure to Work by Sex in Manchester
The most frequent times of departure to work in Manchester are 7:00 AM to 7:29 AM (4,251, 14.0%) for males and 7:30 AM to 7:59 AM (3,761, 13.7%) for females.
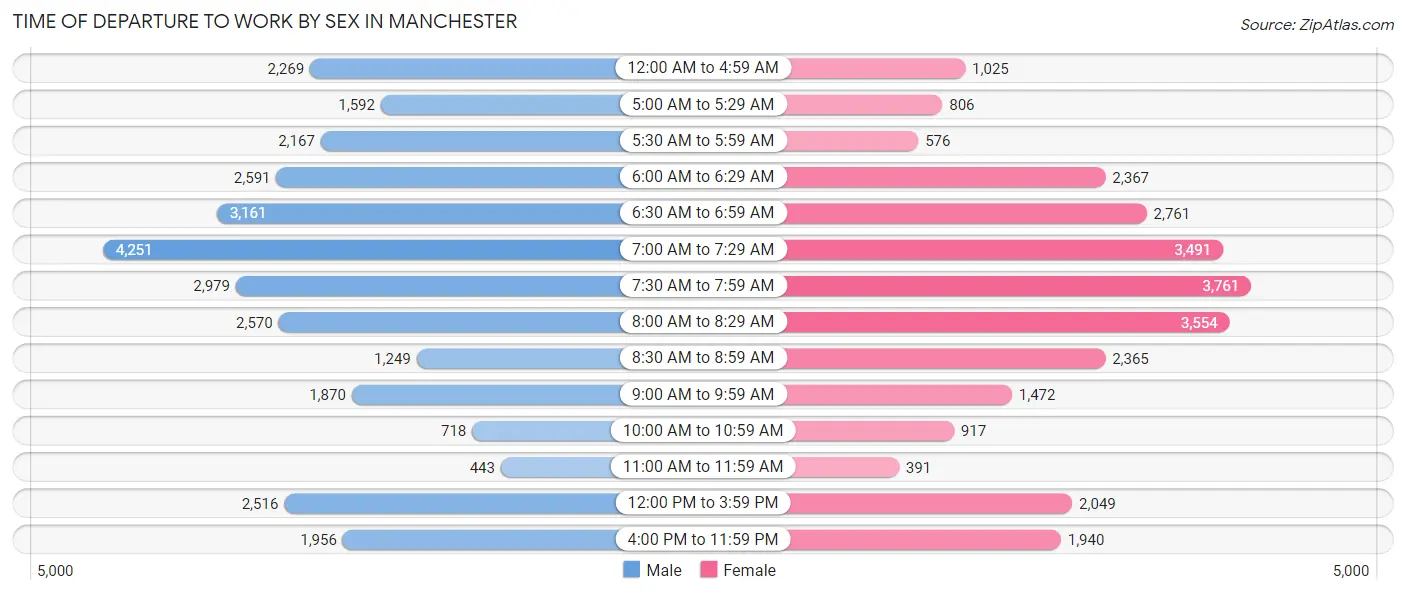
| Time of Departure | Male | Female |
| 12:00 AM to 4:59 AM | 2,269 (7.5%) | 1,025 (3.7%) |
| 5:00 AM to 5:29 AM | 1,592 (5.2%) | 806 (2.9%) |
| 5:30 AM to 5:59 AM | 2,167 (7.1%) | 576 (2.1%) |
| 6:00 AM to 6:29 AM | 2,591 (8.5%) | 2,367 (8.6%) |
| 6:30 AM to 6:59 AM | 3,161 (10.4%) | 2,761 (10.1%) |
| 7:00 AM to 7:29 AM | 4,251 (14.0%) | 3,491 (12.7%) |
| 7:30 AM to 7:59 AM | 2,979 (9.8%) | 3,761 (13.7%) |
| 8:00 AM to 8:29 AM | 2,570 (8.5%) | 3,554 (12.9%) |
| 8:30 AM to 8:59 AM | 1,249 (4.1%) | 2,365 (8.6%) |
| 9:00 AM to 9:59 AM | 1,870 (6.2%) | 1,472 (5.4%) |
| 10:00 AM to 10:59 AM | 718 (2.4%) | 917 (3.3%) |
| 11:00 AM to 11:59 AM | 443 (1.5%) | 391 (1.4%) |
| 12:00 PM to 3:59 PM | 2,516 (8.3%) | 2,049 (7.5%) |
| 4:00 PM to 11:59 PM | 1,956 (6.5%) | 1,940 (7.1%) |
| Total | 30,332 (100.0%) | 27,475 (100.0%) |
Housing Occupancy in Manchester
Occupancy by Ownership in Manchester
Of the total 48,409 dwellings in Manchester, owner-occupied units account for 23,333 (48.2%), while renter-occupied units make up 25,076 (51.8%).
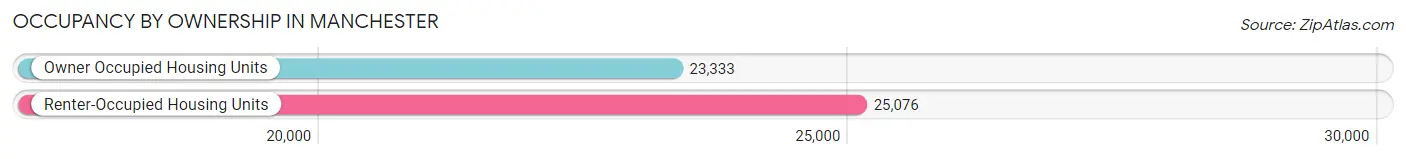
| Occupancy | # Housing Units | % Housing Units |
| Owner Occupied Housing Units | 23,333 | 48.2% |
| Renter-Occupied Housing Units | 25,076 | 51.8% |
| Total Occupied Housing Units | 48,409 | 100.0% |
Occupancy by Household Size in Manchester
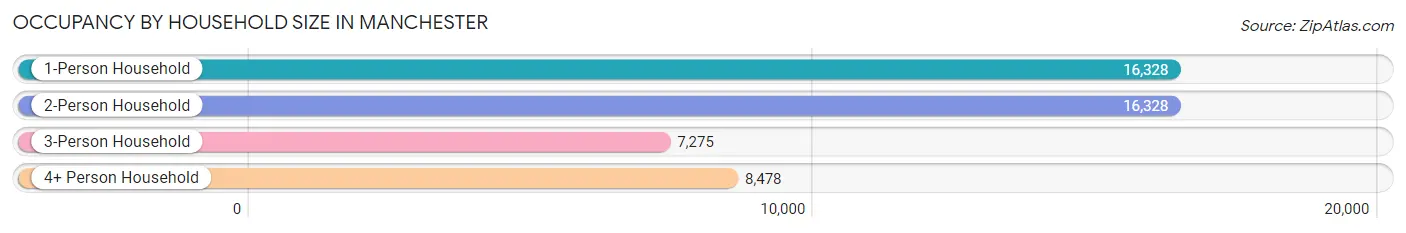
| Household Size | # Housing Units | % Housing Units |
| 1-Person Household | 16,328 | 33.7% |
| 2-Person Household | 16,328 | 33.7% |
| 3-Person Household | 7,275 | 15.0% |
| 4+ Person Household | 8,478 | 17.5% |
| Total Housing Units | 48,409 | 100.0% |
Occupancy by Ownership by Household Size in Manchester
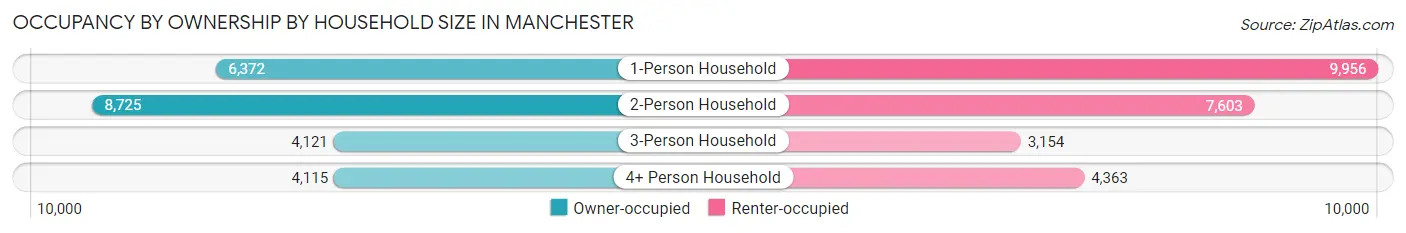
| Household Size | Owner-occupied | Renter-occupied |
| 1-Person Household | 6,372 (39.0%) | 9,956 (61.0%) |
| 2-Person Household | 8,725 (53.4%) | 7,603 (46.6%) |
| 3-Person Household | 4,121 (56.7%) | 3,154 (43.3%) |
| 4+ Person Household | 4,115 (48.5%) | 4,363 (51.5%) |
| Total Housing Units | 23,333 (48.2%) | 25,076 (51.8%) |
Occupancy by Educational Attainment in Manchester
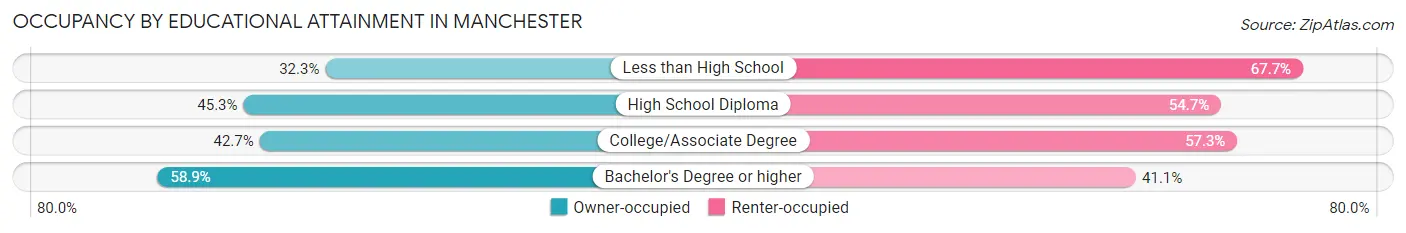
| Household Size | Owner-occupied | Renter-occupied |
| Less than High School | 1,417 (32.3%) | 2,967 (67.7%) |
| High School Diploma | 5,843 (45.3%) | 7,056 (54.7%) |
| College/Associate Degree | 5,993 (42.7%) | 8,029 (57.3%) |
| Bachelor's Degree or higher | 10,080 (58.9%) | 7,024 (41.1%) |
Occupancy by Age of Householder in Manchester
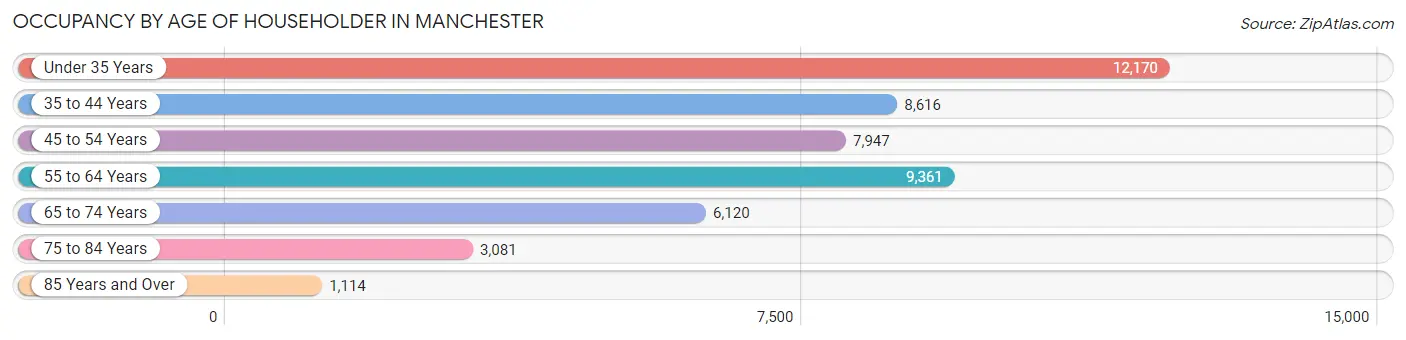
| Age Bracket | # Households | % Households |
| Under 35 Years | 12,170 | 25.1% |
| 35 to 44 Years | 8,616 | 17.8% |
| 45 to 54 Years | 7,947 | 16.4% |
| 55 to 64 Years | 9,361 | 19.3% |
| 65 to 74 Years | 6,120 | 12.6% |
| 75 to 84 Years | 3,081 | 6.4% |
| 85 Years and Over | 1,114 | 2.3% |
| Total | 48,409 | 100.0% |
Housing Finances in Manchester
Median Income by Occupancy in Manchester
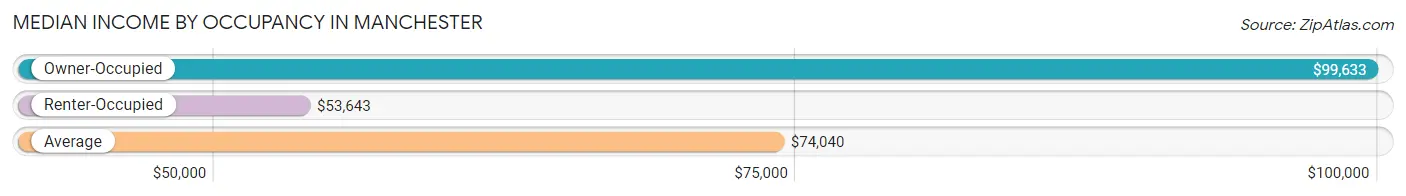
| Occupancy Type | # Households | Median Income |
| Owner-Occupied | 23,333 (48.2%) | $99,633 |
| Renter-Occupied | 25,076 (51.8%) | $53,643 |
| Average | 48,409 (100.0%) | $74,040 |
Occupancy by Householder Income Bracket in Manchester
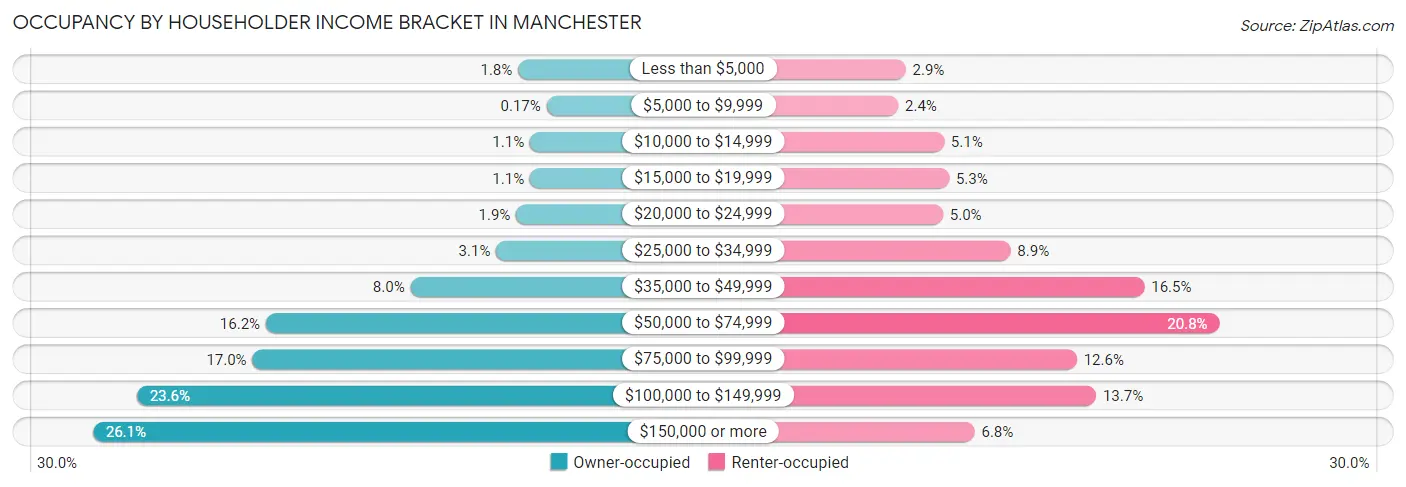
| Income Bracket | Owner-occupied | Renter-occupied |
| Less than $5,000 | 419 (1.8%) | 718 (2.9%) |
| $5,000 to $9,999 | 40 (0.2%) | 610 (2.4%) |
| $10,000 to $14,999 | 261 (1.1%) | 1,267 (5.1%) |
| $15,000 to $19,999 | 262 (1.1%) | 1,339 (5.3%) |
| $20,000 to $24,999 | 446 (1.9%) | 1,251 (5.0%) |
| $25,000 to $34,999 | 711 (3.0%) | 2,218 (8.8%) |
| $35,000 to $49,999 | 1,855 (8.0%) | 4,138 (16.5%) |
| $50,000 to $74,999 | 3,782 (16.2%) | 5,214 (20.8%) |
| $75,000 to $99,999 | 3,963 (17.0%) | 3,170 (12.6%) |
| $100,000 to $149,999 | 5,505 (23.6%) | 3,445 (13.7%) |
| $150,000 or more | 6,089 (26.1%) | 1,706 (6.8%) |
| Total | 23,333 (100.0%) | 25,076 (100.0%) |
Monthly Housing Cost Tiers in Manchester
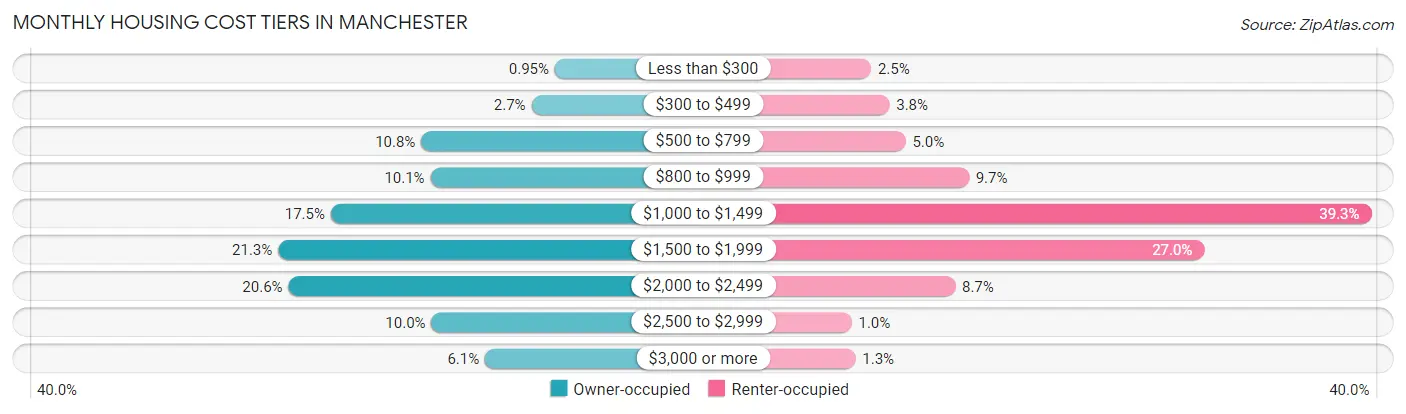
| Monthly Cost | Owner-occupied | Renter-occupied |
| Less than $300 | 222 (0.9%) | 620 (2.5%) |
| $300 to $499 | 624 (2.7%) | 957 (3.8%) |
| $500 to $799 | 2,518 (10.8%) | 1,256 (5.0%) |
| $800 to $999 | 2,358 (10.1%) | 2,424 (9.7%) |
| $1,000 to $1,499 | 4,072 (17.4%) | 9,860 (39.3%) |
| $1,500 to $1,999 | 4,977 (21.3%) | 6,774 (27.0%) |
| $2,000 to $2,499 | 4,799 (20.6%) | 2,172 (8.7%) |
| $2,500 to $2,999 | 2,343 (10.0%) | 262 (1.0%) |
| $3,000 or more | 1,420 (6.1%) | 331 (1.3%) |
| Total | 23,333 (100.0%) | 25,076 (100.0%) |
Physical Housing Characteristics in Manchester
Housing Structures in Manchester
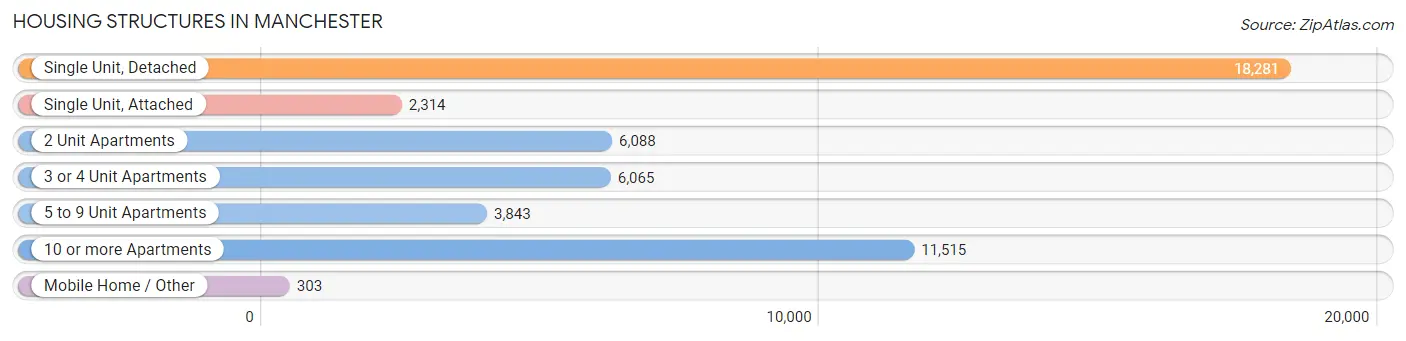
| Structure Type | # Housing Units | % Housing Units |
| Single Unit, Detached | 18,281 | 37.8% |
| Single Unit, Attached | 2,314 | 4.8% |
| 2 Unit Apartments | 6,088 | 12.6% |
| 3 or 4 Unit Apartments | 6,065 | 12.5% |
| 5 to 9 Unit Apartments | 3,843 | 7.9% |
| 10 or more Apartments | 11,515 | 23.8% |
| Mobile Home / Other | 303 | 0.6% |
| Total | 48,409 | 100.0% |
Housing Structures by Occupancy in Manchester
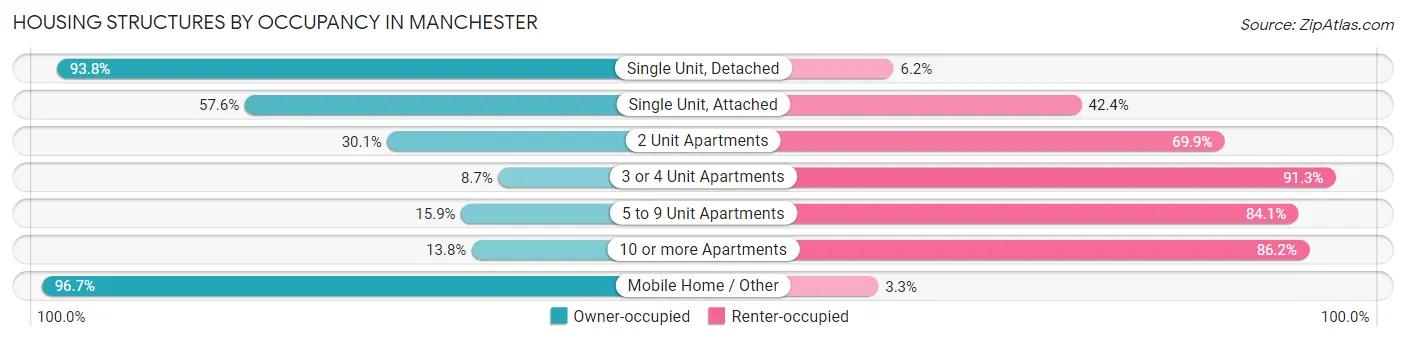
| Structure Type | Owner-occupied | Renter-occupied |
| Single Unit, Detached | 17,142 (93.8%) | 1,139 (6.2%) |
| Single Unit, Attached | 1,332 (57.6%) | 982 (42.4%) |
| 2 Unit Apartments | 1,832 (30.1%) | 4,256 (69.9%) |
| 3 or 4 Unit Apartments | 530 (8.7%) | 5,535 (91.3%) |
| 5 to 9 Unit Apartments | 611 (15.9%) | 3,232 (84.1%) |
| 10 or more Apartments | 1,593 (13.8%) | 9,922 (86.2%) |
| Mobile Home / Other | 293 (96.7%) | 10 (3.3%) |
| Total | 23,333 (48.2%) | 25,076 (51.8%) |
Housing Structures by Number of Rooms in Manchester
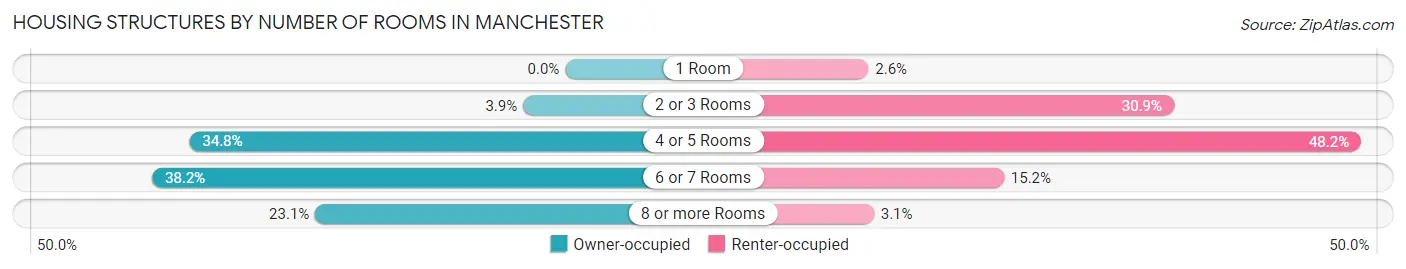
| Number of Rooms | Owner-occupied | Renter-occupied |
| 1 Room | 0 (0.0%) | 660 (2.6%) |
| 2 or 3 Rooms | 909 (3.9%) | 7,744 (30.9%) |
| 4 or 5 Rooms | 8,111 (34.8%) | 12,084 (48.2%) |
| 6 or 7 Rooms | 8,917 (38.2%) | 3,802 (15.2%) |
| 8 or more Rooms | 5,396 (23.1%) | 786 (3.1%) |
| Total | 23,333 (100.0%) | 25,076 (100.0%) |
Housing Structure by Heating Type in Manchester
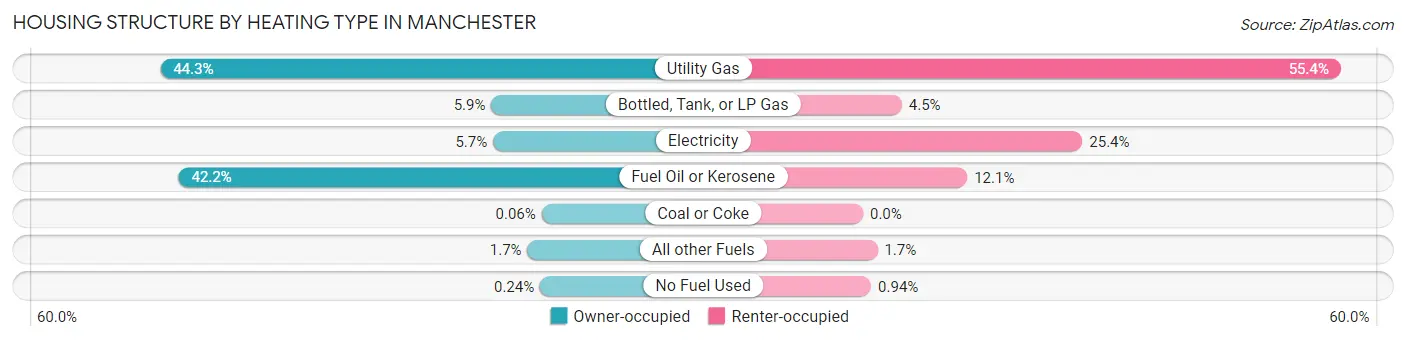
| Heating Type | Owner-occupied | Renter-occupied |
| Utility Gas | 10,329 (44.3%) | 13,888 (55.4%) |
| Bottled, Tank, or LP Gas | 1,374 (5.9%) | 1,128 (4.5%) |
| Electricity | 1,327 (5.7%) | 6,378 (25.4%) |
| Fuel Oil or Kerosene | 9,838 (42.2%) | 3,028 (12.1%) |
| Coal or Coke | 14 (0.1%) | 0 (0.0%) |
| All other Fuels | 396 (1.7%) | 419 (1.7%) |
| No Fuel Used | 55 (0.2%) | 235 (0.9%) |
| Total | 23,333 (100.0%) | 25,076 (100.0%) |
Household Vehicle Usage in Manchester
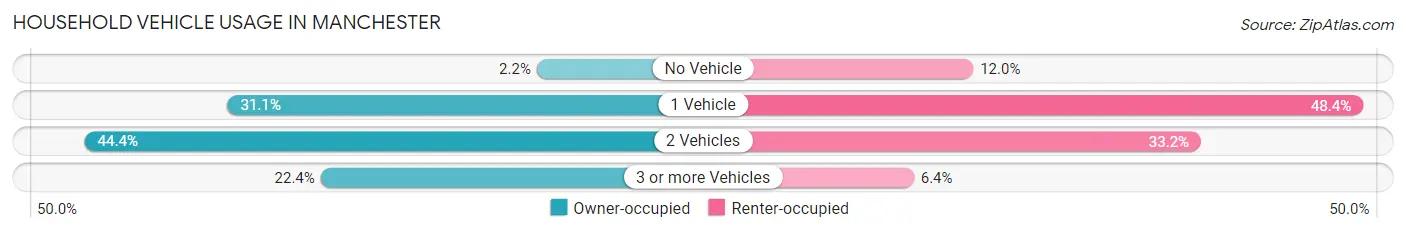
| Vehicles per Household | Owner-occupied | Renter-occupied |
| No Vehicle | 512 (2.2%) | 3,004 (12.0%) |
| 1 Vehicle | 7,244 (31.0%) | 12,126 (48.4%) |
| 2 Vehicles | 10,358 (44.4%) | 8,333 (33.2%) |
| 3 or more Vehicles | 5,219 (22.4%) | 1,613 (6.4%) |
| Total | 23,333 (100.0%) | 25,076 (100.0%) |
Real Estate & Mortgages in Manchester
Real Estate and Mortgage Overview in Manchester
| Characteristic | Without Mortgage | With Mortgage |
| Housing Units | 7,269 | 16,064 |
| Median Property Value | $291,600 | $311,100 |
| Median Household Income | $73,562 | $4,753 |
| Monthly Housing Costs | $843 | $1,415 |
| Real Estate Taxes | $5,615 | $190 |
Property Value by Mortgage Status in Manchester
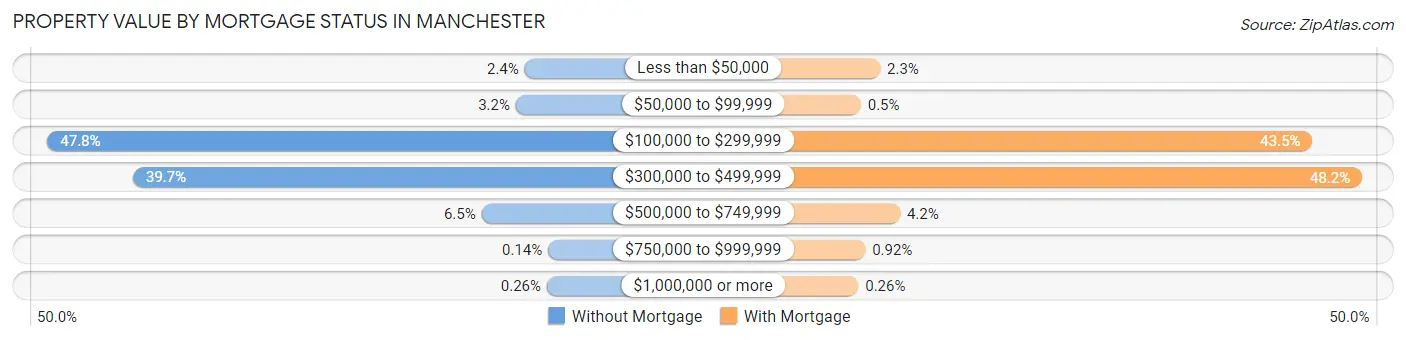
| Property Value | Without Mortgage | With Mortgage |
| Less than $50,000 | 173 (2.4%) | 376 (2.3%) |
| $50,000 to $99,999 | 234 (3.2%) | 81 (0.5%) |
| $100,000 to $299,999 | 3,477 (47.8%) | 6,989 (43.5%) |
| $300,000 to $499,999 | 2,885 (39.7%) | 7,750 (48.2%) |
| $500,000 to $749,999 | 471 (6.5%) | 679 (4.2%) |
| $750,000 to $999,999 | 10 (0.1%) | 148 (0.9%) |
| $1,000,000 or more | 19 (0.3%) | 41 (0.3%) |
| Total | 7,269 (100.0%) | 16,064 (100.0%) |
Household Income by Mortgage Status in Manchester
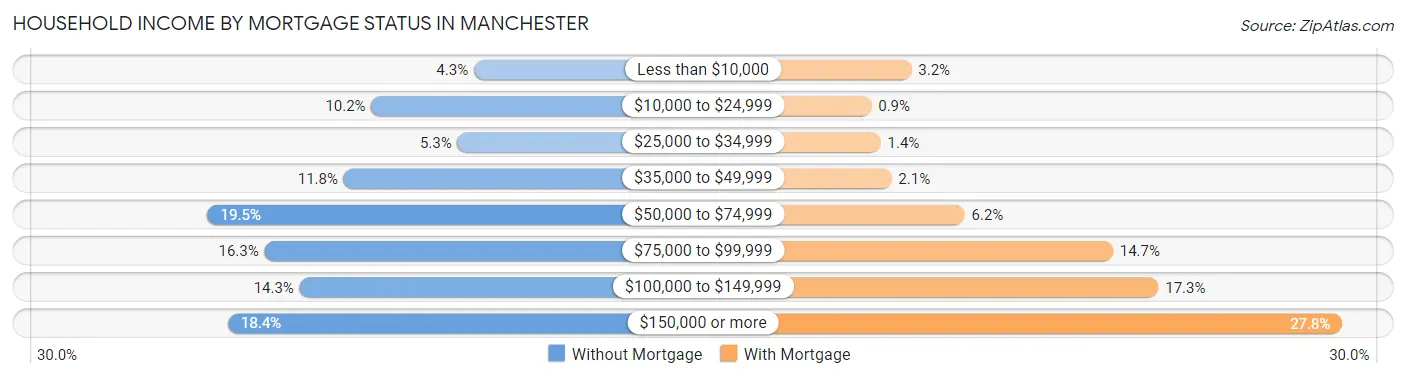
| Household Income | Without Mortgage | With Mortgage |
| Less than $10,000 | 314 (4.3%) | 513 (3.2%) |
| $10,000 to $24,999 | 740 (10.2%) | 145 (0.9%) |
| $25,000 to $34,999 | 382 (5.3%) | 229 (1.4%) |
| $35,000 to $49,999 | 855 (11.8%) | 329 (2.1%) |
| $50,000 to $74,999 | 1,420 (19.5%) | 1,000 (6.2%) |
| $75,000 to $99,999 | 1,184 (16.3%) | 2,362 (14.7%) |
| $100,000 to $149,999 | 1,038 (14.3%) | 2,779 (17.3%) |
| $150,000 or more | 1,336 (18.4%) | 4,467 (27.8%) |
| Total | 7,269 (100.0%) | 16,064 (100.0%) |
Property Value to Household Income Ratio in Manchester
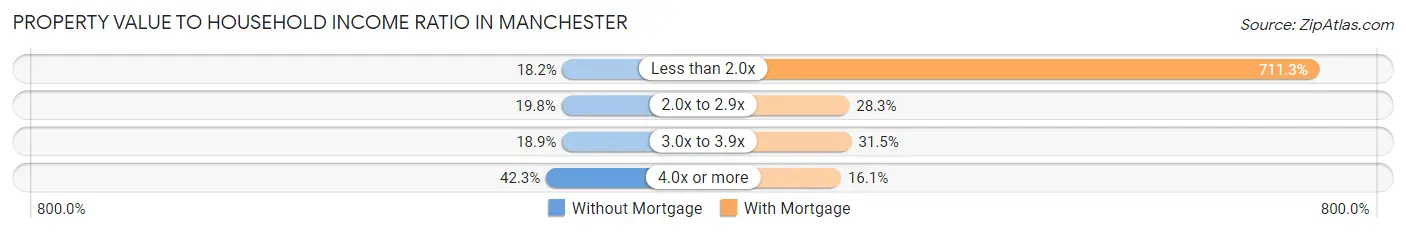
| Value-to-Income Ratio | Without Mortgage | With Mortgage |
| Less than 2.0x | 1,323 (18.2%) | 114,269 (711.3%) |
| 2.0x to 2.9x | 1,436 (19.8%) | 4,542 (28.3%) |
| 3.0x to 3.9x | 1,370 (18.9%) | 5,057 (31.5%) |
| 4.0x or more | 3,074 (42.3%) | 2,583 (16.1%) |
| Total | 7,269 (100.0%) | 16,064 (100.0%) |
Real Estate Taxes by Mortgage Status in Manchester
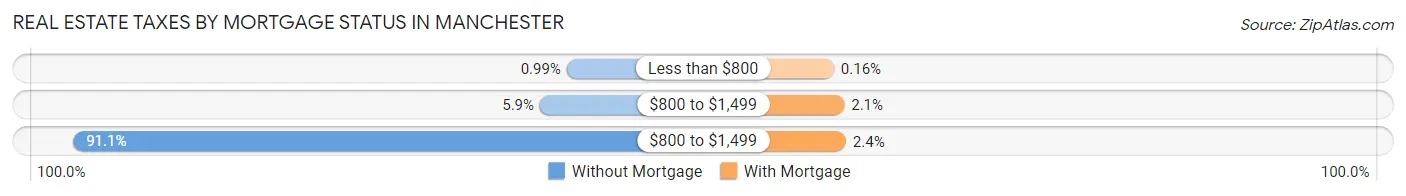
| Property Taxes | Without Mortgage | With Mortgage |
| Less than $800 | 72 (1.0%) | 25 (0.2%) |
| $800 to $1,499 | 428 (5.9%) | 329 (2.1%) |
| $800 to $1,499 | 6,623 (91.1%) | 377 (2.4%) |
| Total | 7,269 (100.0%) | 16,064 (100.0%) |
Health & Disability in Manchester
Health Insurance Coverage by Age in Manchester
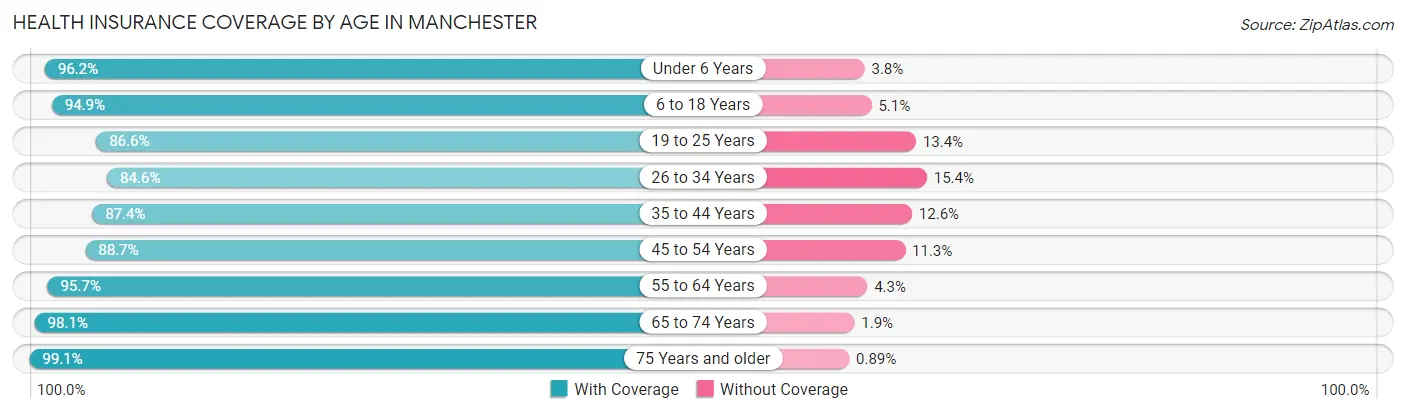
| Age Bracket | With Coverage | Without Coverage |
| Under 6 Years | 7,135 (96.2%) | 280 (3.8%) |
| 6 to 18 Years | 14,010 (94.9%) | 749 (5.1%) |
| 19 to 25 Years | 10,683 (86.6%) | 1,647 (13.4%) |
| 26 to 34 Years | 16,088 (84.6%) | 2,926 (15.4%) |
| 35 to 44 Years | 13,456 (87.4%) | 1,941 (12.6%) |
| 45 to 54 Years | 11,843 (88.7%) | 1,515 (11.3%) |
| 55 to 64 Years | 14,895 (95.7%) | 665 (4.3%) |
| 65 to 74 Years | 8,762 (98.1%) | 168 (1.9%) |
| 75 Years and older | 6,587 (99.1%) | 59 (0.9%) |
| Total | 103,459 (91.2%) | 9,950 (8.8%) |
Health Insurance Coverage by Citizenship Status in Manchester
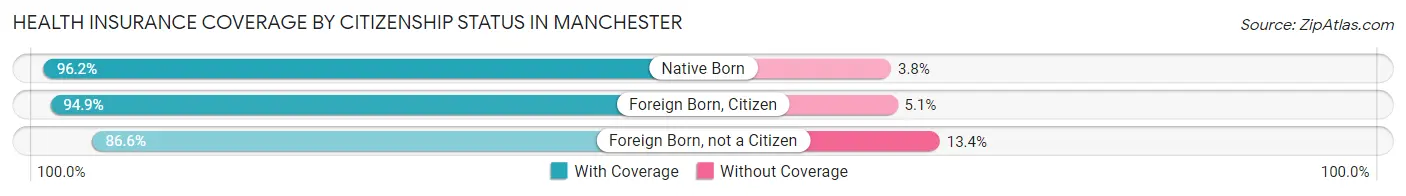
| Citizenship Status | With Coverage | Without Coverage |
| Native Born | 7,135 (96.2%) | 280 (3.8%) |
| Foreign Born, Citizen | 14,010 (94.9%) | 749 (5.1%) |
| Foreign Born, not a Citizen | 10,683 (86.6%) | 1,647 (13.4%) |
Health Insurance Coverage by Household Income in Manchester
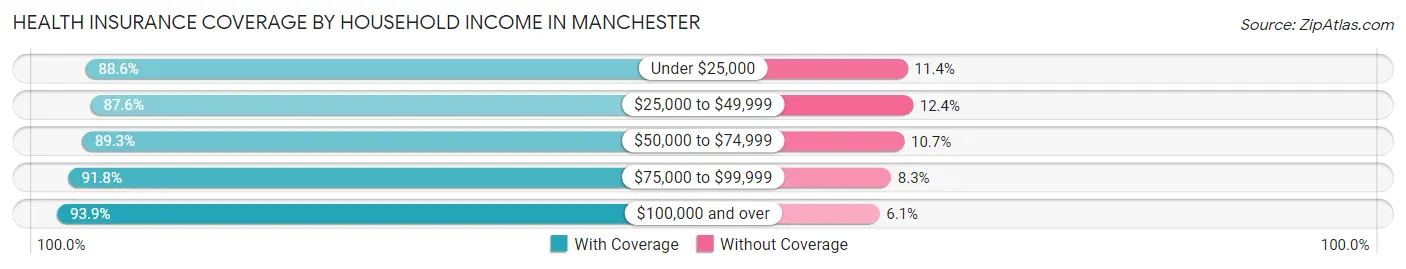
| Household Income | With Coverage | Without Coverage |
| Under $25,000 | 9,405 (88.6%) | 1,210 (11.4%) |
| $25,000 to $49,999 | 15,162 (87.6%) | 2,138 (12.4%) |
| $50,000 to $74,999 | 17,494 (89.3%) | 2,102 (10.7%) |
| $75,000 to $99,999 | 17,176 (91.7%) | 1,544 (8.3%) |
| $100,000 and over | 43,025 (93.9%) | 2,794 (6.1%) |
Public vs Private Health Insurance Coverage by Age in Manchester
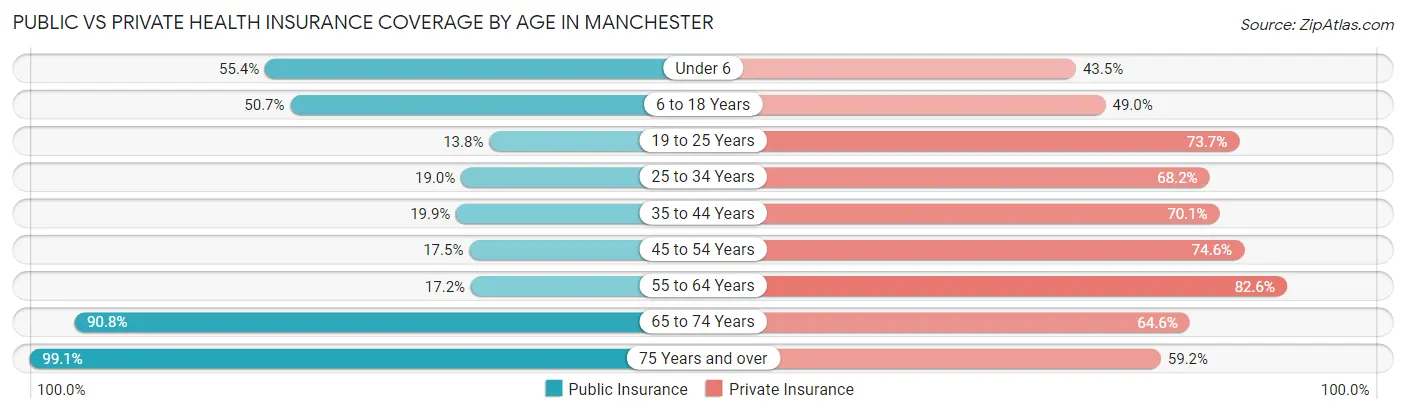
| Age Bracket | Public Insurance | Private Insurance |
| Under 6 | 4,105 (55.4%) | 3,223 (43.5%) |
| 6 to 18 Years | 7,478 (50.7%) | 7,224 (48.9%) |
| 19 to 25 Years | 1,696 (13.8%) | 9,092 (73.7%) |
| 25 to 34 Years | 3,608 (19.0%) | 12,973 (68.2%) |
| 35 to 44 Years | 3,063 (19.9%) | 10,791 (70.1%) |
| 45 to 54 Years | 2,333 (17.5%) | 9,969 (74.6%) |
| 55 to 64 Years | 2,670 (17.2%) | 12,850 (82.6%) |
| 65 to 74 Years | 8,111 (90.8%) | 5,765 (64.6%) |
| 75 Years and over | 6,587 (99.1%) | 3,936 (59.2%) |
| Total | 39,651 (35.0%) | 75,823 (66.9%) |
Disability Status by Sex by Age in Manchester
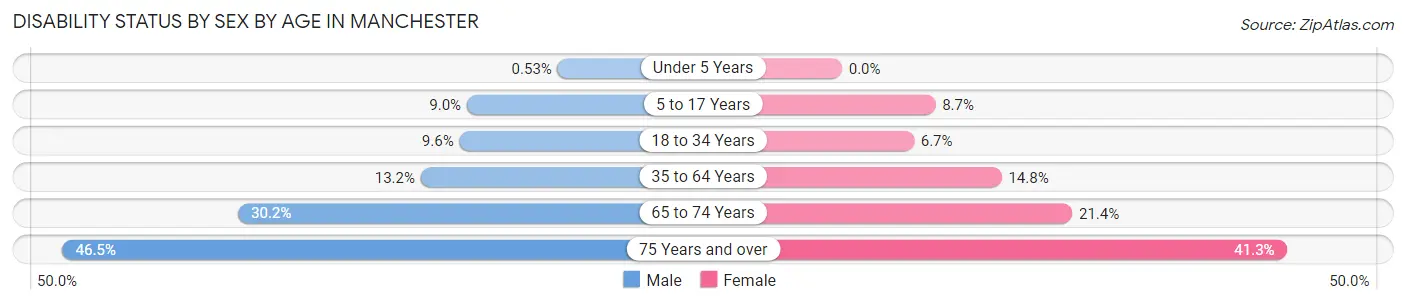
| Age Bracket | Male | Female |
| Under 5 Years | 16 (0.5%) | 0 (0.0%) |
| 5 to 17 Years | 684 (8.9%) | 610 (8.7%) |
| 18 to 34 Years | 1,585 (9.6%) | 1,085 (6.7%) |
| 35 to 64 Years | 2,951 (13.2%) | 3,263 (14.8%) |
| 65 to 74 Years | 1,366 (30.2%) | 941 (21.4%) |
| 75 Years and over | 1,302 (46.5%) | 1,586 (41.3%) |
Disability Class by Sex by Age in Manchester
Disability Class: Hearing Difficulty
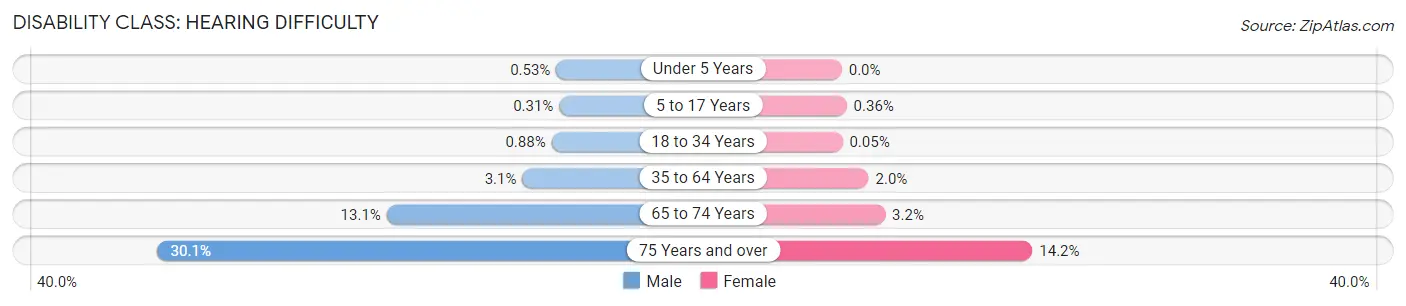
| Age Bracket | Male | Female |
| Under 5 Years | 16 (0.5%) | 0 (0.0%) |
| 5 to 17 Years | 24 (0.3%) | 25 (0.4%) |
| 18 to 34 Years | 144 (0.9%) | 8 (0.1%) |
| 35 to 64 Years | 680 (3.0%) | 437 (2.0%) |
| 65 to 74 Years | 594 (13.1%) | 142 (3.2%) |
| 75 Years and over | 844 (30.1%) | 544 (14.1%) |
Disability Class: Vision Difficulty
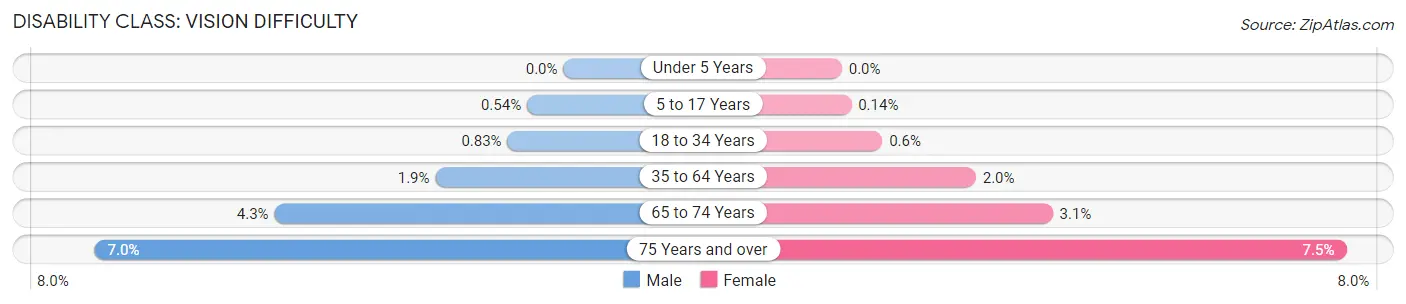
| Age Bracket | Male | Female |
| Under 5 Years | 0 (0.0%) | 0 (0.0%) |
| 5 to 17 Years | 41 (0.5%) | 10 (0.1%) |
| 18 to 34 Years | 136 (0.8%) | 97 (0.6%) |
| 35 to 64 Years | 423 (1.9%) | 438 (2.0%) |
| 65 to 74 Years | 194 (4.3%) | 138 (3.1%) |
| 75 Years and over | 195 (7.0%) | 288 (7.5%) |
Disability Class: Cognitive Difficulty
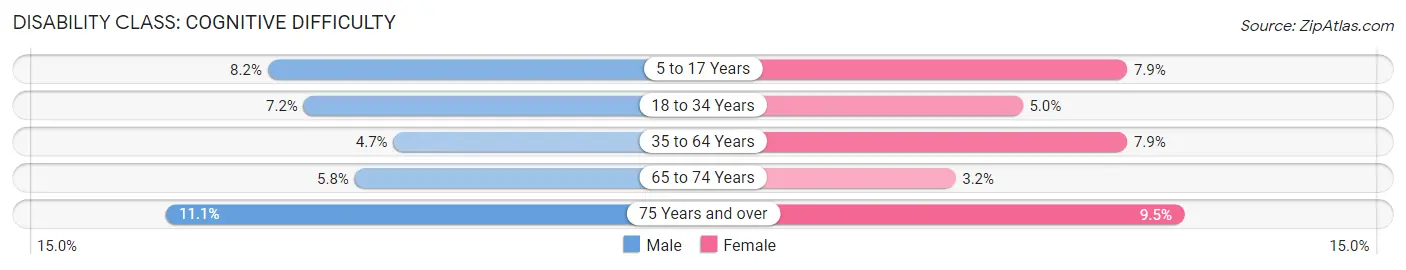
| Age Bracket | Male | Female |
| 5 to 17 Years | 629 (8.2%) | 559 (7.9%) |
| 18 to 34 Years | 1,189 (7.2%) | 817 (5.0%) |
| 35 to 64 Years | 1,055 (4.7%) | 1,747 (7.9%) |
| 65 to 74 Years | 263 (5.8%) | 139 (3.2%) |
| 75 Years and over | 310 (11.1%) | 366 (9.5%) |
Disability Class: Ambulatory Difficulty
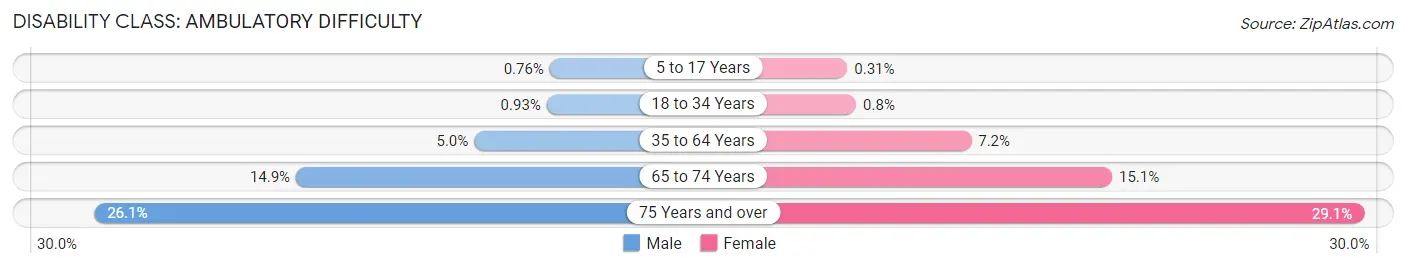
| Age Bracket | Male | Female |
| 5 to 17 Years | 58 (0.8%) | 22 (0.3%) |
| 18 to 34 Years | 153 (0.9%) | 130 (0.8%) |
| 35 to 64 Years | 1,108 (5.0%) | 1,588 (7.2%) |
| 65 to 74 Years | 674 (14.9%) | 663 (15.0%) |
| 75 Years and over | 732 (26.1%) | 1,118 (29.1%) |
Disability Class: Self-Care Difficulty
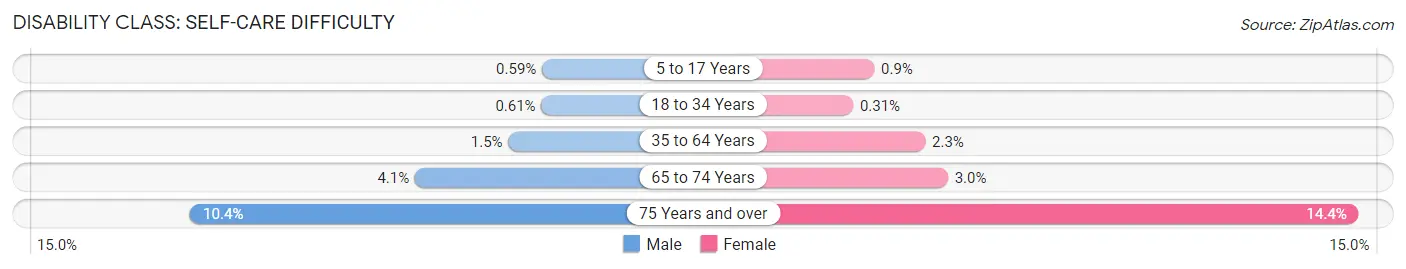
| Age Bracket | Male | Female |
| 5 to 17 Years | 45 (0.6%) | 63 (0.9%) |
| 18 to 34 Years | 101 (0.6%) | 51 (0.3%) |
| 35 to 64 Years | 341 (1.5%) | 511 (2.3%) |
| 65 to 74 Years | 187 (4.1%) | 130 (2.9%) |
| 75 Years and over | 291 (10.4%) | 553 (14.4%) |
Technology Access in Manchester
Computing Device Access in Manchester
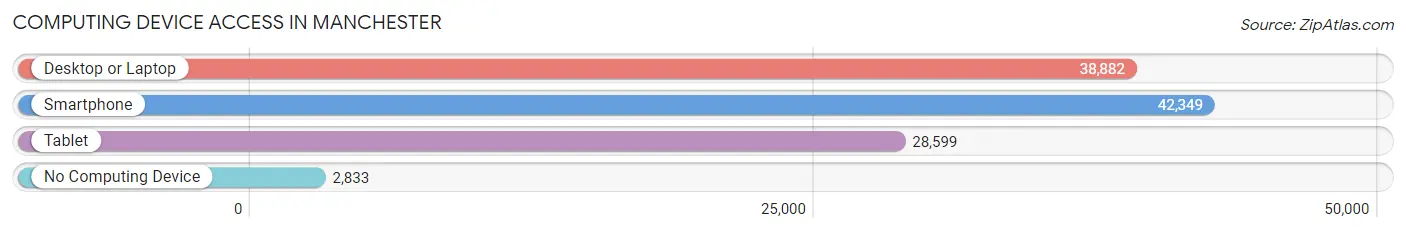
| Device Type | # Households | % Households |
| Desktop or Laptop | 38,882 | 80.3% |
| Smartphone | 42,349 | 87.5% |
| Tablet | 28,599 | 59.1% |
| No Computing Device | 2,833 | 5.9% |
| Total | 48,409 | 100.0% |
Internet Access in Manchester
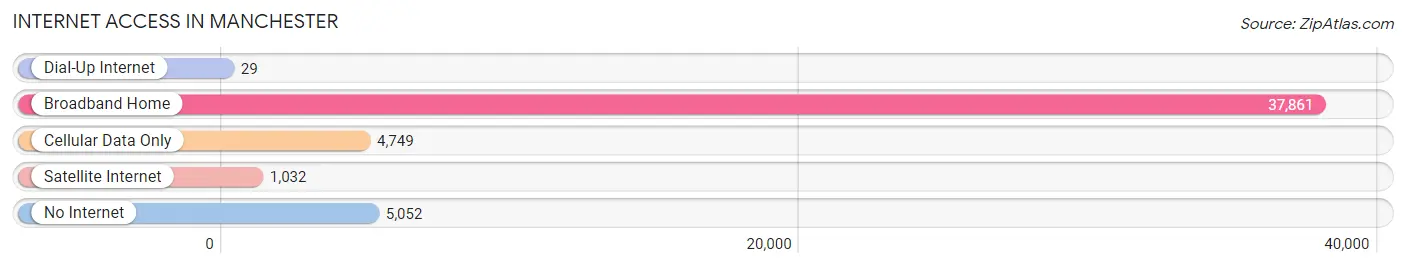
| Internet Type | # Households | % Households |
| Dial-Up Internet | 29 | 0.1% |
| Broadband Home | 37,861 | 78.2% |
| Cellular Data Only | 4,749 | 9.8% |
| Satellite Internet | 1,032 | 2.1% |
| No Internet | 5,052 | 10.4% |
| Total | 48,409 | 100.0% |
Manchester Summary
Manchester, New Hampshire is the largest city in the state and the largest city in northern New England. It is located in Hillsborough County and is part of the Greater Manchester area. The city has a population of 109,565 as of the 2010 census, making it the tenth largest city in New England.
History
Manchester was first settled in 1722 by colonists from Massachusetts. The town was originally called Derryfield, but was renamed Manchester in 1810. The city was incorporated in 1846 and quickly became an important industrial center. The Amoskeag Manufacturing Company was founded in 1838 and was the largest cotton mill in the world at the time. The city was also home to the first passenger railroad in the United States, the Manchester and Lawrence Railroad.
Geography
Manchester is located in the Merrimack Valley region of New Hampshire. The city is situated on the Merrimack River and is bordered by the towns of Bedford, Goffstown, Hooksett, and Londonderry. The city covers an area of 36.2 square miles and has an elevation of approximately 200 feet.
Economy
Manchester is a major economic center in New Hampshire. The city is home to several large companies, including the Manchester-Boston Regional Airport, the Manchester Monarchs hockey team, and the New Hampshire Fisher Cats baseball team. The city is also home to several major hospitals, including Catholic Medical Center and Elliot Hospital.
The city is also home to several major educational institutions, including the University of New Hampshire at Manchester, Southern New Hampshire University, and Manchester Community College.
Demographics
As of the 2010 census, Manchester had a population of 109,565. The racial makeup of the city was 87.2% White, 5.3% African American, 0.5% Native American, 2.7% Asian, 0.1% Pacific Islander, 1.7% from other races, and 2.5% from two or more races. Hispanic or Latino of any race were 5.2% of the population.
The median income for a household in the city was $41,902, and the median income for a family was $51,945. The per capita income for the city was $22,945. About 11.3% of families and 14.7% of the population were below the poverty line, including 19.2% of those under age 18 and 8.7% of those age 65 or over.
Common Questions
What is Per Capita Income in Manchester?
Per Capita income in Manchester is $41,067.
What is the Median Family Income in Manchester?
Median Family Income in Manchester is $90,282.
What is the Median Household income in Manchester?
Median Household Income in Manchester is $74,040.
What is Income or Wage Gap in Manchester?
Income or Wage Gap in Manchester is 23.0%.
Women in Manchester earn 77.0 cents for every dollar earned by a man.
What is Family Income Deficit in Manchester?
Family Income Deficit in Manchester is $11,030.
Families that are below poverty line in Manchester earn $11,030 less on average than the poverty threshold level.
What is Inequality or Gini Index in Manchester?
Inequality or Gini Index in Manchester is 0.43.
What is the Total Population of Manchester?
Total Population of Manchester is 115,037.
What is the Total Male Population of Manchester?
Total Male Population of Manchester is 57,472.
What is the Total Female Population of Manchester?
Total Female Population of Manchester is 57,565.
What is the Ratio of Males per 100 Females in Manchester?
There are 99.84 Males per 100 Females in Manchester.
What is the Ratio of Females per 100 Males in Manchester?
There are 100.16 Females per 100 Males in Manchester.
What is the Median Population Age in Manchester?
Median Population Age in Manchester is 37.0 Years.
What is the Average Family Size in Manchester
Average Family Size in Manchester is 3.0 People.
What is the Average Household Size in Manchester
Average Household Size in Manchester is 2.3 People.
How Large is the Labor Force in Manchester?
There are 68,820 People in the Labor Forcein in Manchester.
What is the Percentage of People in the Labor Force in Manchester?
71.4% of People are in the Labor Force in Manchester.
What is the Unemployment Rate in Manchester?
Unemployment Rate in Manchester is 4.2%.