Fernley, NV Map & Demographics
Fernley Map
Fernley Overview
$36,125
PER CAPITA INCOME
$88,672
AVG FAMILY INCOME
$84,025
AVG HOUSEHOLD INCOME
47.0%
WAGE / INCOME GAP [ % ]
53.0¢/ $1
WAGE / INCOME GAP [ $ ]
0.38
INEQUALITY / GINI INDEX
23,035
TOTAL POPULATION
11,860
MALE POPULATION
11,175
FEMALE POPULATION
106.13
MALES / 100 FEMALES
94.22
FEMALES / 100 MALES
35.9
MEDIAN AGE
3.2
AVG FAMILY SIZE
2.8
AVG HOUSEHOLD SIZE
11,759
LABOR FORCE [ PEOPLE ]
65.1%
PERCENT IN LABOR FORCE
4.6%
UNEMPLOYMENT RATE
Fernley Zip Codes
Fernley Area Codes
Income in Fernley
Income Overview in Fernley
Per Capita Income in Fernley is $36,125, while median incomes of families and households are $88,672 and $84,025 respectively.
| Characteristic | Number | Measure |
| Per Capita Income | 23,035 | $36,125 |
| Median Family Income | 5,951 | $88,672 |
| Mean Family Income | 5,951 | $103,603 |
| Median Household Income | 8,391 | $84,025 |
| Mean Household Income | 8,391 | $96,132 |
| Income Deficit | 5,951 | $0 |
| Wage / Income Gap (%) | 23,035 | 47.04% |
| Wage / Income Gap ($) | 23,035 | 52.96¢ per $1 |
| Gini / Inequality Index | 23,035 | 0.38 |
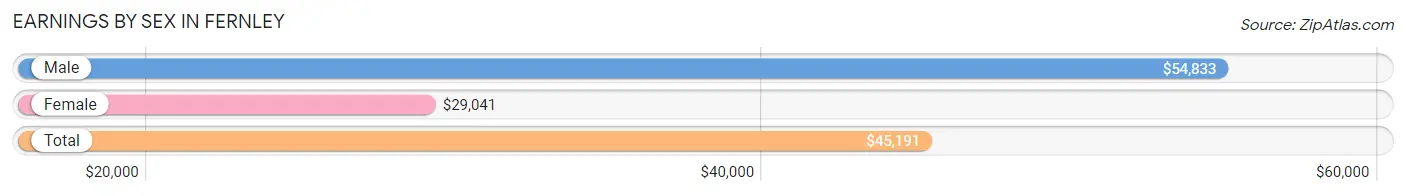
Earnings by Sex in Fernley
Average Earnings in Fernley are $45,191, $54,833 for men and $29,041 for women, a difference of 47.0%.
| Sex | Number | Average Earnings |
| Male | 6,658 (54.2%) | $54,833 |
| Female | 5,621 (45.8%) | $29,041 |
| Total | 12,279 (100.0%) | $45,191 |
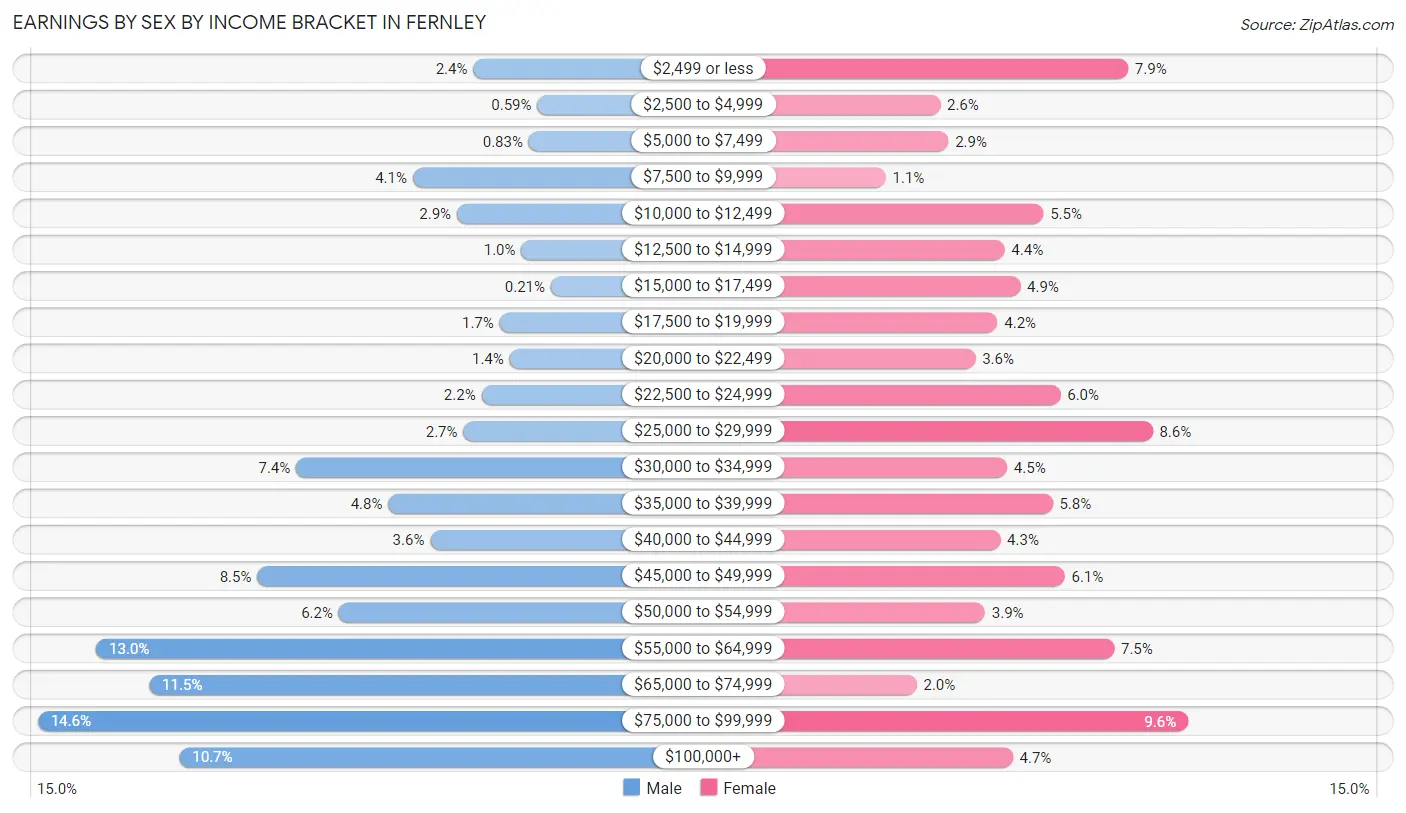
Earnings by Sex by Income Bracket in Fernley
The most common earnings brackets in Fernley are $75,000 to $99,999 for men (974 | 14.6%) and $75,000 to $99,999 for women (539 | 9.6%).
| Income | Male | Female |
| $2,499 or less | 159 (2.4%) | 444 (7.9%) |
| $2,500 to $4,999 | 39 (0.6%) | 147 (2.6%) |
| $5,000 to $7,499 | 55 (0.8%) | 160 (2.9%) |
| $7,500 to $9,999 | 272 (4.1%) | 61 (1.1%) |
| $10,000 to $12,499 | 190 (2.9%) | 310 (5.5%) |
| $12,500 to $14,999 | 69 (1.0%) | 249 (4.4%) |
| $15,000 to $17,499 | 14 (0.2%) | 274 (4.9%) |
| $17,500 to $19,999 | 110 (1.7%) | 238 (4.2%) |
| $20,000 to $22,499 | 91 (1.4%) | 203 (3.6%) |
| $22,500 to $24,999 | 144 (2.2%) | 337 (6.0%) |
| $25,000 to $29,999 | 178 (2.7%) | 483 (8.6%) |
| $30,000 to $34,999 | 491 (7.4%) | 253 (4.5%) |
| $35,000 to $39,999 | 318 (4.8%) | 325 (5.8%) |
| $40,000 to $44,999 | 240 (3.6%) | 242 (4.3%) |
| $45,000 to $49,999 | 563 (8.5%) | 344 (6.1%) |
| $50,000 to $54,999 | 411 (6.2%) | 218 (3.9%) |
| $55,000 to $64,999 | 865 (13.0%) | 422 (7.5%) |
| $65,000 to $74,999 | 766 (11.5%) | 110 (2.0%) |
| $75,000 to $99,999 | 974 (14.6%) | 539 (9.6%) |
| $100,000+ | 709 (10.6%) | 262 (4.7%) |
| Total | 6,658 (100.0%) | 5,621 (100.0%) |
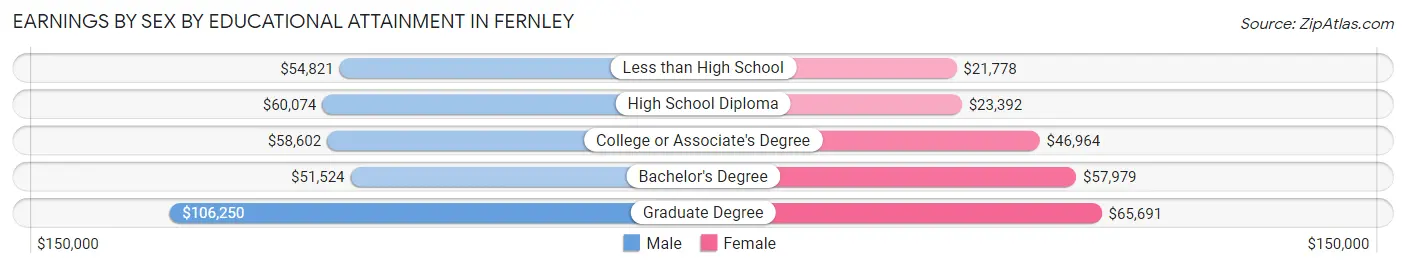
Earnings by Sex by Educational Attainment in Fernley
Average earnings in Fernley are $58,687 for men and $33,690 for women, a difference of 42.6%. Men with an educational attainment of graduate degree enjoy the highest average annual earnings of $106,250, while those with bachelor's degree education earn the least with $51,524. Women with an educational attainment of graduate degree earn the most with the average annual earnings of $65,691, while those with less than high school education have the smallest earnings of $21,778.
| Educational Attainment | Male Income | Female Income |
| Less than High School | $54,821 | $21,778 |
| High School Diploma | $60,074 | $23,392 |
| College or Associate's Degree | $58,602 | $46,964 |
| Bachelor's Degree | $51,524 | $57,979 |
| Graduate Degree | $106,250 | $65,691 |
| Total | $58,687 | $33,690 |
Family Income in Fernley
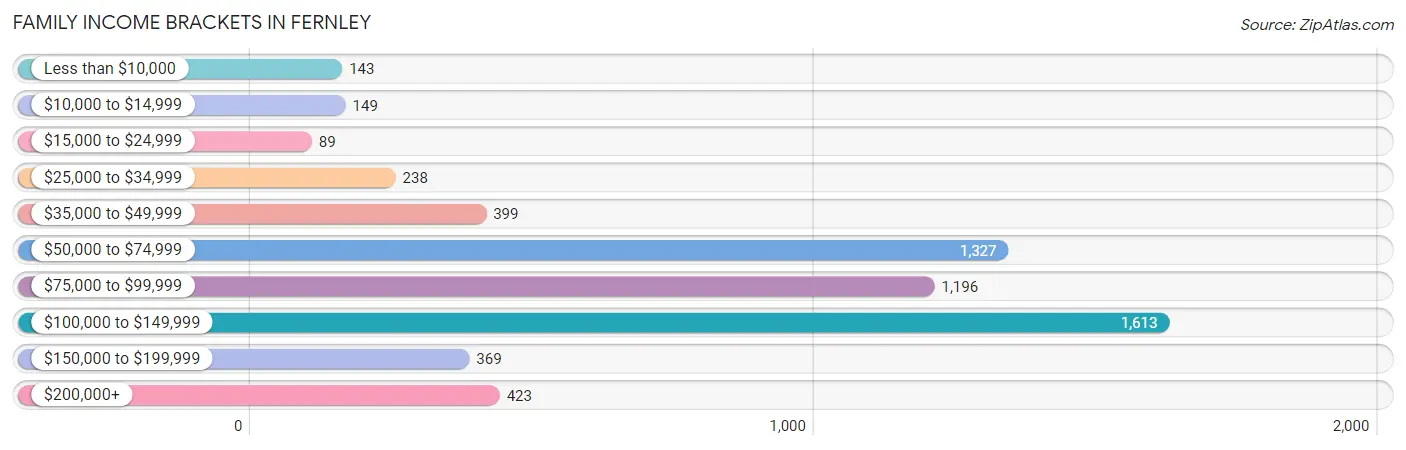
Family Income Brackets in Fernley
According to the Fernley family income data, there are 1,613 families falling into the $100,000 to $149,999 income range, which is the most common income bracket and makes up 27.1% of all families. Conversely, the $15,000 to $24,999 income bracket is the least frequent group with only 89 families (1.5%) belonging to this category.
| Income Bracket | # Families | % Families |
| Less than $10,000 | 143 | 2.4% |
| $10,000 to $14,999 | 149 | 2.5% |
| $15,000 to $24,999 | 89 | 1.5% |
| $25,000 to $34,999 | 238 | 4.0% |
| $35,000 to $49,999 | 399 | 6.7% |
| $50,000 to $74,999 | 1,327 | 22.3% |
| $75,000 to $99,999 | 1,196 | 20.1% |
| $100,000 to $149,999 | 1,613 | 27.1% |
| $150,000 to $199,999 | 369 | 6.2% |
| $200,000+ | 423 | 7.1% |
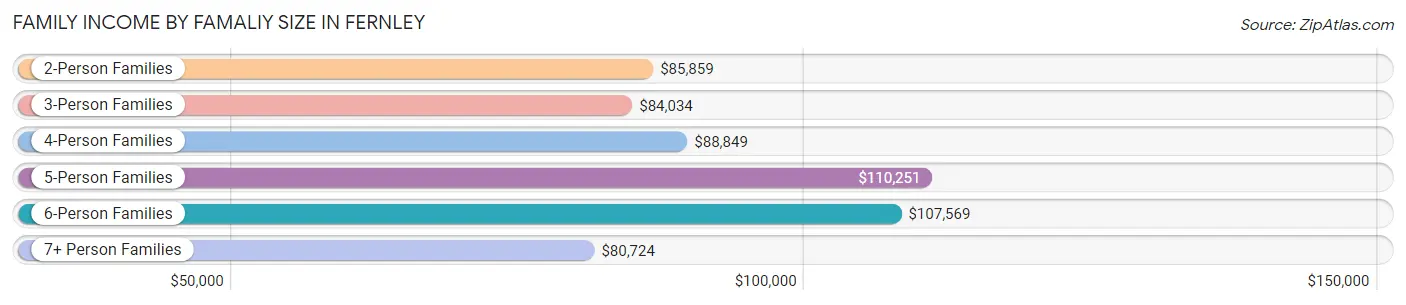
Family Income by Famaliy Size in Fernley
5-person families (693 | 11.7%) account for the highest median family income in Fernley with $110,251 per family, while 2-person families (2,491 | 41.9%) have the highest median income of $42,930 per family member.
| Income Bracket | # Families | Median Income |
| 2-Person Families | 2,491 (41.9%) | $85,859 |
| 3-Person Families | 1,405 (23.6%) | $84,034 |
| 4-Person Families | 1,091 (18.3%) | $88,849 |
| 5-Person Families | 693 (11.7%) | $110,251 |
| 6-Person Families | 198 (3.3%) | $107,569 |
| 7+ Person Families | 73 (1.2%) | $80,724 |
| Total | 5,951 (100.0%) | $88,672 |
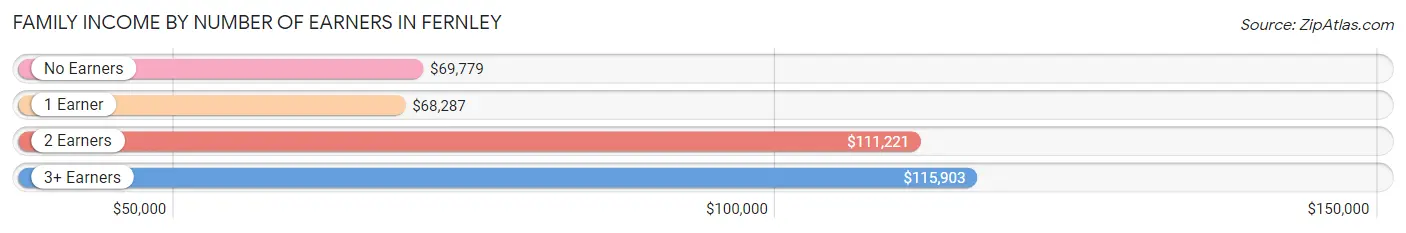
Family Income by Number of Earners in Fernley
The median family income in Fernley is $88,672, with families comprising 3+ earners (654) having the highest median family income of $115,903, while families with 1 earner (2,153) have the lowest median family income of $68,287, accounting for 11.0% and 36.2% of families, respectively.
| Number of Earners | # Families | Median Income |
| No Earners | 839 (14.1%) | $69,779 |
| 1 Earner | 2,153 (36.2%) | $68,287 |
| 2 Earners | 2,305 (38.7%) | $111,221 |
| 3+ Earners | 654 (11.0%) | $115,903 |
| Total | 5,951 (100.0%) | $88,672 |
Household Income in Fernley
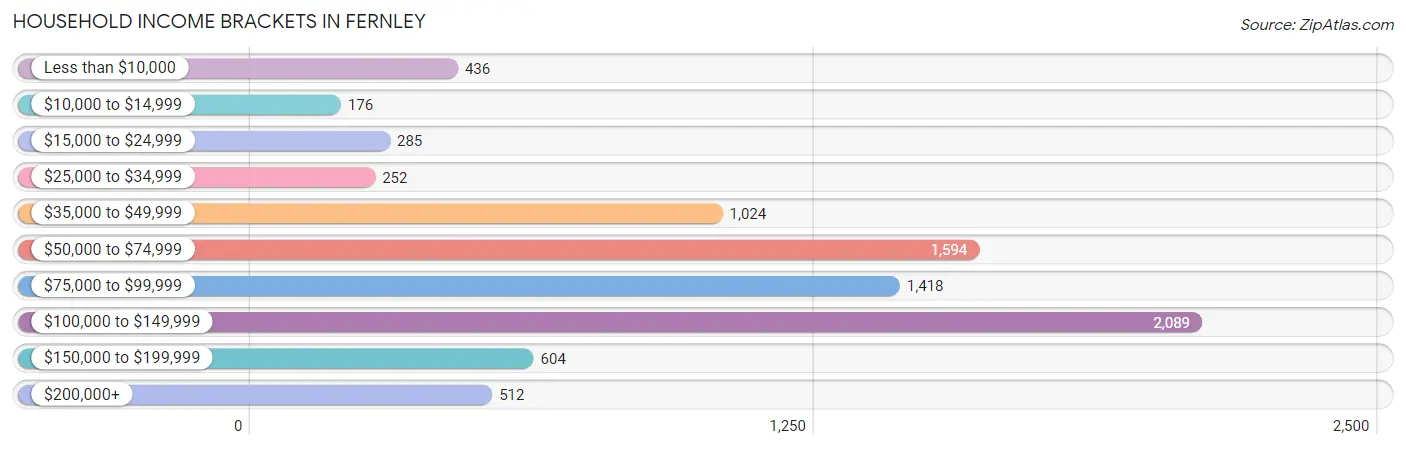
Household Income Brackets in Fernley
With 2,089 households falling in the category, the $100,000 to $149,999 income range is the most frequent in Fernley, accounting for 24.9% of all households. In contrast, only 176 households (2.1%) fall into the $10,000 to $14,999 income bracket, making it the least populous group.
| Income Bracket | # Households | % Households |
| Less than $10,000 | 436 | 5.2% |
| $10,000 to $14,999 | 176 | 2.1% |
| $15,000 to $24,999 | 285 | 3.4% |
| $25,000 to $34,999 | 252 | 3.0% |
| $35,000 to $49,999 | 1,024 | 12.2% |
| $50,000 to $74,999 | 1,594 | 19.0% |
| $75,000 to $99,999 | 1,418 | 16.9% |
| $100,000 to $149,999 | 2,089 | 24.9% |
| $150,000 to $199,999 | 604 | 7.2% |
| $200,000+ | 512 | 6.1% |
Household Income by Householder Age in Fernley
The median household income in Fernley is $84,025, with the highest median household income of $94,737 found in the 25 to 44 years age bracket for the primary householder. A total of 3,426 households (40.8%) fall into this category. Meanwhile, the 15 to 24 years age bracket for the primary householder has the lowest median household income of $47,295, with 280 households (3.3%) in this group.
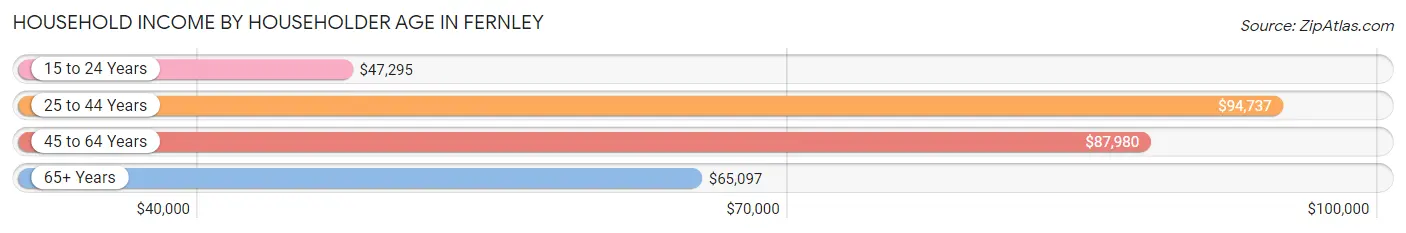
| Income Bracket | # Households | Median Income |
| 15 to 24 Years | 280 (3.3%) | $47,295 |
| 25 to 44 Years | 3,426 (40.8%) | $94,737 |
| 45 to 64 Years | 2,449 (29.2%) | $87,980 |
| 65+ Years | 2,236 (26.7%) | $65,097 |
| Total | 8,391 (100.0%) | $84,025 |
Poverty in Fernley
Income Below Poverty by Sex and Age in Fernley
With 8.6% poverty level for males and 11.5% for females among the residents of Fernley, 6 to 11 year old males and 5 year old females are the most vulnerable to poverty, with 211 males (19.4%) and 102 females (44.4%) in their respective age groups living below the poverty level.
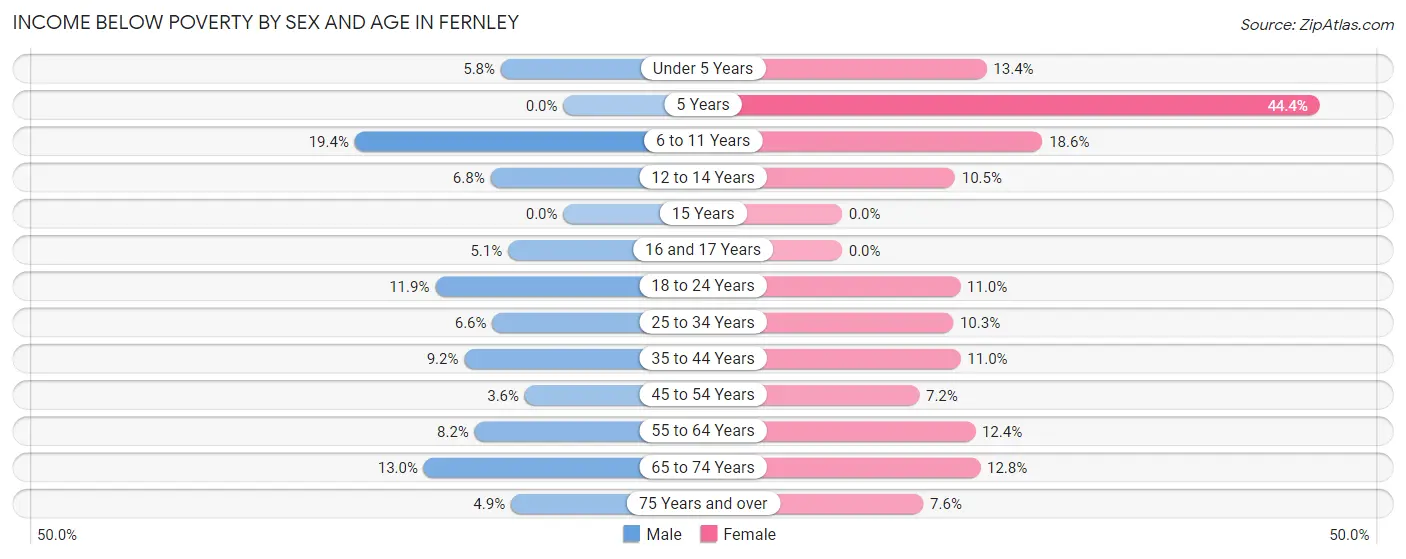
| Age Bracket | Male | Female |
| Under 5 Years | 37 (5.8%) | 95 (13.4%) |
| 5 Years | 0 (0.0%) | 102 (44.4%) |
| 6 to 11 Years | 211 (19.4%) | 157 (18.6%) |
| 12 to 14 Years | 25 (6.8%) | 43 (10.5%) |
| 15 Years | 0 (0.0%) | 0 (0.0%) |
| 16 and 17 Years | 20 (5.1%) | 0 (0.0%) |
| 18 to 24 Years | 87 (11.9%) | 96 (11.0%) |
| 25 to 34 Years | 136 (6.6%) | 199 (10.3%) |
| 35 to 44 Years | 154 (9.2%) | 163 (11.0%) |
| 45 to 54 Years | 51 (3.6%) | 96 (7.2%) |
| 55 to 64 Years | 106 (8.2%) | 145 (12.4%) |
| 65 to 74 Years | 149 (13.0%) | 133 (12.8%) |
| 75 Years and over | 32 (4.9%) | 45 (7.5%) |
| Total | 1,008 (8.6%) | 1,274 (11.5%) |
Income Above Poverty by Sex and Age in Fernley
According to the poverty statistics in Fernley, males aged 5 years and females aged 15 years are the age groups that are most secure financially, with 100.0% of males and 100.0% of females in these age groups living above the poverty line.
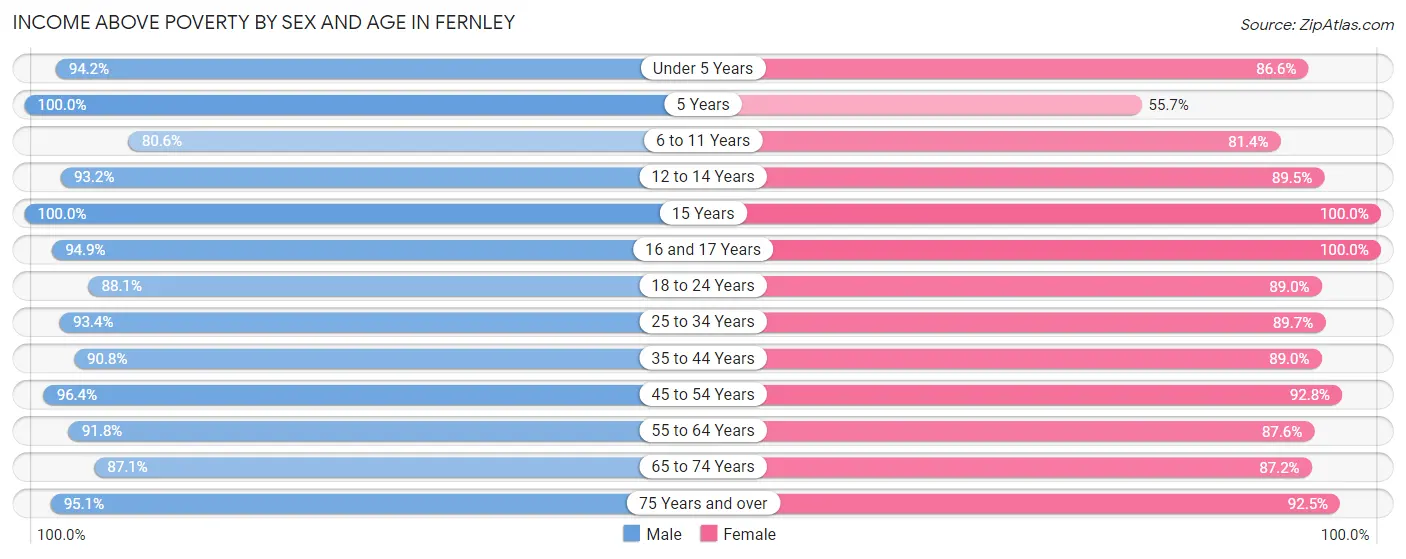
| Age Bracket | Male | Female |
| Under 5 Years | 601 (94.2%) | 613 (86.6%) |
| 5 Years | 214 (100.0%) | 128 (55.6%) |
| 6 to 11 Years | 879 (80.6%) | 687 (81.4%) |
| 12 to 14 Years | 345 (93.2%) | 367 (89.5%) |
| 15 Years | 84 (100.0%) | 217 (100.0%) |
| 16 and 17 Years | 370 (94.9%) | 248 (100.0%) |
| 18 to 24 Years | 645 (88.1%) | 778 (89.0%) |
| 25 to 34 Years | 1,928 (93.4%) | 1,730 (89.7%) |
| 35 to 44 Years | 1,521 (90.8%) | 1,317 (89.0%) |
| 45 to 54 Years | 1,377 (96.4%) | 1,243 (92.8%) |
| 55 to 64 Years | 1,182 (91.8%) | 1,028 (87.6%) |
| 65 to 74 Years | 1,002 (87.1%) | 904 (87.2%) |
| 75 Years and over | 627 (95.1%) | 551 (92.4%) |
| Total | 10,775 (91.4%) | 9,811 (88.5%) |
Income Below Poverty Among Married-Couple Families in Fernley
The poverty statistics for married-couple families in Fernley show that 5.0% or 226 of the total 4,568 families live below the poverty line. Families with 5 or more children have the highest poverty rate of 35.9%, comprising of 14 families. On the other hand, families with 1 or 2 children have the lowest poverty rate of 1.6%, which includes 25 families.
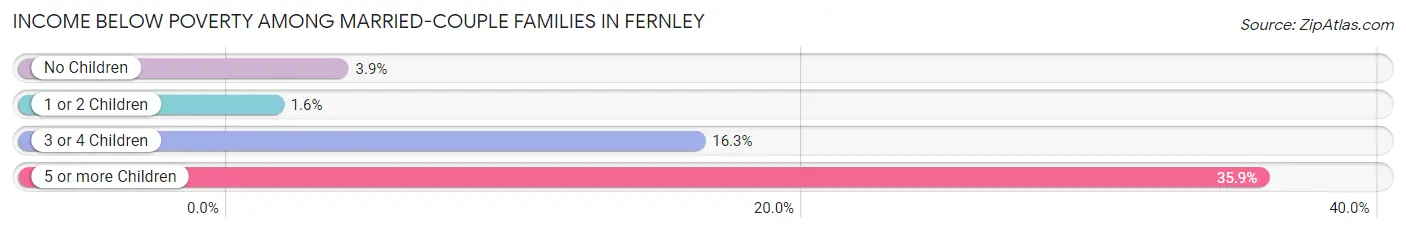
| Children | Above Poverty | Below Poverty |
| No Children | 2,272 (96.2%) | 91 (3.8%) |
| 1 or 2 Children | 1,551 (98.4%) | 25 (1.6%) |
| 3 or 4 Children | 494 (83.7%) | 96 (16.3%) |
| 5 or more Children | 25 (64.1%) | 14 (35.9%) |
| Total | 4,342 (95.1%) | 226 (5.0%) |
Income Below Poverty Among Single-Parent Households in Fernley
According to the poverty data in Fernley, 17.0% or 96 single-father households and 14.2% or 116 single-mother households are living below the poverty line. Among single-father households, those with 5 or more children have the highest poverty rate, with 9 households (100.0%) experiencing poverty. Likewise, among single-mother households, those with no children have the highest poverty rate, with 36 households (16.3%) falling below the poverty line.
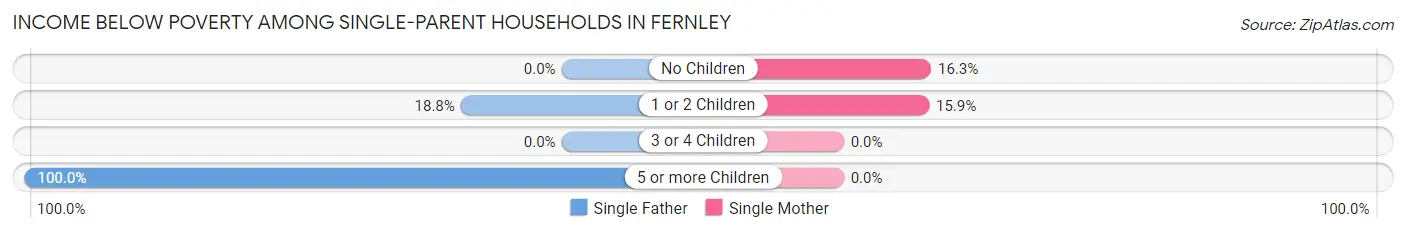
| Children | Single Father | Single Mother |
| No Children | 0 (0.0%) | 36 (16.3%) |
| 1 or 2 Children | 87 (18.8%) | 80 (15.9%) |
| 3 or 4 Children | 0 (0.0%) | 0 (0.0%) |
| 5 or more Children | 9 (100.0%) | 0 (0.0%) |
| Total | 96 (17.0%) | 116 (14.2%) |
Income Below Poverty Among Married-Couple vs Single-Parent Households in Fernley
The poverty data for Fernley shows that 226 of the married-couple family households (5.0%) and 212 of the single-parent households (15.3%) are living below the poverty level. Within the married-couple family households, those with 5 or more children have the highest poverty rate, with 14 households (35.9%) falling below the poverty line. Among the single-parent households, those with 5 or more children have the highest poverty rate, with 9 household (100.0%) living below poverty.
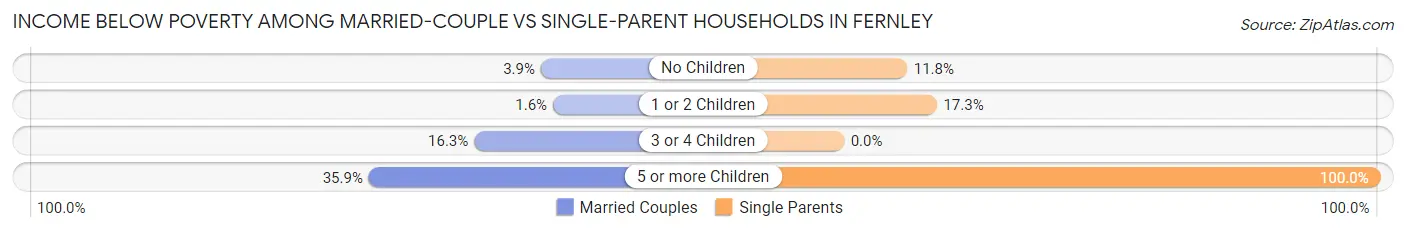
| Children | Married-Couple Families | Single-Parent Households |
| No Children | 91 (3.8%) | 36 (11.8%) |
| 1 or 2 Children | 25 (1.6%) | 167 (17.3%) |
| 3 or 4 Children | 96 (16.3%) | 0 (0.0%) |
| 5 or more Children | 14 (35.9%) | 9 (100.0%) |
| Total | 226 (5.0%) | 212 (15.3%) |
Race in Fernley
The most populous races in Fernley are White / Caucasian (18,303 | 79.5%), Hispanic or Latino (4,132 | 17.9%), and Two or more Races (2,452 | 10.6%).
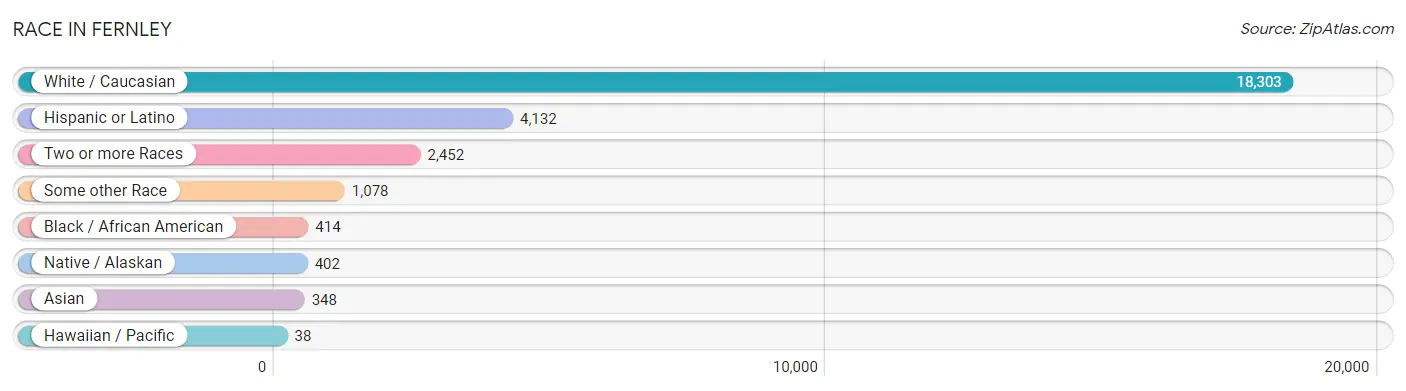
| Race | # Population | % Population |
| Asian | 348 | 1.5% |
| Black / African American | 414 | 1.8% |
| Hawaiian / Pacific | 38 | 0.2% |
| Hispanic or Latino | 4,132 | 17.9% |
| Native / Alaskan | 402 | 1.8% |
| White / Caucasian | 18,303 | 79.5% |
| Two or more Races | 2,452 | 10.6% |
| Some other Race | 1,078 | 4.7% |
| Total | 23,035 | 100.0% |
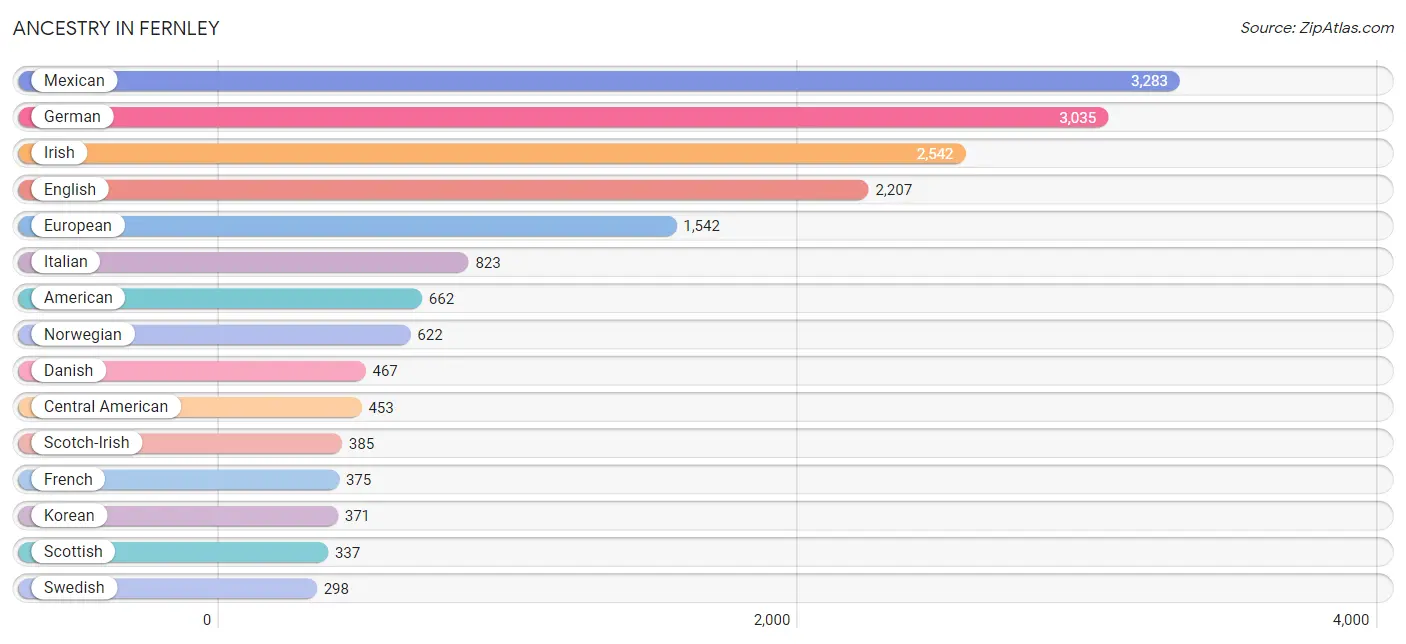
Ancestry in Fernley
The most populous ancestries reported in Fernley are Mexican (3,283 | 14.2%), German (3,035 | 13.2%), Irish (2,542 | 11.0%), English (2,207 | 9.6%), and European (1,542 | 6.7%), together accounting for 54.7% of all Fernley residents.
| Ancestry | # Population | % Population |
| African | 23 | 0.1% |
| Alaska Native | 11 | 0.1% |
| Alsatian | 8 | 0.0% |
| American | 662 | 2.9% |
| Arab | 48 | 0.2% |
| Argentinean | 22 | 0.1% |
| Austrian | 30 | 0.1% |
| Basque | 5 | 0.0% |
| Bhutanese | 62 | 0.3% |
| Blackfeet | 15 | 0.1% |
| British | 50 | 0.2% |
| Burmese | 240 | 1.0% |
| Cambodian | 23 | 0.1% |
| Canadian | 45 | 0.2% |
| Central American | 453 | 2.0% |
| Central American Indian | 11 | 0.1% |
| Cherokee | 106 | 0.5% |
| Chickasaw | 221 | 1.0% |
| Choctaw | 86 | 0.4% |
| Comanche | 3 | 0.0% |
| Czech | 62 | 0.3% |
| Czechoslovakian | 46 | 0.2% |
| Danish | 467 | 2.0% |
| Delaware | 53 | 0.2% |
| Dominican | 48 | 0.2% |
| Dutch | 251 | 1.1% |
| Eastern European | 119 | 0.5% |
| English | 2,207 | 9.6% |
| Estonian | 60 | 0.3% |
| European | 1,542 | 6.7% |
| French | 375 | 1.6% |
| French Canadian | 95 | 0.4% |
| German | 3,035 | 13.2% |
| Greek | 85 | 0.4% |
| Guatemalan | 172 | 0.7% |
| Hungarian | 31 | 0.1% |
| Indian (Asian) | 104 | 0.4% |
| Irish | 2,542 | 11.0% |
| Iroquois | 10 | 0.0% |
| Italian | 823 | 3.6% |
| Jamaican | 36 | 0.2% |
| Korean | 371 | 1.6% |
| Lebanese | 31 | 0.1% |
| Mexican | 3,283 | 14.2% |
| Mexican American Indian | 91 | 0.4% |
| Native Hawaiian | 56 | 0.2% |
| Navajo | 25 | 0.1% |
| Nicaraguan | 96 | 0.4% |
| Northern European | 37 | 0.2% |
| Norwegian | 622 | 2.7% |
| Paiute | 178 | 0.8% |
| Polish | 284 | 1.2% |
| Portuguese | 271 | 1.2% |
| Puerto Rican | 165 | 0.7% |
| Russian | 82 | 0.4% |
| Salvadoran | 185 | 0.8% |
| Samoan | 38 | 0.2% |
| Scandinavian | 182 | 0.8% |
| Scotch-Irish | 385 | 1.7% |
| Scottish | 337 | 1.5% |
| Shoshone | 79 | 0.3% |
| Sioux | 86 | 0.4% |
| Slovak | 41 | 0.2% |
| South American | 22 | 0.1% |
| Spaniard | 83 | 0.4% |
| Spanish | 23 | 0.1% |
| Sri Lankan | 9 | 0.0% |
| Subsaharan African | 23 | 0.1% |
| Swedish | 298 | 1.3% |
| Swiss | 77 | 0.3% |
| Thai | 31 | 0.1% |
| Tlingit-Haida | 2 | 0.0% |
| Welsh | 141 | 0.6% |
| Yugoslavian | 125 | 0.5% | View All 74 Rows |
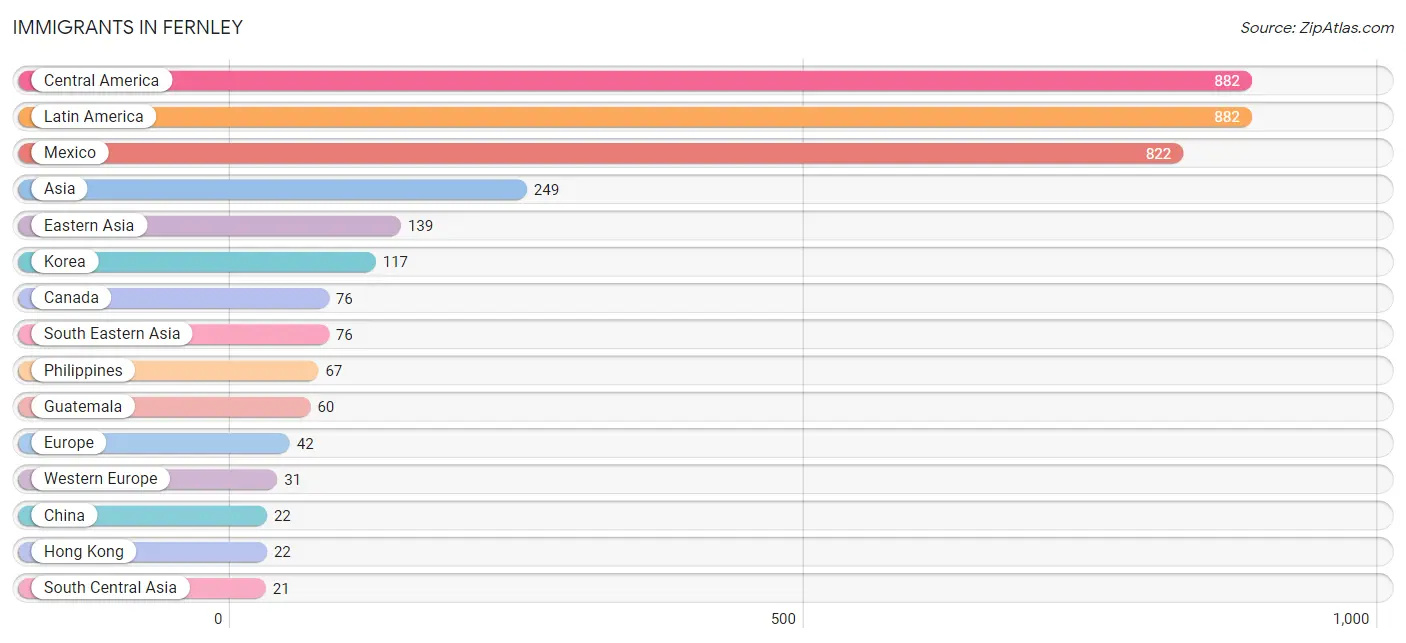
Immigrants in Fernley
The most numerous immigrant groups reported in Fernley came from Central America (882 | 3.8%), Latin America (882 | 3.8%), Mexico (822 | 3.6%), Asia (249 | 1.1%), and Eastern Asia (139 | 0.6%), together accounting for 12.9% of all Fernley residents.
| Immigration Origin | # Population | % Population |
| Armenia | 13 | 0.1% |
| Asia | 249 | 1.1% |
| Belarus | 11 | 0.1% |
| Canada | 76 | 0.3% |
| Central America | 882 | 3.8% |
| China | 22 | 0.1% |
| Eastern Asia | 139 | 0.6% |
| Eastern Europe | 11 | 0.1% |
| Europe | 42 | 0.2% |
| France | 15 | 0.1% |
| Germany | 16 | 0.1% |
| Guatemala | 60 | 0.3% |
| Hong Kong | 22 | 0.1% |
| India | 8 | 0.0% |
| Korea | 117 | 0.5% |
| Latin America | 882 | 3.8% |
| Mexico | 822 | 3.6% |
| Pakistan | 13 | 0.1% |
| Philippines | 67 | 0.3% |
| South Central Asia | 21 | 0.1% |
| South Eastern Asia | 76 | 0.3% |
| Vietnam | 9 | 0.0% |
| Western Asia | 13 | 0.1% |
| Western Europe | 31 | 0.1% | View All 24 Rows |
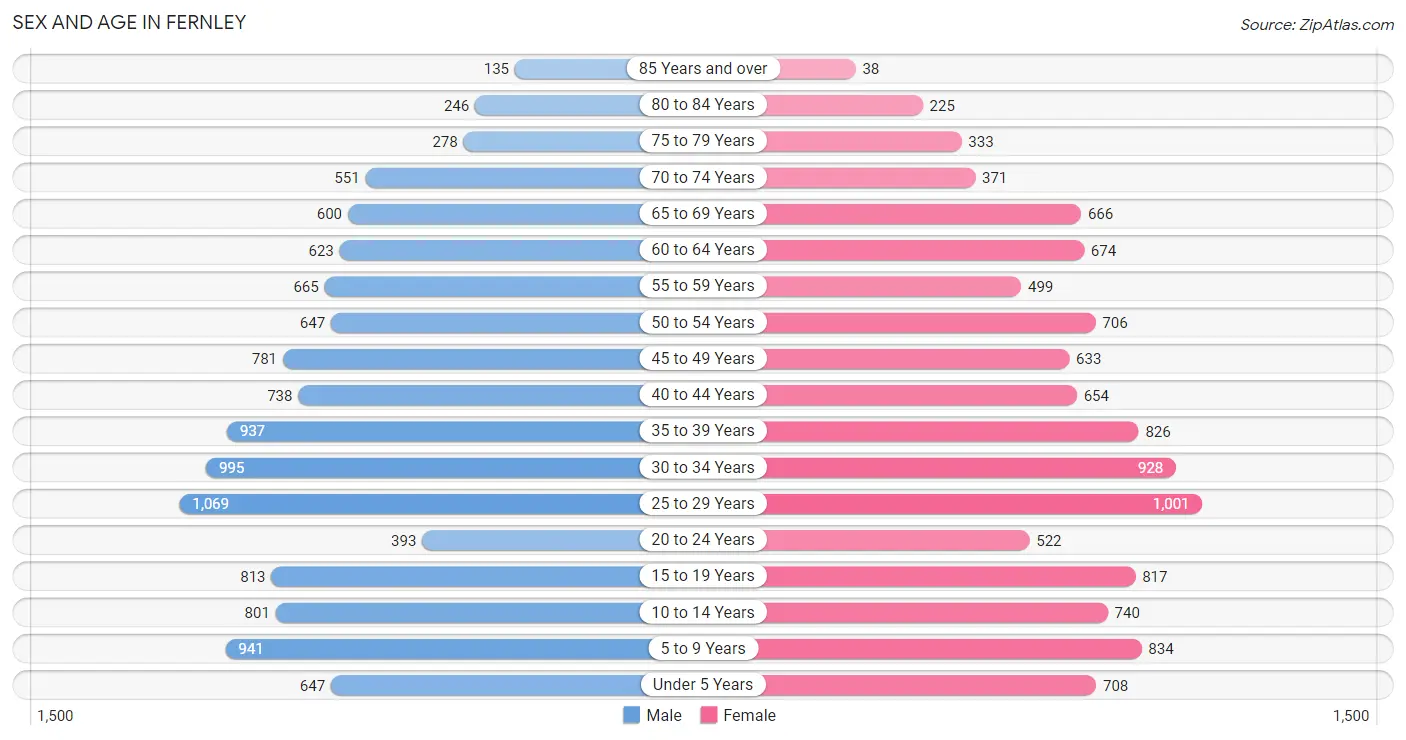
Sex and Age in Fernley
Sex and Age in Fernley
The most populous age groups in Fernley are 25 to 29 Years (1,069 | 9.0%) for men and 25 to 29 Years (1,001 | 9.0%) for women.
| Age Bracket | Male | Female |
| Under 5 Years | 647 (5.5%) | 708 (6.3%) |
| 5 to 9 Years | 941 (7.9%) | 834 (7.5%) |
| 10 to 14 Years | 801 (6.8%) | 740 (6.6%) |
| 15 to 19 Years | 813 (6.9%) | 817 (7.3%) |
| 20 to 24 Years | 393 (3.3%) | 522 (4.7%) |
| 25 to 29 Years | 1,069 (9.0%) | 1,001 (9.0%) |
| 30 to 34 Years | 995 (8.4%) | 928 (8.3%) |
| 35 to 39 Years | 937 (7.9%) | 826 (7.4%) |
| 40 to 44 Years | 738 (6.2%) | 654 (5.9%) |
| 45 to 49 Years | 781 (6.6%) | 633 (5.7%) |
| 50 to 54 Years | 647 (5.5%) | 706 (6.3%) |
| 55 to 59 Years | 665 (5.6%) | 499 (4.5%) |
| 60 to 64 Years | 623 (5.2%) | 674 (6.0%) |
| 65 to 69 Years | 600 (5.1%) | 666 (6.0%) |
| 70 to 74 Years | 551 (4.6%) | 371 (3.3%) |
| 75 to 79 Years | 278 (2.3%) | 333 (3.0%) |
| 80 to 84 Years | 246 (2.1%) | 225 (2.0%) |
| 85 Years and over | 135 (1.1%) | 38 (0.3%) |
| Total | 11,860 (100.0%) | 11,175 (100.0%) |
Families and Households in Fernley
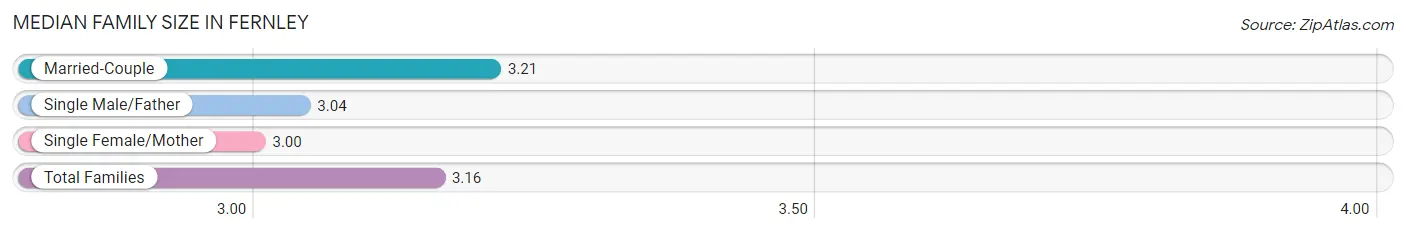
Median Family Size in Fernley
The median family size in Fernley is 3.16 persons per family, with married-couple families (4,568 | 76.8%) accounting for the largest median family size of 3.21 persons per family. On the other hand, single female/mother families (818 | 13.8%) represent the smallest median family size with 3.00 persons per family.
| Family Type | # Families | Family Size |
| Married-Couple | 4,568 (76.8%) | 3.21 |
| Single Male/Father | 565 (9.5%) | 3.04 |
| Single Female/Mother | 818 (13.8%) | 3.00 |
| Total Families | 5,951 (100.0%) | 3.16 |
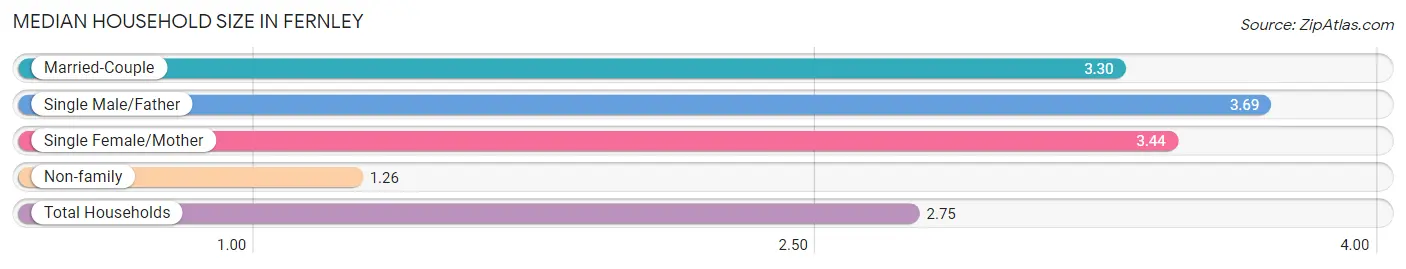
Median Household Size in Fernley
The median household size in Fernley is 2.75 persons per household, with single male/father households (565 | 6.7%) accounting for the largest median household size of 3.69 persons per household. non-family households (2,440 | 29.1%) represent the smallest median household size with 1.26 persons per household.
| Household Type | # Households | Household Size |
| Married-Couple | 4,568 (54.4%) | 3.30 |
| Single Male/Father | 565 (6.7%) | 3.69 |
| Single Female/Mother | 818 (9.8%) | 3.44 |
| Non-family | 2,440 (29.1%) | 1.26 |
| Total Households | 8,391 (100.0%) | 2.75 |
Household Size by Marriage Status in Fernley
Out of a total of 8,391 households in Fernley, 5,951 (70.9%) are family households, while 2,440 (29.1%) are nonfamily households. The most numerous type of family households are 2-person households, comprising 2,230, and the most common type of nonfamily households are 1-person households, comprising 1,751.
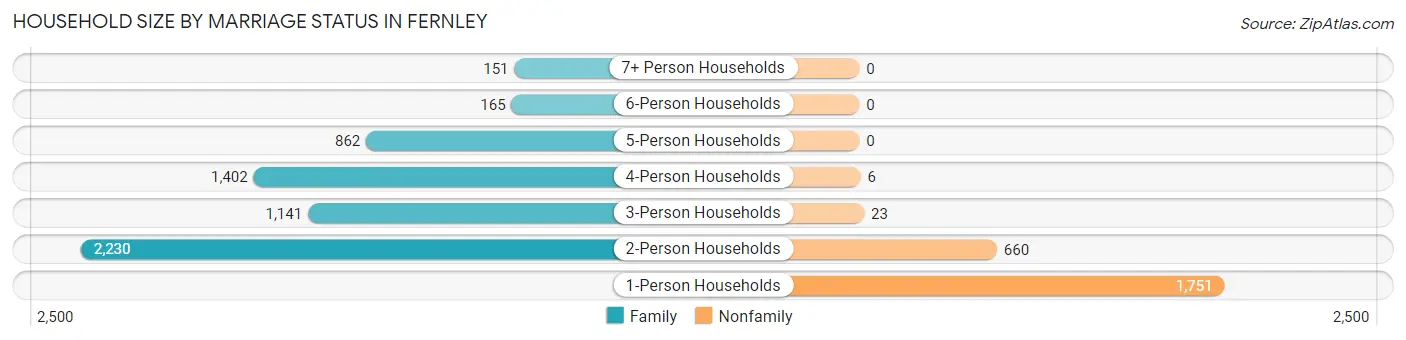
| Household Size | Family Households | Nonfamily Households |
| 1-Person Households | - | 1,751 (20.9%) |
| 2-Person Households | 2,230 (26.6%) | 660 (7.9%) |
| 3-Person Households | 1,141 (13.6%) | 23 (0.3%) |
| 4-Person Households | 1,402 (16.7%) | 6 (0.1%) |
| 5-Person Households | 862 (10.3%) | 0 (0.0%) |
| 6-Person Households | 165 (2.0%) | 0 (0.0%) |
| 7+ Person Households | 151 (1.8%) | 0 (0.0%) |
| Total | 5,951 (70.9%) | 2,440 (29.1%) |
Female Fertility in Fernley
Fertility by Age in Fernley
Average fertility rate in Fernley is 112.0 births per 1,000 women. Women in the age bracket of 20 to 34 years have the highest fertility rate with 205.0 births per 1,000 women. Women in the age bracket of 20 to 34 years acount for 82.1% of all women with births.
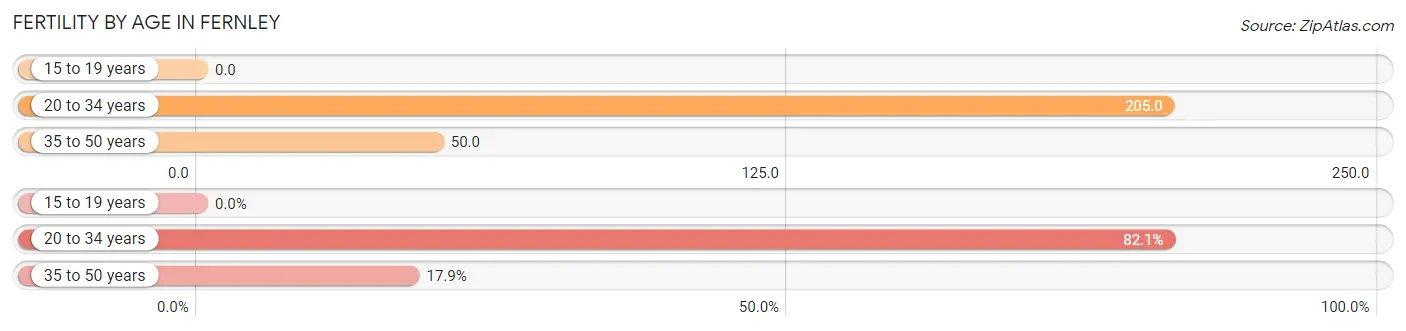
| Age Bracket | Women with Births | Births / 1,000 Women |
| 15 to 19 years | 0 (0.0%) | 0.0 |
| 20 to 34 years | 503 (82.1%) | 205.0 |
| 35 to 50 years | 110 (17.9%) | 50.0 |
| Total | 613 (100.0%) | 112.0 |
Fertility by Age by Marriage Status in Fernley
77.3% of women with births (613) in Fernley are married. The highest percentage of unmarried women with births falls into 20 to 34 years age bracket with 23.9% of them unmarried at the time of birth, while the lowest percentage of unmarried women with births belong to 35 to 50 years age bracket with 17.3% of them unmarried.
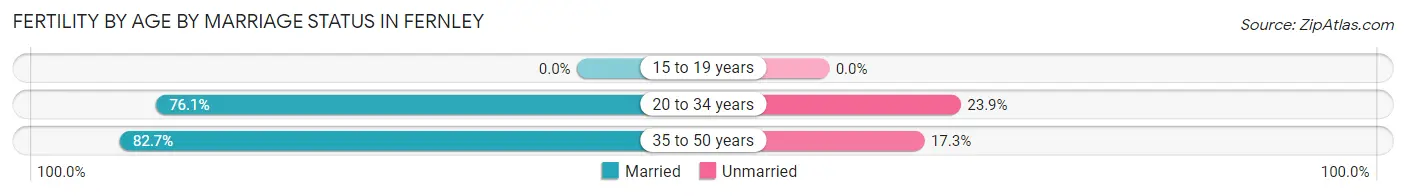
| Age Bracket | Married | Unmarried |
| 15 to 19 years | 0 (0.0%) | 0 (0.0%) |
| 20 to 34 years | 383 (76.1%) | 120 (23.9%) |
| 35 to 50 years | 91 (82.7%) | 19 (17.3%) |
| Total | 474 (77.3%) | 139 (22.7%) |
Fertility by Education in Fernley
Average fertility rate in Fernley is 112.0 births per 1,000 women. Women with the education attainment of bachelor's degree have the highest fertility rate of 161.0 births per 1,000 women, while women with the education attainment of less than high school have the lowest fertility at 19.0 births per 1,000 women. Women with the education attainment of college or associate's degree represent 45.4% of all women with births.
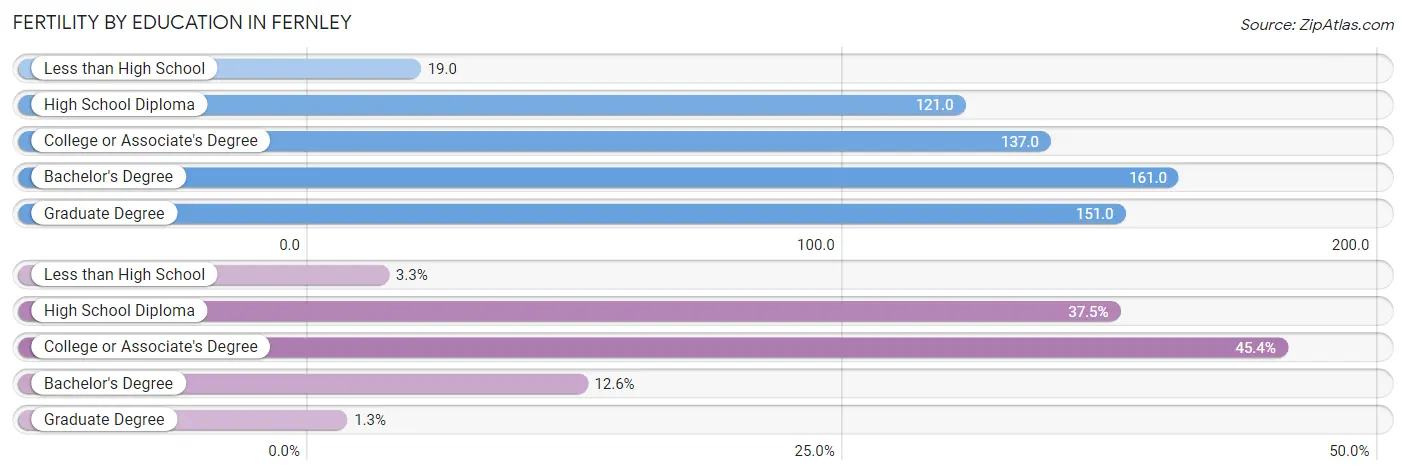
| Educational Attainment | Women with Births | Births / 1,000 Women |
| Less than High School | 20 (3.3%) | 19.0 |
| High School Diploma | 230 (37.5%) | 121.0 |
| College or Associate's Degree | 278 (45.4%) | 137.0 |
| Bachelor's Degree | 77 (12.6%) | 161.0 |
| Graduate Degree | 8 (1.3%) | 151.0 |
| Total | 613 (100.0%) | 112.0 |
Fertility by Education by Marriage Status in Fernley
22.7% of women with births in Fernley are unmarried. Women with the educational attainment of bachelor's degree are most likely to be married with 100.0% of them married at childbirth, while women with the educational attainment of less than high school are least likely to be married with 100.0% of them unmarried at childbirth.
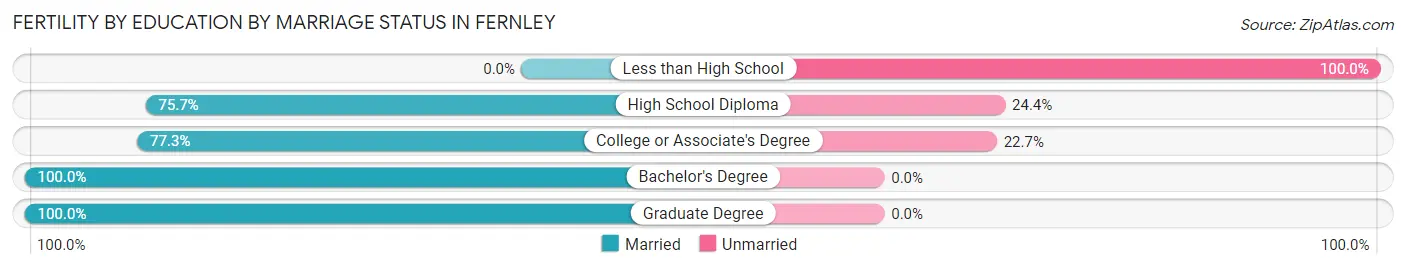
| Educational Attainment | Married | Unmarried |
| Less than High School | 0 (0.0%) | 20 (100.0%) |
| High School Diploma | 174 (75.6%) | 56 (24.3%) |
| College or Associate's Degree | 215 (77.3%) | 63 (22.7%) |
| Bachelor's Degree | 77 (100.0%) | 0 (0.0%) |
| Graduate Degree | 8 (100.0%) | 0 (0.0%) |
| Total | 474 (77.3%) | 139 (22.7%) |
Employment Characteristics in Fernley
Employment by Class of Employer in Fernley
Among the 10,970 employed individuals in Fernley, private company employees (8,358 | 76.2%), local government employees (744 | 6.8%), and state government employees (705 | 6.4%) make up the most common classes of employment.
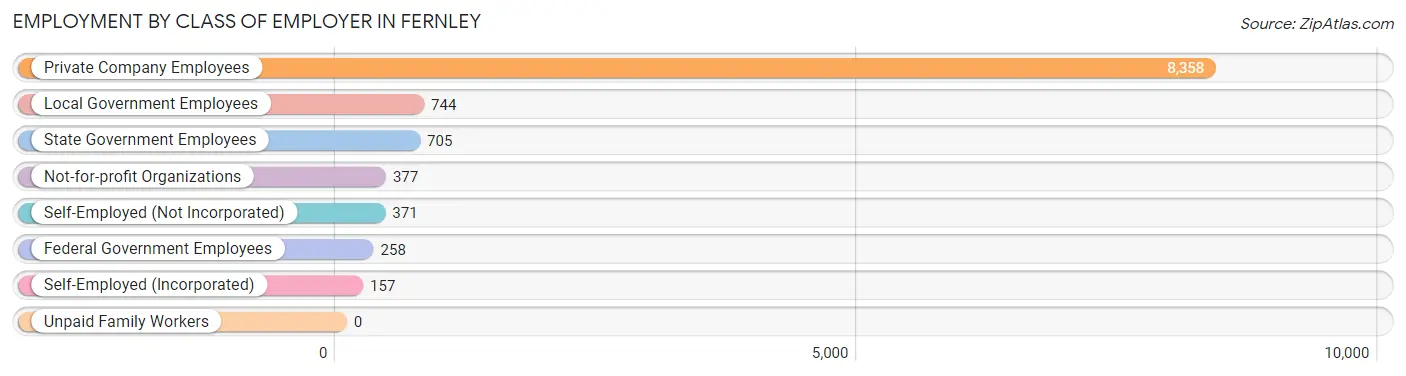
| Employer Class | # Employees | % Employees |
| Private Company Employees | 8,358 | 76.2% |
| Self-Employed (Incorporated) | 157 | 1.4% |
| Self-Employed (Not Incorporated) | 371 | 3.4% |
| Not-for-profit Organizations | 377 | 3.4% |
| Local Government Employees | 744 | 6.8% |
| State Government Employees | 705 | 6.4% |
| Federal Government Employees | 258 | 2.4% |
| Unpaid Family Workers | 0 | 0.0% |
| Total | 10,970 | 100.0% |
Employment Status by Age in Fernley
According to the labor force statistics for Fernley, out of the total population over 16 years of age (18,063), 65.1% or 11,759 individuals are in the labor force, with 4.6% or 541 of them unemployed. The age group with the highest labor force participation rate is 20 to 24 years, with 88.2% or 807 individuals in the labor force. Within the labor force, the 20 to 24 years age range has the highest percentage of unemployed individuals, with 22.1% or 178 of them being unemployed.
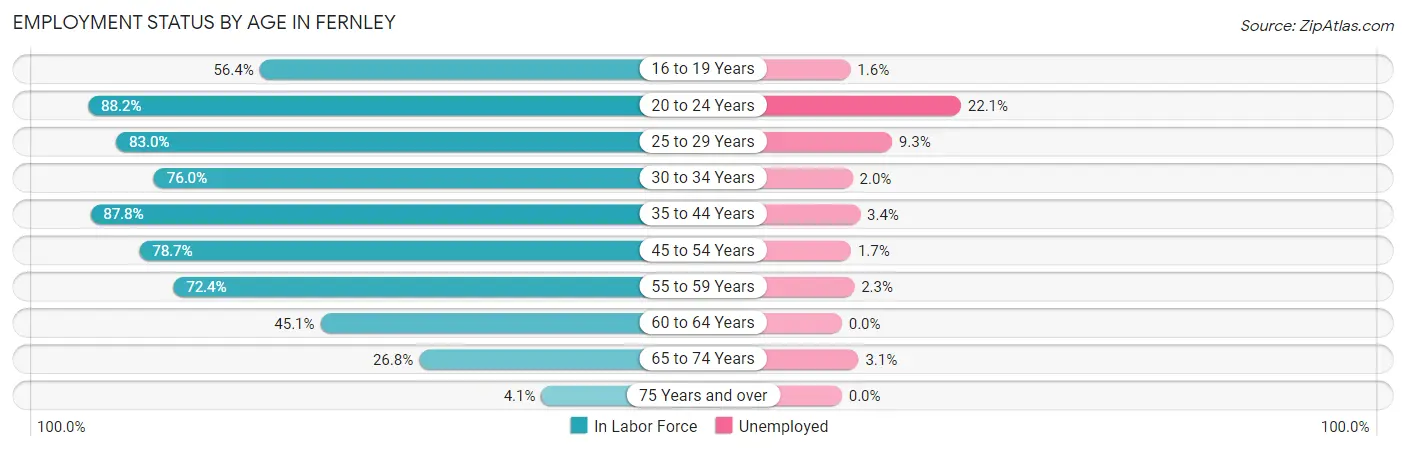
| Age Bracket | In Labor Force | Unemployed |
| 16 to 19 Years | 750 (56.4%) | 12 (1.6%) |
| 20 to 24 Years | 807 (88.2%) | 178 (22.1%) |
| 25 to 29 Years | 1,718 (83.0%) | 160 (9.3%) |
| 30 to 34 Years | 1,461 (76.0%) | 29 (2.0%) |
| 35 to 44 Years | 2,770 (87.8%) | 94 (3.4%) |
| 45 to 54 Years | 2,178 (78.7%) | 37 (1.7%) |
| 55 to 59 Years | 843 (72.4%) | 19 (2.3%) |
| 60 to 64 Years | 585 (45.1%) | 0 (0.0%) |
| 65 to 74 Years | 586 (26.8%) | 18 (3.1%) |
| 75 Years and over | 51 (4.1%) | 0 (0.0%) |
| Total | 11,759 (65.1%) | 541 (4.6%) |
Employment Status by Educational Attainment in Fernley
According to labor force statistics for Fernley, 77.2% of individuals (9,554) out of the total population between 25 and 64 years of age (12,376) are in the labor force, with 3.5% or 334 of them being unemployed. The group with the highest labor force participation rate are those with the educational attainment of bachelor's degree or higher, with 86.9% or 1,389 individuals in the labor force. Within the labor force, individuals with high school diploma education have the highest percentage of unemployment, with 7.3% or 262 of them being unemployed.
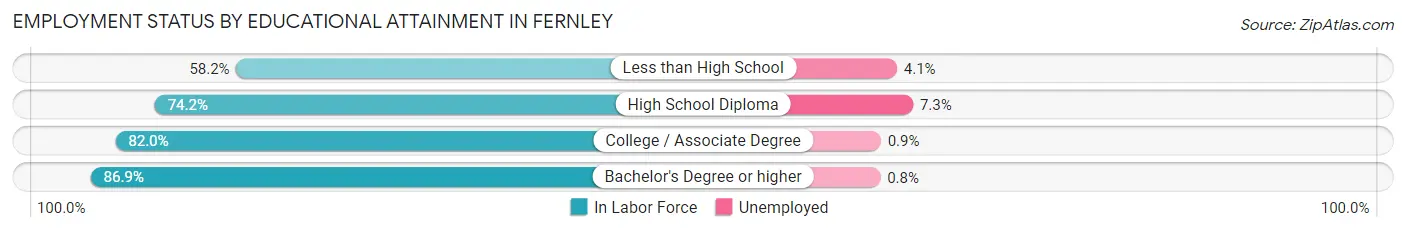
| Educational Attainment | In Labor Force | Unemployed |
| Less than High School | 715 (58.2%) | 50 (4.1%) |
| High School Diploma | 3,585 (74.2%) | 353 (7.3%) |
| College / Associate Degree | 3,869 (82.0%) | 42 (0.9%) |
| Bachelor's Degree or higher | 1,389 (86.9%) | 13 (0.8%) |
| Total | 9,554 (77.2%) | 433 (3.5%) |
Employment Occupations by Sex in Fernley
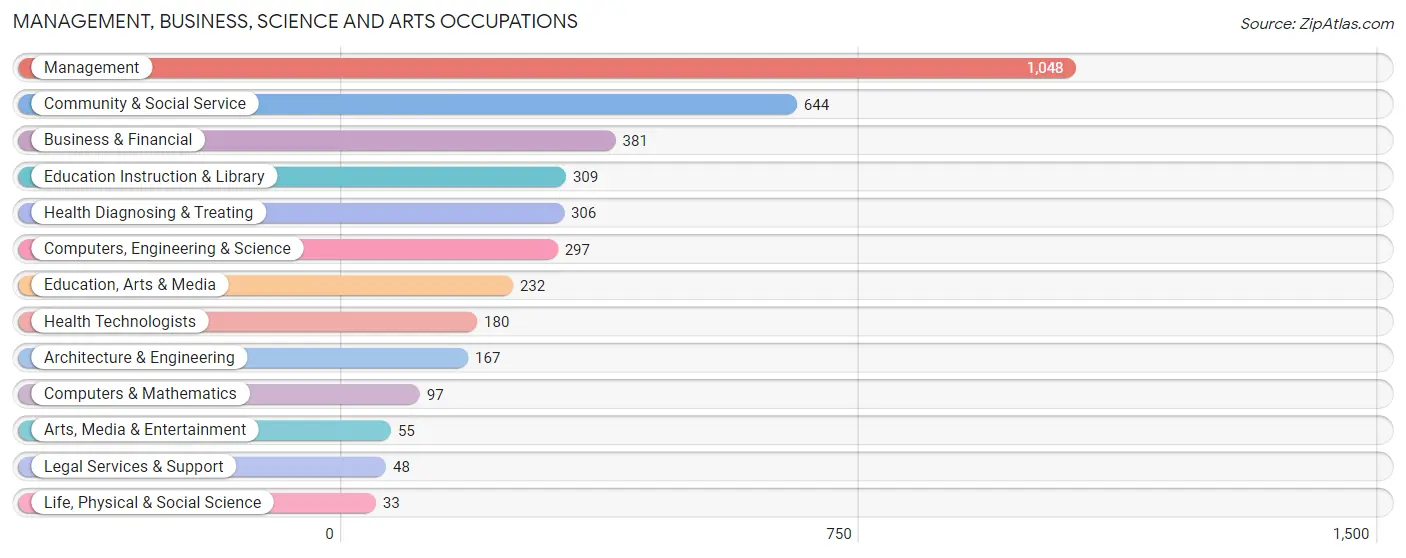
Management, Business, Science and Arts Occupations
The most common Management, Business, Science and Arts occupations in Fernley are Management (1,048 | 9.5%), Community & Social Service (644 | 5.8%), Business & Financial (381 | 3.5%), Education Instruction & Library (309 | 2.8%), and Health Diagnosing & Treating (306 | 2.8%).
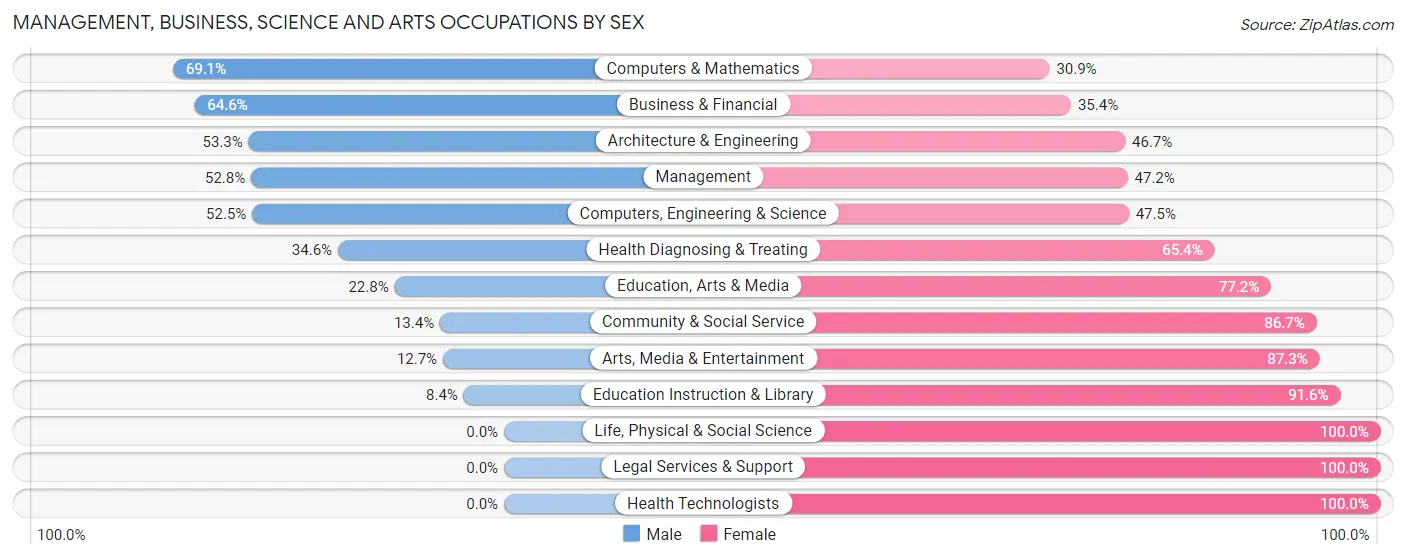
Management, Business, Science and Arts Occupations by Sex
Within the Management, Business, Science and Arts occupations in Fernley, the most male-oriented occupations are Computers & Mathematics (69.1%), Business & Financial (64.6%), and Architecture & Engineering (53.3%), while the most female-oriented occupations are Life, Physical & Social Science (100.0%), Legal Services & Support (100.0%), and Health Technologists (100.0%).
| Occupation | Male | Female |
| Management | 553 (52.8%) | 495 (47.2%) |
| Business & Financial | 246 (64.6%) | 135 (35.4%) |
| Computers, Engineering & Science | 156 (52.5%) | 141 (47.5%) |
| Computers & Mathematics | 67 (69.1%) | 30 (30.9%) |
| Architecture & Engineering | 89 (53.3%) | 78 (46.7%) |
| Life, Physical & Social Science | 0 (0.0%) | 33 (100.0%) |
| Community & Social Service | 86 (13.4%) | 558 (86.7%) |
| Education, Arts & Media | 53 (22.8%) | 179 (77.2%) |
| Legal Services & Support | 0 (0.0%) | 48 (100.0%) |
| Education Instruction & Library | 26 (8.4%) | 283 (91.6%) |
| Arts, Media & Entertainment | 7 (12.7%) | 48 (87.3%) |
| Health Diagnosing & Treating | 106 (34.6%) | 200 (65.4%) |
| Health Technologists | 0 (0.0%) | 180 (100.0%) |
| Total (Category) | 1,147 (42.9%) | 1,529 (57.1%) |
| Total (Overall) | 6,131 (55.5%) | 4,911 (44.5%) |
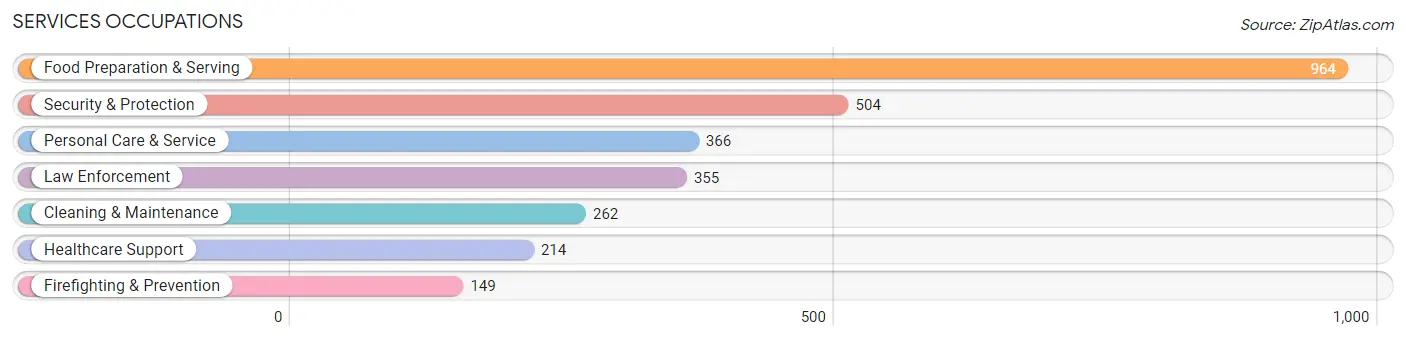
Services Occupations
The most common Services occupations in Fernley are Food Preparation & Serving (964 | 8.7%), Security & Protection (504 | 4.6%), Personal Care & Service (366 | 3.3%), Law Enforcement (355 | 3.2%), and Cleaning & Maintenance (262 | 2.4%).
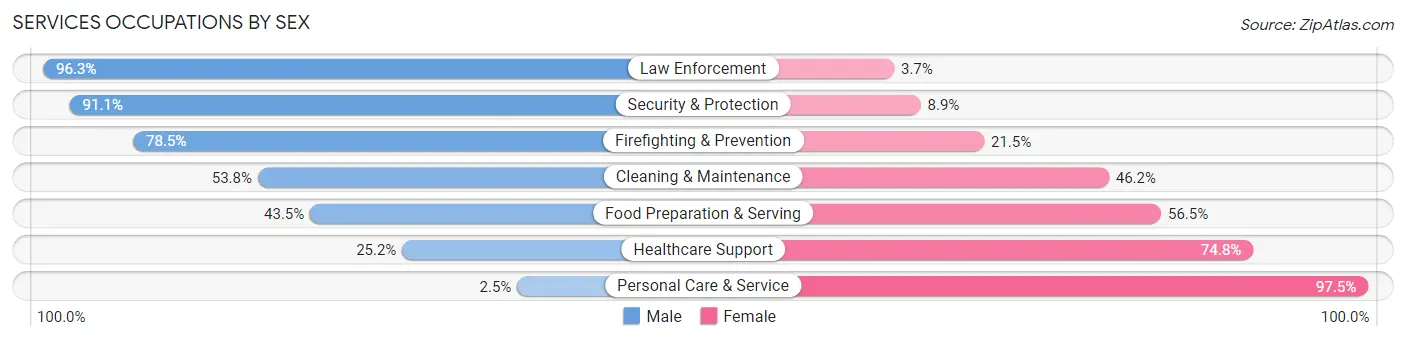
Services Occupations by Sex
Within the Services occupations in Fernley, the most male-oriented occupations are Law Enforcement (96.3%), Security & Protection (91.1%), and Firefighting & Prevention (78.5%), while the most female-oriented occupations are Personal Care & Service (97.5%), Healthcare Support (74.8%), and Food Preparation & Serving (56.5%).
| Occupation | Male | Female |
| Healthcare Support | 54 (25.2%) | 160 (74.8%) |
| Security & Protection | 459 (91.1%) | 45 (8.9%) |
| Firefighting & Prevention | 117 (78.5%) | 32 (21.5%) |
| Law Enforcement | 342 (96.3%) | 13 (3.7%) |
| Food Preparation & Serving | 419 (43.5%) | 545 (56.5%) |
| Cleaning & Maintenance | 141 (53.8%) | 121 (46.2%) |
| Personal Care & Service | 9 (2.5%) | 357 (97.5%) |
| Total (Category) | 1,082 (46.8%) | 1,228 (53.2%) |
| Total (Overall) | 6,131 (55.5%) | 4,911 (44.5%) |
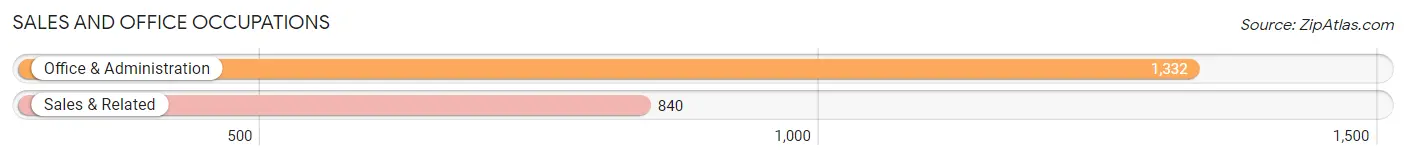
Sales and Office Occupations
The most common Sales and Office occupations in Fernley are Office & Administration (1,332 | 12.1%), and Sales & Related (840 | 7.6%).
Sales and Office Occupations by Sex
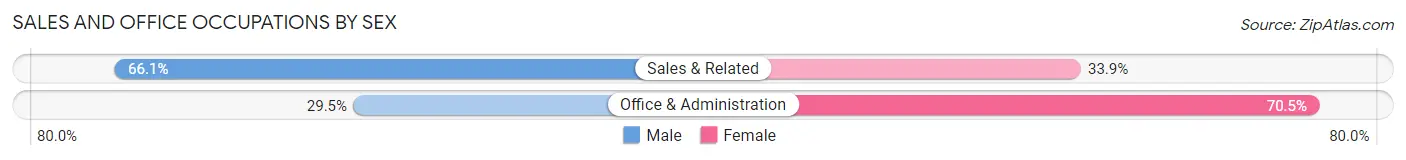
| Occupation | Male | Female |
| Sales & Related | 555 (66.1%) | 285 (33.9%) |
| Office & Administration | 393 (29.5%) | 939 (70.5%) |
| Total (Category) | 948 (43.6%) | 1,224 (56.4%) |
| Total (Overall) | 6,131 (55.5%) | 4,911 (44.5%) |
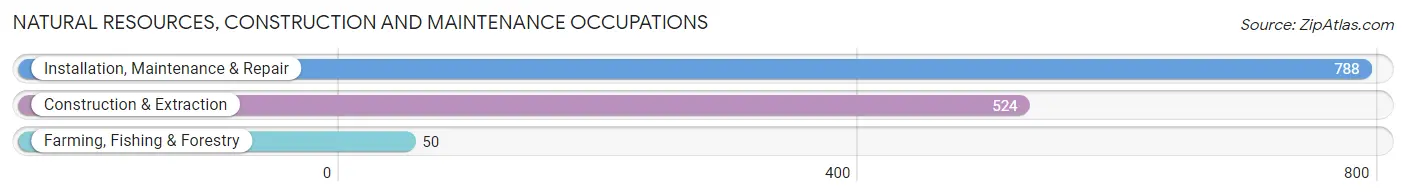
Natural Resources, Construction and Maintenance Occupations
The most common Natural Resources, Construction and Maintenance occupations in Fernley are Installation, Maintenance & Repair (788 | 7.1%), Construction & Extraction (524 | 4.8%), and Farming, Fishing & Forestry (50 | 0.4%).
Natural Resources, Construction and Maintenance Occupations by Sex
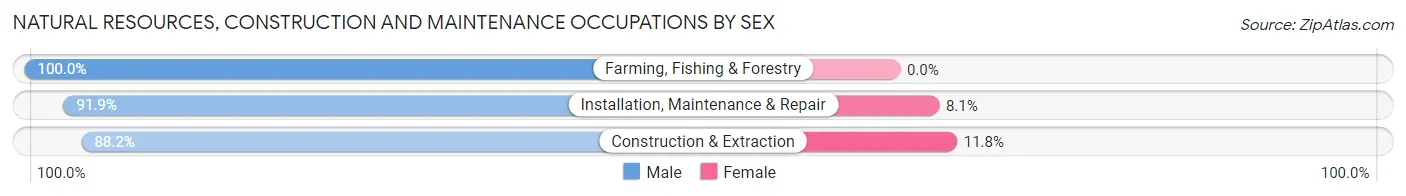
| Occupation | Male | Female |
| Farming, Fishing & Forestry | 50 (100.0%) | 0 (0.0%) |
| Construction & Extraction | 462 (88.2%) | 62 (11.8%) |
| Installation, Maintenance & Repair | 724 (91.9%) | 64 (8.1%) |
| Total (Category) | 1,236 (90.7%) | 126 (9.2%) |
| Total (Overall) | 6,131 (55.5%) | 4,911 (44.5%) |
Production, Transportation and Moving Occupations
The most common Production, Transportation and Moving occupations in Fernley are Production (1,191 | 10.8%), Material Moving (739 | 6.7%), and Transportation (592 | 5.4%).
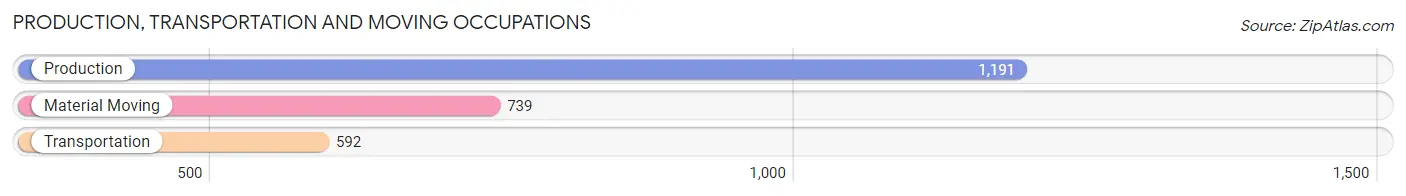
Production, Transportation and Moving Occupations by Sex
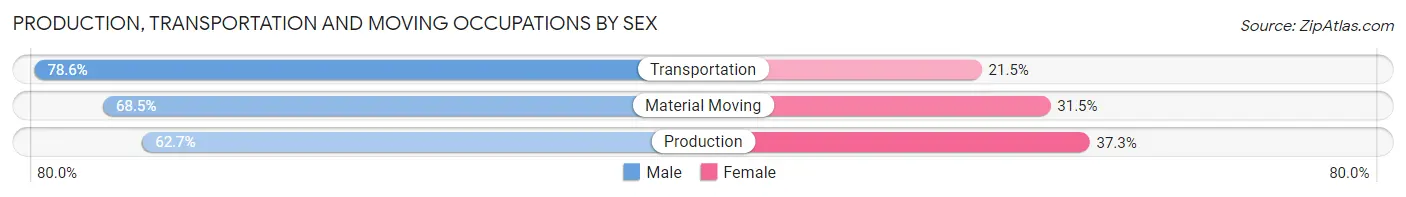
| Occupation | Male | Female |
| Production | 747 (62.7%) | 444 (37.3%) |
| Transportation | 465 (78.5%) | 127 (21.4%) |
| Material Moving | 506 (68.5%) | 233 (31.5%) |
| Total (Category) | 1,718 (68.1%) | 804 (31.9%) |
| Total (Overall) | 6,131 (55.5%) | 4,911 (44.5%) |
Employment Industries by Sex in Fernley
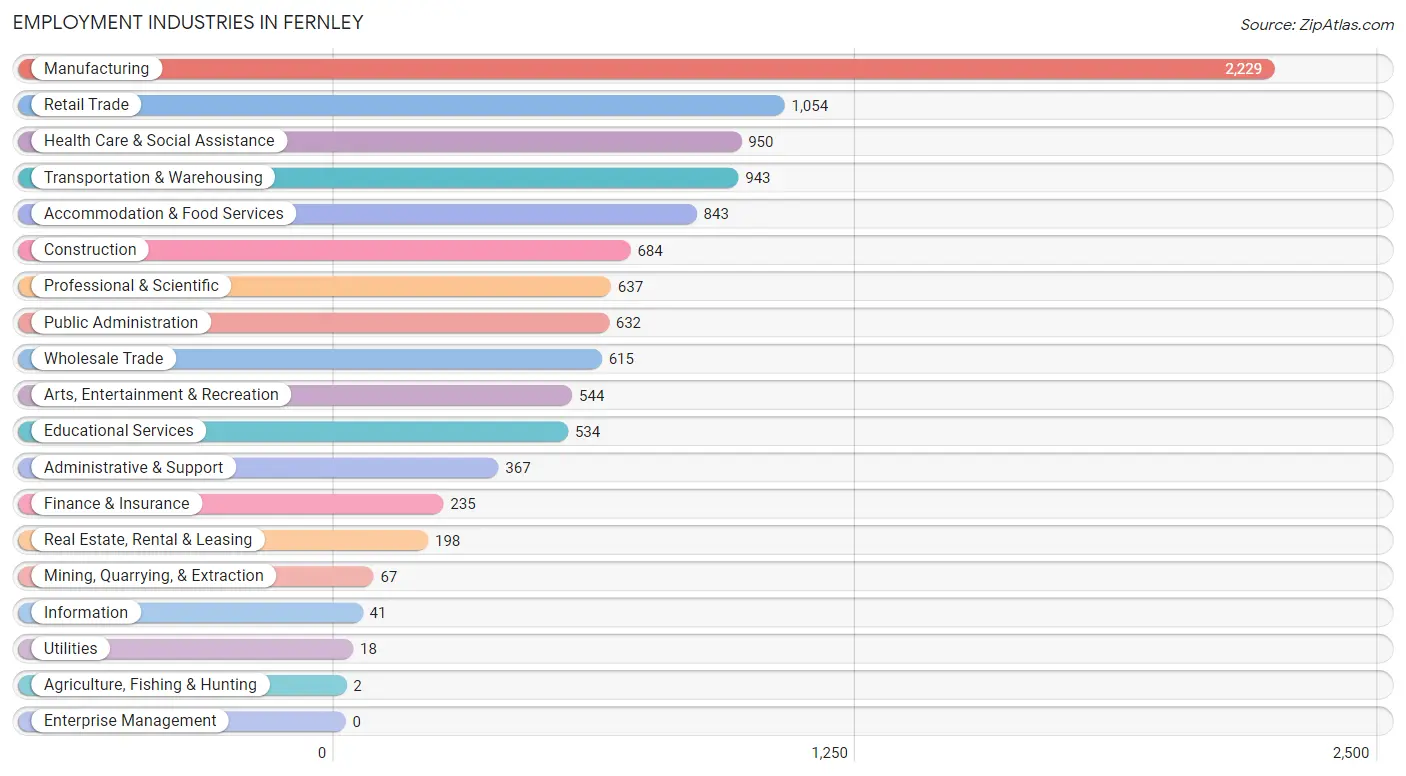
Employment Industries in Fernley
The major employment industries in Fernley include Manufacturing (2,229 | 20.2%), Retail Trade (1,054 | 9.6%), Health Care & Social Assistance (950 | 8.6%), Transportation & Warehousing (943 | 8.5%), and Accommodation & Food Services (843 | 7.6%).
Employment Industries by Sex in Fernley
The Fernley industries that see more men than women are Agriculture, Fishing & Hunting (100.0%), Mining, Quarrying, & Extraction (100.0%), and Utilities (100.0%), whereas the industries that tend to have a higher number of women are Educational Services (90.4%), Health Care & Social Assistance (78.3%), and Professional & Scientific (70.5%).
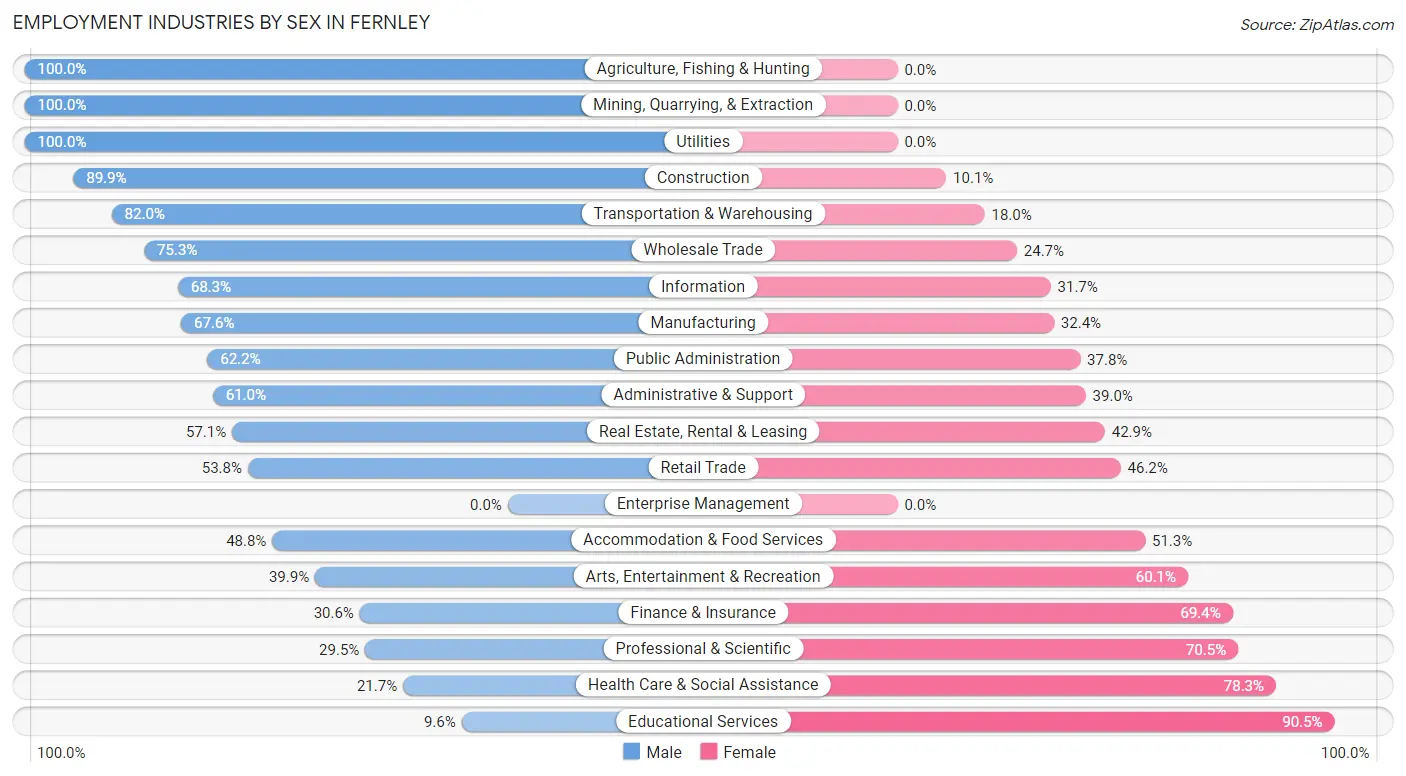
| Industry | Male | Female |
| Agriculture, Fishing & Hunting | 2 (100.0%) | 0 (0.0%) |
| Mining, Quarrying, & Extraction | 67 (100.0%) | 0 (0.0%) |
| Construction | 615 (89.9%) | 69 (10.1%) |
| Manufacturing | 1,507 (67.6%) | 722 (32.4%) |
| Wholesale Trade | 463 (75.3%) | 152 (24.7%) |
| Retail Trade | 567 (53.8%) | 487 (46.2%) |
| Transportation & Warehousing | 773 (82.0%) | 170 (18.0%) |
| Utilities | 18 (100.0%) | 0 (0.0%) |
| Information | 28 (68.3%) | 13 (31.7%) |
| Finance & Insurance | 72 (30.6%) | 163 (69.4%) |
| Real Estate, Rental & Leasing | 113 (57.1%) | 85 (42.9%) |
| Professional & Scientific | 188 (29.5%) | 449 (70.5%) |
| Enterprise Management | 0 (0.0%) | 0 (0.0%) |
| Administrative & Support | 224 (61.0%) | 143 (39.0%) |
| Educational Services | 51 (9.6%) | 483 (90.4%) |
| Health Care & Social Assistance | 206 (21.7%) | 744 (78.3%) |
| Arts, Entertainment & Recreation | 217 (39.9%) | 327 (60.1%) |
| Accommodation & Food Services | 411 (48.7%) | 432 (51.2%) |
| Public Administration | 393 (62.2%) | 239 (37.8%) |
| Total | 6,131 (55.5%) | 4,911 (44.5%) |
Education in Fernley
School Enrollment in Fernley
The most common levels of schooling among the 5,570 students in Fernley are elementary school (1,389 | 24.9%), middle school (1,263 | 22.7%), and high school (1,193 | 21.4%).
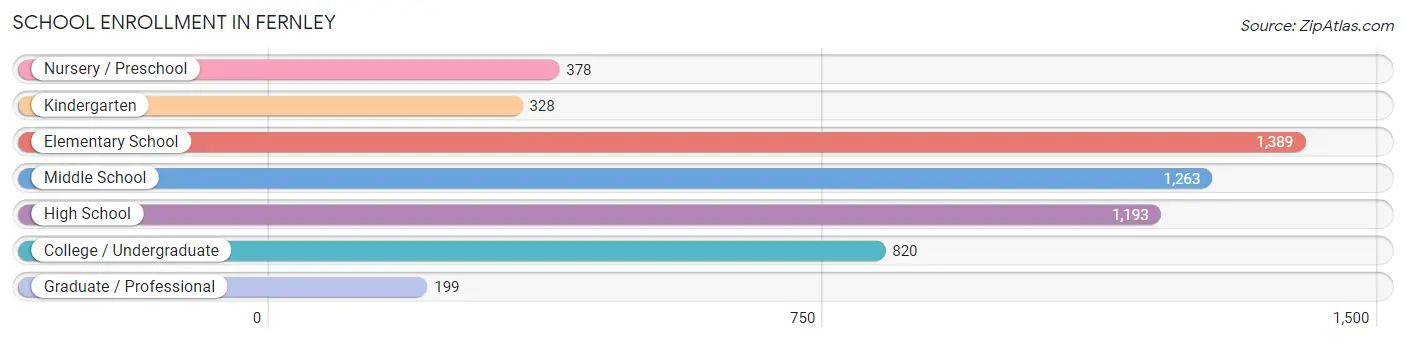
| School Level | # Students | % Students |
| Nursery / Preschool | 378 | 6.8% |
| Kindergarten | 328 | 5.9% |
| Elementary School | 1,389 | 24.9% |
| Middle School | 1,263 | 22.7% |
| High School | 1,193 | 21.4% |
| College / Undergraduate | 820 | 14.7% |
| Graduate / Professional | 199 | 3.6% |
| Total | 5,570 | 100.0% |
School Enrollment by Age by Funding Source in Fernley
Out of a total of 5,570 students who are enrolled in schools in Fernley, 317 (5.7%) attend a private institution, while the remaining 5,253 (94.3%) are enrolled in public schools. The age group of 3 to 4 year olds has the highest likelihood of being enrolled in private schools, with 134 (49.3% in the age bracket) enrolled. Conversely, the age group of 15 to 17 year olds has the lowest likelihood of being enrolled in a private school, with 879 (99.0% in the age bracket) attending a public institution.
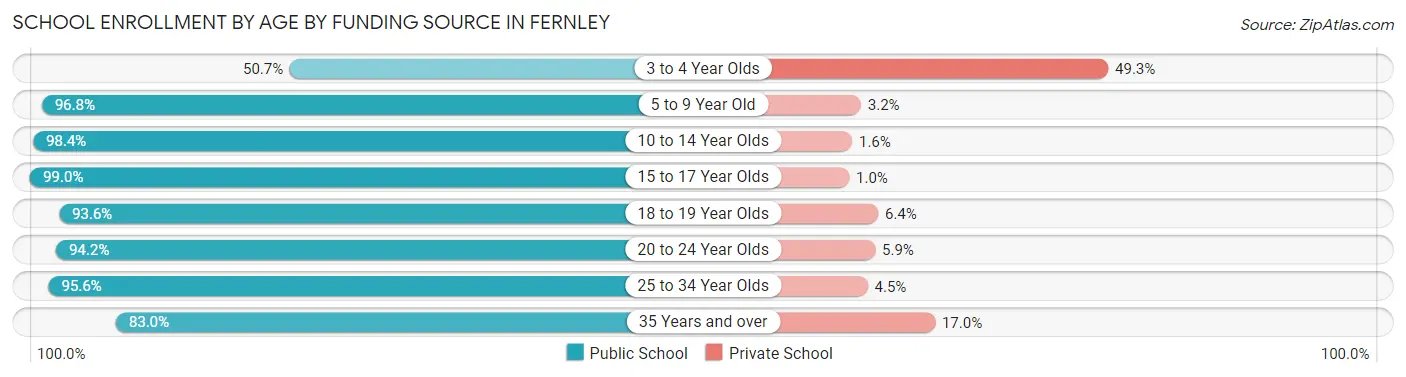
| Age Bracket | Public School | Private School |
| 3 to 4 Year Olds | 138 (50.7%) | 134 (49.3%) |
| 5 to 9 Year Old | 1,544 (96.8%) | 51 (3.2%) |
| 10 to 14 Year Olds | 1,515 (98.4%) | 24 (1.6%) |
| 15 to 17 Year Olds | 879 (99.0%) | 9 (1.0%) |
| 18 to 19 Year Olds | 307 (93.6%) | 21 (6.4%) |
| 20 to 24 Year Olds | 177 (94.2%) | 11 (5.9%) |
| 25 to 34 Year Olds | 451 (95.6%) | 21 (4.4%) |
| 35 Years and over | 239 (83.0%) | 49 (17.0%) |
| Total | 5,253 (94.3%) | 317 (5.7%) |
Educational Attainment by Field of Study in Fernley
Business (594 | 22.8%), education (317 | 12.2%), social sciences (293 | 11.3%), arts & humanities (278 | 10.7%), and bio, nature & agricultural (233 | 9.0%) are the most common fields of study among 2,601 individuals in Fernley who have obtained a bachelor's degree or higher.
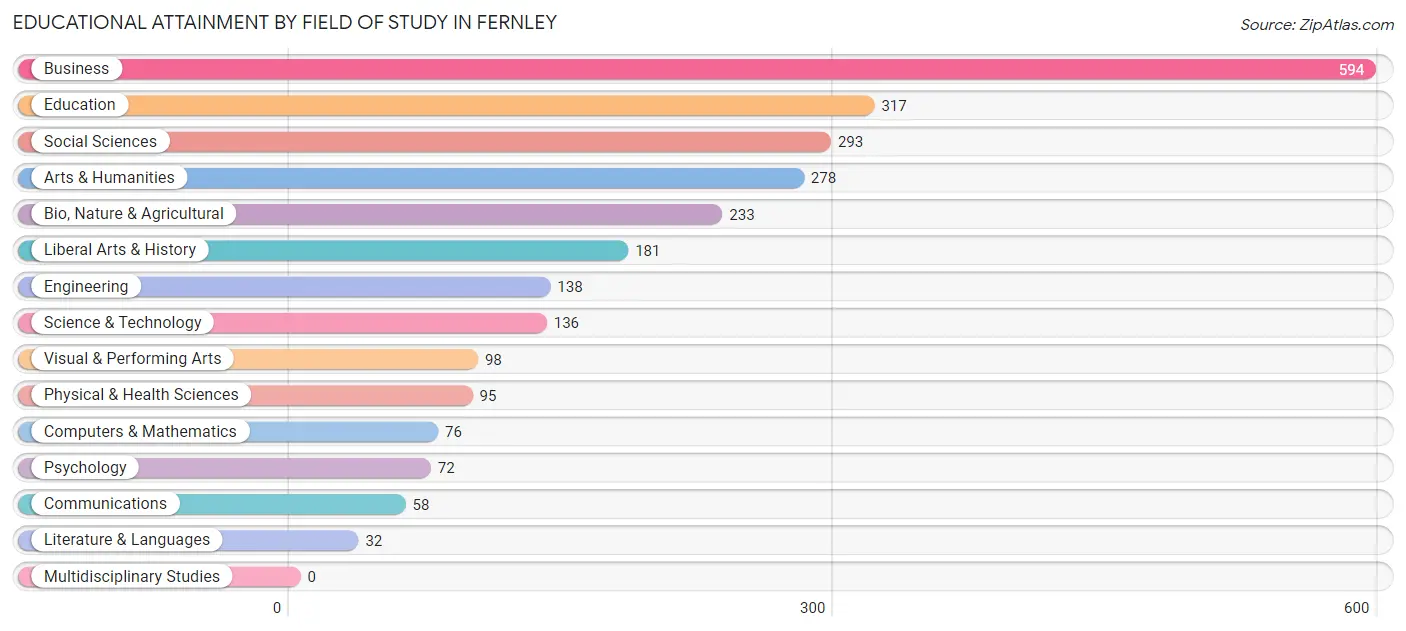
| Field of Study | # Graduates | % Graduates |
| Computers & Mathematics | 76 | 2.9% |
| Bio, Nature & Agricultural | 233 | 9.0% |
| Physical & Health Sciences | 95 | 3.6% |
| Psychology | 72 | 2.8% |
| Social Sciences | 293 | 11.3% |
| Engineering | 138 | 5.3% |
| Multidisciplinary Studies | 0 | 0.0% |
| Science & Technology | 136 | 5.2% |
| Business | 594 | 22.8% |
| Education | 317 | 12.2% |
| Literature & Languages | 32 | 1.2% |
| Liberal Arts & History | 181 | 7.0% |
| Visual & Performing Arts | 98 | 3.8% |
| Communications | 58 | 2.2% |
| Arts & Humanities | 278 | 10.7% |
| Total | 2,601 | 100.0% |
Transportation & Commute in Fernley
Vehicle Availability by Sex in Fernley
The most prevalent vehicle ownership categories in Fernley are males with 2 vehicles (2,512, accounting for 40.3%) and females with 2 vehicles (1,493, making up 53.0%).
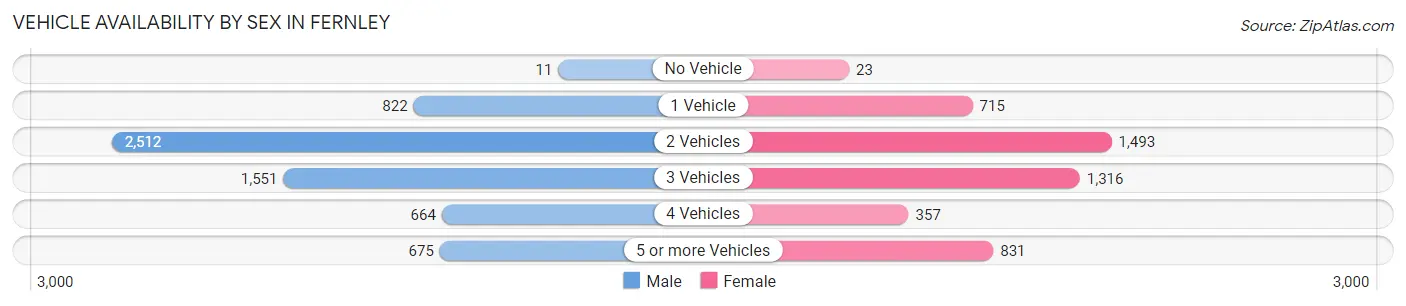
| Vehicles Available | Male | Female |
| No Vehicle | 11 (0.2%) | 23 (0.5%) |
| 1 Vehicle | 822 (13.2%) | 715 (15.1%) |
| 2 Vehicles | 2,512 (40.3%) | 1,493 (31.5%) |
| 3 Vehicles | 1,551 (24.9%) | 1,316 (27.8%) |
| 4 Vehicles | 664 (10.6%) | 357 (7.5%) |
| 5 or more Vehicles | 675 (10.8%) | 831 (17.5%) |
| Total | 6,235 (100.0%) | 4,735 (100.0%) |
Commute Time in Fernley
The most frequently occuring commute durations in Fernley are 30 to 34 minutes (1,482 commuters, 14.2%), 10 to 14 minutes (1,473 commuters, 14.1%), and 5 to 9 minutes (1,338 commuters, 12.8%).
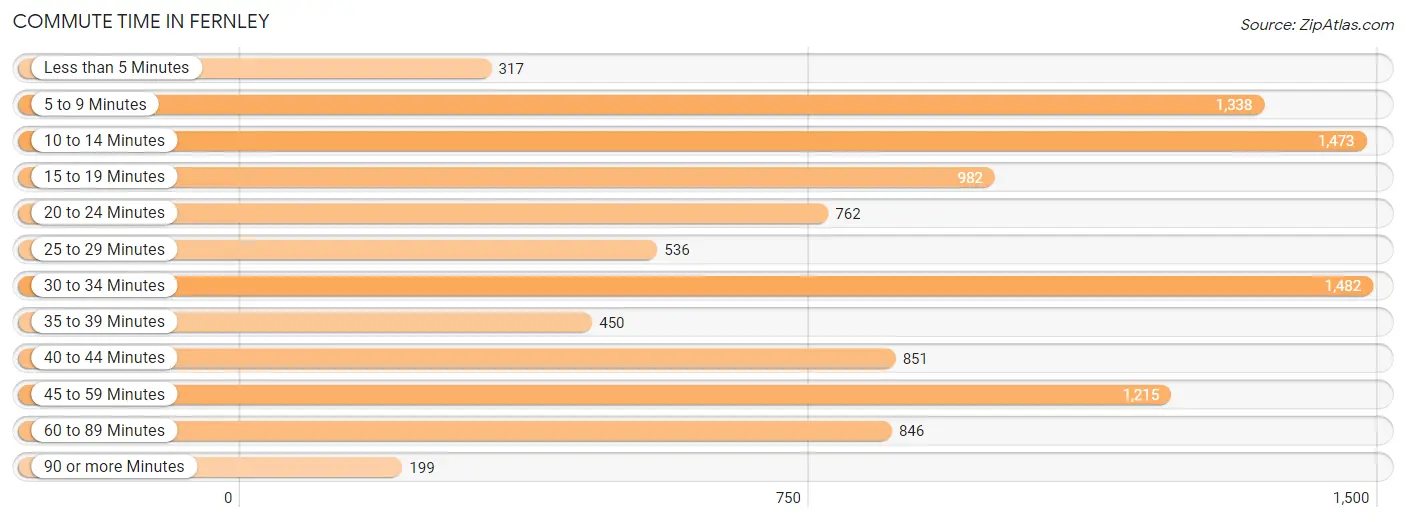
| Commute Time | # Commuters | % Commuters |
| Less than 5 Minutes | 317 | 3.0% |
| 5 to 9 Minutes | 1,338 | 12.8% |
| 10 to 14 Minutes | 1,473 | 14.1% |
| 15 to 19 Minutes | 982 | 9.4% |
| 20 to 24 Minutes | 762 | 7.3% |
| 25 to 29 Minutes | 536 | 5.1% |
| 30 to 34 Minutes | 1,482 | 14.2% |
| 35 to 39 Minutes | 450 | 4.3% |
| 40 to 44 Minutes | 851 | 8.1% |
| 45 to 59 Minutes | 1,215 | 11.6% |
| 60 to 89 Minutes | 846 | 8.1% |
| 90 or more Minutes | 199 | 1.9% |
Commute Time by Sex in Fernley
The most common commute times in Fernley are 30 to 34 minutes (936 commuters, 15.6%) for males and 5 to 9 minutes (911 commuters, 20.5%) for females.
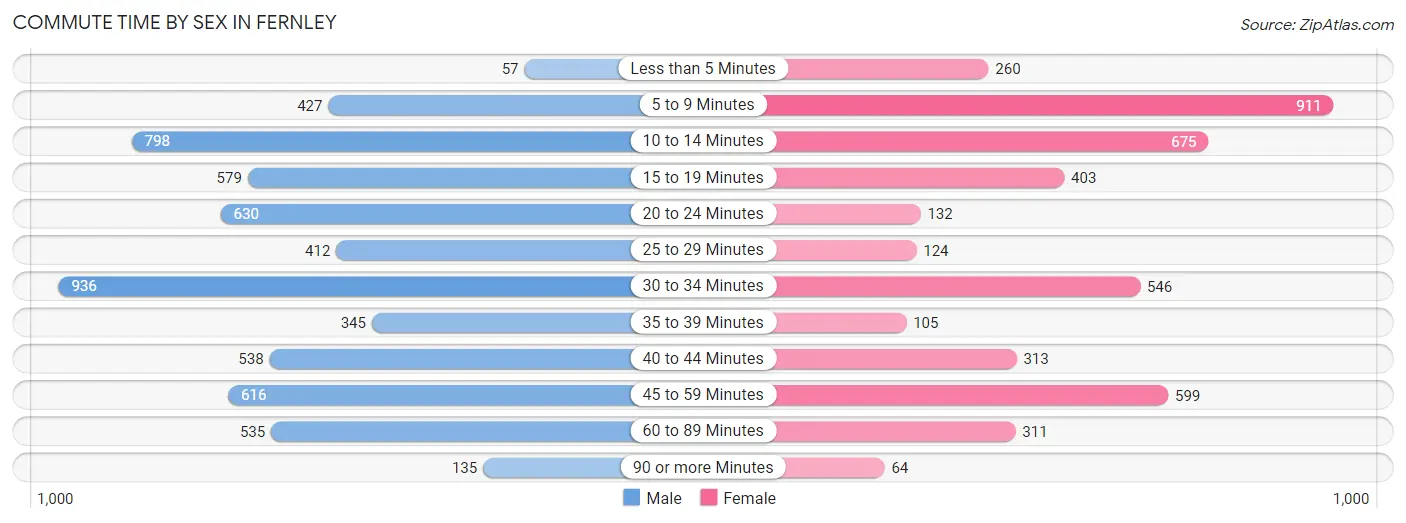
| Commute Time | Male | Female |
| Less than 5 Minutes | 57 (0.9%) | 260 (5.9%) |
| 5 to 9 Minutes | 427 (7.1%) | 911 (20.5%) |
| 10 to 14 Minutes | 798 (13.3%) | 675 (15.2%) |
| 15 to 19 Minutes | 579 (9.6%) | 403 (9.1%) |
| 20 to 24 Minutes | 630 (10.5%) | 132 (3.0%) |
| 25 to 29 Minutes | 412 (6.9%) | 124 (2.8%) |
| 30 to 34 Minutes | 936 (15.6%) | 546 (12.3%) |
| 35 to 39 Minutes | 345 (5.7%) | 105 (2.4%) |
| 40 to 44 Minutes | 538 (8.9%) | 313 (7.0%) |
| 45 to 59 Minutes | 616 (10.2%) | 599 (13.5%) |
| 60 to 89 Minutes | 535 (8.9%) | 311 (7.0%) |
| 90 or more Minutes | 135 (2.2%) | 64 (1.4%) |
Time of Departure to Work by Sex in Fernley
The most frequent times of departure to work in Fernley are 4:00 PM to 11:59 PM (1,204, 20.0%) for males and 6:00 AM to 6:29 AM (594, 13.4%) for females.
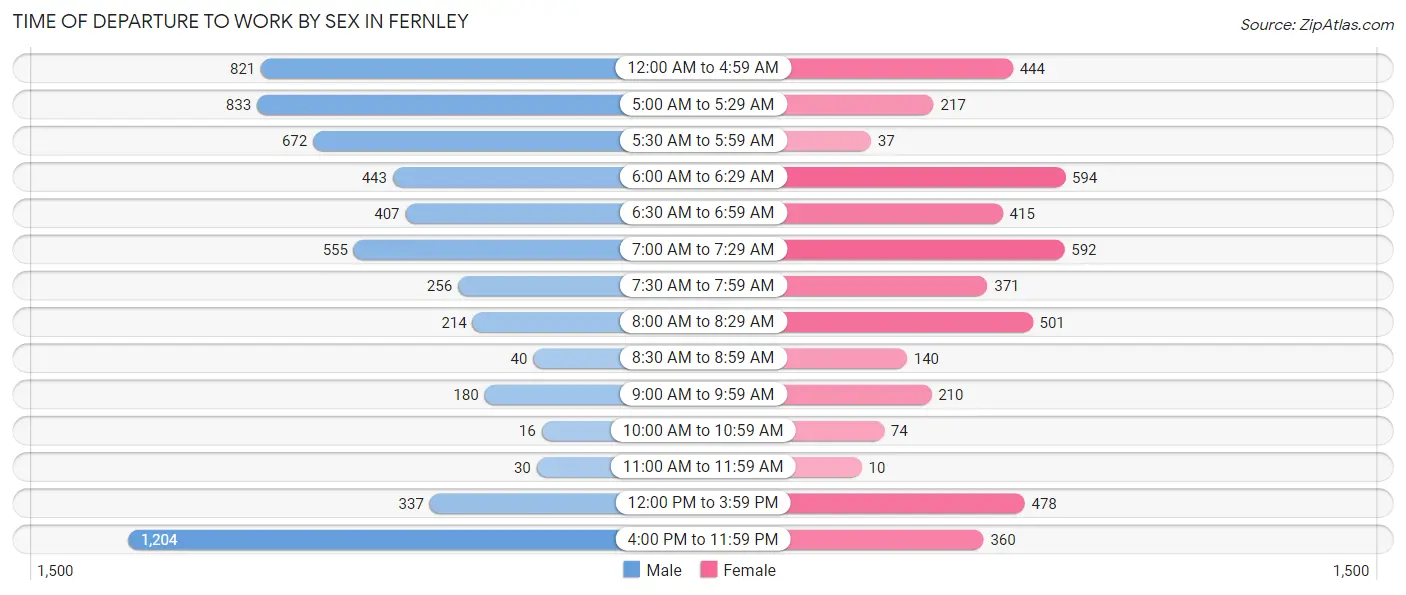
| Time of Departure | Male | Female |
| 12:00 AM to 4:59 AM | 821 (13.7%) | 444 (10.0%) |
| 5:00 AM to 5:29 AM | 833 (13.9%) | 217 (4.9%) |
| 5:30 AM to 5:59 AM | 672 (11.2%) | 37 (0.8%) |
| 6:00 AM to 6:29 AM | 443 (7.4%) | 594 (13.4%) |
| 6:30 AM to 6:59 AM | 407 (6.8%) | 415 (9.3%) |
| 7:00 AM to 7:29 AM | 555 (9.2%) | 592 (13.3%) |
| 7:30 AM to 7:59 AM | 256 (4.3%) | 371 (8.4%) |
| 8:00 AM to 8:29 AM | 214 (3.6%) | 501 (11.3%) |
| 8:30 AM to 8:59 AM | 40 (0.7%) | 140 (3.2%) |
| 9:00 AM to 9:59 AM | 180 (3.0%) | 210 (4.7%) |
| 10:00 AM to 10:59 AM | 16 (0.3%) | 74 (1.7%) |
| 11:00 AM to 11:59 AM | 30 (0.5%) | 10 (0.2%) |
| 12:00 PM to 3:59 PM | 337 (5.6%) | 478 (10.8%) |
| 4:00 PM to 11:59 PM | 1,204 (20.0%) | 360 (8.1%) |
| Total | 6,008 (100.0%) | 4,443 (100.0%) |
Housing Occupancy in Fernley
Occupancy by Ownership in Fernley
Of the total 8,391 dwellings in Fernley, owner-occupied units account for 6,135 (73.1%), while renter-occupied units make up 2,256 (26.9%).
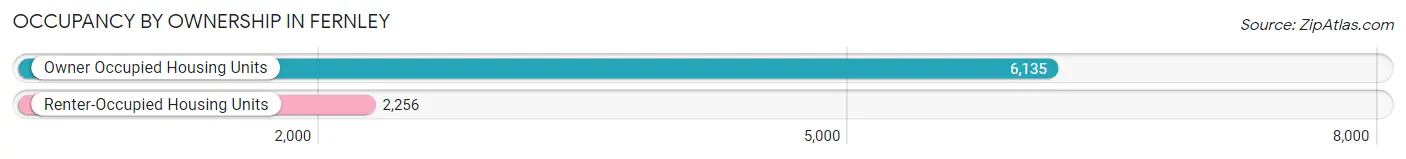
| Occupancy | # Housing Units | % Housing Units |
| Owner Occupied Housing Units | 6,135 | 73.1% |
| Renter-Occupied Housing Units | 2,256 | 26.9% |
| Total Occupied Housing Units | 8,391 | 100.0% |
Occupancy by Household Size in Fernley
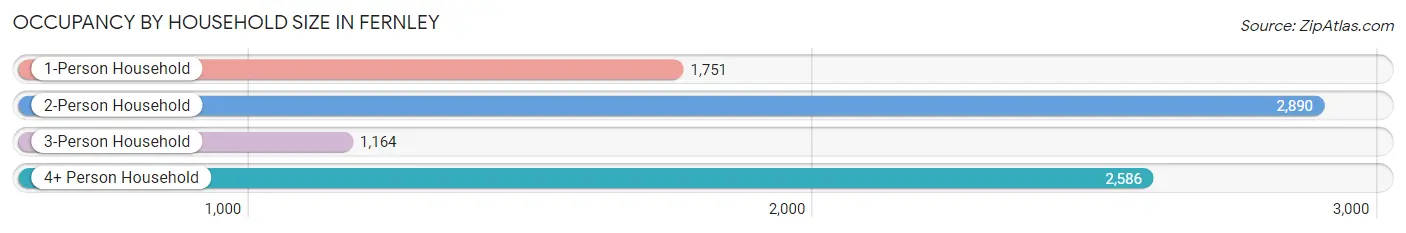
| Household Size | # Housing Units | % Housing Units |
| 1-Person Household | 1,751 | 20.9% |
| 2-Person Household | 2,890 | 34.4% |
| 3-Person Household | 1,164 | 13.9% |
| 4+ Person Household | 2,586 | 30.8% |
| Total Housing Units | 8,391 | 100.0% |
Occupancy by Ownership by Household Size in Fernley
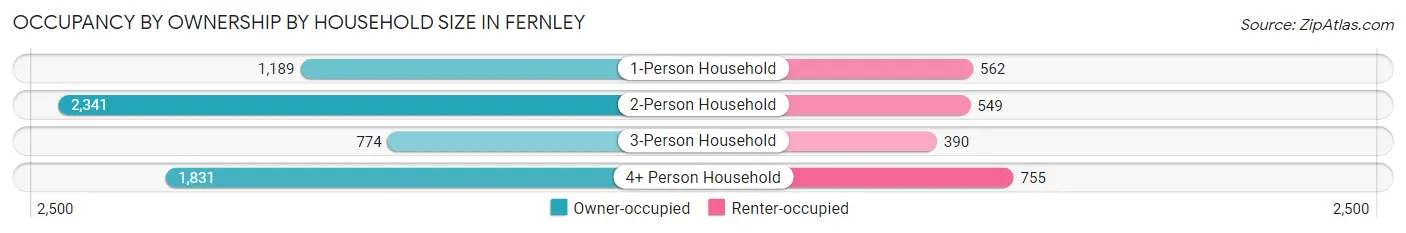
| Household Size | Owner-occupied | Renter-occupied |
| 1-Person Household | 1,189 (67.9%) | 562 (32.1%) |
| 2-Person Household | 2,341 (81.0%) | 549 (19.0%) |
| 3-Person Household | 774 (66.5%) | 390 (33.5%) |
| 4+ Person Household | 1,831 (70.8%) | 755 (29.2%) |
| Total Housing Units | 6,135 (73.1%) | 2,256 (26.9%) |
Occupancy by Educational Attainment in Fernley
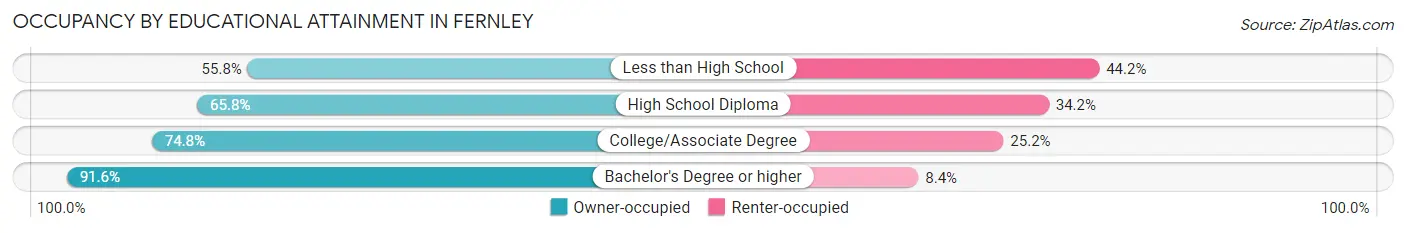
| Household Size | Owner-occupied | Renter-occupied |
| Less than High School | 324 (55.8%) | 257 (44.2%) |
| High School Diploma | 1,907 (65.8%) | 992 (34.2%) |
| College/Associate Degree | 2,643 (74.8%) | 892 (25.2%) |
| Bachelor's Degree or higher | 1,261 (91.6%) | 115 (8.4%) |
Occupancy by Age of Householder in Fernley
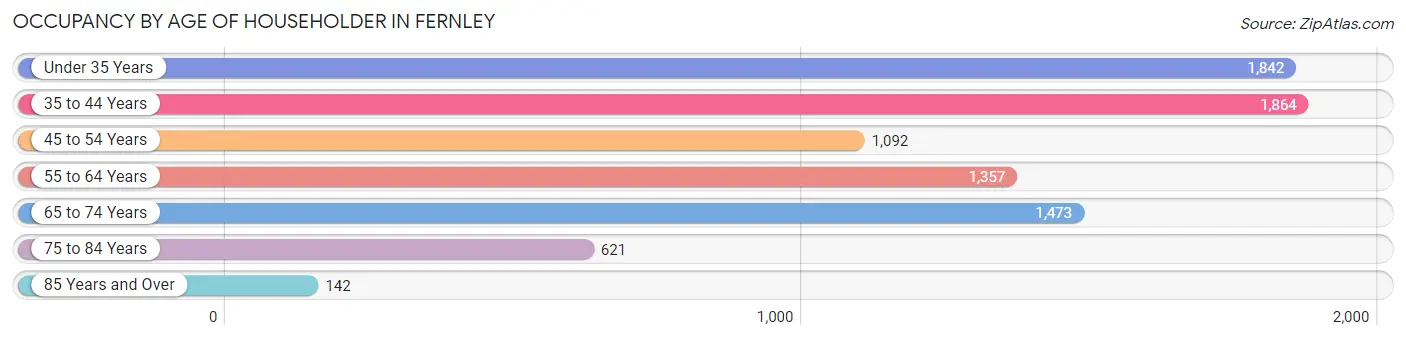
| Age Bracket | # Households | % Households |
| Under 35 Years | 1,842 | 22.0% |
| 35 to 44 Years | 1,864 | 22.2% |
| 45 to 54 Years | 1,092 | 13.0% |
| 55 to 64 Years | 1,357 | 16.2% |
| 65 to 74 Years | 1,473 | 17.5% |
| 75 to 84 Years | 621 | 7.4% |
| 85 Years and Over | 142 | 1.7% |
| Total | 8,391 | 100.0% |
Housing Finances in Fernley
Median Income by Occupancy in Fernley
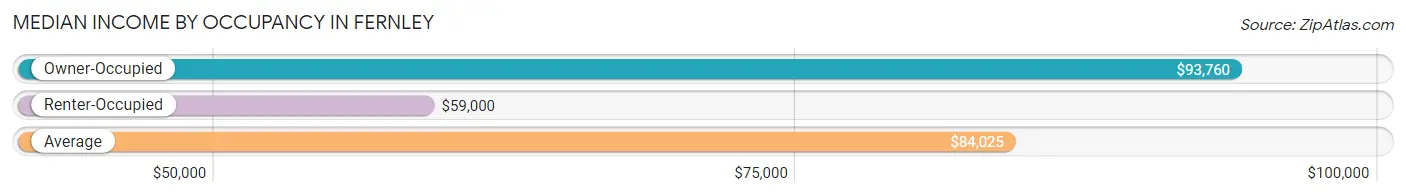
| Occupancy Type | # Households | Median Income |
| Owner-Occupied | 6,135 (73.1%) | $93,760 |
| Renter-Occupied | 2,256 (26.9%) | $59,000 |
| Average | 8,391 (100.0%) | $84,025 |
Occupancy by Householder Income Bracket in Fernley
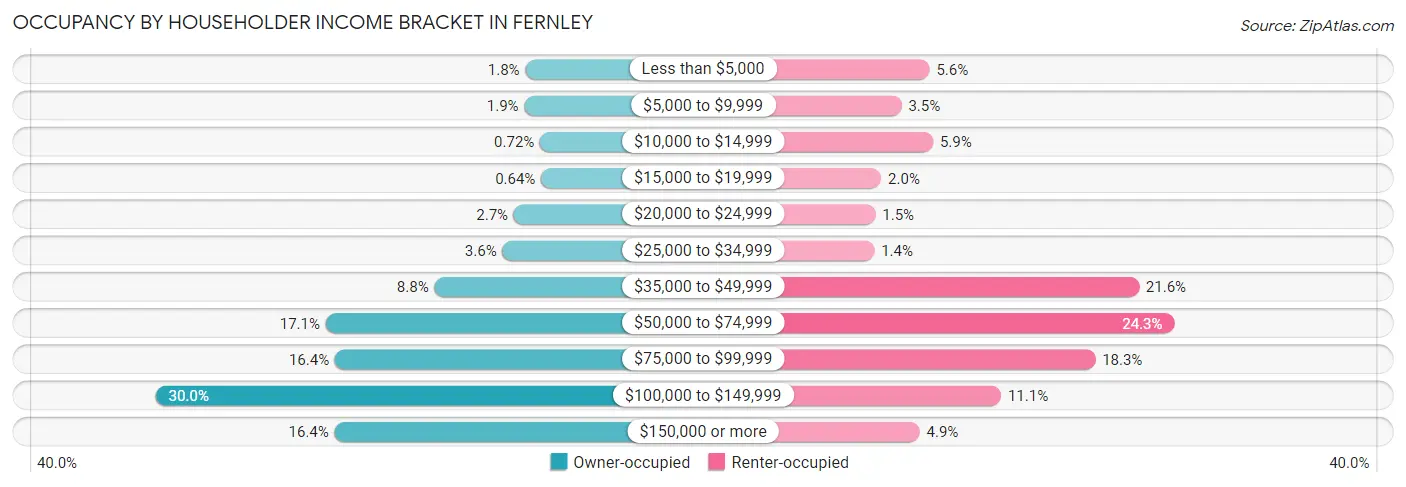
| Income Bracket | Owner-occupied | Renter-occupied |
| Less than $5,000 | 113 (1.8%) | 127 (5.6%) |
| $5,000 to $9,999 | 118 (1.9%) | 79 (3.5%) |
| $10,000 to $14,999 | 44 (0.7%) | 133 (5.9%) |
| $15,000 to $19,999 | 39 (0.6%) | 44 (1.9%) |
| $20,000 to $24,999 | 167 (2.7%) | 34 (1.5%) |
| $25,000 to $34,999 | 220 (3.6%) | 32 (1.4%) |
| $35,000 to $49,999 | 538 (8.8%) | 487 (21.6%) |
| $50,000 to $74,999 | 1,046 (17.1%) | 548 (24.3%) |
| $75,000 to $99,999 | 1,003 (16.4%) | 412 (18.3%) |
| $100,000 to $149,999 | 1,842 (30.0%) | 250 (11.1%) |
| $150,000 or more | 1,005 (16.4%) | 110 (4.9%) |
| Total | 6,135 (100.0%) | 2,256 (100.0%) |
Monthly Housing Cost Tiers in Fernley
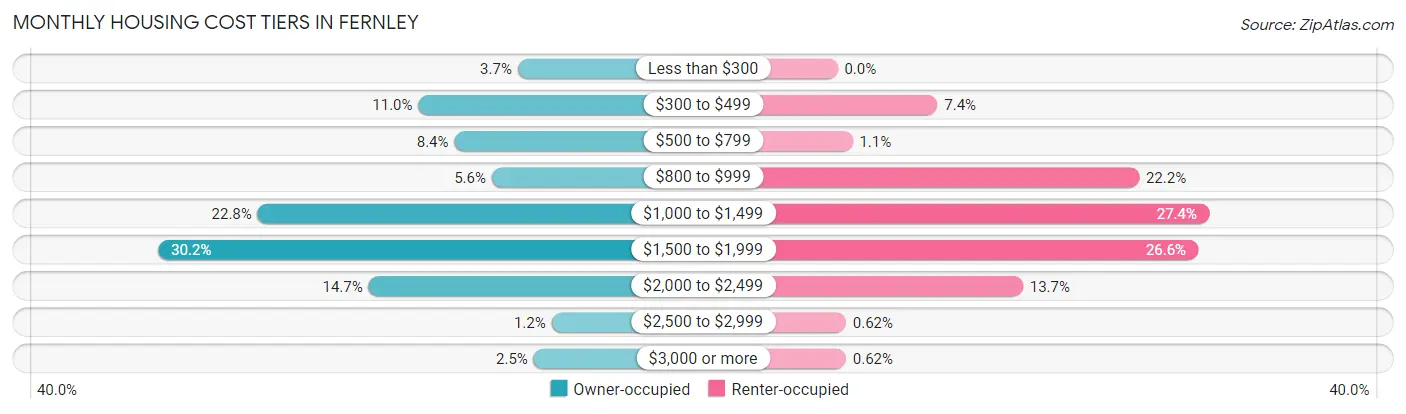
| Monthly Cost | Owner-occupied | Renter-occupied |
| Less than $300 | 226 (3.7%) | 0 (0.0%) |
| $300 to $499 | 675 (11.0%) | 166 (7.4%) |
| $500 to $799 | 512 (8.4%) | 25 (1.1%) |
| $800 to $999 | 343 (5.6%) | 501 (22.2%) |
| $1,000 to $1,499 | 1,401 (22.8%) | 617 (27.4%) |
| $1,500 to $1,999 | 1,851 (30.2%) | 599 (26.6%) |
| $2,000 to $2,499 | 900 (14.7%) | 308 (13.7%) |
| $2,500 to $2,999 | 73 (1.2%) | 14 (0.6%) |
| $3,000 or more | 154 (2.5%) | 14 (0.6%) |
| Total | 6,135 (100.0%) | 2,256 (100.0%) |
Physical Housing Characteristics in Fernley
Housing Structures in Fernley
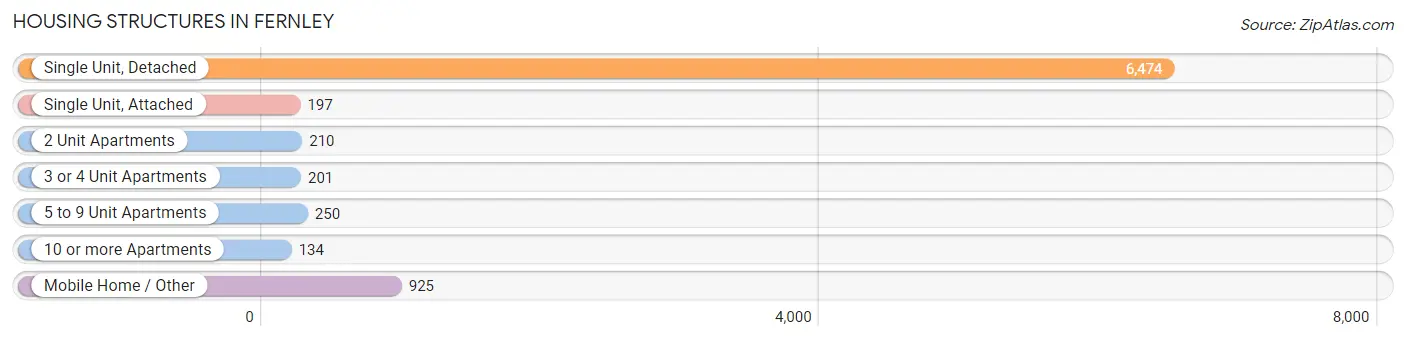
| Structure Type | # Housing Units | % Housing Units |
| Single Unit, Detached | 6,474 | 77.1% |
| Single Unit, Attached | 197 | 2.4% |
| 2 Unit Apartments | 210 | 2.5% |
| 3 or 4 Unit Apartments | 201 | 2.4% |
| 5 to 9 Unit Apartments | 250 | 3.0% |
| 10 or more Apartments | 134 | 1.6% |
| Mobile Home / Other | 925 | 11.0% |
| Total | 8,391 | 100.0% |
Housing Structures by Occupancy in Fernley
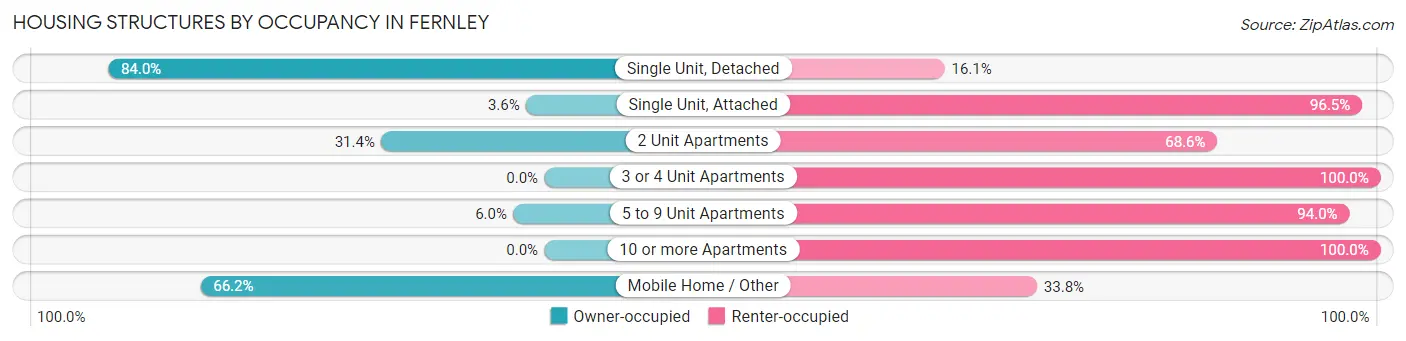
| Structure Type | Owner-occupied | Renter-occupied |
| Single Unit, Detached | 5,435 (84.0%) | 1,039 (16.1%) |
| Single Unit, Attached | 7 (3.5%) | 190 (96.5%) |
| 2 Unit Apartments | 66 (31.4%) | 144 (68.6%) |
| 3 or 4 Unit Apartments | 0 (0.0%) | 201 (100.0%) |
| 5 to 9 Unit Apartments | 15 (6.0%) | 235 (94.0%) |
| 10 or more Apartments | 0 (0.0%) | 134 (100.0%) |
| Mobile Home / Other | 612 (66.2%) | 313 (33.8%) |
| Total | 6,135 (73.1%) | 2,256 (26.9%) |
Housing Structures by Number of Rooms in Fernley
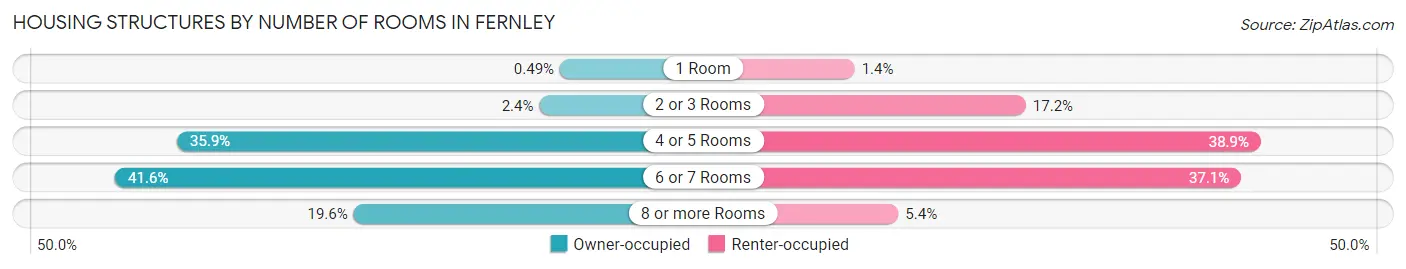
| Number of Rooms | Owner-occupied | Renter-occupied |
| 1 Room | 30 (0.5%) | 31 (1.4%) |
| 2 or 3 Rooms | 147 (2.4%) | 388 (17.2%) |
| 4 or 5 Rooms | 2,203 (35.9%) | 878 (38.9%) |
| 6 or 7 Rooms | 2,554 (41.6%) | 837 (37.1%) |
| 8 or more Rooms | 1,201 (19.6%) | 122 (5.4%) |
| Total | 6,135 (100.0%) | 2,256 (100.0%) |
Housing Structure by Heating Type in Fernley
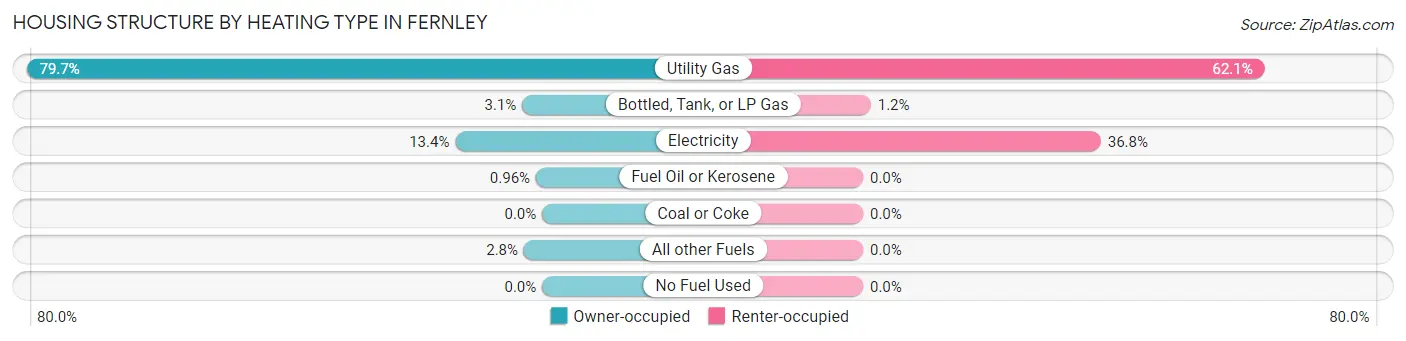
| Heating Type | Owner-occupied | Renter-occupied |
| Utility Gas | 4,890 (79.7%) | 1,400 (62.1%) |
| Bottled, Tank, or LP Gas | 189 (3.1%) | 27 (1.2%) |
| Electricity | 824 (13.4%) | 829 (36.7%) |
| Fuel Oil or Kerosene | 59 (1.0%) | 0 (0.0%) |
| Coal or Coke | 0 (0.0%) | 0 (0.0%) |
| All other Fuels | 173 (2.8%) | 0 (0.0%) |
| No Fuel Used | 0 (0.0%) | 0 (0.0%) |
| Total | 6,135 (100.0%) | 2,256 (100.0%) |
Household Vehicle Usage in Fernley
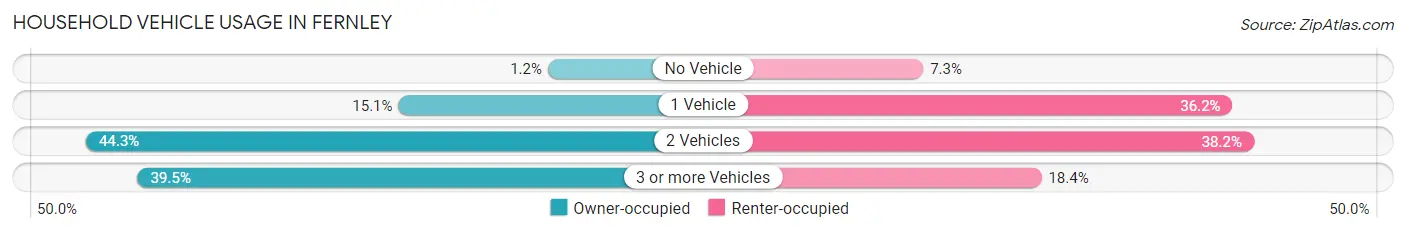
| Vehicles per Household | Owner-occupied | Renter-occupied |
| No Vehicle | 71 (1.2%) | 165 (7.3%) |
| 1 Vehicle | 927 (15.1%) | 816 (36.2%) |
| 2 Vehicles | 2,716 (44.3%) | 861 (38.2%) |
| 3 or more Vehicles | 2,421 (39.5%) | 414 (18.3%) |
| Total | 6,135 (100.0%) | 2,256 (100.0%) |
Real Estate & Mortgages in Fernley
Real Estate and Mortgage Overview in Fernley
| Characteristic | Without Mortgage | With Mortgage |
| Housing Units | 1,551 | 4,584 |
| Median Property Value | $279,500 | $339,800 |
| Median Household Income | $76,917 | $804 |
| Monthly Housing Costs | $470 | $144 |
| Real Estate Taxes | $1,809 | $391 |
Property Value by Mortgage Status in Fernley
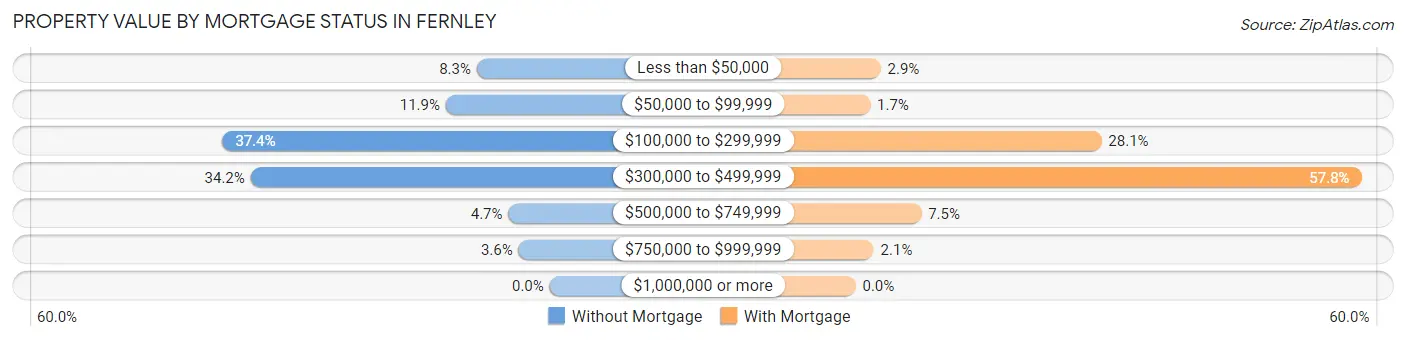
| Property Value | Without Mortgage | With Mortgage |
| Less than $50,000 | 129 (8.3%) | 131 (2.9%) |
| $50,000 to $99,999 | 184 (11.9%) | 76 (1.7%) |
| $100,000 to $299,999 | 580 (37.4%) | 1,288 (28.1%) |
| $300,000 to $499,999 | 530 (34.2%) | 2,650 (57.8%) |
| $500,000 to $749,999 | 73 (4.7%) | 344 (7.5%) |
| $750,000 to $999,999 | 55 (3.5%) | 95 (2.1%) |
| $1,000,000 or more | 0 (0.0%) | 0 (0.0%) |
| Total | 1,551 (100.0%) | 4,584 (100.0%) |
Household Income by Mortgage Status in Fernley
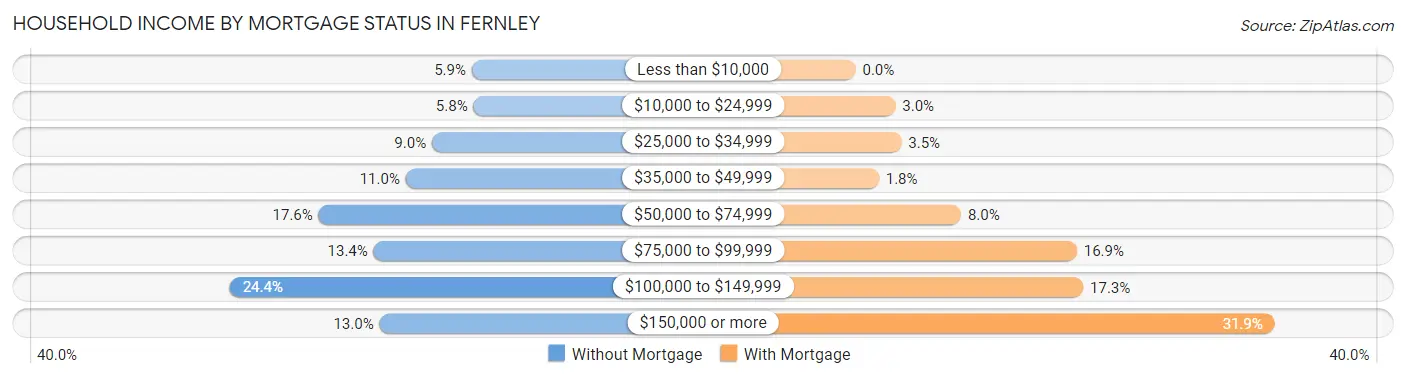
| Household Income | Without Mortgage | With Mortgage |
| Less than $10,000 | 92 (5.9%) | 0 (0.0%) |
| $10,000 to $24,999 | 90 (5.8%) | 139 (3.0%) |
| $25,000 to $34,999 | 139 (9.0%) | 160 (3.5%) |
| $35,000 to $49,999 | 170 (11.0%) | 81 (1.8%) |
| $50,000 to $74,999 | 273 (17.6%) | 368 (8.0%) |
| $75,000 to $99,999 | 208 (13.4%) | 773 (16.9%) |
| $100,000 to $149,999 | 378 (24.4%) | 795 (17.3%) |
| $150,000 or more | 201 (13.0%) | 1,464 (31.9%) |
| Total | 1,551 (100.0%) | 4,584 (100.0%) |
Property Value to Household Income Ratio in Fernley
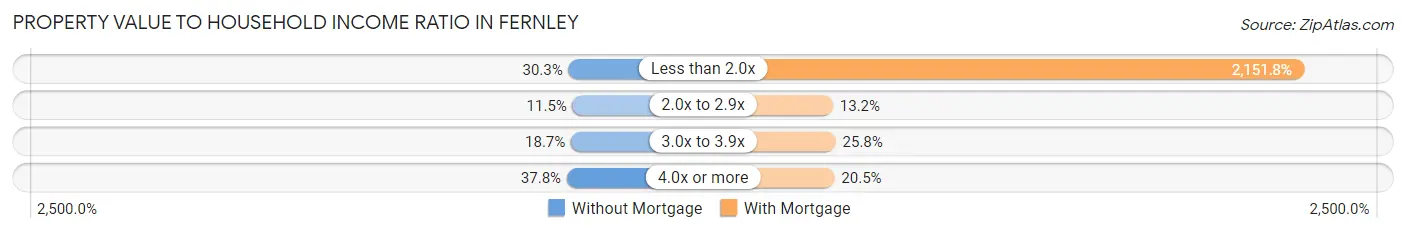
| Value-to-Income Ratio | Without Mortgage | With Mortgage |
| Less than 2.0x | 470 (30.3%) | 98,636 (2,151.7%) |
| 2.0x to 2.9x | 179 (11.5%) | 606 (13.2%) |
| 3.0x to 3.9x | 290 (18.7%) | 1,182 (25.8%) |
| 4.0x or more | 586 (37.8%) | 938 (20.5%) |
| Total | 1,551 (100.0%) | 4,584 (100.0%) |
Real Estate Taxes by Mortgage Status in Fernley
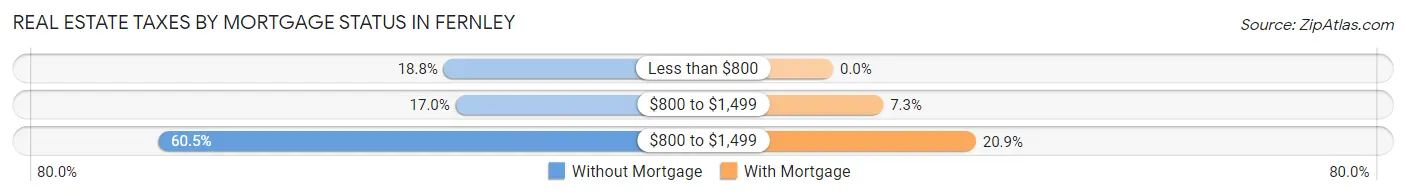
| Property Taxes | Without Mortgage | With Mortgage |
| Less than $800 | 291 (18.8%) | 0 (0.0%) |
| $800 to $1,499 | 264 (17.0%) | 336 (7.3%) |
| $800 to $1,499 | 938 (60.5%) | 956 (20.9%) |
| Total | 1,551 (100.0%) | 4,584 (100.0%) |
Health & Disability in Fernley
Health Insurance Coverage by Age in Fernley
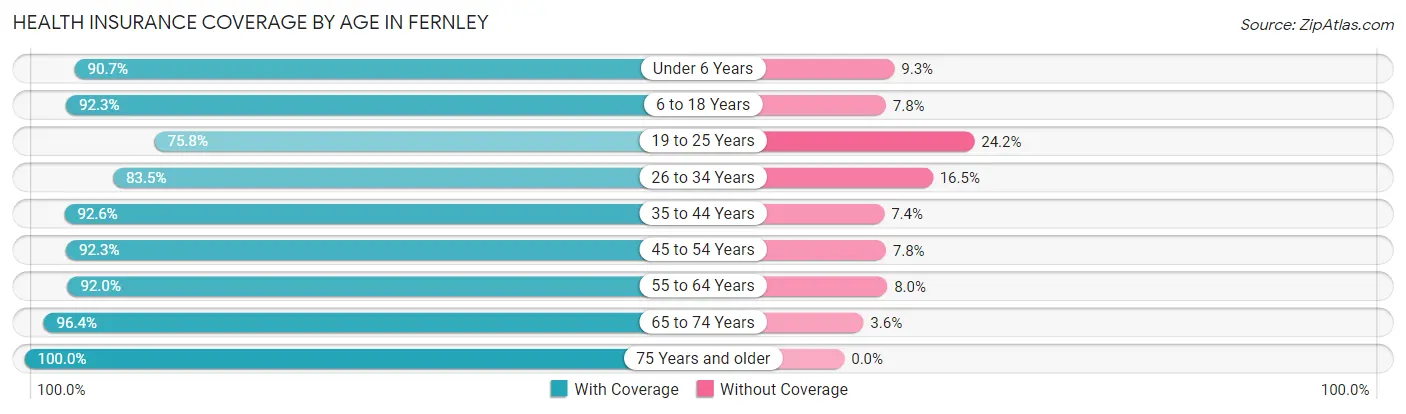
| Age Bracket | With Coverage | Without Coverage |
| Under 6 Years | 1,653 (90.7%) | 170 (9.3%) |
| 6 to 18 Years | 3,739 (92.2%) | 314 (7.7%) |
| 19 to 25 Years | 1,353 (75.8%) | 433 (24.2%) |
| 26 to 34 Years | 2,830 (83.5%) | 559 (16.5%) |
| 35 to 44 Years | 2,913 (92.6%) | 234 (7.4%) |
| 45 to 54 Years | 2,546 (92.2%) | 214 (7.7%) |
| 55 to 64 Years | 2,264 (92.0%) | 197 (8.0%) |
| 65 to 74 Years | 2,110 (96.4%) | 78 (3.6%) |
| 75 Years and older | 1,255 (100.0%) | 0 (0.0%) |
| Total | 20,663 (90.4%) | 2,199 (9.6%) |
Health Insurance Coverage by Citizenship Status in Fernley
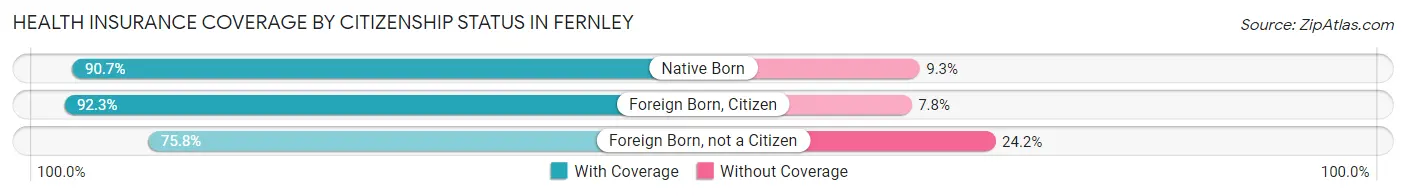
| Citizenship Status | With Coverage | Without Coverage |
| Native Born | 1,653 (90.7%) | 170 (9.3%) |
| Foreign Born, Citizen | 3,739 (92.2%) | 314 (7.7%) |
| Foreign Born, not a Citizen | 1,353 (75.8%) | 433 (24.2%) |
Health Insurance Coverage by Household Income in Fernley
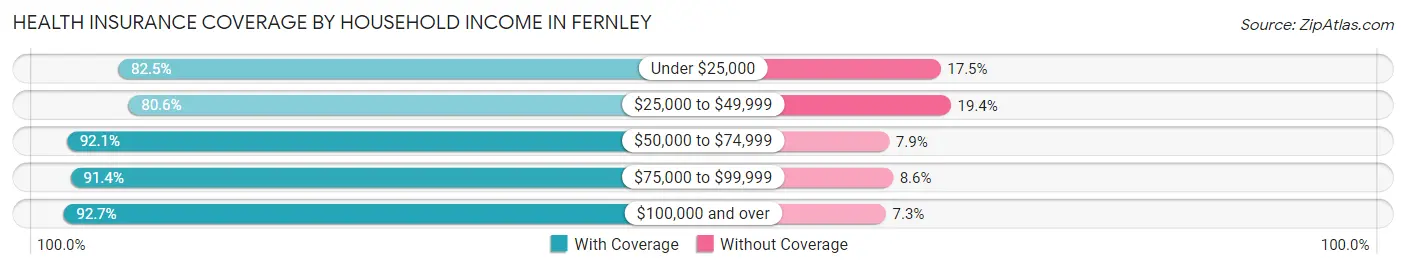
| Household Income | With Coverage | Without Coverage |
| Under $25,000 | 1,308 (82.5%) | 278 (17.5%) |
| $25,000 to $49,999 | 1,944 (80.6%) | 469 (19.4%) |
| $50,000 to $74,999 | 3,641 (92.1%) | 312 (7.9%) |
| $75,000 to $99,999 | 3,834 (91.4%) | 361 (8.6%) |
| $100,000 and over | 9,936 (92.7%) | 779 (7.3%) |
Public vs Private Health Insurance Coverage by Age in Fernley
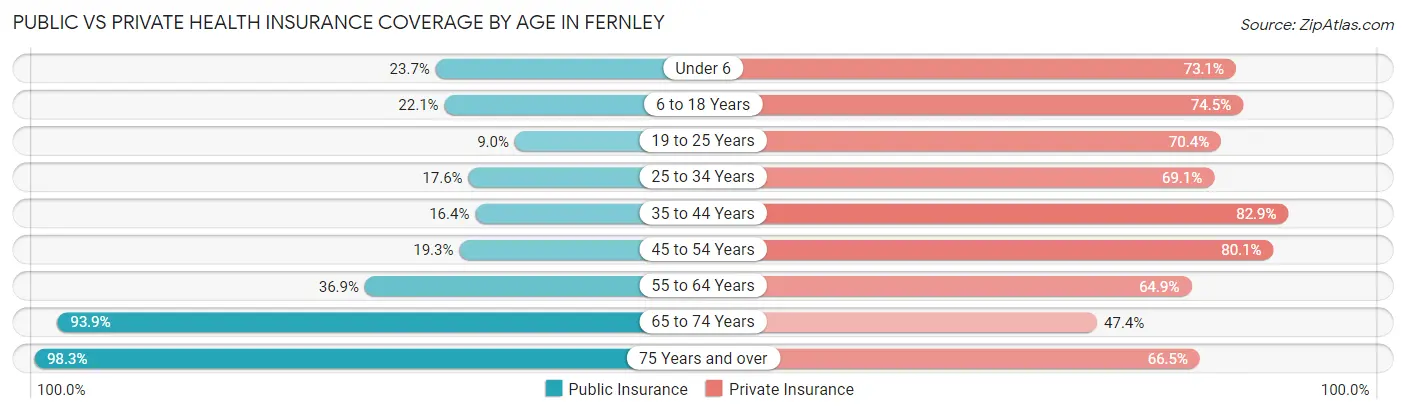
| Age Bracket | Public Insurance | Private Insurance |
| Under 6 | 432 (23.7%) | 1,333 (73.1%) |
| 6 to 18 Years | 895 (22.1%) | 3,018 (74.5%) |
| 19 to 25 Years | 161 (9.0%) | 1,257 (70.4%) |
| 25 to 34 Years | 597 (17.6%) | 2,341 (69.1%) |
| 35 to 44 Years | 515 (16.4%) | 2,608 (82.9%) |
| 45 to 54 Years | 533 (19.3%) | 2,211 (80.1%) |
| 55 to 64 Years | 907 (36.8%) | 1,596 (64.8%) |
| 65 to 74 Years | 2,055 (93.9%) | 1,037 (47.4%) |
| 75 Years and over | 1,233 (98.3%) | 834 (66.4%) |
| Total | 7,328 (32.1%) | 16,235 (71.0%) |
Disability Status by Sex by Age in Fernley
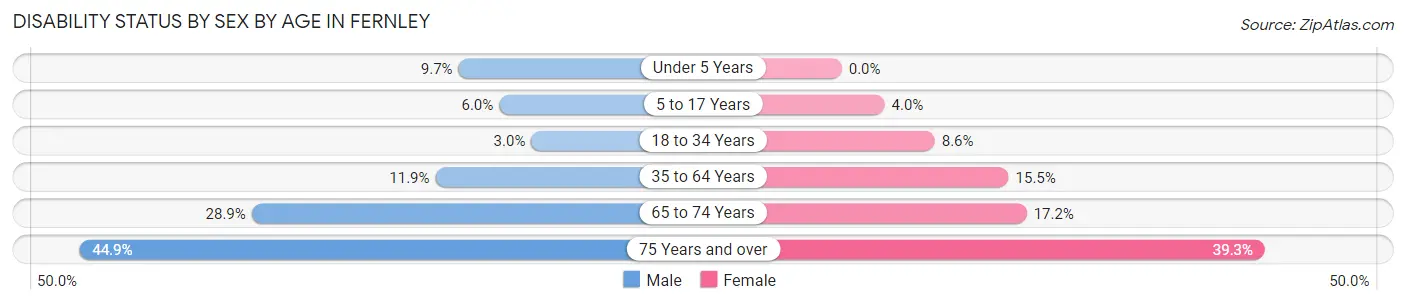
| Age Bracket | Male | Female |
| Under 5 Years | 63 (9.7%) | 0 (0.0%) |
| 5 to 17 Years | 132 (6.0%) | 81 (4.0%) |
| 18 to 34 Years | 79 (3.0%) | 241 (8.6%) |
| 35 to 64 Years | 520 (11.9%) | 618 (15.5%) |
| 65 to 74 Years | 333 (28.9%) | 178 (17.2%) |
| 75 Years and over | 296 (44.9%) | 234 (39.3%) |
Disability Class by Sex by Age in Fernley
Disability Class: Hearing Difficulty
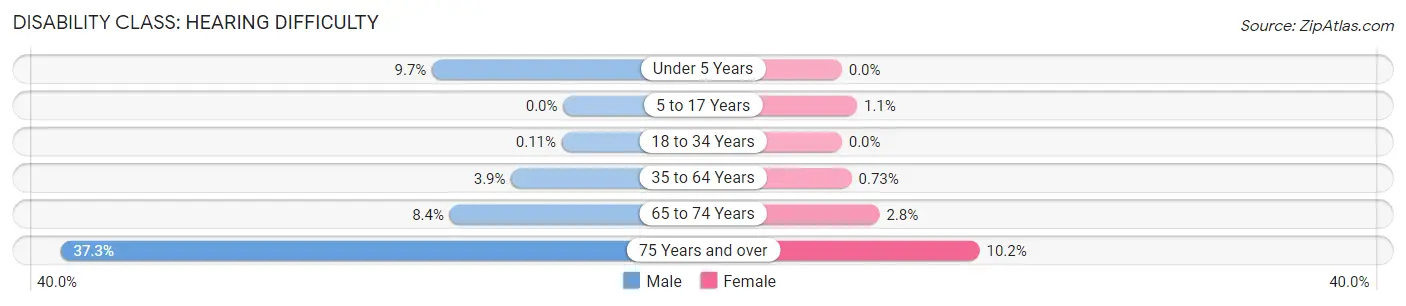
| Age Bracket | Male | Female |
| Under 5 Years | 63 (9.7%) | 0 (0.0%) |
| 5 to 17 Years | 0 (0.0%) | 23 (1.1%) |
| 18 to 34 Years | 3 (0.1%) | 0 (0.0%) |
| 35 to 64 Years | 169 (3.9%) | 29 (0.7%) |
| 65 to 74 Years | 97 (8.4%) | 29 (2.8%) |
| 75 Years and over | 246 (37.3%) | 61 (10.2%) |
Disability Class: Vision Difficulty
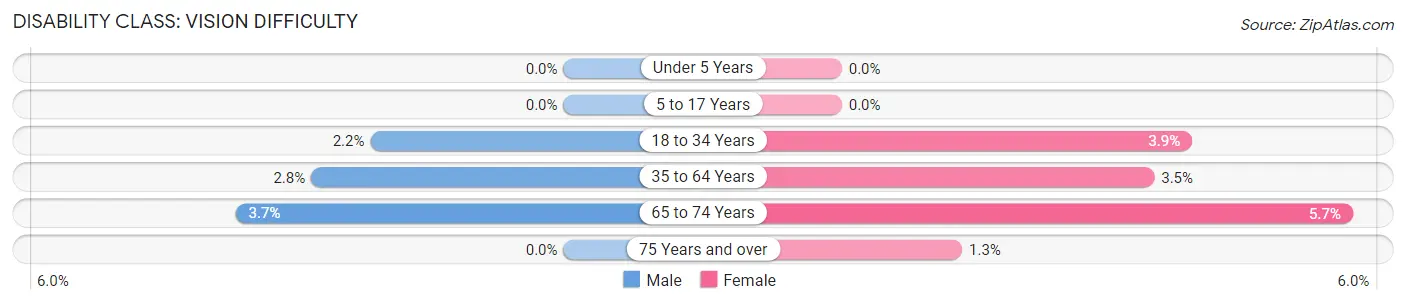
| Age Bracket | Male | Female |
| Under 5 Years | 0 (0.0%) | 0 (0.0%) |
| 5 to 17 Years | 0 (0.0%) | 0 (0.0%) |
| 18 to 34 Years | 57 (2.1%) | 109 (3.9%) |
| 35 to 64 Years | 123 (2.8%) | 139 (3.5%) |
| 65 to 74 Years | 42 (3.6%) | 59 (5.7%) |
| 75 Years and over | 0 (0.0%) | 8 (1.3%) |
Disability Class: Cognitive Difficulty
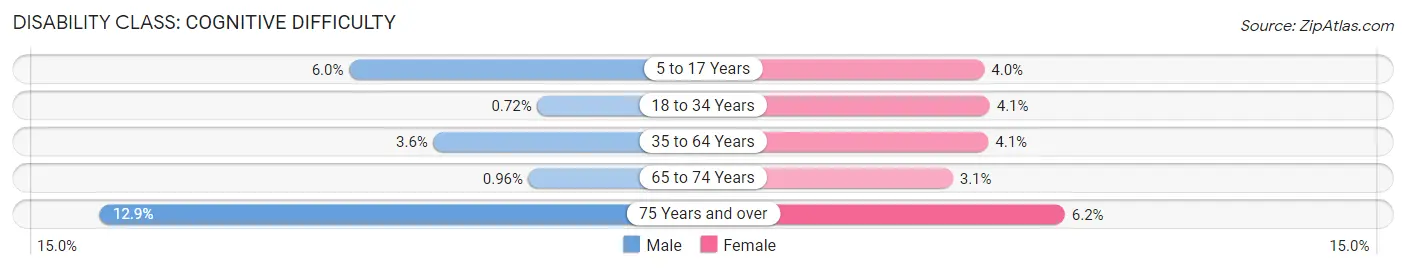
| Age Bracket | Male | Female |
| 5 to 17 Years | 132 (6.0%) | 81 (4.0%) |
| 18 to 34 Years | 19 (0.7%) | 115 (4.1%) |
| 35 to 64 Years | 158 (3.6%) | 163 (4.1%) |
| 65 to 74 Years | 11 (1.0%) | 32 (3.1%) |
| 75 Years and over | 85 (12.9%) | 37 (6.2%) |
Disability Class: Ambulatory Difficulty
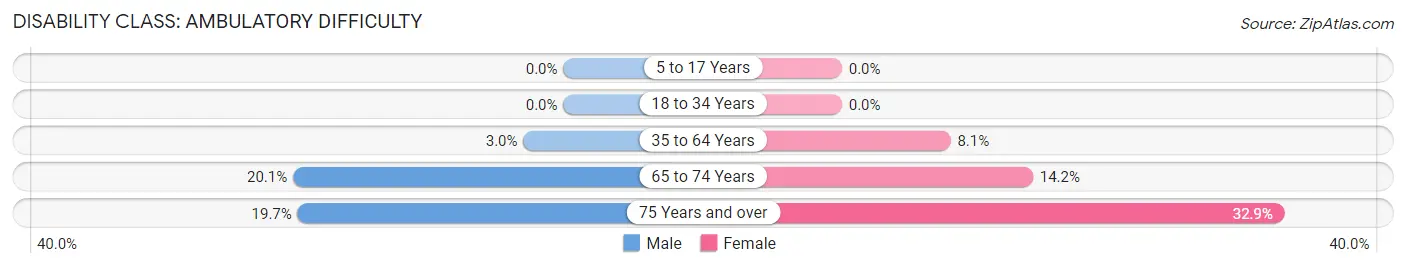
| Age Bracket | Male | Female |
| 5 to 17 Years | 0 (0.0%) | 0 (0.0%) |
| 18 to 34 Years | 0 (0.0%) | 0 (0.0%) |
| 35 to 64 Years | 130 (3.0%) | 322 (8.1%) |
| 65 to 74 Years | 231 (20.1%) | 147 (14.2%) |
| 75 Years and over | 130 (19.7%) | 196 (32.9%) |
Disability Class: Self-Care Difficulty
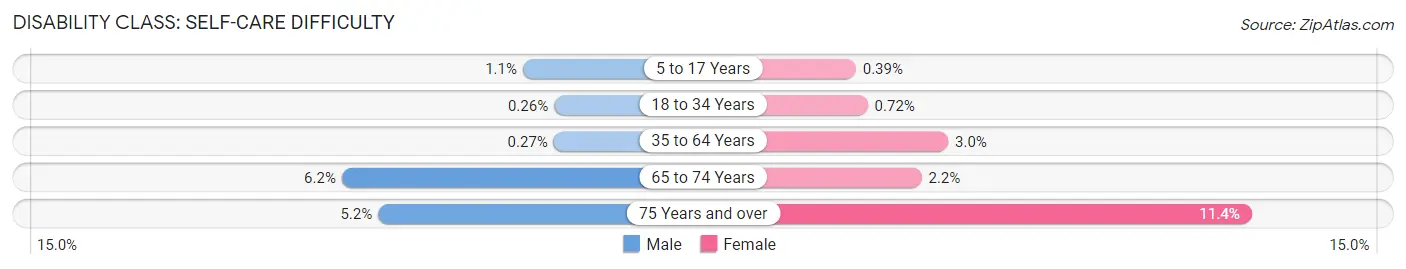
| Age Bracket | Male | Female |
| 5 to 17 Years | 25 (1.1%) | 8 (0.4%) |
| 18 to 34 Years | 7 (0.3%) | 20 (0.7%) |
| 35 to 64 Years | 12 (0.3%) | 118 (3.0%) |
| 65 to 74 Years | 71 (6.2%) | 23 (2.2%) |
| 75 Years and over | 34 (5.2%) | 68 (11.4%) |
Technology Access in Fernley
Computing Device Access in Fernley
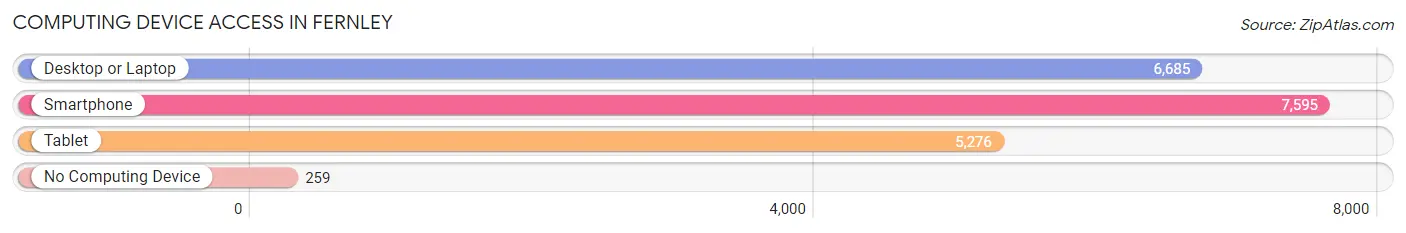
| Device Type | # Households | % Households |
| Desktop or Laptop | 6,685 | 79.7% |
| Smartphone | 7,595 | 90.5% |
| Tablet | 5,276 | 62.9% |
| No Computing Device | 259 | 3.1% |
| Total | 8,391 | 100.0% |
Internet Access in Fernley
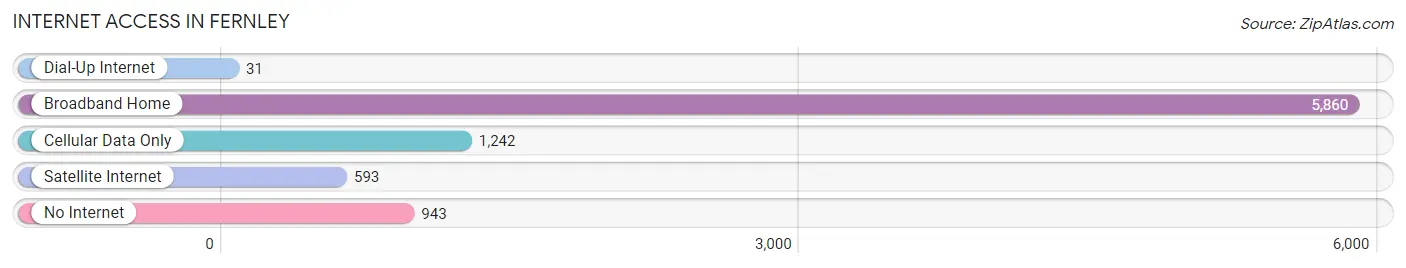
| Internet Type | # Households | % Households |
| Dial-Up Internet | 31 | 0.4% |
| Broadband Home | 5,860 | 69.8% |
| Cellular Data Only | 1,242 | 14.8% |
| Satellite Internet | 593 | 7.1% |
| No Internet | 943 | 11.2% |
| Total | 8,391 | 100.0% |
Fernley Summary
Fernley is a city located in Lyon County, Nevada, United States. The population was 19,368 at the 2010 census, up from 13,765 at the 2000 census. Fernley is located in the Lahontan Valley, near the eastern edge of the Carson Sink, and is part of the Reno–Sparks Metropolitan Statistical Area.
History
Fernley was founded in 1904 as a railroad town, and was named after the local rancher, William Fernley. The town was originally located near the present-day intersection of Main Street and US 50. In the early 1900s, Fernley was a small farming community, with a population of only a few hundred people.
In the 1950s, Fernley began to experience rapid growth due to the construction of the Fernley & Lassen Railway, which connected the town to Reno and Sparks. The railway brought in new businesses and industries, and the population of Fernley began to grow.
In the late 1990s, Fernley experienced another period of rapid growth due to the construction of the Fernley Industrial Park. The industrial park brought in new businesses and industries, and the population of Fernley began to grow again.
Geography
Fernley is located at the intersection of Interstate 80 and US 50, in the Lahontan Valley of western Nevada. The city is located at the eastern edge of the Carson Sink, a large desert basin. The city is located about 25 miles east of Reno, and about 50 miles west of Winnemucca.
The city has a total area of 16.2 square miles, of which 16.1 square miles is land and 0.1 square miles is water.
Economy
Fernley’s economy is largely based on agriculture, manufacturing, and tourism. The city is home to several large agricultural operations, including the Fernley & Lassen Railway, which transports agricultural products to Reno and Sparks.
Fernley is also home to several manufacturing companies, including the Fernley Industrial Park, which is home to several large companies, including Amazon, Walmart, and Target.
Fernley is also a popular tourist destination, with several attractions, including the Fernley Speedway, the Fernley Museum, and the Fernley Aquatic Center.
Demographics
As of the 2010 census, there were 19,368 people, 6,845 households, and 5,072 families residing in the city. The population density was 1,196.3 people per square mile. There were 7,541 housing units at an average density of 467.3 per square mile.
The racial makeup of the city was 79.2% White, 1.2% African American, 1.3% Native American, 1.2% Asian, 0.2% Pacific Islander, 14.2% from other races, and 2.9% from two or more races. Hispanic or Latino of any race were 24.2% of the population.
The median income for a household in the city was $45,945, and the median income for a family was $51,945. Males had a median income of $41,945 versus $30,945 for females. The per capita income for the city was $20,945. About 8.2% of families and 10.2% of the population were below the poverty line, including 14.2% of those under age 18 and 6.2% of those age 65 or over.
Common Questions
What is Per Capita Income in Fernley?
Per Capita income in Fernley is $36,125.
What is the Median Family Income in Fernley?
Median Family Income in Fernley is $88,672.
What is the Median Household income in Fernley?
Median Household Income in Fernley is $84,025.
What is Income or Wage Gap in Fernley?
Income or Wage Gap in Fernley is 47.0%.
Women in Fernley earn 53.0 cents for every dollar earned by a man.
What is Inequality or Gini Index in Fernley?
Inequality or Gini Index in Fernley is 0.38.
What is the Total Population of Fernley?
Total Population of Fernley is 23,035.
What is the Total Male Population of Fernley?
Total Male Population of Fernley is 11,860.
What is the Total Female Population of Fernley?
Total Female Population of Fernley is 11,175.
What is the Ratio of Males per 100 Females in Fernley?
There are 106.13 Males per 100 Females in Fernley.
What is the Ratio of Females per 100 Males in Fernley?
There are 94.22 Females per 100 Males in Fernley.
What is the Median Population Age in Fernley?
Median Population Age in Fernley is 35.9 Years.
What is the Average Family Size in Fernley
Average Family Size in Fernley is 3.2 People.
What is the Average Household Size in Fernley
Average Household Size in Fernley is 2.8 People.
How Large is the Labor Force in Fernley?
There are 11,759 People in the Labor Forcein in Fernley.
What is the Percentage of People in the Labor Force in Fernley?
65.1% of People are in the Labor Force in Fernley.
What is the Unemployment Rate in Fernley?
Unemployment Rate in Fernley is 4.6%.