Haviland, NY Map & Demographics
Haviland Map
Haviland Overview
$41,470
PER CAPITA INCOME
$87,132
AVG FAMILY INCOME
$80,663
AVG HOUSEHOLD INCOME
46.7%
WAGE / INCOME GAP [ % ]
53.3¢/ $1
WAGE / INCOME GAP [ $ ]
0.37
INEQUALITY / GINI INDEX
3,500
TOTAL POPULATION
1,672
MALE POPULATION
1,828
FEMALE POPULATION
91.47
MALES / 100 FEMALES
109.33
FEMALES / 100 MALES
45.0
MEDIAN AGE
2.9
AVG FAMILY SIZE
2.5
AVG HOUSEHOLD SIZE
1,889
LABOR FORCE [ PEOPLE ]
67.1%
PERCENT IN LABOR FORCE
8.3%
UNEMPLOYMENT RATE
Income in Haviland
Income Overview in Haviland
Per Capita Income in Haviland is $41,470, while median incomes of families and households are $87,132 and $80,663 respectively.
| Characteristic | Number | Measure |
| Per Capita Income | 3,500 | $41,470 |
| Median Family Income | 981 | $87,132 |
| Mean Family Income | 981 | $107,868 |
| Median Household Income | 1,376 | $80,663 |
| Mean Household Income | 1,376 | $102,914 |
| Income Deficit | 981 | $0 |
| Wage / Income Gap (%) | 3,500 | 46.69% |
| Wage / Income Gap ($) | 3,500 | 53.31¢ per $1 |
| Gini / Inequality Index | 3,500 | 0.37 |
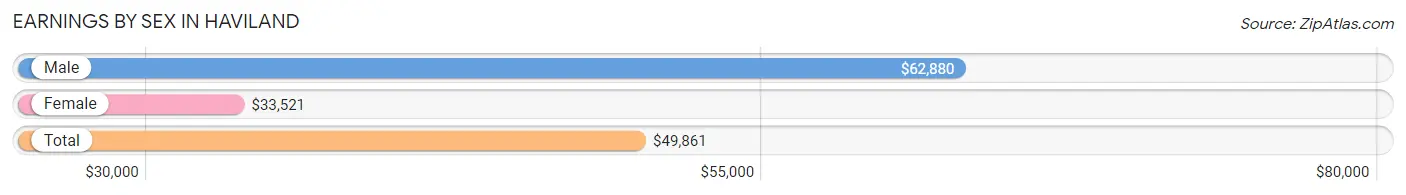
Earnings by Sex in Haviland
Average Earnings in Haviland are $49,861, $62,880 for men and $33,521 for women, a difference of 46.7%.
| Sex | Number | Average Earnings |
| Male | 989 (52.4%) | $62,880 |
| Female | 900 (47.6%) | $33,521 |
| Total | 1,889 (100.0%) | $49,861 |
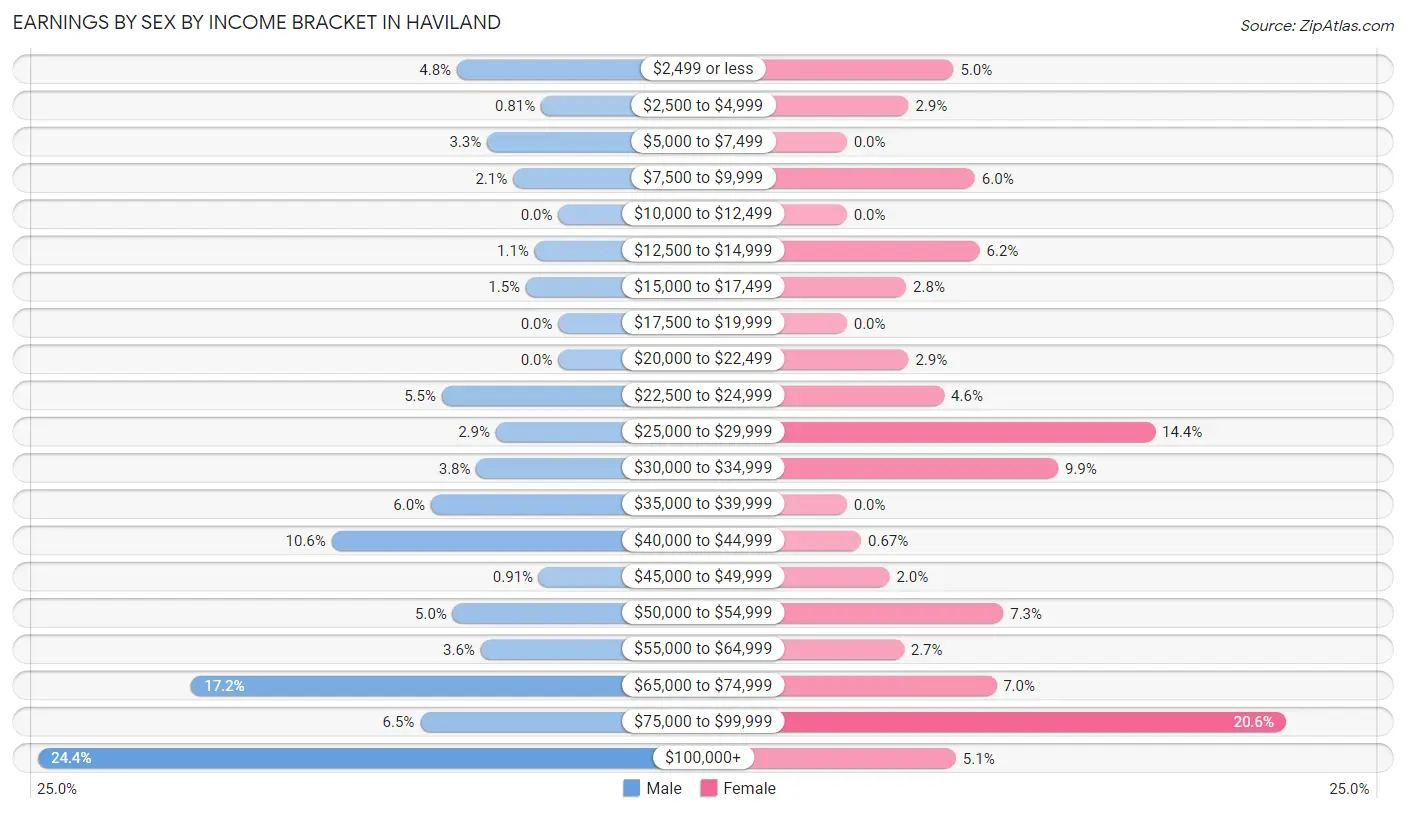
Earnings by Sex by Income Bracket in Haviland
The most common earnings brackets in Haviland are $100,000+ for men (241 | 24.4%) and $75,000 to $99,999 for women (185 | 20.6%).
| Income | Male | Female |
| $2,499 or less | 47 (4.8%) | 45 (5.0%) |
| $2,500 to $4,999 | 8 (0.8%) | 26 (2.9%) |
| $5,000 to $7,499 | 33 (3.3%) | 0 (0.0%) |
| $7,500 to $9,999 | 21 (2.1%) | 54 (6.0%) |
| $10,000 to $12,499 | 0 (0.0%) | 0 (0.0%) |
| $12,500 to $14,999 | 11 (1.1%) | 56 (6.2%) |
| $15,000 to $17,499 | 15 (1.5%) | 25 (2.8%) |
| $17,500 to $19,999 | 0 (0.0%) | 0 (0.0%) |
| $20,000 to $22,499 | 0 (0.0%) | 26 (2.9%) |
| $22,500 to $24,999 | 54 (5.5%) | 41 (4.6%) |
| $25,000 to $29,999 | 29 (2.9%) | 130 (14.4%) |
| $30,000 to $34,999 | 38 (3.8%) | 89 (9.9%) |
| $35,000 to $39,999 | 59 (6.0%) | 0 (0.0%) |
| $40,000 to $44,999 | 105 (10.6%) | 6 (0.7%) |
| $45,000 to $49,999 | 9 (0.9%) | 18 (2.0%) |
| $50,000 to $54,999 | 49 (5.0%) | 66 (7.3%) |
| $55,000 to $64,999 | 36 (3.6%) | 24 (2.7%) |
| $65,000 to $74,999 | 170 (17.2%) | 63 (7.0%) |
| $75,000 to $99,999 | 64 (6.5%) | 185 (20.6%) |
| $100,000+ | 241 (24.4%) | 46 (5.1%) |
| Total | 989 (100.0%) | 900 (100.0%) |
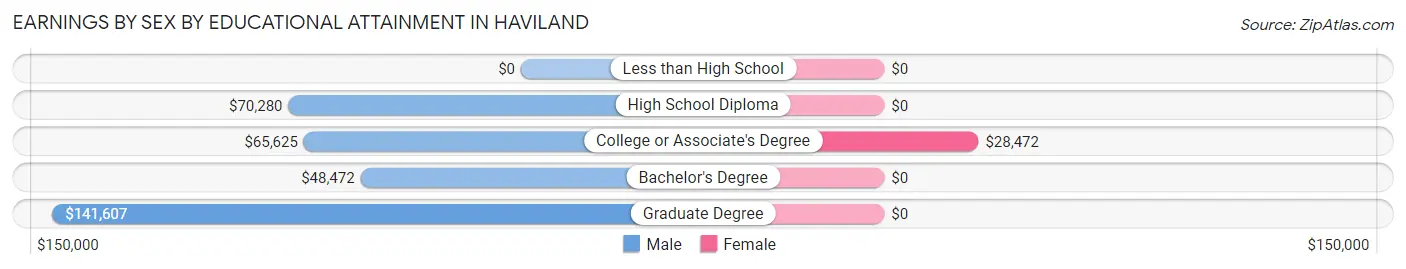
Earnings by Sex by Educational Attainment in Haviland
Average earnings in Haviland are $66,310 for men and $34,560 for women, a difference of 47.9%. Men with an educational attainment of graduate degree enjoy the highest average annual earnings of $141,607, while those with bachelor's degree education earn the least with $48,472. Women with an educational attainment of college or associate's degree earn the most with the average annual earnings of $28,472, while those with college or associate's degree education have the smallest earnings of $28,472.
| Educational Attainment | Male Income | Female Income |
| Less than High School | - | - |
| High School Diploma | $70,280 | $0 |
| College or Associate's Degree | $65,625 | $28,472 |
| Bachelor's Degree | $48,472 | $0 |
| Graduate Degree | $141,607 | $0 |
| Total | $66,310 | $34,560 |
Family Income in Haviland
Family Income Brackets in Haviland
According to the Haviland family income data, there are 242 families falling into the $50,000 to $74,999 income range, which is the most common income bracket and makes up 24.7% of all families.
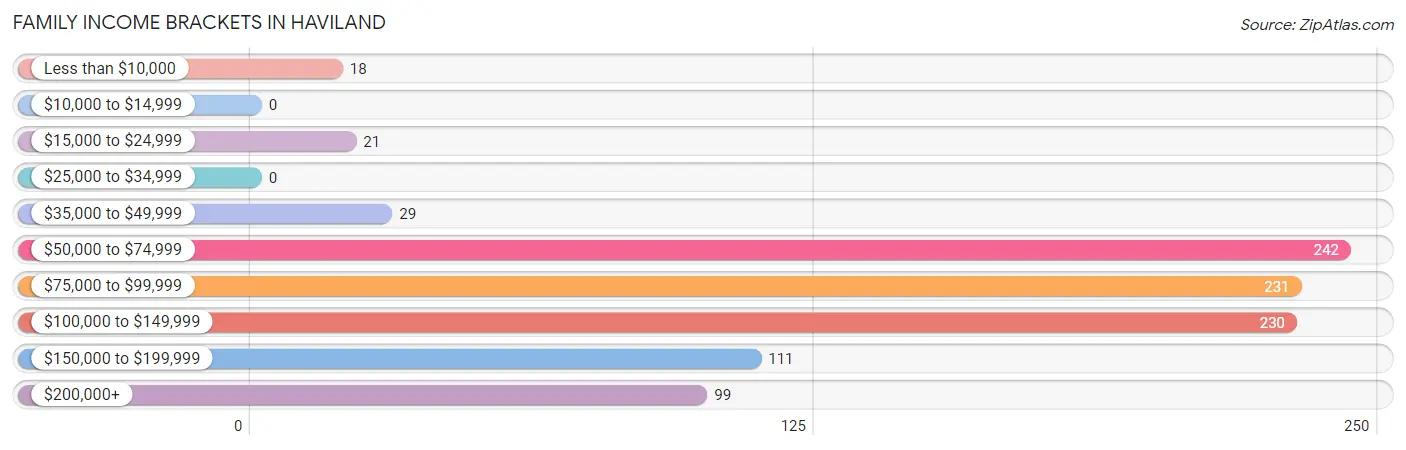
| Income Bracket | # Families | % Families |
| Less than $10,000 | 18 | 1.8% |
| $10,000 to $14,999 | 0 | 0.0% |
| $15,000 to $24,999 | 21 | 2.1% |
| $25,000 to $34,999 | 0 | 0.0% |
| $35,000 to $49,999 | 29 | 3.0% |
| $50,000 to $74,999 | 242 | 24.7% |
| $75,000 to $99,999 | 231 | 23.5% |
| $100,000 to $149,999 | 230 | 23.4% |
| $150,000 to $199,999 | 111 | 11.3% |
| $200,000+ | 99 | 10.1% |
Family Income by Famaliy Size in Haviland
3-person families (261 | 26.6%) account for the highest median family income in Haviland with $93,203 per family, while 2-person families (506 | 51.6%) have the highest median income of $43,014 per family member.
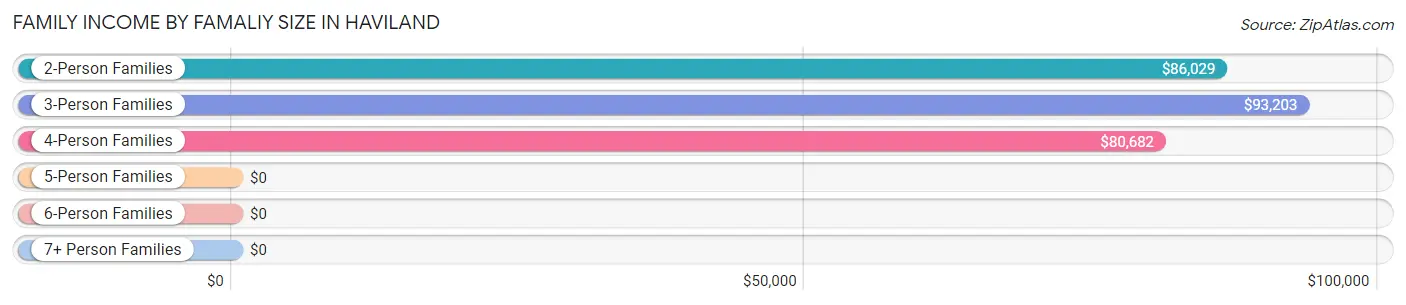
| Income Bracket | # Families | Median Income |
| 2-Person Families | 506 (51.6%) | $86,029 |
| 3-Person Families | 261 (26.6%) | $93,203 |
| 4-Person Families | 128 (13.1%) | $80,682 |
| 5-Person Families | 20 (2.0%) | $0 |
| 6-Person Families | 66 (6.7%) | $0 |
| 7+ Person Families | 0 (0.0%) | $0 |
| Total | 981 (100.0%) | $87,132 |
Family Income by Number of Earners in Haviland
The median family income in Haviland is $87,132, with families comprising 3+ earners (56) having the highest median family income of $120,517, while families with no earners (147) have the lowest median family income of $76,420, accounting for 5.7% and 15.0% of families, respectively.
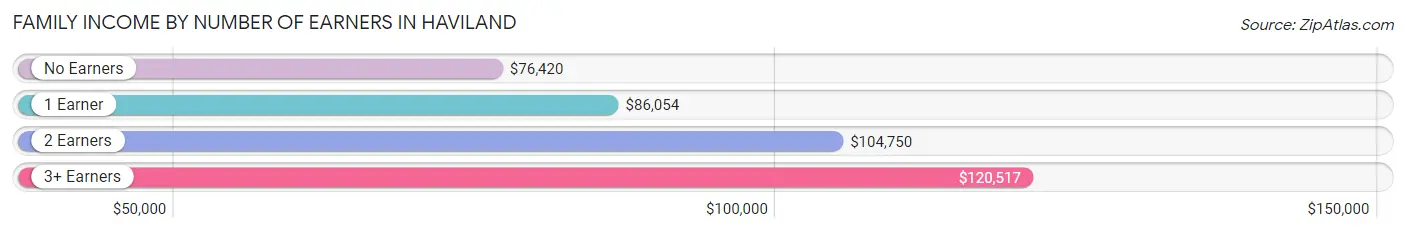
| Number of Earners | # Families | Median Income |
| No Earners | 147 (15.0%) | $76,420 |
| 1 Earner | 311 (31.7%) | $86,054 |
| 2 Earners | 467 (47.6%) | $104,750 |
| 3+ Earners | 56 (5.7%) | $120,517 |
| Total | 981 (100.0%) | $87,132 |
Household Income in Haviland
Household Income Brackets in Haviland
With 283 households falling in the category, the $50,000 to $74,999 income range is the most frequent in Haviland, accounting for 20.6% of all households. In contrast, only 26 households (1.9%) fall into the less than $10,000 income bracket, making it the least populous group.
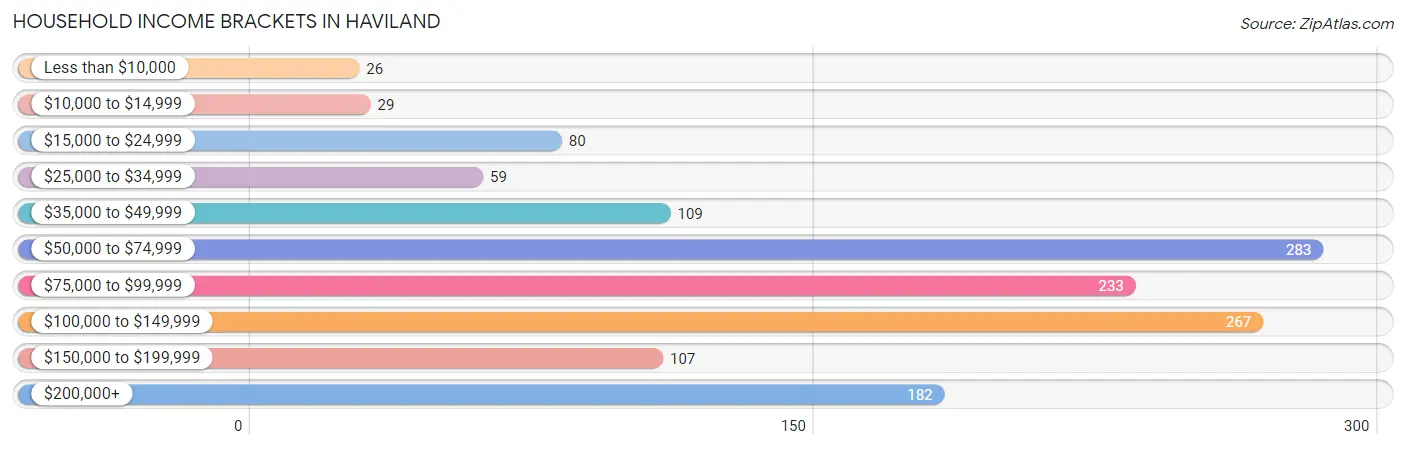
| Income Bracket | # Households | % Households |
| Less than $10,000 | 26 | 1.9% |
| $10,000 to $14,999 | 29 | 2.1% |
| $15,000 to $24,999 | 80 | 5.8% |
| $25,000 to $34,999 | 59 | 4.3% |
| $35,000 to $49,999 | 109 | 7.9% |
| $50,000 to $74,999 | 283 | 20.6% |
| $75,000 to $99,999 | 233 | 16.9% |
| $100,000 to $149,999 | 267 | 19.4% |
| $150,000 to $199,999 | 107 | 7.8% |
| $200,000+ | 182 | 13.2% |
Household Income by Householder Age in Haviland
The median household income in Haviland is $80,663, with the highest median household income of $85,980 found in the 25 to 44 years age bracket for the primary householder. A total of 366 households (26.6%) fall into this category.
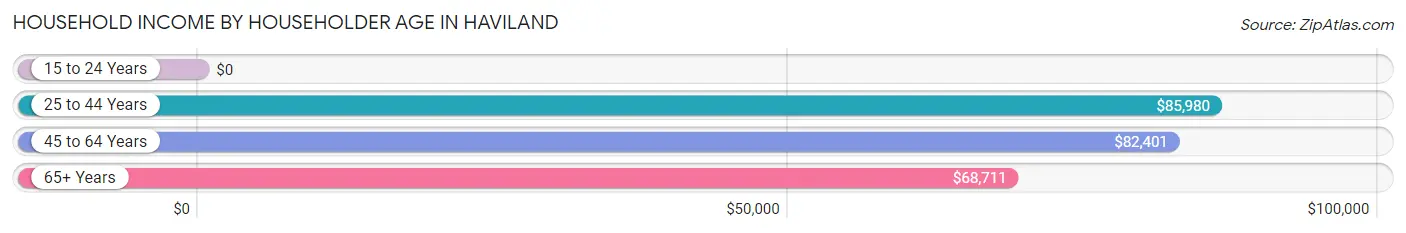
| Income Bracket | # Households | Median Income |
| 15 to 24 Years | 0 (0.0%) | $0 |
| 25 to 44 Years | 366 (26.6%) | $85,980 |
| 45 to 64 Years | 635 (46.2%) | $82,401 |
| 65+ Years | 375 (27.3%) | $68,711 |
| Total | 1,376 (100.0%) | $80,663 |
Poverty in Haviland
Income Below Poverty by Sex and Age in Haviland
With 5.8% poverty level for males and 8.3% for females among the residents of Haviland, under 5 year old males and 65 to 74 year old females are the most vulnerable to poverty, with 17 males (40.5%) and 50 females (25.8%) in their respective age groups living below the poverty level.
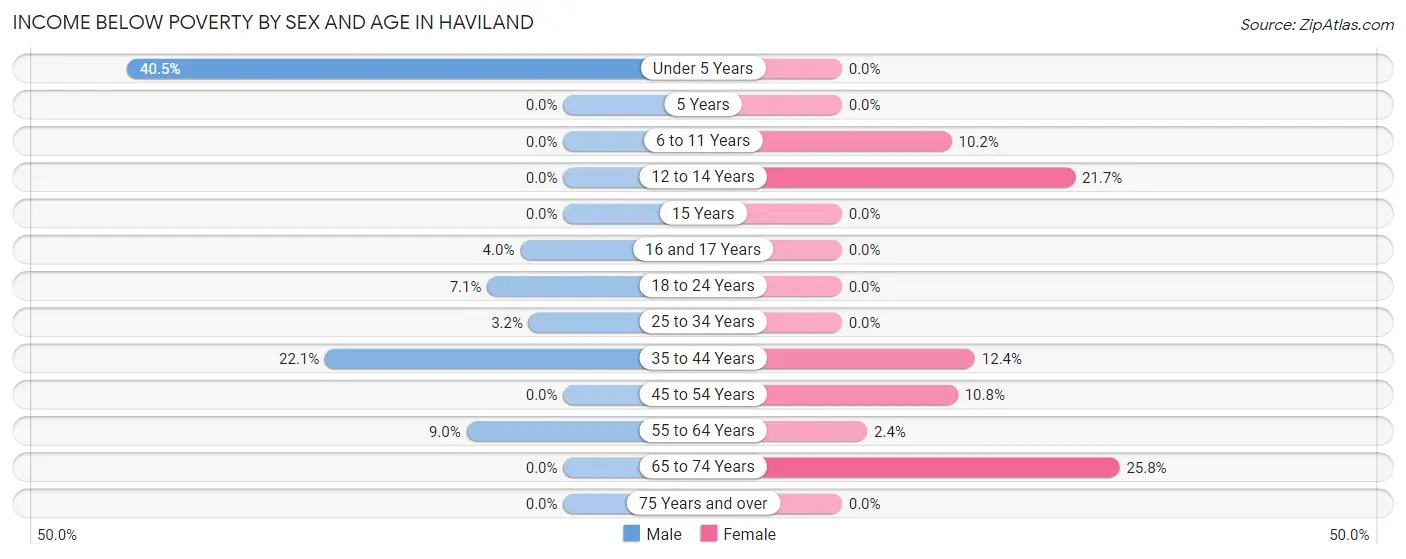
| Age Bracket | Male | Female |
| Under 5 Years | 17 (40.5%) | 0 (0.0%) |
| 5 Years | 0 (0.0%) | 0 (0.0%) |
| 6 to 11 Years | 0 (0.0%) | 21 (10.2%) |
| 12 to 14 Years | 0 (0.0%) | 21 (21.6%) |
| 15 Years | 0 (0.0%) | 0 (0.0%) |
| 16 and 17 Years | 2 (4.0%) | 0 (0.0%) |
| 18 to 24 Years | 6 (7.1%) | 0 (0.0%) |
| 25 to 34 Years | 8 (3.2%) | 0 (0.0%) |
| 35 to 44 Years | 42 (22.1%) | 21 (12.3%) |
| 45 to 54 Years | 0 (0.0%) | 31 (10.8%) |
| 55 to 64 Years | 22 (9.0%) | 7 (2.4%) |
| 65 to 74 Years | 0 (0.0%) | 50 (25.8%) |
| 75 Years and over | 0 (0.0%) | 0 (0.0%) |
| Total | 97 (5.8%) | 151 (8.3%) |
Income Above Poverty by Sex and Age in Haviland
According to the poverty statistics in Haviland, males aged 6 to 11 years and females aged under 5 years are the age groups that are most secure financially, with 100.0% of males and 100.0% of females in these age groups living above the poverty line.
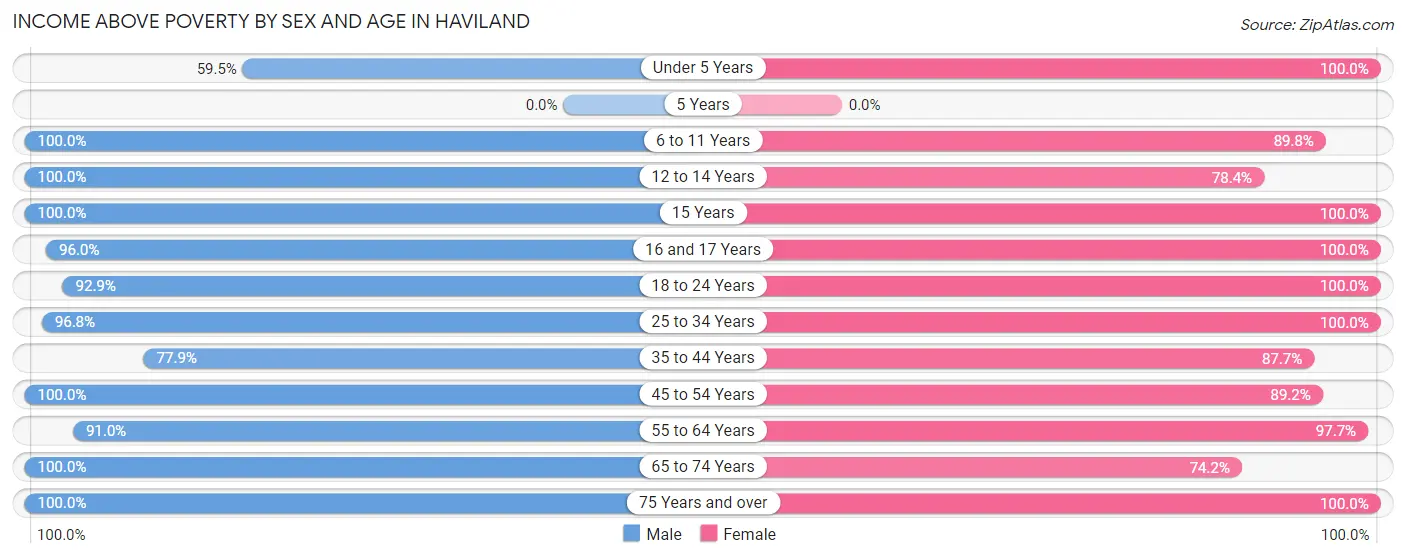
| Age Bracket | Male | Female |
| Under 5 Years | 25 (59.5%) | 47 (100.0%) |
| 5 Years | 0 (0.0%) | 0 (0.0%) |
| 6 to 11 Years | 135 (100.0%) | 185 (89.8%) |
| 12 to 14 Years | 19 (100.0%) | 76 (78.3%) |
| 15 Years | 74 (100.0%) | 57 (100.0%) |
| 16 and 17 Years | 48 (96.0%) | 11 (100.0%) |
| 18 to 24 Years | 79 (92.9%) | 77 (100.0%) |
| 25 to 34 Years | 241 (96.8%) | 231 (100.0%) |
| 35 to 44 Years | 148 (77.9%) | 149 (87.6%) |
| 45 to 54 Years | 298 (100.0%) | 257 (89.2%) |
| 55 to 64 Years | 223 (91.0%) | 291 (97.7%) |
| 65 to 74 Years | 217 (100.0%) | 144 (74.2%) |
| 75 Years and over | 62 (100.0%) | 147 (100.0%) |
| Total | 1,569 (94.2%) | 1,672 (91.7%) |
Income Below Poverty Among Married-Couple Families in Haviland
The poverty statistics for married-couple families in Haviland show that 2.9% or 21 of the total 714 families live below the poverty line. Families with 1 or 2 children have the highest poverty rate of 11.8%, comprising of 21 families. On the other hand, families with no children have the lowest poverty rate of 0.0%, which includes 0 families.
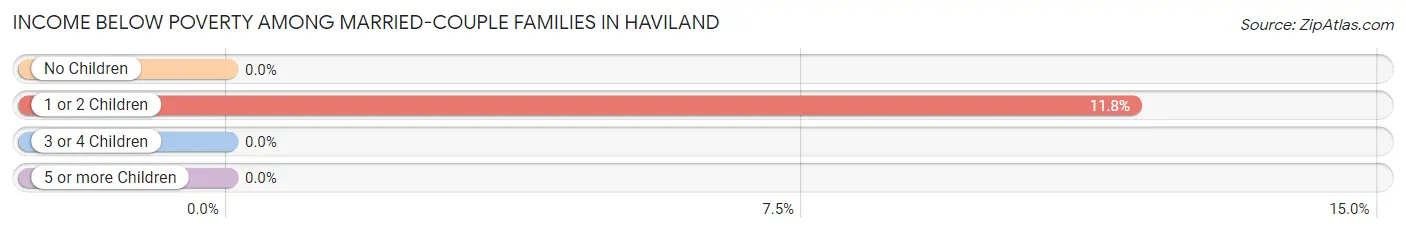
| Children | Above Poverty | Below Poverty |
| No Children | 461 (100.0%) | 0 (0.0%) |
| 1 or 2 Children | 157 (88.2%) | 21 (11.8%) |
| 3 or 4 Children | 75 (100.0%) | 0 (0.0%) |
| 5 or more Children | 0 (0.0%) | 0 (0.0%) |
| Total | 693 (97.1%) | 21 (2.9%) |
Income Below Poverty Among Single-Parent Households in Haviland
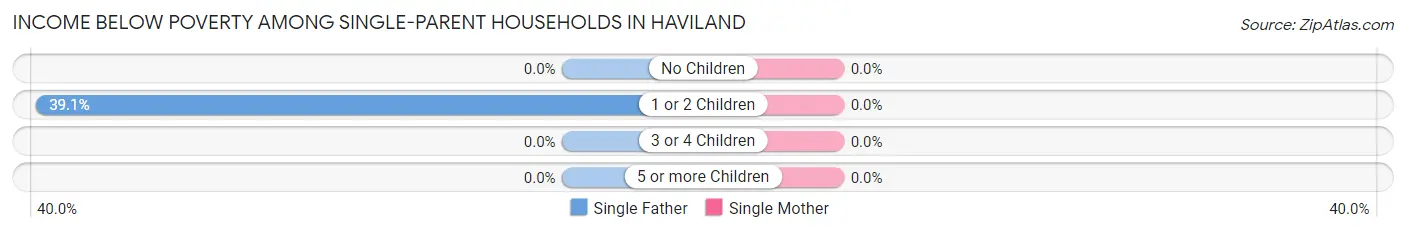
| Children | Single Father | Single Mother |
| No Children | 0 (0.0%) | 0 (0.0%) |
| 1 or 2 Children | 18 (39.1%) | 0 (0.0%) |
| 3 or 4 Children | 0 (0.0%) | 0 (0.0%) |
| 5 or more Children | 0 (0.0%) | 0 (0.0%) |
| Total | 18 (14.3%) | 0 (0.0%) |
Income Below Poverty Among Married-Couple vs Single-Parent Households in Haviland
The poverty data for Haviland shows that 21 of the married-couple family households (2.9%) and 18 of the single-parent households (6.7%) are living below the poverty level. Within the married-couple family households, those with 1 or 2 children have the highest poverty rate, with 21 households (11.8%) falling below the poverty line. Among the single-parent households, those with 1 or 2 children have the highest poverty rate, with 18 household (11.6%) living below poverty.
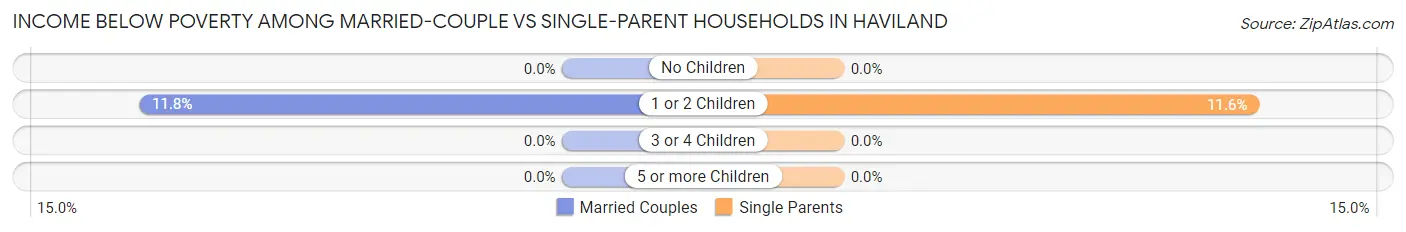
| Children | Married-Couple Families | Single-Parent Households |
| No Children | 0 (0.0%) | 0 (0.0%) |
| 1 or 2 Children | 21 (11.8%) | 18 (11.6%) |
| 3 or 4 Children | 0 (0.0%) | 0 (0.0%) |
| 5 or more Children | 0 (0.0%) | 0 (0.0%) |
| Total | 21 (2.9%) | 18 (6.7%) |
Race in Haviland
The most populous races in Haviland are White / Caucasian (3,178 | 90.8%), Two or more Races (248 | 7.1%), and Hispanic or Latino (117 | 3.3%).
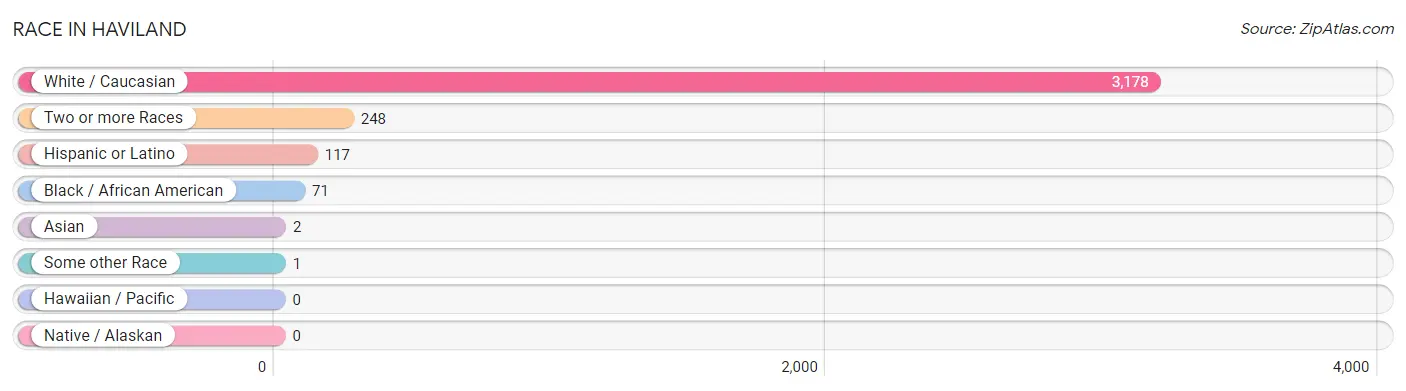
| Race | # Population | % Population |
| Asian | 2 | 0.1% |
| Black / African American | 71 | 2.0% |
| Hawaiian / Pacific | 0 | 0.0% |
| Hispanic or Latino | 117 | 3.3% |
| Native / Alaskan | 0 | 0.0% |
| White / Caucasian | 3,178 | 90.8% |
| Two or more Races | 248 | 7.1% |
| Some other Race | 1 | 0.0% |
| Total | 3,500 | 100.0% |
Ancestry in Haviland
The most populous ancestries reported in Haviland are Irish (655 | 18.7%), Italian (577 | 16.5%), German (458 | 13.1%), English (264 | 7.5%), and European (170 | 4.9%), together accounting for 60.7% of all Haviland residents.
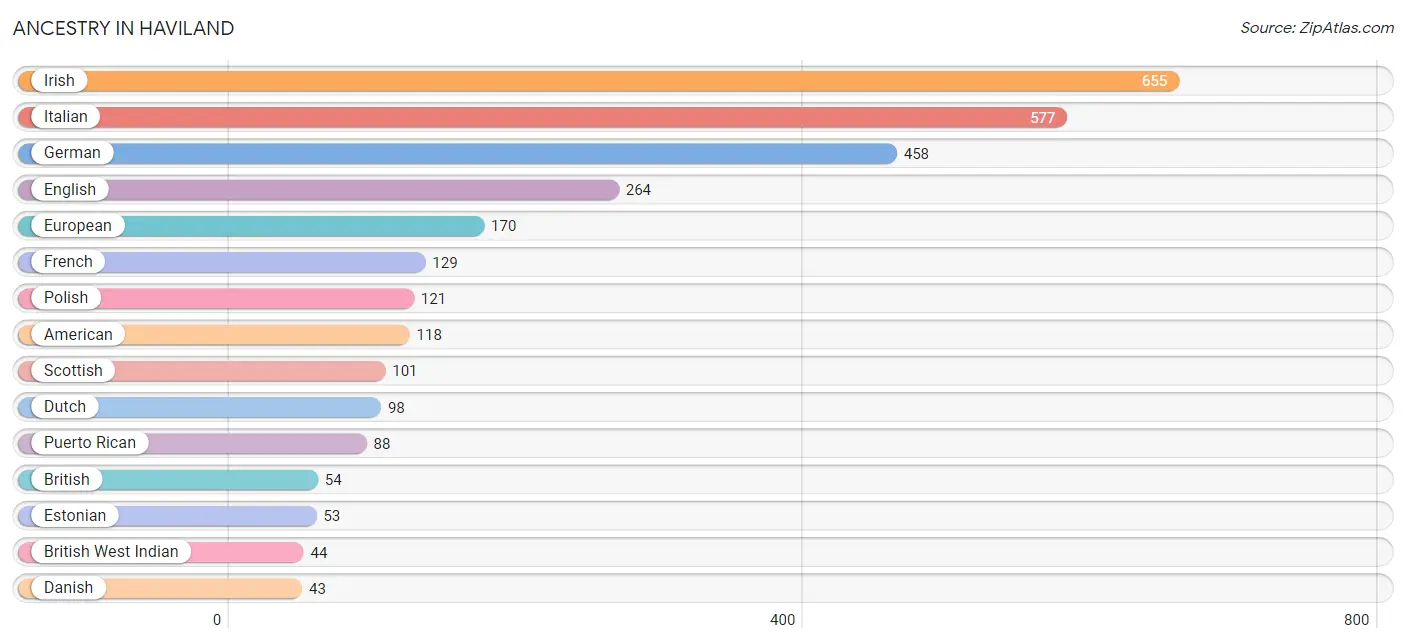
| Ancestry | # Population | % Population |
| American | 118 | 3.4% |
| Belgian | 15 | 0.4% |
| British | 54 | 1.5% |
| British West Indian | 44 | 1.3% |
| Cuban | 15 | 0.4% |
| Danish | 43 | 1.2% |
| Dutch | 98 | 2.8% |
| English | 264 | 7.5% |
| Estonian | 53 | 1.5% |
| European | 170 | 4.9% |
| French | 129 | 3.7% |
| French Canadian | 11 | 0.3% |
| German | 458 | 13.1% |
| Greek | 16 | 0.5% |
| Hungarian | 20 | 0.6% |
| Irish | 655 | 18.7% |
| Italian | 577 | 16.5% |
| Jamaican | 1 | 0.0% |
| Korean | 2 | 0.1% |
| Polish | 121 | 3.5% |
| Portuguese | 22 | 0.6% |
| Puerto Rican | 88 | 2.5% |
| Scottish | 101 | 2.9% |
| Spanish | 13 | 0.4% |
| Swedish | 39 | 1.1% |
| Swiss | 28 | 0.8% | View All 26 Rows |
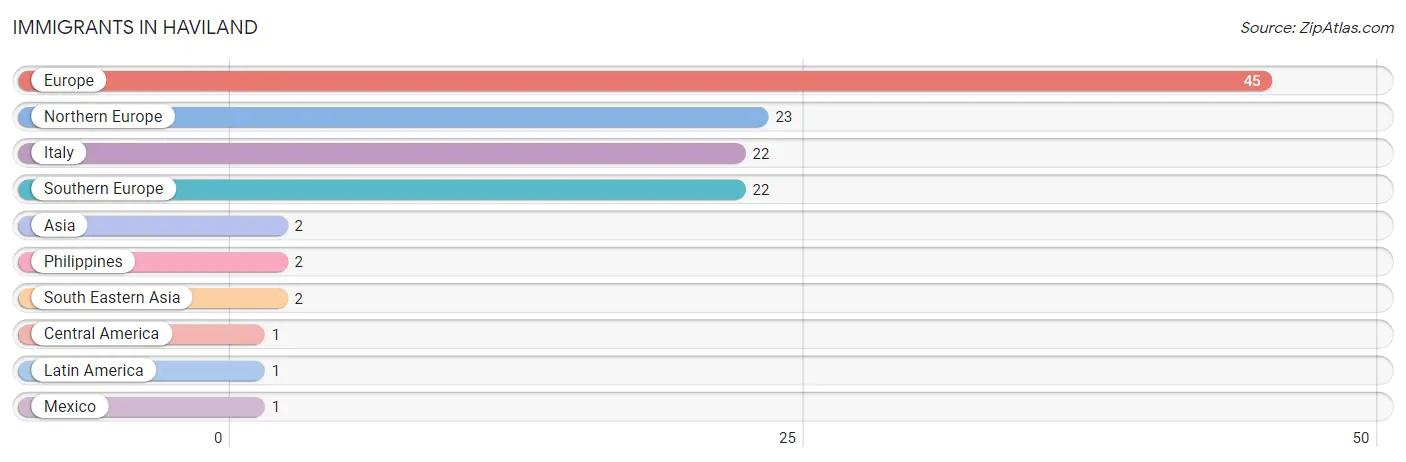
Immigrants in Haviland
The most numerous immigrant groups reported in Haviland came from Europe (45 | 1.3%), Northern Europe (23 | 0.7%), Italy (22 | 0.6%), Southern Europe (22 | 0.6%), and Asia (2 | 0.1%), together accounting for 3.3% of all Haviland residents.
| Immigration Origin | # Population | % Population |
| Asia | 2 | 0.1% |
| Central America | 1 | 0.0% |
| Europe | 45 | 1.3% |
| Italy | 22 | 0.6% |
| Latin America | 1 | 0.0% |
| Mexico | 1 | 0.0% |
| Northern Europe | 23 | 0.7% |
| Philippines | 2 | 0.1% |
| South Eastern Asia | 2 | 0.1% |
| Southern Europe | 22 | 0.6% | View All 10 Rows |
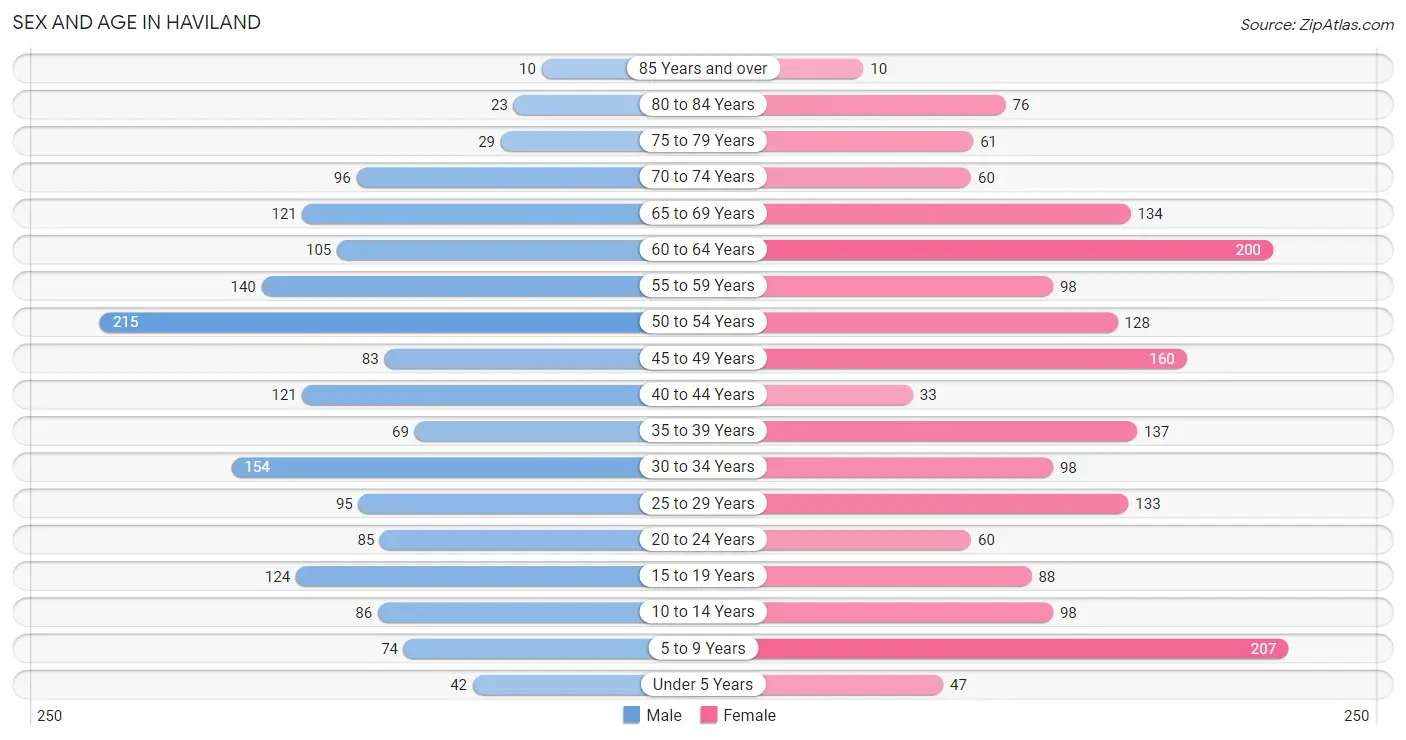
Sex and Age in Haviland
Sex and Age in Haviland
The most populous age groups in Haviland are 50 to 54 Years (215 | 12.9%) for men and 5 to 9 Years (207 | 11.3%) for women.
| Age Bracket | Male | Female |
| Under 5 Years | 42 (2.5%) | 47 (2.6%) |
| 5 to 9 Years | 74 (4.4%) | 207 (11.3%) |
| 10 to 14 Years | 86 (5.1%) | 98 (5.4%) |
| 15 to 19 Years | 124 (7.4%) | 88 (4.8%) |
| 20 to 24 Years | 85 (5.1%) | 60 (3.3%) |
| 25 to 29 Years | 95 (5.7%) | 133 (7.3%) |
| 30 to 34 Years | 154 (9.2%) | 98 (5.4%) |
| 35 to 39 Years | 69 (4.1%) | 137 (7.5%) |
| 40 to 44 Years | 121 (7.2%) | 33 (1.8%) |
| 45 to 49 Years | 83 (5.0%) | 160 (8.7%) |
| 50 to 54 Years | 215 (12.9%) | 128 (7.0%) |
| 55 to 59 Years | 140 (8.4%) | 98 (5.4%) |
| 60 to 64 Years | 105 (6.3%) | 200 (10.9%) |
| 65 to 69 Years | 121 (7.2%) | 134 (7.3%) |
| 70 to 74 Years | 96 (5.7%) | 60 (3.3%) |
| 75 to 79 Years | 29 (1.7%) | 61 (3.3%) |
| 80 to 84 Years | 23 (1.4%) | 76 (4.2%) |
| 85 Years and over | 10 (0.6%) | 10 (0.5%) |
| Total | 1,672 (100.0%) | 1,828 (100.0%) |
Families and Households in Haviland
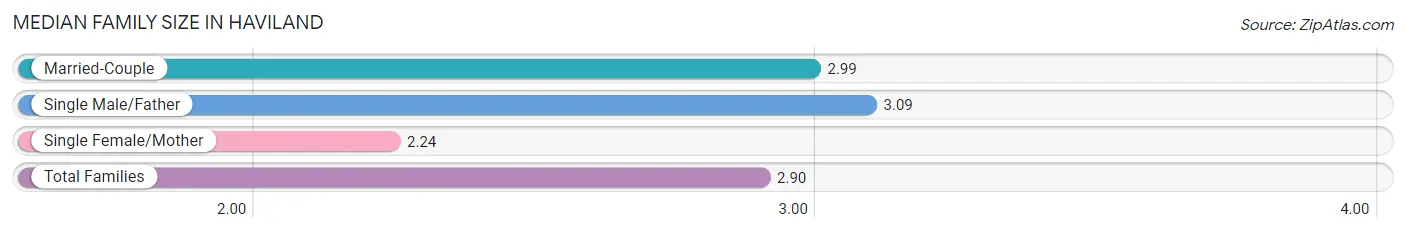
Median Family Size in Haviland
The median family size in Haviland is 2.90 persons per family, with single male/father families (126 | 12.8%) accounting for the largest median family size of 3.09 persons per family. On the other hand, single female/mother families (141 | 14.4%) represent the smallest median family size with 2.24 persons per family.
| Family Type | # Families | Family Size |
| Married-Couple | 714 (72.8%) | 2.99 |
| Single Male/Father | 126 (12.8%) | 3.09 |
| Single Female/Mother | 141 (14.4%) | 2.24 |
| Total Families | 981 (100.0%) | 2.90 |
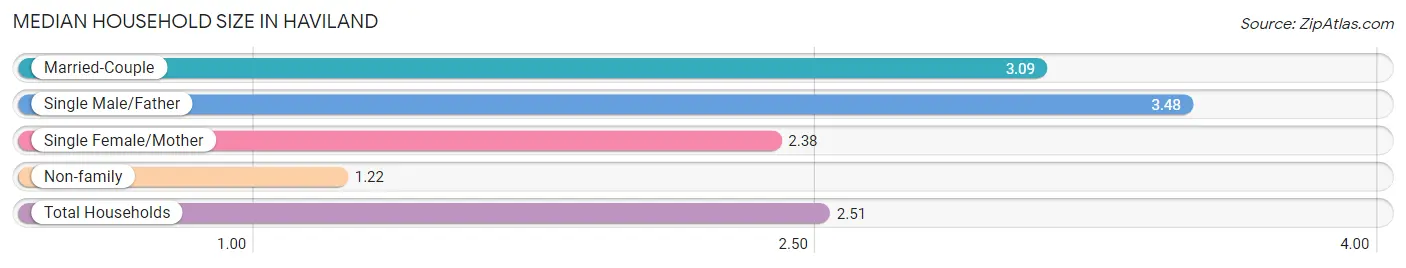
Median Household Size in Haviland
The median household size in Haviland is 2.51 persons per household, with single male/father households (126 | 9.2%) accounting for the largest median household size of 3.48 persons per household. non-family households (395 | 28.7%) represent the smallest median household size with 1.22 persons per household.
| Household Type | # Households | Household Size |
| Married-Couple | 714 (51.9%) | 3.09 |
| Single Male/Father | 126 (9.2%) | 3.48 |
| Single Female/Mother | 141 (10.2%) | 2.38 |
| Non-family | 395 (28.7%) | 1.22 |
| Total Households | 1,376 (100.0%) | 2.51 |
Household Size by Marriage Status in Haviland
Out of a total of 1,376 households in Haviland, 981 (71.3%) are family households, while 395 (28.7%) are nonfamily households. The most numerous type of family households are 2-person households, comprising 440, and the most common type of nonfamily households are 1-person households, comprising 308.
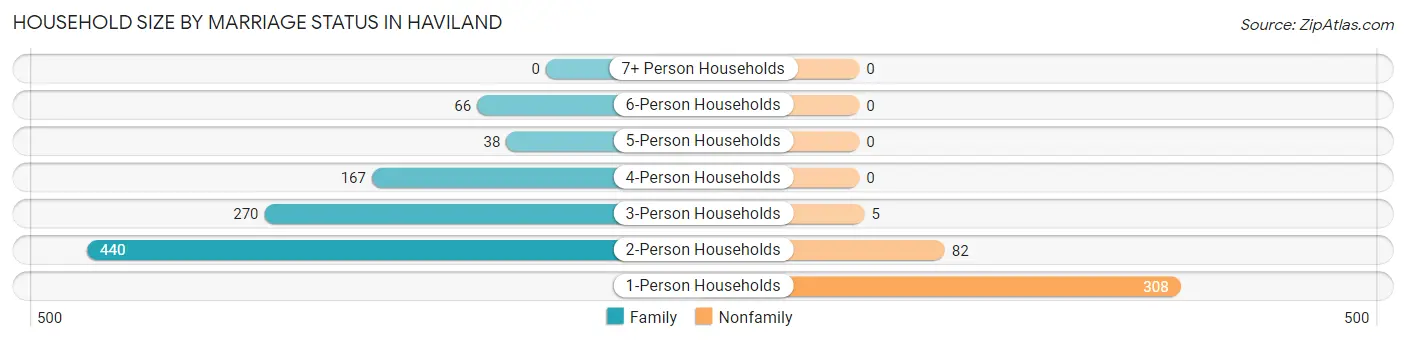
| Household Size | Family Households | Nonfamily Households |
| 1-Person Households | - | 308 (22.4%) |
| 2-Person Households | 440 (32.0%) | 82 (6.0%) |
| 3-Person Households | 270 (19.6%) | 5 (0.4%) |
| 4-Person Households | 167 (12.1%) | 0 (0.0%) |
| 5-Person Households | 38 (2.8%) | 0 (0.0%) |
| 6-Person Households | 66 (4.8%) | 0 (0.0%) |
| 7+ Person Households | 0 (0.0%) | 0 (0.0%) |
| Total | 981 (71.3%) | 395 (28.7%) |
Female Fertility in Haviland
Fertility by Age in Haviland
Average fertility rate in Haviland is 15.0 births per 1,000 women. Women in the age bracket of 20 to 34 years have the highest fertility rate with 38.0 births per 1,000 women. Women in the age bracket of 20 to 34 years acount for 100.0% of all women with births.
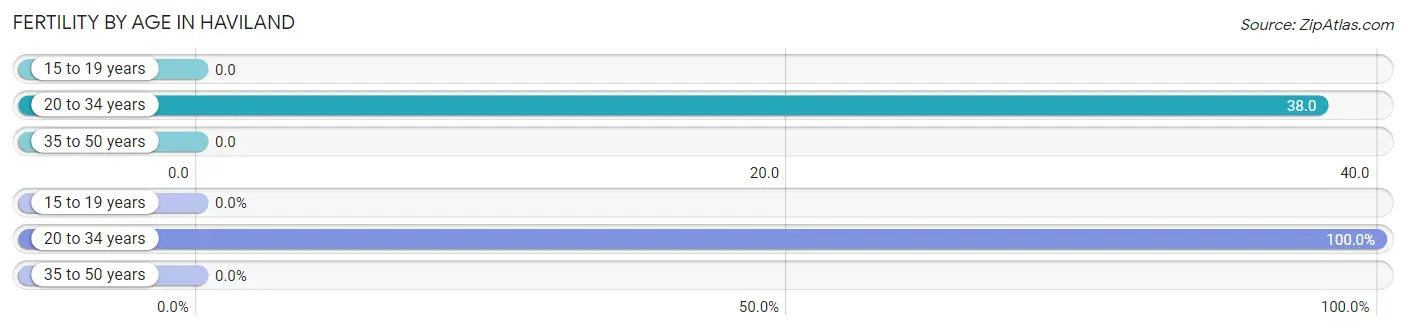
| Age Bracket | Women with Births | Births / 1,000 Women |
| 15 to 19 years | 0 (0.0%) | 0.0 |
| 20 to 34 years | 11 (100.0%) | 38.0 |
| 35 to 50 years | 0 (0.0%) | 0.0 |
| Total | 11 (100.0%) | 15.0 |
Fertility by Age by Marriage Status in Haviland
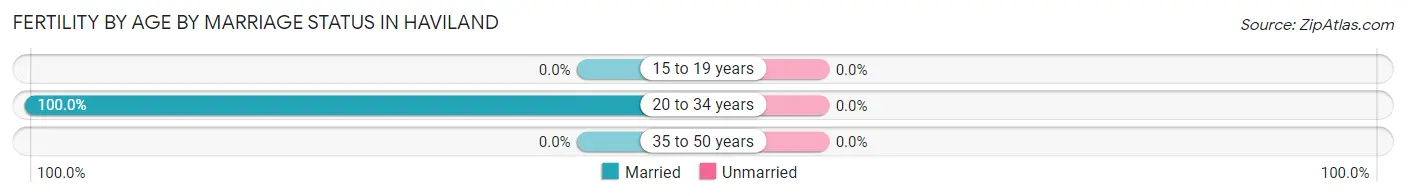
| Age Bracket | Married | Unmarried |
| 15 to 19 years | 0 (0.0%) | 0 (0.0%) |
| 20 to 34 years | 11 (100.0%) | 0 (0.0%) |
| 35 to 50 years | 0 (0.0%) | 0 (0.0%) |
| Total | 11 (100.0%) | 0 (0.0%) |
Fertility by Education in Haviland
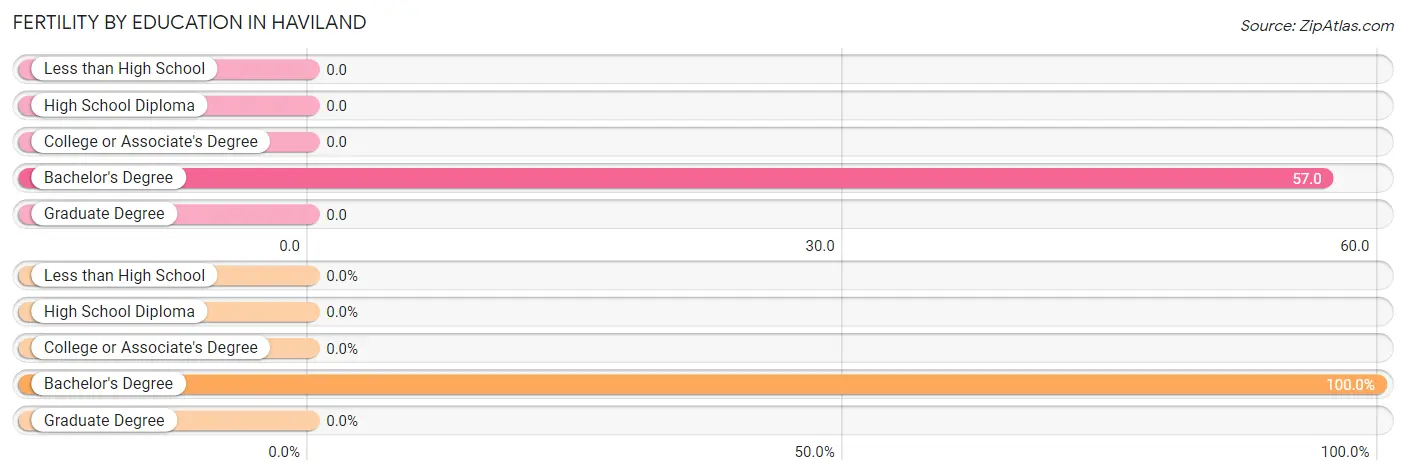
| Educational Attainment | Women with Births | Births / 1,000 Women |
| Less than High School | 0 (0.0%) | 0.0 |
| High School Diploma | 0 (0.0%) | 0.0 |
| College or Associate's Degree | 0 (0.0%) | 0.0 |
| Bachelor's Degree | 11 (100.0%) | 57.0 |
| Graduate Degree | 0 (0.0%) | 0.0 |
| Total | 11 (100.0%) | 15.0 |
Fertility by Education by Marriage Status in Haviland
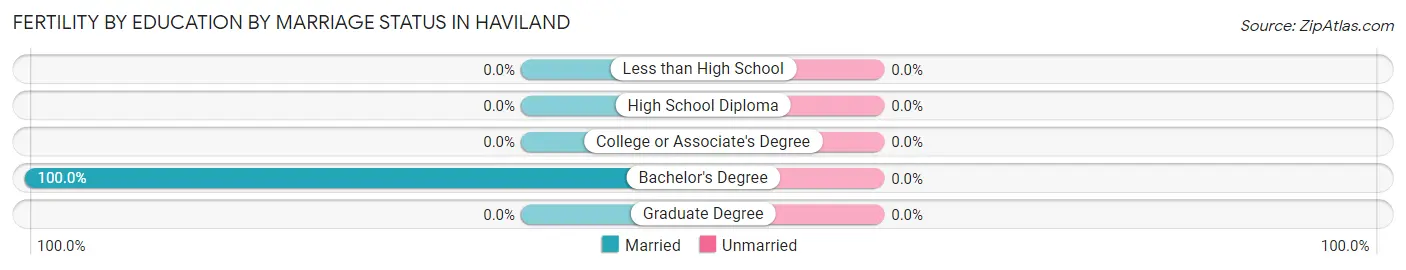
| Educational Attainment | Married | Unmarried |
| Less than High School | 0 (0.0%) | 0 (0.0%) |
| High School Diploma | 0 (0.0%) | 0 (0.0%) |
| College or Associate's Degree | 0 (0.0%) | 0 (0.0%) |
| Bachelor's Degree | 11 (100.0%) | 0 (0.0%) |
| Graduate Degree | 0 (0.0%) | 0 (0.0%) |
| Total | 11 (100.0%) | 0 (0.0%) |
Employment Characteristics in Haviland
Employment by Class of Employer in Haviland
Among the 1,733 employed individuals in Haviland, private company employees (1,088 | 62.8%), not-for-profit organizations (237 | 13.7%), and local government employees (154 | 8.9%) make up the most common classes of employment.
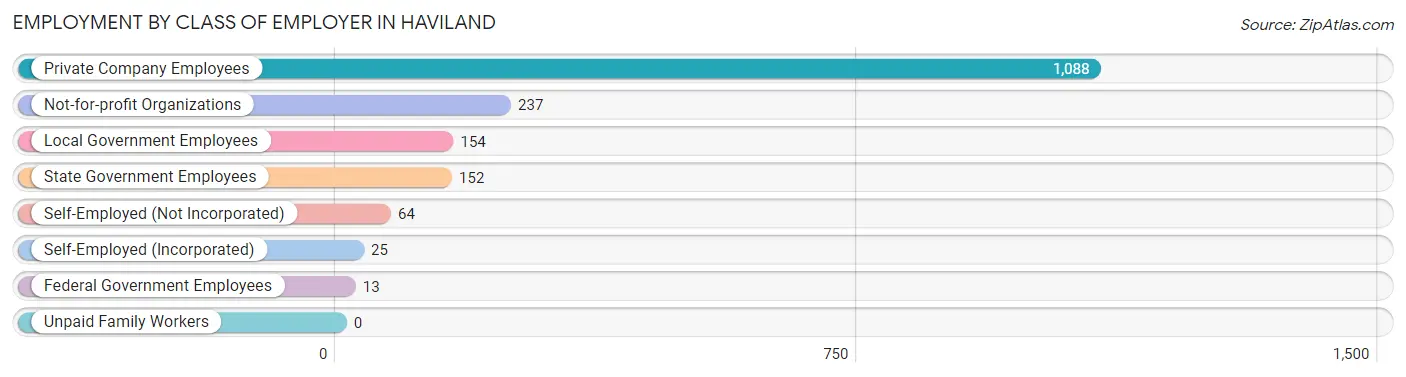
| Employer Class | # Employees | % Employees |
| Private Company Employees | 1,088 | 62.8% |
| Self-Employed (Incorporated) | 25 | 1.4% |
| Self-Employed (Not Incorporated) | 64 | 3.7% |
| Not-for-profit Organizations | 237 | 13.7% |
| Local Government Employees | 154 | 8.9% |
| State Government Employees | 152 | 8.8% |
| Federal Government Employees | 13 | 0.7% |
| Unpaid Family Workers | 0 | 0.0% |
| Total | 1,733 | 100.0% |
Employment Status by Age in Haviland
According to the labor force statistics for Haviland, out of the total population over 16 years of age (2,815), 67.1% or 1,889 individuals are in the labor force, with 8.3% or 157 of them unemployed. The age group with the highest labor force participation rate is 30 to 34 years, with 96.8% or 244 individuals in the labor force. Within the labor force, the 20 to 24 years age range has the highest percentage of unemployed individuals, with 21.0% or 26 of them being unemployed.
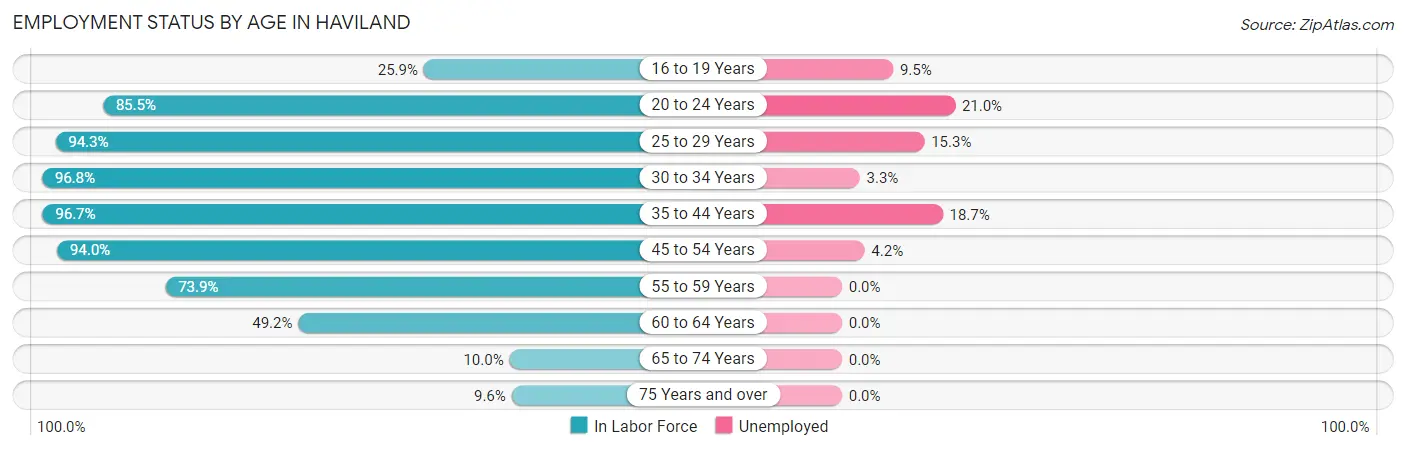
| Age Bracket | In Labor Force | Unemployed |
| 16 to 19 Years | 21 (25.9%) | 2 (9.5%) |
| 20 to 24 Years | 124 (85.5%) | 26 (21.0%) |
| 25 to 29 Years | 215 (94.3%) | 33 (15.3%) |
| 30 to 34 Years | 244 (96.8%) | 8 (3.3%) |
| 35 to 44 Years | 348 (96.7%) | 65 (18.7%) |
| 45 to 54 Years | 551 (94.0%) | 23 (4.2%) |
| 55 to 59 Years | 176 (73.9%) | 0 (0.0%) |
| 60 to 64 Years | 150 (49.2%) | 0 (0.0%) |
| 65 to 74 Years | 41 (10.0%) | 0 (0.0%) |
| 75 Years and over | 20 (9.6%) | 0 (0.0%) |
| Total | 1,889 (67.1%) | 157 (8.3%) |
Employment Status by Educational Attainment in Haviland
According to labor force statistics for Haviland, 85.5% of individuals (1,683) out of the total population between 25 and 64 years of age (1,969) are in the labor force, with 7.7% or 130 of them being unemployed. The group with the highest labor force participation rate are those with the educational attainment of less than high school, with 100.0% or 39 individuals in the labor force. Within the labor force, individuals with less than high school education have the highest percentage of unemployment, with 61.5% or 24 of them being unemployed.
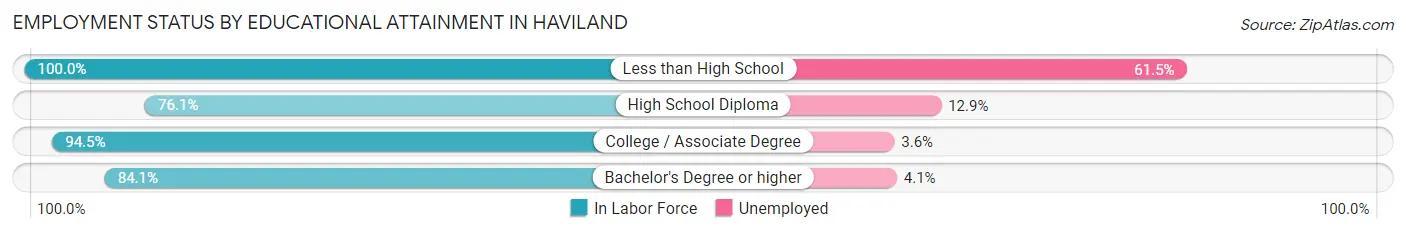
| Educational Attainment | In Labor Force | Unemployed |
| Less than High School | 39 (100.0%) | 24 (61.5%) |
| High School Diploma | 466 (76.1%) | 79 (12.9%) |
| College / Associate Degree | 638 (94.5%) | 24 (3.6%) |
| Bachelor's Degree or higher | 541 (84.1%) | 26 (4.1%) |
| Total | 1,683 (85.5%) | 152 (7.7%) |
Employment Occupations by Sex in Haviland
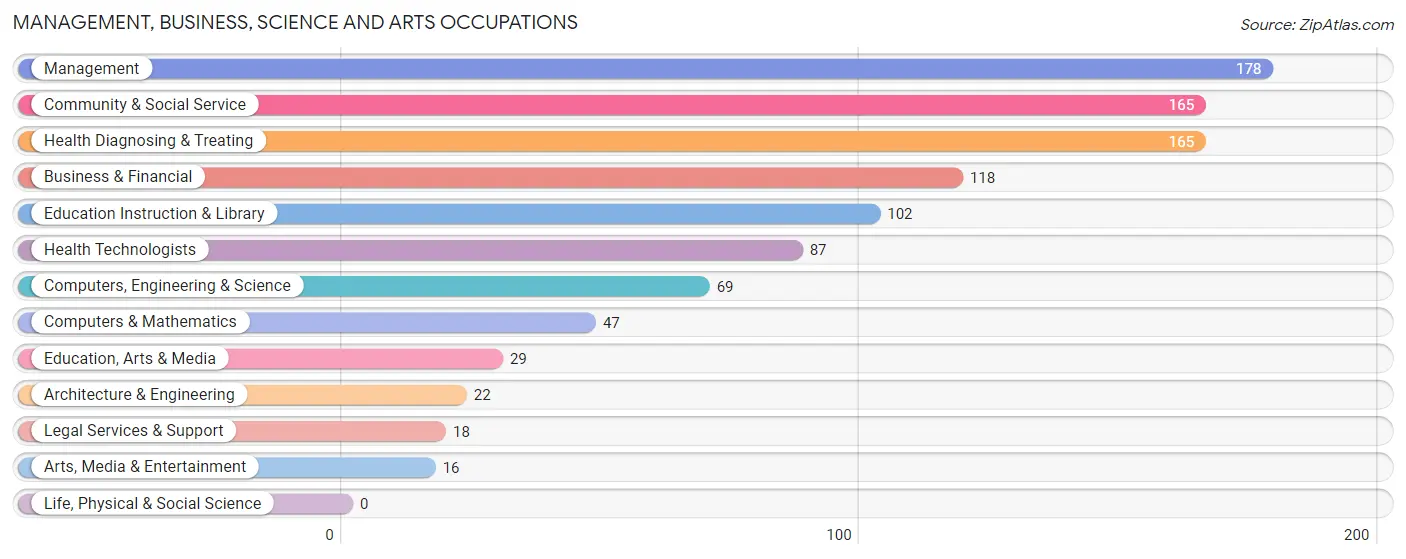
Management, Business, Science and Arts Occupations
The most common Management, Business, Science and Arts occupations in Haviland are Management (178 | 10.3%), Community & Social Service (165 | 9.5%), Health Diagnosing & Treating (165 | 9.5%), Business & Financial (118 | 6.8%), and Education Instruction & Library (102 | 5.9%).
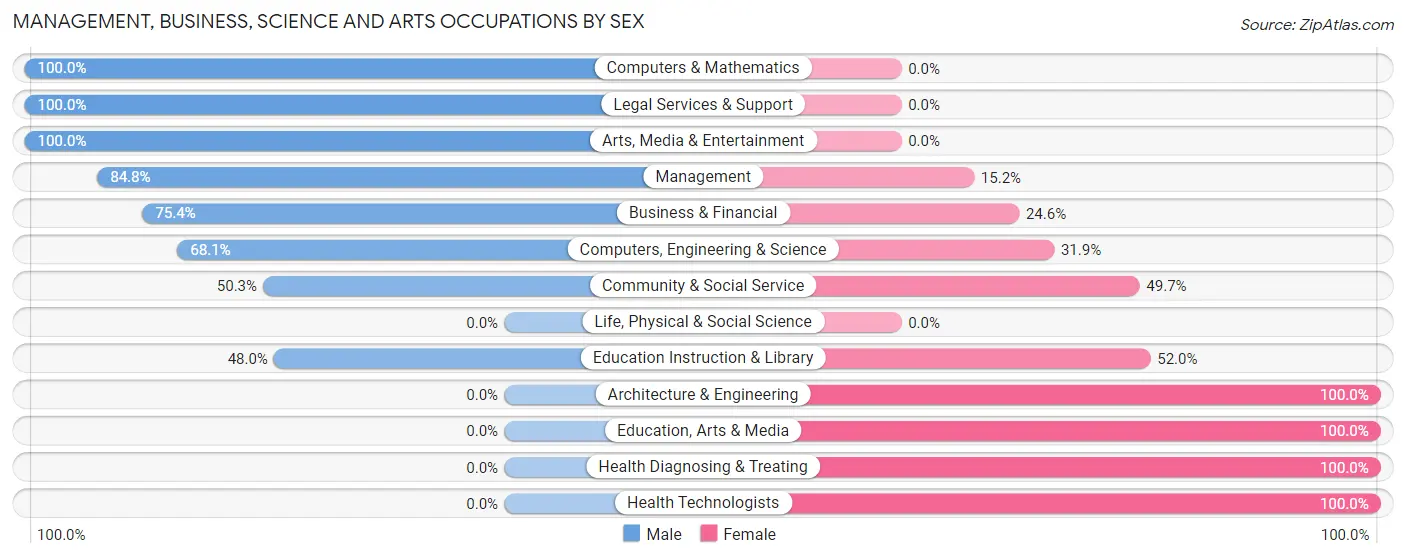
Management, Business, Science and Arts Occupations by Sex
Within the Management, Business, Science and Arts occupations in Haviland, the most male-oriented occupations are Computers & Mathematics (100.0%), Legal Services & Support (100.0%), and Arts, Media & Entertainment (100.0%), while the most female-oriented occupations are Architecture & Engineering (100.0%), Education, Arts & Media (100.0%), and Health Diagnosing & Treating (100.0%).
| Occupation | Male | Female |
| Management | 151 (84.8%) | 27 (15.2%) |
| Business & Financial | 89 (75.4%) | 29 (24.6%) |
| Computers, Engineering & Science | 47 (68.1%) | 22 (31.9%) |
| Computers & Mathematics | 47 (100.0%) | 0 (0.0%) |
| Architecture & Engineering | 0 (0.0%) | 22 (100.0%) |
| Life, Physical & Social Science | 0 (0.0%) | 0 (0.0%) |
| Community & Social Service | 83 (50.3%) | 82 (49.7%) |
| Education, Arts & Media | 0 (0.0%) | 29 (100.0%) |
| Legal Services & Support | 18 (100.0%) | 0 (0.0%) |
| Education Instruction & Library | 49 (48.0%) | 53 (52.0%) |
| Arts, Media & Entertainment | 16 (100.0%) | 0 (0.0%) |
| Health Diagnosing & Treating | 0 (0.0%) | 165 (100.0%) |
| Health Technologists | 0 (0.0%) | 87 (100.0%) |
| Total (Category) | 370 (53.2%) | 325 (46.8%) |
| Total (Overall) | 909 (52.4%) | 824 (47.5%) |
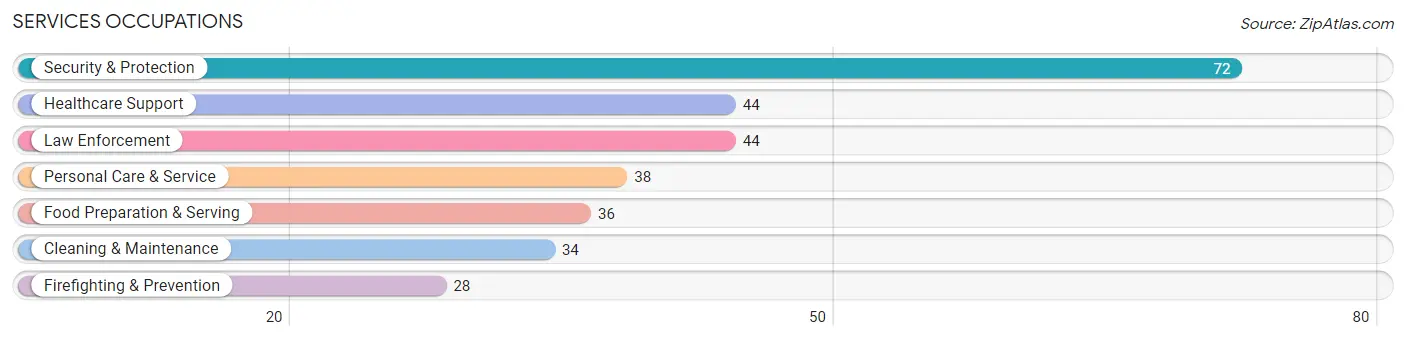
Services Occupations
The most common Services occupations in Haviland are Security & Protection (72 | 4.2%), Healthcare Support (44 | 2.5%), Law Enforcement (44 | 2.5%), Personal Care & Service (38 | 2.2%), and Food Preparation & Serving (36 | 2.1%).
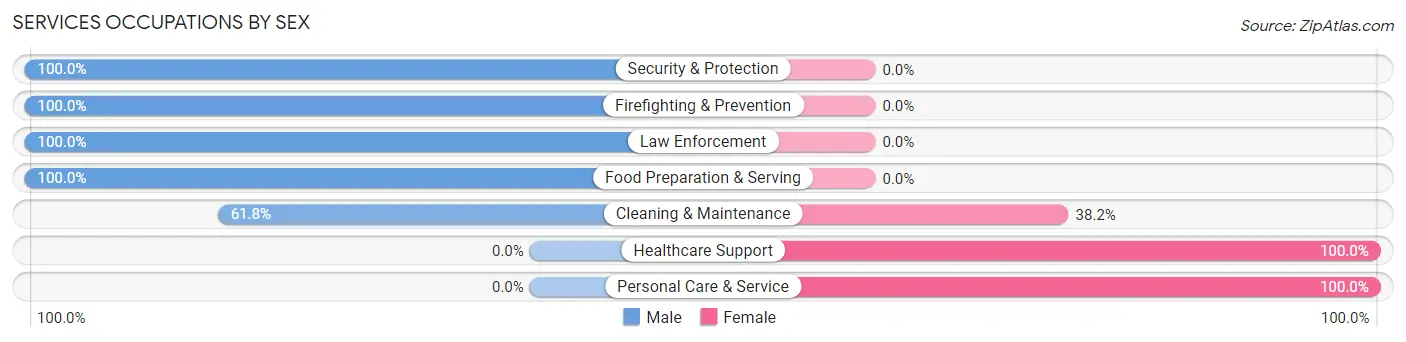
Services Occupations by Sex
Within the Services occupations in Haviland, the most male-oriented occupations are Security & Protection (100.0%), Firefighting & Prevention (100.0%), and Law Enforcement (100.0%), while the most female-oriented occupations are Healthcare Support (100.0%), Personal Care & Service (100.0%), and Cleaning & Maintenance (38.2%).
| Occupation | Male | Female |
| Healthcare Support | 0 (0.0%) | 44 (100.0%) |
| Security & Protection | 72 (100.0%) | 0 (0.0%) |
| Firefighting & Prevention | 28 (100.0%) | 0 (0.0%) |
| Law Enforcement | 44 (100.0%) | 0 (0.0%) |
| Food Preparation & Serving | 36 (100.0%) | 0 (0.0%) |
| Cleaning & Maintenance | 21 (61.8%) | 13 (38.2%) |
| Personal Care & Service | 0 (0.0%) | 38 (100.0%) |
| Total (Category) | 129 (57.6%) | 95 (42.4%) |
| Total (Overall) | 909 (52.4%) | 824 (47.5%) |
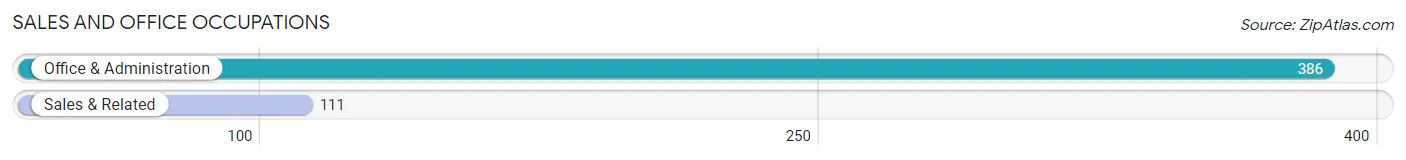
Sales and Office Occupations
The most common Sales and Office occupations in Haviland are Office & Administration (386 | 22.3%), and Sales & Related (111 | 6.4%).
Sales and Office Occupations by Sex
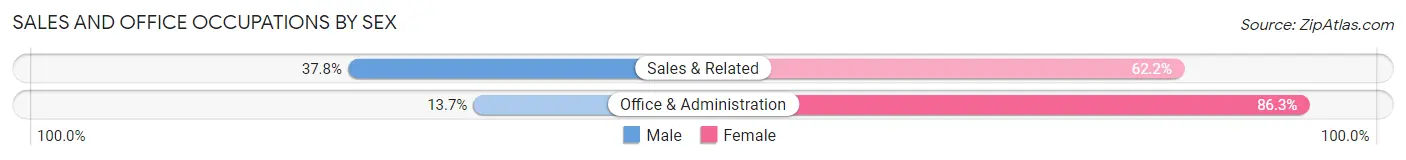
| Occupation | Male | Female |
| Sales & Related | 42 (37.8%) | 69 (62.2%) |
| Office & Administration | 53 (13.7%) | 333 (86.3%) |
| Total (Category) | 95 (19.1%) | 402 (80.9%) |
| Total (Overall) | 909 (52.4%) | 824 (47.5%) |
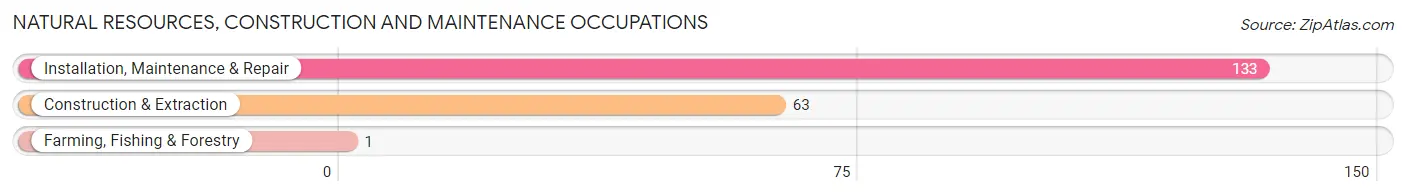
Natural Resources, Construction and Maintenance Occupations
The most common Natural Resources, Construction and Maintenance occupations in Haviland are Installation, Maintenance & Repair (133 | 7.7%), Construction & Extraction (63 | 3.6%), and Farming, Fishing & Forestry (1 | 0.1%).
Natural Resources, Construction and Maintenance Occupations by Sex
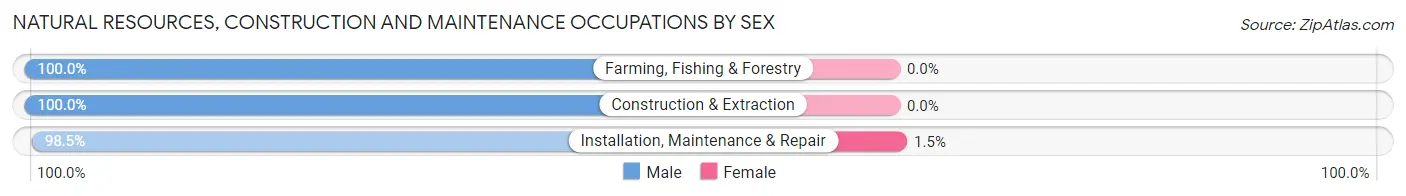
| Occupation | Male | Female |
| Farming, Fishing & Forestry | 1 (100.0%) | 0 (0.0%) |
| Construction & Extraction | 63 (100.0%) | 0 (0.0%) |
| Installation, Maintenance & Repair | 131 (98.5%) | 2 (1.5%) |
| Total (Category) | 195 (99.0%) | 2 (1.0%) |
| Total (Overall) | 909 (52.4%) | 824 (47.5%) |
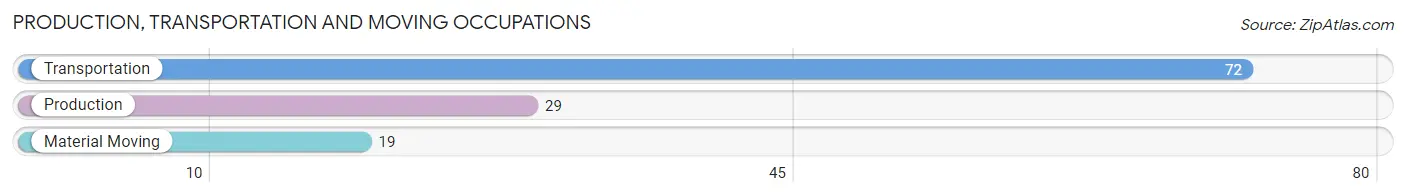
Production, Transportation and Moving Occupations
The most common Production, Transportation and Moving occupations in Haviland are Transportation (72 | 4.2%), Production (29 | 1.7%), and Material Moving (19 | 1.1%).
Production, Transportation and Moving Occupations by Sex
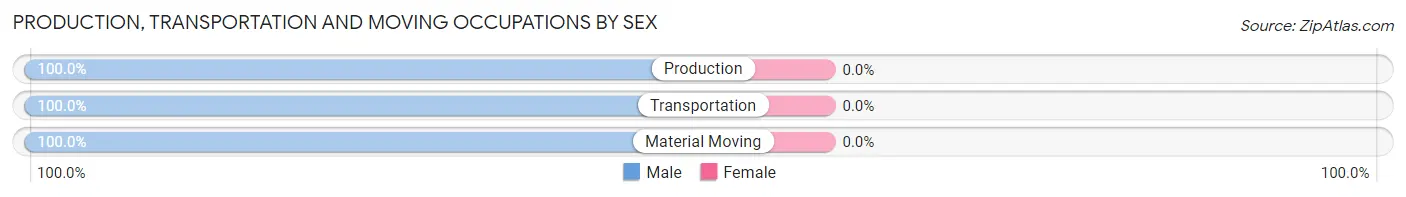
| Occupation | Male | Female |
| Production | 29 (100.0%) | 0 (0.0%) |
| Transportation | 72 (100.0%) | 0 (0.0%) |
| Material Moving | 19 (100.0%) | 0 (0.0%) |
| Total (Category) | 120 (100.0%) | 0 (0.0%) |
| Total (Overall) | 909 (52.4%) | 824 (47.5%) |
Employment Industries by Sex in Haviland
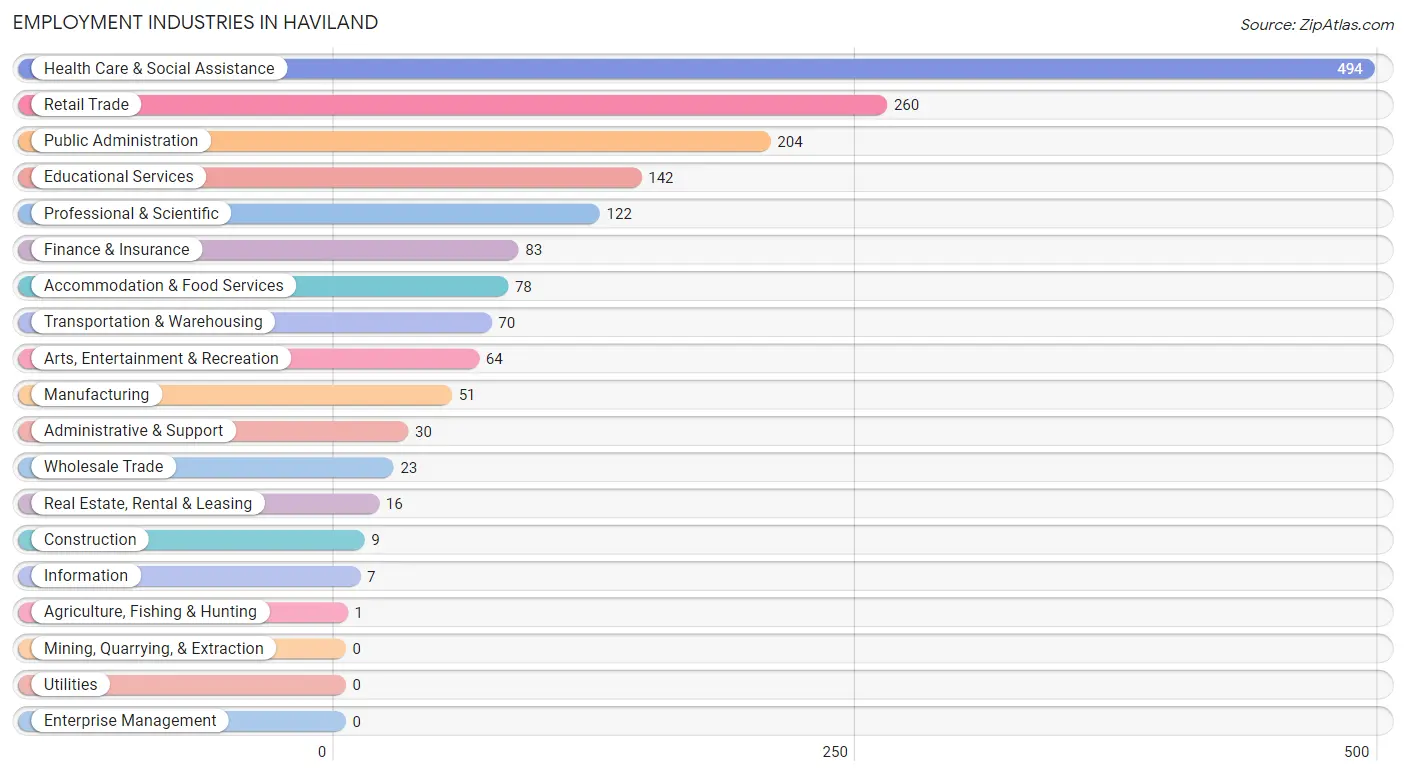
Employment Industries in Haviland
The major employment industries in Haviland include Health Care & Social Assistance (494 | 28.5%), Retail Trade (260 | 15.0%), Public Administration (204 | 11.8%), Educational Services (142 | 8.2%), and Professional & Scientific (122 | 7.0%).
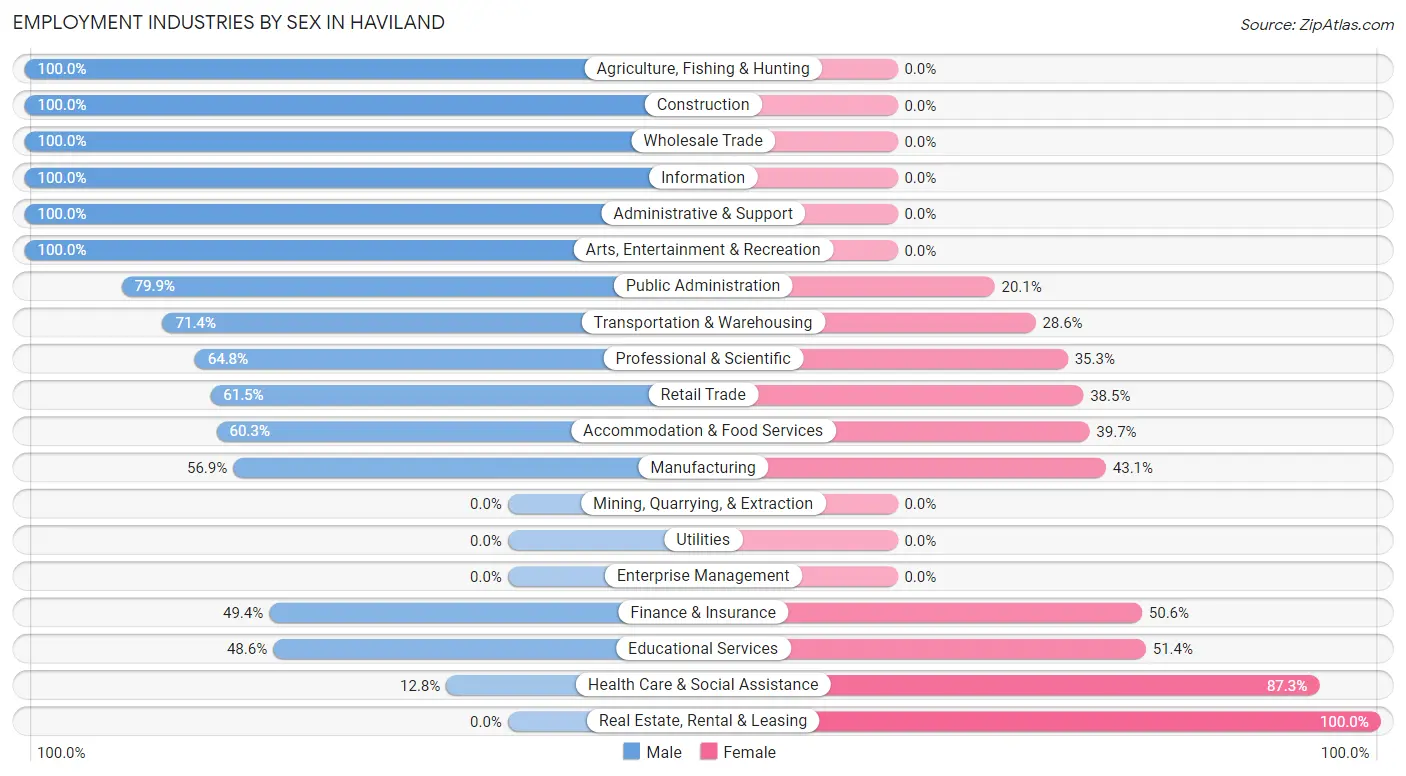
Employment Industries by Sex in Haviland
The Haviland industries that see more men than women are Agriculture, Fishing & Hunting (100.0%), Construction (100.0%), and Wholesale Trade (100.0%), whereas the industries that tend to have a higher number of women are Real Estate, Rental & Leasing (100.0%), Health Care & Social Assistance (87.3%), and Educational Services (51.4%).
| Industry | Male | Female |
| Agriculture, Fishing & Hunting | 1 (100.0%) | 0 (0.0%) |
| Mining, Quarrying, & Extraction | 0 (0.0%) | 0 (0.0%) |
| Construction | 9 (100.0%) | 0 (0.0%) |
| Manufacturing | 29 (56.9%) | 22 (43.1%) |
| Wholesale Trade | 23 (100.0%) | 0 (0.0%) |
| Retail Trade | 160 (61.5%) | 100 (38.5%) |
| Transportation & Warehousing | 50 (71.4%) | 20 (28.6%) |
| Utilities | 0 (0.0%) | 0 (0.0%) |
| Information | 7 (100.0%) | 0 (0.0%) |
| Finance & Insurance | 41 (49.4%) | 42 (50.6%) |
| Real Estate, Rental & Leasing | 0 (0.0%) | 16 (100.0%) |
| Professional & Scientific | 79 (64.7%) | 43 (35.2%) |
| Enterprise Management | 0 (0.0%) | 0 (0.0%) |
| Administrative & Support | 30 (100.0%) | 0 (0.0%) |
| Educational Services | 69 (48.6%) | 73 (51.4%) |
| Health Care & Social Assistance | 63 (12.8%) | 431 (87.3%) |
| Arts, Entertainment & Recreation | 64 (100.0%) | 0 (0.0%) |
| Accommodation & Food Services | 47 (60.3%) | 31 (39.7%) |
| Public Administration | 163 (79.9%) | 41 (20.1%) |
| Total | 909 (52.4%) | 824 (47.5%) |
Education in Haviland
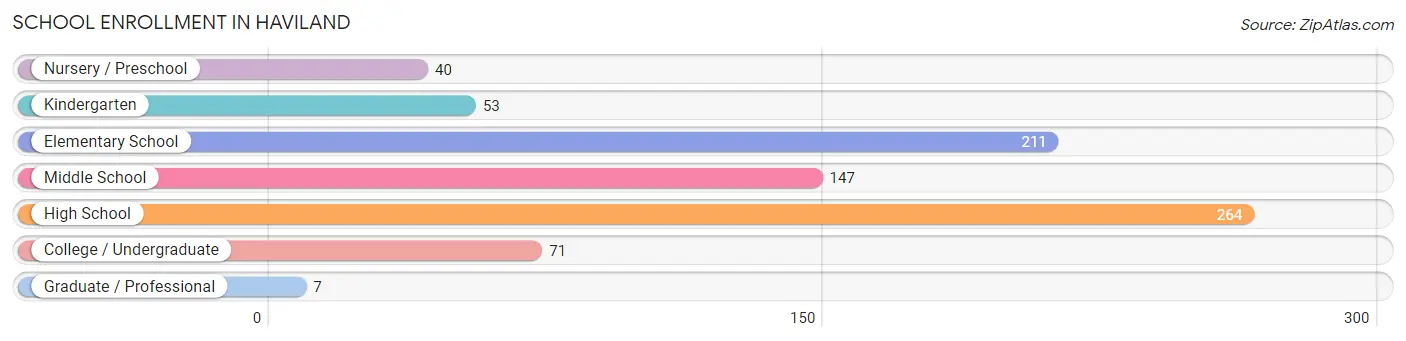
School Enrollment in Haviland
The most common levels of schooling among the 793 students in Haviland are high school (264 | 33.3%), elementary school (211 | 26.6%), and middle school (147 | 18.5%).
| School Level | # Students | % Students |
| Nursery / Preschool | 40 | 5.0% |
| Kindergarten | 53 | 6.7% |
| Elementary School | 211 | 26.6% |
| Middle School | 147 | 18.5% |
| High School | 264 | 33.3% |
| College / Undergraduate | 71 | 8.9% |
| Graduate / Professional | 7 | 0.9% |
| Total | 793 | 100.0% |
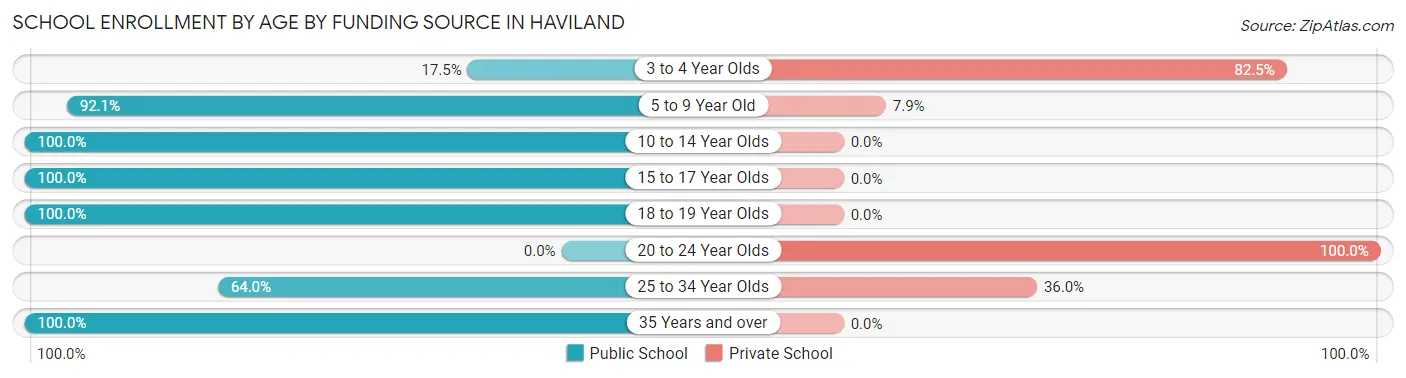
School Enrollment by Age by Funding Source in Haviland
Out of a total of 793 students who are enrolled in schools in Haviland, 90 (11.3%) attend a private institution, while the remaining 703 (88.7%) are enrolled in public schools. The age group of 20 to 24 year olds has the highest likelihood of being enrolled in private schools, with 26 (100.0% in the age bracket) enrolled. Conversely, the age group of 10 to 14 year olds has the lowest likelihood of being enrolled in a private school, with 184 (100.0% in the age bracket) attending a public institution.
| Age Bracket | Public School | Private School |
| 3 to 4 Year Olds | 7 (17.5%) | 33 (82.5%) |
| 5 to 9 Year Old | 258 (92.1%) | 22 (7.9%) |
| 10 to 14 Year Olds | 184 (100.0%) | 0 (0.0%) |
| 15 to 17 Year Olds | 194 (100.0%) | 0 (0.0%) |
| 18 to 19 Year Olds | 17 (100.0%) | 0 (0.0%) |
| 20 to 24 Year Olds | 0 (0.0%) | 26 (100.0%) |
| 25 to 34 Year Olds | 16 (64.0%) | 9 (36.0%) |
| 35 Years and over | 27 (100.0%) | 0 (0.0%) |
| Total | 703 (88.7%) | 90 (11.3%) |
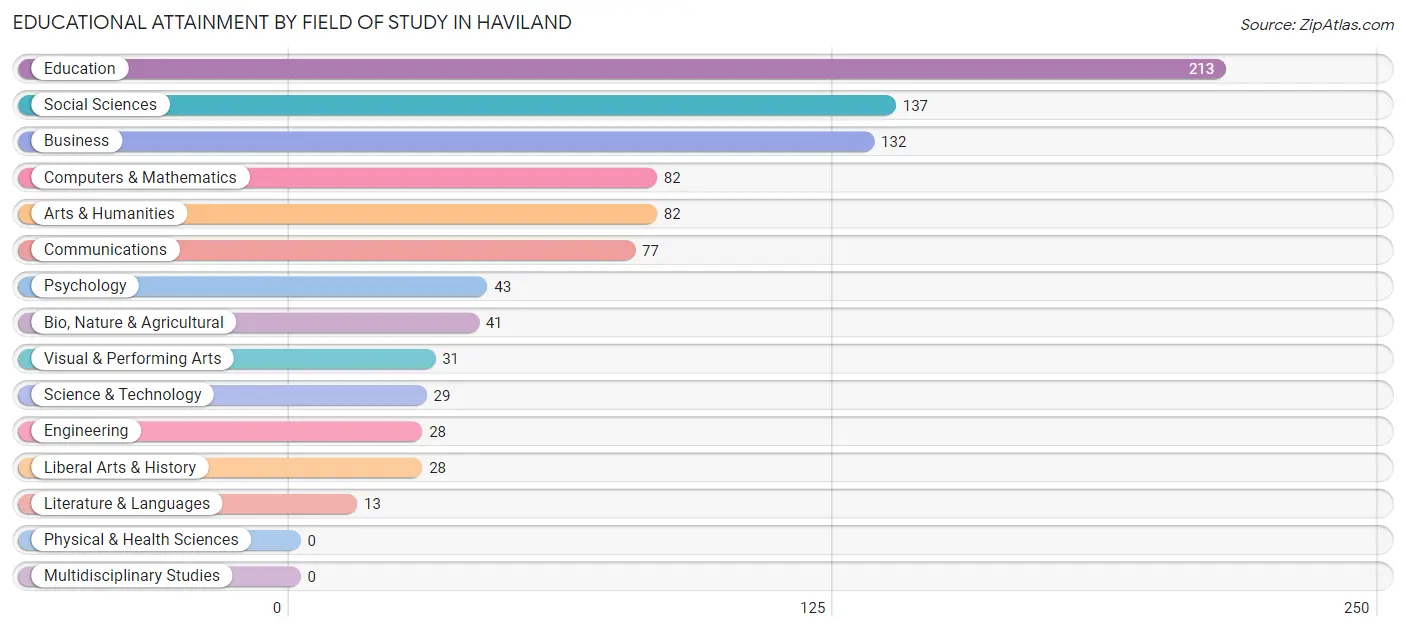
Educational Attainment by Field of Study in Haviland
Education (213 | 22.8%), social sciences (137 | 14.6%), business (132 | 14.1%), computers & mathematics (82 | 8.8%), and arts & humanities (82 | 8.8%) are the most common fields of study among 936 individuals in Haviland who have obtained a bachelor's degree or higher.
| Field of Study | # Graduates | % Graduates |
| Computers & Mathematics | 82 | 8.8% |
| Bio, Nature & Agricultural | 41 | 4.4% |
| Physical & Health Sciences | 0 | 0.0% |
| Psychology | 43 | 4.6% |
| Social Sciences | 137 | 14.6% |
| Engineering | 28 | 3.0% |
| Multidisciplinary Studies | 0 | 0.0% |
| Science & Technology | 29 | 3.1% |
| Business | 132 | 14.1% |
| Education | 213 | 22.8% |
| Literature & Languages | 13 | 1.4% |
| Liberal Arts & History | 28 | 3.0% |
| Visual & Performing Arts | 31 | 3.3% |
| Communications | 77 | 8.2% |
| Arts & Humanities | 82 | 8.8% |
| Total | 936 | 100.0% |
Transportation & Commute in Haviland
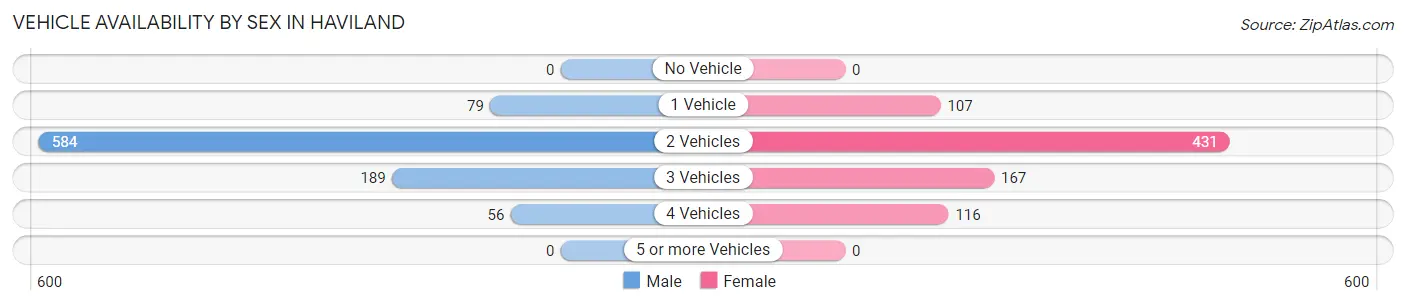
Vehicle Availability by Sex in Haviland
The most prevalent vehicle ownership categories in Haviland are males with 2 vehicles (584, accounting for 64.3%) and females with 2 vehicles (431, making up 71.1%).
| Vehicles Available | Male | Female |
| No Vehicle | 0 (0.0%) | 0 (0.0%) |
| 1 Vehicle | 79 (8.7%) | 107 (13.0%) |
| 2 Vehicles | 584 (64.3%) | 431 (52.5%) |
| 3 Vehicles | 189 (20.8%) | 167 (20.3%) |
| 4 Vehicles | 56 (6.2%) | 116 (14.1%) |
| 5 or more Vehicles | 0 (0.0%) | 0 (0.0%) |
| Total | 908 (100.0%) | 821 (100.0%) |
Commute Time in Haviland
The most frequently occuring commute durations in Haviland are 15 to 19 minutes (313 commuters, 19.7%), 10 to 14 minutes (221 commuters, 13.9%), and 5 to 9 minutes (211 commuters, 13.3%).
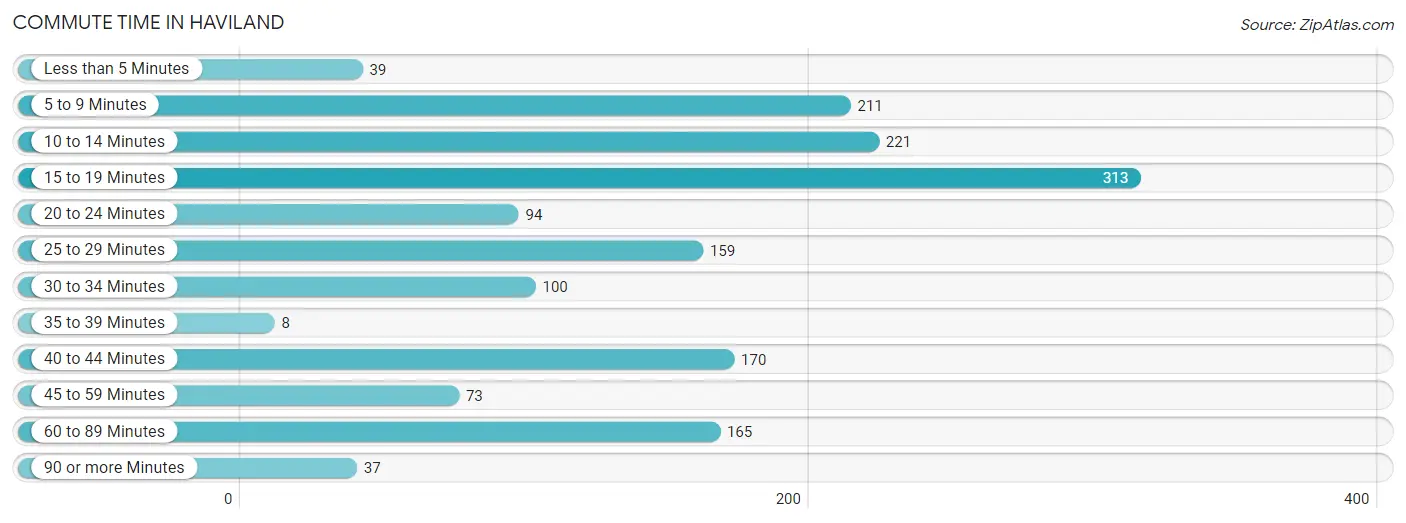
| Commute Time | # Commuters | % Commuters |
| Less than 5 Minutes | 39 | 2.5% |
| 5 to 9 Minutes | 211 | 13.3% |
| 10 to 14 Minutes | 221 | 13.9% |
| 15 to 19 Minutes | 313 | 19.7% |
| 20 to 24 Minutes | 94 | 5.9% |
| 25 to 29 Minutes | 159 | 10.0% |
| 30 to 34 Minutes | 100 | 6.3% |
| 35 to 39 Minutes | 8 | 0.5% |
| 40 to 44 Minutes | 170 | 10.7% |
| 45 to 59 Minutes | 73 | 4.6% |
| 60 to 89 Minutes | 165 | 10.4% |
| 90 or more Minutes | 37 | 2.3% |
Commute Time by Sex in Haviland
The most common commute times in Haviland are 40 to 44 minutes (170 commuters, 20.9%) for males and 15 to 19 minutes (188 commuters, 24.2%) for females.
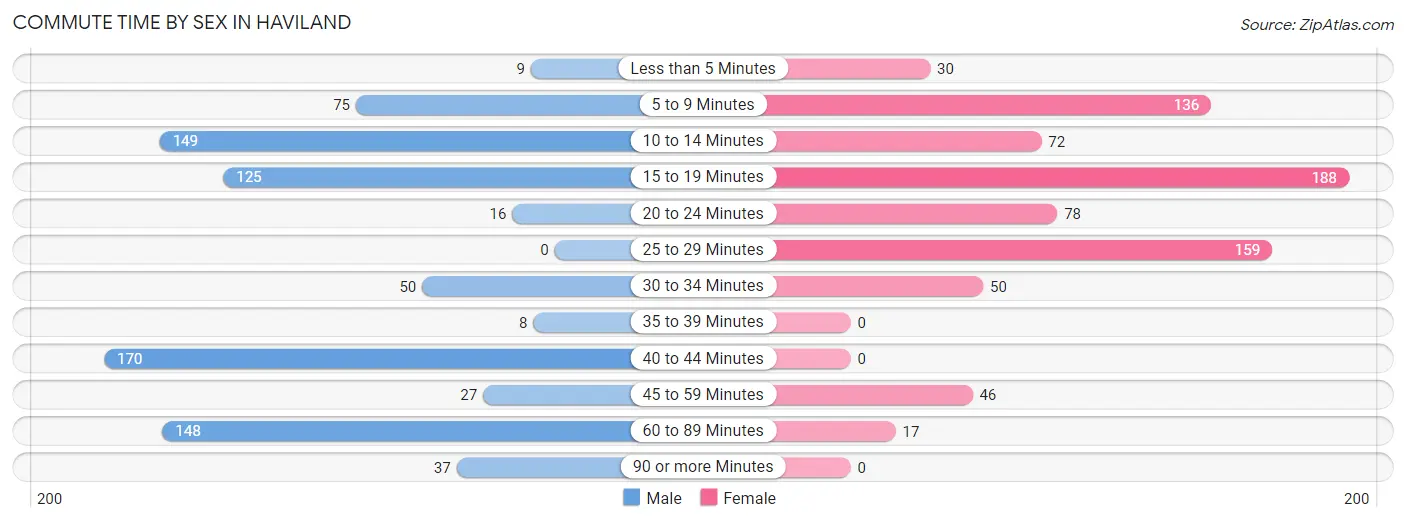
| Commute Time | Male | Female |
| Less than 5 Minutes | 9 (1.1%) | 30 (3.9%) |
| 5 to 9 Minutes | 75 (9.2%) | 136 (17.5%) |
| 10 to 14 Minutes | 149 (18.3%) | 72 (9.3%) |
| 15 to 19 Minutes | 125 (15.4%) | 188 (24.2%) |
| 20 to 24 Minutes | 16 (2.0%) | 78 (10.1%) |
| 25 to 29 Minutes | 0 (0.0%) | 159 (20.5%) |
| 30 to 34 Minutes | 50 (6.1%) | 50 (6.4%) |
| 35 to 39 Minutes | 8 (1.0%) | 0 (0.0%) |
| 40 to 44 Minutes | 170 (20.9%) | 0 (0.0%) |
| 45 to 59 Minutes | 27 (3.3%) | 46 (5.9%) |
| 60 to 89 Minutes | 148 (18.2%) | 17 (2.2%) |
| 90 or more Minutes | 37 (4.5%) | 0 (0.0%) |
Time of Departure to Work by Sex in Haviland
The most frequent times of departure to work in Haviland are 6:30 AM to 6:59 AM (149, 18.3%) for males and 8:30 AM to 8:59 AM (205, 26.4%) for females.
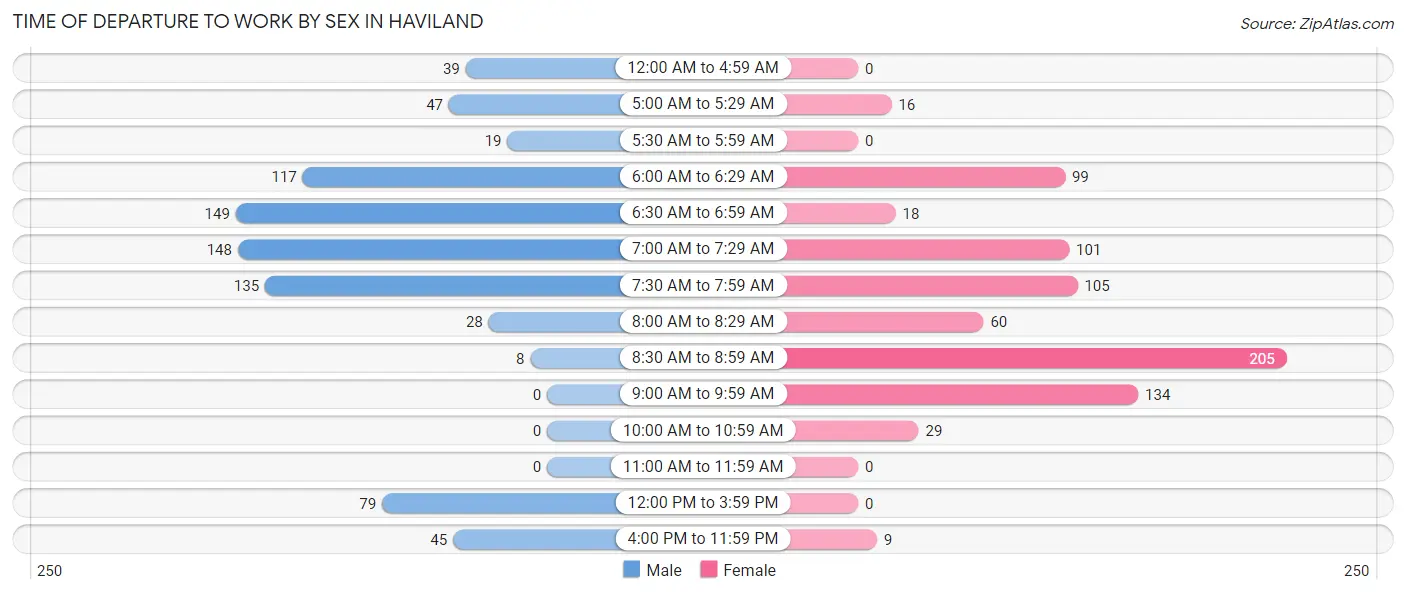
| Time of Departure | Male | Female |
| 12:00 AM to 4:59 AM | 39 (4.8%) | 0 (0.0%) |
| 5:00 AM to 5:29 AM | 47 (5.8%) | 16 (2.1%) |
| 5:30 AM to 5:59 AM | 19 (2.3%) | 0 (0.0%) |
| 6:00 AM to 6:29 AM | 117 (14.4%) | 99 (12.8%) |
| 6:30 AM to 6:59 AM | 149 (18.3%) | 18 (2.3%) |
| 7:00 AM to 7:29 AM | 148 (18.2%) | 101 (13.0%) |
| 7:30 AM to 7:59 AM | 135 (16.6%) | 105 (13.5%) |
| 8:00 AM to 8:29 AM | 28 (3.4%) | 60 (7.7%) |
| 8:30 AM to 8:59 AM | 8 (1.0%) | 205 (26.4%) |
| 9:00 AM to 9:59 AM | 0 (0.0%) | 134 (17.3%) |
| 10:00 AM to 10:59 AM | 0 (0.0%) | 29 (3.7%) |
| 11:00 AM to 11:59 AM | 0 (0.0%) | 0 (0.0%) |
| 12:00 PM to 3:59 PM | 79 (9.7%) | 0 (0.0%) |
| 4:00 PM to 11:59 PM | 45 (5.5%) | 9 (1.2%) |
| Total | 814 (100.0%) | 776 (100.0%) |
Housing Occupancy in Haviland
Occupancy by Ownership in Haviland
Of the total 1,376 dwellings in Haviland, owner-occupied units account for 1,059 (77.0%), while renter-occupied units make up 317 (23.0%).
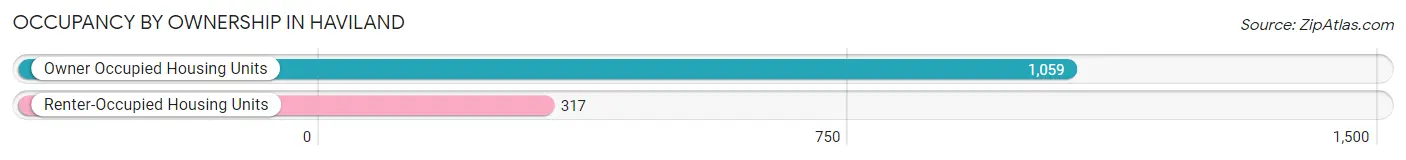
| Occupancy | # Housing Units | % Housing Units |
| Owner Occupied Housing Units | 1,059 | 77.0% |
| Renter-Occupied Housing Units | 317 | 23.0% |
| Total Occupied Housing Units | 1,376 | 100.0% |
Occupancy by Household Size in Haviland
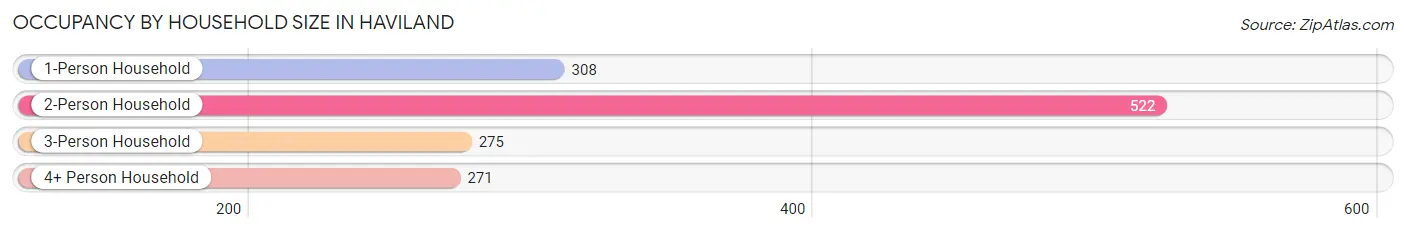
| Household Size | # Housing Units | % Housing Units |
| 1-Person Household | 308 | 22.4% |
| 2-Person Household | 522 | 37.9% |
| 3-Person Household | 275 | 20.0% |
| 4+ Person Household | 271 | 19.7% |
| Total Housing Units | 1,376 | 100.0% |
Occupancy by Ownership by Household Size in Haviland
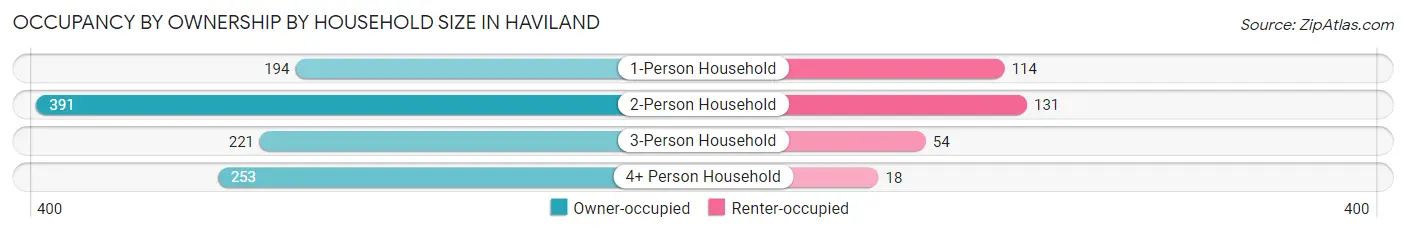
| Household Size | Owner-occupied | Renter-occupied |
| 1-Person Household | 194 (63.0%) | 114 (37.0%) |
| 2-Person Household | 391 (74.9%) | 131 (25.1%) |
| 3-Person Household | 221 (80.4%) | 54 (19.6%) |
| 4+ Person Household | 253 (93.4%) | 18 (6.6%) |
| Total Housing Units | 1,059 (77.0%) | 317 (23.0%) |
Occupancy by Educational Attainment in Haviland
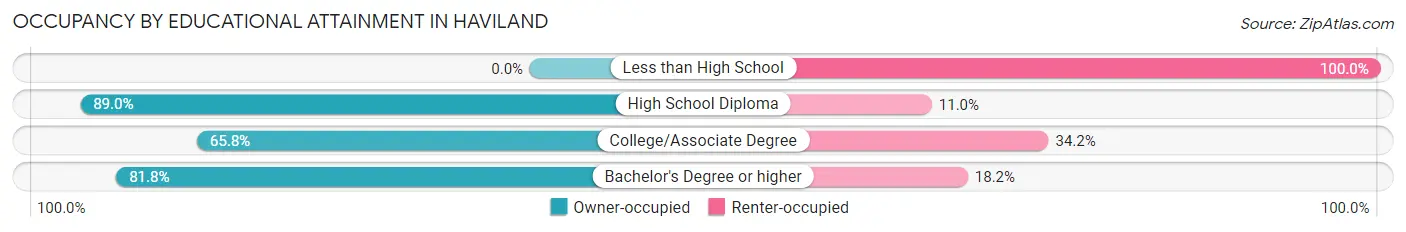
| Household Size | Owner-occupied | Renter-occupied |
| Less than High School | 0 (0.0%) | 14 (100.0%) |
| High School Diploma | 266 (89.0%) | 33 (11.0%) |
| College/Associate Degree | 316 (65.8%) | 164 (34.2%) |
| Bachelor's Degree or higher | 477 (81.8%) | 106 (18.2%) |
Occupancy by Age of Householder in Haviland
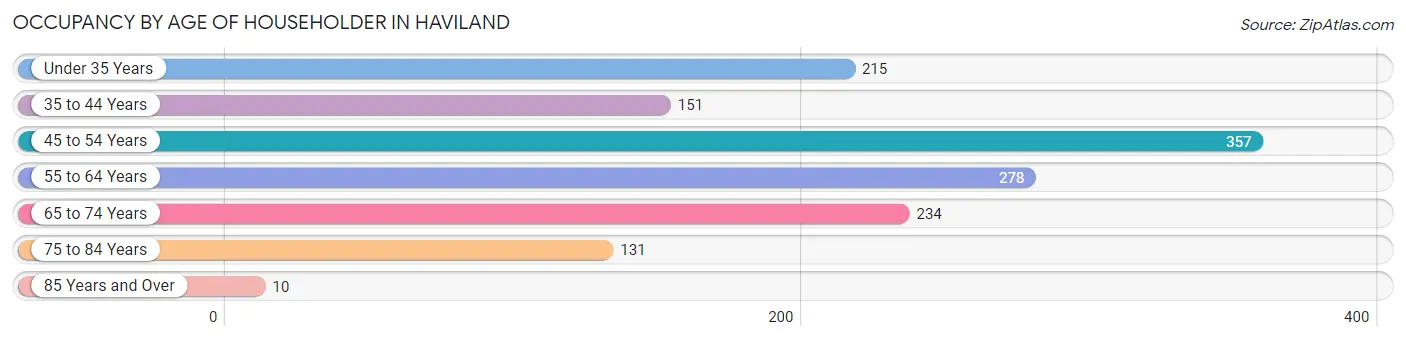
| Age Bracket | # Households | % Households |
| Under 35 Years | 215 | 15.6% |
| 35 to 44 Years | 151 | 11.0% |
| 45 to 54 Years | 357 | 25.9% |
| 55 to 64 Years | 278 | 20.2% |
| 65 to 74 Years | 234 | 17.0% |
| 75 to 84 Years | 131 | 9.5% |
| 85 Years and Over | 10 | 0.7% |
| Total | 1,376 | 100.0% |
Housing Finances in Haviland
Median Income by Occupancy in Haviland
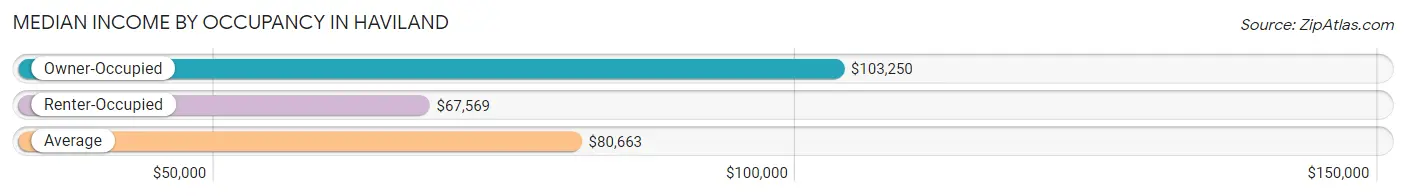
| Occupancy Type | # Households | Median Income |
| Owner-Occupied | 1,059 (77.0%) | $103,250 |
| Renter-Occupied | 317 (23.0%) | $67,569 |
| Average | 1,376 (100.0%) | $80,663 |
Occupancy by Householder Income Bracket in Haviland
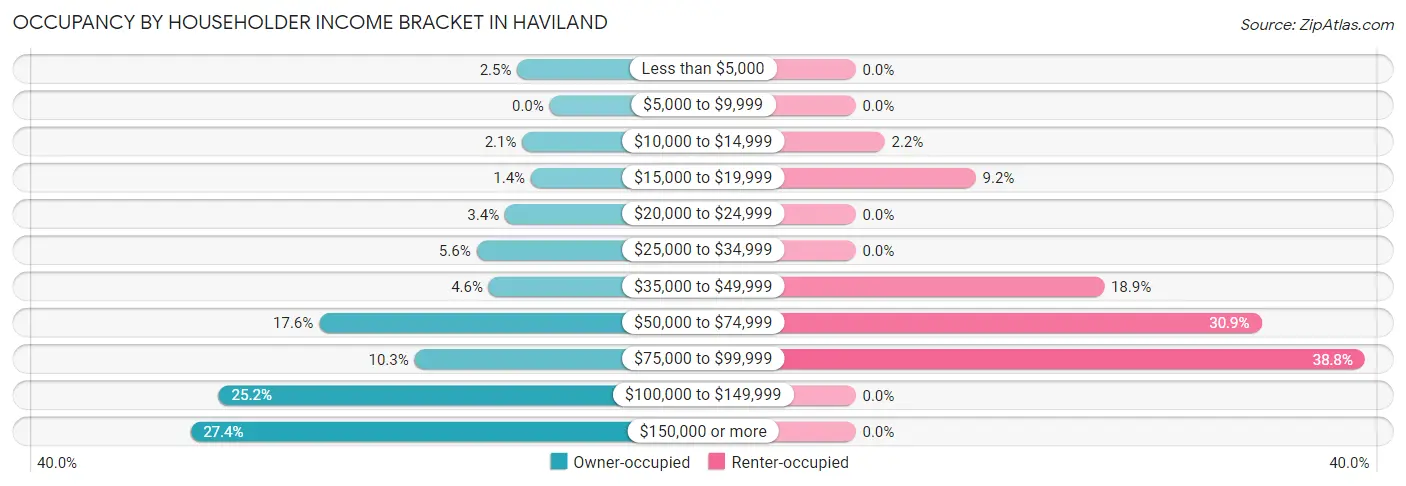
| Income Bracket | Owner-occupied | Renter-occupied |
| Less than $5,000 | 26 (2.5%) | 0 (0.0%) |
| $5,000 to $9,999 | 0 (0.0%) | 0 (0.0%) |
| $10,000 to $14,999 | 22 (2.1%) | 7 (2.2%) |
| $15,000 to $19,999 | 15 (1.4%) | 29 (9.1%) |
| $20,000 to $24,999 | 36 (3.4%) | 0 (0.0%) |
| $25,000 to $34,999 | 59 (5.6%) | 0 (0.0%) |
| $35,000 to $49,999 | 49 (4.6%) | 60 (18.9%) |
| $50,000 to $74,999 | 186 (17.6%) | 98 (30.9%) |
| $75,000 to $99,999 | 109 (10.3%) | 123 (38.8%) |
| $100,000 to $149,999 | 267 (25.2%) | 0 (0.0%) |
| $150,000 or more | 290 (27.4%) | 0 (0.0%) |
| Total | 1,059 (100.0%) | 317 (100.0%) |
Monthly Housing Cost Tiers in Haviland
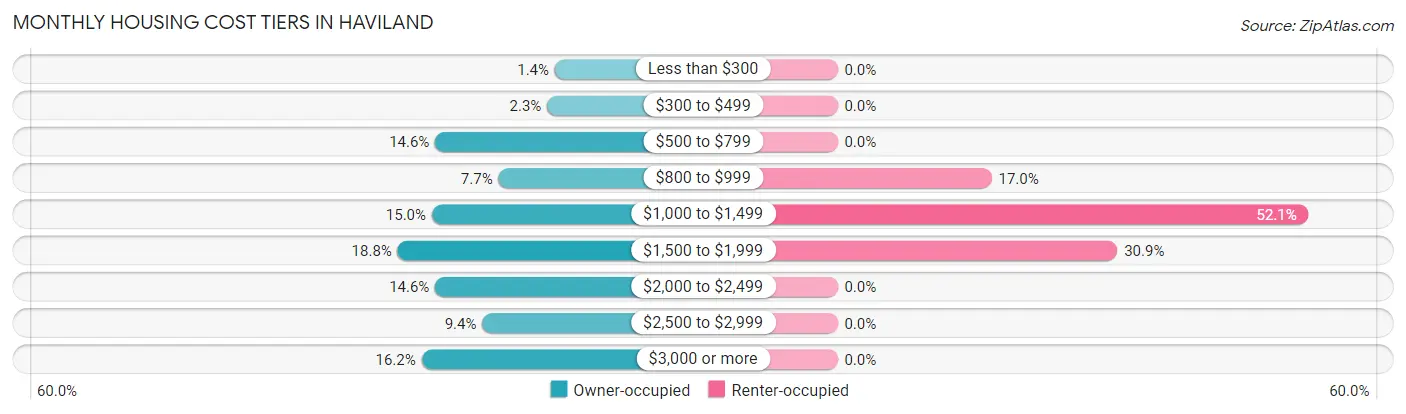
| Monthly Cost | Owner-occupied | Renter-occupied |
| Less than $300 | 15 (1.4%) | 0 (0.0%) |
| $300 to $499 | 24 (2.3%) | 0 (0.0%) |
| $500 to $799 | 155 (14.6%) | 0 (0.0%) |
| $800 to $999 | 81 (7.6%) | 54 (17.0%) |
| $1,000 to $1,499 | 159 (15.0%) | 165 (52.0%) |
| $1,500 to $1,999 | 199 (18.8%) | 98 (30.9%) |
| $2,000 to $2,499 | 155 (14.6%) | 0 (0.0%) |
| $2,500 to $2,999 | 100 (9.4%) | 0 (0.0%) |
| $3,000 or more | 171 (16.2%) | 0 (0.0%) |
| Total | 1,059 (100.0%) | 317 (100.0%) |
Physical Housing Characteristics in Haviland
Housing Structures in Haviland
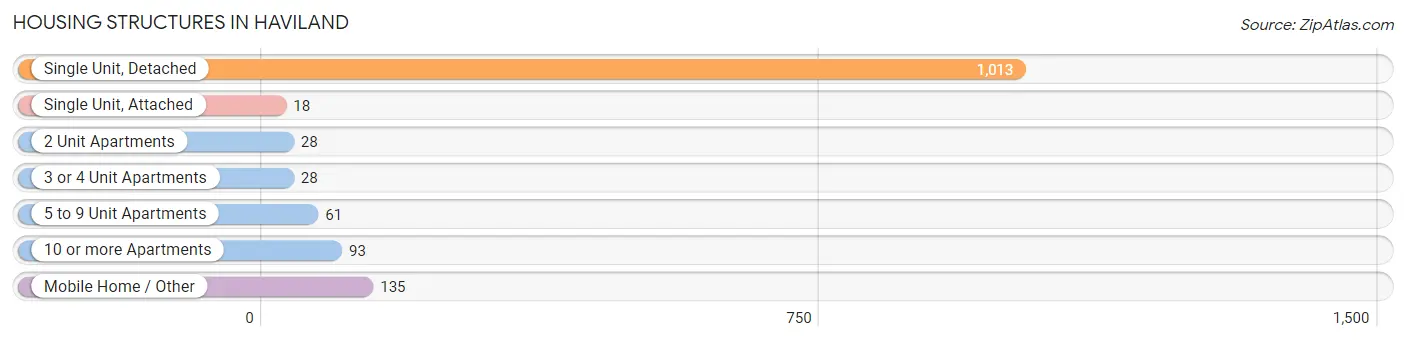
| Structure Type | # Housing Units | % Housing Units |
| Single Unit, Detached | 1,013 | 73.6% |
| Single Unit, Attached | 18 | 1.3% |
| 2 Unit Apartments | 28 | 2.0% |
| 3 or 4 Unit Apartments | 28 | 2.0% |
| 5 to 9 Unit Apartments | 61 | 4.4% |
| 10 or more Apartments | 93 | 6.8% |
| Mobile Home / Other | 135 | 9.8% |
| Total | 1,376 | 100.0% |
Housing Structures by Occupancy in Haviland
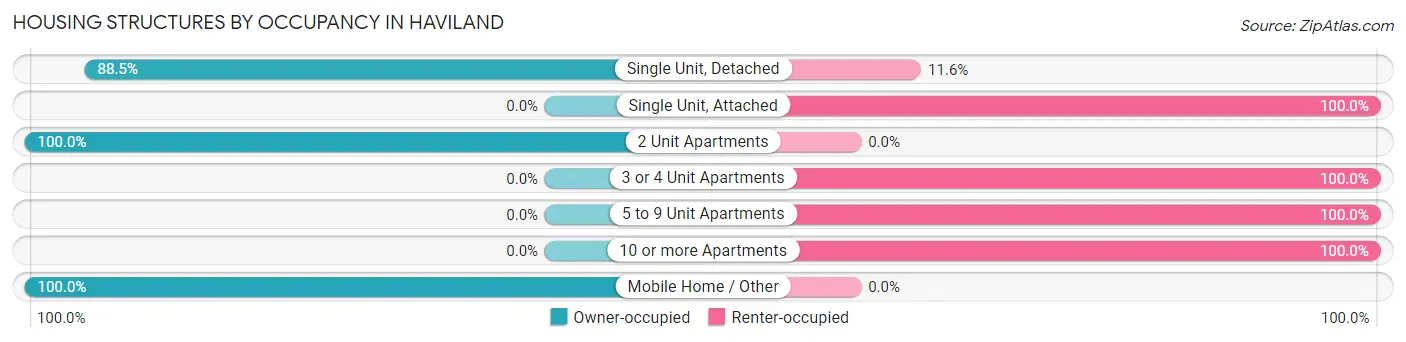
| Structure Type | Owner-occupied | Renter-occupied |
| Single Unit, Detached | 896 (88.4%) | 117 (11.6%) |
| Single Unit, Attached | 0 (0.0%) | 18 (100.0%) |
| 2 Unit Apartments | 28 (100.0%) | 0 (0.0%) |
| 3 or 4 Unit Apartments | 0 (0.0%) | 28 (100.0%) |
| 5 to 9 Unit Apartments | 0 (0.0%) | 61 (100.0%) |
| 10 or more Apartments | 0 (0.0%) | 93 (100.0%) |
| Mobile Home / Other | 135 (100.0%) | 0 (0.0%) |
| Total | 1,059 (77.0%) | 317 (23.0%) |
Housing Structures by Number of Rooms in Haviland
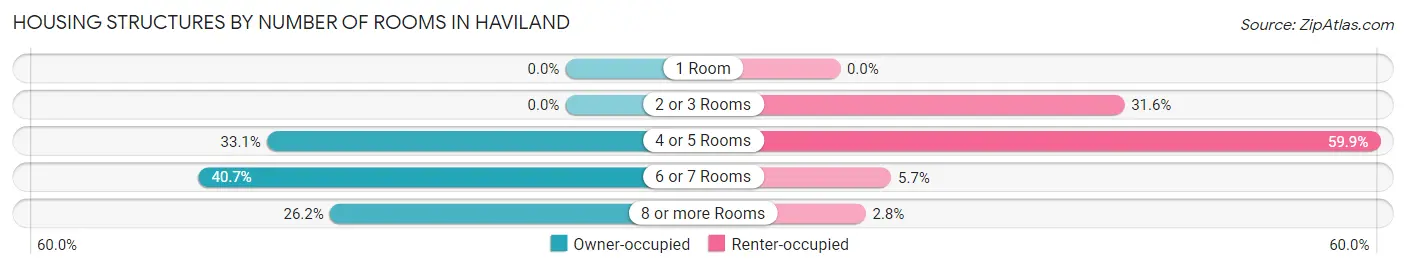
| Number of Rooms | Owner-occupied | Renter-occupied |
| 1 Room | 0 (0.0%) | 0 (0.0%) |
| 2 or 3 Rooms | 0 (0.0%) | 100 (31.6%) |
| 4 or 5 Rooms | 351 (33.1%) | 190 (59.9%) |
| 6 or 7 Rooms | 431 (40.7%) | 18 (5.7%) |
| 8 or more Rooms | 277 (26.2%) | 9 (2.8%) |
| Total | 1,059 (100.0%) | 317 (100.0%) |
Housing Structure by Heating Type in Haviland
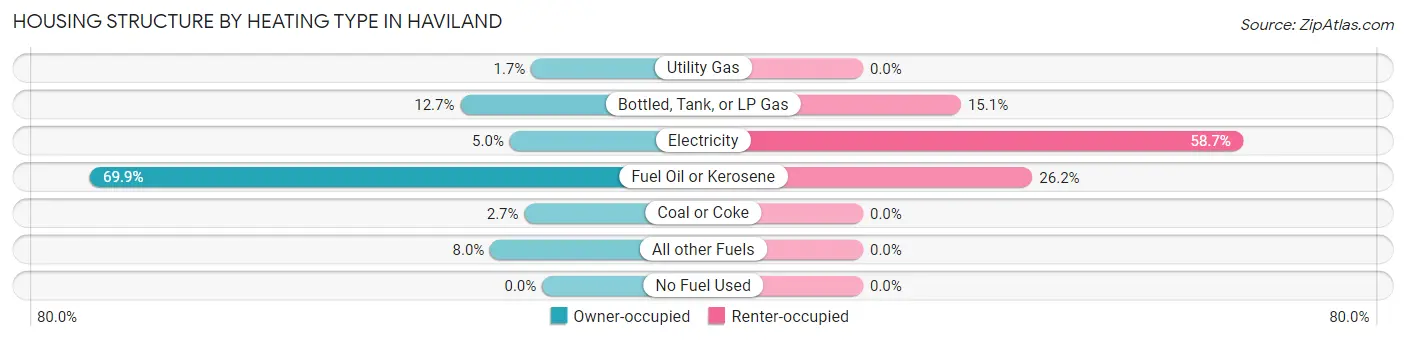
| Heating Type | Owner-occupied | Renter-occupied |
| Utility Gas | 18 (1.7%) | 0 (0.0%) |
| Bottled, Tank, or LP Gas | 134 (12.7%) | 48 (15.1%) |
| Electricity | 53 (5.0%) | 186 (58.7%) |
| Fuel Oil or Kerosene | 740 (69.9%) | 83 (26.2%) |
| Coal or Coke | 29 (2.7%) | 0 (0.0%) |
| All other Fuels | 85 (8.0%) | 0 (0.0%) |
| No Fuel Used | 0 (0.0%) | 0 (0.0%) |
| Total | 1,059 (100.0%) | 317 (100.0%) |
Household Vehicle Usage in Haviland
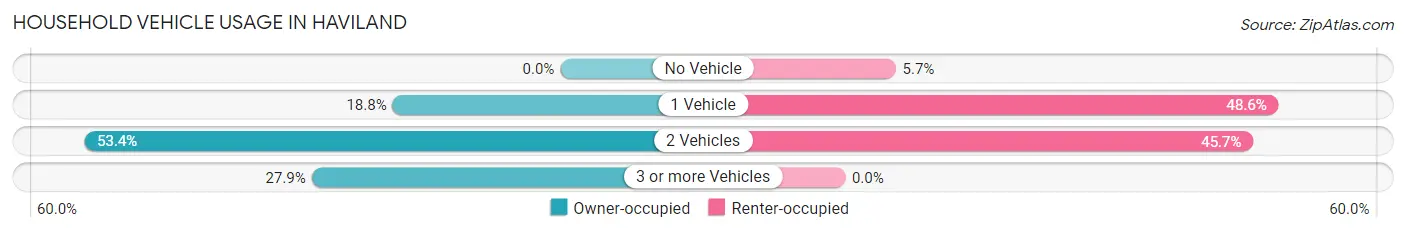
| Vehicles per Household | Owner-occupied | Renter-occupied |
| No Vehicle | 0 (0.0%) | 18 (5.7%) |
| 1 Vehicle | 199 (18.8%) | 154 (48.6%) |
| 2 Vehicles | 565 (53.3%) | 145 (45.7%) |
| 3 or more Vehicles | 295 (27.9%) | 0 (0.0%) |
| Total | 1,059 (100.0%) | 317 (100.0%) |
Real Estate & Mortgages in Haviland
Real Estate and Mortgage Overview in Haviland
| Characteristic | Without Mortgage | With Mortgage |
| Housing Units | 391 | 668 |
| Median Property Value | $206,100 | $286,400 |
| Median Household Income | $84,875 | $232 |
| Monthly Housing Costs | $814 | $171 |
| Real Estate Taxes | $6,478 | $53 |
Property Value by Mortgage Status in Haviland
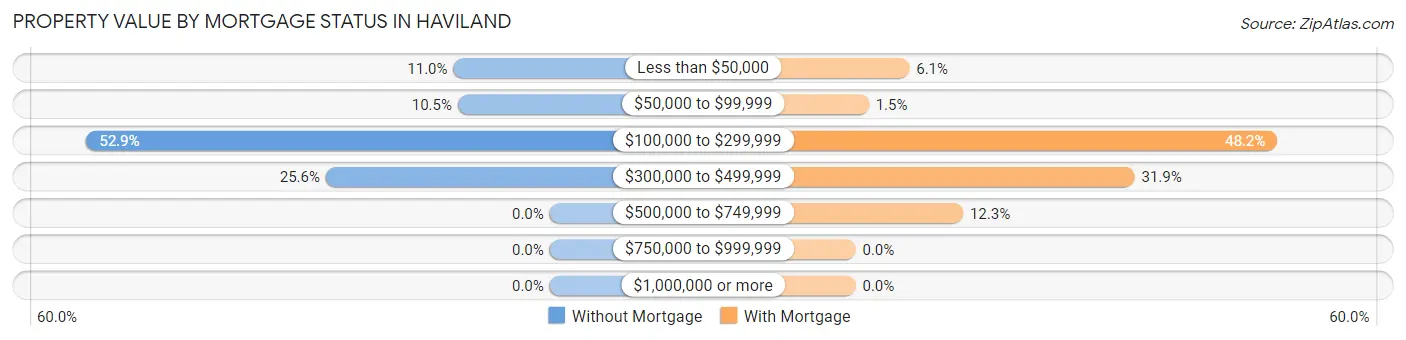
| Property Value | Without Mortgage | With Mortgage |
| Less than $50,000 | 43 (11.0%) | 41 (6.1%) |
| $50,000 to $99,999 | 41 (10.5%) | 10 (1.5%) |
| $100,000 to $299,999 | 207 (52.9%) | 322 (48.2%) |
| $300,000 to $499,999 | 100 (25.6%) | 213 (31.9%) |
| $500,000 to $749,999 | 0 (0.0%) | 82 (12.3%) |
| $750,000 to $999,999 | 0 (0.0%) | 0 (0.0%) |
| $1,000,000 or more | 0 (0.0%) | 0 (0.0%) |
| Total | 391 (100.0%) | 668 (100.0%) |
Household Income by Mortgage Status in Haviland
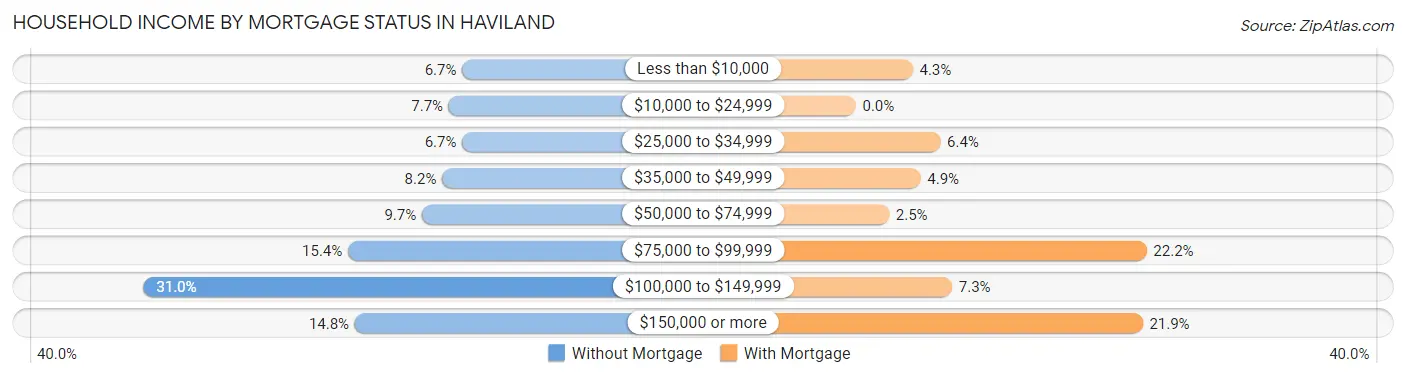
| Household Income | Without Mortgage | With Mortgage |
| Less than $10,000 | 26 (6.7%) | 29 (4.3%) |
| $10,000 to $24,999 | 30 (7.7%) | 0 (0.0%) |
| $25,000 to $34,999 | 26 (6.7%) | 43 (6.4%) |
| $35,000 to $49,999 | 32 (8.2%) | 33 (4.9%) |
| $50,000 to $74,999 | 38 (9.7%) | 17 (2.5%) |
| $75,000 to $99,999 | 60 (15.3%) | 148 (22.2%) |
| $100,000 to $149,999 | 121 (30.9%) | 49 (7.3%) |
| $150,000 or more | 58 (14.8%) | 146 (21.9%) |
| Total | 391 (100.0%) | 668 (100.0%) |
Property Value to Household Income Ratio in Haviland
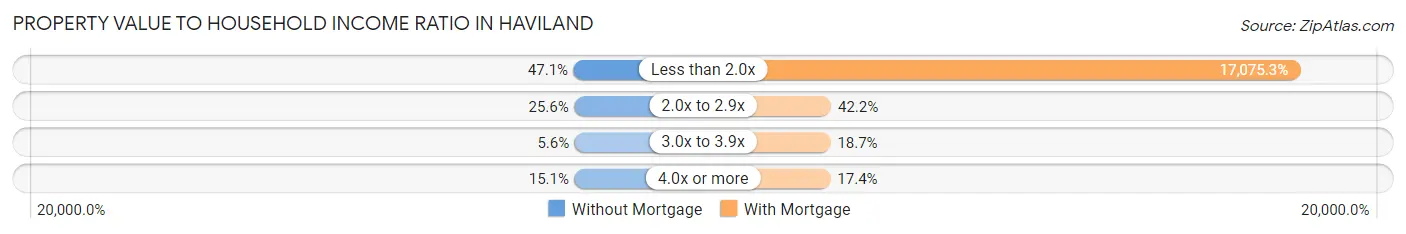
| Value-to-Income Ratio | Without Mortgage | With Mortgage |
| Less than 2.0x | 184 (47.1%) | 114,063 (17,075.3%) |
| 2.0x to 2.9x | 100 (25.6%) | 282 (42.2%) |
| 3.0x to 3.9x | 22 (5.6%) | 125 (18.7%) |
| 4.0x or more | 59 (15.1%) | 116 (17.4%) |
| Total | 391 (100.0%) | 668 (100.0%) |
Real Estate Taxes by Mortgage Status in Haviland
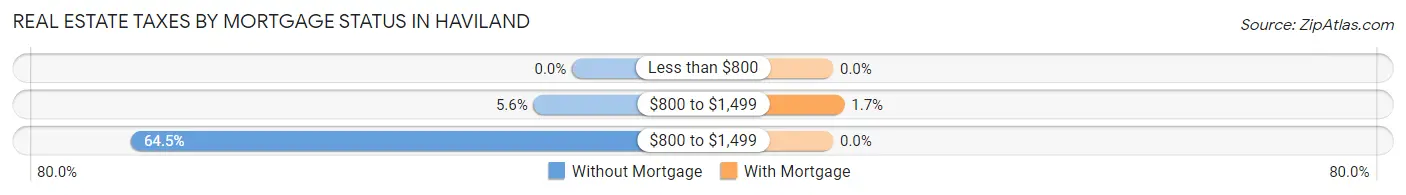
| Property Taxes | Without Mortgage | With Mortgage |
| Less than $800 | 0 (0.0%) | 0 (0.0%) |
| $800 to $1,499 | 22 (5.6%) | 11 (1.7%) |
| $800 to $1,499 | 252 (64.4%) | 0 (0.0%) |
| Total | 391 (100.0%) | 668 (100.0%) |
Health & Disability in Haviland
Health Insurance Coverage by Age in Haviland
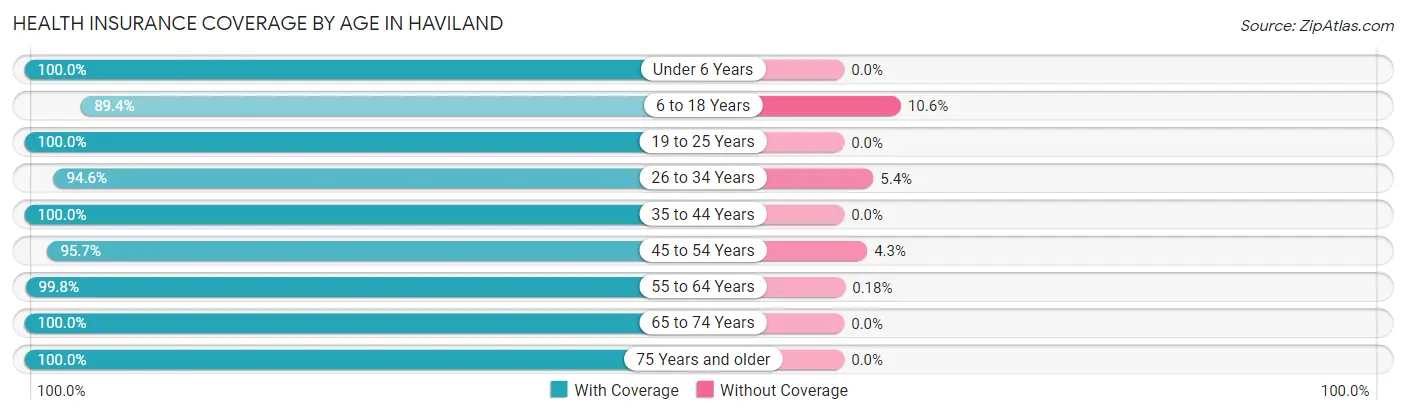
| Age Bracket | With Coverage | Without Coverage |
| Under 6 Years | 89 (100.0%) | 0 (0.0%) |
| 6 to 18 Years | 601 (89.4%) | 71 (10.6%) |
| 19 to 25 Years | 219 (100.0%) | 0 (0.0%) |
| 26 to 34 Years | 384 (94.6%) | 22 (5.4%) |
| 35 to 44 Years | 360 (100.0%) | 0 (0.0%) |
| 45 to 54 Years | 561 (95.7%) | 25 (4.3%) |
| 55 to 64 Years | 542 (99.8%) | 1 (0.2%) |
| 65 to 74 Years | 411 (100.0%) | 0 (0.0%) |
| 75 Years and older | 209 (100.0%) | 0 (0.0%) |
| Total | 3,376 (96.6%) | 119 (3.4%) |
Health Insurance Coverage by Citizenship Status in Haviland
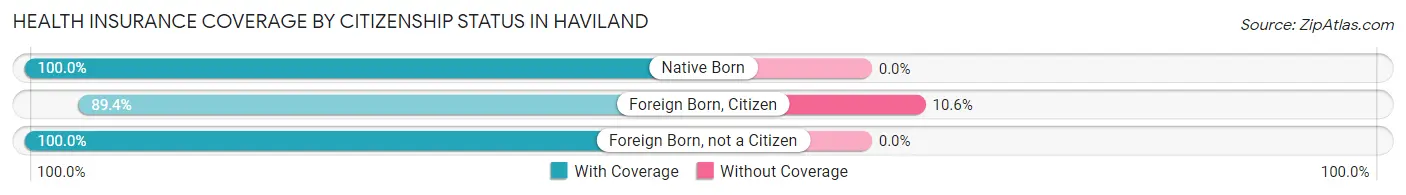
| Citizenship Status | With Coverage | Without Coverage |
| Native Born | 89 (100.0%) | 0 (0.0%) |
| Foreign Born, Citizen | 601 (89.4%) | 71 (10.6%) |
| Foreign Born, not a Citizen | 219 (100.0%) | 0 (0.0%) |
Health Insurance Coverage by Household Income in Haviland
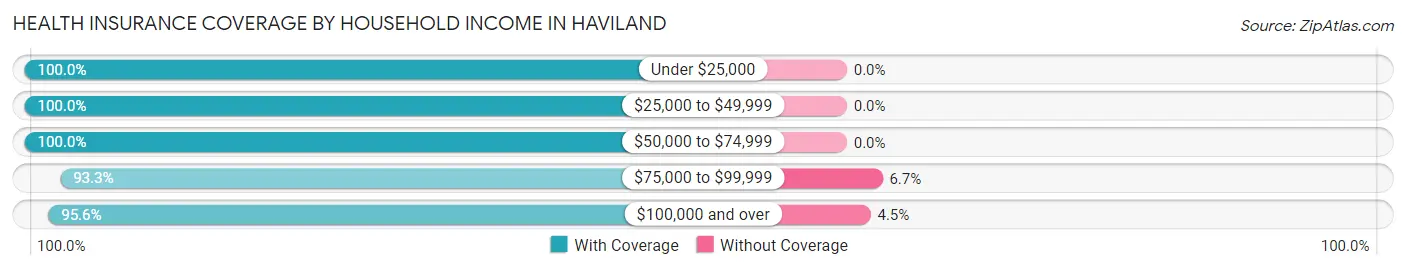
| Household Income | With Coverage | Without Coverage |
| Under $25,000 | 223 (100.0%) | 0 (0.0%) |
| $25,000 to $49,999 | 211 (100.0%) | 0 (0.0%) |
| $50,000 to $74,999 | 679 (100.0%) | 0 (0.0%) |
| $75,000 to $99,999 | 573 (93.3%) | 41 (6.7%) |
| $100,000 and over | 1,655 (95.6%) | 77 (4.4%) |
Public vs Private Health Insurance Coverage by Age in Haviland
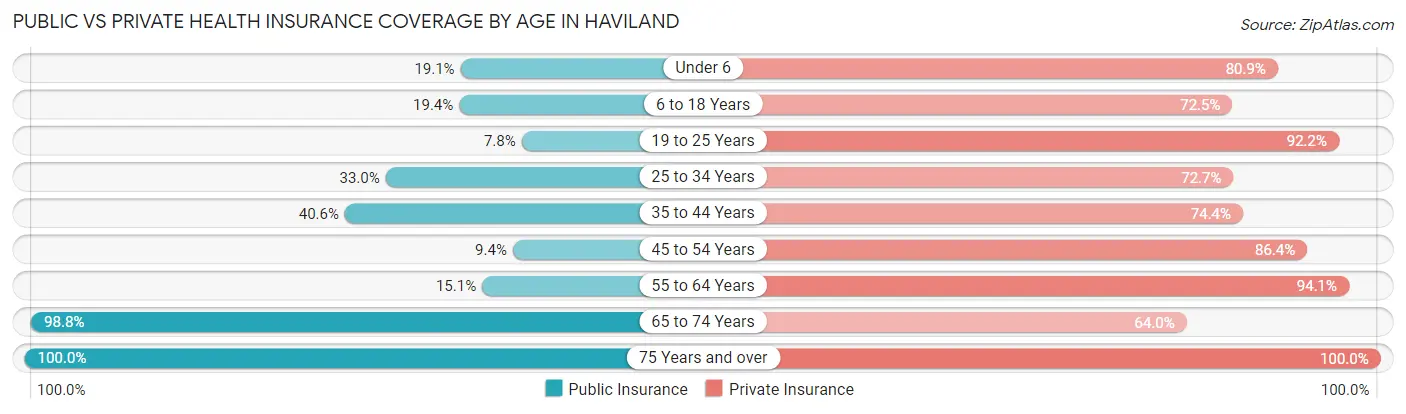
| Age Bracket | Public Insurance | Private Insurance |
| Under 6 | 17 (19.1%) | 72 (80.9%) |
| 6 to 18 Years | 130 (19.4%) | 487 (72.5%) |
| 19 to 25 Years | 17 (7.8%) | 202 (92.2%) |
| 25 to 34 Years | 134 (33.0%) | 295 (72.7%) |
| 35 to 44 Years | 146 (40.6%) | 268 (74.4%) |
| 45 to 54 Years | 55 (9.4%) | 506 (86.4%) |
| 55 to 64 Years | 82 (15.1%) | 511 (94.1%) |
| 65 to 74 Years | 406 (98.8%) | 263 (64.0%) |
| 75 Years and over | 209 (100.0%) | 209 (100.0%) |
| Total | 1,196 (34.2%) | 2,813 (80.5%) |
Disability Status by Sex by Age in Haviland
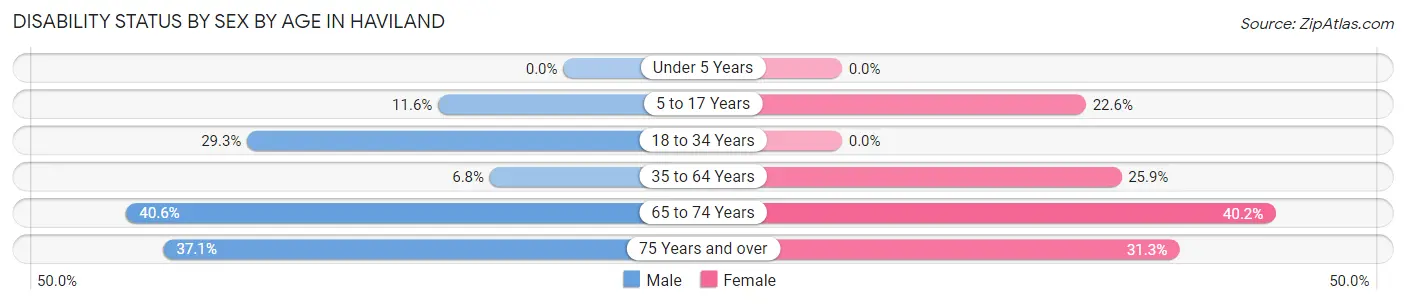
| Age Bracket | Male | Female |
| Under 5 Years | 0 (0.0%) | 0 (0.0%) |
| 5 to 17 Years | 33 (11.6%) | 84 (22.6%) |
| 18 to 34 Years | 98 (29.3%) | 0 (0.0%) |
| 35 to 64 Years | 50 (6.8%) | 196 (25.9%) |
| 65 to 74 Years | 88 (40.6%) | 78 (40.2%) |
| 75 Years and over | 23 (37.1%) | 46 (31.3%) |
Disability Class by Sex by Age in Haviland
Disability Class: Hearing Difficulty
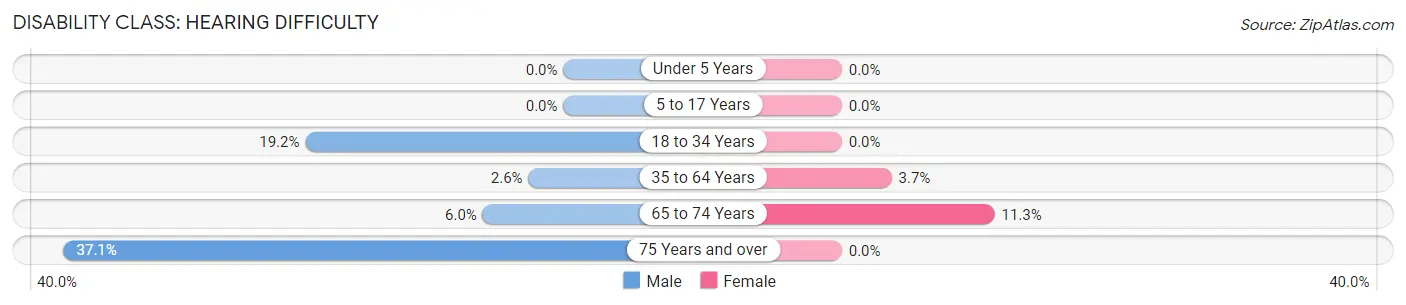
| Age Bracket | Male | Female |
| Under 5 Years | 0 (0.0%) | 0 (0.0%) |
| 5 to 17 Years | 0 (0.0%) | 0 (0.0%) |
| 18 to 34 Years | 64 (19.2%) | 0 (0.0%) |
| 35 to 64 Years | 19 (2.6%) | 28 (3.7%) |
| 65 to 74 Years | 13 (6.0%) | 22 (11.3%) |
| 75 Years and over | 23 (37.1%) | 0 (0.0%) |
Disability Class: Vision Difficulty
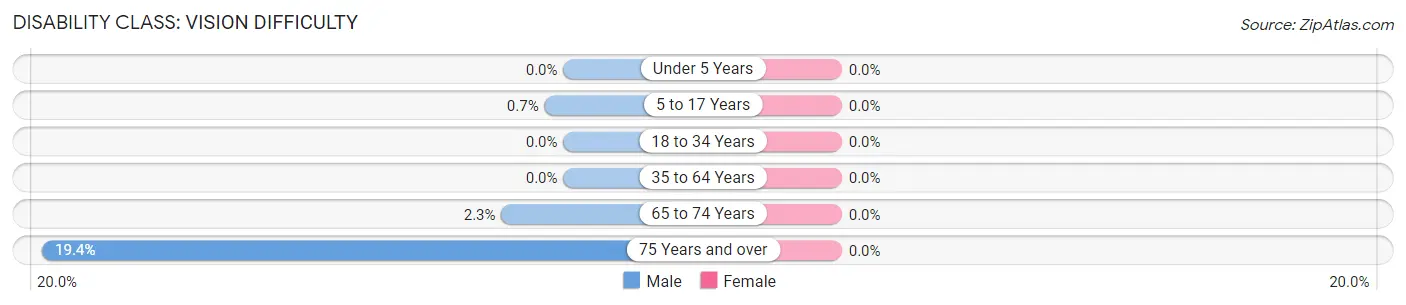
| Age Bracket | Male | Female |
| Under 5 Years | 0 (0.0%) | 0 (0.0%) |
| 5 to 17 Years | 2 (0.7%) | 0 (0.0%) |
| 18 to 34 Years | 0 (0.0%) | 0 (0.0%) |
| 35 to 64 Years | 0 (0.0%) | 0 (0.0%) |
| 65 to 74 Years | 5 (2.3%) | 0 (0.0%) |
| 75 Years and over | 12 (19.4%) | 0 (0.0%) |
Disability Class: Cognitive Difficulty
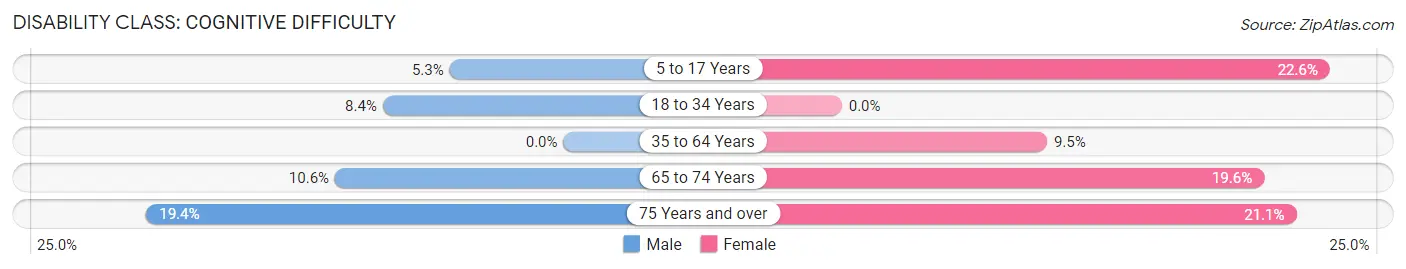
| Age Bracket | Male | Female |
| 5 to 17 Years | 15 (5.3%) | 84 (22.6%) |
| 18 to 34 Years | 28 (8.4%) | 0 (0.0%) |
| 35 to 64 Years | 0 (0.0%) | 72 (9.5%) |
| 65 to 74 Years | 23 (10.6%) | 38 (19.6%) |
| 75 Years and over | 12 (19.4%) | 31 (21.1%) |
Disability Class: Ambulatory Difficulty
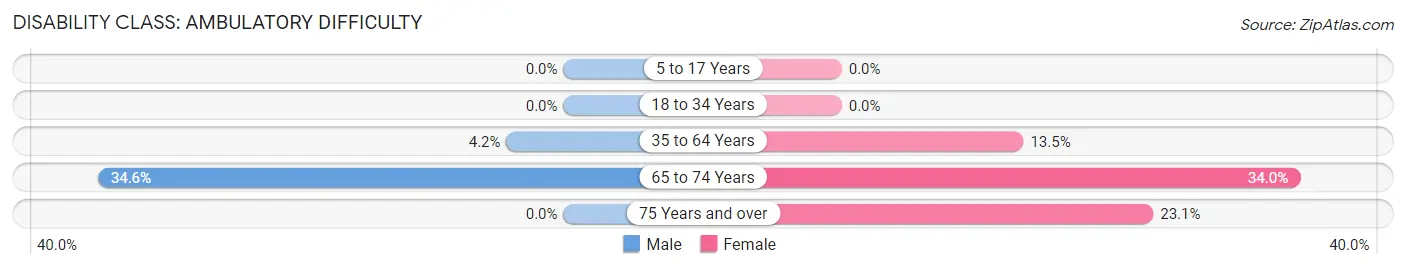
| Age Bracket | Male | Female |
| 5 to 17 Years | 0 (0.0%) | 0 (0.0%) |
| 18 to 34 Years | 0 (0.0%) | 0 (0.0%) |
| 35 to 64 Years | 31 (4.2%) | 102 (13.5%) |
| 65 to 74 Years | 75 (34.6%) | 66 (34.0%) |
| 75 Years and over | 0 (0.0%) | 34 (23.1%) |
Disability Class: Self-Care Difficulty
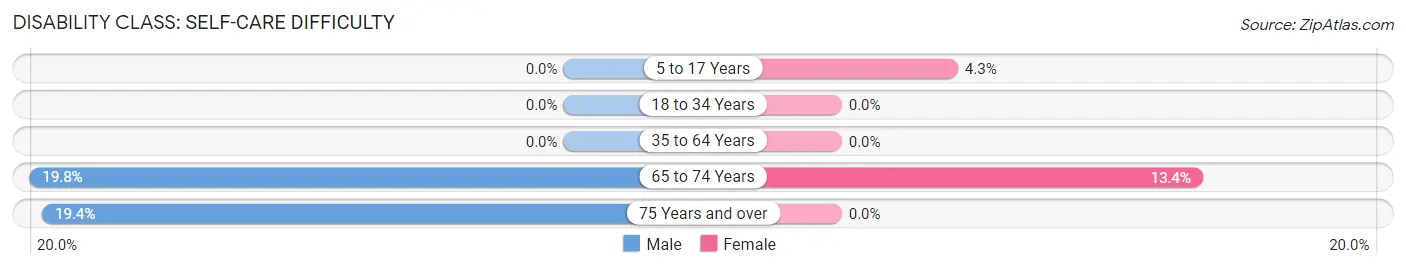
| Age Bracket | Male | Female |
| 5 to 17 Years | 0 (0.0%) | 16 (4.3%) |
| 18 to 34 Years | 0 (0.0%) | 0 (0.0%) |
| 35 to 64 Years | 0 (0.0%) | 0 (0.0%) |
| 65 to 74 Years | 43 (19.8%) | 26 (13.4%) |
| 75 Years and over | 12 (19.4%) | 0 (0.0%) |
Technology Access in Haviland
Computing Device Access in Haviland
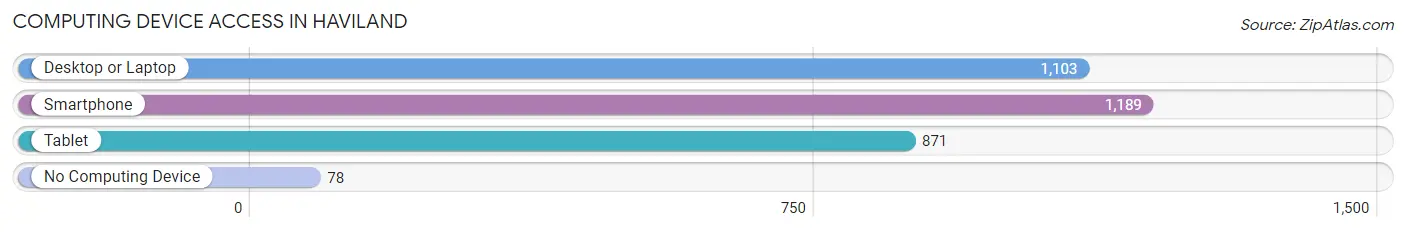
| Device Type | # Households | % Households |
| Desktop or Laptop | 1,103 | 80.2% |
| Smartphone | 1,189 | 86.4% |
| Tablet | 871 | 63.3% |
| No Computing Device | 78 | 5.7% |
| Total | 1,376 | 100.0% |
Internet Access in Haviland
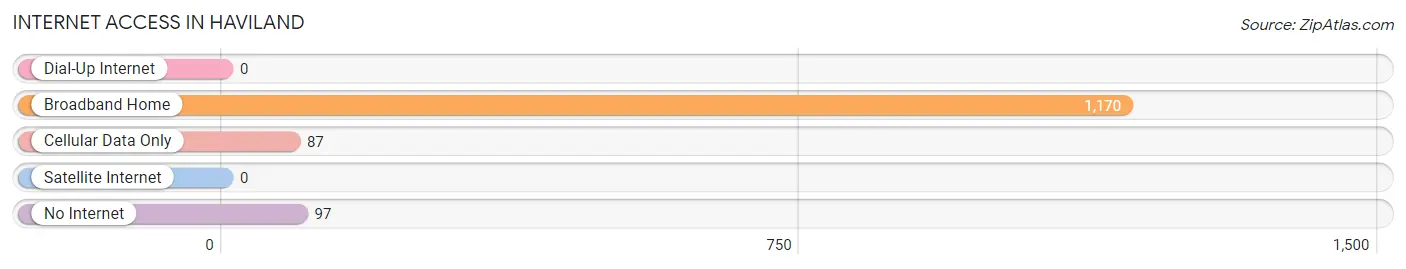
| Internet Type | # Households | % Households |
| Dial-Up Internet | 0 | 0.0% |
| Broadband Home | 1,170 | 85.0% |
| Cellular Data Only | 87 | 6.3% |
| Satellite Internet | 0 | 0.0% |
| No Internet | 97 | 7.0% |
| Total | 1,376 | 100.0% |
Haviland Summary
Haviland is a small town located in the state of New York. It is situated in the southwestern corner of the state, near the border of Pennsylvania. The town has a population of approximately 1,500 people and is part of the larger Delaware County. The town is known for its rural charm and its proximity to the Finger Lakes region.
Geography
Haviland is located in the southwestern corner of New York, near the border of Pennsylvania. The town is situated in the foothills of the Catskill Mountains and is part of the larger Delaware County. The town is located on the banks of the Susquehanna River, which provides a natural border between New York and Pennsylvania. The town is also located near the Finger Lakes region, which is known for its beautiful scenery and recreational activities.
The town of Haviland is made up of several small villages, including East Haviland, West Haviland, and South Haviland. The town is also home to several small lakes, including Lake Haviland, which is the largest lake in the area. The town is also home to several small streams and creeks, which provide a source of water for the town.
History
Haviland was first settled in the late 1700s by a group of settlers from Connecticut. The town was originally known as “Haviland’s Corners” and was named after the original settler, John Haviland. The town was officially incorporated in 1817 and has remained a small, rural community ever since.
The town of Haviland has a long history of farming and agriculture. The town was once home to several large farms, which provided the town with a steady source of income. The town was also home to several small businesses, including a sawmill, a gristmill, and a tannery.
Economy
The economy of Haviland is largely based on agriculture and tourism. The town is home to several small farms, which provide the town with a steady source of income. The town is also home to several small businesses, including a sawmill, a gristmill, and a tannery.
The town is also home to several tourist attractions, including the Finger Lakes region, which is known for its beautiful scenery and recreational activities. The town is also home to several wineries, which attract visitors from all over the world.
Demographics
As of the 2010 census, the population of Haviland was 1,500 people. The town is predominantly white, with approximately 95% of the population being white. The town is also home to a small Hispanic population, with approximately 4% of the population being Hispanic. The town is also home to a small African American population, with approximately 1% of the population being African American.
The median household income in Haviland is approximately $45,000, which is slightly lower than the national average. The town also has a higher than average poverty rate, with approximately 15% of the population living below the poverty line.
Conclusion
Haviland is a small town located in the southwestern corner of New York. The town is known for its rural charm and its proximity to the Finger Lakes region. The town has a population of approximately 1,500 people and is predominantly white. The town is also home to several small businesses and tourist attractions, which provide the town with a steady source of income. The town also has a higher than average poverty rate, with approximately 15% of the population living below the poverty line.
Common Questions
What is Per Capita Income in Haviland?
Per Capita income in Haviland is $41,470.
What is the Median Family Income in Haviland?
Median Family Income in Haviland is $87,132.
What is the Median Household income in Haviland?
Median Household Income in Haviland is $80,663.
What is Income or Wage Gap in Haviland?
Income or Wage Gap in Haviland is 46.7%.
Women in Haviland earn 53.3 cents for every dollar earned by a man.
What is Inequality or Gini Index in Haviland?
Inequality or Gini Index in Haviland is 0.37.
What is the Total Population of Haviland?
Total Population of Haviland is 3,500.
What is the Total Male Population of Haviland?
Total Male Population of Haviland is 1,672.
What is the Total Female Population of Haviland?
Total Female Population of Haviland is 1,828.
What is the Ratio of Males per 100 Females in Haviland?
There are 91.47 Males per 100 Females in Haviland.
What is the Ratio of Females per 100 Males in Haviland?
There are 109.33 Females per 100 Males in Haviland.
What is the Median Population Age in Haviland?
Median Population Age in Haviland is 45.0 Years.
What is the Average Family Size in Haviland
Average Family Size in Haviland is 2.9 People.
What is the Average Household Size in Haviland
Average Household Size in Haviland is 2.5 People.
How Large is the Labor Force in Haviland?
There are 1,889 People in the Labor Forcein in Haviland.
What is the Percentage of People in the Labor Force in Haviland?
67.1% of People are in the Labor Force in Haviland.
What is the Unemployment Rate in Haviland?
Unemployment Rate in Haviland is 8.3%.