Narberth borough, PA Map & Demographics
Narberth borough Overview
$85,806
PER CAPITA INCOME
$233,906
AVG FAMILY INCOME
$114,691
AVG HOUSEHOLD INCOME
21.0%
WAGE / INCOME GAP [ % ]
79.0¢/ $1
WAGE / INCOME GAP [ $ ]
0.49
INEQUALITY / GINI INDEX
4,478
TOTAL POPULATION
2,152
MALE POPULATION
2,326
FEMALE POPULATION
92.52
MALES / 100 FEMALES
108.09
FEMALES / 100 MALES
42.9
MEDIAN AGE
3.1
AVG FAMILY SIZE
2.3
AVG HOUSEHOLD SIZE
2,859
LABOR FORCE [ PEOPLE ]
77.1%
PERCENT IN LABOR FORCE
4.8%
UNEMPLOYMENT RATE
Income in Narberth borough
Income Overview in Narberth borough
Per Capita Income in Narberth borough is $85,806, while median incomes of families and households are $233,906 and $114,691 respectively.
| Characteristic | Number | Measure |
| Per Capita Income | 4,478 | $85,806 |
| Median Family Income | 1,119 | $233,906 |
| Mean Family Income | 1,119 | $272,290 |
| Median Household Income | 1,952 | $114,691 |
| Mean Household Income | 1,952 | $192,798 |
| Income Deficit | 1,119 | $0 |
| Wage / Income Gap (%) | 4,478 | 21.03% |
| Wage / Income Gap ($) | 4,478 | 78.97¢ per $1 |
| Gini / Inequality Index | 4,478 | 0.49 |
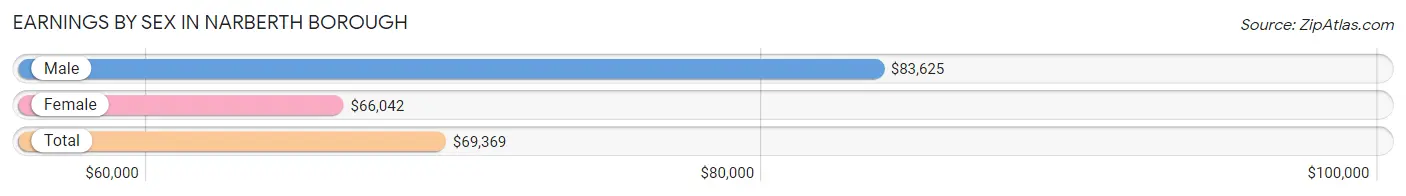
Earnings by Sex in Narberth borough
Average Earnings in Narberth borough are $69,369, $83,625 for men and $66,042 for women, a difference of 21.0%.
| Sex | Number | Average Earnings |
| Male | 1,493 (50.9%) | $83,625 |
| Female | 1,442 (49.1%) | $66,042 |
| Total | 2,935 (100.0%) | $69,369 |
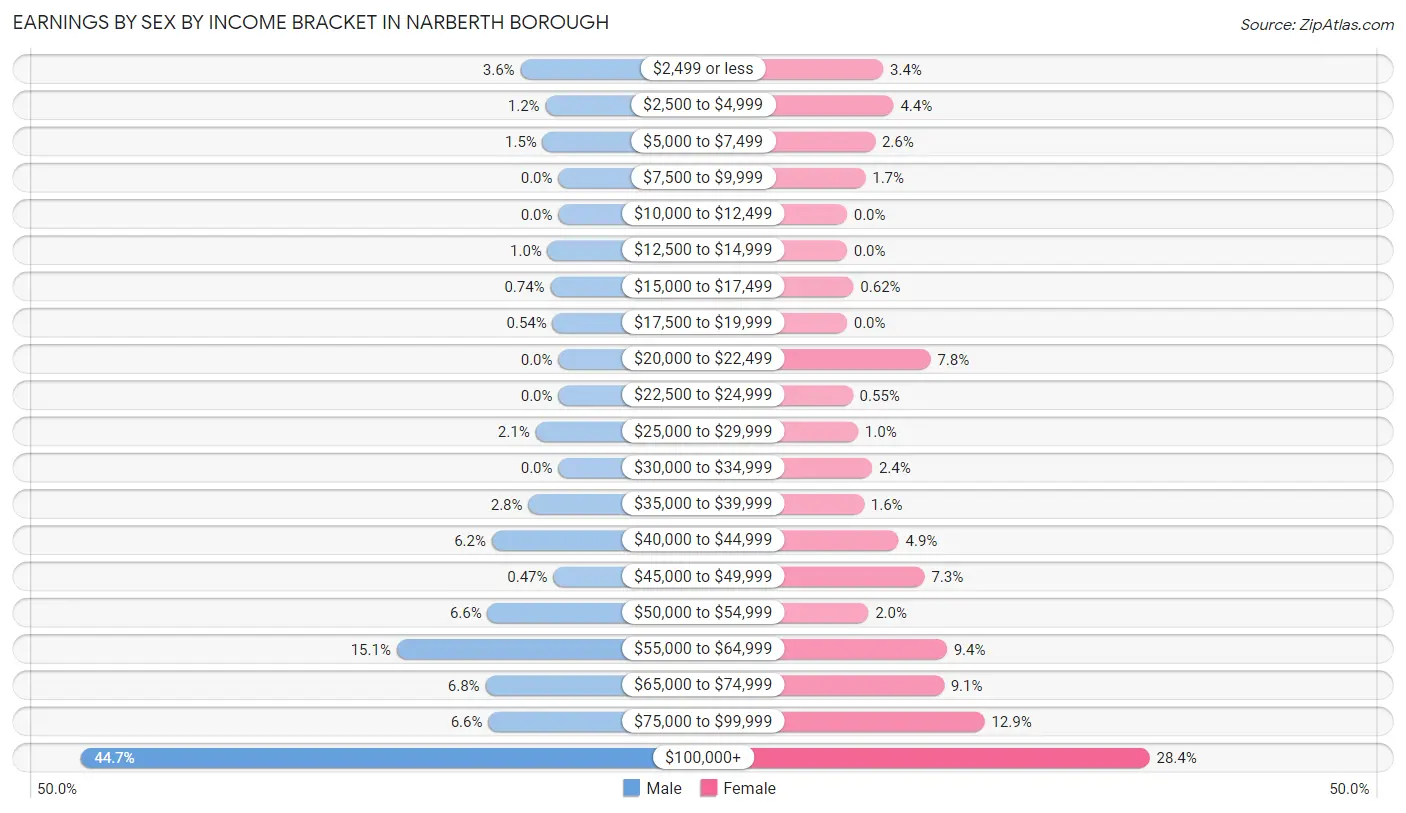
Earnings by Sex by Income Bracket in Narberth borough
The most common earnings brackets in Narberth borough are $100,000+ for men (667 | 44.7%) and $100,000+ for women (409 | 28.4%).
| Income | Male | Female |
| $2,499 or less | 53 (3.5%) | 49 (3.4%) |
| $2,500 to $4,999 | 18 (1.2%) | 63 (4.4%) |
| $5,000 to $7,499 | 22 (1.5%) | 38 (2.6%) |
| $7,500 to $9,999 | 0 (0.0%) | 25 (1.7%) |
| $10,000 to $12,499 | 0 (0.0%) | 0 (0.0%) |
| $12,500 to $14,999 | 15 (1.0%) | 0 (0.0%) |
| $15,000 to $17,499 | 11 (0.7%) | 9 (0.6%) |
| $17,500 to $19,999 | 8 (0.5%) | 0 (0.0%) |
| $20,000 to $22,499 | 0 (0.0%) | 113 (7.8%) |
| $22,500 to $24,999 | 0 (0.0%) | 8 (0.5%) |
| $25,000 to $29,999 | 32 (2.1%) | 15 (1.0%) |
| $30,000 to $34,999 | 0 (0.0%) | 34 (2.4%) |
| $35,000 to $39,999 | 42 (2.8%) | 23 (1.6%) |
| $40,000 to $44,999 | 93 (6.2%) | 70 (4.9%) |
| $45,000 to $49,999 | 7 (0.5%) | 105 (7.3%) |
| $50,000 to $54,999 | 99 (6.6%) | 29 (2.0%) |
| $55,000 to $64,999 | 226 (15.1%) | 135 (9.4%) |
| $65,000 to $74,999 | 102 (6.8%) | 131 (9.1%) |
| $75,000 to $99,999 | 98 (6.6%) | 186 (12.9%) |
| $100,000+ | 667 (44.7%) | 409 (28.4%) |
| Total | 1,493 (100.0%) | 1,442 (100.0%) |
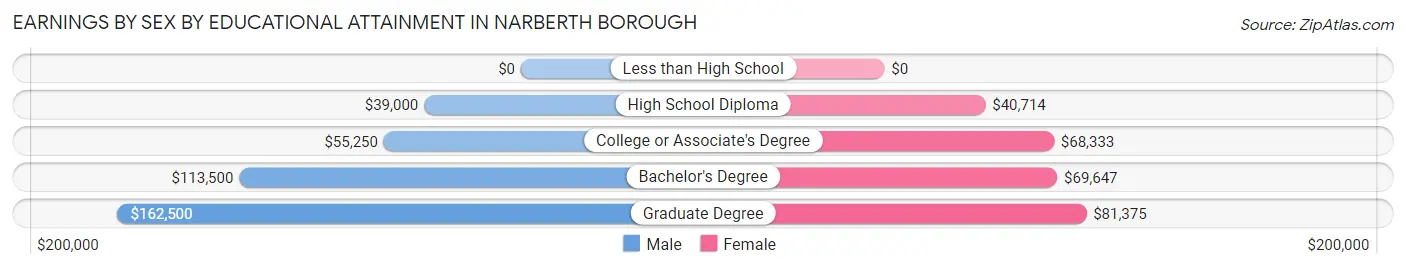
Earnings by Sex by Educational Attainment in Narberth borough
Average earnings in Narberth borough are $100,326 for men and $69,247 for women, a difference of 31.0%. Men with an educational attainment of graduate degree enjoy the highest average annual earnings of $162,500, while those with high school diploma education earn the least with $39,000. Women with an educational attainment of graduate degree earn the most with the average annual earnings of $81,375, while those with high school diploma education have the smallest earnings of $40,714.
| Educational Attainment | Male Income | Female Income |
| Less than High School | - | - |
| High School Diploma | $39,000 | $40,714 |
| College or Associate's Degree | $55,250 | $68,333 |
| Bachelor's Degree | $113,500 | $69,647 |
| Graduate Degree | $162,500 | $81,375 |
| Total | $100,326 | $69,247 |
Family Income in Narberth borough
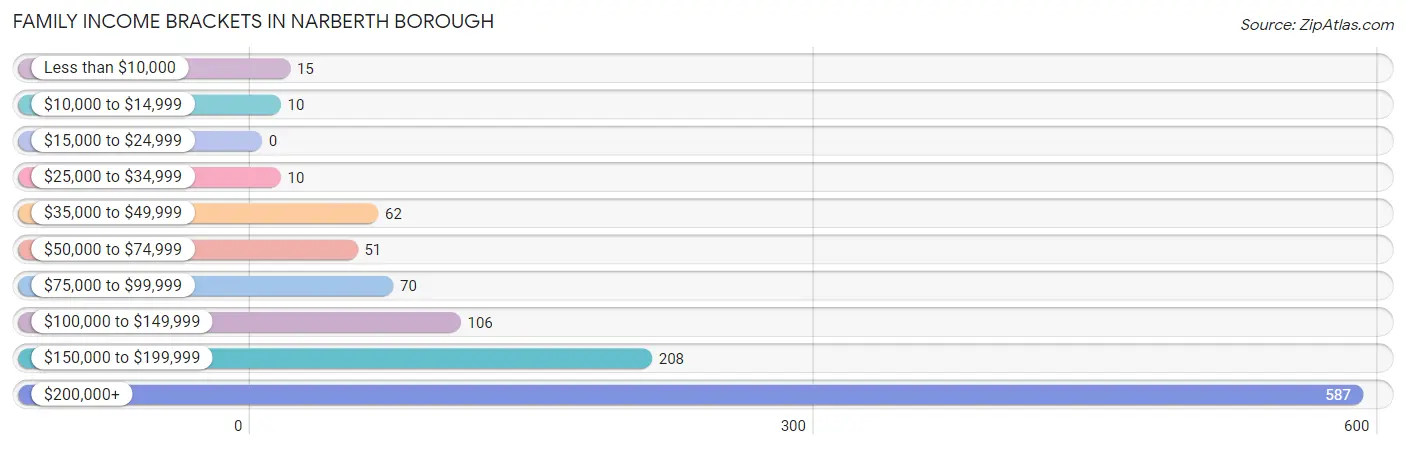
Family Income Brackets in Narberth borough
According to the Narberth borough family income data, there are 587 families falling into the $200,000+ income range, which is the most common income bracket and makes up 52.5% of all families.
| Income Bracket | # Families | % Families |
| Less than $10,000 | 15 | 1.3% |
| $10,000 to $14,999 | 10 | 0.9% |
| $15,000 to $24,999 | 0 | 0.0% |
| $25,000 to $34,999 | 10 | 0.9% |
| $35,000 to $49,999 | 62 | 5.5% |
| $50,000 to $74,999 | 51 | 4.6% |
| $75,000 to $99,999 | 70 | 6.3% |
| $100,000 to $149,999 | 106 | 9.5% |
| $150,000 to $199,999 | 208 | 18.6% |
| $200,000+ | 587 | 52.5% |
Family Income by Famaliy Size in Narberth borough
4-person families (254 | 22.7%) account for the highest median family income in Narberth borough with $250,001 per family, while 2-person families (479 | 42.8%) have the highest median income of $90,090 per family member.
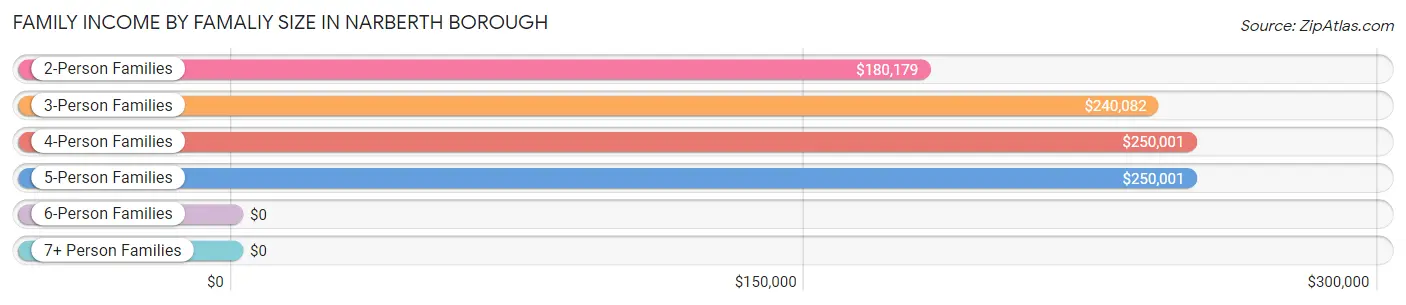
| Income Bracket | # Families | Median Income |
| 2-Person Families | 479 (42.8%) | $180,179 |
| 3-Person Families | 268 (23.9%) | $240,082 |
| 4-Person Families | 254 (22.7%) | $250,001 |
| 5-Person Families | 99 (8.8%) | $250,001 |
| 6-Person Families | 19 (1.7%) | $0 |
| 7+ Person Families | 0 (0.0%) | $0 |
| Total | 1,119 (100.0%) | $233,906 |
Family Income by Number of Earners in Narberth borough
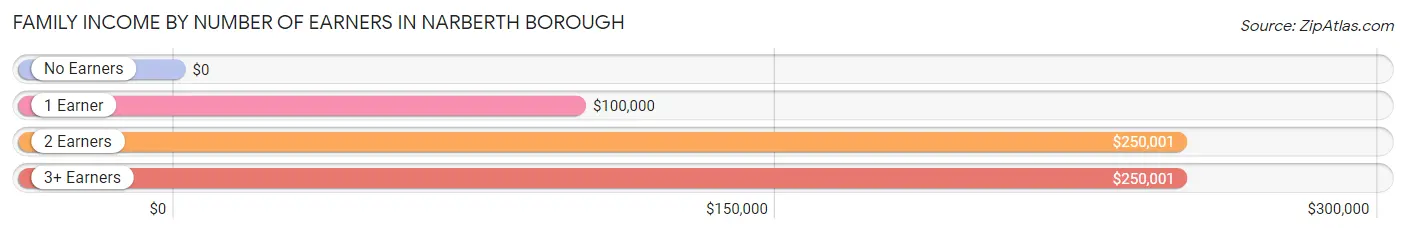
| Number of Earners | # Families | Median Income |
| No Earners | 71 (6.3%) | $0 |
| 1 Earner | 168 (15.0%) | $100,000 |
| 2 Earners | 818 (73.1%) | $250,001 |
| 3+ Earners | 62 (5.5%) | $250,001 |
| Total | 1,119 (100.0%) | $233,906 |
Household Income in Narberth borough
Household Income Brackets in Narberth borough
With 632 households falling in the category, the $200,000+ income range is the most frequent in Narberth borough, accounting for 32.4% of all households. In contrast, only 23 households (1.2%) fall into the $10,000 to $14,999 income bracket, making it the least populous group.
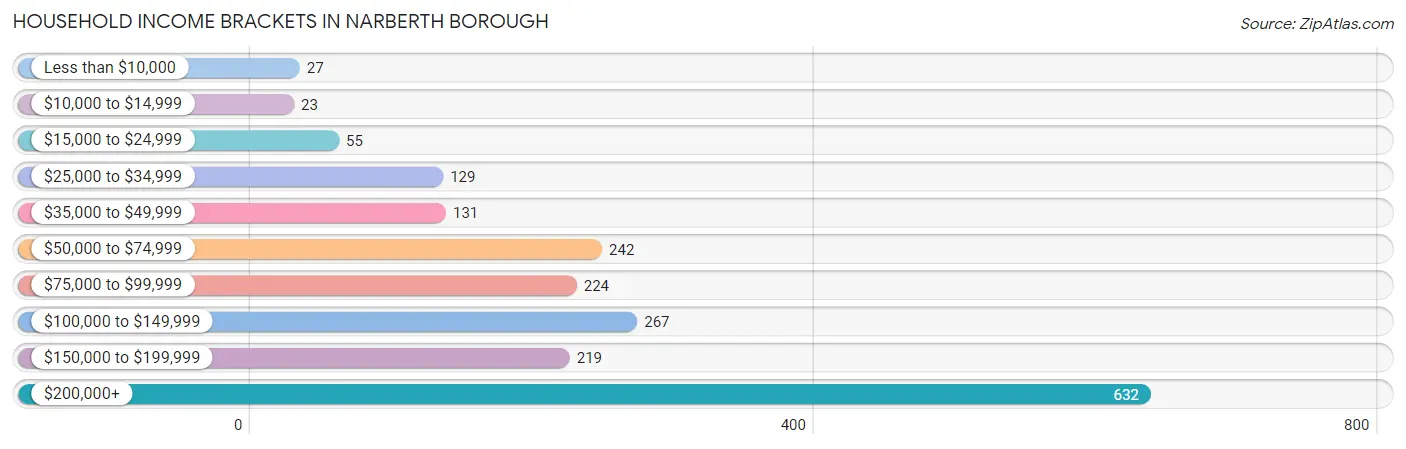
| Income Bracket | # Households | % Households |
| Less than $10,000 | 27 | 1.4% |
| $10,000 to $14,999 | 23 | 1.2% |
| $15,000 to $24,999 | 55 | 2.8% |
| $25,000 to $34,999 | 129 | 6.6% |
| $35,000 to $49,999 | 131 | 6.7% |
| $50,000 to $74,999 | 242 | 12.4% |
| $75,000 to $99,999 | 224 | 11.5% |
| $100,000 to $149,999 | 267 | 13.7% |
| $150,000 to $199,999 | 219 | 11.2% |
| $200,000+ | 632 | 32.4% |
Household Income by Householder Age in Narberth borough
The median household income in Narberth borough is $114,691, with the highest median household income of $181,964 found in the 45 to 64 years age bracket for the primary householder. A total of 731 households (37.4%) fall into this category. Meanwhile, the 15 to 24 years age bracket for the primary householder has the lowest median household income of $0, with 12 households (0.6%) in this group.
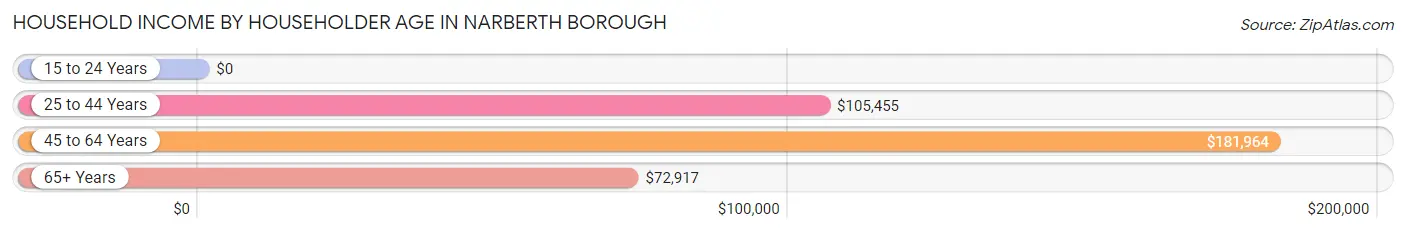
| Income Bracket | # Households | Median Income |
| 15 to 24 Years | 12 (0.6%) | $0 |
| 25 to 44 Years | 698 (35.8%) | $105,455 |
| 45 to 64 Years | 731 (37.4%) | $181,964 |
| 65+ Years | 511 (26.2%) | $72,917 |
| Total | 1,952 (100.0%) | $114,691 |
Poverty in Narberth borough
Income Below Poverty by Sex and Age in Narberth borough
With 1.9% poverty level for males and 2.8% for females among the residents of Narberth borough, 25 to 34 year old males and 18 to 24 year old females are the most vulnerable to poverty, with 13 males (7.5%) and 30 females (19.7%) in their respective age groups living below the poverty level.
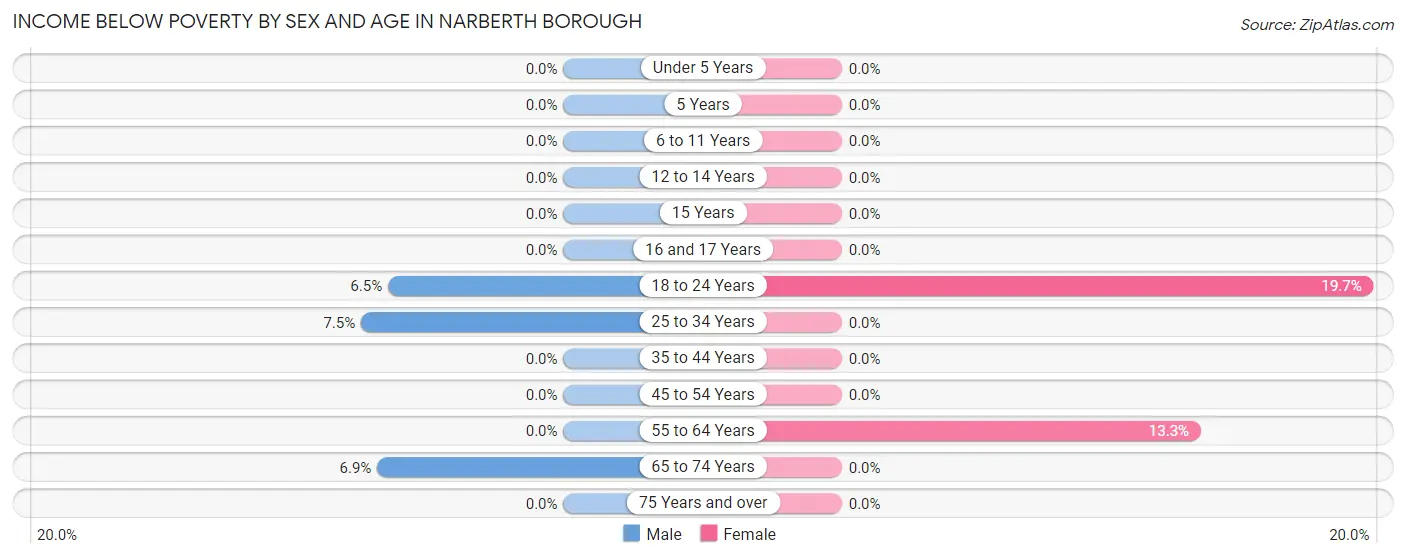
| Age Bracket | Male | Female |
| Under 5 Years | 0 (0.0%) | 0 (0.0%) |
| 5 Years | 0 (0.0%) | 0 (0.0%) |
| 6 to 11 Years | 0 (0.0%) | 0 (0.0%) |
| 12 to 14 Years | 0 (0.0%) | 0 (0.0%) |
| 15 Years | 0 (0.0%) | 0 (0.0%) |
| 16 and 17 Years | 0 (0.0%) | 0 (0.0%) |
| 18 to 24 Years | 14 (6.5%) | 30 (19.7%) |
| 25 to 34 Years | 13 (7.5%) | 0 (0.0%) |
| 35 to 44 Years | 0 (0.0%) | 0 (0.0%) |
| 45 to 54 Years | 0 (0.0%) | 0 (0.0%) |
| 55 to 64 Years | 0 (0.0%) | 36 (13.3%) |
| 65 to 74 Years | 15 (6.9%) | 0 (0.0%) |
| 75 Years and over | 0 (0.0%) | 0 (0.0%) |
| Total | 42 (1.9%) | 66 (2.8%) |
Income Above Poverty by Sex and Age in Narberth borough
According to the poverty statistics in Narberth borough, males aged under 5 years and females aged under 5 years are the age groups that are most secure financially, with 100.0% of males and 100.0% of females in these age groups living above the poverty line.
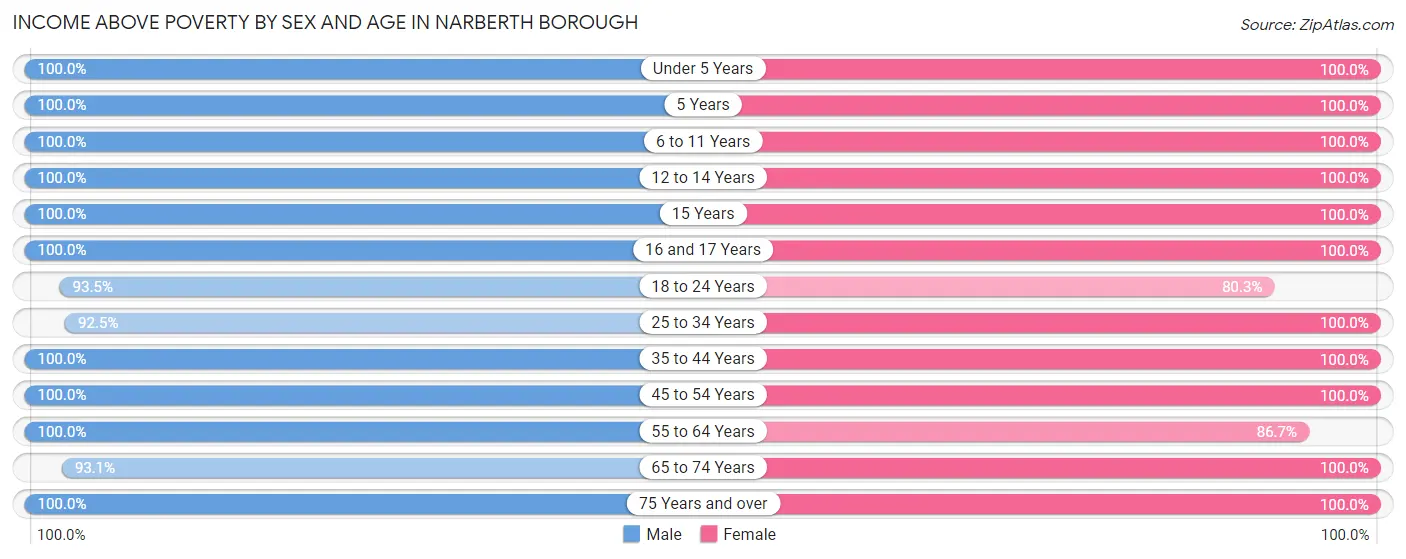
| Age Bracket | Male | Female |
| Under 5 Years | 107 (100.0%) | 65 (100.0%) |
| 5 Years | 18 (100.0%) | 21 (100.0%) |
| 6 to 11 Years | 129 (100.0%) | 201 (100.0%) |
| 12 to 14 Years | 76 (100.0%) | 85 (100.0%) |
| 15 Years | 24 (100.0%) | 44 (100.0%) |
| 16 and 17 Years | 91 (100.0%) | 74 (100.0%) |
| 18 to 24 Years | 201 (93.5%) | 122 (80.3%) |
| 25 to 34 Years | 160 (92.5%) | 294 (100.0%) |
| 35 to 44 Years | 337 (100.0%) | 252 (100.0%) |
| 45 to 54 Years | 408 (100.0%) | 421 (100.0%) |
| 55 to 64 Years | 295 (100.0%) | 234 (86.7%) |
| 65 to 74 Years | 202 (93.1%) | 295 (100.0%) |
| 75 Years and over | 62 (100.0%) | 152 (100.0%) |
| Total | 2,110 (98.1%) | 2,260 (97.2%) |
Income Below Poverty Among Married-Couple Families in Narberth borough
The poverty statistics for married-couple families in Narberth borough show that 1.6% or 15 of the total 933 families live below the poverty line. Families with no children have the highest poverty rate of 3.4%, comprising of 15 families. On the other hand, families with 1 or 2 children have the lowest poverty rate of 0.0%, which includes 0 families.
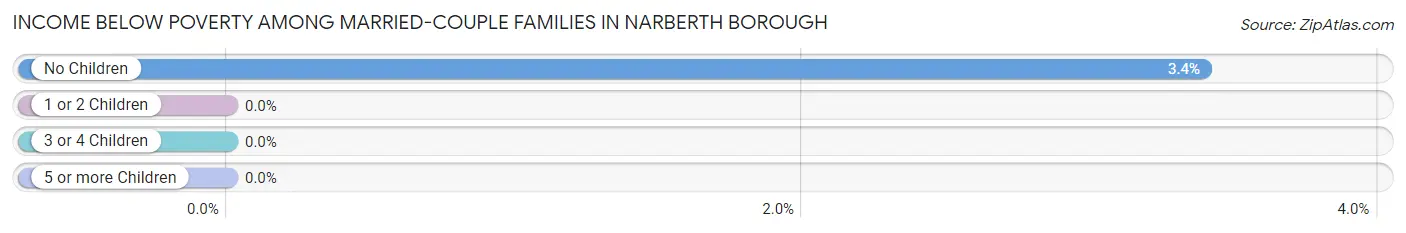
| Children | Above Poverty | Below Poverty |
| No Children | 428 (96.6%) | 15 (3.4%) |
| 1 or 2 Children | 469 (100.0%) | 0 (0.0%) |
| 3 or 4 Children | 21 (100.0%) | 0 (0.0%) |
| 5 or more Children | 0 (0.0%) | 0 (0.0%) |
| Total | 918 (98.4%) | 15 (1.6%) |
Income Below Poverty Among Single-Parent Households in Narberth borough
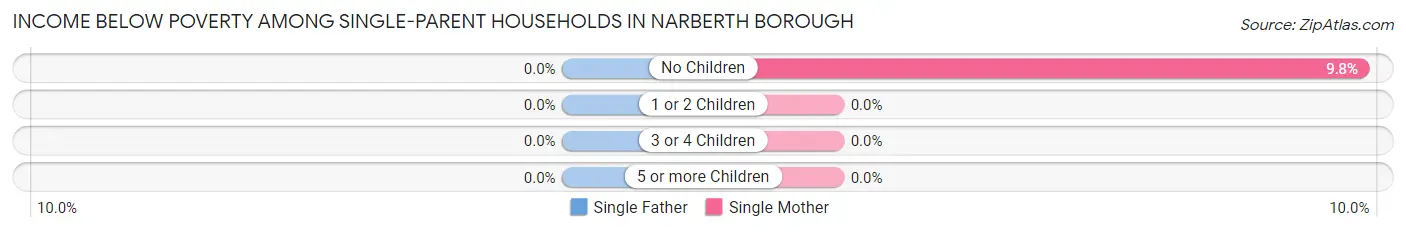
| Children | Single Father | Single Mother |
| No Children | 0 (0.0%) | 10 (9.8%) |
| 1 or 2 Children | 0 (0.0%) | 0 (0.0%) |
| 3 or 4 Children | 0 (0.0%) | 0 (0.0%) |
| 5 or more Children | 0 (0.0%) | 0 (0.0%) |
| Total | 0 (0.0%) | 10 (7.4%) |
Income Below Poverty Among Married-Couple vs Single-Parent Households in Narberth borough
The poverty data for Narberth borough shows that 15 of the married-couple family households (1.6%) and 10 of the single-parent households (5.4%) are living below the poverty level. Within the married-couple family households, those with no children have the highest poverty rate, with 15 households (3.4%) falling below the poverty line. Among the single-parent households, those with no children have the highest poverty rate, with 10 household (8.2%) living below poverty.
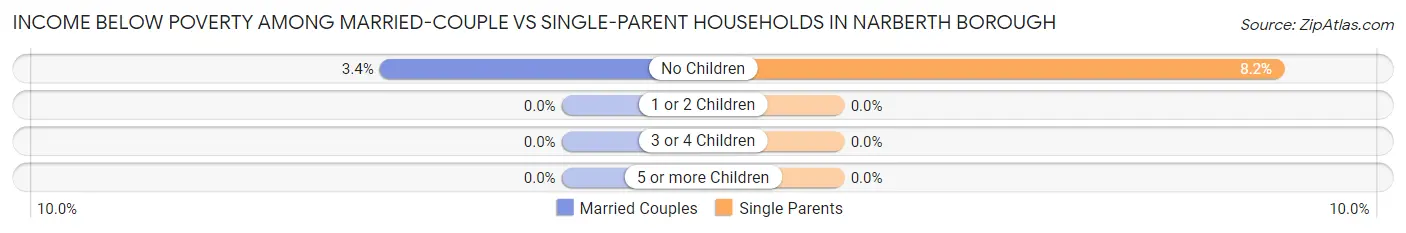
| Children | Married-Couple Families | Single-Parent Households |
| No Children | 15 (3.4%) | 10 (8.2%) |
| 1 or 2 Children | 0 (0.0%) | 0 (0.0%) |
| 3 or 4 Children | 0 (0.0%) | 0 (0.0%) |
| 5 or more Children | 0 (0.0%) | 0 (0.0%) |
| Total | 15 (1.6%) | 10 (5.4%) |
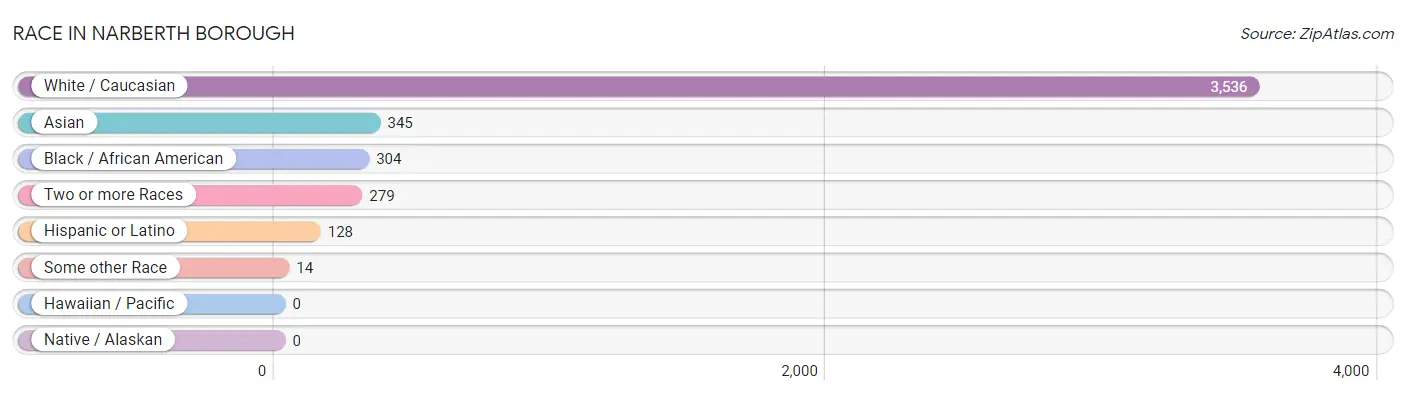
Race in Narberth borough
The most populous races in Narberth borough are White / Caucasian (3,536 | 79.0%), Asian (345 | 7.7%), and Black / African American (304 | 6.8%).
| Race | # Population | % Population |
| Asian | 345 | 7.7% |
| Black / African American | 304 | 6.8% |
| Hawaiian / Pacific | 0 | 0.0% |
| Hispanic or Latino | 128 | 2.9% |
| Native / Alaskan | 0 | 0.0% |
| White / Caucasian | 3,536 | 79.0% |
| Two or more Races | 279 | 6.2% |
| Some other Race | 14 | 0.3% |
| Total | 4,478 | 100.0% |
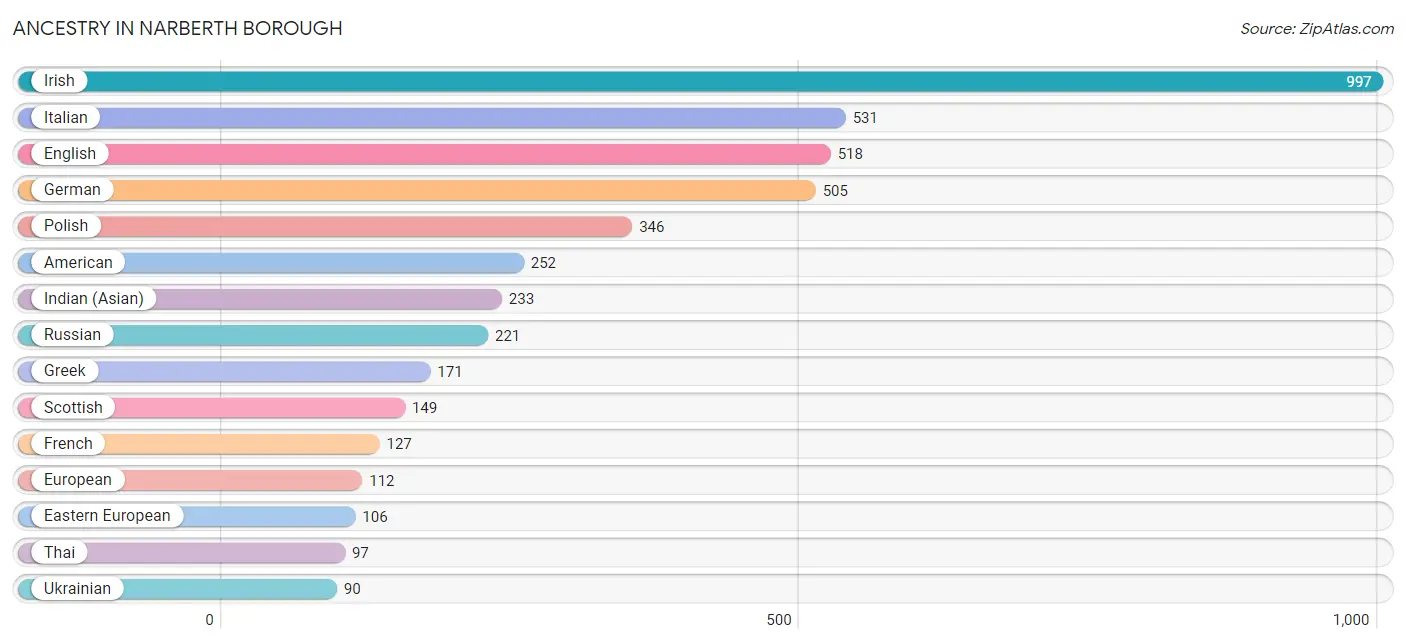
Ancestry in Narberth borough
The most populous ancestries reported in Narberth borough are Irish (997 | 22.3%), Italian (531 | 11.9%), English (518 | 11.6%), German (505 | 11.3%), and Polish (346 | 7.7%), together accounting for 64.7% of all Narberth borough residents.
| Ancestry | # Population | % Population |
| American | 252 | 5.6% |
| Austrian | 49 | 1.1% |
| Belgian | 8 | 0.2% |
| Bhutanese | 73 | 1.6% |
| British | 33 | 0.7% |
| Canadian | 47 | 1.1% |
| Croatian | 25 | 0.6% |
| Cuban | 31 | 0.7% |
| Czech | 20 | 0.4% |
| Eastern European | 106 | 2.4% |
| English | 518 | 11.6% |
| Estonian | 53 | 1.2% |
| European | 112 | 2.5% |
| Filipino | 61 | 1.4% |
| Finnish | 37 | 0.8% |
| French | 127 | 2.8% |
| German | 505 | 11.3% |
| Greek | 171 | 3.8% |
| Hungarian | 72 | 1.6% |
| Indian (Asian) | 233 | 5.2% |
| Irish | 997 | 22.3% |
| Italian | 531 | 11.9% |
| Korean | 30 | 0.7% |
| Lithuanian | 30 | 0.7% |
| Northern European | 8 | 0.2% |
| Norwegian | 18 | 0.4% |
| Paraguayan | 8 | 0.2% |
| Pennsylvania German | 13 | 0.3% |
| Peruvian | 27 | 0.6% |
| Polish | 346 | 7.7% |
| Portuguese | 36 | 0.8% |
| Puerto Rican | 27 | 0.6% |
| Romanian | 35 | 0.8% |
| Russian | 221 | 4.9% |
| Scandinavian | 13 | 0.3% |
| Scotch-Irish | 24 | 0.5% |
| Scottish | 149 | 3.3% |
| Slovak | 13 | 0.3% |
| South American | 35 | 0.8% |
| Spanish | 35 | 0.8% |
| Swedish | 29 | 0.6% |
| Swiss | 30 | 0.7% |
| Thai | 97 | 2.2% |
| Trinidadian and Tobagonian | 1 | 0.0% |
| Turkish | 9 | 0.2% |
| Ukrainian | 90 | 2.0% |
| Welsh | 28 | 0.6% | View All 47 Rows |
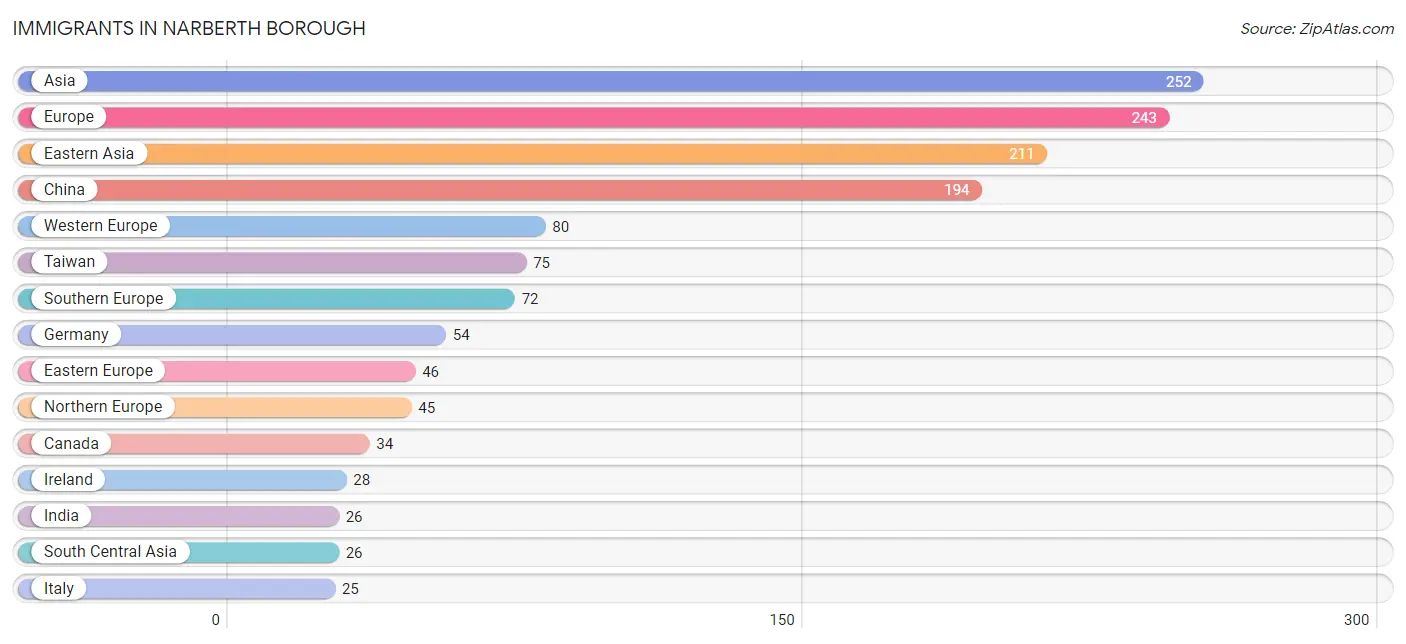
Immigrants in Narberth borough
The most numerous immigrant groups reported in Narberth borough came from Asia (252 | 5.6%), Europe (243 | 5.4%), Eastern Asia (211 | 4.7%), China (194 | 4.3%), and Western Europe (80 | 1.8%), together accounting for 21.9% of all Narberth borough residents.
| Immigration Origin | # Population | % Population |
| Africa | 10 | 0.2% |
| Asia | 252 | 5.6% |
| Canada | 34 | 0.8% |
| Caribbean | 10 | 0.2% |
| China | 194 | 4.3% |
| Cuba | 9 | 0.2% |
| Eastern Asia | 211 | 4.7% |
| Eastern Europe | 46 | 1.0% |
| Egypt | 10 | 0.2% |
| England | 9 | 0.2% |
| Europe | 243 | 5.4% |
| France | 3 | 0.1% |
| Germany | 54 | 1.2% |
| Greece | 21 | 0.5% |
| Hungary | 11 | 0.3% |
| India | 26 | 0.6% |
| Ireland | 28 | 0.6% |
| Italy | 25 | 0.6% |
| Japan | 17 | 0.4% |
| Latin America | 24 | 0.5% |
| Northern Africa | 10 | 0.2% |
| Northern Europe | 45 | 1.0% |
| Peru | 14 | 0.3% |
| Philippines | 11 | 0.3% |
| Portugal | 9 | 0.2% |
| Russia | 24 | 0.5% |
| Scotland | 8 | 0.2% |
| Serbia | 11 | 0.3% |
| South America | 14 | 0.3% |
| South Central Asia | 26 | 0.6% |
| South Eastern Asia | 11 | 0.3% |
| Southern Europe | 72 | 1.6% |
| Spain | 17 | 0.4% |
| Switzerland | 23 | 0.5% |
| Taiwan | 75 | 1.7% |
| Trinidad and Tobago | 1 | 0.0% |
| Turkey | 4 | 0.1% |
| Western Asia | 4 | 0.1% |
| Western Europe | 80 | 1.8% | View All 39 Rows |
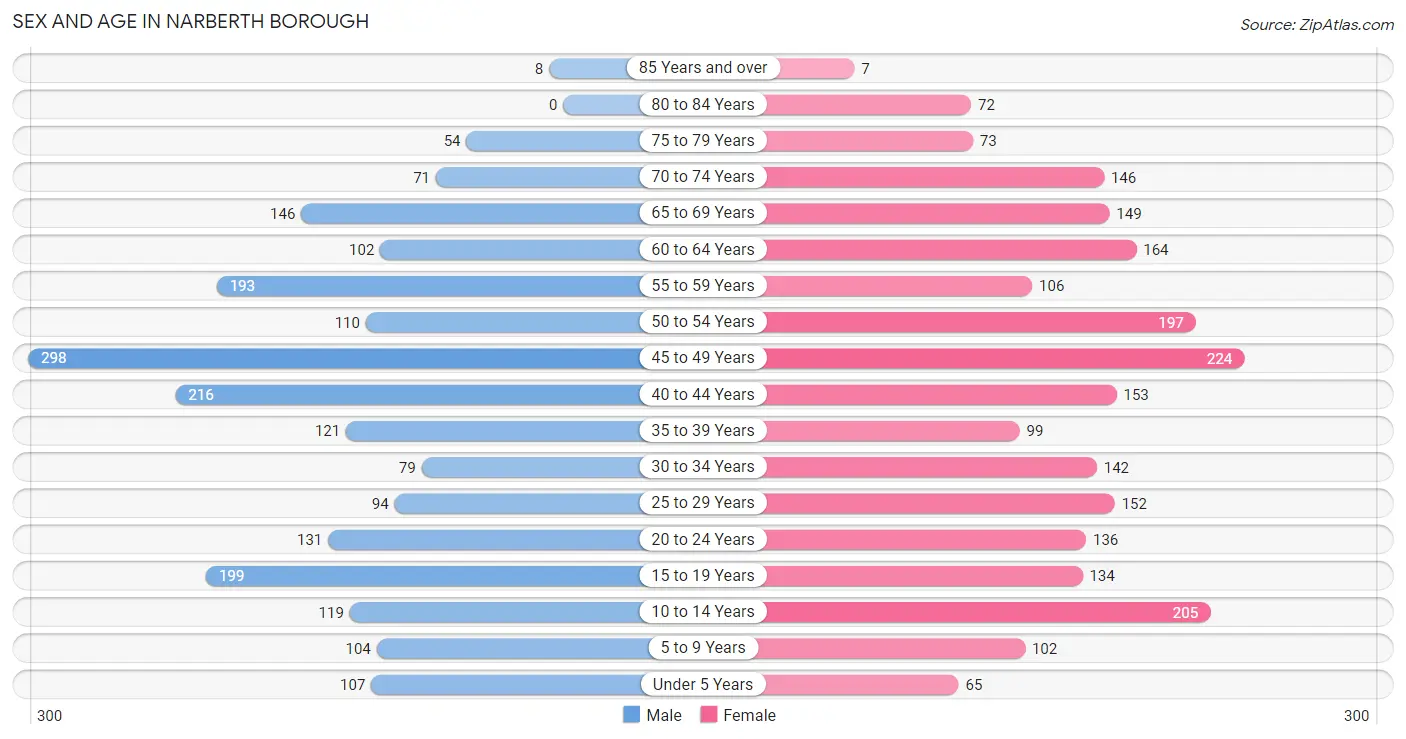
Sex and Age in Narberth borough
Sex and Age in Narberth borough
The most populous age groups in Narberth borough are 45 to 49 Years (298 | 13.9%) for men and 45 to 49 Years (224 | 9.6%) for women.
| Age Bracket | Male | Female |
| Under 5 Years | 107 (5.0%) | 65 (2.8%) |
| 5 to 9 Years | 104 (4.8%) | 102 (4.4%) |
| 10 to 14 Years | 119 (5.5%) | 205 (8.8%) |
| 15 to 19 Years | 199 (9.2%) | 134 (5.8%) |
| 20 to 24 Years | 131 (6.1%) | 136 (5.9%) |
| 25 to 29 Years | 94 (4.4%) | 152 (6.5%) |
| 30 to 34 Years | 79 (3.7%) | 142 (6.1%) |
| 35 to 39 Years | 121 (5.6%) | 99 (4.3%) |
| 40 to 44 Years | 216 (10.0%) | 153 (6.6%) |
| 45 to 49 Years | 298 (13.9%) | 224 (9.6%) |
| 50 to 54 Years | 110 (5.1%) | 197 (8.5%) |
| 55 to 59 Years | 193 (9.0%) | 106 (4.6%) |
| 60 to 64 Years | 102 (4.7%) | 164 (7.0%) |
| 65 to 69 Years | 146 (6.8%) | 149 (6.4%) |
| 70 to 74 Years | 71 (3.3%) | 146 (6.3%) |
| 75 to 79 Years | 54 (2.5%) | 73 (3.1%) |
| 80 to 84 Years | 0 (0.0%) | 72 (3.1%) |
| 85 Years and over | 8 (0.4%) | 7 (0.3%) |
| Total | 2,152 (100.0%) | 2,326 (100.0%) |
Families and Households in Narberth borough
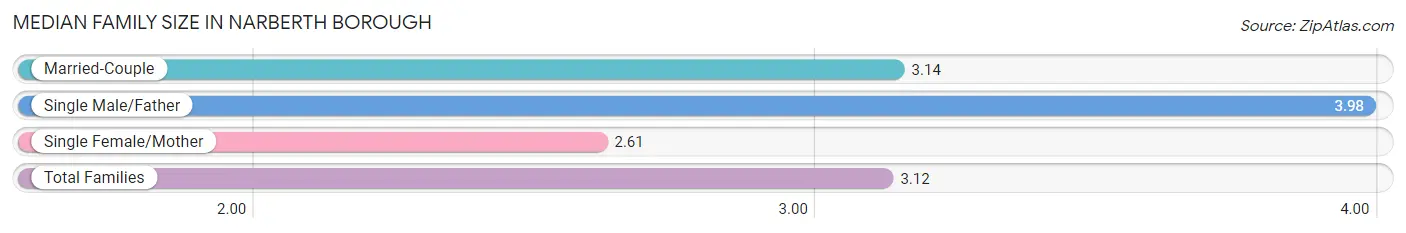
Median Family Size in Narberth borough
The median family size in Narberth borough is 3.12 persons per family, with single male/father families (51 | 4.6%) accounting for the largest median family size of 3.98 persons per family. On the other hand, single female/mother families (135 | 12.1%) represent the smallest median family size with 2.61 persons per family.
| Family Type | # Families | Family Size |
| Married-Couple | 933 (83.4%) | 3.14 |
| Single Male/Father | 51 (4.6%) | 3.98 |
| Single Female/Mother | 135 (12.1%) | 2.61 |
| Total Families | 1,119 (100.0%) | 3.12 |
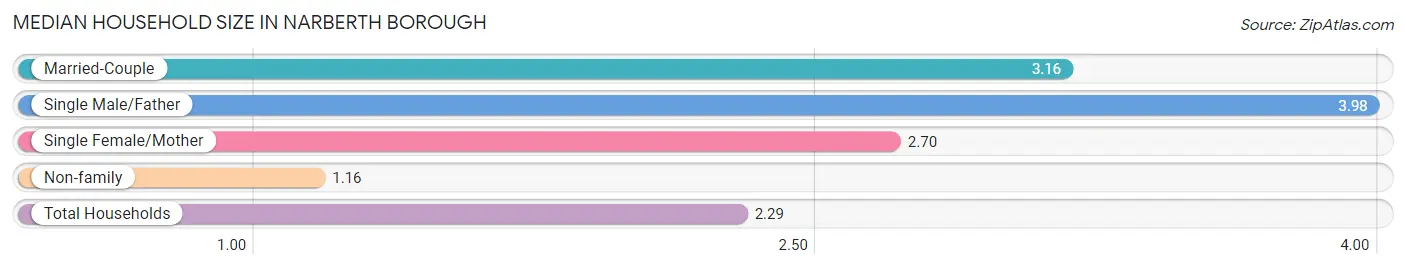
Median Household Size in Narberth borough
The median household size in Narberth borough is 2.29 persons per household, with single male/father households (51 | 2.6%) accounting for the largest median household size of 3.98 persons per household. non-family households (833 | 42.7%) represent the smallest median household size with 1.16 persons per household.
| Household Type | # Households | Household Size |
| Married-Couple | 933 (47.8%) | 3.16 |
| Single Male/Father | 51 (2.6%) | 3.98 |
| Single Female/Mother | 135 (6.9%) | 2.70 |
| Non-family | 833 (42.7%) | 1.16 |
| Total Households | 1,952 (100.0%) | 2.29 |
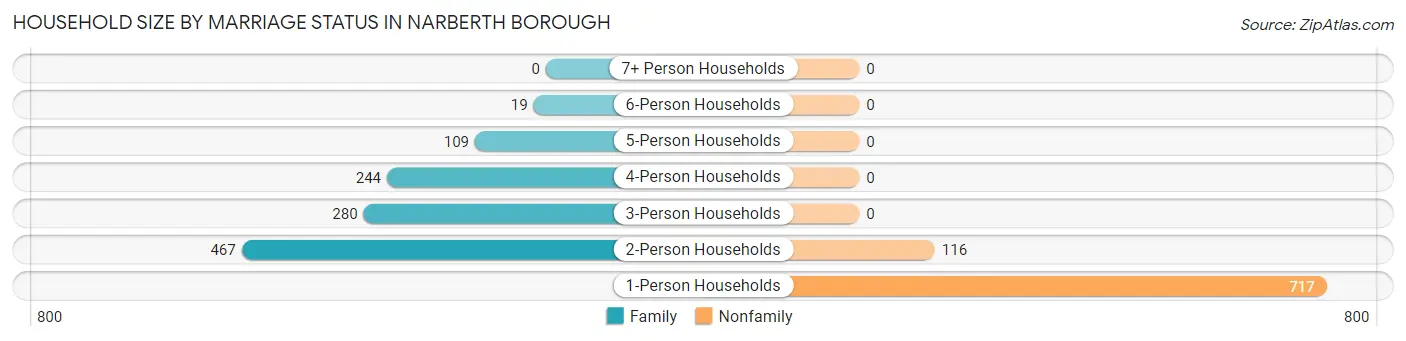
Household Size by Marriage Status in Narberth borough
Out of a total of 1,952 households in Narberth borough, 1,119 (57.3%) are family households, while 833 (42.7%) are nonfamily households. The most numerous type of family households are 2-person households, comprising 467, and the most common type of nonfamily households are 1-person households, comprising 717.
| Household Size | Family Households | Nonfamily Households |
| 1-Person Households | - | 717 (36.7%) |
| 2-Person Households | 467 (23.9%) | 116 (5.9%) |
| 3-Person Households | 280 (14.3%) | 0 (0.0%) |
| 4-Person Households | 244 (12.5%) | 0 (0.0%) |
| 5-Person Households | 109 (5.6%) | 0 (0.0%) |
| 6-Person Households | 19 (1.0%) | 0 (0.0%) |
| 7+ Person Households | 0 (0.0%) | 0 (0.0%) |
| Total | 1,119 (57.3%) | 833 (42.7%) |
Female Fertility in Narberth borough
Fertility by Age in Narberth borough
Average fertility rate in Narberth borough is 20.0 births per 1,000 women. Women in the age bracket of 35 to 50 years have the highest fertility rate with 33.0 births per 1,000 women. Women in the age bracket of 35 to 50 years acount for 76.2% of all women with births.
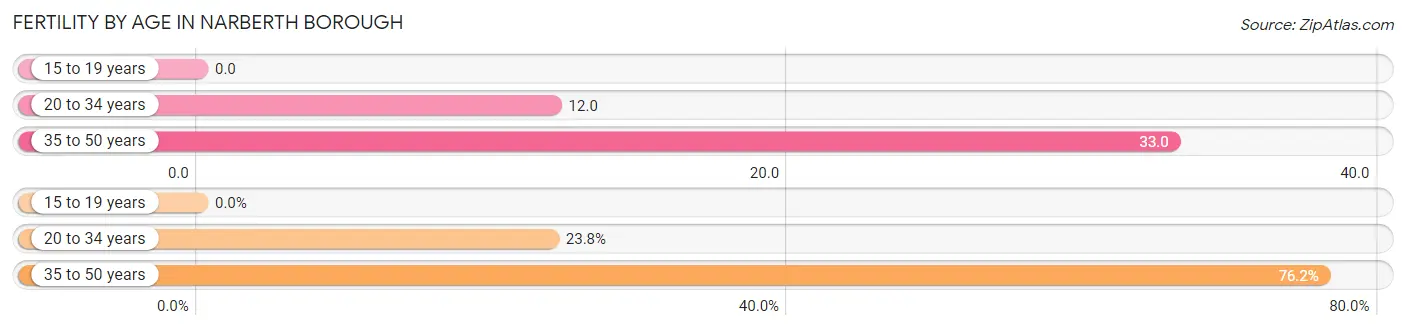
| Age Bracket | Women with Births | Births / 1,000 Women |
| 15 to 19 years | 0 (0.0%) | 0.0 |
| 20 to 34 years | 5 (23.8%) | 12.0 |
| 35 to 50 years | 16 (76.2%) | 33.0 |
| Total | 21 (100.0%) | 20.0 |
Fertility by Age by Marriage Status in Narberth borough
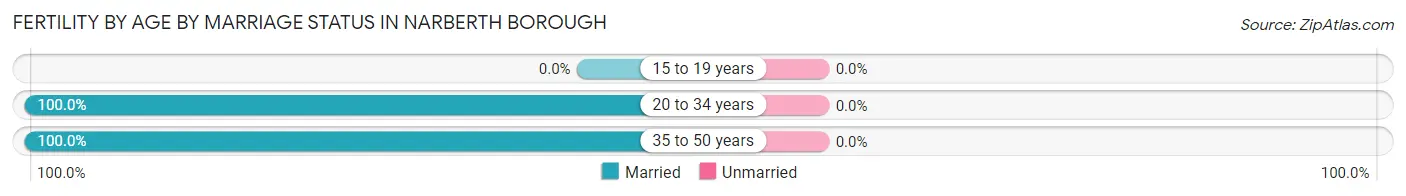
| Age Bracket | Married | Unmarried |
| 15 to 19 years | 0 (0.0%) | 0 (0.0%) |
| 20 to 34 years | 5 (100.0%) | 0 (0.0%) |
| 35 to 50 years | 16 (100.0%) | 0 (0.0%) |
| Total | 21 (100.0%) | 0 (0.0%) |
Fertility by Education in Narberth borough
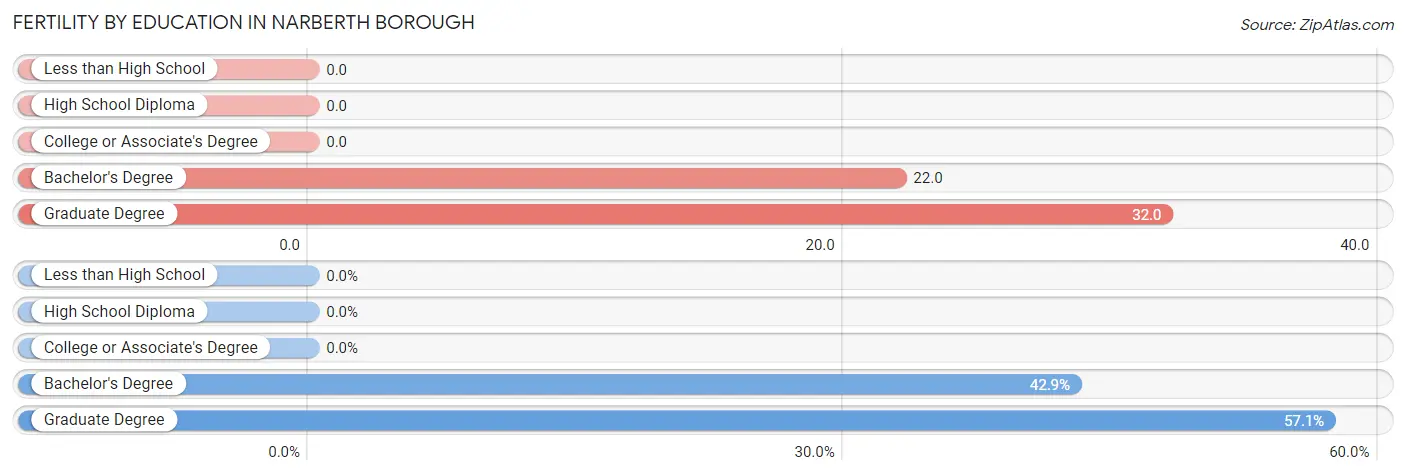
| Educational Attainment | Women with Births | Births / 1,000 Women |
| Less than High School | 0 (0.0%) | 0.0 |
| High School Diploma | 0 (0.0%) | 0.0 |
| College or Associate's Degree | 0 (0.0%) | 0.0 |
| Bachelor's Degree | 9 (42.9%) | 22.0 |
| Graduate Degree | 12 (57.1%) | 32.0 |
| Total | 21 (100.0%) | 20.0 |
Fertility by Education by Marriage Status in Narberth borough
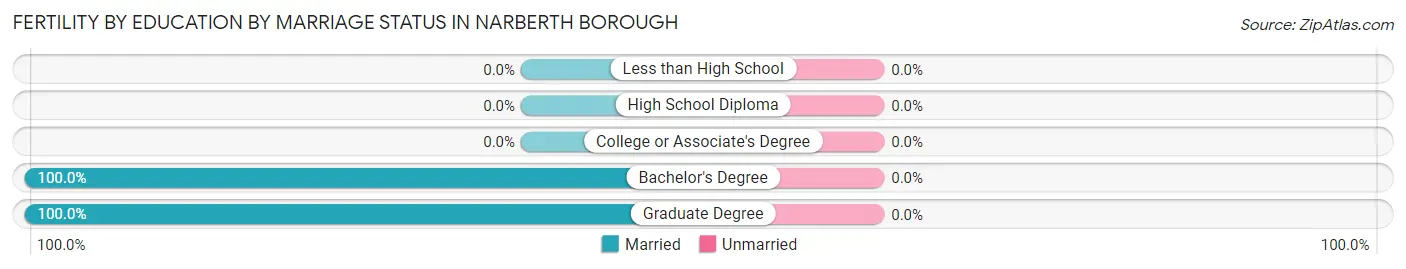
| Educational Attainment | Married | Unmarried |
| Less than High School | 0 (0.0%) | 0 (0.0%) |
| High School Diploma | 0 (0.0%) | 0 (0.0%) |
| College or Associate's Degree | 0 (0.0%) | 0 (0.0%) |
| Bachelor's Degree | 9 (100.0%) | 0 (0.0%) |
| Graduate Degree | 12 (100.0%) | 0 (0.0%) |
| Total | 21 (100.0%) | 0 (0.0%) |
Employment Characteristics in Narberth borough
Employment by Class of Employer in Narberth borough
Among the 2,697 employed individuals in Narberth borough, private company employees (1,271 | 47.1%), not-for-profit organizations (908 | 33.7%), and self-employed (not incorporated) (179 | 6.6%) make up the most common classes of employment.
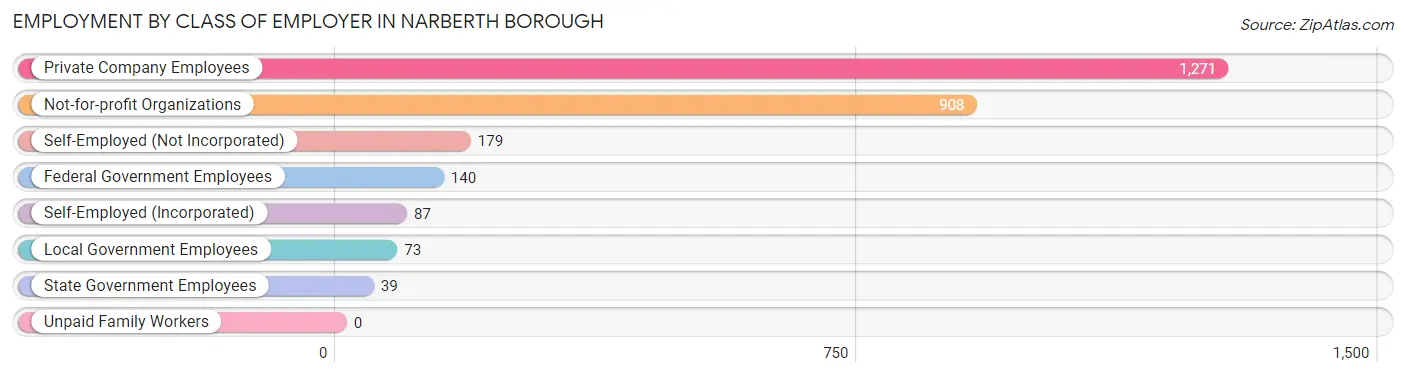
| Employer Class | # Employees | % Employees |
| Private Company Employees | 1,271 | 47.1% |
| Self-Employed (Incorporated) | 87 | 3.2% |
| Self-Employed (Not Incorporated) | 179 | 6.6% |
| Not-for-profit Organizations | 908 | 33.7% |
| Local Government Employees | 73 | 2.7% |
| State Government Employees | 39 | 1.5% |
| Federal Government Employees | 140 | 5.2% |
| Unpaid Family Workers | 0 | 0.0% |
| Total | 2,697 | 100.0% |
Employment Status by Age in Narberth borough
According to the labor force statistics for Narberth borough, out of the total population over 16 years of age (3,708), 77.1% or 2,859 individuals are in the labor force, with 4.8% or 137 of them unemployed. The age group with the highest labor force participation rate is 25 to 29 years, with 100.0% or 246 individuals in the labor force. Within the labor force, the 16 to 19 years age range has the highest percentage of unemployed individuals, with 39.5% or 32 of them being unemployed.
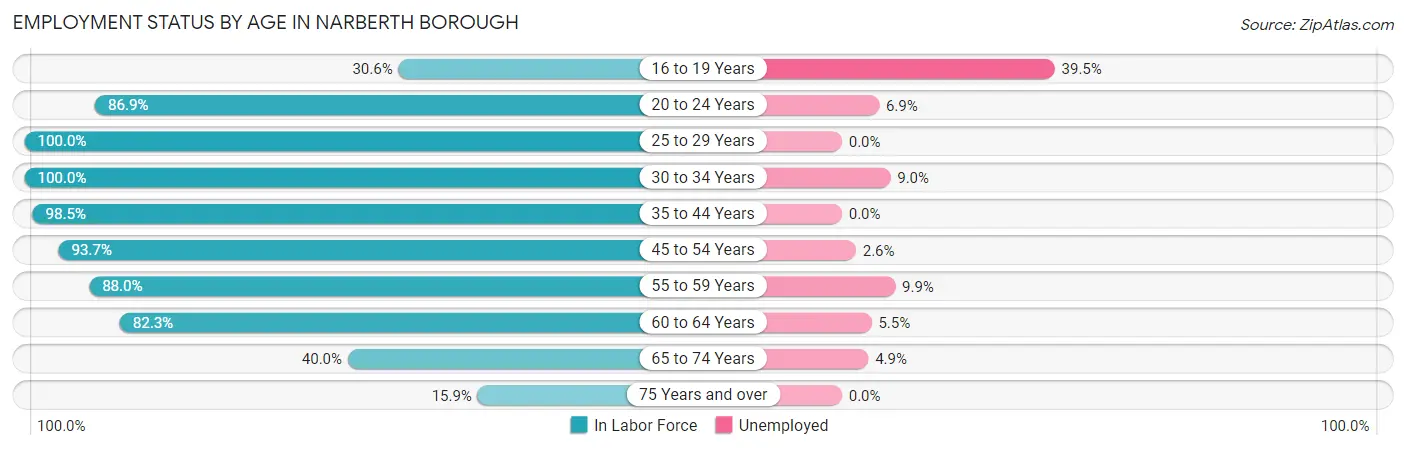
| Age Bracket | In Labor Force | Unemployed |
| 16 to 19 Years | 81 (30.6%) | 32 (39.5%) |
| 20 to 24 Years | 232 (86.9%) | 16 (6.9%) |
| 25 to 29 Years | 246 (100.0%) | 0 (0.0%) |
| 30 to 34 Years | 221 (100.0%) | 20 (9.0%) |
| 35 to 44 Years | 580 (98.5%) | 0 (0.0%) |
| 45 to 54 Years | 777 (93.7%) | 20 (2.6%) |
| 55 to 59 Years | 263 (88.0%) | 26 (9.9%) |
| 60 to 64 Years | 219 (82.3%) | 12 (5.5%) |
| 65 to 74 Years | 205 (40.0%) | 10 (4.9%) |
| 75 Years and over | 34 (15.9%) | 0 (0.0%) |
| Total | 2,859 (77.1%) | 137 (4.8%) |
Employment Status by Educational Attainment in Narberth borough
According to labor force statistics for Narberth borough, 94.1% of individuals (2,305) out of the total population between 25 and 64 years of age (2,450) are in the labor force, with 3.4% or 78 of them being unemployed. The group with the highest labor force participation rate are those with the educational attainment of bachelor's degree or higher, with 96.8% or 1,948 individuals in the labor force. Within the labor force, individuals with high school diploma education have the highest percentage of unemployment, with 11.4% or 13 of them being unemployed.
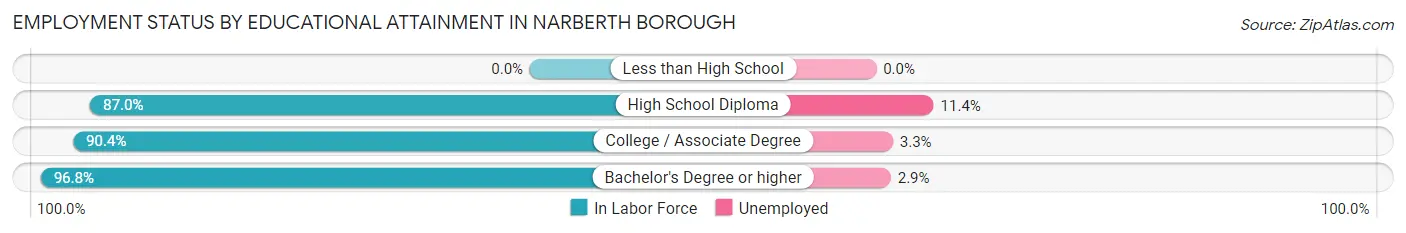
| Educational Attainment | In Labor Force | Unemployed |
| Less than High School | 0 (0.0%) | 0 (0.0%) |
| High School Diploma | 114 (87.0%) | 15 (11.4%) |
| College / Associate Degree | 245 (90.4%) | 9 (3.3%) |
| Bachelor's Degree or higher | 1,948 (96.8%) | 58 (2.9%) |
| Total | 2,305 (94.1%) | 83 (3.4%) |
Employment Occupations by Sex in Narberth borough
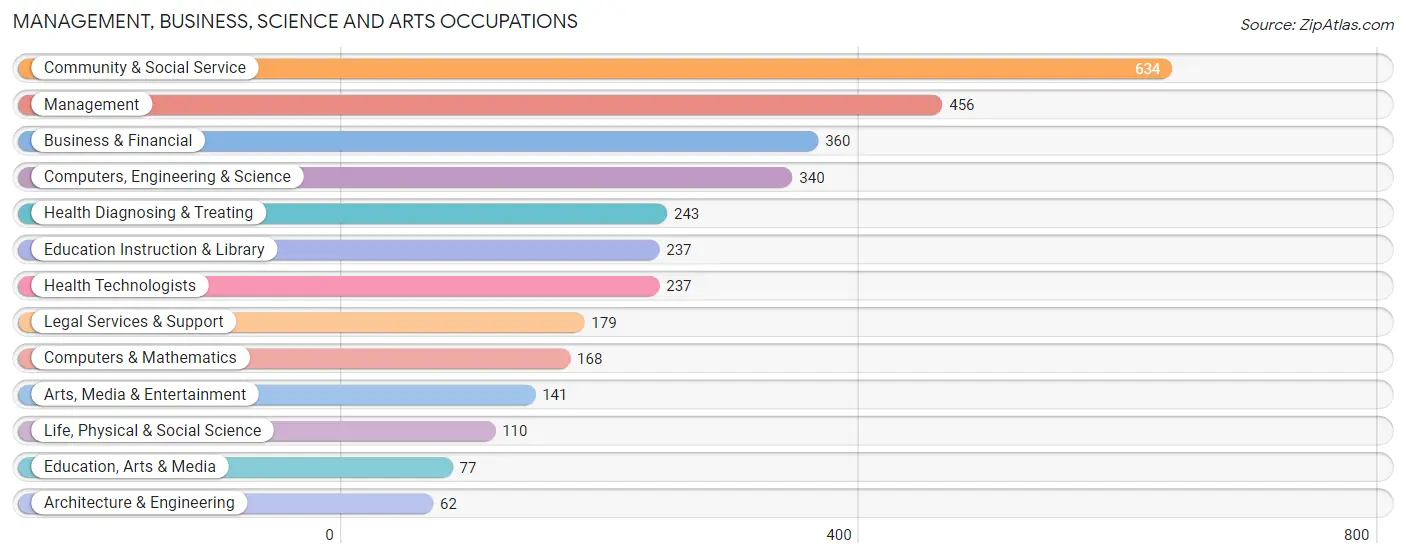
Management, Business, Science and Arts Occupations
The most common Management, Business, Science and Arts occupations in Narberth borough are Community & Social Service (634 | 23.3%), Management (456 | 16.8%), Business & Financial (360 | 13.2%), Computers, Engineering & Science (340 | 12.5%), and Health Diagnosing & Treating (243 | 8.9%).
Management, Business, Science and Arts Occupations by Sex
Within the Management, Business, Science and Arts occupations in Narberth borough, the most male-oriented occupations are Architecture & Engineering (100.0%), Computers & Mathematics (82.7%), and Computers, Engineering & Science (71.5%), while the most female-oriented occupations are Education Instruction & Library (66.2%), Life, Physical & Social Science (61.8%), and Management (61.6%).
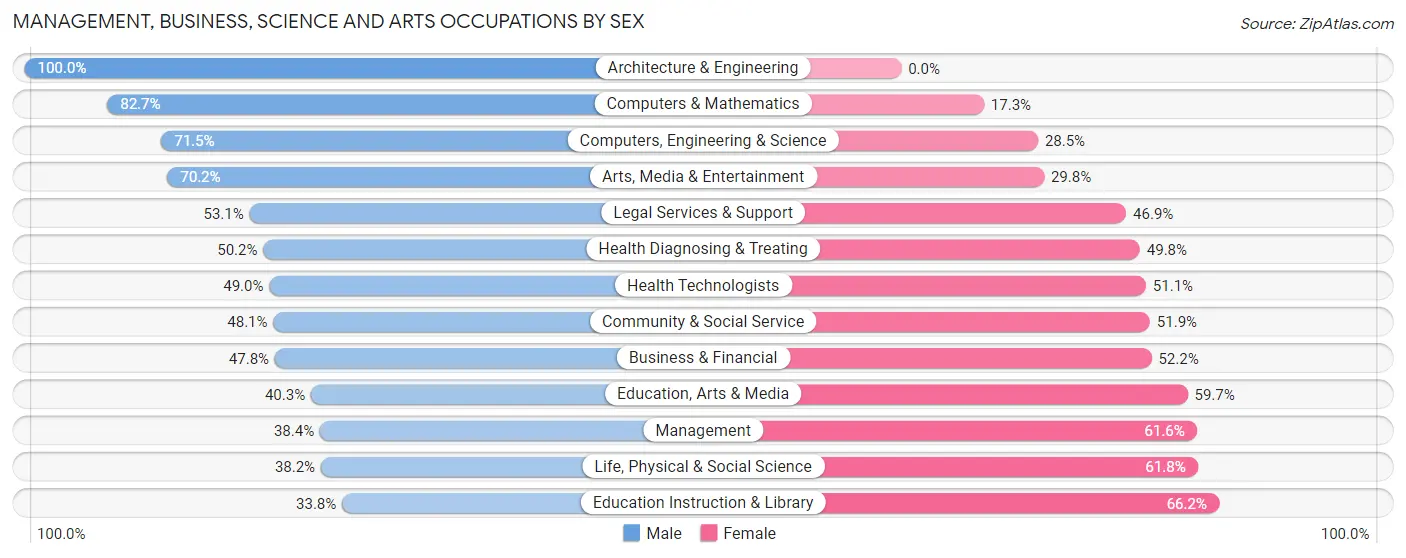
| Occupation | Male | Female |
| Management | 175 (38.4%) | 281 (61.6%) |
| Business & Financial | 172 (47.8%) | 188 (52.2%) |
| Computers, Engineering & Science | 243 (71.5%) | 97 (28.5%) |
| Computers & Mathematics | 139 (82.7%) | 29 (17.3%) |
| Architecture & Engineering | 62 (100.0%) | 0 (0.0%) |
| Life, Physical & Social Science | 42 (38.2%) | 68 (61.8%) |
| Community & Social Service | 305 (48.1%) | 329 (51.9%) |
| Education, Arts & Media | 31 (40.3%) | 46 (59.7%) |
| Legal Services & Support | 95 (53.1%) | 84 (46.9%) |
| Education Instruction & Library | 80 (33.8%) | 157 (66.2%) |
| Arts, Media & Entertainment | 99 (70.2%) | 42 (29.8%) |
| Health Diagnosing & Treating | 122 (50.2%) | 121 (49.8%) |
| Health Technologists | 116 (48.9%) | 121 (51.0%) |
| Total (Category) | 1,017 (50.0%) | 1,016 (50.0%) |
| Total (Overall) | 1,420 (52.2%) | 1,302 (47.8%) |
Services Occupations
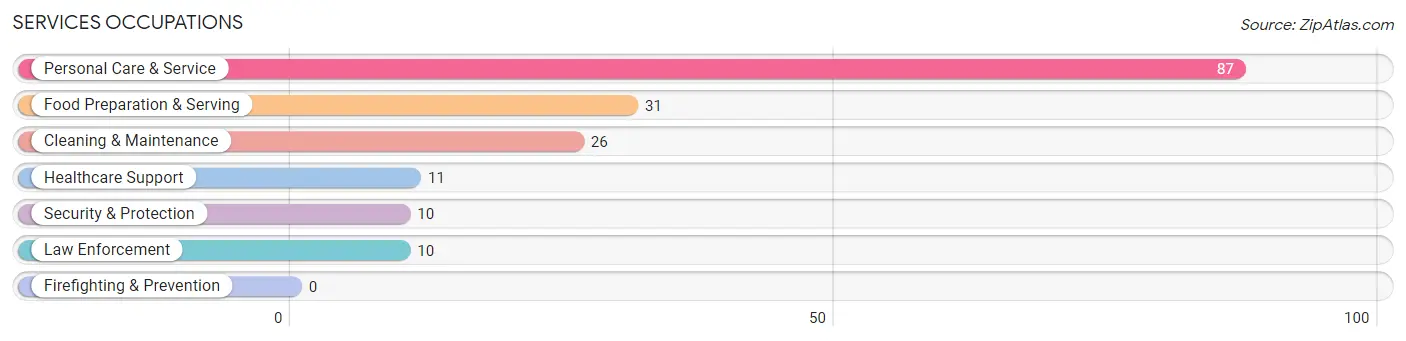
The most common Services occupations in Narberth borough are Personal Care & Service (87 | 3.2%), Food Preparation & Serving (31 | 1.1%), Cleaning & Maintenance (26 | 1.0%), Healthcare Support (11 | 0.4%), and Security & Protection (10 | 0.4%).
Services Occupations by Sex
Within the Services occupations in Narberth borough, the most male-oriented occupations are Cleaning & Maintenance (65.4%), Food Preparation & Serving (38.7%), and Personal Care & Service (10.3%), while the most female-oriented occupations are Healthcare Support (100.0%), Security & Protection (100.0%), and Law Enforcement (100.0%).
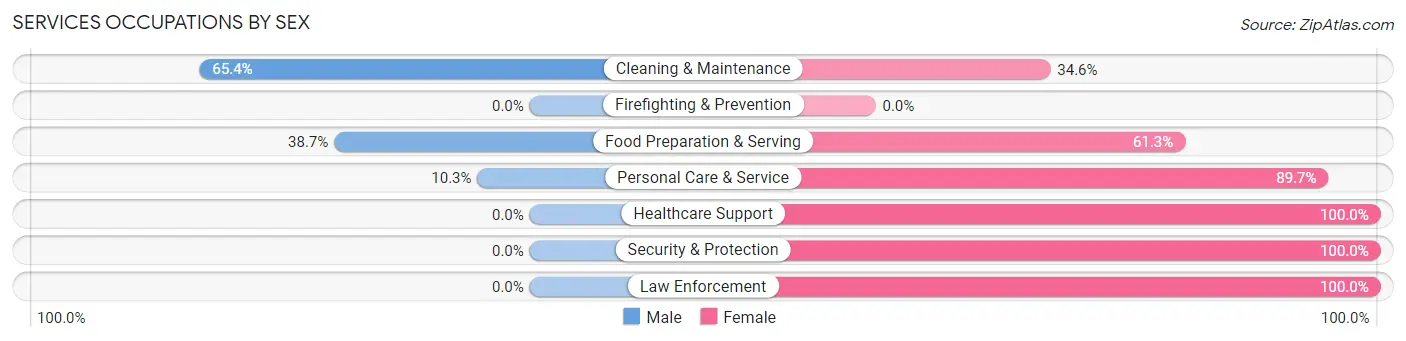
| Occupation | Male | Female |
| Healthcare Support | 0 (0.0%) | 11 (100.0%) |
| Security & Protection | 0 (0.0%) | 10 (100.0%) |
| Firefighting & Prevention | 0 (0.0%) | 0 (0.0%) |
| Law Enforcement | 0 (0.0%) | 10 (100.0%) |
| Food Preparation & Serving | 12 (38.7%) | 19 (61.3%) |
| Cleaning & Maintenance | 17 (65.4%) | 9 (34.6%) |
| Personal Care & Service | 9 (10.3%) | 78 (89.7%) |
| Total (Category) | 38 (23.0%) | 127 (77.0%) |
| Total (Overall) | 1,420 (52.2%) | 1,302 (47.8%) |
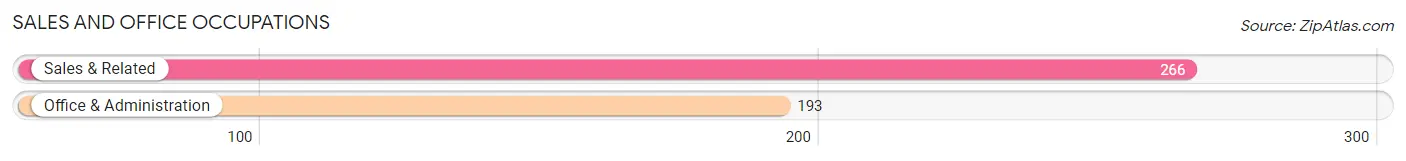
Sales and Office Occupations
The most common Sales and Office occupations in Narberth borough are Sales & Related (266 | 9.8%), and Office & Administration (193 | 7.1%).
Sales and Office Occupations by Sex
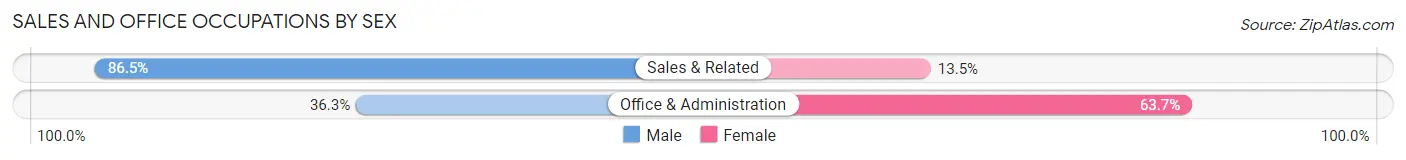
| Occupation | Male | Female |
| Sales & Related | 230 (86.5%) | 36 (13.5%) |
| Office & Administration | 70 (36.3%) | 123 (63.7%) |
| Total (Category) | 300 (65.4%) | 159 (34.6%) |
| Total (Overall) | 1,420 (52.2%) | 1,302 (47.8%) |
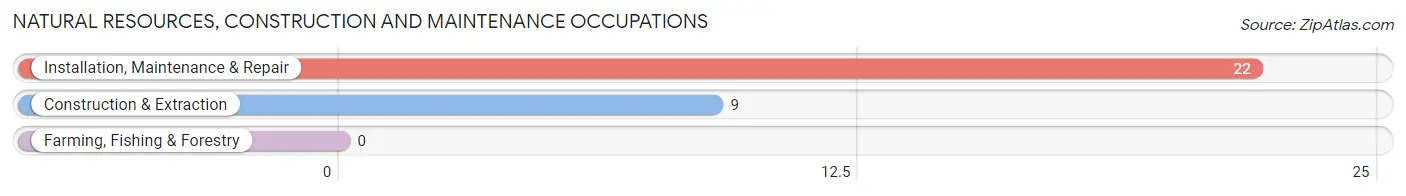
Natural Resources, Construction and Maintenance Occupations
The most common Natural Resources, Construction and Maintenance occupations in Narberth borough are Installation, Maintenance & Repair (22 | 0.8%), and Construction & Extraction (9 | 0.3%).
Natural Resources, Construction and Maintenance Occupations by Sex
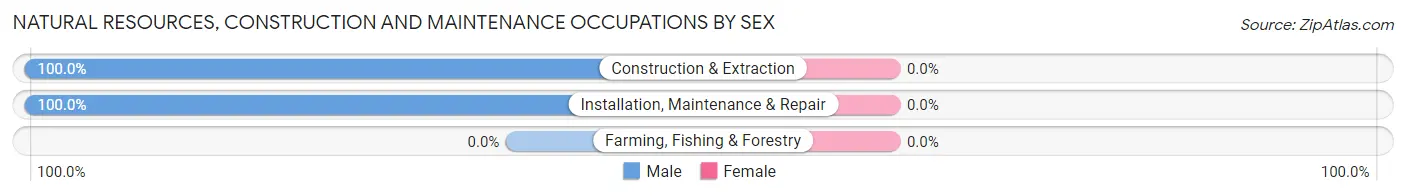
| Occupation | Male | Female |
| Farming, Fishing & Forestry | 0 (0.0%) | 0 (0.0%) |
| Construction & Extraction | 9 (100.0%) | 0 (0.0%) |
| Installation, Maintenance & Repair | 22 (100.0%) | 0 (0.0%) |
| Total (Category) | 31 (100.0%) | 0 (0.0%) |
| Total (Overall) | 1,420 (52.2%) | 1,302 (47.8%) |
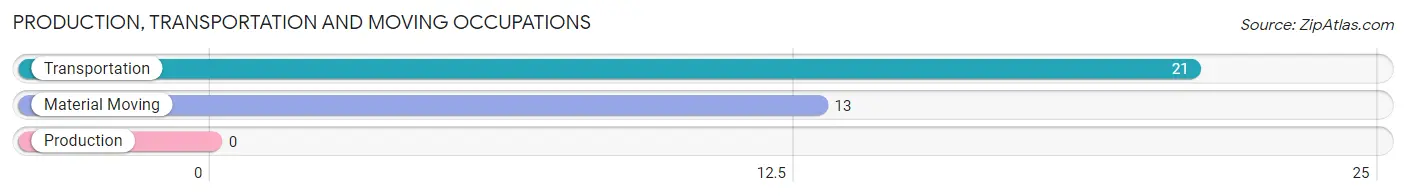
Production, Transportation and Moving Occupations
The most common Production, Transportation and Moving occupations in Narberth borough are Transportation (21 | 0.8%), and Material Moving (13 | 0.5%).
Production, Transportation and Moving Occupations by Sex
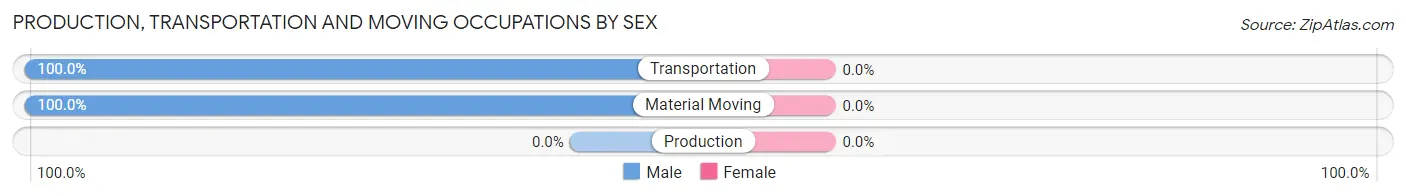
| Occupation | Male | Female |
| Production | 0 (0.0%) | 0 (0.0%) |
| Transportation | 21 (100.0%) | 0 (0.0%) |
| Material Moving | 13 (100.0%) | 0 (0.0%) |
| Total (Category) | 34 (100.0%) | 0 (0.0%) |
| Total (Overall) | 1,420 (52.2%) | 1,302 (47.8%) |
Employment Industries by Sex in Narberth borough
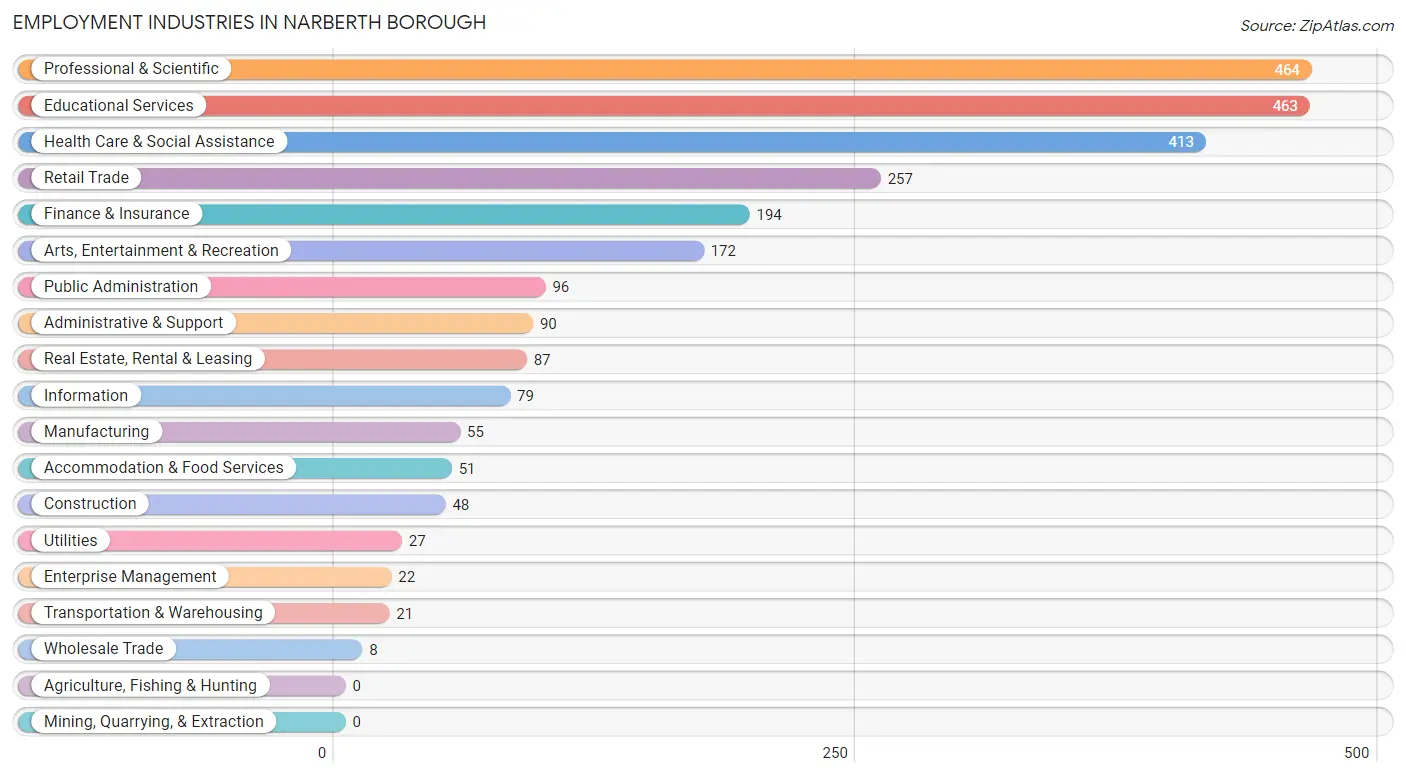
Employment Industries in Narberth borough
The major employment industries in Narberth borough include Professional & Scientific (464 | 17.1%), Educational Services (463 | 17.0%), Health Care & Social Assistance (413 | 15.2%), Retail Trade (257 | 9.4%), and Finance & Insurance (194 | 7.1%).
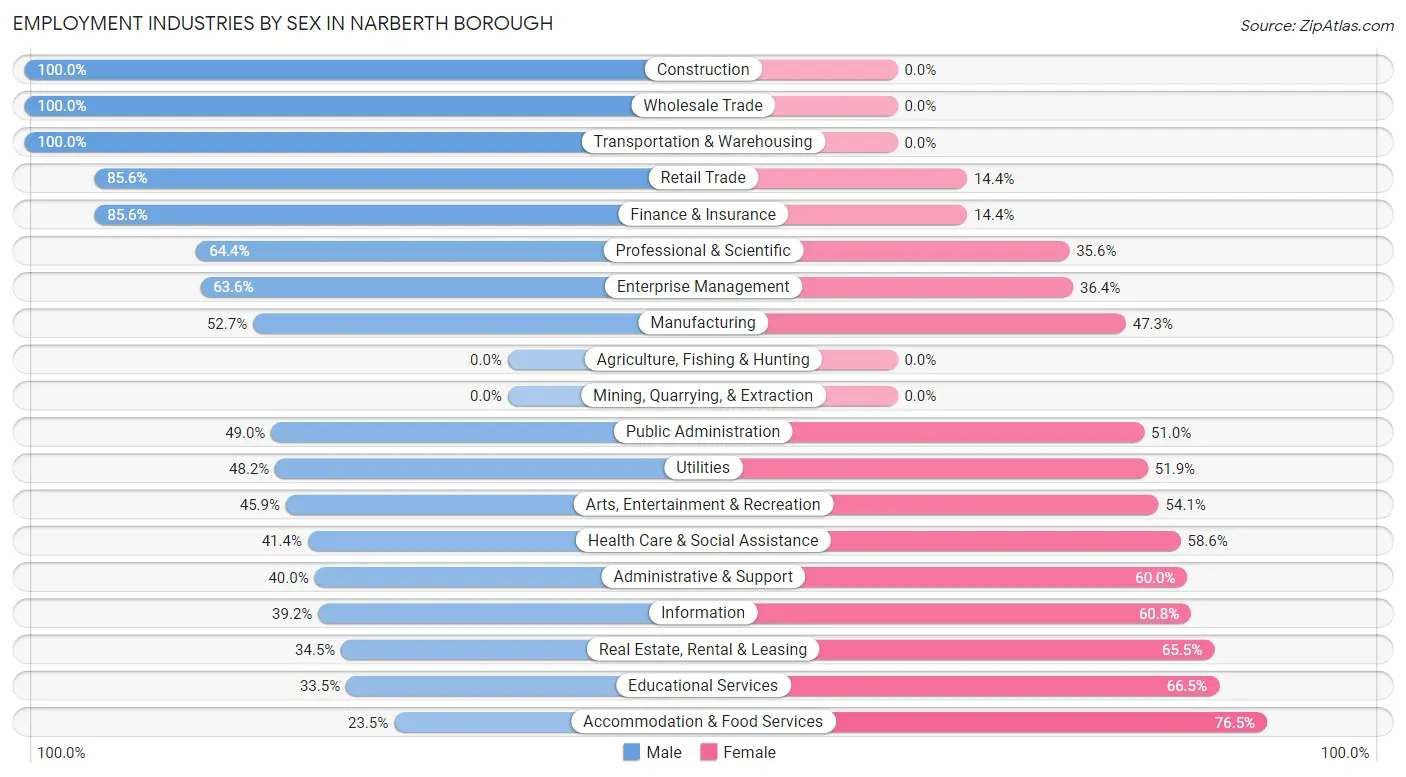
Employment Industries by Sex in Narberth borough
The Narberth borough industries that see more men than women are Construction (100.0%), Wholesale Trade (100.0%), and Transportation & Warehousing (100.0%), whereas the industries that tend to have a higher number of women are Accommodation & Food Services (76.5%), Educational Services (66.5%), and Real Estate, Rental & Leasing (65.5%).
| Industry | Male | Female |
| Agriculture, Fishing & Hunting | 0 (0.0%) | 0 (0.0%) |
| Mining, Quarrying, & Extraction | 0 (0.0%) | 0 (0.0%) |
| Construction | 48 (100.0%) | 0 (0.0%) |
| Manufacturing | 29 (52.7%) | 26 (47.3%) |
| Wholesale Trade | 8 (100.0%) | 0 (0.0%) |
| Retail Trade | 220 (85.6%) | 37 (14.4%) |
| Transportation & Warehousing | 21 (100.0%) | 0 (0.0%) |
| Utilities | 13 (48.1%) | 14 (51.8%) |
| Information | 31 (39.2%) | 48 (60.8%) |
| Finance & Insurance | 166 (85.6%) | 28 (14.4%) |
| Real Estate, Rental & Leasing | 30 (34.5%) | 57 (65.5%) |
| Professional & Scientific | 299 (64.4%) | 165 (35.6%) |
| Enterprise Management | 14 (63.6%) | 8 (36.4%) |
| Administrative & Support | 36 (40.0%) | 54 (60.0%) |
| Educational Services | 155 (33.5%) | 308 (66.5%) |
| Health Care & Social Assistance | 171 (41.4%) | 242 (58.6%) |
| Arts, Entertainment & Recreation | 79 (45.9%) | 93 (54.1%) |
| Accommodation & Food Services | 12 (23.5%) | 39 (76.5%) |
| Public Administration | 47 (49.0%) | 49 (51.0%) |
| Total | 1,420 (52.2%) | 1,302 (47.8%) |
Education in Narberth borough
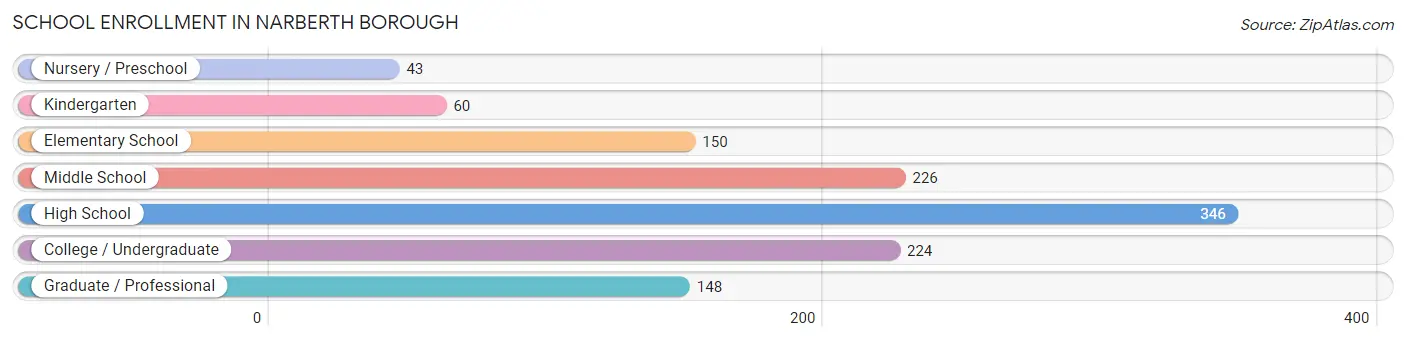
School Enrollment in Narberth borough
The most common levels of schooling among the 1,197 students in Narberth borough are high school (346 | 28.9%), middle school (226 | 18.9%), and college / undergraduate (224 | 18.7%).
| School Level | # Students | % Students |
| Nursery / Preschool | 43 | 3.6% |
| Kindergarten | 60 | 5.0% |
| Elementary School | 150 | 12.5% |
| Middle School | 226 | 18.9% |
| High School | 346 | 28.9% |
| College / Undergraduate | 224 | 18.7% |
| Graduate / Professional | 148 | 12.4% |
| Total | 1,197 | 100.0% |
School Enrollment by Age by Funding Source in Narberth borough
Out of a total of 1,197 students who are enrolled in schools in Narberth borough, 443 (37.0%) attend a private institution, while the remaining 754 (63.0%) are enrolled in public schools. The age group of 3 to 4 year olds has the highest likelihood of being enrolled in private schools, with 43 (100.0% in the age bracket) enrolled. Conversely, the age group of 15 to 17 year olds has the lowest likelihood of being enrolled in a private school, with 221 (94.9% in the age bracket) attending a public institution.

| Age Bracket | Public School | Private School |
| 3 to 4 Year Olds | 0 (0.0%) | 43 (100.0%) |
| 5 to 9 Year Old | 107 (62.6%) | 64 (37.4%) |
| 10 to 14 Year Olds | 249 (79.8%) | 63 (20.2%) |
| 15 to 17 Year Olds | 221 (94.9%) | 12 (5.1%) |
| 18 to 19 Year Olds | 66 (66.0%) | 34 (34.0%) |
| 20 to 24 Year Olds | 83 (46.6%) | 95 (53.4%) |
| 25 to 34 Year Olds | 7 (14.3%) | 42 (85.7%) |
| 35 Years and over | 21 (18.9%) | 90 (81.1%) |
| Total | 754 (63.0%) | 443 (37.0%) |
Educational Attainment by Field of Study in Narberth borough
Business (462 | 17.1%), psychology (279 | 10.3%), literature & languages (262 | 9.7%), social sciences (253 | 9.4%), and bio, nature & agricultural (247 | 9.1%) are the most common fields of study among 2,703 individuals in Narberth borough who have obtained a bachelor's degree or higher.
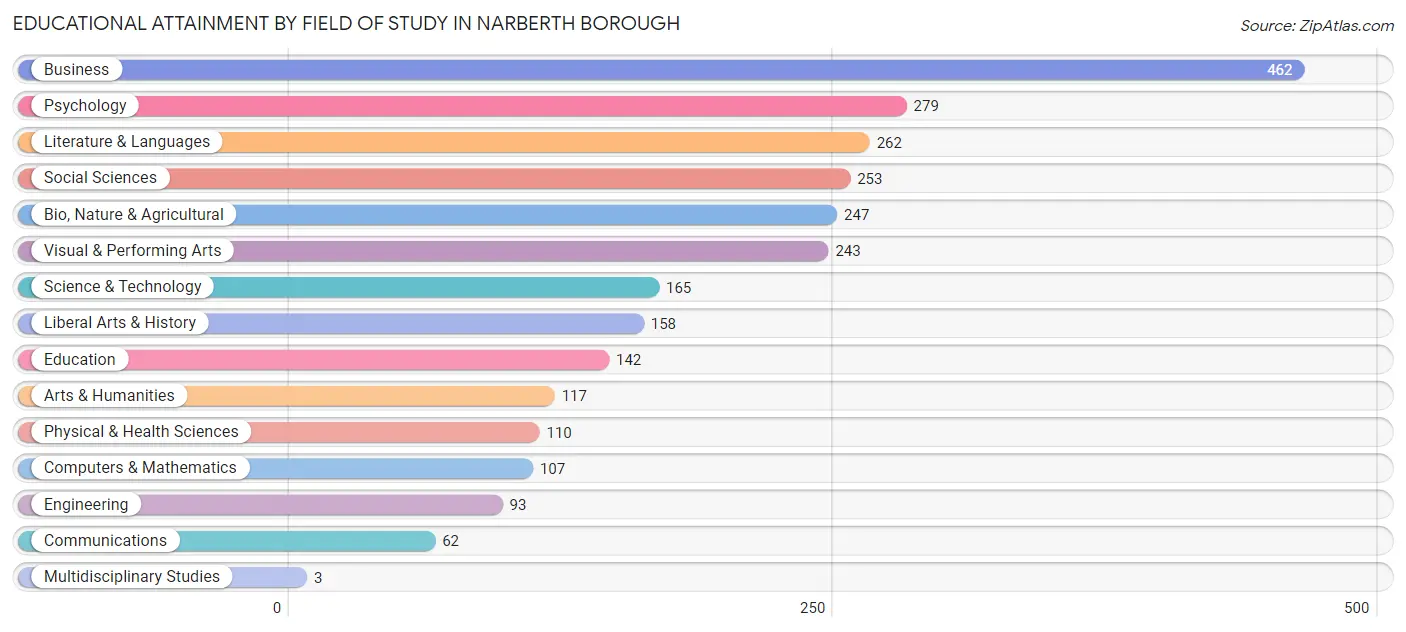
| Field of Study | # Graduates | % Graduates |
| Computers & Mathematics | 107 | 4.0% |
| Bio, Nature & Agricultural | 247 | 9.1% |
| Physical & Health Sciences | 110 | 4.1% |
| Psychology | 279 | 10.3% |
| Social Sciences | 253 | 9.4% |
| Engineering | 93 | 3.4% |
| Multidisciplinary Studies | 3 | 0.1% |
| Science & Technology | 165 | 6.1% |
| Business | 462 | 17.1% |
| Education | 142 | 5.2% |
| Literature & Languages | 262 | 9.7% |
| Liberal Arts & History | 158 | 5.9% |
| Visual & Performing Arts | 243 | 9.0% |
| Communications | 62 | 2.3% |
| Arts & Humanities | 117 | 4.3% |
| Total | 2,703 | 100.0% |
Transportation & Commute in Narberth borough
Vehicle Availability by Sex in Narberth borough
The most prevalent vehicle ownership categories in Narberth borough are males with 2 vehicles (843, accounting for 59.4%) and females with 2 vehicles (596, making up 66.0%).
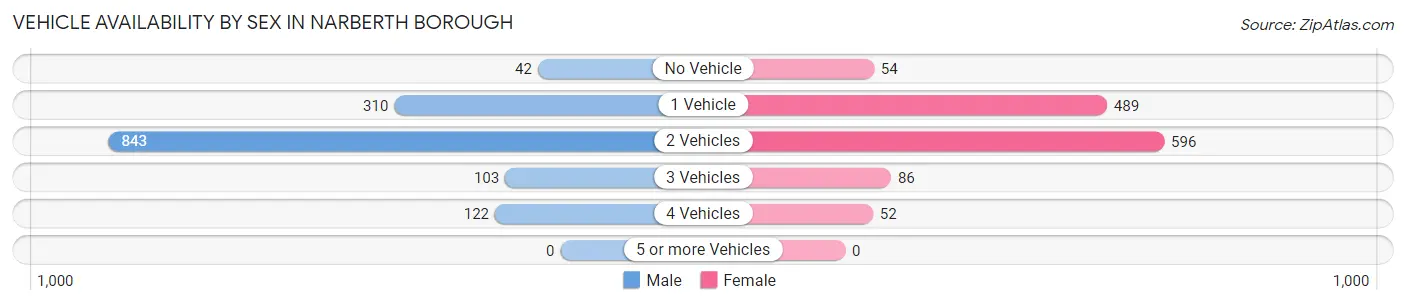
| Vehicles Available | Male | Female |
| No Vehicle | 42 (3.0%) | 54 (4.2%) |
| 1 Vehicle | 310 (21.8%) | 489 (38.3%) |
| 2 Vehicles | 843 (59.4%) | 596 (46.7%) |
| 3 Vehicles | 103 (7.2%) | 86 (6.7%) |
| 4 Vehicles | 122 (8.6%) | 52 (4.1%) |
| 5 or more Vehicles | 0 (0.0%) | 0 (0.0%) |
| Total | 1,420 (100.0%) | 1,277 (100.0%) |
Commute Time in Narberth borough
The most frequently occuring commute durations in Narberth borough are 30 to 34 minutes (483 commuters, 27.1%), 15 to 19 minutes (199 commuters, 11.2%), and 35 to 39 minutes (188 commuters, 10.5%).
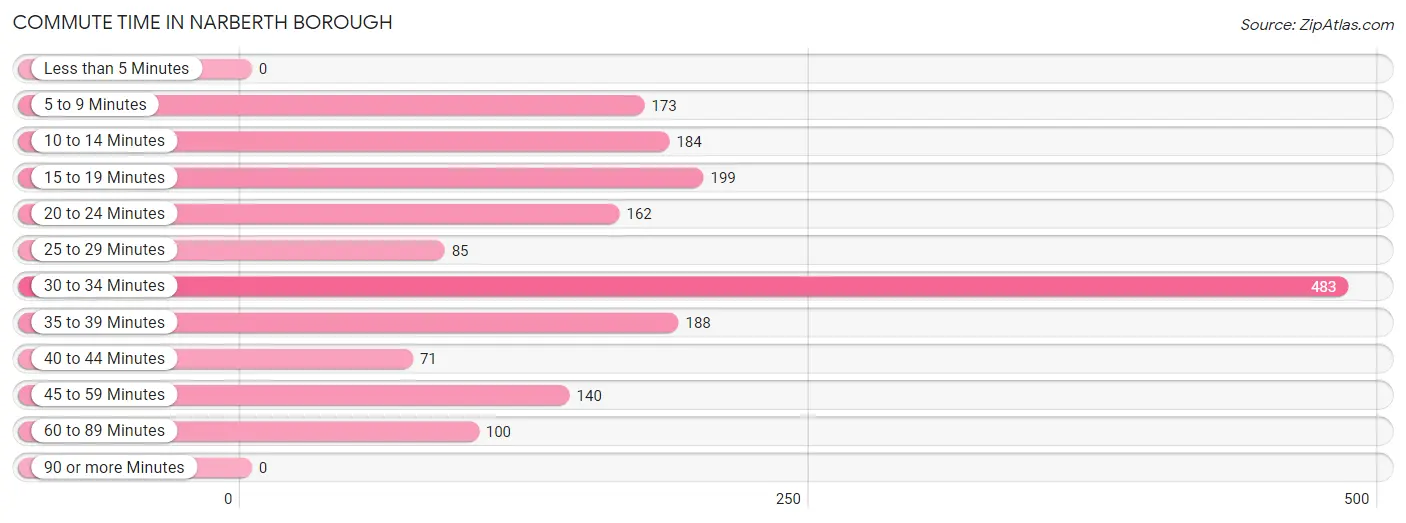
| Commute Time | # Commuters | % Commuters |
| Less than 5 Minutes | 0 | 0.0% |
| 5 to 9 Minutes | 173 | 9.7% |
| 10 to 14 Minutes | 184 | 10.3% |
| 15 to 19 Minutes | 199 | 11.2% |
| 20 to 24 Minutes | 162 | 9.1% |
| 25 to 29 Minutes | 85 | 4.8% |
| 30 to 34 Minutes | 483 | 27.1% |
| 35 to 39 Minutes | 188 | 10.5% |
| 40 to 44 Minutes | 71 | 4.0% |
| 45 to 59 Minutes | 140 | 7.8% |
| 60 to 89 Minutes | 100 | 5.6% |
| 90 or more Minutes | 0 | 0.0% |
Commute Time by Sex in Narberth borough
The most common commute times in Narberth borough are 30 to 34 minutes (338 commuters, 33.0%) for males and 30 to 34 minutes (145 commuters, 19.0%) for females.
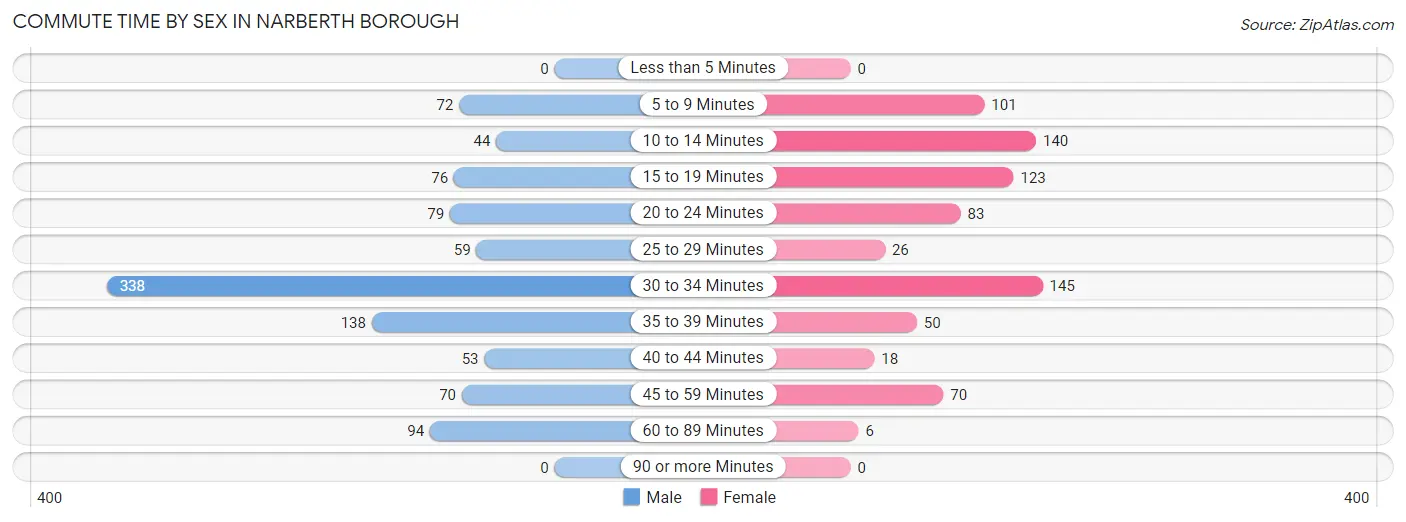
| Commute Time | Male | Female |
| Less than 5 Minutes | 0 (0.0%) | 0 (0.0%) |
| 5 to 9 Minutes | 72 (7.0%) | 101 (13.3%) |
| 10 to 14 Minutes | 44 (4.3%) | 140 (18.4%) |
| 15 to 19 Minutes | 76 (7.4%) | 123 (16.1%) |
| 20 to 24 Minutes | 79 (7.7%) | 83 (10.9%) |
| 25 to 29 Minutes | 59 (5.8%) | 26 (3.4%) |
| 30 to 34 Minutes | 338 (33.0%) | 145 (19.0%) |
| 35 to 39 Minutes | 138 (13.5%) | 50 (6.6%) |
| 40 to 44 Minutes | 53 (5.2%) | 18 (2.4%) |
| 45 to 59 Minutes | 70 (6.8%) | 70 (9.2%) |
| 60 to 89 Minutes | 94 (9.2%) | 6 (0.8%) |
| 90 or more Minutes | 0 (0.0%) | 0 (0.0%) |
Time of Departure to Work by Sex in Narberth borough
The most frequent times of departure to work in Narberth borough are 7:30 AM to 7:59 AM (238, 23.3%) for males and 8:00 AM to 8:29 AM (161, 21.1%) for females.
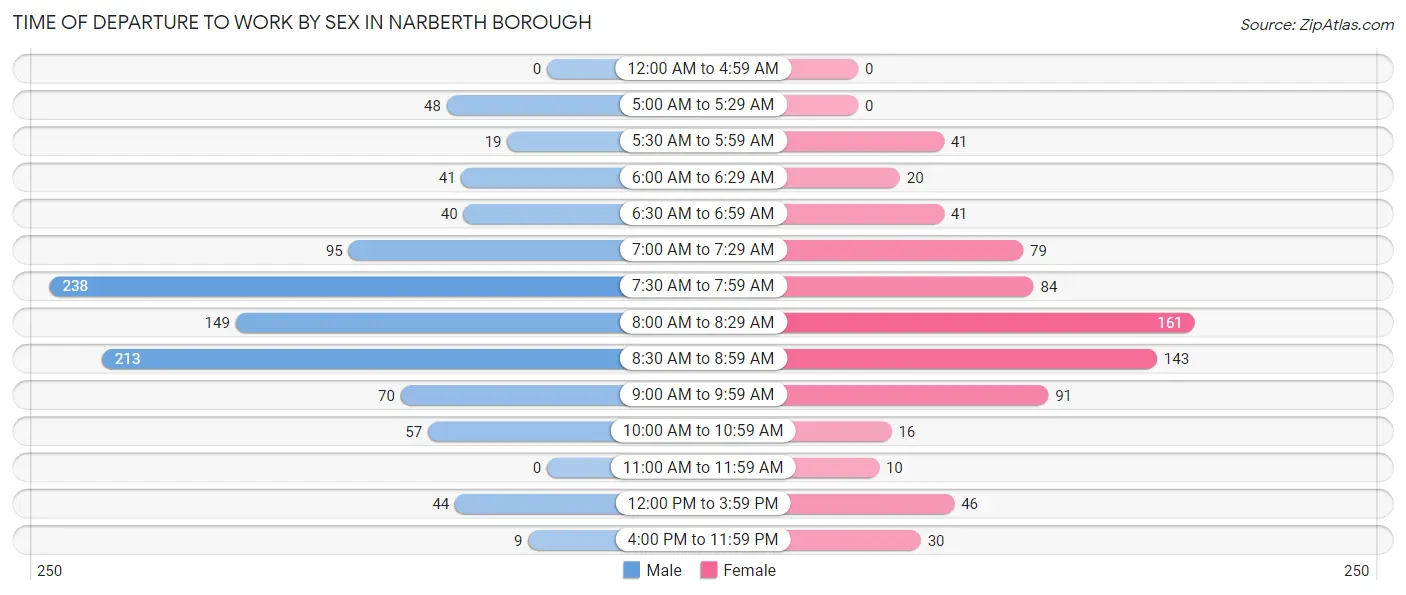
| Time of Departure | Male | Female |
| 12:00 AM to 4:59 AM | 0 (0.0%) | 0 (0.0%) |
| 5:00 AM to 5:29 AM | 48 (4.7%) | 0 (0.0%) |
| 5:30 AM to 5:59 AM | 19 (1.9%) | 41 (5.4%) |
| 6:00 AM to 6:29 AM | 41 (4.0%) | 20 (2.6%) |
| 6:30 AM to 6:59 AM | 40 (3.9%) | 41 (5.4%) |
| 7:00 AM to 7:29 AM | 95 (9.3%) | 79 (10.4%) |
| 7:30 AM to 7:59 AM | 238 (23.3%) | 84 (11.0%) |
| 8:00 AM to 8:29 AM | 149 (14.6%) | 161 (21.1%) |
| 8:30 AM to 8:59 AM | 213 (20.8%) | 143 (18.8%) |
| 9:00 AM to 9:59 AM | 70 (6.8%) | 91 (11.9%) |
| 10:00 AM to 10:59 AM | 57 (5.6%) | 16 (2.1%) |
| 11:00 AM to 11:59 AM | 0 (0.0%) | 10 (1.3%) |
| 12:00 PM to 3:59 PM | 44 (4.3%) | 46 (6.0%) |
| 4:00 PM to 11:59 PM | 9 (0.9%) | 30 (3.9%) |
| Total | 1,023 (100.0%) | 762 (100.0%) |
Housing Occupancy in Narberth borough
Occupancy by Ownership in Narberth borough
Of the total 1,952 dwellings in Narberth borough, owner-occupied units account for 1,092 (55.9%), while renter-occupied units make up 860 (44.1%).
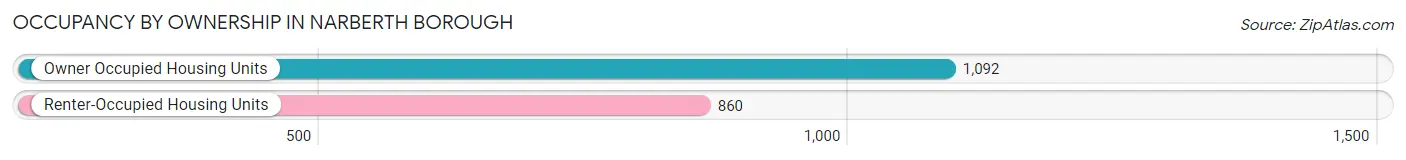
| Occupancy | # Housing Units | % Housing Units |
| Owner Occupied Housing Units | 1,092 | 55.9% |
| Renter-Occupied Housing Units | 860 | 44.1% |
| Total Occupied Housing Units | 1,952 | 100.0% |
Occupancy by Household Size in Narberth borough
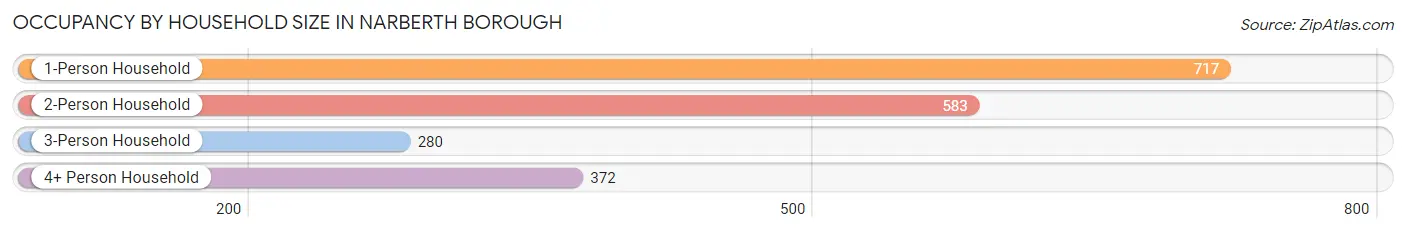
| Household Size | # Housing Units | % Housing Units |
| 1-Person Household | 717 | 36.7% |
| 2-Person Household | 583 | 29.9% |
| 3-Person Household | 280 | 14.3% |
| 4+ Person Household | 372 | 19.1% |
| Total Housing Units | 1,952 | 100.0% |
Occupancy by Ownership by Household Size in Narberth borough
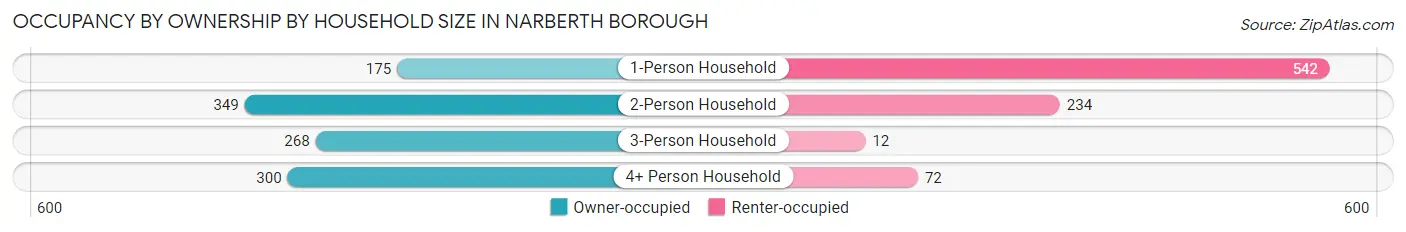
| Household Size | Owner-occupied | Renter-occupied |
| 1-Person Household | 175 (24.4%) | 542 (75.6%) |
| 2-Person Household | 349 (59.9%) | 234 (40.1%) |
| 3-Person Household | 268 (95.7%) | 12 (4.3%) |
| 4+ Person Household | 300 (80.6%) | 72 (19.4%) |
| Total Housing Units | 1,092 (55.9%) | 860 (44.1%) |
Occupancy by Educational Attainment in Narberth borough
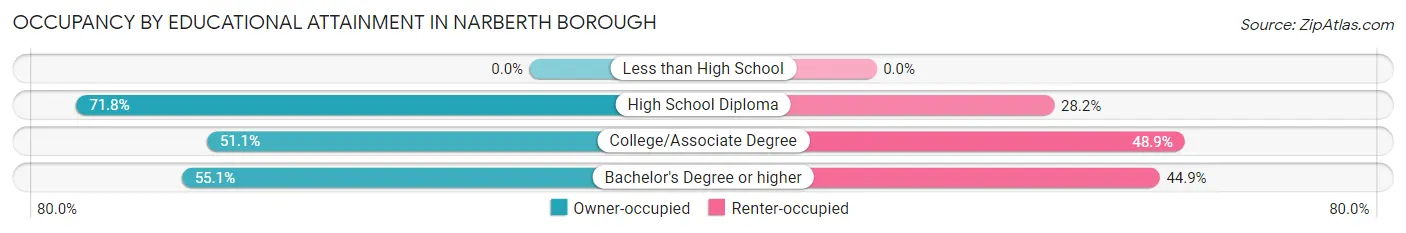
| Household Size | Owner-occupied | Renter-occupied |
| Less than High School | 0 (0.0%) | 0 (0.0%) |
| High School Diploma | 112 (71.8%) | 44 (28.2%) |
| College/Associate Degree | 117 (51.1%) | 112 (48.9%) |
| Bachelor's Degree or higher | 863 (55.1%) | 704 (44.9%) |
Occupancy by Age of Householder in Narberth borough
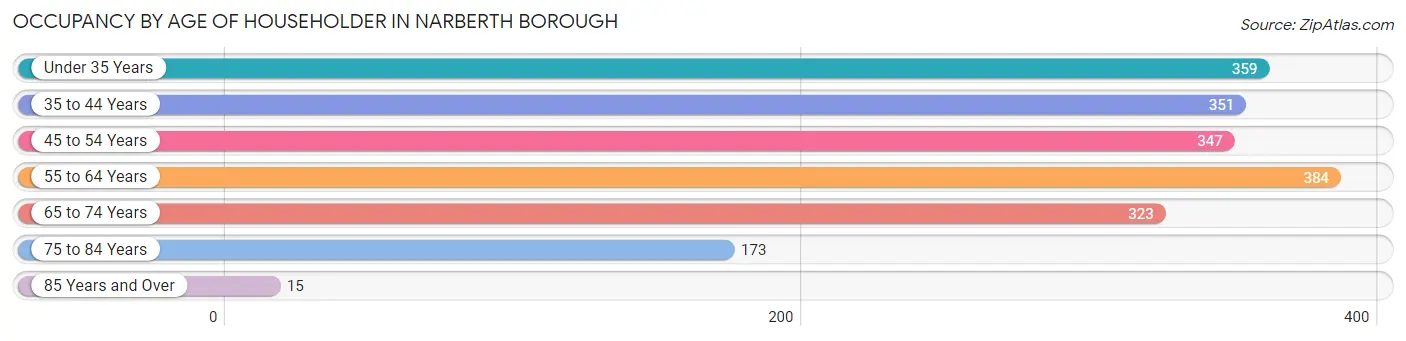
| Age Bracket | # Households | % Households |
| Under 35 Years | 359 | 18.4% |
| 35 to 44 Years | 351 | 18.0% |
| 45 to 54 Years | 347 | 17.8% |
| 55 to 64 Years | 384 | 19.7% |
| 65 to 74 Years | 323 | 16.6% |
| 75 to 84 Years | 173 | 8.9% |
| 85 Years and Over | 15 | 0.8% |
| Total | 1,952 | 100.0% |
Housing Finances in Narberth borough
Median Income by Occupancy in Narberth borough
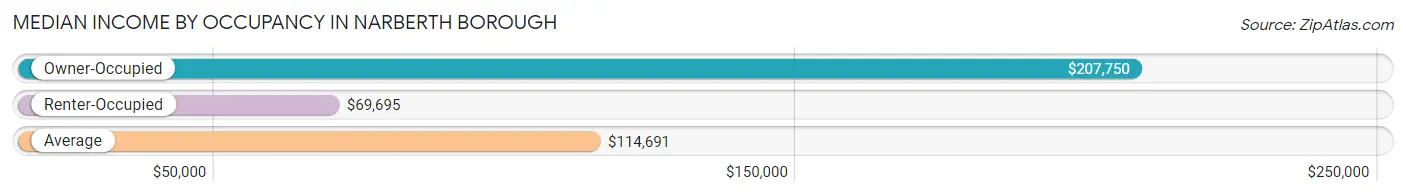
| Occupancy Type | # Households | Median Income |
| Owner-Occupied | 1,092 (55.9%) | $207,750 |
| Renter-Occupied | 860 (44.1%) | $69,695 |
| Average | 1,952 (100.0%) | $114,691 |
Occupancy by Householder Income Bracket in Narberth borough
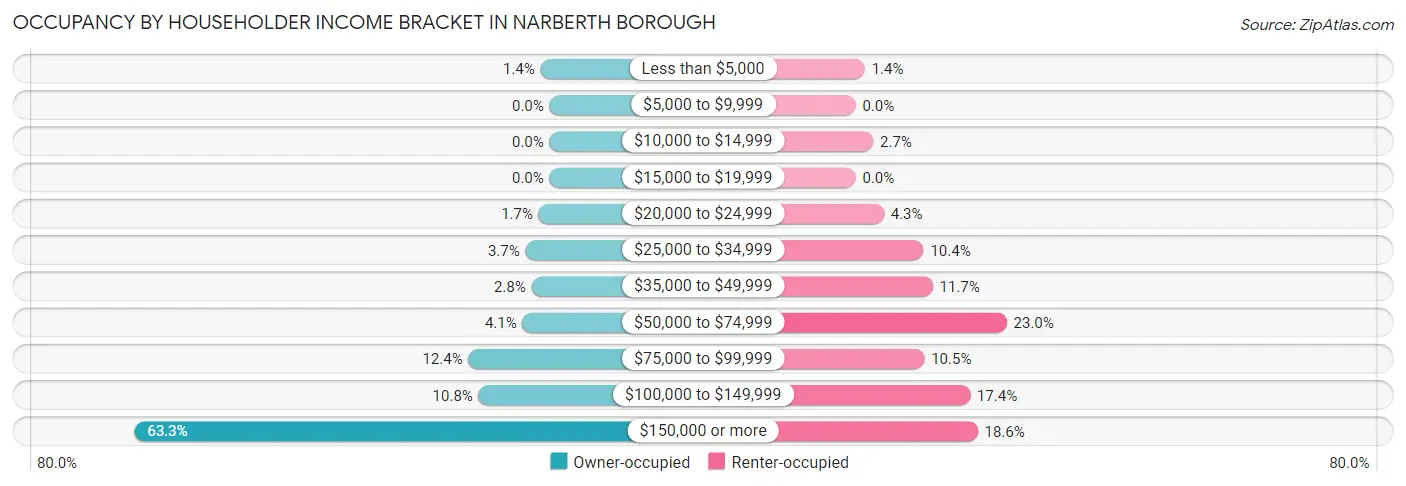
| Income Bracket | Owner-occupied | Renter-occupied |
| Less than $5,000 | 15 (1.4%) | 12 (1.4%) |
| $5,000 to $9,999 | 0 (0.0%) | 0 (0.0%) |
| $10,000 to $14,999 | 0 (0.0%) | 23 (2.7%) |
| $15,000 to $19,999 | 0 (0.0%) | 0 (0.0%) |
| $20,000 to $24,999 | 18 (1.7%) | 37 (4.3%) |
| $25,000 to $34,999 | 40 (3.7%) | 89 (10.3%) |
| $35,000 to $49,999 | 30 (2.8%) | 101 (11.7%) |
| $50,000 to $74,999 | 45 (4.1%) | 198 (23.0%) |
| $75,000 to $99,999 | 135 (12.4%) | 90 (10.5%) |
| $100,000 to $149,999 | 118 (10.8%) | 150 (17.4%) |
| $150,000 or more | 691 (63.3%) | 160 (18.6%) |
| Total | 1,092 (100.0%) | 860 (100.0%) |
Monthly Housing Cost Tiers in Narberth borough
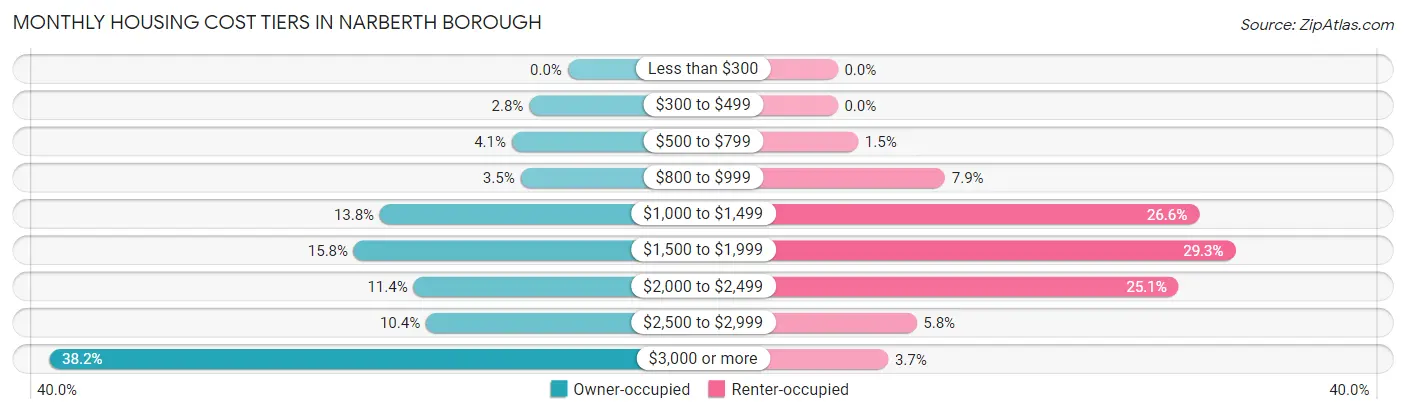
| Monthly Cost | Owner-occupied | Renter-occupied |
| Less than $300 | 0 (0.0%) | 0 (0.0%) |
| $300 to $499 | 31 (2.8%) | 0 (0.0%) |
| $500 to $799 | 45 (4.1%) | 13 (1.5%) |
| $800 to $999 | 38 (3.5%) | 68 (7.9%) |
| $1,000 to $1,499 | 151 (13.8%) | 229 (26.6%) |
| $1,500 to $1,999 | 172 (15.8%) | 252 (29.3%) |
| $2,000 to $2,499 | 124 (11.4%) | 216 (25.1%) |
| $2,500 to $2,999 | 114 (10.4%) | 50 (5.8%) |
| $3,000 or more | 417 (38.2%) | 32 (3.7%) |
| Total | 1,092 (100.0%) | 860 (100.0%) |
Physical Housing Characteristics in Narberth borough
Housing Structures in Narberth borough
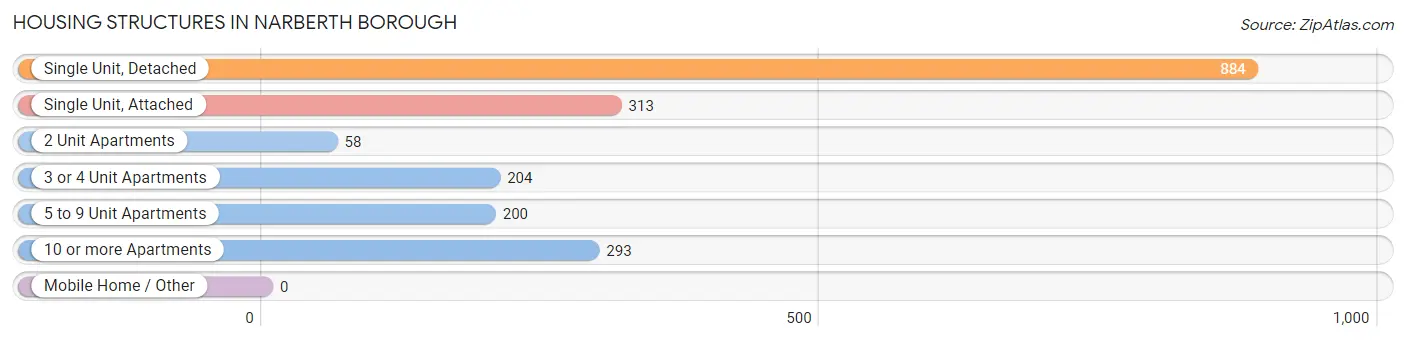
| Structure Type | # Housing Units | % Housing Units |
| Single Unit, Detached | 884 | 45.3% |
| Single Unit, Attached | 313 | 16.0% |
| 2 Unit Apartments | 58 | 3.0% |
| 3 or 4 Unit Apartments | 204 | 10.4% |
| 5 to 9 Unit Apartments | 200 | 10.2% |
| 10 or more Apartments | 293 | 15.0% |
| Mobile Home / Other | 0 | 0.0% |
| Total | 1,952 | 100.0% |
Housing Structures by Occupancy in Narberth borough
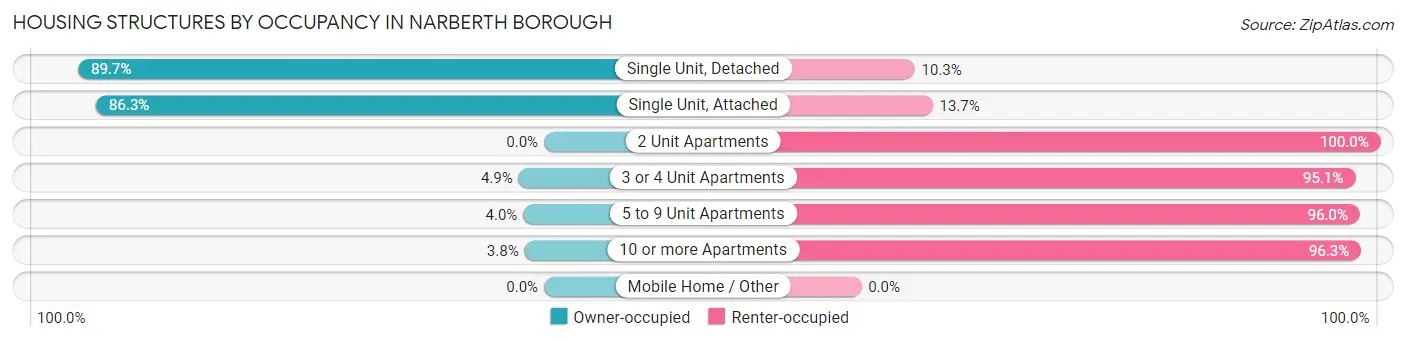
| Structure Type | Owner-occupied | Renter-occupied |
| Single Unit, Detached | 793 (89.7%) | 91 (10.3%) |
| Single Unit, Attached | 270 (86.3%) | 43 (13.7%) |
| 2 Unit Apartments | 0 (0.0%) | 58 (100.0%) |
| 3 or 4 Unit Apartments | 10 (4.9%) | 194 (95.1%) |
| 5 to 9 Unit Apartments | 8 (4.0%) | 192 (96.0%) |
| 10 or more Apartments | 11 (3.7%) | 282 (96.3%) |
| Mobile Home / Other | 0 (0.0%) | 0 (0.0%) |
| Total | 1,092 (55.9%) | 860 (44.1%) |
Housing Structures by Number of Rooms in Narberth borough
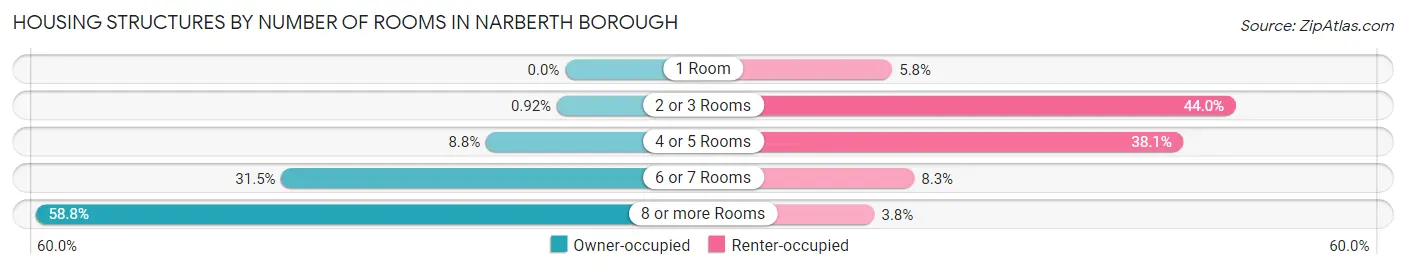
| Number of Rooms | Owner-occupied | Renter-occupied |
| 1 Room | 0 (0.0%) | 50 (5.8%) |
| 2 or 3 Rooms | 10 (0.9%) | 378 (44.0%) |
| 4 or 5 Rooms | 96 (8.8%) | 328 (38.1%) |
| 6 or 7 Rooms | 344 (31.5%) | 71 (8.3%) |
| 8 or more Rooms | 642 (58.8%) | 33 (3.8%) |
| Total | 1,092 (100.0%) | 860 (100.0%) |
Housing Structure by Heating Type in Narberth borough
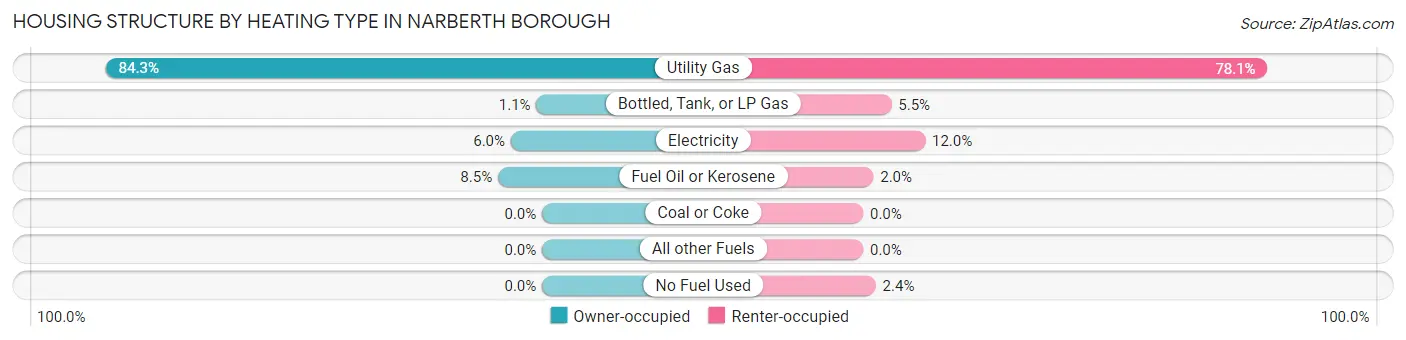
| Heating Type | Owner-occupied | Renter-occupied |
| Utility Gas | 921 (84.3%) | 672 (78.1%) |
| Bottled, Tank, or LP Gas | 12 (1.1%) | 47 (5.5%) |
| Electricity | 66 (6.0%) | 103 (12.0%) |
| Fuel Oil or Kerosene | 93 (8.5%) | 17 (2.0%) |
| Coal or Coke | 0 (0.0%) | 0 (0.0%) |
| All other Fuels | 0 (0.0%) | 0 (0.0%) |
| No Fuel Used | 0 (0.0%) | 21 (2.4%) |
| Total | 1,092 (100.0%) | 860 (100.0%) |
Household Vehicle Usage in Narberth borough
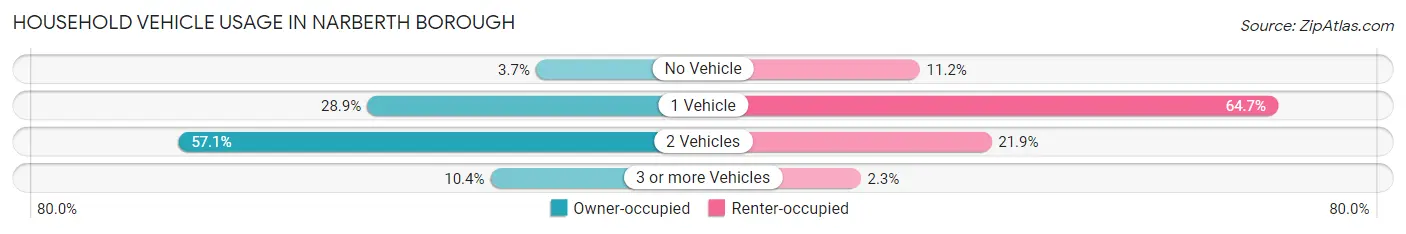
| Vehicles per Household | Owner-occupied | Renter-occupied |
| No Vehicle | 40 (3.7%) | 96 (11.2%) |
| 1 Vehicle | 315 (28.8%) | 556 (64.6%) |
| 2 Vehicles | 623 (57.1%) | 188 (21.9%) |
| 3 or more Vehicles | 114 (10.4%) | 20 (2.3%) |
| Total | 1,092 (100.0%) | 860 (100.0%) |
Real Estate & Mortgages in Narberth borough
Real Estate and Mortgage Overview in Narberth borough
| Characteristic | Without Mortgage | With Mortgage |
| Housing Units | 386 | 706 |
| Median Property Value | $593,100 | $624,300 |
| Median Household Income | $141,250 | $512 |
| Monthly Housing Costs | $1,082 | $417 |
| Real Estate Taxes | $7,783 | $0 |
Property Value by Mortgage Status in Narberth borough
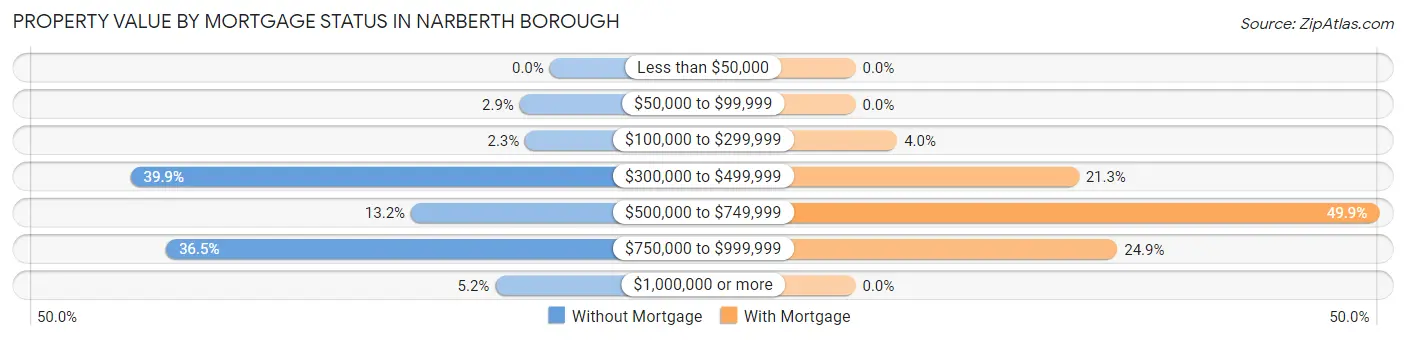
| Property Value | Without Mortgage | With Mortgage |
| Less than $50,000 | 0 (0.0%) | 0 (0.0%) |
| $50,000 to $99,999 | 11 (2.9%) | 0 (0.0%) |
| $100,000 to $299,999 | 9 (2.3%) | 28 (4.0%) |
| $300,000 to $499,999 | 154 (39.9%) | 150 (21.2%) |
| $500,000 to $749,999 | 51 (13.2%) | 352 (49.9%) |
| $750,000 to $999,999 | 141 (36.5%) | 176 (24.9%) |
| $1,000,000 or more | 20 (5.2%) | 0 (0.0%) |
| Total | 386 (100.0%) | 706 (100.0%) |
Household Income by Mortgage Status in Narberth borough
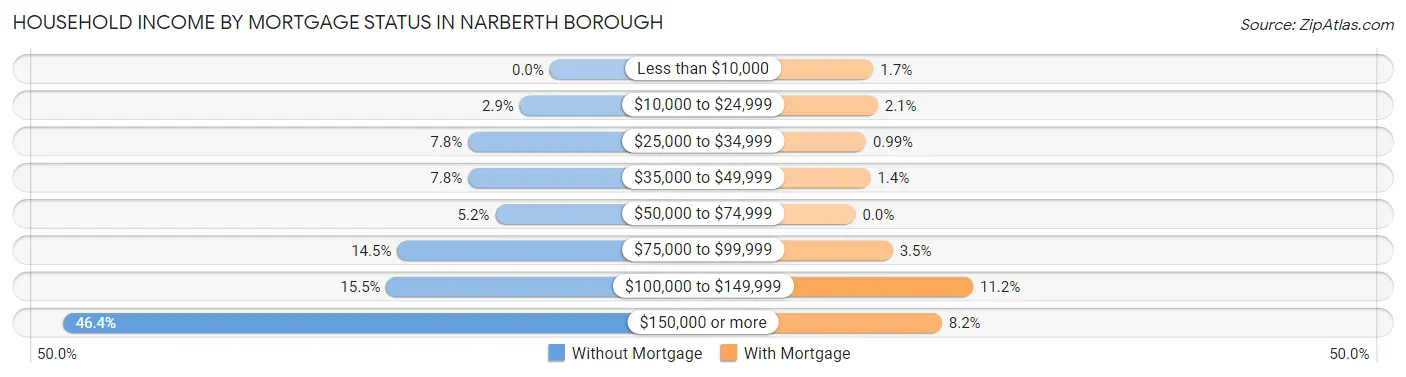
| Household Income | Without Mortgage | With Mortgage |
| Less than $10,000 | 0 (0.0%) | 12 (1.7%) |
| $10,000 to $24,999 | 11 (2.9%) | 15 (2.1%) |
| $25,000 to $34,999 | 30 (7.8%) | 7 (1.0%) |
| $35,000 to $49,999 | 30 (7.8%) | 10 (1.4%) |
| $50,000 to $74,999 | 20 (5.2%) | 0 (0.0%) |
| $75,000 to $99,999 | 56 (14.5%) | 25 (3.5%) |
| $100,000 to $149,999 | 60 (15.5%) | 79 (11.2%) |
| $150,000 or more | 179 (46.4%) | 58 (8.2%) |
| Total | 386 (100.0%) | 706 (100.0%) |
Property Value to Household Income Ratio in Narberth borough
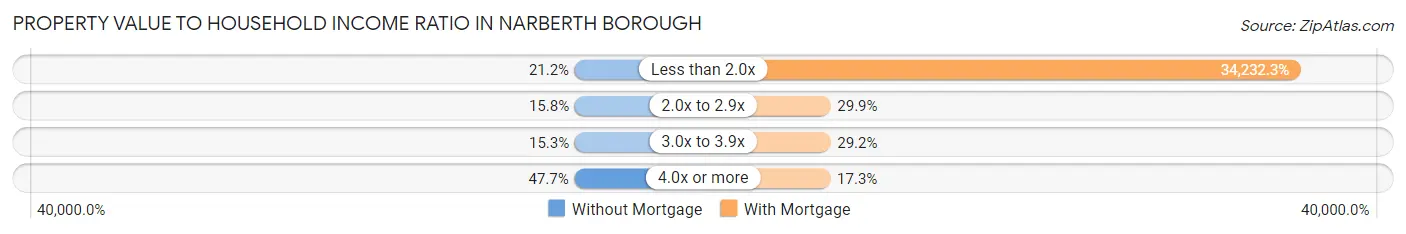
| Value-to-Income Ratio | Without Mortgage | With Mortgage |
| Less than 2.0x | 82 (21.2%) | 241,680 (34,232.3%) |
| 2.0x to 2.9x | 61 (15.8%) | 211 (29.9%) |
| 3.0x to 3.9x | 59 (15.3%) | 206 (29.2%) |
| 4.0x or more | 184 (47.7%) | 122 (17.3%) |
| Total | 386 (100.0%) | 706 (100.0%) |
Real Estate Taxes by Mortgage Status in Narberth borough
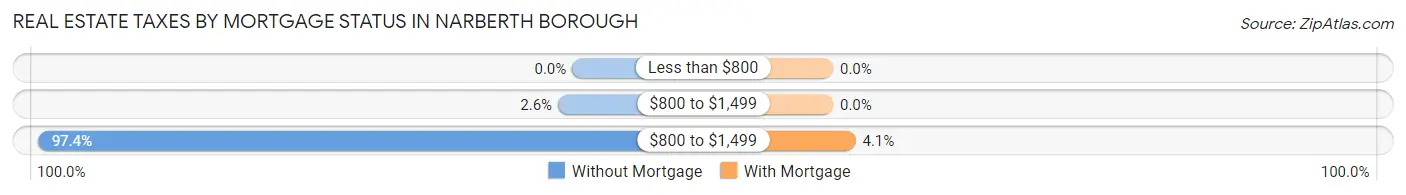
| Property Taxes | Without Mortgage | With Mortgage |
| Less than $800 | 0 (0.0%) | 0 (0.0%) |
| $800 to $1,499 | 10 (2.6%) | 0 (0.0%) |
| $800 to $1,499 | 376 (97.4%) | 29 (4.1%) |
| Total | 386 (100.0%) | 706 (100.0%) |
Health & Disability in Narberth borough
Health Insurance Coverage by Age in Narberth borough
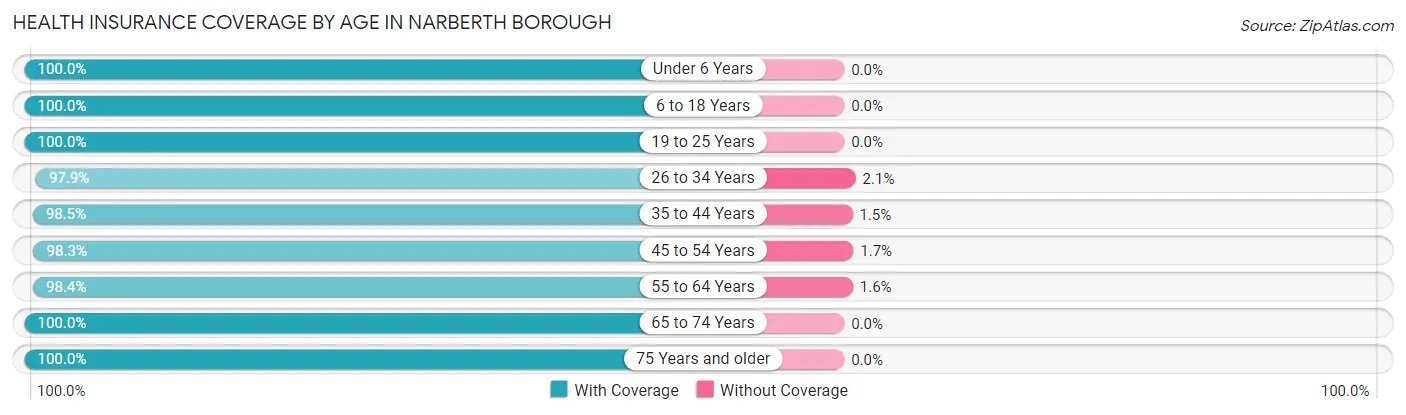
| Age Bracket | With Coverage | Without Coverage |
| Under 6 Years | 211 (100.0%) | 0 (0.0%) |
| 6 to 18 Years | 790 (100.0%) | 0 (0.0%) |
| 19 to 25 Years | 343 (100.0%) | 0 (0.0%) |
| 26 to 34 Years | 416 (97.9%) | 9 (2.1%) |
| 35 to 44 Years | 580 (98.5%) | 9 (1.5%) |
| 45 to 54 Years | 815 (98.3%) | 14 (1.7%) |
| 55 to 64 Years | 556 (98.4%) | 9 (1.6%) |
| 65 to 74 Years | 512 (100.0%) | 0 (0.0%) |
| 75 Years and older | 214 (100.0%) | 0 (0.0%) |
| Total | 4,437 (99.1%) | 41 (0.9%) |
Health Insurance Coverage by Citizenship Status in Narberth borough
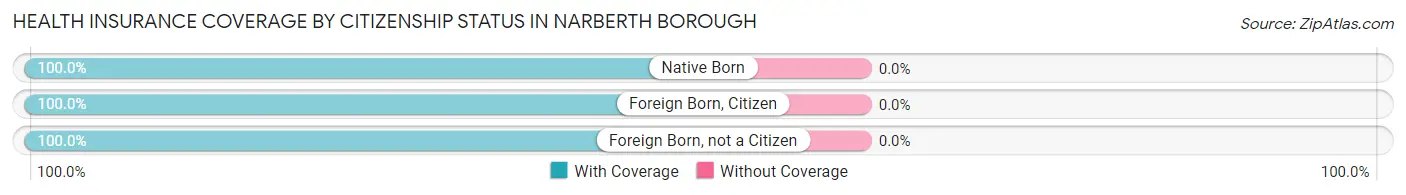
| Citizenship Status | With Coverage | Without Coverage |
| Native Born | 211 (100.0%) | 0 (0.0%) |
| Foreign Born, Citizen | 790 (100.0%) | 0 (0.0%) |
| Foreign Born, not a Citizen | 343 (100.0%) | 0 (0.0%) |
Health Insurance Coverage by Household Income in Narberth borough
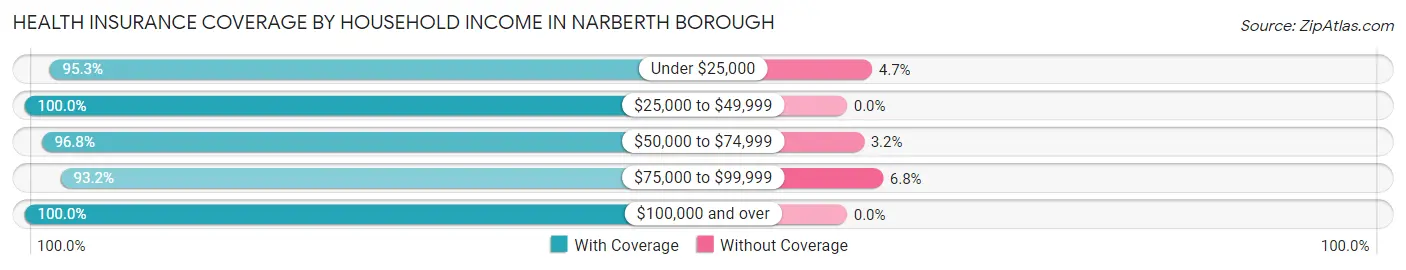
| Household Income | With Coverage | Without Coverage |
| Under $25,000 | 142 (95.3%) | 7 (4.7%) |
| $25,000 to $49,999 | 437 (100.0%) | 0 (0.0%) |
| $50,000 to $74,999 | 275 (96.8%) | 9 (3.2%) |
| $75,000 to $99,999 | 345 (93.2%) | 25 (6.8%) |
| $100,000 and over | 3,238 (100.0%) | 0 (0.0%) |
Public vs Private Health Insurance Coverage by Age in Narberth borough
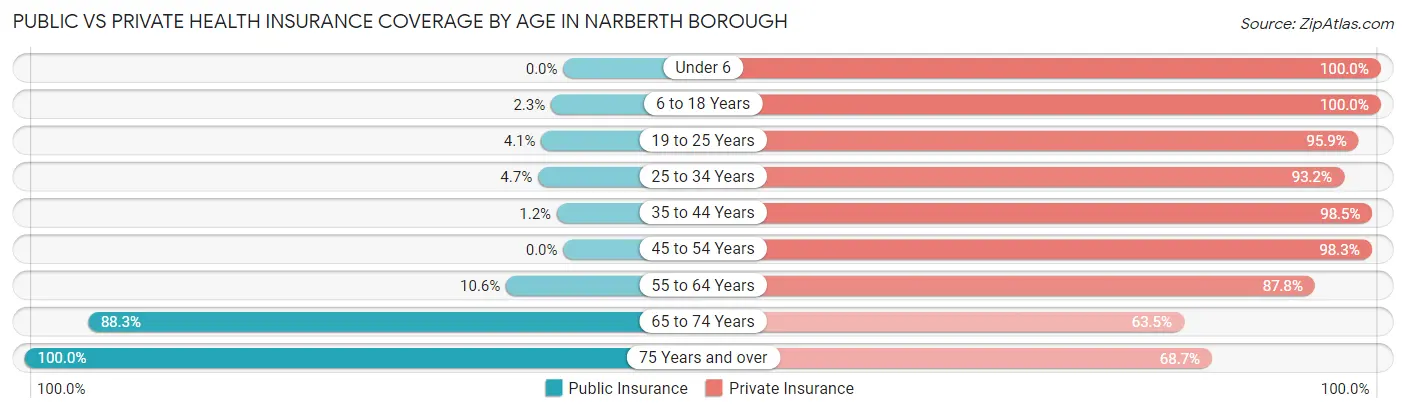
| Age Bracket | Public Insurance | Private Insurance |
| Under 6 | 0 (0.0%) | 211 (100.0%) |
| 6 to 18 Years | 18 (2.3%) | 790 (100.0%) |
| 19 to 25 Years | 14 (4.1%) | 329 (95.9%) |
| 25 to 34 Years | 20 (4.7%) | 396 (93.2%) |
| 35 to 44 Years | 7 (1.2%) | 580 (98.5%) |
| 45 to 54 Years | 0 (0.0%) | 815 (98.3%) |
| 55 to 64 Years | 60 (10.6%) | 496 (87.8%) |
| 65 to 74 Years | 452 (88.3%) | 325 (63.5%) |
| 75 Years and over | 214 (100.0%) | 147 (68.7%) |
| Total | 785 (17.5%) | 4,089 (91.3%) |
Disability Status by Sex by Age in Narberth borough
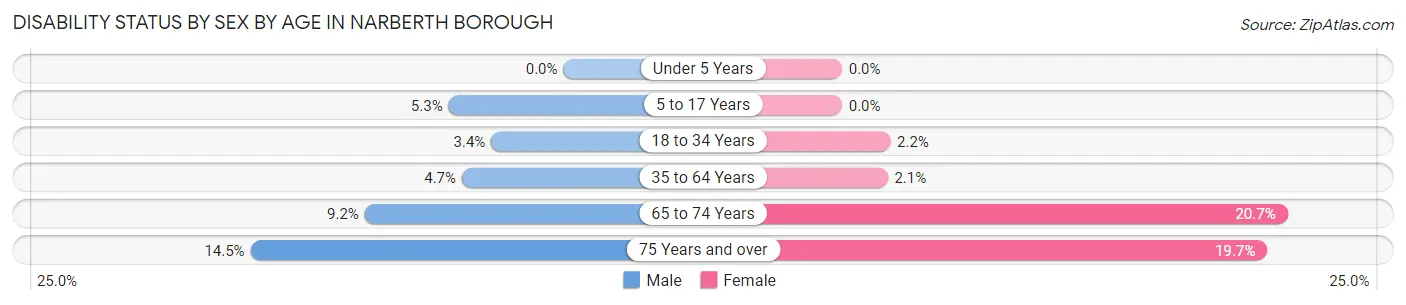
| Age Bracket | Male | Female |
| Under 5 Years | 0 (0.0%) | 0 (0.0%) |
| 5 to 17 Years | 18 (5.3%) | 0 (0.0%) |
| 18 to 34 Years | 13 (3.4%) | 10 (2.2%) |
| 35 to 64 Years | 49 (4.7%) | 20 (2.1%) |
| 65 to 74 Years | 20 (9.2%) | 61 (20.7%) |
| 75 Years and over | 9 (14.5%) | 30 (19.7%) |
Disability Class by Sex by Age in Narberth borough
Disability Class: Hearing Difficulty
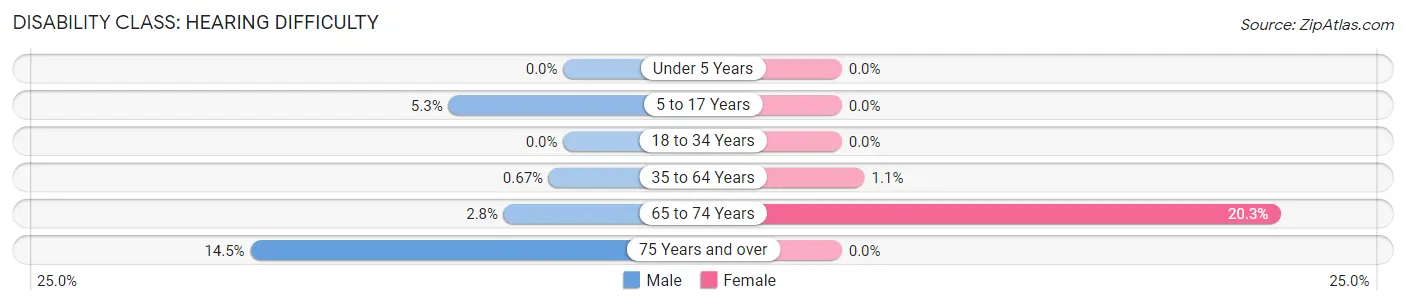
| Age Bracket | Male | Female |
| Under 5 Years | 0 (0.0%) | 0 (0.0%) |
| 5 to 17 Years | 18 (5.3%) | 0 (0.0%) |
| 18 to 34 Years | 0 (0.0%) | 0 (0.0%) |
| 35 to 64 Years | 7 (0.7%) | 10 (1.1%) |
| 65 to 74 Years | 6 (2.8%) | 60 (20.3%) |
| 75 Years and over | 9 (14.5%) | 0 (0.0%) |
Disability Class: Vision Difficulty
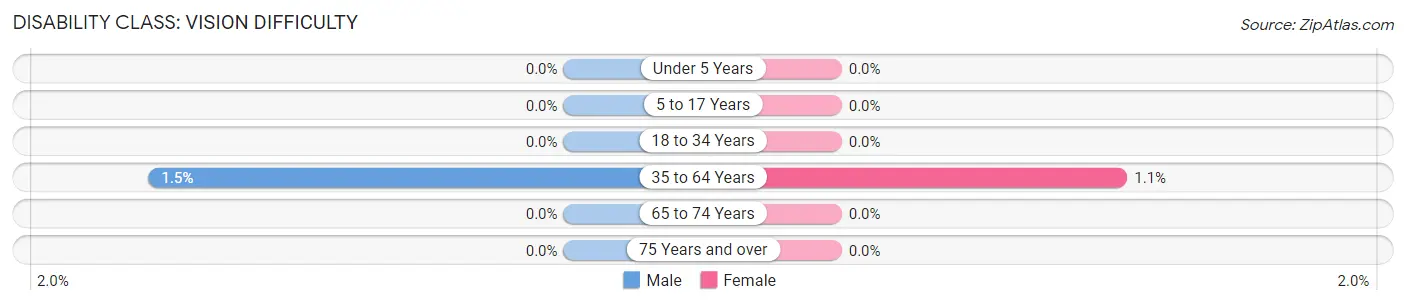
| Age Bracket | Male | Female |
| Under 5 Years | 0 (0.0%) | 0 (0.0%) |
| 5 to 17 Years | 0 (0.0%) | 0 (0.0%) |
| 18 to 34 Years | 0 (0.0%) | 0 (0.0%) |
| 35 to 64 Years | 16 (1.5%) | 10 (1.1%) |
| 65 to 74 Years | 0 (0.0%) | 0 (0.0%) |
| 75 Years and over | 0 (0.0%) | 0 (0.0%) |
Disability Class: Cognitive Difficulty
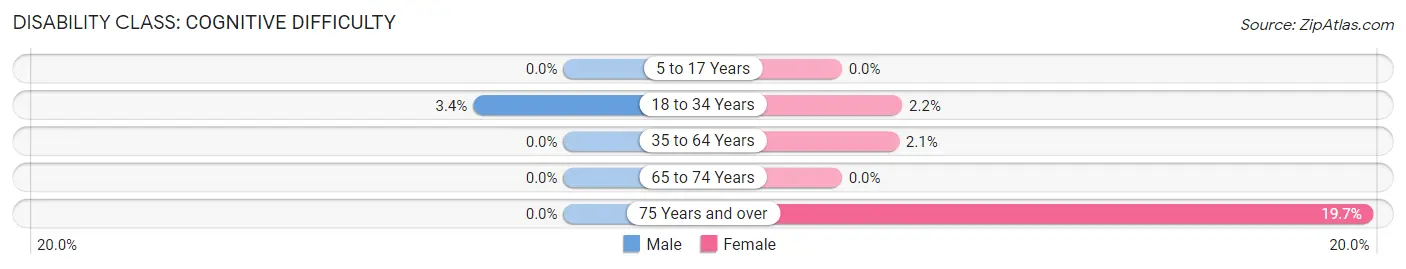
| Age Bracket | Male | Female |
| 5 to 17 Years | 0 (0.0%) | 0 (0.0%) |
| 18 to 34 Years | 13 (3.4%) | 10 (2.2%) |
| 35 to 64 Years | 0 (0.0%) | 20 (2.1%) |
| 65 to 74 Years | 0 (0.0%) | 0 (0.0%) |
| 75 Years and over | 0 (0.0%) | 30 (19.7%) |
Disability Class: Ambulatory Difficulty
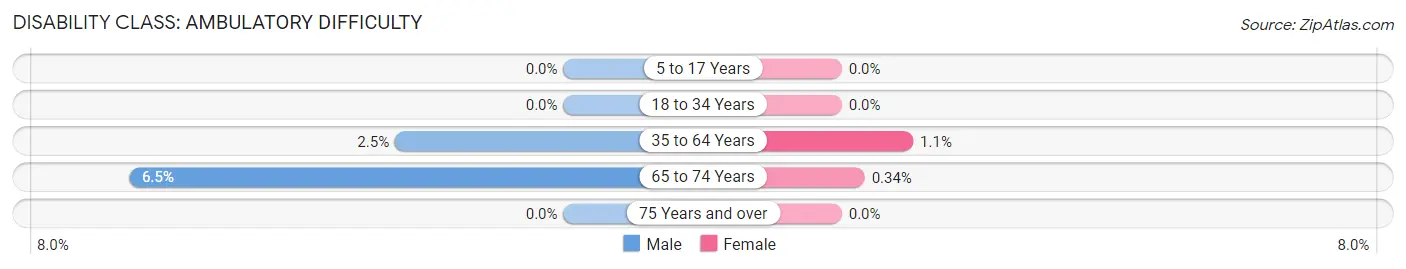
| Age Bracket | Male | Female |
| 5 to 17 Years | 0 (0.0%) | 0 (0.0%) |
| 18 to 34 Years | 0 (0.0%) | 0 (0.0%) |
| 35 to 64 Years | 26 (2.5%) | 10 (1.1%) |
| 65 to 74 Years | 14 (6.5%) | 1 (0.3%) |
| 75 Years and over | 0 (0.0%) | 0 (0.0%) |
Disability Class: Self-Care Difficulty
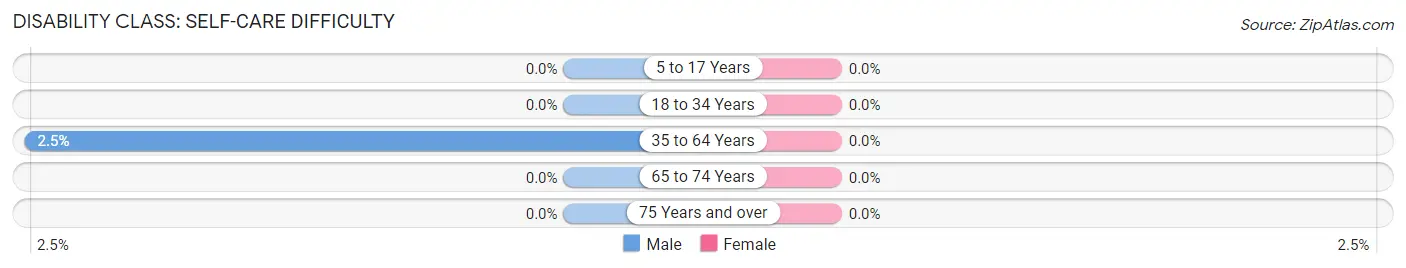
| Age Bracket | Male | Female |
| 5 to 17 Years | 0 (0.0%) | 0 (0.0%) |
| 18 to 34 Years | 0 (0.0%) | 0 (0.0%) |
| 35 to 64 Years | 26 (2.5%) | 0 (0.0%) |
| 65 to 74 Years | 0 (0.0%) | 0 (0.0%) |
| 75 Years and over | 0 (0.0%) | 0 (0.0%) |
Technology Access in Narberth borough
Computing Device Access in Narberth borough
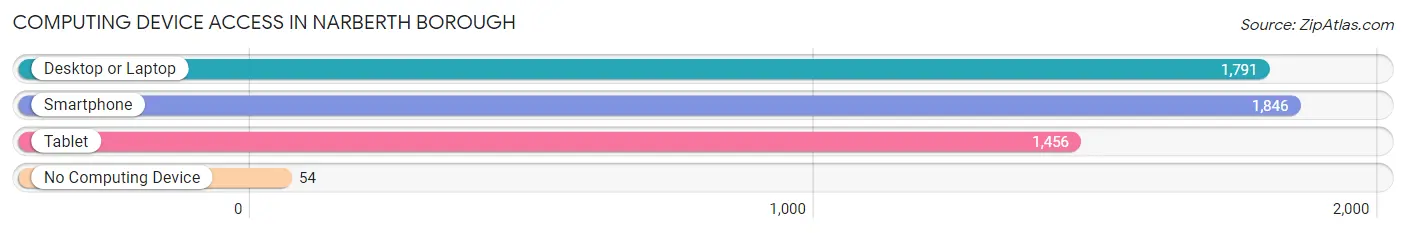
| Device Type | # Households | % Households |
| Desktop or Laptop | 1,791 | 91.7% |
| Smartphone | 1,846 | 94.6% |
| Tablet | 1,456 | 74.6% |
| No Computing Device | 54 | 2.8% |
| Total | 1,952 | 100.0% |
Internet Access in Narberth borough
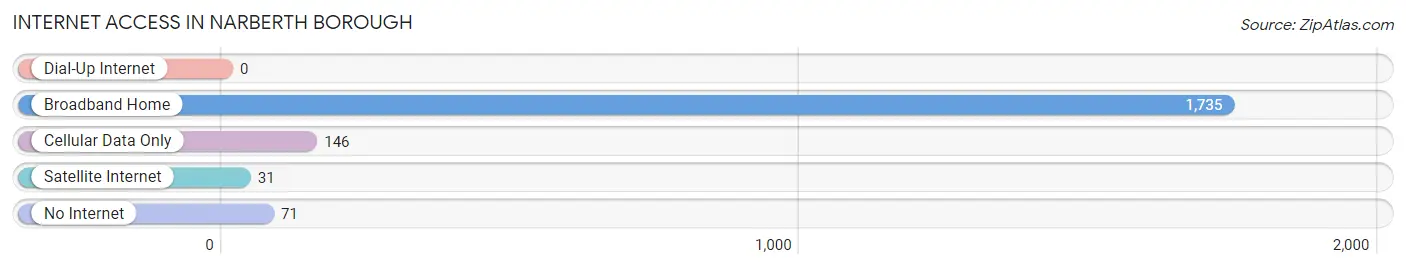
| Internet Type | # Households | % Households |
| Dial-Up Internet | 0 | 0.0% |
| Broadband Home | 1,735 | 88.9% |
| Cellular Data Only | 146 | 7.5% |
| Satellite Internet | 31 | 1.6% |
| No Internet | 71 | 3.6% |
| Total | 1,952 | 100.0% |
Narberth borough Summary
History
The history of Narberth Borough, Pennsylvania dates back to the late 19th century. The area was originally part of Lower Merion Township, but was incorporated as a borough in 1895. The name Narberth comes from the Welsh language and means “the summit of the hill”.
The first settlers in the area were Welsh Quakers who arrived in the late 1600s. They established a small village called Merion Square, which was later renamed Narberth. The village grew slowly over the years, and by the late 1800s it had become a popular summer resort destination for wealthy Philadelphians.
In 1895, the residents of Narberth petitioned the Pennsylvania legislature to incorporate the area as a borough. The petition was granted, and Narberth officially became a borough on April 3, 1895.
Geography
Narberth Borough is located in Montgomery County, Pennsylvania, approximately 10 miles northwest of Philadelphia. The borough is bordered by Lower Merion Township to the north, Haverford Township to the east, and Upper Merion Township to the south and west.
The borough covers an area of 0.8 square miles and is home to approximately 4,000 residents. The terrain is mostly flat, with some hills in the northern part of the borough. The borough is located in the Schuylkill River watershed and is home to several creeks, including Mill Creek, which runs through the center of the borough.
Economy
The economy of Narberth Borough is largely based on retail and services. The borough is home to several small businesses, including restaurants, shops, and professional services. The borough is also home to several corporate offices, including those of the pharmaceutical company GlaxoSmithKline and the financial services company Vanguard.
The borough is also home to several educational institutions, including the Narberth School District, which serves students in grades K-12. The borough is also home to several private schools, including the Shipley School and the Baldwin School.
Demographics
As of the 2010 census, the population of Narberth Borough was 4,282. The racial makeup of the borough was 87.3% White, 5.3% African American, 0.2% Native American, 4.2% Asian, and 2.9% from other races. Hispanic or Latino of any race were 5.3% of the population.
The median household income in the borough was $76,944, and the median family income was $90,917. The per capita income was $41,945. About 4.3% of families and 5.7% of the population were below the poverty line, including 6.3% of those under age 18 and 4.2% of those age 65 or over.
The borough is served by the Narberth School District, which consists of four elementary schools, one middle school, and one high school. The borough is also home to several private schools, including the Shipley School and the Baldwin School.
Common Questions
What is Per Capita Income in Narberth borough?
Per Capita income in Narberth borough is $85,806.
What is the Median Family Income in Narberth borough?
Median Family Income in Narberth borough is $233,906.
What is the Median Household income in Narberth borough?
Median Household Income in Narberth borough is $114,691.
What is Income or Wage Gap in Narberth borough?
Income or Wage Gap in Narberth borough is 21.0%.
Women in Narberth borough earn 79.0 cents for every dollar earned by a man.
What is Inequality or Gini Index in Narberth borough?
Inequality or Gini Index in Narberth borough is 0.49.
What is the Total Population of Narberth borough?
Total Population of Narberth borough is 4,478.
What is the Total Male Population of Narberth borough?
Total Male Population of Narberth borough is 2,152.
What is the Total Female Population of Narberth borough?
Total Female Population of Narberth borough is 2,326.
What is the Ratio of Males per 100 Females in Narberth borough?
There are 92.52 Males per 100 Females in Narberth borough.
What is the Ratio of Females per 100 Males in Narberth borough?
There are 108.09 Females per 100 Males in Narberth borough.
What is the Median Population Age in Narberth borough?
Median Population Age in Narberth borough is 42.9 Years.
What is the Average Family Size in Narberth borough
Average Family Size in Narberth borough is 3.1 People.
What is the Average Household Size in Narberth borough
Average Household Size in Narberth borough is 2.3 People.
How Large is the Labor Force in Narberth borough?
There are 2,859 People in the Labor Forcein in Narberth borough.
What is the Percentage of People in the Labor Force in Narberth borough?
77.1% of People are in the Labor Force in Narberth borough.
What is the Unemployment Rate in Narberth borough?
Unemployment Rate in Narberth borough is 4.8%.