Annapolis, MD Map & Demographics
Annapolis Map
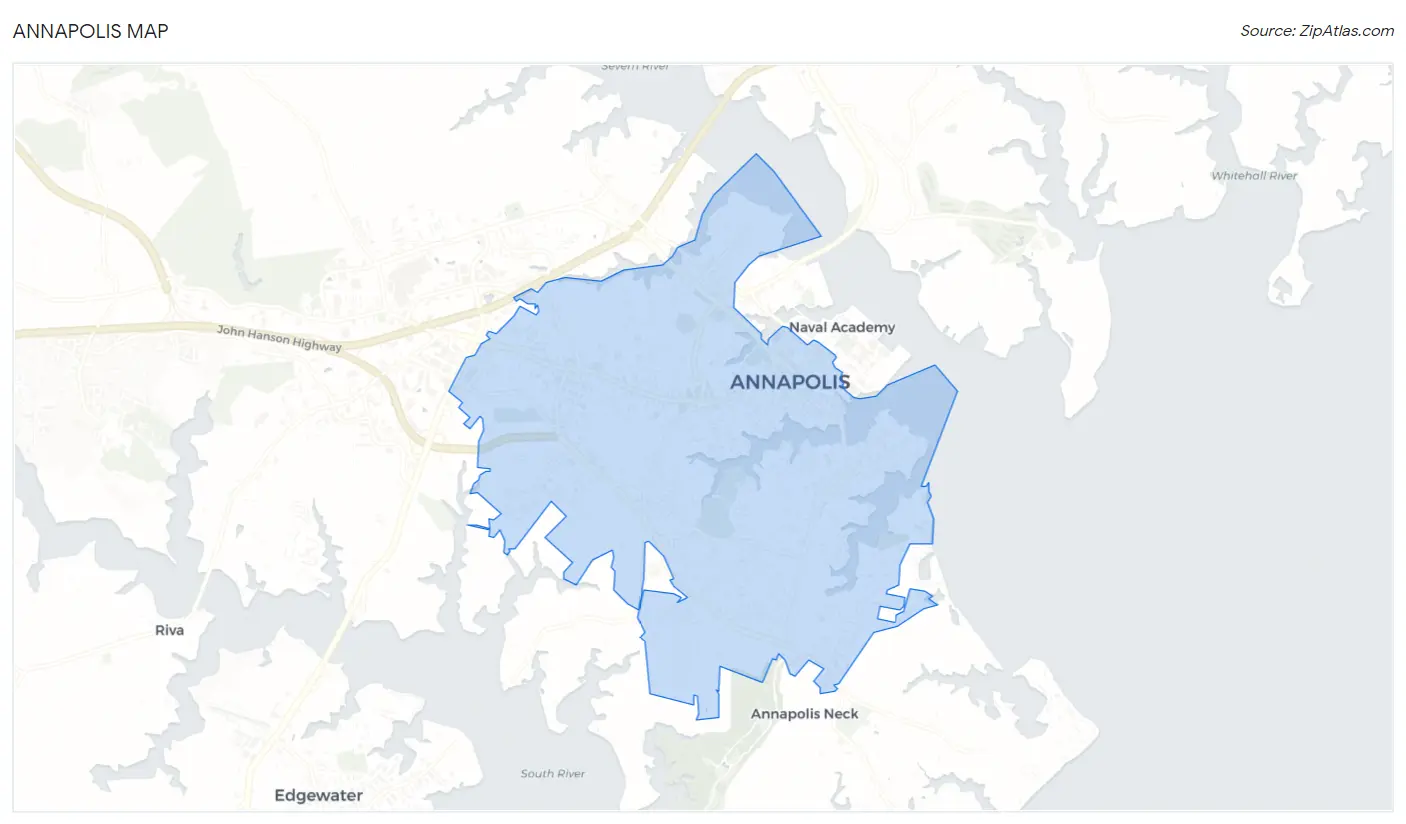
Annapolis Overview
$58,082
PER CAPITA INCOME
$120,895
AVG FAMILY INCOME
$97,219
AVG HOUSEHOLD INCOME
21.0%
WAGE / INCOME GAP [ % ]
79.0¢/ $1
WAGE / INCOME GAP [ $ ]
0.48
INEQUALITY / GINI INDEX
40,719
TOTAL POPULATION
19,556
MALE POPULATION
21,163
FEMALE POPULATION
92.41
MALES / 100 FEMALES
108.22
FEMALES / 100 MALES
37.7
MEDIAN AGE
3.2
AVG FAMILY SIZE
2.4
AVG HOUSEHOLD SIZE
22,003
LABOR FORCE [ PEOPLE ]
68.1%
PERCENT IN LABOR FORCE
4.3%
UNEMPLOYMENT RATE
Income in Annapolis
Income Overview in Annapolis
Per Capita Income in Annapolis is $58,082, while median incomes of families and households are $120,895 and $97,219 respectively.
| Characteristic | Number | Measure |
| Per Capita Income | 40,719 | $58,082 |
| Median Family Income | 9,562 | $120,895 |
| Mean Family Income | 9,562 | $160,329 |
| Median Household Income | 16,969 | $97,219 |
| Mean Household Income | 16,969 | $136,263 |
| Income Deficit | 9,562 | $0 |
| Wage / Income Gap (%) | 40,719 | 21.02% |
| Wage / Income Gap ($) | 40,719 | 78.98¢ per $1 |
| Gini / Inequality Index | 40,719 | 0.48 |
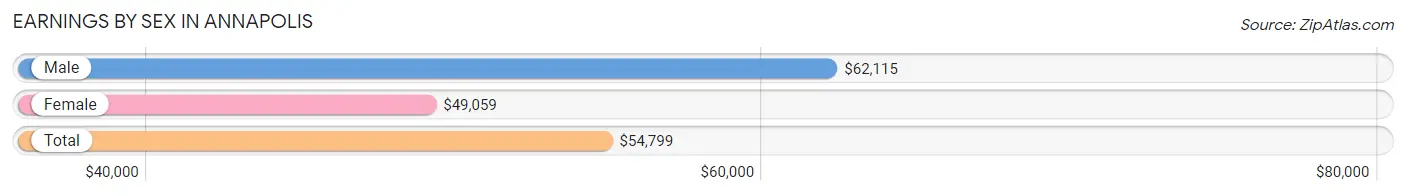
Earnings by Sex in Annapolis
Average Earnings in Annapolis are $54,799, $62,115 for men and $49,059 for women, a difference of 21.0%.
| Sex | Number | Average Earnings |
| Male | 12,129 (52.6%) | $62,115 |
| Female | 10,935 (47.4%) | $49,059 |
| Total | 23,064 (100.0%) | $54,799 |
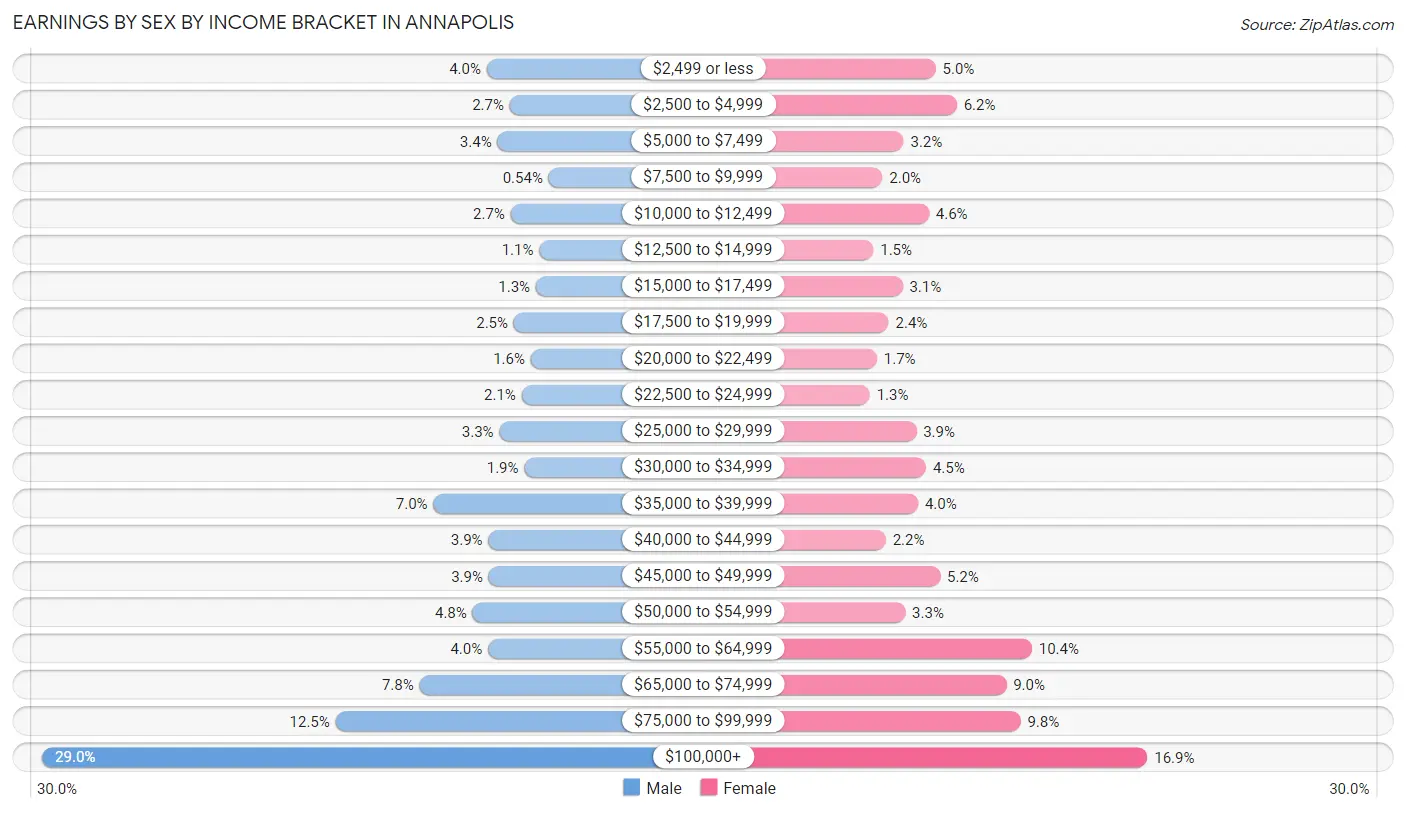
Earnings by Sex by Income Bracket in Annapolis
The most common earnings brackets in Annapolis are $100,000+ for men (3,519 | 29.0%) and $100,000+ for women (1,847 | 16.9%).
| Income | Male | Female |
| $2,499 or less | 487 (4.0%) | 546 (5.0%) |
| $2,500 to $4,999 | 331 (2.7%) | 676 (6.2%) |
| $5,000 to $7,499 | 415 (3.4%) | 349 (3.2%) |
| $7,500 to $9,999 | 65 (0.5%) | 219 (2.0%) |
| $10,000 to $12,499 | 325 (2.7%) | 504 (4.6%) |
| $12,500 to $14,999 | 130 (1.1%) | 163 (1.5%) |
| $15,000 to $17,499 | 153 (1.3%) | 342 (3.1%) |
| $17,500 to $19,999 | 303 (2.5%) | 257 (2.4%) |
| $20,000 to $22,499 | 188 (1.5%) | 185 (1.7%) |
| $22,500 to $24,999 | 250 (2.1%) | 141 (1.3%) |
| $25,000 to $29,999 | 401 (3.3%) | 426 (3.9%) |
| $30,000 to $34,999 | 232 (1.9%) | 487 (4.4%) |
| $35,000 to $39,999 | 851 (7.0%) | 437 (4.0%) |
| $40,000 to $44,999 | 477 (3.9%) | 240 (2.2%) |
| $45,000 to $49,999 | 474 (3.9%) | 573 (5.2%) |
| $50,000 to $54,999 | 585 (4.8%) | 359 (3.3%) |
| $55,000 to $64,999 | 479 (4.0%) | 1,137 (10.4%) |
| $65,000 to $74,999 | 946 (7.8%) | 980 (9.0%) |
| $75,000 to $99,999 | 1,518 (12.5%) | 1,067 (9.8%) |
| $100,000+ | 3,519 (29.0%) | 1,847 (16.9%) |
| Total | 12,129 (100.0%) | 10,935 (100.0%) |
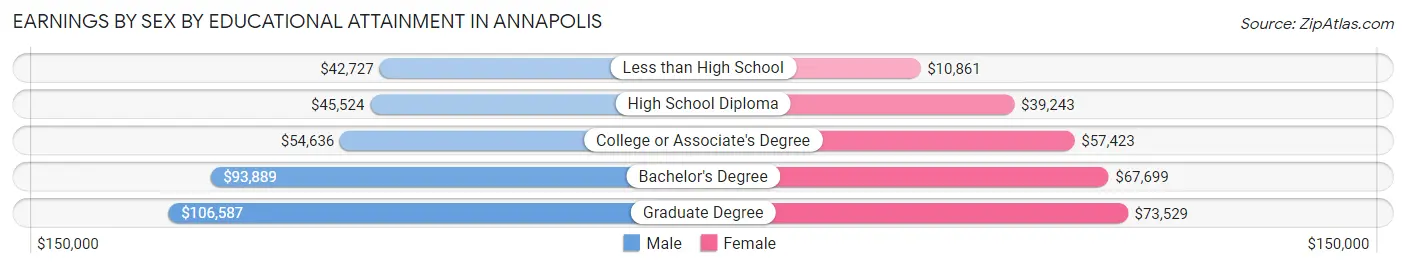
Earnings by Sex by Educational Attainment in Annapolis
Average earnings in Annapolis are $71,406 for men and $56,609 for women, a difference of 20.7%. Men with an educational attainment of graduate degree enjoy the highest average annual earnings of $106,587, while those with less than high school education earn the least with $42,727. Women with an educational attainment of graduate degree earn the most with the average annual earnings of $73,529, while those with less than high school education have the smallest earnings of $10,861.
| Educational Attainment | Male Income | Female Income |
| Less than High School | $42,727 | $10,861 |
| High School Diploma | $45,524 | $39,243 |
| College or Associate's Degree | $54,636 | $57,423 |
| Bachelor's Degree | $93,889 | $67,699 |
| Graduate Degree | $106,587 | $73,529 |
| Total | $71,406 | $56,609 |
Family Income in Annapolis
Family Income Brackets in Annapolis
According to the Annapolis family income data, there are 2,419 families falling into the $200,000+ income range, which is the most common income bracket and makes up 25.3% of all families. Conversely, the $10,000 to $14,999 income bracket is the least frequent group with only 105 families (1.1%) belonging to this category.
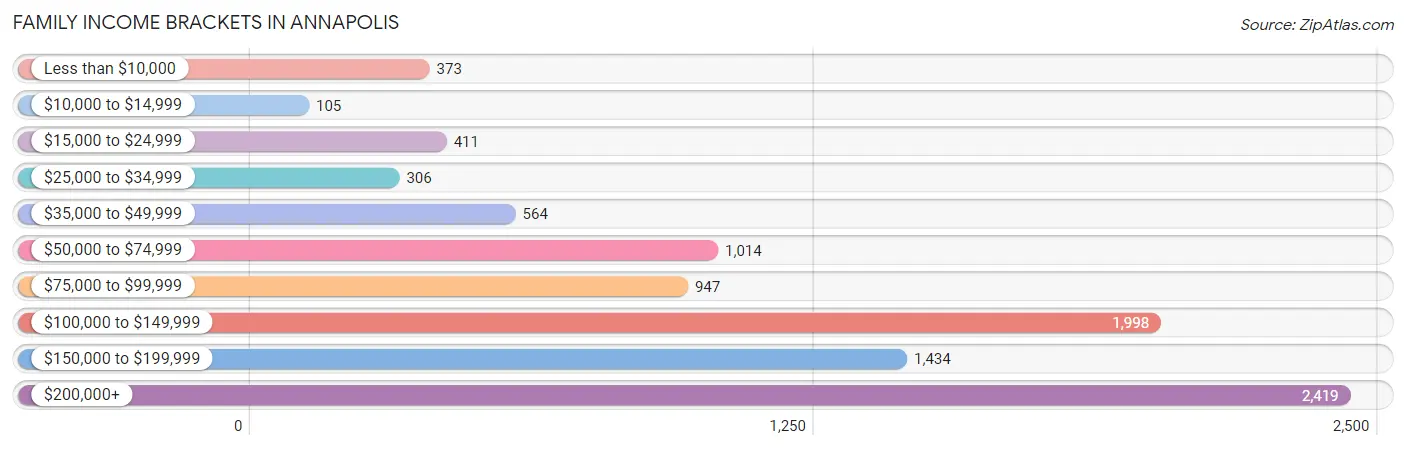
| Income Bracket | # Families | % Families |
| Less than $10,000 | 373 | 3.9% |
| $10,000 to $14,999 | 105 | 1.1% |
| $15,000 to $24,999 | 411 | 4.3% |
| $25,000 to $34,999 | 306 | 3.2% |
| $35,000 to $49,999 | 564 | 5.9% |
| $50,000 to $74,999 | 1,014 | 10.6% |
| $75,000 to $99,999 | 947 | 9.9% |
| $100,000 to $149,999 | 1,998 | 20.9% |
| $150,000 to $199,999 | 1,434 | 15.0% |
| $200,000+ | 2,419 | 25.3% |
Family Income by Famaliy Size in Annapolis
7+ person families (235 | 2.5%) account for the highest median family income in Annapolis with $181,004 per family, while 2-person families (5,197 | 54.3%) have the highest median income of $61,592 per family member.
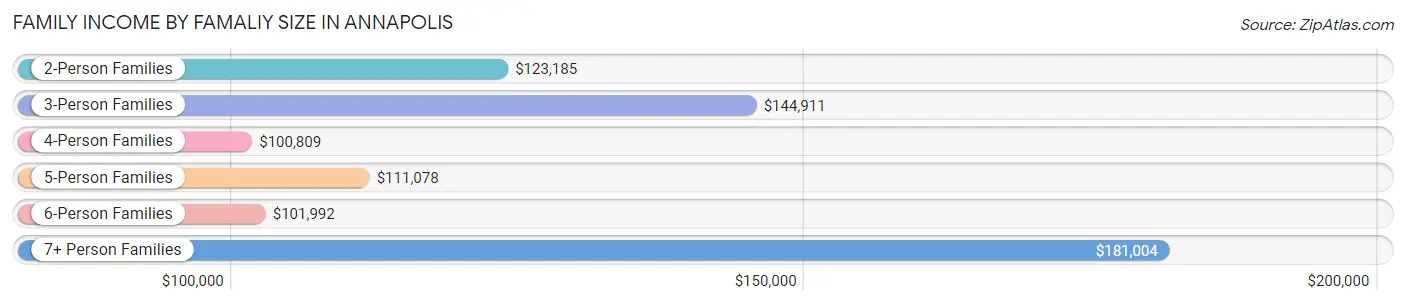
| Income Bracket | # Families | Median Income |
| 2-Person Families | 5,197 (54.3%) | $123,185 |
| 3-Person Families | 1,445 (15.1%) | $144,911 |
| 4-Person Families | 1,832 (19.2%) | $100,809 |
| 5-Person Families | 672 (7.0%) | $111,078 |
| 6-Person Families | 181 (1.9%) | $101,992 |
| 7+ Person Families | 235 (2.5%) | $181,004 |
| Total | 9,562 (100.0%) | $120,895 |
Family Income by Number of Earners in Annapolis
The median family income in Annapolis is $120,895, with families comprising 3+ earners (951) having the highest median family income of $180,900, while families with no earners (1,196) have the lowest median family income of $94,257, accounting for 10.0% and 12.5% of families, respectively.
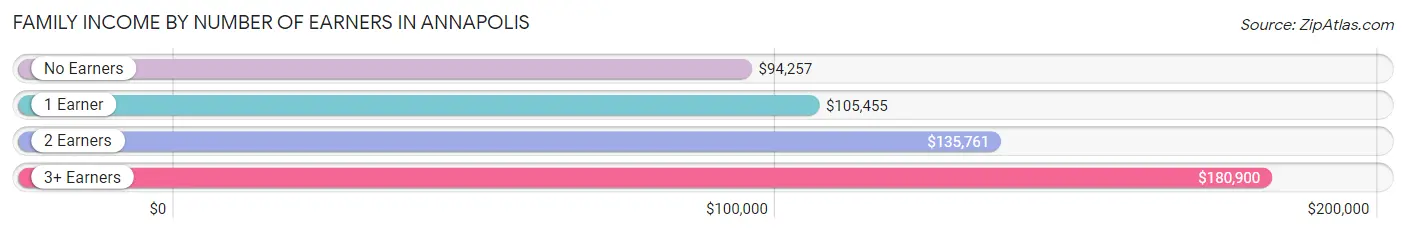
| Number of Earners | # Families | Median Income |
| No Earners | 1,196 (12.5%) | $94,257 |
| 1 Earner | 3,053 (31.9%) | $105,455 |
| 2 Earners | 4,362 (45.6%) | $135,761 |
| 3+ Earners | 951 (10.0%) | $180,900 |
| Total | 9,562 (100.0%) | $120,895 |
Household Income in Annapolis
Household Income Brackets in Annapolis
With 3,241 households falling in the category, the $200,000+ income range is the most frequent in Annapolis, accounting for 19.1% of all households. In contrast, only 288 households (1.7%) fall into the $10,000 to $14,999 income bracket, making it the least populous group.
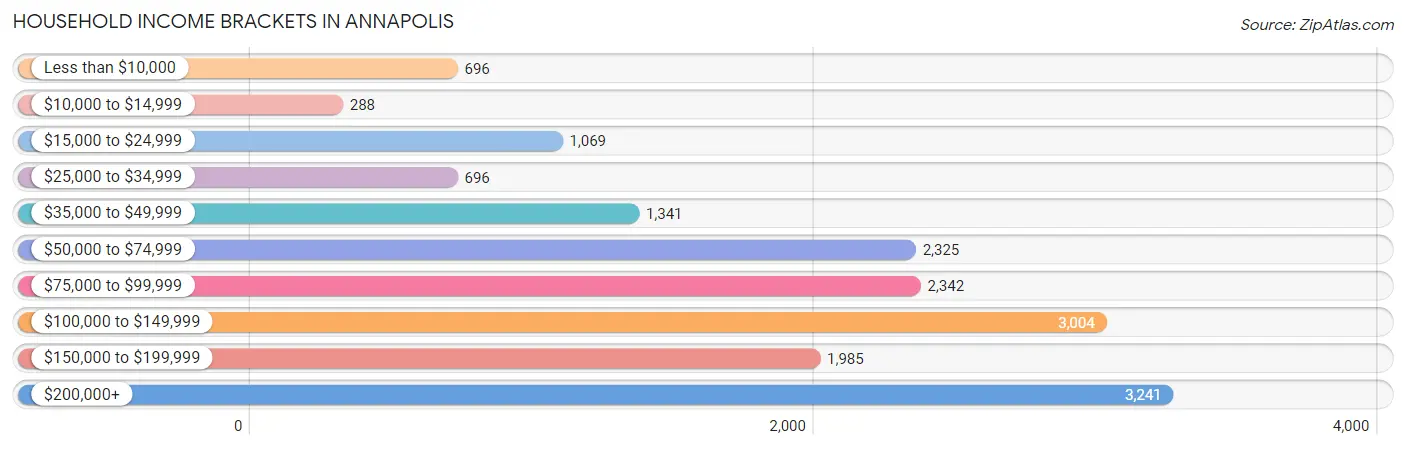
| Income Bracket | # Households | % Households |
| Less than $10,000 | 696 | 4.1% |
| $10,000 to $14,999 | 288 | 1.7% |
| $15,000 to $24,999 | 1,069 | 6.3% |
| $25,000 to $34,999 | 696 | 4.1% |
| $35,000 to $49,999 | 1,341 | 7.9% |
| $50,000 to $74,999 | 2,325 | 13.7% |
| $75,000 to $99,999 | 2,342 | 13.8% |
| $100,000 to $149,999 | 3,004 | 17.7% |
| $150,000 to $199,999 | 1,985 | 11.7% |
| $200,000+ | 3,241 | 19.1% |
Household Income by Householder Age in Annapolis
The median household income in Annapolis is $97,219, with the highest median household income of $123,877 found in the 45 to 64 years age bracket for the primary householder. A total of 5,533 households (32.6%) fall into this category. Meanwhile, the 15 to 24 years age bracket for the primary householder has the lowest median household income of $41,038, with 604 households (3.6%) in this group.
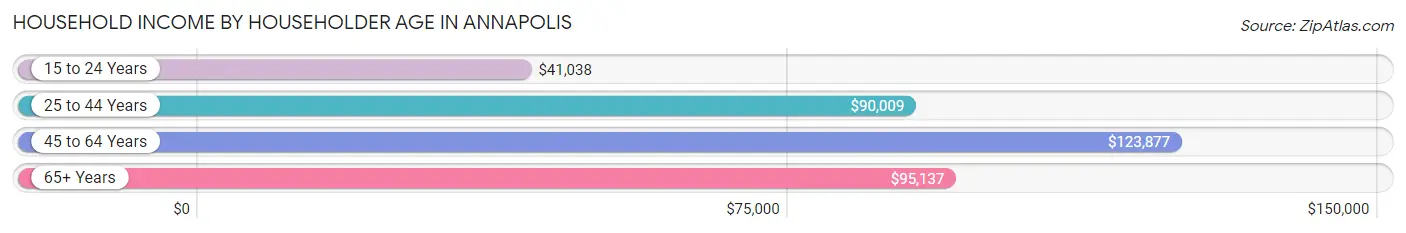
| Income Bracket | # Households | Median Income |
| 15 to 24 Years | 604 (3.6%) | $41,038 |
| 25 to 44 Years | 5,761 (34.0%) | $90,009 |
| 45 to 64 Years | 5,533 (32.6%) | $123,877 |
| 65+ Years | 5,071 (29.9%) | $95,137 |
| Total | 16,969 (100.0%) | $97,219 |
Poverty in Annapolis
Income Below Poverty by Sex and Age in Annapolis
With 8.5% poverty level for males and 12.6% for females among the residents of Annapolis, 5 year old males and 6 to 11 year old females are the most vulnerable to poverty, with 55 males (26.7%) and 439 females (33.8%) in their respective age groups living below the poverty level.
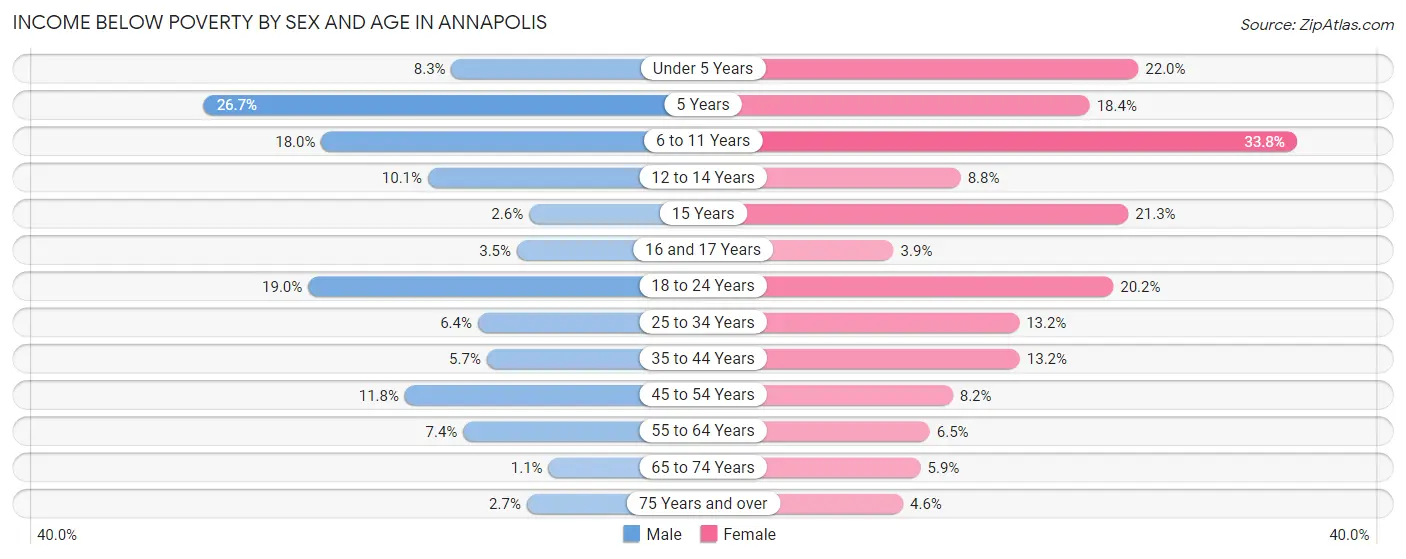
| Age Bracket | Male | Female |
| Under 5 Years | 136 (8.3%) | 338 (22.0%) |
| 5 Years | 55 (26.7%) | 65 (18.4%) |
| 6 to 11 Years | 264 (18.0%) | 439 (33.8%) |
| 12 to 14 Years | 64 (10.1%) | 67 (8.8%) |
| 15 Years | 5 (2.5%) | 50 (21.3%) |
| 16 and 17 Years | 25 (3.5%) | 13 (3.8%) |
| 18 to 24 Years | 289 (19.0%) | 305 (20.2%) |
| 25 to 34 Years | 151 (6.4%) | 415 (13.2%) |
| 35 to 44 Years | 152 (5.7%) | 357 (13.2%) |
| 45 to 54 Years | 266 (11.8%) | 155 (8.2%) |
| 55 to 64 Years | 187 (7.4%) | 181 (6.5%) |
| 65 to 74 Years | 20 (1.1%) | 144 (5.9%) |
| 75 Years and over | 35 (2.7%) | 82 (4.5%) |
| Total | 1,649 (8.5%) | 2,611 (12.6%) |
Income Above Poverty by Sex and Age in Annapolis
According to the poverty statistics in Annapolis, males aged 65 to 74 years and females aged 16 and 17 years are the age groups that are most secure financially, with 98.9% of males and 96.2% of females in these age groups living above the poverty line.
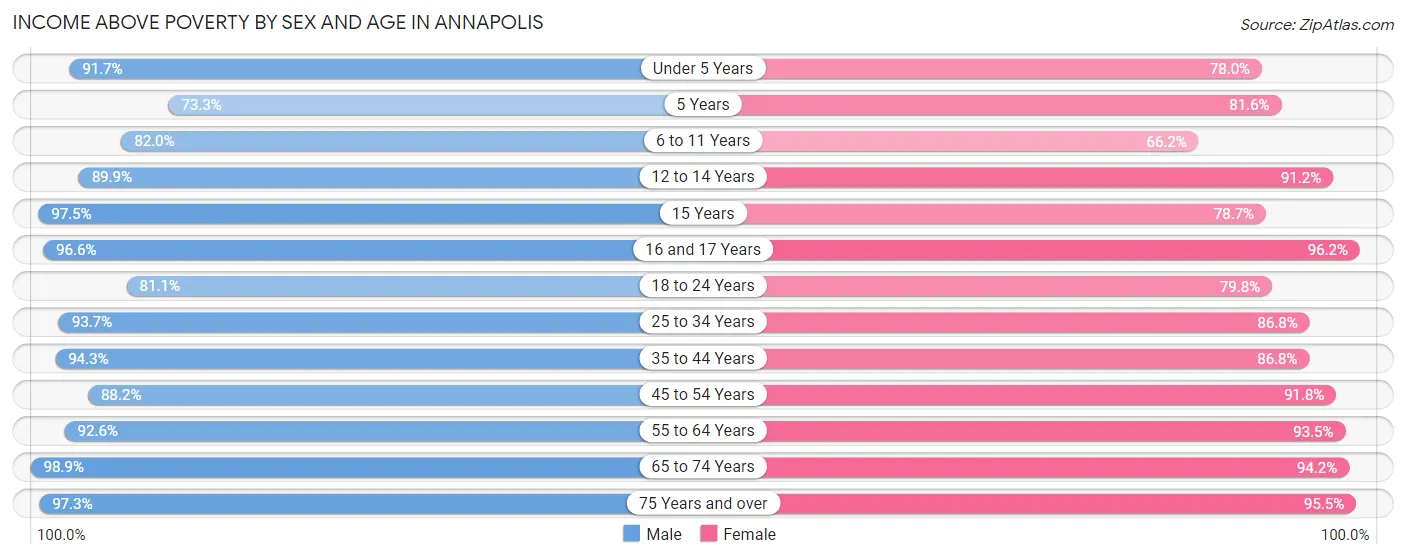
| Age Bracket | Male | Female |
| Under 5 Years | 1,501 (91.7%) | 1,197 (78.0%) |
| 5 Years | 151 (73.3%) | 288 (81.6%) |
| 6 to 11 Years | 1,205 (82.0%) | 861 (66.2%) |
| 12 to 14 Years | 572 (89.9%) | 692 (91.2%) |
| 15 Years | 191 (97.5%) | 185 (78.7%) |
| 16 and 17 Years | 700 (96.6%) | 325 (96.2%) |
| 18 to 24 Years | 1,236 (81.0%) | 1,208 (79.8%) |
| 25 to 34 Years | 2,228 (93.6%) | 2,735 (86.8%) |
| 35 to 44 Years | 2,521 (94.3%) | 2,343 (86.8%) |
| 45 to 54 Years | 1,994 (88.2%) | 1,727 (91.8%) |
| 55 to 64 Years | 2,327 (92.6%) | 2,587 (93.5%) |
| 65 to 74 Years | 1,789 (98.9%) | 2,319 (94.2%) |
| 75 Years and over | 1,251 (97.3%) | 1,719 (95.5%) |
| Total | 17,666 (91.5%) | 18,186 (87.5%) |
Income Below Poverty Among Married-Couple Families in Annapolis
The poverty statistics for married-couple families in Annapolis show that 4.5% or 307 of the total 6,870 families live below the poverty line. Families with 1 or 2 children have the highest poverty rate of 12.0%, comprising of 257 families. On the other hand, families with 3 or 4 children have the lowest poverty rate of 0.0%, which includes 0 families.
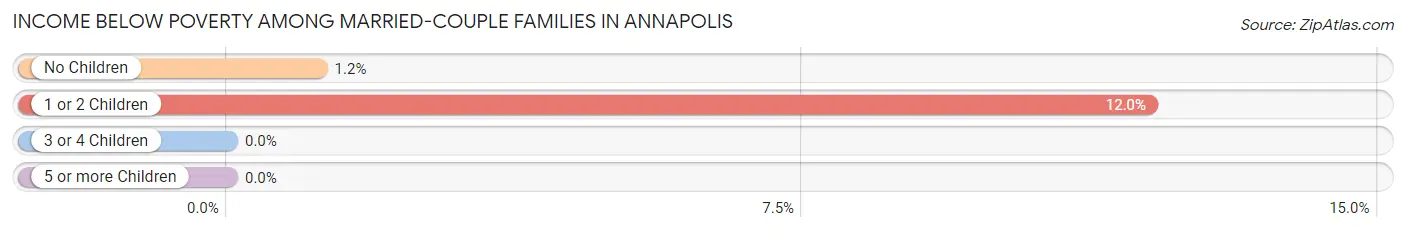
| Children | Above Poverty | Below Poverty |
| No Children | 4,232 (98.8%) | 50 (1.2%) |
| 1 or 2 Children | 1,882 (88.0%) | 257 (12.0%) |
| 3 or 4 Children | 328 (100.0%) | 0 (0.0%) |
| 5 or more Children | 121 (100.0%) | 0 (0.0%) |
| Total | 6,563 (95.5%) | 307 (4.5%) |
Income Below Poverty Among Single-Parent Households in Annapolis
According to the poverty data in Annapolis, 7.9% or 38 single-father households and 23.0% or 509 single-mother households are living below the poverty line. Among single-father households, those with 1 or 2 children have the highest poverty rate, with 38 households (13.5%) experiencing poverty. Likewise, among single-mother households, those with 3 or 4 children have the highest poverty rate, with 119 households (49.6%) falling below the poverty line.
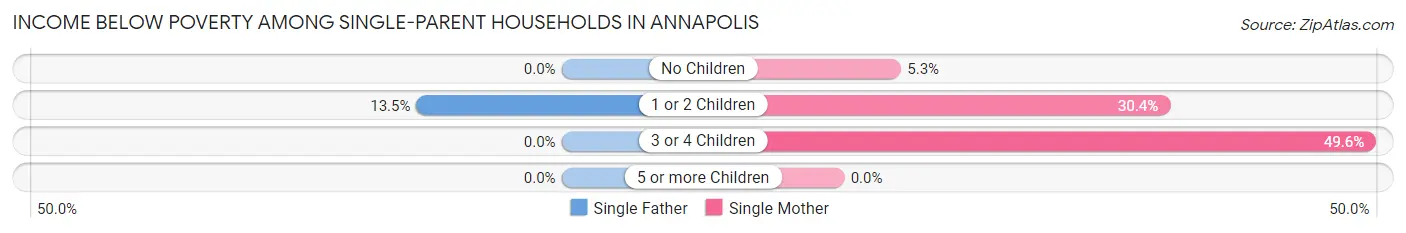
| Children | Single Father | Single Mother |
| No Children | 0 (0.0%) | 44 (5.3%) |
| 1 or 2 Children | 38 (13.5%) | 346 (30.4%) |
| 3 or 4 Children | 0 (0.0%) | 119 (49.6%) |
| 5 or more Children | 0 (0.0%) | 0 (0.0%) |
| Total | 38 (7.9%) | 509 (23.0%) |
Income Below Poverty Among Married-Couple vs Single-Parent Households in Annapolis
The poverty data for Annapolis shows that 307 of the married-couple family households (4.5%) and 547 of the single-parent households (20.3%) are living below the poverty level. Within the married-couple family households, those with 1 or 2 children have the highest poverty rate, with 257 households (12.0%) falling below the poverty line. Among the single-parent households, those with 3 or 4 children have the highest poverty rate, with 119 household (41.0%) living below poverty.
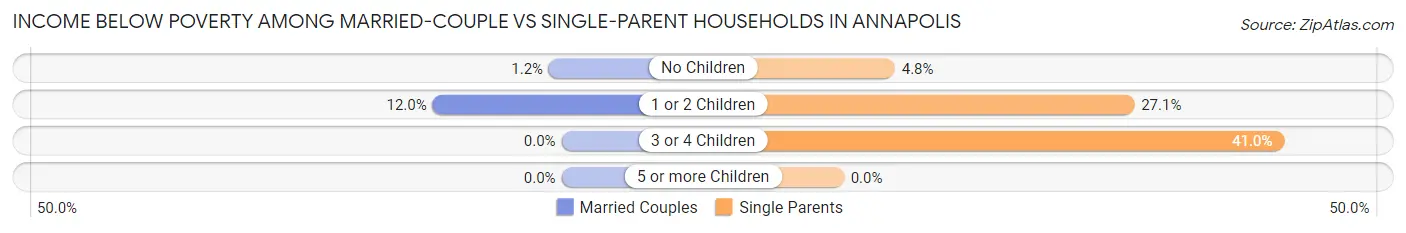
| Children | Married-Couple Families | Single-Parent Households |
| No Children | 50 (1.2%) | 44 (4.8%) |
| 1 or 2 Children | 257 (12.0%) | 384 (27.1%) |
| 3 or 4 Children | 0 (0.0%) | 119 (41.0%) |
| 5 or more Children | 0 (0.0%) | 0 (0.0%) |
| Total | 307 (4.5%) | 547 (20.3%) |
Race in Annapolis
The most populous races in Annapolis are White / Caucasian (23,911 | 58.7%), Black / African American (9,336 | 22.9%), and Hispanic or Latino (7,093 | 17.4%).
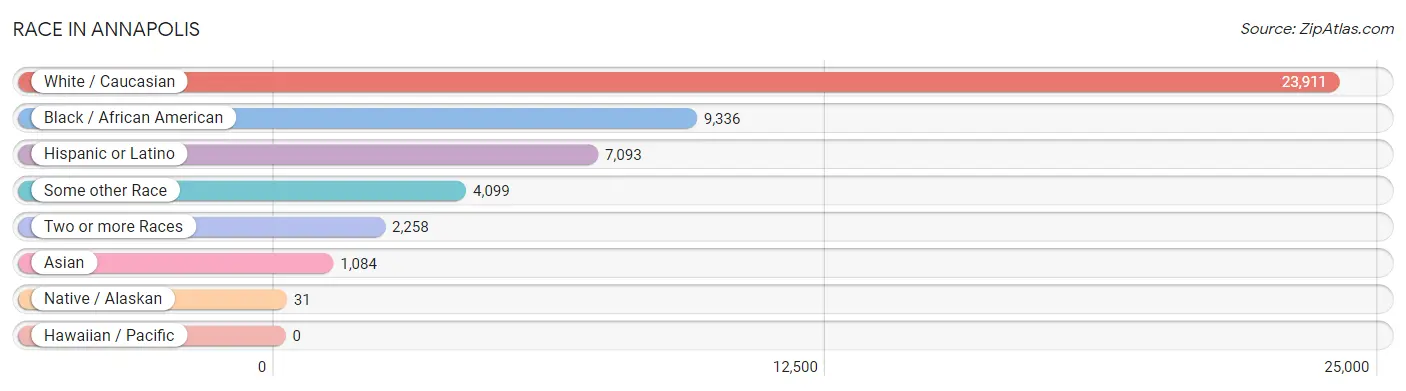
| Race | # Population | % Population |
| Asian | 1,084 | 2.7% |
| Black / African American | 9,336 | 22.9% |
| Hawaiian / Pacific | 0 | 0.0% |
| Hispanic or Latino | 7,093 | 17.4% |
| Native / Alaskan | 31 | 0.1% |
| White / Caucasian | 23,911 | 58.7% |
| Two or more Races | 2,258 | 5.6% |
| Some other Race | 4,099 | 10.1% |
| Total | 40,719 | 100.0% |
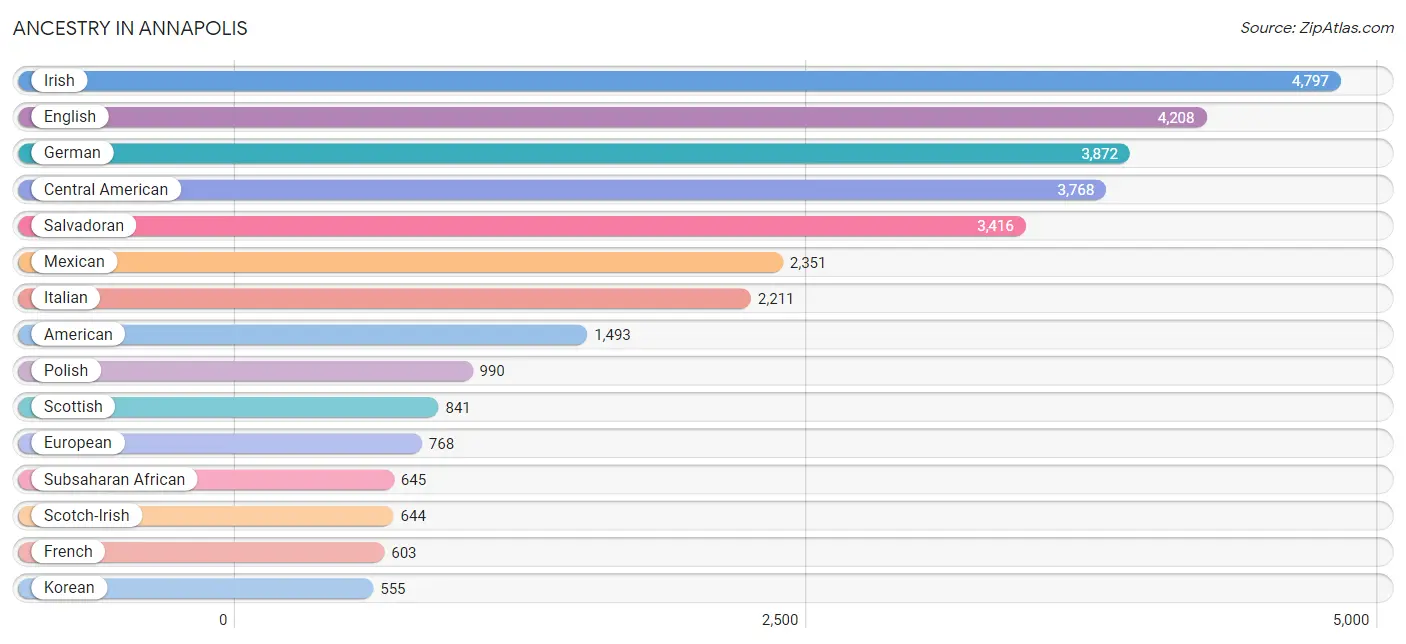
Ancestry in Annapolis
The most populous ancestries reported in Annapolis are Irish (4,797 | 11.8%), English (4,208 | 10.3%), German (3,872 | 9.5%), Central American (3,768 | 9.2%), and Salvadoran (3,416 | 8.4%), together accounting for 49.3% of all Annapolis residents.
| Ancestry | # Population | % Population |
| Afghan | 10 | 0.0% |
| African | 477 | 1.2% |
| Albanian | 34 | 0.1% |
| Alsatian | 22 | 0.1% |
| American | 1,493 | 3.7% |
| Apache | 90 | 0.2% |
| Arab | 59 | 0.1% |
| Argentinean | 13 | 0.0% |
| Armenian | 43 | 0.1% |
| Austrian | 65 | 0.2% |
| Belgian | 128 | 0.3% |
| Bhutanese | 221 | 0.5% |
| Blackfeet | 30 | 0.1% |
| Brazilian | 12 | 0.0% |
| British | 535 | 1.3% |
| British West Indian | 23 | 0.1% |
| Burmese | 154 | 0.4% |
| Canadian | 26 | 0.1% |
| Cape Verdean | 10 | 0.0% |
| Central American | 3,768 | 9.2% |
| Central American Indian | 10 | 0.0% |
| Cherokee | 108 | 0.3% |
| Chilean | 48 | 0.1% |
| Choctaw | 95 | 0.2% |
| Colville | 18 | 0.0% |
| Costa Rican | 11 | 0.0% |
| Creek | 5 | 0.0% |
| Croatian | 43 | 0.1% |
| Cuban | 63 | 0.2% |
| Cypriot | 32 | 0.1% |
| Czech | 85 | 0.2% |
| Czechoslovakian | 51 | 0.1% |
| Danish | 197 | 0.5% |
| Dominican | 113 | 0.3% |
| Dutch | 313 | 0.8% |
| Eastern European | 154 | 0.4% |
| Ecuadorian | 211 | 0.5% |
| English | 4,208 | 10.3% |
| Estonian | 124 | 0.3% |
| Ethiopian | 7 | 0.0% |
| European | 768 | 1.9% |
| Filipino | 73 | 0.2% |
| Finnish | 8 | 0.0% |
| French | 603 | 1.5% |
| French Canadian | 156 | 0.4% |
| German | 3,872 | 9.5% |
| Ghanaian | 99 | 0.2% |
| Greek | 310 | 0.8% |
| Guatemalan | 261 | 0.6% |
| Haitian | 19 | 0.1% |
| Honduran | 28 | 0.1% |
| Hungarian | 63 | 0.2% |
| Indian (Asian) | 90 | 0.2% |
| Iranian | 128 | 0.3% |
| Irish | 4,797 | 11.8% |
| Iroquois | 8 | 0.0% |
| Italian | 2,211 | 5.4% |
| Jamaican | 40 | 0.1% |
| Korean | 555 | 1.4% |
| Laotian | 17 | 0.0% |
| Latvian | 6 | 0.0% |
| Lebanese | 39 | 0.1% |
| Lithuanian | 148 | 0.4% |
| Mexican | 2,351 | 5.8% |
| Moroccan | 11 | 0.0% |
| New Zealander | 19 | 0.1% |
| Nicaraguan | 1 | 0.0% |
| Nigerian | 23 | 0.1% |
| Northern European | 167 | 0.4% |
| Norwegian | 157 | 0.4% |
| Osage | 9 | 0.0% |
| Pakistani | 136 | 0.3% |
| Panamanian | 51 | 0.1% |
| Pennsylvania German | 6 | 0.0% |
| Peruvian | 35 | 0.1% |
| Polish | 990 | 2.4% |
| Portuguese | 98 | 0.2% |
| Pueblo | 73 | 0.2% |
| Puerto Rican | 204 | 0.5% |
| Romanian | 23 | 0.1% |
| Russian | 179 | 0.4% |
| Salvadoran | 3,416 | 8.4% |
| Scandinavian | 123 | 0.3% |
| Scotch-Irish | 644 | 1.6% |
| Scottish | 841 | 2.1% |
| Senegalese | 11 | 0.0% |
| Serbian | 47 | 0.1% |
| Slavic | 33 | 0.1% |
| Slovak | 104 | 0.3% |
| Slovene | 13 | 0.0% |
| South African | 15 | 0.0% |
| South American | 307 | 0.7% |
| Spaniard | 71 | 0.2% |
| Spanish | 81 | 0.2% |
| Sri Lankan | 19 | 0.1% |
| Subsaharan African | 645 | 1.6% |
| Sudanese | 10 | 0.0% |
| Swedish | 275 | 0.7% |
| Swiss | 117 | 0.3% |
| Syrian | 16 | 0.0% |
| Thai | 78 | 0.2% |
| Trinidadian and Tobagonian | 36 | 0.1% |
| Ukrainian | 19 | 0.1% |
| Welsh | 354 | 0.9% |
| West Indian | 29 | 0.1% | View All 105 Rows |
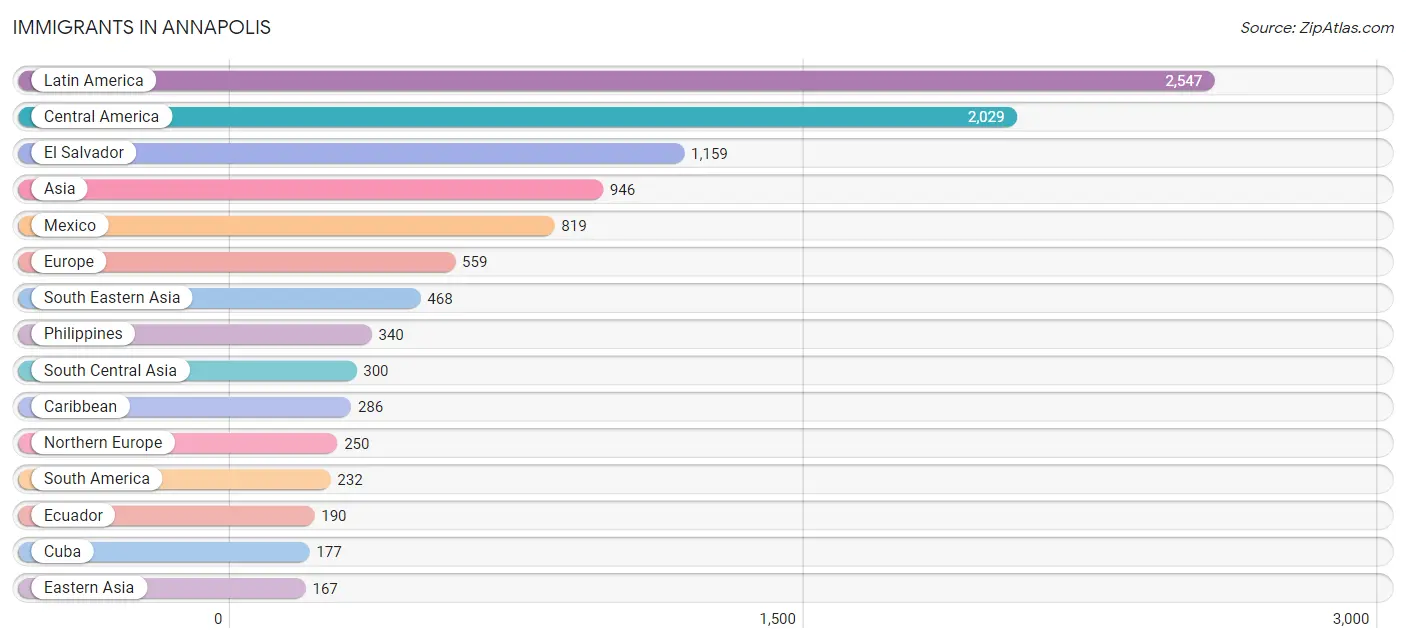
Immigrants in Annapolis
The most numerous immigrant groups reported in Annapolis came from Latin America (2,547 | 6.3%), Central America (2,029 | 5.0%), El Salvador (1,159 | 2.9%), Asia (946 | 2.3%), and Mexico (819 | 2.0%), together accounting for 18.4% of all Annapolis residents.
| Immigration Origin | # Population | % Population |
| Afghanistan | 10 | 0.0% |
| Africa | 153 | 0.4% |
| Albania | 34 | 0.1% |
| Asia | 946 | 2.3% |
| Australia | 12 | 0.0% |
| Austria | 16 | 0.0% |
| Bosnia and Herzegovina | 16 | 0.0% |
| Brazil | 26 | 0.1% |
| Cameroon | 14 | 0.0% |
| Canada | 60 | 0.2% |
| Caribbean | 286 | 0.7% |
| Central America | 2,029 | 5.0% |
| China | 37 | 0.1% |
| Cuba | 177 | 0.4% |
| Czechoslovakia | 13 | 0.0% |
| Dominican Republic | 88 | 0.2% |
| Eastern Africa | 7 | 0.0% |
| Eastern Asia | 167 | 0.4% |
| Eastern Europe | 107 | 0.3% |
| Ecuador | 190 | 0.5% |
| El Salvador | 1,159 | 2.9% |
| England | 36 | 0.1% |
| Ethiopia | 7 | 0.0% |
| Europe | 559 | 1.4% |
| France | 50 | 0.1% |
| Germany | 46 | 0.1% |
| Ghana | 99 | 0.2% |
| Hong Kong | 9 | 0.0% |
| India | 41 | 0.1% |
| Indonesia | 8 | 0.0% |
| Iran | 118 | 0.3% |
| Ireland | 45 | 0.1% |
| Italy | 30 | 0.1% |
| Jamaica | 21 | 0.1% |
| Japan | 38 | 0.1% |
| Korea | 92 | 0.2% |
| Latin America | 2,547 | 6.3% |
| Mexico | 819 | 2.0% |
| Middle Africa | 14 | 0.0% |
| Nepal | 131 | 0.3% |
| Netherlands | 33 | 0.1% |
| Nicaragua | 1 | 0.0% |
| Northern Europe | 250 | 0.6% |
| Oceania | 12 | 0.0% |
| Panama | 50 | 0.1% |
| Peru | 16 | 0.0% |
| Philippines | 340 | 0.8% |
| Russia | 10 | 0.0% |
| Senegal | 11 | 0.0% |
| South Africa | 22 | 0.1% |
| South America | 232 | 0.6% |
| South Central Asia | 300 | 0.7% |
| South Eastern Asia | 468 | 1.1% |
| Southern Europe | 57 | 0.1% |
| Spain | 27 | 0.1% |
| Taiwan | 5 | 0.0% |
| Thailand | 120 | 0.3% |
| Western Africa | 110 | 0.3% |
| Western Asia | 11 | 0.0% |
| Western Europe | 145 | 0.4% | View All 60 Rows |
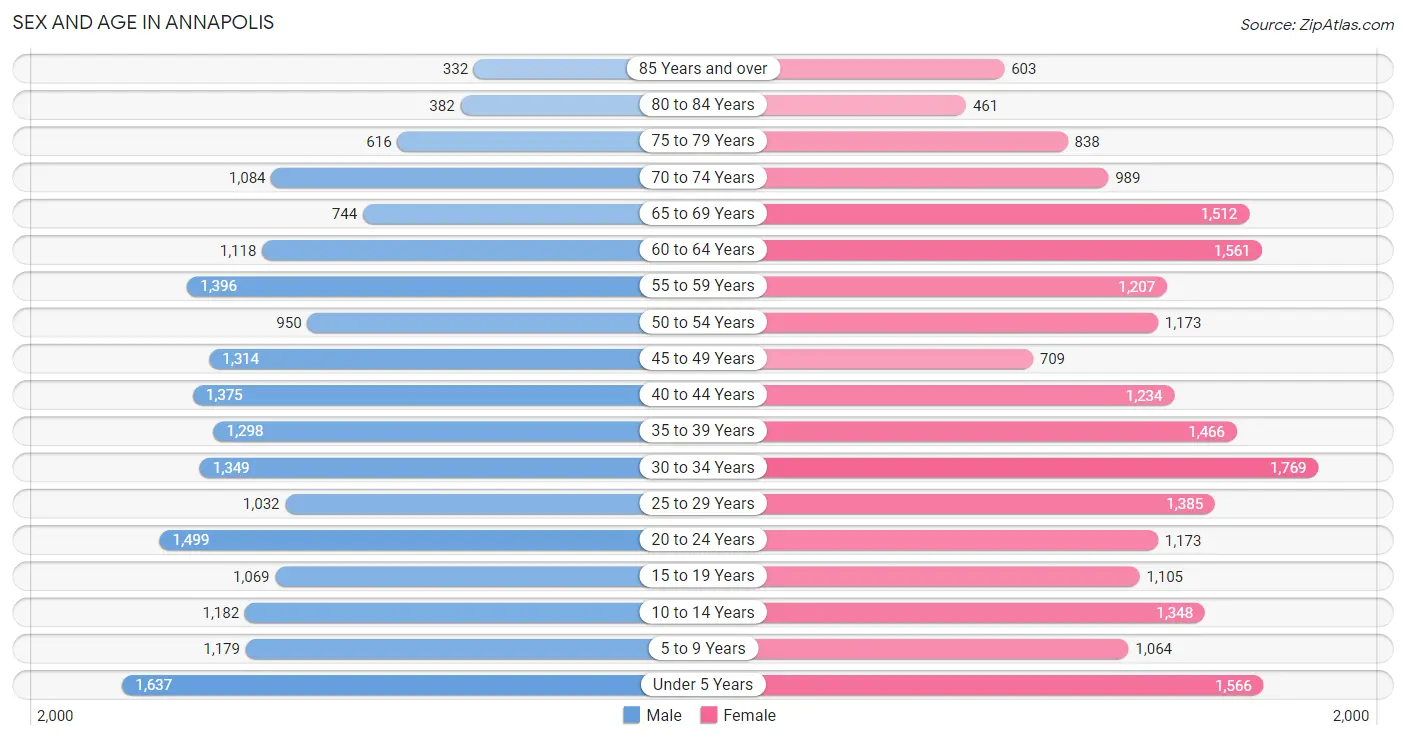
Sex and Age in Annapolis
Sex and Age in Annapolis
The most populous age groups in Annapolis are Under 5 Years (1,637 | 8.4%) for men and 30 to 34 Years (1,769 | 8.4%) for women.
| Age Bracket | Male | Female |
| Under 5 Years | 1,637 (8.4%) | 1,566 (7.4%) |
| 5 to 9 Years | 1,179 (6.0%) | 1,064 (5.0%) |
| 10 to 14 Years | 1,182 (6.0%) | 1,348 (6.4%) |
| 15 to 19 Years | 1,069 (5.5%) | 1,105 (5.2%) |
| 20 to 24 Years | 1,499 (7.7%) | 1,173 (5.5%) |
| 25 to 29 Years | 1,032 (5.3%) | 1,385 (6.5%) |
| 30 to 34 Years | 1,349 (6.9%) | 1,769 (8.4%) |
| 35 to 39 Years | 1,298 (6.6%) | 1,466 (6.9%) |
| 40 to 44 Years | 1,375 (7.0%) | 1,234 (5.8%) |
| 45 to 49 Years | 1,314 (6.7%) | 709 (3.4%) |
| 50 to 54 Years | 950 (4.9%) | 1,173 (5.5%) |
| 55 to 59 Years | 1,396 (7.1%) | 1,207 (5.7%) |
| 60 to 64 Years | 1,118 (5.7%) | 1,561 (7.4%) |
| 65 to 69 Years | 744 (3.8%) | 1,512 (7.1%) |
| 70 to 74 Years | 1,084 (5.5%) | 989 (4.7%) |
| 75 to 79 Years | 616 (3.2%) | 838 (4.0%) |
| 80 to 84 Years | 382 (1.9%) | 461 (2.2%) |
| 85 Years and over | 332 (1.7%) | 603 (2.9%) |
| Total | 19,556 (100.0%) | 21,163 (100.0%) |
Families and Households in Annapolis
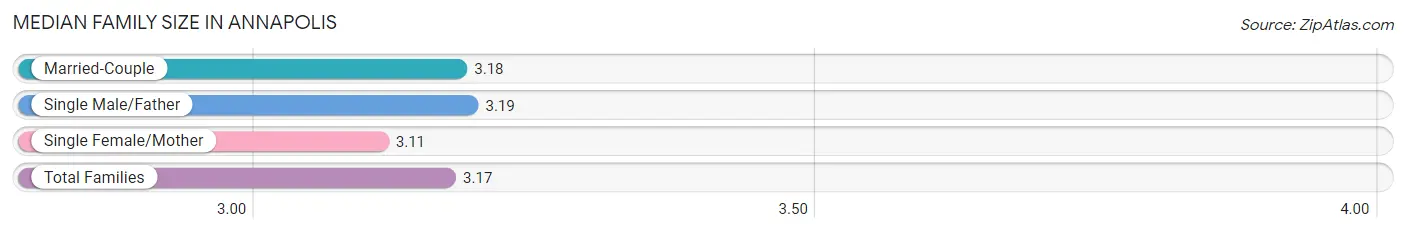
Median Family Size in Annapolis
The median family size in Annapolis is 3.17 persons per family, with single male/father families (480 | 5.0%) accounting for the largest median family size of 3.19 persons per family. On the other hand, single female/mother families (2,212 | 23.1%) represent the smallest median family size with 3.11 persons per family.
| Family Type | # Families | Family Size |
| Married-Couple | 6,870 (71.9%) | 3.18 |
| Single Male/Father | 480 (5.0%) | 3.19 |
| Single Female/Mother | 2,212 (23.1%) | 3.11 |
| Total Families | 9,562 (100.0%) | 3.17 |
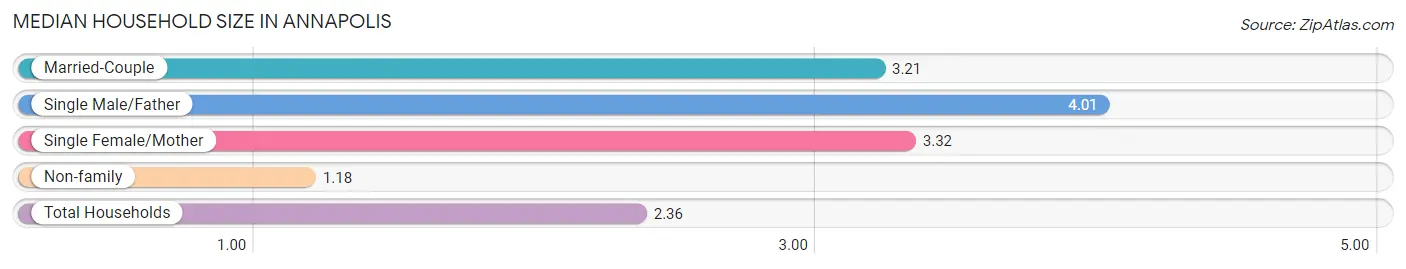
Median Household Size in Annapolis
The median household size in Annapolis is 2.36 persons per household, with single male/father households (480 | 2.8%) accounting for the largest median household size of 4.01 persons per household. non-family households (7,407 | 43.6%) represent the smallest median household size with 1.18 persons per household.
| Household Type | # Households | Household Size |
| Married-Couple | 6,870 (40.5%) | 3.21 |
| Single Male/Father | 480 (2.8%) | 4.01 |
| Single Female/Mother | 2,212 (13.0%) | 3.32 |
| Non-family | 7,407 (43.6%) | 1.18 |
| Total Households | 16,969 (100.0%) | 2.36 |
Household Size by Marriage Status in Annapolis
Out of a total of 16,969 households in Annapolis, 9,562 (56.4%) are family households, while 7,407 (43.6%) are nonfamily households. The most numerous type of family households are 2-person households, comprising 4,906, and the most common type of nonfamily households are 1-person households, comprising 6,276.
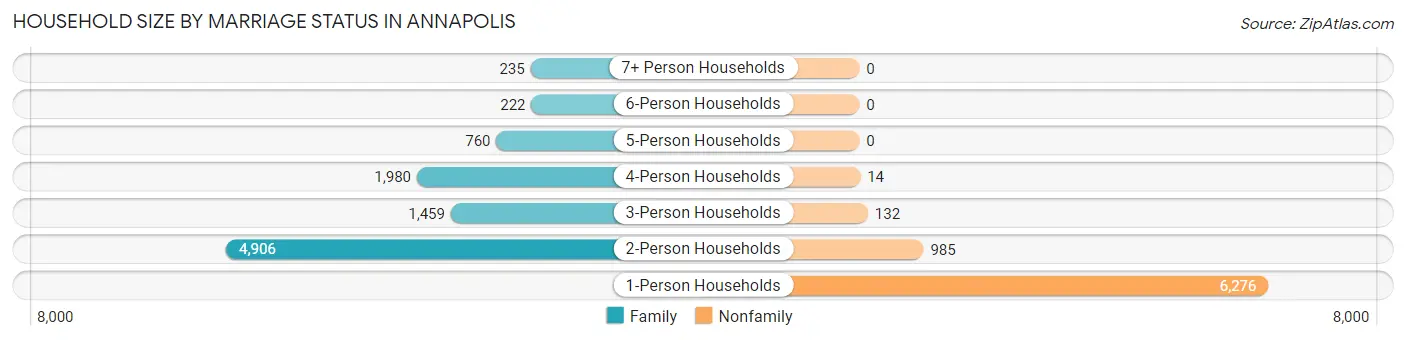
| Household Size | Family Households | Nonfamily Households |
| 1-Person Households | - | 6,276 (37.0%) |
| 2-Person Households | 4,906 (28.9%) | 985 (5.8%) |
| 3-Person Households | 1,459 (8.6%) | 132 (0.8%) |
| 4-Person Households | 1,980 (11.7%) | 14 (0.1%) |
| 5-Person Households | 760 (4.5%) | 0 (0.0%) |
| 6-Person Households | 222 (1.3%) | 0 (0.0%) |
| 7+ Person Households | 235 (1.4%) | 0 (0.0%) |
| Total | 9,562 (56.4%) | 7,407 (43.6%) |
Female Fertility in Annapolis
Fertility by Age in Annapolis
Average fertility rate in Annapolis is 55.0 births per 1,000 women. Women in the age bracket of 35 to 50 years have the highest fertility rate with 67.0 births per 1,000 women. Women in the age bracket of 20 to 34 years acount for 52.1% of all women with births.
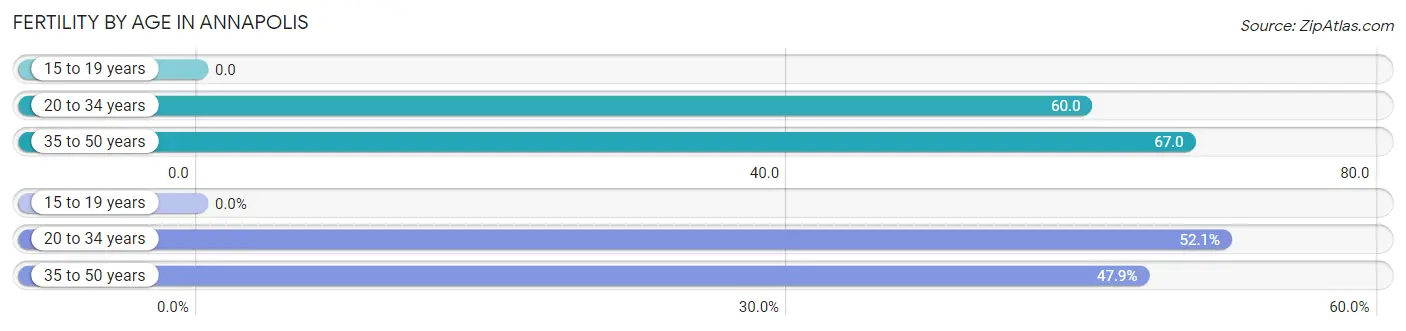
| Age Bracket | Women with Births | Births / 1,000 Women |
| 15 to 19 years | 0 (0.0%) | 0.0 |
| 20 to 34 years | 261 (52.1%) | 60.0 |
| 35 to 50 years | 240 (47.9%) | 67.0 |
| Total | 501 (100.0%) | 55.0 |
Fertility by Age by Marriage Status in Annapolis
88.4% of women with births (501) in Annapolis are married. The highest percentage of unmarried women with births falls into 20 to 34 years age bracket with 12.3% of them unmarried at the time of birth, while the lowest percentage of unmarried women with births belong to 35 to 50 years age bracket with 10.8% of them unmarried.
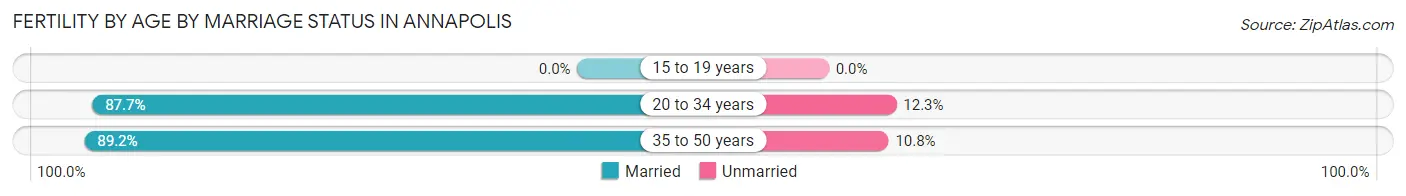
| Age Bracket | Married | Unmarried |
| 15 to 19 years | 0 (0.0%) | 0 (0.0%) |
| 20 to 34 years | 229 (87.7%) | 32 (12.3%) |
| 35 to 50 years | 214 (89.2%) | 26 (10.8%) |
| Total | 443 (88.4%) | 58 (11.6%) |
Fertility by Education in Annapolis
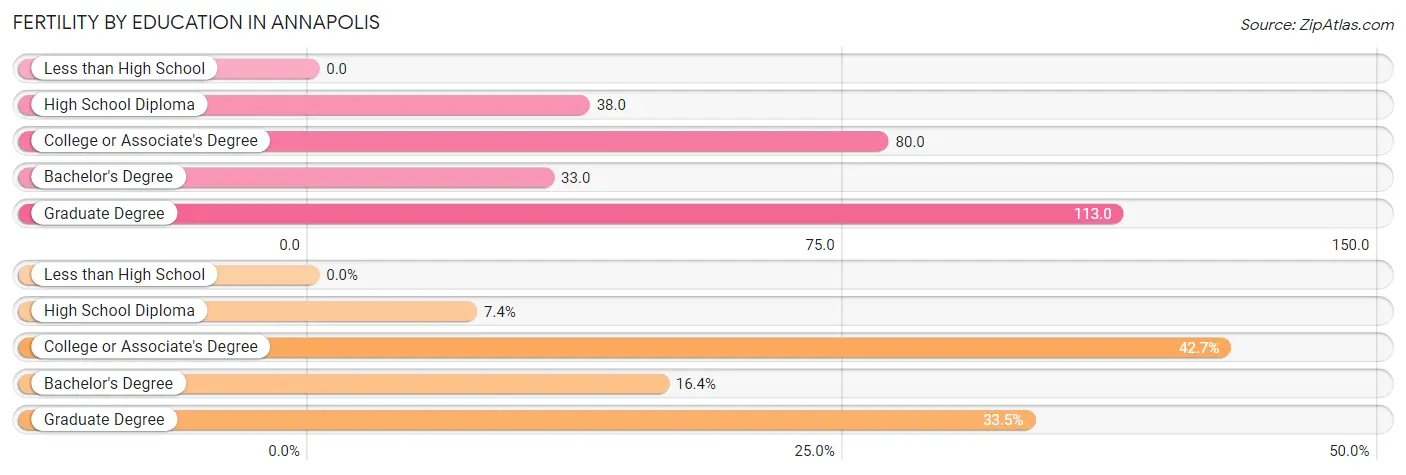
| Educational Attainment | Women with Births | Births / 1,000 Women |
| Less than High School | 0 (0.0%) | 0.0 |
| High School Diploma | 37 (7.4%) | 38.0 |
| College or Associate's Degree | 214 (42.7%) | 80.0 |
| Bachelor's Degree | 82 (16.4%) | 33.0 |
| Graduate Degree | 168 (33.5%) | 113.0 |
| Total | 501 (100.0%) | 55.0 |
Fertility by Education by Marriage Status in Annapolis
11.6% of women with births in Annapolis are unmarried. Women with the educational attainment of college or associate's degree are most likely to be married with 100.0% of them married at childbirth, while women with the educational attainment of high school diploma are least likely to be married with 86.5% of them unmarried at childbirth.
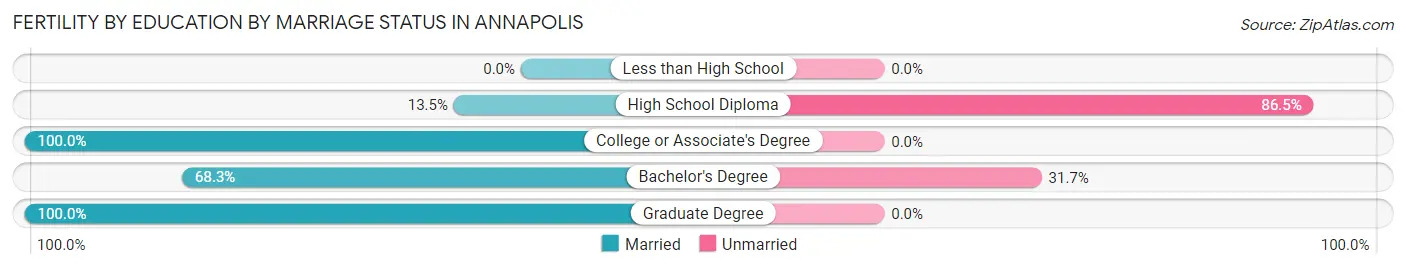
| Educational Attainment | Married | Unmarried |
| Less than High School | 0 (0.0%) | 0 (0.0%) |
| High School Diploma | 5 (13.5%) | 32 (86.5%) |
| College or Associate's Degree | 214 (100.0%) | 0 (0.0%) |
| Bachelor's Degree | 56 (68.3%) | 26 (31.7%) |
| Graduate Degree | 168 (100.0%) | 0 (0.0%) |
| Total | 443 (88.4%) | 58 (11.6%) |
Employment Characteristics in Annapolis
Employment by Class of Employer in Annapolis
Among the 21,002 employed individuals in Annapolis, private company employees (11,796 | 56.2%), not-for-profit organizations (2,018 | 9.6%), and federal government employees (1,999 | 9.5%) make up the most common classes of employment.
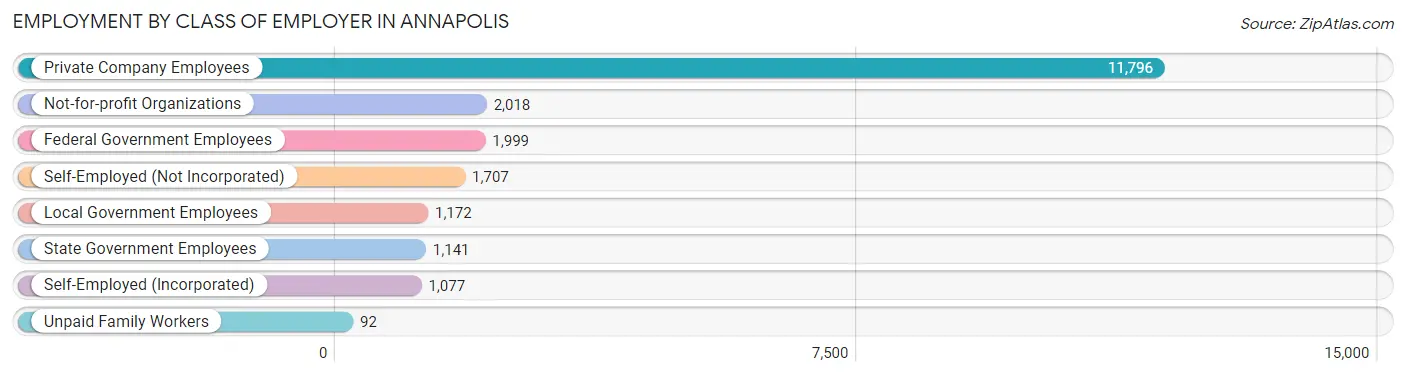
| Employer Class | # Employees | % Employees |
| Private Company Employees | 11,796 | 56.2% |
| Self-Employed (Incorporated) | 1,077 | 5.1% |
| Self-Employed (Not Incorporated) | 1,707 | 8.1% |
| Not-for-profit Organizations | 2,018 | 9.6% |
| Local Government Employees | 1,172 | 5.6% |
| State Government Employees | 1,141 | 5.4% |
| Federal Government Employees | 1,999 | 9.5% |
| Unpaid Family Workers | 92 | 0.4% |
| Total | 21,002 | 100.0% |
Employment Status by Age in Annapolis
According to the labor force statistics for Annapolis, out of the total population over 16 years of age (32,310), 68.1% or 22,003 individuals are in the labor force, with 4.3% or 946 of them unemployed. The age group with the highest labor force participation rate is 35 to 44 years, with 90.7% or 4,873 individuals in the labor force. Within the labor force, the 75 years and over age range has the highest percentage of unemployed individuals, with 9.7% or 37 of them being unemployed.
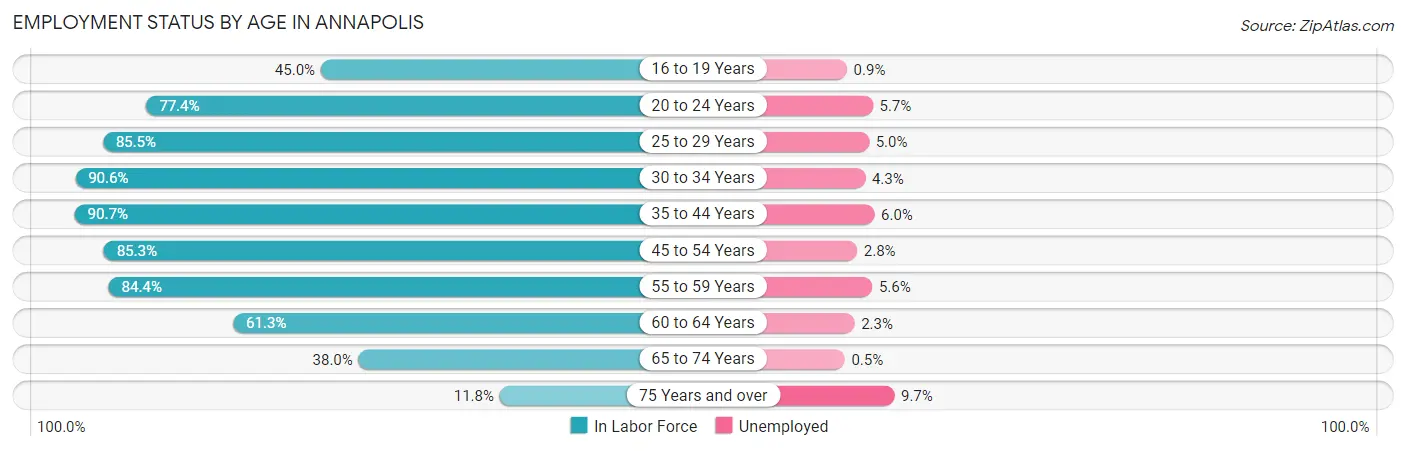
| Age Bracket | In Labor Force | Unemployed |
| 16 to 19 Years | 783 (45.0%) | 7 (0.9%) |
| 20 to 24 Years | 2,068 (77.4%) | 118 (5.7%) |
| 25 to 29 Years | 2,067 (85.5%) | 103 (5.0%) |
| 30 to 34 Years | 2,825 (90.6%) | 121 (4.3%) |
| 35 to 44 Years | 4,873 (90.7%) | 292 (6.0%) |
| 45 to 54 Years | 3,537 (85.3%) | 99 (2.8%) |
| 55 to 59 Years | 2,197 (84.4%) | 123 (5.6%) |
| 60 to 64 Years | 1,642 (61.3%) | 38 (2.3%) |
| 65 to 74 Years | 1,645 (38.0%) | 8 (0.5%) |
| 75 Years and over | 381 (11.8%) | 37 (9.7%) |
| Total | 22,003 (68.1%) | 946 (4.3%) |
Employment Status by Educational Attainment in Annapolis
According to labor force statistics for Annapolis, 84.3% of individuals (17,143) out of the total population between 25 and 64 years of age (20,336) are in the labor force, with 4.5% or 771 of them being unemployed. The group with the highest labor force participation rate are those with the educational attainment of bachelor's degree or higher, with 87.9% or 9,291 individuals in the labor force. Within the labor force, individuals with high school diploma education have the highest percentage of unemployment, with 10.3% or 251 of them being unemployed.
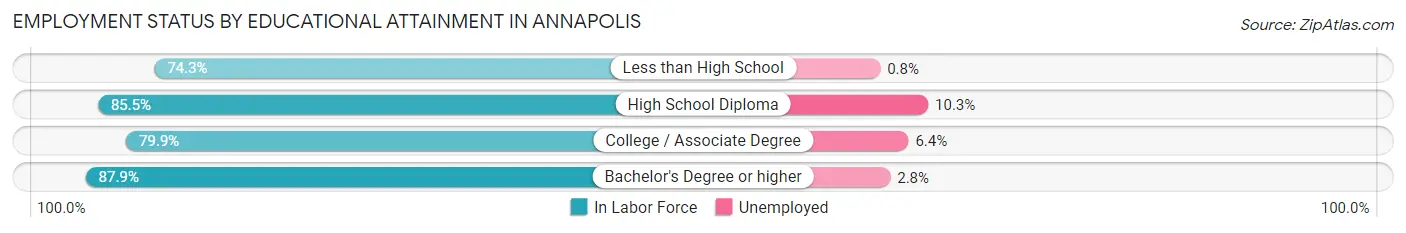
| Educational Attainment | In Labor Force | Unemployed |
| Less than High School | 1,528 (74.3%) | 16 (0.8%) |
| High School Diploma | 2,440 (85.5%) | 294 (10.3%) |
| College / Associate Degree | 3,880 (79.9%) | 311 (6.4%) |
| Bachelor's Degree or higher | 9,291 (87.9%) | 296 (2.8%) |
| Total | 17,143 (84.3%) | 915 (4.5%) |
Employment Occupations by Sex in Annapolis
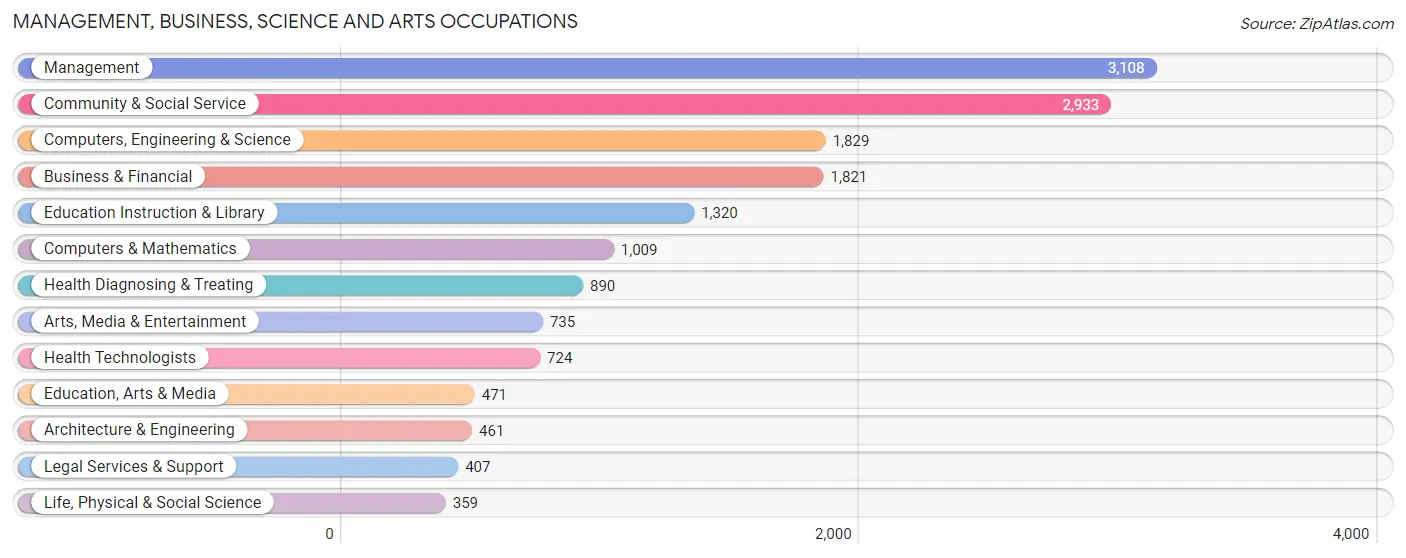
Management, Business, Science and Arts Occupations
The most common Management, Business, Science and Arts occupations in Annapolis are Management (3,108 | 15.0%), Community & Social Service (2,933 | 14.1%), Computers, Engineering & Science (1,829 | 8.8%), Business & Financial (1,821 | 8.8%), and Education Instruction & Library (1,320 | 6.4%).
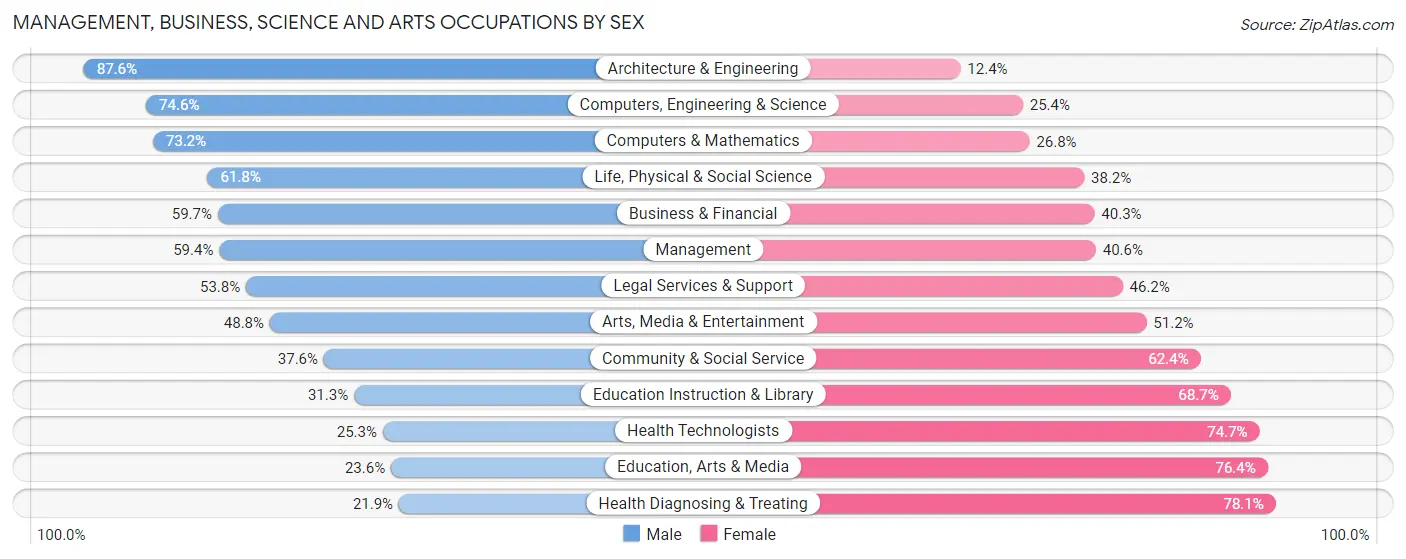
Management, Business, Science and Arts Occupations by Sex
Within the Management, Business, Science and Arts occupations in Annapolis, the most male-oriented occupations are Architecture & Engineering (87.6%), Computers, Engineering & Science (74.6%), and Computers & Mathematics (73.2%), while the most female-oriented occupations are Health Diagnosing & Treating (78.1%), Education, Arts & Media (76.4%), and Health Technologists (74.7%).
| Occupation | Male | Female |
| Management | 1,846 (59.4%) | 1,262 (40.6%) |
| Business & Financial | 1,087 (59.7%) | 734 (40.3%) |
| Computers, Engineering & Science | 1,365 (74.6%) | 464 (25.4%) |
| Computers & Mathematics | 739 (73.2%) | 270 (26.8%) |
| Architecture & Engineering | 404 (87.6%) | 57 (12.4%) |
| Life, Physical & Social Science | 222 (61.8%) | 137 (38.2%) |
| Community & Social Service | 1,102 (37.6%) | 1,831 (62.4%) |
| Education, Arts & Media | 111 (23.6%) | 360 (76.4%) |
| Legal Services & Support | 219 (53.8%) | 188 (46.2%) |
| Education Instruction & Library | 413 (31.3%) | 907 (68.7%) |
| Arts, Media & Entertainment | 359 (48.8%) | 376 (51.2%) |
| Health Diagnosing & Treating | 195 (21.9%) | 695 (78.1%) |
| Health Technologists | 183 (25.3%) | 541 (74.7%) |
| Total (Category) | 5,595 (52.9%) | 4,986 (47.1%) |
| Total (Overall) | 10,762 (51.9%) | 9,986 (48.1%) |
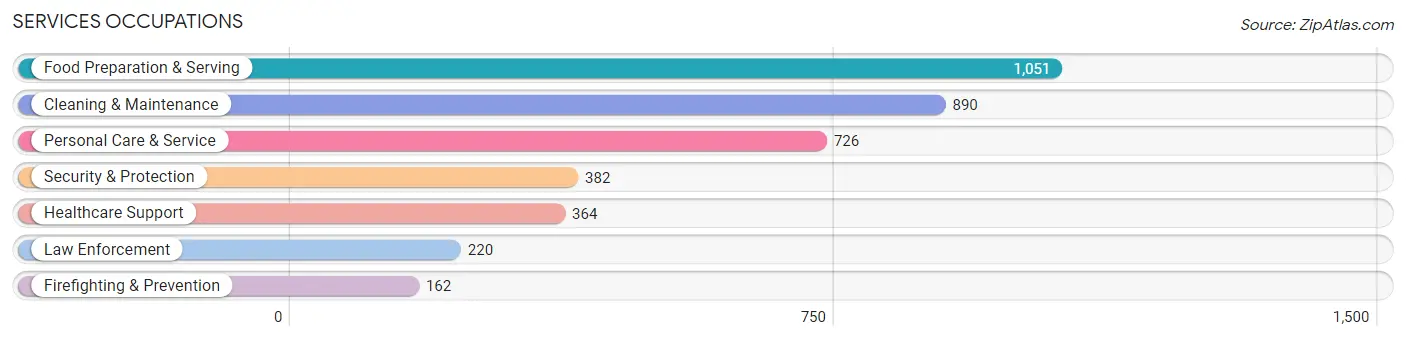
Services Occupations
The most common Services occupations in Annapolis are Food Preparation & Serving (1,051 | 5.1%), Cleaning & Maintenance (890 | 4.3%), Personal Care & Service (726 | 3.5%), Security & Protection (382 | 1.8%), and Healthcare Support (364 | 1.8%).
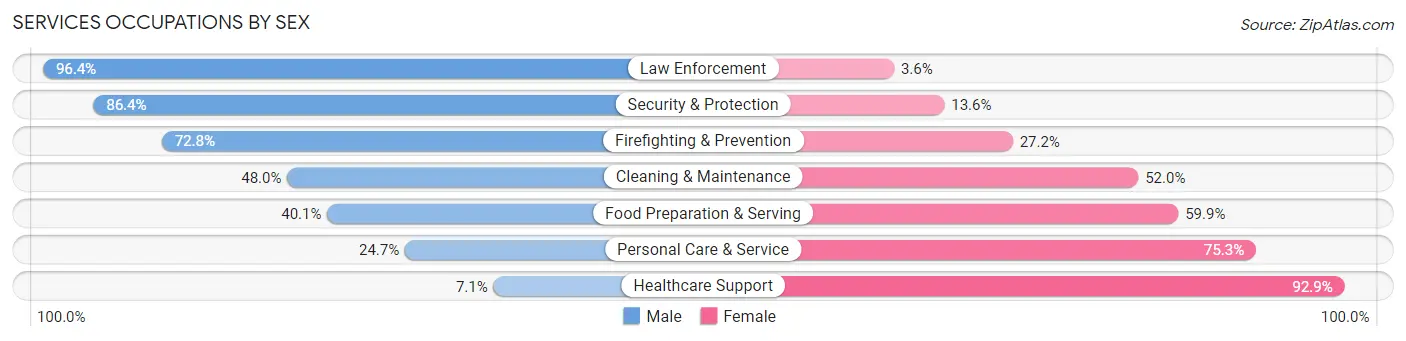
Services Occupations by Sex
Within the Services occupations in Annapolis, the most male-oriented occupations are Law Enforcement (96.4%), Security & Protection (86.4%), and Firefighting & Prevention (72.8%), while the most female-oriented occupations are Healthcare Support (92.9%), Personal Care & Service (75.3%), and Food Preparation & Serving (59.9%).
| Occupation | Male | Female |
| Healthcare Support | 26 (7.1%) | 338 (92.9%) |
| Security & Protection | 330 (86.4%) | 52 (13.6%) |
| Firefighting & Prevention | 118 (72.8%) | 44 (27.2%) |
| Law Enforcement | 212 (96.4%) | 8 (3.6%) |
| Food Preparation & Serving | 421 (40.1%) | 630 (59.9%) |
| Cleaning & Maintenance | 427 (48.0%) | 463 (52.0%) |
| Personal Care & Service | 179 (24.7%) | 547 (75.3%) |
| Total (Category) | 1,383 (40.5%) | 2,030 (59.5%) |
| Total (Overall) | 10,762 (51.9%) | 9,986 (48.1%) |
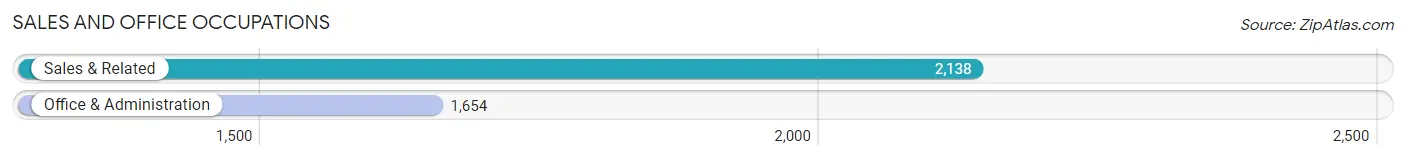
Sales and Office Occupations
The most common Sales and Office occupations in Annapolis are Sales & Related (2,138 | 10.3%), and Office & Administration (1,654 | 8.0%).
Sales and Office Occupations by Sex
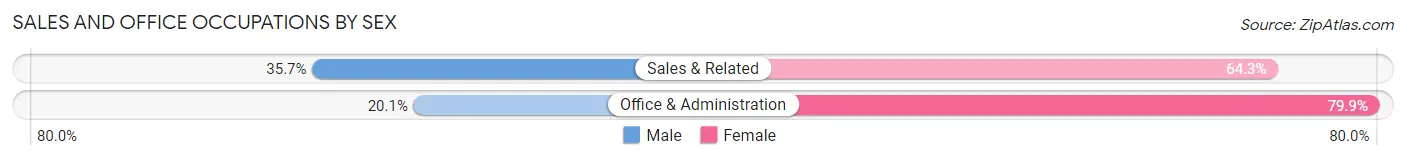
| Occupation | Male | Female |
| Sales & Related | 764 (35.7%) | 1,374 (64.3%) |
| Office & Administration | 333 (20.1%) | 1,321 (79.9%) |
| Total (Category) | 1,097 (28.9%) | 2,695 (71.1%) |
| Total (Overall) | 10,762 (51.9%) | 9,986 (48.1%) |
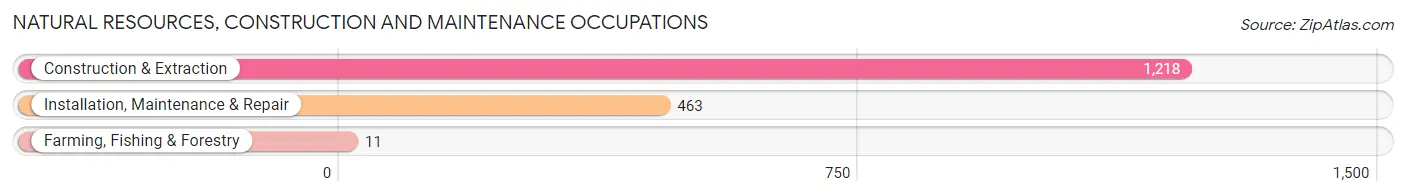
Natural Resources, Construction and Maintenance Occupations
The most common Natural Resources, Construction and Maintenance occupations in Annapolis are Construction & Extraction (1,218 | 5.9%), Installation, Maintenance & Repair (463 | 2.2%), and Farming, Fishing & Forestry (11 | 0.1%).
Natural Resources, Construction and Maintenance Occupations by Sex
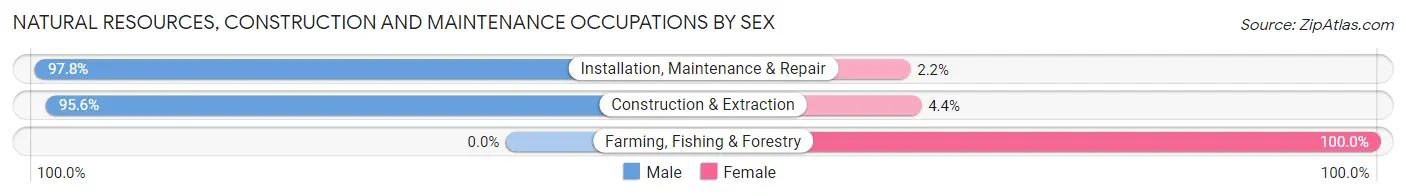
| Occupation | Male | Female |
| Farming, Fishing & Forestry | 0 (0.0%) | 11 (100.0%) |
| Construction & Extraction | 1,164 (95.6%) | 54 (4.4%) |
| Installation, Maintenance & Repair | 453 (97.8%) | 10 (2.2%) |
| Total (Category) | 1,617 (95.6%) | 75 (4.4%) |
| Total (Overall) | 10,762 (51.9%) | 9,986 (48.1%) |
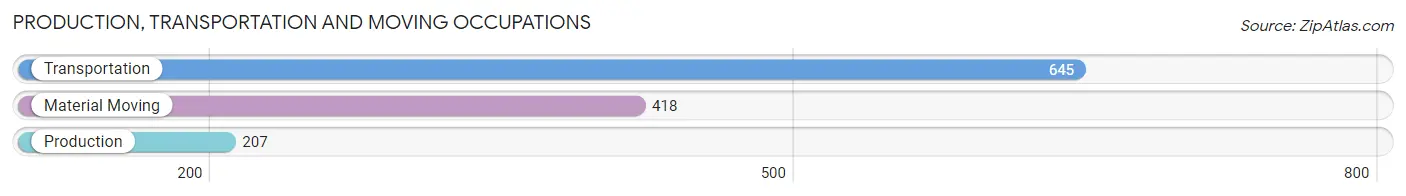
Production, Transportation and Moving Occupations
The most common Production, Transportation and Moving occupations in Annapolis are Transportation (645 | 3.1%), Material Moving (418 | 2.0%), and Production (207 | 1.0%).
Production, Transportation and Moving Occupations by Sex
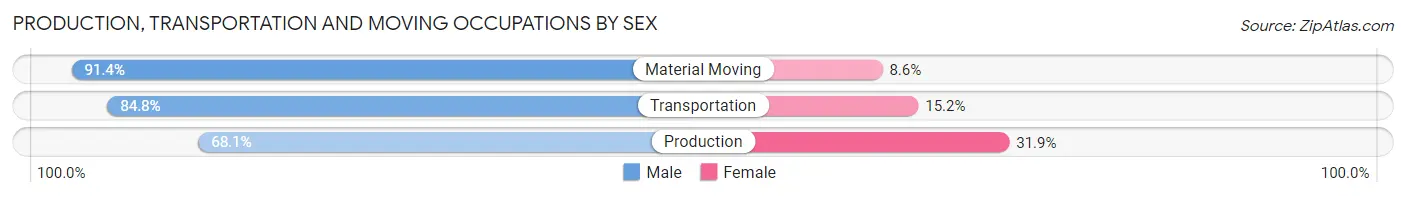
| Occupation | Male | Female |
| Production | 141 (68.1%) | 66 (31.9%) |
| Transportation | 547 (84.8%) | 98 (15.2%) |
| Material Moving | 382 (91.4%) | 36 (8.6%) |
| Total (Category) | 1,070 (84.3%) | 200 (15.8%) |
| Total (Overall) | 10,762 (51.9%) | 9,986 (48.1%) |
Employment Industries by Sex in Annapolis
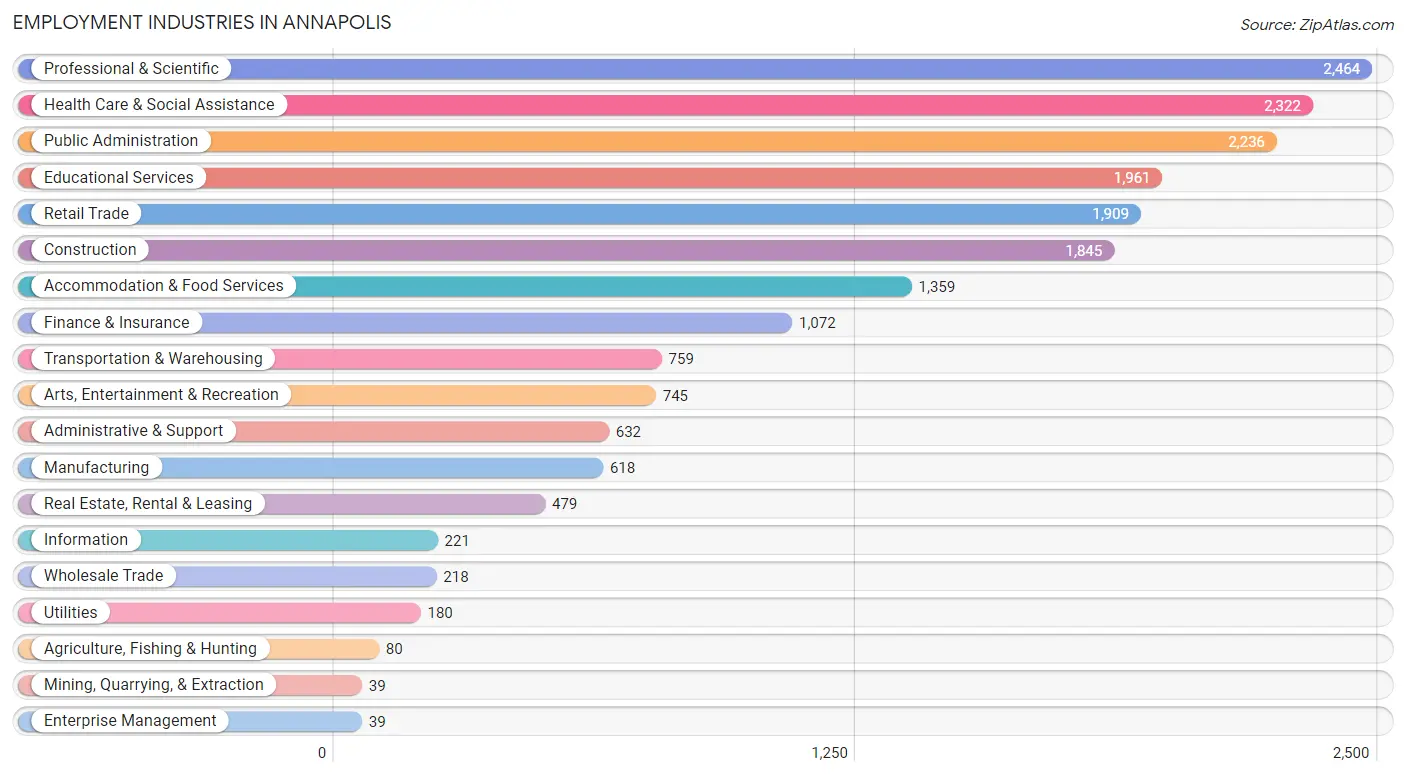
Employment Industries in Annapolis
The major employment industries in Annapolis include Professional & Scientific (2,464 | 11.9%), Health Care & Social Assistance (2,322 | 11.2%), Public Administration (2,236 | 10.8%), Educational Services (1,961 | 9.5%), and Retail Trade (1,909 | 9.2%).
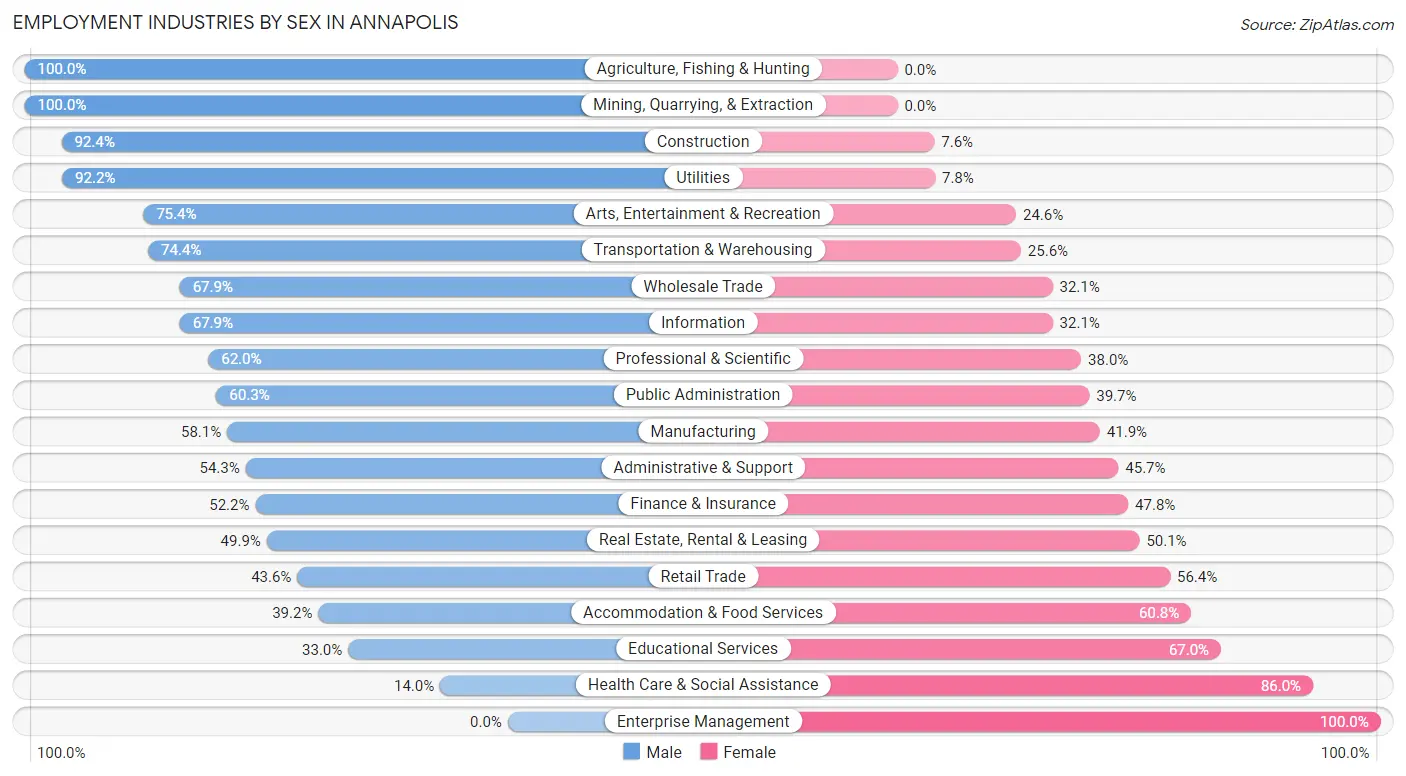
Employment Industries by Sex in Annapolis
The Annapolis industries that see more men than women are Agriculture, Fishing & Hunting (100.0%), Mining, Quarrying, & Extraction (100.0%), and Construction (92.4%), whereas the industries that tend to have a higher number of women are Enterprise Management (100.0%), Health Care & Social Assistance (86.0%), and Educational Services (67.0%).
| Industry | Male | Female |
| Agriculture, Fishing & Hunting | 80 (100.0%) | 0 (0.0%) |
| Mining, Quarrying, & Extraction | 39 (100.0%) | 0 (0.0%) |
| Construction | 1,704 (92.4%) | 141 (7.6%) |
| Manufacturing | 359 (58.1%) | 259 (41.9%) |
| Wholesale Trade | 148 (67.9%) | 70 (32.1%) |
| Retail Trade | 832 (43.6%) | 1,077 (56.4%) |
| Transportation & Warehousing | 565 (74.4%) | 194 (25.6%) |
| Utilities | 166 (92.2%) | 14 (7.8%) |
| Information | 150 (67.9%) | 71 (32.1%) |
| Finance & Insurance | 560 (52.2%) | 512 (47.8%) |
| Real Estate, Rental & Leasing | 239 (49.9%) | 240 (50.1%) |
| Professional & Scientific | 1,527 (62.0%) | 937 (38.0%) |
| Enterprise Management | 0 (0.0%) | 39 (100.0%) |
| Administrative & Support | 343 (54.3%) | 289 (45.7%) |
| Educational Services | 648 (33.0%) | 1,313 (67.0%) |
| Health Care & Social Assistance | 325 (14.0%) | 1,997 (86.0%) |
| Arts, Entertainment & Recreation | 562 (75.4%) | 183 (24.6%) |
| Accommodation & Food Services | 533 (39.2%) | 826 (60.8%) |
| Public Administration | 1,348 (60.3%) | 888 (39.7%) |
| Total | 10,762 (51.9%) | 9,986 (48.1%) |
Education in Annapolis
School Enrollment in Annapolis
The most common levels of schooling among the 9,593 students in Annapolis are middle school (2,154 | 22.5%), elementary school (1,733 | 18.1%), and college / undergraduate (1,692 | 17.6%).
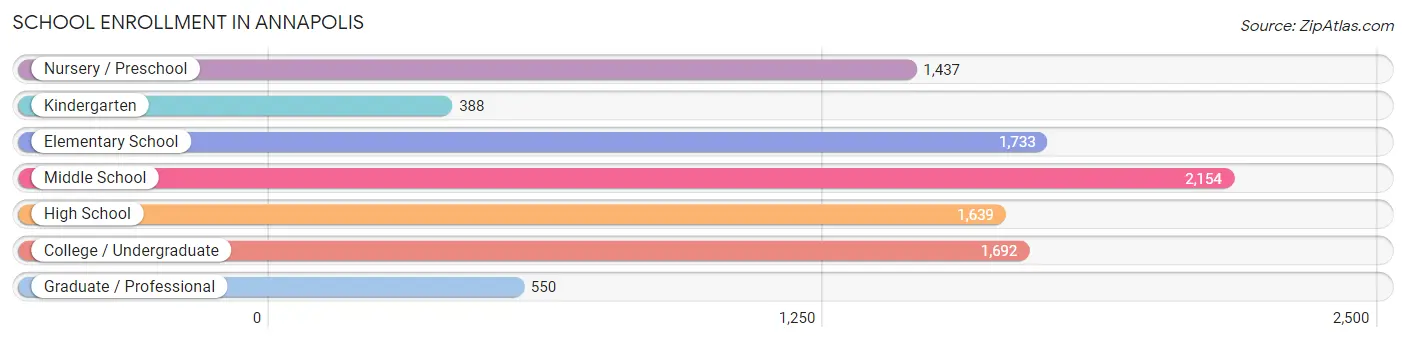
| School Level | # Students | % Students |
| Nursery / Preschool | 1,437 | 15.0% |
| Kindergarten | 388 | 4.0% |
| Elementary School | 1,733 | 18.1% |
| Middle School | 2,154 | 22.5% |
| High School | 1,639 | 17.1% |
| College / Undergraduate | 1,692 | 17.6% |
| Graduate / Professional | 550 | 5.7% |
| Total | 9,593 | 100.0% |
School Enrollment by Age by Funding Source in Annapolis
Out of a total of 9,593 students who are enrolled in schools in Annapolis, 2,552 (26.6%) attend a private institution, while the remaining 7,041 (73.4%) are enrolled in public schools. The age group of 20 to 24 year olds has the highest likelihood of being enrolled in private schools, with 442 (55.9% in the age bracket) enrolled. Conversely, the age group of 18 to 19 year olds has the lowest likelihood of being enrolled in a private school, with 455 (84.0% in the age bracket) attending a public institution.
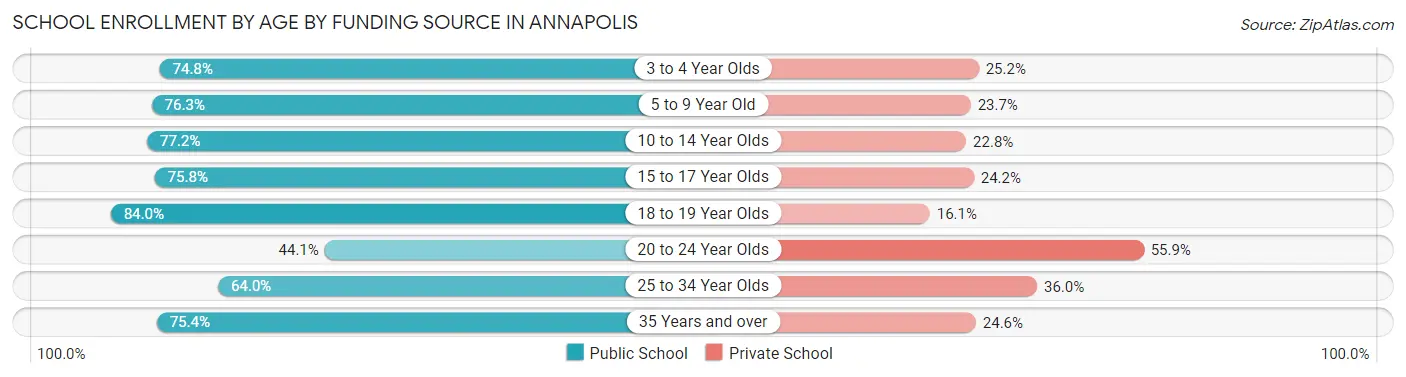
| Age Bracket | Public School | Private School |
| 3 to 4 Year Olds | 809 (74.8%) | 272 (25.2%) |
| 5 to 9 Year Old | 1,636 (76.3%) | 507 (23.7%) |
| 10 to 14 Year Olds | 1,946 (77.2%) | 575 (22.8%) |
| 15 to 17 Year Olds | 1,107 (75.8%) | 354 (24.2%) |
| 18 to 19 Year Olds | 455 (84.0%) | 87 (16.1%) |
| 20 to 24 Year Olds | 349 (44.1%) | 442 (55.9%) |
| 25 to 34 Year Olds | 334 (64.0%) | 188 (36.0%) |
| 35 Years and over | 401 (75.4%) | 131 (24.6%) |
| Total | 7,041 (73.4%) | 2,552 (26.6%) |
Educational Attainment by Field of Study in Annapolis
Business (2,399 | 15.4%), social sciences (2,024 | 13.0%), engineering (1,341 | 8.6%), education (1,296 | 8.3%), and literature & languages (1,206 | 7.7%) are the most common fields of study among 15,607 individuals in Annapolis who have obtained a bachelor's degree or higher.
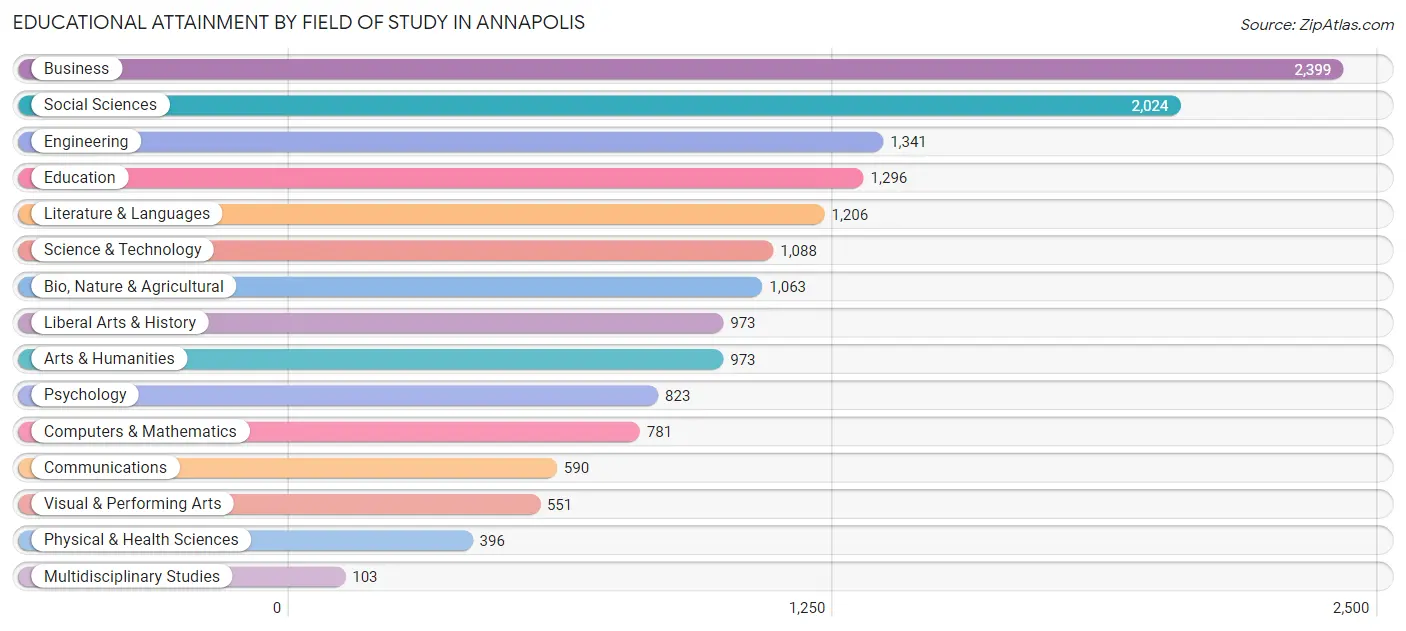
| Field of Study | # Graduates | % Graduates |
| Computers & Mathematics | 781 | 5.0% |
| Bio, Nature & Agricultural | 1,063 | 6.8% |
| Physical & Health Sciences | 396 | 2.5% |
| Psychology | 823 | 5.3% |
| Social Sciences | 2,024 | 13.0% |
| Engineering | 1,341 | 8.6% |
| Multidisciplinary Studies | 103 | 0.7% |
| Science & Technology | 1,088 | 7.0% |
| Business | 2,399 | 15.4% |
| Education | 1,296 | 8.3% |
| Literature & Languages | 1,206 | 7.7% |
| Liberal Arts & History | 973 | 6.2% |
| Visual & Performing Arts | 551 | 3.5% |
| Communications | 590 | 3.8% |
| Arts & Humanities | 973 | 6.2% |
| Total | 15,607 | 100.0% |
Transportation & Commute in Annapolis
Vehicle Availability by Sex in Annapolis
The most prevalent vehicle ownership categories in Annapolis are males with 2 vehicles (4,634, accounting for 42.1%) and females with 2 vehicles (4,189, making up 46.7%).
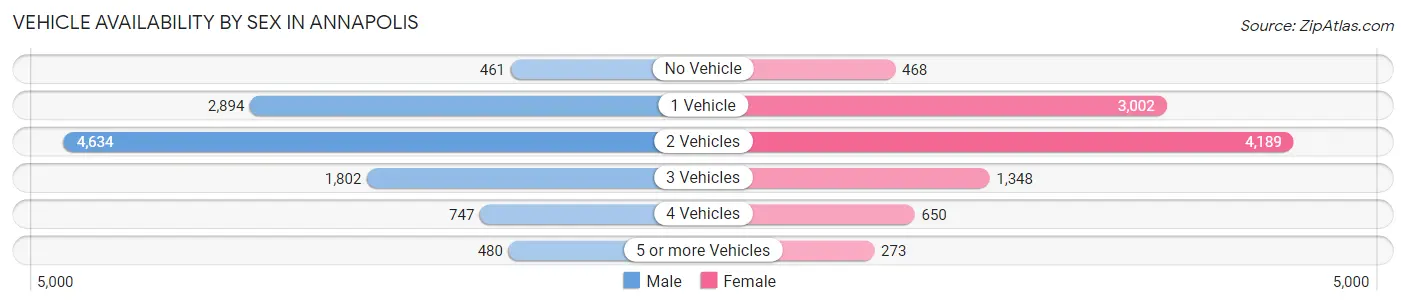
| Vehicles Available | Male | Female |
| No Vehicle | 461 (4.2%) | 468 (4.7%) |
| 1 Vehicle | 2,894 (26.3%) | 3,002 (30.2%) |
| 2 Vehicles | 4,634 (42.1%) | 4,189 (42.2%) |
| 3 Vehicles | 1,802 (16.4%) | 1,348 (13.6%) |
| 4 Vehicles | 747 (6.8%) | 650 (6.6%) |
| 5 or more Vehicles | 480 (4.4%) | 273 (2.8%) |
| Total | 11,018 (100.0%) | 9,930 (100.0%) |
Commute Time in Annapolis
The most frequently occuring commute durations in Annapolis are 10 to 14 minutes (4,054 commuters, 22.7%), 15 to 19 minutes (1,959 commuters, 11.0%), and 45 to 59 minutes (1,901 commuters, 10.7%).
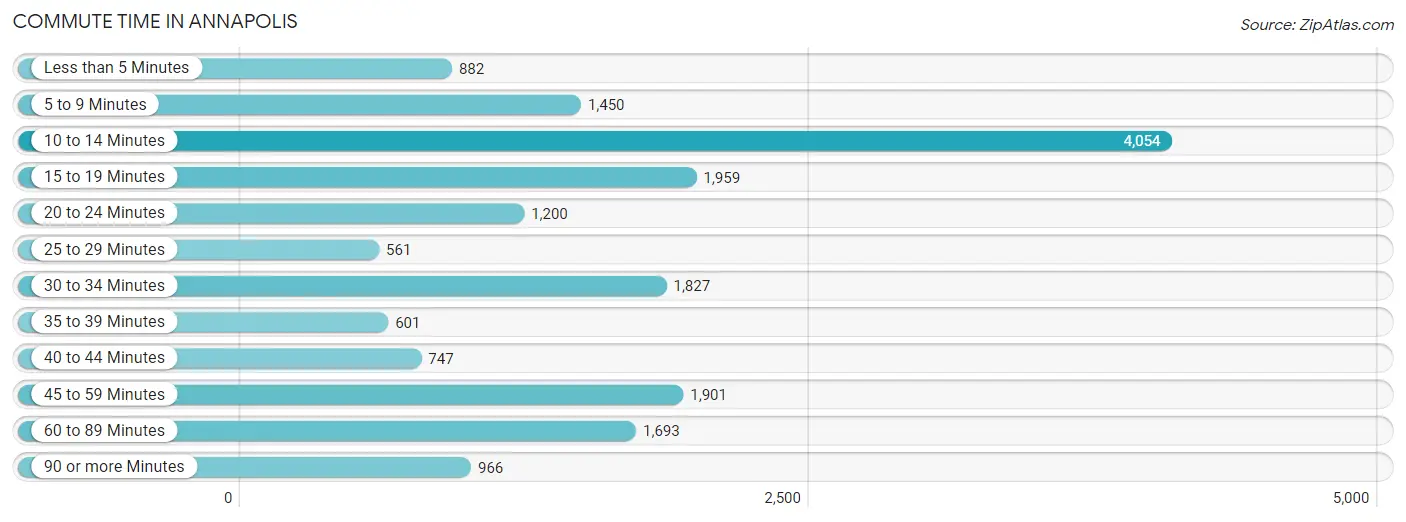
| Commute Time | # Commuters | % Commuters |
| Less than 5 Minutes | 882 | 4.9% |
| 5 to 9 Minutes | 1,450 | 8.1% |
| 10 to 14 Minutes | 4,054 | 22.7% |
| 15 to 19 Minutes | 1,959 | 11.0% |
| 20 to 24 Minutes | 1,200 | 6.7% |
| 25 to 29 Minutes | 561 | 3.1% |
| 30 to 34 Minutes | 1,827 | 10.2% |
| 35 to 39 Minutes | 601 | 3.4% |
| 40 to 44 Minutes | 747 | 4.2% |
| 45 to 59 Minutes | 1,901 | 10.7% |
| 60 to 89 Minutes | 1,693 | 9.5% |
| 90 or more Minutes | 966 | 5.4% |
Commute Time by Sex in Annapolis
The most common commute times in Annapolis are 10 to 14 minutes (1,684 commuters, 18.2%) for males and 10 to 14 minutes (2,370 commuters, 27.6%) for females.
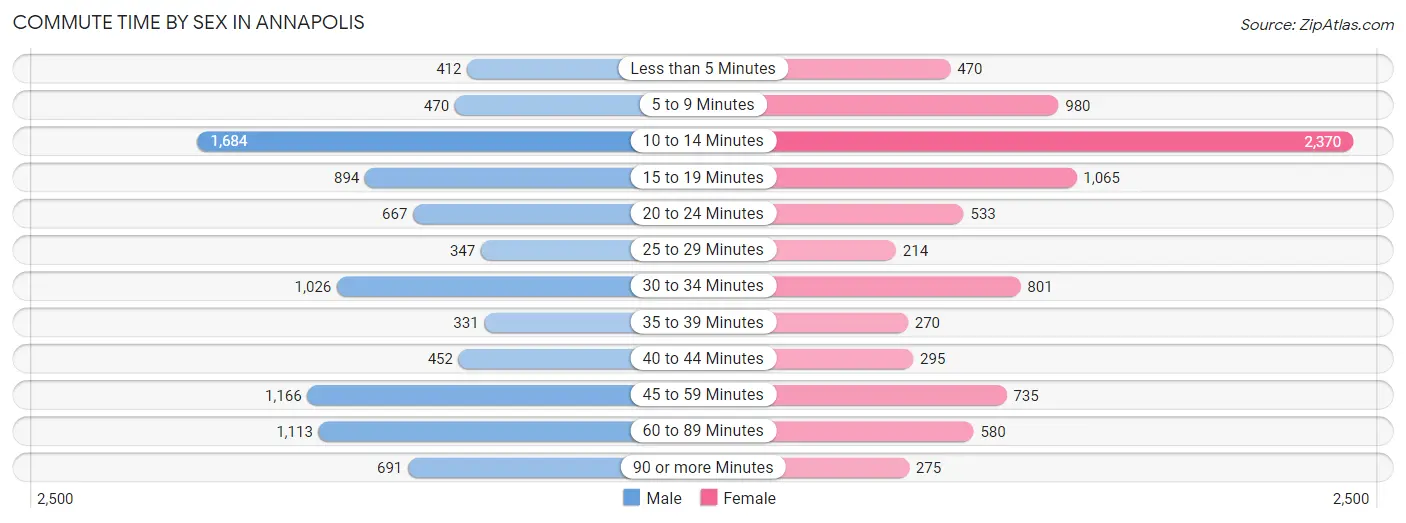
| Commute Time | Male | Female |
| Less than 5 Minutes | 412 (4.4%) | 470 (5.5%) |
| 5 to 9 Minutes | 470 (5.1%) | 980 (11.4%) |
| 10 to 14 Minutes | 1,684 (18.2%) | 2,370 (27.6%) |
| 15 to 19 Minutes | 894 (9.7%) | 1,065 (12.4%) |
| 20 to 24 Minutes | 667 (7.2%) | 533 (6.2%) |
| 25 to 29 Minutes | 347 (3.7%) | 214 (2.5%) |
| 30 to 34 Minutes | 1,026 (11.1%) | 801 (9.3%) |
| 35 to 39 Minutes | 331 (3.6%) | 270 (3.1%) |
| 40 to 44 Minutes | 452 (4.9%) | 295 (3.4%) |
| 45 to 59 Minutes | 1,166 (12.6%) | 735 (8.6%) |
| 60 to 89 Minutes | 1,113 (12.0%) | 580 (6.8%) |
| 90 or more Minutes | 691 (7.5%) | 275 (3.2%) |
Time of Departure to Work by Sex in Annapolis
The most frequent times of departure to work in Annapolis are 8:00 AM to 8:29 AM (1,469, 15.9%) for males and 8:00 AM to 8:29 AM (1,493, 17.4%) for females.
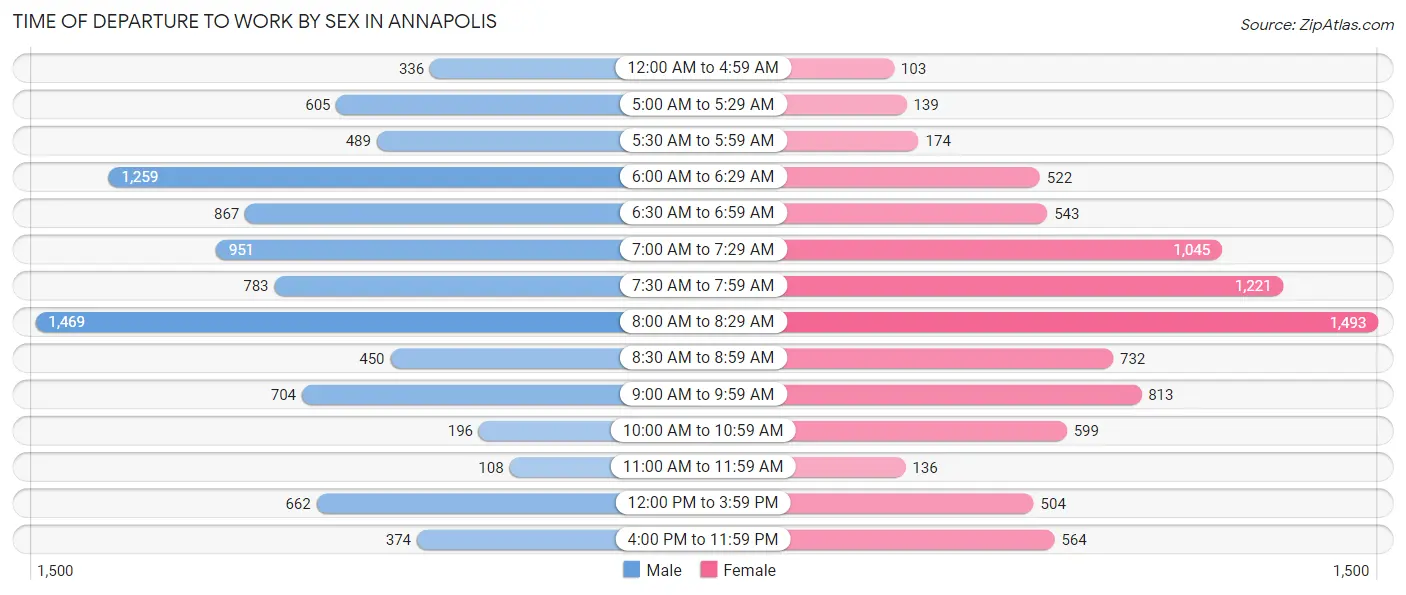
| Time of Departure | Male | Female |
| 12:00 AM to 4:59 AM | 336 (3.6%) | 103 (1.2%) |
| 5:00 AM to 5:29 AM | 605 (6.5%) | 139 (1.6%) |
| 5:30 AM to 5:59 AM | 489 (5.3%) | 174 (2.0%) |
| 6:00 AM to 6:29 AM | 1,259 (13.6%) | 522 (6.1%) |
| 6:30 AM to 6:59 AM | 867 (9.4%) | 543 (6.3%) |
| 7:00 AM to 7:29 AM | 951 (10.3%) | 1,045 (12.2%) |
| 7:30 AM to 7:59 AM | 783 (8.5%) | 1,221 (14.2%) |
| 8:00 AM to 8:29 AM | 1,469 (15.9%) | 1,493 (17.4%) |
| 8:30 AM to 8:59 AM | 450 (4.9%) | 732 (8.5%) |
| 9:00 AM to 9:59 AM | 704 (7.6%) | 813 (9.5%) |
| 10:00 AM to 10:59 AM | 196 (2.1%) | 599 (7.0%) |
| 11:00 AM to 11:59 AM | 108 (1.2%) | 136 (1.6%) |
| 12:00 PM to 3:59 PM | 662 (7.1%) | 504 (5.9%) |
| 4:00 PM to 11:59 PM | 374 (4.0%) | 564 (6.6%) |
| Total | 9,253 (100.0%) | 8,588 (100.0%) |
Housing Occupancy in Annapolis
Occupancy by Ownership in Annapolis
Of the total 16,969 dwellings in Annapolis, owner-occupied units account for 10,141 (59.8%), while renter-occupied units make up 6,828 (40.2%).
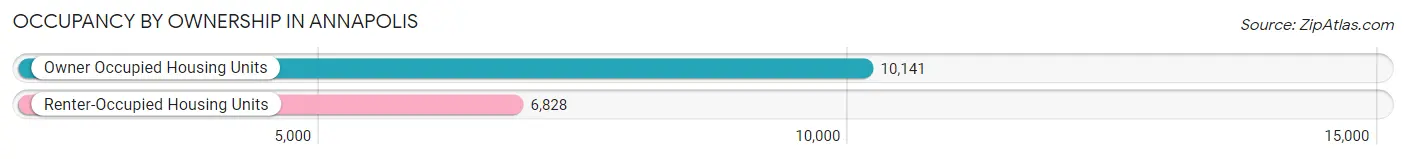
| Occupancy | # Housing Units | % Housing Units |
| Owner Occupied Housing Units | 10,141 | 59.8% |
| Renter-Occupied Housing Units | 6,828 | 40.2% |
| Total Occupied Housing Units | 16,969 | 100.0% |
Occupancy by Household Size in Annapolis
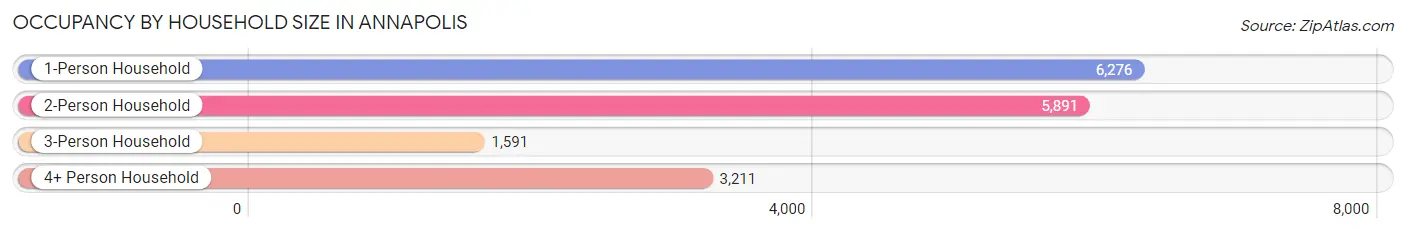
| Household Size | # Housing Units | % Housing Units |
| 1-Person Household | 6,276 | 37.0% |
| 2-Person Household | 5,891 | 34.7% |
| 3-Person Household | 1,591 | 9.4% |
| 4+ Person Household | 3,211 | 18.9% |
| Total Housing Units | 16,969 | 100.0% |
Occupancy by Ownership by Household Size in Annapolis
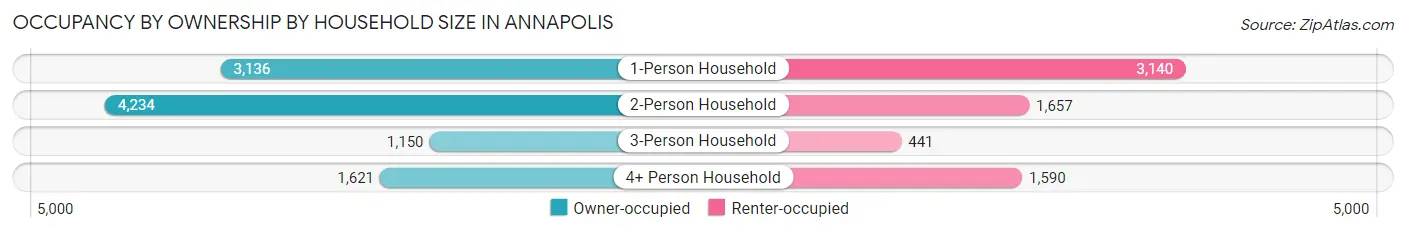
| Household Size | Owner-occupied | Renter-occupied |
| 1-Person Household | 3,136 (50.0%) | 3,140 (50.0%) |
| 2-Person Household | 4,234 (71.9%) | 1,657 (28.1%) |
| 3-Person Household | 1,150 (72.3%) | 441 (27.7%) |
| 4+ Person Household | 1,621 (50.5%) | 1,590 (49.5%) |
| Total Housing Units | 10,141 (59.8%) | 6,828 (40.2%) |
Occupancy by Educational Attainment in Annapolis
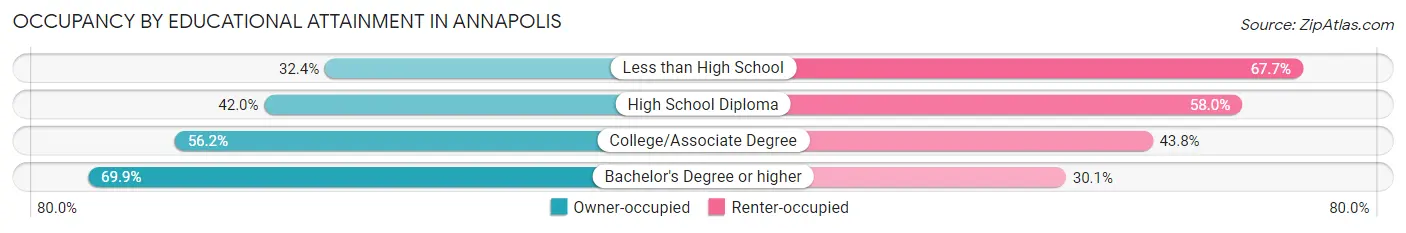
| Household Size | Owner-occupied | Renter-occupied |
| Less than High School | 450 (32.4%) | 941 (67.6%) |
| High School Diploma | 956 (42.0%) | 1,322 (58.0%) |
| College/Associate Degree | 2,308 (56.2%) | 1,800 (43.8%) |
| Bachelor's Degree or higher | 6,427 (69.9%) | 2,765 (30.1%) |
Occupancy by Age of Householder in Annapolis
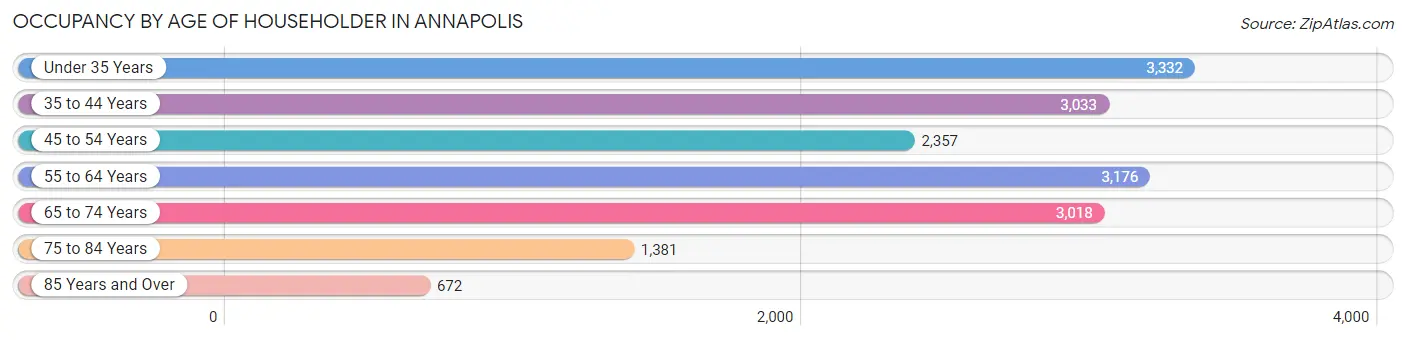
| Age Bracket | # Households | % Households |
| Under 35 Years | 3,332 | 19.6% |
| 35 to 44 Years | 3,033 | 17.9% |
| 45 to 54 Years | 2,357 | 13.9% |
| 55 to 64 Years | 3,176 | 18.7% |
| 65 to 74 Years | 3,018 | 17.8% |
| 75 to 84 Years | 1,381 | 8.1% |
| 85 Years and Over | 672 | 4.0% |
| Total | 16,969 | 100.0% |
Housing Finances in Annapolis
Median Income by Occupancy in Annapolis
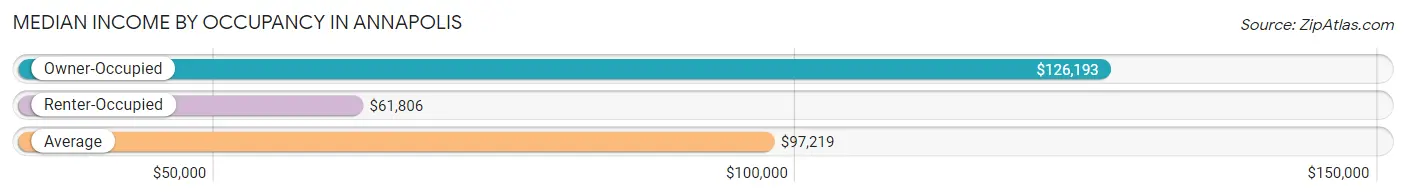
| Occupancy Type | # Households | Median Income |
| Owner-Occupied | 10,141 (59.8%) | $126,193 |
| Renter-Occupied | 6,828 (40.2%) | $61,806 |
| Average | 16,969 (100.0%) | $97,219 |
Occupancy by Householder Income Bracket in Annapolis
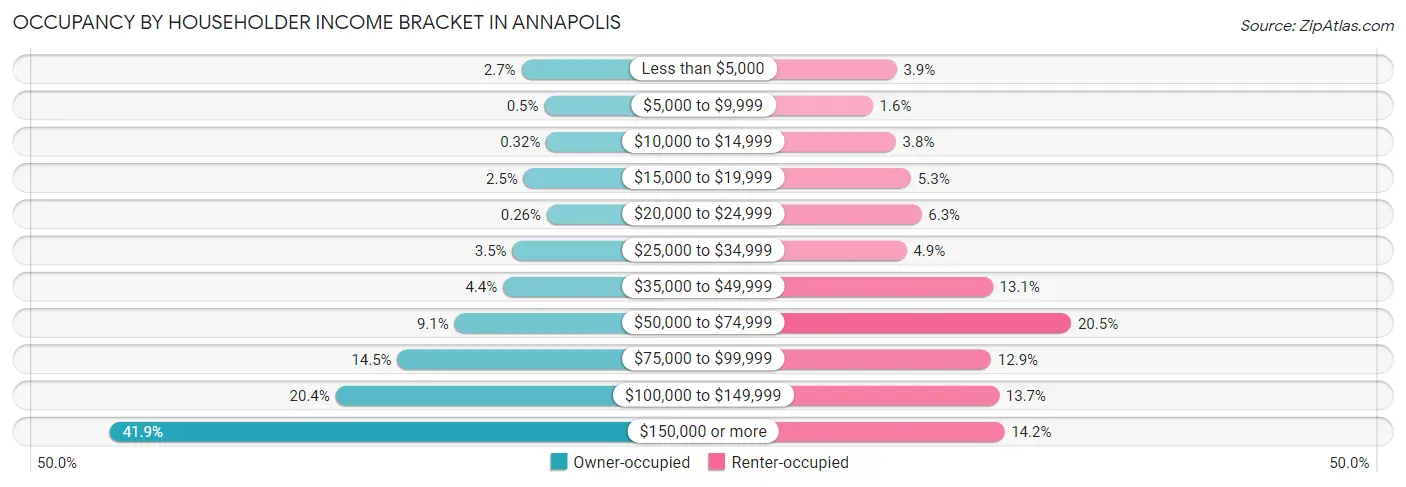
| Income Bracket | Owner-occupied | Renter-occupied |
| Less than $5,000 | 272 (2.7%) | 266 (3.9%) |
| $5,000 to $9,999 | 51 (0.5%) | 111 (1.6%) |
| $10,000 to $14,999 | 32 (0.3%) | 261 (3.8%) |
| $15,000 to $19,999 | 250 (2.5%) | 360 (5.3%) |
| $20,000 to $24,999 | 26 (0.3%) | 428 (6.3%) |
| $25,000 to $34,999 | 359 (3.5%) | 331 (4.9%) |
| $35,000 to $49,999 | 449 (4.4%) | 891 (13.1%) |
| $50,000 to $74,999 | 918 (9.0%) | 1,401 (20.5%) |
| $75,000 to $99,999 | 1,469 (14.5%) | 880 (12.9%) |
| $100,000 to $149,999 | 2,067 (20.4%) | 932 (13.7%) |
| $150,000 or more | 4,248 (41.9%) | 967 (14.2%) |
| Total | 10,141 (100.0%) | 6,828 (100.0%) |
Monthly Housing Cost Tiers in Annapolis
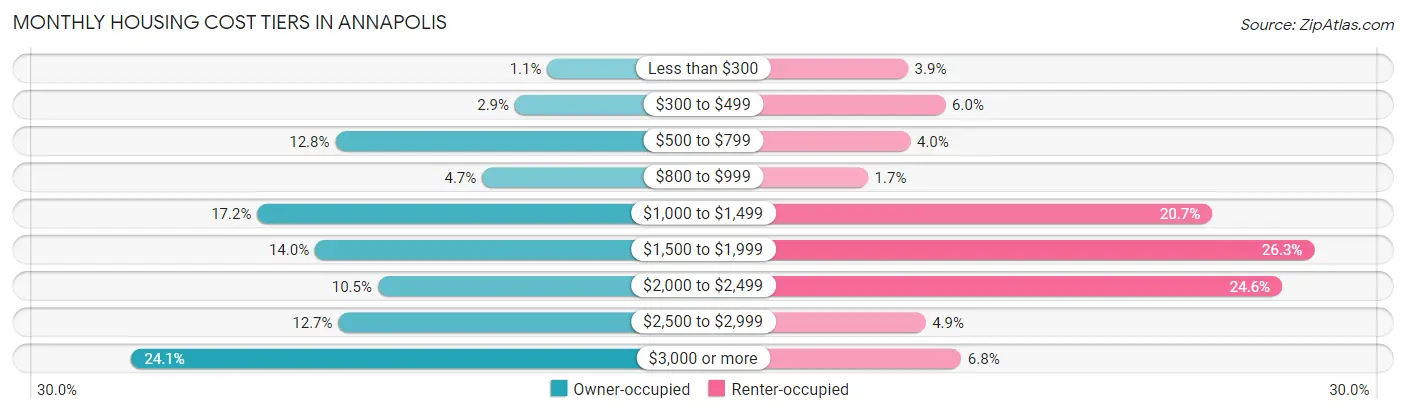
| Monthly Cost | Owner-occupied | Renter-occupied |
| Less than $300 | 115 (1.1%) | 265 (3.9%) |
| $300 to $499 | 296 (2.9%) | 406 (5.9%) |
| $500 to $799 | 1,302 (12.8%) | 274 (4.0%) |
| $800 to $999 | 480 (4.7%) | 114 (1.7%) |
| $1,000 to $1,499 | 1,739 (17.2%) | 1,413 (20.7%) |
| $1,500 to $1,999 | 1,416 (14.0%) | 1,798 (26.3%) |
| $2,000 to $2,499 | 1,064 (10.5%) | 1,676 (24.5%) |
| $2,500 to $2,999 | 1,285 (12.7%) | 331 (4.9%) |
| $3,000 or more | 2,444 (24.1%) | 466 (6.8%) |
| Total | 10,141 (100.0%) | 6,828 (100.0%) |
Physical Housing Characteristics in Annapolis
Housing Structures in Annapolis
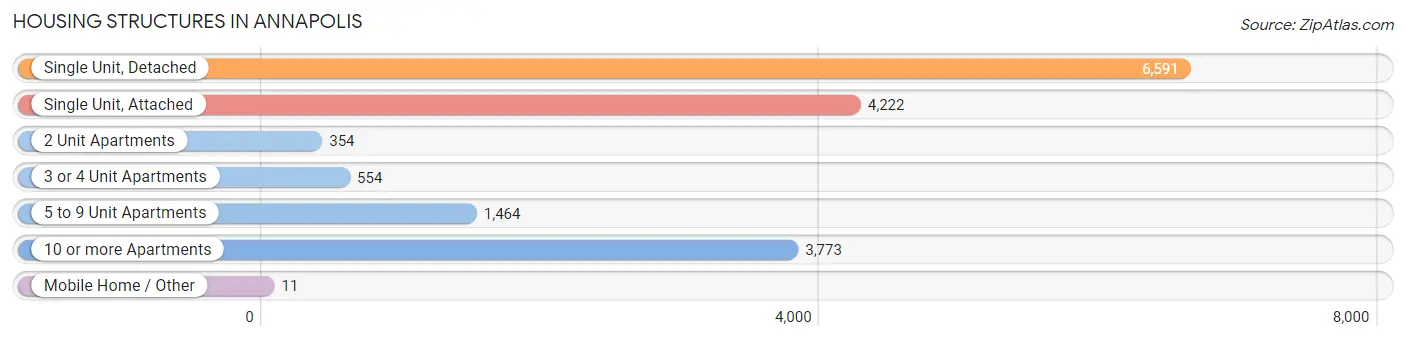
| Structure Type | # Housing Units | % Housing Units |
| Single Unit, Detached | 6,591 | 38.8% |
| Single Unit, Attached | 4,222 | 24.9% |
| 2 Unit Apartments | 354 | 2.1% |
| 3 or 4 Unit Apartments | 554 | 3.3% |
| 5 to 9 Unit Apartments | 1,464 | 8.6% |
| 10 or more Apartments | 3,773 | 22.2% |
| Mobile Home / Other | 11 | 0.1% |
| Total | 16,969 | 100.0% |
Housing Structures by Occupancy in Annapolis
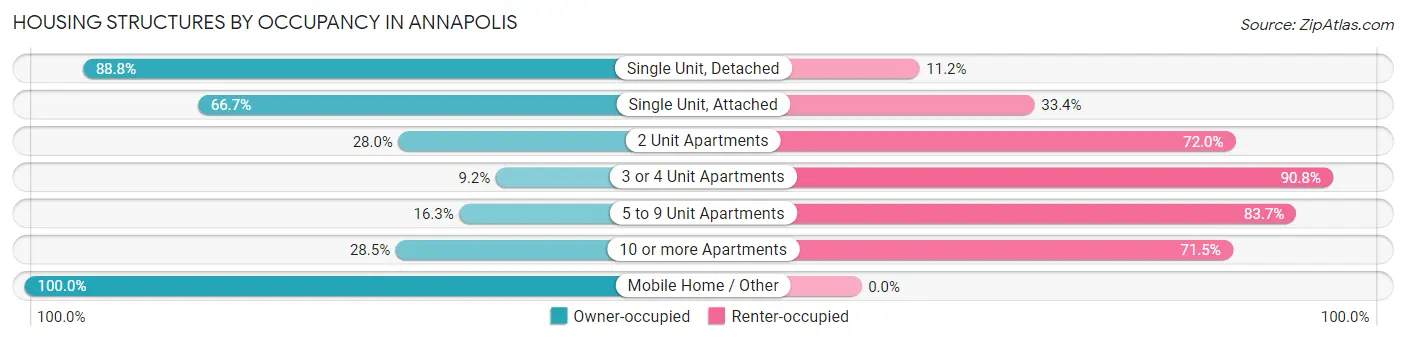
| Structure Type | Owner-occupied | Renter-occupied |
| Single Unit, Detached | 5,853 (88.8%) | 738 (11.2%) |
| Single Unit, Attached | 2,814 (66.6%) | 1,408 (33.4%) |
| 2 Unit Apartments | 99 (28.0%) | 255 (72.0%) |
| 3 or 4 Unit Apartments | 51 (9.2%) | 503 (90.8%) |
| 5 to 9 Unit Apartments | 238 (16.3%) | 1,226 (83.7%) |
| 10 or more Apartments | 1,075 (28.5%) | 2,698 (71.5%) |
| Mobile Home / Other | 11 (100.0%) | 0 (0.0%) |
| Total | 10,141 (59.8%) | 6,828 (40.2%) |
Housing Structures by Number of Rooms in Annapolis
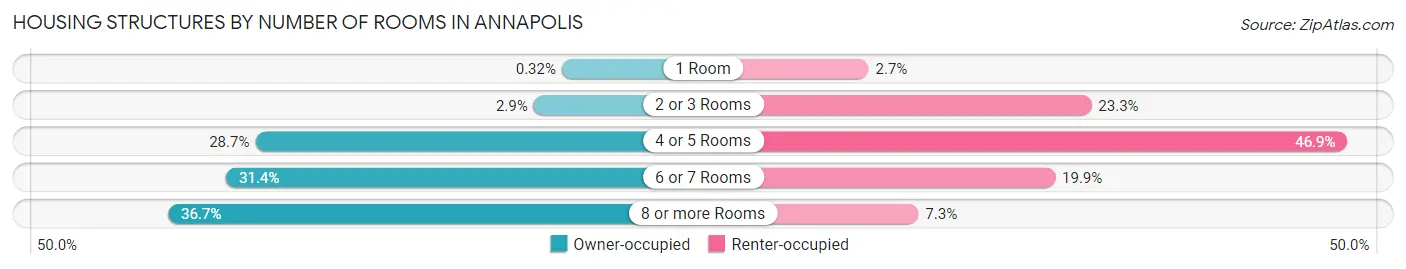
| Number of Rooms | Owner-occupied | Renter-occupied |
| 1 Room | 32 (0.3%) | 181 (2.6%) |
| 2 or 3 Rooms | 297 (2.9%) | 1,588 (23.3%) |
| 4 or 5 Rooms | 2,907 (28.7%) | 3,204 (46.9%) |
| 6 or 7 Rooms | 3,180 (31.4%) | 1,359 (19.9%) |
| 8 or more Rooms | 3,725 (36.7%) | 496 (7.3%) |
| Total | 10,141 (100.0%) | 6,828 (100.0%) |
Housing Structure by Heating Type in Annapolis
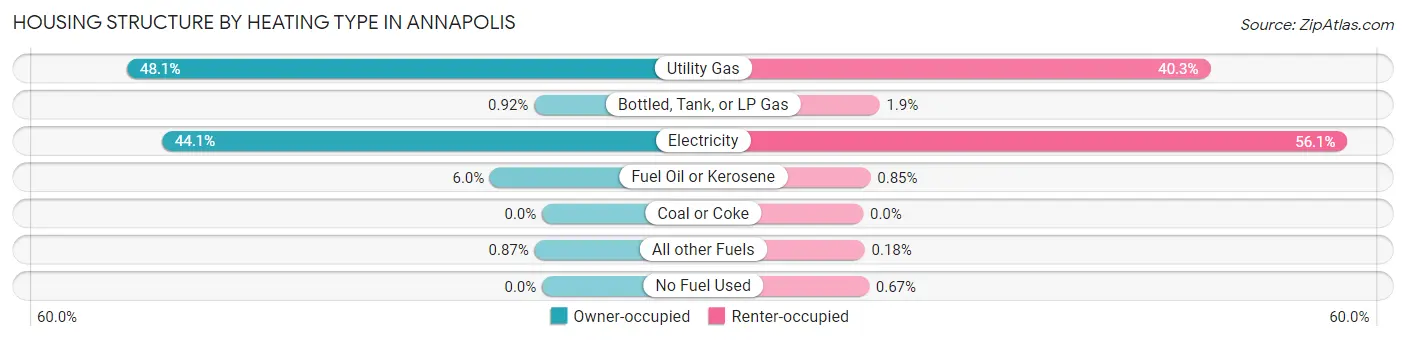
| Heating Type | Owner-occupied | Renter-occupied |
| Utility Gas | 4,879 (48.1%) | 2,749 (40.3%) |
| Bottled, Tank, or LP Gas | 93 (0.9%) | 130 (1.9%) |
| Electricity | 4,470 (44.1%) | 3,833 (56.1%) |
| Fuel Oil or Kerosene | 611 (6.0%) | 58 (0.9%) |
| Coal or Coke | 0 (0.0%) | 0 (0.0%) |
| All other Fuels | 88 (0.9%) | 12 (0.2%) |
| No Fuel Used | 0 (0.0%) | 46 (0.7%) |
| Total | 10,141 (100.0%) | 6,828 (100.0%) |
Household Vehicle Usage in Annapolis
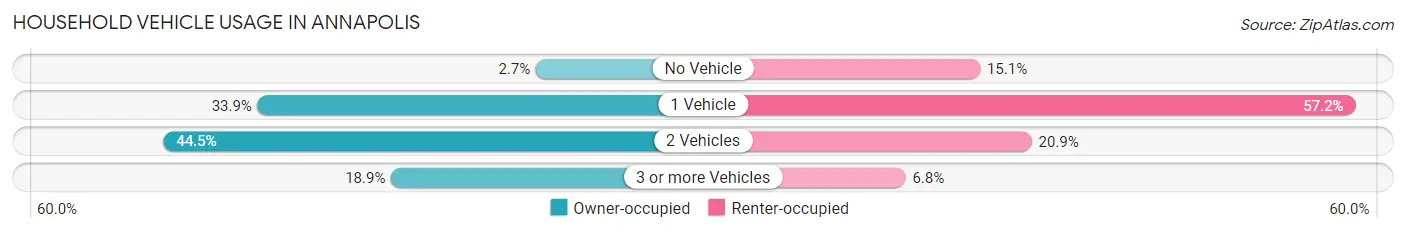
| Vehicles per Household | Owner-occupied | Renter-occupied |
| No Vehicle | 275 (2.7%) | 1,033 (15.1%) |
| 1 Vehicle | 3,437 (33.9%) | 3,904 (57.2%) |
| 2 Vehicles | 4,509 (44.5%) | 1,428 (20.9%) |
| 3 or more Vehicles | 1,920 (18.9%) | 463 (6.8%) |
| Total | 10,141 (100.0%) | 6,828 (100.0%) |
Real Estate & Mortgages in Annapolis
Real Estate and Mortgage Overview in Annapolis
| Characteristic | Without Mortgage | With Mortgage |
| Housing Units | 3,170 | 6,971 |
| Median Property Value | $463,800 | $479,000 |
| Median Household Income | $97,450 | $3,309 |
| Monthly Housing Costs | $859 | $2,309 |
| Real Estate Taxes | $4,817 | $100 |
Property Value by Mortgage Status in Annapolis
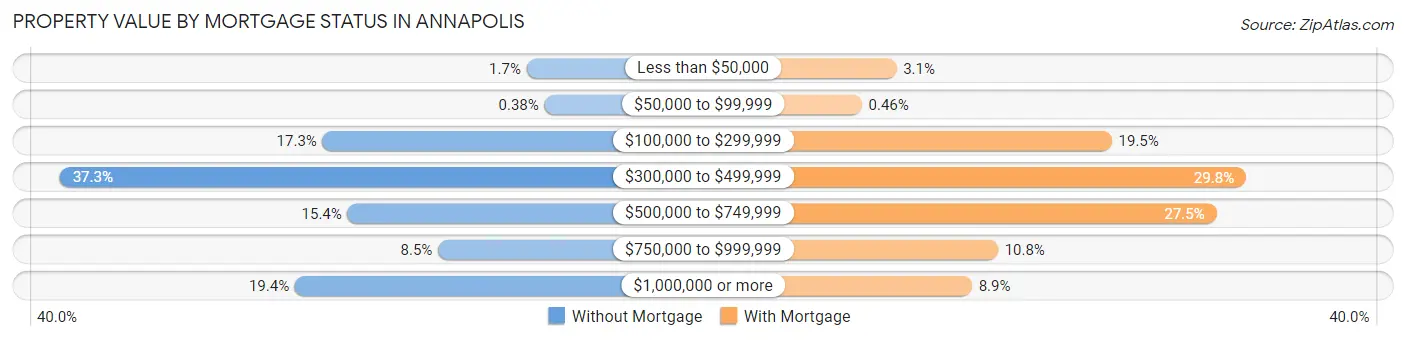
| Property Value | Without Mortgage | With Mortgage |
| Less than $50,000 | 55 (1.7%) | 216 (3.1%) |
| $50,000 to $99,999 | 12 (0.4%) | 32 (0.5%) |
| $100,000 to $299,999 | 548 (17.3%) | 1,360 (19.5%) |
| $300,000 to $499,999 | 1,183 (37.3%) | 2,074 (29.7%) |
| $500,000 to $749,999 | 488 (15.4%) | 1,917 (27.5%) |
| $750,000 to $999,999 | 269 (8.5%) | 755 (10.8%) |
| $1,000,000 or more | 615 (19.4%) | 617 (8.8%) |
| Total | 3,170 (100.0%) | 6,971 (100.0%) |
Household Income by Mortgage Status in Annapolis
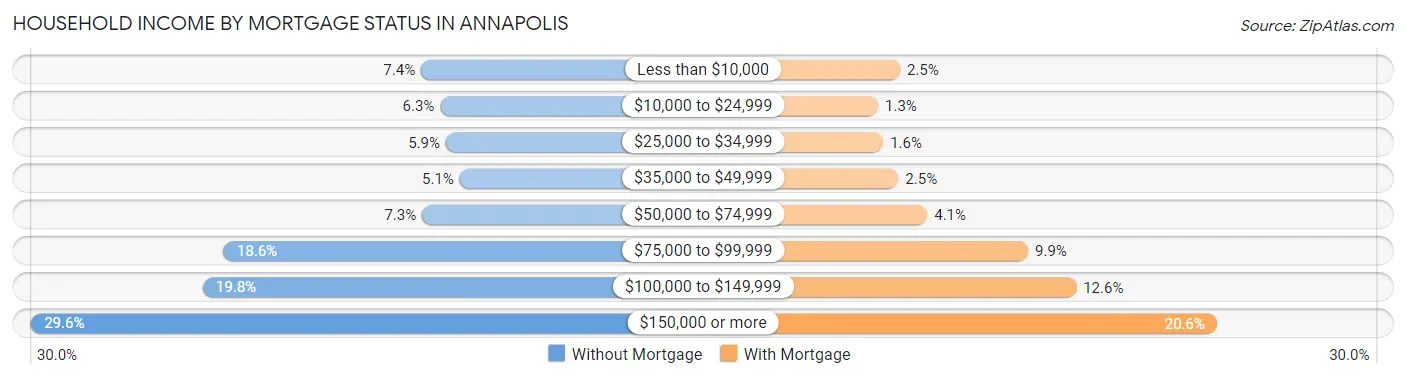
| Household Income | Without Mortgage | With Mortgage |
| Less than $10,000 | 233 (7.3%) | 177 (2.5%) |
| $10,000 to $24,999 | 198 (6.2%) | 90 (1.3%) |
| $25,000 to $34,999 | 188 (5.9%) | 110 (1.6%) |
| $35,000 to $49,999 | 163 (5.1%) | 171 (2.5%) |
| $50,000 to $74,999 | 231 (7.3%) | 286 (4.1%) |
| $75,000 to $99,999 | 590 (18.6%) | 687 (9.9%) |
| $100,000 to $149,999 | 628 (19.8%) | 879 (12.6%) |
| $150,000 or more | 939 (29.6%) | 1,439 (20.6%) |
| Total | 3,170 (100.0%) | 6,971 (100.0%) |
Property Value to Household Income Ratio in Annapolis
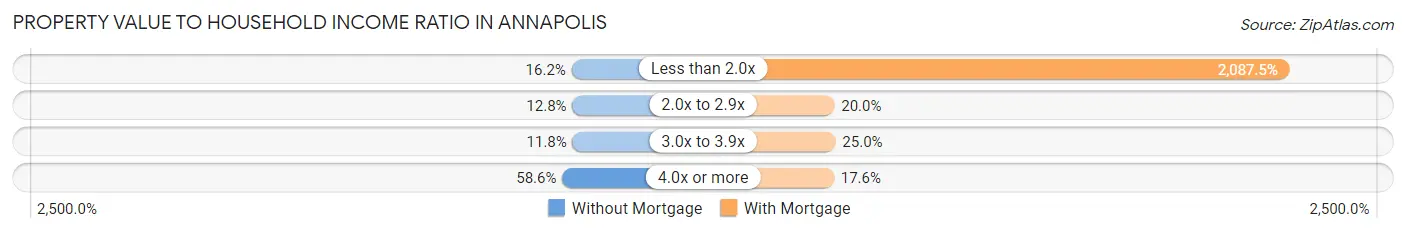
| Value-to-Income Ratio | Without Mortgage | With Mortgage |
| Less than 2.0x | 514 (16.2%) | 145,521 (2,087.5%) |
| 2.0x to 2.9x | 406 (12.8%) | 1,392 (20.0%) |
| 3.0x to 3.9x | 375 (11.8%) | 1,743 (25.0%) |
| 4.0x or more | 1,857 (58.6%) | 1,230 (17.6%) |
| Total | 3,170 (100.0%) | 6,971 (100.0%) |
Real Estate Taxes by Mortgage Status in Annapolis
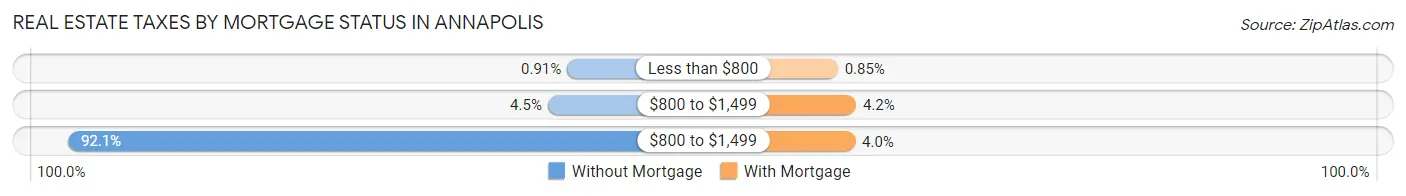
| Property Taxes | Without Mortgage | With Mortgage |
| Less than $800 | 29 (0.9%) | 59 (0.9%) |
| $800 to $1,499 | 141 (4.4%) | 292 (4.2%) |
| $800 to $1,499 | 2,919 (92.1%) | 281 (4.0%) |
| Total | 3,170 (100.0%) | 6,971 (100.0%) |
Health & Disability in Annapolis
Health Insurance Coverage by Age in Annapolis
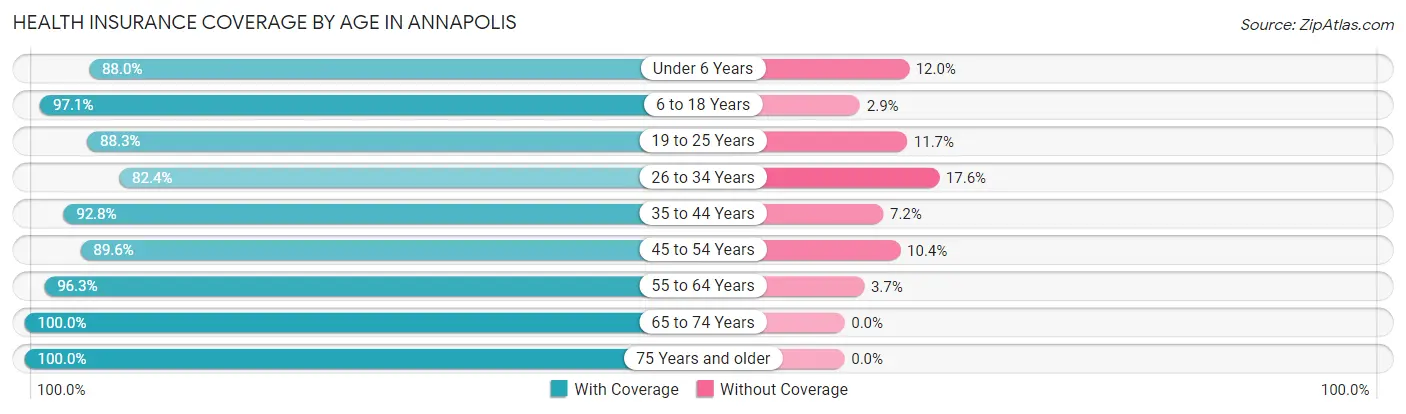
| Age Bracket | With Coverage | Without Coverage |
| Under 6 Years | 3,310 (88.0%) | 452 (12.0%) |
| 6 to 18 Years | 5,990 (97.1%) | 179 (2.9%) |
| 19 to 25 Years | 2,822 (88.3%) | 373 (11.7%) |
| 26 to 34 Years | 4,081 (82.4%) | 874 (17.6%) |
| 35 to 44 Years | 4,921 (92.8%) | 383 (7.2%) |
| 45 to 54 Years | 3,711 (89.6%) | 431 (10.4%) |
| 55 to 64 Years | 5,088 (96.3%) | 194 (3.7%) |
| 65 to 74 Years | 4,272 (100.0%) | 0 (0.0%) |
| 75 Years and older | 3,087 (100.0%) | 0 (0.0%) |
| Total | 37,282 (92.8%) | 2,886 (7.2%) |
Health Insurance Coverage by Citizenship Status in Annapolis
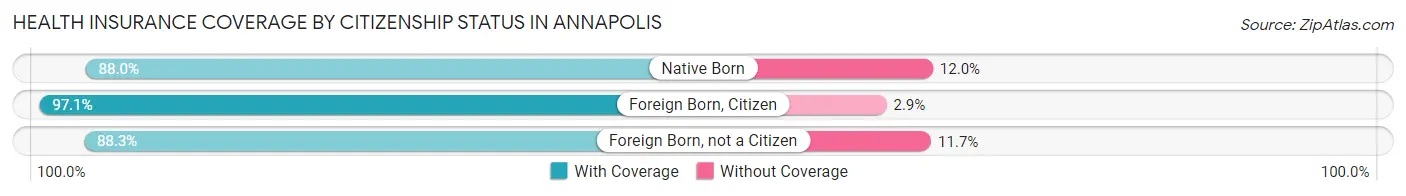
| Citizenship Status | With Coverage | Without Coverage |
| Native Born | 3,310 (88.0%) | 452 (12.0%) |
| Foreign Born, Citizen | 5,990 (97.1%) | 179 (2.9%) |
| Foreign Born, not a Citizen | 2,822 (88.3%) | 373 (11.7%) |
Health Insurance Coverage by Household Income in Annapolis
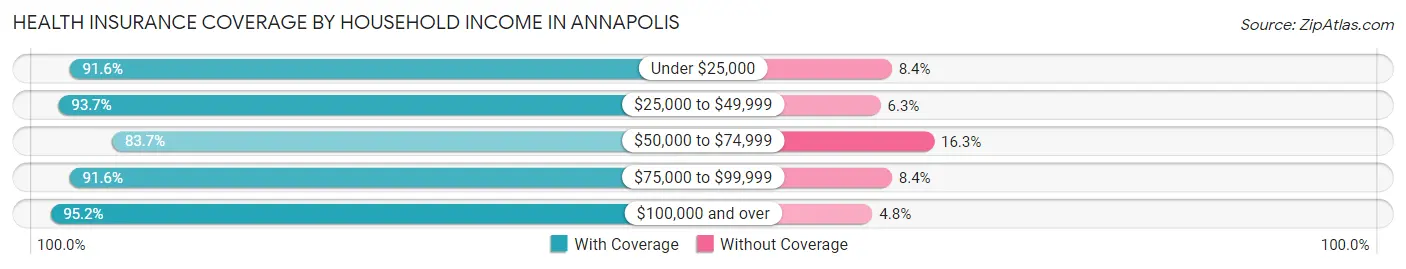
| Household Income | With Coverage | Without Coverage |
| Under $25,000 | 3,653 (91.6%) | 336 (8.4%) |
| $25,000 to $49,999 | 3,271 (93.7%) | 221 (6.3%) |
| $50,000 to $74,999 | 4,337 (83.7%) | 847 (16.3%) |
| $75,000 to $99,999 | 4,218 (91.6%) | 389 (8.4%) |
| $100,000 and over | 21,382 (95.2%) | 1,079 (4.8%) |
Public vs Private Health Insurance Coverage by Age in Annapolis
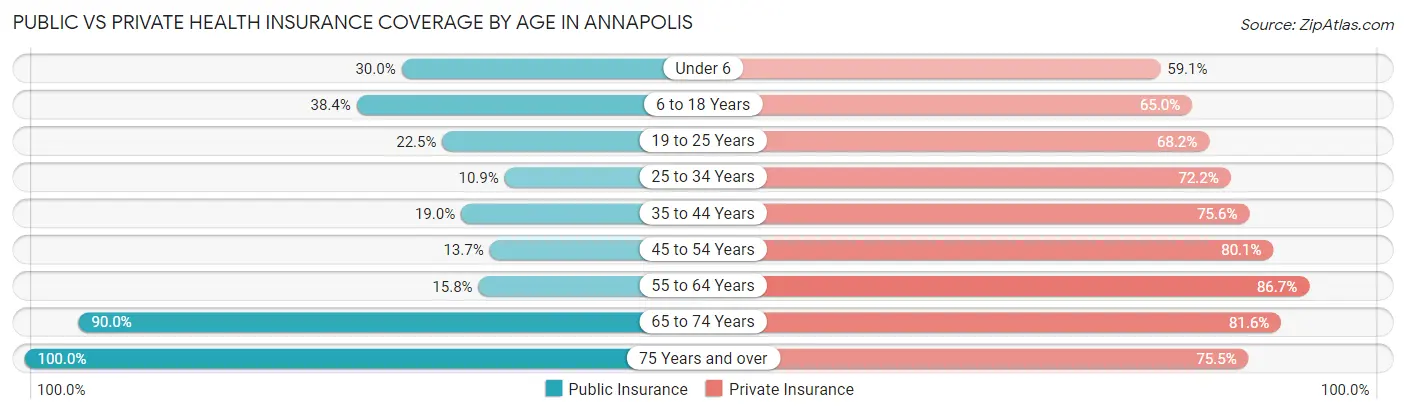
| Age Bracket | Public Insurance | Private Insurance |
| Under 6 | 1,130 (30.0%) | 2,224 (59.1%) |
| 6 to 18 Years | 2,368 (38.4%) | 4,011 (65.0%) |
| 19 to 25 Years | 718 (22.5%) | 2,178 (68.2%) |
| 25 to 34 Years | 541 (10.9%) | 3,575 (72.2%) |
| 35 to 44 Years | 1,008 (19.0%) | 4,011 (75.6%) |
| 45 to 54 Years | 568 (13.7%) | 3,317 (80.1%) |
| 55 to 64 Years | 833 (15.8%) | 4,580 (86.7%) |
| 65 to 74 Years | 3,845 (90.0%) | 3,484 (81.6%) |
| 75 Years and over | 3,087 (100.0%) | 2,330 (75.5%) |
| Total | 14,098 (35.1%) | 29,710 (74.0%) |
Disability Status by Sex by Age in Annapolis
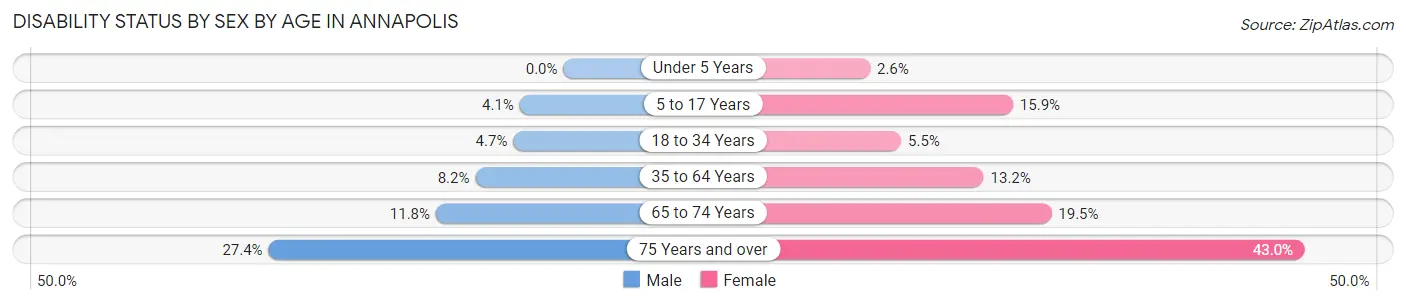
| Age Bracket | Male | Female |
| Under 5 Years | 0 (0.0%) | 41 (2.6%) |
| 5 to 17 Years | 133 (4.1%) | 475 (15.9%) |
| 18 to 34 Years | 176 (4.6%) | 265 (5.5%) |
| 35 to 64 Years | 603 (8.2%) | 967 (13.2%) |
| 65 to 74 Years | 214 (11.8%) | 479 (19.5%) |
| 75 Years and over | 352 (27.4%) | 774 (43.0%) |
Disability Class by Sex by Age in Annapolis
Disability Class: Hearing Difficulty
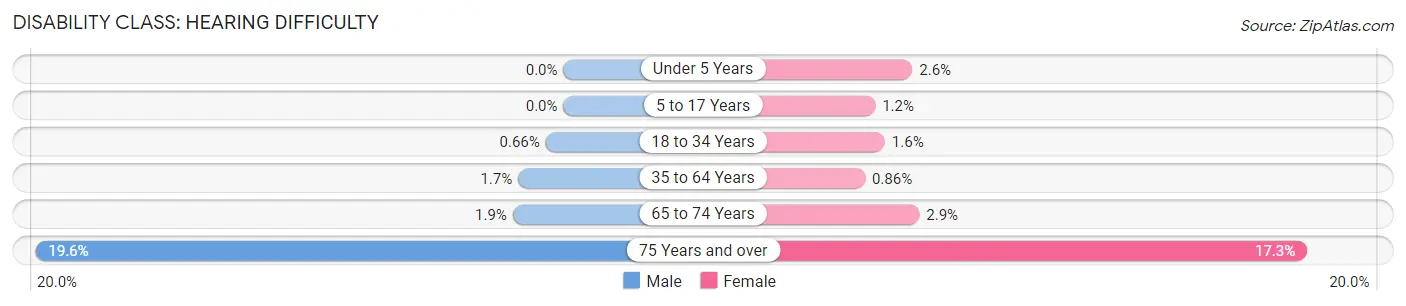
| Age Bracket | Male | Female |
| Under 5 Years | 0 (0.0%) | 41 (2.6%) |
| 5 to 17 Years | 0 (0.0%) | 37 (1.2%) |
| 18 to 34 Years | 25 (0.7%) | 77 (1.6%) |
| 35 to 64 Years | 124 (1.7%) | 63 (0.9%) |
| 65 to 74 Years | 34 (1.9%) | 71 (2.9%) |
| 75 Years and over | 252 (19.6%) | 311 (17.3%) |
Disability Class: Vision Difficulty
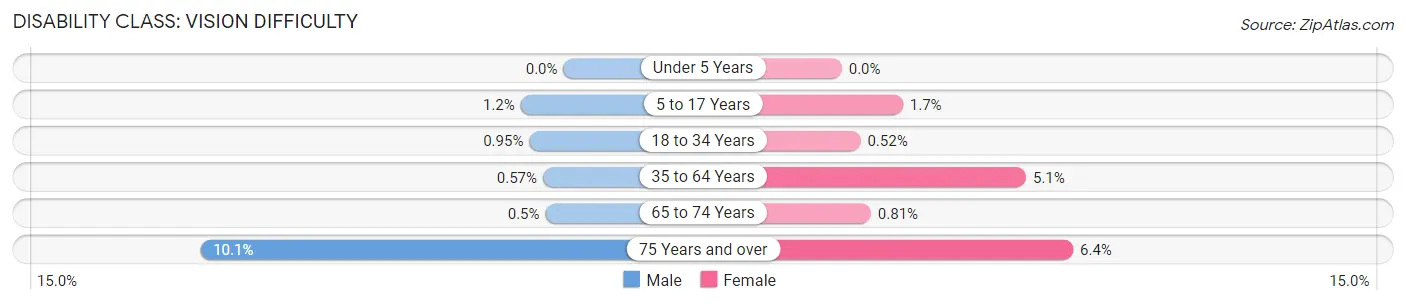
| Age Bracket | Male | Female |
| Under 5 Years | 0 (0.0%) | 0 (0.0%) |
| 5 to 17 Years | 39 (1.2%) | 51 (1.7%) |
| 18 to 34 Years | 36 (0.9%) | 25 (0.5%) |
| 35 to 64 Years | 42 (0.6%) | 377 (5.1%) |
| 65 to 74 Years | 9 (0.5%) | 20 (0.8%) |
| 75 Years and over | 130 (10.1%) | 116 (6.4%) |
Disability Class: Cognitive Difficulty
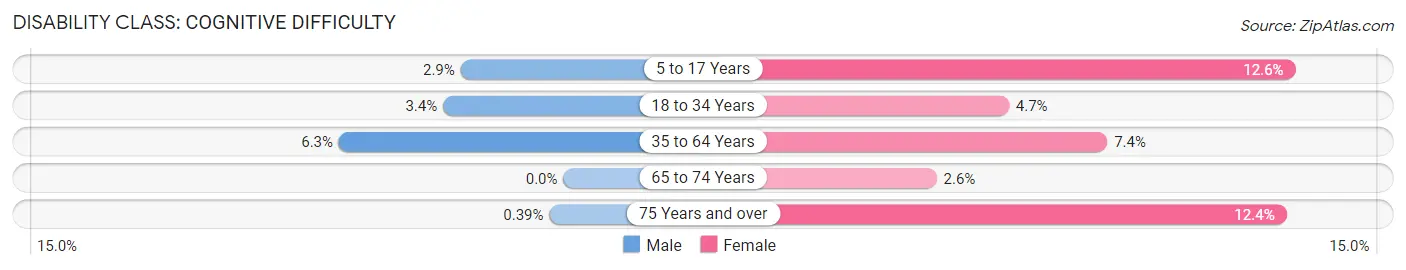
| Age Bracket | Male | Female |
| 5 to 17 Years | 94 (2.9%) | 378 (12.6%) |
| 18 to 34 Years | 127 (3.4%) | 224 (4.6%) |
| 35 to 64 Years | 461 (6.2%) | 543 (7.4%) |
| 65 to 74 Years | 0 (0.0%) | 65 (2.6%) |
| 75 Years and over | 5 (0.4%) | 223 (12.4%) |
Disability Class: Ambulatory Difficulty
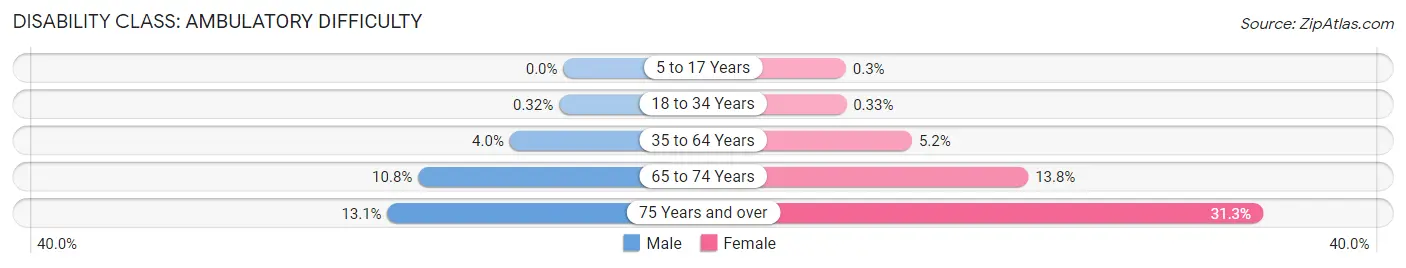
| Age Bracket | Male | Female |
| 5 to 17 Years | 0 (0.0%) | 9 (0.3%) |
| 18 to 34 Years | 12 (0.3%) | 16 (0.3%) |
| 35 to 64 Years | 294 (4.0%) | 383 (5.2%) |
| 65 to 74 Years | 195 (10.8%) | 341 (13.8%) |
| 75 Years and over | 168 (13.1%) | 563 (31.3%) |
Disability Class: Self-Care Difficulty
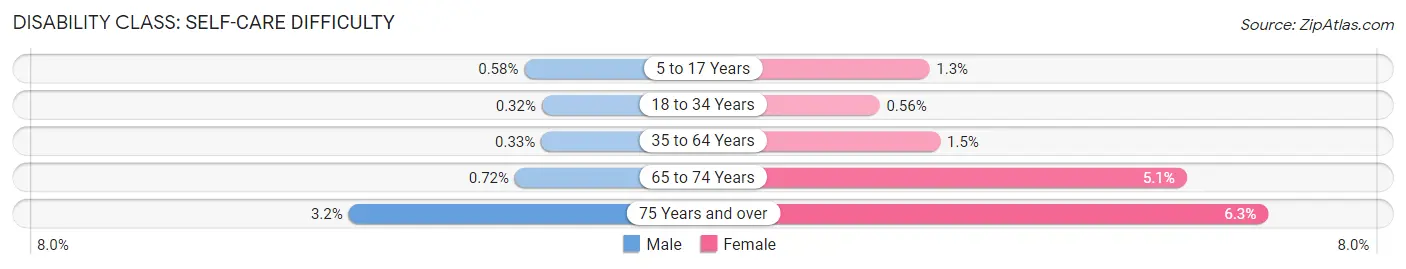
| Age Bracket | Male | Female |
| 5 to 17 Years | 19 (0.6%) | 39 (1.3%) |
| 18 to 34 Years | 12 (0.3%) | 27 (0.6%) |
| 35 to 64 Years | 24 (0.3%) | 107 (1.5%) |
| 65 to 74 Years | 13 (0.7%) | 126 (5.1%) |
| 75 Years and over | 41 (3.2%) | 114 (6.3%) |
Technology Access in Annapolis
Computing Device Access in Annapolis
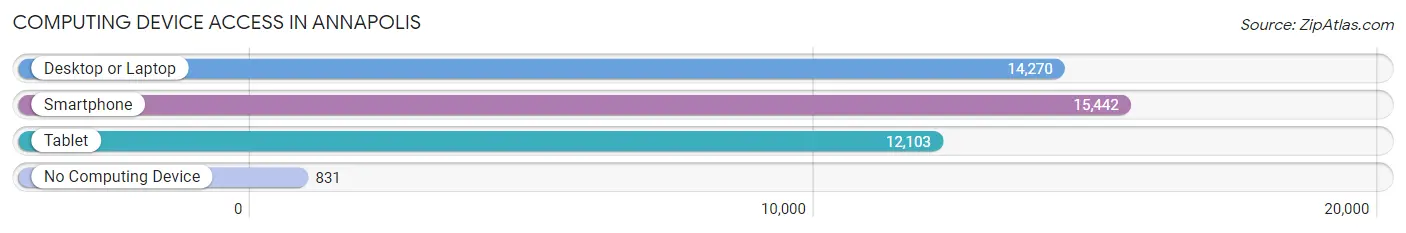
| Device Type | # Households | % Households |
| Desktop or Laptop | 14,270 | 84.1% |
| Smartphone | 15,442 | 91.0% |
| Tablet | 12,103 | 71.3% |
| No Computing Device | 831 | 4.9% |
| Total | 16,969 | 100.0% |
Internet Access in Annapolis
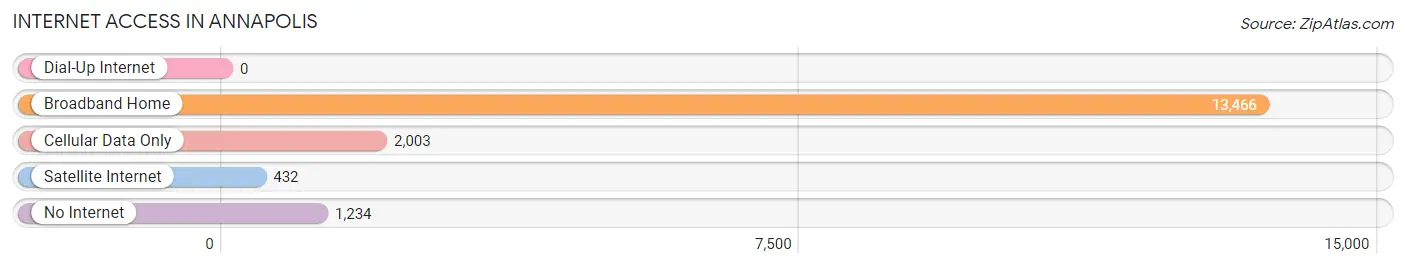
| Internet Type | # Households | % Households |
| Dial-Up Internet | 0 | 0.0% |
| Broadband Home | 13,466 | 79.4% |
| Cellular Data Only | 2,003 | 11.8% |
| Satellite Internet | 432 | 2.5% |
| No Internet | 1,234 | 7.3% |
| Total | 16,969 | 100.0% |
Annapolis Summary
Annapolis, Maryland is a city located in Anne Arundel County, Maryland, United States. It is situated on the Chesapeake Bay at the mouth of the Severn River, 26 miles south of Baltimore and about 30 miles east of Washington, D.C. Annapolis is the capital of Maryland and the county seat of Anne Arundel County. The city has a population of 38,394, according to the 2010 census, making it the fourth largest city in the state.
History
The area that is now Annapolis was first settled in 1649 by Puritan exiles from Virginia led by William Claiborne. The settlement was initially known as "Providence" and was renamed "Anne Arundel's Towne" in 1650 in honor of Lady Ann Arundell, the wife of Cecilius Calvert, the second Lord Baltimore and the first Proprietary Governor of the Province of Maryland. The town was incorporated as a city in 1708 and was made the state capital in 1783.
Geography
Annapolis is located at 38°58′N 76°30′W (38.967, -76.500). According to the United States Census Bureau, the city has a total area of 8.03 square miles (20.77 km2), of which 7.90 square miles (20.45 km2) is land and 0.13 square miles (0.33 km2) is water.
Economy
Annapolis is a major economic center in the state of Maryland. The city is home to a variety of businesses, including government, retail, and professional services. The city is also home to the United States Naval Academy, which is a major employer in the area. The city also has a thriving tourism industry, with many visitors coming to the city to visit the historic sites and attractions.
Demographics
As of the 2010 census, there were 38,394 people, 15,945 households, and 8,845 families residing in the city. The population density was 4,851.3 people per square mile (1,876.2/km2). There were 17,521 housing units at an average density of 2,203.3 per square mile (851.2/km2). The racial makeup of the city was 63.2% White, 28.2% African American, 0.3% Native American, 3.2% Asian, 0.1% Pacific Islander, 2.3% from other races, and 2.7% from two or more races. Hispanic or Latino of any race were 6.2% of the population.
Annapolis is a diverse city with a variety of cultures and backgrounds. The city is home to a large African American population, as well as a growing Hispanic population. The city also has a large number of military personnel and their families, due to the presence of the United States Naval Academy.
Common Questions
What is Per Capita Income in Annapolis?
Per Capita income in Annapolis is $58,082.
What is the Median Family Income in Annapolis?
Median Family Income in Annapolis is $120,895.
What is the Median Household income in Annapolis?
Median Household Income in Annapolis is $97,219.
What is Income or Wage Gap in Annapolis?
Income or Wage Gap in Annapolis is 21.0%.
Women in Annapolis earn 79.0 cents for every dollar earned by a man.
What is Inequality or Gini Index in Annapolis?
Inequality or Gini Index in Annapolis is 0.48.
What is the Total Population of Annapolis?
Total Population of Annapolis is 40,719.
What is the Total Male Population of Annapolis?
Total Male Population of Annapolis is 19,556.
What is the Total Female Population of Annapolis?
Total Female Population of Annapolis is 21,163.
What is the Ratio of Males per 100 Females in Annapolis?
There are 92.41 Males per 100 Females in Annapolis.
What is the Ratio of Females per 100 Males in Annapolis?
There are 108.22 Females per 100 Males in Annapolis.
What is the Median Population Age in Annapolis?
Median Population Age in Annapolis is 37.7 Years.
What is the Average Family Size in Annapolis
Average Family Size in Annapolis is 3.2 People.
What is the Average Household Size in Annapolis
Average Household Size in Annapolis is 2.4 People.
How Large is the Labor Force in Annapolis?
There are 22,003 People in the Labor Forcein in Annapolis.
What is the Percentage of People in the Labor Force in Annapolis?
68.1% of People are in the Labor Force in Annapolis.
What is the Unemployment Rate in Annapolis?
Unemployment Rate in Annapolis is 4.3%.