Turlock, CA Map & Demographics
Turlock Map
Turlock Overview
$33,194
PER CAPITA INCOME
$89,663
AVG FAMILY INCOME
$74,559
AVG HOUSEHOLD INCOME
39.4%
WAGE / INCOME GAP [ % ]
60.6¢/ $1
WAGE / INCOME GAP [ $ ]
$9,355
FAMILY INCOME DEFICIT
0.44
INEQUALITY / GINI INDEX
72,504
TOTAL POPULATION
34,835
MALE POPULATION
37,669
FEMALE POPULATION
92.48
MALES / 100 FEMALES
108.14
FEMALES / 100 MALES
34.3
MEDIAN AGE
3.4
AVG FAMILY SIZE
2.9
AVG HOUSEHOLD SIZE
34,347
LABOR FORCE [ PEOPLE ]
61.5%
PERCENT IN LABOR FORCE
7.6%
UNEMPLOYMENT RATE
Turlock Area Codes
Income in Turlock
Income Overview in Turlock
Per Capita Income in Turlock is $33,194, while median incomes of families and households are $89,663 and $74,559 respectively.
| Characteristic | Number | Measure |
| Per Capita Income | 72,504 | $33,194 |
| Median Family Income | 17,377 | $89,663 |
| Mean Family Income | 17,377 | $108,265 |
| Median Household Income | 24,733 | $74,559 |
| Mean Household Income | 24,733 | $95,366 |
| Income Deficit | 17,377 | $9,355 |
| Wage / Income Gap (%) | 72,504 | 39.45% |
| Wage / Income Gap ($) | 72,504 | 60.55¢ per $1 |
| Gini / Inequality Index | 72,504 | 0.44 |
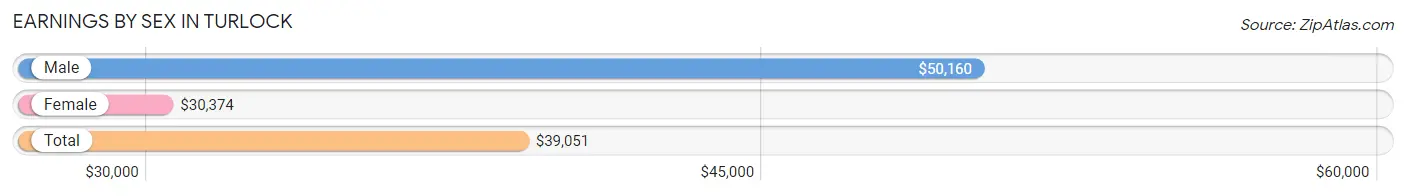
Earnings by Sex in Turlock
Average Earnings in Turlock are $39,051, $50,160 for men and $30,374 for women, a difference of 39.5%.
| Sex | Number | Average Earnings |
| Male | 18,344 (52.4%) | $50,160 |
| Female | 16,635 (47.6%) | $30,374 |
| Total | 34,979 (100.0%) | $39,051 |
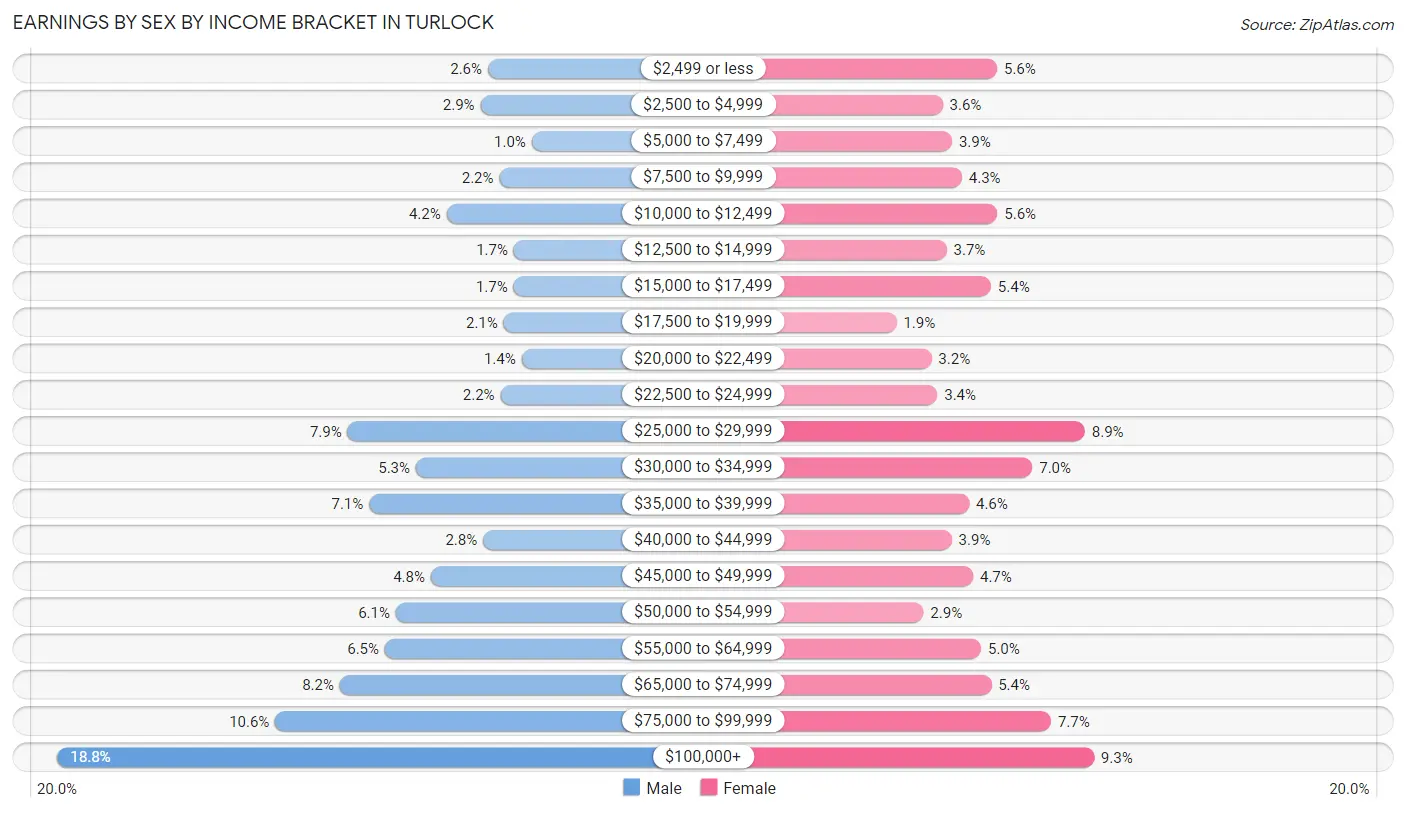
Earnings by Sex by Income Bracket in Turlock
The most common earnings brackets in Turlock are $100,000+ for men (3,444 | 18.8%) and $100,000+ for women (1,540 | 9.3%).
| Income | Male | Female |
| $2,499 or less | 484 (2.6%) | 937 (5.6%) |
| $2,500 to $4,999 | 535 (2.9%) | 597 (3.6%) |
| $5,000 to $7,499 | 184 (1.0%) | 655 (3.9%) |
| $7,500 to $9,999 | 406 (2.2%) | 717 (4.3%) |
| $10,000 to $12,499 | 769 (4.2%) | 938 (5.6%) |
| $12,500 to $14,999 | 306 (1.7%) | 622 (3.7%) |
| $15,000 to $17,499 | 308 (1.7%) | 899 (5.4%) |
| $17,500 to $19,999 | 376 (2.1%) | 309 (1.9%) |
| $20,000 to $22,499 | 253 (1.4%) | 528 (3.2%) |
| $22,500 to $24,999 | 398 (2.2%) | 564 (3.4%) |
| $25,000 to $29,999 | 1,449 (7.9%) | 1,484 (8.9%) |
| $30,000 to $34,999 | 979 (5.3%) | 1,156 (7.0%) |
| $35,000 to $39,999 | 1,301 (7.1%) | 762 (4.6%) |
| $40,000 to $44,999 | 518 (2.8%) | 654 (3.9%) |
| $45,000 to $49,999 | 876 (4.8%) | 787 (4.7%) |
| $50,000 to $54,999 | 1,117 (6.1%) | 478 (2.9%) |
| $55,000 to $64,999 | 1,192 (6.5%) | 836 (5.0%) |
| $65,000 to $74,999 | 1,503 (8.2%) | 900 (5.4%) |
| $75,000 to $99,999 | 1,946 (10.6%) | 1,272 (7.6%) |
| $100,000+ | 3,444 (18.8%) | 1,540 (9.3%) |
| Total | 18,344 (100.0%) | 16,635 (100.0%) |
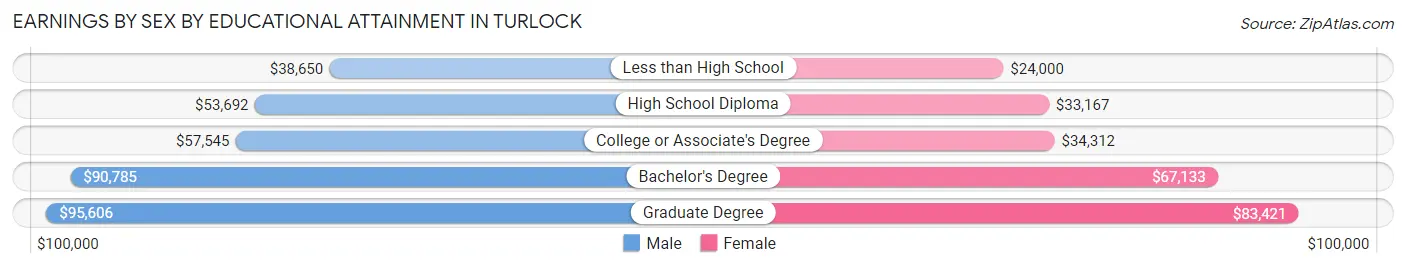
Earnings by Sex by Educational Attainment in Turlock
Average earnings in Turlock are $57,512 for men and $37,052 for women, a difference of 35.6%. Men with an educational attainment of graduate degree enjoy the highest average annual earnings of $95,606, while those with less than high school education earn the least with $38,650. Women with an educational attainment of graduate degree earn the most with the average annual earnings of $83,421, while those with less than high school education have the smallest earnings of $24,000.
| Educational Attainment | Male Income | Female Income |
| Less than High School | $38,650 | $24,000 |
| High School Diploma | $53,692 | $33,167 |
| College or Associate's Degree | $57,545 | $34,312 |
| Bachelor's Degree | $90,785 | $67,133 |
| Graduate Degree | $95,606 | $83,421 |
| Total | $57,512 | $37,052 |
Family Income in Turlock
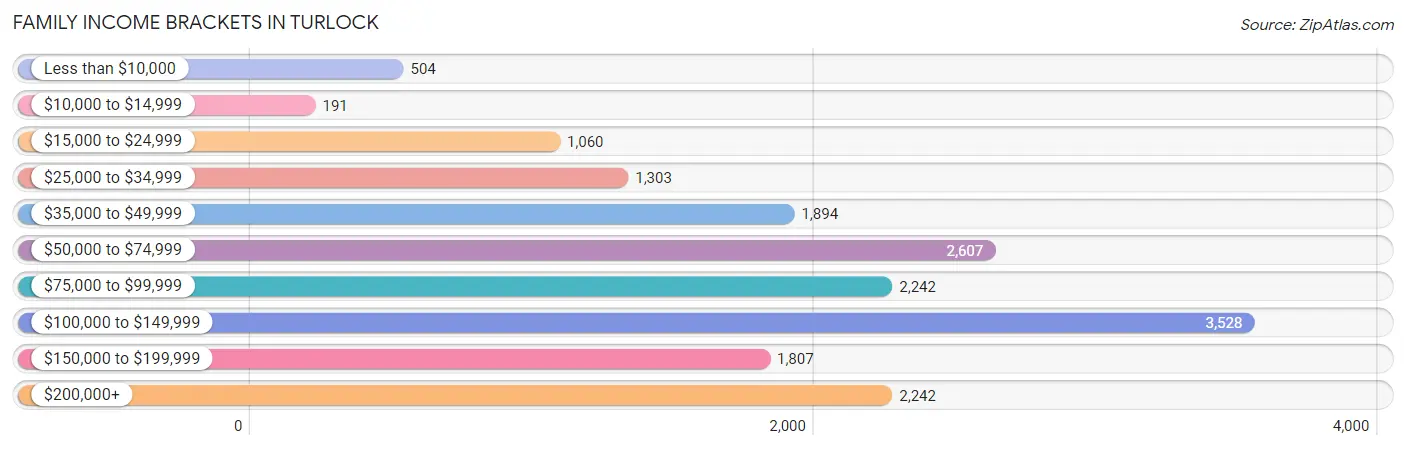
Family Income Brackets in Turlock
According to the Turlock family income data, there are 3,528 families falling into the $100,000 to $149,999 income range, which is the most common income bracket and makes up 20.3% of all families. Conversely, the $10,000 to $14,999 income bracket is the least frequent group with only 191 families (1.1%) belonging to this category.
| Income Bracket | # Families | % Families |
| Less than $10,000 | 504 | 2.9% |
| $10,000 to $14,999 | 191 | 1.1% |
| $15,000 to $24,999 | 1,060 | 6.1% |
| $25,000 to $34,999 | 1,303 | 7.5% |
| $35,000 to $49,999 | 1,894 | 10.9% |
| $50,000 to $74,999 | 2,607 | 15.0% |
| $75,000 to $99,999 | 2,242 | 12.9% |
| $100,000 to $149,999 | 3,528 | 20.3% |
| $150,000 to $199,999 | 1,807 | 10.4% |
| $200,000+ | 2,242 | 12.9% |
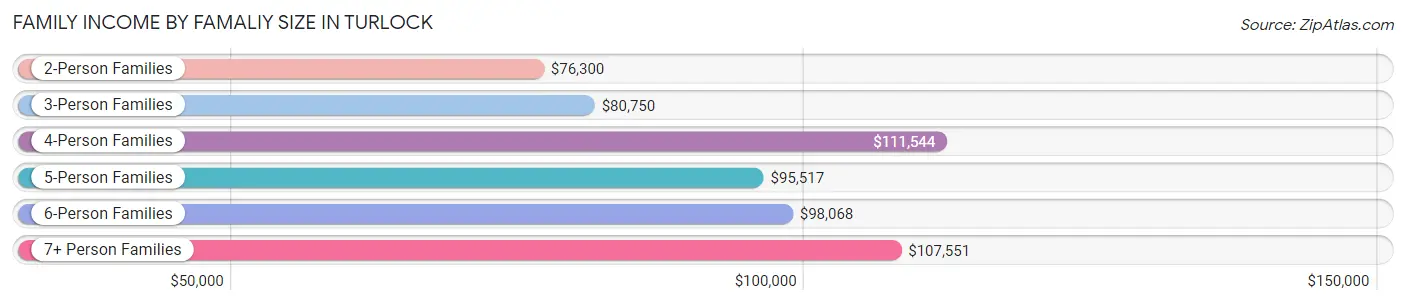
Family Income by Famaliy Size in Turlock
4-person families (3,505 | 20.2%) account for the highest median family income in Turlock with $111,544 per family, while 2-person families (7,064 | 40.6%) have the highest median income of $38,150 per family member.
| Income Bracket | # Families | Median Income |
| 2-Person Families | 7,064 (40.6%) | $76,300 |
| 3-Person Families | 3,837 (22.1%) | $80,750 |
| 4-Person Families | 3,505 (20.2%) | $111,544 |
| 5-Person Families | 1,510 (8.7%) | $95,517 |
| 6-Person Families | 813 (4.7%) | $98,068 |
| 7+ Person Families | 648 (3.7%) | $107,551 |
| Total | 17,377 (100.0%) | $89,663 |
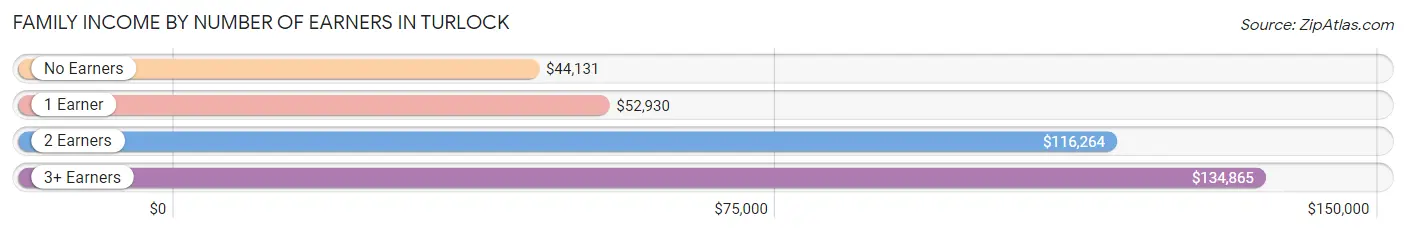
Family Income by Number of Earners in Turlock
The median family income in Turlock is $89,663, with families comprising 3+ earners (2,319) having the highest median family income of $134,865, while families with no earners (2,389) have the lowest median family income of $44,131, accounting for 13.4% and 13.8% of families, respectively.
| Number of Earners | # Families | Median Income |
| No Earners | 2,389 (13.8%) | $44,131 |
| 1 Earner | 6,251 (36.0%) | $52,930 |
| 2 Earners | 6,418 (36.9%) | $116,264 |
| 3+ Earners | 2,319 (13.4%) | $134,865 |
| Total | 17,377 (100.0%) | $89,663 |
Household Income in Turlock
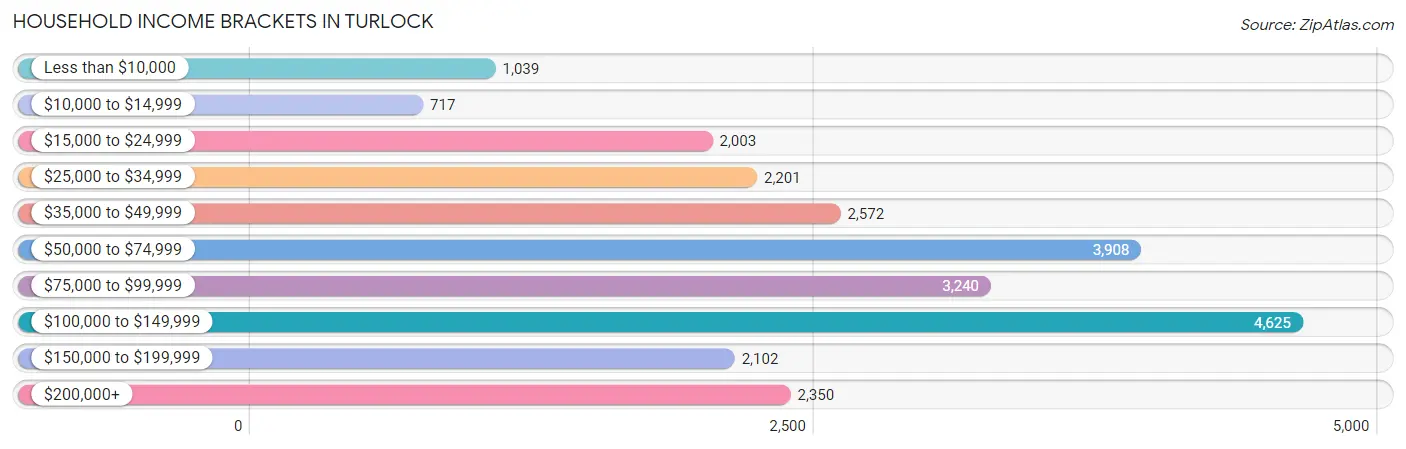
Household Income Brackets in Turlock
With 4,625 households falling in the category, the $100,000 to $149,999 income range is the most frequent in Turlock, accounting for 18.7% of all households. In contrast, only 717 households (2.9%) fall into the $10,000 to $14,999 income bracket, making it the least populous group.
| Income Bracket | # Households | % Households |
| Less than $10,000 | 1,039 | 4.2% |
| $10,000 to $14,999 | 717 | 2.9% |
| $15,000 to $24,999 | 2,003 | 8.1% |
| $25,000 to $34,999 | 2,201 | 8.9% |
| $35,000 to $49,999 | 2,572 | 10.4% |
| $50,000 to $74,999 | 3,908 | 15.8% |
| $75,000 to $99,999 | 3,240 | 13.1% |
| $100,000 to $149,999 | 4,625 | 18.7% |
| $150,000 to $199,999 | 2,102 | 8.5% |
| $200,000+ | 2,350 | 9.5% |
Household Income by Householder Age in Turlock
The median household income in Turlock is $74,559, with the highest median household income of $88,998 found in the 45 to 64 years age bracket for the primary householder. A total of 8,715 households (35.2%) fall into this category. Meanwhile, the 15 to 24 years age bracket for the primary householder has the lowest median household income of $35,225, with 1,093 households (4.4%) in this group.
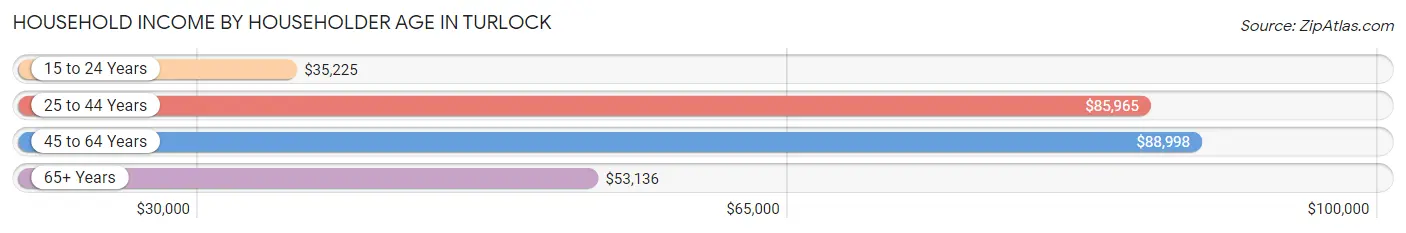
| Income Bracket | # Households | Median Income |
| 15 to 24 Years | 1,093 (4.4%) | $35,225 |
| 25 to 44 Years | 8,980 (36.3%) | $85,965 |
| 45 to 64 Years | 8,715 (35.2%) | $88,998 |
| 65+ Years | 5,945 (24.0%) | $53,136 |
| Total | 24,733 (100.0%) | $74,559 |
Poverty in Turlock
Income Below Poverty by Sex and Age in Turlock
With 11.7% poverty level for males and 14.3% for females among the residents of Turlock, 5 year old males and 18 to 24 year old females are the most vulnerable to poverty, with 161 males (32.5%) and 841 females (19.4%) in their respective age groups living below the poverty level.
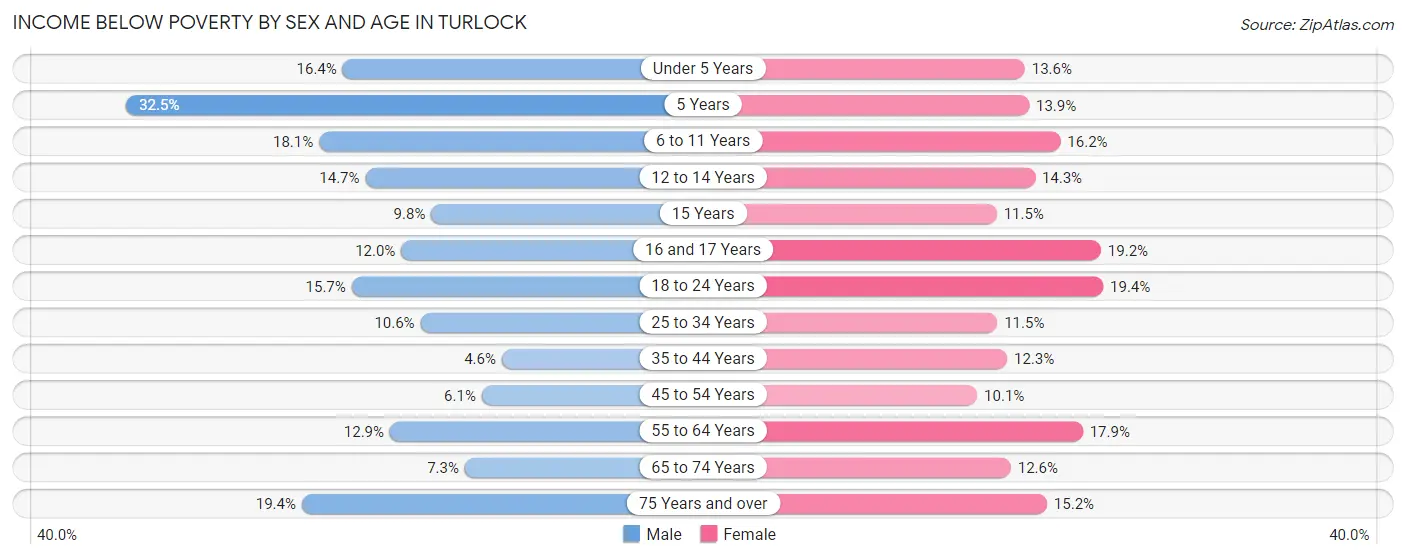
| Age Bracket | Male | Female |
| Under 5 Years | 452 (16.4%) | 305 (13.6%) |
| 5 Years | 161 (32.5%) | 46 (13.9%) |
| 6 to 11 Years | 484 (18.1%) | 497 (16.2%) |
| 12 to 14 Years | 258 (14.7%) | 267 (14.3%) |
| 15 Years | 53 (9.8%) | 73 (11.5%) |
| 16 and 17 Years | 132 (12.0%) | 237 (19.2%) |
| 18 to 24 Years | 529 (15.7%) | 841 (19.4%) |
| 25 to 34 Years | 547 (10.6%) | 571 (11.5%) |
| 35 to 44 Years | 208 (4.6%) | 609 (12.3%) |
| 45 to 54 Years | 246 (6.1%) | 413 (10.1%) |
| 55 to 64 Years | 444 (12.9%) | 705 (17.9%) |
| 65 to 74 Years | 210 (7.3%) | 411 (12.6%) |
| 75 Years and over | 314 (19.4%) | 308 (15.2%) |
| Total | 4,038 (11.7%) | 5,283 (14.3%) |
Income Above Poverty by Sex and Age in Turlock
According to the poverty statistics in Turlock, males aged 35 to 44 years and females aged 45 to 54 years are the age groups that are most secure financially, with 95.4% of males and 89.9% of females in these age groups living above the poverty line.
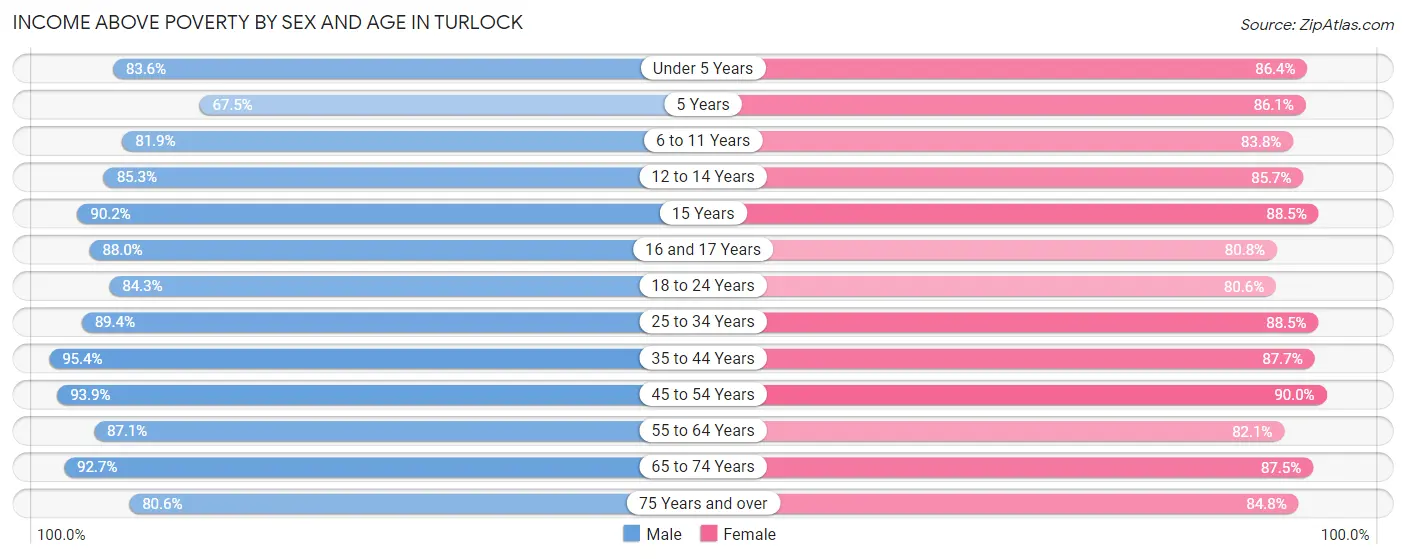
| Age Bracket | Male | Female |
| Under 5 Years | 2,306 (83.6%) | 1,939 (86.4%) |
| 5 Years | 335 (67.5%) | 285 (86.1%) |
| 6 to 11 Years | 2,184 (81.9%) | 2,566 (83.8%) |
| 12 to 14 Years | 1,497 (85.3%) | 1,595 (85.7%) |
| 15 Years | 487 (90.2%) | 562 (88.5%) |
| 16 and 17 Years | 964 (88.0%) | 995 (80.8%) |
| 18 to 24 Years | 2,836 (84.3%) | 3,495 (80.6%) |
| 25 to 34 Years | 4,610 (89.4%) | 4,379 (88.5%) |
| 35 to 44 Years | 4,341 (95.4%) | 4,356 (87.7%) |
| 45 to 54 Years | 3,812 (93.9%) | 3,698 (89.9%) |
| 55 to 64 Years | 3,003 (87.1%) | 3,235 (82.1%) |
| 65 to 74 Years | 2,660 (92.7%) | 2,863 (87.5%) |
| 75 Years and over | 1,303 (80.6%) | 1,714 (84.8%) |
| Total | 30,338 (88.2%) | 31,682 (85.7%) |
Income Below Poverty Among Married-Couple Families in Turlock
The poverty statistics for married-couple families in Turlock show that 5.1% or 597 of the total 11,689 families live below the poverty line. Families with 5 or more children have the highest poverty rate of 42.5%, comprising of 108 families. On the other hand, families with no children have the lowest poverty rate of 2.4%, which includes 137 families.
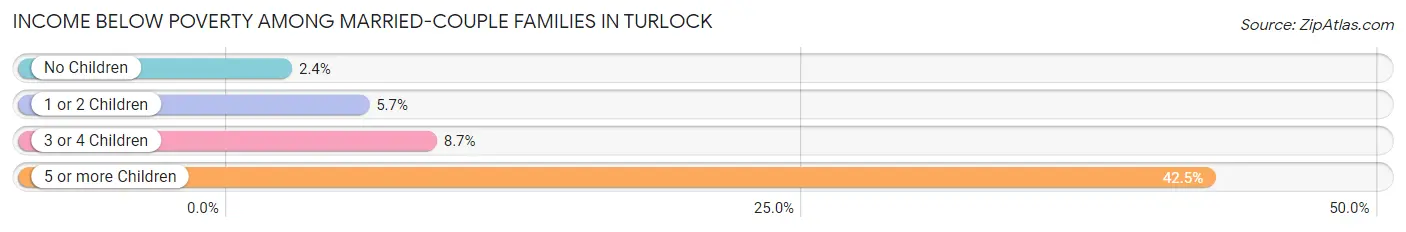
| Children | Above Poverty | Below Poverty |
| No Children | 5,681 (97.7%) | 137 (2.4%) |
| 1 or 2 Children | 4,293 (94.3%) | 260 (5.7%) |
| 3 or 4 Children | 972 (91.3%) | 92 (8.6%) |
| 5 or more Children | 146 (57.5%) | 108 (42.5%) |
| Total | 11,092 (94.9%) | 597 (5.1%) |
Income Below Poverty Among Single-Parent Households in Turlock
According to the poverty data in Turlock, 8.5% or 165 single-father households and 22.4% or 842 single-mother households are living below the poverty line. Among single-father households, those with no children have the highest poverty rate, with 117 households (15.4%) experiencing poverty. Likewise, among single-mother households, those with 5 or more children have the highest poverty rate, with 36 households (57.1%) falling below the poverty line.
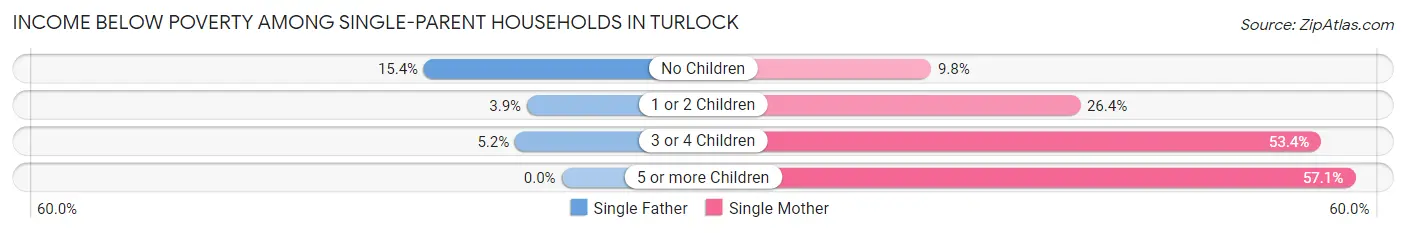
| Children | Single Father | Single Mother |
| No Children | 117 (15.4%) | 137 (9.8%) |
| 1 or 2 Children | 37 (3.9%) | 542 (26.4%) |
| 3 or 4 Children | 11 (5.2%) | 127 (53.4%) |
| 5 or more Children | 0 (0.0%) | 36 (57.1%) |
| Total | 165 (8.5%) | 842 (22.4%) |
Income Below Poverty Among Married-Couple vs Single-Parent Households in Turlock
The poverty data for Turlock shows that 597 of the married-couple family households (5.1%) and 1,007 of the single-parent households (17.7%) are living below the poverty level. Within the married-couple family households, those with 5 or more children have the highest poverty rate, with 108 households (42.5%) falling below the poverty line. Among the single-parent households, those with 5 or more children have the highest poverty rate, with 36 household (57.1%) living below poverty.
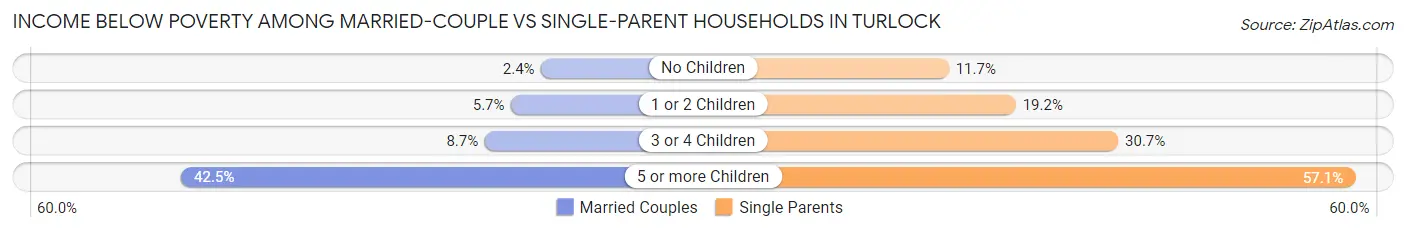
| Children | Married-Couple Families | Single-Parent Households |
| No Children | 137 (2.4%) | 254 (11.7%) |
| 1 or 2 Children | 260 (5.7%) | 579 (19.2%) |
| 3 or 4 Children | 92 (8.6%) | 138 (30.7%) |
| 5 or more Children | 108 (42.5%) | 36 (57.1%) |
| Total | 597 (5.1%) | 1,007 (17.7%) |
Race in Turlock
The most populous races in Turlock are White / Caucasian (42,104 | 58.1%), Hispanic or Latino (32,195 | 44.4%), and Some other Race (14,338 | 19.8%).
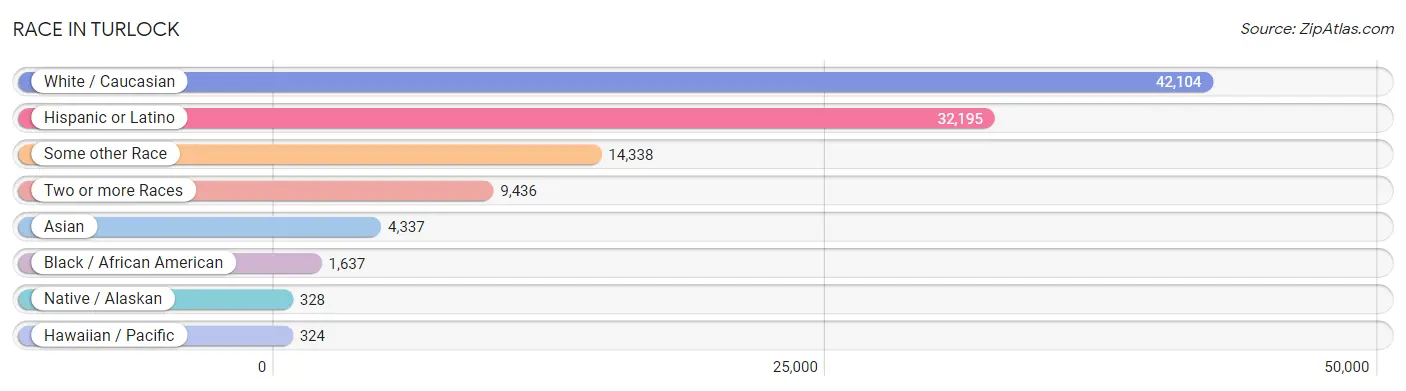
| Race | # Population | % Population |
| Asian | 4,337 | 6.0% |
| Black / African American | 1,637 | 2.3% |
| Hawaiian / Pacific | 324 | 0.4% |
| Hispanic or Latino | 32,195 | 44.4% |
| Native / Alaskan | 328 | 0.4% |
| White / Caucasian | 42,104 | 58.1% |
| Two or more Races | 9,436 | 13.0% |
| Some other Race | 14,338 | 19.8% |
| Total | 72,504 | 100.0% |
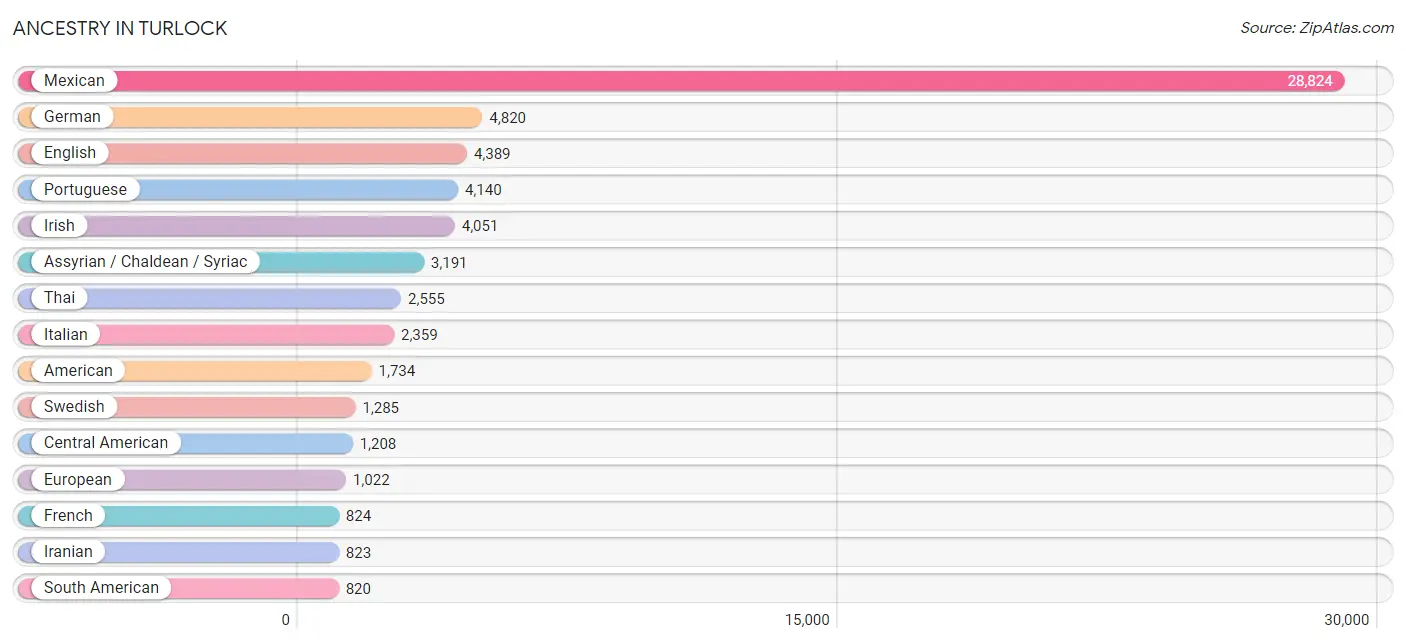
Ancestry in Turlock
The most populous ancestries reported in Turlock are Mexican (28,824 | 39.8%), German (4,820 | 6.7%), English (4,389 | 6.0%), Portuguese (4,140 | 5.7%), and Irish (4,051 | 5.6%), together accounting for 63.8% of all Turlock residents.
| Ancestry | # Population | % Population |
| Afghan | 481 | 0.7% |
| African | 61 | 0.1% |
| American | 1,734 | 2.4% |
| Apache | 52 | 0.1% |
| Arab | 493 | 0.7% |
| Armenian | 111 | 0.2% |
| Assyrian / Chaldean / Syriac | 3,191 | 4.4% |
| Australian | 69 | 0.1% |
| Austrian | 28 | 0.0% |
| Bangladeshi | 43 | 0.1% |
| Basque | 20 | 0.0% |
| Bhutanese | 454 | 0.6% |
| Blackfeet | 114 | 0.2% |
| Bolivian | 66 | 0.1% |
| Brazilian | 54 | 0.1% |
| British | 261 | 0.4% |
| Burmese | 391 | 0.5% |
| Canadian | 78 | 0.1% |
| Central American | 1,208 | 1.7% |
| Central American Indian | 36 | 0.1% |
| Cherokee | 256 | 0.4% |
| Cheyenne | 95 | 0.1% |
| Chilean | 37 | 0.1% |
| Choctaw | 26 | 0.0% |
| Colombian | 209 | 0.3% |
| Creek | 26 | 0.0% |
| Croatian | 61 | 0.1% |
| Cuban | 19 | 0.0% |
| Czech | 60 | 0.1% |
| Czechoslovakian | 43 | 0.1% |
| Danish | 275 | 0.4% |
| Dominican | 9 | 0.0% |
| Dutch | 637 | 0.9% |
| Eastern European | 122 | 0.2% |
| Ecuadorian | 54 | 0.1% |
| English | 4,389 | 6.0% |
| Estonian | 100 | 0.1% |
| European | 1,022 | 1.4% |
| Filipino | 12 | 0.0% |
| Finnish | 89 | 0.1% |
| French | 824 | 1.1% |
| French Canadian | 184 | 0.3% |
| German | 4,820 | 6.7% |
| Greek | 292 | 0.4% |
| Guamanian / Chamorro | 359 | 0.5% |
| Guatemalan | 598 | 0.8% |
| Honduran | 22 | 0.0% |
| Hopi | 10 | 0.0% |
| Hungarian | 53 | 0.1% |
| Indian (Asian) | 732 | 1.0% |
| Iranian | 823 | 1.1% |
| Iraqi | 129 | 0.2% |
| Irish | 4,051 | 5.6% |
| Israeli | 8 | 0.0% |
| Italian | 2,359 | 3.3% |
| Japanese | 102 | 0.1% |
| Kenyan | 18 | 0.0% |
| Korean | 737 | 1.0% |
| Laotian | 25 | 0.0% |
| Lebanese | 38 | 0.1% |
| Lithuanian | 32 | 0.0% |
| Lumbee | 33 | 0.1% |
| Malaysian | 1 | 0.0% |
| Maltese | 12 | 0.0% |
| Mexican | 28,824 | 39.8% |
| Mexican American Indian | 187 | 0.3% |
| Native Hawaiian | 253 | 0.4% |
| Navajo | 21 | 0.0% |
| Nicaraguan | 69 | 0.1% |
| Nigerian | 22 | 0.0% |
| Northern European | 88 | 0.1% |
| Norwegian | 764 | 1.1% |
| Pakistani | 11 | 0.0% |
| Palestinian | 44 | 0.1% |
| Peruvian | 454 | 0.6% |
| Pima | 48 | 0.1% |
| Polish | 199 | 0.3% |
| Portuguese | 4,140 | 5.7% |
| Pueblo | 21 | 0.0% |
| Puerto Rican | 270 | 0.4% |
| Romanian | 31 | 0.0% |
| Russian | 214 | 0.3% |
| Salvadoran | 519 | 0.7% |
| Samoan | 47 | 0.1% |
| Scandinavian | 195 | 0.3% |
| Scotch-Irish | 171 | 0.2% |
| Scottish | 615 | 0.9% |
| Shoshone | 1 | 0.0% |
| Sioux | 22 | 0.0% |
| South American | 820 | 1.1% |
| Spaniard | 295 | 0.4% |
| Spanish | 462 | 0.6% |
| Sri Lankan | 40 | 0.1% |
| Subsaharan African | 102 | 0.1% |
| Swedish | 1,285 | 1.8% |
| Swiss | 174 | 0.2% |
| Syrian | 236 | 0.3% |
| Thai | 2,555 | 3.5% |
| Tongan | 178 | 0.3% |
| Turkish | 9 | 0.0% |
| Welsh | 341 | 0.5% |
| Yaqui | 70 | 0.1% |
| Yugoslavian | 29 | 0.0% | View All 103 Rows |
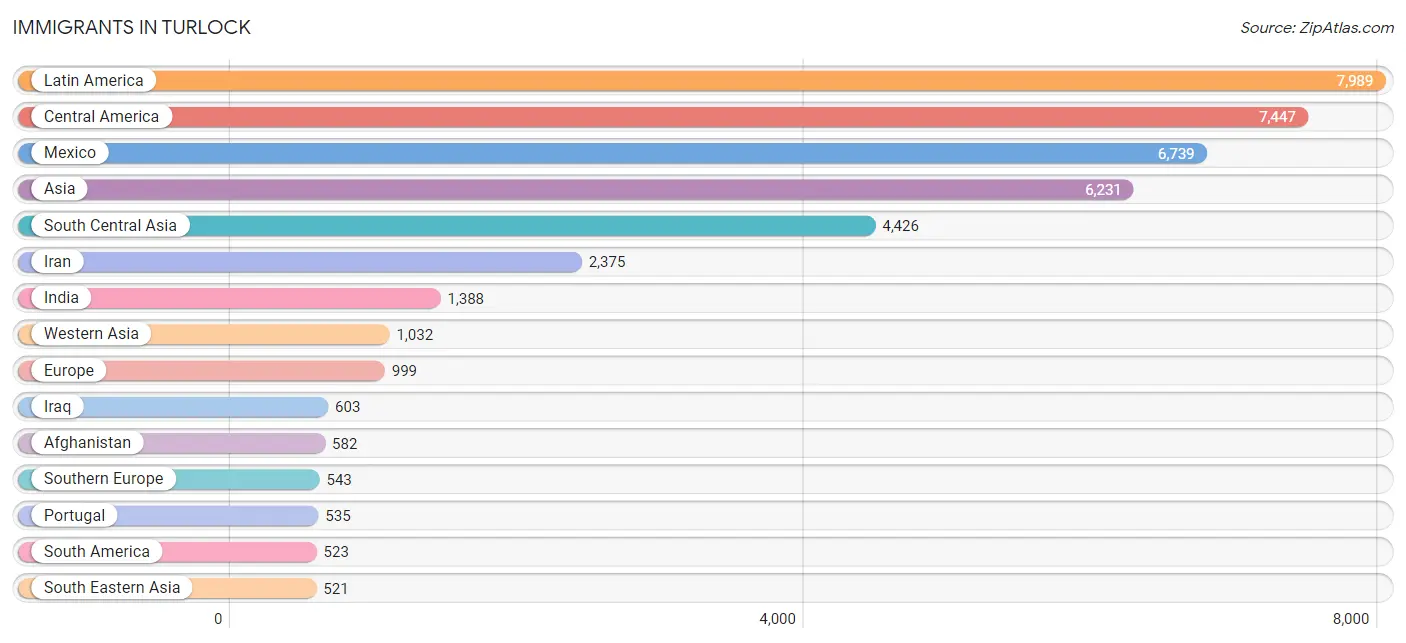
Immigrants in Turlock
The most numerous immigrant groups reported in Turlock came from Latin America (7,989 | 11.0%), Central America (7,447 | 10.3%), Mexico (6,739 | 9.3%), Asia (6,231 | 8.6%), and South Central Asia (4,426 | 6.1%), together accounting for 45.3% of all Turlock residents.
| Immigration Origin | # Population | % Population |
| Afghanistan | 582 | 0.8% |
| Africa | 103 | 0.1% |
| Armenia | 19 | 0.0% |
| Asia | 6,231 | 8.6% |
| Australia | 29 | 0.0% |
| Azores | 361 | 0.5% |
| Belarus | 21 | 0.0% |
| Bolivia | 32 | 0.0% |
| Brazil | 4 | 0.0% |
| Cambodia | 13 | 0.0% |
| Canada | 28 | 0.0% |
| Caribbean | 19 | 0.0% |
| Central America | 7,447 | 10.3% |
| Chile | 17 | 0.0% |
| China | 73 | 0.1% |
| Colombia | 46 | 0.1% |
| Cuba | 19 | 0.0% |
| Czechoslovakia | 18 | 0.0% |
| Eastern Africa | 42 | 0.1% |
| Eastern Asia | 252 | 0.4% |
| Eastern Europe | 102 | 0.1% |
| El Salvador | 215 | 0.3% |
| England | 83 | 0.1% |
| Europe | 999 | 1.4% |
| Fiji | 291 | 0.4% |
| France | 14 | 0.0% |
| Germany | 36 | 0.1% |
| Guatemala | 486 | 0.7% |
| Honduras | 7 | 0.0% |
| Hong Kong | 22 | 0.0% |
| India | 1,388 | 1.9% |
| Indonesia | 95 | 0.1% |
| Iran | 2,375 | 3.3% |
| Iraq | 603 | 0.8% |
| Ireland | 81 | 0.1% |
| Italy | 8 | 0.0% |
| Japan | 21 | 0.0% |
| Kenya | 42 | 0.1% |
| Korea | 158 | 0.2% |
| Kuwait | 11 | 0.0% |
| Latin America | 7,989 | 11.0% |
| Lebanon | 37 | 0.1% |
| Mexico | 6,739 | 9.3% |
| Middle Africa | 16 | 0.0% |
| Netherlands | 59 | 0.1% |
| Nigeria | 23 | 0.0% |
| Northern Africa | 22 | 0.0% |
| Northern Europe | 197 | 0.3% |
| Oceania | 440 | 0.6% |
| Pakistan | 81 | 0.1% |
| Peru | 424 | 0.6% |
| Philippines | 303 | 0.4% |
| Portugal | 535 | 0.7% |
| Romania | 21 | 0.0% |
| Russia | 42 | 0.1% |
| Singapore | 30 | 0.0% |
| South America | 523 | 0.7% |
| South Central Asia | 4,426 | 6.1% |
| South Eastern Asia | 521 | 0.7% |
| Southern Europe | 543 | 0.7% |
| Sweden | 19 | 0.0% |
| Switzerland | 48 | 0.1% |
| Syria | 297 | 0.4% |
| Thailand | 19 | 0.0% |
| Turkey | 53 | 0.1% |
| Vietnam | 30 | 0.0% |
| Western Africa | 23 | 0.0% |
| Western Asia | 1,032 | 1.4% |
| Western Europe | 157 | 0.2% | View All 69 Rows |
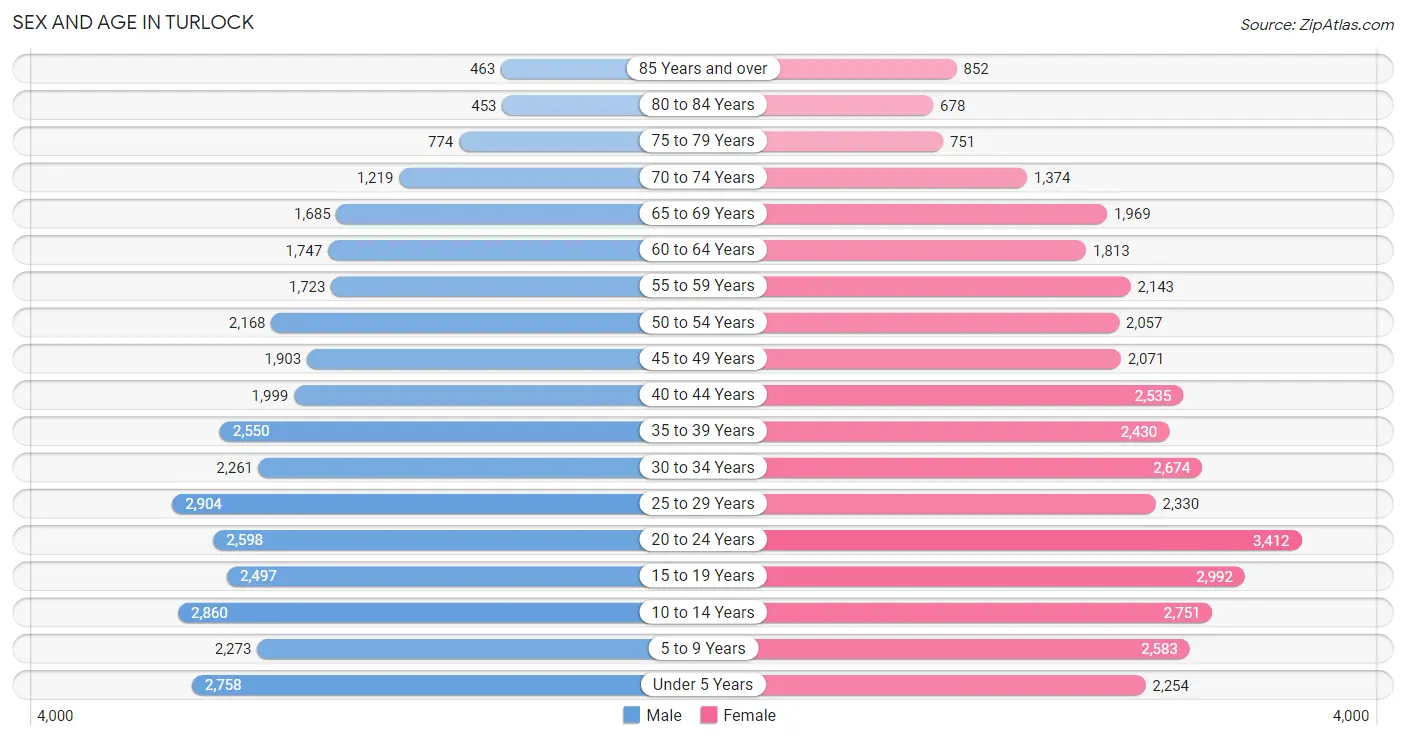
Sex and Age in Turlock
Sex and Age in Turlock
The most populous age groups in Turlock are 25 to 29 Years (2,904 | 8.3%) for men and 20 to 24 Years (3,412 | 9.1%) for women.
| Age Bracket | Male | Female |
| Under 5 Years | 2,758 (7.9%) | 2,254 (6.0%) |
| 5 to 9 Years | 2,273 (6.5%) | 2,583 (6.9%) |
| 10 to 14 Years | 2,860 (8.2%) | 2,751 (7.3%) |
| 15 to 19 Years | 2,497 (7.2%) | 2,992 (7.9%) |
| 20 to 24 Years | 2,598 (7.5%) | 3,412 (9.1%) |
| 25 to 29 Years | 2,904 (8.3%) | 2,330 (6.2%) |
| 30 to 34 Years | 2,261 (6.5%) | 2,674 (7.1%) |
| 35 to 39 Years | 2,550 (7.3%) | 2,430 (6.5%) |
| 40 to 44 Years | 1,999 (5.7%) | 2,535 (6.7%) |
| 45 to 49 Years | 1,903 (5.5%) | 2,071 (5.5%) |
| 50 to 54 Years | 2,168 (6.2%) | 2,057 (5.5%) |
| 55 to 59 Years | 1,723 (5.0%) | 2,143 (5.7%) |
| 60 to 64 Years | 1,747 (5.0%) | 1,813 (4.8%) |
| 65 to 69 Years | 1,685 (4.8%) | 1,969 (5.2%) |
| 70 to 74 Years | 1,219 (3.5%) | 1,374 (3.6%) |
| 75 to 79 Years | 774 (2.2%) | 751 (2.0%) |
| 80 to 84 Years | 453 (1.3%) | 678 (1.8%) |
| 85 Years and over | 463 (1.3%) | 852 (2.3%) |
| Total | 34,835 (100.0%) | 37,669 (100.0%) |
Families and Households in Turlock
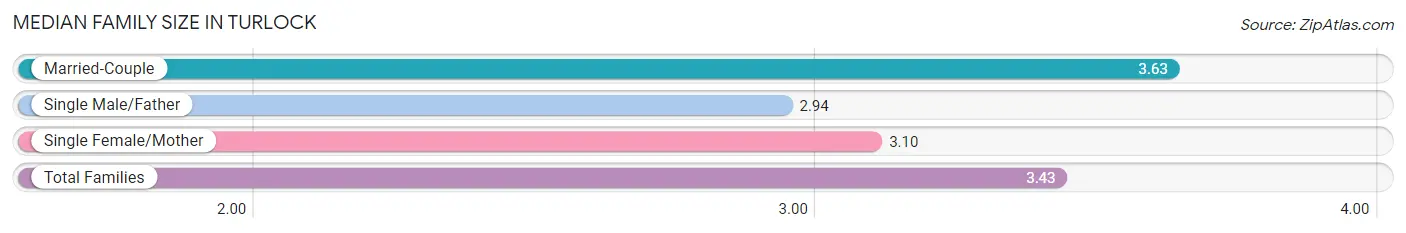
Median Family Size in Turlock
The median family size in Turlock is 3.43 persons per family, with married-couple families (11,689 | 67.3%) accounting for the largest median family size of 3.63 persons per family. On the other hand, single male/father families (1,932 | 11.1%) represent the smallest median family size with 2.94 persons per family.
| Family Type | # Families | Family Size |
| Married-Couple | 11,689 (67.3%) | 3.63 |
| Single Male/Father | 1,932 (11.1%) | 2.94 |
| Single Female/Mother | 3,756 (21.6%) | 3.10 |
| Total Families | 17,377 (100.0%) | 3.43 |
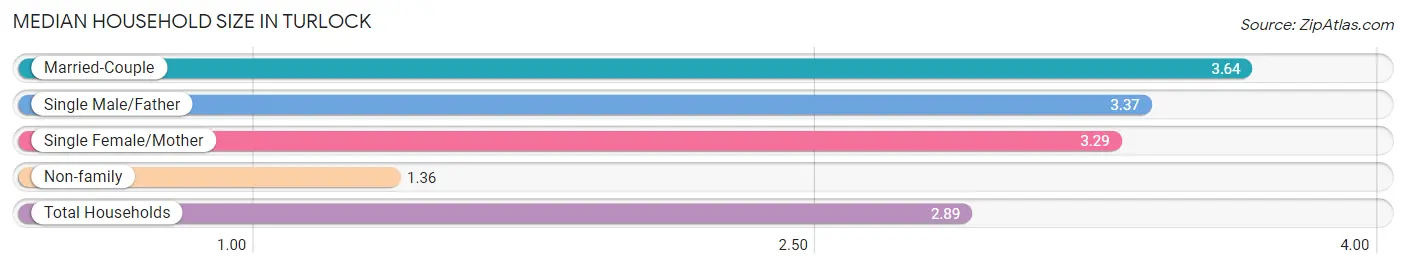
Median Household Size in Turlock
The median household size in Turlock is 2.89 persons per household, with married-couple households (11,689 | 47.3%) accounting for the largest median household size of 3.64 persons per household. non-family households (7,356 | 29.7%) represent the smallest median household size with 1.36 persons per household.
| Household Type | # Households | Household Size |
| Married-Couple | 11,689 (47.3%) | 3.64 |
| Single Male/Father | 1,932 (7.8%) | 3.37 |
| Single Female/Mother | 3,756 (15.2%) | 3.29 |
| Non-family | 7,356 (29.7%) | 1.36 |
| Total Households | 24,733 (100.0%) | 2.89 |
Household Size by Marriage Status in Turlock
Out of a total of 24,733 households in Turlock, 17,377 (70.3%) are family households, while 7,356 (29.7%) are nonfamily households. The most numerous type of family households are 2-person households, comprising 6,464, and the most common type of nonfamily households are 1-person households, comprising 5,438.
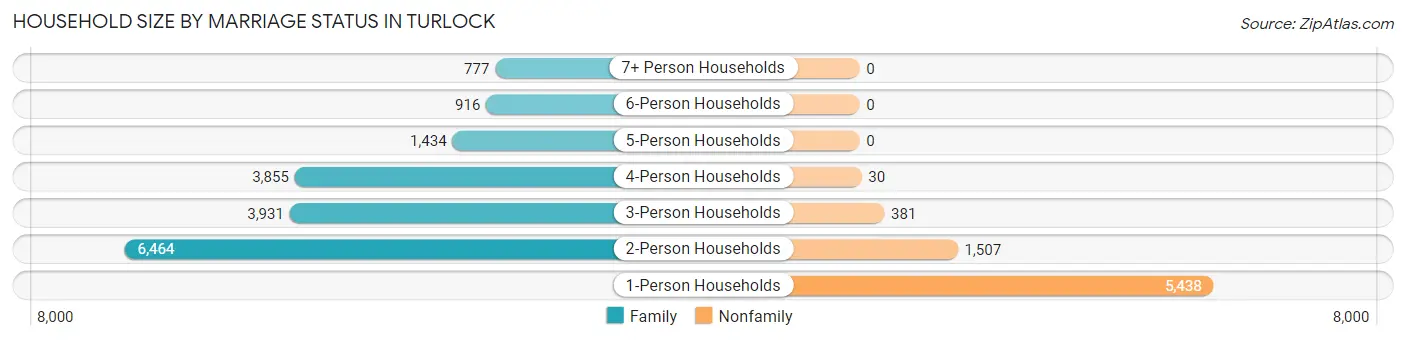
| Household Size | Family Households | Nonfamily Households |
| 1-Person Households | - | 5,438 (22.0%) |
| 2-Person Households | 6,464 (26.1%) | 1,507 (6.1%) |
| 3-Person Households | 3,931 (15.9%) | 381 (1.5%) |
| 4-Person Households | 3,855 (15.6%) | 30 (0.1%) |
| 5-Person Households | 1,434 (5.8%) | 0 (0.0%) |
| 6-Person Households | 916 (3.7%) | 0 (0.0%) |
| 7+ Person Households | 777 (3.1%) | 0 (0.0%) |
| Total | 17,377 (70.3%) | 7,356 (29.7%) |
Female Fertility in Turlock
Fertility by Age in Turlock
Average fertility rate in Turlock is 64.0 births per 1,000 women. Women in the age bracket of 20 to 34 years have the highest fertility rate with 115.0 births per 1,000 women. Women in the age bracket of 20 to 34 years acount for 80.1% of all women with births.
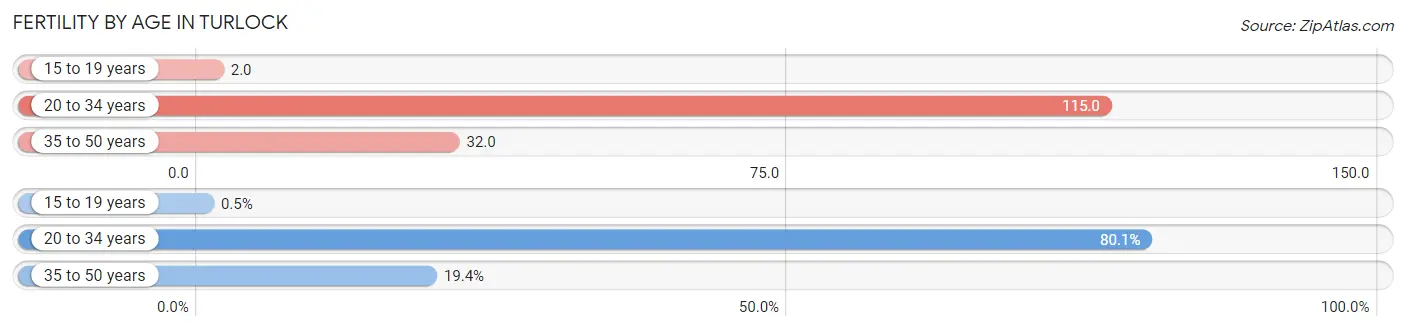
| Age Bracket | Women with Births | Births / 1,000 Women |
| 15 to 19 years | 6 (0.5%) | 2.0 |
| 20 to 34 years | 965 (80.1%) | 115.0 |
| 35 to 50 years | 234 (19.4%) | 32.0 |
| Total | 1,205 (100.0%) | 64.0 |
Fertility by Age by Marriage Status in Turlock
75.4% of women with births (1,205) in Turlock are married. The highest percentage of unmarried women with births falls into 15 to 19 years age bracket with 100.0% of them unmarried at the time of birth, while the lowest percentage of unmarried women with births belong to 35 to 50 years age bracket with 2.6% of them unmarried.
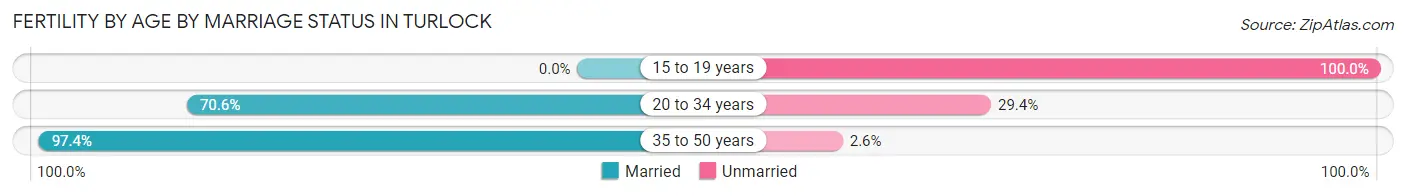
| Age Bracket | Married | Unmarried |
| 15 to 19 years | 0 (0.0%) | 6 (100.0%) |
| 20 to 34 years | 681 (70.6%) | 284 (29.4%) |
| 35 to 50 years | 228 (97.4%) | 6 (2.6%) |
| Total | 909 (75.4%) | 296 (24.6%) |
Fertility by Education in Turlock
Average fertility rate in Turlock is 64.0 births per 1,000 women. Women with the education attainment of graduate degree have the highest fertility rate of 160.0 births per 1,000 women, while women with the education attainment of less than high school have the lowest fertility at 5.0 births per 1,000 women. Women with the education attainment of high school diploma represent 41.3% of all women with births.
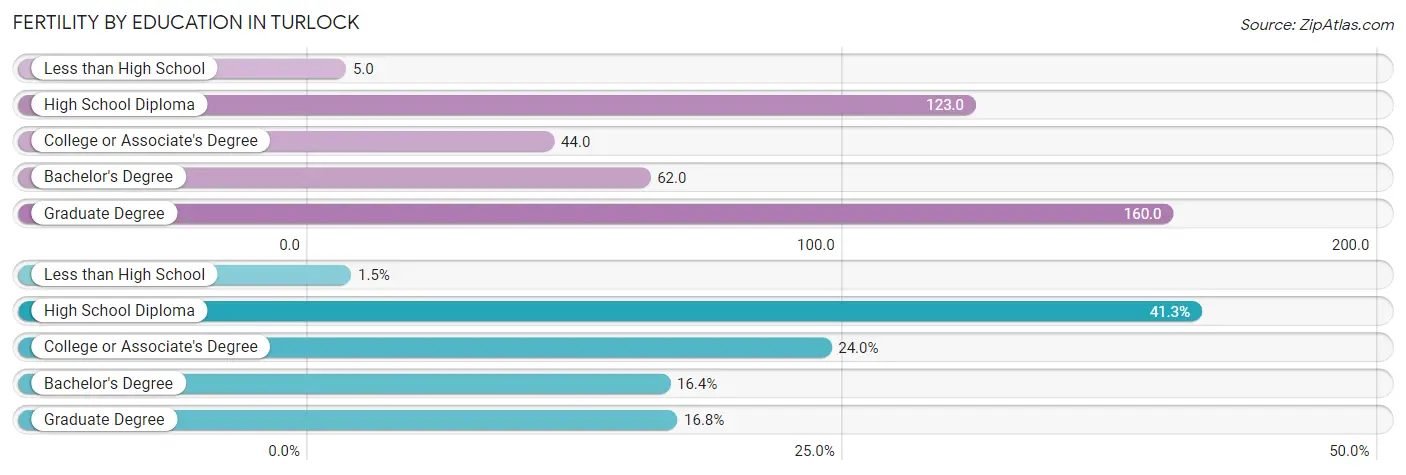
| Educational Attainment | Women with Births | Births / 1,000 Women |
| Less than High School | 18 (1.5%) | 5.0 |
| High School Diploma | 498 (41.3%) | 123.0 |
| College or Associate's Degree | 289 (24.0%) | 44.0 |
| Bachelor's Degree | 198 (16.4%) | 62.0 |
| Graduate Degree | 202 (16.8%) | 160.0 |
| Total | 1,205 (100.0%) | 64.0 |
Fertility by Education by Marriage Status in Turlock
24.6% of women with births in Turlock are unmarried. Women with the educational attainment of graduate degree are most likely to be married with 97.0% of them married at childbirth, while women with the educational attainment of college or associate's degree are least likely to be married with 44.6% of them unmarried at childbirth.
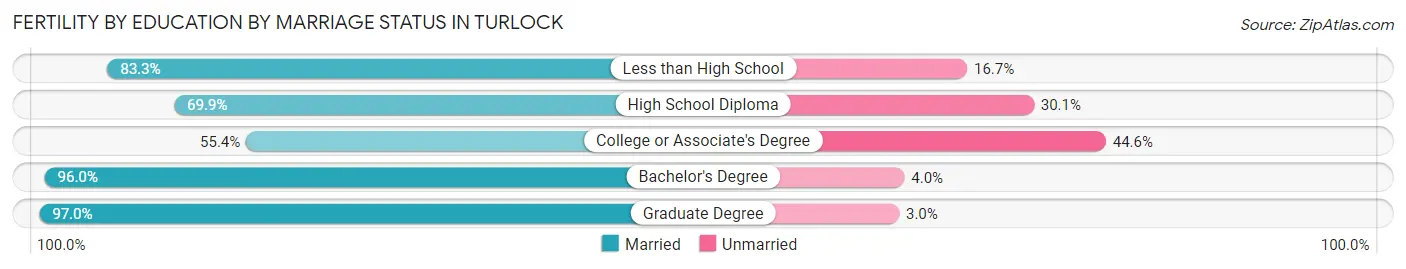
| Educational Attainment | Married | Unmarried |
| Less than High School | 15 (83.3%) | 3 (16.7%) |
| High School Diploma | 348 (69.9%) | 150 (30.1%) |
| College or Associate's Degree | 160 (55.4%) | 129 (44.6%) |
| Bachelor's Degree | 190 (96.0%) | 8 (4.0%) |
| Graduate Degree | 196 (97.0%) | 6 (3.0%) |
| Total | 909 (75.4%) | 296 (24.6%) |
Employment Characteristics in Turlock
Employment by Class of Employer in Turlock
Among the 30,638 employed individuals in Turlock, private company employees (20,587 | 67.2%), local government employees (4,262 | 13.9%), and not-for-profit organizations (1,835 | 6.0%) make up the most common classes of employment.
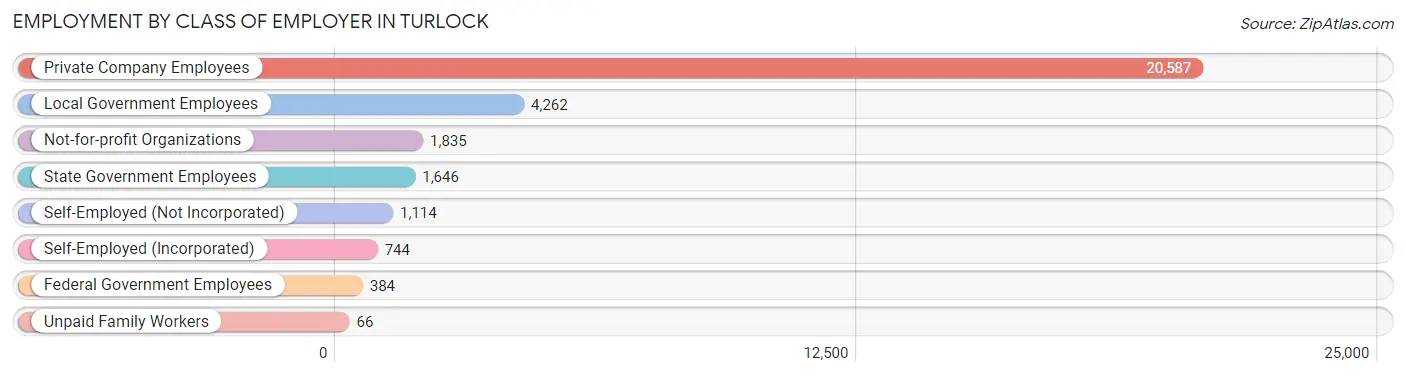
| Employer Class | # Employees | % Employees |
| Private Company Employees | 20,587 | 67.2% |
| Self-Employed (Incorporated) | 744 | 2.4% |
| Self-Employed (Not Incorporated) | 1,114 | 3.6% |
| Not-for-profit Organizations | 1,835 | 6.0% |
| Local Government Employees | 4,262 | 13.9% |
| State Government Employees | 1,646 | 5.4% |
| Federal Government Employees | 384 | 1.3% |
| Unpaid Family Workers | 66 | 0.2% |
| Total | 30,638 | 100.0% |
Employment Status by Age in Turlock
According to the labor force statistics for Turlock, out of the total population over 16 years of age (55,848), 61.5% or 34,347 individuals are in the labor force, with 7.6% or 2,610 of them unemployed. The age group with the highest labor force participation rate is 25 to 29 years, with 85.6% or 4,480 individuals in the labor force. Within the labor force, the 16 to 19 years age range has the highest percentage of unemployed individuals, with 27.7% or 381 of them being unemployed.
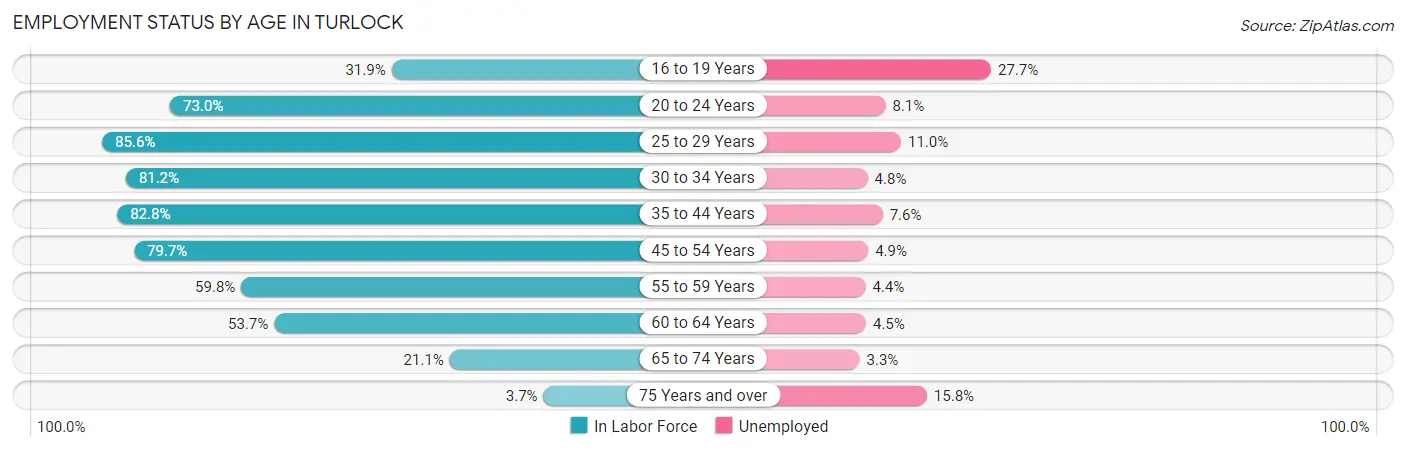
| Age Bracket | In Labor Force | Unemployed |
| 16 to 19 Years | 1,376 (31.9%) | 381 (27.7%) |
| 20 to 24 Years | 4,387 (73.0%) | 355 (8.1%) |
| 25 to 29 Years | 4,480 (85.6%) | 493 (11.0%) |
| 30 to 34 Years | 4,007 (81.2%) | 192 (4.8%) |
| 35 to 44 Years | 7,878 (82.8%) | 599 (7.6%) |
| 45 to 54 Years | 6,535 (79.7%) | 320 (4.9%) |
| 55 to 59 Years | 2,312 (59.8%) | 102 (4.4%) |
| 60 to 64 Years | 1,912 (53.7%) | 86 (4.5%) |
| 65 to 74 Years | 1,318 (21.1%) | 43 (3.3%) |
| 75 Years and over | 147 (3.7%) | 23 (15.8%) |
| Total | 34,347 (61.5%) | 2,610 (7.6%) |
Employment Status by Educational Attainment in Turlock
According to labor force statistics for Turlock, 76.8% of individuals (27,117) out of the total population between 25 and 64 years of age (35,308) are in the labor force, with 6.6% or 1,790 of them being unemployed. The group with the highest labor force participation rate are those with the educational attainment of bachelor's degree or higher, with 87.2% or 8,458 individuals in the labor force. Within the labor force, individuals with less than high school education have the highest percentage of unemployment, with 9.7% or 349 of them being unemployed.
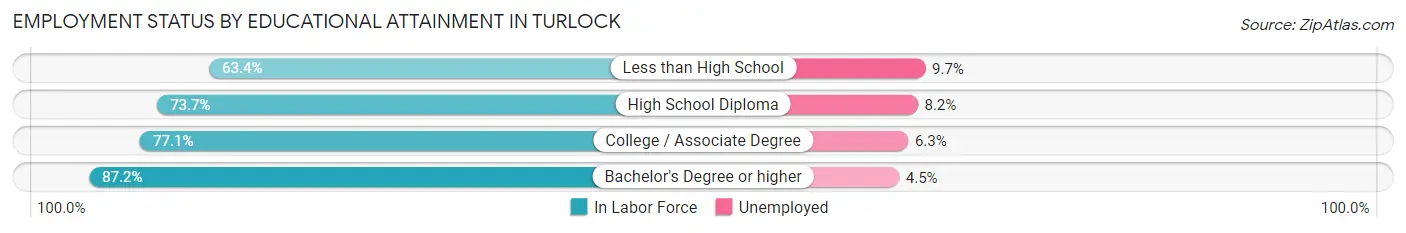
| Educational Attainment | In Labor Force | Unemployed |
| Less than High School | 3,601 (63.4%) | 551 (9.7%) |
| High School Diploma | 6,276 (73.7%) | 698 (8.2%) |
| College / Associate Degree | 8,800 (77.1%) | 719 (6.3%) |
| Bachelor's Degree or higher | 8,458 (87.2%) | 436 (4.5%) |
| Total | 27,117 (76.8%) | 2,330 (6.6%) |
Employment Occupations by Sex in Turlock
Management, Business, Science and Arts Occupations
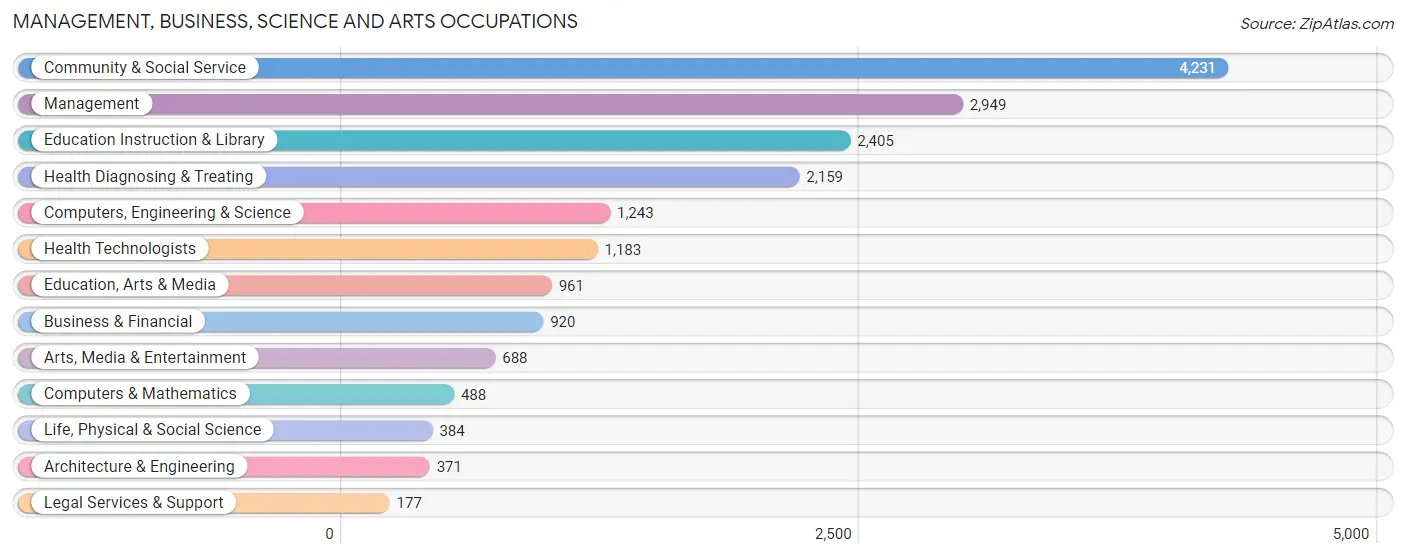
The most common Management, Business, Science and Arts occupations in Turlock are Community & Social Service (4,231 | 13.3%), Management (2,949 | 9.3%), Education Instruction & Library (2,405 | 7.6%), Health Diagnosing & Treating (2,159 | 6.8%), and Computers, Engineering & Science (1,243 | 3.9%).
Management, Business, Science and Arts Occupations by Sex
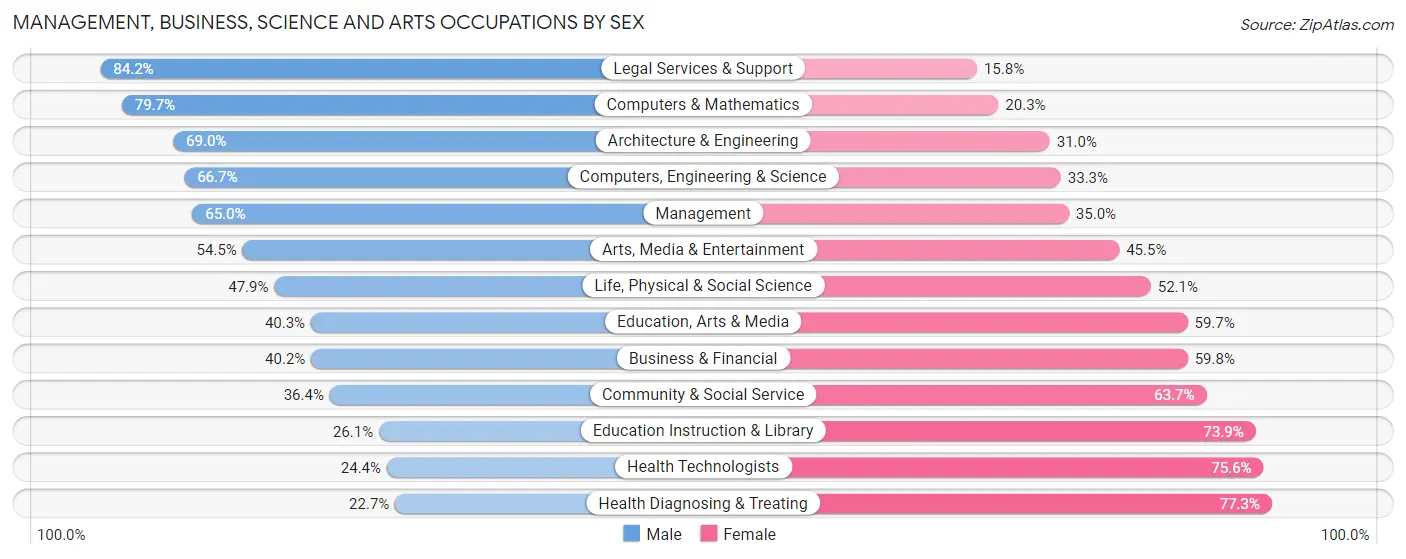
Within the Management, Business, Science and Arts occupations in Turlock, the most male-oriented occupations are Legal Services & Support (84.2%), Computers & Mathematics (79.7%), and Architecture & Engineering (69.0%), while the most female-oriented occupations are Health Diagnosing & Treating (77.3%), Health Technologists (75.6%), and Education Instruction & Library (73.9%).
| Occupation | Male | Female |
| Management | 1,917 (65.0%) | 1,032 (35.0%) |
| Business & Financial | 370 (40.2%) | 550 (59.8%) |
| Computers, Engineering & Science | 829 (66.7%) | 414 (33.3%) |
| Computers & Mathematics | 389 (79.7%) | 99 (20.3%) |
| Architecture & Engineering | 256 (69.0%) | 115 (31.0%) |
| Life, Physical & Social Science | 184 (47.9%) | 200 (52.1%) |
| Community & Social Service | 1,538 (36.3%) | 2,693 (63.6%) |
| Education, Arts & Media | 387 (40.3%) | 574 (59.7%) |
| Legal Services & Support | 149 (84.2%) | 28 (15.8%) |
| Education Instruction & Library | 627 (26.1%) | 1,778 (73.9%) |
| Arts, Media & Entertainment | 375 (54.5%) | 313 (45.5%) |
| Health Diagnosing & Treating | 490 (22.7%) | 1,669 (77.3%) |
| Health Technologists | 289 (24.4%) | 894 (75.6%) |
| Total (Category) | 5,144 (44.7%) | 6,358 (55.3%) |
| Total (Overall) | 17,131 (54.0%) | 14,615 (46.0%) |
Services Occupations
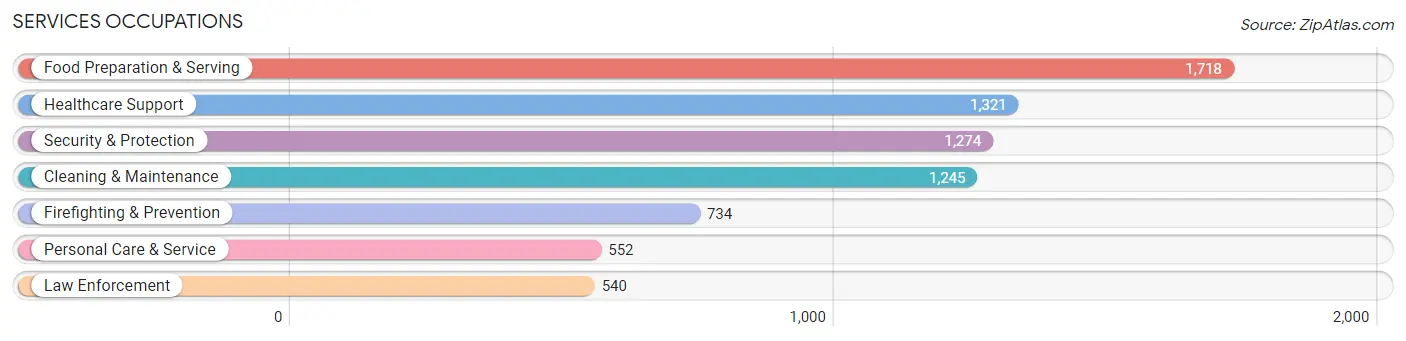
The most common Services occupations in Turlock are Food Preparation & Serving (1,718 | 5.4%), Healthcare Support (1,321 | 4.2%), Security & Protection (1,274 | 4.0%), Cleaning & Maintenance (1,245 | 3.9%), and Firefighting & Prevention (734 | 2.3%).
Services Occupations by Sex
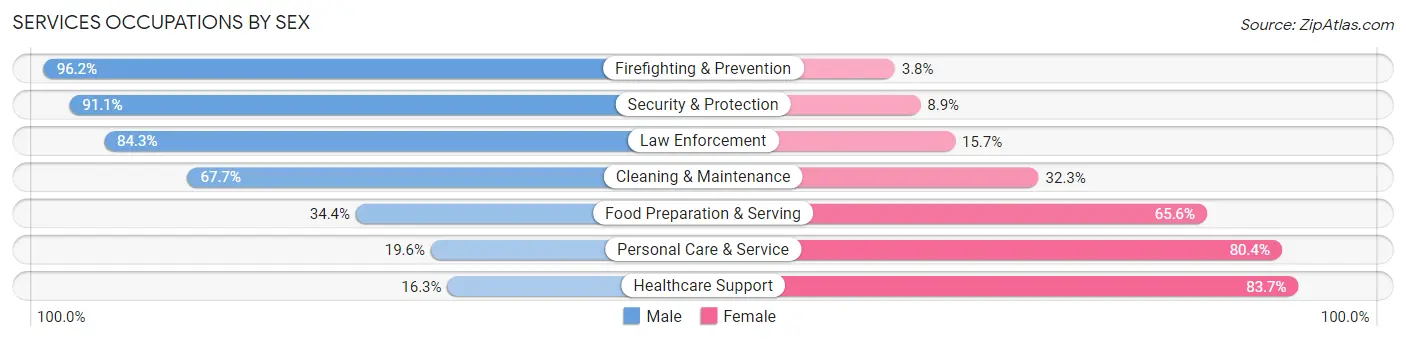
Within the Services occupations in Turlock, the most male-oriented occupations are Firefighting & Prevention (96.2%), Security & Protection (91.1%), and Law Enforcement (84.3%), while the most female-oriented occupations are Healthcare Support (83.7%), Personal Care & Service (80.4%), and Food Preparation & Serving (65.6%).
| Occupation | Male | Female |
| Healthcare Support | 215 (16.3%) | 1,106 (83.7%) |
| Security & Protection | 1,161 (91.1%) | 113 (8.9%) |
| Firefighting & Prevention | 706 (96.2%) | 28 (3.8%) |
| Law Enforcement | 455 (84.3%) | 85 (15.7%) |
| Food Preparation & Serving | 591 (34.4%) | 1,127 (65.6%) |
| Cleaning & Maintenance | 843 (67.7%) | 402 (32.3%) |
| Personal Care & Service | 108 (19.6%) | 444 (80.4%) |
| Total (Category) | 2,918 (47.8%) | 3,192 (52.2%) |
| Total (Overall) | 17,131 (54.0%) | 14,615 (46.0%) |
Sales and Office Occupations
The most common Sales and Office occupations in Turlock are Sales & Related (3,037 | 9.6%), and Office & Administration (2,906 | 9.1%).

Sales and Office Occupations by Sex
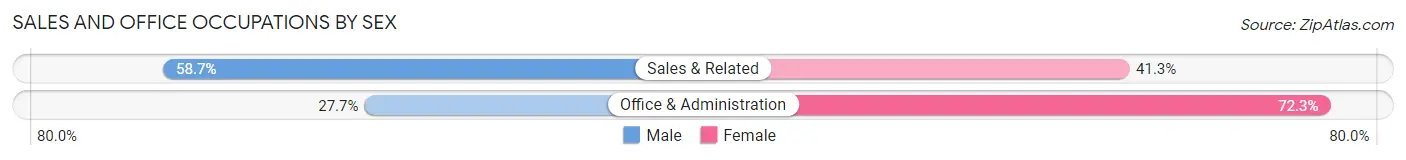
| Occupation | Male | Female |
| Sales & Related | 1,782 (58.7%) | 1,255 (41.3%) |
| Office & Administration | 806 (27.7%) | 2,100 (72.3%) |
| Total (Category) | 2,588 (43.5%) | 3,355 (56.5%) |
| Total (Overall) | 17,131 (54.0%) | 14,615 (46.0%) |
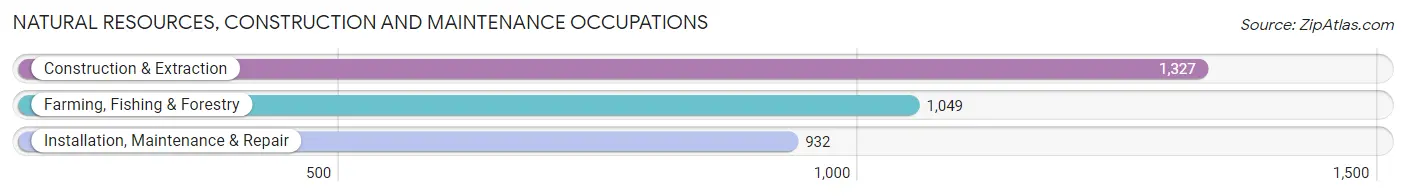
Natural Resources, Construction and Maintenance Occupations
The most common Natural Resources, Construction and Maintenance occupations in Turlock are Construction & Extraction (1,327 | 4.2%), Farming, Fishing & Forestry (1,049 | 3.3%), and Installation, Maintenance & Repair (932 | 2.9%).
Natural Resources, Construction and Maintenance Occupations by Sex
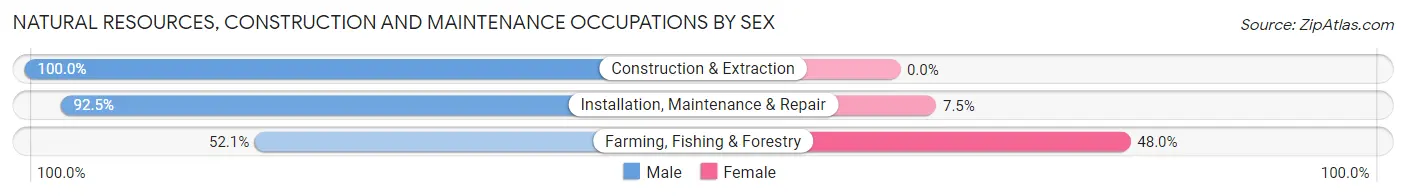
| Occupation | Male | Female |
| Farming, Fishing & Forestry | 546 (52.0%) | 503 (47.9%) |
| Construction & Extraction | 1,327 (100.0%) | 0 (0.0%) |
| Installation, Maintenance & Repair | 862 (92.5%) | 70 (7.5%) |
| Total (Category) | 2,735 (82.7%) | 573 (17.3%) |
| Total (Overall) | 17,131 (54.0%) | 14,615 (46.0%) |
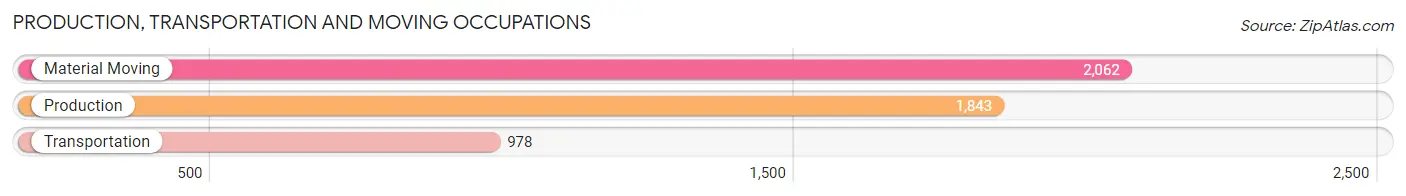
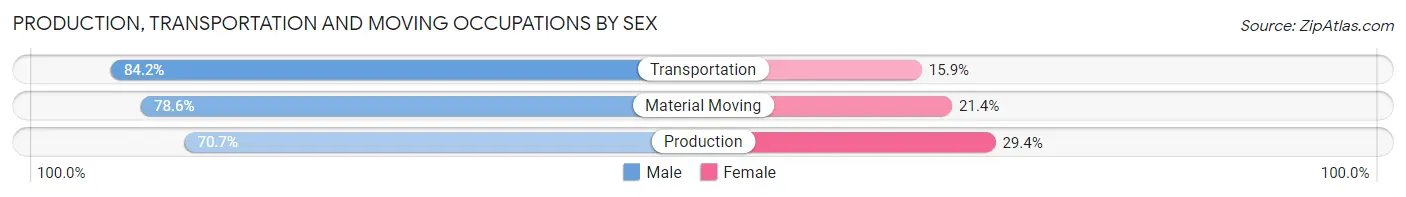
Production, Transportation and Moving Occupations
The most common Production, Transportation and Moving occupations in Turlock are Material Moving (2,062 | 6.5%), Production (1,843 | 5.8%), and Transportation (978 | 3.1%).
Production, Transportation and Moving Occupations by Sex
| Occupation | Male | Female |
| Production | 1,302 (70.7%) | 541 (29.3%) |
| Transportation | 823 (84.2%) | 155 (15.9%) |
| Material Moving | 1,621 (78.6%) | 441 (21.4%) |
| Total (Category) | 3,746 (76.7%) | 1,137 (23.3%) |
| Total (Overall) | 17,131 (54.0%) | 14,615 (46.0%) |
Employment Industries by Sex in Turlock
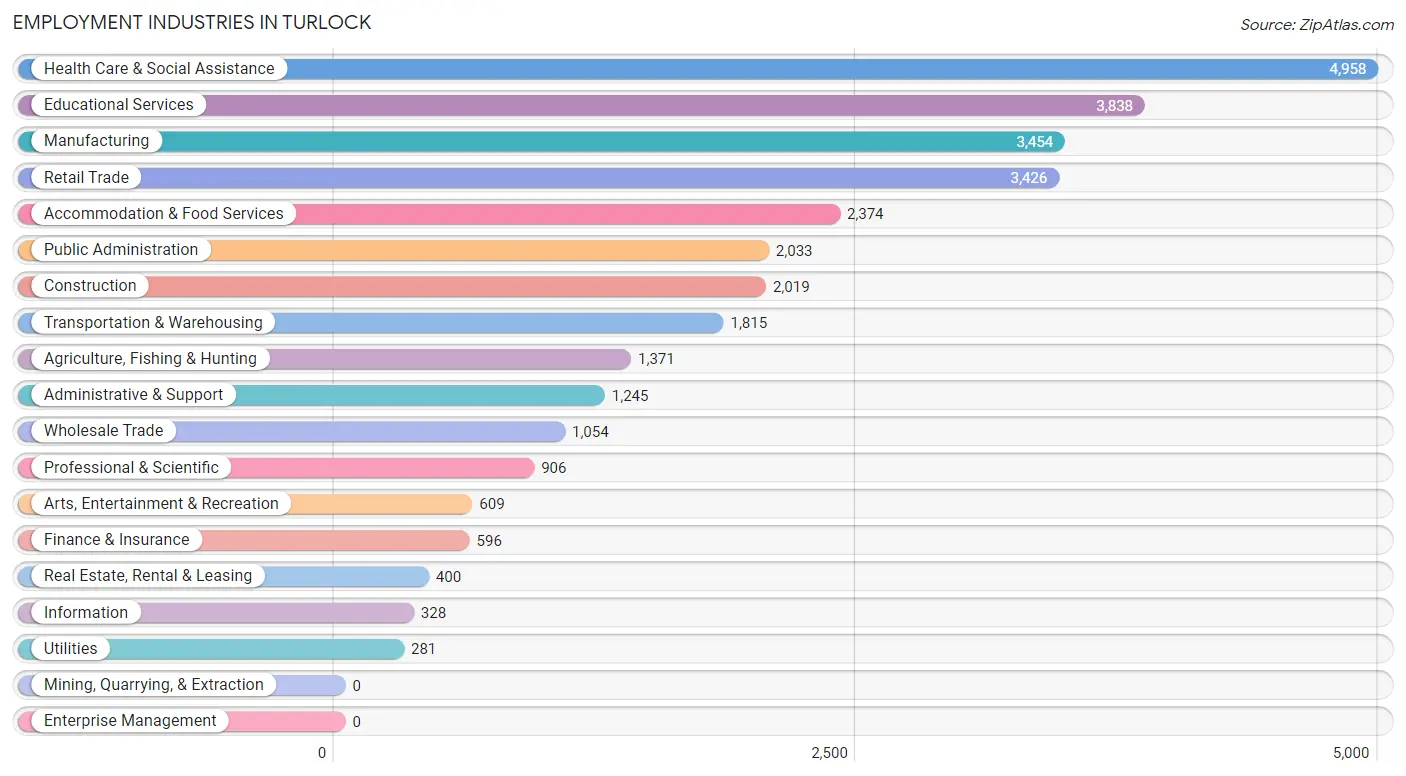
Employment Industries in Turlock
The major employment industries in Turlock include Health Care & Social Assistance (4,958 | 15.6%), Educational Services (3,838 | 12.1%), Manufacturing (3,454 | 10.9%), Retail Trade (3,426 | 10.8%), and Accommodation & Food Services (2,374 | 7.5%).
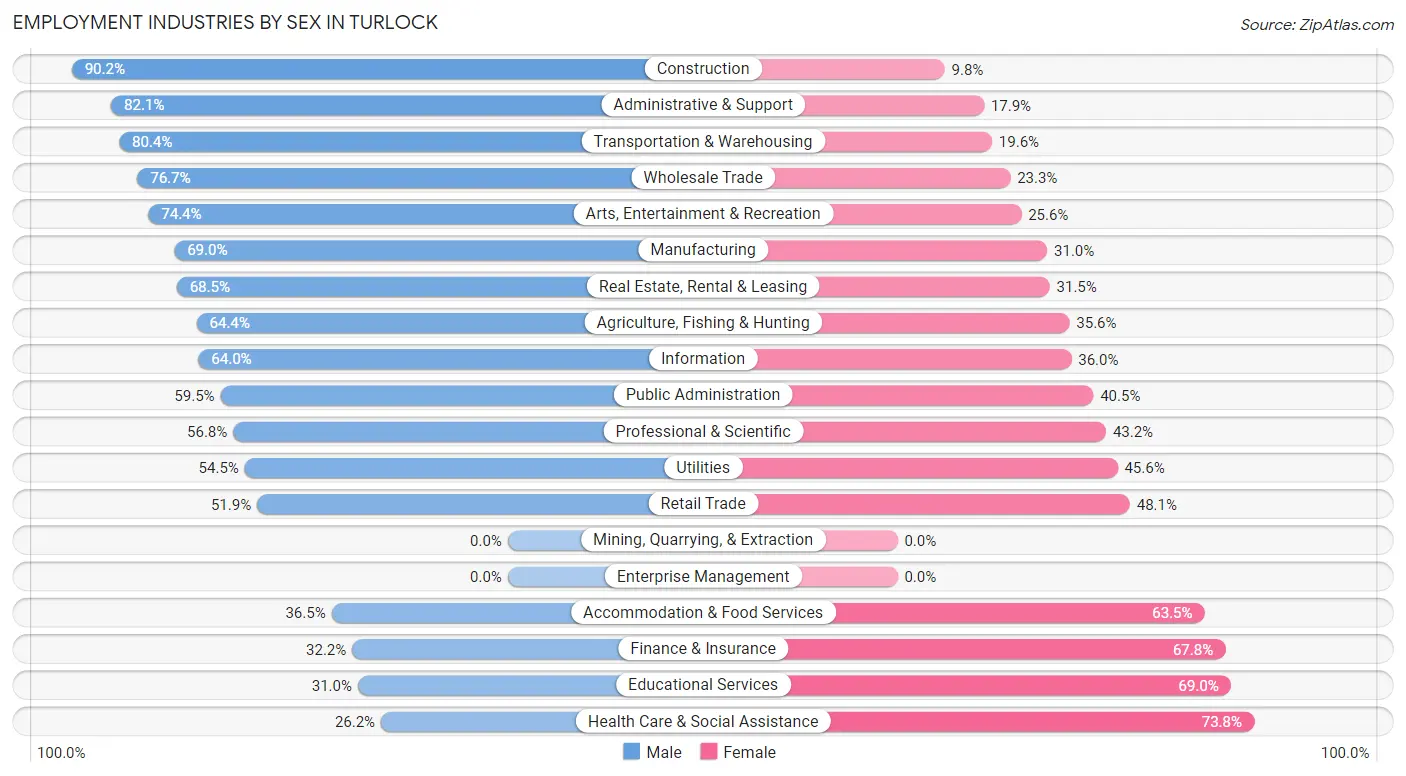
Employment Industries by Sex in Turlock
The Turlock industries that see more men than women are Construction (90.2%), Administrative & Support (82.1%), and Transportation & Warehousing (80.4%), whereas the industries that tend to have a higher number of women are Health Care & Social Assistance (73.8%), Educational Services (69.0%), and Finance & Insurance (67.8%).
| Industry | Male | Female |
| Agriculture, Fishing & Hunting | 883 (64.4%) | 488 (35.6%) |
| Mining, Quarrying, & Extraction | 0 (0.0%) | 0 (0.0%) |
| Construction | 1,822 (90.2%) | 197 (9.8%) |
| Manufacturing | 2,384 (69.0%) | 1,070 (31.0%) |
| Wholesale Trade | 808 (76.7%) | 246 (23.3%) |
| Retail Trade | 1,778 (51.9%) | 1,648 (48.1%) |
| Transportation & Warehousing | 1,460 (80.4%) | 355 (19.6%) |
| Utilities | 153 (54.4%) | 128 (45.6%) |
| Information | 210 (64.0%) | 118 (36.0%) |
| Finance & Insurance | 192 (32.2%) | 404 (67.8%) |
| Real Estate, Rental & Leasing | 274 (68.5%) | 126 (31.5%) |
| Professional & Scientific | 515 (56.8%) | 391 (43.2%) |
| Enterprise Management | 0 (0.0%) | 0 (0.0%) |
| Administrative & Support | 1,022 (82.1%) | 223 (17.9%) |
| Educational Services | 1,191 (31.0%) | 2,647 (69.0%) |
| Health Care & Social Assistance | 1,301 (26.2%) | 3,657 (73.8%) |
| Arts, Entertainment & Recreation | 453 (74.4%) | 156 (25.6%) |
| Accommodation & Food Services | 866 (36.5%) | 1,508 (63.5%) |
| Public Administration | 1,209 (59.5%) | 824 (40.5%) |
| Total | 17,131 (54.0%) | 14,615 (46.0%) |
Education in Turlock
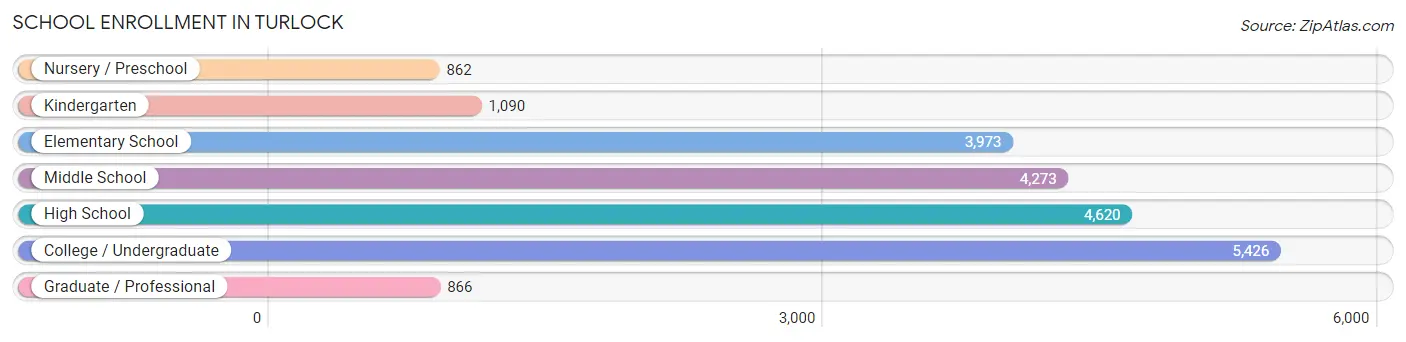
School Enrollment in Turlock
The most common levels of schooling among the 21,110 students in Turlock are college / undergraduate (5,426 | 25.7%), high school (4,620 | 21.9%), and middle school (4,273 | 20.2%).
| School Level | # Students | % Students |
| Nursery / Preschool | 862 | 4.1% |
| Kindergarten | 1,090 | 5.2% |
| Elementary School | 3,973 | 18.8% |
| Middle School | 4,273 | 20.2% |
| High School | 4,620 | 21.9% |
| College / Undergraduate | 5,426 | 25.7% |
| Graduate / Professional | 866 | 4.1% |
| Total | 21,110 | 100.0% |
School Enrollment by Age by Funding Source in Turlock
Out of a total of 21,110 students who are enrolled in schools in Turlock, 1,478 (7.0%) attend a private institution, while the remaining 19,632 (93.0%) are enrolled in public schools. The age group of 25 to 34 year olds has the highest likelihood of being enrolled in private schools, with 420 (24.1% in the age bracket) enrolled. Conversely, the age group of 15 to 17 year olds has the lowest likelihood of being enrolled in a private school, with 3,344 (97.4% in the age bracket) attending a public institution.
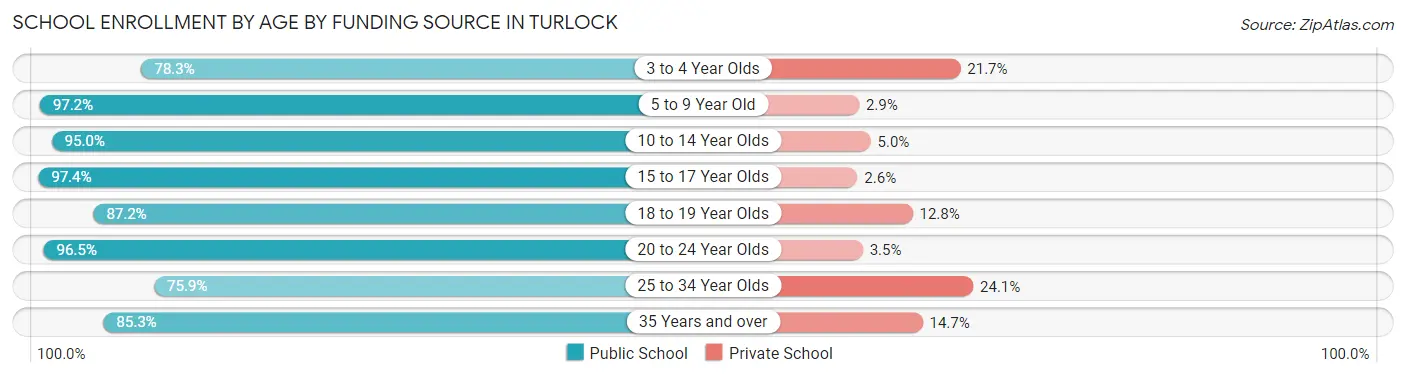
| Age Bracket | Public School | Private School |
| 3 to 4 Year Olds | 601 (78.3%) | 167 (21.7%) |
| 5 to 9 Year Old | 4,570 (97.2%) | 134 (2.9%) |
| 10 to 14 Year Olds | 5,260 (95.0%) | 278 (5.0%) |
| 15 to 17 Year Olds | 3,344 (97.4%) | 88 (2.6%) |
| 18 to 19 Year Olds | 1,270 (87.2%) | 187 (12.8%) |
| 20 to 24 Year Olds | 2,565 (96.5%) | 94 (3.5%) |
| 25 to 34 Year Olds | 1,322 (75.9%) | 420 (24.1%) |
| 35 Years and over | 691 (85.3%) | 119 (14.7%) |
| Total | 19,632 (93.0%) | 1,478 (7.0%) |
Educational Attainment by Field of Study in Turlock
Business (2,206 | 17.8%), arts & humanities (1,444 | 11.6%), social sciences (1,242 | 10.0%), bio, nature & agricultural (1,102 | 8.9%), and science & technology (1,039 | 8.4%) are the most common fields of study among 12,403 individuals in Turlock who have obtained a bachelor's degree or higher.
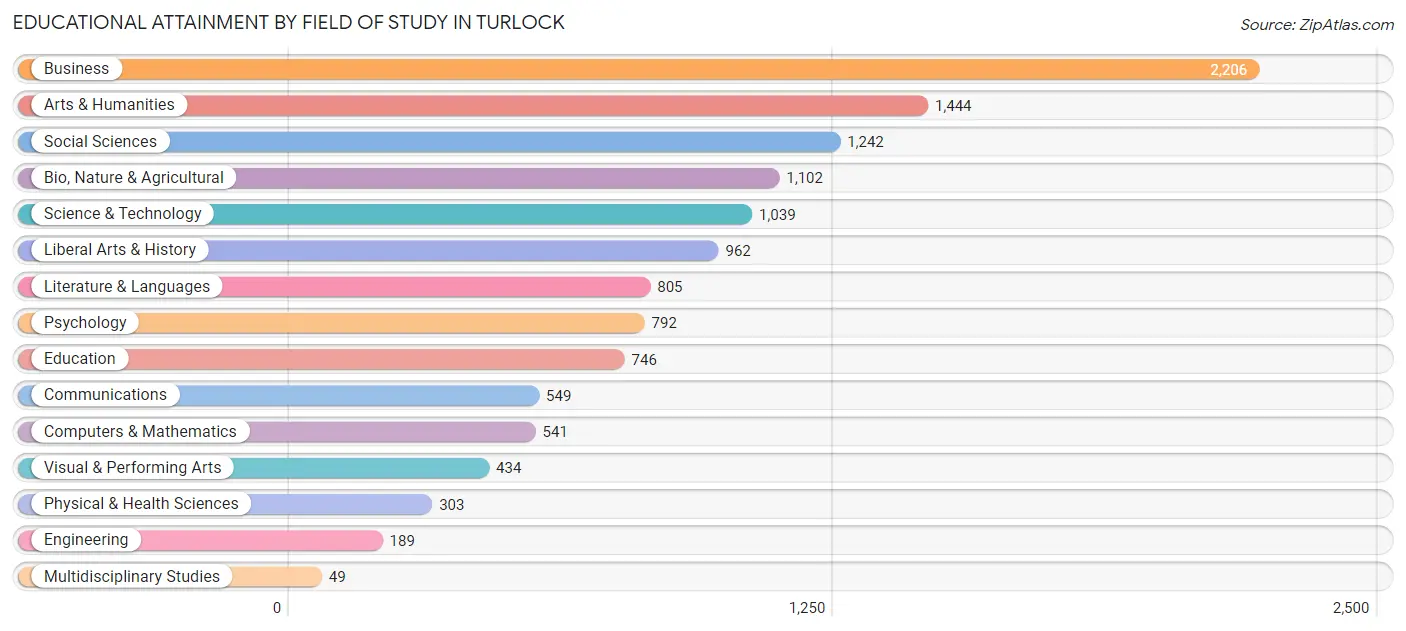
| Field of Study | # Graduates | % Graduates |
| Computers & Mathematics | 541 | 4.4% |
| Bio, Nature & Agricultural | 1,102 | 8.9% |
| Physical & Health Sciences | 303 | 2.4% |
| Psychology | 792 | 6.4% |
| Social Sciences | 1,242 | 10.0% |
| Engineering | 189 | 1.5% |
| Multidisciplinary Studies | 49 | 0.4% |
| Science & Technology | 1,039 | 8.4% |
| Business | 2,206 | 17.8% |
| Education | 746 | 6.0% |
| Literature & Languages | 805 | 6.5% |
| Liberal Arts & History | 962 | 7.8% |
| Visual & Performing Arts | 434 | 3.5% |
| Communications | 549 | 4.4% |
| Arts & Humanities | 1,444 | 11.6% |
| Total | 12,403 | 100.0% |
Transportation & Commute in Turlock
Vehicle Availability by Sex in Turlock
The most prevalent vehicle ownership categories in Turlock are males with 2 vehicles (7,260, accounting for 43.5%) and females with 2 vehicles (5,465, making up 52.5%).
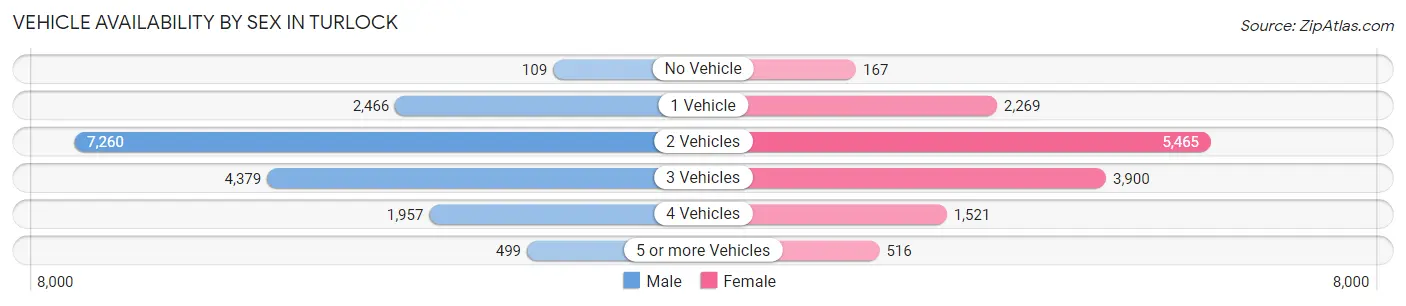
| Vehicles Available | Male | Female |
| No Vehicle | 109 (0.6%) | 167 (1.2%) |
| 1 Vehicle | 2,466 (14.8%) | 2,269 (16.4%) |
| 2 Vehicles | 7,260 (43.5%) | 5,465 (39.5%) |
| 3 Vehicles | 4,379 (26.3%) | 3,900 (28.2%) |
| 4 Vehicles | 1,957 (11.7%) | 1,521 (11.0%) |
| 5 or more Vehicles | 499 (3.0%) | 516 (3.7%) |
| Total | 16,670 (100.0%) | 13,838 (100.0%) |
Commute Time in Turlock
The most frequently occuring commute durations in Turlock are 10 to 14 minutes (4,743 commuters, 16.3%), 5 to 9 minutes (4,229 commuters, 14.5%), and 30 to 34 minutes (4,128 commuters, 14.2%).
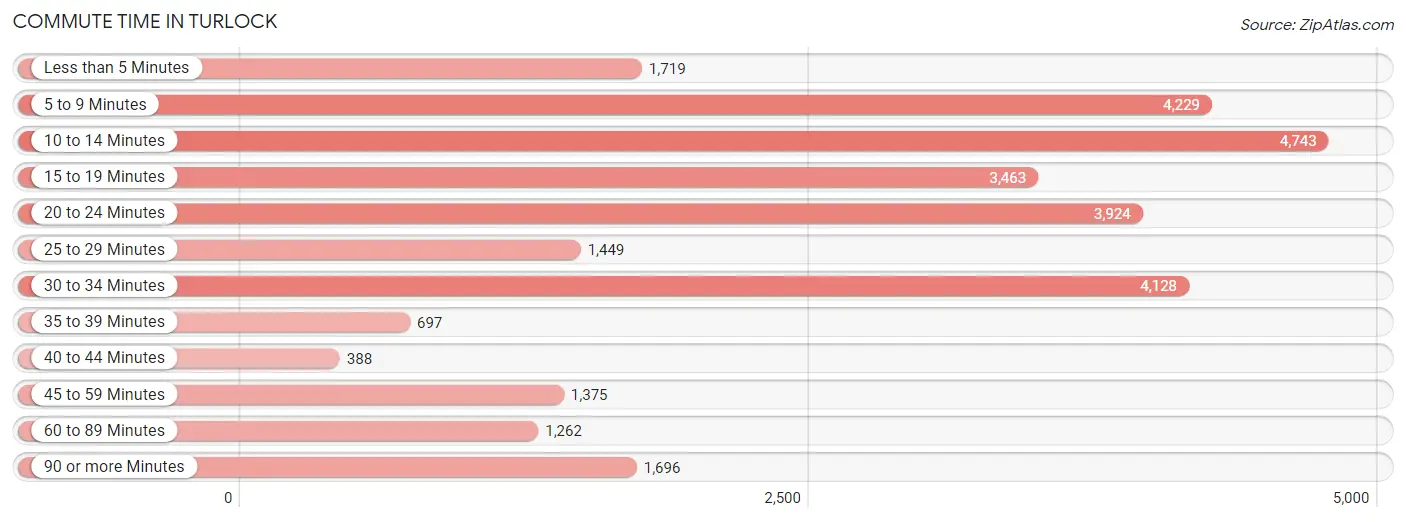
| Commute Time | # Commuters | % Commuters |
| Less than 5 Minutes | 1,719 | 5.9% |
| 5 to 9 Minutes | 4,229 | 14.5% |
| 10 to 14 Minutes | 4,743 | 16.3% |
| 15 to 19 Minutes | 3,463 | 11.9% |
| 20 to 24 Minutes | 3,924 | 13.5% |
| 25 to 29 Minutes | 1,449 | 5.0% |
| 30 to 34 Minutes | 4,128 | 14.2% |
| 35 to 39 Minutes | 697 | 2.4% |
| 40 to 44 Minutes | 388 | 1.3% |
| 45 to 59 Minutes | 1,375 | 4.7% |
| 60 to 89 Minutes | 1,262 | 4.3% |
| 90 or more Minutes | 1,696 | 5.8% |
Commute Time by Sex in Turlock
The most common commute times in Turlock are 30 to 34 minutes (2,524 commuters, 15.8%) for males and 10 to 14 minutes (2,604 commuters, 19.8%) for females.
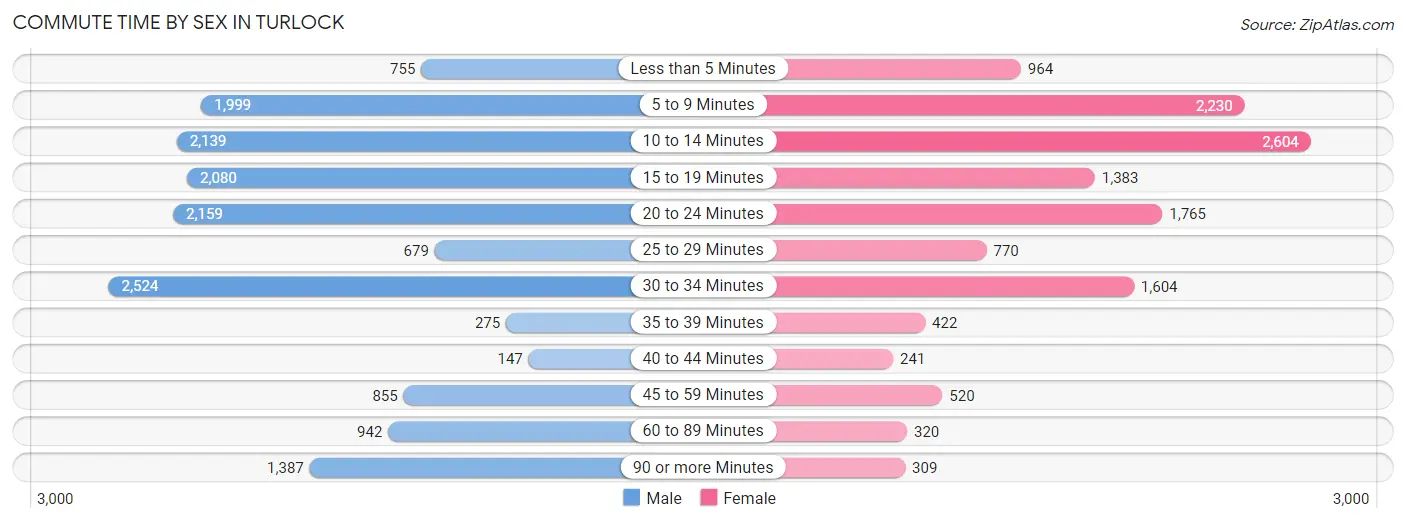
| Commute Time | Male | Female |
| Less than 5 Minutes | 755 (4.7%) | 964 (7.3%) |
| 5 to 9 Minutes | 1,999 (12.5%) | 2,230 (17.0%) |
| 10 to 14 Minutes | 2,139 (13.4%) | 2,604 (19.8%) |
| 15 to 19 Minutes | 2,080 (13.1%) | 1,383 (10.5%) |
| 20 to 24 Minutes | 2,159 (13.5%) | 1,765 (13.4%) |
| 25 to 29 Minutes | 679 (4.3%) | 770 (5.9%) |
| 30 to 34 Minutes | 2,524 (15.8%) | 1,604 (12.2%) |
| 35 to 39 Minutes | 275 (1.7%) | 422 (3.2%) |
| 40 to 44 Minutes | 147 (0.9%) | 241 (1.8%) |
| 45 to 59 Minutes | 855 (5.4%) | 520 (4.0%) |
| 60 to 89 Minutes | 942 (5.9%) | 320 (2.4%) |
| 90 or more Minutes | 1,387 (8.7%) | 309 (2.4%) |
Time of Departure to Work by Sex in Turlock
The most frequent times of departure to work in Turlock are 7:00 AM to 7:29 AM (1,991, 12.5%) for males and 7:00 AM to 7:29 AM (2,198, 16.7%) for females.
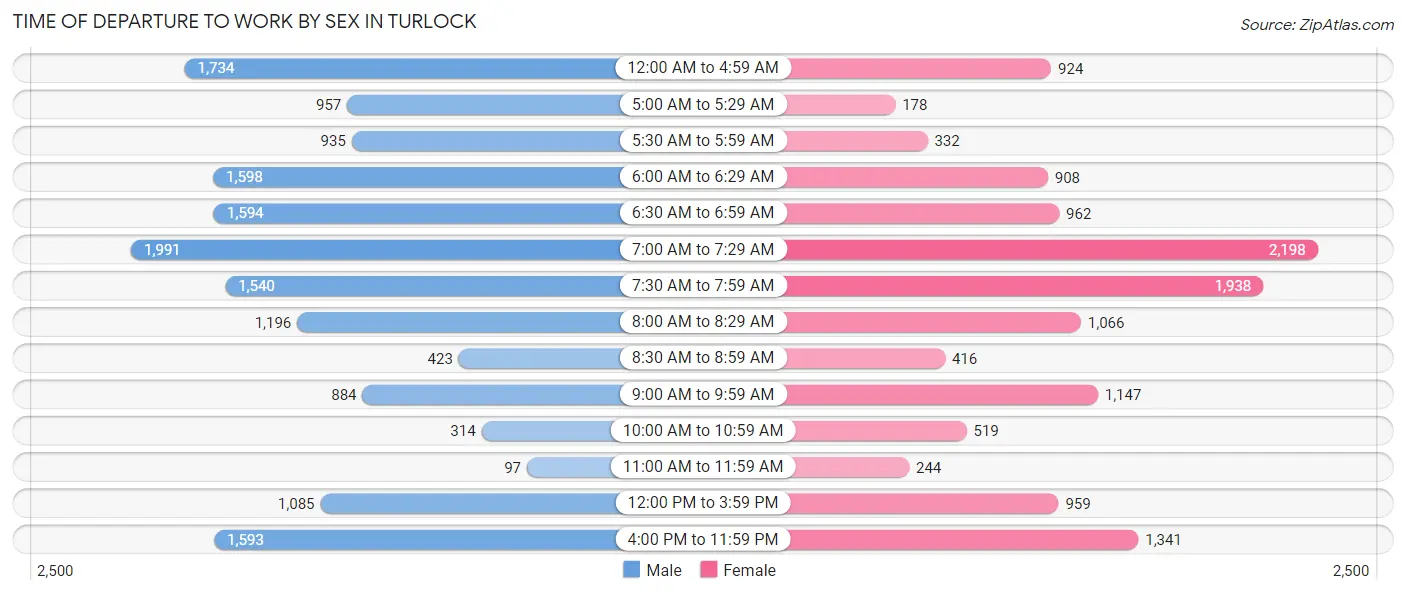
| Time of Departure | Male | Female |
| 12:00 AM to 4:59 AM | 1,734 (10.9%) | 924 (7.0%) |
| 5:00 AM to 5:29 AM | 957 (6.0%) | 178 (1.4%) |
| 5:30 AM to 5:59 AM | 935 (5.9%) | 332 (2.5%) |
| 6:00 AM to 6:29 AM | 1,598 (10.0%) | 908 (6.9%) |
| 6:30 AM to 6:59 AM | 1,594 (10.0%) | 962 (7.3%) |
| 7:00 AM to 7:29 AM | 1,991 (12.5%) | 2,198 (16.7%) |
| 7:30 AM to 7:59 AM | 1,540 (9.7%) | 1,938 (14.8%) |
| 8:00 AM to 8:29 AM | 1,196 (7.5%) | 1,066 (8.1%) |
| 8:30 AM to 8:59 AM | 423 (2.6%) | 416 (3.2%) |
| 9:00 AM to 9:59 AM | 884 (5.6%) | 1,147 (8.7%) |
| 10:00 AM to 10:59 AM | 314 (2.0%) | 519 (4.0%) |
| 11:00 AM to 11:59 AM | 97 (0.6%) | 244 (1.9%) |
| 12:00 PM to 3:59 PM | 1,085 (6.8%) | 959 (7.3%) |
| 4:00 PM to 11:59 PM | 1,593 (10.0%) | 1,341 (10.2%) |
| Total | 15,941 (100.0%) | 13,132 (100.0%) |
Housing Occupancy in Turlock
Occupancy by Ownership in Turlock
Of the total 24,733 dwellings in Turlock, owner-occupied units account for 13,603 (55.0%), while renter-occupied units make up 11,130 (45.0%).
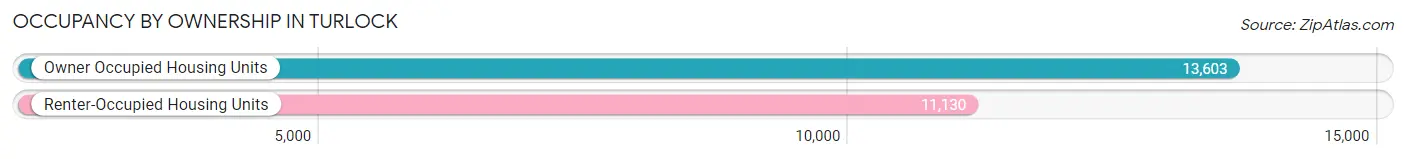
| Occupancy | # Housing Units | % Housing Units |
| Owner Occupied Housing Units | 13,603 | 55.0% |
| Renter-Occupied Housing Units | 11,130 | 45.0% |
| Total Occupied Housing Units | 24,733 | 100.0% |
Occupancy by Household Size in Turlock
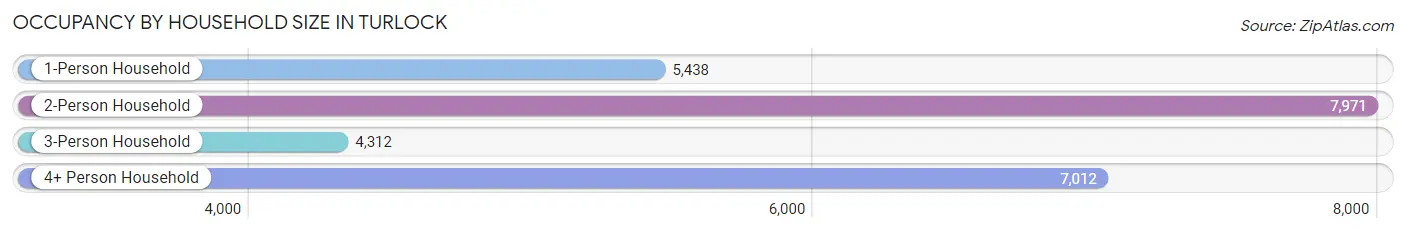
| Household Size | # Housing Units | % Housing Units |
| 1-Person Household | 5,438 | 22.0% |
| 2-Person Household | 7,971 | 32.2% |
| 3-Person Household | 4,312 | 17.4% |
| 4+ Person Household | 7,012 | 28.3% |
| Total Housing Units | 24,733 | 100.0% |
Occupancy by Ownership by Household Size in Turlock
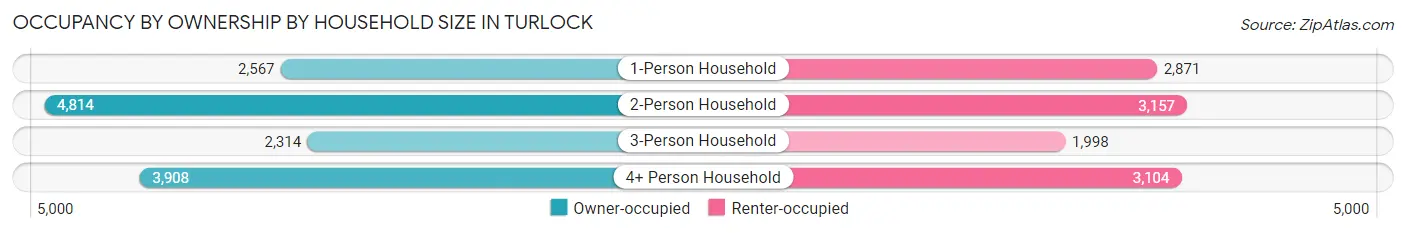
| Household Size | Owner-occupied | Renter-occupied |
| 1-Person Household | 2,567 (47.2%) | 2,871 (52.8%) |
| 2-Person Household | 4,814 (60.4%) | 3,157 (39.6%) |
| 3-Person Household | 2,314 (53.7%) | 1,998 (46.3%) |
| 4+ Person Household | 3,908 (55.7%) | 3,104 (44.3%) |
| Total Housing Units | 13,603 (55.0%) | 11,130 (45.0%) |
Occupancy by Educational Attainment in Turlock
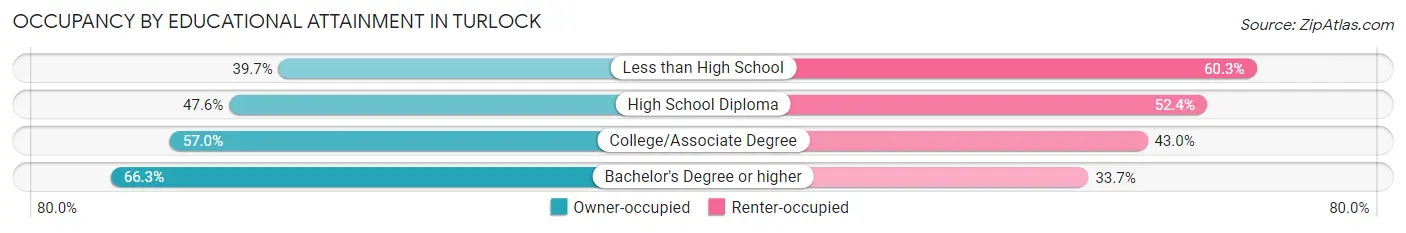
| Household Size | Owner-occupied | Renter-occupied |
| Less than High School | 1,472 (39.7%) | 2,234 (60.3%) |
| High School Diploma | 2,587 (47.6%) | 2,852 (52.4%) |
| College/Associate Degree | 4,838 (57.0%) | 3,654 (43.0%) |
| Bachelor's Degree or higher | 4,706 (66.3%) | 2,390 (33.7%) |
Occupancy by Age of Householder in Turlock
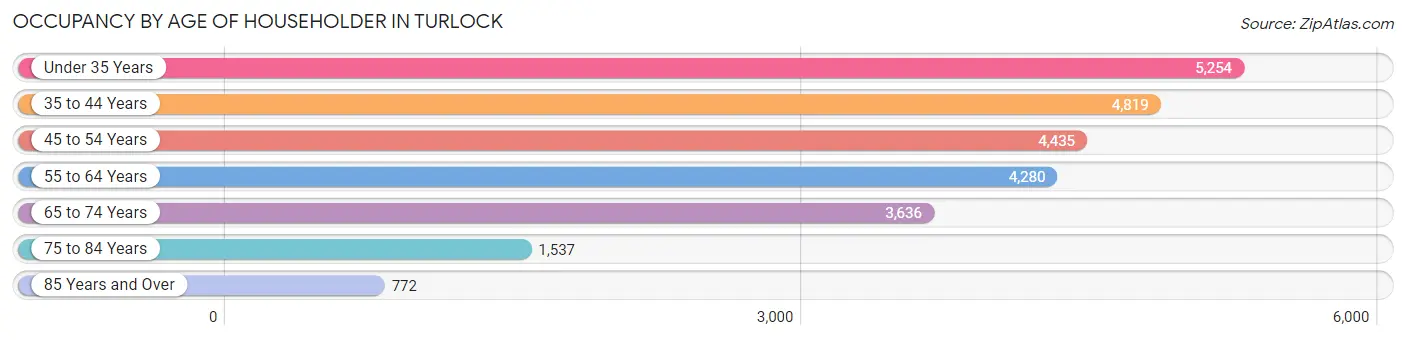
| Age Bracket | # Households | % Households |
| Under 35 Years | 5,254 | 21.2% |
| 35 to 44 Years | 4,819 | 19.5% |
| 45 to 54 Years | 4,435 | 17.9% |
| 55 to 64 Years | 4,280 | 17.3% |
| 65 to 74 Years | 3,636 | 14.7% |
| 75 to 84 Years | 1,537 | 6.2% |
| 85 Years and Over | 772 | 3.1% |
| Total | 24,733 | 100.0% |
Housing Finances in Turlock
Median Income by Occupancy in Turlock
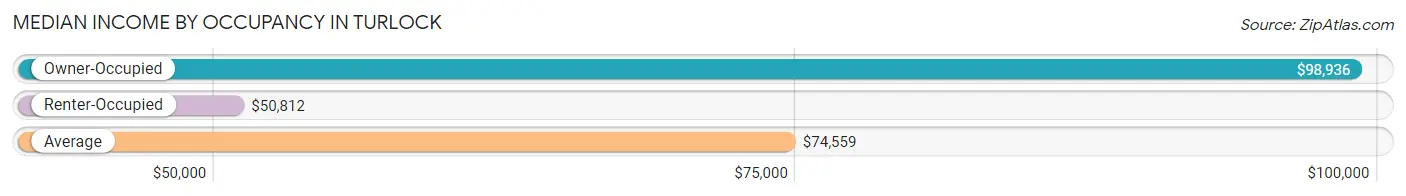
| Occupancy Type | # Households | Median Income |
| Owner-Occupied | 13,603 (55.0%) | $98,936 |
| Renter-Occupied | 11,130 (45.0%) | $50,812 |
| Average | 24,733 (100.0%) | $74,559 |
Occupancy by Householder Income Bracket in Turlock
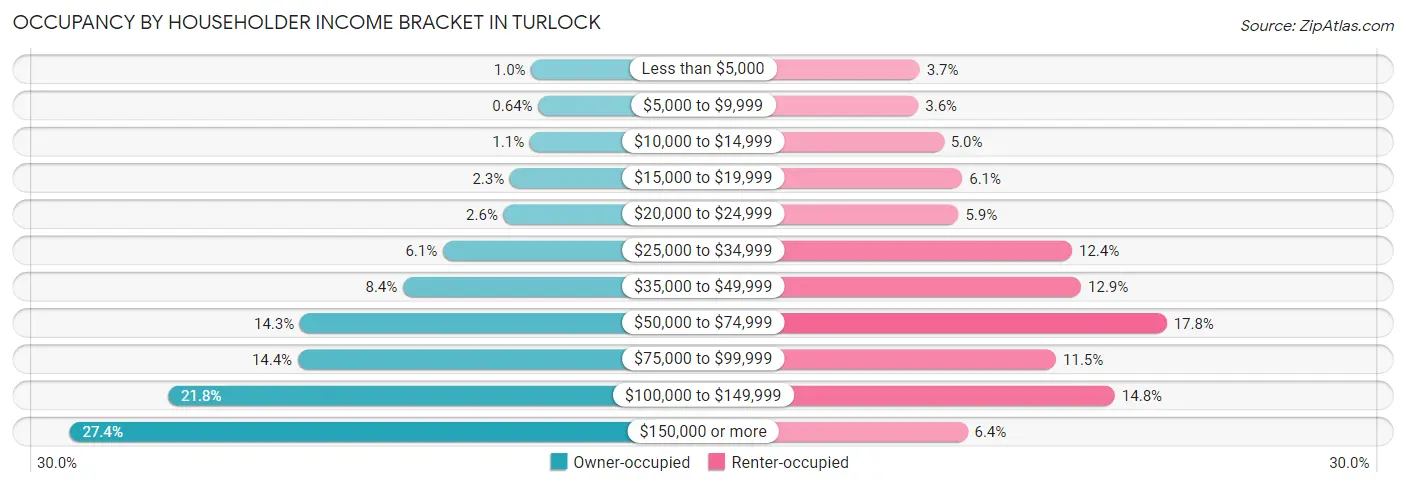
| Income Bracket | Owner-occupied | Renter-occupied |
| Less than $5,000 | 141 (1.0%) | 408 (3.7%) |
| $5,000 to $9,999 | 87 (0.6%) | 400 (3.6%) |
| $10,000 to $14,999 | 152 (1.1%) | 561 (5.0%) |
| $15,000 to $19,999 | 307 (2.3%) | 679 (6.1%) |
| $20,000 to $24,999 | 357 (2.6%) | 654 (5.9%) |
| $25,000 to $34,999 | 828 (6.1%) | 1,377 (12.4%) |
| $35,000 to $49,999 | 1,139 (8.4%) | 1,435 (12.9%) |
| $50,000 to $74,999 | 1,940 (14.3%) | 1,979 (17.8%) |
| $75,000 to $99,999 | 1,956 (14.4%) | 1,275 (11.5%) |
| $100,000 to $149,999 | 2,965 (21.8%) | 1,650 (14.8%) |
| $150,000 or more | 3,731 (27.4%) | 712 (6.4%) |
| Total | 13,603 (100.0%) | 11,130 (100.0%) |
Monthly Housing Cost Tiers in Turlock
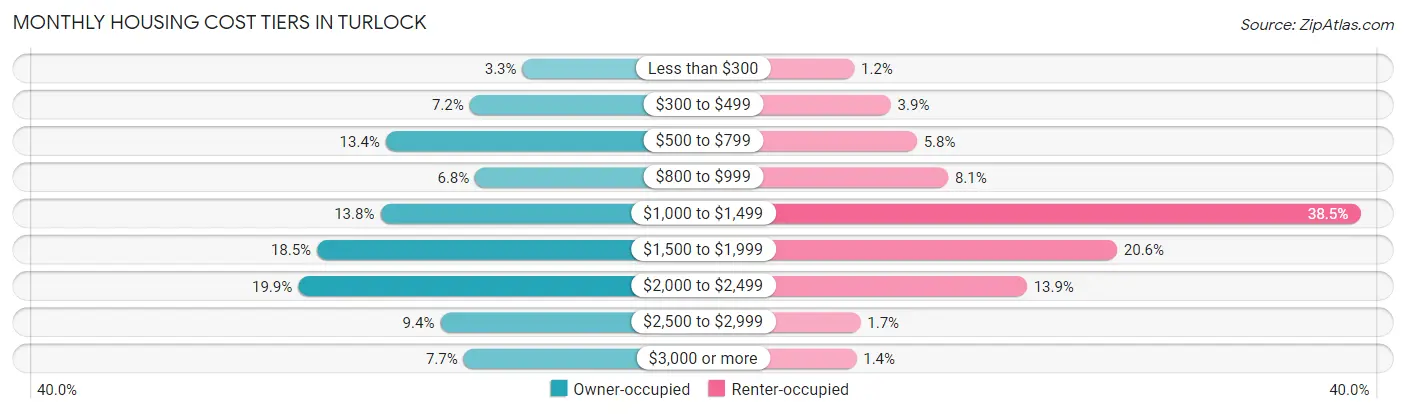
| Monthly Cost | Owner-occupied | Renter-occupied |
| Less than $300 | 454 (3.3%) | 137 (1.2%) |
| $300 to $499 | 983 (7.2%) | 436 (3.9%) |
| $500 to $799 | 1,824 (13.4%) | 650 (5.8%) |
| $800 to $999 | 928 (6.8%) | 906 (8.1%) |
| $1,000 to $1,499 | 1,879 (13.8%) | 4,284 (38.5%) |
| $1,500 to $1,999 | 2,513 (18.5%) | 2,290 (20.6%) |
| $2,000 to $2,499 | 2,701 (19.9%) | 1,551 (13.9%) |
| $2,500 to $2,999 | 1,277 (9.4%) | 188 (1.7%) |
| $3,000 or more | 1,044 (7.7%) | 155 (1.4%) |
| Total | 13,603 (100.0%) | 11,130 (100.0%) |
Physical Housing Characteristics in Turlock
Housing Structures in Turlock
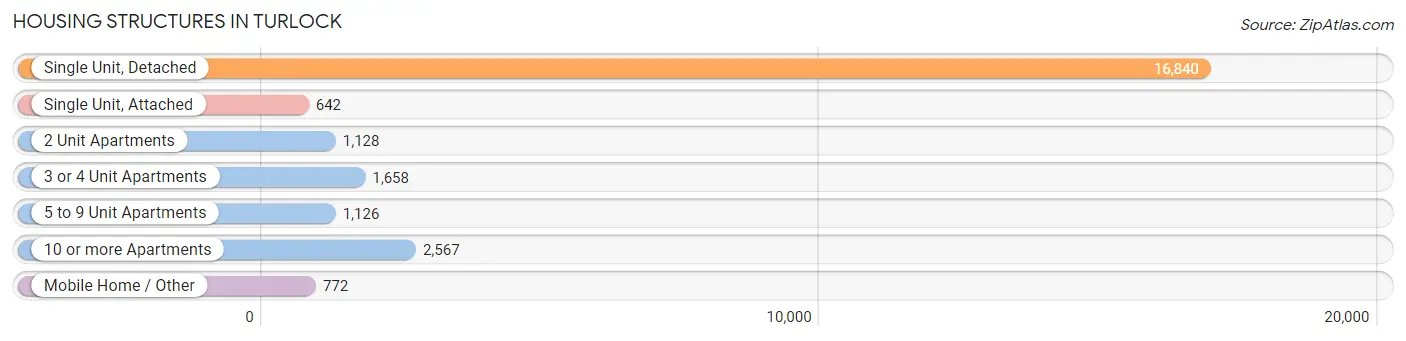
| Structure Type | # Housing Units | % Housing Units |
| Single Unit, Detached | 16,840 | 68.1% |
| Single Unit, Attached | 642 | 2.6% |
| 2 Unit Apartments | 1,128 | 4.6% |
| 3 or 4 Unit Apartments | 1,658 | 6.7% |
| 5 to 9 Unit Apartments | 1,126 | 4.5% |
| 10 or more Apartments | 2,567 | 10.4% |
| Mobile Home / Other | 772 | 3.1% |
| Total | 24,733 | 100.0% |
Housing Structures by Occupancy in Turlock
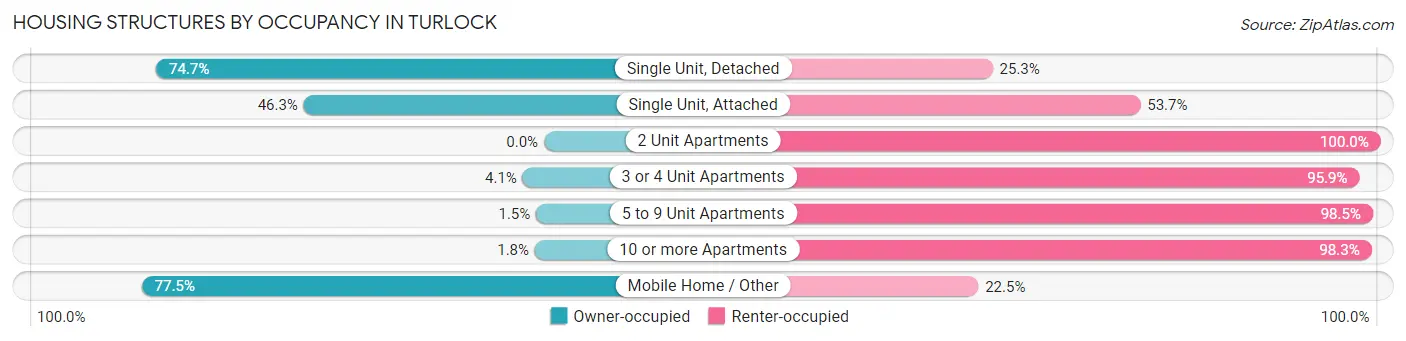
| Structure Type | Owner-occupied | Renter-occupied |
| Single Unit, Detached | 12,578 (74.7%) | 4,262 (25.3%) |
| Single Unit, Attached | 297 (46.3%) | 345 (53.7%) |
| 2 Unit Apartments | 0 (0.0%) | 1,128 (100.0%) |
| 3 or 4 Unit Apartments | 68 (4.1%) | 1,590 (95.9%) |
| 5 to 9 Unit Apartments | 17 (1.5%) | 1,109 (98.5%) |
| 10 or more Apartments | 45 (1.8%) | 2,522 (98.3%) |
| Mobile Home / Other | 598 (77.5%) | 174 (22.5%) |
| Total | 13,603 (55.0%) | 11,130 (45.0%) |
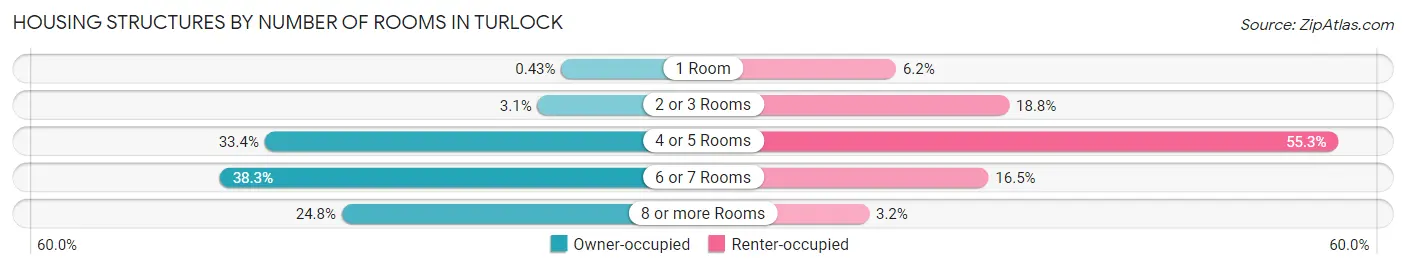
Housing Structures by Number of Rooms in Turlock
| Number of Rooms | Owner-occupied | Renter-occupied |
| 1 Room | 58 (0.4%) | 692 (6.2%) |
| 2 or 3 Rooms | 419 (3.1%) | 2,090 (18.8%) |
| 4 or 5 Rooms | 4,537 (33.4%) | 6,155 (55.3%) |
| 6 or 7 Rooms | 5,216 (38.3%) | 1,834 (16.5%) |
| 8 or more Rooms | 3,373 (24.8%) | 359 (3.2%) |
| Total | 13,603 (100.0%) | 11,130 (100.0%) |
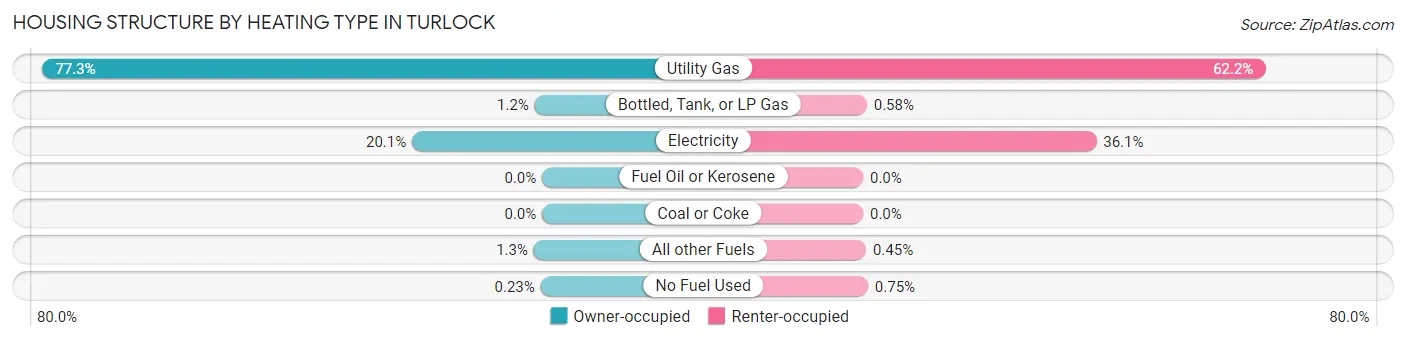
Housing Structure by Heating Type in Turlock
| Heating Type | Owner-occupied | Renter-occupied |
| Utility Gas | 10,508 (77.2%) | 6,918 (62.2%) |
| Bottled, Tank, or LP Gas | 156 (1.1%) | 65 (0.6%) |
| Electricity | 2,734 (20.1%) | 4,014 (36.1%) |
| Fuel Oil or Kerosene | 0 (0.0%) | 0 (0.0%) |
| Coal or Coke | 0 (0.0%) | 0 (0.0%) |
| All other Fuels | 174 (1.3%) | 50 (0.4%) |
| No Fuel Used | 31 (0.2%) | 83 (0.7%) |
| Total | 13,603 (100.0%) | 11,130 (100.0%) |
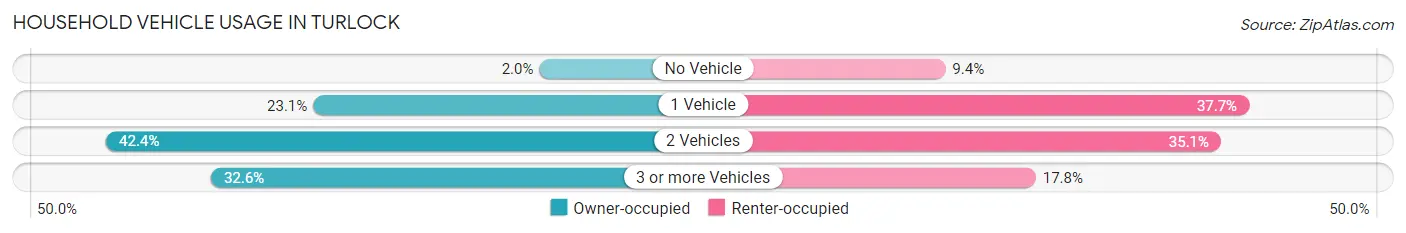
Household Vehicle Usage in Turlock
| Vehicles per Household | Owner-occupied | Renter-occupied |
| No Vehicle | 265 (1.9%) | 1,044 (9.4%) |
| 1 Vehicle | 3,138 (23.1%) | 4,197 (37.7%) |
| 2 Vehicles | 5,766 (42.4%) | 3,906 (35.1%) |
| 3 or more Vehicles | 4,434 (32.6%) | 1,983 (17.8%) |
| Total | 13,603 (100.0%) | 11,130 (100.0%) |
Real Estate & Mortgages in Turlock
Real Estate and Mortgage Overview in Turlock
| Characteristic | Without Mortgage | With Mortgage |
| Housing Units | 4,151 | 9,452 |
| Median Property Value | $363,400 | $419,200 |
| Median Household Income | $69,353 | $3,103 |
| Monthly Housing Costs | $636 | $1,036 |
| Real Estate Taxes | $2,123 | $155 |
Property Value by Mortgage Status in Turlock
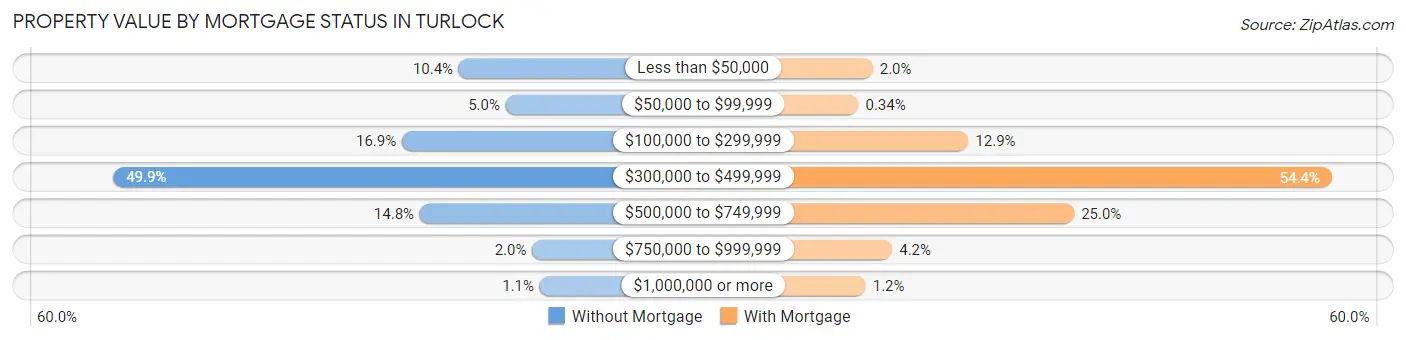
| Property Value | Without Mortgage | With Mortgage |
| Less than $50,000 | 430 (10.4%) | 186 (2.0%) |
| $50,000 to $99,999 | 208 (5.0%) | 32 (0.3%) |
| $100,000 to $299,999 | 700 (16.9%) | 1,219 (12.9%) |
| $300,000 to $499,999 | 2,070 (49.9%) | 5,145 (54.4%) |
| $500,000 to $749,999 | 615 (14.8%) | 2,362 (25.0%) |
| $750,000 to $999,999 | 82 (2.0%) | 397 (4.2%) |
| $1,000,000 or more | 46 (1.1%) | 111 (1.2%) |
| Total | 4,151 (100.0%) | 9,452 (100.0%) |
Household Income by Mortgage Status in Turlock
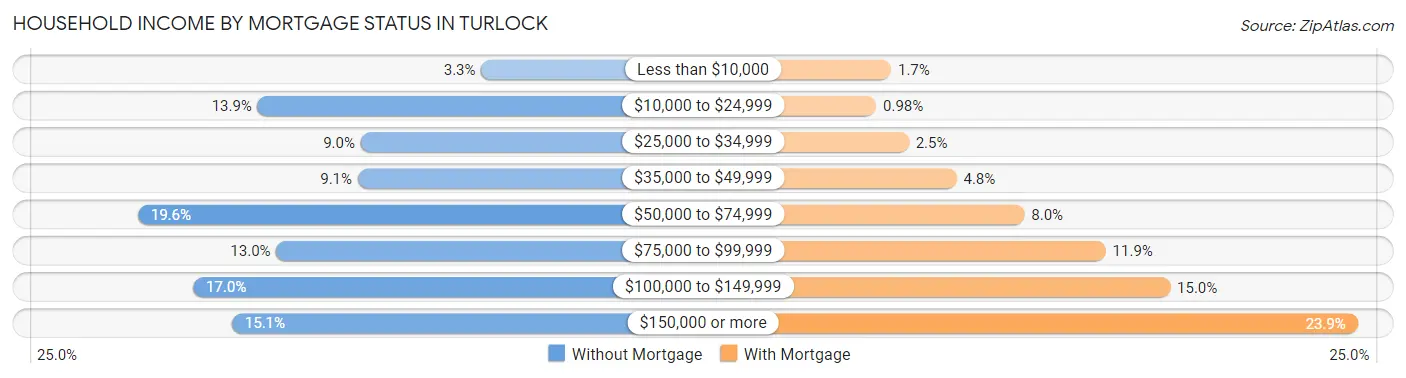
| Household Income | Without Mortgage | With Mortgage |
| Less than $10,000 | 135 (3.3%) | 160 (1.7%) |
| $10,000 to $24,999 | 577 (13.9%) | 93 (1.0%) |
| $25,000 to $34,999 | 373 (9.0%) | 239 (2.5%) |
| $35,000 to $49,999 | 379 (9.1%) | 455 (4.8%) |
| $50,000 to $74,999 | 814 (19.6%) | 760 (8.0%) |
| $75,000 to $99,999 | 540 (13.0%) | 1,126 (11.9%) |
| $100,000 to $149,999 | 705 (17.0%) | 1,416 (15.0%) |
| $150,000 or more | 628 (15.1%) | 2,260 (23.9%) |
| Total | 4,151 (100.0%) | 9,452 (100.0%) |
Property Value to Household Income Ratio in Turlock
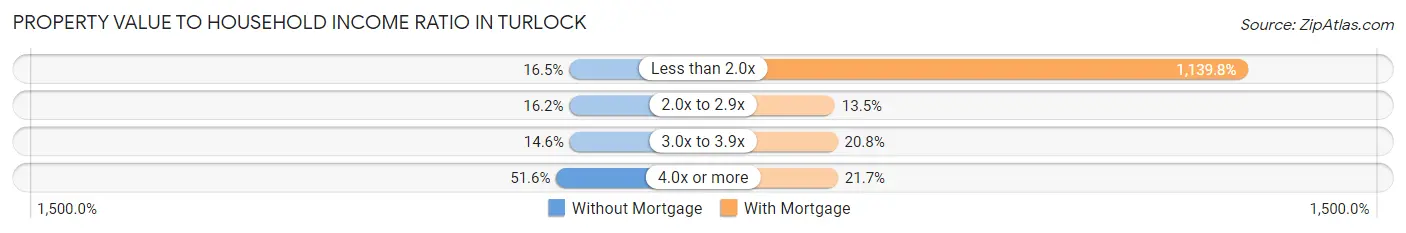
| Value-to-Income Ratio | Without Mortgage | With Mortgage |
| Less than 2.0x | 683 (16.5%) | 107,731 (1,139.8%) |
| 2.0x to 2.9x | 673 (16.2%) | 1,279 (13.5%) |
| 3.0x to 3.9x | 607 (14.6%) | 1,970 (20.8%) |
| 4.0x or more | 2,142 (51.6%) | 2,055 (21.7%) |
| Total | 4,151 (100.0%) | 9,452 (100.0%) |
Real Estate Taxes by Mortgage Status in Turlock
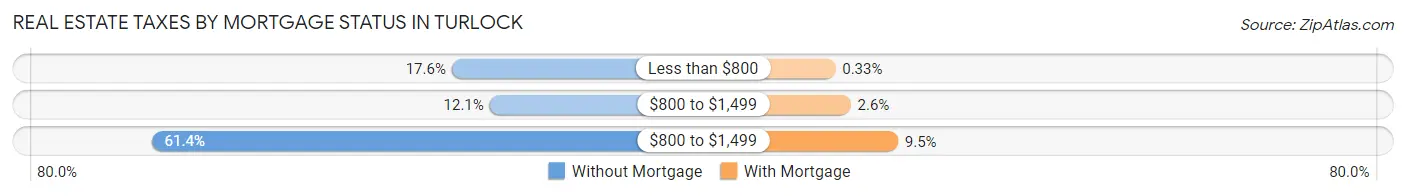
| Property Taxes | Without Mortgage | With Mortgage |
| Less than $800 | 730 (17.6%) | 31 (0.3%) |
| $800 to $1,499 | 500 (12.0%) | 243 (2.6%) |
| $800 to $1,499 | 2,550 (61.4%) | 895 (9.5%) |
| Total | 4,151 (100.0%) | 9,452 (100.0%) |
Health & Disability in Turlock
Health Insurance Coverage by Age in Turlock
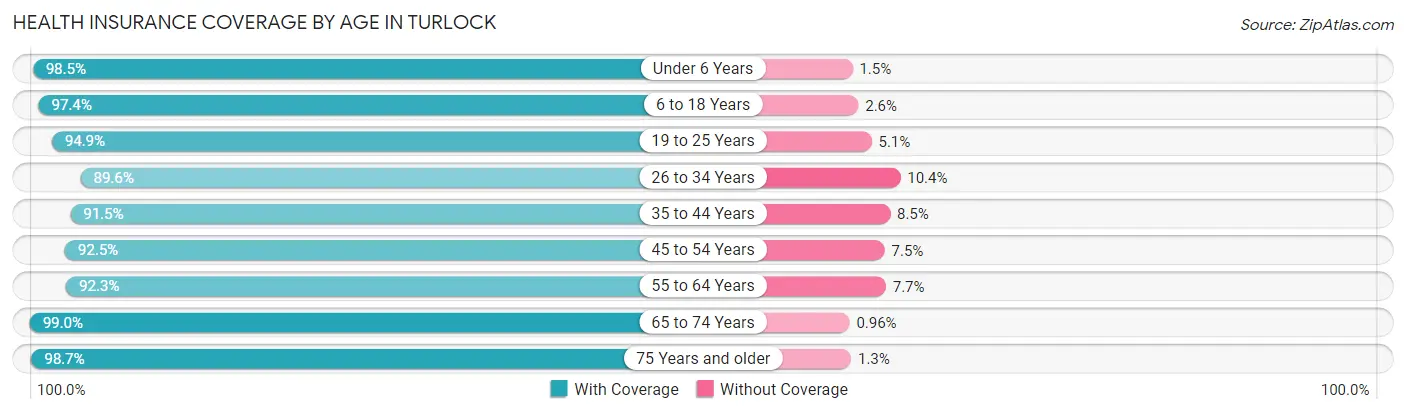
| Age Bracket | With Coverage | Without Coverage |
| Under 6 Years | 5,750 (98.5%) | 89 (1.5%) |
| 6 to 18 Years | 13,743 (97.4%) | 369 (2.6%) |
| 19 to 25 Years | 7,609 (94.9%) | 407 (5.1%) |
| 26 to 34 Years | 8,184 (89.6%) | 954 (10.4%) |
| 35 to 44 Years | 8,702 (91.5%) | 812 (8.5%) |
| 45 to 54 Years | 7,555 (92.5%) | 614 (7.5%) |
| 55 to 64 Years | 6,815 (92.3%) | 572 (7.7%) |
| 65 to 74 Years | 6,085 (99.0%) | 59 (1.0%) |
| 75 Years and older | 3,593 (98.7%) | 46 (1.3%) |
| Total | 68,036 (94.6%) | 3,922 (5.4%) |
Health Insurance Coverage by Citizenship Status in Turlock
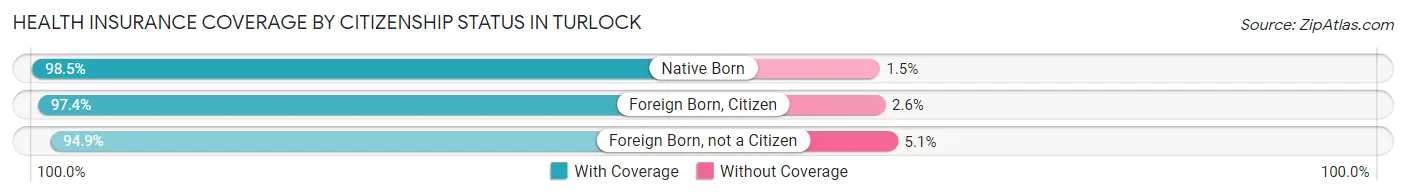
| Citizenship Status | With Coverage | Without Coverage |
| Native Born | 5,750 (98.5%) | 89 (1.5%) |
| Foreign Born, Citizen | 13,743 (97.4%) | 369 (2.6%) |
| Foreign Born, not a Citizen | 7,609 (94.9%) | 407 (5.1%) |
Health Insurance Coverage by Household Income in Turlock
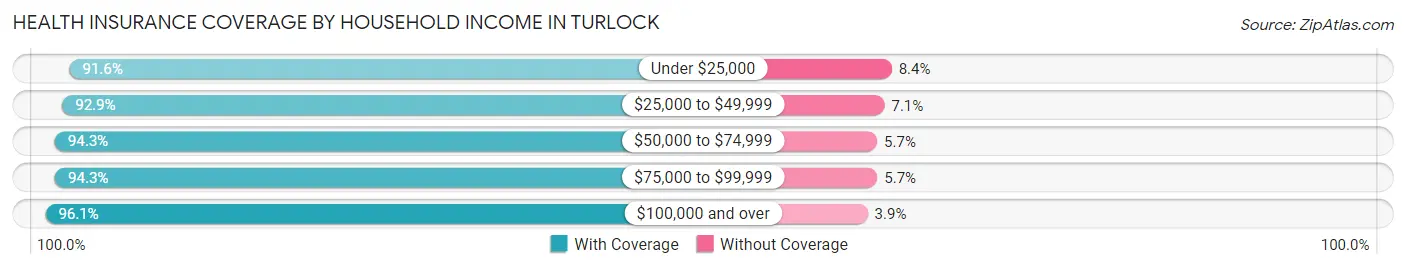
| Household Income | With Coverage | Without Coverage |
| Under $25,000 | 6,461 (91.6%) | 594 (8.4%) |
| $25,000 to $49,999 | 11,492 (92.9%) | 874 (7.1%) |
| $50,000 to $74,999 | 10,563 (94.3%) | 637 (5.7%) |
| $75,000 to $99,999 | 10,101 (94.3%) | 614 (5.7%) |
| $100,000 and over | 28,955 (96.1%) | 1,177 (3.9%) |
Public vs Private Health Insurance Coverage by Age in Turlock
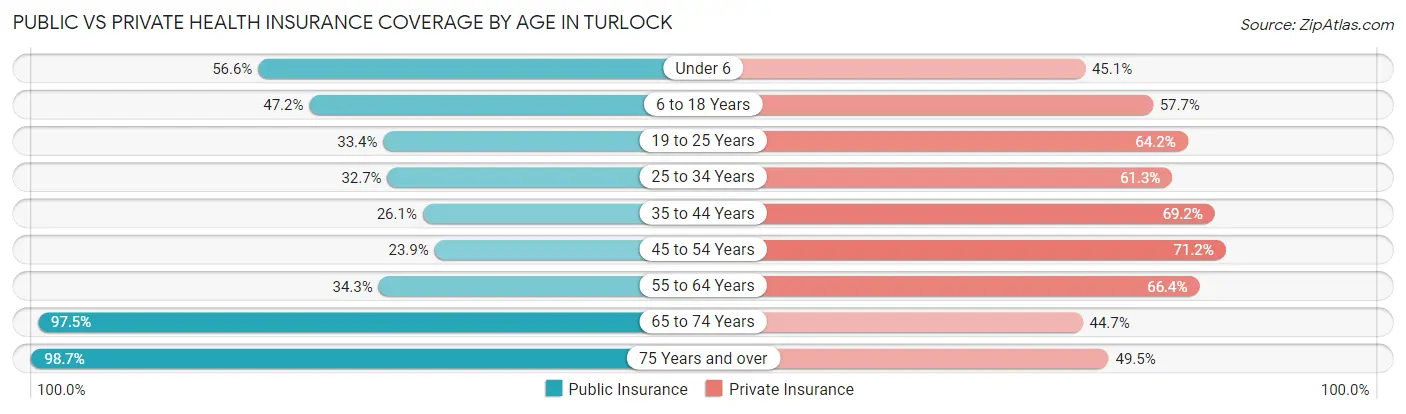
| Age Bracket | Public Insurance | Private Insurance |
| Under 6 | 3,307 (56.6%) | 2,636 (45.1%) |
| 6 to 18 Years | 6,655 (47.2%) | 8,144 (57.7%) |
| 19 to 25 Years | 2,679 (33.4%) | 5,144 (64.2%) |
| 25 to 34 Years | 2,984 (32.7%) | 5,603 (61.3%) |
| 35 to 44 Years | 2,483 (26.1%) | 6,585 (69.2%) |
| 45 to 54 Years | 1,953 (23.9%) | 5,820 (71.2%) |
| 55 to 64 Years | 2,534 (34.3%) | 4,901 (66.3%) |
| 65 to 74 Years | 5,992 (97.5%) | 2,746 (44.7%) |
| 75 Years and over | 3,593 (98.7%) | 1,802 (49.5%) |
| Total | 32,180 (44.7%) | 43,381 (60.3%) |
Disability Status by Sex by Age in Turlock
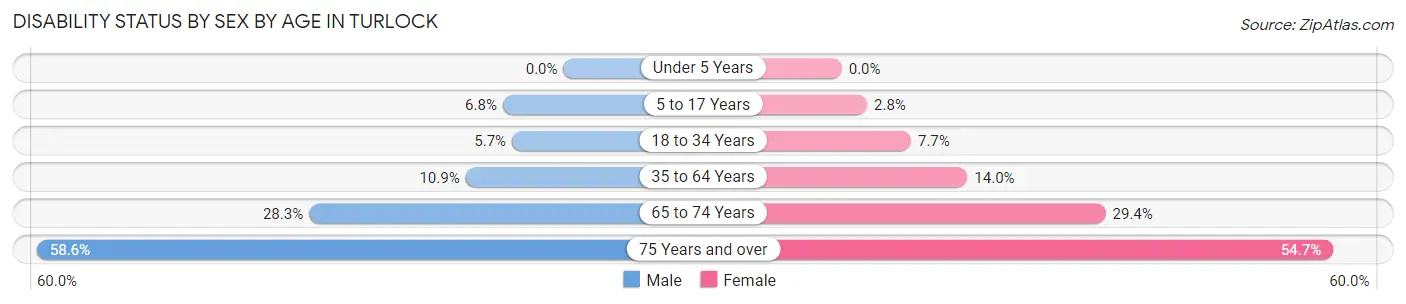
| Age Bracket | Male | Female |
| Under 5 Years | 0 (0.0%) | 0 (0.0%) |
| 5 to 17 Years | 457 (6.8%) | 203 (2.8%) |
| 18 to 34 Years | 493 (5.7%) | 734 (7.7%) |
| 35 to 64 Years | 1,314 (10.9%) | 1,821 (14.0%) |
| 65 to 74 Years | 813 (28.3%) | 962 (29.4%) |
| 75 Years and over | 948 (58.6%) | 1,106 (54.7%) |
Disability Class by Sex by Age in Turlock
Disability Class: Hearing Difficulty
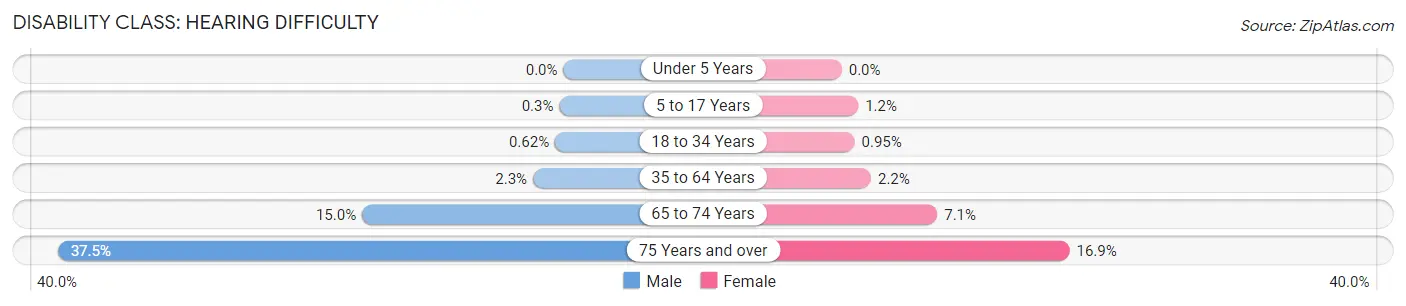
| Age Bracket | Male | Female |
| Under 5 Years | 0 (0.0%) | 0 (0.0%) |
| 5 to 17 Years | 20 (0.3%) | 88 (1.2%) |
| 18 to 34 Years | 53 (0.6%) | 90 (0.9%) |
| 35 to 64 Years | 273 (2.3%) | 282 (2.2%) |
| 65 to 74 Years | 429 (14.9%) | 232 (7.1%) |
| 75 Years and over | 607 (37.5%) | 342 (16.9%) |
Disability Class: Vision Difficulty
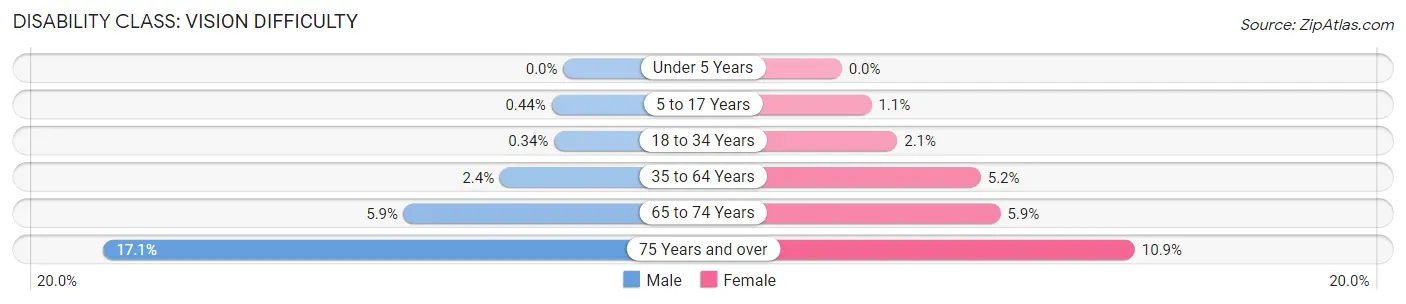
| Age Bracket | Male | Female |
| Under 5 Years | 0 (0.0%) | 0 (0.0%) |
| 5 to 17 Years | 30 (0.4%) | 79 (1.1%) |
| 18 to 34 Years | 29 (0.3%) | 196 (2.1%) |
| 35 to 64 Years | 283 (2.4%) | 671 (5.2%) |
| 65 to 74 Years | 170 (5.9%) | 193 (5.9%) |
| 75 Years and over | 276 (17.1%) | 220 (10.9%) |
Disability Class: Cognitive Difficulty
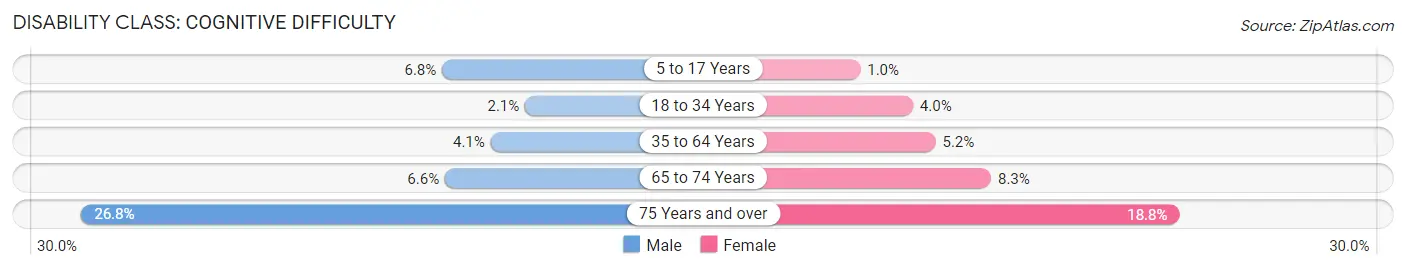
| Age Bracket | Male | Female |
| 5 to 17 Years | 457 (6.8%) | 74 (1.0%) |
| 18 to 34 Years | 183 (2.1%) | 377 (4.0%) |
| 35 to 64 Years | 488 (4.1%) | 679 (5.2%) |
| 65 to 74 Years | 189 (6.6%) | 272 (8.3%) |
| 75 Years and over | 434 (26.8%) | 380 (18.8%) |
Disability Class: Ambulatory Difficulty
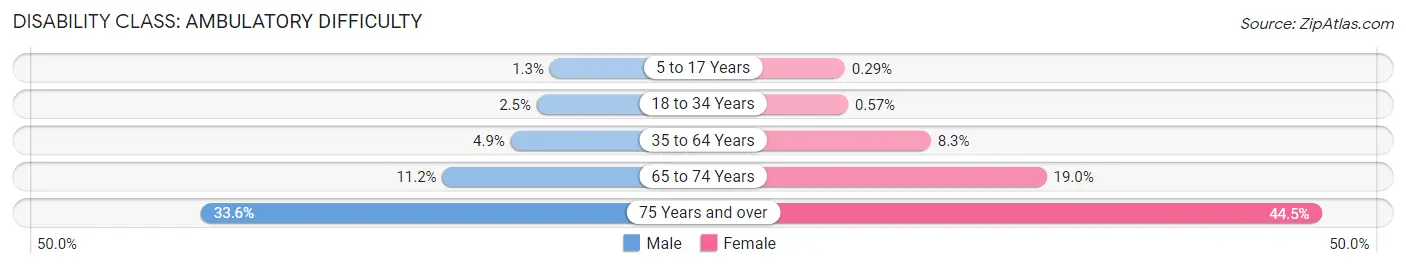
| Age Bracket | Male | Female |
| 5 to 17 Years | 85 (1.3%) | 21 (0.3%) |
| 18 to 34 Years | 212 (2.5%) | 54 (0.6%) |
| 35 to 64 Years | 589 (4.9%) | 1,075 (8.3%) |
| 65 to 74 Years | 322 (11.2%) | 622 (19.0%) |
| 75 Years and over | 544 (33.6%) | 900 (44.5%) |
Disability Class: Self-Care Difficulty
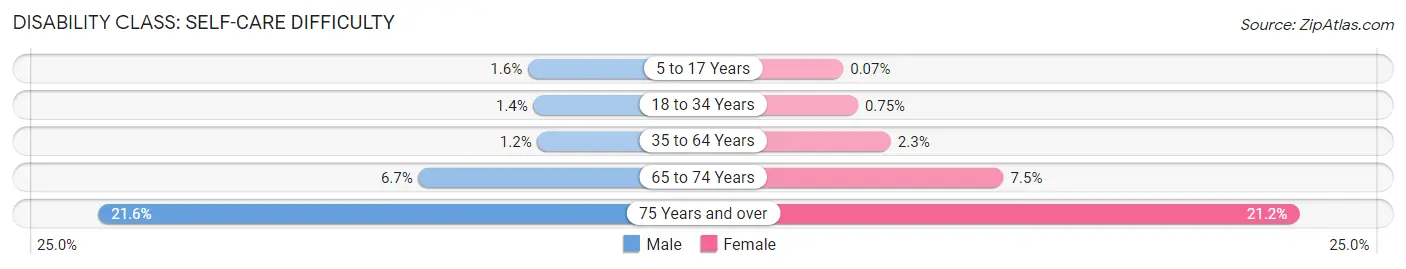
| Age Bracket | Male | Female |
| 5 to 17 Years | 111 (1.6%) | 5 (0.1%) |
| 18 to 34 Years | 119 (1.4%) | 71 (0.7%) |
| 35 to 64 Years | 145 (1.2%) | 297 (2.3%) |
| 65 to 74 Years | 193 (6.7%) | 246 (7.5%) |
| 75 Years and over | 349 (21.6%) | 429 (21.2%) |
Technology Access in Turlock
Computing Device Access in Turlock
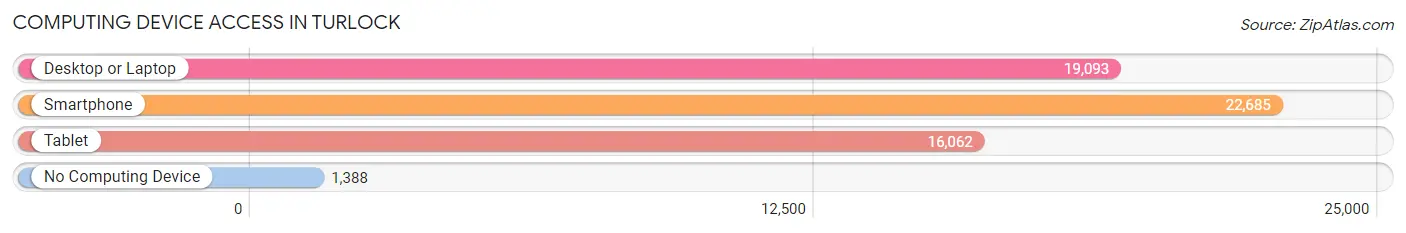
| Device Type | # Households | % Households |
| Desktop or Laptop | 19,093 | 77.2% |
| Smartphone | 22,685 | 91.7% |
| Tablet | 16,062 | 64.9% |
| No Computing Device | 1,388 | 5.6% |
| Total | 24,733 | 100.0% |
Internet Access in Turlock
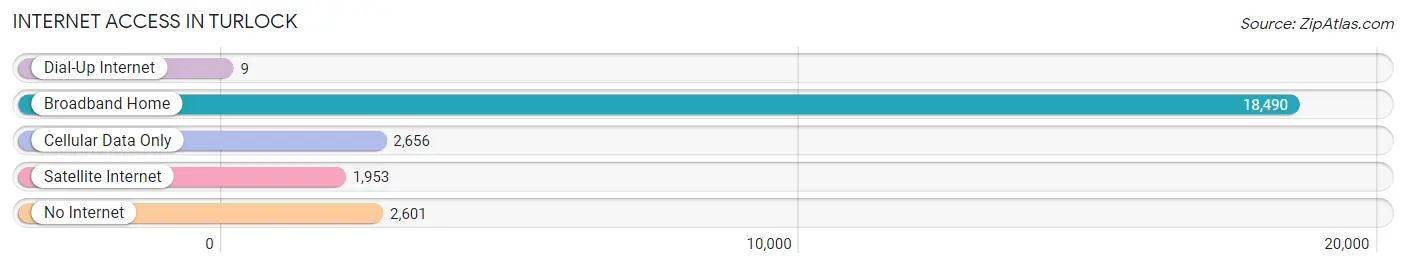
| Internet Type | # Households | % Households |
| Dial-Up Internet | 9 | 0.0% |
| Broadband Home | 18,490 | 74.8% |
| Cellular Data Only | 2,656 | 10.7% |
| Satellite Internet | 1,953 | 7.9% |
| No Internet | 2,601 | 10.5% |
| Total | 24,733 | 100.0% |
Turlock Summary
Turlock is a city located in Stanislaus County, California, United States. It is part of the Modesto Metropolitan Statistical Area. The population was estimated to be 68,549 in 2019, making it the second-largest city in Stanislaus County after Modesto.
History
Turlock was founded in 1871 by John William Mitchell, a cattle rancher from the Midwest. He named the city after Turlough, a town in County Mayo, Ireland. The city was incorporated in 1908 and has since grown to become a major agricultural and industrial center in the Central Valley.
Turlock is home to California State University, Stanislaus, which was founded in 1957. The university is the largest employer in the city and has a major impact on the local economy.
Geography
Turlock is located in the Central Valley of California, about 70 miles east of San Francisco. The city is situated at an elevation of about 200 feet above sea level. The city covers an area of about 15.5 square miles and is bordered by Modesto to the north, Merced to the south, and the San Joaquin River to the east.
The climate in Turlock is Mediterranean, with hot, dry summers and mild, wet winters. The average annual temperature is about 65°F, with temperatures ranging from the mid-90s in the summer to the mid-40s in the winter.
Economy
Turlock’s economy is largely based on agriculture and food processing. The city is home to a number of large food processing companies, including Foster Farms, Hilmar Cheese Company, and Sun-Maid Raisins.
The city is also home to a number of manufacturing companies, including Turlock Manufacturing, which produces agricultural equipment, and Turlock Steel, which produces steel products.
The city is also home to a number of retail stores including Walmart Target and Kohl s
Demographics
As of the 2010 census, the population of Turlock was estimated to be 58,664. The racial makeup of the city was 57.2% White, 2.3% African American, 1.2% Native American, 1.7% Asian, 0.2% Pacific Islander, and 36.4% from other races. Hispanic or Latino of any race were 44.2% of the population.
The median household income in Turlock was $45,845 in 2019, and the median home value was $310,000. The city has a poverty rate of 17.3%.
Conclusion
Turlock is a city located in Stanislaus County, California. It was founded in 1871 and has since grown to become a major agricultural and industrial center in the Central Valley. The city is home to California State University, Stanislaus, and a number of large food processing and manufacturing companies. The population of Turlock was estimated to be 58,664 in 2010, and the median household income was $45,845 in 2019.
Common Questions
What is Per Capita Income in Turlock?
Per Capita income in Turlock is $33,194.
What is the Median Family Income in Turlock?
Median Family Income in Turlock is $89,663.
What is the Median Household income in Turlock?
Median Household Income in Turlock is $74,559.
What is Income or Wage Gap in Turlock?
Income or Wage Gap in Turlock is 39.4%.
Women in Turlock earn 60.6 cents for every dollar earned by a man.
What is Family Income Deficit in Turlock?
Family Income Deficit in Turlock is $9,355.
Families that are below poverty line in Turlock earn $9,355 less on average than the poverty threshold level.
What is Inequality or Gini Index in Turlock?
Inequality or Gini Index in Turlock is 0.44.
What is the Total Population of Turlock?
Total Population of Turlock is 72,504.
What is the Total Male Population of Turlock?
Total Male Population of Turlock is 34,835.
What is the Total Female Population of Turlock?
Total Female Population of Turlock is 37,669.
What is the Ratio of Males per 100 Females in Turlock?
There are 92.48 Males per 100 Females in Turlock.
What is the Ratio of Females per 100 Males in Turlock?
There are 108.14 Females per 100 Males in Turlock.
What is the Median Population Age in Turlock?
Median Population Age in Turlock is 34.3 Years.
What is the Average Family Size in Turlock
Average Family Size in Turlock is 3.4 People.
What is the Average Household Size in Turlock
Average Household Size in Turlock is 2.9 People.
How Large is the Labor Force in Turlock?
There are 34,347 People in the Labor Forcein in Turlock.
What is the Percentage of People in the Labor Force in Turlock?
61.5% of People are in the Labor Force in Turlock.
What is the Unemployment Rate in Turlock?
Unemployment Rate in Turlock is 7.6%.