Scotts Valley, CA Map & Demographics
Scotts Valley Map
Scotts Valley Overview
$79,871
PER CAPITA INCOME
$182,629
AVG FAMILY INCOME
$136,867
AVG HOUSEHOLD INCOME
24.5%
WAGE / INCOME GAP [ % ]
75.5¢/ $1
WAGE / INCOME GAP [ $ ]
0.50
INEQUALITY / GINI INDEX
12,239
TOTAL POPULATION
6,202
MALE POPULATION
6,037
FEMALE POPULATION
102.73
MALES / 100 FEMALES
97.34
FEMALES / 100 MALES
49.0
MEDIAN AGE
2.8
AVG FAMILY SIZE
2.4
AVG HOUSEHOLD SIZE
6,627
LABOR FORCE [ PEOPLE ]
63.2%
PERCENT IN LABOR FORCE
1.9%
UNEMPLOYMENT RATE
Scotts Valley Zip Codes
Scotts Valley Area Codes
Income in Scotts Valley
Income Overview in Scotts Valley
Per Capita Income in Scotts Valley is $79,871, while median incomes of families and households are $182,629 and $136,867 respectively.
| Characteristic | Number | Measure |
| Per Capita Income | 12,239 | $79,871 |
| Median Family Income | 3,548 | $182,629 |
| Mean Family Income | 3,548 | $243,049 |
| Median Household Income | 4,920 | $136,867 |
| Mean Household Income | 4,920 | $196,590 |
| Income Deficit | 3,548 | $0 |
| Wage / Income Gap (%) | 12,239 | 24.53% |
| Wage / Income Gap ($) | 12,239 | 75.47¢ per $1 |
| Gini / Inequality Index | 12,239 | 0.50 |
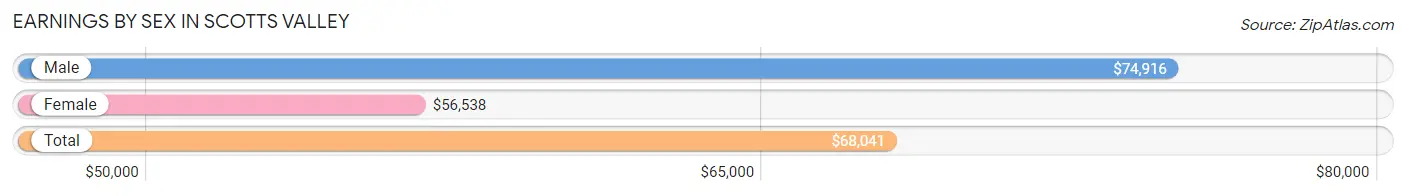
Earnings by Sex in Scotts Valley
Average Earnings in Scotts Valley are $68,041, $74,916 for men and $56,538 for women, a difference of 24.5%.
| Sex | Number | Average Earnings |
| Male | 4,103 (56.9%) | $74,916 |
| Female | 3,108 (43.1%) | $56,538 |
| Total | 7,211 (100.0%) | $68,041 |
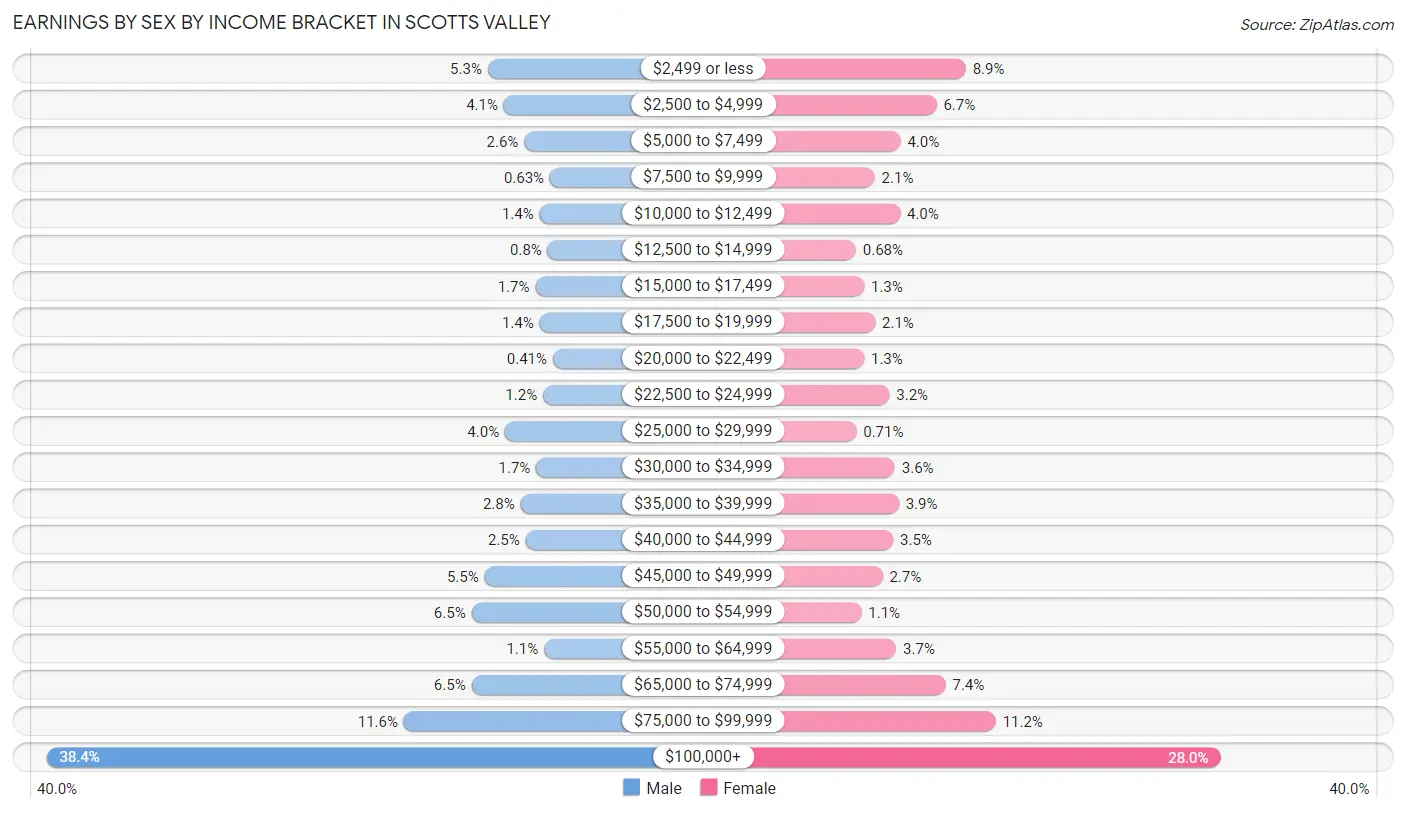
Earnings by Sex by Income Bracket in Scotts Valley
The most common earnings brackets in Scotts Valley are $100,000+ for men (1,574 | 38.4%) and $100,000+ for women (870 | 28.0%).
| Income | Male | Female |
| $2,499 or less | 217 (5.3%) | 277 (8.9%) |
| $2,500 to $4,999 | 168 (4.1%) | 209 (6.7%) |
| $5,000 to $7,499 | 105 (2.6%) | 125 (4.0%) |
| $7,500 to $9,999 | 26 (0.6%) | 65 (2.1%) |
| $10,000 to $12,499 | 58 (1.4%) | 124 (4.0%) |
| $12,500 to $14,999 | 33 (0.8%) | 21 (0.7%) |
| $15,000 to $17,499 | 71 (1.7%) | 40 (1.3%) |
| $17,500 to $19,999 | 58 (1.4%) | 66 (2.1%) |
| $20,000 to $22,499 | 17 (0.4%) | 40 (1.3%) |
| $22,500 to $24,999 | 47 (1.1%) | 99 (3.2%) |
| $25,000 to $29,999 | 164 (4.0%) | 22 (0.7%) |
| $30,000 to $34,999 | 68 (1.7%) | 112 (3.6%) |
| $35,000 to $39,999 | 116 (2.8%) | 121 (3.9%) |
| $40,000 to $44,999 | 101 (2.5%) | 108 (3.5%) |
| $45,000 to $49,999 | 227 (5.5%) | 83 (2.7%) |
| $50,000 to $54,999 | 267 (6.5%) | 34 (1.1%) |
| $55,000 to $64,999 | 44 (1.1%) | 115 (3.7%) |
| $65,000 to $74,999 | 267 (6.5%) | 230 (7.4%) |
| $75,000 to $99,999 | 475 (11.6%) | 347 (11.2%) |
| $100,000+ | 1,574 (38.4%) | 870 (28.0%) |
| Total | 4,103 (100.0%) | 3,108 (100.0%) |
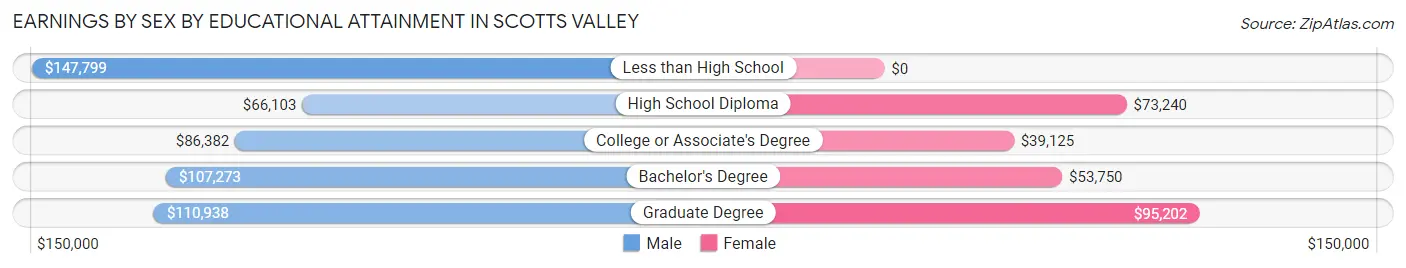
Earnings by Sex by Educational Attainment in Scotts Valley
Average earnings in Scotts Valley are $90,022 for men and $65,453 for women, a difference of 27.3%. Men with an educational attainment of less than high school enjoy the highest average annual earnings of $147,799, while those with high school diploma education earn the least with $66,103. Women with an educational attainment of graduate degree earn the most with the average annual earnings of $95,202, while those with college or associate's degree education have the smallest earnings of $39,125.
| Educational Attainment | Male Income | Female Income |
| Less than High School | $147,799 | $0 |
| High School Diploma | $66,103 | $73,240 |
| College or Associate's Degree | $86,382 | $39,125 |
| Bachelor's Degree | $107,273 | $53,750 |
| Graduate Degree | $110,938 | $95,202 |
| Total | $90,022 | $65,453 |
Family Income in Scotts Valley
Family Income Brackets in Scotts Valley
According to the Scotts Valley family income data, there are 1,394 families falling into the $200,000+ income range, which is the most common income bracket and makes up 39.3% of all families.
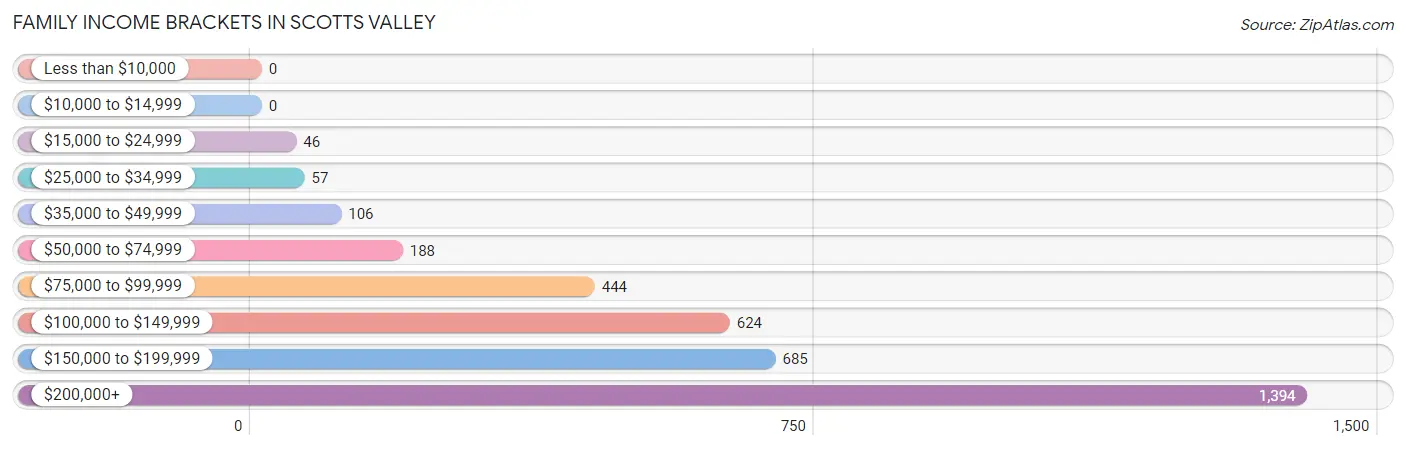
| Income Bracket | # Families | % Families |
| Less than $10,000 | 0 | 0.0% |
| $10,000 to $14,999 | 0 | 0.0% |
| $15,000 to $24,999 | 46 | 1.3% |
| $25,000 to $34,999 | 57 | 1.6% |
| $35,000 to $49,999 | 106 | 3.0% |
| $50,000 to $74,999 | 188 | 5.3% |
| $75,000 to $99,999 | 444 | 12.5% |
| $100,000 to $149,999 | 624 | 17.6% |
| $150,000 to $199,999 | 685 | 19.3% |
| $200,000+ | 1,394 | 39.3% |
Family Income by Famaliy Size in Scotts Valley
4-person families (647 | 18.2%) account for the highest median family income in Scotts Valley with $206,813 per family, while 2-person families (1,824 | 51.4%) have the highest median income of $77,708 per family member.
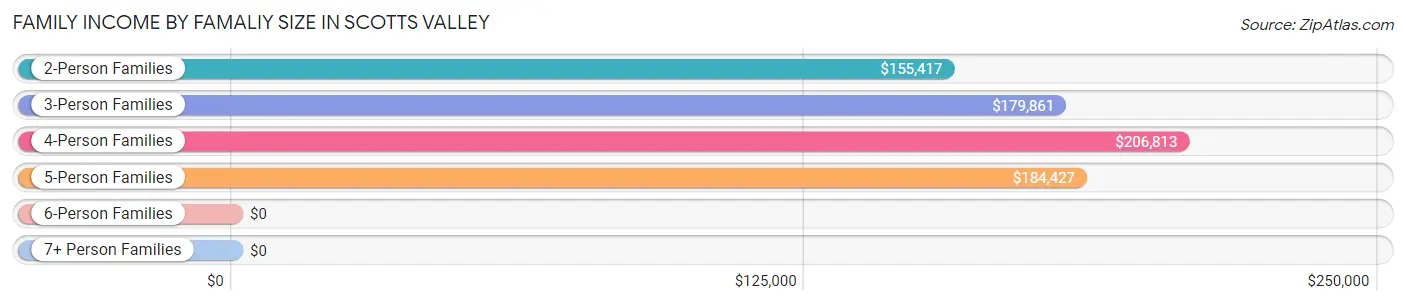
| Income Bracket | # Families | Median Income |
| 2-Person Families | 1,824 (51.4%) | $155,417 |
| 3-Person Families | 878 (24.7%) | $179,861 |
| 4-Person Families | 647 (18.2%) | $206,813 |
| 5-Person Families | 178 (5.0%) | $184,427 |
| 6-Person Families | 21 (0.6%) | $0 |
| 7+ Person Families | 0 (0.0%) | $0 |
| Total | 3,548 (100.0%) | $182,629 |
Family Income by Number of Earners in Scotts Valley
The median family income in Scotts Valley is $182,629, with families comprising 3+ earners (508) having the highest median family income of $194,167, while families with no earners (468) have the lowest median family income of $95,417, accounting for 14.3% and 13.2% of families, respectively.
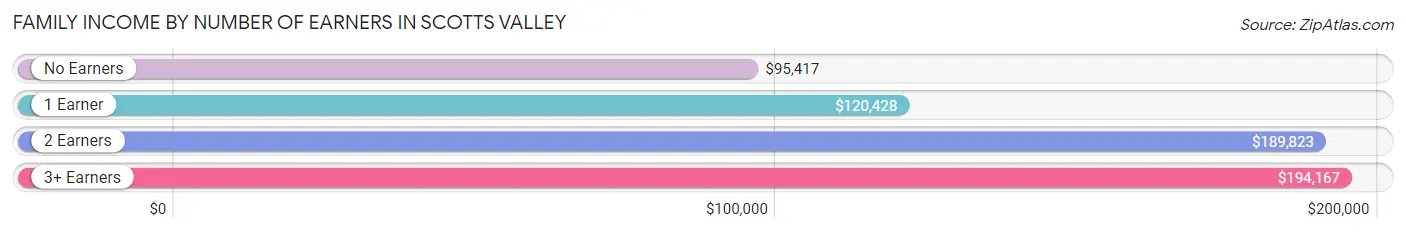
| Number of Earners | # Families | Median Income |
| No Earners | 468 (13.2%) | $95,417 |
| 1 Earner | 879 (24.8%) | $120,428 |
| 2 Earners | 1,693 (47.7%) | $189,823 |
| 3+ Earners | 508 (14.3%) | $194,167 |
| Total | 3,548 (100.0%) | $182,629 |
Household Income in Scotts Valley
Household Income Brackets in Scotts Valley
With 1,461 households falling in the category, the $200,000+ income range is the most frequent in Scotts Valley, accounting for 29.7% of all households. In contrast, only 103 households (2.1%) fall into the less than $10,000 income bracket, making it the least populous group.
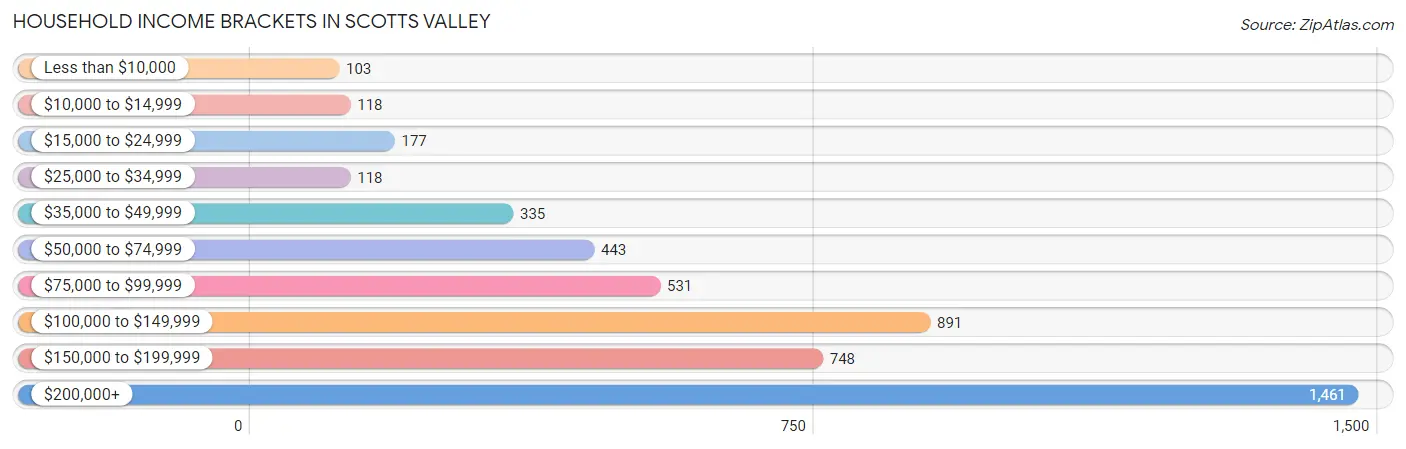
| Income Bracket | # Households | % Households |
| Less than $10,000 | 103 | 2.1% |
| $10,000 to $14,999 | 118 | 2.4% |
| $15,000 to $24,999 | 177 | 3.6% |
| $25,000 to $34,999 | 118 | 2.4% |
| $35,000 to $49,999 | 335 | 6.8% |
| $50,000 to $74,999 | 443 | 9.0% |
| $75,000 to $99,999 | 531 | 10.8% |
| $100,000 to $149,999 | 891 | 18.1% |
| $150,000 to $199,999 | 748 | 15.2% |
| $200,000+ | 1,461 | 29.7% |
Household Income by Householder Age in Scotts Valley
The median household income in Scotts Valley is $136,867, with the highest median household income of $184,740 found in the 25 to 44 years age bracket for the primary householder. A total of 1,100 households (22.4%) fall into this category. Meanwhile, the 15 to 24 years age bracket for the primary householder has the lowest median household income of $0, with 20 households (0.4%) in this group.
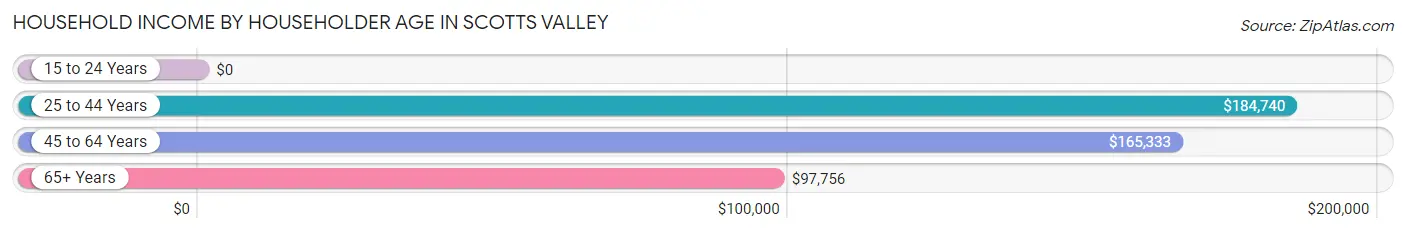
| Income Bracket | # Households | Median Income |
| 15 to 24 Years | 20 (0.4%) | $0 |
| 25 to 44 Years | 1,100 (22.4%) | $184,740 |
| 45 to 64 Years | 1,872 (38.1%) | $165,333 |
| 65+ Years | 1,928 (39.2%) | $97,756 |
| Total | 4,920 (100.0%) | $136,867 |
Poverty in Scotts Valley
Income Below Poverty by Sex and Age in Scotts Valley
With 1.4% poverty level for males and 6.7% for females among the residents of Scotts Valley, 25 to 34 year old males and 5 year old females are the most vulnerable to poverty, with 23 males (5.8%) and 18 females (58.1%) in their respective age groups living below the poverty level.
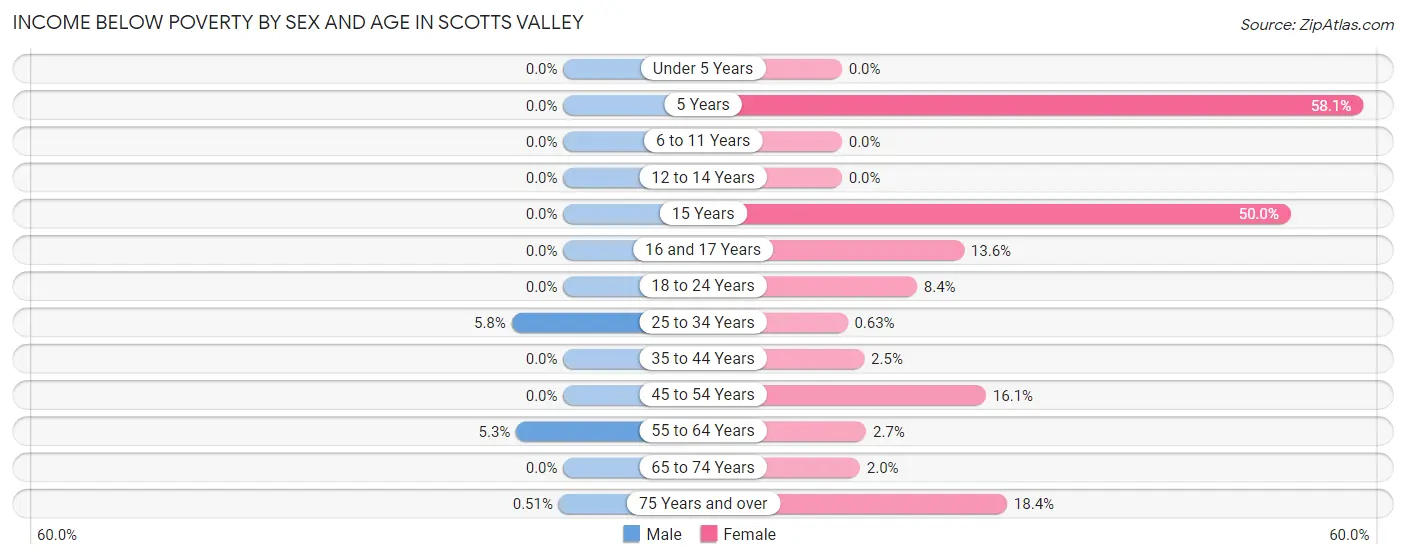
| Age Bracket | Male | Female |
| Under 5 Years | 0 (0.0%) | 0 (0.0%) |
| 5 Years | 0 (0.0%) | 18 (58.1%) |
| 6 to 11 Years | 0 (0.0%) | 0 (0.0%) |
| 12 to 14 Years | 0 (0.0%) | 0 (0.0%) |
| 15 Years | 0 (0.0%) | 17 (50.0%) |
| 16 and 17 Years | 0 (0.0%) | 17 (13.6%) |
| 18 to 24 Years | 0 (0.0%) | 25 (8.4%) |
| 25 to 34 Years | 23 (5.8%) | 4 (0.6%) |
| 35 to 44 Years | 0 (0.0%) | 16 (2.5%) |
| 45 to 54 Years | 0 (0.0%) | 134 (16.1%) |
| 55 to 64 Years | 58 (5.2%) | 33 (2.7%) |
| 65 to 74 Years | 0 (0.0%) | 15 (2.0%) |
| 75 Years and over | 3 (0.5%) | 119 (18.4%) |
| Total | 84 (1.4%) | 398 (6.7%) |
Income Above Poverty by Sex and Age in Scotts Valley
According to the poverty statistics in Scotts Valley, males aged under 5 years and females aged under 5 years are the age groups that are most secure financially, with 100.0% of males and 100.0% of females in these age groups living above the poverty line.
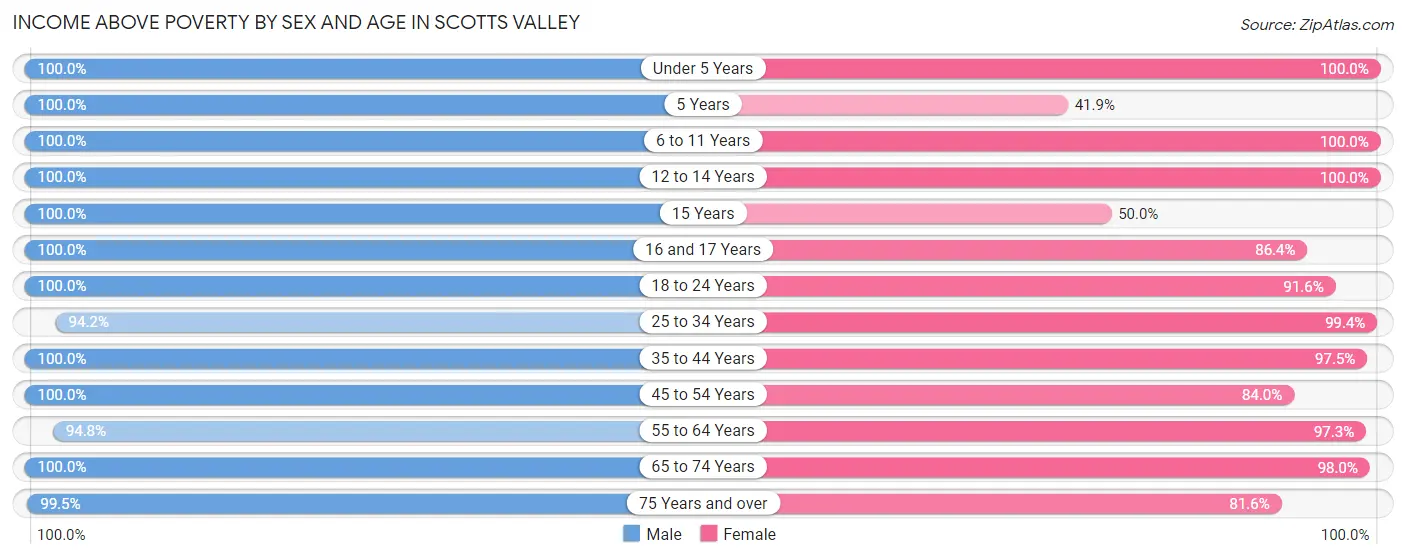
| Age Bracket | Male | Female |
| Under 5 Years | 238 (100.0%) | 235 (100.0%) |
| 5 Years | 21 (100.0%) | 13 (41.9%) |
| 6 to 11 Years | 421 (100.0%) | 418 (100.0%) |
| 12 to 14 Years | 164 (100.0%) | 112 (100.0%) |
| 15 Years | 36 (100.0%) | 17 (50.0%) |
| 16 and 17 Years | 111 (100.0%) | 108 (86.4%) |
| 18 to 24 Years | 747 (100.0%) | 274 (91.6%) |
| 25 to 34 Years | 376 (94.2%) | 632 (99.4%) |
| 35 to 44 Years | 888 (100.0%) | 626 (97.5%) |
| 45 to 54 Years | 515 (100.0%) | 701 (84.0%) |
| 55 to 64 Years | 1,046 (94.8%) | 1,186 (97.3%) |
| 65 to 74 Years | 892 (100.0%) | 731 (98.0%) |
| 75 Years and over | 586 (99.5%) | 528 (81.6%) |
| Total | 6,041 (98.6%) | 5,581 (93.3%) |
Income Below Poverty Among Married-Couple Families in Scotts Valley
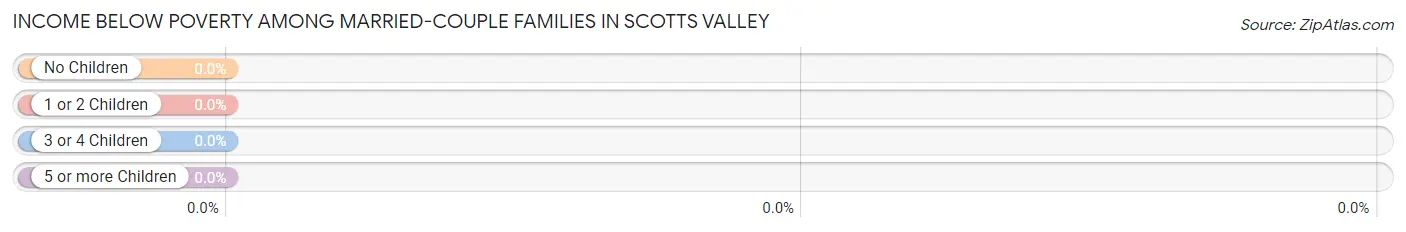
| Children | Above Poverty | Below Poverty |
| No Children | 2,133 (100.0%) | 0 (0.0%) |
| 1 or 2 Children | 816 (100.0%) | 0 (0.0%) |
| 3 or 4 Children | 102 (100.0%) | 0 (0.0%) |
| 5 or more Children | 0 (0.0%) | 0 (0.0%) |
| Total | 3,051 (100.0%) | 0 (0.0%) |
Income Below Poverty Among Single-Parent Households in Scotts Valley
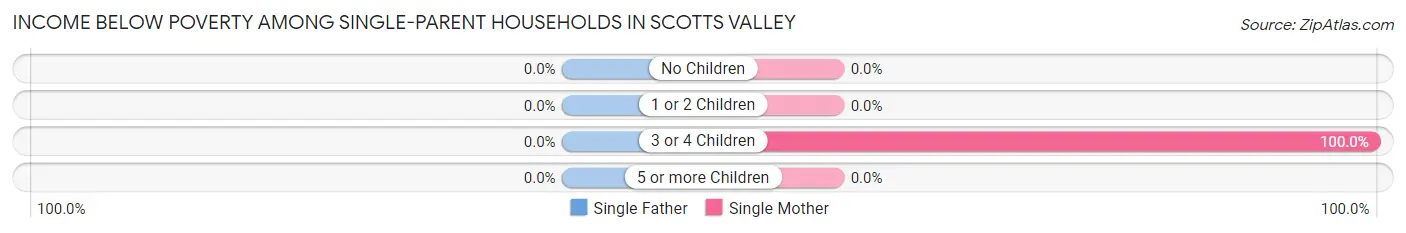
| Children | Single Father | Single Mother |
| No Children | 0 (0.0%) | 0 (0.0%) |
| 1 or 2 Children | 0 (0.0%) | 0 (0.0%) |
| 3 or 4 Children | 0 (0.0%) | 16 (100.0%) |
| 5 or more Children | 0 (0.0%) | 0 (0.0%) |
| Total | 0 (0.0%) | 16 (5.7%) |
Income Below Poverty Among Married-Couple vs Single-Parent Households in Scotts Valley
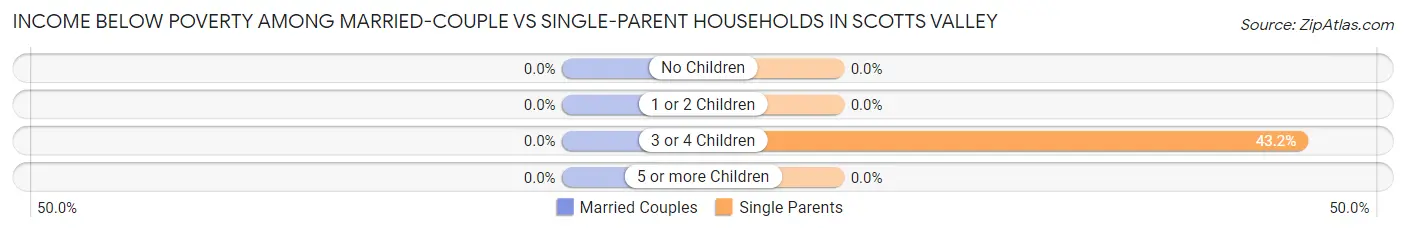
| Children | Married-Couple Families | Single-Parent Households |
| No Children | 0 (0.0%) | 0 (0.0%) |
| 1 or 2 Children | 0 (0.0%) | 0 (0.0%) |
| 3 or 4 Children | 0 (0.0%) | 16 (43.2%) |
| 5 or more Children | 0 (0.0%) | 0 (0.0%) |
| Total | 0 (0.0%) | 16 (3.2%) |
Race in Scotts Valley
The most populous races in Scotts Valley are White / Caucasian (9,704 | 79.3%), Hispanic or Latino (1,426 | 11.7%), and Two or more Races (959 | 7.8%).
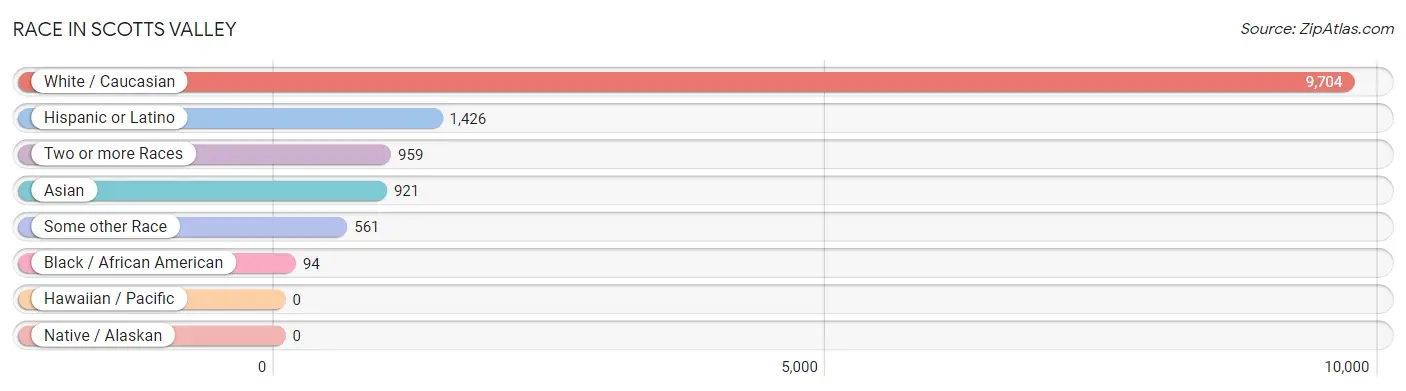
| Race | # Population | % Population |
| Asian | 921 | 7.5% |
| Black / African American | 94 | 0.8% |
| Hawaiian / Pacific | 0 | 0.0% |
| Hispanic or Latino | 1,426 | 11.7% |
| Native / Alaskan | 0 | 0.0% |
| White / Caucasian | 9,704 | 79.3% |
| Two or more Races | 959 | 7.8% |
| Some other Race | 561 | 4.6% |
| Total | 12,239 | 100.0% |
Ancestry in Scotts Valley
The most populous ancestries reported in Scotts Valley are English (2,609 | 21.3%), German (1,938 | 15.8%), Irish (1,615 | 13.2%), Mexican (1,197 | 9.8%), and Italian (1,117 | 9.1%), together accounting for 69.3% of all Scotts Valley residents.
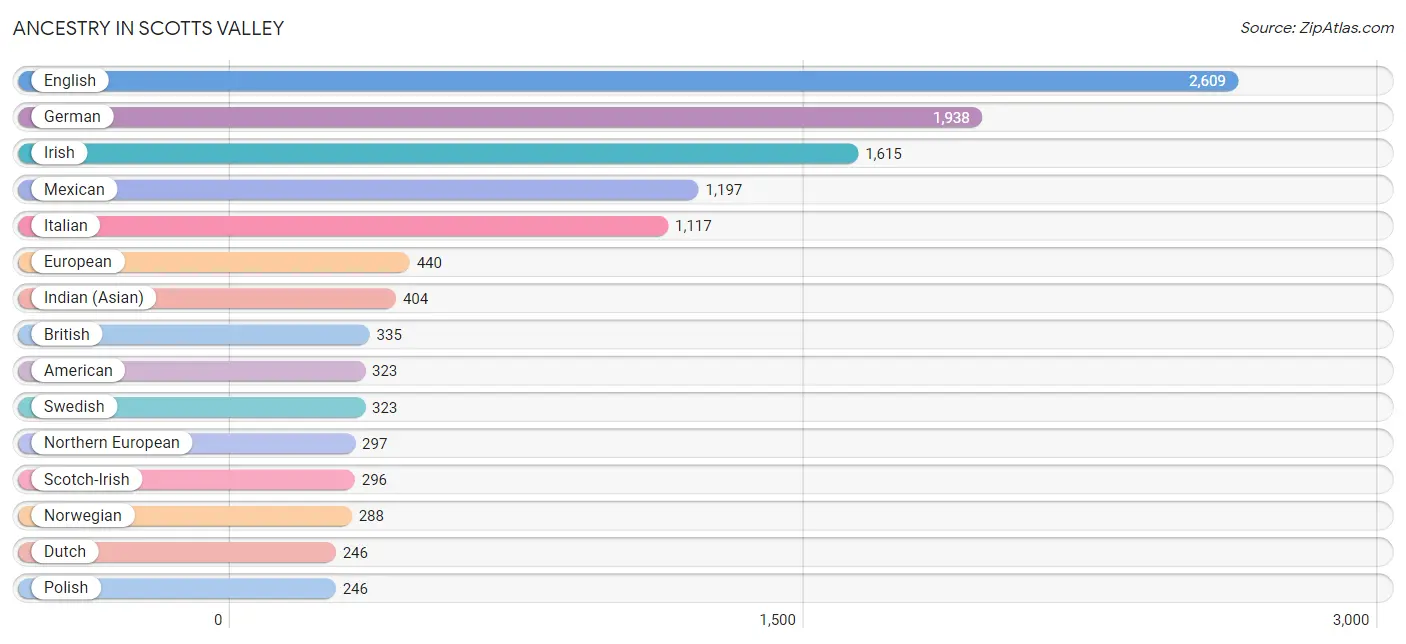
| Ancestry | # Population | % Population |
| American | 323 | 2.6% |
| Apache | 22 | 0.2% |
| Arab | 53 | 0.4% |
| Armenian | 69 | 0.6% |
| Austrian | 125 | 1.0% |
| Bhutanese | 61 | 0.5% |
| British | 335 | 2.7% |
| Burmese | 145 | 1.2% |
| Celtic | 68 | 0.6% |
| Central American | 62 | 0.5% |
| Cherokee | 69 | 0.6% |
| Costa Rican | 13 | 0.1% |
| Croatian | 103 | 0.8% |
| Czech | 23 | 0.2% |
| Danish | 57 | 0.5% |
| Dutch | 246 | 2.0% |
| Eastern European | 73 | 0.6% |
| English | 2,609 | 21.3% |
| Estonian | 67 | 0.5% |
| European | 440 | 3.6% |
| Filipino | 34 | 0.3% |
| Finnish | 31 | 0.3% |
| French | 216 | 1.8% |
| French Canadian | 53 | 0.4% |
| German | 1,938 | 15.8% |
| Greek | 91 | 0.7% |
| Hungarian | 75 | 0.6% |
| Icelander | 76 | 0.6% |
| Indian (Asian) | 404 | 3.3% |
| Iranian | 9 | 0.1% |
| Irish | 1,615 | 13.2% |
| Israeli | 89 | 0.7% |
| Italian | 1,117 | 9.1% |
| Japanese | 145 | 1.2% |
| Korean | 221 | 1.8% |
| Lebanese | 12 | 0.1% |
| Lithuanian | 62 | 0.5% |
| Mexican | 1,197 | 9.8% |
| Moroccan | 19 | 0.2% |
| Northern European | 297 | 2.4% |
| Norwegian | 288 | 2.4% |
| Polish | 246 | 2.0% |
| Portuguese | 129 | 1.1% |
| Puerto Rican | 17 | 0.1% |
| Romanian | 29 | 0.2% |
| Russian | 234 | 1.9% |
| Salvadoran | 49 | 0.4% |
| Samoan | 4 | 0.0% |
| Scandinavian | 15 | 0.1% |
| Scotch-Irish | 296 | 2.4% |
| Scottish | 187 | 1.5% |
| Slovene | 16 | 0.1% |
| Spaniard | 34 | 0.3% |
| Spanish | 97 | 0.8% |
| Sri Lankan | 11 | 0.1% |
| Swedish | 323 | 2.6% |
| Swiss | 59 | 0.5% |
| Thai | 219 | 1.8% |
| Ukrainian | 131 | 1.1% |
| Welsh | 88 | 0.7% |
| West Indian | 35 | 0.3% | View All 61 Rows |
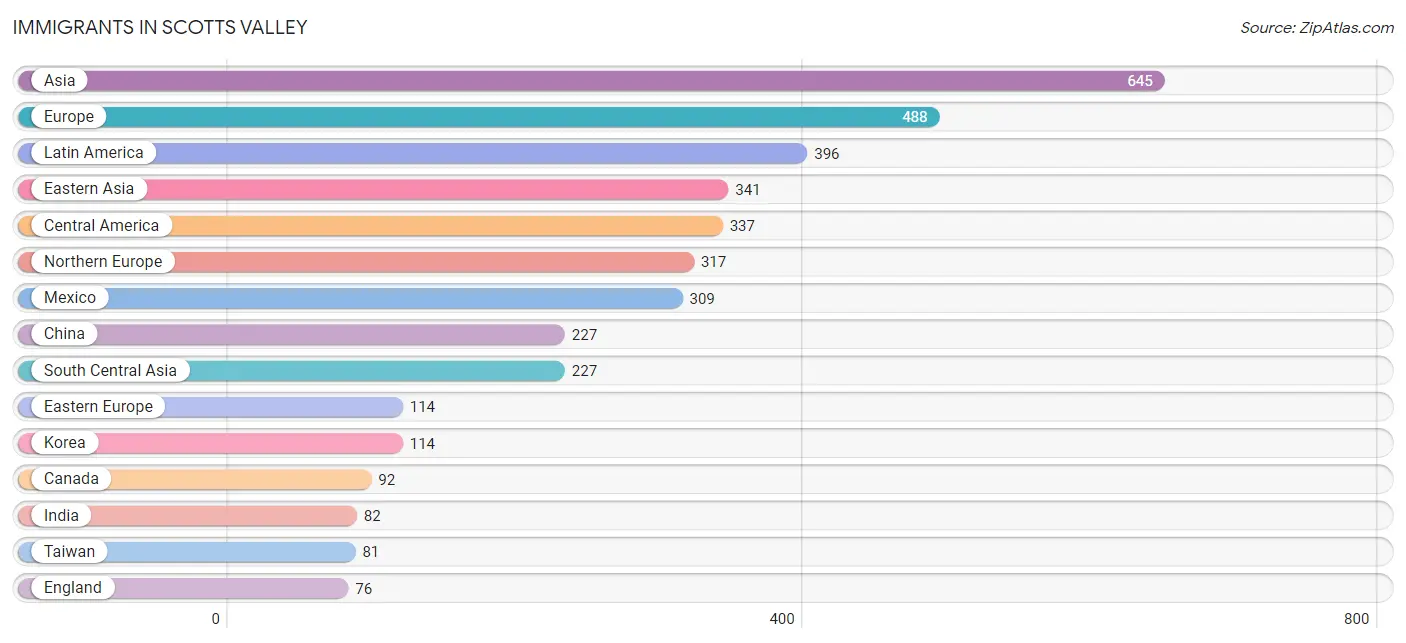
Immigrants in Scotts Valley
The most numerous immigrant groups reported in Scotts Valley came from Asia (645 | 5.3%), Europe (488 | 4.0%), Latin America (396 | 3.2%), Eastern Asia (341 | 2.8%), and Central America (337 | 2.8%), together accounting for 18.0% of all Scotts Valley residents.
| Immigration Origin | # Population | % Population |
| Africa | 45 | 0.4% |
| Asia | 645 | 5.3% |
| Brazil | 59 | 0.5% |
| Cambodia | 22 | 0.2% |
| Canada | 92 | 0.7% |
| Central America | 337 | 2.8% |
| China | 227 | 1.8% |
| Costa Rica | 13 | 0.1% |
| Croatia | 27 | 0.2% |
| Eastern Africa | 30 | 0.3% |
| Eastern Asia | 341 | 2.8% |
| Eastern Europe | 114 | 0.9% |
| El Salvador | 15 | 0.1% |
| England | 76 | 0.6% |
| Europe | 488 | 4.0% |
| Germany | 31 | 0.3% |
| Hungary | 24 | 0.2% |
| India | 82 | 0.7% |
| Iran | 67 | 0.5% |
| Israel | 22 | 0.2% |
| Italy | 15 | 0.1% |
| Korea | 114 | 0.9% |
| Latin America | 396 | 3.2% |
| Mexico | 309 | 2.5% |
| Moldova | 21 | 0.2% |
| Nepal | 42 | 0.3% |
| Netherlands | 11 | 0.1% |
| Northern Europe | 317 | 2.6% |
| Pakistan | 36 | 0.3% |
| Philippines | 22 | 0.2% |
| Russia | 9 | 0.1% |
| Scotland | 44 | 0.4% |
| South Africa | 15 | 0.1% |
| South America | 59 | 0.5% |
| South Central Asia | 227 | 1.8% |
| South Eastern Asia | 55 | 0.4% |
| Southern Europe | 15 | 0.1% |
| Taiwan | 81 | 0.7% |
| Vietnam | 11 | 0.1% |
| Western Asia | 22 | 0.2% |
| Western Europe | 42 | 0.3% | View All 41 Rows |
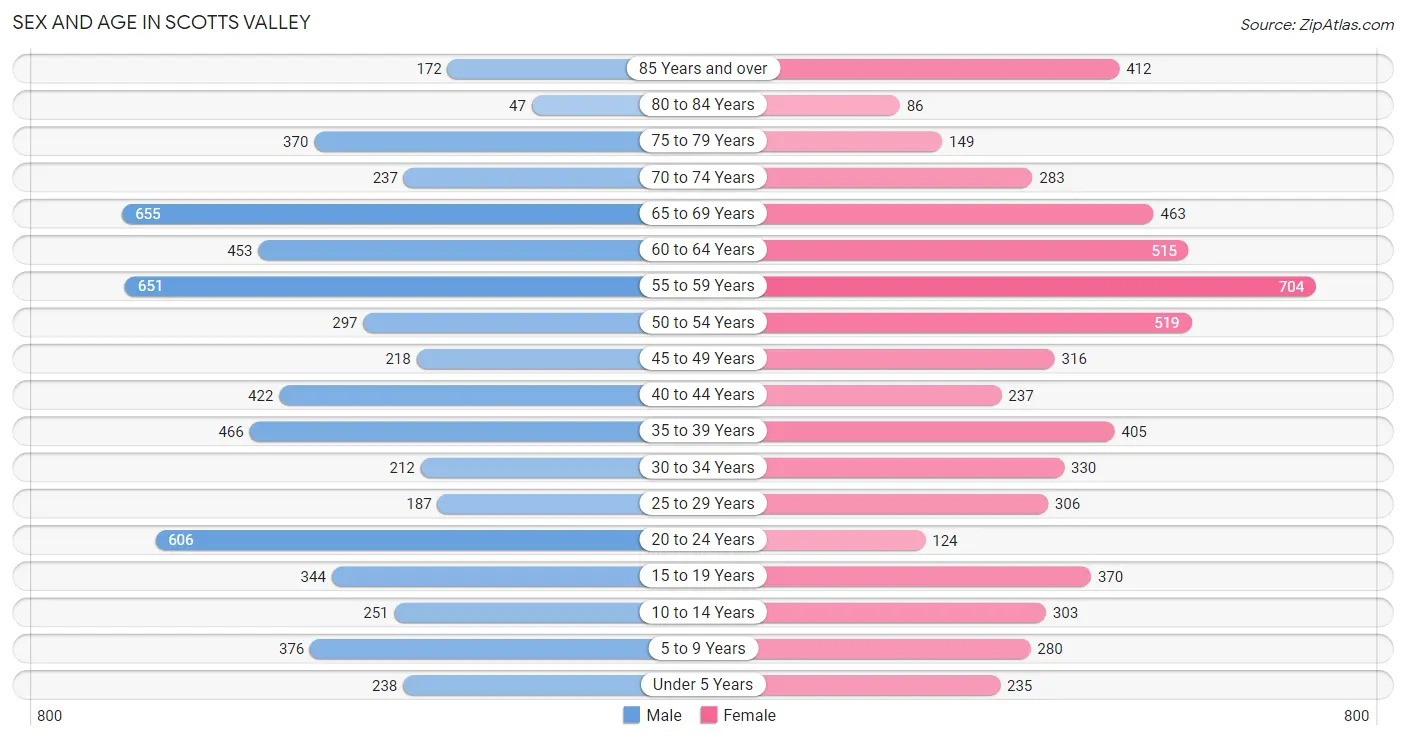
Sex and Age in Scotts Valley
Sex and Age in Scotts Valley
The most populous age groups in Scotts Valley are 65 to 69 Years (655 | 10.6%) for men and 55 to 59 Years (704 | 11.7%) for women.
| Age Bracket | Male | Female |
| Under 5 Years | 238 (3.8%) | 235 (3.9%) |
| 5 to 9 Years | 376 (6.1%) | 280 (4.6%) |
| 10 to 14 Years | 251 (4.1%) | 303 (5.0%) |
| 15 to 19 Years | 344 (5.6%) | 370 (6.1%) |
| 20 to 24 Years | 606 (9.8%) | 124 (2.1%) |
| 25 to 29 Years | 187 (3.0%) | 306 (5.1%) |
| 30 to 34 Years | 212 (3.4%) | 330 (5.5%) |
| 35 to 39 Years | 466 (7.5%) | 405 (6.7%) |
| 40 to 44 Years | 422 (6.8%) | 237 (3.9%) |
| 45 to 49 Years | 218 (3.5%) | 316 (5.2%) |
| 50 to 54 Years | 297 (4.8%) | 519 (8.6%) |
| 55 to 59 Years | 651 (10.5%) | 704 (11.7%) |
| 60 to 64 Years | 453 (7.3%) | 515 (8.5%) |
| 65 to 69 Years | 655 (10.6%) | 463 (7.7%) |
| 70 to 74 Years | 237 (3.8%) | 283 (4.7%) |
| 75 to 79 Years | 370 (6.0%) | 149 (2.5%) |
| 80 to 84 Years | 47 (0.8%) | 86 (1.4%) |
| 85 Years and over | 172 (2.8%) | 412 (6.8%) |
| Total | 6,202 (100.0%) | 6,037 (100.0%) |
Families and Households in Scotts Valley
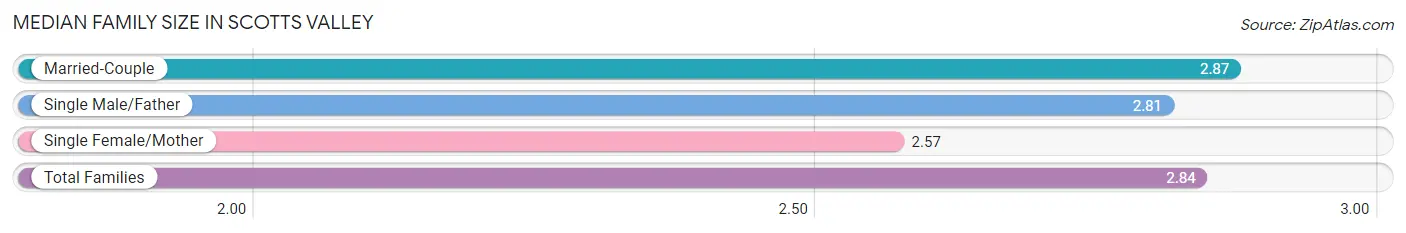
Median Family Size in Scotts Valley
The median family size in Scotts Valley is 2.84 persons per family, with married-couple families (3,051 | 86.0%) accounting for the largest median family size of 2.87 persons per family. On the other hand, single female/mother families (283 | 8.0%) represent the smallest median family size with 2.57 persons per family.
| Family Type | # Families | Family Size |
| Married-Couple | 3,051 (86.0%) | 2.87 |
| Single Male/Father | 214 (6.0%) | 2.81 |
| Single Female/Mother | 283 (8.0%) | 2.57 |
| Total Families | 3,548 (100.0%) | 2.84 |
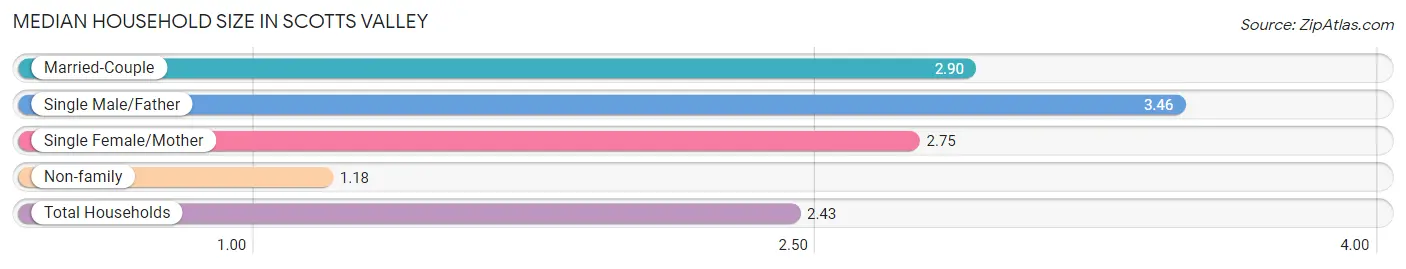
Median Household Size in Scotts Valley
The median household size in Scotts Valley is 2.43 persons per household, with single male/father households (214 | 4.3%) accounting for the largest median household size of 3.46 persons per household. non-family households (1,372 | 27.9%) represent the smallest median household size with 1.18 persons per household.
| Household Type | # Households | Household Size |
| Married-Couple | 3,051 (62.0%) | 2.90 |
| Single Male/Father | 214 (4.3%) | 3.46 |
| Single Female/Mother | 283 (5.8%) | 2.75 |
| Non-family | 1,372 (27.9%) | 1.18 |
| Total Households | 4,920 (100.0%) | 2.43 |
Household Size by Marriage Status in Scotts Valley
Out of a total of 4,920 households in Scotts Valley, 3,548 (72.1%) are family households, while 1,372 (27.9%) are nonfamily households. The most numerous type of family households are 2-person households, comprising 1,761, and the most common type of nonfamily households are 1-person households, comprising 1,161.
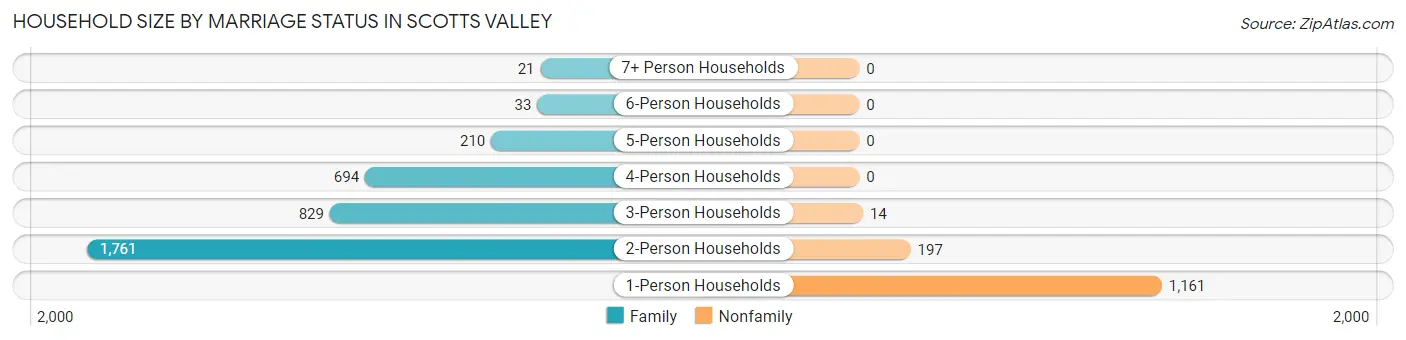
| Household Size | Family Households | Nonfamily Households |
| 1-Person Households | - | 1,161 (23.6%) |
| 2-Person Households | 1,761 (35.8%) | 197 (4.0%) |
| 3-Person Households | 829 (16.9%) | 14 (0.3%) |
| 4-Person Households | 694 (14.1%) | 0 (0.0%) |
| 5-Person Households | 210 (4.3%) | 0 (0.0%) |
| 6-Person Households | 33 (0.7%) | 0 (0.0%) |
| 7+ Person Households | 21 (0.4%) | 0 (0.0%) |
| Total | 3,548 (72.1%) | 1,372 (27.9%) |
Female Fertility in Scotts Valley
Fertility by Age in Scotts Valley
Average fertility rate in Scotts Valley is 60.0 births per 1,000 women. Women in the age bracket of 20 to 34 years have the highest fertility rate with 99.0 births per 1,000 women. Women in the age bracket of 20 to 34 years acount for 55.6% of all women with births.
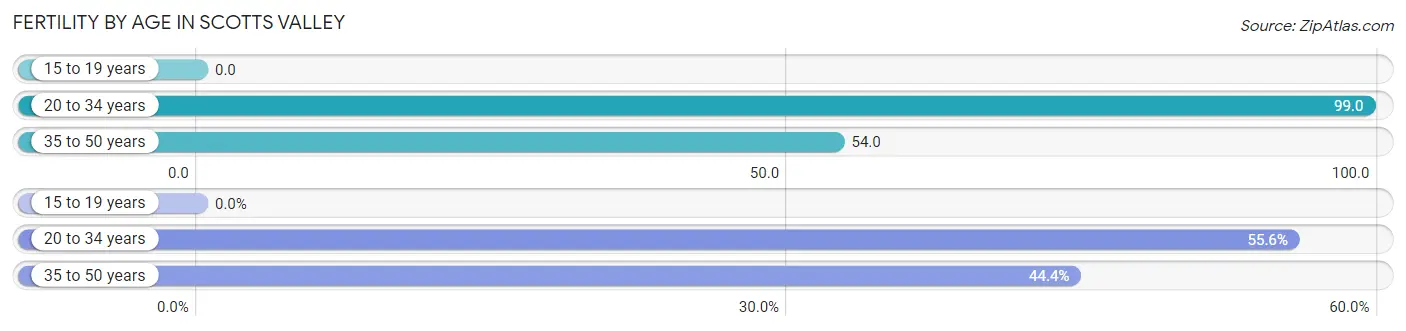
| Age Bracket | Women with Births | Births / 1,000 Women |
| 15 to 19 years | 0 (0.0%) | 0.0 |
| 20 to 34 years | 75 (55.6%) | 99.0 |
| 35 to 50 years | 60 (44.4%) | 54.0 |
| Total | 135 (100.0%) | 60.0 |
Fertility by Age by Marriage Status in Scotts Valley
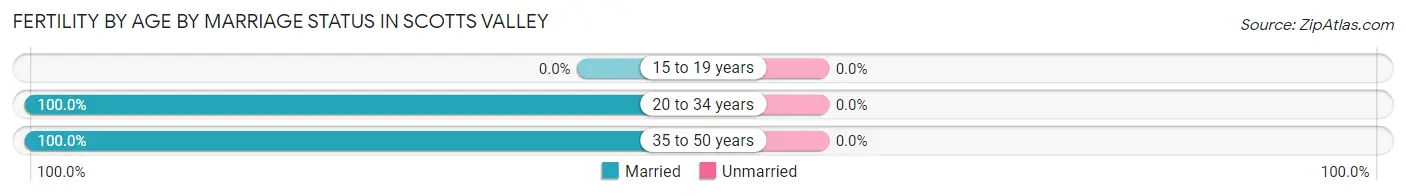
| Age Bracket | Married | Unmarried |
| 15 to 19 years | 0 (0.0%) | 0 (0.0%) |
| 20 to 34 years | 75 (100.0%) | 0 (0.0%) |
| 35 to 50 years | 60 (100.0%) | 0 (0.0%) |
| Total | 135 (100.0%) | 0 (0.0%) |
Fertility by Education in Scotts Valley
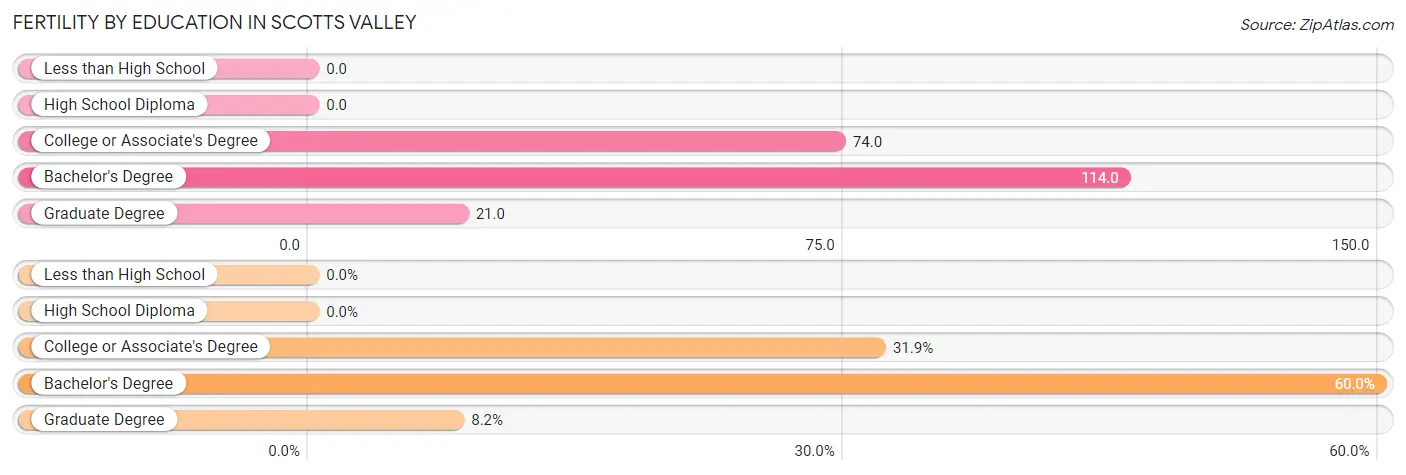
| Educational Attainment | Women with Births | Births / 1,000 Women |
| Less than High School | 0 (0.0%) | 0.0 |
| High School Diploma | 0 (0.0%) | 0.0 |
| College or Associate's Degree | 43 (31.9%) | 74.0 |
| Bachelor's Degree | 81 (60.0%) | 114.0 |
| Graduate Degree | 11 (8.2%) | 21.0 |
| Total | 135 (100.0%) | 60.0 |
Fertility by Education by Marriage Status in Scotts Valley
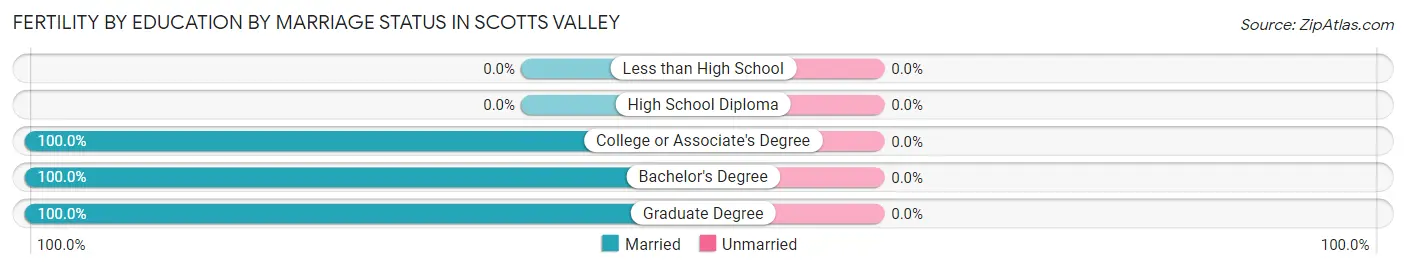
| Educational Attainment | Married | Unmarried |
| Less than High School | 0 (0.0%) | 0 (0.0%) |
| High School Diploma | 0 (0.0%) | 0 (0.0%) |
| College or Associate's Degree | 43 (100.0%) | 0 (0.0%) |
| Bachelor's Degree | 81 (100.0%) | 0 (0.0%) |
| Graduate Degree | 11 (100.0%) | 0 (0.0%) |
| Total | 135 (100.0%) | 0 (0.0%) |
Employment Characteristics in Scotts Valley
Employment by Class of Employer in Scotts Valley
Among the 6,183 employed individuals in Scotts Valley, private company employees (3,313 | 53.6%), local government employees (925 | 15.0%), and not-for-profit organizations (613 | 9.9%) make up the most common classes of employment.
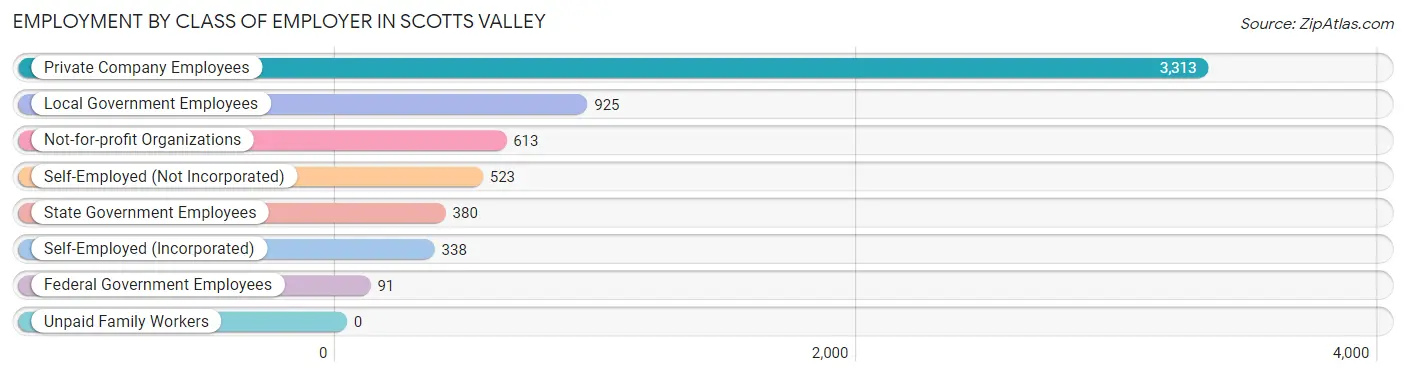
| Employer Class | # Employees | % Employees |
| Private Company Employees | 3,313 | 53.6% |
| Self-Employed (Incorporated) | 338 | 5.5% |
| Self-Employed (Not Incorporated) | 523 | 8.5% |
| Not-for-profit Organizations | 613 | 9.9% |
| Local Government Employees | 925 | 15.0% |
| State Government Employees | 380 | 6.1% |
| Federal Government Employees | 91 | 1.5% |
| Unpaid Family Workers | 0 | 0.0% |
| Total | 6,183 | 100.0% |
Employment Status by Age in Scotts Valley
According to the labor force statistics for Scotts Valley, out of the total population over 16 years of age (10,486), 63.2% or 6,627 individuals are in the labor force, with 1.9% or 126 of them unemployed. The age group with the highest labor force participation rate is 35 to 44 years, with 93.1% or 1,424 individuals in the labor force. Within the labor force, the 25 to 29 years age range has the highest percentage of unemployed individuals, with 11.7% or 44 of them being unemployed.
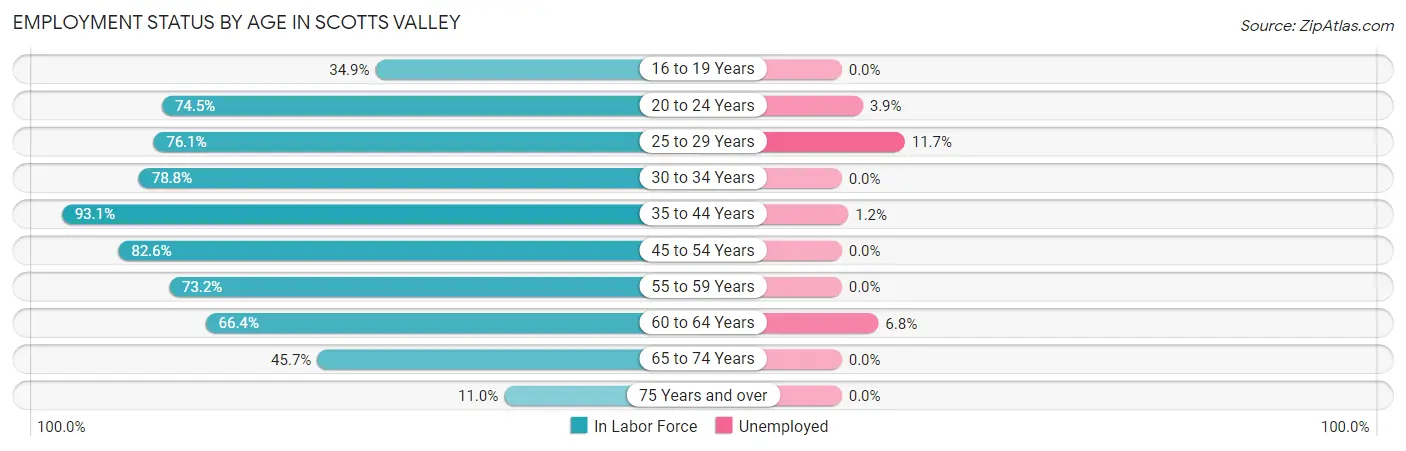
| Age Bracket | In Labor Force | Unemployed |
| 16 to 19 Years | 225 (34.9%) | 0 (0.0%) |
| 20 to 24 Years | 544 (74.5%) | 21 (3.9%) |
| 25 to 29 Years | 375 (76.1%) | 44 (11.7%) |
| 30 to 34 Years | 427 (78.8%) | 0 (0.0%) |
| 35 to 44 Years | 1,424 (93.1%) | 17 (1.2%) |
| 45 to 54 Years | 1,115 (82.6%) | 0 (0.0%) |
| 55 to 59 Years | 992 (73.2%) | 0 (0.0%) |
| 60 to 64 Years | 643 (66.4%) | 44 (6.8%) |
| 65 to 74 Years | 749 (45.7%) | 0 (0.0%) |
| 75 Years and over | 136 (11.0%) | 0 (0.0%) |
| Total | 6,627 (63.2%) | 126 (1.9%) |
Employment Status by Educational Attainment in Scotts Valley
According to labor force statistics for Scotts Valley, 79.8% of individuals (4,978) out of the total population between 25 and 64 years of age (6,238) are in the labor force, with 2.1% or 105 of them being unemployed. The group with the highest labor force participation rate are those with the educational attainment of bachelor's degree or higher, with 87.0% or 3,223 individuals in the labor force. Within the labor force, individuals with college / associate degree education have the highest percentage of unemployment, with 4.0% or 46 of them being unemployed.
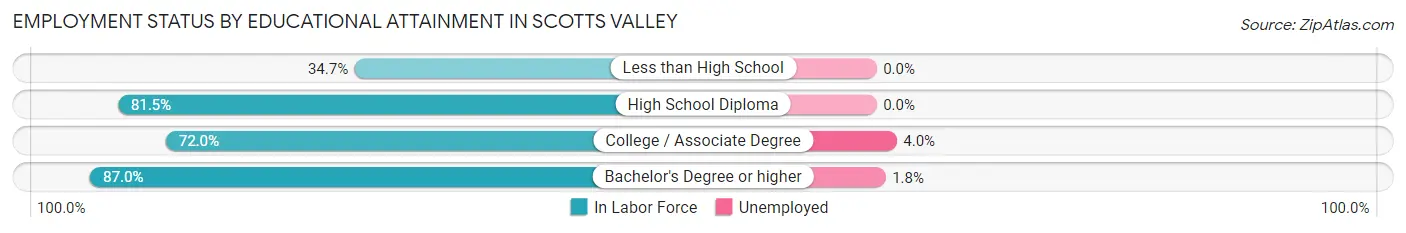
| Educational Attainment | In Labor Force | Unemployed |
| Less than High School | 120 (34.7%) | 0 (0.0%) |
| High School Diploma | 494 (81.5%) | 0 (0.0%) |
| College / Associate Degree | 1,138 (72.0%) | 63 (4.0%) |
| Bachelor's Degree or higher | 3,223 (87.0%) | 67 (1.8%) |
| Total | 4,978 (79.8%) | 131 (2.1%) |
Employment Occupations by Sex in Scotts Valley
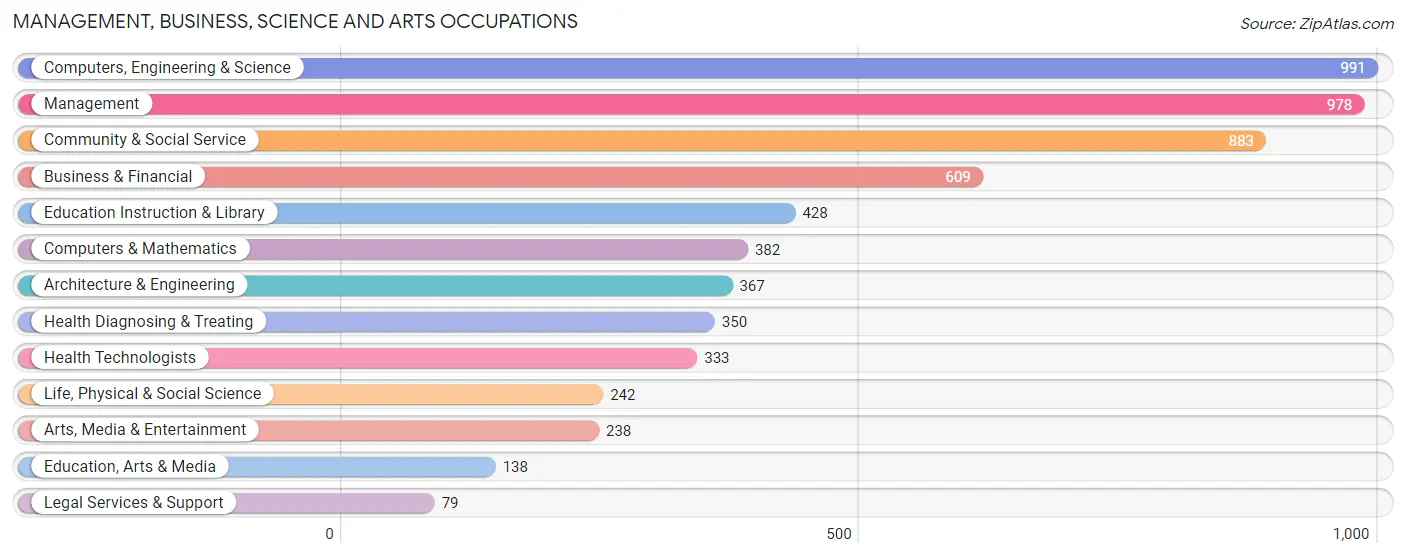
Management, Business, Science and Arts Occupations
The most common Management, Business, Science and Arts occupations in Scotts Valley are Computers, Engineering & Science (991 | 15.2%), Management (978 | 15.0%), Community & Social Service (883 | 13.6%), Business & Financial (609 | 9.4%), and Education Instruction & Library (428 | 6.6%).
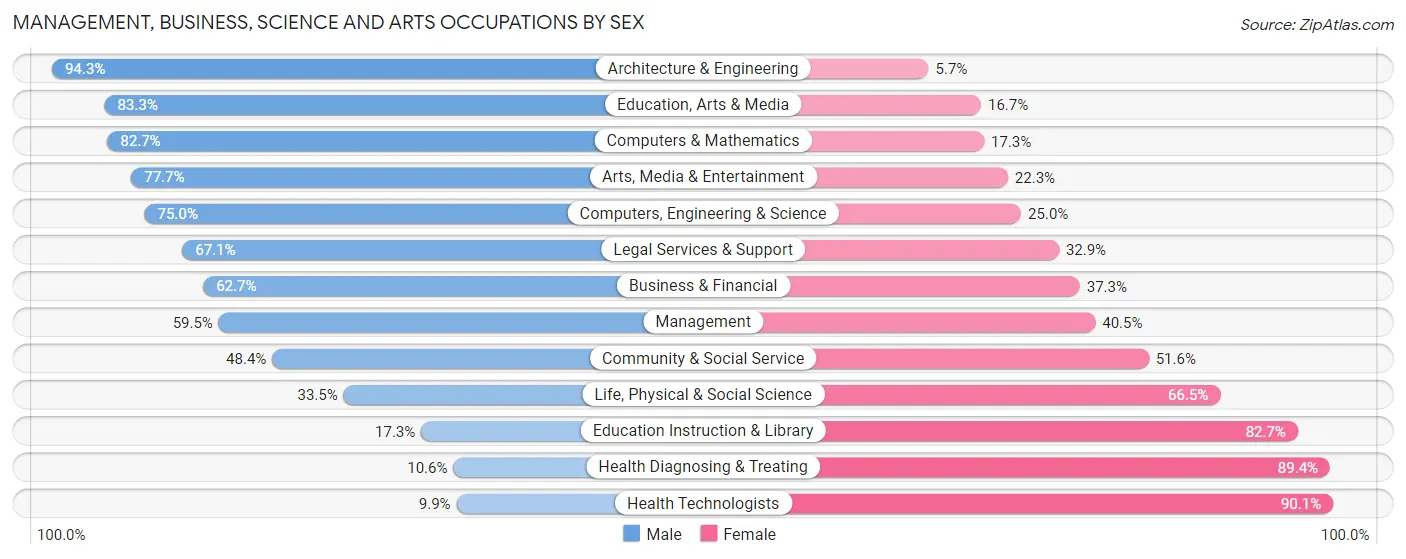
Management, Business, Science and Arts Occupations by Sex
Within the Management, Business, Science and Arts occupations in Scotts Valley, the most male-oriented occupations are Architecture & Engineering (94.3%), Education, Arts & Media (83.3%), and Computers & Mathematics (82.7%), while the most female-oriented occupations are Health Technologists (90.1%), Health Diagnosing & Treating (89.4%), and Education Instruction & Library (82.7%).
| Occupation | Male | Female |
| Management | 582 (59.5%) | 396 (40.5%) |
| Business & Financial | 382 (62.7%) | 227 (37.3%) |
| Computers, Engineering & Science | 743 (75.0%) | 248 (25.0%) |
| Computers & Mathematics | 316 (82.7%) | 66 (17.3%) |
| Architecture & Engineering | 346 (94.3%) | 21 (5.7%) |
| Life, Physical & Social Science | 81 (33.5%) | 161 (66.5%) |
| Community & Social Service | 427 (48.4%) | 456 (51.6%) |
| Education, Arts & Media | 115 (83.3%) | 23 (16.7%) |
| Legal Services & Support | 53 (67.1%) | 26 (32.9%) |
| Education Instruction & Library | 74 (17.3%) | 354 (82.7%) |
| Arts, Media & Entertainment | 185 (77.7%) | 53 (22.3%) |
| Health Diagnosing & Treating | 37 (10.6%) | 313 (89.4%) |
| Health Technologists | 33 (9.9%) | 300 (90.1%) |
| Total (Category) | 2,171 (57.0%) | 1,640 (43.0%) |
| Total (Overall) | 3,786 (58.2%) | 2,718 (41.8%) |
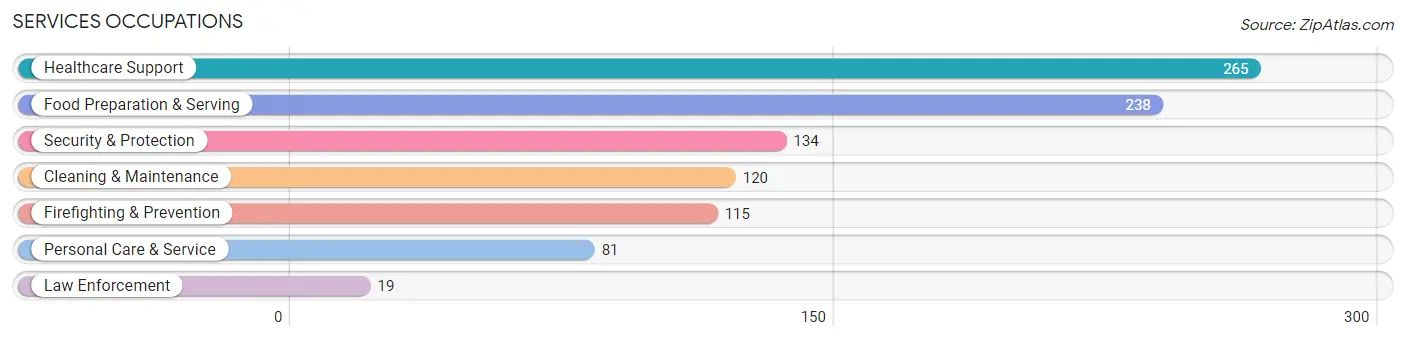
Services Occupations
The most common Services occupations in Scotts Valley are Healthcare Support (265 | 4.1%), Food Preparation & Serving (238 | 3.7%), Security & Protection (134 | 2.1%), Cleaning & Maintenance (120 | 1.8%), and Firefighting & Prevention (115 | 1.8%).
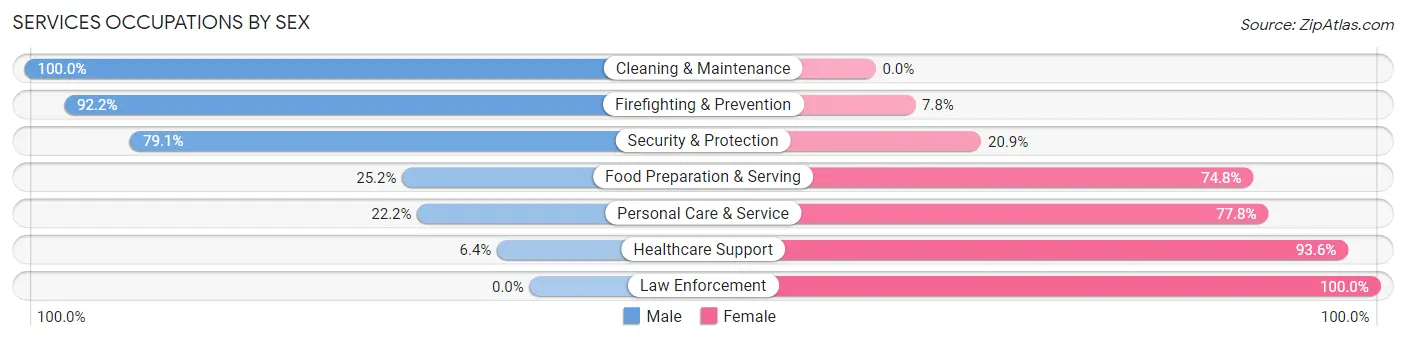
Services Occupations by Sex
Within the Services occupations in Scotts Valley, the most male-oriented occupations are Cleaning & Maintenance (100.0%), Firefighting & Prevention (92.2%), and Security & Protection (79.1%), while the most female-oriented occupations are Law Enforcement (100.0%), Healthcare Support (93.6%), and Personal Care & Service (77.8%).
| Occupation | Male | Female |
| Healthcare Support | 17 (6.4%) | 248 (93.6%) |
| Security & Protection | 106 (79.1%) | 28 (20.9%) |
| Firefighting & Prevention | 106 (92.2%) | 9 (7.8%) |
| Law Enforcement | 0 (0.0%) | 19 (100.0%) |
| Food Preparation & Serving | 60 (25.2%) | 178 (74.8%) |
| Cleaning & Maintenance | 120 (100.0%) | 0 (0.0%) |
| Personal Care & Service | 18 (22.2%) | 63 (77.8%) |
| Total (Category) | 321 (38.3%) | 517 (61.7%) |
| Total (Overall) | 3,786 (58.2%) | 2,718 (41.8%) |
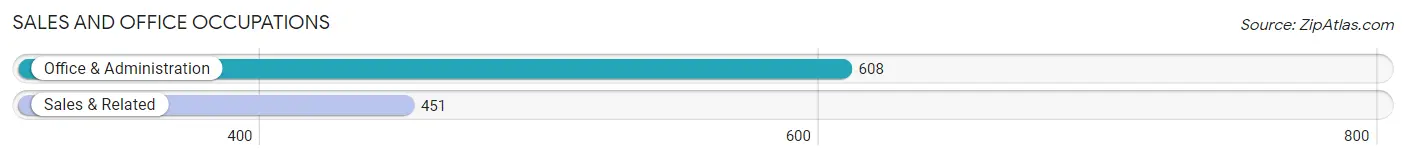
Sales and Office Occupations
The most common Sales and Office occupations in Scotts Valley are Office & Administration (608 | 9.3%), and Sales & Related (451 | 6.9%).
Sales and Office Occupations by Sex
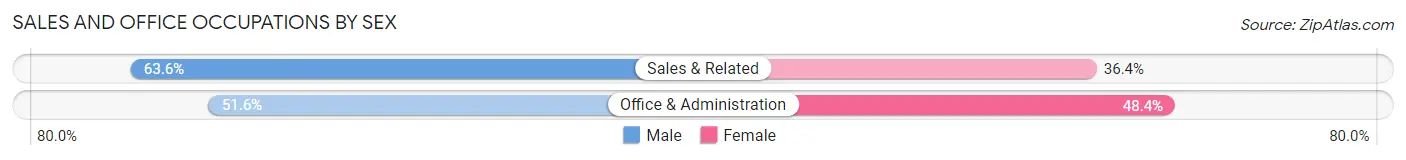
| Occupation | Male | Female |
| Sales & Related | 287 (63.6%) | 164 (36.4%) |
| Office & Administration | 314 (51.6%) | 294 (48.4%) |
| Total (Category) | 601 (56.8%) | 458 (43.2%) |
| Total (Overall) | 3,786 (58.2%) | 2,718 (41.8%) |
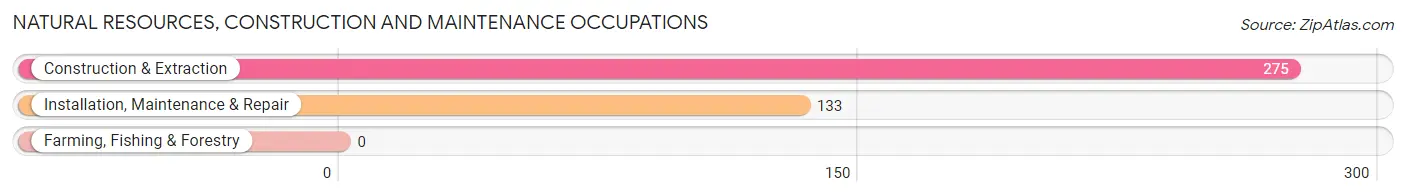
Natural Resources, Construction and Maintenance Occupations
The most common Natural Resources, Construction and Maintenance occupations in Scotts Valley are Construction & Extraction (275 | 4.2%), and Installation, Maintenance & Repair (133 | 2.0%).
Natural Resources, Construction and Maintenance Occupations by Sex
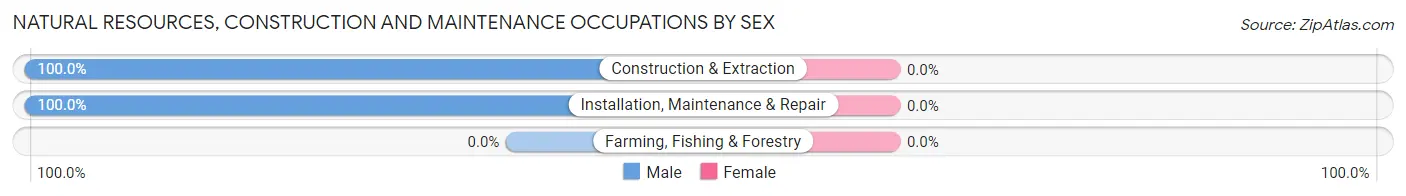
| Occupation | Male | Female |
| Farming, Fishing & Forestry | 0 (0.0%) | 0 (0.0%) |
| Construction & Extraction | 275 (100.0%) | 0 (0.0%) |
| Installation, Maintenance & Repair | 133 (100.0%) | 0 (0.0%) |
| Total (Category) | 408 (100.0%) | 0 (0.0%) |
| Total (Overall) | 3,786 (58.2%) | 2,718 (41.8%) |
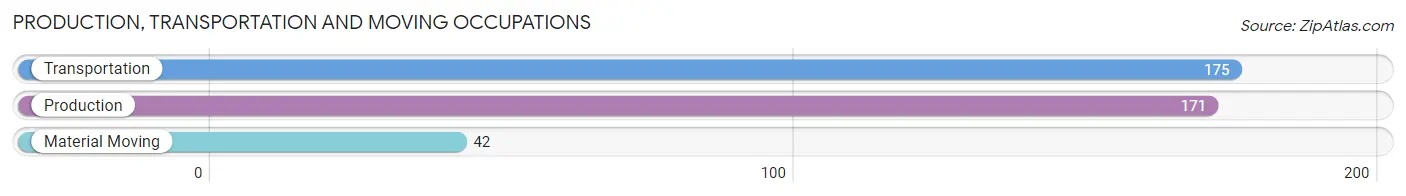
Production, Transportation and Moving Occupations
The most common Production, Transportation and Moving occupations in Scotts Valley are Transportation (175 | 2.7%), Production (171 | 2.6%), and Material Moving (42 | 0.6%).
Production, Transportation and Moving Occupations by Sex
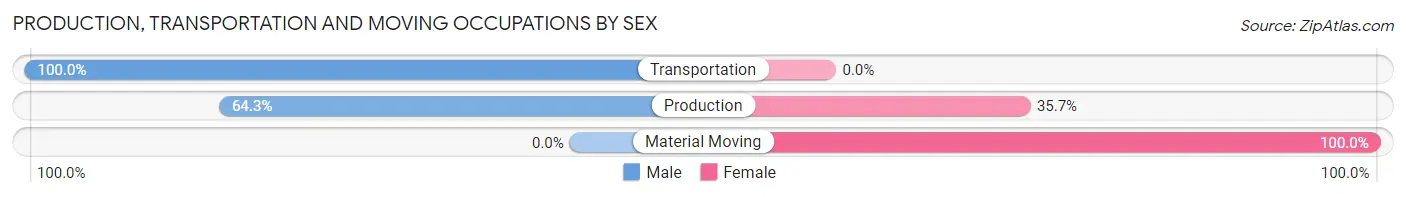
| Occupation | Male | Female |
| Production | 110 (64.3%) | 61 (35.7%) |
| Transportation | 175 (100.0%) | 0 (0.0%) |
| Material Moving | 0 (0.0%) | 42 (100.0%) |
| Total (Category) | 285 (73.5%) | 103 (26.6%) |
| Total (Overall) | 3,786 (58.2%) | 2,718 (41.8%) |
Employment Industries by Sex in Scotts Valley
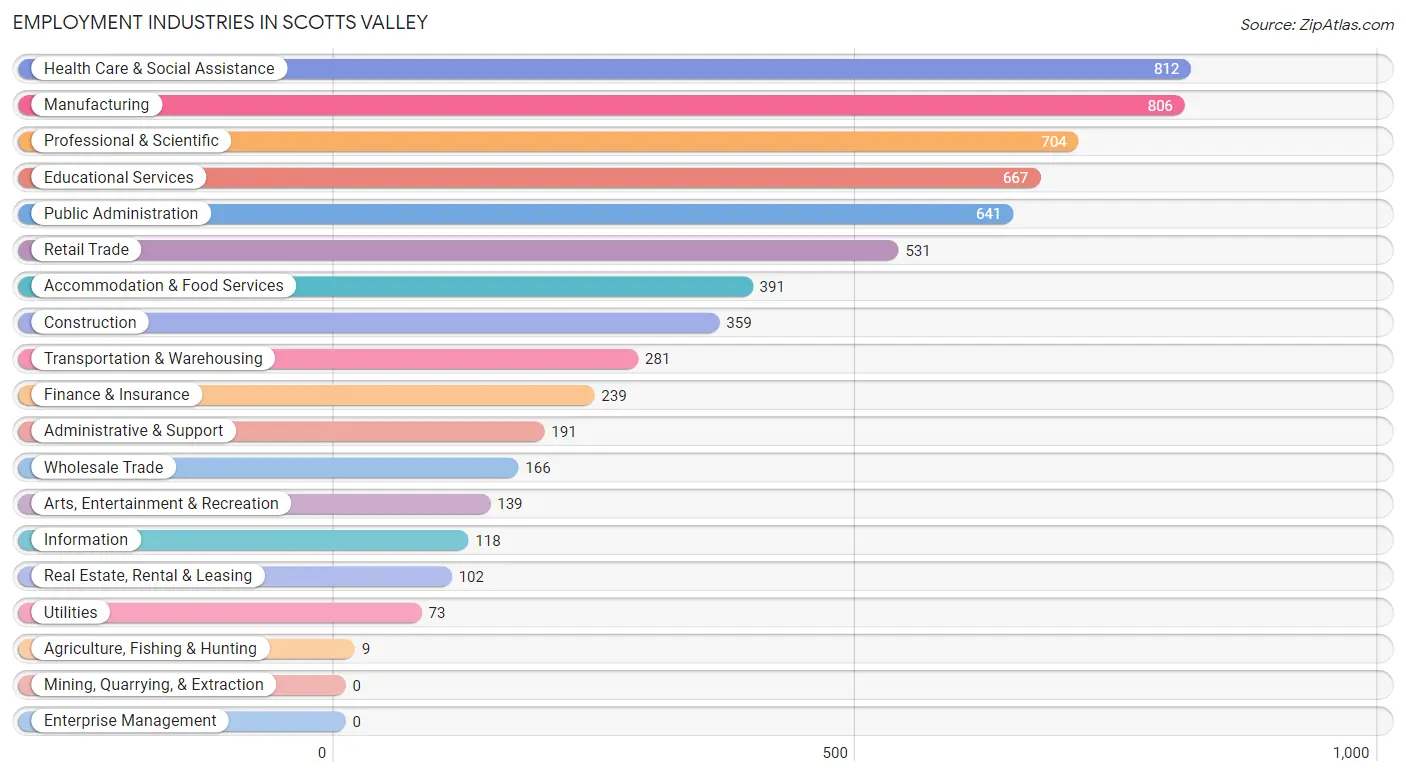
Employment Industries in Scotts Valley
The major employment industries in Scotts Valley include Health Care & Social Assistance (812 | 12.5%), Manufacturing (806 | 12.4%), Professional & Scientific (704 | 10.8%), Educational Services (667 | 10.3%), and Public Administration (641 | 9.9%).
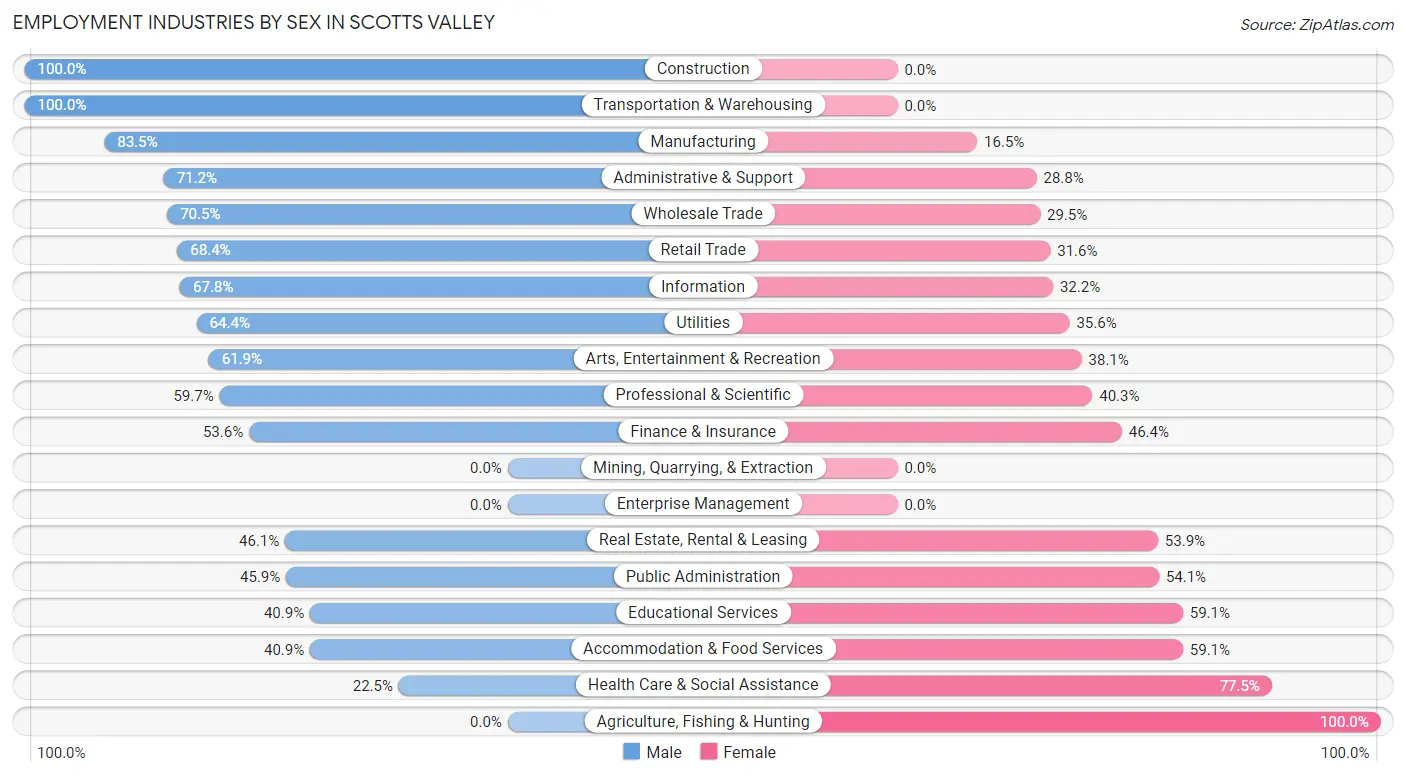
Employment Industries by Sex in Scotts Valley
The Scotts Valley industries that see more men than women are Construction (100.0%), Transportation & Warehousing (100.0%), and Manufacturing (83.5%), whereas the industries that tend to have a higher number of women are Agriculture, Fishing & Hunting (100.0%), Health Care & Social Assistance (77.5%), and Accommodation & Food Services (59.1%).
| Industry | Male | Female |
| Agriculture, Fishing & Hunting | 0 (0.0%) | 9 (100.0%) |
| Mining, Quarrying, & Extraction | 0 (0.0%) | 0 (0.0%) |
| Construction | 359 (100.0%) | 0 (0.0%) |
| Manufacturing | 673 (83.5%) | 133 (16.5%) |
| Wholesale Trade | 117 (70.5%) | 49 (29.5%) |
| Retail Trade | 363 (68.4%) | 168 (31.6%) |
| Transportation & Warehousing | 281 (100.0%) | 0 (0.0%) |
| Utilities | 47 (64.4%) | 26 (35.6%) |
| Information | 80 (67.8%) | 38 (32.2%) |
| Finance & Insurance | 128 (53.6%) | 111 (46.4%) |
| Real Estate, Rental & Leasing | 47 (46.1%) | 55 (53.9%) |
| Professional & Scientific | 420 (59.7%) | 284 (40.3%) |
| Enterprise Management | 0 (0.0%) | 0 (0.0%) |
| Administrative & Support | 136 (71.2%) | 55 (28.8%) |
| Educational Services | 273 (40.9%) | 394 (59.1%) |
| Health Care & Social Assistance | 183 (22.5%) | 629 (77.5%) |
| Arts, Entertainment & Recreation | 86 (61.9%) | 53 (38.1%) |
| Accommodation & Food Services | 160 (40.9%) | 231 (59.1%) |
| Public Administration | 294 (45.9%) | 347 (54.1%) |
| Total | 3,786 (58.2%) | 2,718 (41.8%) |
Education in Scotts Valley
School Enrollment in Scotts Valley
The most common levels of schooling among the 2,873 students in Scotts Valley are college / undergraduate (961 | 33.5%), elementary school (674 | 23.5%), and high school (543 | 18.9%).
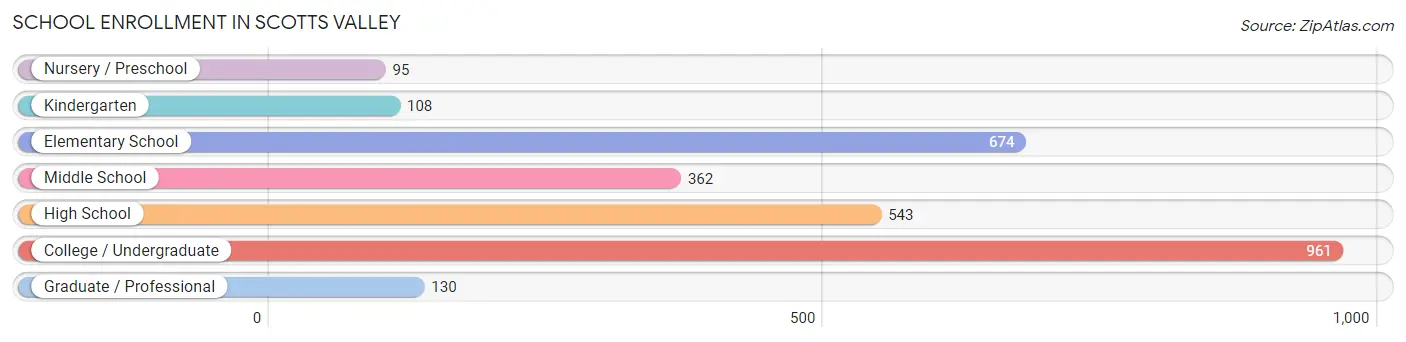
| School Level | # Students | % Students |
| Nursery / Preschool | 95 | 3.3% |
| Kindergarten | 108 | 3.8% |
| Elementary School | 674 | 23.5% |
| Middle School | 362 | 12.6% |
| High School | 543 | 18.9% |
| College / Undergraduate | 961 | 33.5% |
| Graduate / Professional | 130 | 4.5% |
| Total | 2,873 | 100.0% |
School Enrollment by Age by Funding Source in Scotts Valley
Out of a total of 2,873 students who are enrolled in schools in Scotts Valley, 707 (24.6%) attend a private institution, while the remaining 2,166 (75.4%) are enrolled in public schools. The age group of 3 to 4 year olds has the highest likelihood of being enrolled in private schools, with 84 (88.4% in the age bracket) enrolled. Conversely, the age group of 15 to 17 year olds has the lowest likelihood of being enrolled in a private school, with 282 (89.0% in the age bracket) attending a public institution.
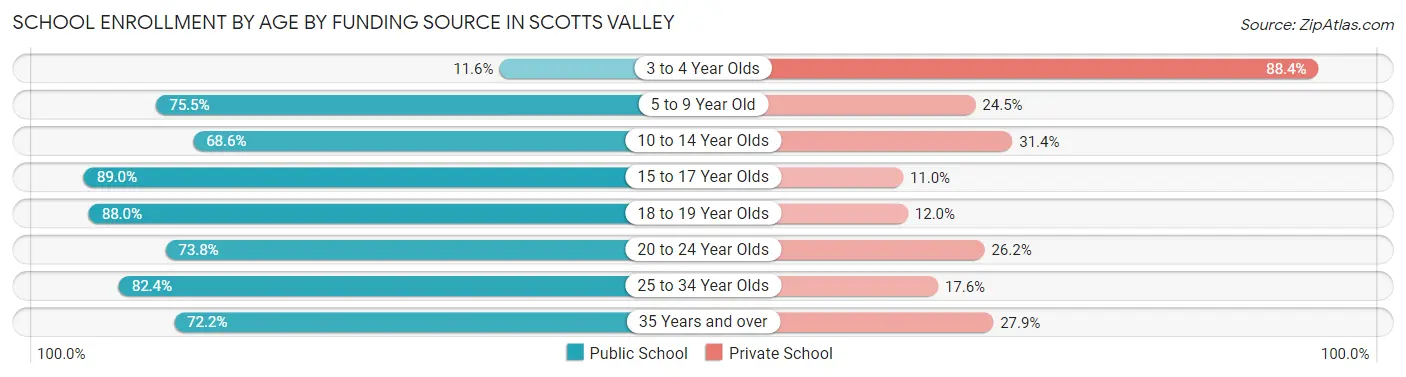
| Age Bracket | Public School | Private School |
| 3 to 4 Year Olds | 11 (11.6%) | 84 (88.4%) |
| 5 to 9 Year Old | 495 (75.5%) | 161 (24.5%) |
| 10 to 14 Year Olds | 380 (68.6%) | 174 (31.4%) |
| 15 to 17 Year Olds | 282 (89.0%) | 35 (11.0%) |
| 18 to 19 Year Olds | 324 (88.0%) | 44 (12.0%) |
| 20 to 24 Year Olds | 329 (73.8%) | 117 (26.2%) |
| 25 to 34 Year Olds | 230 (82.4%) | 49 (17.6%) |
| 35 Years and over | 114 (72.2%) | 44 (27.9%) |
| Total | 2,166 (75.4%) | 707 (24.6%) |
Educational Attainment by Field of Study in Scotts Valley
Business (926 | 18.0%), engineering (691 | 13.4%), social sciences (463 | 9.0%), bio, nature & agricultural (454 | 8.8%), and psychology (418 | 8.1%) are the most common fields of study among 5,145 individuals in Scotts Valley who have obtained a bachelor's degree or higher.
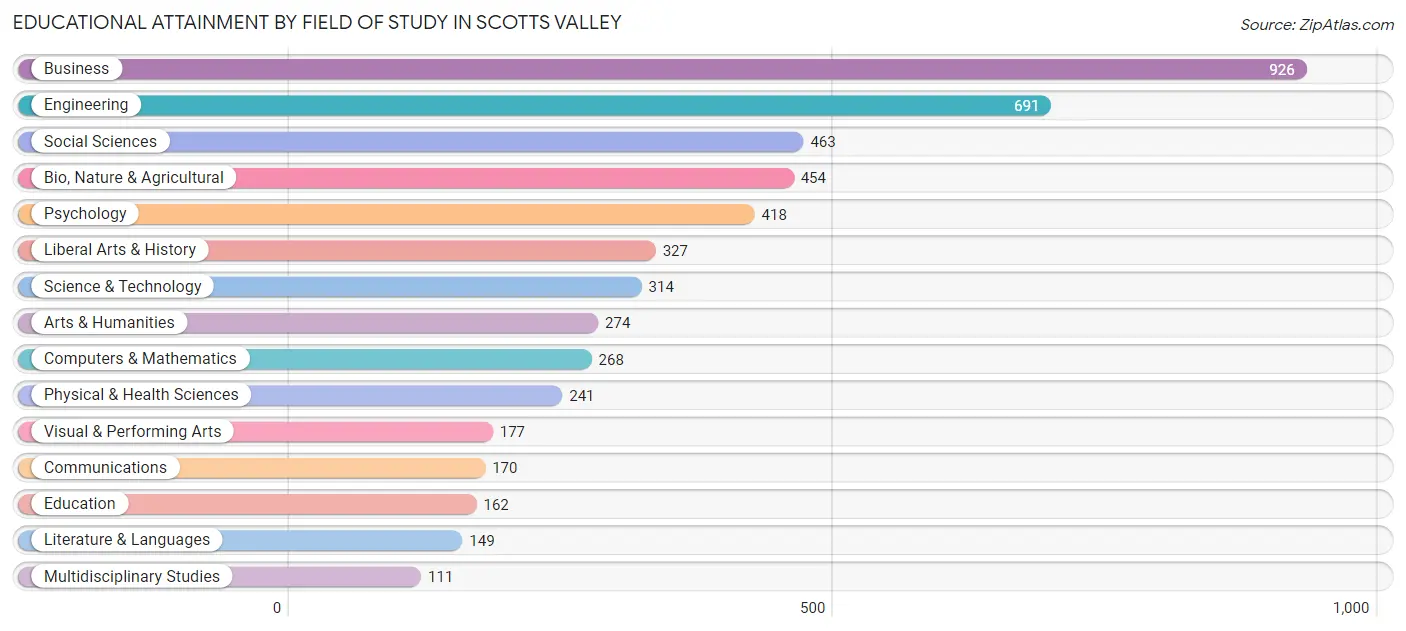
| Field of Study | # Graduates | % Graduates |
| Computers & Mathematics | 268 | 5.2% |
| Bio, Nature & Agricultural | 454 | 8.8% |
| Physical & Health Sciences | 241 | 4.7% |
| Psychology | 418 | 8.1% |
| Social Sciences | 463 | 9.0% |
| Engineering | 691 | 13.4% |
| Multidisciplinary Studies | 111 | 2.2% |
| Science & Technology | 314 | 6.1% |
| Business | 926 | 18.0% |
| Education | 162 | 3.2% |
| Literature & Languages | 149 | 2.9% |
| Liberal Arts & History | 327 | 6.4% |
| Visual & Performing Arts | 177 | 3.4% |
| Communications | 170 | 3.3% |
| Arts & Humanities | 274 | 5.3% |
| Total | 5,145 | 100.0% |
Transportation & Commute in Scotts Valley
Vehicle Availability by Sex in Scotts Valley
The most prevalent vehicle ownership categories in Scotts Valley are males with 2 vehicles (1,730, accounting for 47.9%) and females with 2 vehicles (998, making up 69.9%).
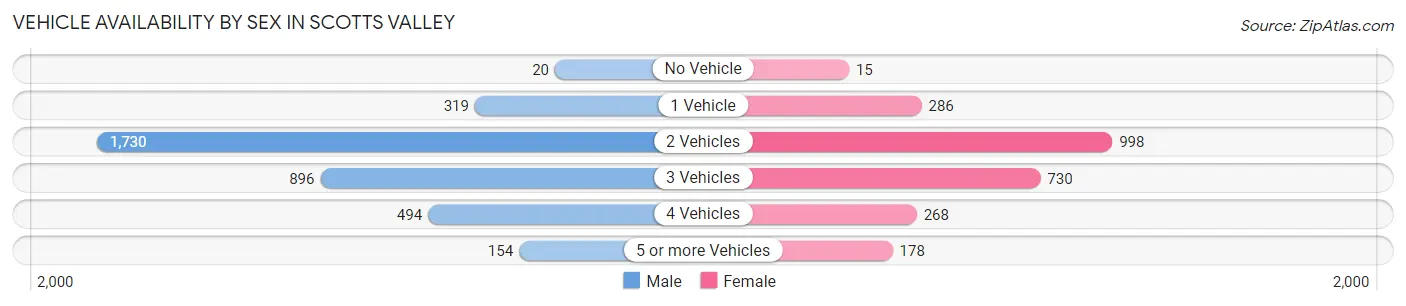
| Vehicles Available | Male | Female |
| No Vehicle | 20 (0.5%) | 15 (0.6%) |
| 1 Vehicle | 319 (8.8%) | 286 (11.6%) |
| 2 Vehicles | 1,730 (47.9%) | 998 (40.3%) |
| 3 Vehicles | 896 (24.8%) | 730 (29.5%) |
| 4 Vehicles | 494 (13.7%) | 268 (10.8%) |
| 5 or more Vehicles | 154 (4.3%) | 178 (7.2%) |
| Total | 3,613 (100.0%) | 2,475 (100.0%) |
Commute Time in Scotts Valley
The most frequently occuring commute durations in Scotts Valley are 10 to 14 minutes (993 commuters, 20.8%), 15 to 19 minutes (869 commuters, 18.2%), and 45 to 59 minutes (566 commuters, 11.8%).
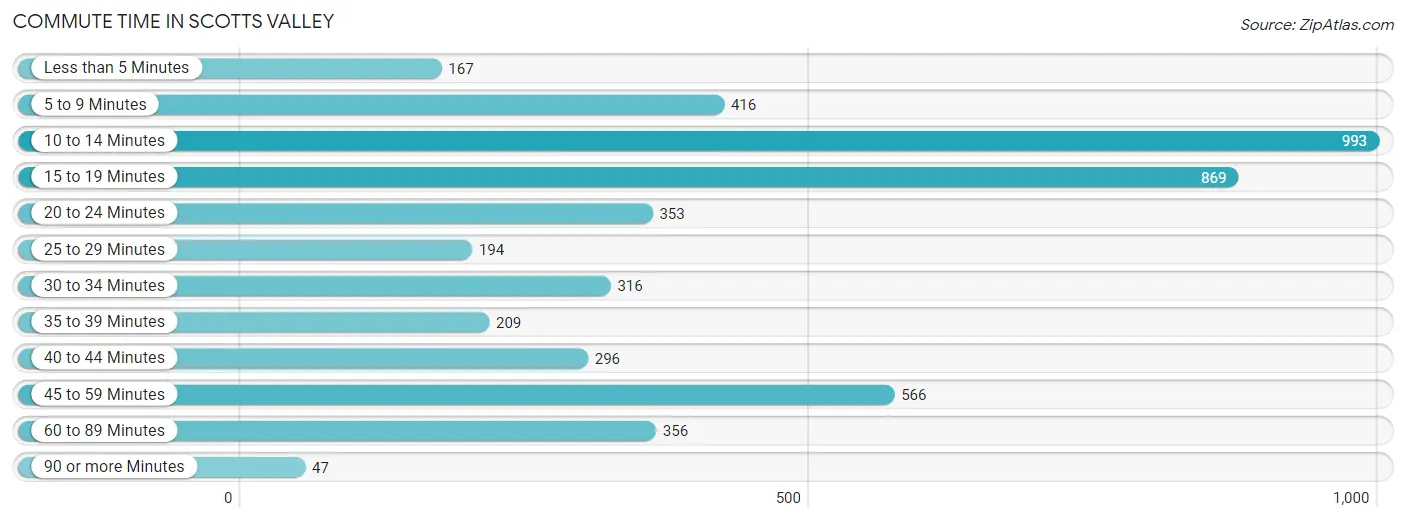
| Commute Time | # Commuters | % Commuters |
| Less than 5 Minutes | 167 | 3.5% |
| 5 to 9 Minutes | 416 | 8.7% |
| 10 to 14 Minutes | 993 | 20.8% |
| 15 to 19 Minutes | 869 | 18.2% |
| 20 to 24 Minutes | 353 | 7.4% |
| 25 to 29 Minutes | 194 | 4.1% |
| 30 to 34 Minutes | 316 | 6.6% |
| 35 to 39 Minutes | 209 | 4.4% |
| 40 to 44 Minutes | 296 | 6.2% |
| 45 to 59 Minutes | 566 | 11.8% |
| 60 to 89 Minutes | 356 | 7.4% |
| 90 or more Minutes | 47 | 1.0% |
Commute Time by Sex in Scotts Valley
The most common commute times in Scotts Valley are 10 to 14 minutes (602 commuters, 21.4%) for males and 15 to 19 minutes (462 commuters, 23.5%) for females.
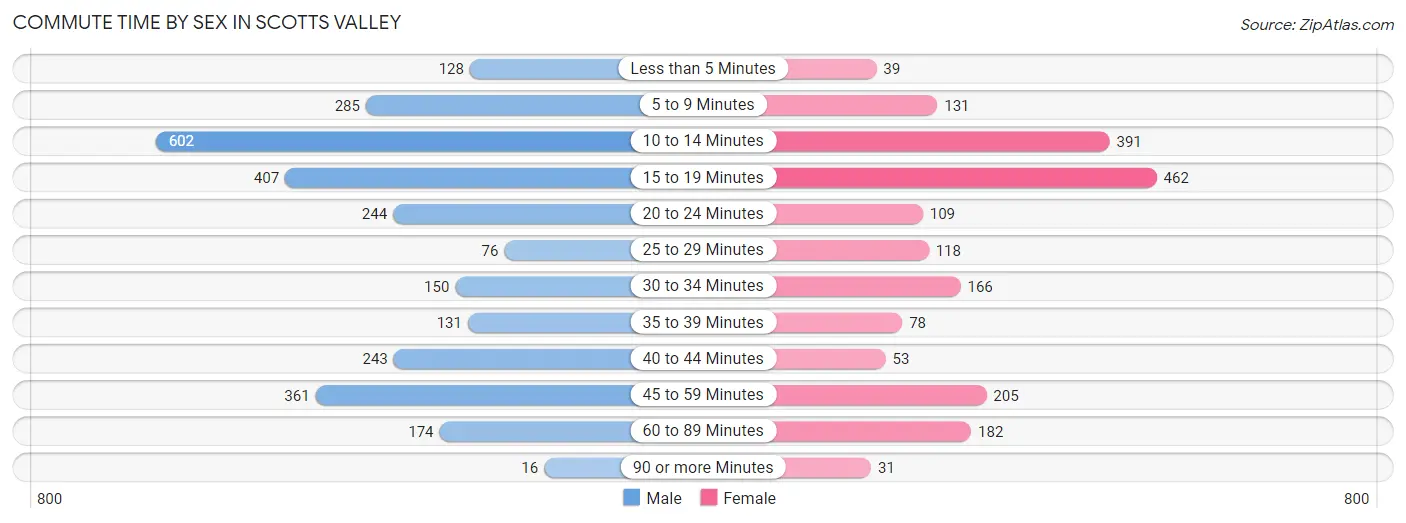
| Commute Time | Male | Female |
| Less than 5 Minutes | 128 (4.5%) | 39 (2.0%) |
| 5 to 9 Minutes | 285 (10.1%) | 131 (6.7%) |
| 10 to 14 Minutes | 602 (21.4%) | 391 (19.9%) |
| 15 to 19 Minutes | 407 (14.4%) | 462 (23.5%) |
| 20 to 24 Minutes | 244 (8.7%) | 109 (5.6%) |
| 25 to 29 Minutes | 76 (2.7%) | 118 (6.0%) |
| 30 to 34 Minutes | 150 (5.3%) | 166 (8.5%) |
| 35 to 39 Minutes | 131 (4.6%) | 78 (4.0%) |
| 40 to 44 Minutes | 243 (8.6%) | 53 (2.7%) |
| 45 to 59 Minutes | 361 (12.8%) | 205 (10.4%) |
| 60 to 89 Minutes | 174 (6.2%) | 182 (9.3%) |
| 90 or more Minutes | 16 (0.6%) | 31 (1.6%) |
Time of Departure to Work by Sex in Scotts Valley
The most frequent times of departure to work in Scotts Valley are 7:00 AM to 7:29 AM (444, 15.8%) for males and 7:00 AM to 7:29 AM (295, 15.0%) for females.
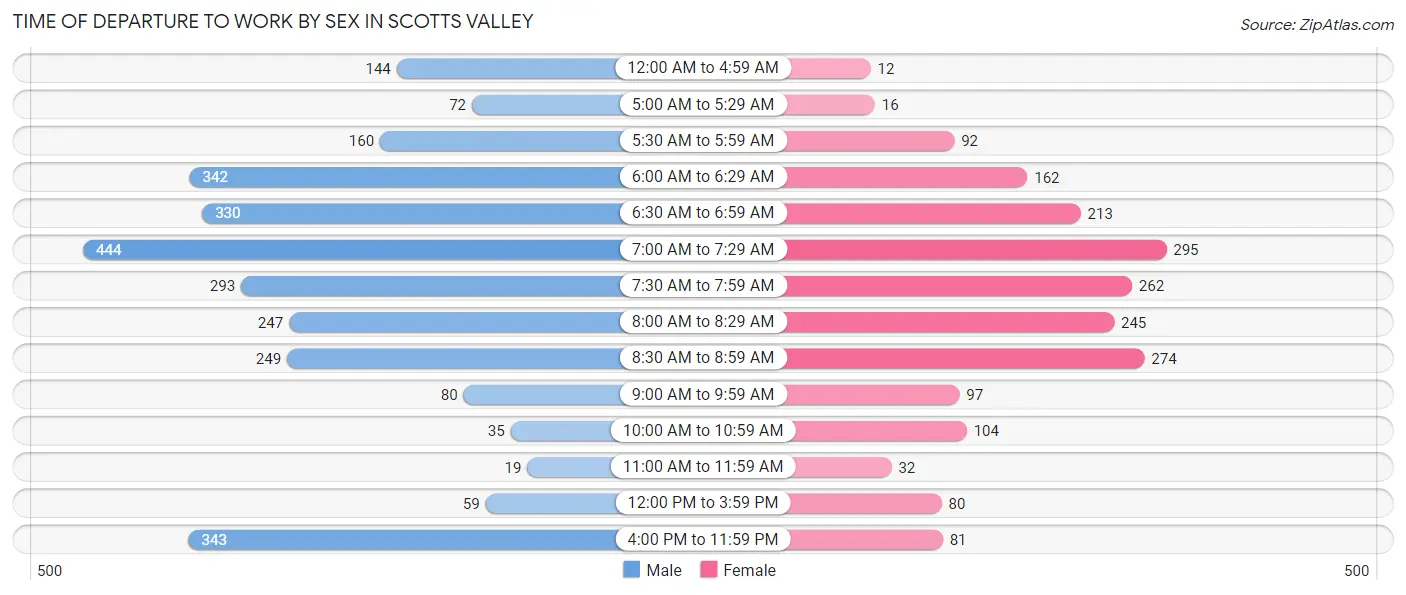
| Time of Departure | Male | Female |
| 12:00 AM to 4:59 AM | 144 (5.1%) | 12 (0.6%) |
| 5:00 AM to 5:29 AM | 72 (2.6%) | 16 (0.8%) |
| 5:30 AM to 5:59 AM | 160 (5.7%) | 92 (4.7%) |
| 6:00 AM to 6:29 AM | 342 (12.1%) | 162 (8.2%) |
| 6:30 AM to 6:59 AM | 330 (11.7%) | 213 (10.8%) |
| 7:00 AM to 7:29 AM | 444 (15.8%) | 295 (15.0%) |
| 7:30 AM to 7:59 AM | 293 (10.4%) | 262 (13.3%) |
| 8:00 AM to 8:29 AM | 247 (8.8%) | 245 (12.5%) |
| 8:30 AM to 8:59 AM | 249 (8.8%) | 274 (13.9%) |
| 9:00 AM to 9:59 AM | 80 (2.8%) | 97 (4.9%) |
| 10:00 AM to 10:59 AM | 35 (1.2%) | 104 (5.3%) |
| 11:00 AM to 11:59 AM | 19 (0.7%) | 32 (1.6%) |
| 12:00 PM to 3:59 PM | 59 (2.1%) | 80 (4.1%) |
| 4:00 PM to 11:59 PM | 343 (12.2%) | 81 (4.1%) |
| Total | 2,817 (100.0%) | 1,965 (100.0%) |
Housing Occupancy in Scotts Valley
Occupancy by Ownership in Scotts Valley
Of the total 4,920 dwellings in Scotts Valley, owner-occupied units account for 3,622 (73.6%), while renter-occupied units make up 1,298 (26.4%).
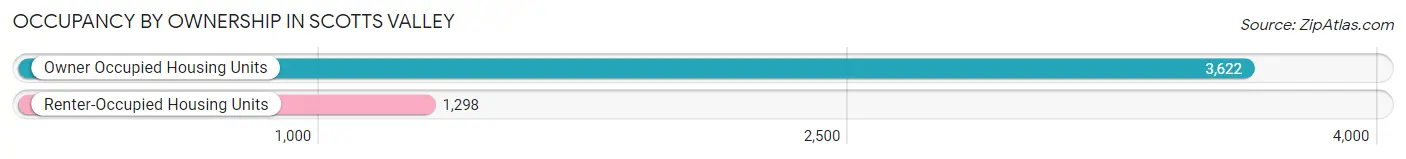
| Occupancy | # Housing Units | % Housing Units |
| Owner Occupied Housing Units | 3,622 | 73.6% |
| Renter-Occupied Housing Units | 1,298 | 26.4% |
| Total Occupied Housing Units | 4,920 | 100.0% |
Occupancy by Household Size in Scotts Valley
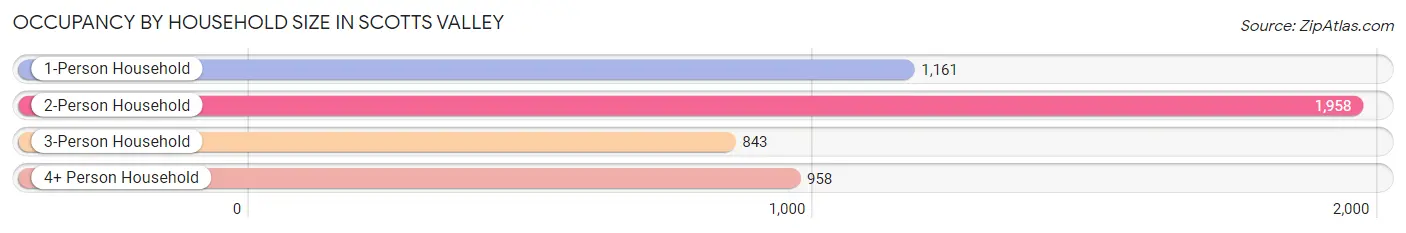
| Household Size | # Housing Units | % Housing Units |
| 1-Person Household | 1,161 | 23.6% |
| 2-Person Household | 1,958 | 39.8% |
| 3-Person Household | 843 | 17.1% |
| 4+ Person Household | 958 | 19.5% |
| Total Housing Units | 4,920 | 100.0% |
Occupancy by Ownership by Household Size in Scotts Valley
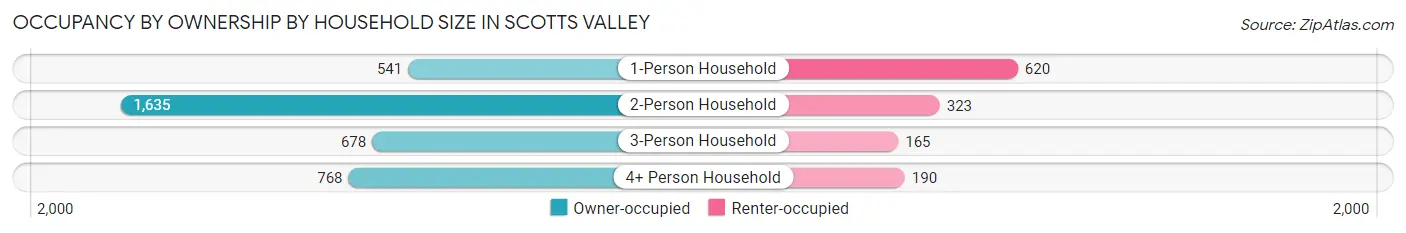
| Household Size | Owner-occupied | Renter-occupied |
| 1-Person Household | 541 (46.6%) | 620 (53.4%) |
| 2-Person Household | 1,635 (83.5%) | 323 (16.5%) |
| 3-Person Household | 678 (80.4%) | 165 (19.6%) |
| 4+ Person Household | 768 (80.2%) | 190 (19.8%) |
| Total Housing Units | 3,622 (73.6%) | 1,298 (26.4%) |
Occupancy by Educational Attainment in Scotts Valley
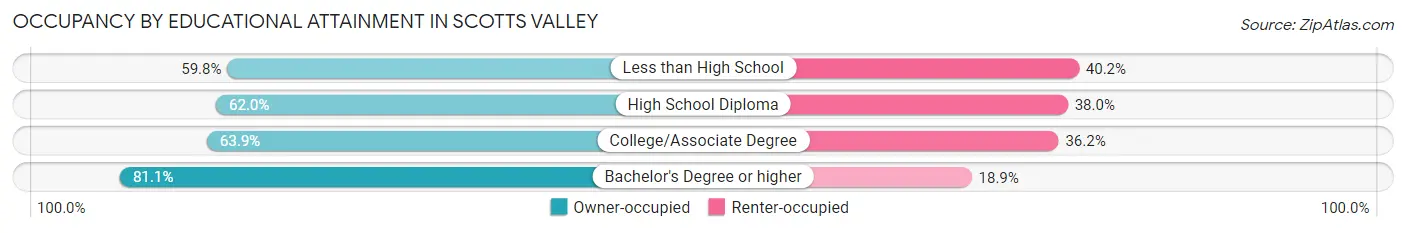
| Household Size | Owner-occupied | Renter-occupied |
| Less than High School | 67 (59.8%) | 45 (40.2%) |
| High School Diploma | 320 (62.0%) | 196 (38.0%) |
| College/Associate Degree | 908 (63.8%) | 514 (36.1%) |
| Bachelor's Degree or higher | 2,327 (81.1%) | 543 (18.9%) |
Occupancy by Age of Householder in Scotts Valley
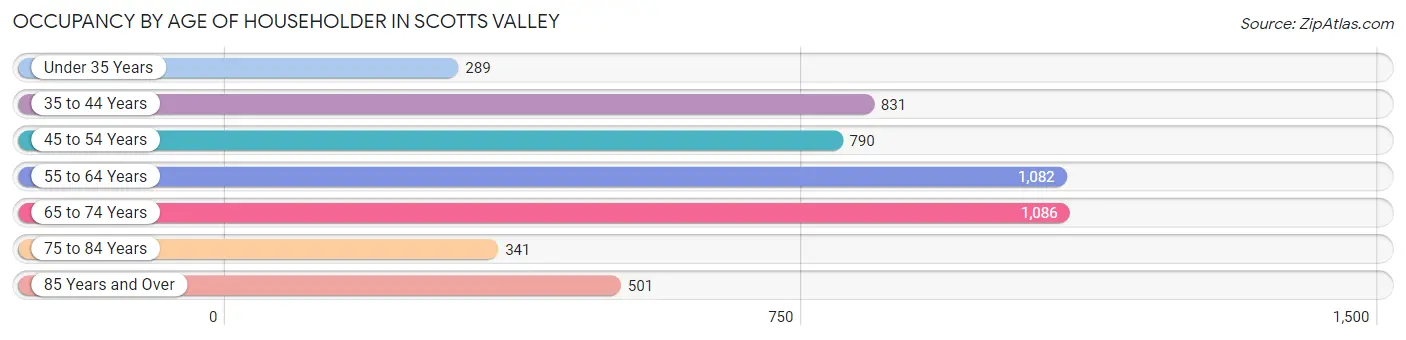
| Age Bracket | # Households | % Households |
| Under 35 Years | 289 | 5.9% |
| 35 to 44 Years | 831 | 16.9% |
| 45 to 54 Years | 790 | 16.1% |
| 55 to 64 Years | 1,082 | 22.0% |
| 65 to 74 Years | 1,086 | 22.1% |
| 75 to 84 Years | 341 | 6.9% |
| 85 Years and Over | 501 | 10.2% |
| Total | 4,920 | 100.0% |
Housing Finances in Scotts Valley
Median Income by Occupancy in Scotts Valley
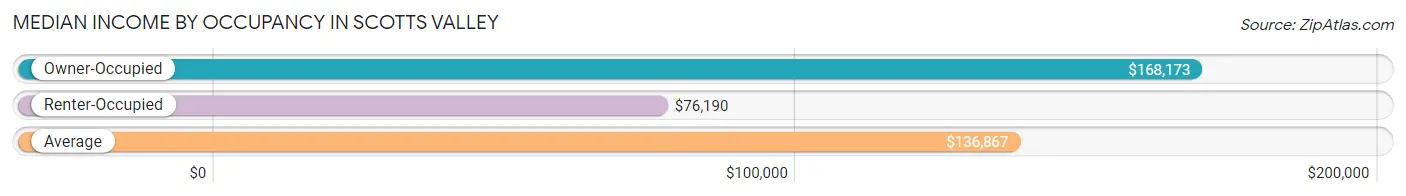
| Occupancy Type | # Households | Median Income |
| Owner-Occupied | 3,622 (73.6%) | $168,173 |
| Renter-Occupied | 1,298 (26.4%) | $76,190 |
| Average | 4,920 (100.0%) | $136,867 |
Occupancy by Householder Income Bracket in Scotts Valley
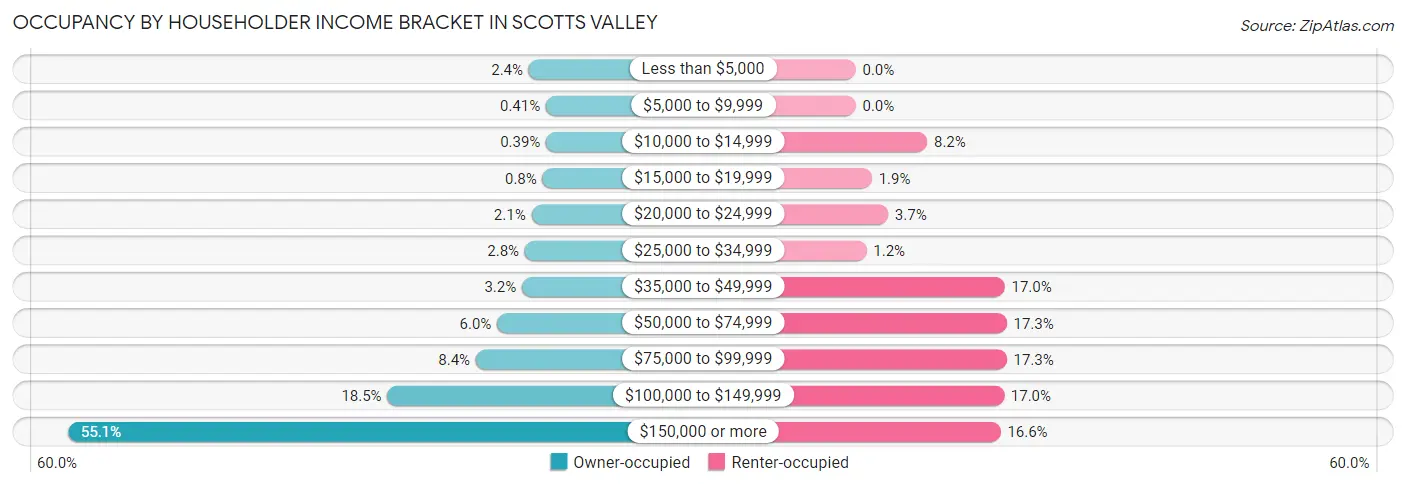
| Income Bracket | Owner-occupied | Renter-occupied |
| Less than $5,000 | 86 (2.4%) | 0 (0.0%) |
| $5,000 to $9,999 | 15 (0.4%) | 0 (0.0%) |
| $10,000 to $14,999 | 14 (0.4%) | 106 (8.2%) |
| $15,000 to $19,999 | 29 (0.8%) | 24 (1.8%) |
| $20,000 to $24,999 | 75 (2.1%) | 48 (3.7%) |
| $25,000 to $34,999 | 102 (2.8%) | 16 (1.2%) |
| $35,000 to $49,999 | 114 (3.2%) | 221 (17.0%) |
| $50,000 to $74,999 | 217 (6.0%) | 224 (17.3%) |
| $75,000 to $99,999 | 305 (8.4%) | 224 (17.3%) |
| $100,000 to $149,999 | 671 (18.5%) | 220 (17.0%) |
| $150,000 or more | 1,994 (55.0%) | 215 (16.6%) |
| Total | 3,622 (100.0%) | 1,298 (100.0%) |
Monthly Housing Cost Tiers in Scotts Valley
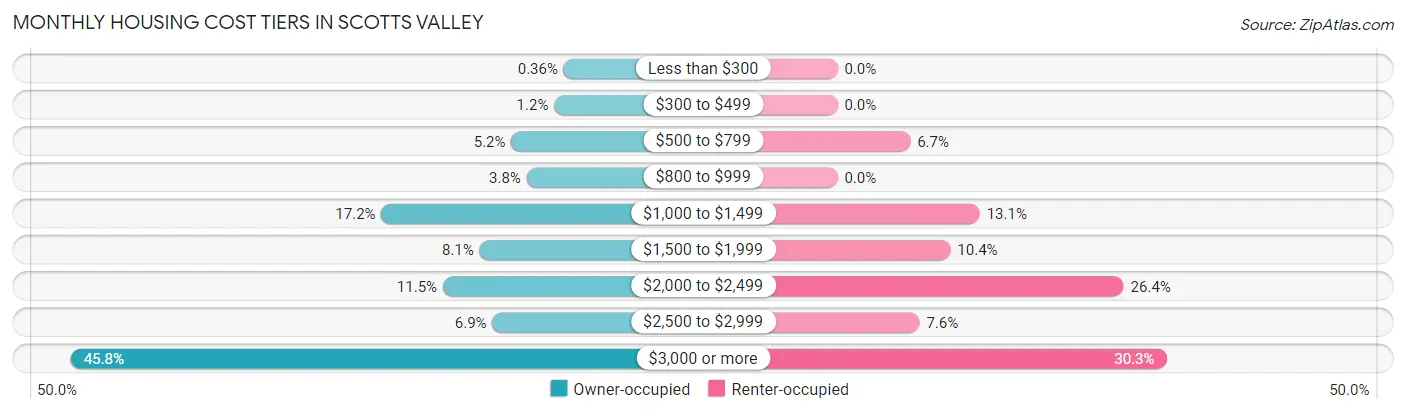
| Monthly Cost | Owner-occupied | Renter-occupied |
| Less than $300 | 13 (0.4%) | 0 (0.0%) |
| $300 to $499 | 45 (1.2%) | 0 (0.0%) |
| $500 to $799 | 188 (5.2%) | 87 (6.7%) |
| $800 to $999 | 137 (3.8%) | 0 (0.0%) |
| $1,000 to $1,499 | 621 (17.2%) | 170 (13.1%) |
| $1,500 to $1,999 | 294 (8.1%) | 135 (10.4%) |
| $2,000 to $2,499 | 416 (11.5%) | 342 (26.4%) |
| $2,500 to $2,999 | 251 (6.9%) | 98 (7.5%) |
| $3,000 or more | 1,657 (45.8%) | 393 (30.3%) |
| Total | 3,622 (100.0%) | 1,298 (100.0%) |
Physical Housing Characteristics in Scotts Valley
Housing Structures in Scotts Valley
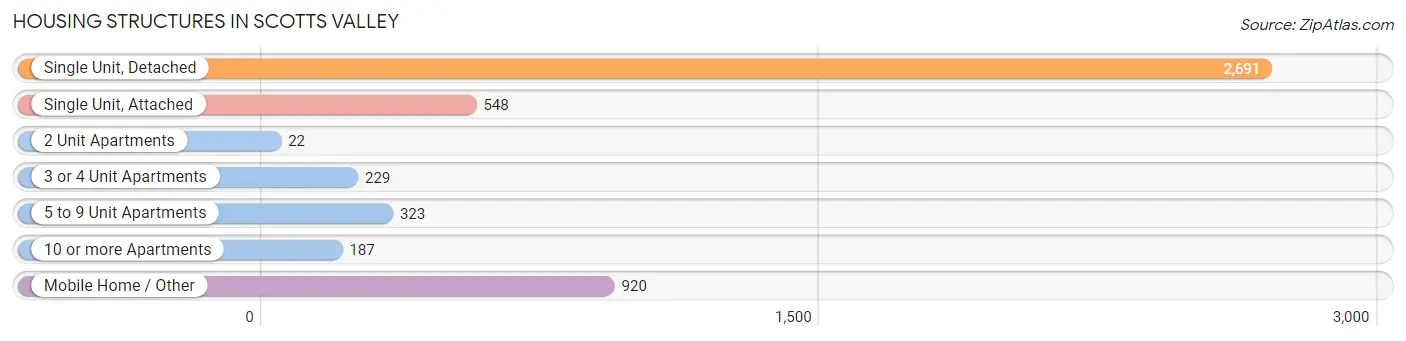
| Structure Type | # Housing Units | % Housing Units |
| Single Unit, Detached | 2,691 | 54.7% |
| Single Unit, Attached | 548 | 11.1% |
| 2 Unit Apartments | 22 | 0.4% |
| 3 or 4 Unit Apartments | 229 | 4.6% |
| 5 to 9 Unit Apartments | 323 | 6.6% |
| 10 or more Apartments | 187 | 3.8% |
| Mobile Home / Other | 920 | 18.7% |
| Total | 4,920 | 100.0% |
Housing Structures by Occupancy in Scotts Valley
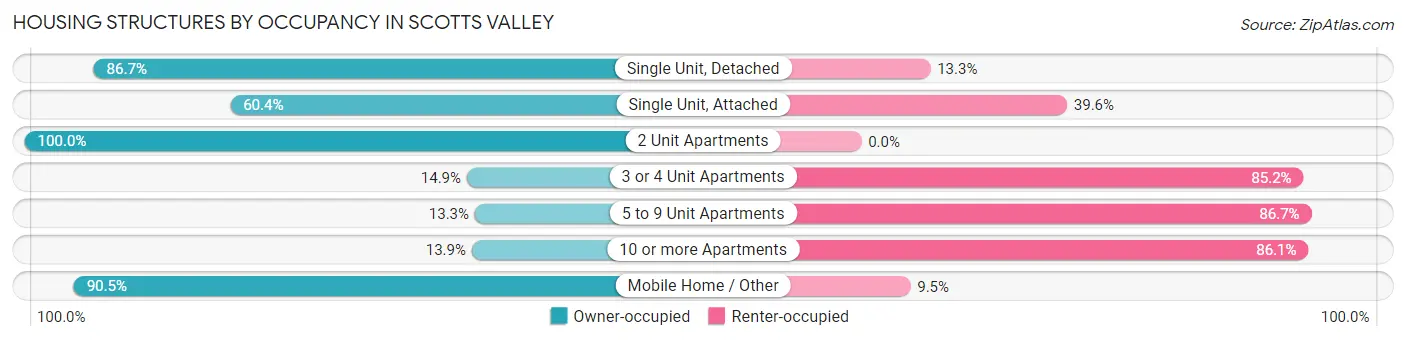
| Structure Type | Owner-occupied | Renter-occupied |
| Single Unit, Detached | 2,333 (86.7%) | 358 (13.3%) |
| Single Unit, Attached | 331 (60.4%) | 217 (39.6%) |
| 2 Unit Apartments | 22 (100.0%) | 0 (0.0%) |
| 3 or 4 Unit Apartments | 34 (14.8%) | 195 (85.2%) |
| 5 to 9 Unit Apartments | 43 (13.3%) | 280 (86.7%) |
| 10 or more Apartments | 26 (13.9%) | 161 (86.1%) |
| Mobile Home / Other | 833 (90.5%) | 87 (9.5%) |
| Total | 3,622 (73.6%) | 1,298 (26.4%) |
Housing Structures by Number of Rooms in Scotts Valley
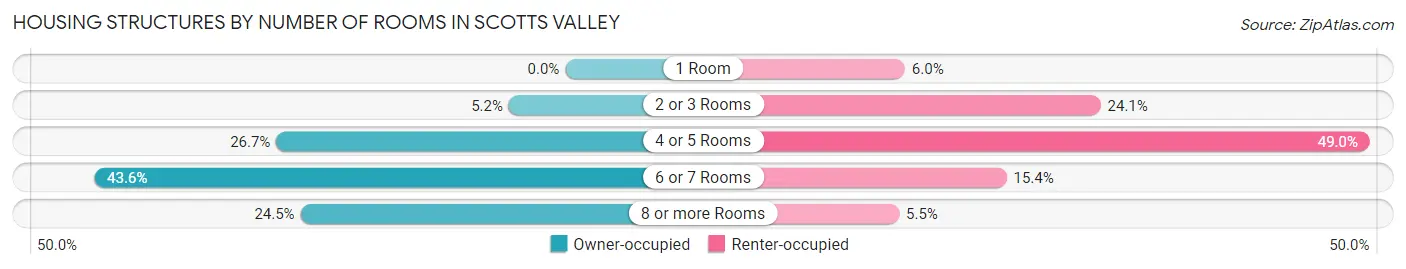
| Number of Rooms | Owner-occupied | Renter-occupied |
| 1 Room | 0 (0.0%) | 78 (6.0%) |
| 2 or 3 Rooms | 189 (5.2%) | 313 (24.1%) |
| 4 or 5 Rooms | 968 (26.7%) | 636 (49.0%) |
| 6 or 7 Rooms | 1,578 (43.6%) | 200 (15.4%) |
| 8 or more Rooms | 887 (24.5%) | 71 (5.5%) |
| Total | 3,622 (100.0%) | 1,298 (100.0%) |
Housing Structure by Heating Type in Scotts Valley
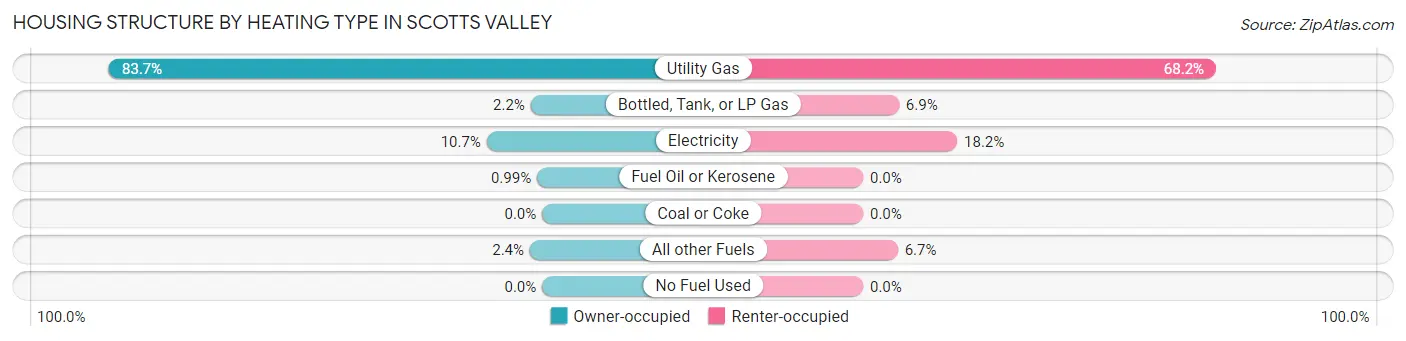
| Heating Type | Owner-occupied | Renter-occupied |
| Utility Gas | 3,032 (83.7%) | 885 (68.2%) |
| Bottled, Tank, or LP Gas | 80 (2.2%) | 90 (6.9%) |
| Electricity | 388 (10.7%) | 236 (18.2%) |
| Fuel Oil or Kerosene | 36 (1.0%) | 0 (0.0%) |
| Coal or Coke | 0 (0.0%) | 0 (0.0%) |
| All other Fuels | 86 (2.4%) | 87 (6.7%) |
| No Fuel Used | 0 (0.0%) | 0 (0.0%) |
| Total | 3,622 (100.0%) | 1,298 (100.0%) |
Household Vehicle Usage in Scotts Valley
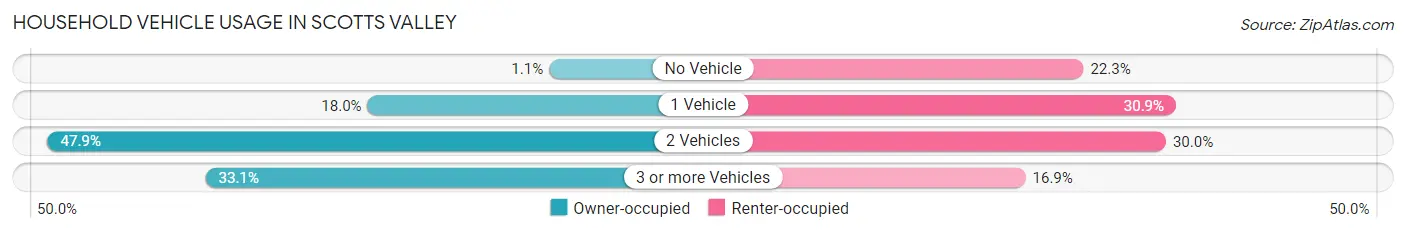
| Vehicles per Household | Owner-occupied | Renter-occupied |
| No Vehicle | 38 (1.1%) | 289 (22.3%) |
| 1 Vehicle | 652 (18.0%) | 401 (30.9%) |
| 2 Vehicles | 1,733 (47.8%) | 389 (30.0%) |
| 3 or more Vehicles | 1,199 (33.1%) | 219 (16.9%) |
| Total | 3,622 (100.0%) | 1,298 (100.0%) |
Real Estate & Mortgages in Scotts Valley
Real Estate and Mortgage Overview in Scotts Valley
| Characteristic | Without Mortgage | With Mortgage |
| Housing Units | 1,147 | 2,475 |
| Median Property Value | $789,100 | $1,118,000 |
| Median Household Income | $104,892 | $1,644 |
| Monthly Housing Costs | $1,177 | $1,657 |
| Real Estate Taxes | $5,622 | $20 |
Property Value by Mortgage Status in Scotts Valley
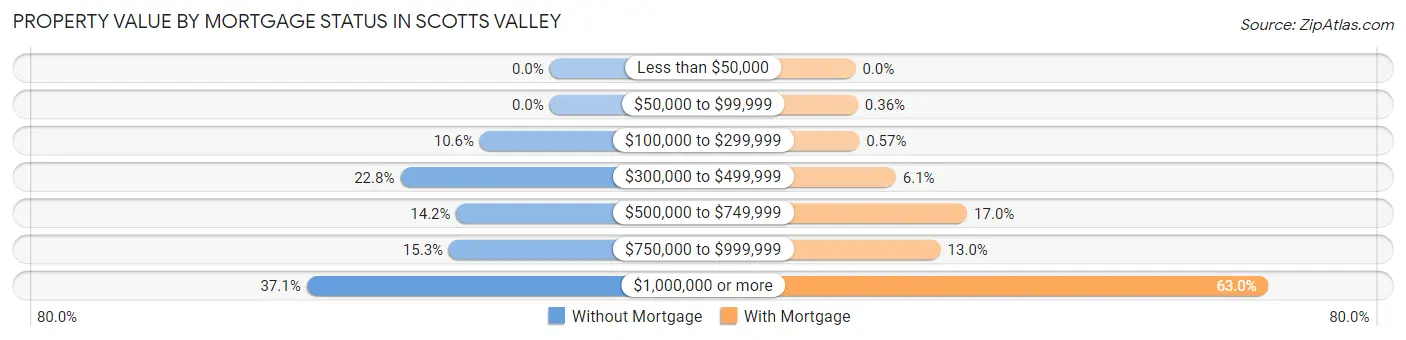
| Property Value | Without Mortgage | With Mortgage |
| Less than $50,000 | 0 (0.0%) | 0 (0.0%) |
| $50,000 to $99,999 | 0 (0.0%) | 9 (0.4%) |
| $100,000 to $299,999 | 122 (10.6%) | 14 (0.6%) |
| $300,000 to $499,999 | 261 (22.8%) | 152 (6.1%) |
| $500,000 to $749,999 | 163 (14.2%) | 421 (17.0%) |
| $750,000 to $999,999 | 176 (15.3%) | 321 (13.0%) |
| $1,000,000 or more | 425 (37.0%) | 1,558 (62.9%) |
| Total | 1,147 (100.0%) | 2,475 (100.0%) |
Household Income by Mortgage Status in Scotts Valley
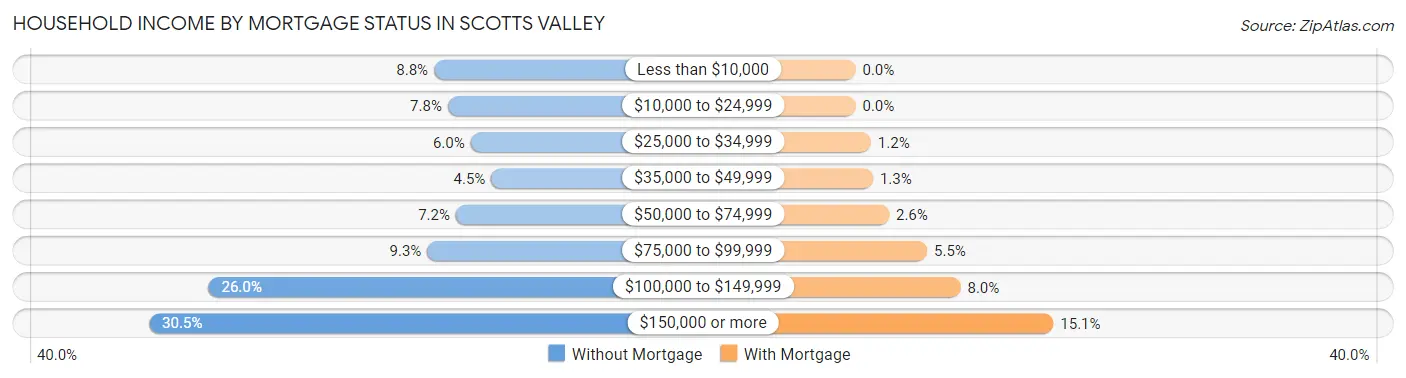
| Household Income | Without Mortgage | With Mortgage |
| Less than $10,000 | 101 (8.8%) | 0 (0.0%) |
| $10,000 to $24,999 | 89 (7.8%) | 0 (0.0%) |
| $25,000 to $34,999 | 69 (6.0%) | 29 (1.2%) |
| $35,000 to $49,999 | 51 (4.4%) | 33 (1.3%) |
| $50,000 to $74,999 | 82 (7.1%) | 63 (2.5%) |
| $75,000 to $99,999 | 107 (9.3%) | 135 (5.4%) |
| $100,000 to $149,999 | 298 (26.0%) | 198 (8.0%) |
| $150,000 or more | 350 (30.5%) | 373 (15.1%) |
| Total | 1,147 (100.0%) | 2,475 (100.0%) |
Property Value to Household Income Ratio in Scotts Valley
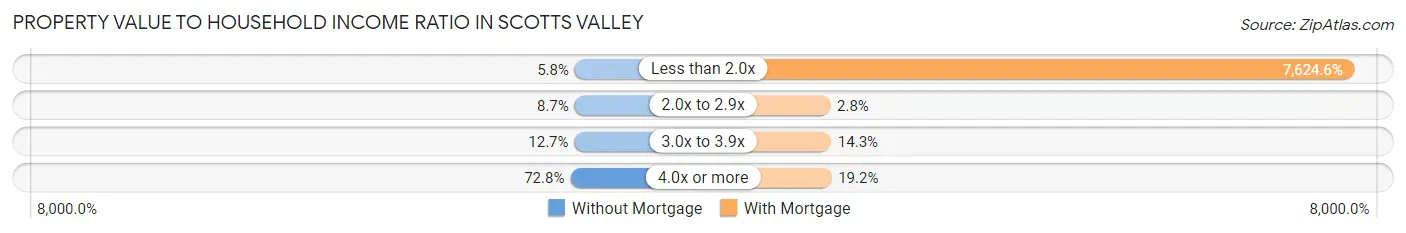
| Value-to-Income Ratio | Without Mortgage | With Mortgage |
| Less than 2.0x | 66 (5.8%) | 188,708 (7,624.6%) |
| 2.0x to 2.9x | 100 (8.7%) | 70 (2.8%) |
| 3.0x to 3.9x | 146 (12.7%) | 354 (14.3%) |
| 4.0x or more | 835 (72.8%) | 474 (19.2%) |
| Total | 1,147 (100.0%) | 2,475 (100.0%) |
Real Estate Taxes by Mortgage Status in Scotts Valley
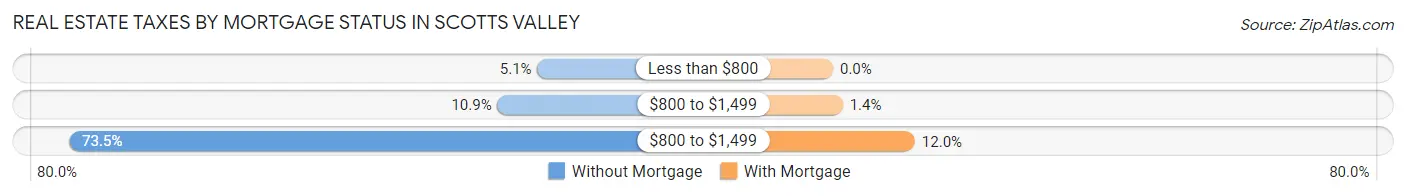
| Property Taxes | Without Mortgage | With Mortgage |
| Less than $800 | 58 (5.1%) | 0 (0.0%) |
| $800 to $1,499 | 125 (10.9%) | 35 (1.4%) |
| $800 to $1,499 | 843 (73.5%) | 296 (12.0%) |
| Total | 1,147 (100.0%) | 2,475 (100.0%) |
Health & Disability in Scotts Valley
Health Insurance Coverage by Age in Scotts Valley
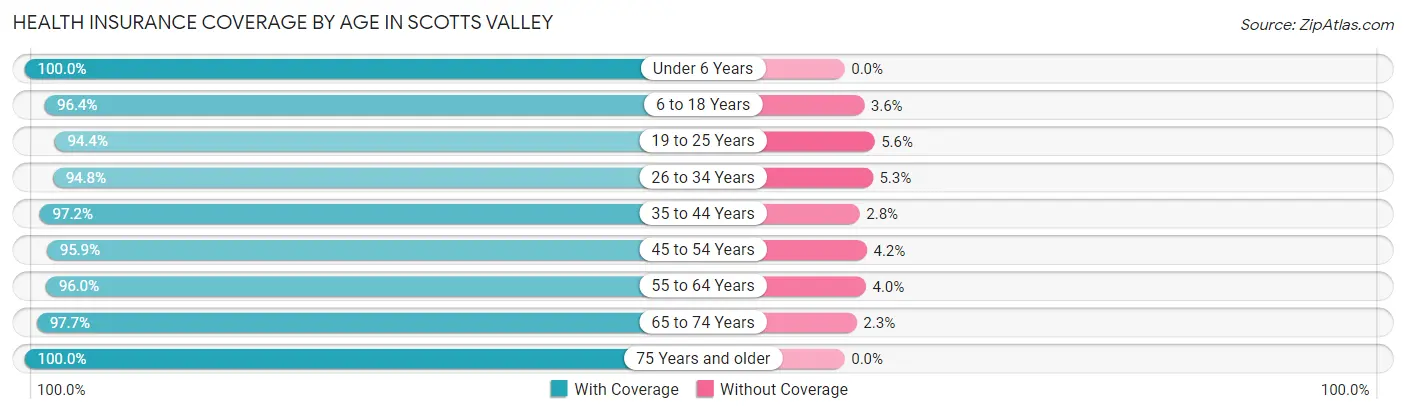
| Age Bracket | With Coverage | Without Coverage |
| Under 6 Years | 525 (100.0%) | 0 (0.0%) |
| 6 to 18 Years | 1,590 (96.4%) | 60 (3.6%) |
| 19 to 25 Years | 930 (94.4%) | 55 (5.6%) |
| 26 to 34 Years | 939 (94.8%) | 52 (5.2%) |
| 35 to 44 Years | 1,487 (97.2%) | 43 (2.8%) |
| 45 to 54 Years | 1,294 (95.9%) | 56 (4.2%) |
| 55 to 64 Years | 2,231 (96.0%) | 92 (4.0%) |
| 65 to 74 Years | 1,601 (97.7%) | 37 (2.3%) |
| 75 Years and older | 1,236 (100.0%) | 0 (0.0%) |
| Total | 11,833 (96.8%) | 395 (3.2%) |
Health Insurance Coverage by Citizenship Status in Scotts Valley
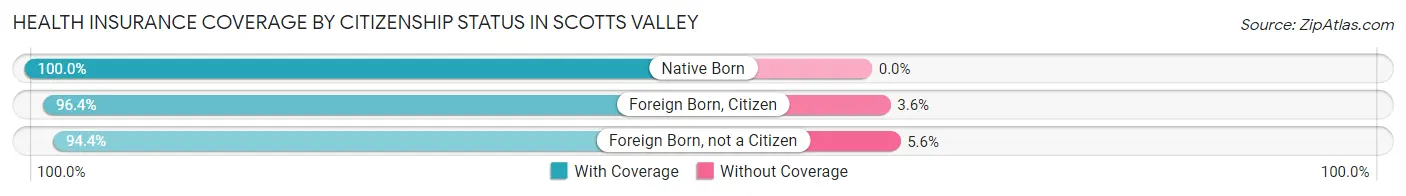
| Citizenship Status | With Coverage | Without Coverage |
| Native Born | 525 (100.0%) | 0 (0.0%) |
| Foreign Born, Citizen | 1,590 (96.4%) | 60 (3.6%) |
| Foreign Born, not a Citizen | 930 (94.4%) | 55 (5.6%) |
Health Insurance Coverage by Household Income in Scotts Valley
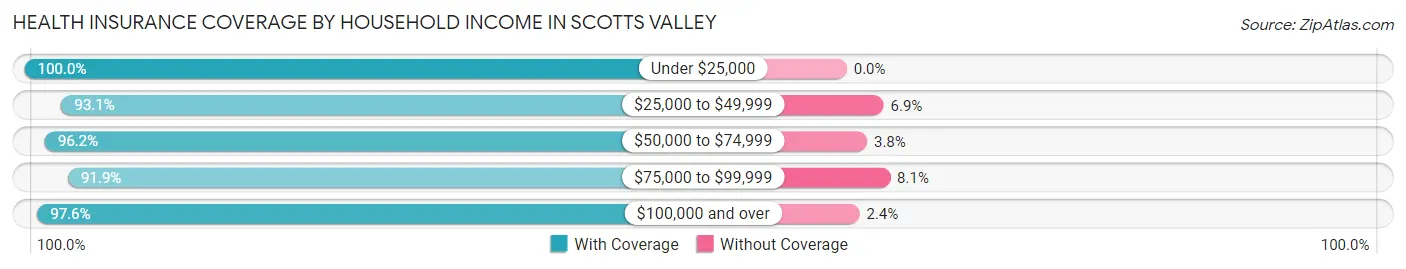
| Household Income | With Coverage | Without Coverage |
| Under $25,000 | 478 (100.0%) | 0 (0.0%) |
| $25,000 to $49,999 | 634 (93.1%) | 47 (6.9%) |
| $50,000 to $74,999 | 686 (96.2%) | 27 (3.8%) |
| $75,000 to $99,999 | 1,278 (91.9%) | 113 (8.1%) |
| $100,000 and over | 8,509 (97.6%) | 208 (2.4%) |
Public vs Private Health Insurance Coverage by Age in Scotts Valley
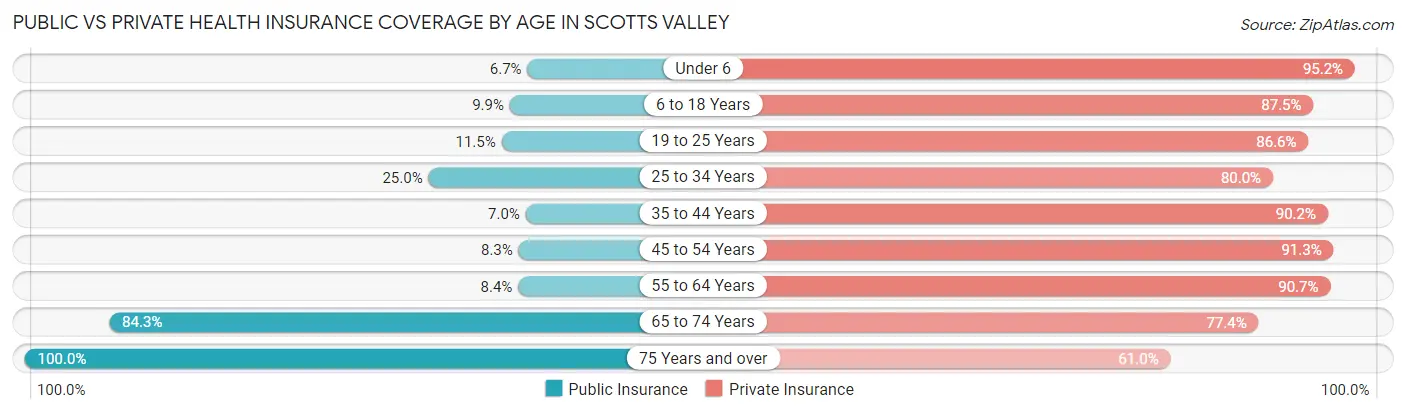
| Age Bracket | Public Insurance | Private Insurance |
| Under 6 | 35 (6.7%) | 500 (95.2%) |
| 6 to 18 Years | 164 (9.9%) | 1,444 (87.5%) |
| 19 to 25 Years | 113 (11.5%) | 853 (86.6%) |
| 25 to 34 Years | 248 (25.0%) | 793 (80.0%) |
| 35 to 44 Years | 107 (7.0%) | 1,380 (90.2%) |
| 45 to 54 Years | 112 (8.3%) | 1,232 (91.3%) |
| 55 to 64 Years | 195 (8.4%) | 2,106 (90.7%) |
| 65 to 74 Years | 1,381 (84.3%) | 1,267 (77.3%) |
| 75 Years and over | 1,236 (100.0%) | 754 (61.0%) |
| Total | 3,591 (29.4%) | 10,329 (84.5%) |
Disability Status by Sex by Age in Scotts Valley
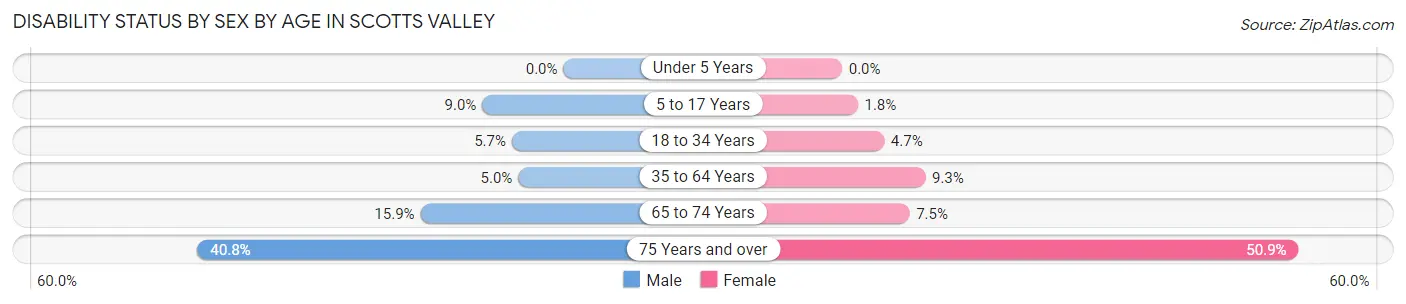
| Age Bracket | Male | Female |
| Under 5 Years | 0 (0.0%) | 0 (0.0%) |
| 5 to 17 Years | 70 (9.0%) | 13 (1.8%) |
| 18 to 34 Years | 69 (5.7%) | 45 (4.7%) |
| 35 to 64 Years | 126 (5.0%) | 250 (9.3%) |
| 65 to 74 Years | 142 (15.9%) | 56 (7.5%) |
| 75 Years and over | 240 (40.7%) | 329 (50.8%) |
Disability Class by Sex by Age in Scotts Valley
Disability Class: Hearing Difficulty
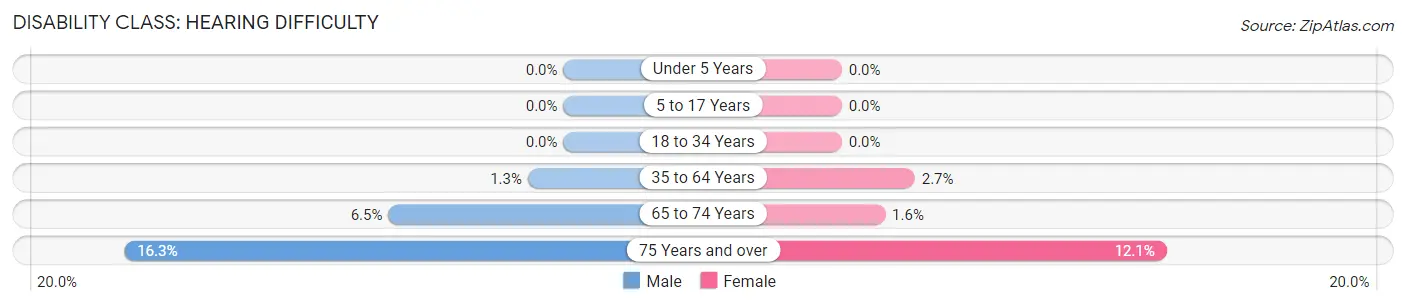
| Age Bracket | Male | Female |
| Under 5 Years | 0 (0.0%) | 0 (0.0%) |
| 5 to 17 Years | 0 (0.0%) | 0 (0.0%) |
| 18 to 34 Years | 0 (0.0%) | 0 (0.0%) |
| 35 to 64 Years | 33 (1.3%) | 73 (2.7%) |
| 65 to 74 Years | 58 (6.5%) | 12 (1.6%) |
| 75 Years and over | 96 (16.3%) | 78 (12.1%) |
Disability Class: Vision Difficulty
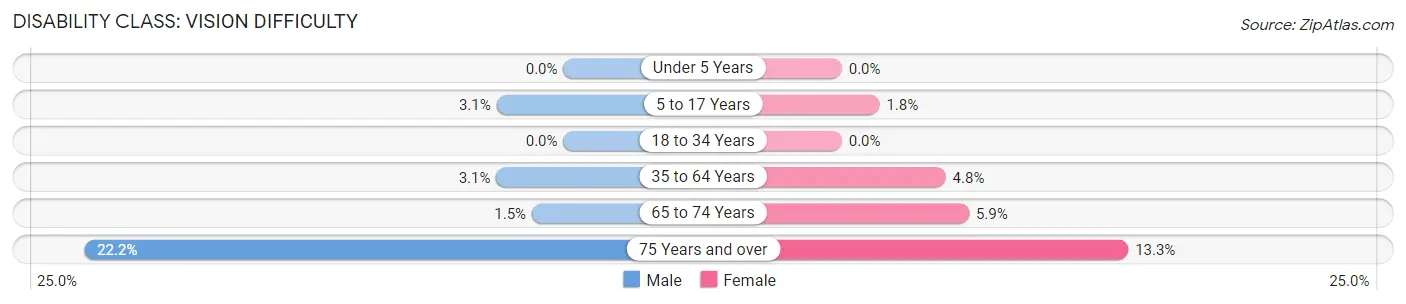
| Age Bracket | Male | Female |
| Under 5 Years | 0 (0.0%) | 0 (0.0%) |
| 5 to 17 Years | 24 (3.1%) | 13 (1.8%) |
| 18 to 34 Years | 0 (0.0%) | 0 (0.0%) |
| 35 to 64 Years | 78 (3.1%) | 130 (4.8%) |
| 65 to 74 Years | 13 (1.5%) | 44 (5.9%) |
| 75 Years and over | 131 (22.2%) | 86 (13.3%) |
Disability Class: Cognitive Difficulty
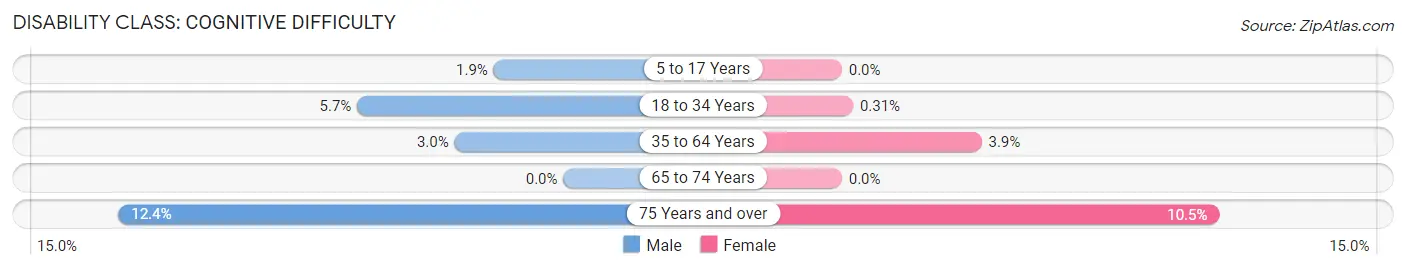
| Age Bracket | Male | Female |
| 5 to 17 Years | 15 (1.9%) | 0 (0.0%) |
| 18 to 34 Years | 69 (5.7%) | 3 (0.3%) |
| 35 to 64 Years | 76 (3.0%) | 105 (3.9%) |
| 65 to 74 Years | 0 (0.0%) | 0 (0.0%) |
| 75 Years and over | 73 (12.4%) | 68 (10.5%) |
Disability Class: Ambulatory Difficulty
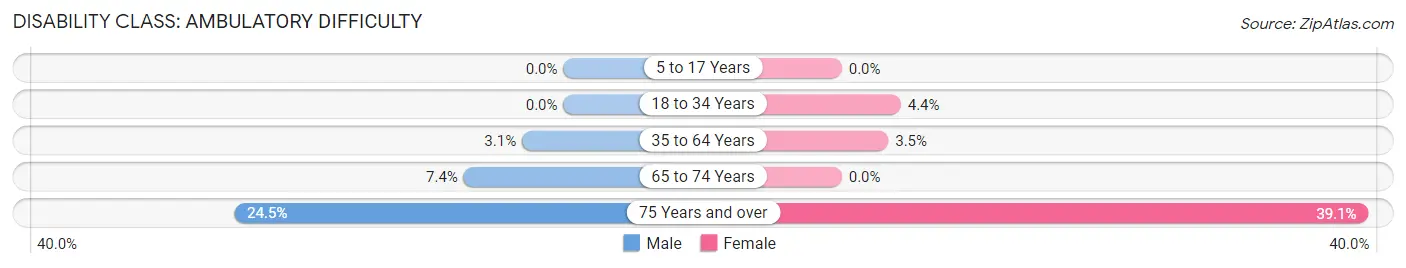
| Age Bracket | Male | Female |
| 5 to 17 Years | 0 (0.0%) | 0 (0.0%) |
| 18 to 34 Years | 0 (0.0%) | 42 (4.4%) |
| 35 to 64 Years | 77 (3.1%) | 93 (3.5%) |
| 65 to 74 Years | 66 (7.4%) | 0 (0.0%) |
| 75 Years and over | 144 (24.4%) | 253 (39.1%) |
Disability Class: Self-Care Difficulty
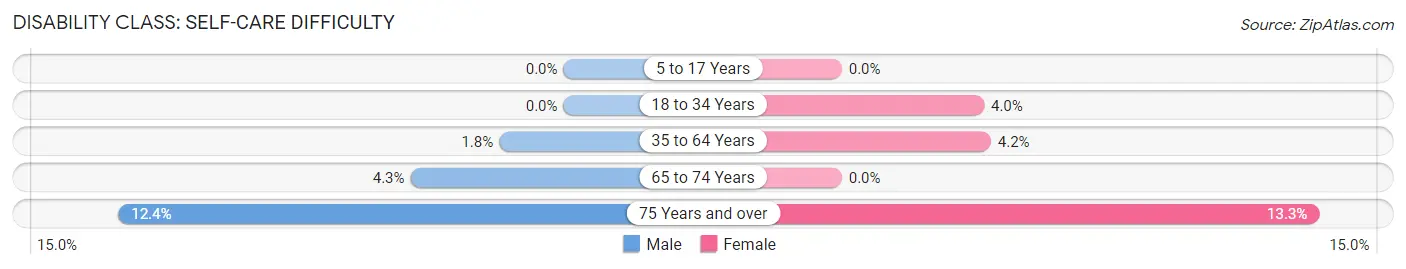
| Age Bracket | Male | Female |
| 5 to 17 Years | 0 (0.0%) | 0 (0.0%) |
| 18 to 34 Years | 0 (0.0%) | 38 (4.0%) |
| 35 to 64 Years | 45 (1.8%) | 112 (4.2%) |
| 65 to 74 Years | 38 (4.3%) | 0 (0.0%) |
| 75 Years and over | 73 (12.4%) | 86 (13.3%) |
Technology Access in Scotts Valley
Computing Device Access in Scotts Valley
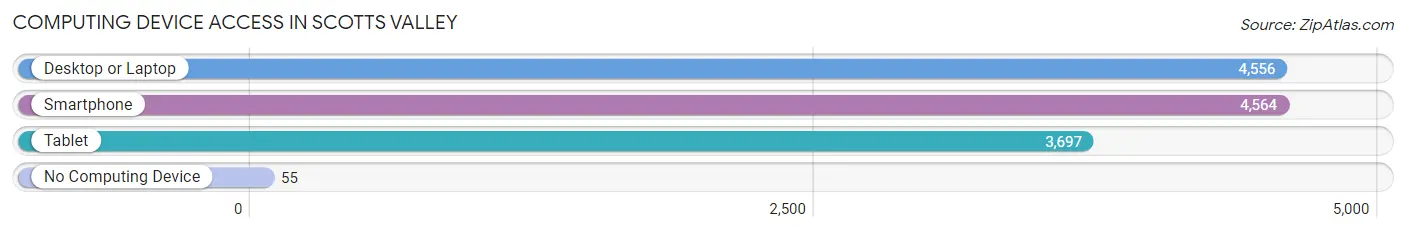
| Device Type | # Households | % Households |
| Desktop or Laptop | 4,556 | 92.6% |
| Smartphone | 4,564 | 92.8% |
| Tablet | 3,697 | 75.1% |
| No Computing Device | 55 | 1.1% |
| Total | 4,920 | 100.0% |
Internet Access in Scotts Valley
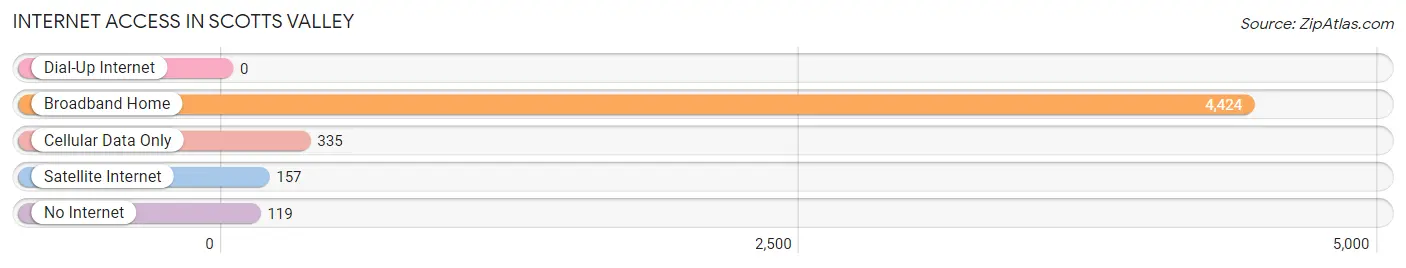
| Internet Type | # Households | % Households |
| Dial-Up Internet | 0 | 0.0% |
| Broadband Home | 4,424 | 89.9% |
| Cellular Data Only | 335 | 6.8% |
| Satellite Internet | 157 | 3.2% |
| No Internet | 119 | 2.4% |
| Total | 4,920 | 100.0% |
Scotts Valley Summary
Scott’s Valley is a small city located in Santa Cruz County, California. It is situated in the foothills of the Santa Cruz Mountains, about 10 miles from the Pacific Ocean. The city has a population of 11,580 as of the 2010 census, and is part of the San Jose-Sunnyvale-Santa Clara metropolitan area.
History
The area now known as Scott’s Valley was originally inhabited by the Ohlone people, who lived in the area for thousands of years before the arrival of Europeans. The first European settlers arrived in the area in the late 1700s, and the area was officially established as a town in 1853. The town was named after Hiram Scott, a settler who had purchased the land in 1851.
In the late 1800s, the area became a popular destination for tourists, who came to enjoy the mild climate and scenic beauty of the area. The town was incorporated in 1966, and has since grown to become a popular residential community.
Geography
Scott’s Valley is located in the foothills of the Santa Cruz Mountains, about 10 miles from the Pacific Ocean. The city has a total area of 4.3 square miles, of which 4.2 square miles is land and 0.1 square miles is water. The city is located at an elevation of about 500 feet above sea level.
The climate in Scott’s Valley is mild and temperate, with warm summers and cool winters. The average annual temperature is about 60 degrees Fahrenheit, and the average annual precipitation is about 25 inches.
Economy
The economy of Scott’s Valley is largely based on tourism and retail. The city is home to several popular tourist attractions, including the Santa Cruz Beach Boardwalk, the Santa Cruz Wharf, and the Mystery Spot. The city is also home to several retail stores, including the popular Scotts Valley Market.
The city is also home to several technology companies, including Seagate Technology, which is headquartered in the city. Other major employers in the city include the Santa Cruz County Office of Education, the Santa Cruz County Sheriff’s Office, and the Santa Cruz County Fire Department.
Demographics
As of the 2010 census, the population of Scott’s Valley was 11,580. The racial makeup of the city was 79.2% White, 0.7% African American, 0.7% Native American, 8.2% Asian, 0.2% Pacific Islander, 8.2% from other races, and 2.8% from two or more races. Hispanic or Latino of any race were 18.2% of the population.
The median household income in Scott’s Valley was $76,845, and the median family income was $87,813. The per capita income for the city was $35,945. About 5.2% of families and 7.2% of the population were below the poverty line, including 8.3% of those under age 18 and 4.2% of those age 65 or over.
Common Questions
What is Per Capita Income in Scotts Valley?
Per Capita income in Scotts Valley is $79,871.
What is the Median Family Income in Scotts Valley?
Median Family Income in Scotts Valley is $182,629.
What is the Median Household income in Scotts Valley?
Median Household Income in Scotts Valley is $136,867.
What is Income or Wage Gap in Scotts Valley?
Income or Wage Gap in Scotts Valley is 24.5%.
Women in Scotts Valley earn 75.5 cents for every dollar earned by a man.
What is Inequality or Gini Index in Scotts Valley?
Inequality or Gini Index in Scotts Valley is 0.50.
What is the Total Population of Scotts Valley?
Total Population of Scotts Valley is 12,239.
What is the Total Male Population of Scotts Valley?
Total Male Population of Scotts Valley is 6,202.
What is the Total Female Population of Scotts Valley?
Total Female Population of Scotts Valley is 6,037.
What is the Ratio of Males per 100 Females in Scotts Valley?
There are 102.73 Males per 100 Females in Scotts Valley.
What is the Ratio of Females per 100 Males in Scotts Valley?
There are 97.34 Females per 100 Males in Scotts Valley.
What is the Median Population Age in Scotts Valley?
Median Population Age in Scotts Valley is 49.0 Years.
What is the Average Family Size in Scotts Valley
Average Family Size in Scotts Valley is 2.8 People.
What is the Average Household Size in Scotts Valley
Average Household Size in Scotts Valley is 2.4 People.
How Large is the Labor Force in Scotts Valley?
There are 6,627 People in the Labor Forcein in Scotts Valley.
What is the Percentage of People in the Labor Force in Scotts Valley?
63.2% of People are in the Labor Force in Scotts Valley.
What is the Unemployment Rate in Scotts Valley?
Unemployment Rate in Scotts Valley is 1.9%.