Santa Fe, NM Map & Demographics
Santa Fe Map
Santa Fe Overview
$44,359
PER CAPITA INCOME
$78,882
AVG FAMILY INCOME
$67,663
AVG HOUSEHOLD INCOME
24.2%
WAGE / INCOME GAP [ % ]
75.8¢/ $1
WAGE / INCOME GAP [ $ ]
$9,674
FAMILY INCOME DEFICIT
0.48
INEQUALITY / GINI INDEX
87,617
TOTAL POPULATION
42,226
MALE POPULATION
45,391
FEMALE POPULATION
93.03
MALES / 100 FEMALES
107.50
FEMALES / 100 MALES
44.5
MEDIAN AGE
2.9
AVG FAMILY SIZE
2.2
AVG HOUSEHOLD SIZE
45,477
LABOR FORCE [ PEOPLE ]
61.1%
PERCENT IN LABOR FORCE
5.3%
UNEMPLOYMENT RATE
Income in Santa Fe
Income Overview in Santa Fe
Per Capita Income in Santa Fe is $44,359, while median incomes of families and households are $78,882 and $67,663 respectively.
| Characteristic | Number | Measure |
| Per Capita Income | 87,617 | $44,359 |
| Median Family Income | 21,287 | $78,882 |
| Mean Family Income | 21,287 | $112,596 |
| Median Household Income | 39,311 | $67,663 |
| Mean Household Income | 39,311 | $95,734 |
| Income Deficit | 21,287 | $9,674 |
| Wage / Income Gap (%) | 87,617 | 24.16% |
| Wage / Income Gap ($) | 87,617 | 75.84¢ per $1 |
| Gini / Inequality Index | 87,617 | 0.48 |
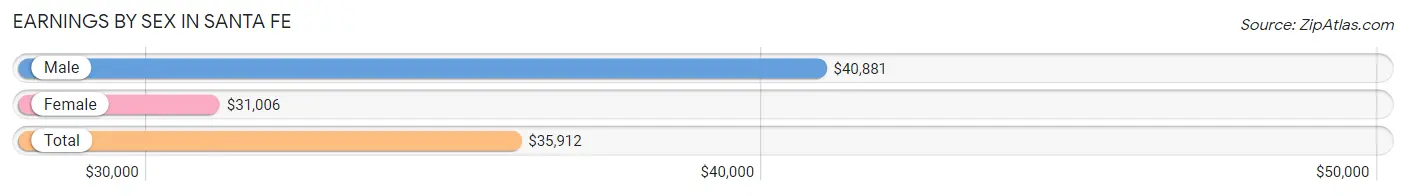
Earnings by Sex in Santa Fe
Average Earnings in Santa Fe are $35,912, $40,881 for men and $31,006 for women, a difference of 24.2%.
| Sex | Number | Average Earnings |
| Male | 24,031 (50.6%) | $40,881 |
| Female | 23,489 (49.4%) | $31,006 |
| Total | 47,520 (100.0%) | $35,912 |
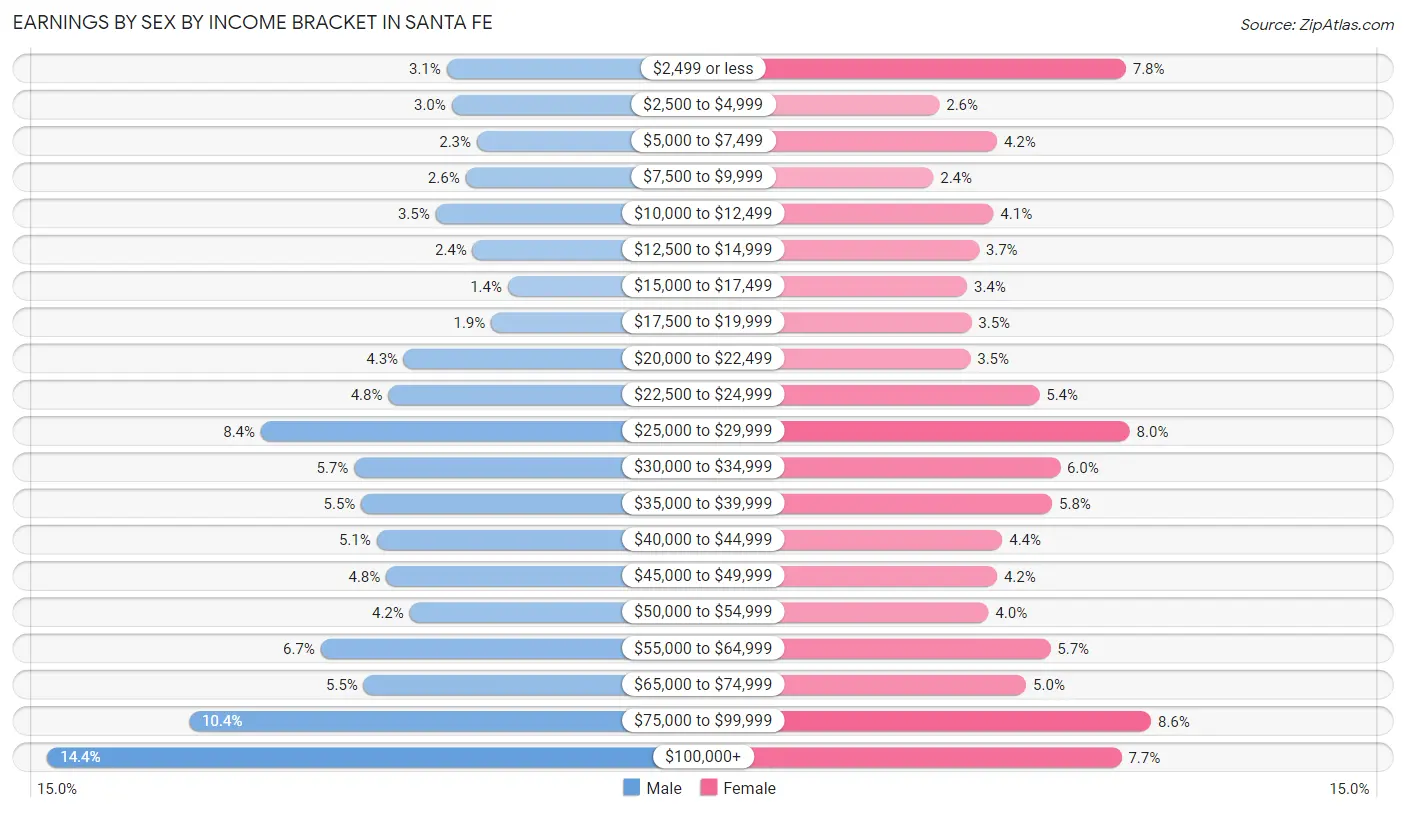
Earnings by Sex by Income Bracket in Santa Fe
The most common earnings brackets in Santa Fe are $100,000+ for men (3,452 | 14.4%) and $75,000 to $99,999 for women (2,009 | 8.6%).
| Income | Male | Female |
| $2,499 or less | 755 (3.1%) | 1,841 (7.8%) |
| $2,500 to $4,999 | 720 (3.0%) | 611 (2.6%) |
| $5,000 to $7,499 | 550 (2.3%) | 992 (4.2%) |
| $7,500 to $9,999 | 627 (2.6%) | 571 (2.4%) |
| $10,000 to $12,499 | 830 (3.5%) | 968 (4.1%) |
| $12,500 to $14,999 | 578 (2.4%) | 871 (3.7%) |
| $15,000 to $17,499 | 341 (1.4%) | 795 (3.4%) |
| $17,500 to $19,999 | 455 (1.9%) | 822 (3.5%) |
| $20,000 to $22,499 | 1,043 (4.3%) | 815 (3.5%) |
| $22,500 to $24,999 | 1,148 (4.8%) | 1,270 (5.4%) |
| $25,000 to $29,999 | 2,008 (8.4%) | 1,867 (8.0%) |
| $30,000 to $34,999 | 1,380 (5.7%) | 1,406 (6.0%) |
| $35,000 to $39,999 | 1,332 (5.5%) | 1,356 (5.8%) |
| $40,000 to $44,999 | 1,229 (5.1%) | 1,027 (4.4%) |
| $45,000 to $49,999 | 1,164 (4.8%) | 991 (4.2%) |
| $50,000 to $54,999 | 1,005 (4.2%) | 935 (4.0%) |
| $55,000 to $64,999 | 1,605 (6.7%) | 1,344 (5.7%) |
| $65,000 to $74,999 | 1,314 (5.5%) | 1,184 (5.0%) |
| $75,000 to $99,999 | 2,495 (10.4%) | 2,009 (8.6%) |
| $100,000+ | 3,452 (14.4%) | 1,814 (7.7%) |
| Total | 24,031 (100.0%) | 23,489 (100.0%) |
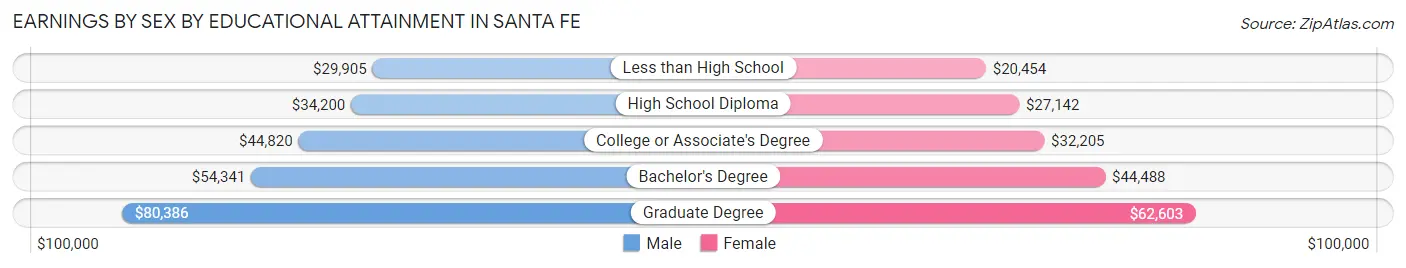
Earnings by Sex by Educational Attainment in Santa Fe
Average earnings in Santa Fe are $46,051 for men and $35,312 for women, a difference of 23.3%. Men with an educational attainment of graduate degree enjoy the highest average annual earnings of $80,386, while those with less than high school education earn the least with $29,905. Women with an educational attainment of graduate degree earn the most with the average annual earnings of $62,603, while those with less than high school education have the smallest earnings of $20,454.
| Educational Attainment | Male Income | Female Income |
| Less than High School | $29,905 | $20,454 |
| High School Diploma | $34,200 | $27,142 |
| College or Associate's Degree | $44,820 | $32,205 |
| Bachelor's Degree | $54,341 | $44,488 |
| Graduate Degree | $80,386 | $62,603 |
| Total | $46,051 | $35,312 |
Family Income in Santa Fe
Family Income Brackets in Santa Fe
According to the Santa Fe family income data, there are 4,130 families falling into the $50,000 to $74,999 income range, which is the most common income bracket and makes up 19.4% of all families. Conversely, the $10,000 to $14,999 income bracket is the least frequent group with only 234 families (1.1%) belonging to this category.
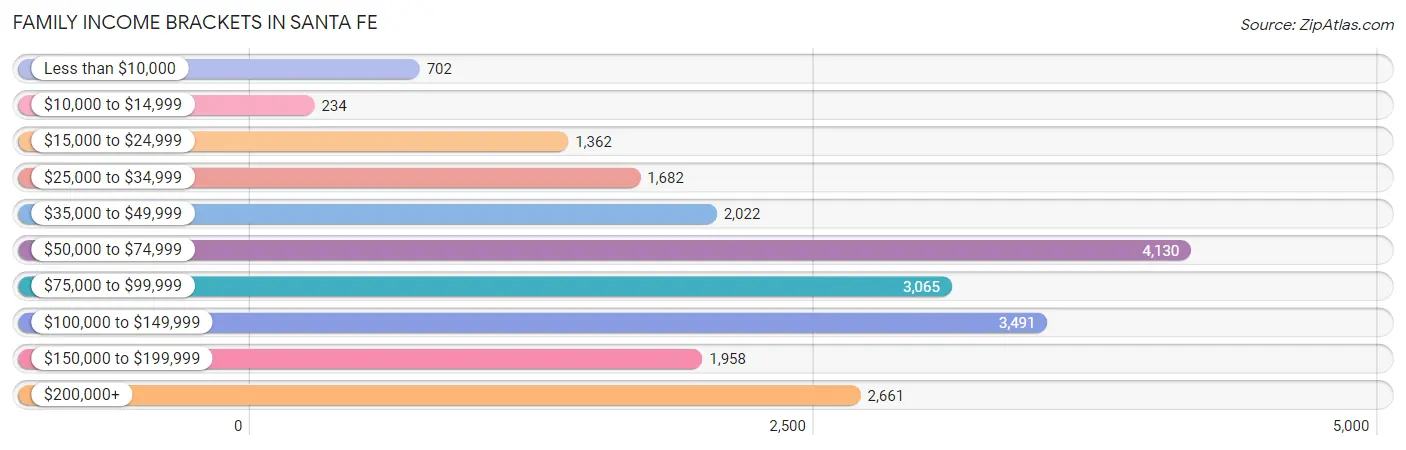
| Income Bracket | # Families | % Families |
| Less than $10,000 | 702 | 3.3% |
| $10,000 to $14,999 | 234 | 1.1% |
| $15,000 to $24,999 | 1,362 | 6.4% |
| $25,000 to $34,999 | 1,682 | 7.9% |
| $35,000 to $49,999 | 2,022 | 9.5% |
| $50,000 to $74,999 | 4,130 | 19.4% |
| $75,000 to $99,999 | 3,065 | 14.4% |
| $100,000 to $149,999 | 3,491 | 16.4% |
| $150,000 to $199,999 | 1,958 | 9.2% |
| $200,000+ | 2,661 | 12.5% |
Family Income by Famaliy Size in Santa Fe
7+ person families (140 | 0.7%) account for the highest median family income in Santa Fe with $111,618 per family, while 2-person families (11,763 | 55.3%) have the highest median income of $42,503 per family member.
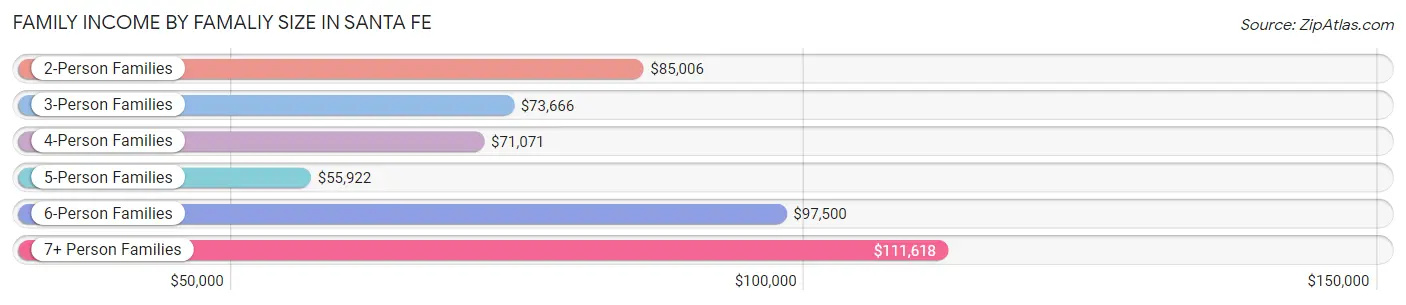
| Income Bracket | # Families | Median Income |
| 2-Person Families | 11,763 (55.3%) | $85,006 |
| 3-Person Families | 4,923 (23.1%) | $73,666 |
| 4-Person Families | 2,780 (13.1%) | $71,071 |
| 5-Person Families | 1,101 (5.2%) | $55,922 |
| 6-Person Families | 580 (2.7%) | $97,500 |
| 7+ Person Families | 140 (0.7%) | $111,618 |
| Total | 21,287 (100.0%) | $78,882 |
Family Income by Number of Earners in Santa Fe
The median family income in Santa Fe is $78,882, with families comprising 3+ earners (1,496) having the highest median family income of $106,553, while families with 1 earner (7,279) have the lowest median family income of $55,498, accounting for 7.0% and 34.2% of families, respectively.
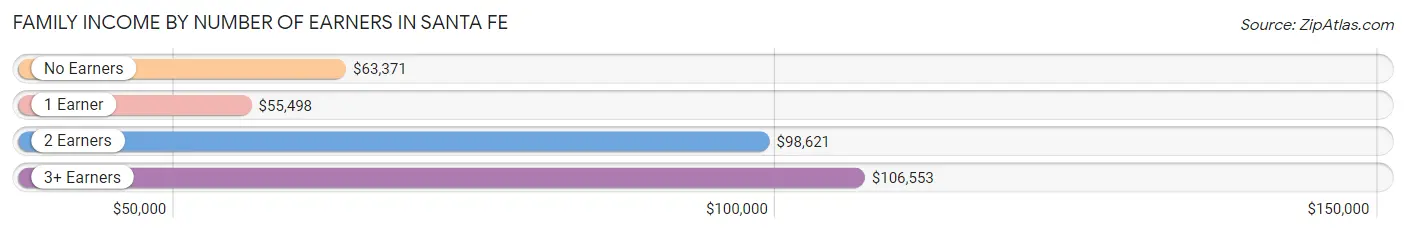
| Number of Earners | # Families | Median Income |
| No Earners | 4,111 (19.3%) | $63,371 |
| 1 Earner | 7,279 (34.2%) | $55,498 |
| 2 Earners | 8,401 (39.5%) | $98,621 |
| 3+ Earners | 1,496 (7.0%) | $106,553 |
| Total | 21,287 (100.0%) | $78,882 |
Household Income in Santa Fe
Household Income Brackets in Santa Fe
With 6,644 households falling in the category, the $50,000 to $74,999 income range is the most frequent in Santa Fe, accounting for 16.9% of all households. In contrast, only 1,219 households (3.1%) fall into the $10,000 to $14,999 income bracket, making it the least populous group.
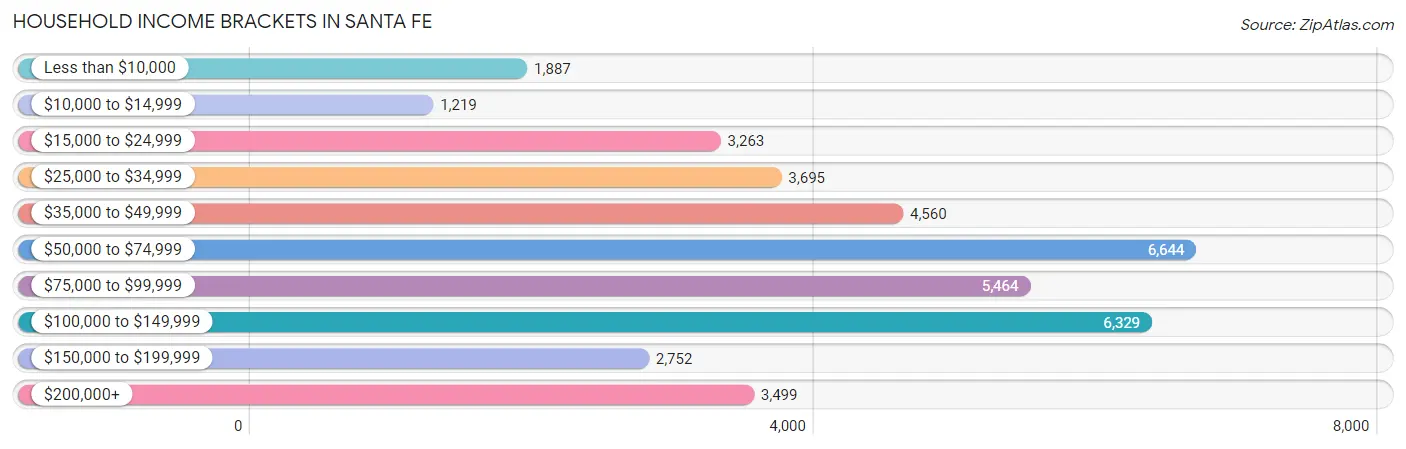
| Income Bracket | # Households | % Households |
| Less than $10,000 | 1,887 | 4.8% |
| $10,000 to $14,999 | 1,219 | 3.1% |
| $15,000 to $24,999 | 3,263 | 8.3% |
| $25,000 to $34,999 | 3,695 | 9.4% |
| $35,000 to $49,999 | 4,560 | 11.6% |
| $50,000 to $74,999 | 6,644 | 16.9% |
| $75,000 to $99,999 | 5,464 | 13.9% |
| $100,000 to $149,999 | 6,329 | 16.1% |
| $150,000 to $199,999 | 2,752 | 7.0% |
| $200,000+ | 3,499 | 8.9% |
Household Income by Householder Age in Santa Fe
The median household income in Santa Fe is $67,663, with the highest median household income of $76,870 found in the 45 to 64 years age bracket for the primary householder. A total of 12,596 households (32.0%) fall into this category. Meanwhile, the 15 to 24 years age bracket for the primary householder has the lowest median household income of $31,285, with 1,149 households (2.9%) in this group.
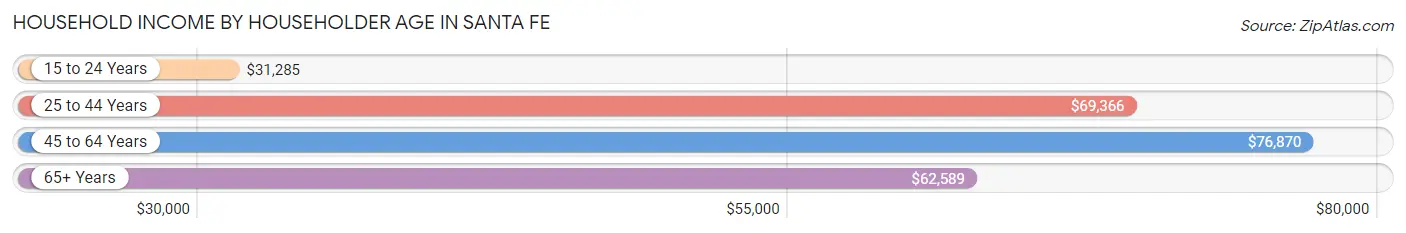
| Income Bracket | # Households | Median Income |
| 15 to 24 Years | 1,149 (2.9%) | $31,285 |
| 25 to 44 Years | 10,757 (27.4%) | $69,366 |
| 45 to 64 Years | 12,596 (32.0%) | $76,870 |
| 65+ Years | 14,809 (37.7%) | $62,589 |
| Total | 39,311 (100.0%) | $67,663 |
Poverty in Santa Fe
Income Below Poverty by Sex and Age in Santa Fe
With 12.6% poverty level for males and 14.8% for females among the residents of Santa Fe, under 5 year old males and 15 year old females are the most vulnerable to poverty, with 499 males (28.6%) and 137 females (45.1%) in their respective age groups living below the poverty level.
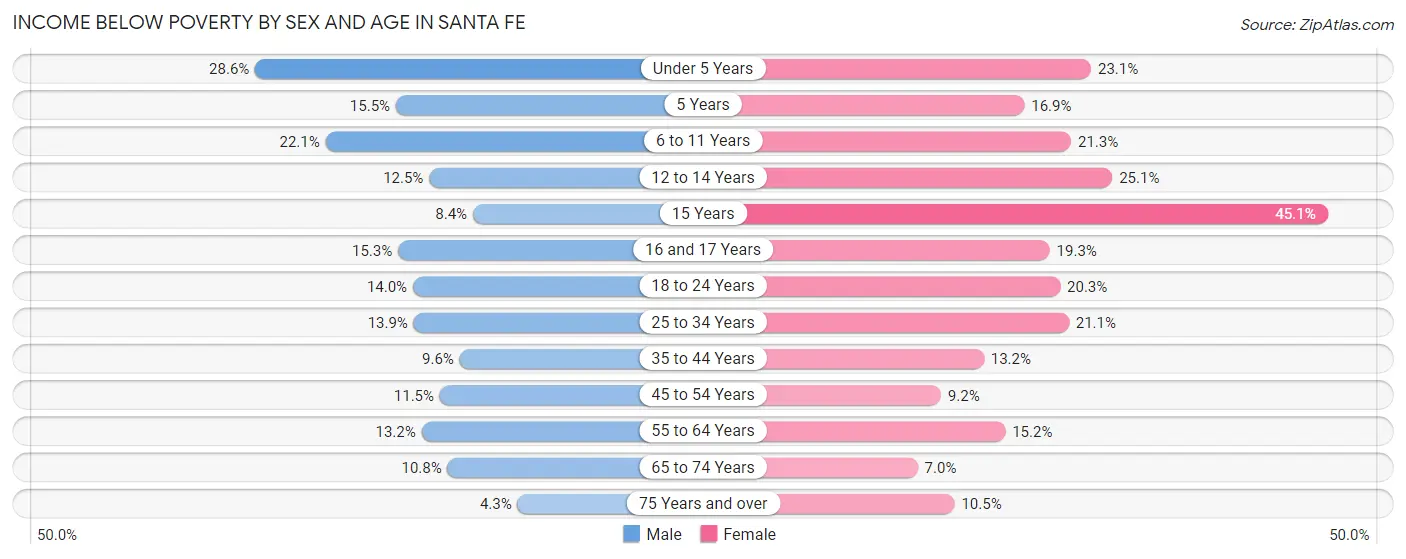
| Age Bracket | Male | Female |
| Under 5 Years | 499 (28.6%) | 384 (23.1%) |
| 5 Years | 55 (15.5%) | 51 (16.9%) |
| 6 to 11 Years | 474 (22.1%) | 575 (21.3%) |
| 12 to 14 Years | 203 (12.4%) | 368 (25.1%) |
| 15 Years | 49 (8.4%) | 137 (45.1%) |
| 16 and 17 Years | 147 (15.3%) | 196 (19.3%) |
| 18 to 24 Years | 470 (14.0%) | 703 (20.3%) |
| 25 to 34 Years | 701 (13.9%) | 1,094 (21.1%) |
| 35 to 44 Years | 546 (9.6%) | 724 (13.2%) |
| 45 to 54 Years | 639 (11.5%) | 475 (9.2%) |
| 55 to 64 Years | 678 (13.2%) | 896 (15.2%) |
| 65 to 74 Years | 626 (10.7%) | 521 (7.0%) |
| 75 Years and over | 149 (4.3%) | 493 (10.5%) |
| Total | 5,236 (12.6%) | 6,617 (14.8%) |
Income Above Poverty by Sex and Age in Santa Fe
According to the poverty statistics in Santa Fe, males aged 75 years and over and females aged 65 to 74 years are the age groups that are most secure financially, with 95.8% of males and 93.0% of females in these age groups living above the poverty line.
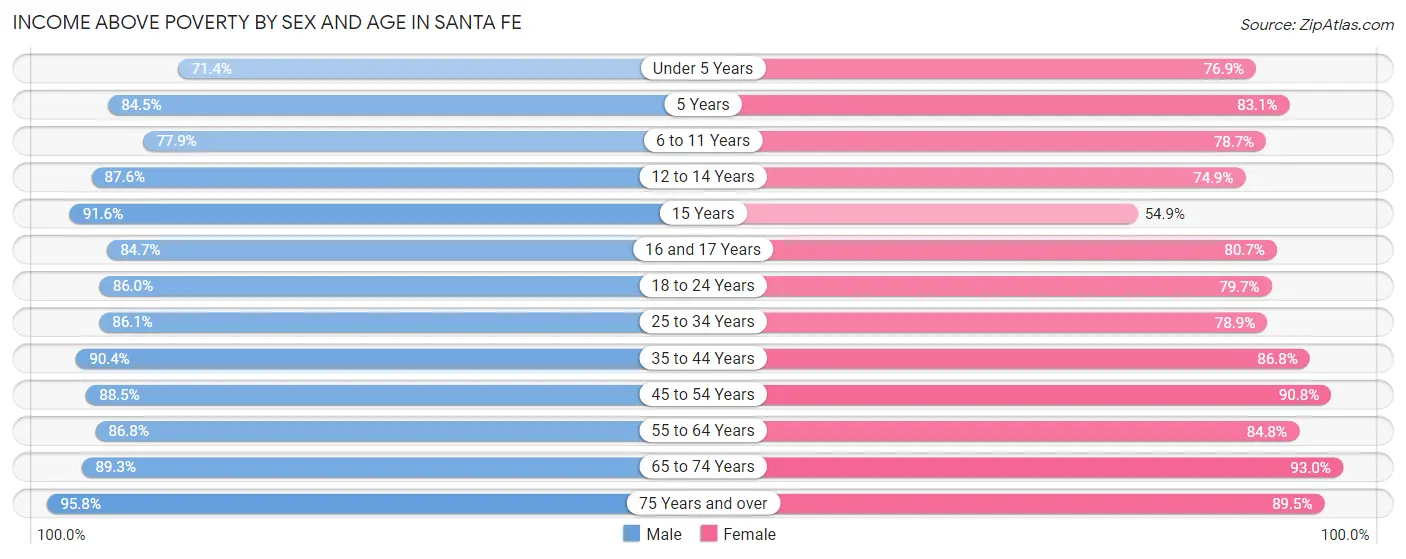
| Age Bracket | Male | Female |
| Under 5 Years | 1,246 (71.4%) | 1,276 (76.9%) |
| 5 Years | 299 (84.5%) | 250 (83.1%) |
| 6 to 11 Years | 1,674 (77.9%) | 2,127 (78.7%) |
| 12 to 14 Years | 1,427 (87.5%) | 1,098 (74.9%) |
| 15 Years | 535 (91.6%) | 167 (54.9%) |
| 16 and 17 Years | 811 (84.7%) | 820 (80.7%) |
| 18 to 24 Years | 2,897 (86.0%) | 2,767 (79.7%) |
| 25 to 34 Years | 4,345 (86.1%) | 4,098 (78.9%) |
| 35 to 44 Years | 5,132 (90.4%) | 4,769 (86.8%) |
| 45 to 54 Years | 4,937 (88.5%) | 4,690 (90.8%) |
| 55 to 64 Years | 4,475 (86.8%) | 5,012 (84.8%) |
| 65 to 74 Years | 5,198 (89.2%) | 6,882 (93.0%) |
| 75 Years and over | 3,359 (95.8%) | 4,219 (89.5%) |
| Total | 36,335 (87.4%) | 38,175 (85.2%) |
Income Below Poverty Among Married-Couple Families in Santa Fe
The poverty statistics for married-couple families in Santa Fe show that 7.6% or 1,091 of the total 14,377 families live below the poverty line. Families with 5 or more children have the highest poverty rate of 100.0%, comprising of 14 families. On the other hand, families with no children have the lowest poverty rate of 3.2%, which includes 296 families.
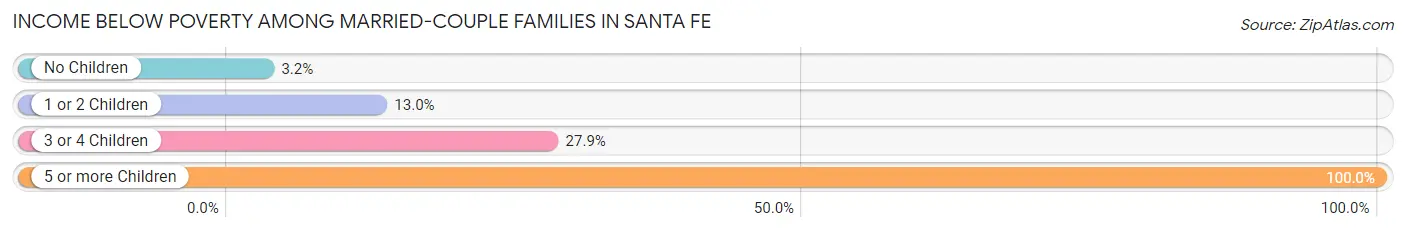
| Children | Above Poverty | Below Poverty |
| No Children | 9,046 (96.8%) | 296 (3.2%) |
| 1 or 2 Children | 3,620 (87.0%) | 541 (13.0%) |
| 3 or 4 Children | 620 (72.1%) | 240 (27.9%) |
| 5 or more Children | 0 (0.0%) | 14 (100.0%) |
| Total | 13,286 (92.4%) | 1,091 (7.6%) |
Income Below Poverty Among Single-Parent Households in Santa Fe
According to the poverty data in Santa Fe, 5.4% or 114 single-father households and 20.5% or 985 single-mother households are living below the poverty line. Among single-father households, those with 3 or 4 children have the highest poverty rate, with 8 households (30.8%) experiencing poverty. Likewise, among single-mother households, those with 3 or 4 children have the highest poverty rate, with 279 households (62.3%) falling below the poverty line.
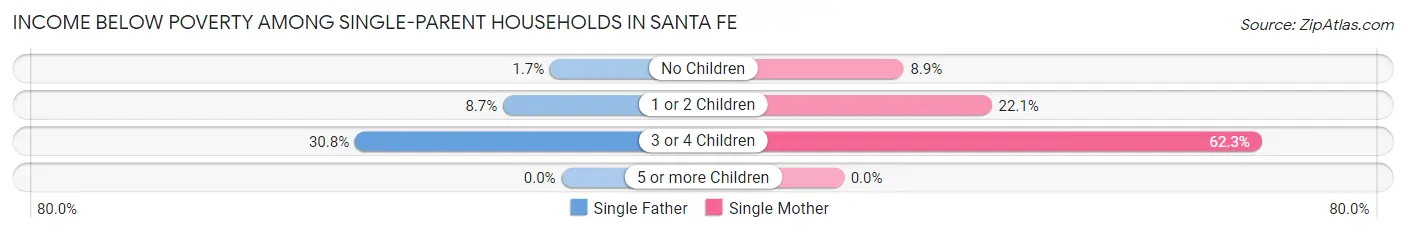
| Children | Single Father | Single Mother |
| No Children | 18 (1.7%) | 165 (8.9%) |
| 1 or 2 Children | 88 (8.7%) | 541 (22.1%) |
| 3 or 4 Children | 8 (30.8%) | 279 (62.3%) |
| 5 or more Children | 0 (0.0%) | 0 (0.0%) |
| Total | 114 (5.4%) | 985 (20.5%) |
Income Below Poverty Among Married-Couple vs Single-Parent Households in Santa Fe
The poverty data for Santa Fe shows that 1,091 of the married-couple family households (7.6%) and 1,099 of the single-parent households (15.9%) are living below the poverty level. Within the married-couple family households, those with 5 or more children have the highest poverty rate, with 14 households (100.0%) falling below the poverty line. Among the single-parent households, those with 3 or 4 children have the highest poverty rate, with 287 household (60.6%) living below poverty.
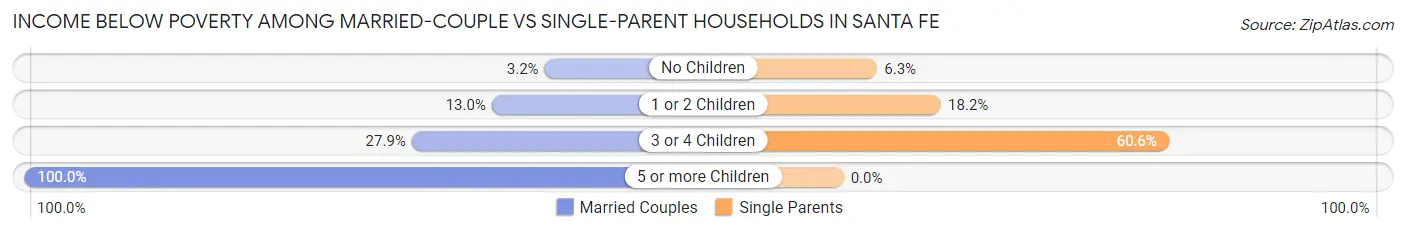
| Children | Married-Couple Families | Single-Parent Households |
| No Children | 296 (3.2%) | 183 (6.3%) |
| 1 or 2 Children | 541 (13.0%) | 629 (18.2%) |
| 3 or 4 Children | 240 (27.9%) | 287 (60.6%) |
| 5 or more Children | 14 (100.0%) | 0 (0.0%) |
| Total | 1,091 (7.6%) | 1,099 (15.9%) |
Race in Santa Fe
The most populous races in Santa Fe are White / Caucasian (59,775 | 68.2%), Hispanic or Latino (46,481 | 53.0%), and Two or more Races (14,194 | 16.2%).
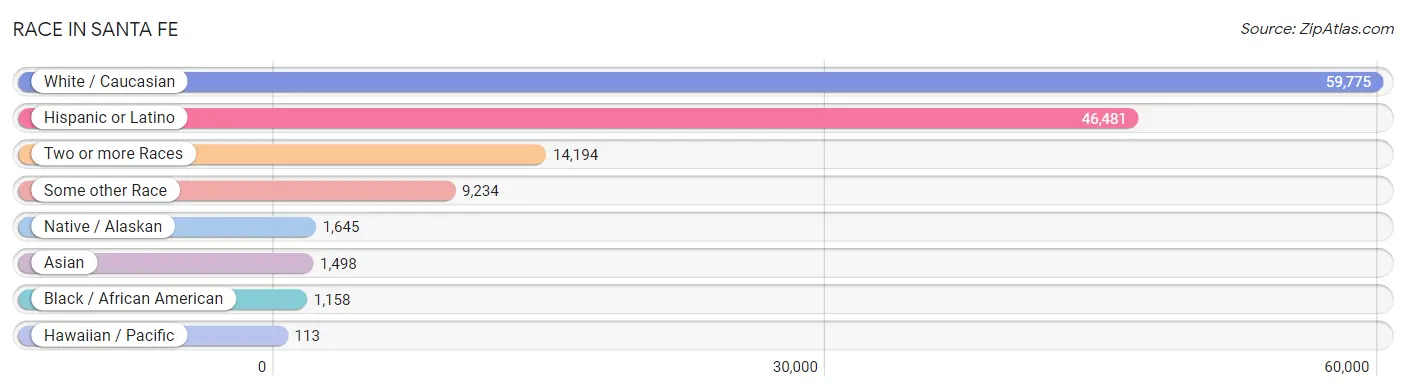
| Race | # Population | % Population |
| Asian | 1,498 | 1.7% |
| Black / African American | 1,158 | 1.3% |
| Hawaiian / Pacific | 113 | 0.1% |
| Hispanic or Latino | 46,481 | 53.0% |
| Native / Alaskan | 1,645 | 1.9% |
| White / Caucasian | 59,775 | 68.2% |
| Two or more Races | 14,194 | 16.2% |
| Some other Race | 9,234 | 10.5% |
| Total | 87,617 | 100.0% |
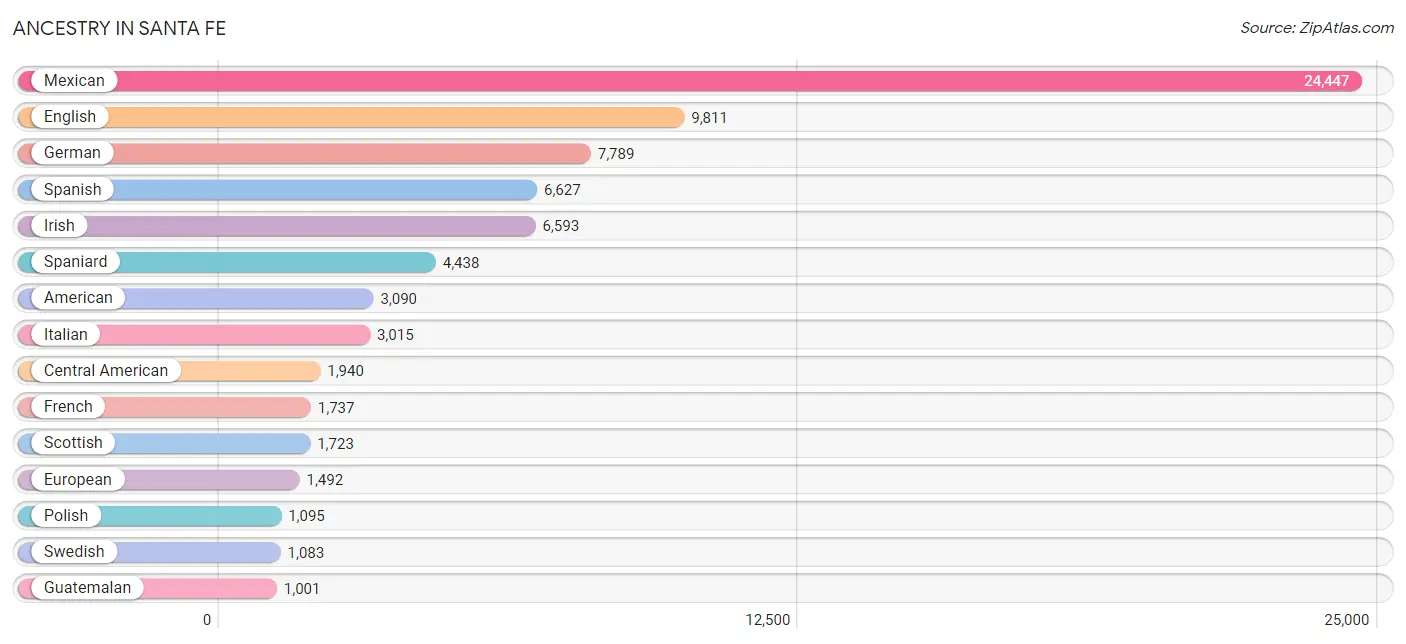
Ancestry in Santa Fe
The most populous ancestries reported in Santa Fe are Mexican (24,447 | 27.9%), English (9,811 | 11.2%), German (7,789 | 8.9%), Spanish (6,627 | 7.6%), and Irish (6,593 | 7.5%), together accounting for 63.1% of all Santa Fe residents.
| Ancestry | # Population | % Population |
| Afghan | 18 | 0.0% |
| African | 77 | 0.1% |
| Albanian | 58 | 0.1% |
| Aleut | 16 | 0.0% |
| American | 3,090 | 3.5% |
| Apache | 163 | 0.2% |
| Arab | 130 | 0.2% |
| Argentinean | 94 | 0.1% |
| Armenian | 18 | 0.0% |
| Australian | 66 | 0.1% |
| Austrian | 225 | 0.3% |
| Basque | 77 | 0.1% |
| Belgian | 72 | 0.1% |
| Belizean | 9 | 0.0% |
| Bhutanese | 249 | 0.3% |
| Blackfeet | 10 | 0.0% |
| Bolivian | 13 | 0.0% |
| Brazilian | 37 | 0.0% |
| British | 840 | 1.0% |
| Bulgarian | 10 | 0.0% |
| Burmese | 138 | 0.2% |
| Cajun | 53 | 0.1% |
| Canadian | 120 | 0.1% |
| Celtic | 71 | 0.1% |
| Central American | 1,940 | 2.2% |
| Central American Indian | 253 | 0.3% |
| Cherokee | 125 | 0.1% |
| Chilean | 136 | 0.2% |
| Choctaw | 39 | 0.0% |
| Colombian | 202 | 0.2% |
| Costa Rican | 31 | 0.0% |
| Creek | 13 | 0.0% |
| Croatian | 96 | 0.1% |
| Cuban | 246 | 0.3% |
| Czech | 274 | 0.3% |
| Czechoslovakian | 42 | 0.1% |
| Danish | 316 | 0.4% |
| Delaware | 15 | 0.0% |
| Dominican | 43 | 0.1% |
| Dutch | 816 | 0.9% |
| Dutch West Indian | 5 | 0.0% |
| Eastern European | 603 | 0.7% |
| Ecuadorian | 51 | 0.1% |
| English | 9,811 | 11.2% |
| Estonian | 78 | 0.1% |
| Ethiopian | 5 | 0.0% |
| European | 1,492 | 1.7% |
| Filipino | 59 | 0.1% |
| Finnish | 274 | 0.3% |
| French | 1,737 | 2.0% |
| French American Indian | 25 | 0.0% |
| French Canadian | 280 | 0.3% |
| German | 7,789 | 8.9% |
| Greek | 127 | 0.1% |
| Guamanian / Chamorro | 42 | 0.1% |
| Guatemalan | 1,001 | 1.1% |
| Honduran | 107 | 0.1% |
| Hopi | 28 | 0.0% |
| Hungarian | 283 | 0.3% |
| Indian (Asian) | 588 | 0.7% |
| Inupiat | 25 | 0.0% |
| Iranian | 69 | 0.1% |
| Iraqi | 9 | 0.0% |
| Irish | 6,593 | 7.5% |
| Iroquois | 80 | 0.1% |
| Israeli | 3 | 0.0% |
| Italian | 3,015 | 3.4% |
| Jamaican | 26 | 0.0% |
| Japanese | 4 | 0.0% |
| Kenyan | 126 | 0.1% |
| Korean | 536 | 0.6% |
| Laotian | 5 | 0.0% |
| Latvian | 46 | 0.1% |
| Lebanese | 37 | 0.0% |
| Lithuanian | 107 | 0.1% |
| Luxembourger | 12 | 0.0% |
| Maltese | 1 | 0.0% |
| Mexican | 24,447 | 27.9% |
| Mexican American Indian | 212 | 0.2% |
| Native Hawaiian | 65 | 0.1% |
| Navajo | 664 | 0.8% |
| Nigerian | 16 | 0.0% |
| Northern European | 463 | 0.5% |
| Norwegian | 838 | 1.0% |
| Pakistani | 301 | 0.3% |
| Panamanian | 16 | 0.0% |
| Paraguayan | 36 | 0.0% |
| Pennsylvania German | 24 | 0.0% |
| Peruvian | 207 | 0.2% |
| Polish | 1,095 | 1.3% |
| Portuguese | 180 | 0.2% |
| Pueblo | 570 | 0.6% |
| Puerto Rican | 579 | 0.7% |
| Romanian | 54 | 0.1% |
| Russian | 959 | 1.1% |
| Salvadoran | 785 | 0.9% |
| Samoan | 75 | 0.1% |
| Scandinavian | 362 | 0.4% |
| Scotch-Irish | 730 | 0.8% |
| Scottish | 1,723 | 2.0% |
| Seminole | 8 | 0.0% |
| Serbian | 27 | 0.0% |
| Sioux | 78 | 0.1% |
| Slavic | 55 | 0.1% |
| Slovak | 99 | 0.1% |
| South African | 40 | 0.1% |
| South American | 940 | 1.1% |
| South American Indian | 9 | 0.0% |
| Spaniard | 4,438 | 5.1% |
| Spanish | 6,627 | 7.6% |
| Spanish American | 460 | 0.5% |
| Spanish American Indian | 86 | 0.1% |
| Sri Lankan | 64 | 0.1% |
| Subsaharan African | 307 | 0.4% |
| Swedish | 1,083 | 1.2% |
| Swiss | 308 | 0.4% |
| Syrian | 41 | 0.1% |
| Thai | 268 | 0.3% |
| Trinidadian and Tobagonian | 7 | 0.0% |
| Turkish | 21 | 0.0% |
| Ukrainian | 168 | 0.2% |
| Uruguayan | 63 | 0.1% |
| Ute | 132 | 0.2% |
| Venezuelan | 138 | 0.2% |
| Welsh | 867 | 1.0% |
| Yaqui | 40 | 0.1% |
| Yugoslavian | 10 | 0.0% | View All 127 Rows |
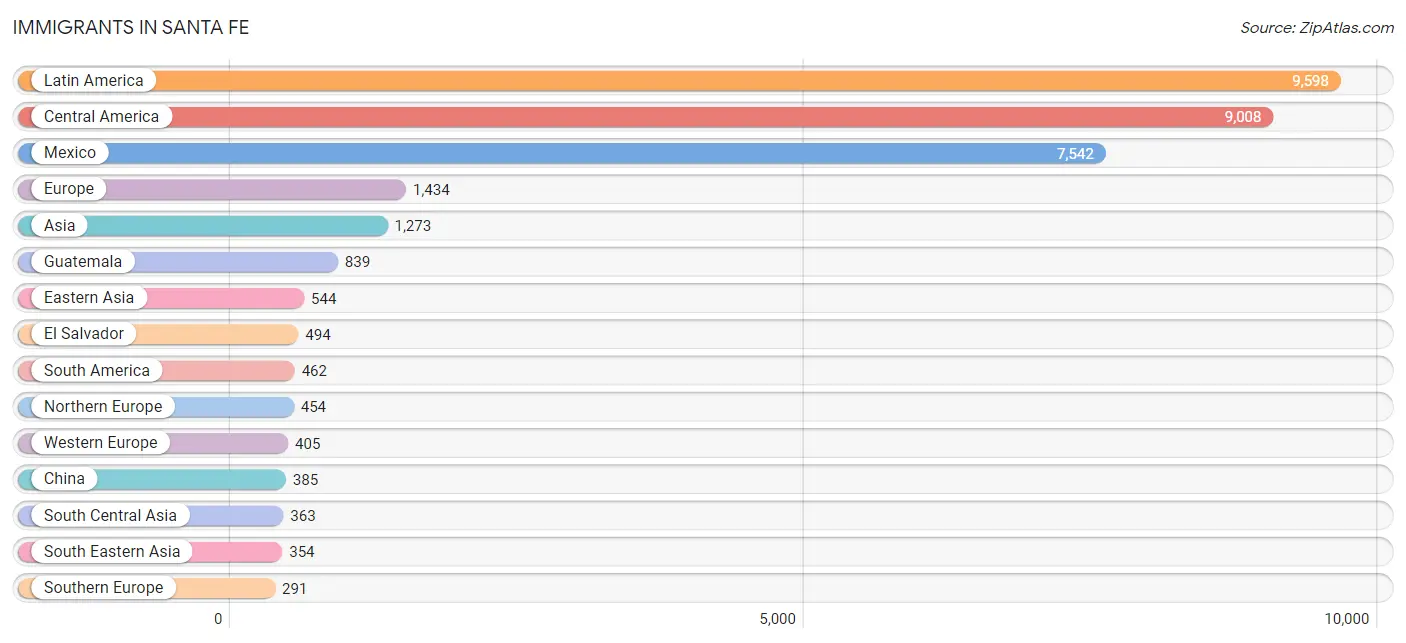
Immigrants in Santa Fe
The most numerous immigrant groups reported in Santa Fe came from Latin America (9,598 | 11.0%), Central America (9,008 | 10.3%), Mexico (7,542 | 8.6%), Europe (1,434 | 1.6%), and Asia (1,273 | 1.5%), together accounting for 32.9% of all Santa Fe residents.
| Immigration Origin | # Population | % Population |
| Afghanistan | 9 | 0.0% |
| Africa | 289 | 0.3% |
| Albania | 34 | 0.0% |
| Argentina | 101 | 0.1% |
| Asia | 1,273 | 1.5% |
| Australia | 23 | 0.0% |
| Austria | 22 | 0.0% |
| Belgium | 19 | 0.0% |
| Brazil | 15 | 0.0% |
| Canada | 231 | 0.3% |
| Caribbean | 128 | 0.2% |
| Central America | 9,008 | 10.3% |
| Chile | 145 | 0.2% |
| China | 385 | 0.4% |
| Colombia | 42 | 0.1% |
| Cuba | 95 | 0.1% |
| Czechoslovakia | 37 | 0.0% |
| Dominican Republic | 14 | 0.0% |
| Eastern Africa | 158 | 0.2% |
| Eastern Asia | 544 | 0.6% |
| Eastern Europe | 284 | 0.3% |
| El Salvador | 494 | 0.6% |
| England | 177 | 0.2% |
| Europe | 1,434 | 1.6% |
| France | 55 | 0.1% |
| Germany | 279 | 0.3% |
| Ghana | 20 | 0.0% |
| Greece | 9 | 0.0% |
| Guatemala | 839 | 1.0% |
| Honduras | 121 | 0.1% |
| Hungary | 10 | 0.0% |
| India | 181 | 0.2% |
| Indonesia | 46 | 0.1% |
| Iran | 69 | 0.1% |
| Ireland | 17 | 0.0% |
| Italy | 182 | 0.2% |
| Jamaica | 19 | 0.0% |
| Japan | 48 | 0.1% |
| Kenya | 125 | 0.1% |
| Korea | 111 | 0.1% |
| Latin America | 9,598 | 11.0% |
| Lithuania | 8 | 0.0% |
| Mexico | 7,542 | 8.6% |
| Nepal | 20 | 0.0% |
| Netherlands | 13 | 0.0% |
| Northern Africa | 2 | 0.0% |
| Northern Europe | 454 | 0.5% |
| Norway | 25 | 0.0% |
| Oceania | 23 | 0.0% |
| Pakistan | 71 | 0.1% |
| Panama | 12 | 0.0% |
| Peru | 44 | 0.1% |
| Philippines | 190 | 0.2% |
| Poland | 75 | 0.1% |
| Portugal | 3 | 0.0% |
| Romania | 7 | 0.0% |
| Russia | 40 | 0.1% |
| Serbia | 27 | 0.0% |
| South Africa | 62 | 0.1% |
| South America | 462 | 0.5% |
| South Central Asia | 363 | 0.4% |
| South Eastern Asia | 354 | 0.4% |
| Southern Europe | 291 | 0.3% |
| Spain | 96 | 0.1% |
| Sri Lanka | 13 | 0.0% |
| Sweden | 30 | 0.0% |
| Switzerland | 17 | 0.0% |
| Thailand | 82 | 0.1% |
| Turkey | 12 | 0.0% |
| Ukraine | 17 | 0.0% |
| Uruguay | 11 | 0.0% |
| Venezuela | 104 | 0.1% |
| Vietnam | 36 | 0.0% |
| Western Africa | 67 | 0.1% |
| Western Asia | 12 | 0.0% |
| Western Europe | 405 | 0.5% |
| Zimbabwe | 9 | 0.0% | View All 77 Rows |
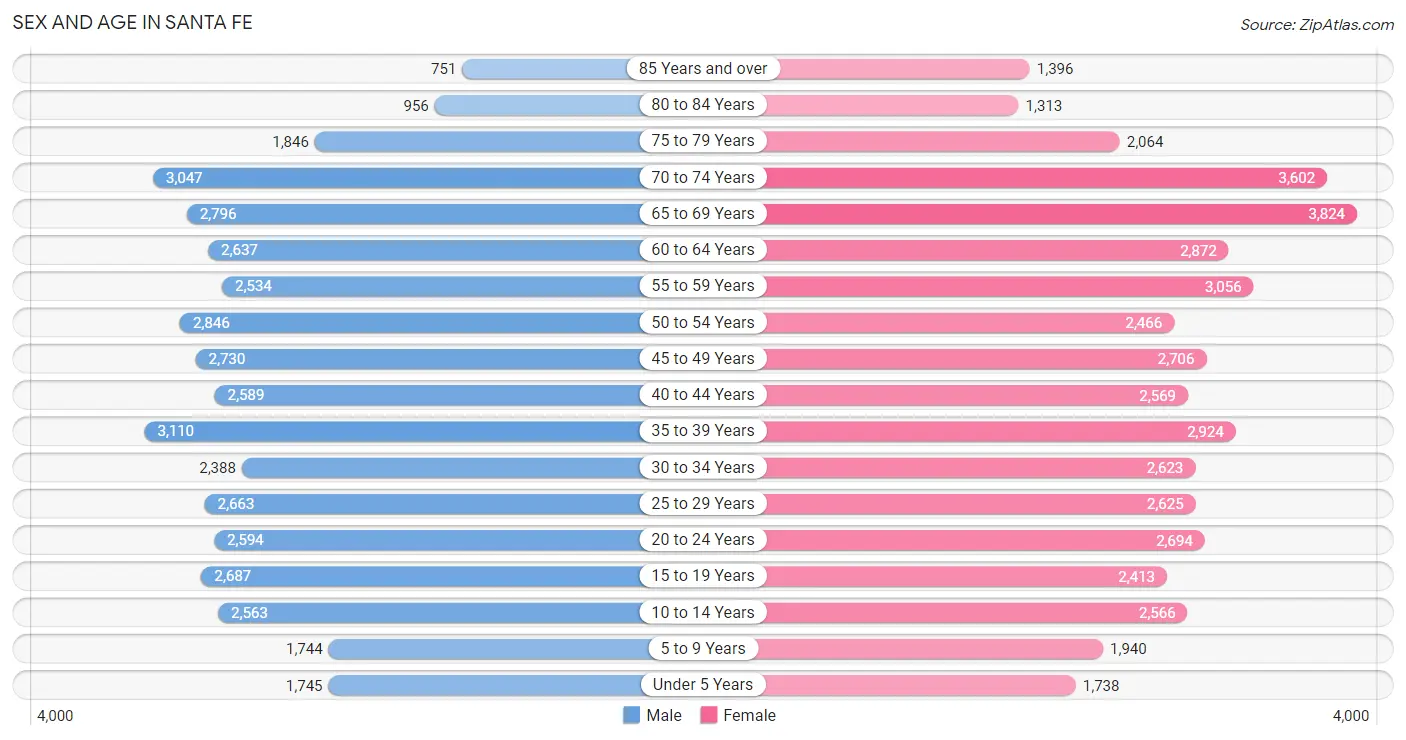
Sex and Age in Santa Fe
Sex and Age in Santa Fe
The most populous age groups in Santa Fe are 35 to 39 Years (3,110 | 7.4%) for men and 65 to 69 Years (3,824 | 8.4%) for women.
| Age Bracket | Male | Female |
| Under 5 Years | 1,745 (4.1%) | 1,738 (3.8%) |
| 5 to 9 Years | 1,744 (4.1%) | 1,940 (4.3%) |
| 10 to 14 Years | 2,563 (6.1%) | 2,566 (5.7%) |
| 15 to 19 Years | 2,687 (6.4%) | 2,413 (5.3%) |
| 20 to 24 Years | 2,594 (6.1%) | 2,694 (5.9%) |
| 25 to 29 Years | 2,663 (6.3%) | 2,625 (5.8%) |
| 30 to 34 Years | 2,388 (5.7%) | 2,623 (5.8%) |
| 35 to 39 Years | 3,110 (7.4%) | 2,924 (6.4%) |
| 40 to 44 Years | 2,589 (6.1%) | 2,569 (5.7%) |
| 45 to 49 Years | 2,730 (6.5%) | 2,706 (6.0%) |
| 50 to 54 Years | 2,846 (6.7%) | 2,466 (5.4%) |
| 55 to 59 Years | 2,534 (6.0%) | 3,056 (6.7%) |
| 60 to 64 Years | 2,637 (6.2%) | 2,872 (6.3%) |
| 65 to 69 Years | 2,796 (6.6%) | 3,824 (8.4%) |
| 70 to 74 Years | 3,047 (7.2%) | 3,602 (7.9%) |
| 75 to 79 Years | 1,846 (4.4%) | 2,064 (4.5%) |
| 80 to 84 Years | 956 (2.3%) | 1,313 (2.9%) |
| 85 Years and over | 751 (1.8%) | 1,396 (3.1%) |
| Total | 42,226 (100.0%) | 45,391 (100.0%) |
Families and Households in Santa Fe
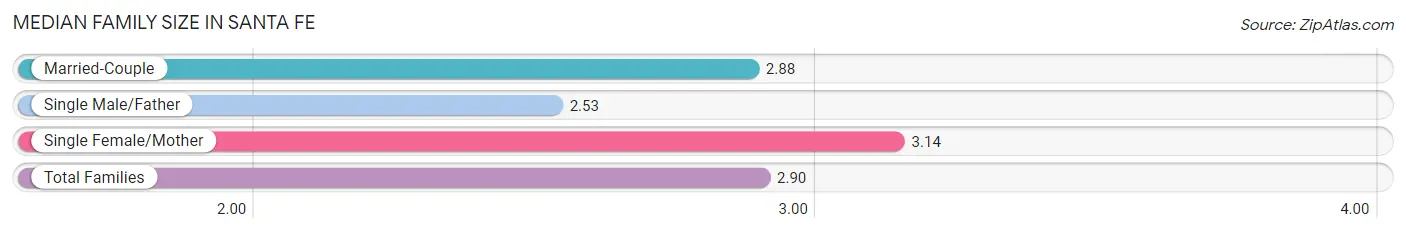
Median Family Size in Santa Fe
The median family size in Santa Fe is 2.90 persons per family, with single female/mother families (4,807 | 22.6%) accounting for the largest median family size of 3.14 persons per family. On the other hand, single male/father families (2,103 | 9.9%) represent the smallest median family size with 2.53 persons per family.
| Family Type | # Families | Family Size |
| Married-Couple | 14,377 (67.5%) | 2.88 |
| Single Male/Father | 2,103 (9.9%) | 2.53 |
| Single Female/Mother | 4,807 (22.6%) | 3.14 |
| Total Families | 21,287 (100.0%) | 2.90 |
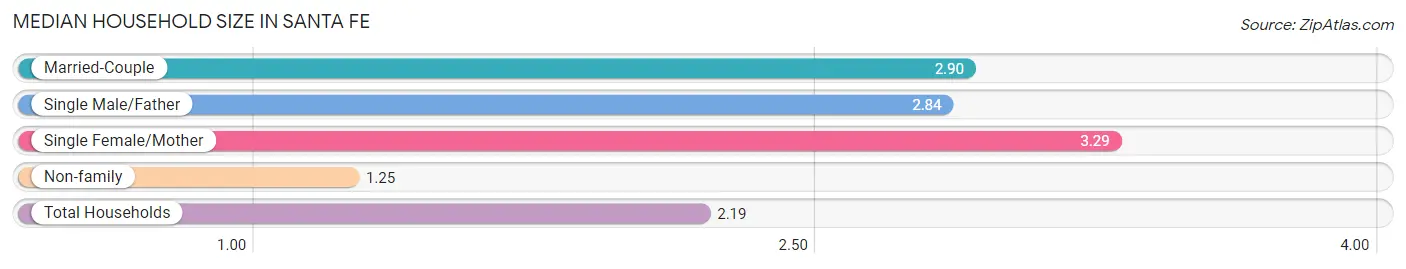
Median Household Size in Santa Fe
The median household size in Santa Fe is 2.19 persons per household, with single female/mother households (4,807 | 12.2%) accounting for the largest median household size of 3.29 persons per household. non-family households (18,024 | 45.9%) represent the smallest median household size with 1.25 persons per household.
| Household Type | # Households | Household Size |
| Married-Couple | 14,377 (36.6%) | 2.90 |
| Single Male/Father | 2,103 (5.3%) | 2.84 |
| Single Female/Mother | 4,807 (12.2%) | 3.29 |
| Non-family | 18,024 (45.9%) | 1.25 |
| Total Households | 39,311 (100.0%) | 2.19 |
Household Size by Marriage Status in Santa Fe
Out of a total of 39,311 households in Santa Fe, 21,287 (54.1%) are family households, while 18,024 (45.9%) are nonfamily households. The most numerous type of family households are 2-person households, comprising 11,044, and the most common type of nonfamily households are 1-person households, comprising 14,604.
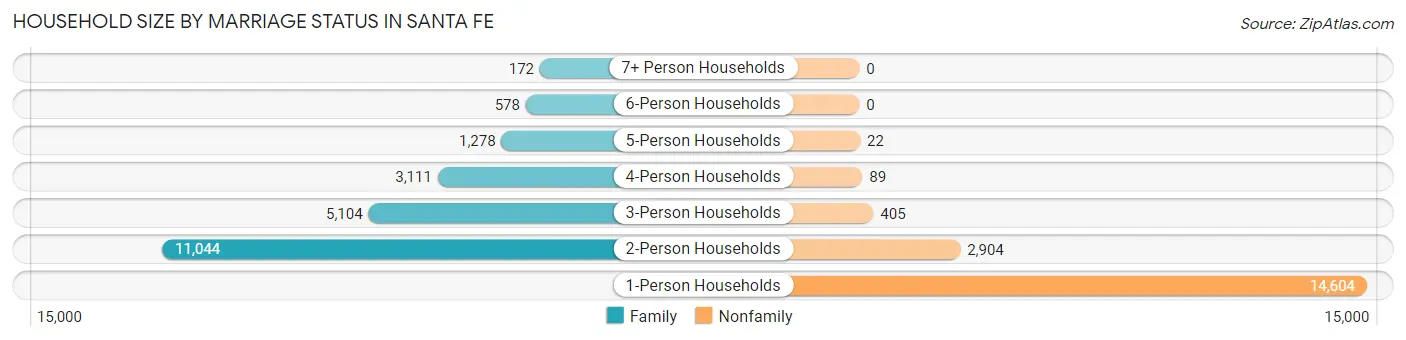
| Household Size | Family Households | Nonfamily Households |
| 1-Person Households | - | 14,604 (37.1%) |
| 2-Person Households | 11,044 (28.1%) | 2,904 (7.4%) |
| 3-Person Households | 5,104 (13.0%) | 405 (1.0%) |
| 4-Person Households | 3,111 (7.9%) | 89 (0.2%) |
| 5-Person Households | 1,278 (3.3%) | 22 (0.1%) |
| 6-Person Households | 578 (1.5%) | 0 (0.0%) |
| 7+ Person Households | 172 (0.4%) | 0 (0.0%) |
| Total | 21,287 (54.1%) | 18,024 (45.9%) |
Female Fertility in Santa Fe
Fertility by Age in Santa Fe
Average fertility rate in Santa Fe is 46.0 births per 1,000 women. Women in the age bracket of 20 to 34 years have the highest fertility rate with 61.0 births per 1,000 women. Women in the age bracket of 20 to 34 years acount for 55.8% of all women with births.
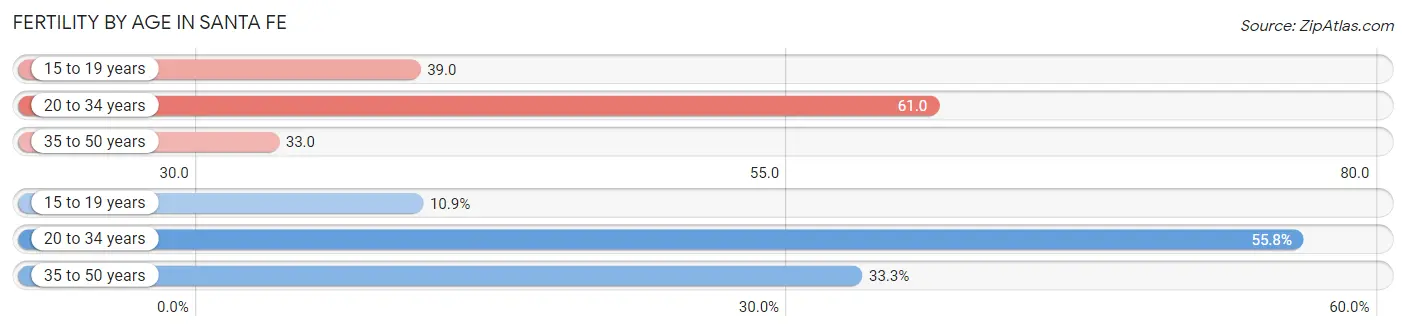
| Age Bracket | Women with Births | Births / 1,000 Women |
| 15 to 19 years | 95 (10.9%) | 39.0 |
| 20 to 34 years | 484 (55.8%) | 61.0 |
| 35 to 50 years | 289 (33.3%) | 33.0 |
| Total | 868 (100.0%) | 46.0 |
Fertility by Age by Marriage Status in Santa Fe
61.9% of women with births (868) in Santa Fe are married. The highest percentage of unmarried women with births falls into 15 to 19 years age bracket with 100.0% of them unmarried at the time of birth, while the lowest percentage of unmarried women with births belong to 35 to 50 years age bracket with 9.7% of them unmarried.
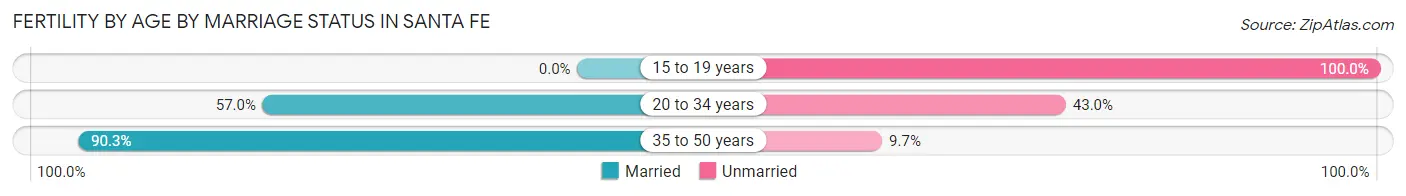
| Age Bracket | Married | Unmarried |
| 15 to 19 years | 0 (0.0%) | 95 (100.0%) |
| 20 to 34 years | 276 (57.0%) | 208 (43.0%) |
| 35 to 50 years | 261 (90.3%) | 28 (9.7%) |
| Total | 537 (61.9%) | 331 (38.1%) |
Fertility by Education in Santa Fe
Average fertility rate in Santa Fe is 46.0 births per 1,000 women. Women with the education attainment of college or associate's degree have the highest fertility rate of 54.0 births per 1,000 women, while women with the education attainment of bachelor's degree have the lowest fertility at 31.0 births per 1,000 women. Women with the education attainment of college or associate's degree represent 38.0% of all women with births.
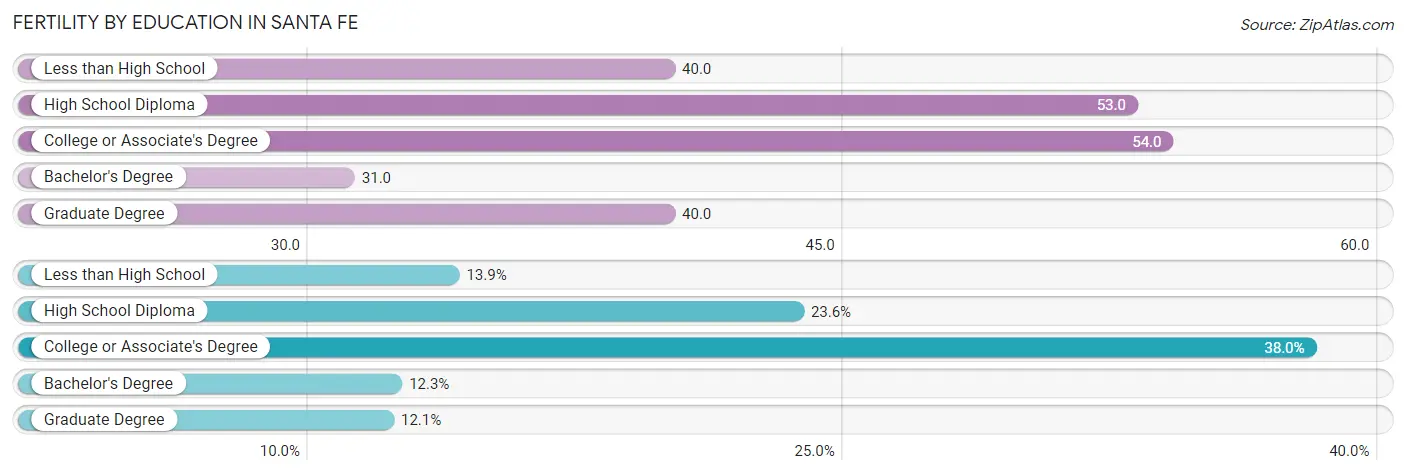
| Educational Attainment | Women with Births | Births / 1,000 Women |
| Less than High School | 121 (13.9%) | 40.0 |
| High School Diploma | 205 (23.6%) | 53.0 |
| College or Associate's Degree | 330 (38.0%) | 54.0 |
| Bachelor's Degree | 107 (12.3%) | 31.0 |
| Graduate Degree | 105 (12.1%) | 40.0 |
| Total | 868 (100.0%) | 46.0 |
Fertility by Education by Marriage Status in Santa Fe
38.1% of women with births in Santa Fe are unmarried. Women with the educational attainment of bachelor's degree are most likely to be married with 100.0% of them married at childbirth, while women with the educational attainment of less than high school are least likely to be married with 90.9% of them unmarried at childbirth.
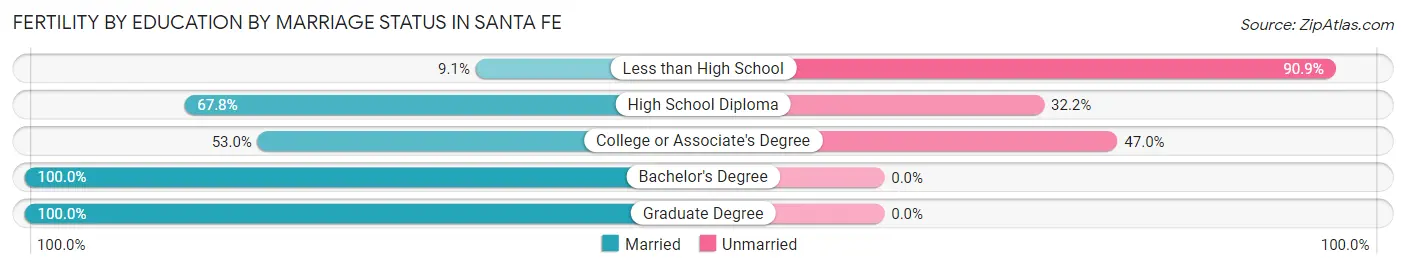
| Educational Attainment | Married | Unmarried |
| Less than High School | 11 (9.1%) | 110 (90.9%) |
| High School Diploma | 139 (67.8%) | 66 (32.2%) |
| College or Associate's Degree | 175 (53.0%) | 155 (47.0%) |
| Bachelor's Degree | 107 (100.0%) | 0 (0.0%) |
| Graduate Degree | 105 (100.0%) | 0 (0.0%) |
| Total | 537 (61.9%) | 331 (38.1%) |
Employment Characteristics in Santa Fe
Employment by Class of Employer in Santa Fe
Among the 42,496 employed individuals in Santa Fe, private company employees (22,080 | 52.0%), not-for-profit organizations (4,702 | 11.1%), and self-employed (not incorporated) (4,523 | 10.6%) make up the most common classes of employment.
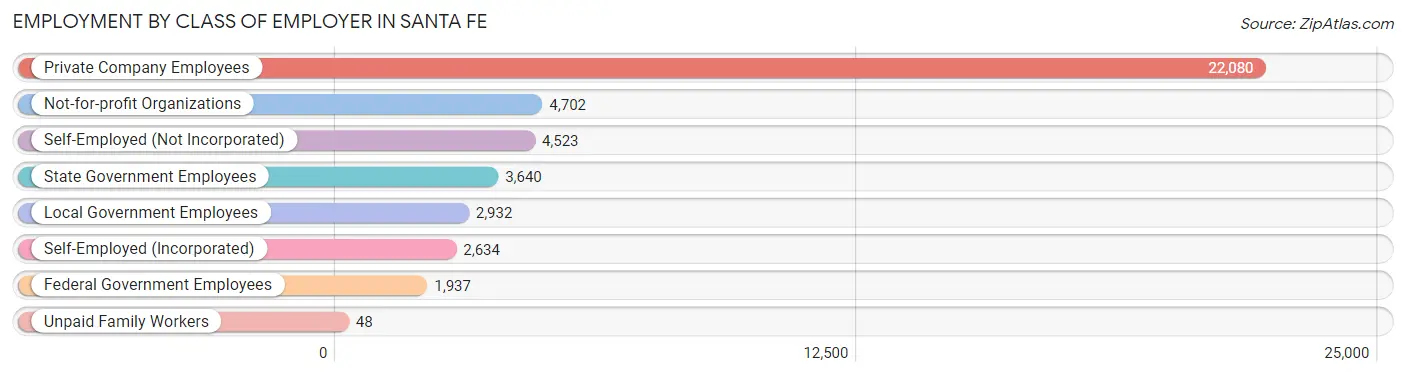
| Employer Class | # Employees | % Employees |
| Private Company Employees | 22,080 | 52.0% |
| Self-Employed (Incorporated) | 2,634 | 6.2% |
| Self-Employed (Not Incorporated) | 4,523 | 10.6% |
| Not-for-profit Organizations | 4,702 | 11.1% |
| Local Government Employees | 2,932 | 6.9% |
| State Government Employees | 3,640 | 8.6% |
| Federal Government Employees | 1,937 | 4.6% |
| Unpaid Family Workers | 48 | 0.1% |
| Total | 42,496 | 100.0% |
Employment Status by Age in Santa Fe
According to the labor force statistics for Santa Fe, out of the total population over 16 years of age (74,431), 61.1% or 45,477 individuals are in the labor force, with 5.3% or 2,410 of them unemployed. The age group with the highest labor force participation rate is 35 to 44 years, with 86.9% or 9,726 individuals in the labor force. Within the labor force, the 16 to 19 years age range has the highest percentage of unemployed individuals, with 18.9% or 303 of them being unemployed.
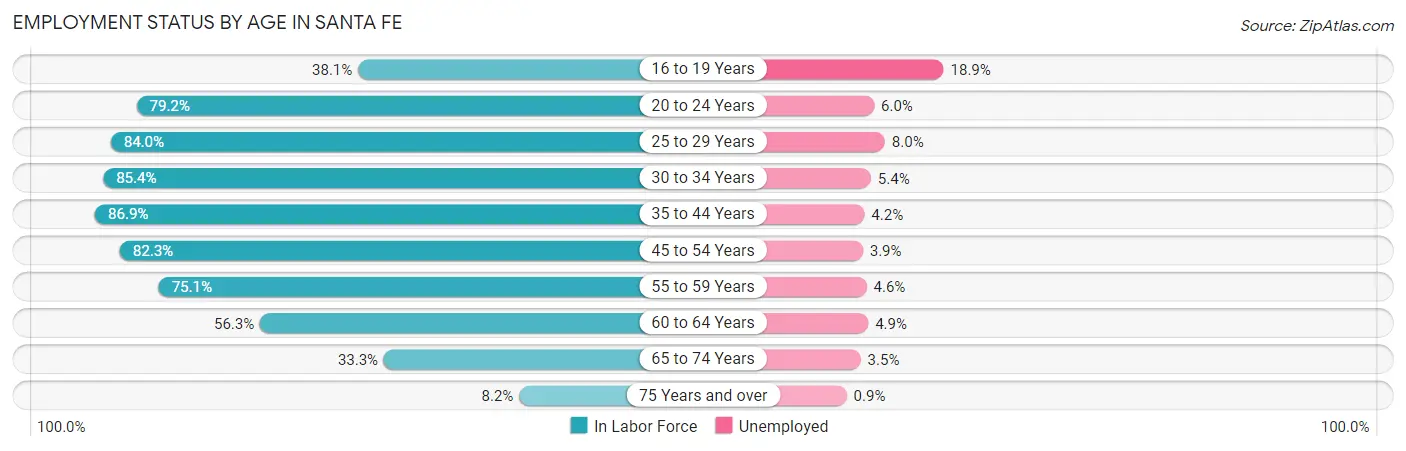
| Age Bracket | In Labor Force | Unemployed |
| 16 to 19 Years | 1,604 (38.1%) | 303 (18.9%) |
| 20 to 24 Years | 4,188 (79.2%) | 251 (6.0%) |
| 25 to 29 Years | 4,442 (84.0%) | 355 (8.0%) |
| 30 to 34 Years | 4,279 (85.4%) | 231 (5.4%) |
| 35 to 44 Years | 9,726 (86.9%) | 408 (4.2%) |
| 45 to 54 Years | 8,846 (82.3%) | 345 (3.9%) |
| 55 to 59 Years | 4,198 (75.1%) | 193 (4.6%) |
| 60 to 64 Years | 3,102 (56.3%) | 152 (4.9%) |
| 65 to 74 Years | 4,419 (33.3%) | 155 (3.5%) |
| 75 Years and over | 683 (8.2%) | 6 (0.9%) |
| Total | 45,477 (61.1%) | 2,410 (5.3%) |
Employment Status by Educational Attainment in Santa Fe
According to labor force statistics for Santa Fe, 79.8% of individuals (34,584) out of the total population between 25 and 64 years of age (43,338) are in the labor force, with 4.9% or 1,695 of them being unemployed. The group with the highest labor force participation rate are those with the educational attainment of bachelor's degree or higher, with 85.4% or 14,488 individuals in the labor force. Within the labor force, individuals with high school diploma education have the highest percentage of unemployment, with 7.5% or 511 of them being unemployed.
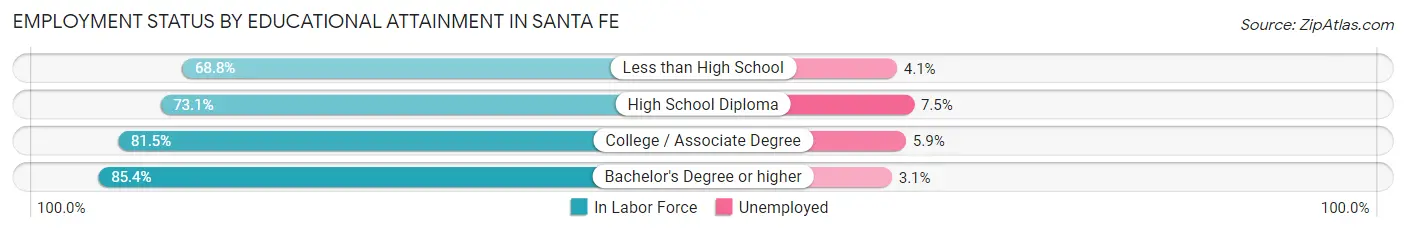
| Educational Attainment | In Labor Force | Unemployed |
| Less than High School | 3,283 (68.8%) | 196 (4.1%) |
| High School Diploma | 6,807 (73.1%) | 698 (7.5%) |
| College / Associate Degree | 10,016 (81.5%) | 725 (5.9%) |
| Bachelor's Degree or higher | 14,488 (85.4%) | 526 (3.1%) |
| Total | 34,584 (79.8%) | 2,124 (4.9%) |
Employment Occupations by Sex in Santa Fe
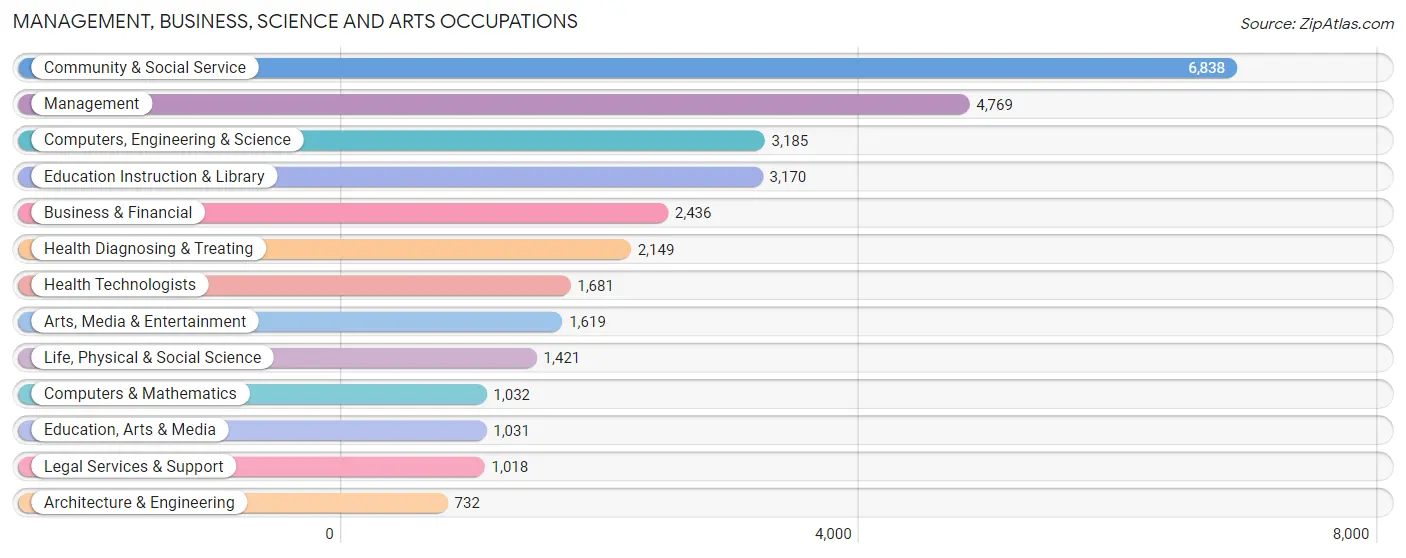
Management, Business, Science and Arts Occupations
The most common Management, Business, Science and Arts occupations in Santa Fe are Community & Social Service (6,838 | 16.0%), Management (4,769 | 11.1%), Computers, Engineering & Science (3,185 | 7.4%), Education Instruction & Library (3,170 | 7.4%), and Business & Financial (2,436 | 5.7%).
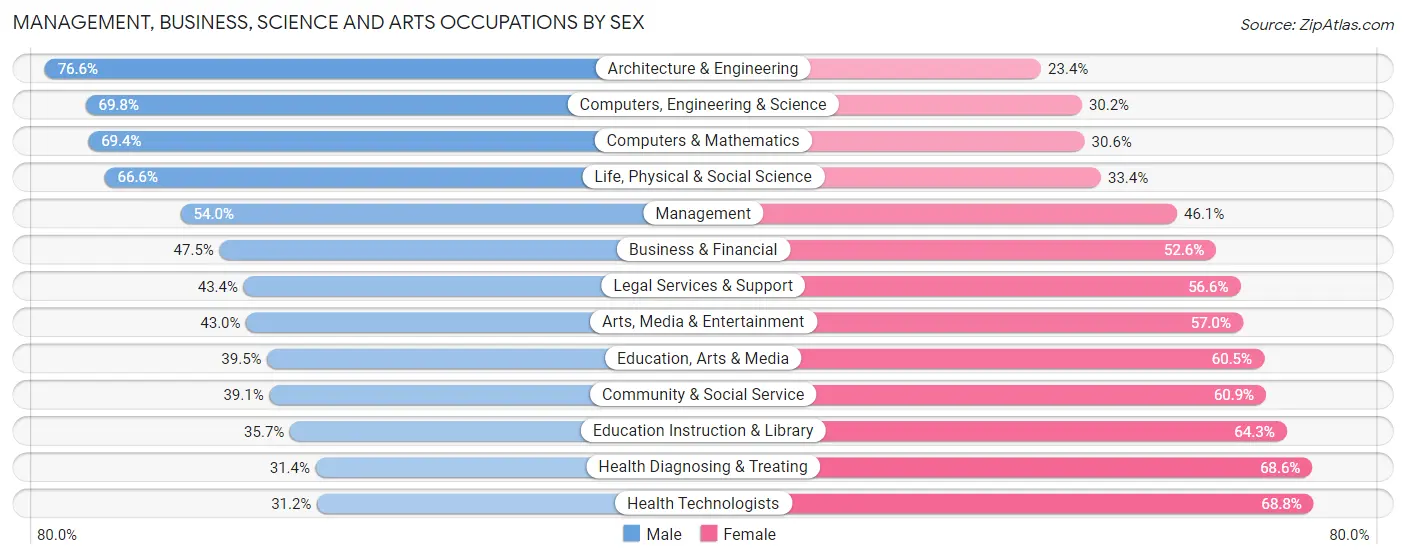
Management, Business, Science and Arts Occupations by Sex
Within the Management, Business, Science and Arts occupations in Santa Fe, the most male-oriented occupations are Architecture & Engineering (76.6%), Computers, Engineering & Science (69.8%), and Computers & Mathematics (69.4%), while the most female-oriented occupations are Health Technologists (68.8%), Health Diagnosing & Treating (68.6%), and Education Instruction & Library (64.3%).
| Occupation | Male | Female |
| Management | 2,573 (53.9%) | 2,196 (46.1%) |
| Business & Financial | 1,156 (47.4%) | 1,280 (52.5%) |
| Computers, Engineering & Science | 2,224 (69.8%) | 961 (30.2%) |
| Computers & Mathematics | 716 (69.4%) | 316 (30.6%) |
| Architecture & Engineering | 561 (76.6%) | 171 (23.4%) |
| Life, Physical & Social Science | 947 (66.6%) | 474 (33.4%) |
| Community & Social Service | 2,676 (39.1%) | 4,162 (60.9%) |
| Education, Arts & Media | 407 (39.5%) | 624 (60.5%) |
| Legal Services & Support | 442 (43.4%) | 576 (56.6%) |
| Education Instruction & Library | 1,131 (35.7%) | 2,039 (64.3%) |
| Arts, Media & Entertainment | 696 (43.0%) | 923 (57.0%) |
| Health Diagnosing & Treating | 675 (31.4%) | 1,474 (68.6%) |
| Health Technologists | 524 (31.2%) | 1,157 (68.8%) |
| Total (Category) | 9,304 (48.0%) | 10,073 (52.0%) |
| Total (Overall) | 21,821 (50.9%) | 21,056 (49.1%) |
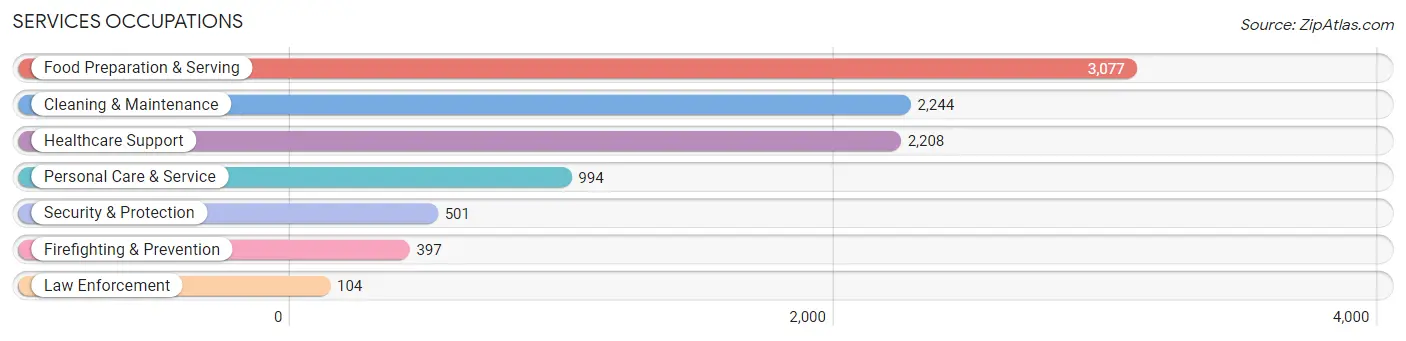
Services Occupations
The most common Services occupations in Santa Fe are Food Preparation & Serving (3,077 | 7.2%), Cleaning & Maintenance (2,244 | 5.2%), Healthcare Support (2,208 | 5.1%), Personal Care & Service (994 | 2.3%), and Security & Protection (501 | 1.2%).
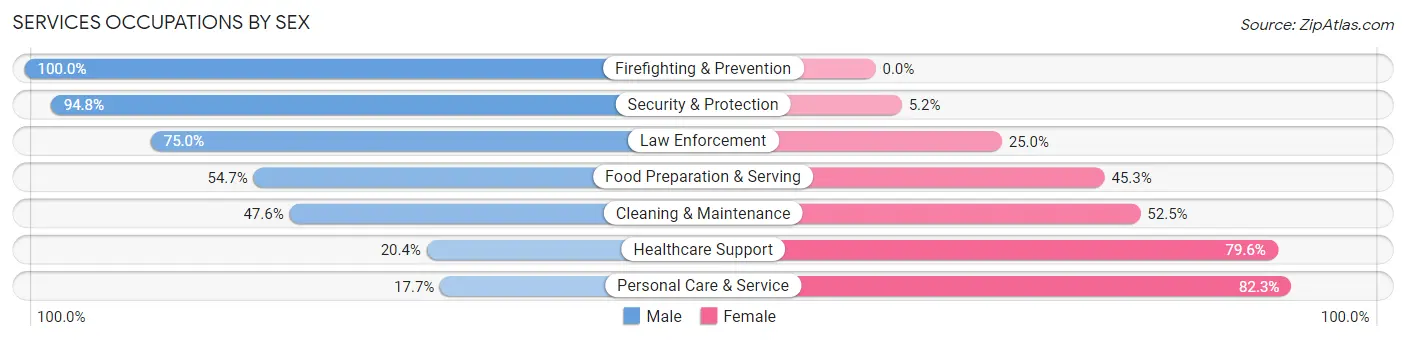
Services Occupations by Sex
Within the Services occupations in Santa Fe, the most male-oriented occupations are Firefighting & Prevention (100.0%), Security & Protection (94.8%), and Law Enforcement (75.0%), while the most female-oriented occupations are Personal Care & Service (82.3%), Healthcare Support (79.6%), and Cleaning & Maintenance (52.4%).
| Occupation | Male | Female |
| Healthcare Support | 450 (20.4%) | 1,758 (79.6%) |
| Security & Protection | 475 (94.8%) | 26 (5.2%) |
| Firefighting & Prevention | 397 (100.0%) | 0 (0.0%) |
| Law Enforcement | 78 (75.0%) | 26 (25.0%) |
| Food Preparation & Serving | 1,682 (54.7%) | 1,395 (45.3%) |
| Cleaning & Maintenance | 1,067 (47.5%) | 1,177 (52.4%) |
| Personal Care & Service | 176 (17.7%) | 818 (82.3%) |
| Total (Category) | 3,850 (42.7%) | 5,174 (57.3%) |
| Total (Overall) | 21,821 (50.9%) | 21,056 (49.1%) |
Sales and Office Occupations
The most common Sales and Office occupations in Santa Fe are Office & Administration (4,150 | 9.7%), and Sales & Related (3,677 | 8.6%).

Sales and Office Occupations by Sex
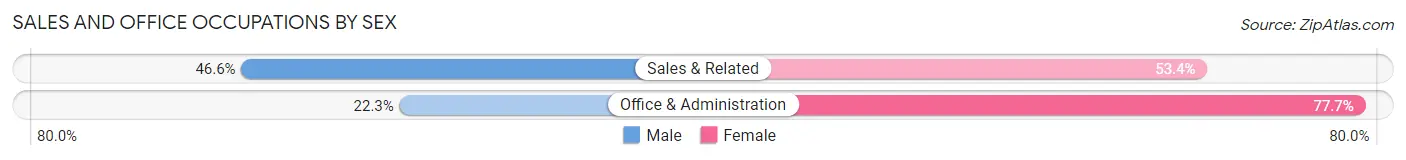
| Occupation | Male | Female |
| Sales & Related | 1,715 (46.6%) | 1,962 (53.4%) |
| Office & Administration | 926 (22.3%) | 3,224 (77.7%) |
| Total (Category) | 2,641 (33.7%) | 5,186 (66.3%) |
| Total (Overall) | 21,821 (50.9%) | 21,056 (49.1%) |
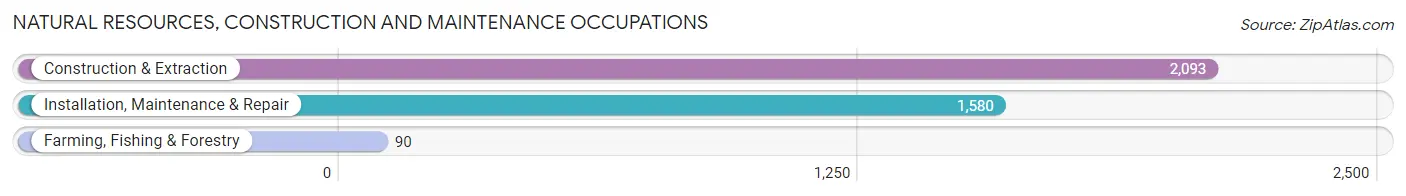
Natural Resources, Construction and Maintenance Occupations
The most common Natural Resources, Construction and Maintenance occupations in Santa Fe are Construction & Extraction (2,093 | 4.9%), Installation, Maintenance & Repair (1,580 | 3.7%), and Farming, Fishing & Forestry (90 | 0.2%).
Natural Resources, Construction and Maintenance Occupations by Sex
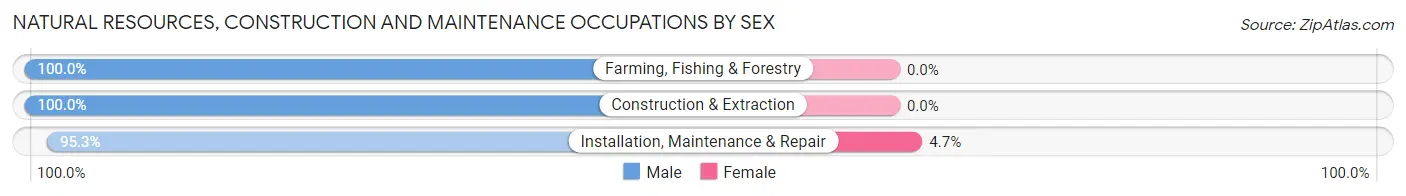
| Occupation | Male | Female |
| Farming, Fishing & Forestry | 90 (100.0%) | 0 (0.0%) |
| Construction & Extraction | 2,093 (100.0%) | 0 (0.0%) |
| Installation, Maintenance & Repair | 1,506 (95.3%) | 74 (4.7%) |
| Total (Category) | 3,689 (98.0%) | 74 (2.0%) |
| Total (Overall) | 21,821 (50.9%) | 21,056 (49.1%) |
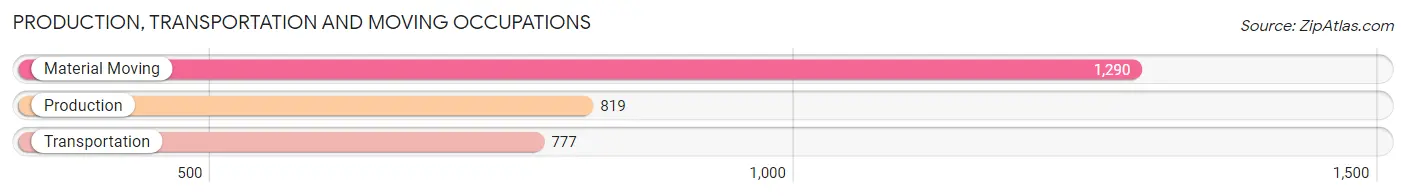
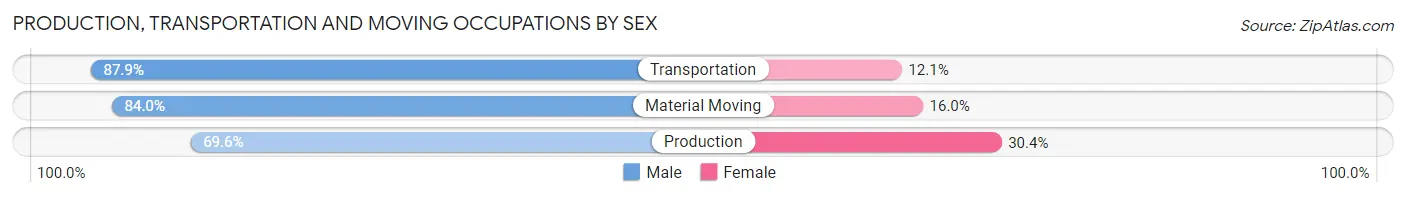
Production, Transportation and Moving Occupations
The most common Production, Transportation and Moving occupations in Santa Fe are Material Moving (1,290 | 3.0%), Production (819 | 1.9%), and Transportation (777 | 1.8%).
Production, Transportation and Moving Occupations by Sex
| Occupation | Male | Female |
| Production | 570 (69.6%) | 249 (30.4%) |
| Transportation | 683 (87.9%) | 94 (12.1%) |
| Material Moving | 1,084 (84.0%) | 206 (16.0%) |
| Total (Category) | 2,337 (81.0%) | 549 (19.0%) |
| Total (Overall) | 21,821 (50.9%) | 21,056 (49.1%) |
Employment Industries by Sex in Santa Fe
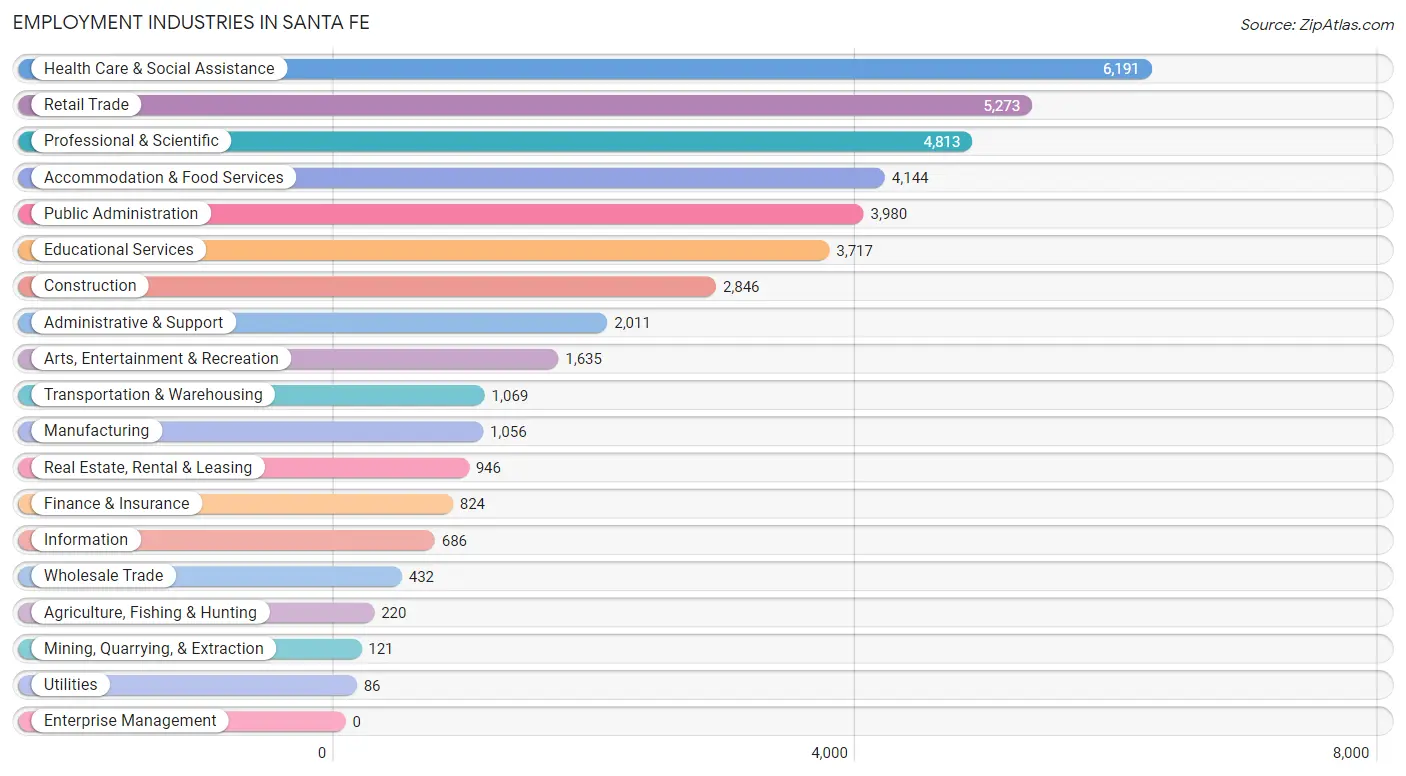
Employment Industries in Santa Fe
The major employment industries in Santa Fe include Health Care & Social Assistance (6,191 | 14.4%), Retail Trade (5,273 | 12.3%), Professional & Scientific (4,813 | 11.2%), Accommodation & Food Services (4,144 | 9.7%), and Public Administration (3,980 | 9.3%).
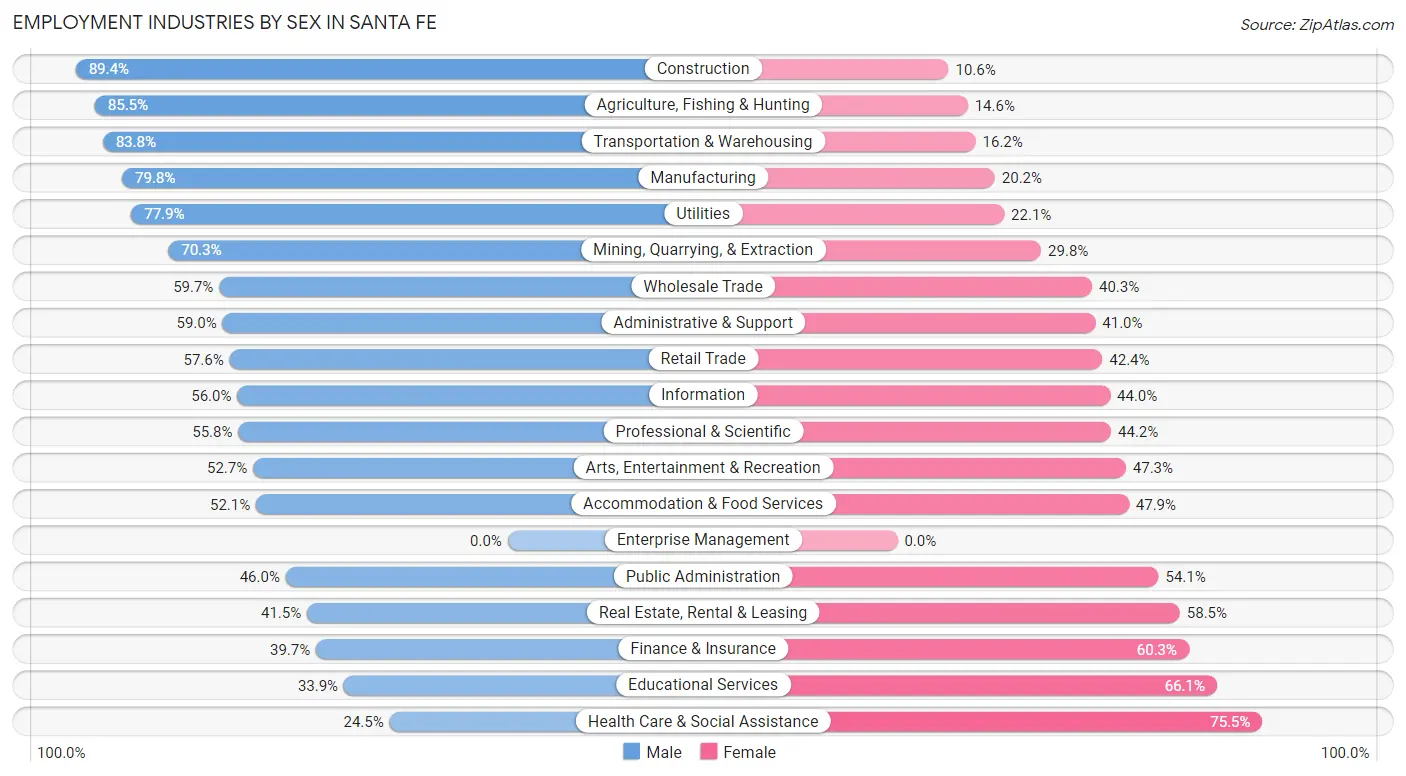
Employment Industries by Sex in Santa Fe
The Santa Fe industries that see more men than women are Construction (89.4%), Agriculture, Fishing & Hunting (85.5%), and Transportation & Warehousing (83.8%), whereas the industries that tend to have a higher number of women are Health Care & Social Assistance (75.5%), Educational Services (66.1%), and Finance & Insurance (60.3%).
| Industry | Male | Female |
| Agriculture, Fishing & Hunting | 188 (85.5%) | 32 (14.5%) |
| Mining, Quarrying, & Extraction | 85 (70.3%) | 36 (29.7%) |
| Construction | 2,545 (89.4%) | 301 (10.6%) |
| Manufacturing | 843 (79.8%) | 213 (20.2%) |
| Wholesale Trade | 258 (59.7%) | 174 (40.3%) |
| Retail Trade | 3,036 (57.6%) | 2,237 (42.4%) |
| Transportation & Warehousing | 896 (83.8%) | 173 (16.2%) |
| Utilities | 67 (77.9%) | 19 (22.1%) |
| Information | 384 (56.0%) | 302 (44.0%) |
| Finance & Insurance | 327 (39.7%) | 497 (60.3%) |
| Real Estate, Rental & Leasing | 393 (41.5%) | 553 (58.5%) |
| Professional & Scientific | 2,684 (55.8%) | 2,129 (44.2%) |
| Enterprise Management | 0 (0.0%) | 0 (0.0%) |
| Administrative & Support | 1,187 (59.0%) | 824 (41.0%) |
| Educational Services | 1,260 (33.9%) | 2,457 (66.1%) |
| Health Care & Social Assistance | 1,515 (24.5%) | 4,676 (75.5%) |
| Arts, Entertainment & Recreation | 862 (52.7%) | 773 (47.3%) |
| Accommodation & Food Services | 2,159 (52.1%) | 1,985 (47.9%) |
| Public Administration | 1,829 (46.0%) | 2,151 (54.0%) |
| Total | 21,821 (50.9%) | 21,056 (49.1%) |
Education in Santa Fe
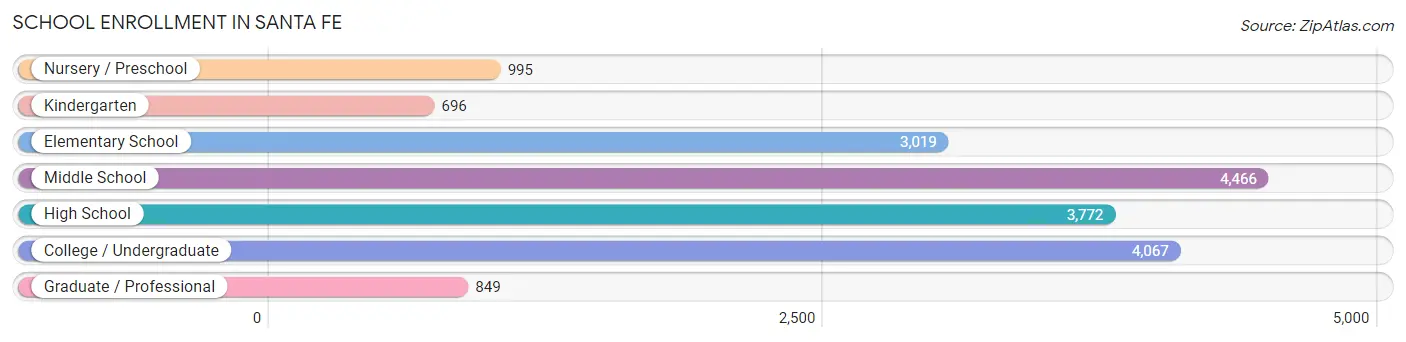
School Enrollment in Santa Fe
The most common levels of schooling among the 17,864 students in Santa Fe are middle school (4,466 | 25.0%), college / undergraduate (4,067 | 22.8%), and high school (3,772 | 21.1%).
| School Level | # Students | % Students |
| Nursery / Preschool | 995 | 5.6% |
| Kindergarten | 696 | 3.9% |
| Elementary School | 3,019 | 16.9% |
| Middle School | 4,466 | 25.0% |
| High School | 3,772 | 21.1% |
| College / Undergraduate | 4,067 | 22.8% |
| Graduate / Professional | 849 | 4.8% |
| Total | 17,864 | 100.0% |
School Enrollment by Age by Funding Source in Santa Fe
Out of a total of 17,864 students who are enrolled in schools in Santa Fe, 2,769 (15.5%) attend a private institution, while the remaining 15,095 (84.5%) are enrolled in public schools. The age group of 3 to 4 year olds has the highest likelihood of being enrolled in private schools, with 314 (37.2% in the age bracket) enrolled. Conversely, the age group of 15 to 17 year olds has the lowest likelihood of being enrolled in a private school, with 2,559 (90.1% in the age bracket) attending a public institution.
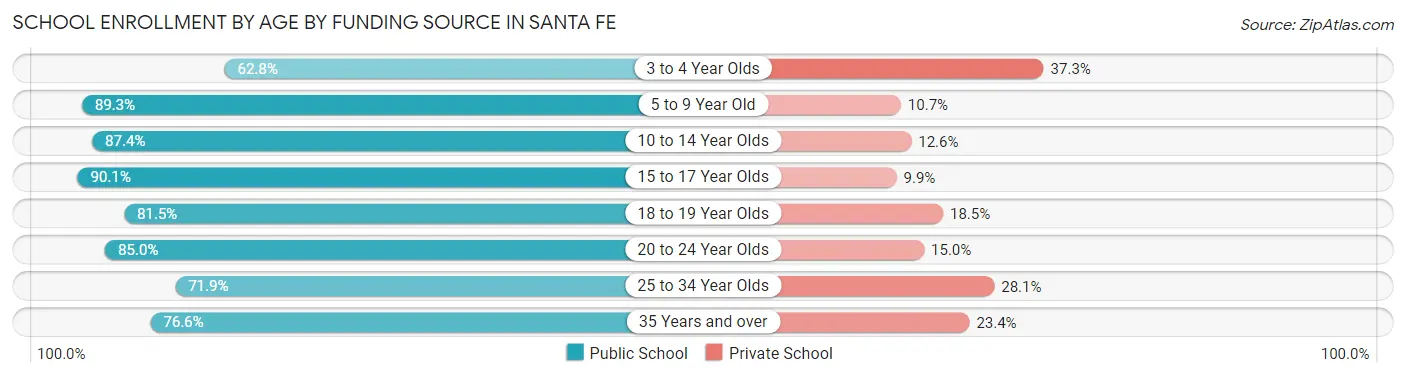
| Age Bracket | Public School | Private School |
| 3 to 4 Year Olds | 529 (62.7%) | 314 (37.2%) |
| 5 to 9 Year Old | 3,151 (89.3%) | 376 (10.7%) |
| 10 to 14 Year Olds | 4,442 (87.4%) | 640 (12.6%) |
| 15 to 17 Year Olds | 2,559 (90.1%) | 280 (9.9%) |
| 18 to 19 Year Olds | 1,202 (81.5%) | 273 (18.5%) |
| 20 to 24 Year Olds | 1,271 (85.0%) | 224 (15.0%) |
| 25 to 34 Year Olds | 933 (71.9%) | 364 (28.1%) |
| 35 Years and over | 1,000 (76.6%) | 306 (23.4%) |
| Total | 15,095 (84.5%) | 2,769 (15.5%) |
Educational Attainment by Field of Study in Santa Fe
Visual & performing arts (3,800 | 11.9%), business (3,611 | 11.4%), social sciences (3,352 | 10.5%), education (2,966 | 9.3%), and literature & languages (2,952 | 9.3%) are the most common fields of study among 31,808 individuals in Santa Fe who have obtained a bachelor's degree or higher.
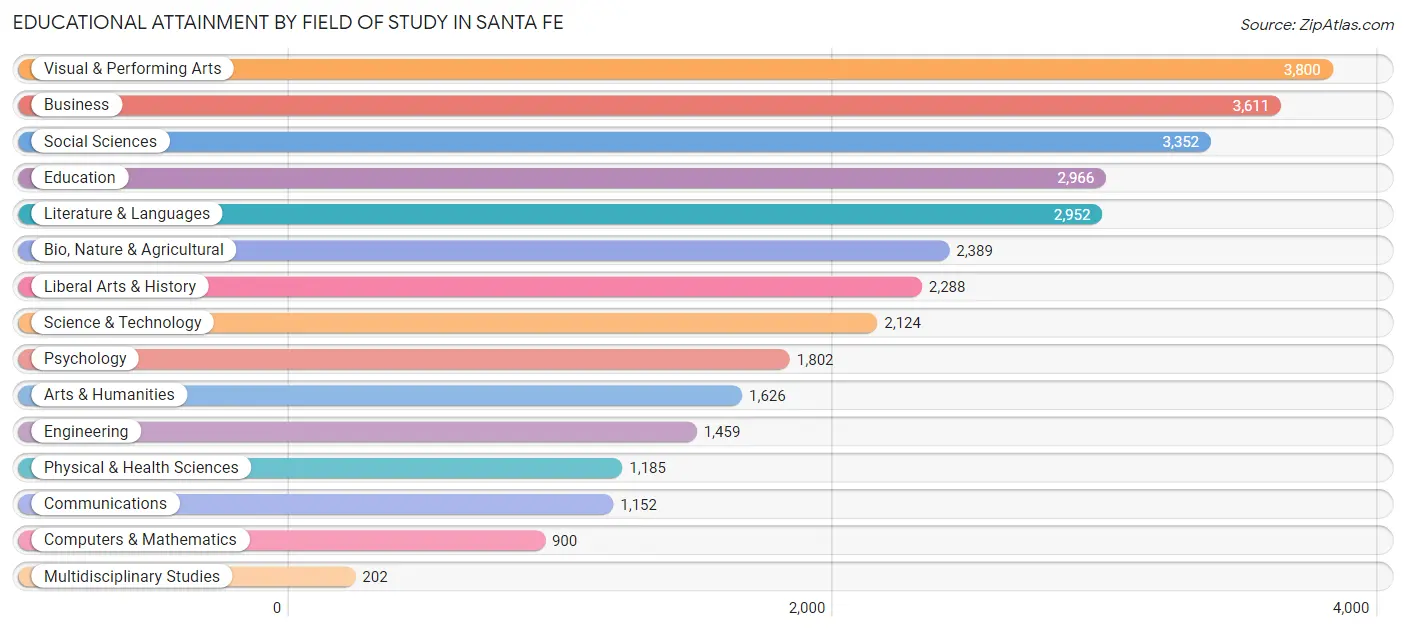
| Field of Study | # Graduates | % Graduates |
| Computers & Mathematics | 900 | 2.8% |
| Bio, Nature & Agricultural | 2,389 | 7.5% |
| Physical & Health Sciences | 1,185 | 3.7% |
| Psychology | 1,802 | 5.7% |
| Social Sciences | 3,352 | 10.5% |
| Engineering | 1,459 | 4.6% |
| Multidisciplinary Studies | 202 | 0.6% |
| Science & Technology | 2,124 | 6.7% |
| Business | 3,611 | 11.4% |
| Education | 2,966 | 9.3% |
| Literature & Languages | 2,952 | 9.3% |
| Liberal Arts & History | 2,288 | 7.2% |
| Visual & Performing Arts | 3,800 | 11.9% |
| Communications | 1,152 | 3.6% |
| Arts & Humanities | 1,626 | 5.1% |
| Total | 31,808 | 100.0% |
Transportation & Commute in Santa Fe
Vehicle Availability by Sex in Santa Fe
The most prevalent vehicle ownership categories in Santa Fe are males with 2 vehicles (9,675, accounting for 44.7%) and females with 2 vehicles (8,219, making up 47.2%).
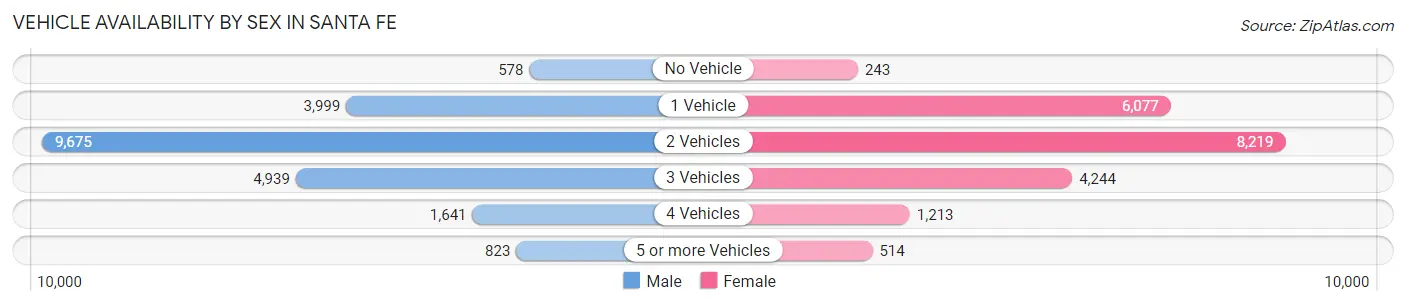
| Vehicles Available | Male | Female |
| No Vehicle | 578 (2.7%) | 243 (1.2%) |
| 1 Vehicle | 3,999 (18.5%) | 6,077 (29.6%) |
| 2 Vehicles | 9,675 (44.7%) | 8,219 (40.1%) |
| 3 Vehicles | 4,939 (22.8%) | 4,244 (20.7%) |
| 4 Vehicles | 1,641 (7.6%) | 1,213 (5.9%) |
| 5 or more Vehicles | 823 (3.8%) | 514 (2.5%) |
| Total | 21,655 (100.0%) | 20,510 (100.0%) |
Commute Time in Santa Fe
The most frequently occuring commute durations in Santa Fe are 15 to 19 minutes (8,553 commuters, 23.6%), 10 to 14 minutes (7,169 commuters, 19.8%), and 20 to 24 minutes (6,185 commuters, 17.1%).
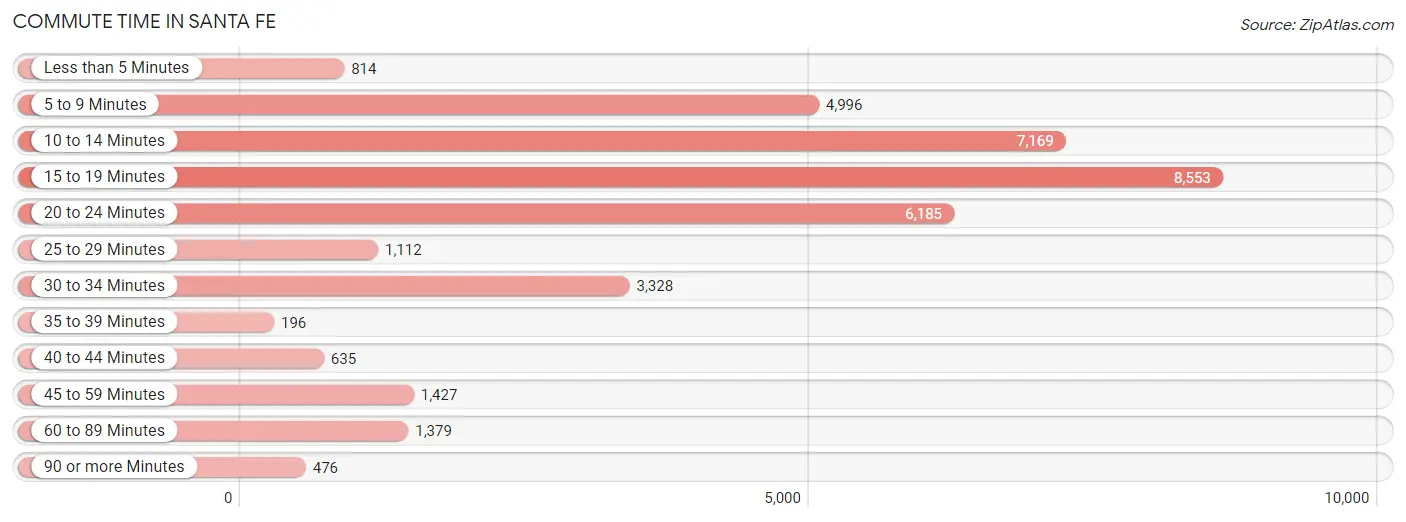
| Commute Time | # Commuters | % Commuters |
| Less than 5 Minutes | 814 | 2.2% |
| 5 to 9 Minutes | 4,996 | 13.8% |
| 10 to 14 Minutes | 7,169 | 19.8% |
| 15 to 19 Minutes | 8,553 | 23.6% |
| 20 to 24 Minutes | 6,185 | 17.1% |
| 25 to 29 Minutes | 1,112 | 3.1% |
| 30 to 34 Minutes | 3,328 | 9.2% |
| 35 to 39 Minutes | 196 | 0.5% |
| 40 to 44 Minutes | 635 | 1.8% |
| 45 to 59 Minutes | 1,427 | 3.9% |
| 60 to 89 Minutes | 1,379 | 3.8% |
| 90 or more Minutes | 476 | 1.3% |
Commute Time by Sex in Santa Fe
The most common commute times in Santa Fe are 15 to 19 minutes (4,321 commuters, 22.7%) for males and 15 to 19 minutes (4,232 commuters, 24.6%) for females.
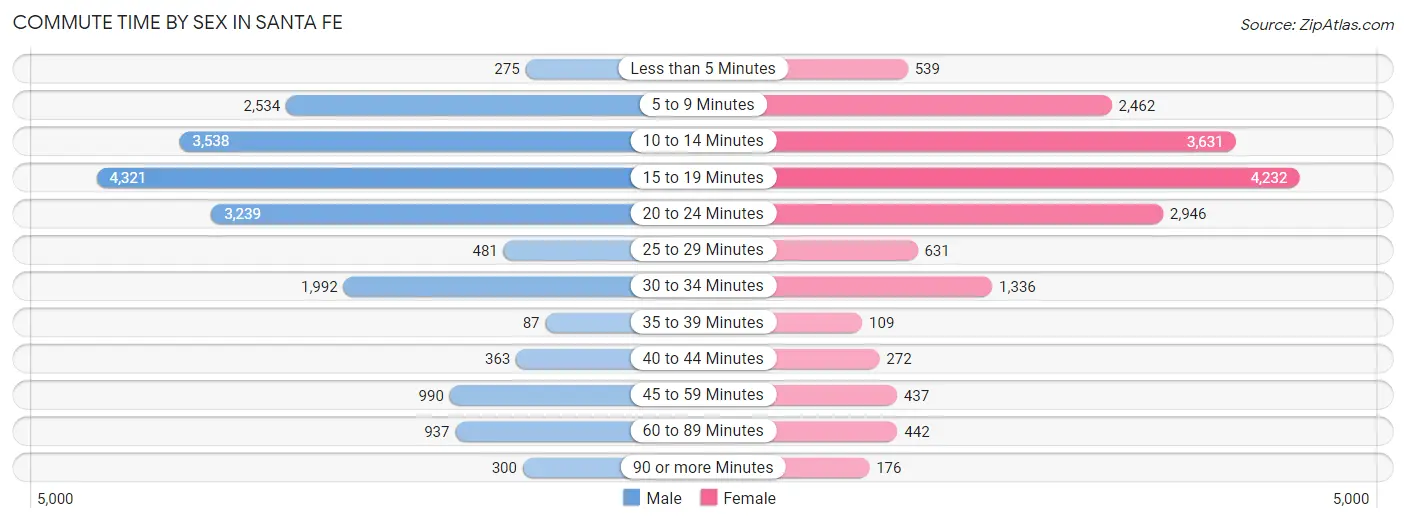
| Commute Time | Male | Female |
| Less than 5 Minutes | 275 (1.4%) | 539 (3.1%) |
| 5 to 9 Minutes | 2,534 (13.3%) | 2,462 (14.3%) |
| 10 to 14 Minutes | 3,538 (18.6%) | 3,631 (21.1%) |
| 15 to 19 Minutes | 4,321 (22.7%) | 4,232 (24.6%) |
| 20 to 24 Minutes | 3,239 (17.0%) | 2,946 (17.1%) |
| 25 to 29 Minutes | 481 (2.5%) | 631 (3.7%) |
| 30 to 34 Minutes | 1,992 (10.4%) | 1,336 (7.8%) |
| 35 to 39 Minutes | 87 (0.5%) | 109 (0.6%) |
| 40 to 44 Minutes | 363 (1.9%) | 272 (1.6%) |
| 45 to 59 Minutes | 990 (5.2%) | 437 (2.5%) |
| 60 to 89 Minutes | 937 (4.9%) | 442 (2.6%) |
| 90 or more Minutes | 300 (1.6%) | 176 (1.0%) |
Time of Departure to Work by Sex in Santa Fe
The most frequent times of departure to work in Santa Fe are 7:30 AM to 7:59 AM (3,518, 18.5%) for males and 7:30 AM to 7:59 AM (3,828, 22.2%) for females.
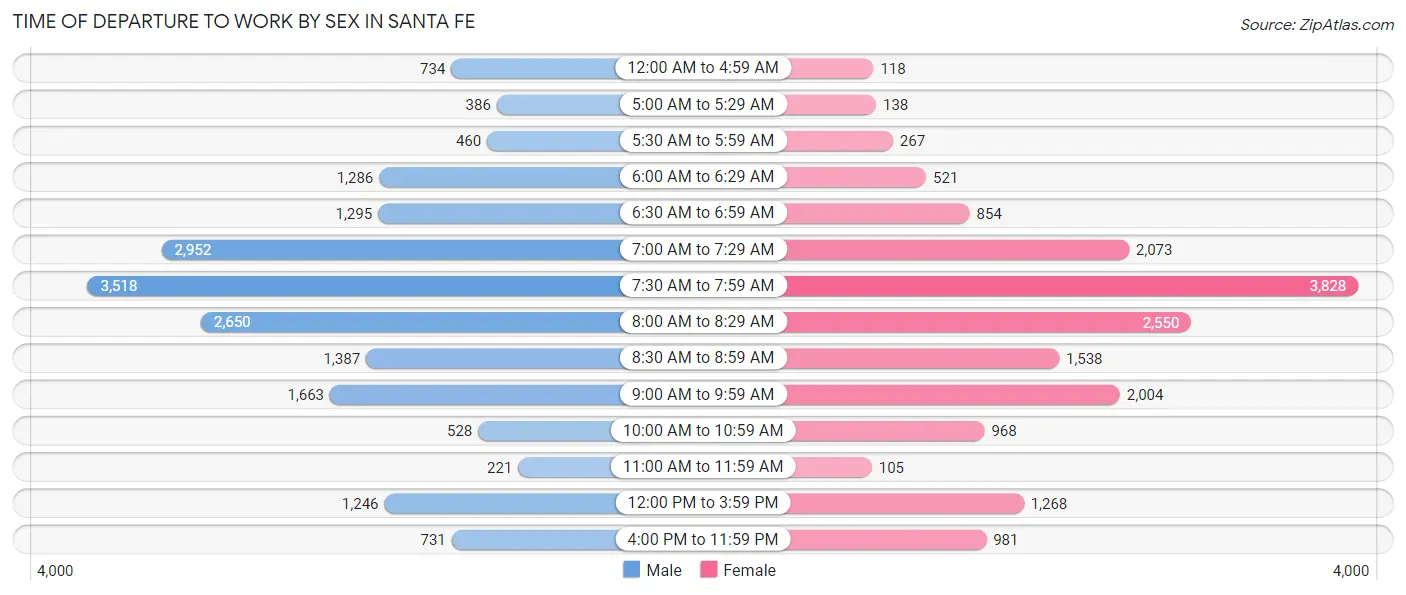
| Time of Departure | Male | Female |
| 12:00 AM to 4:59 AM | 734 (3.8%) | 118 (0.7%) |
| 5:00 AM to 5:29 AM | 386 (2.0%) | 138 (0.8%) |
| 5:30 AM to 5:59 AM | 460 (2.4%) | 267 (1.5%) |
| 6:00 AM to 6:29 AM | 1,286 (6.8%) | 521 (3.0%) |
| 6:30 AM to 6:59 AM | 1,295 (6.8%) | 854 (5.0%) |
| 7:00 AM to 7:29 AM | 2,952 (15.5%) | 2,073 (12.0%) |
| 7:30 AM to 7:59 AM | 3,518 (18.5%) | 3,828 (22.2%) |
| 8:00 AM to 8:29 AM | 2,650 (13.9%) | 2,550 (14.8%) |
| 8:30 AM to 8:59 AM | 1,387 (7.3%) | 1,538 (8.9%) |
| 9:00 AM to 9:59 AM | 1,663 (8.7%) | 2,004 (11.6%) |
| 10:00 AM to 10:59 AM | 528 (2.8%) | 968 (5.6%) |
| 11:00 AM to 11:59 AM | 221 (1.2%) | 105 (0.6%) |
| 12:00 PM to 3:59 PM | 1,246 (6.5%) | 1,268 (7.4%) |
| 4:00 PM to 11:59 PM | 731 (3.8%) | 981 (5.7%) |
| Total | 19,057 (100.0%) | 17,213 (100.0%) |
Housing Occupancy in Santa Fe
Occupancy by Ownership in Santa Fe
Of the total 39,311 dwellings in Santa Fe, owner-occupied units account for 25,289 (64.3%), while renter-occupied units make up 14,022 (35.7%).
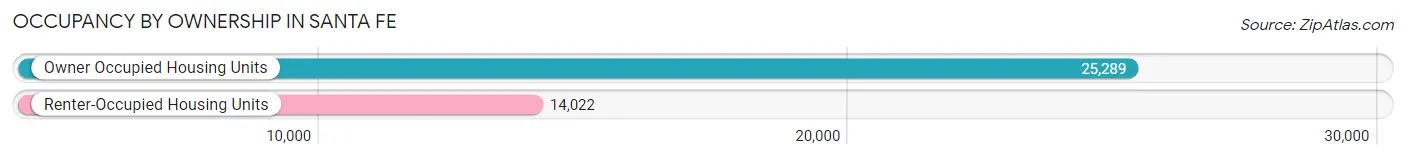
| Occupancy | # Housing Units | % Housing Units |
| Owner Occupied Housing Units | 25,289 | 64.3% |
| Renter-Occupied Housing Units | 14,022 | 35.7% |
| Total Occupied Housing Units | 39,311 | 100.0% |
Occupancy by Household Size in Santa Fe
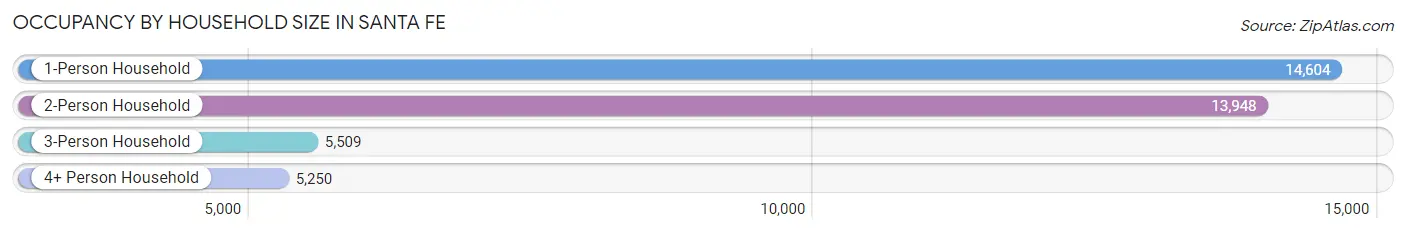
| Household Size | # Housing Units | % Housing Units |
| 1-Person Household | 14,604 | 37.1% |
| 2-Person Household | 13,948 | 35.5% |
| 3-Person Household | 5,509 | 14.0% |
| 4+ Person Household | 5,250 | 13.4% |
| Total Housing Units | 39,311 | 100.0% |
Occupancy by Ownership by Household Size in Santa Fe
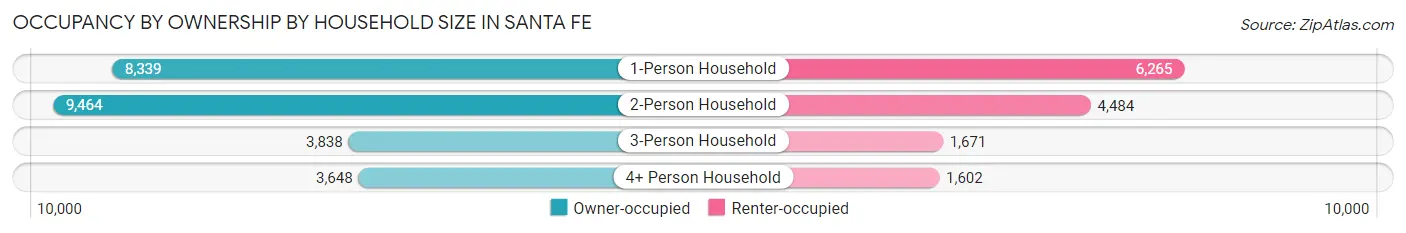
| Household Size | Owner-occupied | Renter-occupied |
| 1-Person Household | 8,339 (57.1%) | 6,265 (42.9%) |
| 2-Person Household | 9,464 (67.8%) | 4,484 (32.2%) |
| 3-Person Household | 3,838 (69.7%) | 1,671 (30.3%) |
| 4+ Person Household | 3,648 (69.5%) | 1,602 (30.5%) |
| Total Housing Units | 25,289 (64.3%) | 14,022 (35.7%) |
Occupancy by Educational Attainment in Santa Fe
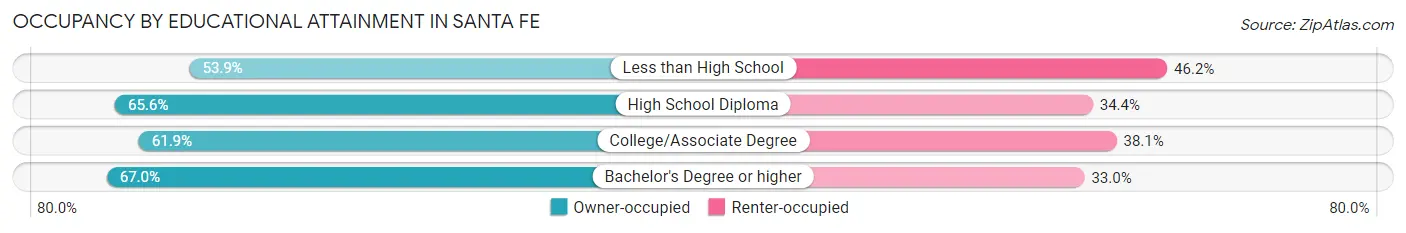
| Household Size | Owner-occupied | Renter-occupied |
| Less than High School | 1,736 (53.8%) | 1,488 (46.2%) |
| High School Diploma | 4,362 (65.6%) | 2,283 (34.4%) |
| College/Associate Degree | 6,370 (61.9%) | 3,925 (38.1%) |
| Bachelor's Degree or higher | 12,821 (67.0%) | 6,326 (33.0%) |
Occupancy by Age of Householder in Santa Fe
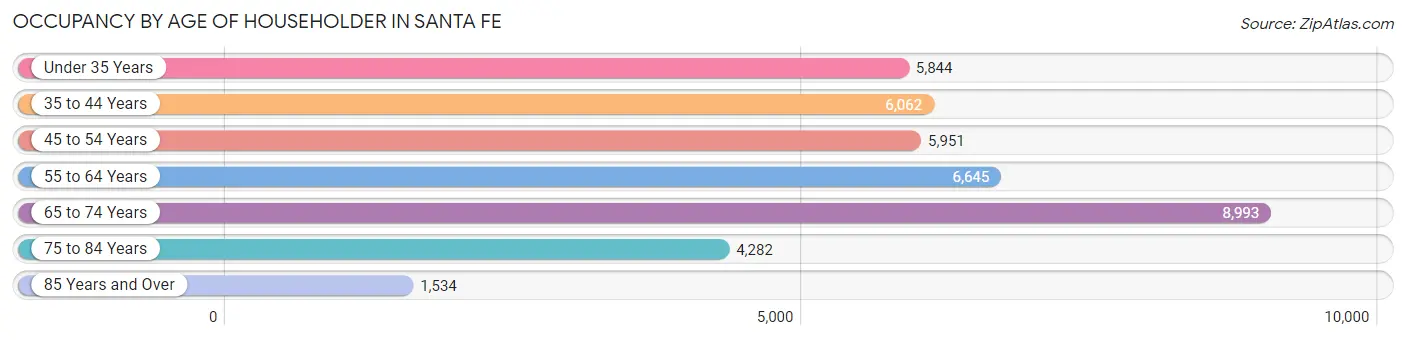
| Age Bracket | # Households | % Households |
| Under 35 Years | 5,844 | 14.9% |
| 35 to 44 Years | 6,062 | 15.4% |
| 45 to 54 Years | 5,951 | 15.1% |
| 55 to 64 Years | 6,645 | 16.9% |
| 65 to 74 Years | 8,993 | 22.9% |
| 75 to 84 Years | 4,282 | 10.9% |
| 85 Years and Over | 1,534 | 3.9% |
| Total | 39,311 | 100.0% |
Housing Finances in Santa Fe
Median Income by Occupancy in Santa Fe
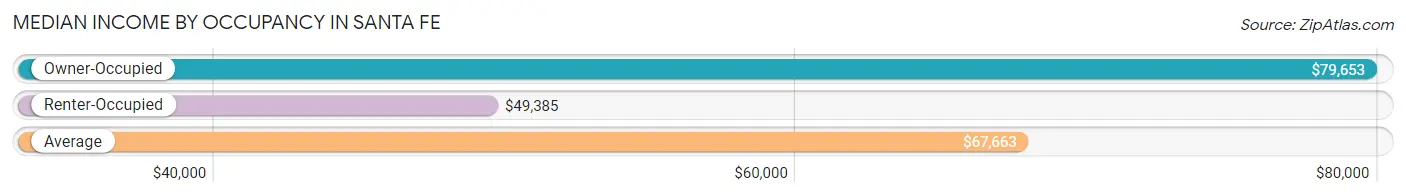
| Occupancy Type | # Households | Median Income |
| Owner-Occupied | 25,289 (64.3%) | $79,653 |
| Renter-Occupied | 14,022 (35.7%) | $49,385 |
| Average | 39,311 (100.0%) | $67,663 |
Occupancy by Householder Income Bracket in Santa Fe
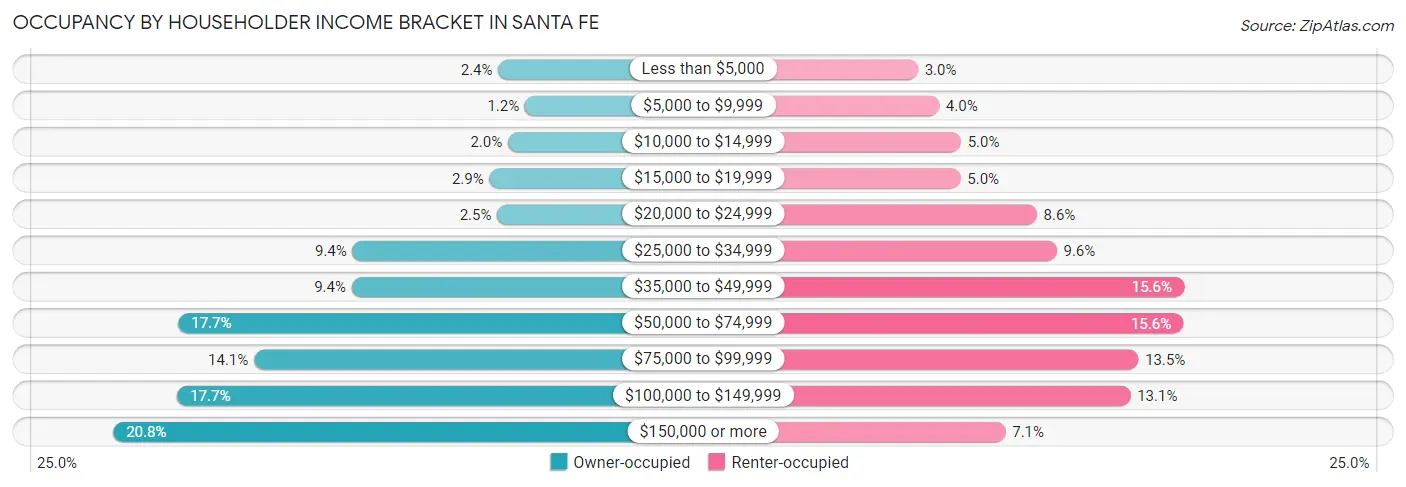
| Income Bracket | Owner-occupied | Renter-occupied |
| Less than $5,000 | 618 (2.4%) | 415 (3.0%) |
| $5,000 to $9,999 | 296 (1.2%) | 556 (4.0%) |
| $10,000 to $14,999 | 500 (2.0%) | 702 (5.0%) |
| $15,000 to $19,999 | 724 (2.9%) | 700 (5.0%) |
| $20,000 to $24,999 | 629 (2.5%) | 1,208 (8.6%) |
| $25,000 to $34,999 | 2,372 (9.4%) | 1,342 (9.6%) |
| $35,000 to $49,999 | 2,381 (9.4%) | 2,191 (15.6%) |
| $50,000 to $74,999 | 4,470 (17.7%) | 2,186 (15.6%) |
| $75,000 to $99,999 | 3,559 (14.1%) | 1,888 (13.5%) |
| $100,000 to $149,999 | 4,484 (17.7%) | 1,834 (13.1%) |
| $150,000 or more | 5,256 (20.8%) | 1,000 (7.1%) |
| Total | 25,289 (100.0%) | 14,022 (100.0%) |
Monthly Housing Cost Tiers in Santa Fe
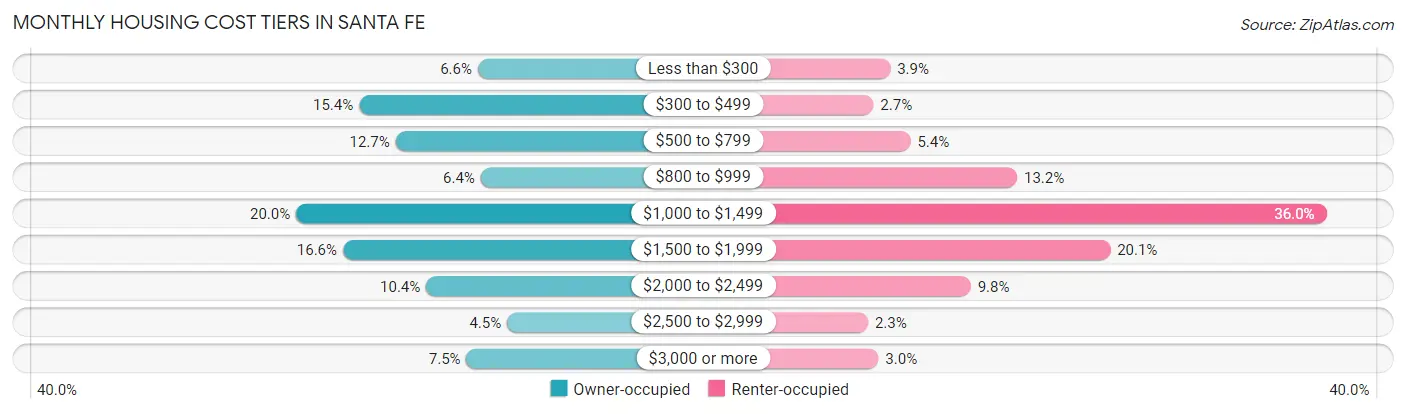
| Monthly Cost | Owner-occupied | Renter-occupied |
| Less than $300 | 1,673 (6.6%) | 546 (3.9%) |
| $300 to $499 | 3,886 (15.4%) | 372 (2.6%) |
| $500 to $799 | 3,207 (12.7%) | 754 (5.4%) |
| $800 to $999 | 1,621 (6.4%) | 1,855 (13.2%) |
| $1,000 to $1,499 | 5,060 (20.0%) | 5,049 (36.0%) |
| $1,500 to $1,999 | 4,187 (16.6%) | 2,817 (20.1%) |
| $2,000 to $2,499 | 2,638 (10.4%) | 1,377 (9.8%) |
| $2,500 to $2,999 | 1,131 (4.5%) | 316 (2.2%) |
| $3,000 or more | 1,886 (7.5%) | 423 (3.0%) |
| Total | 25,289 (100.0%) | 14,022 (100.0%) |
Physical Housing Characteristics in Santa Fe
Housing Structures in Santa Fe

| Structure Type | # Housing Units | % Housing Units |
| Single Unit, Detached | 22,955 | 58.4% |
| Single Unit, Attached | 3,885 | 9.9% |
| 2 Unit Apartments | 1,223 | 3.1% |
| 3 or 4 Unit Apartments | 1,986 | 5.1% |
| 5 to 9 Unit Apartments | 1,826 | 4.6% |
| 10 or more Apartments | 3,686 | 9.4% |
| Mobile Home / Other | 3,750 | 9.5% |
| Total | 39,311 | 100.0% |
Housing Structures by Occupancy in Santa Fe
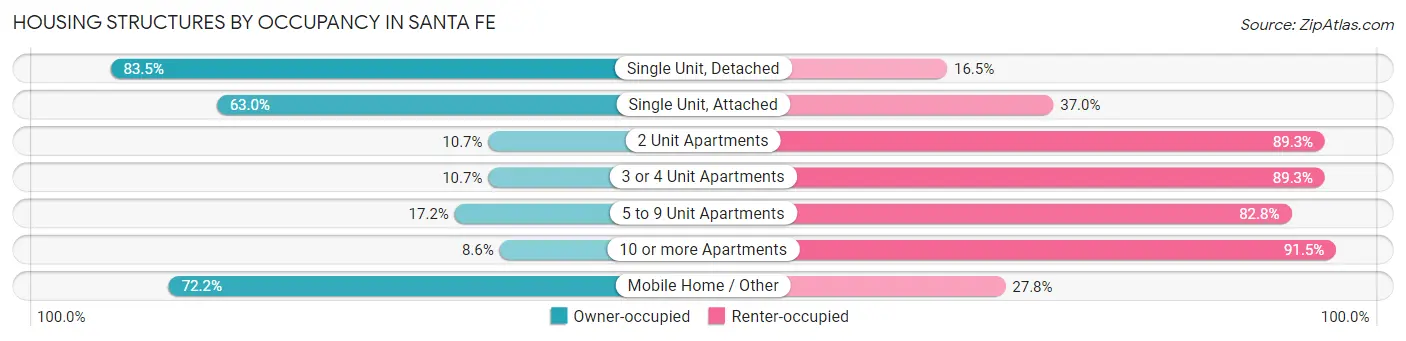
| Structure Type | Owner-occupied | Renter-occupied |
| Single Unit, Detached | 19,159 (83.5%) | 3,796 (16.5%) |
| Single Unit, Attached | 2,448 (63.0%) | 1,437 (37.0%) |
| 2 Unit Apartments | 131 (10.7%) | 1,092 (89.3%) |
| 3 or 4 Unit Apartments | 213 (10.7%) | 1,773 (89.3%) |
| 5 to 9 Unit Apartments | 314 (17.2%) | 1,512 (82.8%) |
| 10 or more Apartments | 315 (8.6%) | 3,371 (91.4%) |
| Mobile Home / Other | 2,709 (72.2%) | 1,041 (27.8%) |
| Total | 25,289 (64.3%) | 14,022 (35.7%) |
Housing Structures by Number of Rooms in Santa Fe
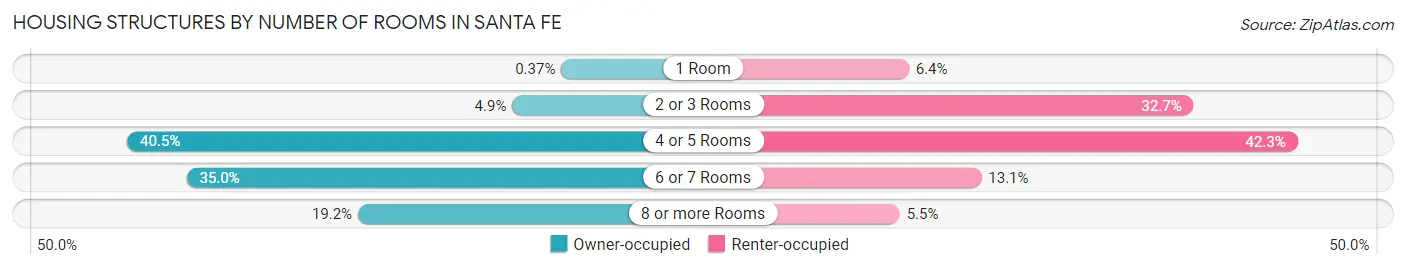
| Number of Rooms | Owner-occupied | Renter-occupied |
| 1 Room | 94 (0.4%) | 893 (6.4%) |
| 2 or 3 Rooms | 1,238 (4.9%) | 4,585 (32.7%) |
| 4 or 5 Rooms | 10,248 (40.5%) | 5,934 (42.3%) |
| 6 or 7 Rooms | 8,860 (35.0%) | 1,834 (13.1%) |
| 8 or more Rooms | 4,849 (19.2%) | 776 (5.5%) |
| Total | 25,289 (100.0%) | 14,022 (100.0%) |
Housing Structure by Heating Type in Santa Fe
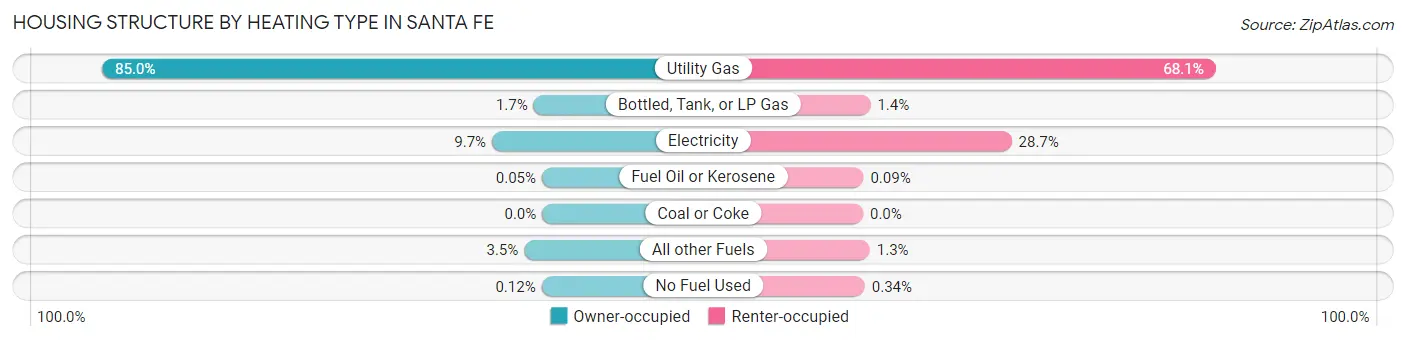
| Heating Type | Owner-occupied | Renter-occupied |
| Utility Gas | 21,497 (85.0%) | 9,549 (68.1%) |
| Bottled, Tank, or LP Gas | 419 (1.7%) | 201 (1.4%) |
| Electricity | 2,453 (9.7%) | 4,026 (28.7%) |
| Fuel Oil or Kerosene | 13 (0.1%) | 13 (0.1%) |
| Coal or Coke | 0 (0.0%) | 0 (0.0%) |
| All other Fuels | 877 (3.5%) | 185 (1.3%) |
| No Fuel Used | 30 (0.1%) | 48 (0.3%) |
| Total | 25,289 (100.0%) | 14,022 (100.0%) |
Household Vehicle Usage in Santa Fe
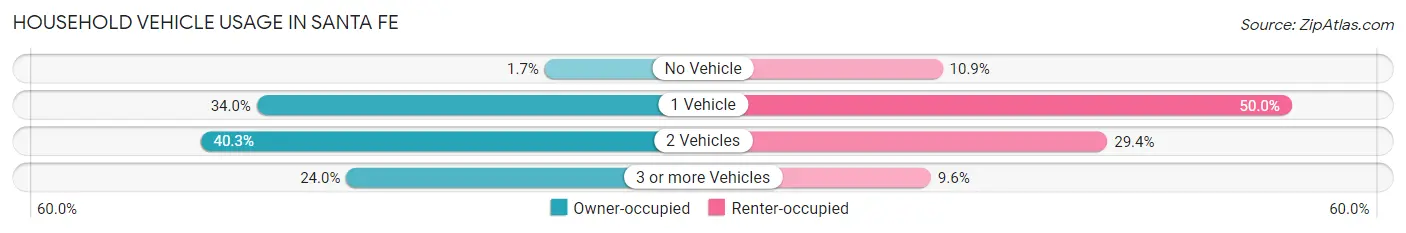
| Vehicles per Household | Owner-occupied | Renter-occupied |
| No Vehicle | 441 (1.7%) | 1,534 (10.9%) |
| 1 Vehicle | 8,597 (34.0%) | 7,016 (50.0%) |
| 2 Vehicles | 10,188 (40.3%) | 4,121 (29.4%) |
| 3 or more Vehicles | 6,063 (24.0%) | 1,351 (9.6%) |
| Total | 25,289 (100.0%) | 14,022 (100.0%) |
Real Estate & Mortgages in Santa Fe
Real Estate and Mortgage Overview in Santa Fe
| Characteristic | Without Mortgage | With Mortgage |
| Housing Units | 10,871 | 14,418 |
| Median Property Value | $349,200 | $380,100 |
| Median Household Income | $64,572 | $3,315 |
| Monthly Housing Costs | $501 | $1,727 |
| Real Estate Taxes | $1,835 | $628 |
Property Value by Mortgage Status in Santa Fe
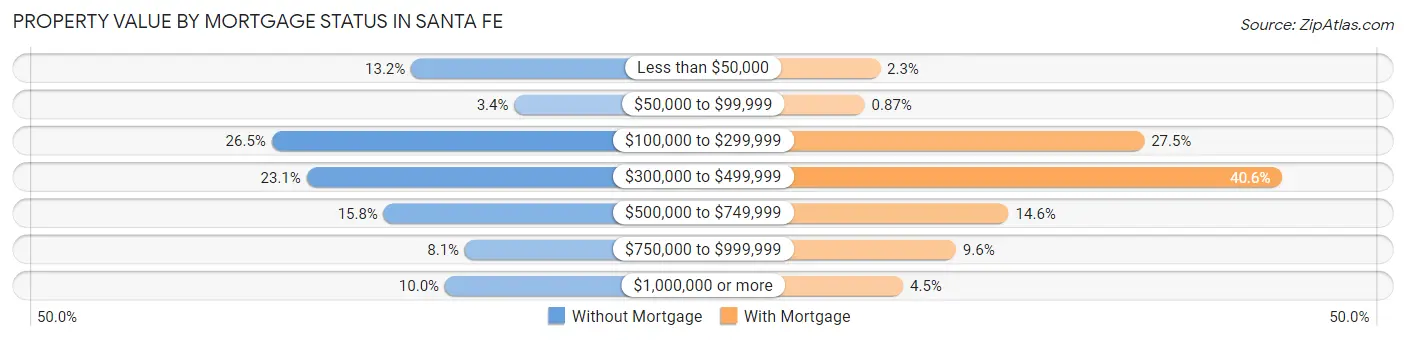
| Property Value | Without Mortgage | With Mortgage |
| Less than $50,000 | 1,434 (13.2%) | 337 (2.3%) |
| $50,000 to $99,999 | 365 (3.4%) | 126 (0.9%) |
| $100,000 to $299,999 | 2,878 (26.5%) | 3,963 (27.5%) |
| $300,000 to $499,999 | 2,516 (23.1%) | 5,859 (40.6%) |
| $500,000 to $749,999 | 1,718 (15.8%) | 2,102 (14.6%) |
| $750,000 to $999,999 | 876 (8.1%) | 1,378 (9.6%) |
| $1,000,000 or more | 1,084 (10.0%) | 653 (4.5%) |
| Total | 10,871 (100.0%) | 14,418 (100.0%) |
Household Income by Mortgage Status in Santa Fe
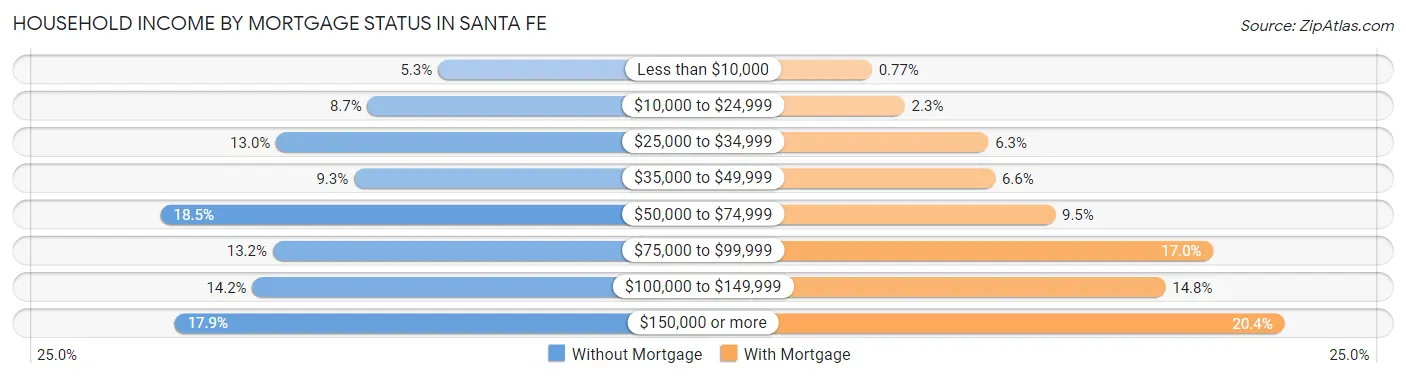
| Household Income | Without Mortgage | With Mortgage |
| Less than $10,000 | 577 (5.3%) | 111 (0.8%) |
| $10,000 to $24,999 | 942 (8.7%) | 337 (2.3%) |
| $25,000 to $34,999 | 1,415 (13.0%) | 911 (6.3%) |
| $35,000 to $49,999 | 1,012 (9.3%) | 957 (6.6%) |
| $50,000 to $74,999 | 2,013 (18.5%) | 1,369 (9.5%) |
| $75,000 to $99,999 | 1,433 (13.2%) | 2,457 (17.0%) |
| $100,000 to $149,999 | 1,538 (14.1%) | 2,126 (14.7%) |
| $150,000 or more | 1,941 (17.8%) | 2,946 (20.4%) |
| Total | 10,871 (100.0%) | 14,418 (100.0%) |
Property Value to Household Income Ratio in Santa Fe
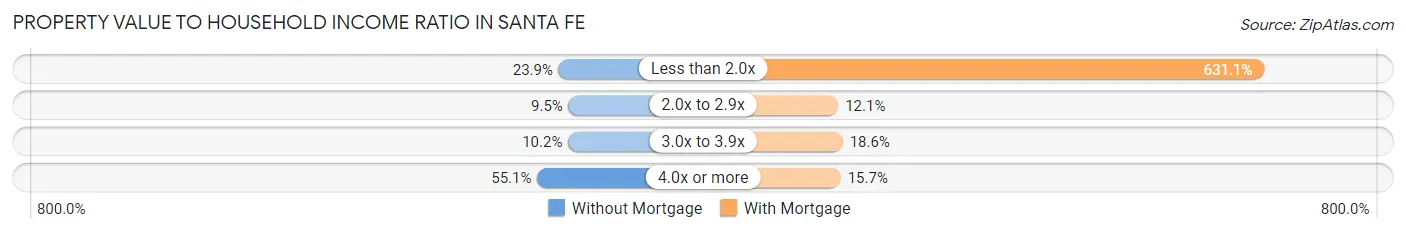
| Value-to-Income Ratio | Without Mortgage | With Mortgage |
| Less than 2.0x | 2,595 (23.9%) | 90,991 (631.1%) |
| 2.0x to 2.9x | 1,031 (9.5%) | 1,744 (12.1%) |
| 3.0x to 3.9x | 1,107 (10.2%) | 2,679 (18.6%) |
| 4.0x or more | 5,991 (55.1%) | 2,269 (15.7%) |
| Total | 10,871 (100.0%) | 14,418 (100.0%) |
Real Estate Taxes by Mortgage Status in Santa Fe
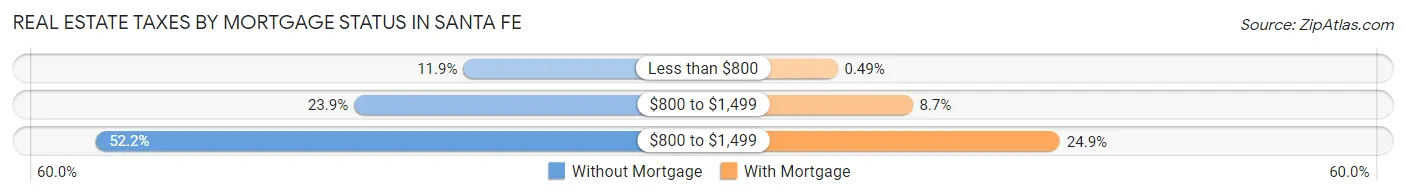
| Property Taxes | Without Mortgage | With Mortgage |
| Less than $800 | 1,297 (11.9%) | 70 (0.5%) |
| $800 to $1,499 | 2,598 (23.9%) | 1,256 (8.7%) |
| $800 to $1,499 | 5,669 (52.1%) | 3,584 (24.9%) |
| Total | 10,871 (100.0%) | 14,418 (100.0%) |
Health & Disability in Santa Fe
Health Insurance Coverage by Age in Santa Fe
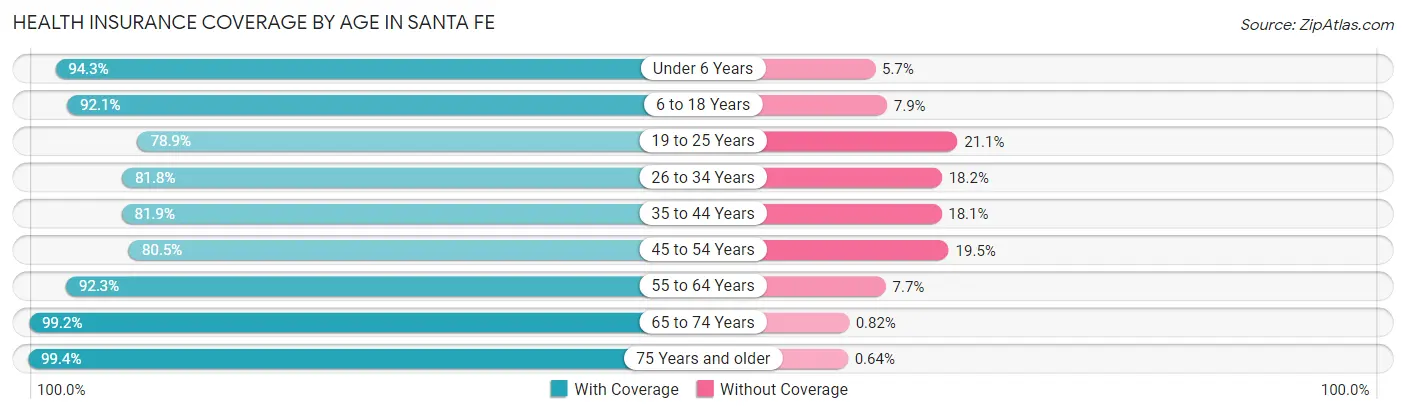
| Age Bracket | With Coverage | Without Coverage |
| Under 6 Years | 3,915 (94.3%) | 238 (5.7%) |
| 6 to 18 Years | 11,117 (92.1%) | 958 (7.9%) |
| 19 to 25 Years | 5,832 (78.9%) | 1,558 (21.1%) |
| 26 to 34 Years | 7,548 (81.8%) | 1,676 (18.2%) |
| 35 to 44 Years | 9,137 (81.9%) | 2,016 (18.1%) |
| 45 to 54 Years | 8,586 (80.5%) | 2,075 (19.5%) |
| 55 to 64 Years | 10,209 (92.3%) | 852 (7.7%) |
| 65 to 74 Years | 13,118 (99.2%) | 109 (0.8%) |
| 75 Years and older | 8,167 (99.4%) | 53 (0.6%) |
| Total | 77,629 (89.1%) | 9,535 (10.9%) |
Health Insurance Coverage by Citizenship Status in Santa Fe
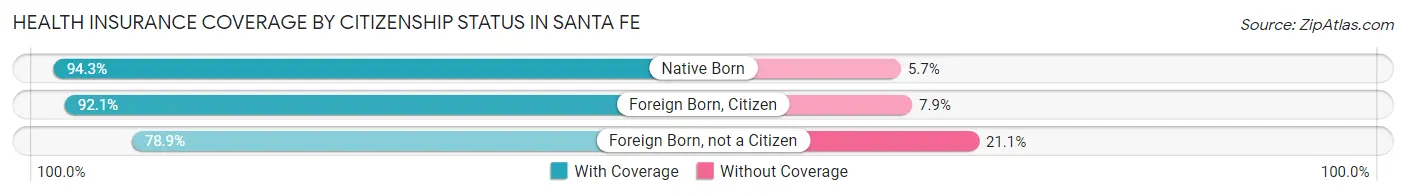
| Citizenship Status | With Coverage | Without Coverage |
| Native Born | 3,915 (94.3%) | 238 (5.7%) |
| Foreign Born, Citizen | 11,117 (92.1%) | 958 (7.9%) |
| Foreign Born, not a Citizen | 5,832 (78.9%) | 1,558 (21.1%) |
Health Insurance Coverage by Household Income in Santa Fe
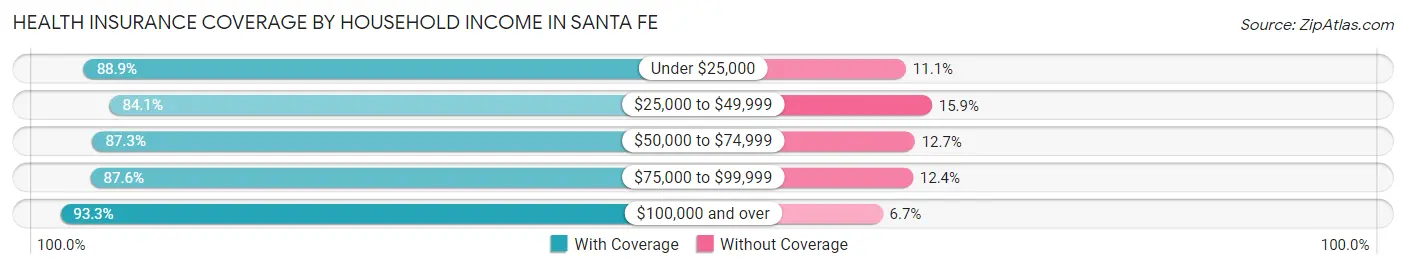
| Household Income | With Coverage | Without Coverage |
| Under $25,000 | 9,598 (88.9%) | 1,196 (11.1%) |
| $25,000 to $49,999 | 13,625 (84.1%) | 2,579 (15.9%) |
| $50,000 to $74,999 | 12,442 (87.3%) | 1,814 (12.7%) |
| $75,000 to $99,999 | 11,859 (87.6%) | 1,675 (12.4%) |
| $100,000 and over | 28,901 (93.3%) | 2,079 (6.7%) |
Public vs Private Health Insurance Coverage by Age in Santa Fe
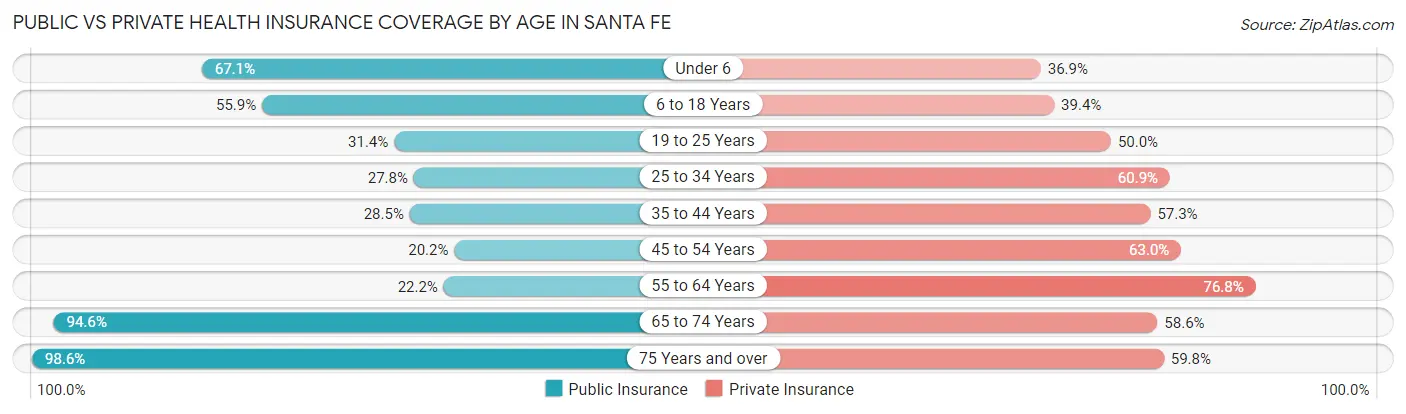
| Age Bracket | Public Insurance | Private Insurance |
| Under 6 | 2,787 (67.1%) | 1,534 (36.9%) |
| 6 to 18 Years | 6,754 (55.9%) | 4,760 (39.4%) |
| 19 to 25 Years | 2,321 (31.4%) | 3,692 (50.0%) |
| 25 to 34 Years | 2,561 (27.8%) | 5,617 (60.9%) |
| 35 to 44 Years | 3,180 (28.5%) | 6,389 (57.3%) |
| 45 to 54 Years | 2,158 (20.2%) | 6,714 (63.0%) |
| 55 to 64 Years | 2,457 (22.2%) | 8,494 (76.8%) |
| 65 to 74 Years | 12,516 (94.6%) | 7,748 (58.6%) |
| 75 Years and over | 8,108 (98.6%) | 4,912 (59.8%) |
| Total | 42,842 (49.1%) | 49,860 (57.2%) |
Disability Status by Sex by Age in Santa Fe
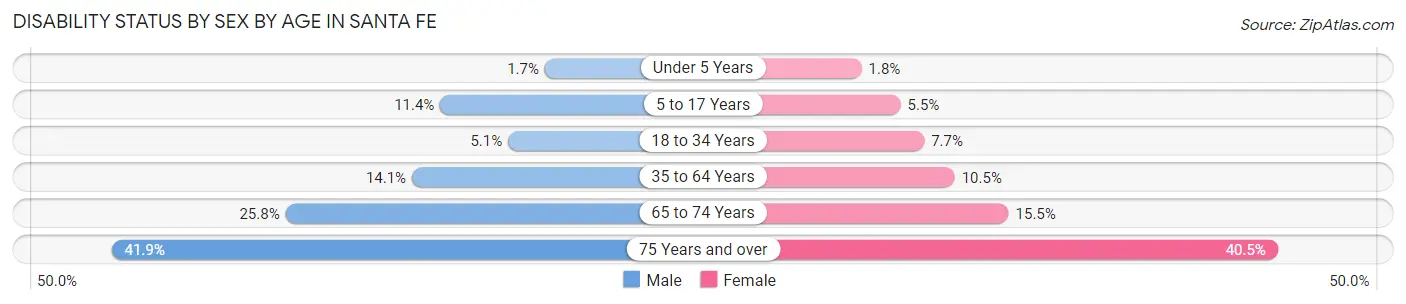
| Age Bracket | Male | Female |
| Under 5 Years | 30 (1.7%) | 32 (1.8%) |
| 5 to 17 Years | 671 (11.4%) | 318 (5.5%) |
| 18 to 34 Years | 443 (5.1%) | 691 (7.6%) |
| 35 to 64 Years | 2,291 (14.1%) | 1,736 (10.5%) |
| 65 to 74 Years | 1,502 (25.8%) | 1,146 (15.5%) |
| 75 Years and over | 1,471 (41.9%) | 1,906 (40.5%) |
Disability Class by Sex by Age in Santa Fe
Disability Class: Hearing Difficulty
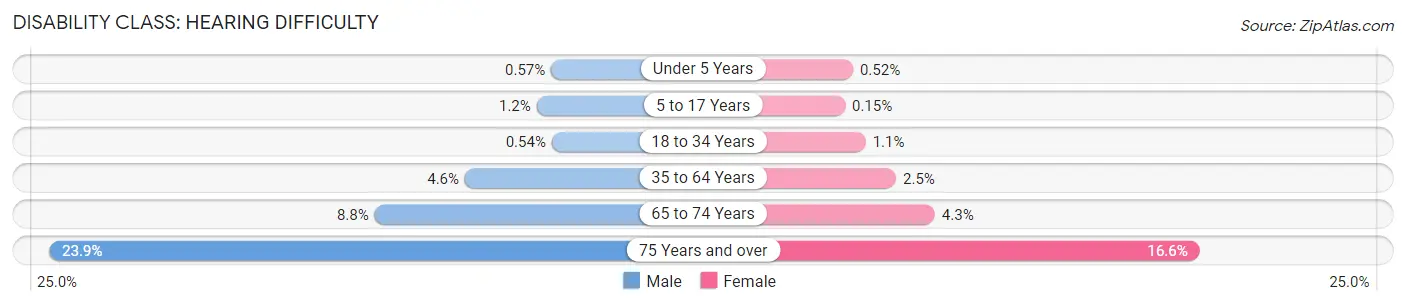
| Age Bracket | Male | Female |
| Under 5 Years | 10 (0.6%) | 9 (0.5%) |
| 5 to 17 Years | 73 (1.2%) | 9 (0.2%) |
| 18 to 34 Years | 47 (0.5%) | 100 (1.1%) |
| 35 to 64 Years | 745 (4.6%) | 418 (2.5%) |
| 65 to 74 Years | 510 (8.8%) | 320 (4.3%) |
| 75 Years and over | 837 (23.9%) | 782 (16.6%) |
Disability Class: Vision Difficulty
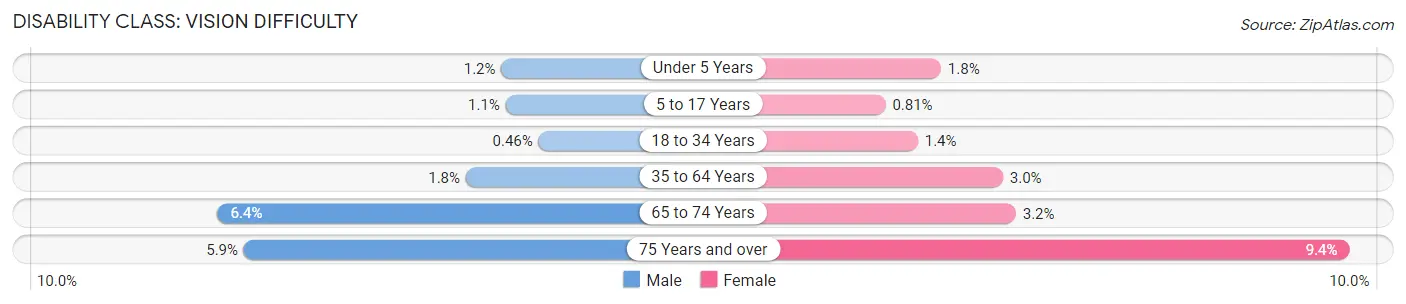
| Age Bracket | Male | Female |
| Under 5 Years | 20 (1.1%) | 32 (1.8%) |
| 5 to 17 Years | 63 (1.1%) | 47 (0.8%) |
| 18 to 34 Years | 40 (0.5%) | 127 (1.4%) |
| 35 to 64 Years | 296 (1.8%) | 495 (3.0%) |
| 65 to 74 Years | 374 (6.4%) | 239 (3.2%) |
| 75 Years and over | 208 (5.9%) | 444 (9.4%) |
Disability Class: Cognitive Difficulty
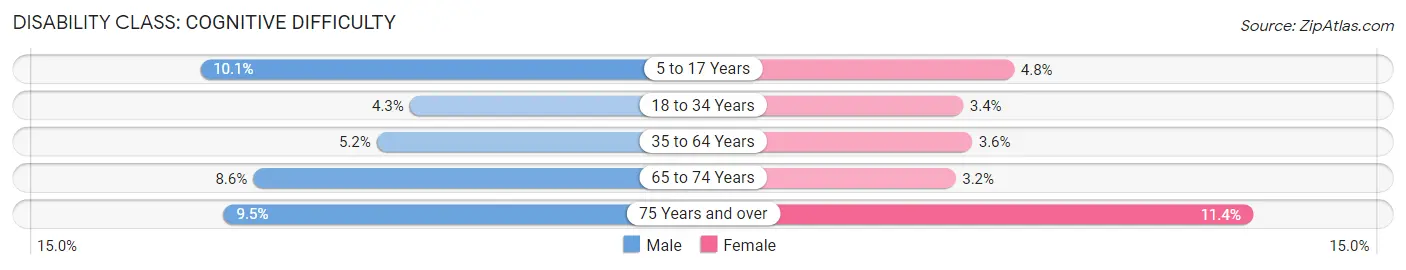
| Age Bracket | Male | Female |
| 5 to 17 Years | 593 (10.1%) | 279 (4.8%) |
| 18 to 34 Years | 369 (4.3%) | 304 (3.4%) |
| 35 to 64 Years | 848 (5.2%) | 600 (3.6%) |
| 65 to 74 Years | 503 (8.6%) | 234 (3.2%) |
| 75 Years and over | 332 (9.5%) | 539 (11.4%) |
Disability Class: Ambulatory Difficulty
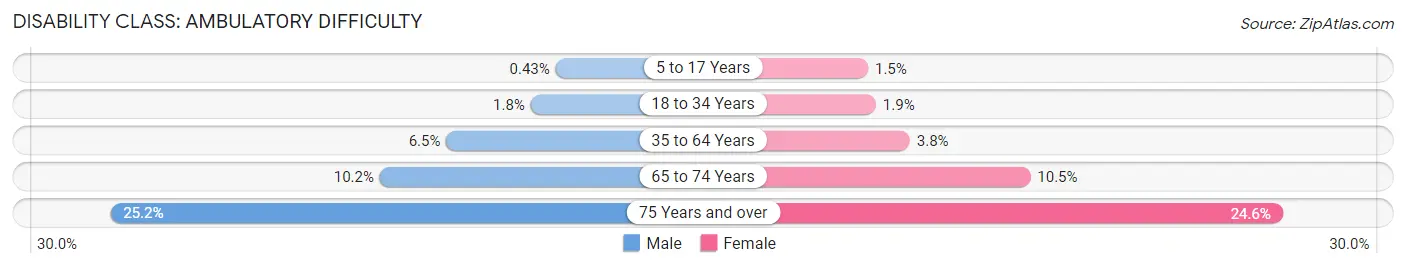
| Age Bracket | Male | Female |
| 5 to 17 Years | 25 (0.4%) | 85 (1.5%) |
| 18 to 34 Years | 157 (1.8%) | 172 (1.9%) |
| 35 to 64 Years | 1,063 (6.5%) | 628 (3.8%) |
| 65 to 74 Years | 595 (10.2%) | 777 (10.5%) |
| 75 Years and over | 885 (25.2%) | 1,157 (24.5%) |
Disability Class: Self-Care Difficulty
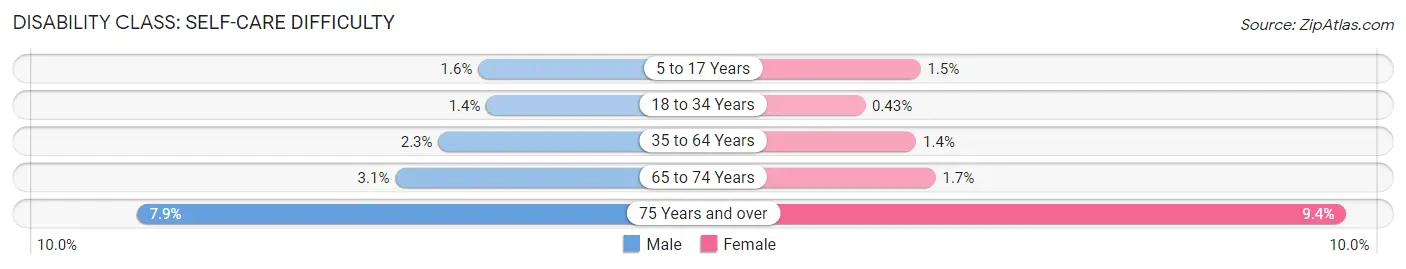
| Age Bracket | Male | Female |
| 5 to 17 Years | 93 (1.6%) | 85 (1.5%) |
| 18 to 34 Years | 123 (1.4%) | 39 (0.4%) |
| 35 to 64 Years | 378 (2.3%) | 228 (1.4%) |
| 65 to 74 Years | 182 (3.1%) | 129 (1.7%) |
| 75 Years and over | 278 (7.9%) | 441 (9.4%) |
Technology Access in Santa Fe
Computing Device Access in Santa Fe
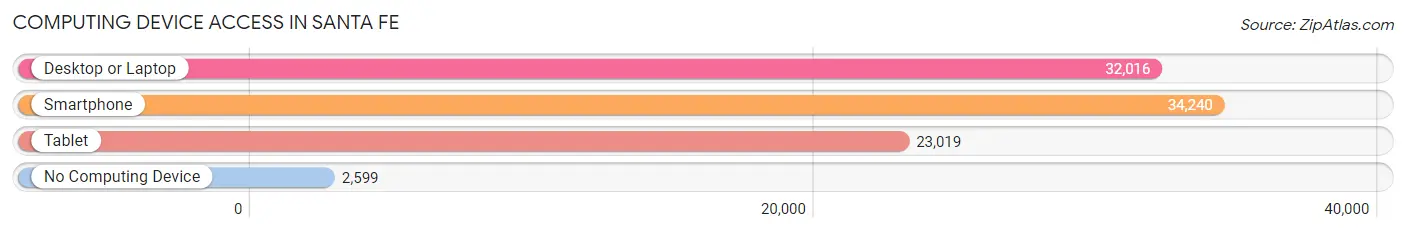
| Device Type | # Households | % Households |
| Desktop or Laptop | 32,016 | 81.4% |
| Smartphone | 34,240 | 87.1% |
| Tablet | 23,019 | 58.6% |
| No Computing Device | 2,599 | 6.6% |
| Total | 39,311 | 100.0% |
Internet Access in Santa Fe
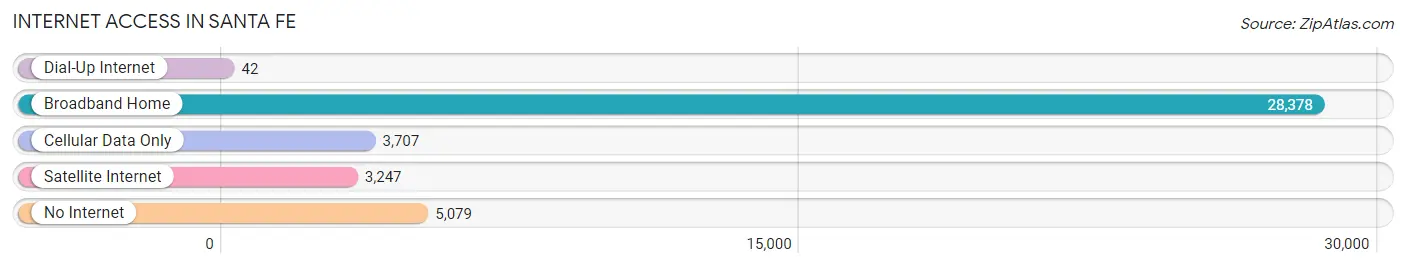
| Internet Type | # Households | % Households |
| Dial-Up Internet | 42 | 0.1% |
| Broadband Home | 28,378 | 72.2% |
| Cellular Data Only | 3,707 | 9.4% |
| Satellite Internet | 3,247 | 8.3% |
| No Internet | 5,079 | 12.9% |
| Total | 39,311 | 100.0% |
Santa Fe Summary
Santa Fe, New Mexico is the capital of the state and the fourth-largest city in the state. It is located in the north-central part of the state, in the foothills of the Sangre de Cristo Mountains. Santa Fe is the oldest capital city in the United States, having been founded in 1610. It is known for its art galleries, museums, and cultural attractions, as well as its unique blend of Native American, Spanish, and Mexican cultures.
Geography
Santa Fe is located in the northern part of New Mexico, in the foothills of the Sangre de Cristo Mountains. The city is situated at an elevation of 7,000 feet above sea level, making it the highest state capital in the United States. The city is surrounded by the Santa Fe National Forest, which covers 1.6 million acres of land. The city is also located near the Rio Grande, which is the longest river in the state.
The city has a total area of 37.3 square miles, of which 36.9 square miles is land and 0.4 square miles is water. The city is located in a semi-arid climate, with hot summers and cold winters. The average annual temperature is 57 degrees Fahrenheit, with an average high of 79 degrees in the summer and an average low of 35 degrees in the winter.
Economy
Santa Fe has a diverse economy, with a mix of government, tourism, and technology sectors. The city is home to several government agencies, including the New Mexico State Capitol, the New Mexico Supreme Court, and the New Mexico State University. The city is also a major tourist destination, with over one million visitors each year. The city is home to several museums, art galleries, and cultural attractions, as well as numerous restaurants and shops.
The city is also home to several technology companies, including Los Alamos National Laboratory, Sandia National Laboratories, and the Santa Fe Institute. The city is also home to several major employers, including the University of New Mexico, Presbyterian Healthcare Services, and the Santa Fe Public Schools.
Demographics
As of the 2010 census, Santa Fe had a population of 67,947. The racial makeup of the city was 73.3% White, 1.2% African American, 1.3% Native American, 0.7% Asian, 0.1% Pacific Islander, 19.2% from other races, and 4.4% from two or more races. Hispanic or Latino of any race were 44.7% of the population.
The median income for a household in the city was $41,919, and the median income for a family was $50,817. The per capita income for the city was $25,945. About 16.2% of families and 20.2% of the population were below the poverty line, including 28.2% of those under age 18 and 8.3% of those age 65 or over.
Santa Fe is a diverse city, with a unique blend of Native American, Spanish, and Mexican cultures. The city is home to several museums, art galleries, and cultural attractions, as well as numerous restaurants and shops. The city is also home to several major employers, including the University of New Mexico, Presbyterian Healthcare Services, and the Santa Fe Public Schools. Santa Fe is a vibrant city with a rich history and culture, and a strong economy.
Common Questions
What is Per Capita Income in Santa Fe?
Per Capita income in Santa Fe is $44,359.
What is the Median Family Income in Santa Fe?
Median Family Income in Santa Fe is $78,882.
What is the Median Household income in Santa Fe?
Median Household Income in Santa Fe is $67,663.
What is Income or Wage Gap in Santa Fe?
Income or Wage Gap in Santa Fe is 24.2%.
Women in Santa Fe earn 75.8 cents for every dollar earned by a man.
What is Family Income Deficit in Santa Fe?
Family Income Deficit in Santa Fe is $9,674.
Families that are below poverty line in Santa Fe earn $9,674 less on average than the poverty threshold level.
What is Inequality or Gini Index in Santa Fe?
Inequality or Gini Index in Santa Fe is 0.48.
What is the Total Population of Santa Fe?
Total Population of Santa Fe is 87,617.
What is the Total Male Population of Santa Fe?
Total Male Population of Santa Fe is 42,226.
What is the Total Female Population of Santa Fe?
Total Female Population of Santa Fe is 45,391.
What is the Ratio of Males per 100 Females in Santa Fe?
There are 93.03 Males per 100 Females in Santa Fe.
What is the Ratio of Females per 100 Males in Santa Fe?
There are 107.50 Females per 100 Males in Santa Fe.
What is the Median Population Age in Santa Fe?
Median Population Age in Santa Fe is 44.5 Years.
What is the Average Family Size in Santa Fe
Average Family Size in Santa Fe is 2.9 People.
What is the Average Household Size in Santa Fe
Average Household Size in Santa Fe is 2.2 People.
How Large is the Labor Force in Santa Fe?
There are 45,477 People in the Labor Forcein in Santa Fe.
What is the Percentage of People in the Labor Force in Santa Fe?
61.1% of People are in the Labor Force in Santa Fe.
What is the Unemployment Rate in Santa Fe?
Unemployment Rate in Santa Fe is 5.3%.