Winchendon, MA Map & Demographics
Winchendon Map
Winchendon Overview
$34,283
PER CAPITA INCOME
$65,236
AVG FAMILY INCOME
$56,042
AVG HOUSEHOLD INCOME
7.4%
WAGE / INCOME GAP [ % ]
92.6¢/ $1
WAGE / INCOME GAP [ $ ]
0.49
INEQUALITY / GINI INDEX
4,461
TOTAL POPULATION
2,209
MALE POPULATION
2,252
FEMALE POPULATION
98.09
MALES / 100 FEMALES
101.95
FEMALES / 100 MALES
33.7
MEDIAN AGE
3.0
AVG FAMILY SIZE
2.8
AVG HOUSEHOLD SIZE
2,204
LABOR FORCE [ PEOPLE ]
63.9%
PERCENT IN LABOR FORCE
6.8%
UNEMPLOYMENT RATE
Winchendon Zip Codes
Winchendon Area Codes
Income in Winchendon
Income Overview in Winchendon
Per Capita Income in Winchendon is $34,283, while median incomes of families and households are $65,236 and $56,042 respectively.
| Characteristic | Number | Measure |
| Per Capita Income | 4,461 | $34,283 |
| Median Family Income | 1,227 | $65,236 |
| Mean Family Income | 1,227 | $108,963 |
| Median Household Income | 1,592 | $56,042 |
| Mean Household Income | 1,592 | $95,900 |
| Income Deficit | 1,227 | $0 |
| Wage / Income Gap (%) | 4,461 | 7.43% |
| Wage / Income Gap ($) | 4,461 | 92.57¢ per $1 |
| Gini / Inequality Index | 4,461 | 0.49 |
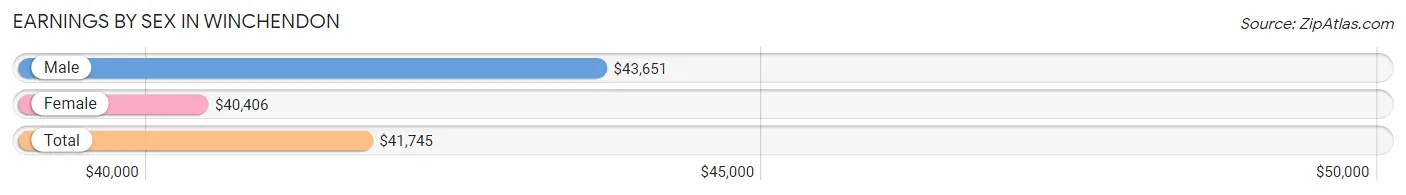
Earnings by Sex in Winchendon
Average Earnings in Winchendon are $41,745, $43,651 for men and $40,406 for women, a difference of 7.4%.
| Sex | Number | Average Earnings |
| Male | 1,164 (51.5%) | $43,651 |
| Female | 1,094 (48.4%) | $40,406 |
| Total | 2,258 (100.0%) | $41,745 |
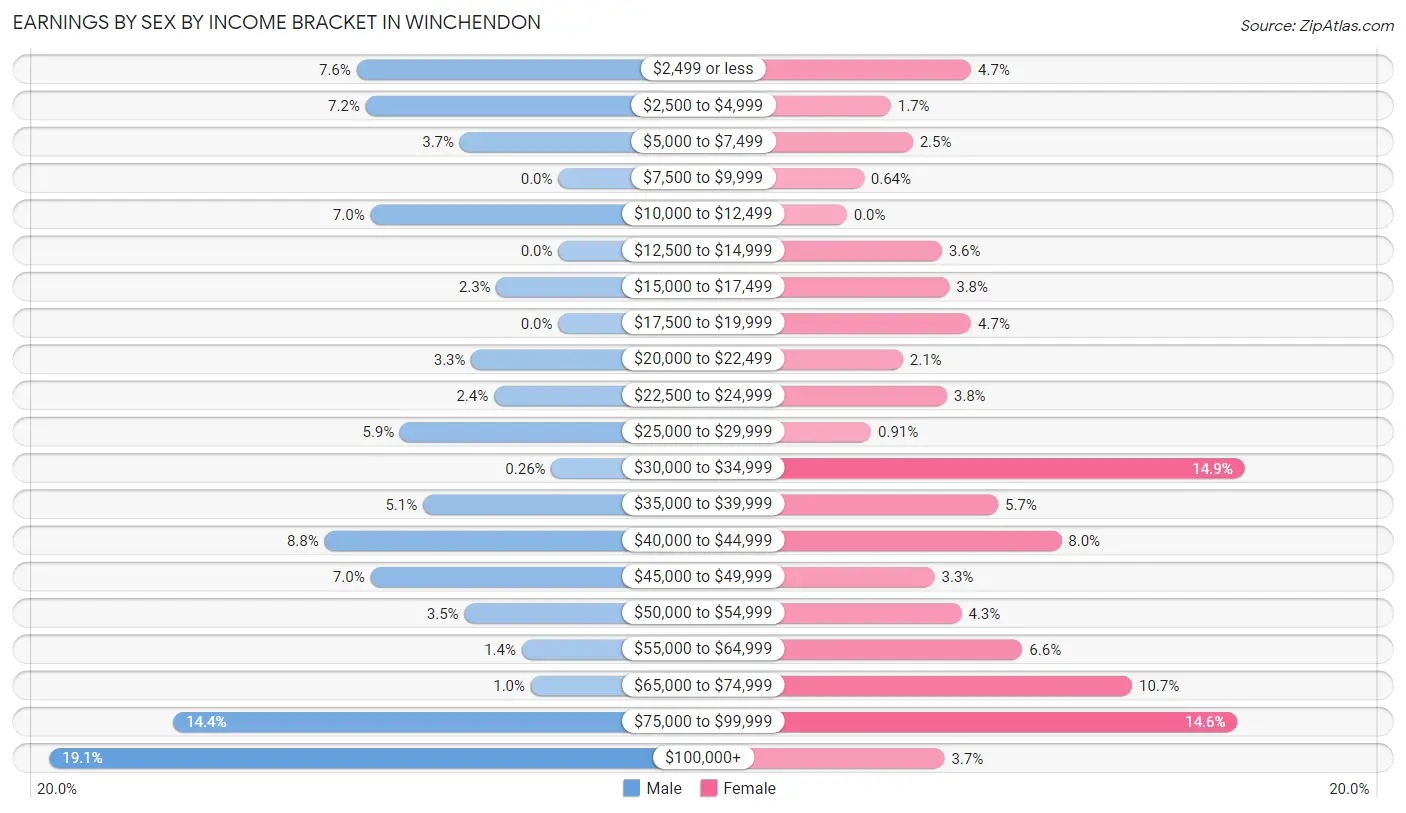
Earnings by Sex by Income Bracket in Winchendon
The most common earnings brackets in Winchendon are $100,000+ for men (222 | 19.1%) and $30,000 to $34,999 for women (163 | 14.9%).
| Income | Male | Female |
| $2,499 or less | 88 (7.6%) | 51 (4.7%) |
| $2,500 to $4,999 | 84 (7.2%) | 18 (1.7%) |
| $5,000 to $7,499 | 43 (3.7%) | 27 (2.5%) |
| $7,500 to $9,999 | 0 (0.0%) | 7 (0.6%) |
| $10,000 to $12,499 | 82 (7.0%) | 0 (0.0%) |
| $12,500 to $14,999 | 0 (0.0%) | 39 (3.6%) |
| $15,000 to $17,499 | 27 (2.3%) | 42 (3.8%) |
| $17,500 to $19,999 | 0 (0.0%) | 51 (4.7%) |
| $20,000 to $22,499 | 38 (3.3%) | 23 (2.1%) |
| $22,500 to $24,999 | 28 (2.4%) | 41 (3.7%) |
| $25,000 to $29,999 | 69 (5.9%) | 10 (0.9%) |
| $30,000 to $34,999 | 3 (0.3%) | 163 (14.9%) |
| $35,000 to $39,999 | 59 (5.1%) | 62 (5.7%) |
| $40,000 to $44,999 | 102 (8.8%) | 88 (8.0%) |
| $45,000 to $49,999 | 82 (7.0%) | 36 (3.3%) |
| $50,000 to $54,999 | 41 (3.5%) | 47 (4.3%) |
| $55,000 to $64,999 | 16 (1.4%) | 72 (6.6%) |
| $65,000 to $74,999 | 12 (1.0%) | 117 (10.7%) |
| $75,000 to $99,999 | 168 (14.4%) | 160 (14.6%) |
| $100,000+ | 222 (19.1%) | 40 (3.7%) |
| Total | 1,164 (100.0%) | 1,094 (100.0%) |
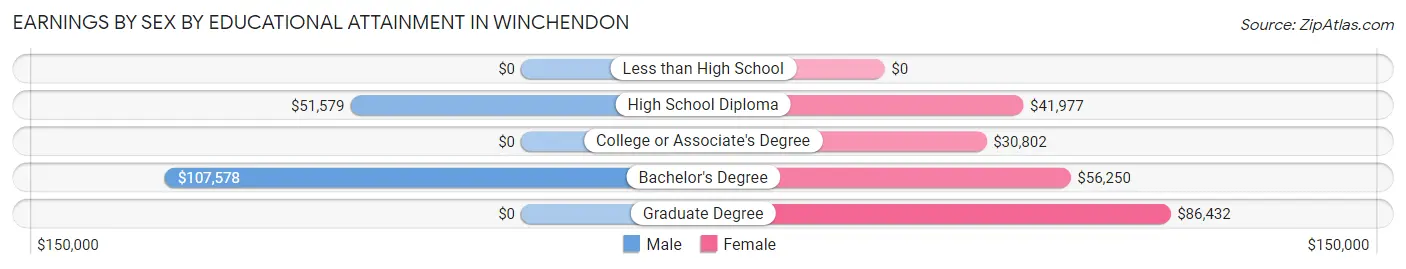
Earnings by Sex by Educational Attainment in Winchendon
Average earnings in Winchendon are $46,612 for men and $41,609 for women, a difference of 10.7%. Men with an educational attainment of bachelor's degree enjoy the highest average annual earnings of $107,578, while those with high school diploma education earn the least with $51,579. Women with an educational attainment of graduate degree earn the most with the average annual earnings of $86,432, while those with college or associate's degree education have the smallest earnings of $30,802.
| Educational Attainment | Male Income | Female Income |
| Less than High School | - | - |
| High School Diploma | $51,579 | $41,977 |
| College or Associate's Degree | - | - |
| Bachelor's Degree | $107,578 | $56,250 |
| Graduate Degree | - | - |
| Total | $46,612 | $41,609 |
Family Income in Winchendon
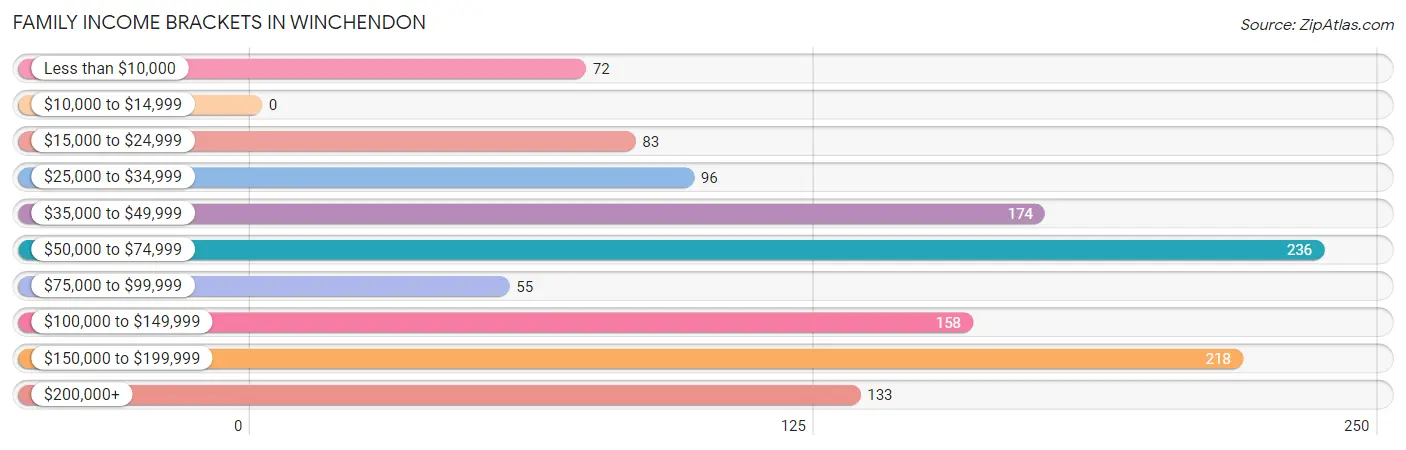
Family Income Brackets in Winchendon
According to the Winchendon family income data, there are 236 families falling into the $50,000 to $74,999 income range, which is the most common income bracket and makes up 19.2% of all families.
| Income Bracket | # Families | % Families |
| Less than $10,000 | 72 | 5.9% |
| $10,000 to $14,999 | 0 | 0.0% |
| $15,000 to $24,999 | 83 | 6.8% |
| $25,000 to $34,999 | 96 | 7.8% |
| $35,000 to $49,999 | 174 | 14.2% |
| $50,000 to $74,999 | 236 | 19.2% |
| $75,000 to $99,999 | 55 | 4.5% |
| $100,000 to $149,999 | 158 | 12.9% |
| $150,000 to $199,999 | 218 | 17.8% |
| $200,000+ | 133 | 10.8% |
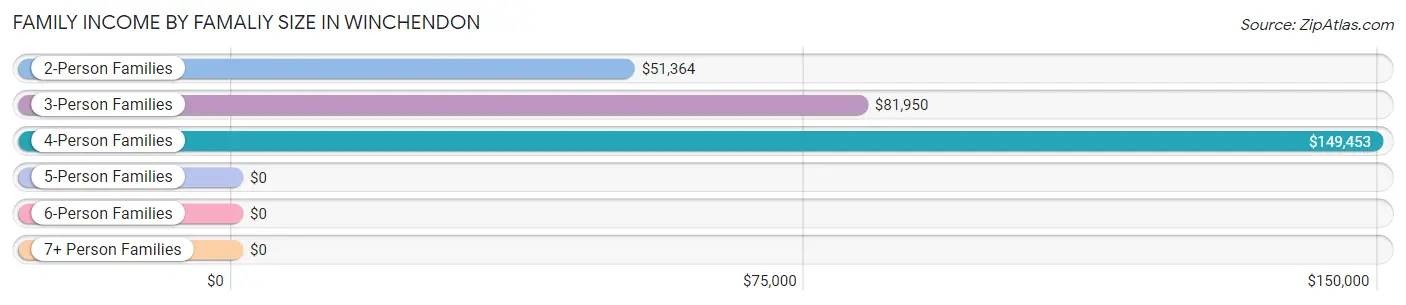
Family Income by Famaliy Size in Winchendon
4-person families (266 | 21.7%) account for the highest median family income in Winchendon with $149,453 per family, while 4-person families (266 | 21.7%) have the highest median income of $37,363 per family member.
| Income Bracket | # Families | Median Income |
| 2-Person Families | 438 (35.7%) | $51,364 |
| 3-Person Families | 411 (33.5%) | $81,950 |
| 4-Person Families | 266 (21.7%) | $149,453 |
| 5-Person Families | 56 (4.6%) | $0 |
| 6-Person Families | 56 (4.6%) | $0 |
| 7+ Person Families | 0 (0.0%) | $0 |
| Total | 1,227 (100.0%) | $65,236 |
Family Income by Number of Earners in Winchendon
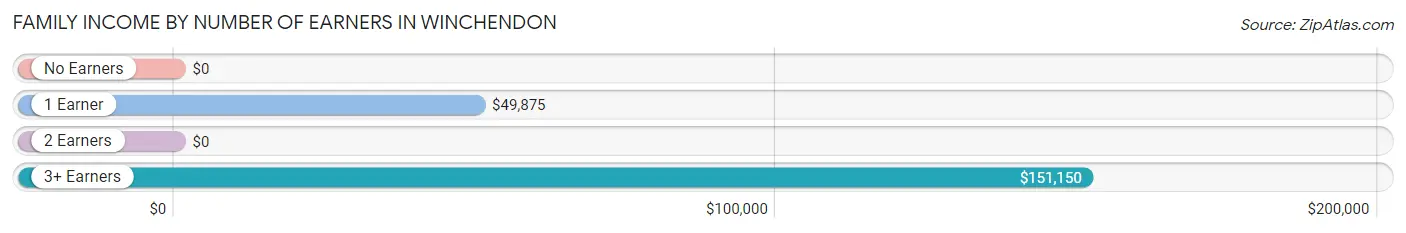
| Number of Earners | # Families | Median Income |
| No Earners | 159 (13.0%) | $0 |
| 1 Earner | 413 (33.7%) | $49,875 |
| 2 Earners | 513 (41.8%) | $0 |
| 3+ Earners | 142 (11.6%) | $151,150 |
| Total | 1,227 (100.0%) | $65,236 |
Household Income in Winchendon
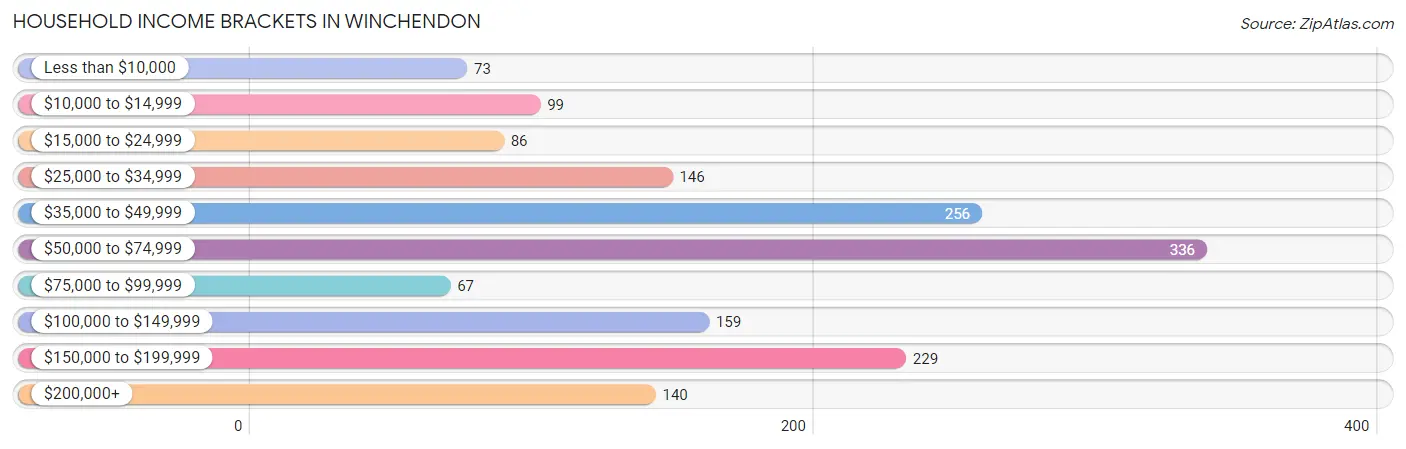
Household Income Brackets in Winchendon
With 336 households falling in the category, the $50,000 to $74,999 income range is the most frequent in Winchendon, accounting for 21.1% of all households. In contrast, only 67 households (4.2%) fall into the $75,000 to $99,999 income bracket, making it the least populous group.
| Income Bracket | # Households | % Households |
| Less than $10,000 | 73 | 4.6% |
| $10,000 to $14,999 | 99 | 6.2% |
| $15,000 to $24,999 | 86 | 5.4% |
| $25,000 to $34,999 | 146 | 9.2% |
| $35,000 to $49,999 | 256 | 16.1% |
| $50,000 to $74,999 | 336 | 21.1% |
| $75,000 to $99,999 | 67 | 4.2% |
| $100,000 to $149,999 | 159 | 10.0% |
| $150,000 to $199,999 | 229 | 14.4% |
| $200,000+ | 140 | 8.8% |
Household Income by Householder Age in Winchendon
The median household income in Winchendon is $56,042, with the highest median household income of $97,857 found in the 45 to 64 years age bracket for the primary householder. A total of 456 households (28.6%) fall into this category. Meanwhile, the 15 to 24 years age bracket for the primary householder has the lowest median household income of $0, with 53 households (3.3%) in this group.
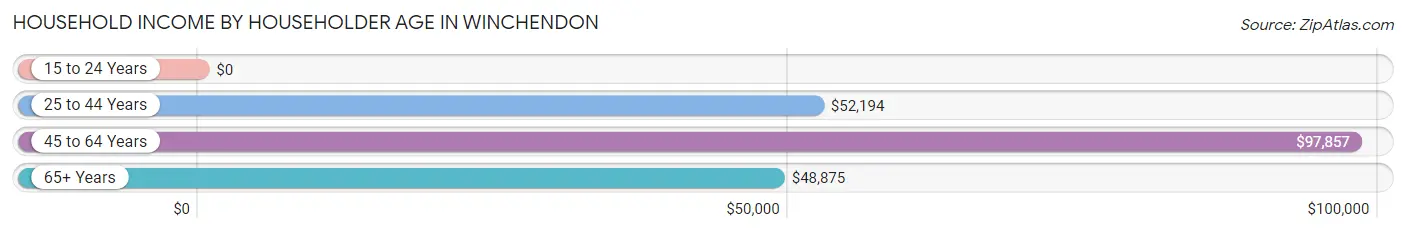
| Income Bracket | # Households | Median Income |
| 15 to 24 Years | 53 (3.3%) | $0 |
| 25 to 44 Years | 688 (43.2%) | $52,194 |
| 45 to 64 Years | 456 (28.6%) | $97,857 |
| 65+ Years | 395 (24.8%) | $48,875 |
| Total | 1,592 (100.0%) | $56,042 |
Poverty in Winchendon
Income Below Poverty by Sex and Age in Winchendon
With 12.6% poverty level for males and 14.7% for females among the residents of Winchendon, 5 year old males and 18 to 24 year old females are the most vulnerable to poverty, with 108 males (72.5%) and 42 females (47.7%) in their respective age groups living below the poverty level.
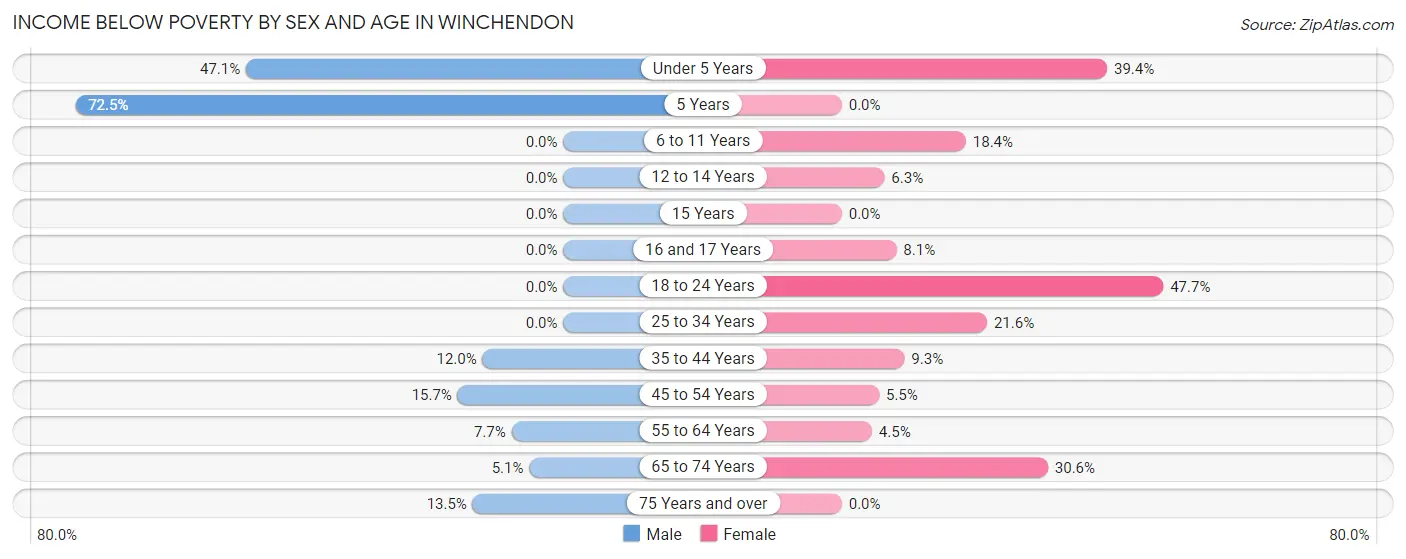
| Age Bracket | Male | Female |
| Under 5 Years | 49 (47.1%) | 39 (39.4%) |
| 5 Years | 108 (72.5%) | 0 (0.0%) |
| 6 to 11 Years | 0 (0.0%) | 35 (18.4%) |
| 12 to 14 Years | 0 (0.0%) | 14 (6.3%) |
| 15 Years | 0 (0.0%) | 0 (0.0%) |
| 16 and 17 Years | 0 (0.0%) | 12 (8.1%) |
| 18 to 24 Years | 0 (0.0%) | 42 (47.7%) |
| 25 to 34 Years | 0 (0.0%) | 94 (21.6%) |
| 35 to 44 Years | 36 (12.0%) | 32 (9.3%) |
| 45 to 54 Years | 32 (15.7%) | 14 (5.5%) |
| 55 to 64 Years | 23 (7.7%) | 8 (4.5%) |
| 65 to 74 Years | 11 (5.1%) | 41 (30.6%) |
| 75 Years and over | 14 (13.5%) | 0 (0.0%) |
| Total | 273 (12.6%) | 331 (14.7%) |
Income Above Poverty by Sex and Age in Winchendon
According to the poverty statistics in Winchendon, males aged 6 to 11 years and females aged 75 years and over are the age groups that are most secure financially, with 100.0% of males and 100.0% of females in these age groups living above the poverty line.
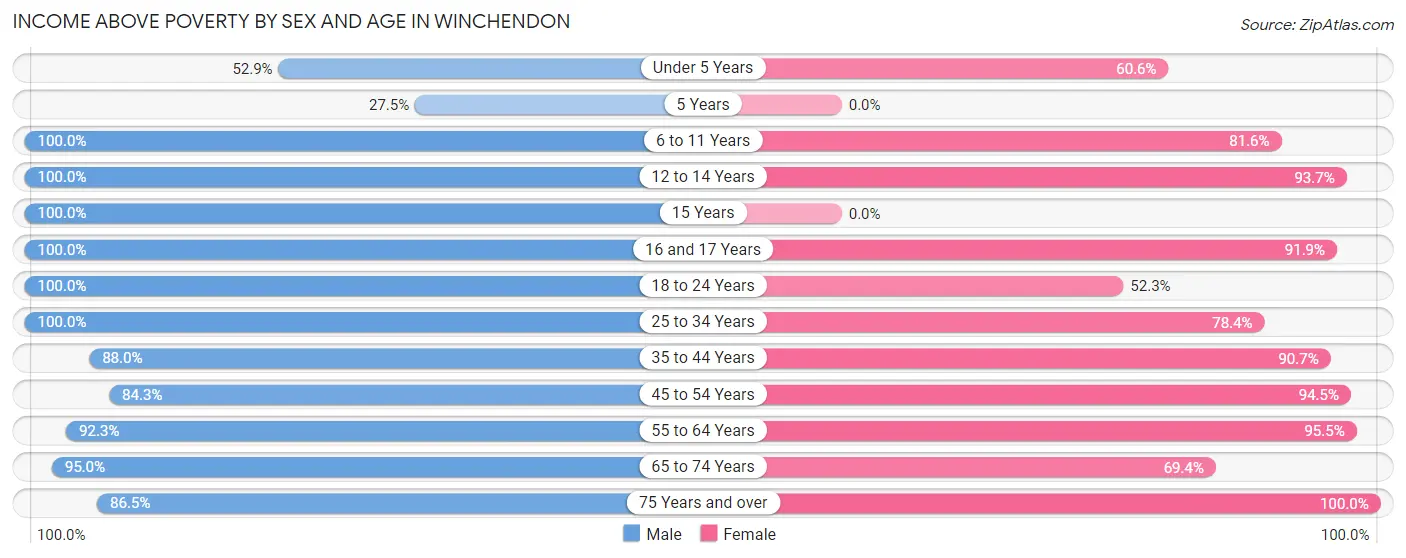
| Age Bracket | Male | Female |
| Under 5 Years | 55 (52.9%) | 60 (60.6%) |
| 5 Years | 41 (27.5%) | 0 (0.0%) |
| 6 to 11 Years | 98 (100.0%) | 155 (81.6%) |
| 12 to 14 Years | 131 (100.0%) | 207 (93.7%) |
| 15 Years | 20 (100.0%) | 0 (0.0%) |
| 16 and 17 Years | 13 (100.0%) | 136 (91.9%) |
| 18 to 24 Years | 207 (100.0%) | 46 (52.3%) |
| 25 to 34 Years | 316 (100.0%) | 342 (78.4%) |
| 35 to 44 Years | 264 (88.0%) | 312 (90.7%) |
| 45 to 54 Years | 172 (84.3%) | 239 (94.5%) |
| 55 to 64 Years | 276 (92.3%) | 171 (95.5%) |
| 65 to 74 Years | 207 (95.0%) | 93 (69.4%) |
| 75 Years and over | 90 (86.5%) | 160 (100.0%) |
| Total | 1,890 (87.4%) | 1,921 (85.3%) |
Income Below Poverty Among Married-Couple Families in Winchendon
The poverty statistics for married-couple families in Winchendon show that 3.8% or 30 of the total 798 families live below the poverty line. Families with 1 or 2 children have the highest poverty rate of 11.1%, comprising of 30 families. On the other hand, families with no children have the lowest poverty rate of 0.0%, which includes 0 families.
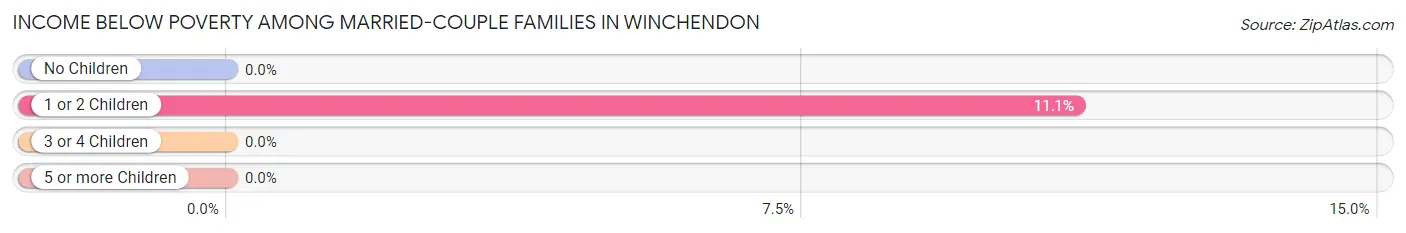
| Children | Above Poverty | Below Poverty |
| No Children | 424 (100.0%) | 0 (0.0%) |
| 1 or 2 Children | 241 (88.9%) | 30 (11.1%) |
| 3 or 4 Children | 103 (100.0%) | 0 (0.0%) |
| 5 or more Children | 0 (0.0%) | 0 (0.0%) |
| Total | 768 (96.2%) | 30 (3.8%) |
Income Below Poverty Among Single-Parent Households in Winchendon
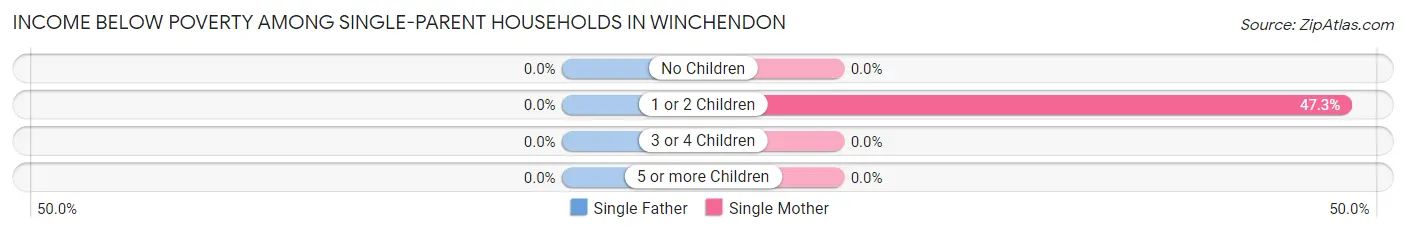
| Children | Single Father | Single Mother |
| No Children | 0 (0.0%) | 0 (0.0%) |
| 1 or 2 Children | 0 (0.0%) | 98 (47.3%) |
| 3 or 4 Children | 0 (0.0%) | 0 (0.0%) |
| 5 or more Children | 0 (0.0%) | 0 (0.0%) |
| Total | 0 (0.0%) | 98 (34.9%) |
Income Below Poverty Among Married-Couple vs Single-Parent Households in Winchendon
The poverty data for Winchendon shows that 30 of the married-couple family households (3.8%) and 98 of the single-parent households (22.8%) are living below the poverty level. Within the married-couple family households, those with 1 or 2 children have the highest poverty rate, with 30 households (11.1%) falling below the poverty line. Among the single-parent households, those with 1 or 2 children have the highest poverty rate, with 98 household (35.8%) living below poverty.
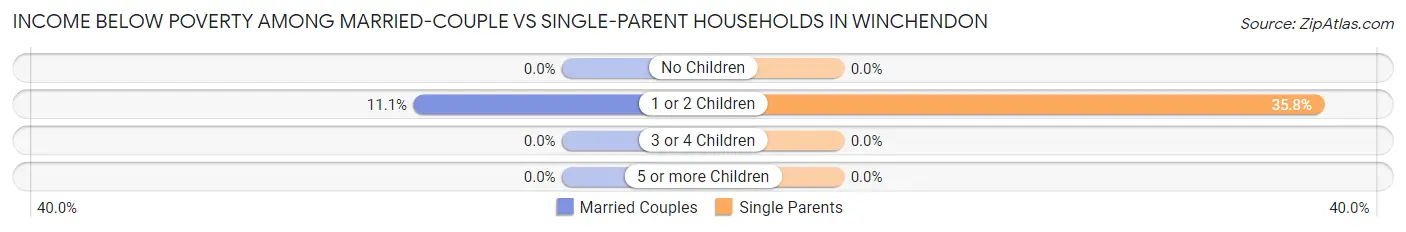
| Children | Married-Couple Families | Single-Parent Households |
| No Children | 0 (0.0%) | 0 (0.0%) |
| 1 or 2 Children | 30 (11.1%) | 98 (35.8%) |
| 3 or 4 Children | 0 (0.0%) | 0 (0.0%) |
| 5 or more Children | 0 (0.0%) | 0 (0.0%) |
| Total | 30 (3.8%) | 98 (22.8%) |
Race in Winchendon
The most populous races in Winchendon are White / Caucasian (3,749 | 84.0%), Asian (361 | 8.1%), and Hispanic or Latino (275 | 6.2%).
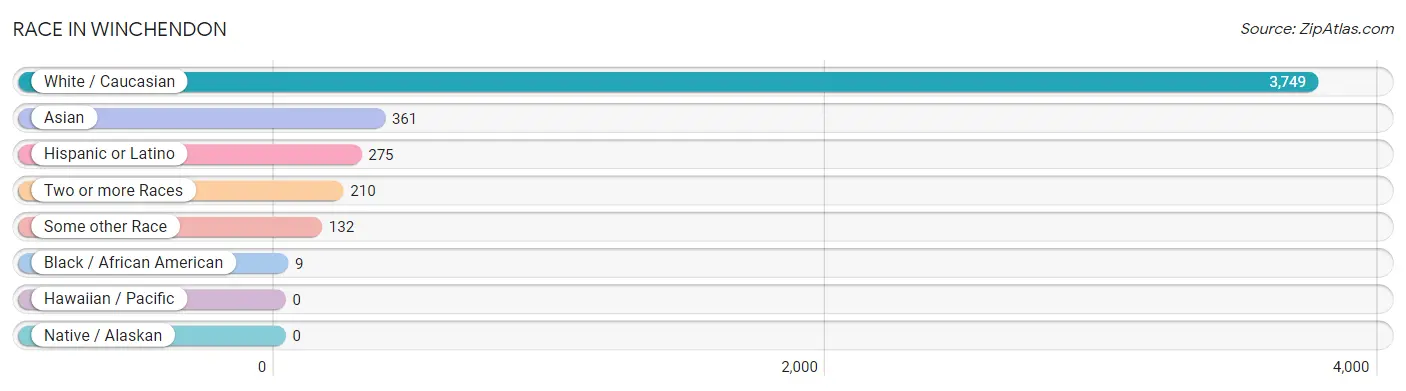
| Race | # Population | % Population |
| Asian | 361 | 8.1% |
| Black / African American | 9 | 0.2% |
| Hawaiian / Pacific | 0 | 0.0% |
| Hispanic or Latino | 275 | 6.2% |
| Native / Alaskan | 0 | 0.0% |
| White / Caucasian | 3,749 | 84.0% |
| Two or more Races | 210 | 4.7% |
| Some other Race | 132 | 3.0% |
| Total | 4,461 | 100.0% |
Ancestry in Winchendon
The most populous ancestries reported in Winchendon are Italian (592 | 13.3%), American (588 | 13.2%), French (460 | 10.3%), Irish (455 | 10.2%), and German (436 | 9.8%), together accounting for 56.7% of all Winchendon residents.
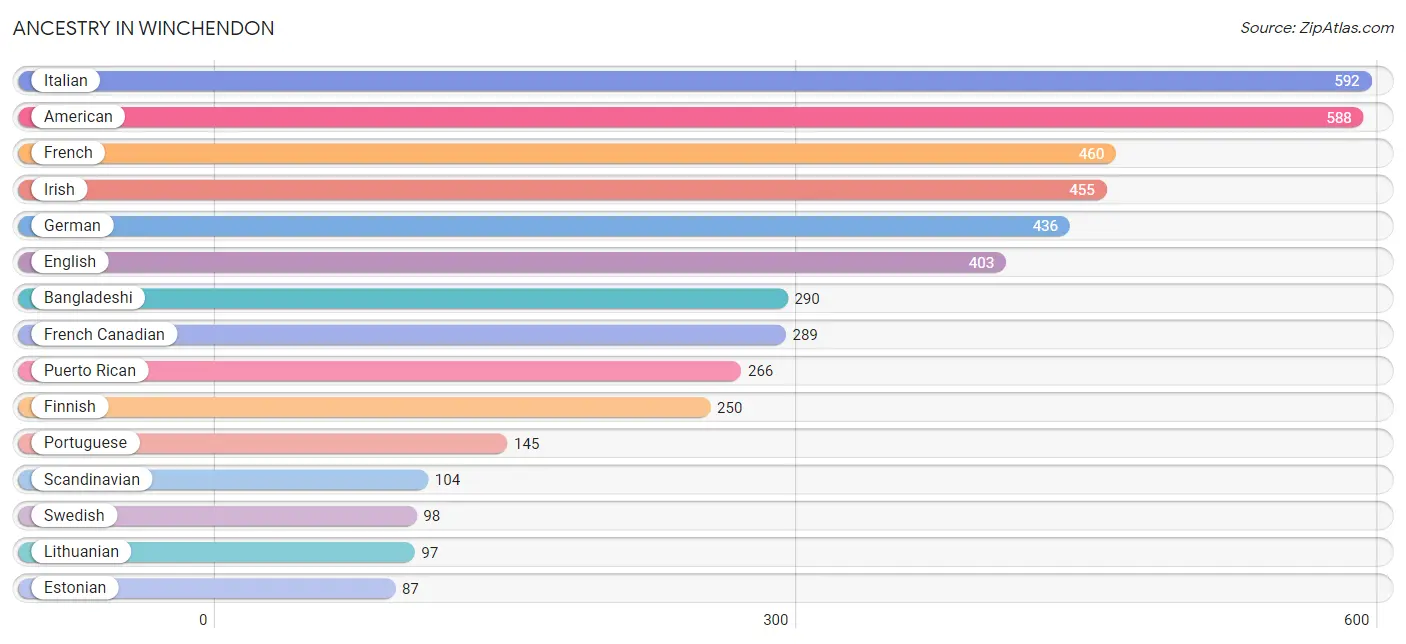
| Ancestry | # Population | % Population |
| American | 588 | 13.2% |
| Arab | 12 | 0.3% |
| Bangladeshi | 290 | 6.5% |
| Burmese | 26 | 0.6% |
| Canadian | 40 | 0.9% |
| Cape Verdean | 85 | 1.9% |
| Dutch | 43 | 1.0% |
| English | 403 | 9.0% |
| Estonian | 87 | 1.9% |
| Finnish | 250 | 5.6% |
| French | 460 | 10.3% |
| French Canadian | 289 | 6.5% |
| German | 436 | 9.8% |
| Greek | 2 | 0.0% |
| Indian (Asian) | 52 | 1.2% |
| Irish | 455 | 10.2% |
| Iroquois | 9 | 0.2% |
| Italian | 592 | 13.3% |
| Lebanese | 12 | 0.3% |
| Lithuanian | 97 | 2.2% |
| Malaysian | 54 | 1.2% |
| Mexican | 9 | 0.2% |
| Norwegian | 16 | 0.4% |
| Polish | 71 | 1.6% |
| Portuguese | 145 | 3.3% |
| Puerto Rican | 266 | 6.0% |
| Scandinavian | 104 | 2.3% |
| Scottish | 70 | 1.6% |
| Serbian | 21 | 0.5% |
| Subsaharan African | 85 | 1.9% |
| Swedish | 98 | 2.2% |
| Ukrainian | 36 | 0.8% | View All 32 Rows |
Immigrants in Winchendon
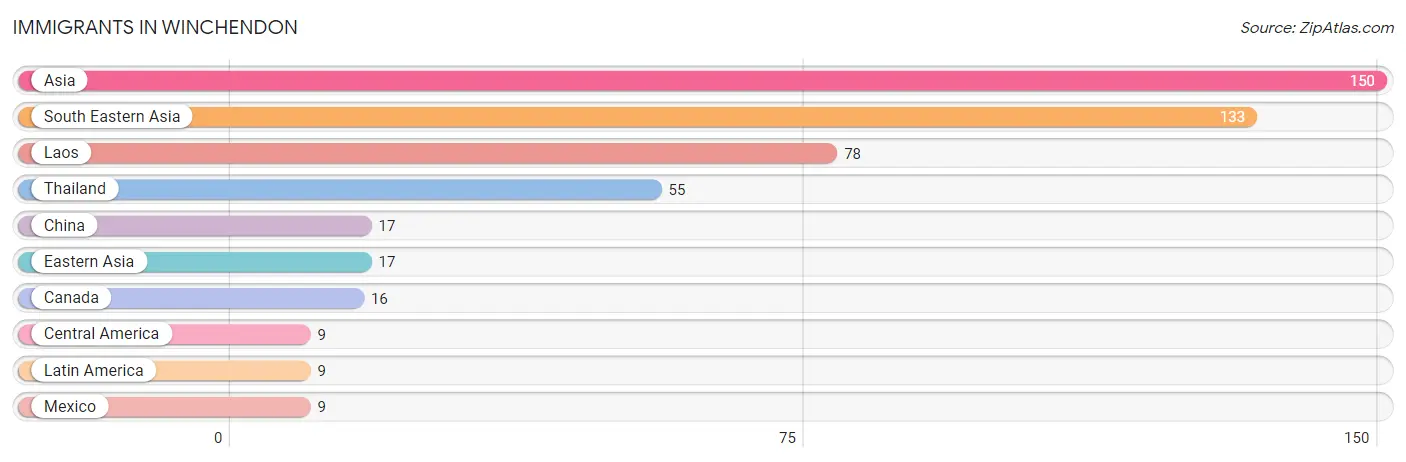
The most numerous immigrant groups reported in Winchendon came from Asia (150 | 3.4%), South Eastern Asia (133 | 3.0%), Laos (78 | 1.8%), Thailand (55 | 1.2%), and China (17 | 0.4%), together accounting for 9.7% of all Winchendon residents.
| Immigration Origin | # Population | % Population |
| Asia | 150 | 3.4% |
| Canada | 16 | 0.4% |
| Central America | 9 | 0.2% |
| China | 17 | 0.4% |
| Eastern Asia | 17 | 0.4% |
| Laos | 78 | 1.8% |
| Latin America | 9 | 0.2% |
| Mexico | 9 | 0.2% |
| South Eastern Asia | 133 | 3.0% |
| Thailand | 55 | 1.2% | View All 10 Rows |
Sex and Age in Winchendon
Sex and Age in Winchendon
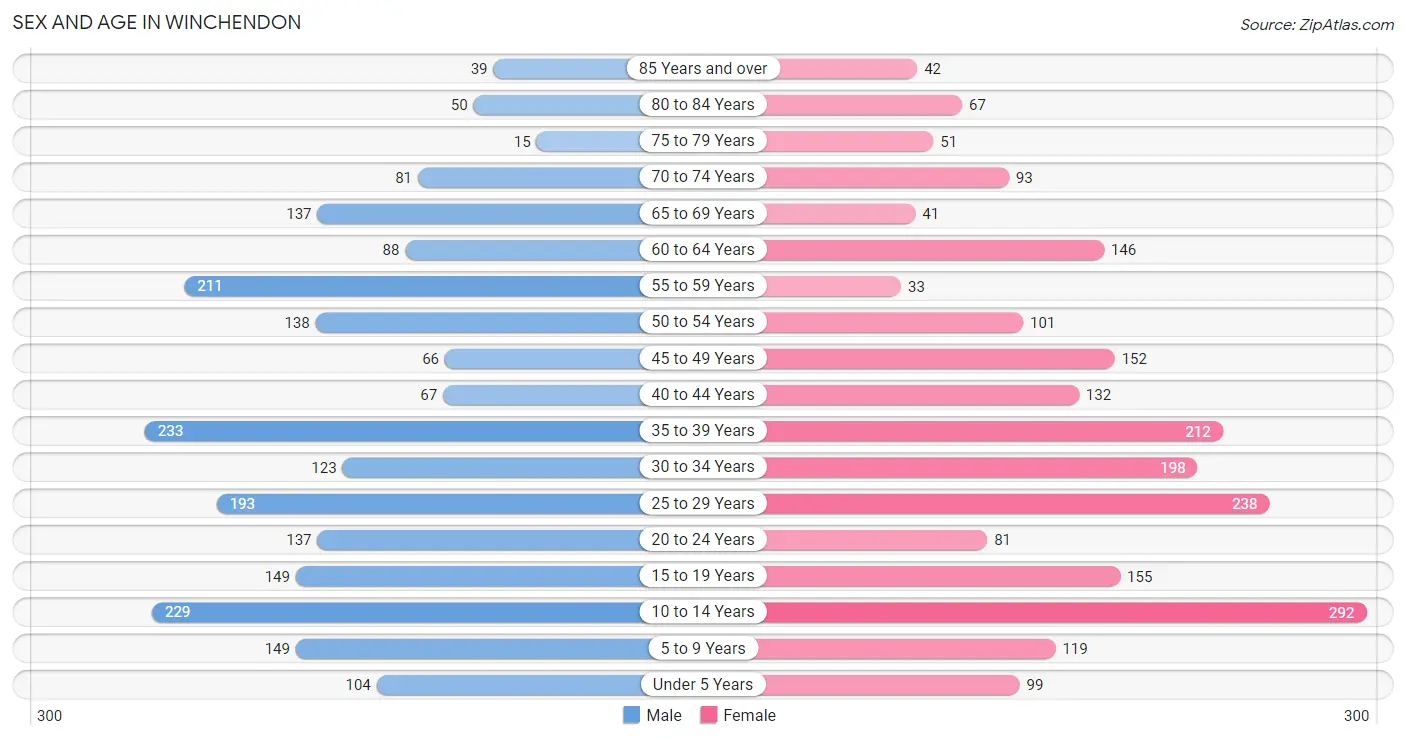
The most populous age groups in Winchendon are 35 to 39 Years (233 | 10.5%) for men and 10 to 14 Years (292 | 13.0%) for women.
| Age Bracket | Male | Female |
| Under 5 Years | 104 (4.7%) | 99 (4.4%) |
| 5 to 9 Years | 149 (6.8%) | 119 (5.3%) |
| 10 to 14 Years | 229 (10.4%) | 292 (13.0%) |
| 15 to 19 Years | 149 (6.8%) | 155 (6.9%) |
| 20 to 24 Years | 137 (6.2%) | 81 (3.6%) |
| 25 to 29 Years | 193 (8.7%) | 238 (10.6%) |
| 30 to 34 Years | 123 (5.6%) | 198 (8.8%) |
| 35 to 39 Years | 233 (10.5%) | 212 (9.4%) |
| 40 to 44 Years | 67 (3.0%) | 132 (5.9%) |
| 45 to 49 Years | 66 (3.0%) | 152 (6.8%) |
| 50 to 54 Years | 138 (6.2%) | 101 (4.5%) |
| 55 to 59 Years | 211 (9.6%) | 33 (1.5%) |
| 60 to 64 Years | 88 (4.0%) | 146 (6.5%) |
| 65 to 69 Years | 137 (6.2%) | 41 (1.8%) |
| 70 to 74 Years | 81 (3.7%) | 93 (4.1%) |
| 75 to 79 Years | 15 (0.7%) | 51 (2.3%) |
| 80 to 84 Years | 50 (2.3%) | 67 (3.0%) |
| 85 Years and over | 39 (1.8%) | 42 (1.9%) |
| Total | 2,209 (100.0%) | 2,252 (100.0%) |
Families and Households in Winchendon
Median Family Size in Winchendon
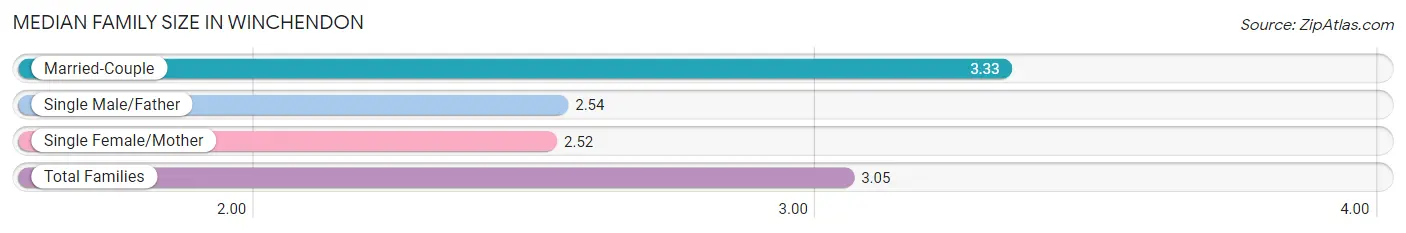
The median family size in Winchendon is 3.05 persons per family, with married-couple families (798 | 65.0%) accounting for the largest median family size of 3.33 persons per family. On the other hand, single female/mother families (281 | 22.9%) represent the smallest median family size with 2.52 persons per family.
| Family Type | # Families | Family Size |
| Married-Couple | 798 (65.0%) | 3.33 |
| Single Male/Father | 148 (12.1%) | 2.54 |
| Single Female/Mother | 281 (22.9%) | 2.52 |
| Total Families | 1,227 (100.0%) | 3.05 |
Median Household Size in Winchendon
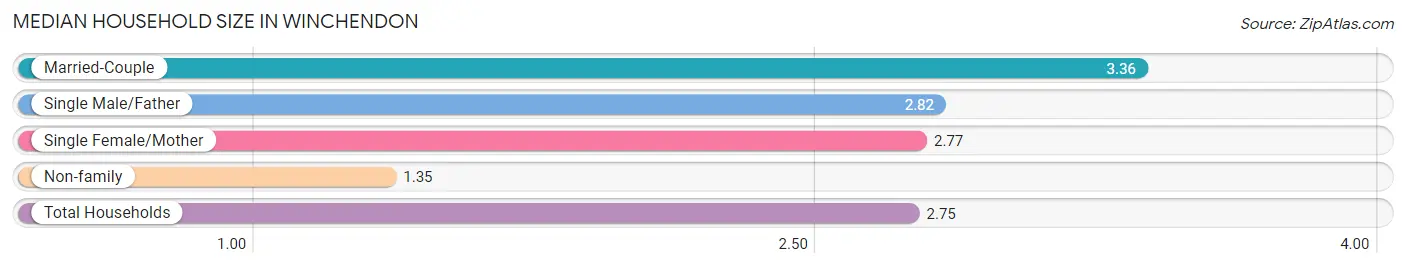
The median household size in Winchendon is 2.75 persons per household, with married-couple households (798 | 50.1%) accounting for the largest median household size of 3.36 persons per household. non-family households (365 | 22.9%) represent the smallest median household size with 1.35 persons per household.
| Household Type | # Households | Household Size |
| Married-Couple | 798 (50.1%) | 3.36 |
| Single Male/Father | 148 (9.3%) | 2.82 |
| Single Female/Mother | 281 (17.6%) | 2.77 |
| Non-family | 365 (22.9%) | 1.35 |
| Total Households | 1,592 (100.0%) | 2.75 |
Household Size by Marriage Status in Winchendon
Out of a total of 1,592 households in Winchendon, 1,227 (77.1%) are family households, while 365 (22.9%) are nonfamily households. The most numerous type of family households are 2-person households, comprising 425, and the most common type of nonfamily households are 1-person households, comprising 232.
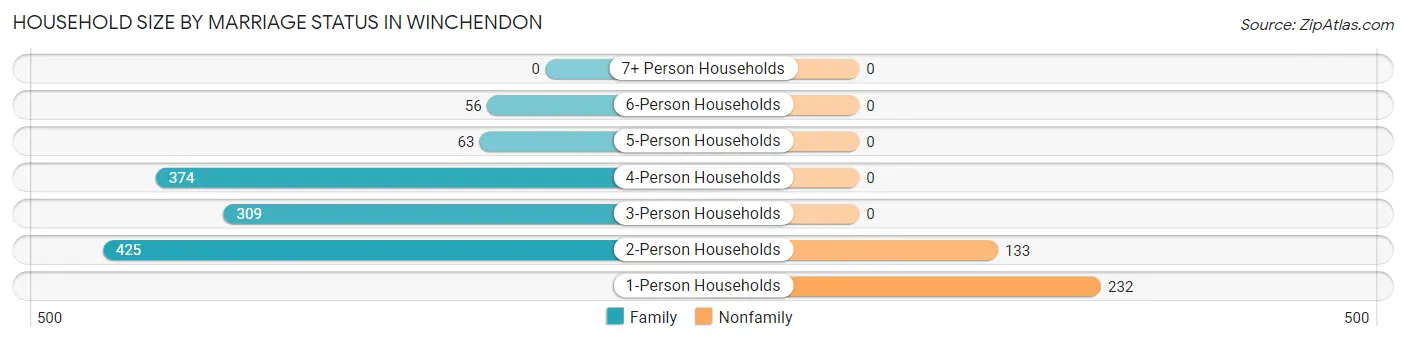
| Household Size | Family Households | Nonfamily Households |
| 1-Person Households | - | 232 (14.6%) |
| 2-Person Households | 425 (26.7%) | 133 (8.4%) |
| 3-Person Households | 309 (19.4%) | 0 (0.0%) |
| 4-Person Households | 374 (23.5%) | 0 (0.0%) |
| 5-Person Households | 63 (4.0%) | 0 (0.0%) |
| 6-Person Households | 56 (3.5%) | 0 (0.0%) |
| 7+ Person Households | 0 (0.0%) | 0 (0.0%) |
| Total | 1,227 (77.1%) | 365 (22.9%) |
Female Fertility in Winchendon
Fertility by Age in Winchendon
Average fertility rate in Winchendon is 50.0 births per 1,000 women. Women in the age bracket of 35 to 50 years have the highest fertility rate with 117.0 births per 1,000 women. Women in the age bracket of 35 to 50 years acount for 100.0% of all women with births.
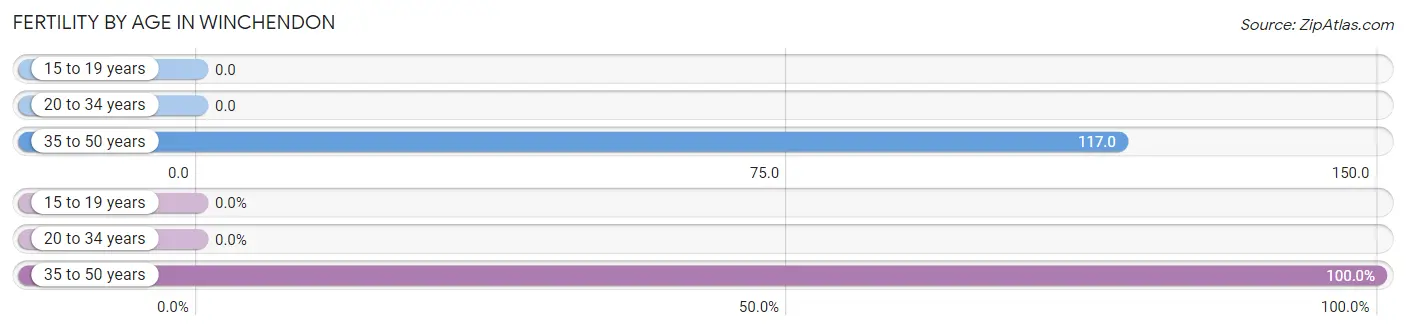
| Age Bracket | Women with Births | Births / 1,000 Women |
| 15 to 19 years | 0 (0.0%) | 0.0 |
| 20 to 34 years | 0 (0.0%) | 0.0 |
| 35 to 50 years | 58 (100.0%) | 117.0 |
| Total | 58 (100.0%) | 50.0 |
Fertility by Age by Marriage Status in Winchendon
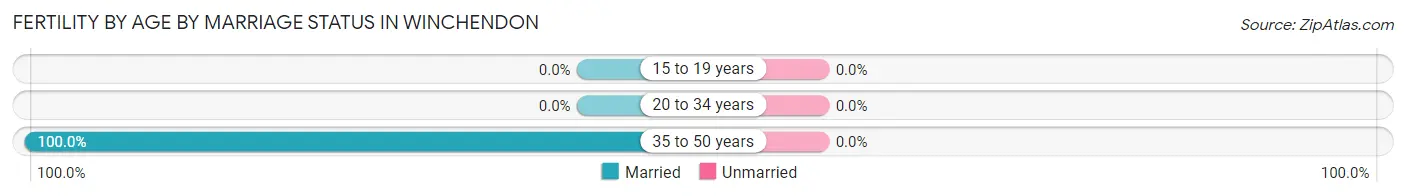
| Age Bracket | Married | Unmarried |
| 15 to 19 years | 0 (0.0%) | 0 (0.0%) |
| 20 to 34 years | 0 (0.0%) | 0 (0.0%) |
| 35 to 50 years | 58 (100.0%) | 0 (0.0%) |
| Total | 58 (100.0%) | 0 (0.0%) |
Fertility by Education in Winchendon
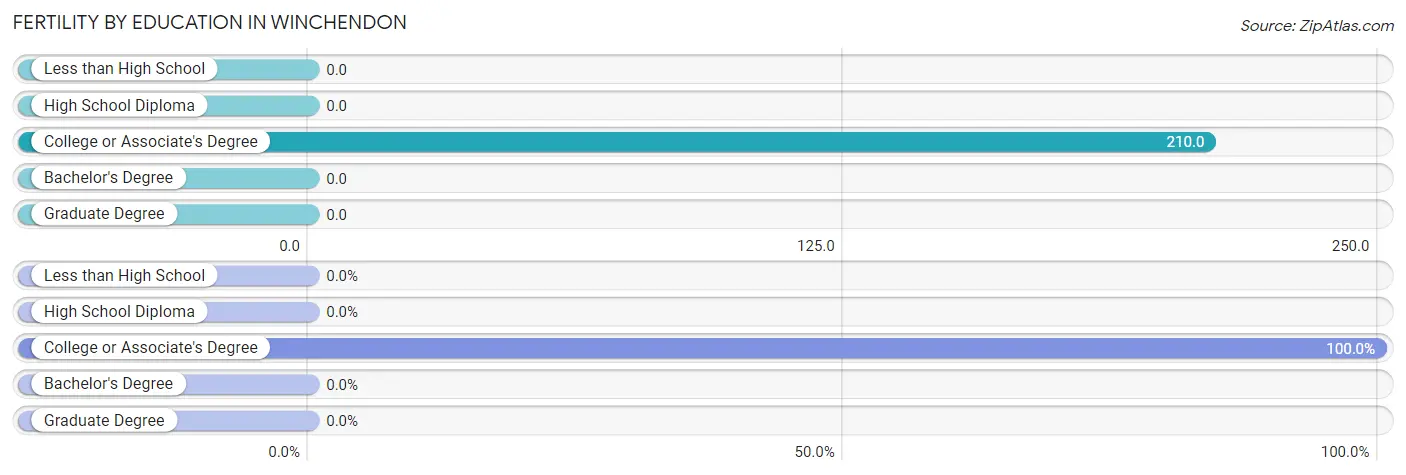
| Educational Attainment | Women with Births | Births / 1,000 Women |
| Less than High School | 0 (0.0%) | 0.0 |
| High School Diploma | 0 (0.0%) | 0.0 |
| College or Associate's Degree | 58 (100.0%) | 210.0 |
| Bachelor's Degree | 0 (0.0%) | 0.0 |
| Graduate Degree | 0 (0.0%) | 0.0 |
| Total | 58 (100.0%) | 50.0 |
Fertility by Education by Marriage Status in Winchendon
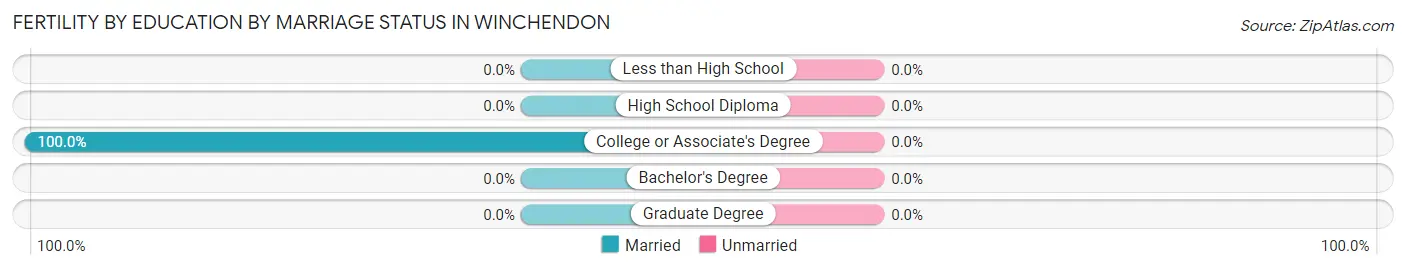
| Educational Attainment | Married | Unmarried |
| Less than High School | 0 (0.0%) | 0 (0.0%) |
| High School Diploma | 0 (0.0%) | 0 (0.0%) |
| College or Associate's Degree | 58 (100.0%) | 0 (0.0%) |
| Bachelor's Degree | 0 (0.0%) | 0 (0.0%) |
| Graduate Degree | 0 (0.0%) | 0 (0.0%) |
| Total | 58 (100.0%) | 0 (0.0%) |
Employment Characteristics in Winchendon
Employment by Class of Employer in Winchendon
Among the 2,034 employed individuals in Winchendon, private company employees (1,333 | 65.5%), not-for-profit organizations (288 | 14.2%), and local government employees (227 | 11.2%) make up the most common classes of employment.
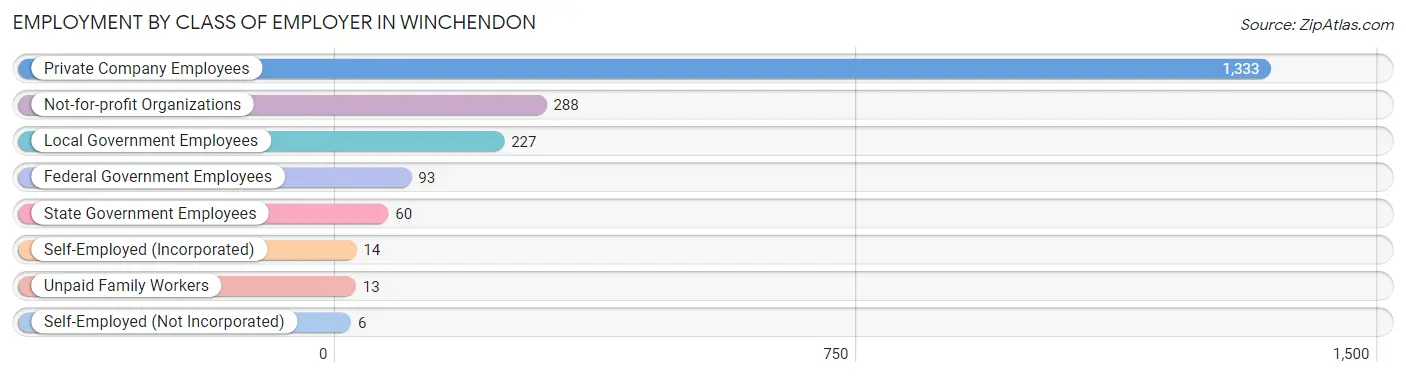
| Employer Class | # Employees | % Employees |
| Private Company Employees | 1,333 | 65.5% |
| Self-Employed (Incorporated) | 14 | 0.7% |
| Self-Employed (Not Incorporated) | 6 | 0.3% |
| Not-for-profit Organizations | 288 | 14.2% |
| Local Government Employees | 227 | 11.2% |
| State Government Employees | 60 | 2.9% |
| Federal Government Employees | 93 | 4.6% |
| Unpaid Family Workers | 13 | 0.6% |
| Total | 2,034 | 100.0% |
Employment Status by Age in Winchendon
According to the labor force statistics for Winchendon, out of the total population over 16 years of age (3,449), 63.9% or 2,204 individuals are in the labor force, with 6.8% or 150 of them unemployed. The age group with the highest labor force participation rate is 30 to 34 years, with 94.7% or 304 individuals in the labor force. Within the labor force, the 16 to 19 years age range has the highest percentage of unemployed individuals, with 46.9% or 53 of them being unemployed.
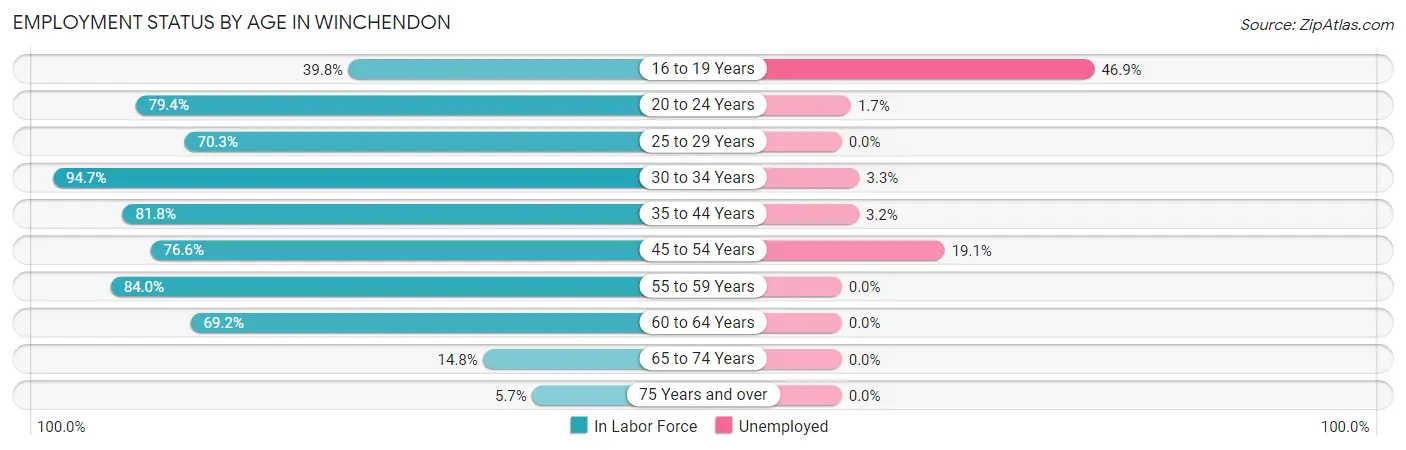
| Age Bracket | In Labor Force | Unemployed |
| 16 to 19 Years | 113 (39.8%) | 53 (46.9%) |
| 20 to 24 Years | 173 (79.4%) | 3 (1.7%) |
| 25 to 29 Years | 303 (70.3%) | 0 (0.0%) |
| 30 to 34 Years | 304 (94.7%) | 10 (3.3%) |
| 35 to 44 Years | 527 (81.8%) | 17 (3.2%) |
| 45 to 54 Years | 350 (76.6%) | 67 (19.1%) |
| 55 to 59 Years | 205 (84.0%) | 0 (0.0%) |
| 60 to 64 Years | 162 (69.2%) | 0 (0.0%) |
| 65 to 74 Years | 52 (14.8%) | 0 (0.0%) |
| 75 Years and over | 15 (5.7%) | 0 (0.0%) |
| Total | 2,204 (63.9%) | 150 (6.8%) |
Employment Status by Educational Attainment in Winchendon
According to labor force statistics for Winchendon, 79.4% of individuals (1,851) out of the total population between 25 and 64 years of age (2,331) are in the labor force, with 5.1% or 94 of them being unemployed. The group with the highest labor force participation rate are those with the educational attainment of bachelor's degree or higher, with 85.5% or 503 individuals in the labor force. Within the labor force, individuals with less than high school education have the highest percentage of unemployment, with 46.2% or 42 of them being unemployed.
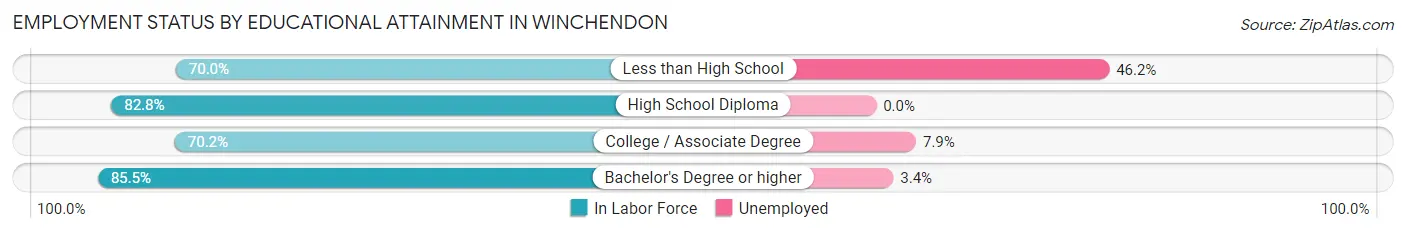
| Educational Attainment | In Labor Force | Unemployed |
| Less than High School | 91 (70.0%) | 60 (46.2%) |
| High School Diploma | 816 (82.8%) | 0 (0.0%) |
| College / Associate Degree | 441 (70.2%) | 50 (7.9%) |
| Bachelor's Degree or higher | 503 (85.5%) | 20 (3.4%) |
| Total | 1,851 (79.4%) | 119 (5.1%) |
Employment Occupations by Sex in Winchendon
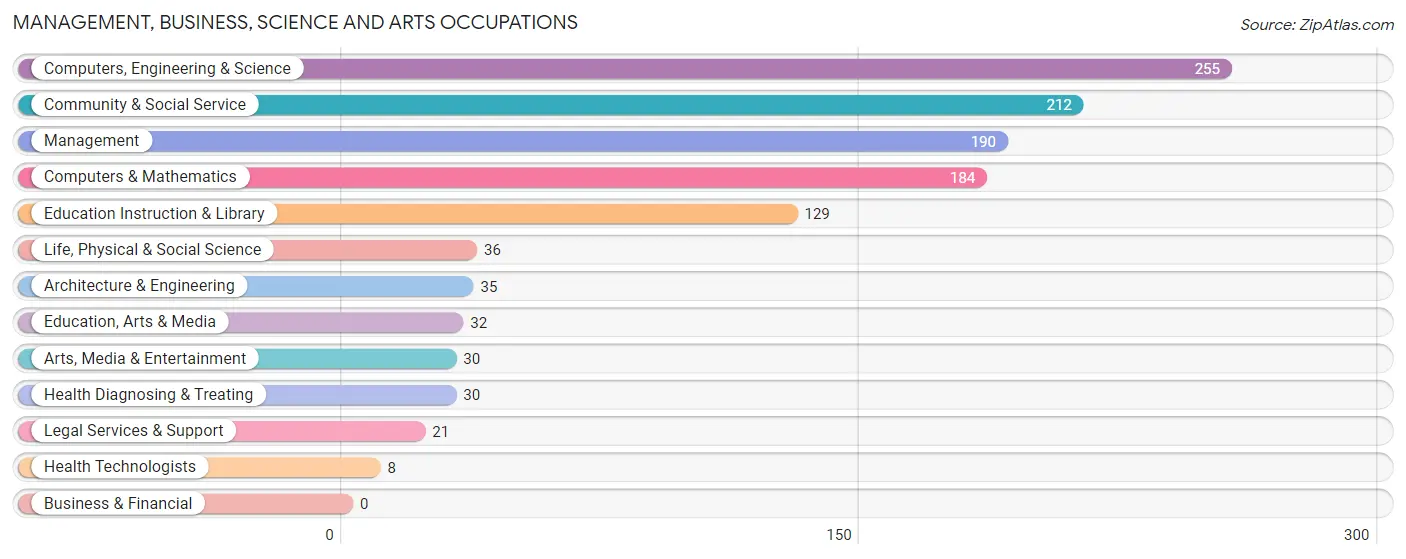
Management, Business, Science and Arts Occupations
The most common Management, Business, Science and Arts occupations in Winchendon are Computers, Engineering & Science (255 | 12.4%), Community & Social Service (212 | 10.3%), Management (190 | 9.2%), Computers & Mathematics (184 | 9.0%), and Education Instruction & Library (129 | 6.3%).
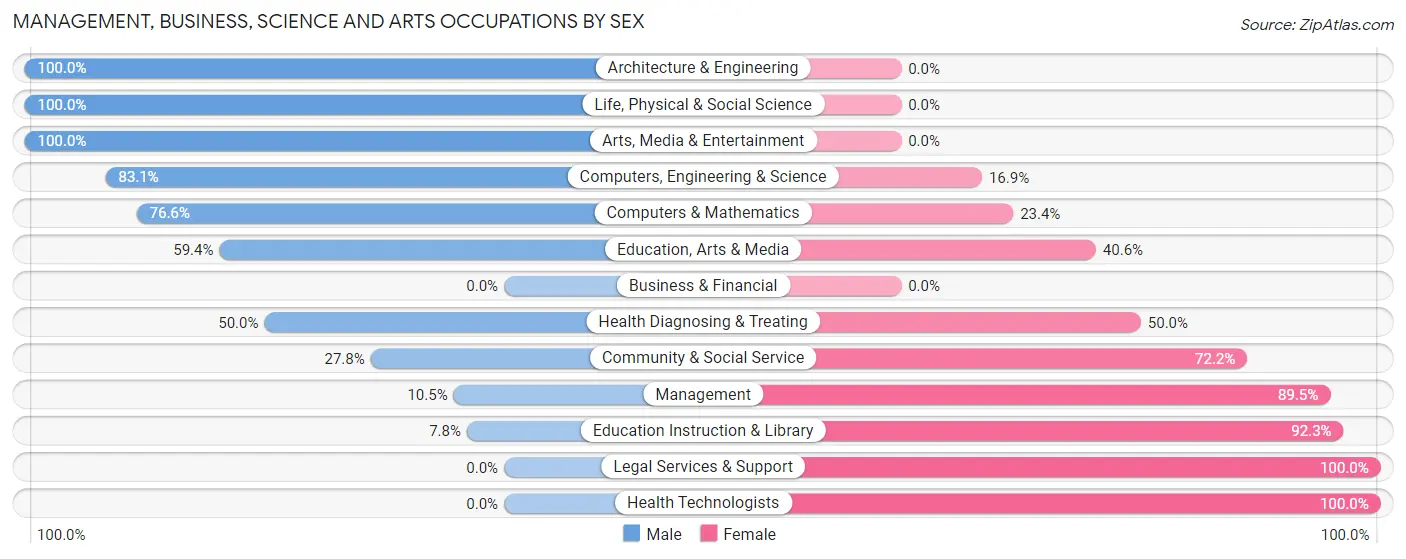
Management, Business, Science and Arts Occupations by Sex
Within the Management, Business, Science and Arts occupations in Winchendon, the most male-oriented occupations are Architecture & Engineering (100.0%), Life, Physical & Social Science (100.0%), and Arts, Media & Entertainment (100.0%), while the most female-oriented occupations are Legal Services & Support (100.0%), Health Technologists (100.0%), and Education Instruction & Library (92.2%).
| Occupation | Male | Female |
| Management | 20 (10.5%) | 170 (89.5%) |
| Business & Financial | 0 (0.0%) | 0 (0.0%) |
| Computers, Engineering & Science | 212 (83.1%) | 43 (16.9%) |
| Computers & Mathematics | 141 (76.6%) | 43 (23.4%) |
| Architecture & Engineering | 35 (100.0%) | 0 (0.0%) |
| Life, Physical & Social Science | 36 (100.0%) | 0 (0.0%) |
| Community & Social Service | 59 (27.8%) | 153 (72.2%) |
| Education, Arts & Media | 19 (59.4%) | 13 (40.6%) |
| Legal Services & Support | 0 (0.0%) | 21 (100.0%) |
| Education Instruction & Library | 10 (7.7%) | 119 (92.2%) |
| Arts, Media & Entertainment | 30 (100.0%) | 0 (0.0%) |
| Health Diagnosing & Treating | 15 (50.0%) | 15 (50.0%) |
| Health Technologists | 0 (0.0%) | 8 (100.0%) |
| Total (Category) | 306 (44.5%) | 381 (55.5%) |
| Total (Overall) | 1,033 (50.3%) | 1,021 (49.7%) |
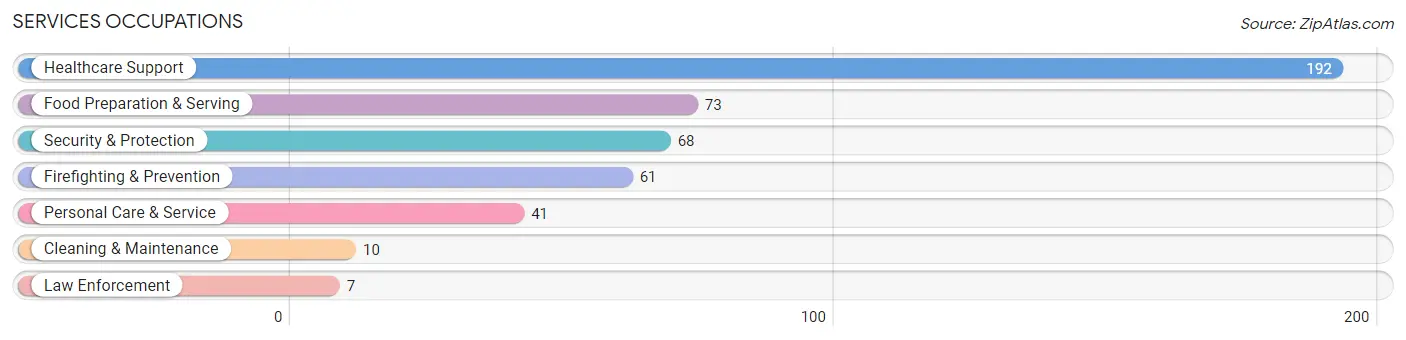
Services Occupations
The most common Services occupations in Winchendon are Healthcare Support (192 | 9.3%), Food Preparation & Serving (73 | 3.5%), Security & Protection (68 | 3.3%), Firefighting & Prevention (61 | 3.0%), and Personal Care & Service (41 | 2.0%).
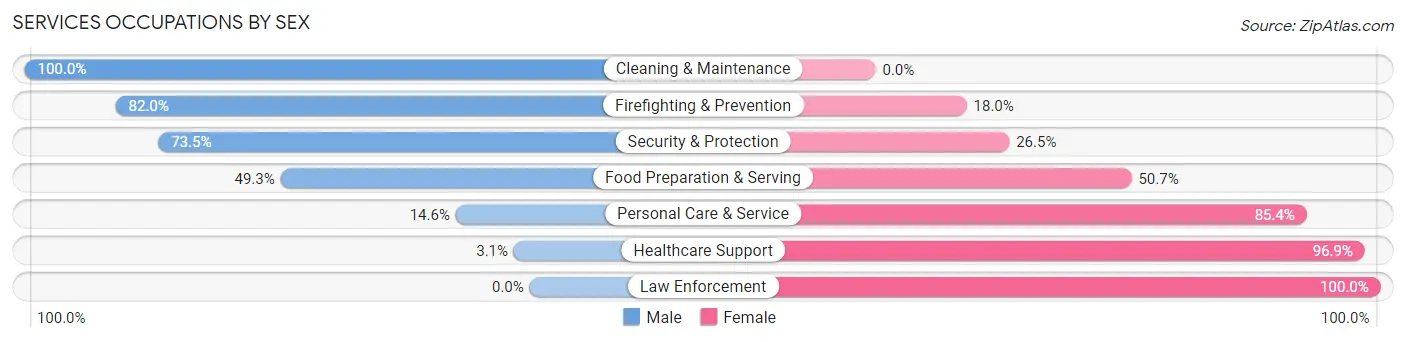
Services Occupations by Sex
Within the Services occupations in Winchendon, the most male-oriented occupations are Cleaning & Maintenance (100.0%), Firefighting & Prevention (82.0%), and Security & Protection (73.5%), while the most female-oriented occupations are Law Enforcement (100.0%), Healthcare Support (96.9%), and Personal Care & Service (85.4%).
| Occupation | Male | Female |
| Healthcare Support | 6 (3.1%) | 186 (96.9%) |
| Security & Protection | 50 (73.5%) | 18 (26.5%) |
| Firefighting & Prevention | 50 (82.0%) | 11 (18.0%) |
| Law Enforcement | 0 (0.0%) | 7 (100.0%) |
| Food Preparation & Serving | 36 (49.3%) | 37 (50.7%) |
| Cleaning & Maintenance | 10 (100.0%) | 0 (0.0%) |
| Personal Care & Service | 6 (14.6%) | 35 (85.4%) |
| Total (Category) | 108 (28.1%) | 276 (71.9%) |
| Total (Overall) | 1,033 (50.3%) | 1,021 (49.7%) |
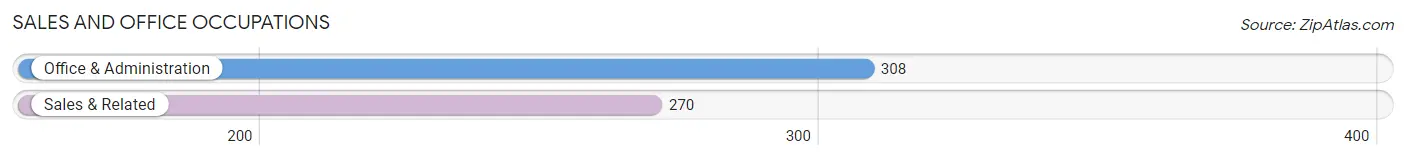
Sales and Office Occupations
The most common Sales and Office occupations in Winchendon are Office & Administration (308 | 15.0%), and Sales & Related (270 | 13.2%).
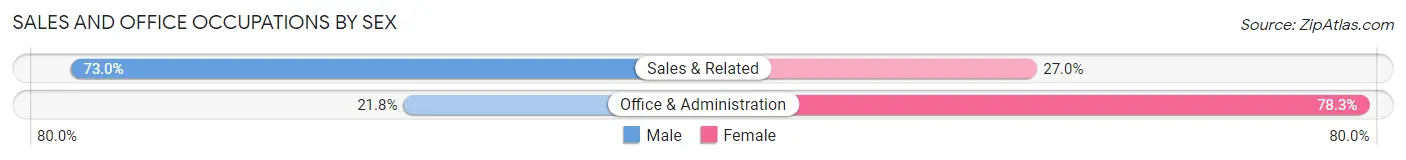
Sales and Office Occupations by Sex
| Occupation | Male | Female |
| Sales & Related | 197 (73.0%) | 73 (27.0%) |
| Office & Administration | 67 (21.7%) | 241 (78.2%) |
| Total (Category) | 264 (45.7%) | 314 (54.3%) |
| Total (Overall) | 1,033 (50.3%) | 1,021 (49.7%) |
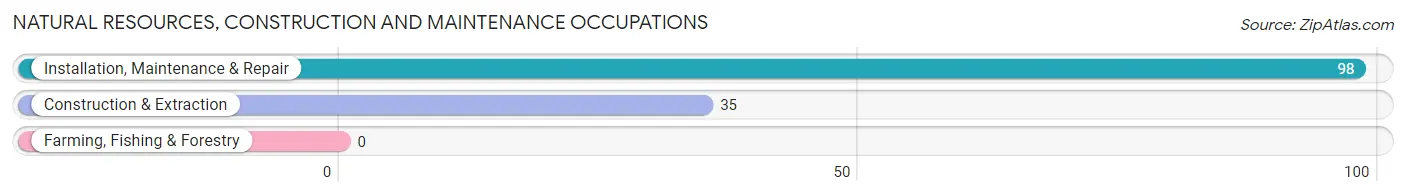
Natural Resources, Construction and Maintenance Occupations
The most common Natural Resources, Construction and Maintenance occupations in Winchendon are Installation, Maintenance & Repair (98 | 4.8%), and Construction & Extraction (35 | 1.7%).
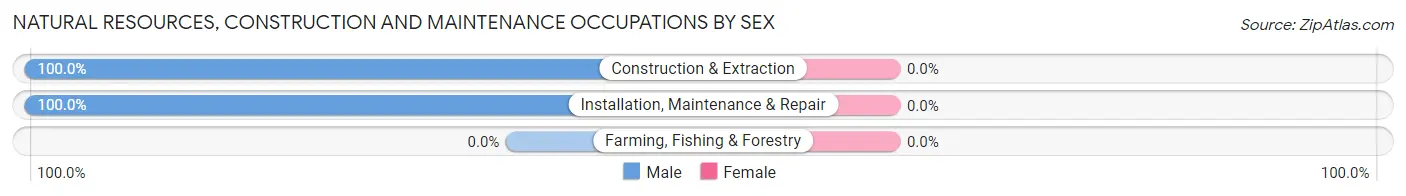
Natural Resources, Construction and Maintenance Occupations by Sex
| Occupation | Male | Female |
| Farming, Fishing & Forestry | 0 (0.0%) | 0 (0.0%) |
| Construction & Extraction | 35 (100.0%) | 0 (0.0%) |
| Installation, Maintenance & Repair | 98 (100.0%) | 0 (0.0%) |
| Total (Category) | 133 (100.0%) | 0 (0.0%) |
| Total (Overall) | 1,033 (50.3%) | 1,021 (49.7%) |
Production, Transportation and Moving Occupations
The most common Production, Transportation and Moving occupations in Winchendon are Material Moving (151 | 7.3%), Production (87 | 4.2%), and Transportation (34 | 1.7%).
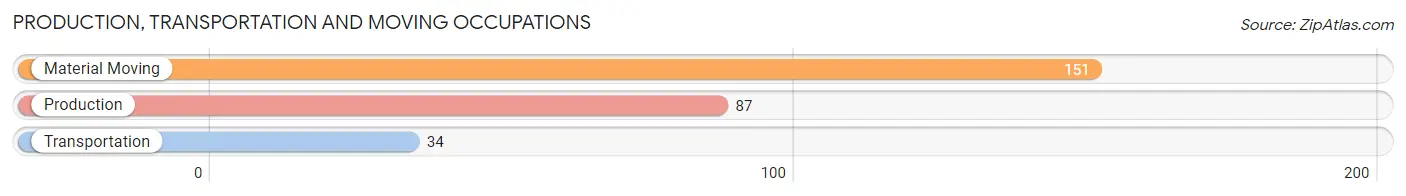
Production, Transportation and Moving Occupations by Sex
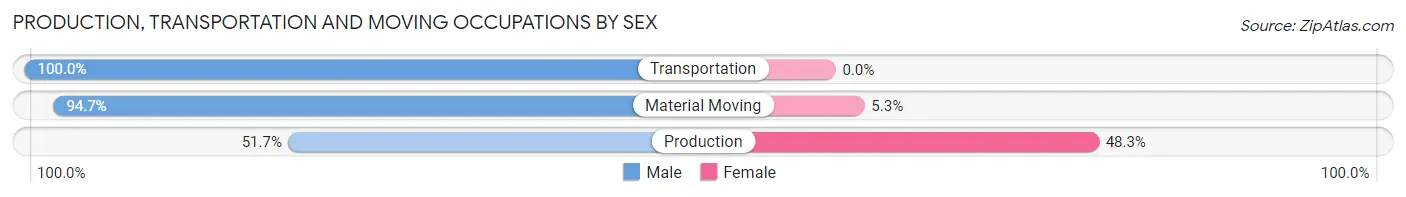
| Occupation | Male | Female |
| Production | 45 (51.7%) | 42 (48.3%) |
| Transportation | 34 (100.0%) | 0 (0.0%) |
| Material Moving | 143 (94.7%) | 8 (5.3%) |
| Total (Category) | 222 (81.6%) | 50 (18.4%) |
| Total (Overall) | 1,033 (50.3%) | 1,021 (49.7%) |
Employment Industries by Sex in Winchendon
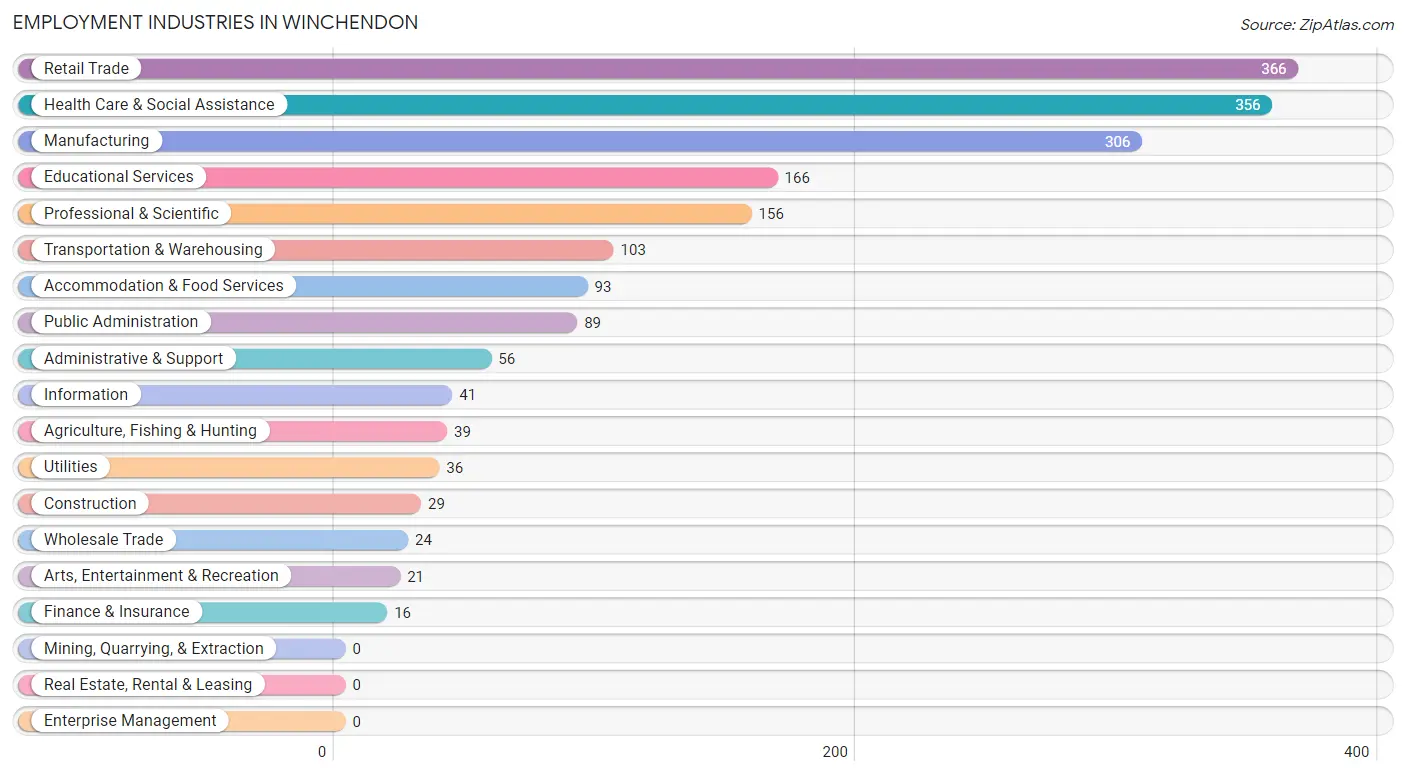
Employment Industries in Winchendon
The major employment industries in Winchendon include Retail Trade (366 | 17.8%), Health Care & Social Assistance (356 | 17.3%), Manufacturing (306 | 14.9%), Educational Services (166 | 8.1%), and Professional & Scientific (156 | 7.6%).
Employment Industries by Sex in Winchendon
The Winchendon industries that see more men than women are Agriculture, Fishing & Hunting (100.0%), Wholesale Trade (100.0%), and Utilities (100.0%), whereas the industries that tend to have a higher number of women are Information (100.0%), Health Care & Social Assistance (89.6%), and Professional & Scientific (86.5%).
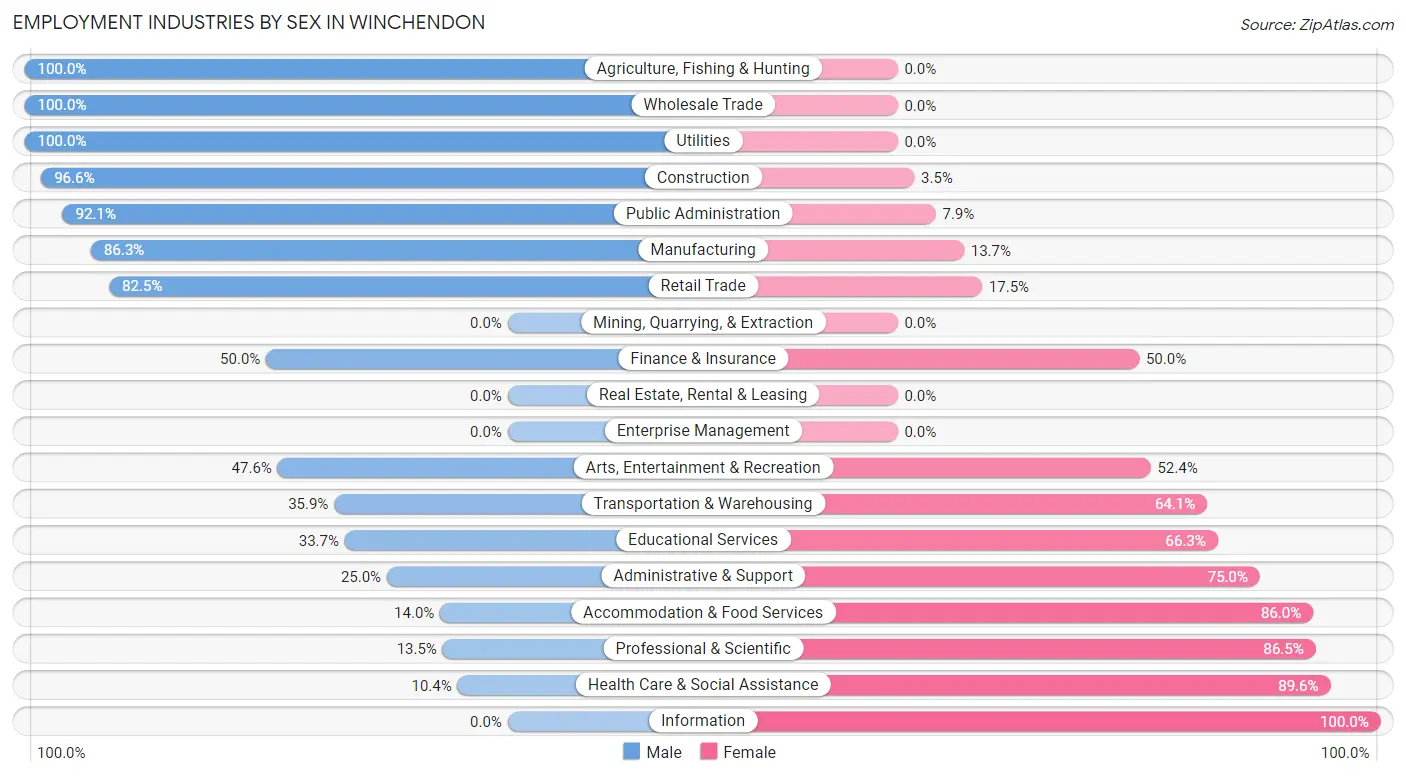
| Industry | Male | Female |
| Agriculture, Fishing & Hunting | 39 (100.0%) | 0 (0.0%) |
| Mining, Quarrying, & Extraction | 0 (0.0%) | 0 (0.0%) |
| Construction | 28 (96.6%) | 1 (3.5%) |
| Manufacturing | 264 (86.3%) | 42 (13.7%) |
| Wholesale Trade | 24 (100.0%) | 0 (0.0%) |
| Retail Trade | 302 (82.5%) | 64 (17.5%) |
| Transportation & Warehousing | 37 (35.9%) | 66 (64.1%) |
| Utilities | 36 (100.0%) | 0 (0.0%) |
| Information | 0 (0.0%) | 41 (100.0%) |
| Finance & Insurance | 8 (50.0%) | 8 (50.0%) |
| Real Estate, Rental & Leasing | 0 (0.0%) | 0 (0.0%) |
| Professional & Scientific | 21 (13.5%) | 135 (86.5%) |
| Enterprise Management | 0 (0.0%) | 0 (0.0%) |
| Administrative & Support | 14 (25.0%) | 42 (75.0%) |
| Educational Services | 56 (33.7%) | 110 (66.3%) |
| Health Care & Social Assistance | 37 (10.4%) | 319 (89.6%) |
| Arts, Entertainment & Recreation | 10 (47.6%) | 11 (52.4%) |
| Accommodation & Food Services | 13 (14.0%) | 80 (86.0%) |
| Public Administration | 82 (92.1%) | 7 (7.9%) |
| Total | 1,033 (50.3%) | 1,021 (49.7%) |
Education in Winchendon
School Enrollment in Winchendon
The most common levels of schooling among the 1,288 students in Winchendon are middle school (447 | 34.7%), college / undergraduate (242 | 18.8%), and high school (237 | 18.4%).
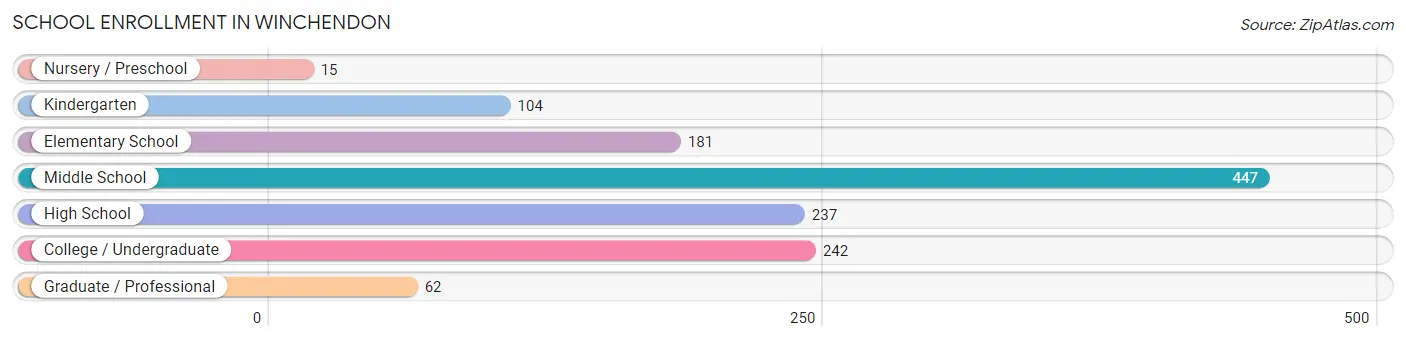
| School Level | # Students | % Students |
| Nursery / Preschool | 15 | 1.2% |
| Kindergarten | 104 | 8.1% |
| Elementary School | 181 | 14.1% |
| Middle School | 447 | 34.7% |
| High School | 237 | 18.4% |
| College / Undergraduate | 242 | 18.8% |
| Graduate / Professional | 62 | 4.8% |
| Total | 1,288 | 100.0% |
School Enrollment by Age by Funding Source in Winchendon
Out of a total of 1,288 students who are enrolled in schools in Winchendon, 180 (14.0%) attend a private institution, while the remaining 1,108 (86.0%) are enrolled in public schools. The age group of 3 to 4 year olds has the highest likelihood of being enrolled in private schools, with 15 (100.0% in the age bracket) enrolled. Conversely, the age group of 10 to 14 year olds has the lowest likelihood of being enrolled in a private school, with 521 (100.0% in the age bracket) attending a public institution.
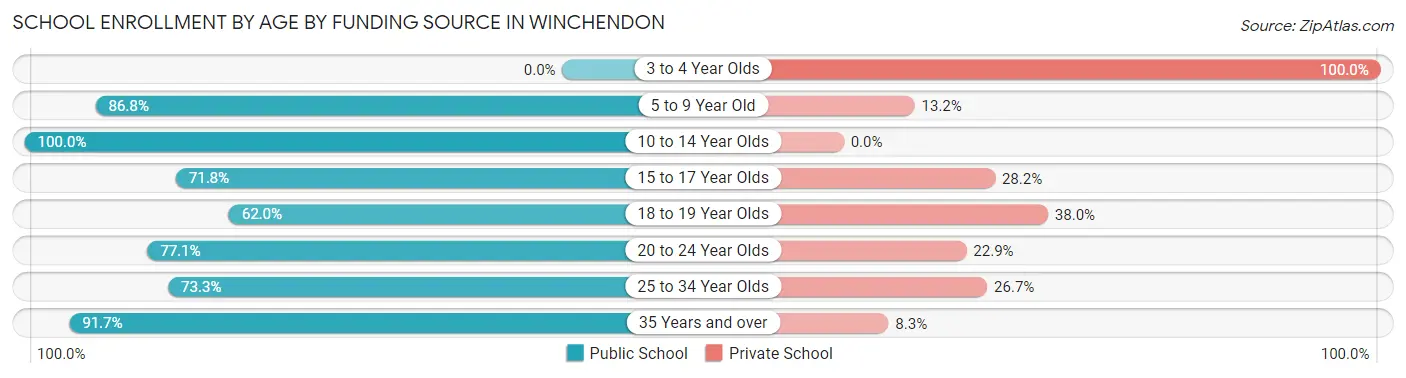
| Age Bracket | Public School | Private School |
| 3 to 4 Year Olds | 0 (0.0%) | 15 (100.0%) |
| 5 to 9 Year Old | 184 (86.8%) | 28 (13.2%) |
| 10 to 14 Year Olds | 521 (100.0%) | 0 (0.0%) |
| 15 to 17 Year Olds | 130 (71.8%) | 51 (28.2%) |
| 18 to 19 Year Olds | 57 (62.0%) | 35 (38.0%) |
| 20 to 24 Year Olds | 54 (77.1%) | 16 (22.9%) |
| 25 to 34 Year Olds | 74 (73.3%) | 27 (26.7%) |
| 35 Years and over | 88 (91.7%) | 8 (8.3%) |
| Total | 1,108 (86.0%) | 180 (14.0%) |
Educational Attainment by Field of Study in Winchendon
Education (150 | 17.6%), business (116 | 13.6%), psychology (113 | 13.2%), visual & performing arts (106 | 12.4%), and bio, nature & agricultural (79 | 9.2%) are the most common fields of study among 854 individuals in Winchendon who have obtained a bachelor's degree or higher.
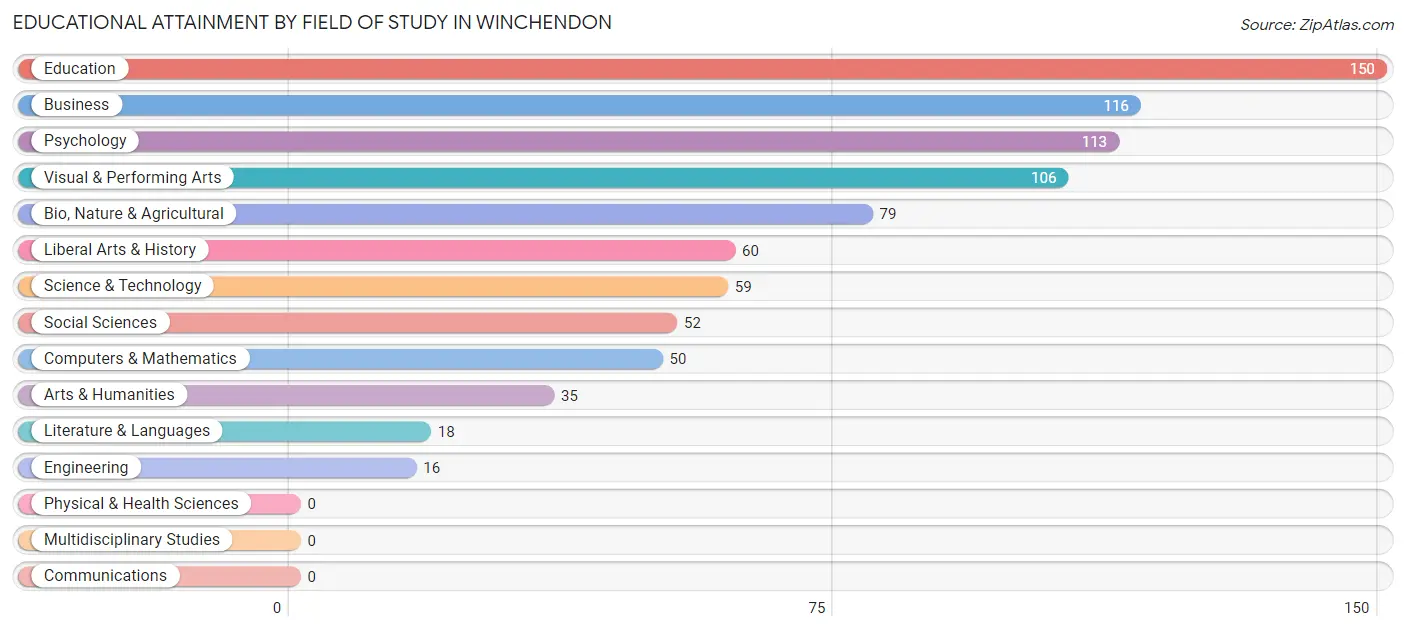
| Field of Study | # Graduates | % Graduates |
| Computers & Mathematics | 50 | 5.9% |
| Bio, Nature & Agricultural | 79 | 9.2% |
| Physical & Health Sciences | 0 | 0.0% |
| Psychology | 113 | 13.2% |
| Social Sciences | 52 | 6.1% |
| Engineering | 16 | 1.9% |
| Multidisciplinary Studies | 0 | 0.0% |
| Science & Technology | 59 | 6.9% |
| Business | 116 | 13.6% |
| Education | 150 | 17.6% |
| Literature & Languages | 18 | 2.1% |
| Liberal Arts & History | 60 | 7.0% |
| Visual & Performing Arts | 106 | 12.4% |
| Communications | 0 | 0.0% |
| Arts & Humanities | 35 | 4.1% |
| Total | 854 | 100.0% |
Transportation & Commute in Winchendon
Vehicle Availability by Sex in Winchendon
The most prevalent vehicle ownership categories in Winchendon are males with 2 vehicles (400, accounting for 40.6%) and females with 2 vehicles (475, making up 40.4%).
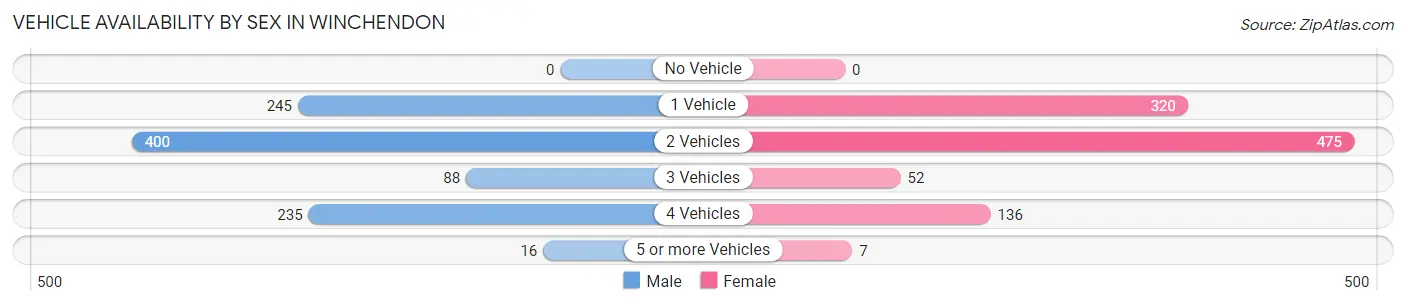
| Vehicles Available | Male | Female |
| No Vehicle | 0 (0.0%) | 0 (0.0%) |
| 1 Vehicle | 245 (24.9%) | 320 (32.3%) |
| 2 Vehicles | 400 (40.6%) | 475 (48.0%) |
| 3 Vehicles | 88 (8.9%) | 52 (5.2%) |
| 4 Vehicles | 235 (23.9%) | 136 (13.7%) |
| 5 or more Vehicles | 16 (1.6%) | 7 (0.7%) |
| Total | 984 (100.0%) | 990 (100.0%) |
Commute Time in Winchendon
The most frequently occuring commute durations in Winchendon are 10 to 14 minutes (332 commuters, 17.6%), 15 to 19 minutes (326 commuters, 17.3%), and 30 to 34 minutes (273 commuters, 14.5%).
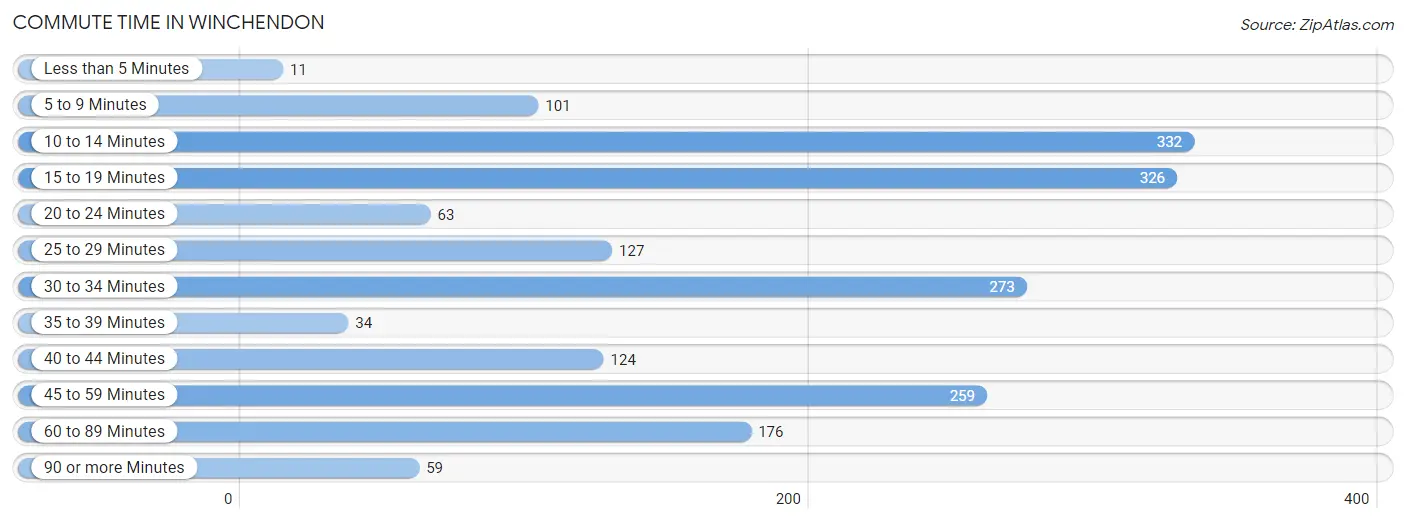
| Commute Time | # Commuters | % Commuters |
| Less than 5 Minutes | 11 | 0.6% |
| 5 to 9 Minutes | 101 | 5.4% |
| 10 to 14 Minutes | 332 | 17.6% |
| 15 to 19 Minutes | 326 | 17.3% |
| 20 to 24 Minutes | 63 | 3.3% |
| 25 to 29 Minutes | 127 | 6.7% |
| 30 to 34 Minutes | 273 | 14.5% |
| 35 to 39 Minutes | 34 | 1.8% |
| 40 to 44 Minutes | 124 | 6.6% |
| 45 to 59 Minutes | 259 | 13.7% |
| 60 to 89 Minutes | 176 | 9.3% |
| 90 or more Minutes | 59 | 3.1% |
Commute Time by Sex in Winchendon
The most common commute times in Winchendon are 15 to 19 minutes (184 commuters, 19.0%) for males and 10 to 14 minutes (214 commuters, 23.3%) for females.
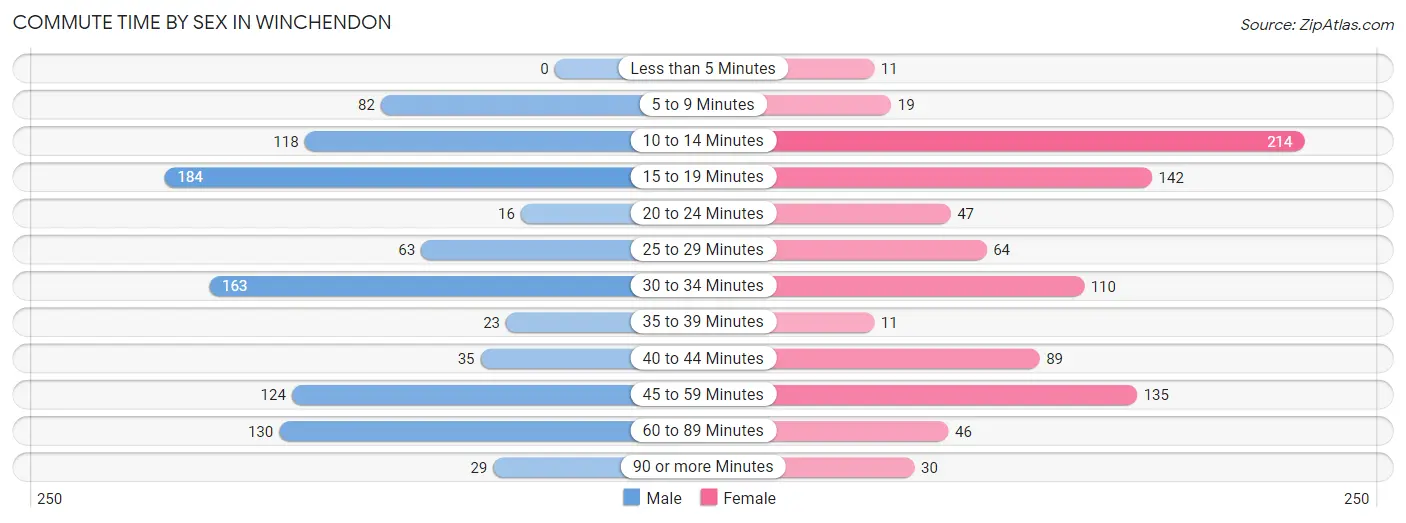
| Commute Time | Male | Female |
| Less than 5 Minutes | 0 (0.0%) | 11 (1.2%) |
| 5 to 9 Minutes | 82 (8.5%) | 19 (2.1%) |
| 10 to 14 Minutes | 118 (12.2%) | 214 (23.3%) |
| 15 to 19 Minutes | 184 (19.0%) | 142 (15.5%) |
| 20 to 24 Minutes | 16 (1.7%) | 47 (5.1%) |
| 25 to 29 Minutes | 63 (6.5%) | 64 (7.0%) |
| 30 to 34 Minutes | 163 (16.9%) | 110 (12.0%) |
| 35 to 39 Minutes | 23 (2.4%) | 11 (1.2%) |
| 40 to 44 Minutes | 35 (3.6%) | 89 (9.7%) |
| 45 to 59 Minutes | 124 (12.8%) | 135 (14.7%) |
| 60 to 89 Minutes | 130 (13.4%) | 46 (5.0%) |
| 90 or more Minutes | 29 (3.0%) | 30 (3.3%) |
Time of Departure to Work by Sex in Winchendon
The most frequent times of departure to work in Winchendon are 6:00 AM to 6:29 AM (194, 20.1%) for males and 7:00 AM to 7:29 AM (257, 28.0%) for females.
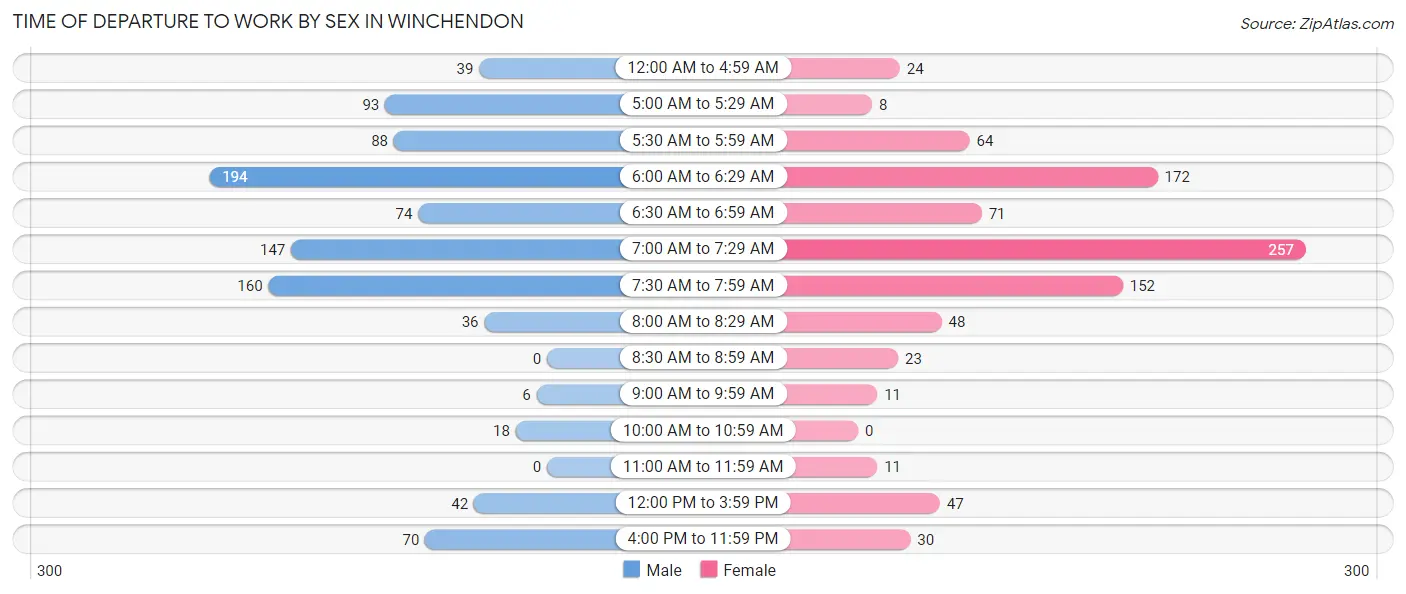
| Time of Departure | Male | Female |
| 12:00 AM to 4:59 AM | 39 (4.0%) | 24 (2.6%) |
| 5:00 AM to 5:29 AM | 93 (9.6%) | 8 (0.9%) |
| 5:30 AM to 5:59 AM | 88 (9.1%) | 64 (7.0%) |
| 6:00 AM to 6:29 AM | 194 (20.1%) | 172 (18.7%) |
| 6:30 AM to 6:59 AM | 74 (7.6%) | 71 (7.7%) |
| 7:00 AM to 7:29 AM | 147 (15.2%) | 257 (28.0%) |
| 7:30 AM to 7:59 AM | 160 (16.6%) | 152 (16.6%) |
| 8:00 AM to 8:29 AM | 36 (3.7%) | 48 (5.2%) |
| 8:30 AM to 8:59 AM | 0 (0.0%) | 23 (2.5%) |
| 9:00 AM to 9:59 AM | 6 (0.6%) | 11 (1.2%) |
| 10:00 AM to 10:59 AM | 18 (1.9%) | 0 (0.0%) |
| 11:00 AM to 11:59 AM | 0 (0.0%) | 11 (1.2%) |
| 12:00 PM to 3:59 PM | 42 (4.3%) | 47 (5.1%) |
| 4:00 PM to 11:59 PM | 70 (7.2%) | 30 (3.3%) |
| Total | 967 (100.0%) | 918 (100.0%) |
Housing Occupancy in Winchendon
Occupancy by Ownership in Winchendon
Of the total 1,592 dwellings in Winchendon, owner-occupied units account for 856 (53.8%), while renter-occupied units make up 736 (46.2%).
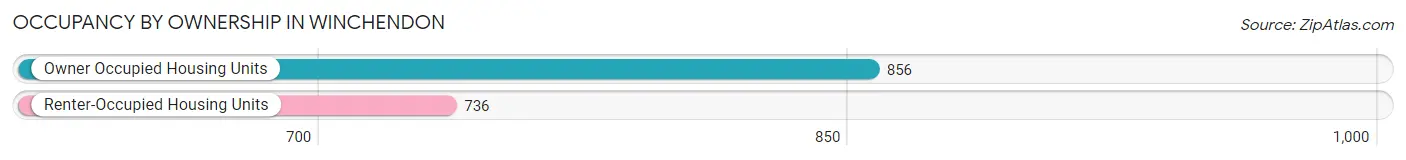
| Occupancy | # Housing Units | % Housing Units |
| Owner Occupied Housing Units | 856 | 53.8% |
| Renter-Occupied Housing Units | 736 | 46.2% |
| Total Occupied Housing Units | 1,592 | 100.0% |
Occupancy by Household Size in Winchendon
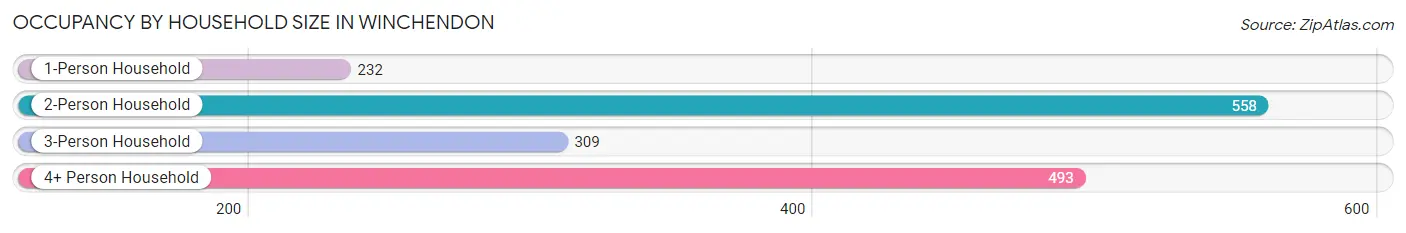
| Household Size | # Housing Units | % Housing Units |
| 1-Person Household | 232 | 14.6% |
| 2-Person Household | 558 | 35.0% |
| 3-Person Household | 309 | 19.4% |
| 4+ Person Household | 493 | 31.0% |
| Total Housing Units | 1,592 | 100.0% |
Occupancy by Ownership by Household Size in Winchendon
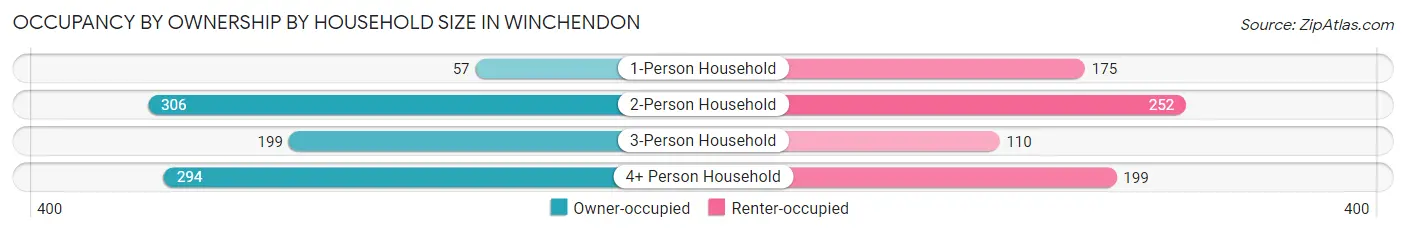
| Household Size | Owner-occupied | Renter-occupied |
| 1-Person Household | 57 (24.6%) | 175 (75.4%) |
| 2-Person Household | 306 (54.8%) | 252 (45.2%) |
| 3-Person Household | 199 (64.4%) | 110 (35.6%) |
| 4+ Person Household | 294 (59.6%) | 199 (40.4%) |
| Total Housing Units | 856 (53.8%) | 736 (46.2%) |
Occupancy by Educational Attainment in Winchendon
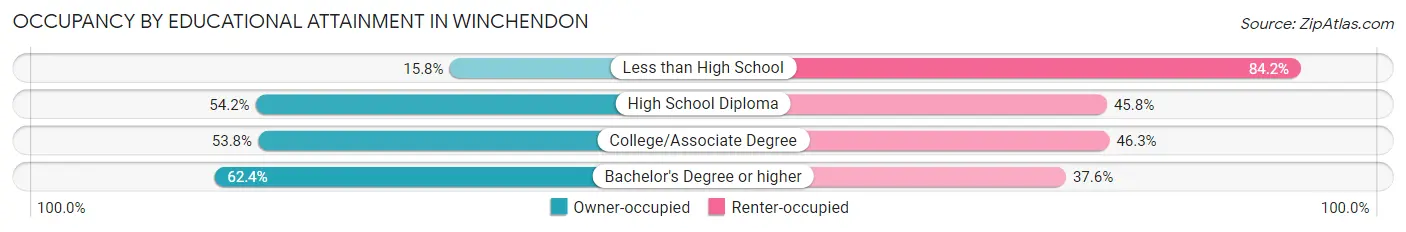
| Household Size | Owner-occupied | Renter-occupied |
| Less than High School | 12 (15.8%) | 64 (84.2%) |
| High School Diploma | 409 (54.2%) | 345 (45.8%) |
| College/Associate Degree | 251 (53.7%) | 216 (46.3%) |
| Bachelor's Degree or higher | 184 (62.4%) | 111 (37.6%) |
Occupancy by Age of Householder in Winchendon
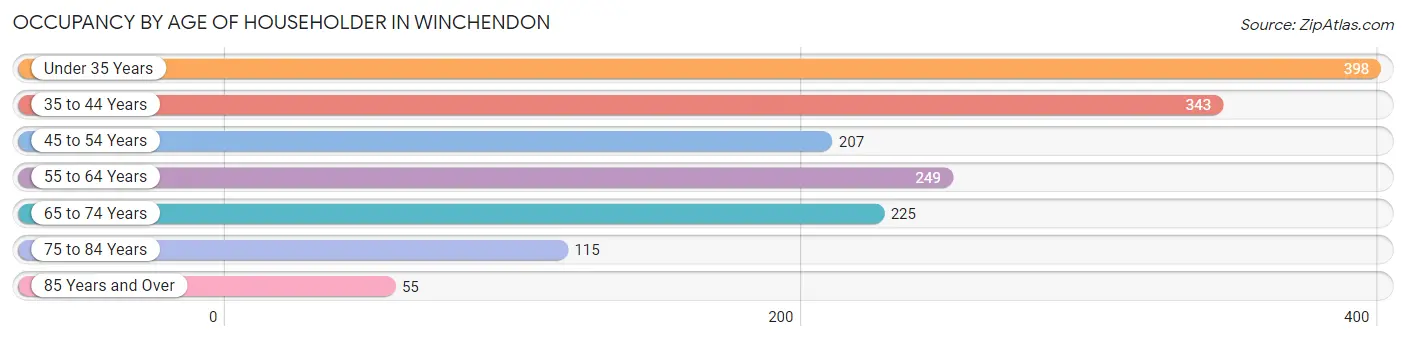
| Age Bracket | # Households | % Households |
| Under 35 Years | 398 | 25.0% |
| 35 to 44 Years | 343 | 21.5% |
| 45 to 54 Years | 207 | 13.0% |
| 55 to 64 Years | 249 | 15.6% |
| 65 to 74 Years | 225 | 14.1% |
| 75 to 84 Years | 115 | 7.2% |
| 85 Years and Over | 55 | 3.5% |
| Total | 1,592 | 100.0% |
Housing Finances in Winchendon
Median Income by Occupancy in Winchendon
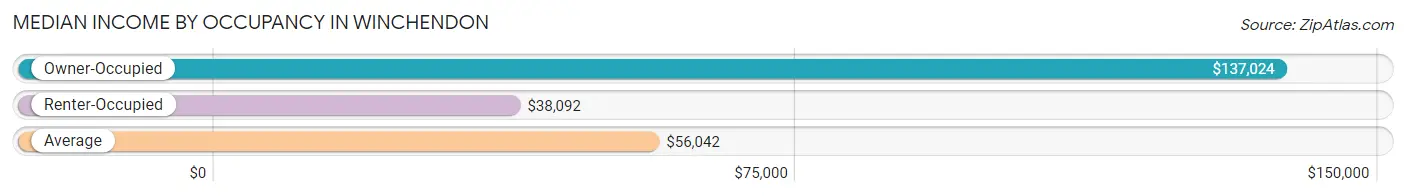
| Occupancy Type | # Households | Median Income |
| Owner-Occupied | 856 (53.8%) | $137,024 |
| Renter-Occupied | 736 (46.2%) | $38,092 |
| Average | 1,592 (100.0%) | $56,042 |
Occupancy by Householder Income Bracket in Winchendon
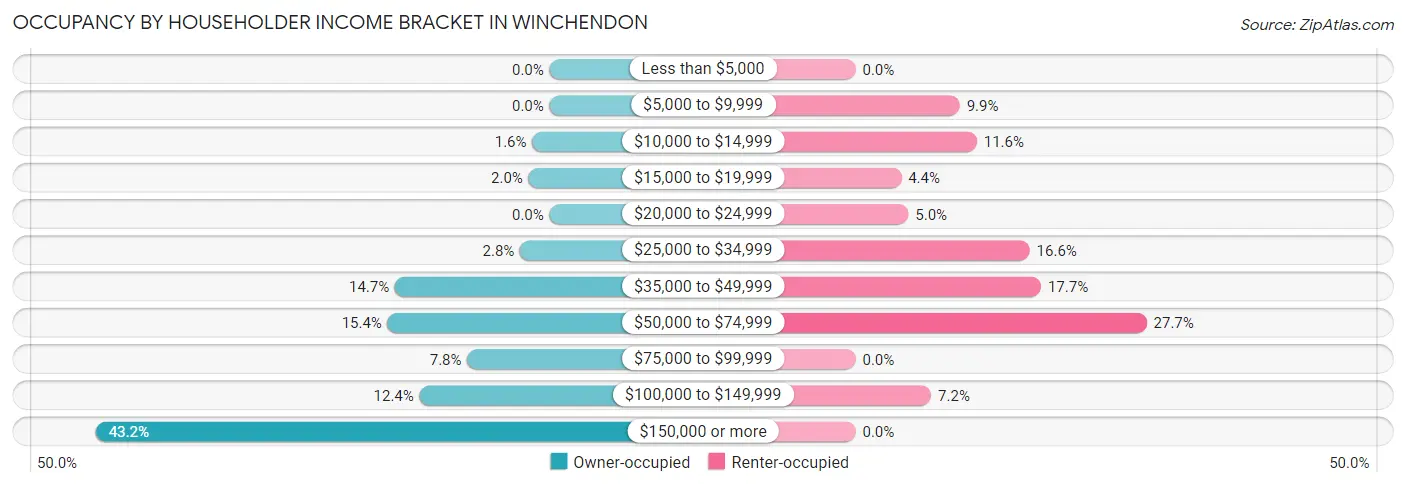
| Income Bracket | Owner-occupied | Renter-occupied |
| Less than $5,000 | 0 (0.0%) | 0 (0.0%) |
| $5,000 to $9,999 | 0 (0.0%) | 73 (9.9%) |
| $10,000 to $14,999 | 14 (1.6%) | 85 (11.6%) |
| $15,000 to $19,999 | 17 (2.0%) | 32 (4.3%) |
| $20,000 to $24,999 | 0 (0.0%) | 37 (5.0%) |
| $25,000 to $34,999 | 24 (2.8%) | 122 (16.6%) |
| $35,000 to $49,999 | 126 (14.7%) | 130 (17.7%) |
| $50,000 to $74,999 | 132 (15.4%) | 204 (27.7%) |
| $75,000 to $99,999 | 67 (7.8%) | 0 (0.0%) |
| $100,000 to $149,999 | 106 (12.4%) | 53 (7.2%) |
| $150,000 or more | 370 (43.2%) | 0 (0.0%) |
| Total | 856 (100.0%) | 736 (100.0%) |
Monthly Housing Cost Tiers in Winchendon
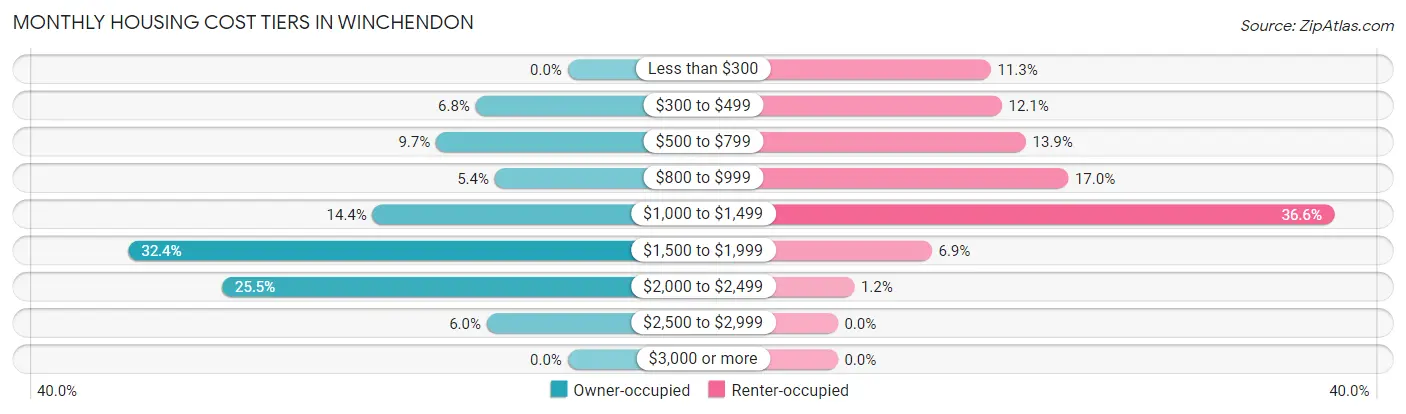
| Monthly Cost | Owner-occupied | Renter-occupied |
| Less than $300 | 0 (0.0%) | 83 (11.3%) |
| $300 to $499 | 58 (6.8%) | 89 (12.1%) |
| $500 to $799 | 83 (9.7%) | 102 (13.9%) |
| $800 to $999 | 46 (5.4%) | 125 (17.0%) |
| $1,000 to $1,499 | 123 (14.4%) | 269 (36.5%) |
| $1,500 to $1,999 | 277 (32.4%) | 51 (6.9%) |
| $2,000 to $2,499 | 218 (25.5%) | 9 (1.2%) |
| $2,500 to $2,999 | 51 (6.0%) | 0 (0.0%) |
| $3,000 or more | 0 (0.0%) | 0 (0.0%) |
| Total | 856 (100.0%) | 736 (100.0%) |
Physical Housing Characteristics in Winchendon
Housing Structures in Winchendon
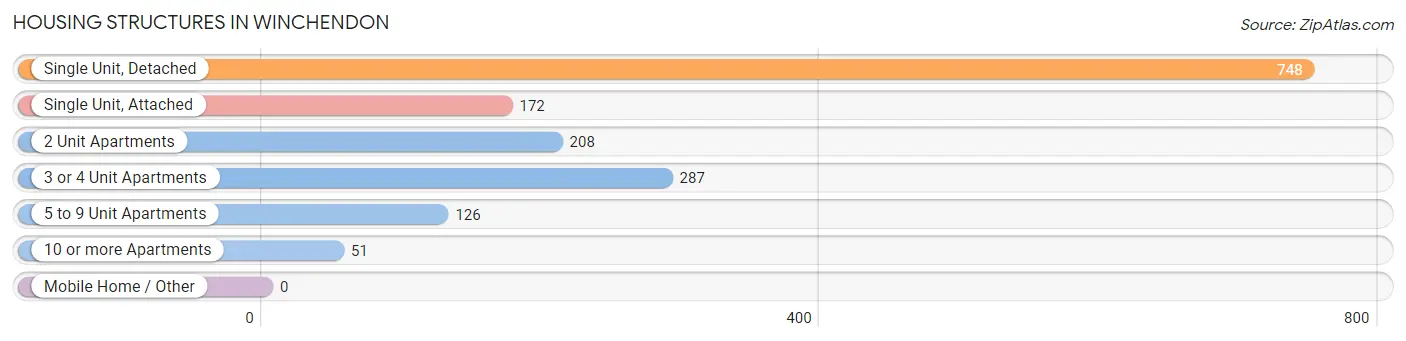
| Structure Type | # Housing Units | % Housing Units |
| Single Unit, Detached | 748 | 47.0% |
| Single Unit, Attached | 172 | 10.8% |
| 2 Unit Apartments | 208 | 13.1% |
| 3 or 4 Unit Apartments | 287 | 18.0% |
| 5 to 9 Unit Apartments | 126 | 7.9% |
| 10 or more Apartments | 51 | 3.2% |
| Mobile Home / Other | 0 | 0.0% |
| Total | 1,592 | 100.0% |
Housing Structures by Occupancy in Winchendon
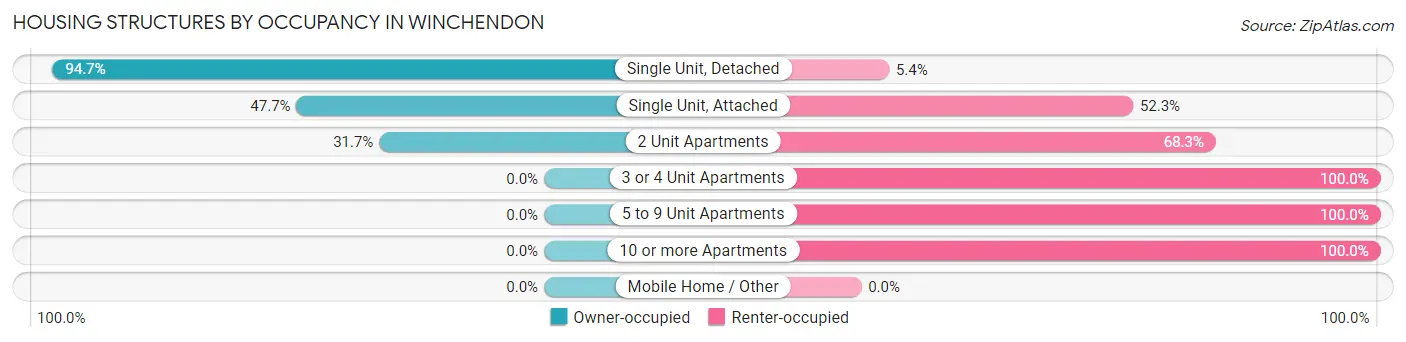
| Structure Type | Owner-occupied | Renter-occupied |
| Single Unit, Detached | 708 (94.7%) | 40 (5.3%) |
| Single Unit, Attached | 82 (47.7%) | 90 (52.3%) |
| 2 Unit Apartments | 66 (31.7%) | 142 (68.3%) |
| 3 or 4 Unit Apartments | 0 (0.0%) | 287 (100.0%) |
| 5 to 9 Unit Apartments | 0 (0.0%) | 126 (100.0%) |
| 10 or more Apartments | 0 (0.0%) | 51 (100.0%) |
| Mobile Home / Other | 0 (0.0%) | 0 (0.0%) |
| Total | 856 (53.8%) | 736 (46.2%) |
Housing Structures by Number of Rooms in Winchendon
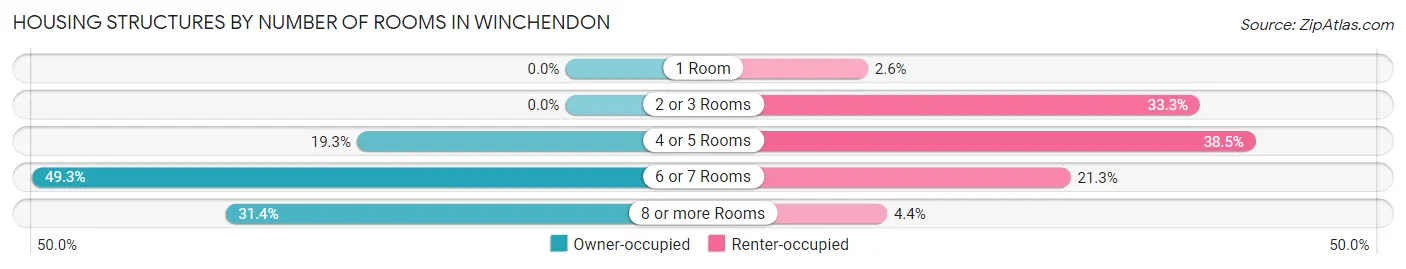
| Number of Rooms | Owner-occupied | Renter-occupied |
| 1 Room | 0 (0.0%) | 19 (2.6%) |
| 2 or 3 Rooms | 0 (0.0%) | 245 (33.3%) |
| 4 or 5 Rooms | 165 (19.3%) | 283 (38.5%) |
| 6 or 7 Rooms | 422 (49.3%) | 157 (21.3%) |
| 8 or more Rooms | 269 (31.4%) | 32 (4.3%) |
| Total | 856 (100.0%) | 736 (100.0%) |
Housing Structure by Heating Type in Winchendon
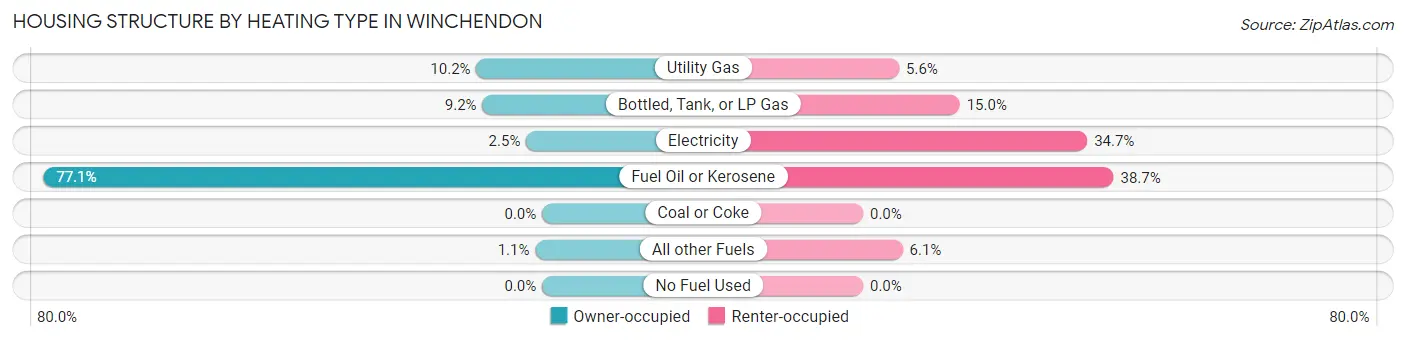
| Heating Type | Owner-occupied | Renter-occupied |
| Utility Gas | 87 (10.2%) | 41 (5.6%) |
| Bottled, Tank, or LP Gas | 79 (9.2%) | 110 (14.9%) |
| Electricity | 21 (2.5%) | 255 (34.6%) |
| Fuel Oil or Kerosene | 660 (77.1%) | 285 (38.7%) |
| Coal or Coke | 0 (0.0%) | 0 (0.0%) |
| All other Fuels | 9 (1.1%) | 45 (6.1%) |
| No Fuel Used | 0 (0.0%) | 0 (0.0%) |
| Total | 856 (100.0%) | 736 (100.0%) |
Household Vehicle Usage in Winchendon
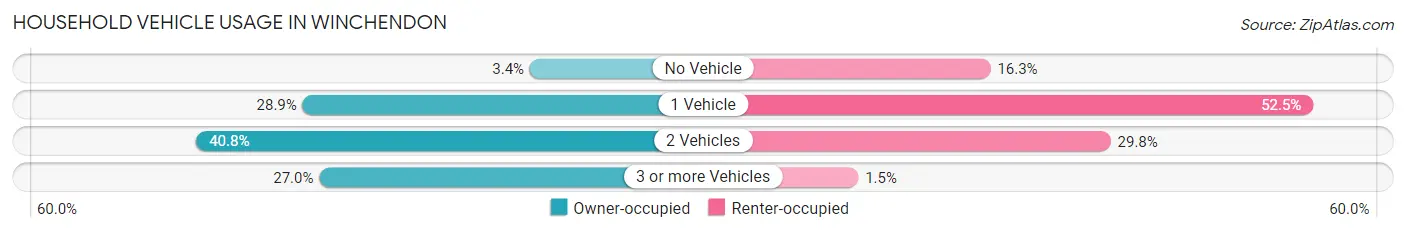
| Vehicles per Household | Owner-occupied | Renter-occupied |
| No Vehicle | 29 (3.4%) | 120 (16.3%) |
| 1 Vehicle | 247 (28.9%) | 386 (52.4%) |
| 2 Vehicles | 349 (40.8%) | 219 (29.8%) |
| 3 or more Vehicles | 231 (27.0%) | 11 (1.5%) |
| Total | 856 (100.0%) | 736 (100.0%) |
Real Estate & Mortgages in Winchendon
Real Estate and Mortgage Overview in Winchendon
| Characteristic | Without Mortgage | With Mortgage |
| Housing Units | 216 | 640 |
| Median Property Value | $189,900 | $244,400 |
| Median Household Income | $68,833 | $334 |
| Monthly Housing Costs | $631 | $0 |
| Real Estate Taxes | $2,896 | $0 |
Property Value by Mortgage Status in Winchendon
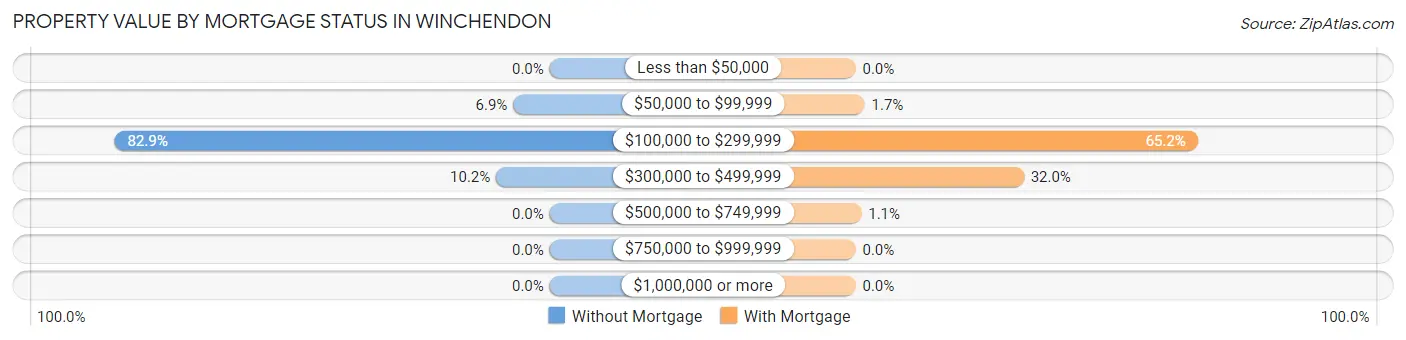
| Property Value | Without Mortgage | With Mortgage |
| Less than $50,000 | 0 (0.0%) | 0 (0.0%) |
| $50,000 to $99,999 | 15 (6.9%) | 11 (1.7%) |
| $100,000 to $299,999 | 179 (82.9%) | 417 (65.2%) |
| $300,000 to $499,999 | 22 (10.2%) | 205 (32.0%) |
| $500,000 to $749,999 | 0 (0.0%) | 7 (1.1%) |
| $750,000 to $999,999 | 0 (0.0%) | 0 (0.0%) |
| $1,000,000 or more | 0 (0.0%) | 0 (0.0%) |
| Total | 216 (100.0%) | 640 (100.0%) |
Household Income by Mortgage Status in Winchendon
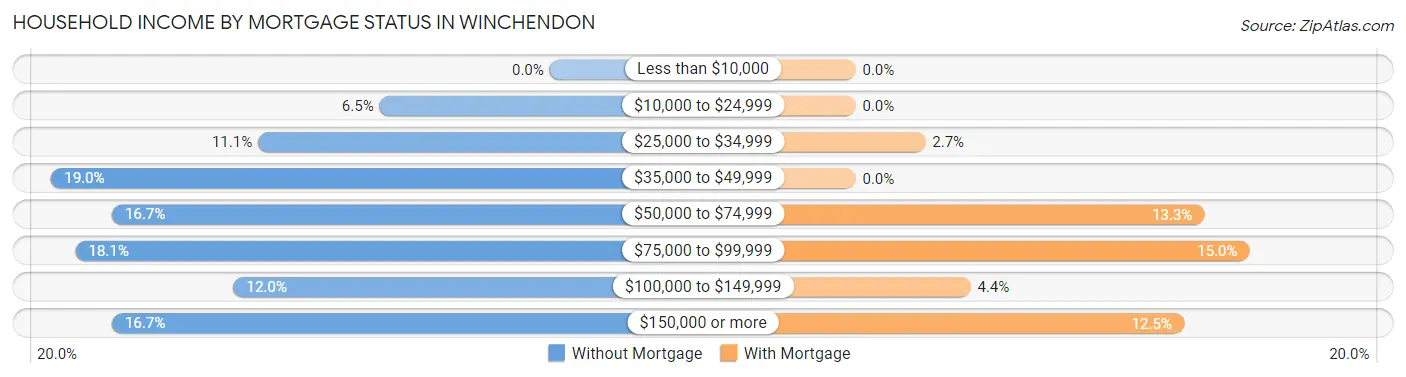
| Household Income | Without Mortgage | With Mortgage |
| Less than $10,000 | 0 (0.0%) | 0 (0.0%) |
| $10,000 to $24,999 | 14 (6.5%) | 0 (0.0%) |
| $25,000 to $34,999 | 24 (11.1%) | 17 (2.7%) |
| $35,000 to $49,999 | 41 (19.0%) | 0 (0.0%) |
| $50,000 to $74,999 | 36 (16.7%) | 85 (13.3%) |
| $75,000 to $99,999 | 39 (18.1%) | 96 (15.0%) |
| $100,000 to $149,999 | 26 (12.0%) | 28 (4.4%) |
| $150,000 or more | 36 (16.7%) | 80 (12.5%) |
| Total | 216 (100.0%) | 640 (100.0%) |
Property Value to Household Income Ratio in Winchendon
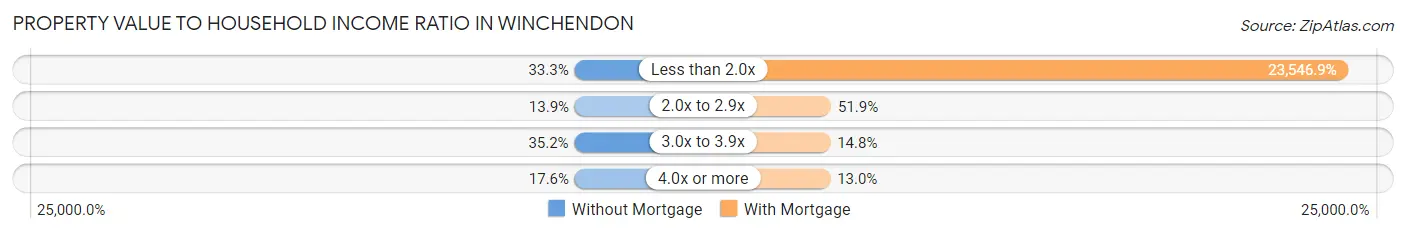
| Value-to-Income Ratio | Without Mortgage | With Mortgage |
| Less than 2.0x | 72 (33.3%) | 150,700 (23,546.9%) |
| 2.0x to 2.9x | 30 (13.9%) | 332 (51.9%) |
| 3.0x to 3.9x | 76 (35.2%) | 95 (14.8%) |
| 4.0x or more | 38 (17.6%) | 83 (13.0%) |
| Total | 216 (100.0%) | 640 (100.0%) |
Real Estate Taxes by Mortgage Status in Winchendon
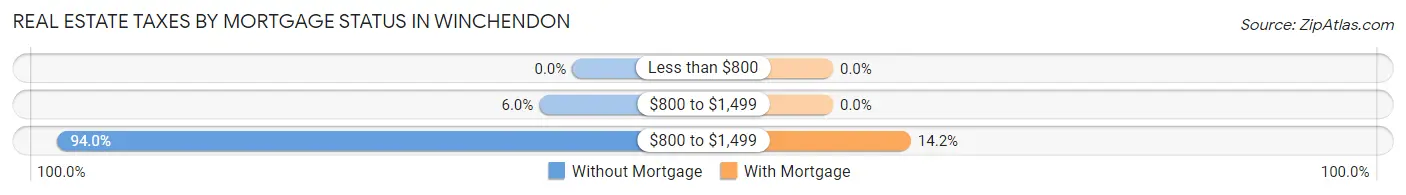
| Property Taxes | Without Mortgage | With Mortgage |
| Less than $800 | 0 (0.0%) | 0 (0.0%) |
| $800 to $1,499 | 13 (6.0%) | 0 (0.0%) |
| $800 to $1,499 | 203 (94.0%) | 91 (14.2%) |
| Total | 216 (100.0%) | 640 (100.0%) |
Health & Disability in Winchendon
Health Insurance Coverage by Age in Winchendon
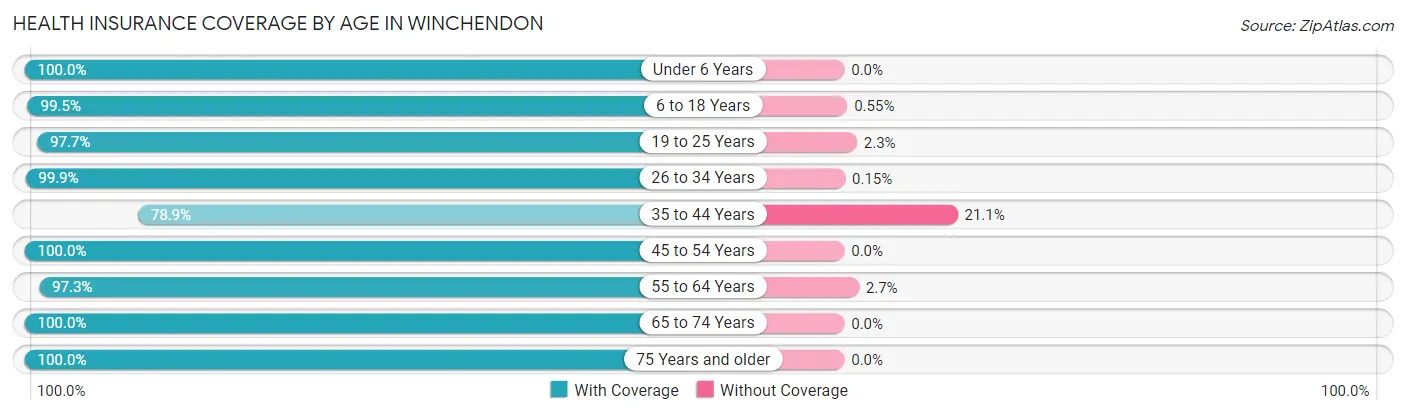
| Age Bracket | With Coverage | Without Coverage |
| Under 6 Years | 352 (100.0%) | 0 (0.0%) |
| 6 to 18 Years | 897 (99.5%) | 5 (0.5%) |
| 19 to 25 Years | 334 (97.7%) | 8 (2.3%) |
| 26 to 34 Years | 669 (99.9%) | 1 (0.2%) |
| 35 to 44 Years | 508 (78.9%) | 136 (21.1%) |
| 45 to 54 Years | 457 (100.0%) | 0 (0.0%) |
| 55 to 64 Years | 465 (97.3%) | 13 (2.7%) |
| 65 to 74 Years | 352 (100.0%) | 0 (0.0%) |
| 75 Years and older | 264 (100.0%) | 0 (0.0%) |
| Total | 4,298 (96.4%) | 163 (3.6%) |
Health Insurance Coverage by Citizenship Status in Winchendon
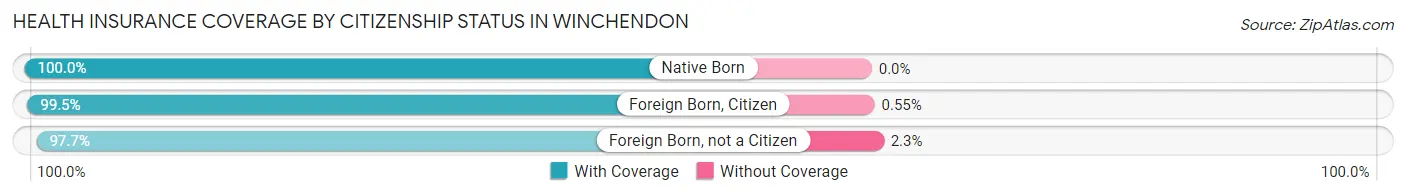
| Citizenship Status | With Coverage | Without Coverage |
| Native Born | 352 (100.0%) | 0 (0.0%) |
| Foreign Born, Citizen | 897 (99.5%) | 5 (0.5%) |
| Foreign Born, not a Citizen | 334 (97.7%) | 8 (2.3%) |
Health Insurance Coverage by Household Income in Winchendon
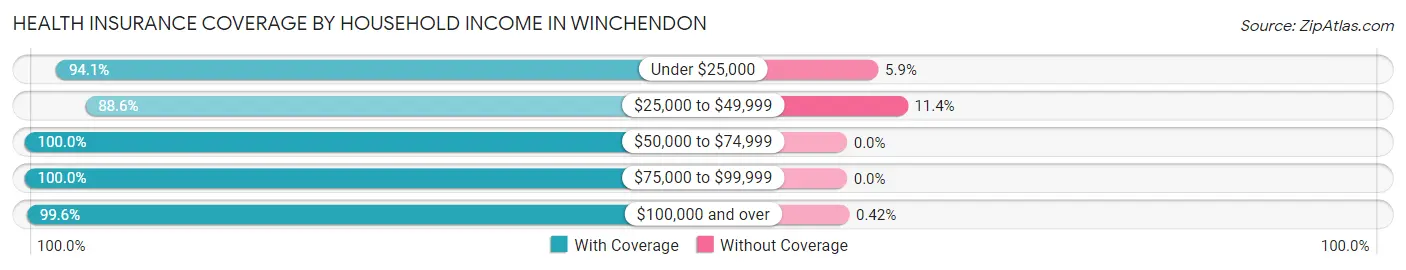
| Household Income | With Coverage | Without Coverage |
| Under $25,000 | 448 (94.1%) | 28 (5.9%) |
| $25,000 to $49,999 | 968 (88.6%) | 124 (11.4%) |
| $50,000 to $74,999 | 727 (100.0%) | 0 (0.0%) |
| $75,000 to $99,999 | 193 (100.0%) | 0 (0.0%) |
| $100,000 and over | 1,875 (99.6%) | 8 (0.4%) |
Public vs Private Health Insurance Coverage by Age in Winchendon
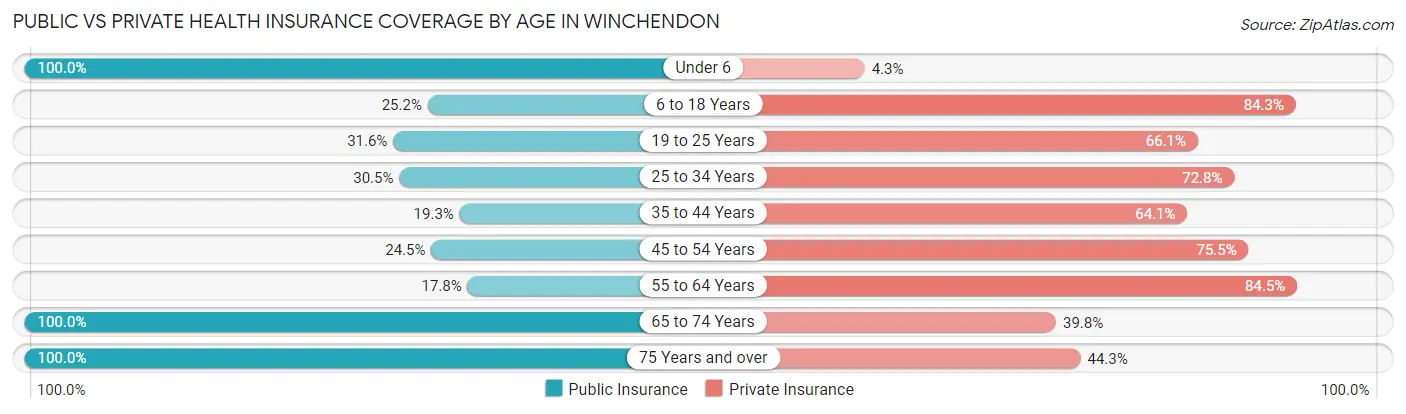
| Age Bracket | Public Insurance | Private Insurance |
| Under 6 | 352 (100.0%) | 15 (4.3%) |
| 6 to 18 Years | 227 (25.2%) | 760 (84.3%) |
| 19 to 25 Years | 108 (31.6%) | 226 (66.1%) |
| 25 to 34 Years | 204 (30.4%) | 488 (72.8%) |
| 35 to 44 Years | 124 (19.3%) | 413 (64.1%) |
| 45 to 54 Years | 112 (24.5%) | 345 (75.5%) |
| 55 to 64 Years | 85 (17.8%) | 404 (84.5%) |
| 65 to 74 Years | 352 (100.0%) | 140 (39.8%) |
| 75 Years and over | 264 (100.0%) | 117 (44.3%) |
| Total | 1,828 (41.0%) | 2,908 (65.2%) |
Disability Status by Sex by Age in Winchendon
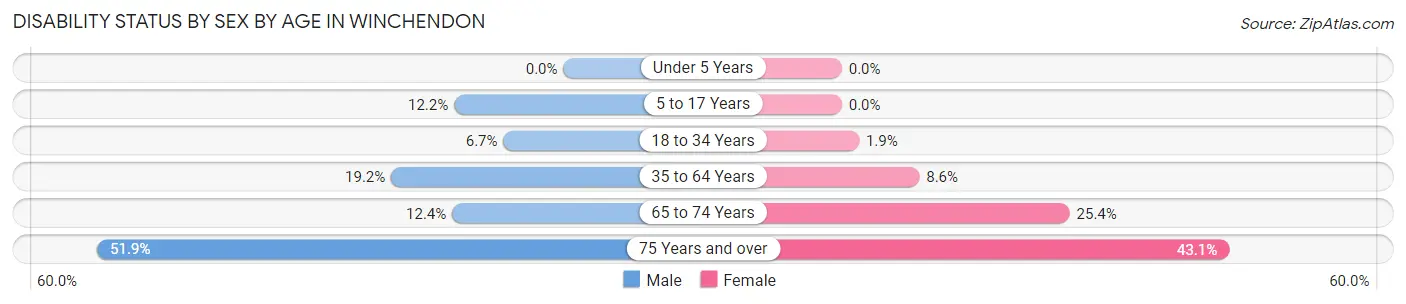
| Age Bracket | Male | Female |
| Under 5 Years | 0 (0.0%) | 0 (0.0%) |
| 5 to 17 Years | 50 (12.2%) | 0 (0.0%) |
| 18 to 34 Years | 38 (6.7%) | 10 (1.9%) |
| 35 to 64 Years | 154 (19.2%) | 67 (8.6%) |
| 65 to 74 Years | 27 (12.4%) | 34 (25.4%) |
| 75 Years and over | 54 (51.9%) | 69 (43.1%) |
Disability Class by Sex by Age in Winchendon
Disability Class: Hearing Difficulty
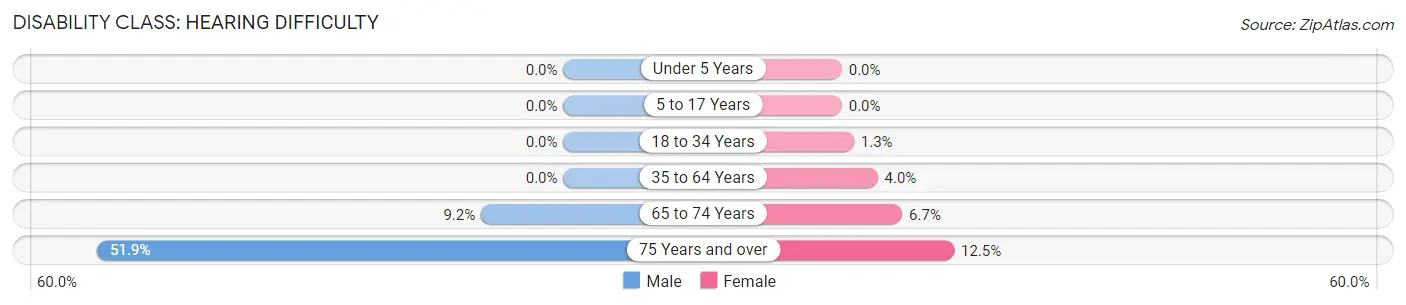
| Age Bracket | Male | Female |
| Under 5 Years | 0 (0.0%) | 0 (0.0%) |
| 5 to 17 Years | 0 (0.0%) | 0 (0.0%) |
| 18 to 34 Years | 0 (0.0%) | 7 (1.3%) |
| 35 to 64 Years | 0 (0.0%) | 31 (4.0%) |
| 65 to 74 Years | 20 (9.2%) | 9 (6.7%) |
| 75 Years and over | 54 (51.9%) | 20 (12.5%) |
Disability Class: Vision Difficulty
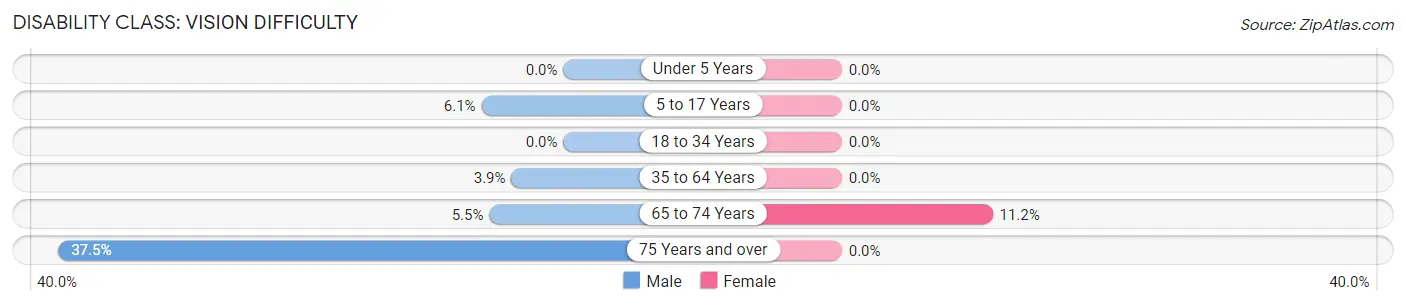
| Age Bracket | Male | Female |
| Under 5 Years | 0 (0.0%) | 0 (0.0%) |
| 5 to 17 Years | 25 (6.1%) | 0 (0.0%) |
| 18 to 34 Years | 0 (0.0%) | 0 (0.0%) |
| 35 to 64 Years | 31 (3.9%) | 0 (0.0%) |
| 65 to 74 Years | 12 (5.5%) | 15 (11.2%) |
| 75 Years and over | 39 (37.5%) | 0 (0.0%) |
Disability Class: Cognitive Difficulty
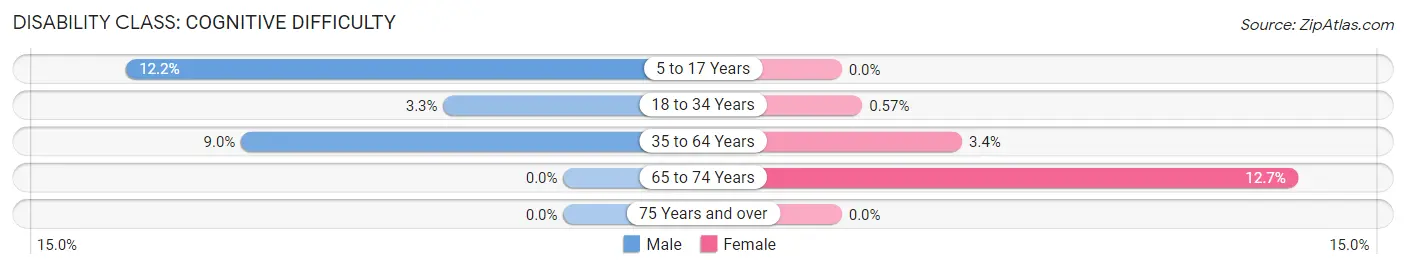
| Age Bracket | Male | Female |
| 5 to 17 Years | 50 (12.2%) | 0 (0.0%) |
| 18 to 34 Years | 19 (3.3%) | 3 (0.6%) |
| 35 to 64 Years | 72 (9.0%) | 26 (3.4%) |
| 65 to 74 Years | 0 (0.0%) | 17 (12.7%) |
| 75 Years and over | 0 (0.0%) | 0 (0.0%) |
Disability Class: Ambulatory Difficulty
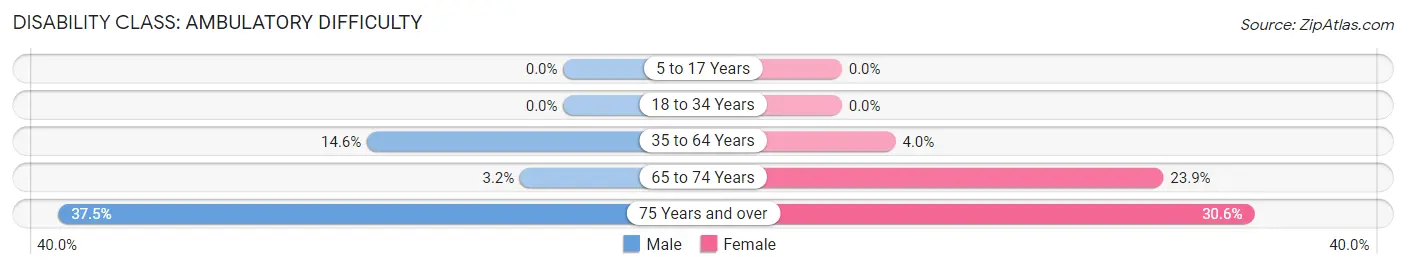
| Age Bracket | Male | Female |
| 5 to 17 Years | 0 (0.0%) | 0 (0.0%) |
| 18 to 34 Years | 0 (0.0%) | 0 (0.0%) |
| 35 to 64 Years | 117 (14.6%) | 31 (4.0%) |
| 65 to 74 Years | 7 (3.2%) | 32 (23.9%) |
| 75 Years and over | 39 (37.5%) | 49 (30.6%) |
Disability Class: Self-Care Difficulty
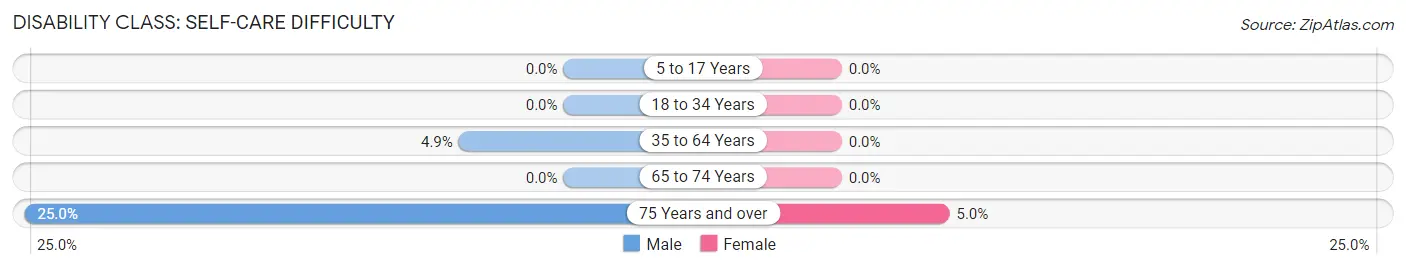
| Age Bracket | Male | Female |
| 5 to 17 Years | 0 (0.0%) | 0 (0.0%) |
| 18 to 34 Years | 0 (0.0%) | 0 (0.0%) |
| 35 to 64 Years | 39 (4.9%) | 0 (0.0%) |
| 65 to 74 Years | 0 (0.0%) | 0 (0.0%) |
| 75 Years and over | 26 (25.0%) | 8 (5.0%) |
Technology Access in Winchendon
Computing Device Access in Winchendon
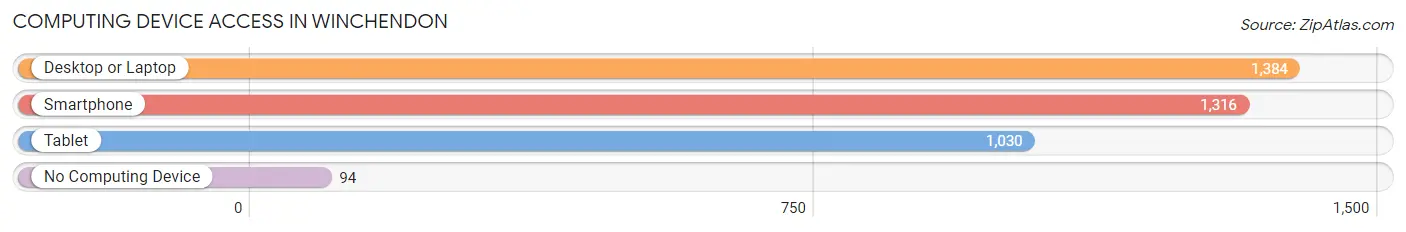
| Device Type | # Households | % Households |
| Desktop or Laptop | 1,384 | 86.9% |
| Smartphone | 1,316 | 82.7% |
| Tablet | 1,030 | 64.7% |
| No Computing Device | 94 | 5.9% |
| Total | 1,592 | 100.0% |
Internet Access in Winchendon
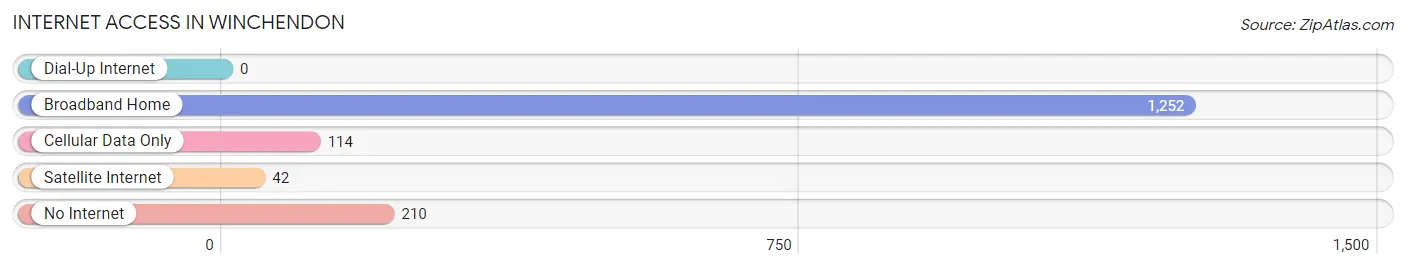
| Internet Type | # Households | % Households |
| Dial-Up Internet | 0 | 0.0% |
| Broadband Home | 1,252 | 78.6% |
| Cellular Data Only | 114 | 7.2% |
| Satellite Internet | 42 | 2.6% |
| No Internet | 210 | 13.2% |
| Total | 1,592 | 100.0% |
Winchendon Summary
Winchendon is a town located in Worcester County, Massachusetts, United States. The population was 10,300 at the 2010 census. It is part of the Gardner, Massachusetts Micropolitan Statistical Area.
History
Winchendon was first settled in 1720 and was officially incorporated in 1764. The town was named after the English village of Winchendon in Buckinghamshire. The town was originally part of the town of Ashburnham, Massachusetts, and was known as "Narragansett Number 4". The town was a major center for the production of wooden clocks in the 19th century.
Geography
Winchendon is located at (42.717, -71.937). According to the United States Census Bureau, the town has a total area of 24.2 square miles (62.7 km2), of which 23.9 square miles (61.9 km2) is land and 0.3 square miles (0.8 km2) (1.17%) is water.
The town is bordered by Ashburnham to the north, Royalston to the east, Templeton to the south, and Gardner to the west. The town is located in the northern part of Worcester County, and is approximately 40 miles (64 km) northwest of Boston.
Economy
Winchendon is home to several small businesses, including a number of manufacturing companies. The town is also home to the Winchendon School, a private boarding school.
Demographics
As of the census of 2000, there were 9,845 people, 3,845 households, and 2,541 families residing in the town. The population density was 412.2 people per square mile (159.2/km2). There were 4,068 housing units at an average density of 170.2 per square mile (65.7/km2). The racial makeup of the town was 97.17% White, 0.45% African American, 0.20% Native American, 0.45% Asian, 0.02% Pacific Islander, 0.45% from other races, and 1.26% from two or more races. Hispanic or Latino of any race were 1.17% of the population.
There were 3,845 households, out of which 33.2% had children under the age of 18 living with them, 50.2% were married couples living together, 11.7% had a female householder with no husband present, and 33.2% were non-families. 27.2% of all households were made up of individuals, and 11.7% had someone living alone who was 65 years of age or older. The average household size was 2.54 and the average family size was 3.10.
In the town, the population was spread out, with 26.2% under the age of 18, 8.2% from 18 to 24, 30.2% from 25 to 44, 21.2% from 45 to 64, and 14.2% who were 65 years of age or older. The median age was 36 years. For every 100 females, there were 93.2 males. For every 100 females age 18 and over, there were 89.7 males.
The median income for a household in the town was $41,919, and the median income for a family was $50,917. Males had a median income of $36,945 versus $26,945 for females. The per capita income for the town was $19,845. About 5.2% of families and 7.3% of the population were below the poverty line, including 8.2% of those under age 18 and 8.2% of those age 65 or over.
Common Questions
What is Per Capita Income in Winchendon?
Per Capita income in Winchendon is $34,283.
What is the Median Family Income in Winchendon?
Median Family Income in Winchendon is $65,236.
What is the Median Household income in Winchendon?
Median Household Income in Winchendon is $56,042.
What is Income or Wage Gap in Winchendon?
Income or Wage Gap in Winchendon is 7.4%.
Women in Winchendon earn 92.6 cents for every dollar earned by a man.
What is Inequality or Gini Index in Winchendon?
Inequality or Gini Index in Winchendon is 0.49.
What is the Total Population of Winchendon?
Total Population of Winchendon is 4,461.
What is the Total Male Population of Winchendon?
Total Male Population of Winchendon is 2,209.
What is the Total Female Population of Winchendon?
Total Female Population of Winchendon is 2,252.
What is the Ratio of Males per 100 Females in Winchendon?
There are 98.09 Males per 100 Females in Winchendon.
What is the Ratio of Females per 100 Males in Winchendon?
There are 101.95 Females per 100 Males in Winchendon.
What is the Median Population Age in Winchendon?
Median Population Age in Winchendon is 33.7 Years.
What is the Average Family Size in Winchendon
Average Family Size in Winchendon is 3.0 People.
What is the Average Household Size in Winchendon
Average Household Size in Winchendon is 2.8 People.
How Large is the Labor Force in Winchendon?
There are 2,204 People in the Labor Forcein in Winchendon.
What is the Percentage of People in the Labor Force in Winchendon?
63.9% of People are in the Labor Force in Winchendon.
What is the Unemployment Rate in Winchendon?
Unemployment Rate in Winchendon is 6.8%.