Towson, MD Map & Demographics
Towson Map
Towson Overview
$57,897
PER CAPITA INCOME
$150,639
AVG FAMILY INCOME
$98,425
AVG HOUSEHOLD INCOME
45.8%
WAGE / INCOME GAP [ % ]
54.2¢/ $1
WAGE / INCOME GAP [ $ ]
$13,571
FAMILY INCOME DEFICIT
0.50
INEQUALITY / GINI INDEX
57,617
TOTAL POPULATION
26,596
MALE POPULATION
31,021
FEMALE POPULATION
85.74
MALES / 100 FEMALES
116.64
FEMALES / 100 MALES
33.9
MEDIAN AGE
3.0
AVG FAMILY SIZE
2.2
AVG HOUSEHOLD SIZE
30,161
LABOR FORCE [ PEOPLE ]
61.9%
PERCENT IN LABOR FORCE
4.6%
UNEMPLOYMENT RATE
Income in Towson
Income Overview in Towson
Per Capita Income in Towson is $57,897, while median incomes of families and households are $150,639 and $98,425 respectively.
| Characteristic | Number | Measure |
| Per Capita Income | 57,617 | $57,897 |
| Median Family Income | 11,865 | $150,639 |
| Mean Family Income | 11,865 | $197,016 |
| Median Household Income | 22,430 | $98,425 |
| Mean Household Income | 22,430 | $142,428 |
| Income Deficit | 11,865 | $13,571 |
| Wage / Income Gap (%) | 57,617 | 45.85% |
| Wage / Income Gap ($) | 57,617 | 54.15¢ per $1 |
| Gini / Inequality Index | 57,617 | 0.50 |
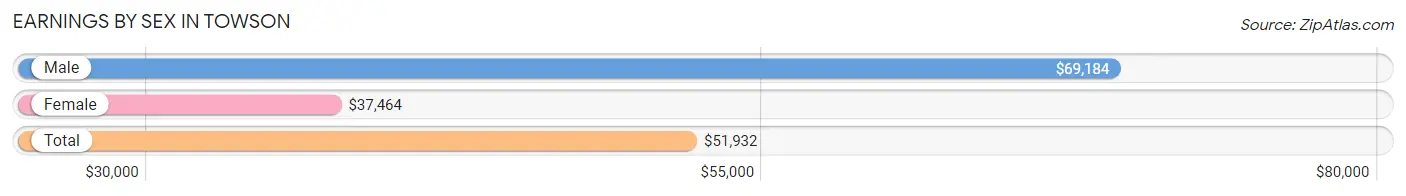
Earnings by Sex in Towson
Average Earnings in Towson are $51,932, $69,184 for men and $37,464 for women, a difference of 45.9%.
| Sex | Number | Average Earnings |
| Male | 15,766 (46.5%) | $69,184 |
| Female | 18,165 (53.5%) | $37,464 |
| Total | 33,931 (100.0%) | $51,932 |
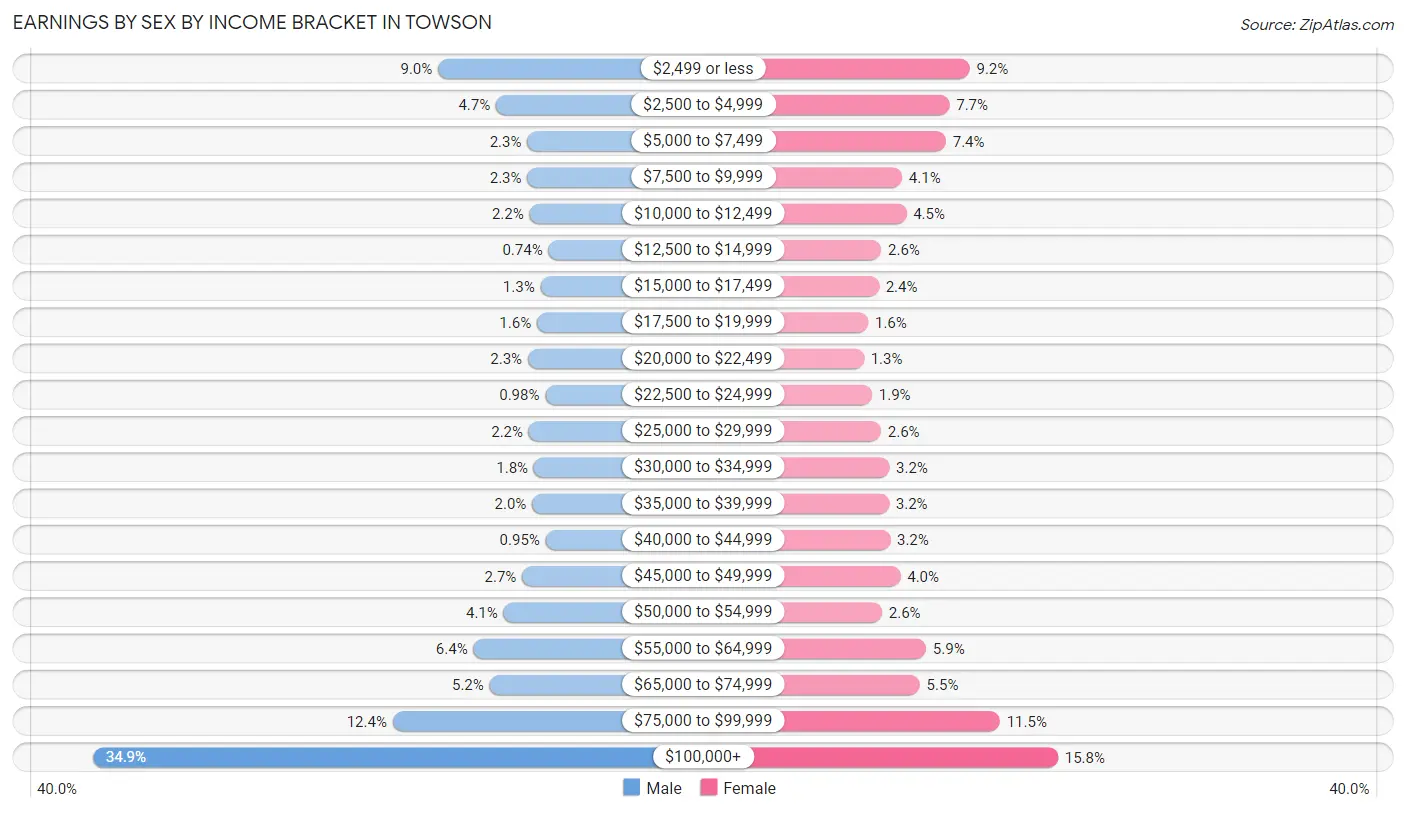
Earnings by Sex by Income Bracket in Towson
The most common earnings brackets in Towson are $100,000+ for men (5,499 | 34.9%) and $100,000+ for women (2,871 | 15.8%).
| Income | Male | Female |
| $2,499 or less | 1,421 (9.0%) | 1,672 (9.2%) |
| $2,500 to $4,999 | 737 (4.7%) | 1,395 (7.7%) |
| $5,000 to $7,499 | 368 (2.3%) | 1,347 (7.4%) |
| $7,500 to $9,999 | 366 (2.3%) | 751 (4.1%) |
| $10,000 to $12,499 | 340 (2.2%) | 808 (4.4%) |
| $12,500 to $14,999 | 116 (0.7%) | 467 (2.6%) |
| $15,000 to $17,499 | 212 (1.3%) | 434 (2.4%) |
| $17,500 to $19,999 | 252 (1.6%) | 289 (1.6%) |
| $20,000 to $22,499 | 359 (2.3%) | 230 (1.3%) |
| $22,500 to $24,999 | 155 (1.0%) | 342 (1.9%) |
| $25,000 to $29,999 | 348 (2.2%) | 464 (2.5%) |
| $30,000 to $34,999 | 289 (1.8%) | 576 (3.2%) |
| $35,000 to $39,999 | 309 (2.0%) | 573 (3.2%) |
| $40,000 to $44,999 | 150 (0.9%) | 589 (3.2%) |
| $45,000 to $49,999 | 428 (2.7%) | 728 (4.0%) |
| $50,000 to $54,999 | 646 (4.1%) | 478 (2.6%) |
| $55,000 to $64,999 | 1,002 (6.4%) | 1,077 (5.9%) |
| $65,000 to $74,999 | 812 (5.1%) | 992 (5.5%) |
| $75,000 to $99,999 | 1,957 (12.4%) | 2,082 (11.5%) |
| $100,000+ | 5,499 (34.9%) | 2,871 (15.8%) |
| Total | 15,766 (100.0%) | 18,165 (100.0%) |
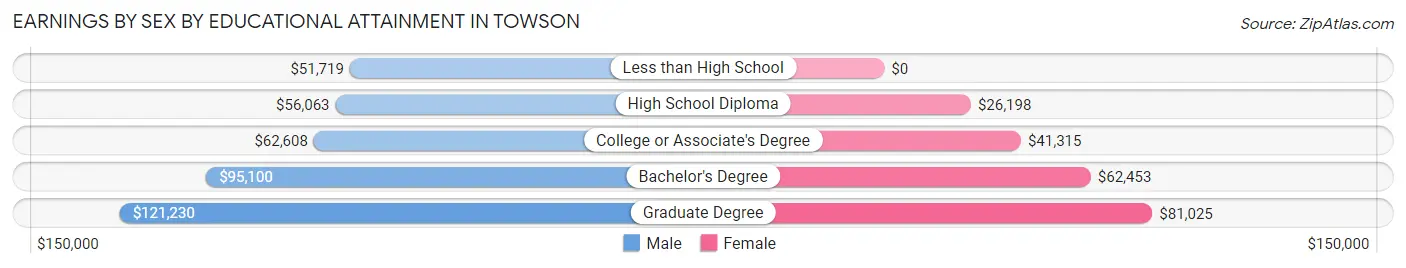
Earnings by Sex by Educational Attainment in Towson
Average earnings in Towson are $90,191 for men and $61,925 for women, a difference of 31.3%. Men with an educational attainment of graduate degree enjoy the highest average annual earnings of $121,230, while those with less than high school education earn the least with $51,719. Women with an educational attainment of graduate degree earn the most with the average annual earnings of $81,025, while those with high school diploma education have the smallest earnings of $26,198.
| Educational Attainment | Male Income | Female Income |
| Less than High School | $51,719 | $0 |
| High School Diploma | $56,063 | $26,198 |
| College or Associate's Degree | $62,608 | $41,315 |
| Bachelor's Degree | $95,100 | $62,453 |
| Graduate Degree | $121,230 | $81,025 |
| Total | $90,191 | $61,925 |
Family Income in Towson
Family Income Brackets in Towson
According to the Towson family income data, there are 4,082 families falling into the $200,000+ income range, which is the most common income bracket and makes up 34.4% of all families. Conversely, the $10,000 to $14,999 income bracket is the least frequent group with only 71 families (0.6%) belonging to this category.
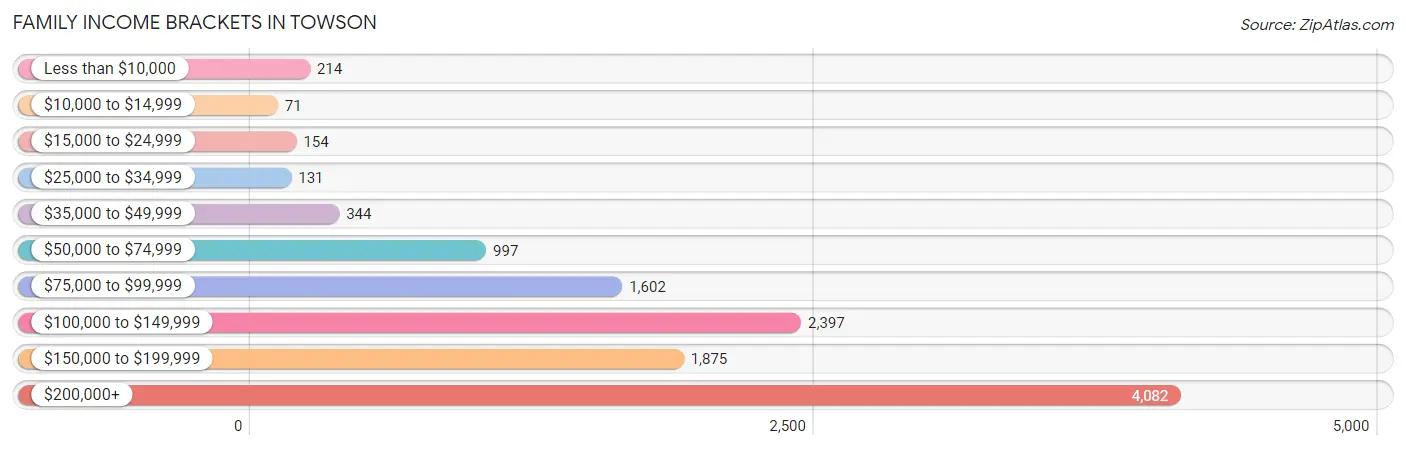
| Income Bracket | # Families | % Families |
| Less than $10,000 | 214 | 1.8% |
| $10,000 to $14,999 | 71 | 0.6% |
| $15,000 to $24,999 | 154 | 1.3% |
| $25,000 to $34,999 | 131 | 1.1% |
| $35,000 to $49,999 | 344 | 2.9% |
| $50,000 to $74,999 | 997 | 8.4% |
| $75,000 to $99,999 | 1,602 | 13.5% |
| $100,000 to $149,999 | 2,397 | 20.2% |
| $150,000 to $199,999 | 1,875 | 15.8% |
| $200,000+ | 4,082 | 34.4% |
Family Income by Famaliy Size in Towson
6-person families (164 | 1.4%) account for the highest median family income in Towson with $218,750 per family, while 2-person families (5,554 | 46.8%) have the highest median income of $58,976 per family member.
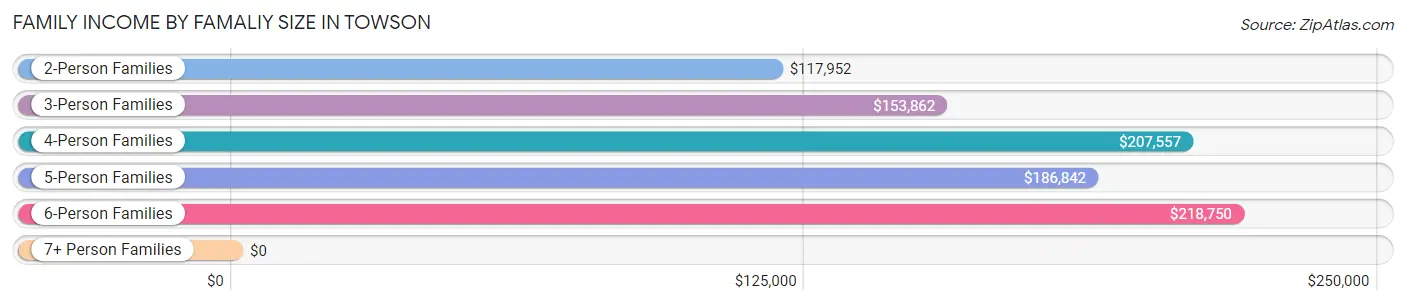
| Income Bracket | # Families | Median Income |
| 2-Person Families | 5,554 (46.8%) | $117,952 |
| 3-Person Families | 2,953 (24.9%) | $153,862 |
| 4-Person Families | 2,505 (21.1%) | $207,557 |
| 5-Person Families | 674 (5.7%) | $186,842 |
| 6-Person Families | 164 (1.4%) | $218,750 |
| 7+ Person Families | 15 (0.1%) | $0 |
| Total | 11,865 (100.0%) | $150,639 |
Family Income by Number of Earners in Towson
The median family income in Towson is $150,639, with families comprising 3+ earners (1,009) having the highest median family income of $209,809, while families with no earners (1,263) have the lowest median family income of $92,198, accounting for 8.5% and 10.6% of families, respectively.
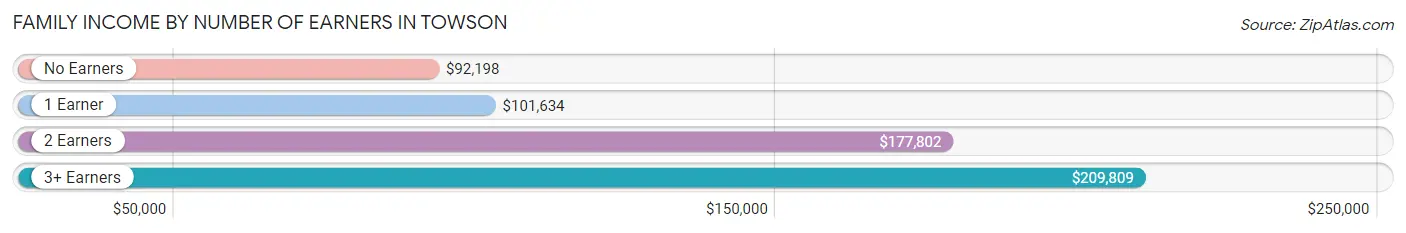
| Number of Earners | # Families | Median Income |
| No Earners | 1,263 (10.6%) | $92,198 |
| 1 Earner | 3,615 (30.5%) | $101,634 |
| 2 Earners | 5,978 (50.4%) | $177,802 |
| 3+ Earners | 1,009 (8.5%) | $209,809 |
| Total | 11,865 (100.0%) | $150,639 |
Household Income in Towson
Household Income Brackets in Towson
With 4,822 households falling in the category, the $200,000+ income range is the most frequent in Towson, accounting for 21.5% of all households. In contrast, only 404 households (1.8%) fall into the $10,000 to $14,999 income bracket, making it the least populous group.
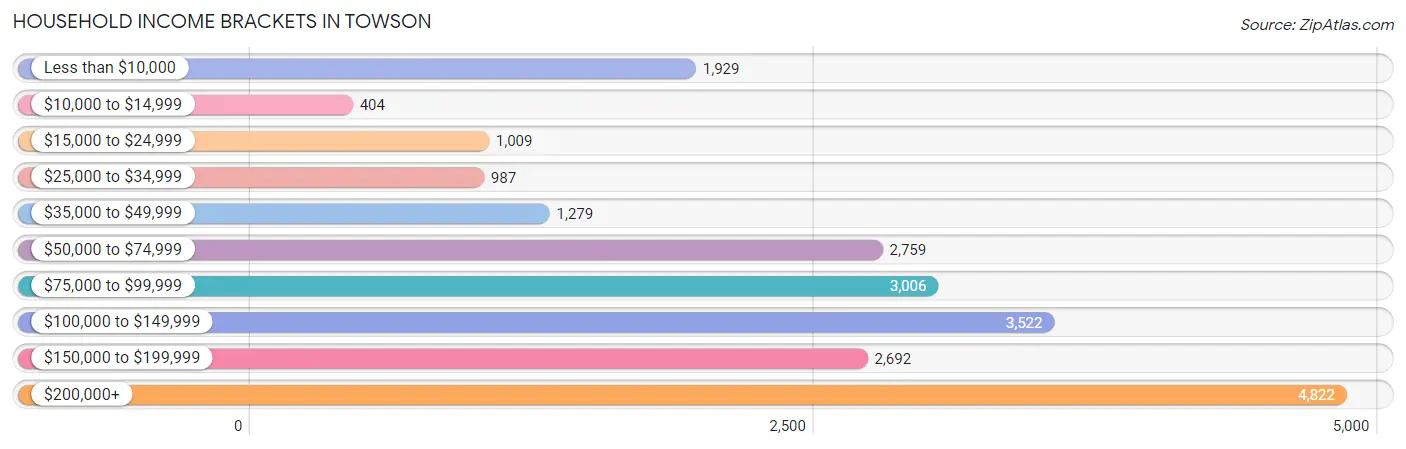
| Income Bracket | # Households | % Households |
| Less than $10,000 | 1,929 | 8.6% |
| $10,000 to $14,999 | 404 | 1.8% |
| $15,000 to $24,999 | 1,009 | 4.5% |
| $25,000 to $34,999 | 987 | 4.4% |
| $35,000 to $49,999 | 1,279 | 5.7% |
| $50,000 to $74,999 | 2,759 | 12.3% |
| $75,000 to $99,999 | 3,006 | 13.4% |
| $100,000 to $149,999 | 3,522 | 15.7% |
| $150,000 to $199,999 | 2,692 | 12.0% |
| $200,000+ | 4,822 | 21.5% |
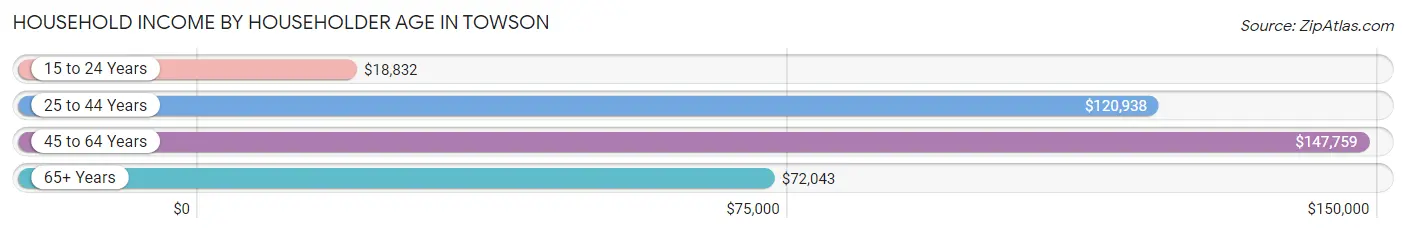
Household Income by Householder Age in Towson
The median household income in Towson is $98,425, with the highest median household income of $147,759 found in the 45 to 64 years age bracket for the primary householder. A total of 7,000 households (31.2%) fall into this category. Meanwhile, the 15 to 24 years age bracket for the primary householder has the lowest median household income of $18,832, with 2,093 households (9.3%) in this group.
| Income Bracket | # Households | Median Income |
| 15 to 24 Years | 2,093 (9.3%) | $18,832 |
| 25 to 44 Years | 6,708 (29.9%) | $120,938 |
| 45 to 64 Years | 7,000 (31.2%) | $147,759 |
| 65+ Years | 6,629 (29.5%) | $72,043 |
| Total | 22,430 (100.0%) | $98,425 |
Poverty in Towson
Income Below Poverty by Sex and Age in Towson
With 9.5% poverty level for males and 13.5% for females among the residents of Towson, 18 to 24 year old males and 18 to 24 year old females are the most vulnerable to poverty, with 1,196 males (45.7%) and 1,881 females (51.1%) in their respective age groups living below the poverty level.
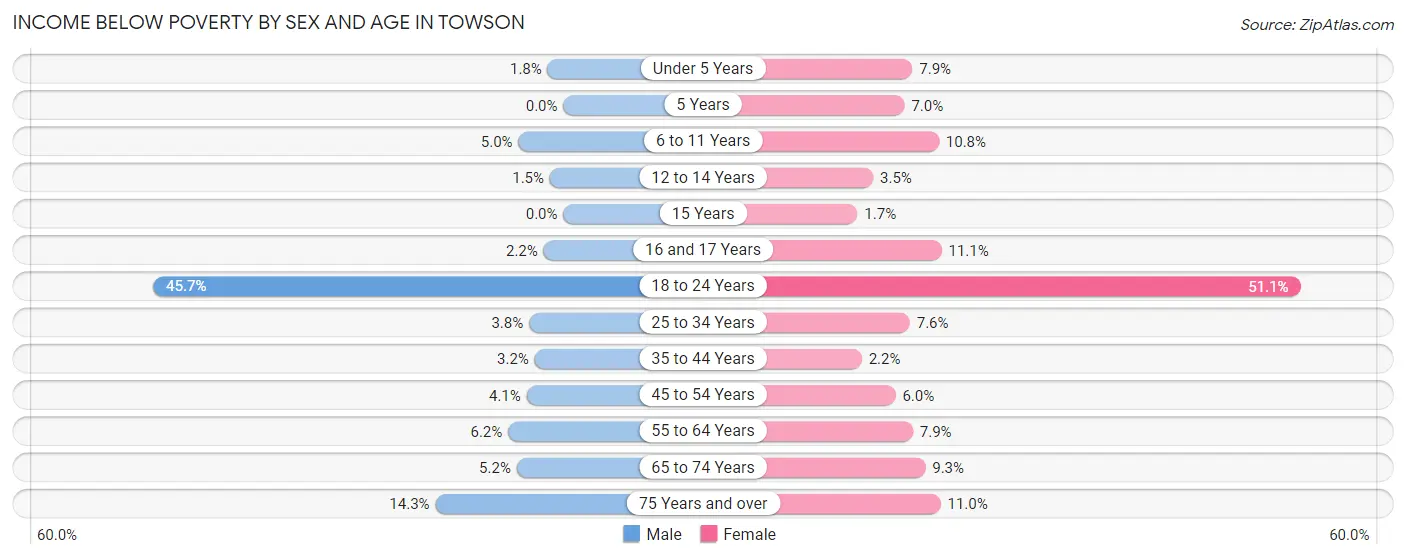
| Age Bracket | Male | Female |
| Under 5 Years | 19 (1.8%) | 103 (7.9%) |
| 5 Years | 0 (0.0%) | 18 (7.0%) |
| 6 to 11 Years | 98 (5.0%) | 186 (10.8%) |
| 12 to 14 Years | 13 (1.5%) | 31 (3.5%) |
| 15 Years | 0 (0.0%) | 5 (1.7%) |
| 16 and 17 Years | 12 (2.2%) | 59 (11.1%) |
| 18 to 24 Years | 1,196 (45.7%) | 1,881 (51.1%) |
| 25 to 34 Years | 131 (3.8%) | 293 (7.6%) |
| 35 to 44 Years | 99 (3.2%) | 60 (2.2%) |
| 45 to 54 Years | 111 (4.1%) | 183 (6.0%) |
| 55 to 64 Years | 160 (6.1%) | 238 (7.9%) |
| 65 to 74 Years | 113 (5.2%) | 250 (9.3%) |
| 75 Years and over | 265 (14.2%) | 338 (11.0%) |
| Total | 2,217 (9.5%) | 3,645 (13.5%) |
Income Above Poverty by Sex and Age in Towson
According to the poverty statistics in Towson, males aged 5 years and females aged 15 years are the age groups that are most secure financially, with 100.0% of males and 98.3% of females in these age groups living above the poverty line.
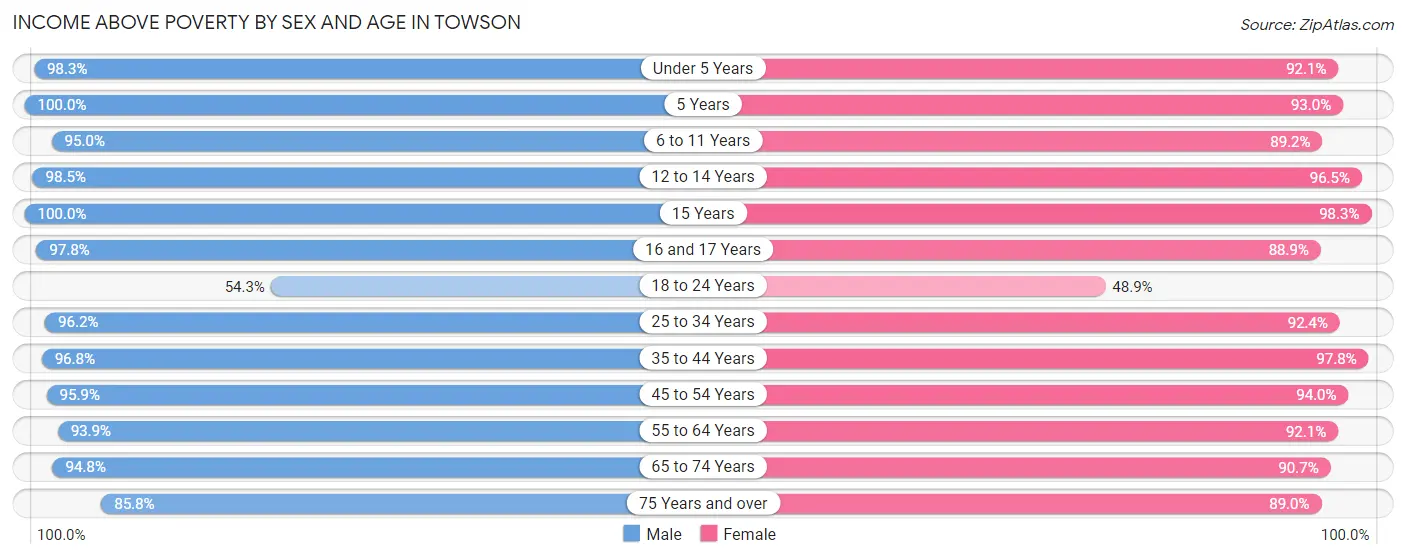
| Age Bracket | Male | Female |
| Under 5 Years | 1,066 (98.3%) | 1,208 (92.1%) |
| 5 Years | 150 (100.0%) | 240 (93.0%) |
| 6 to 11 Years | 1,863 (95.0%) | 1,535 (89.2%) |
| 12 to 14 Years | 856 (98.5%) | 856 (96.5%) |
| 15 Years | 278 (100.0%) | 282 (98.3%) |
| 16 and 17 Years | 533 (97.8%) | 472 (88.9%) |
| 18 to 24 Years | 1,422 (54.3%) | 1,802 (48.9%) |
| 25 to 34 Years | 3,300 (96.2%) | 3,580 (92.4%) |
| 35 to 44 Years | 3,006 (96.8%) | 2,648 (97.8%) |
| 45 to 54 Years | 2,600 (95.9%) | 2,878 (94.0%) |
| 55 to 64 Years | 2,443 (93.9%) | 2,770 (92.1%) |
| 65 to 74 Years | 2,063 (94.8%) | 2,439 (90.7%) |
| 75 Years and over | 1,595 (85.8%) | 2,736 (89.0%) |
| Total | 21,175 (90.5%) | 23,446 (86.6%) |
Income Below Poverty Among Married-Couple Families in Towson
The poverty statistics for married-couple families in Towson show that 1.7% or 156 of the total 9,259 families live below the poverty line. Families with 3 or 4 children have the highest poverty rate of 5.4%, comprising of 33 families. On the other hand, families with 5 or more children have the lowest poverty rate of 0.0%, which includes 0 families.
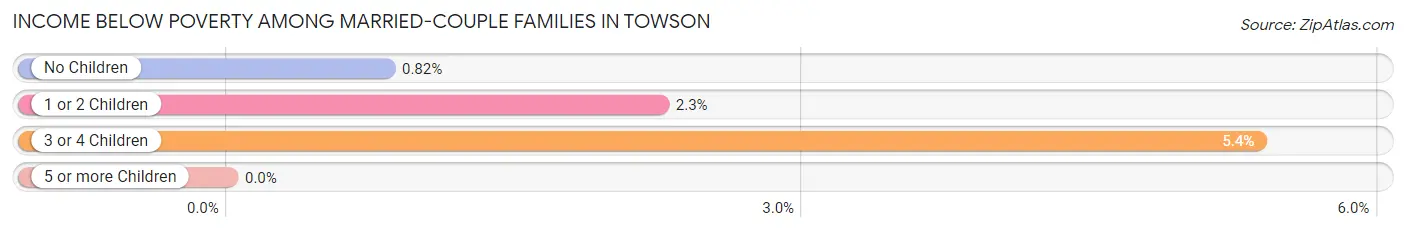
| Children | Above Poverty | Below Poverty |
| No Children | 4,946 (99.2%) | 41 (0.8%) |
| 1 or 2 Children | 3,564 (97.8%) | 82 (2.2%) |
| 3 or 4 Children | 582 (94.6%) | 33 (5.4%) |
| 5 or more Children | 11 (100.0%) | 0 (0.0%) |
| Total | 9,103 (98.3%) | 156 (1.7%) |
Income Below Poverty Among Single-Parent Households in Towson
According to the poverty data in Towson, 16.8% or 162 single-father households and 6.5% or 106 single-mother households are living below the poverty line. Among single-father households, those with 3 or 4 children have the highest poverty rate, with 19 households (31.7%) experiencing poverty. Likewise, among single-mother households, those with 1 or 2 children have the highest poverty rate, with 84 households (9.3%) falling below the poverty line.
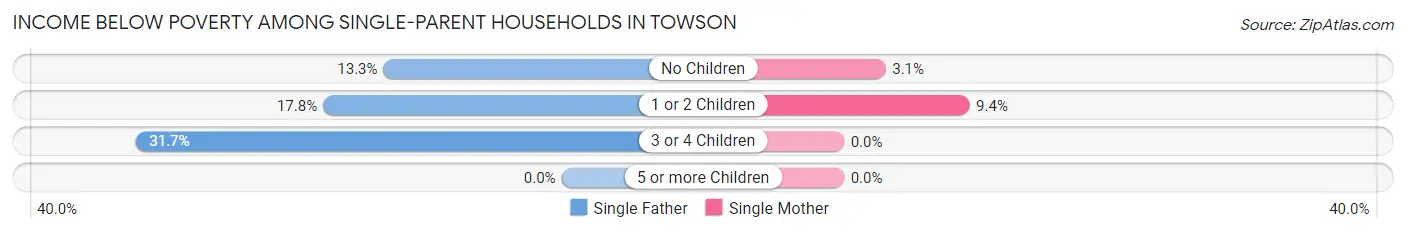
| Children | Single Father | Single Mother |
| No Children | 52 (13.3%) | 22 (3.1%) |
| 1 or 2 Children | 91 (17.8%) | 84 (9.3%) |
| 3 or 4 Children | 19 (31.7%) | 0 (0.0%) |
| 5 or more Children | 0 (0.0%) | 0 (0.0%) |
| Total | 162 (16.8%) | 106 (6.5%) |
Income Below Poverty Among Married-Couple vs Single-Parent Households in Towson
The poverty data for Towson shows that 156 of the married-couple family households (1.7%) and 268 of the single-parent households (10.3%) are living below the poverty level. Within the married-couple family households, those with 3 or 4 children have the highest poverty rate, with 33 households (5.4%) falling below the poverty line. Among the single-parent households, those with 3 or 4 children have the highest poverty rate, with 19 household (20.2%) living below poverty.
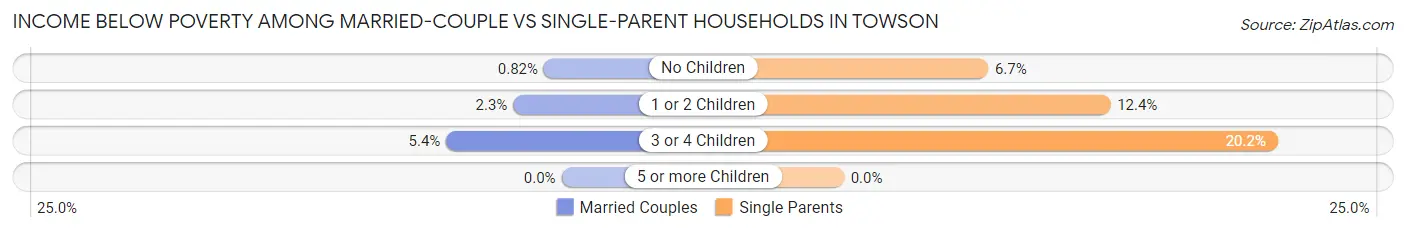
| Children | Married-Couple Families | Single-Parent Households |
| No Children | 41 (0.8%) | 74 (6.7%) |
| 1 or 2 Children | 82 (2.2%) | 175 (12.4%) |
| 3 or 4 Children | 33 (5.4%) | 19 (20.2%) |
| 5 or more Children | 0 (0.0%) | 0 (0.0%) |
| Total | 156 (1.7%) | 268 (10.3%) |
Race in Towson
The most populous races in Towson are White / Caucasian (41,067 | 71.3%), Black / African American (9,352 | 16.2%), and Two or more Races (3,366 | 5.8%).
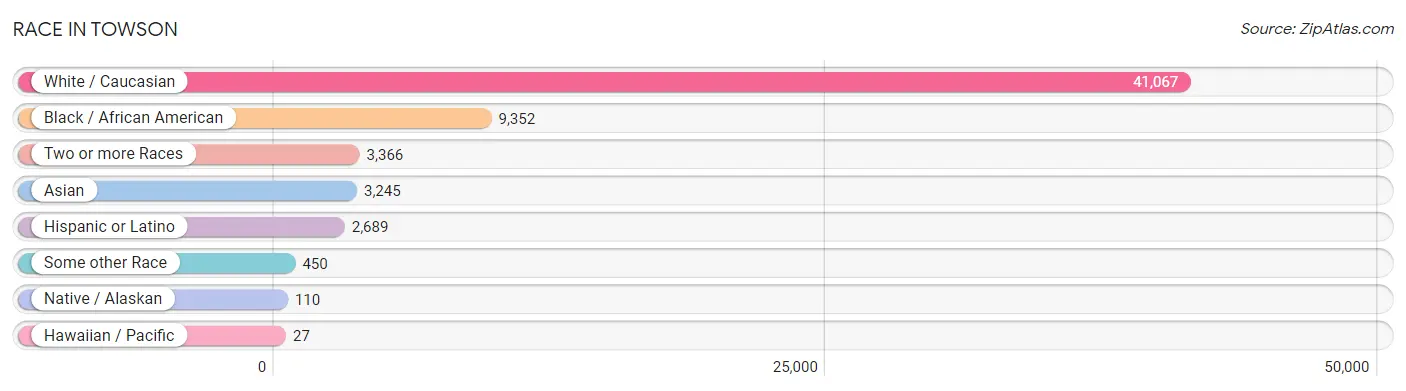
| Race | # Population | % Population |
| Asian | 3,245 | 5.6% |
| Black / African American | 9,352 | 16.2% |
| Hawaiian / Pacific | 27 | 0.1% |
| Hispanic or Latino | 2,689 | 4.7% |
| Native / Alaskan | 110 | 0.2% |
| White / Caucasian | 41,067 | 71.3% |
| Two or more Races | 3,366 | 5.8% |
| Some other Race | 450 | 0.8% |
| Total | 57,617 | 100.0% |
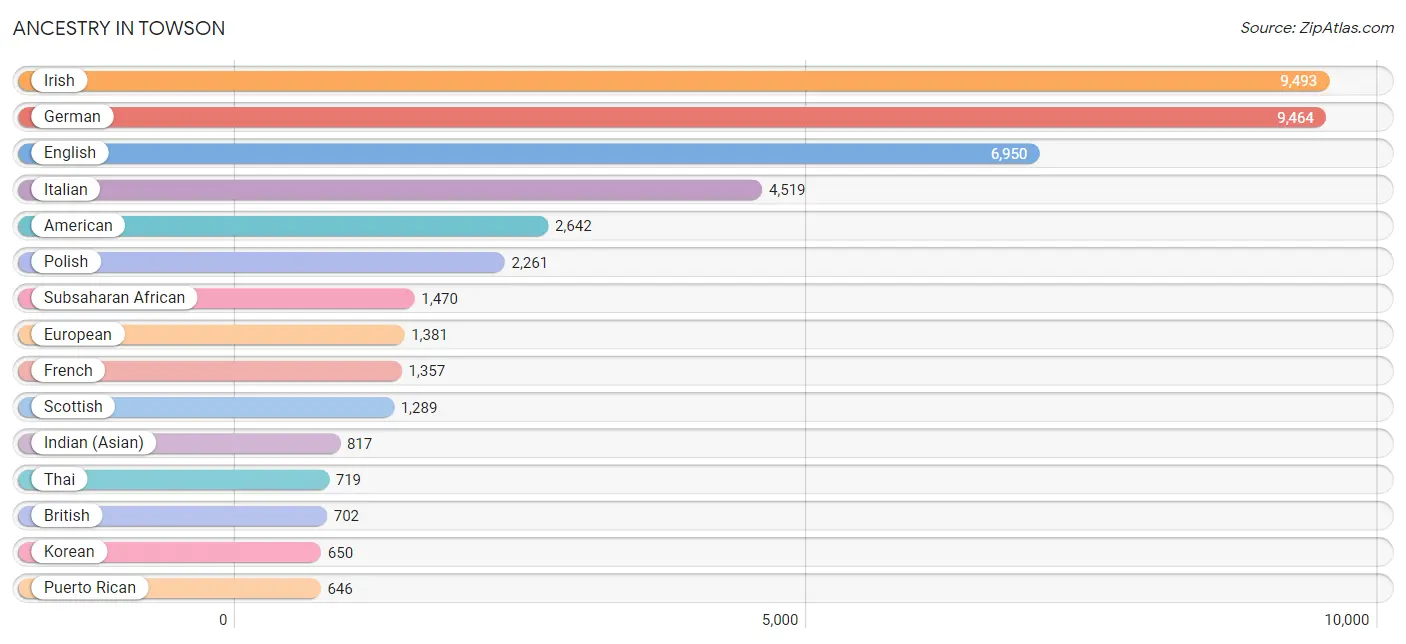
Ancestry in Towson
The most populous ancestries reported in Towson are Irish (9,493 | 16.5%), German (9,464 | 16.4%), English (6,950 | 12.1%), Italian (4,519 | 7.8%), and American (2,642 | 4.6%), together accounting for 57.4% of all Towson residents.
| Ancestry | # Population | % Population |
| Afghan | 2 | 0.0% |
| African | 455 | 0.8% |
| Albanian | 22 | 0.0% |
| American | 2,642 | 4.6% |
| Apache | 19 | 0.0% |
| Arab | 519 | 0.9% |
| Argentinean | 119 | 0.2% |
| Armenian | 99 | 0.2% |
| Australian | 38 | 0.1% |
| Austrian | 127 | 0.2% |
| Belgian | 54 | 0.1% |
| Belizean | 10 | 0.0% |
| Bhutanese | 99 | 0.2% |
| Blackfeet | 5 | 0.0% |
| Bolivian | 59 | 0.1% |
| Brazilian | 58 | 0.1% |
| British | 702 | 1.2% |
| British West Indian | 3 | 0.0% |
| Bulgarian | 33 | 0.1% |
| Burmese | 410 | 0.7% |
| Cajun | 4 | 0.0% |
| Canadian | 53 | 0.1% |
| Central American | 345 | 0.6% |
| Central American Indian | 35 | 0.1% |
| Cherokee | 155 | 0.3% |
| Chilean | 60 | 0.1% |
| Choctaw | 5 | 0.0% |
| Colombian | 133 | 0.2% |
| Costa Rican | 40 | 0.1% |
| Croatian | 7 | 0.0% |
| Cuban | 126 | 0.2% |
| Czech | 315 | 0.5% |
| Czechoslovakian | 35 | 0.1% |
| Danish | 266 | 0.5% |
| Delaware | 6 | 0.0% |
| Dominican | 189 | 0.3% |
| Dutch | 493 | 0.9% |
| Eastern European | 345 | 0.6% |
| Ecuadorian | 67 | 0.1% |
| Egyptian | 23 | 0.0% |
| English | 6,950 | 12.1% |
| Estonian | 54 | 0.1% |
| Ethiopian | 433 | 0.7% |
| European | 1,381 | 2.4% |
| Filipino | 121 | 0.2% |
| Finnish | 95 | 0.2% |
| French | 1,357 | 2.4% |
| French Canadian | 246 | 0.4% |
| German | 9,464 | 16.4% |
| German Russian | 8 | 0.0% |
| Ghanaian | 11 | 0.0% |
| Greek | 544 | 0.9% |
| Guamanian / Chamorro | 15 | 0.0% |
| Guatemalan | 19 | 0.0% |
| Haitian | 62 | 0.1% |
| Honduran | 13 | 0.0% |
| Hungarian | 493 | 0.9% |
| Indian (Asian) | 817 | 1.4% |
| Indonesian | 111 | 0.2% |
| Iranian | 261 | 0.4% |
| Irish | 9,493 | 16.5% |
| Iroquois | 162 | 0.3% |
| Israeli | 89 | 0.2% |
| Italian | 4,519 | 7.8% |
| Jamaican | 297 | 0.5% |
| Japanese | 24 | 0.0% |
| Jordanian | 6 | 0.0% |
| Kenyan | 36 | 0.1% |
| Korean | 650 | 1.1% |
| Laotian | 9 | 0.0% |
| Latvian | 69 | 0.1% |
| Lebanese | 81 | 0.1% |
| Liberian | 6 | 0.0% |
| Lithuanian | 274 | 0.5% |
| Lumbee | 28 | 0.1% |
| Luxembourger | 9 | 0.0% |
| Maltese | 19 | 0.0% |
| Mexican | 497 | 0.9% |
| Mexican American Indian | 28 | 0.1% |
| Moroccan | 19 | 0.0% |
| Navajo | 33 | 0.1% |
| Nicaraguan | 12 | 0.0% |
| Nigerian | 328 | 0.6% |
| Northern European | 128 | 0.2% |
| Norwegian | 427 | 0.7% |
| Pakistani | 65 | 0.1% |
| Palestinian | 8 | 0.0% |
| Panamanian | 24 | 0.0% |
| Paraguayan | 10 | 0.0% |
| Pennsylvania German | 20 | 0.0% |
| Peruvian | 111 | 0.2% |
| Polish | 2,261 | 3.9% |
| Portuguese | 183 | 0.3% |
| Puerto Rican | 646 | 1.1% |
| Romanian | 108 | 0.2% |
| Russian | 583 | 1.0% |
| Salvadoran | 237 | 0.4% |
| Scandinavian | 96 | 0.2% |
| Scotch-Irish | 541 | 0.9% |
| Scottish | 1,289 | 2.2% |
| Seminole | 21 | 0.0% |
| Serbian | 10 | 0.0% |
| Sierra Leonean | 10 | 0.0% |
| Slavic | 47 | 0.1% |
| Slovak | 110 | 0.2% |
| Slovene | 24 | 0.0% |
| South African | 19 | 0.0% |
| South American | 560 | 1.0% |
| Spaniard | 99 | 0.2% |
| Spanish | 138 | 0.2% |
| Sri Lankan | 245 | 0.4% |
| Subsaharan African | 1,470 | 2.5% |
| Swedish | 476 | 0.8% |
| Swiss | 221 | 0.4% |
| Syrian | 133 | 0.2% |
| Thai | 719 | 1.3% |
| Tongan | 5 | 0.0% |
| Trinidadian and Tobagonian | 173 | 0.3% |
| Turkish | 70 | 0.1% |
| Ugandan | 104 | 0.2% |
| Ukrainian | 228 | 0.4% |
| Venezuelan | 1 | 0.0% |
| Vietnamese | 26 | 0.1% |
| Welsh | 411 | 0.7% |
| West Indian | 55 | 0.1% | View All 125 Rows |
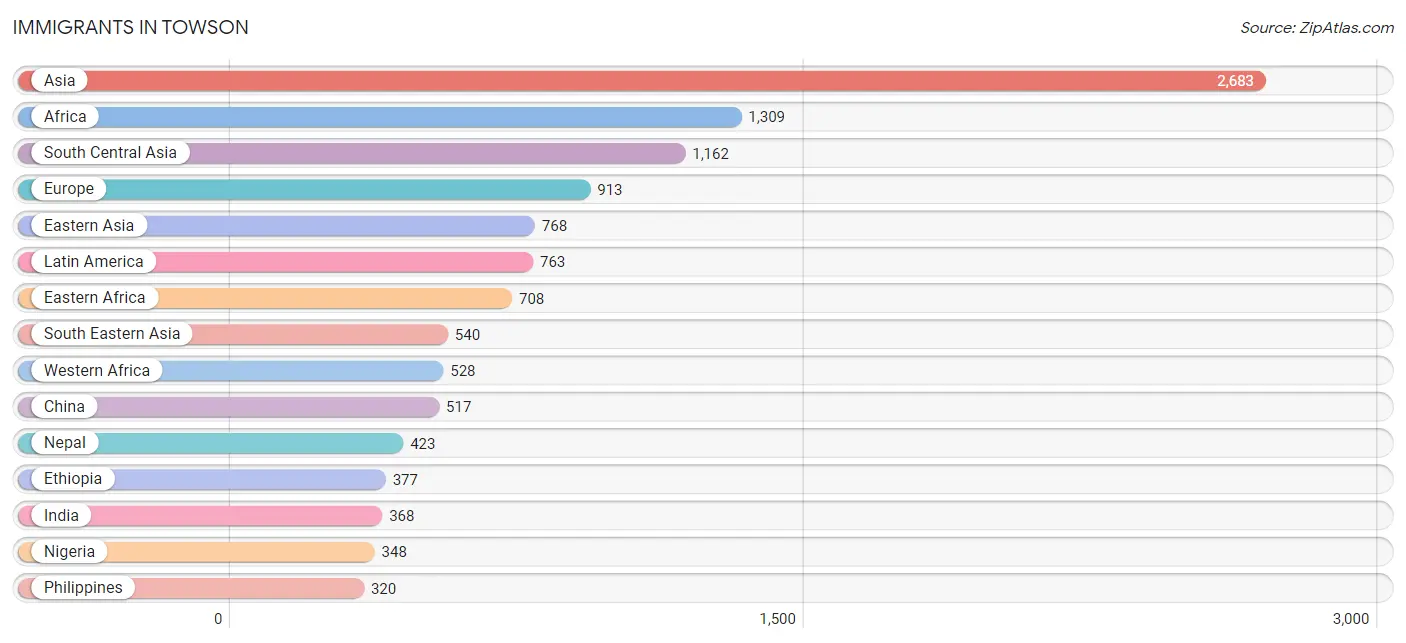
Immigrants in Towson
The most numerous immigrant groups reported in Towson came from Asia (2,683 | 4.7%), Africa (1,309 | 2.3%), South Central Asia (1,162 | 2.0%), Europe (913 | 1.6%), and Eastern Asia (768 | 1.3%), together accounting for 11.9% of all Towson residents.
| Immigration Origin | # Population | % Population |
| Africa | 1,309 | 2.3% |
| Argentina | 59 | 0.1% |
| Asia | 2,683 | 4.7% |
| Australia | 79 | 0.1% |
| Austria | 11 | 0.0% |
| Bangladesh | 20 | 0.0% |
| Barbados | 6 | 0.0% |
| Belgium | 7 | 0.0% |
| Belize | 1 | 0.0% |
| Bolivia | 19 | 0.0% |
| Brazil | 74 | 0.1% |
| Bulgaria | 27 | 0.1% |
| Cameroon | 22 | 0.0% |
| Canada | 122 | 0.2% |
| Caribbean | 210 | 0.4% |
| Central America | 260 | 0.4% |
| Chile | 59 | 0.1% |
| China | 517 | 0.9% |
| Colombia | 36 | 0.1% |
| Costa Rica | 35 | 0.1% |
| Cuba | 9 | 0.0% |
| Denmark | 6 | 0.0% |
| Dominica | 26 | 0.1% |
| Dominican Republic | 16 | 0.0% |
| Eastern Africa | 708 | 1.2% |
| Eastern Asia | 768 | 1.3% |
| Eastern Europe | 302 | 0.5% |
| Egypt | 14 | 0.0% |
| El Salvador | 21 | 0.0% |
| England | 78 | 0.1% |
| Eritrea | 19 | 0.0% |
| Ethiopia | 377 | 0.6% |
| Europe | 913 | 1.6% |
| France | 42 | 0.1% |
| Germany | 30 | 0.1% |
| Ghana | 12 | 0.0% |
| Greece | 44 | 0.1% |
| Guatemala | 27 | 0.1% |
| Hong Kong | 8 | 0.0% |
| Hungary | 31 | 0.1% |
| India | 368 | 0.6% |
| Indonesia | 9 | 0.0% |
| Iran | 178 | 0.3% |
| Ireland | 17 | 0.0% |
| Israel | 2 | 0.0% |
| Italy | 135 | 0.2% |
| Jamaica | 50 | 0.1% |
| Japan | 35 | 0.1% |
| Jordan | 13 | 0.0% |
| Kazakhstan | 60 | 0.1% |
| Kenya | 141 | 0.2% |
| Korea | 216 | 0.4% |
| Laos | 20 | 0.0% |
| Latin America | 763 | 1.3% |
| Liberia | 155 | 0.3% |
| Mexico | 173 | 0.3% |
| Middle Africa | 22 | 0.0% |
| Morocco | 22 | 0.0% |
| Nepal | 423 | 0.7% |
| Netherlands | 51 | 0.1% |
| Nicaragua | 3 | 0.0% |
| Nigeria | 348 | 0.6% |
| Northern Africa | 41 | 0.1% |
| Northern Europe | 237 | 0.4% |
| Norway | 28 | 0.1% |
| Oceania | 84 | 0.2% |
| Pakistan | 113 | 0.2% |
| Peru | 3 | 0.0% |
| Philippines | 320 | 0.6% |
| Poland | 32 | 0.1% |
| Portugal | 9 | 0.0% |
| Romania | 100 | 0.2% |
| Russia | 30 | 0.1% |
| Saudi Arabia | 71 | 0.1% |
| Scotland | 18 | 0.0% |
| Singapore | 3 | 0.0% |
| South Africa | 10 | 0.0% |
| South America | 293 | 0.5% |
| South Central Asia | 1,162 | 2.0% |
| South Eastern Asia | 540 | 0.9% |
| Southern Europe | 233 | 0.4% |
| Spain | 33 | 0.1% |
| Sweden | 11 | 0.0% |
| Syria | 65 | 0.1% |
| Taiwan | 131 | 0.2% |
| Thailand | 9 | 0.0% |
| Trinidad and Tobago | 77 | 0.1% |
| Turkey | 45 | 0.1% |
| Uganda | 106 | 0.2% |
| Ukraine | 66 | 0.1% |
| Venezuela | 33 | 0.1% |
| Vietnam | 68 | 0.1% |
| Western Africa | 528 | 0.9% |
| Western Asia | 213 | 0.4% |
| Western Europe | 141 | 0.2% | View All 95 Rows |
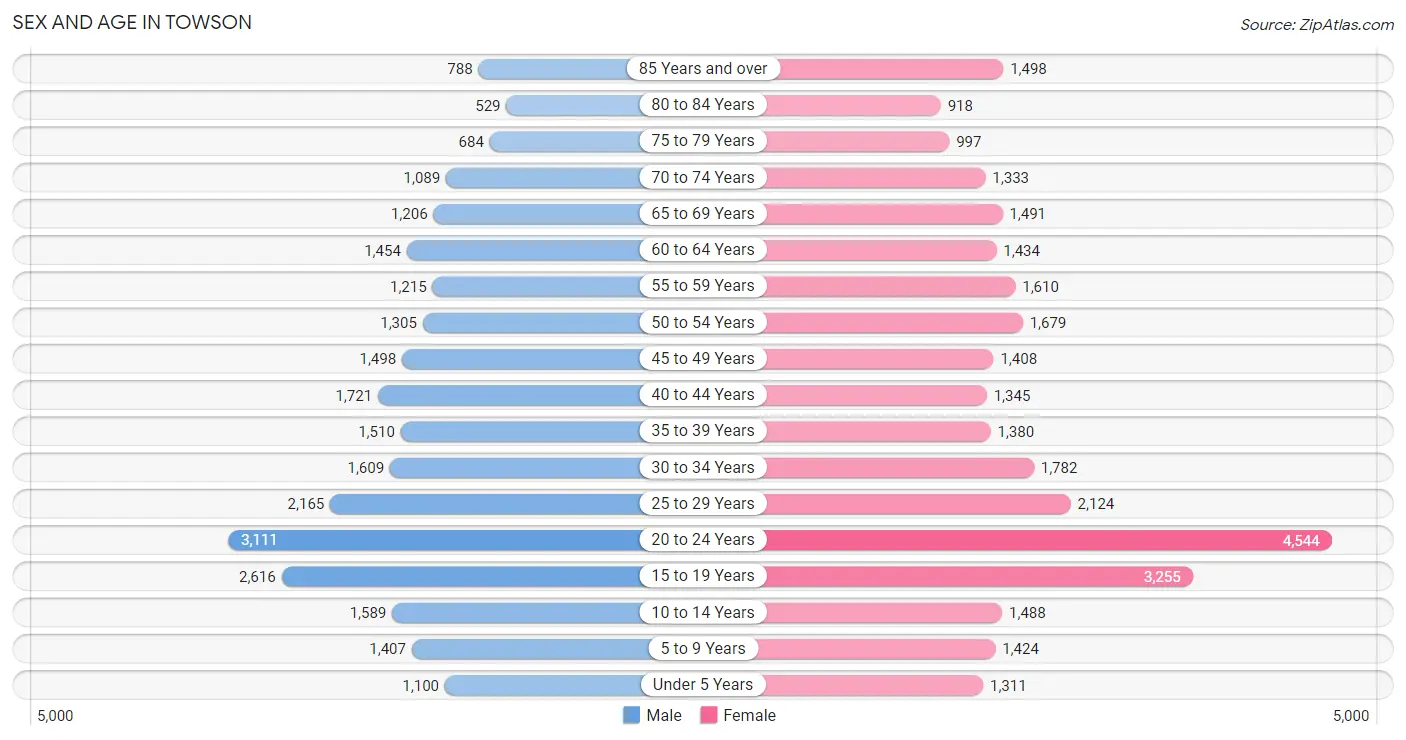
Sex and Age in Towson
Sex and Age in Towson
The most populous age groups in Towson are 20 to 24 Years (3,111 | 11.7%) for men and 20 to 24 Years (4,544 | 14.6%) for women.
| Age Bracket | Male | Female |
| Under 5 Years | 1,100 (4.1%) | 1,311 (4.2%) |
| 5 to 9 Years | 1,407 (5.3%) | 1,424 (4.6%) |
| 10 to 14 Years | 1,589 (6.0%) | 1,488 (4.8%) |
| 15 to 19 Years | 2,616 (9.8%) | 3,255 (10.5%) |
| 20 to 24 Years | 3,111 (11.7%) | 4,544 (14.6%) |
| 25 to 29 Years | 2,165 (8.1%) | 2,124 (6.9%) |
| 30 to 34 Years | 1,609 (6.0%) | 1,782 (5.7%) |
| 35 to 39 Years | 1,510 (5.7%) | 1,380 (4.4%) |
| 40 to 44 Years | 1,721 (6.5%) | 1,345 (4.3%) |
| 45 to 49 Years | 1,498 (5.6%) | 1,408 (4.5%) |
| 50 to 54 Years | 1,305 (4.9%) | 1,679 (5.4%) |
| 55 to 59 Years | 1,215 (4.6%) | 1,610 (5.2%) |
| 60 to 64 Years | 1,454 (5.5%) | 1,434 (4.6%) |
| 65 to 69 Years | 1,206 (4.5%) | 1,491 (4.8%) |
| 70 to 74 Years | 1,089 (4.1%) | 1,333 (4.3%) |
| 75 to 79 Years | 684 (2.6%) | 997 (3.2%) |
| 80 to 84 Years | 529 (2.0%) | 918 (3.0%) |
| 85 Years and over | 788 (3.0%) | 1,498 (4.8%) |
| Total | 26,596 (100.0%) | 31,021 (100.0%) |
Families and Households in Towson
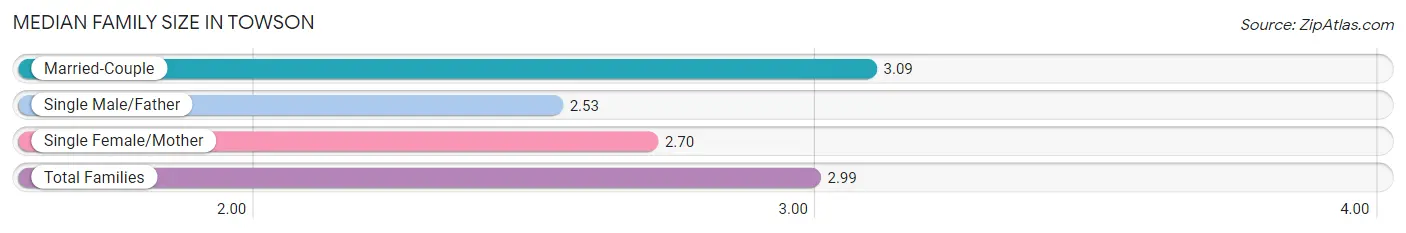
Median Family Size in Towson
The median family size in Towson is 2.99 persons per family, with married-couple families (9,259 | 78.0%) accounting for the largest median family size of 3.09 persons per family. On the other hand, single male/father families (964 | 8.1%) represent the smallest median family size with 2.53 persons per family.
| Family Type | # Families | Family Size |
| Married-Couple | 9,259 (78.0%) | 3.09 |
| Single Male/Father | 964 (8.1%) | 2.53 |
| Single Female/Mother | 1,642 (13.8%) | 2.70 |
| Total Families | 11,865 (100.0%) | 2.99 |
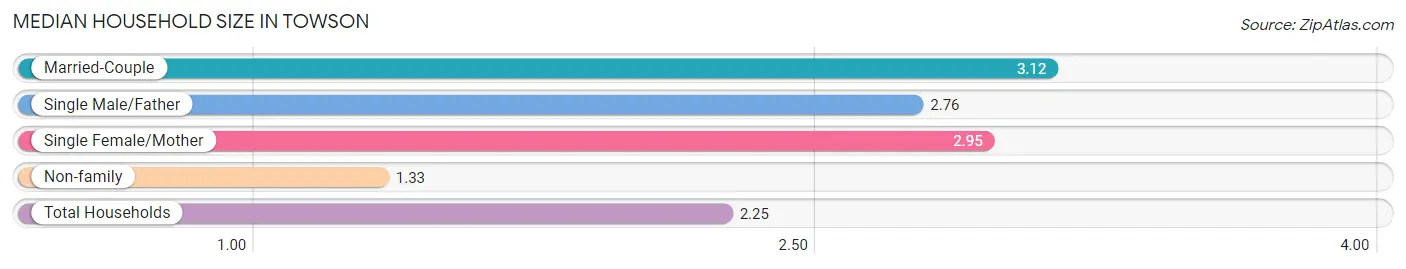
Median Household Size in Towson
The median household size in Towson is 2.25 persons per household, with married-couple households (9,259 | 41.3%) accounting for the largest median household size of 3.12 persons per household. non-family households (10,565 | 47.1%) represent the smallest median household size with 1.33 persons per household.
| Household Type | # Households | Household Size |
| Married-Couple | 9,259 (41.3%) | 3.12 |
| Single Male/Father | 964 (4.3%) | 2.76 |
| Single Female/Mother | 1,642 (7.3%) | 2.95 |
| Non-family | 10,565 (47.1%) | 1.33 |
| Total Households | 22,430 (100.0%) | 2.25 |
Household Size by Marriage Status in Towson
Out of a total of 22,430 households in Towson, 11,865 (52.9%) are family households, while 10,565 (47.1%) are nonfamily households. The most numerous type of family households are 2-person households, comprising 5,237, and the most common type of nonfamily households are 1-person households, comprising 8,098.
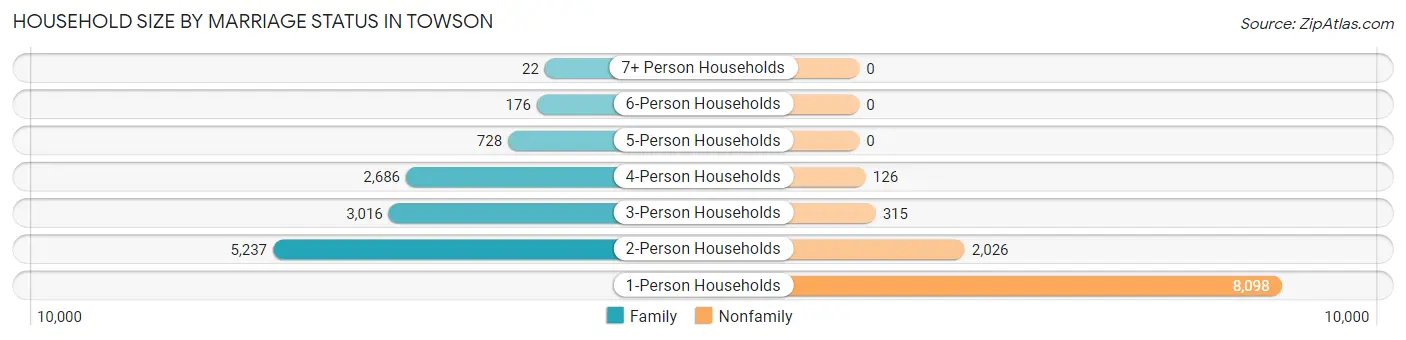
| Household Size | Family Households | Nonfamily Households |
| 1-Person Households | - | 8,098 (36.1%) |
| 2-Person Households | 5,237 (23.4%) | 2,026 (9.0%) |
| 3-Person Households | 3,016 (13.5%) | 315 (1.4%) |
| 4-Person Households | 2,686 (12.0%) | 126 (0.6%) |
| 5-Person Households | 728 (3.3%) | 0 (0.0%) |
| 6-Person Households | 176 (0.8%) | 0 (0.0%) |
| 7+ Person Households | 22 (0.1%) | 0 (0.0%) |
| Total | 11,865 (52.9%) | 10,565 (47.1%) |
Female Fertility in Towson
Fertility by Age in Towson
Average fertility rate in Towson is 31.0 births per 1,000 women. Women in the age bracket of 20 to 34 years have the highest fertility rate with 40.0 births per 1,000 women. Women in the age bracket of 20 to 34 years acount for 67.7% of all women with births.
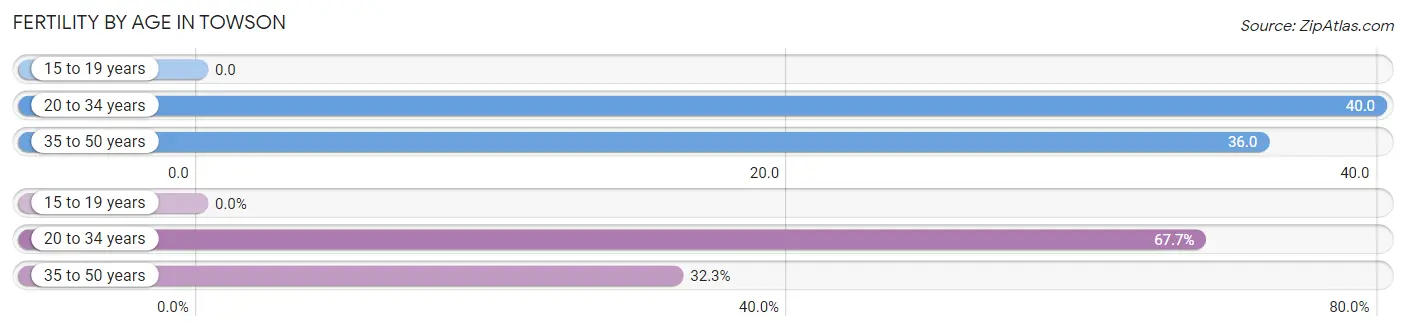
| Age Bracket | Women with Births | Births / 1,000 Women |
| 15 to 19 years | 0 (0.0%) | 0.0 |
| 20 to 34 years | 338 (67.7%) | 40.0 |
| 35 to 50 years | 161 (32.3%) | 36.0 |
| Total | 499 (100.0%) | 31.0 |
Fertility by Age by Marriage Status in Towson
78.2% of women with births (499) in Towson are married. The highest percentage of unmarried women with births falls into 20 to 34 years age bracket with 24.8% of them unmarried at the time of birth, while the lowest percentage of unmarried women with births belong to 35 to 50 years age bracket with 15.5% of them unmarried.
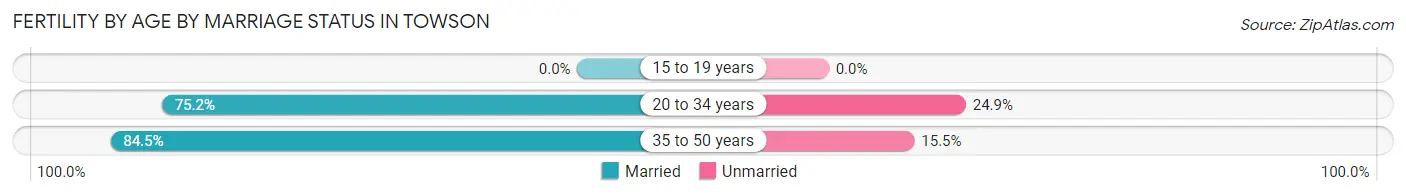
| Age Bracket | Married | Unmarried |
| 15 to 19 years | 0 (0.0%) | 0 (0.0%) |
| 20 to 34 years | 254 (75.1%) | 84 (24.8%) |
| 35 to 50 years | 136 (84.5%) | 25 (15.5%) |
| Total | 390 (78.2%) | 109 (21.8%) |
Fertility by Education in Towson
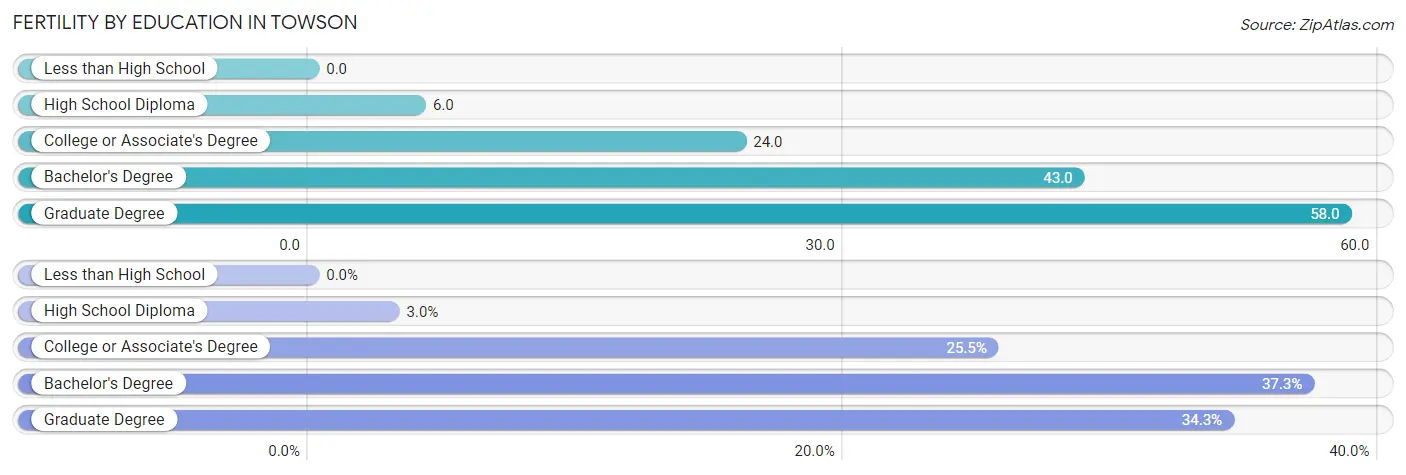
| Educational Attainment | Women with Births | Births / 1,000 Women |
| Less than High School | 0 (0.0%) | 0.0 |
| High School Diploma | 15 (3.0%) | 6.0 |
| College or Associate's Degree | 127 (25.5%) | 24.0 |
| Bachelor's Degree | 186 (37.3%) | 43.0 |
| Graduate Degree | 171 (34.3%) | 58.0 |
| Total | 499 (100.0%) | 31.0 |
Fertility by Education by Marriage Status in Towson
21.8% of women with births in Towson are unmarried. Women with the educational attainment of high school diploma are most likely to be married with 100.0% of them married at childbirth, while women with the educational attainment of college or associate's degree are least likely to be married with 56.7% of them unmarried at childbirth.
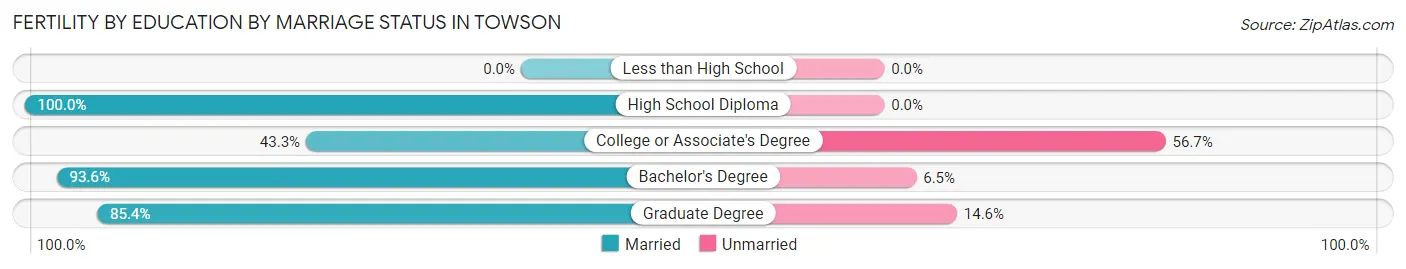
| Educational Attainment | Married | Unmarried |
| Less than High School | 0 (0.0%) | 0 (0.0%) |
| High School Diploma | 15 (100.0%) | 0 (0.0%) |
| College or Associate's Degree | 55 (43.3%) | 72 (56.7%) |
| Bachelor's Degree | 174 (93.5%) | 12 (6.5%) |
| Graduate Degree | 146 (85.4%) | 25 (14.6%) |
| Total | 390 (78.2%) | 109 (21.8%) |
Employment Characteristics in Towson
Employment by Class of Employer in Towson
Among the 28,329 employed individuals in Towson, private company employees (16,268 | 57.4%), not-for-profit organizations (4,820 | 17.0%), and state government employees (1,800 | 6.4%) make up the most common classes of employment.
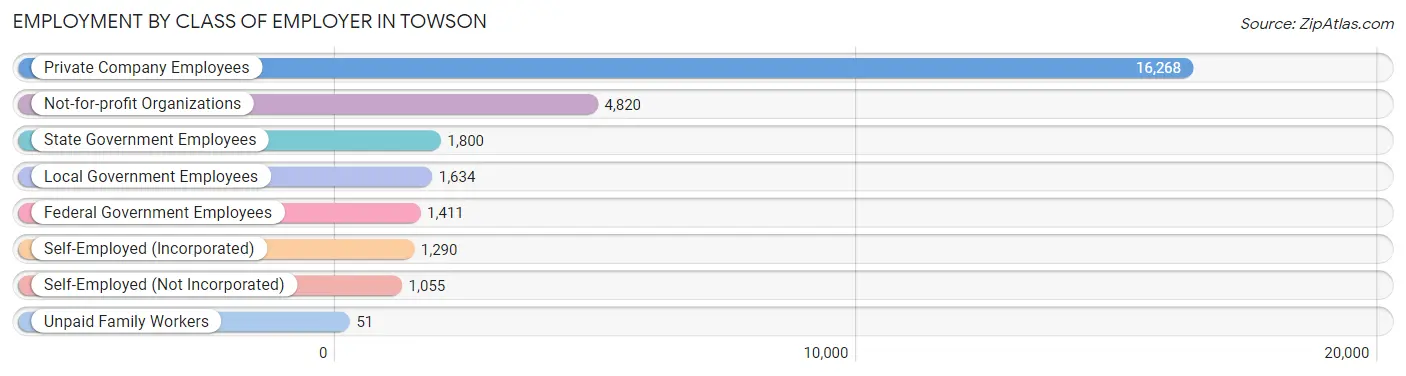
| Employer Class | # Employees | % Employees |
| Private Company Employees | 16,268 | 57.4% |
| Self-Employed (Incorporated) | 1,290 | 4.5% |
| Self-Employed (Not Incorporated) | 1,055 | 3.7% |
| Not-for-profit Organizations | 4,820 | 17.0% |
| Local Government Employees | 1,634 | 5.8% |
| State Government Employees | 1,800 | 6.4% |
| Federal Government Employees | 1,411 | 5.0% |
| Unpaid Family Workers | 51 | 0.2% |
| Total | 28,329 | 100.0% |
Employment Status by Age in Towson
According to the labor force statistics for Towson, out of the total population over 16 years of age (48,726), 61.9% or 30,161 individuals are in the labor force, with 4.6% or 1,387 of them unemployed. The age group with the highest labor force participation rate is 35 to 44 years, with 90.6% or 5,396 individuals in the labor force. Within the labor force, the 16 to 19 years age range has the highest percentage of unemployed individuals, with 11.5% or 226 of them being unemployed.
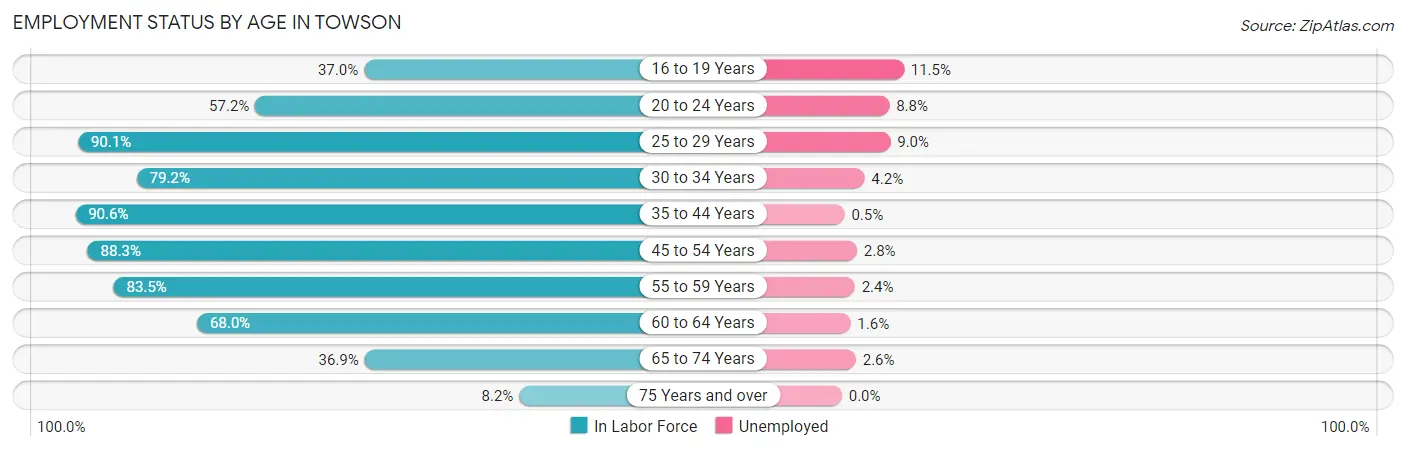
| Age Bracket | In Labor Force | Unemployed |
| 16 to 19 Years | 1,961 (37.0%) | 226 (11.5%) |
| 20 to 24 Years | 4,379 (57.2%) | 385 (8.8%) |
| 25 to 29 Years | 3,864 (90.1%) | 348 (9.0%) |
| 30 to 34 Years | 2,686 (79.2%) | 113 (4.2%) |
| 35 to 44 Years | 5,396 (90.6%) | 27 (0.5%) |
| 45 to 54 Years | 5,201 (88.3%) | 146 (2.8%) |
| 55 to 59 Years | 2,359 (83.5%) | 57 (2.4%) |
| 60 to 64 Years | 1,964 (68.0%) | 31 (1.6%) |
| 65 to 74 Years | 1,889 (36.9%) | 49 (2.6%) |
| 75 Years and over | 444 (8.2%) | 0 (0.0%) |
| Total | 30,161 (61.9%) | 1,387 (4.6%) |
Employment Status by Educational Attainment in Towson
According to labor force statistics for Towson, 85.1% of individuals (21,478) out of the total population between 25 and 64 years of age (25,239) are in the labor force, with 3.4% or 730 of them being unemployed. The group with the highest labor force participation rate are those with the educational attainment of bachelor's degree or higher, with 90.6% or 16,235 individuals in the labor force. Within the labor force, individuals with less than high school education have the highest percentage of unemployment, with 9.6% or 32 of them being unemployed.
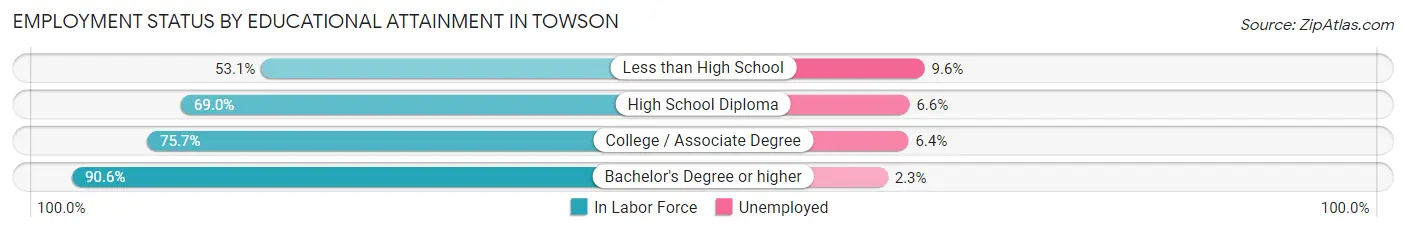
| Educational Attainment | In Labor Force | Unemployed |
| Less than High School | 332 (53.1%) | 60 (9.6%) |
| High School Diploma | 1,720 (69.0%) | 165 (6.6%) |
| College / Associate Degree | 3,181 (75.7%) | 269 (6.4%) |
| Bachelor's Degree or higher | 16,235 (90.6%) | 412 (2.3%) |
| Total | 21,478 (85.1%) | 858 (3.4%) |
Employment Occupations by Sex in Towson
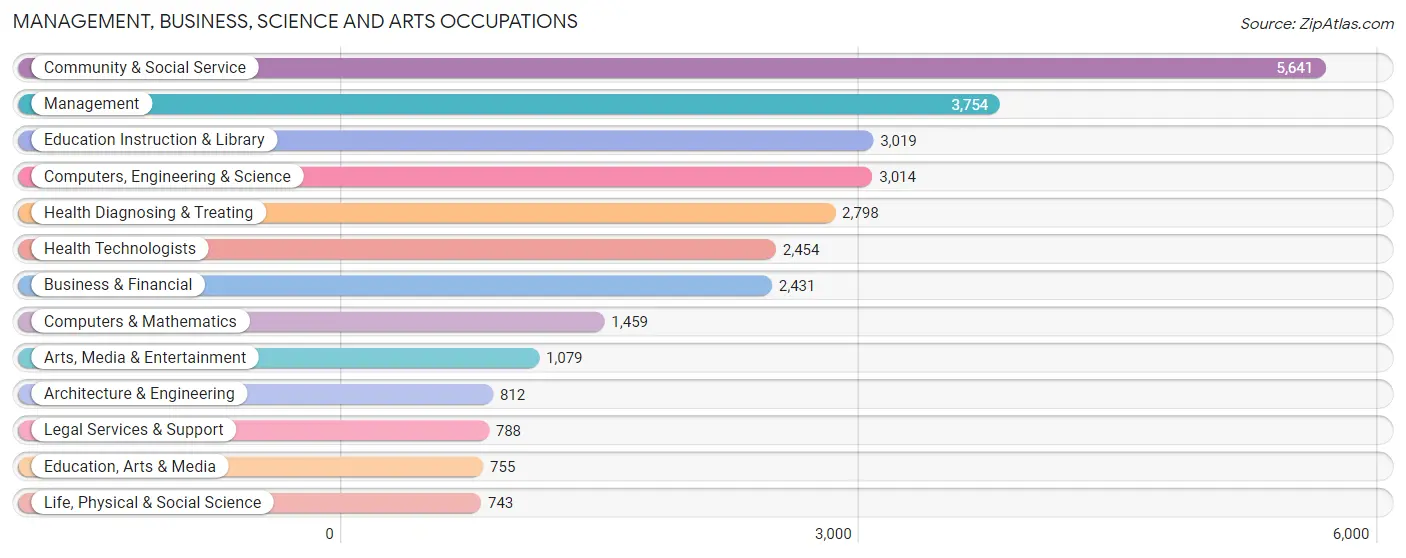
Management, Business, Science and Arts Occupations
The most common Management, Business, Science and Arts occupations in Towson are Community & Social Service (5,641 | 19.7%), Management (3,754 | 13.1%), Education Instruction & Library (3,019 | 10.5%), Computers, Engineering & Science (3,014 | 10.5%), and Health Diagnosing & Treating (2,798 | 9.8%).
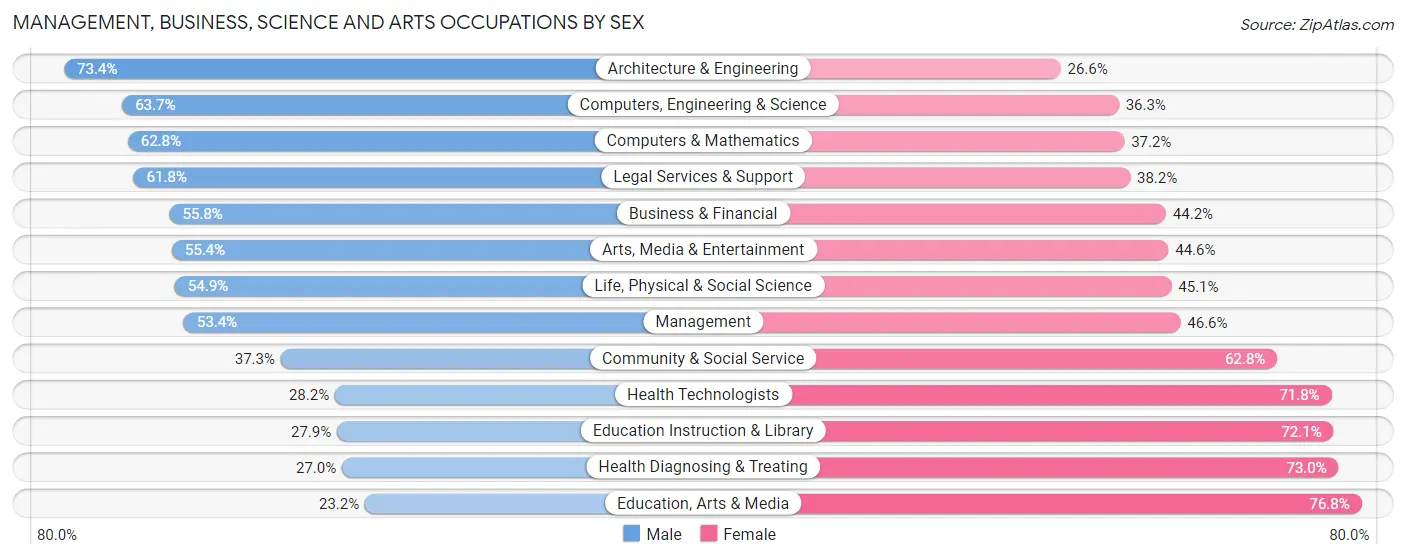
Management, Business, Science and Arts Occupations by Sex
Within the Management, Business, Science and Arts occupations in Towson, the most male-oriented occupations are Architecture & Engineering (73.4%), Computers, Engineering & Science (63.7%), and Computers & Mathematics (62.8%), while the most female-oriented occupations are Education, Arts & Media (76.8%), Health Diagnosing & Treating (73.0%), and Education Instruction & Library (72.1%).
| Occupation | Male | Female |
| Management | 2,005 (53.4%) | 1,749 (46.6%) |
| Business & Financial | 1,357 (55.8%) | 1,074 (44.2%) |
| Computers, Engineering & Science | 1,920 (63.7%) | 1,094 (36.3%) |
| Computers & Mathematics | 916 (62.8%) | 543 (37.2%) |
| Architecture & Engineering | 596 (73.4%) | 216 (26.6%) |
| Life, Physical & Social Science | 408 (54.9%) | 335 (45.1%) |
| Community & Social Service | 2,101 (37.2%) | 3,540 (62.7%) |
| Education, Arts & Media | 175 (23.2%) | 580 (76.8%) |
| Legal Services & Support | 487 (61.8%) | 301 (38.2%) |
| Education Instruction & Library | 841 (27.9%) | 2,178 (72.1%) |
| Arts, Media & Entertainment | 598 (55.4%) | 481 (44.6%) |
| Health Diagnosing & Treating | 756 (27.0%) | 2,042 (73.0%) |
| Health Technologists | 692 (28.2%) | 1,762 (71.8%) |
| Total (Category) | 8,139 (46.1%) | 9,499 (53.9%) |
| Total (Overall) | 13,399 (46.7%) | 15,303 (53.3%) |
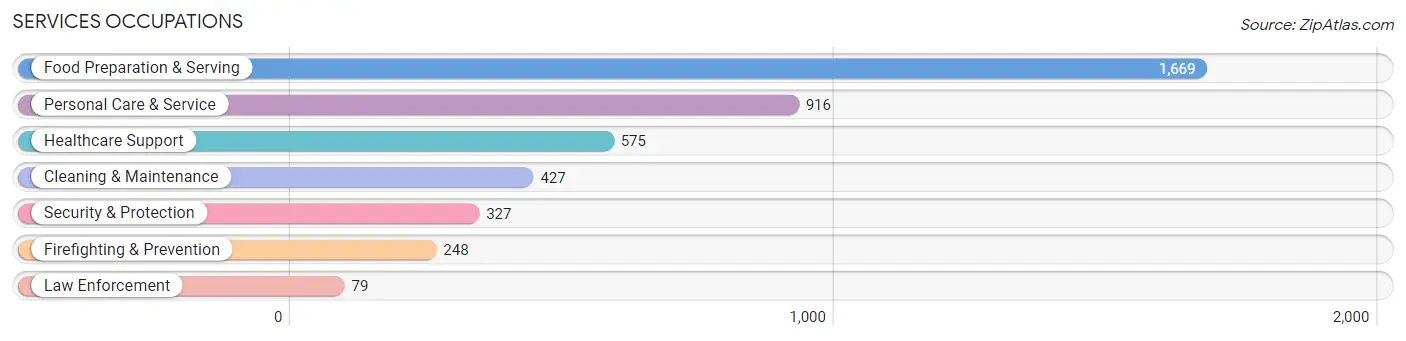
Services Occupations
The most common Services occupations in Towson are Food Preparation & Serving (1,669 | 5.8%), Personal Care & Service (916 | 3.2%), Healthcare Support (575 | 2.0%), Cleaning & Maintenance (427 | 1.5%), and Security & Protection (327 | 1.1%).
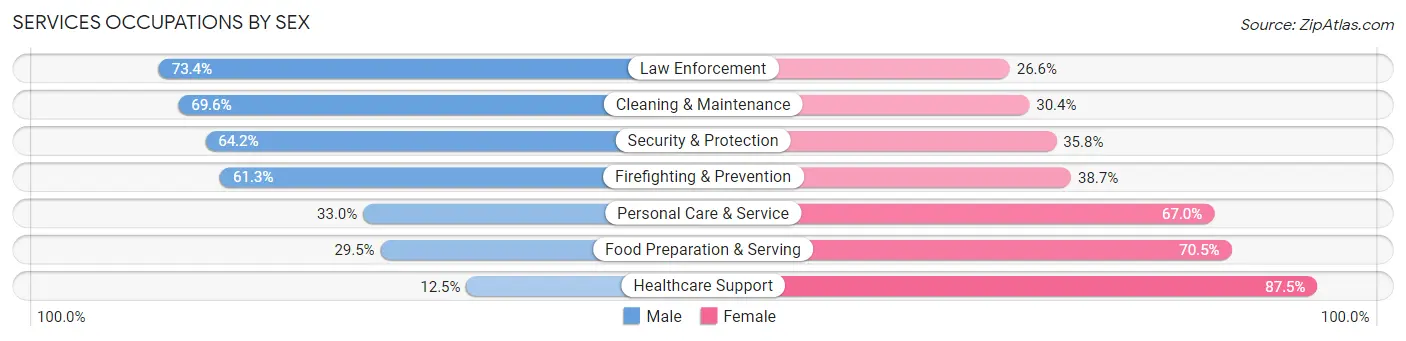
Services Occupations by Sex
Within the Services occupations in Towson, the most male-oriented occupations are Law Enforcement (73.4%), Cleaning & Maintenance (69.6%), and Security & Protection (64.2%), while the most female-oriented occupations are Healthcare Support (87.5%), Food Preparation & Serving (70.5%), and Personal Care & Service (67.0%).
| Occupation | Male | Female |
| Healthcare Support | 72 (12.5%) | 503 (87.5%) |
| Security & Protection | 210 (64.2%) | 117 (35.8%) |
| Firefighting & Prevention | 152 (61.3%) | 96 (38.7%) |
| Law Enforcement | 58 (73.4%) | 21 (26.6%) |
| Food Preparation & Serving | 493 (29.5%) | 1,176 (70.5%) |
| Cleaning & Maintenance | 297 (69.6%) | 130 (30.4%) |
| Personal Care & Service | 302 (33.0%) | 614 (67.0%) |
| Total (Category) | 1,374 (35.1%) | 2,540 (64.9%) |
| Total (Overall) | 13,399 (46.7%) | 15,303 (53.3%) |
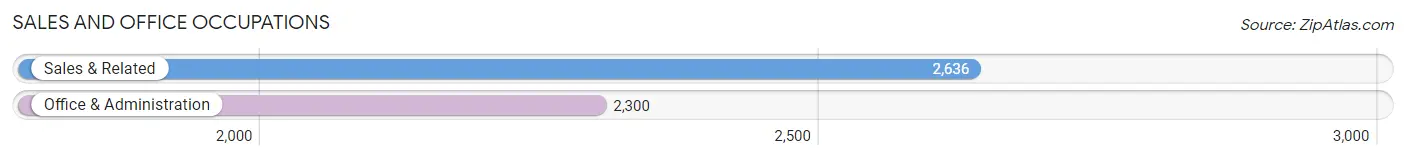
Sales and Office Occupations
The most common Sales and Office occupations in Towson are Sales & Related (2,636 | 9.2%), and Office & Administration (2,300 | 8.0%).
Sales and Office Occupations by Sex
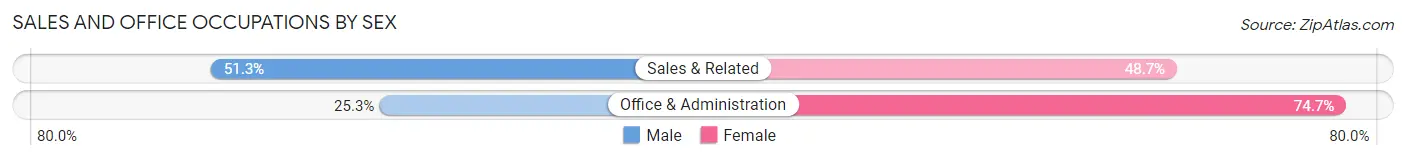
| Occupation | Male | Female |
| Sales & Related | 1,353 (51.3%) | 1,283 (48.7%) |
| Office & Administration | 582 (25.3%) | 1,718 (74.7%) |
| Total (Category) | 1,935 (39.2%) | 3,001 (60.8%) |
| Total (Overall) | 13,399 (46.7%) | 15,303 (53.3%) |
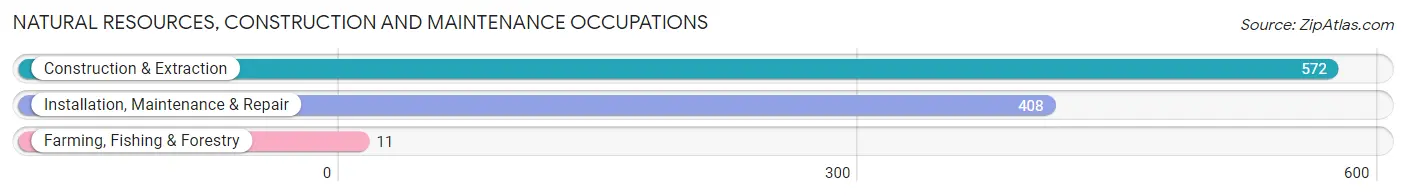
Natural Resources, Construction and Maintenance Occupations
The most common Natural Resources, Construction and Maintenance occupations in Towson are Construction & Extraction (572 | 2.0%), Installation, Maintenance & Repair (408 | 1.4%), and Farming, Fishing & Forestry (11 | 0.0%).
Natural Resources, Construction and Maintenance Occupations by Sex
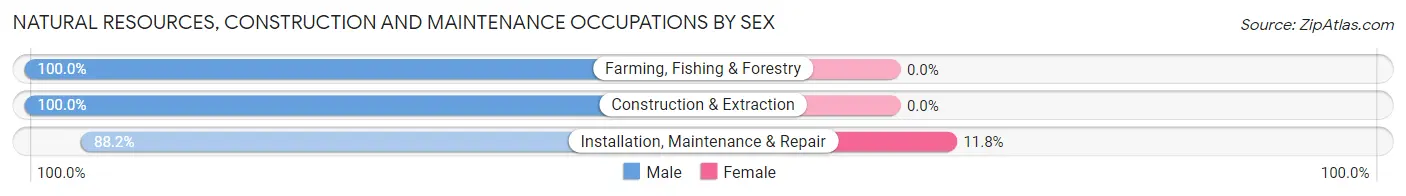
| Occupation | Male | Female |
| Farming, Fishing & Forestry | 11 (100.0%) | 0 (0.0%) |
| Construction & Extraction | 572 (100.0%) | 0 (0.0%) |
| Installation, Maintenance & Repair | 360 (88.2%) | 48 (11.8%) |
| Total (Category) | 943 (95.2%) | 48 (4.8%) |
| Total (Overall) | 13,399 (46.7%) | 15,303 (53.3%) |
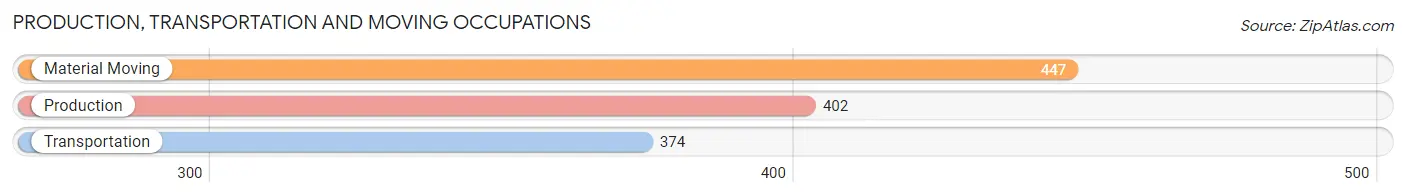
Production, Transportation and Moving Occupations
The most common Production, Transportation and Moving occupations in Towson are Material Moving (447 | 1.6%), Production (402 | 1.4%), and Transportation (374 | 1.3%).
Production, Transportation and Moving Occupations by Sex
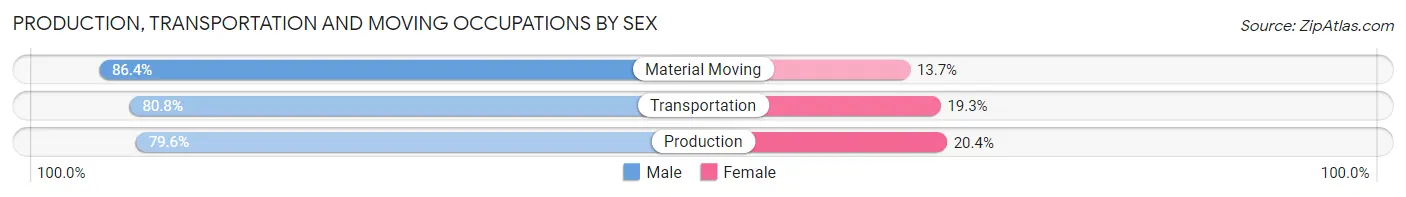
| Occupation | Male | Female |
| Production | 320 (79.6%) | 82 (20.4%) |
| Transportation | 302 (80.7%) | 72 (19.3%) |
| Material Moving | 386 (86.4%) | 61 (13.7%) |
| Total (Category) | 1,008 (82.4%) | 215 (17.6%) |
| Total (Overall) | 13,399 (46.7%) | 15,303 (53.3%) |
Employment Industries by Sex in Towson
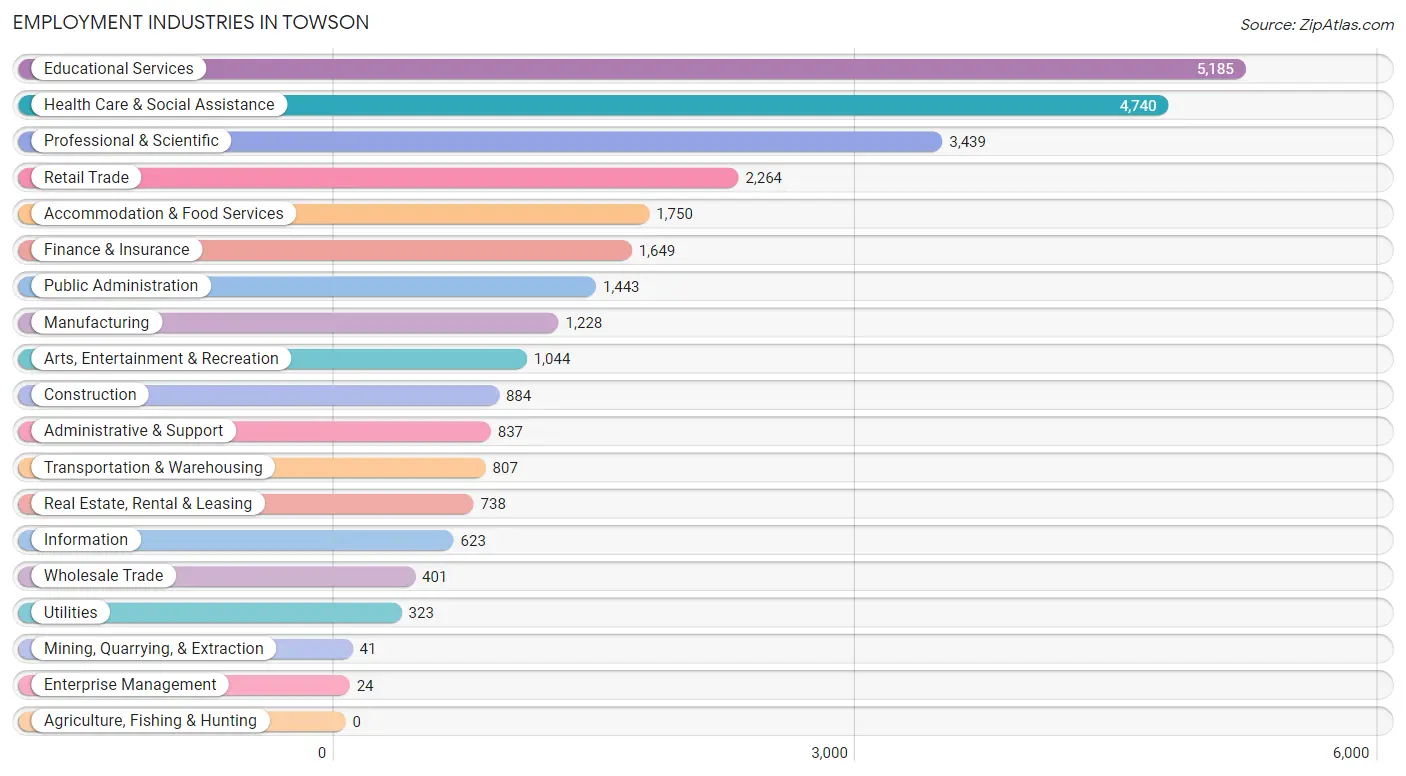
Employment Industries in Towson
The major employment industries in Towson include Educational Services (5,185 | 18.1%), Health Care & Social Assistance (4,740 | 16.5%), Professional & Scientific (3,439 | 12.0%), Retail Trade (2,264 | 7.9%), and Accommodation & Food Services (1,750 | 6.1%).
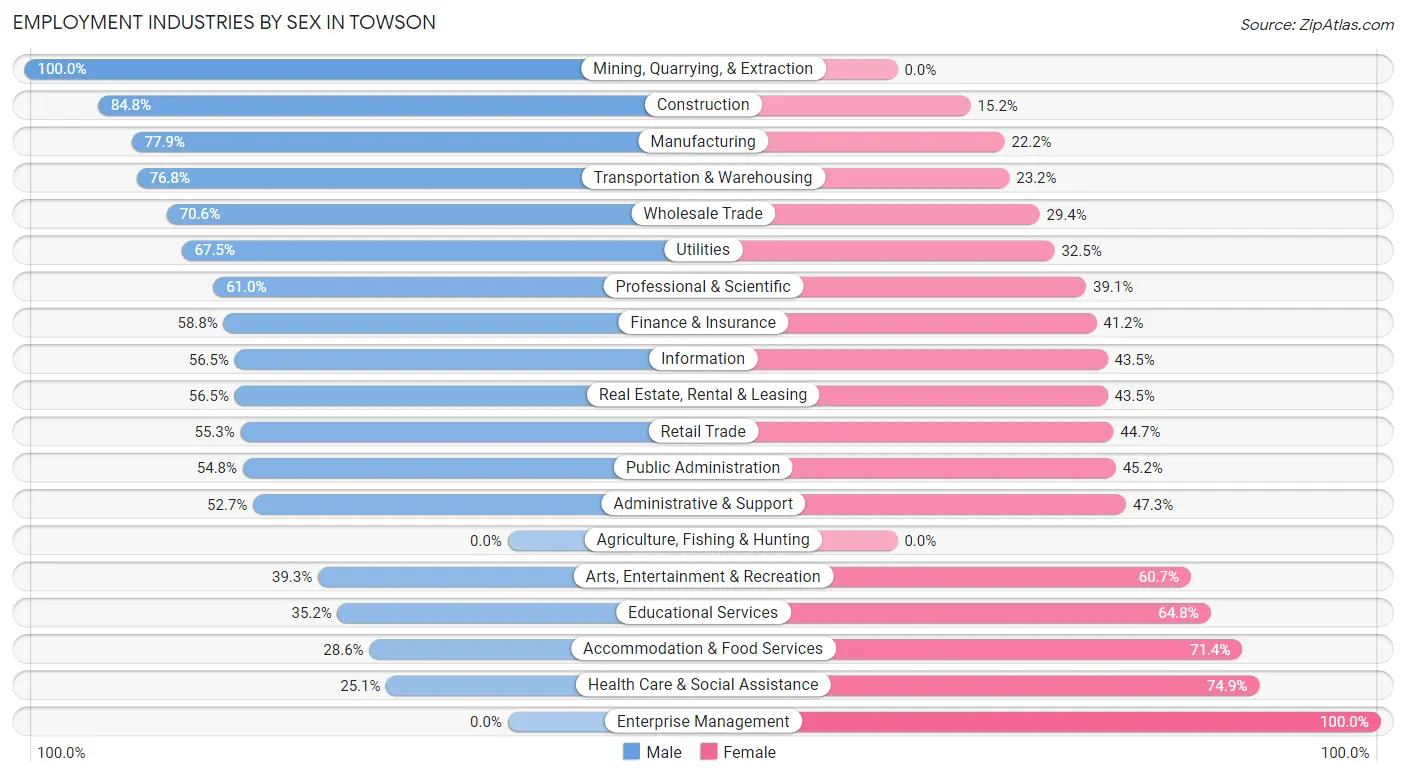
Employment Industries by Sex in Towson
The Towson industries that see more men than women are Mining, Quarrying, & Extraction (100.0%), Construction (84.8%), and Manufacturing (77.8%), whereas the industries that tend to have a higher number of women are Enterprise Management (100.0%), Health Care & Social Assistance (74.9%), and Accommodation & Food Services (71.4%).
| Industry | Male | Female |
| Agriculture, Fishing & Hunting | 0 (0.0%) | 0 (0.0%) |
| Mining, Quarrying, & Extraction | 41 (100.0%) | 0 (0.0%) |
| Construction | 750 (84.8%) | 134 (15.2%) |
| Manufacturing | 956 (77.8%) | 272 (22.2%) |
| Wholesale Trade | 283 (70.6%) | 118 (29.4%) |
| Retail Trade | 1,252 (55.3%) | 1,012 (44.7%) |
| Transportation & Warehousing | 620 (76.8%) | 187 (23.2%) |
| Utilities | 218 (67.5%) | 105 (32.5%) |
| Information | 352 (56.5%) | 271 (43.5%) |
| Finance & Insurance | 970 (58.8%) | 679 (41.2%) |
| Real Estate, Rental & Leasing | 417 (56.5%) | 321 (43.5%) |
| Professional & Scientific | 2,096 (61.0%) | 1,343 (39.1%) |
| Enterprise Management | 0 (0.0%) | 24 (100.0%) |
| Administrative & Support | 441 (52.7%) | 396 (47.3%) |
| Educational Services | 1,825 (35.2%) | 3,360 (64.8%) |
| Health Care & Social Assistance | 1,191 (25.1%) | 3,549 (74.9%) |
| Arts, Entertainment & Recreation | 410 (39.3%) | 634 (60.7%) |
| Accommodation & Food Services | 501 (28.6%) | 1,249 (71.4%) |
| Public Administration | 791 (54.8%) | 652 (45.2%) |
| Total | 13,399 (46.7%) | 15,303 (53.3%) |
Education in Towson
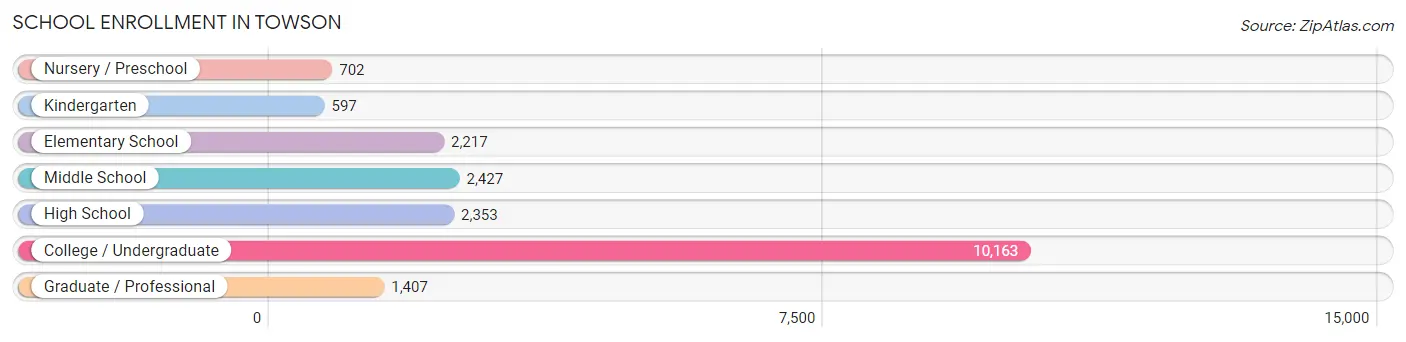
School Enrollment in Towson
The most common levels of schooling among the 19,866 students in Towson are college / undergraduate (10,163 | 51.2%), middle school (2,427 | 12.2%), and high school (2,353 | 11.8%).
| School Level | # Students | % Students |
| Nursery / Preschool | 702 | 3.5% |
| Kindergarten | 597 | 3.0% |
| Elementary School | 2,217 | 11.2% |
| Middle School | 2,427 | 12.2% |
| High School | 2,353 | 11.8% |
| College / Undergraduate | 10,163 | 51.2% |
| Graduate / Professional | 1,407 | 7.1% |
| Total | 19,866 | 100.0% |
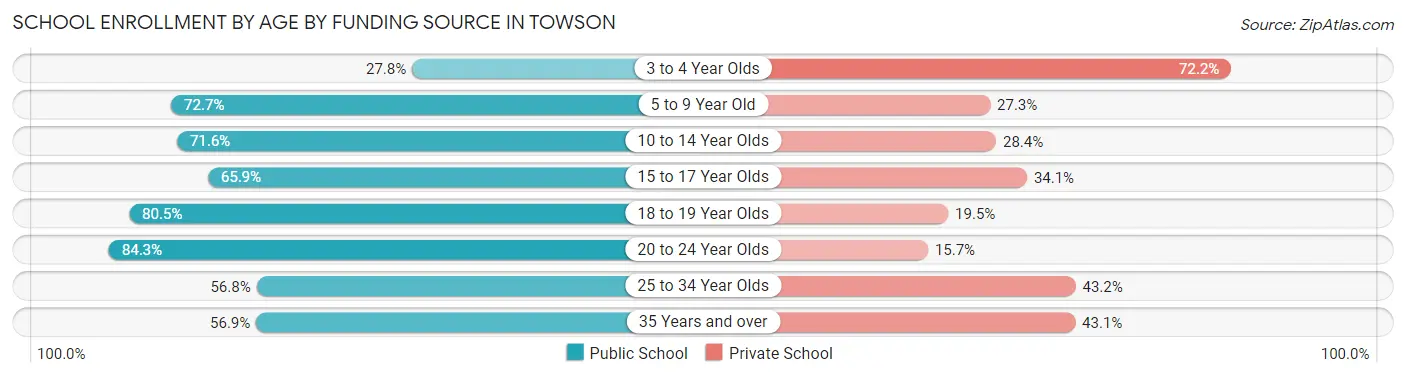
School Enrollment by Age by Funding Source in Towson
Out of a total of 19,866 students who are enrolled in schools in Towson, 5,145 (25.9%) attend a private institution, while the remaining 14,721 (74.1%) are enrolled in public schools. The age group of 3 to 4 year olds has the highest likelihood of being enrolled in private schools, with 415 (72.2% in the age bracket) enrolled. Conversely, the age group of 20 to 24 year olds has the lowest likelihood of being enrolled in a private school, with 5,112 (84.3% in the age bracket) attending a public institution.
| Age Bracket | Public School | Private School |
| 3 to 4 Year Olds | 160 (27.8%) | 415 (72.2%) |
| 5 to 9 Year Old | 1,930 (72.7%) | 724 (27.3%) |
| 10 to 14 Year Olds | 2,158 (71.6%) | 855 (28.4%) |
| 15 to 17 Year Olds | 1,121 (65.9%) | 581 (34.1%) |
| 18 to 19 Year Olds | 3,117 (80.5%) | 753 (19.5%) |
| 20 to 24 Year Olds | 5,112 (84.3%) | 952 (15.7%) |
| 25 to 34 Year Olds | 667 (56.8%) | 507 (43.2%) |
| 35 Years and over | 463 (56.9%) | 351 (43.1%) |
| Total | 14,721 (74.1%) | 5,145 (25.9%) |
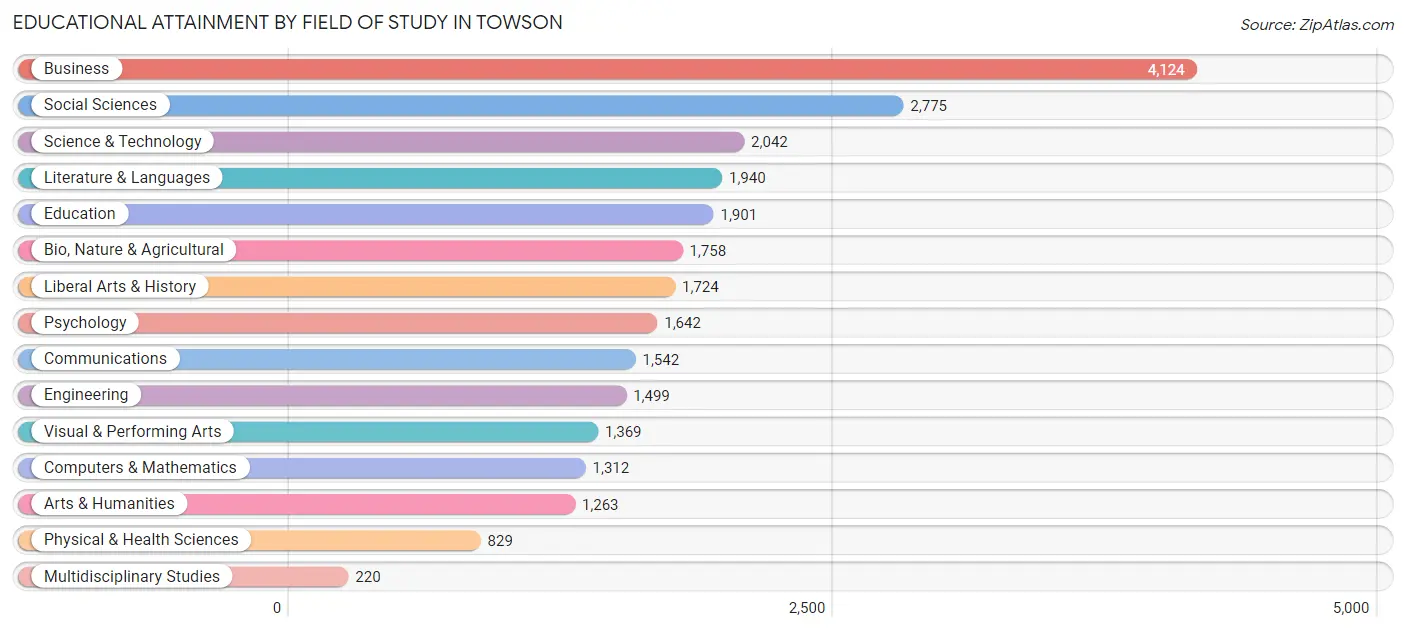
Educational Attainment by Field of Study in Towson
Business (4,124 | 15.9%), social sciences (2,775 | 10.7%), science & technology (2,042 | 7.9%), literature & languages (1,940 | 7.5%), and education (1,901 | 7.3%) are the most common fields of study among 25,940 individuals in Towson who have obtained a bachelor's degree or higher.
| Field of Study | # Graduates | % Graduates |
| Computers & Mathematics | 1,312 | 5.1% |
| Bio, Nature & Agricultural | 1,758 | 6.8% |
| Physical & Health Sciences | 829 | 3.2% |
| Psychology | 1,642 | 6.3% |
| Social Sciences | 2,775 | 10.7% |
| Engineering | 1,499 | 5.8% |
| Multidisciplinary Studies | 220 | 0.9% |
| Science & Technology | 2,042 | 7.9% |
| Business | 4,124 | 15.9% |
| Education | 1,901 | 7.3% |
| Literature & Languages | 1,940 | 7.5% |
| Liberal Arts & History | 1,724 | 6.7% |
| Visual & Performing Arts | 1,369 | 5.3% |
| Communications | 1,542 | 5.9% |
| Arts & Humanities | 1,263 | 4.9% |
| Total | 25,940 | 100.0% |
Transportation & Commute in Towson
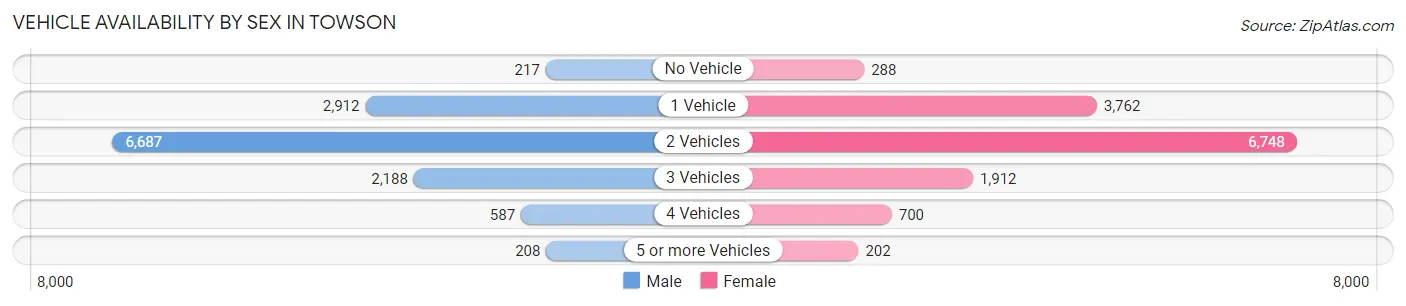
Vehicle Availability by Sex in Towson
The most prevalent vehicle ownership categories in Towson are males with 2 vehicles (6,687, accounting for 52.2%) and females with 2 vehicles (6,748, making up 49.1%).
| Vehicles Available | Male | Female |
| No Vehicle | 217 (1.7%) | 288 (2.1%) |
| 1 Vehicle | 2,912 (22.8%) | 3,762 (27.6%) |
| 2 Vehicles | 6,687 (52.2%) | 6,748 (49.6%) |
| 3 Vehicles | 2,188 (17.1%) | 1,912 (14.1%) |
| 4 Vehicles | 587 (4.6%) | 700 (5.1%) |
| 5 or more Vehicles | 208 (1.6%) | 202 (1.5%) |
| Total | 12,799 (100.0%) | 13,612 (100.0%) |
Commute Time in Towson
The most frequently occuring commute durations in Towson are 20 to 24 minutes (3,725 commuters, 15.7%), 30 to 34 minutes (3,470 commuters, 14.6%), and 10 to 14 minutes (3,149 commuters, 13.3%).
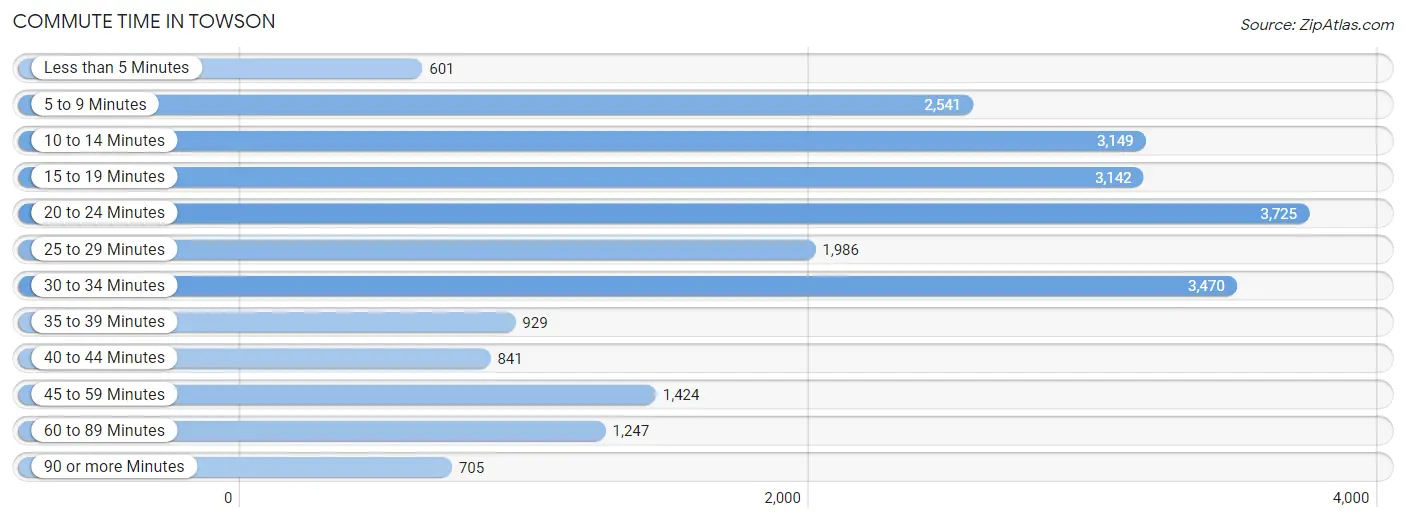
| Commute Time | # Commuters | % Commuters |
| Less than 5 Minutes | 601 | 2.5% |
| 5 to 9 Minutes | 2,541 | 10.7% |
| 10 to 14 Minutes | 3,149 | 13.3% |
| 15 to 19 Minutes | 3,142 | 13.2% |
| 20 to 24 Minutes | 3,725 | 15.7% |
| 25 to 29 Minutes | 1,986 | 8.4% |
| 30 to 34 Minutes | 3,470 | 14.6% |
| 35 to 39 Minutes | 929 | 3.9% |
| 40 to 44 Minutes | 841 | 3.5% |
| 45 to 59 Minutes | 1,424 | 6.0% |
| 60 to 89 Minutes | 1,247 | 5.2% |
| 90 or more Minutes | 705 | 3.0% |
Commute Time by Sex in Towson
The most common commute times in Towson are 30 to 34 minutes (1,880 commuters, 16.7%) for males and 20 to 24 minutes (1,871 commuters, 15.0%) for females.
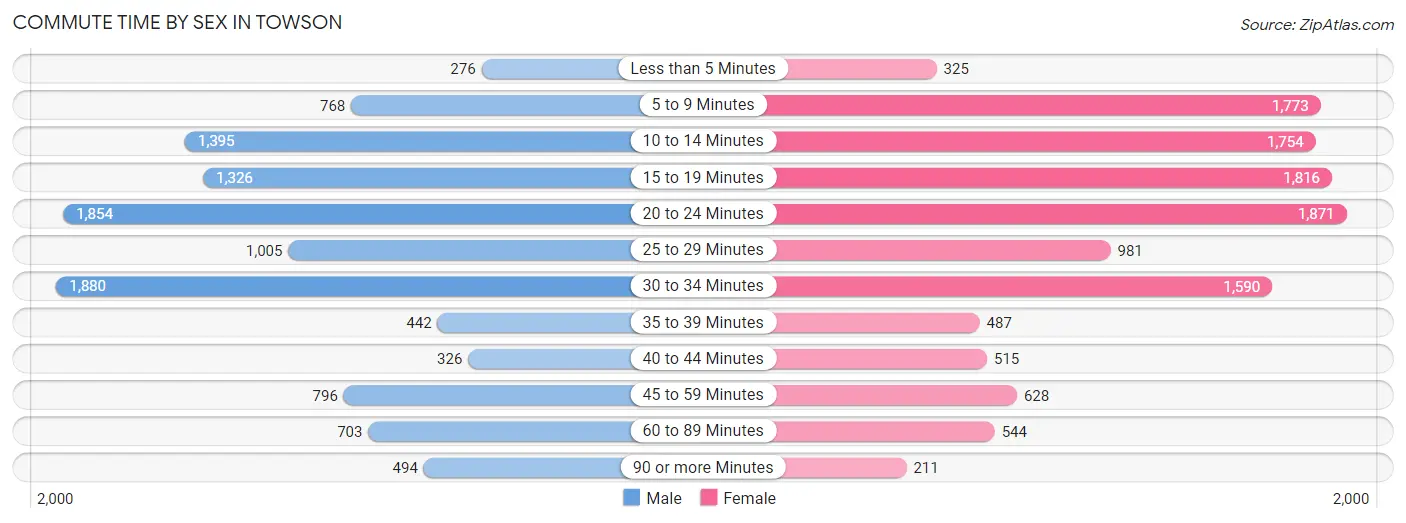
| Commute Time | Male | Female |
| Less than 5 Minutes | 276 (2.5%) | 325 (2.6%) |
| 5 to 9 Minutes | 768 (6.8%) | 1,773 (14.2%) |
| 10 to 14 Minutes | 1,395 (12.4%) | 1,754 (14.0%) |
| 15 to 19 Minutes | 1,326 (11.8%) | 1,816 (14.5%) |
| 20 to 24 Minutes | 1,854 (16.5%) | 1,871 (15.0%) |
| 25 to 29 Minutes | 1,005 (8.9%) | 981 (7.9%) |
| 30 to 34 Minutes | 1,880 (16.7%) | 1,590 (12.7%) |
| 35 to 39 Minutes | 442 (3.9%) | 487 (3.9%) |
| 40 to 44 Minutes | 326 (2.9%) | 515 (4.1%) |
| 45 to 59 Minutes | 796 (7.1%) | 628 (5.0%) |
| 60 to 89 Minutes | 703 (6.2%) | 544 (4.3%) |
| 90 or more Minutes | 494 (4.4%) | 211 (1.7%) |
Time of Departure to Work by Sex in Towson
The most frequent times of departure to work in Towson are 8:00 AM to 8:29 AM (2,098, 18.6%) for males and 8:00 AM to 8:29 AM (1,779, 14.2%) for females.
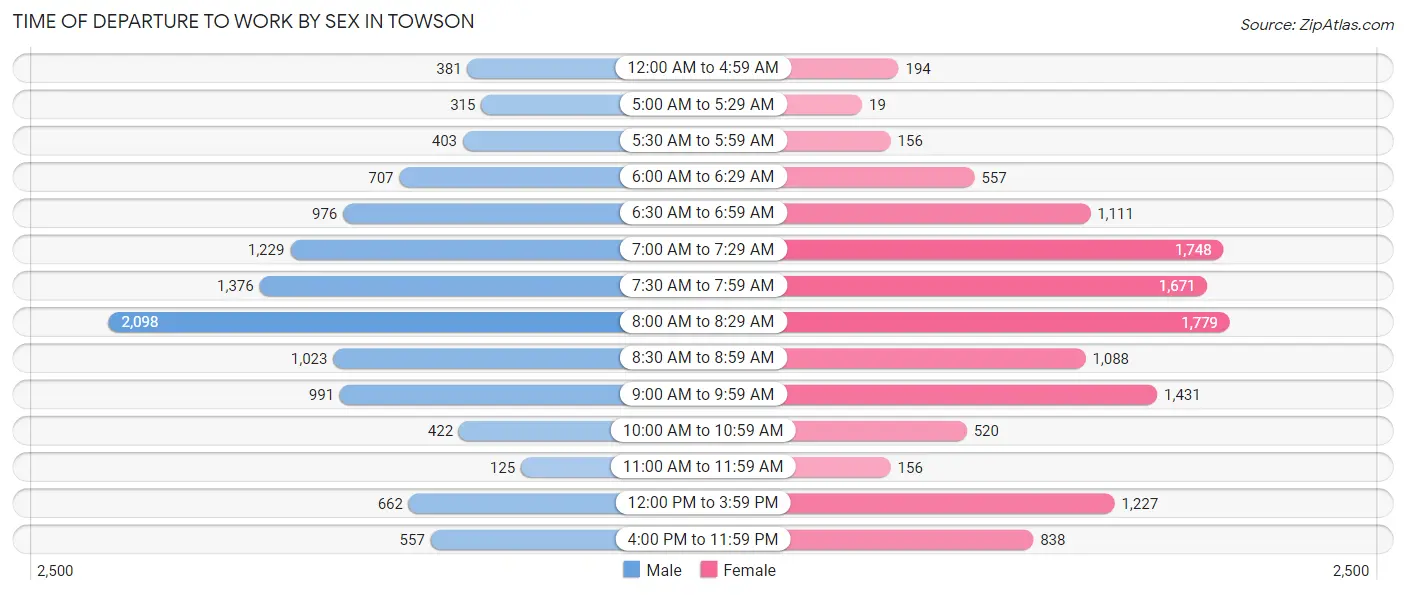
| Time of Departure | Male | Female |
| 12:00 AM to 4:59 AM | 381 (3.4%) | 194 (1.5%) |
| 5:00 AM to 5:29 AM | 315 (2.8%) | 19 (0.2%) |
| 5:30 AM to 5:59 AM | 403 (3.6%) | 156 (1.3%) |
| 6:00 AM to 6:29 AM | 707 (6.3%) | 557 (4.5%) |
| 6:30 AM to 6:59 AM | 976 (8.7%) | 1,111 (8.9%) |
| 7:00 AM to 7:29 AM | 1,229 (10.9%) | 1,748 (14.0%) |
| 7:30 AM to 7:59 AM | 1,376 (12.2%) | 1,671 (13.4%) |
| 8:00 AM to 8:29 AM | 2,098 (18.6%) | 1,779 (14.2%) |
| 8:30 AM to 8:59 AM | 1,023 (9.1%) | 1,088 (8.7%) |
| 9:00 AM to 9:59 AM | 991 (8.8%) | 1,431 (11.5%) |
| 10:00 AM to 10:59 AM | 422 (3.7%) | 520 (4.2%) |
| 11:00 AM to 11:59 AM | 125 (1.1%) | 156 (1.3%) |
| 12:00 PM to 3:59 PM | 662 (5.9%) | 1,227 (9.8%) |
| 4:00 PM to 11:59 PM | 557 (4.9%) | 838 (6.7%) |
| Total | 11,265 (100.0%) | 12,495 (100.0%) |
Housing Occupancy in Towson
Occupancy by Ownership in Towson
Of the total 22,430 dwellings in Towson, owner-occupied units account for 12,896 (57.5%), while renter-occupied units make up 9,534 (42.5%).
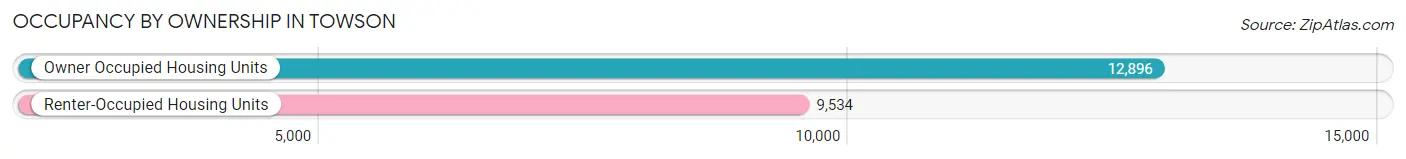
| Occupancy | # Housing Units | % Housing Units |
| Owner Occupied Housing Units | 12,896 | 57.5% |
| Renter-Occupied Housing Units | 9,534 | 42.5% |
| Total Occupied Housing Units | 22,430 | 100.0% |
Occupancy by Household Size in Towson
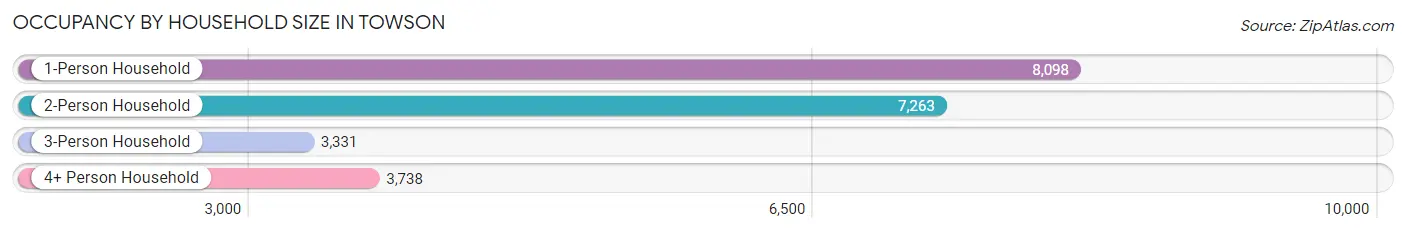
| Household Size | # Housing Units | % Housing Units |
| 1-Person Household | 8,098 | 36.1% |
| 2-Person Household | 7,263 | 32.4% |
| 3-Person Household | 3,331 | 14.8% |
| 4+ Person Household | 3,738 | 16.7% |
| Total Housing Units | 22,430 | 100.0% |
Occupancy by Ownership by Household Size in Towson
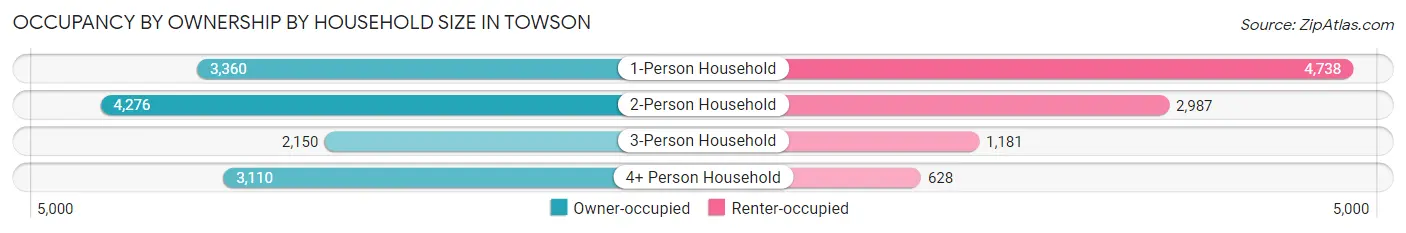
| Household Size | Owner-occupied | Renter-occupied |
| 1-Person Household | 3,360 (41.5%) | 4,738 (58.5%) |
| 2-Person Household | 4,276 (58.9%) | 2,987 (41.1%) |
| 3-Person Household | 2,150 (64.5%) | 1,181 (35.4%) |
| 4+ Person Household | 3,110 (83.2%) | 628 (16.8%) |
| Total Housing Units | 12,896 (57.5%) | 9,534 (42.5%) |
Occupancy by Educational Attainment in Towson
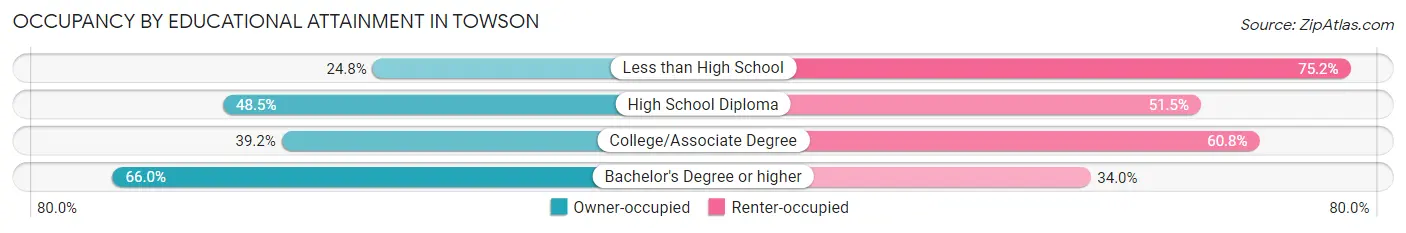
| Household Size | Owner-occupied | Renter-occupied |
| Less than High School | 131 (24.8%) | 397 (75.2%) |
| High School Diploma | 941 (48.5%) | 999 (51.5%) |
| College/Associate Degree | 1,988 (39.2%) | 3,078 (60.8%) |
| Bachelor's Degree or higher | 9,836 (66.0%) | 5,060 (34.0%) |
Occupancy by Age of Householder in Towson
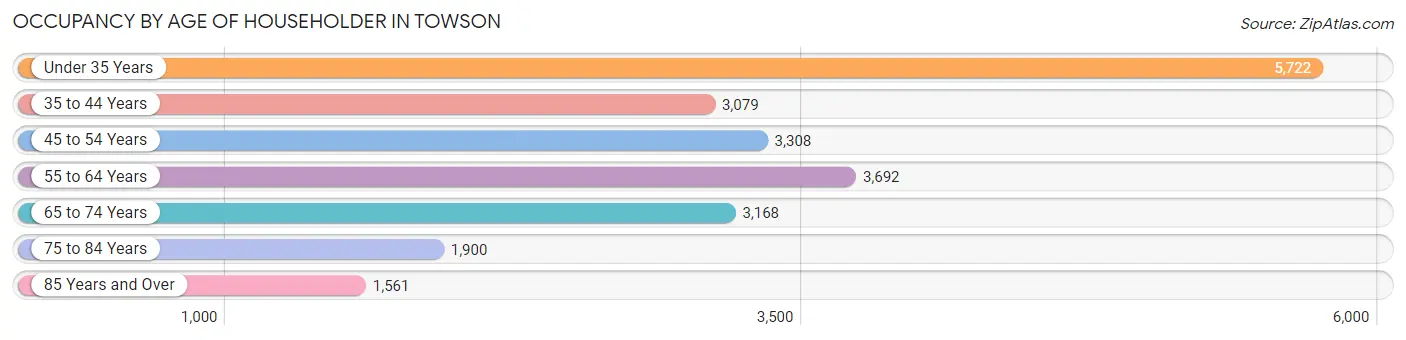
| Age Bracket | # Households | % Households |
| Under 35 Years | 5,722 | 25.5% |
| 35 to 44 Years | 3,079 | 13.7% |
| 45 to 54 Years | 3,308 | 14.7% |
| 55 to 64 Years | 3,692 | 16.5% |
| 65 to 74 Years | 3,168 | 14.1% |
| 75 to 84 Years | 1,900 | 8.5% |
| 85 Years and Over | 1,561 | 7.0% |
| Total | 22,430 | 100.0% |
Housing Finances in Towson
Median Income by Occupancy in Towson
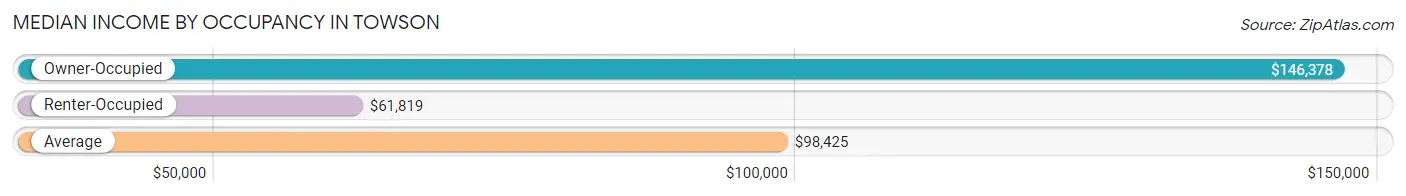
| Occupancy Type | # Households | Median Income |
| Owner-Occupied | 12,896 (57.5%) | $146,378 |
| Renter-Occupied | 9,534 (42.5%) | $61,819 |
| Average | 22,430 (100.0%) | $98,425 |
Occupancy by Householder Income Bracket in Towson
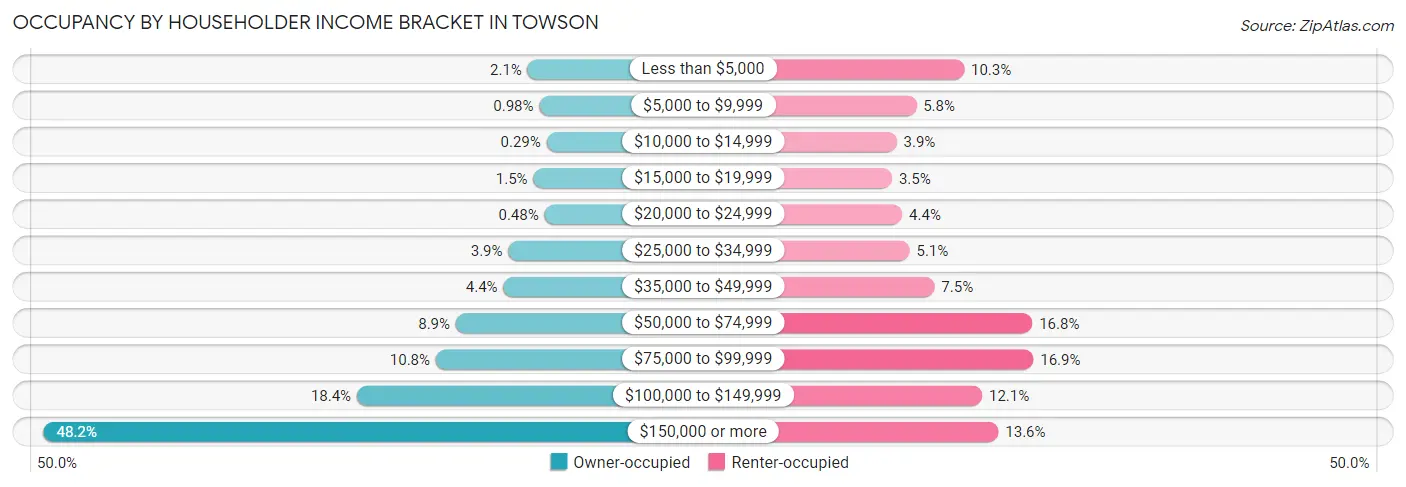
| Income Bracket | Owner-occupied | Renter-occupied |
| Less than $5,000 | 269 (2.1%) | 985 (10.3%) |
| $5,000 to $9,999 | 127 (1.0%) | 551 (5.8%) |
| $10,000 to $14,999 | 37 (0.3%) | 373 (3.9%) |
| $15,000 to $19,999 | 199 (1.5%) | 331 (3.5%) |
| $20,000 to $24,999 | 62 (0.5%) | 423 (4.4%) |
| $25,000 to $34,999 | 507 (3.9%) | 490 (5.1%) |
| $35,000 to $49,999 | 567 (4.4%) | 716 (7.5%) |
| $50,000 to $74,999 | 1,151 (8.9%) | 1,605 (16.8%) |
| $75,000 to $99,999 | 1,397 (10.8%) | 1,614 (16.9%) |
| $100,000 to $149,999 | 2,366 (18.3%) | 1,149 (12.0%) |
| $150,000 or more | 6,214 (48.2%) | 1,297 (13.6%) |
| Total | 12,896 (100.0%) | 9,534 (100.0%) |
Monthly Housing Cost Tiers in Towson
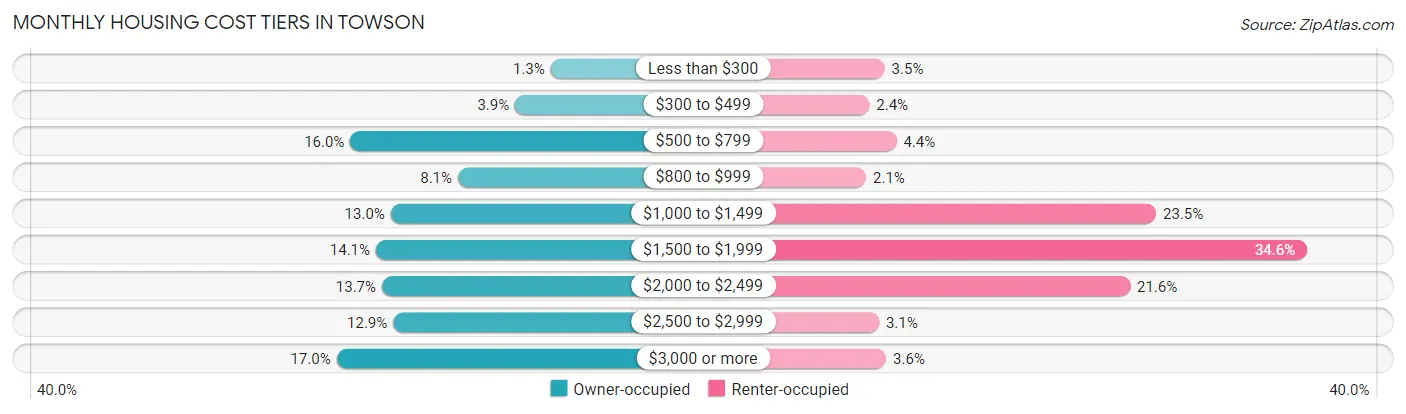
| Monthly Cost | Owner-occupied | Renter-occupied |
| Less than $300 | 163 (1.3%) | 332 (3.5%) |
| $300 to $499 | 501 (3.9%) | 224 (2.4%) |
| $500 to $799 | 2,066 (16.0%) | 415 (4.3%) |
| $800 to $999 | 1,043 (8.1%) | 201 (2.1%) |
| $1,000 to $1,499 | 1,681 (13.0%) | 2,238 (23.5%) |
| $1,500 to $1,999 | 1,822 (14.1%) | 3,297 (34.6%) |
| $2,000 to $2,499 | 1,765 (13.7%) | 2,055 (21.5%) |
| $2,500 to $2,999 | 1,659 (12.9%) | 292 (3.1%) |
| $3,000 or more | 2,196 (17.0%) | 342 (3.6%) |
| Total | 12,896 (100.0%) | 9,534 (100.0%) |
Physical Housing Characteristics in Towson
Housing Structures in Towson
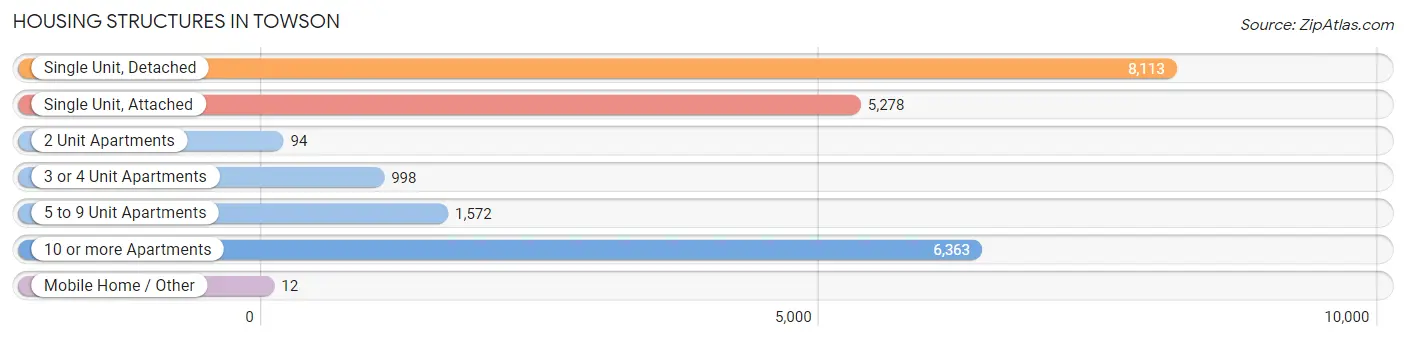
| Structure Type | # Housing Units | % Housing Units |
| Single Unit, Detached | 8,113 | 36.2% |
| Single Unit, Attached | 5,278 | 23.5% |
| 2 Unit Apartments | 94 | 0.4% |
| 3 or 4 Unit Apartments | 998 | 4.4% |
| 5 to 9 Unit Apartments | 1,572 | 7.0% |
| 10 or more Apartments | 6,363 | 28.4% |
| Mobile Home / Other | 12 | 0.1% |
| Total | 22,430 | 100.0% |
Housing Structures by Occupancy in Towson
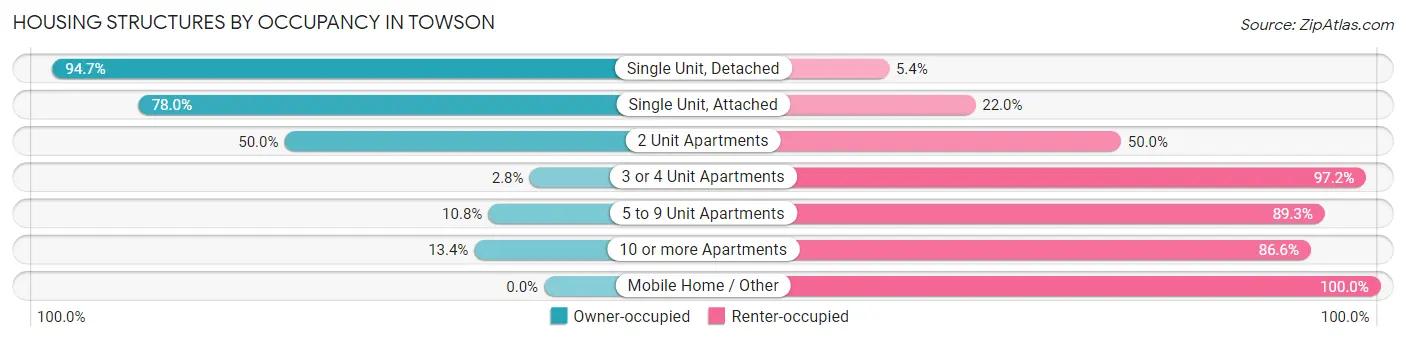
| Structure Type | Owner-occupied | Renter-occupied |
| Single Unit, Detached | 7,679 (94.7%) | 434 (5.3%) |
| Single Unit, Attached | 4,118 (78.0%) | 1,160 (22.0%) |
| 2 Unit Apartments | 47 (50.0%) | 47 (50.0%) |
| 3 or 4 Unit Apartments | 28 (2.8%) | 970 (97.2%) |
| 5 to 9 Unit Apartments | 169 (10.7%) | 1,403 (89.2%) |
| 10 or more Apartments | 855 (13.4%) | 5,508 (86.6%) |
| Mobile Home / Other | 0 (0.0%) | 12 (100.0%) |
| Total | 12,896 (57.5%) | 9,534 (42.5%) |
Housing Structures by Number of Rooms in Towson
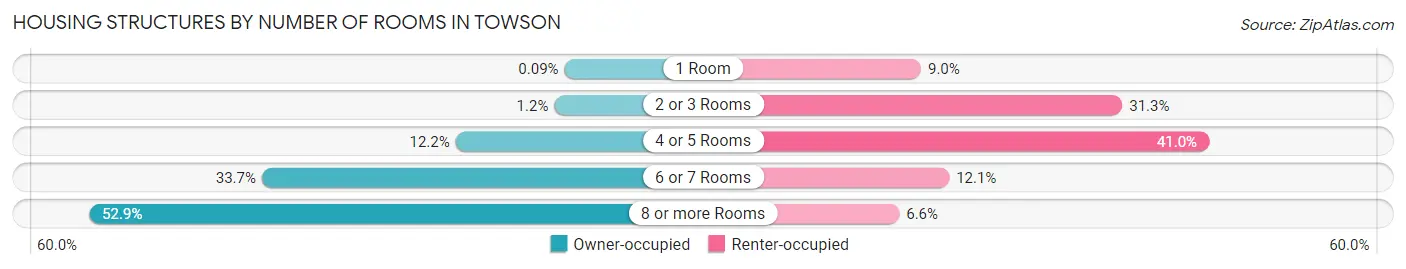
| Number of Rooms | Owner-occupied | Renter-occupied |
| 1 Room | 11 (0.1%) | 858 (9.0%) |
| 2 or 3 Rooms | 157 (1.2%) | 2,988 (31.3%) |
| 4 or 5 Rooms | 1,569 (12.2%) | 3,904 (40.9%) |
| 6 or 7 Rooms | 4,343 (33.7%) | 1,156 (12.1%) |
| 8 or more Rooms | 6,816 (52.8%) | 628 (6.6%) |
| Total | 12,896 (100.0%) | 9,534 (100.0%) |
Housing Structure by Heating Type in Towson
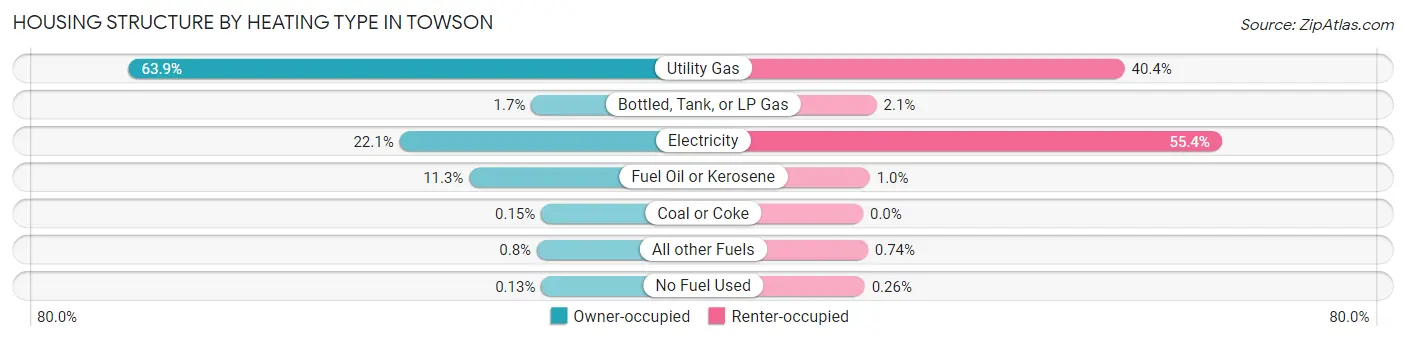
| Heating Type | Owner-occupied | Renter-occupied |
| Utility Gas | 8,242 (63.9%) | 3,855 (40.4%) |
| Bottled, Tank, or LP Gas | 217 (1.7%) | 199 (2.1%) |
| Electricity | 2,844 (22.1%) | 5,285 (55.4%) |
| Fuel Oil or Kerosene | 1,454 (11.3%) | 99 (1.0%) |
| Coal or Coke | 19 (0.2%) | 0 (0.0%) |
| All other Fuels | 103 (0.8%) | 71 (0.7%) |
| No Fuel Used | 17 (0.1%) | 25 (0.3%) |
| Total | 12,896 (100.0%) | 9,534 (100.0%) |
Household Vehicle Usage in Towson
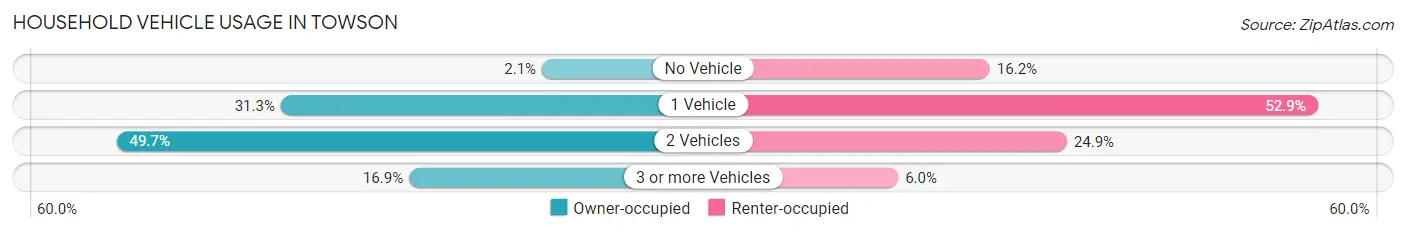
| Vehicles per Household | Owner-occupied | Renter-occupied |
| No Vehicle | 264 (2.1%) | 1,548 (16.2%) |
| 1 Vehicle | 4,038 (31.3%) | 5,046 (52.9%) |
| 2 Vehicles | 6,409 (49.7%) | 2,371 (24.9%) |
| 3 or more Vehicles | 2,185 (16.9%) | 569 (6.0%) |
| Total | 12,896 (100.0%) | 9,534 (100.0%) |
Real Estate & Mortgages in Towson
Real Estate and Mortgage Overview in Towson
| Characteristic | Without Mortgage | With Mortgage |
| Housing Units | 4,696 | 8,200 |
| Median Property Value | $382,800 | $429,200 |
| Median Household Income | $103,396 | $4,545 |
| Monthly Housing Costs | $769 | $2,147 |
| Real Estate Taxes | $4,258 | $47 |
Property Value by Mortgage Status in Towson
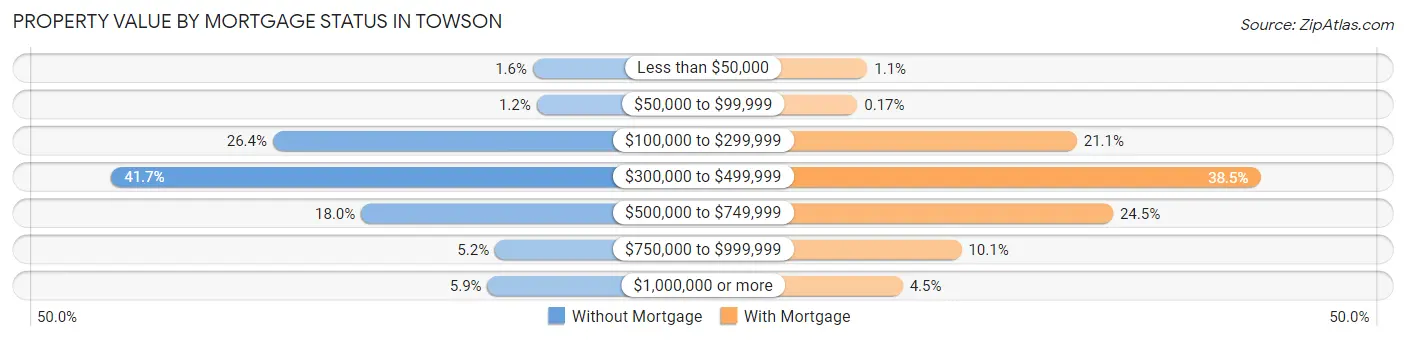
| Property Value | Without Mortgage | With Mortgage |
| Less than $50,000 | 75 (1.6%) | 92 (1.1%) |
| $50,000 to $99,999 | 58 (1.2%) | 14 (0.2%) |
| $100,000 to $299,999 | 1,238 (26.4%) | 1,728 (21.1%) |
| $300,000 to $499,999 | 1,960 (41.7%) | 3,160 (38.5%) |
| $500,000 to $749,999 | 843 (17.9%) | 2,011 (24.5%) |
| $750,000 to $999,999 | 244 (5.2%) | 827 (10.1%) |
| $1,000,000 or more | 278 (5.9%) | 368 (4.5%) |
| Total | 4,696 (100.0%) | 8,200 (100.0%) |
Household Income by Mortgage Status in Towson
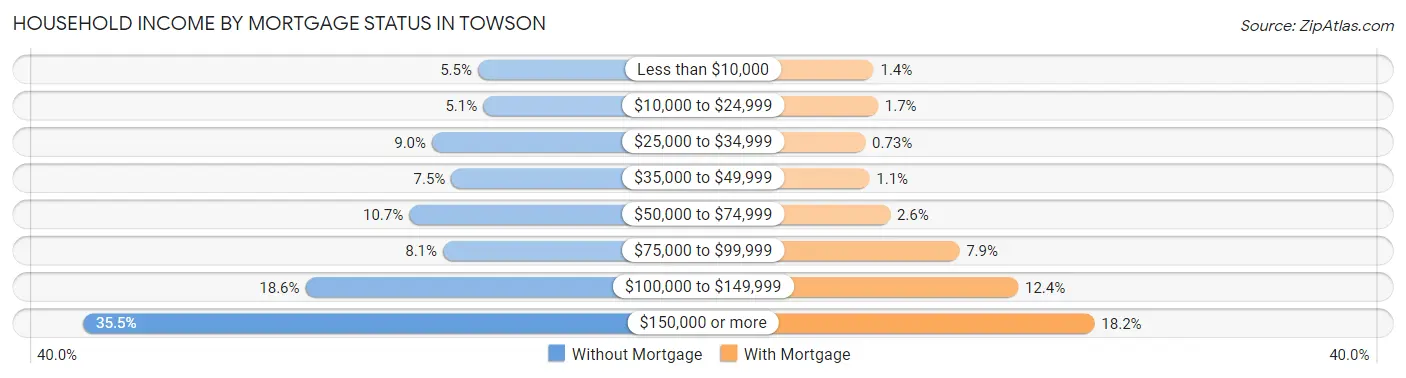
| Household Income | Without Mortgage | With Mortgage |
| Less than $10,000 | 257 (5.5%) | 112 (1.4%) |
| $10,000 to $24,999 | 238 (5.1%) | 139 (1.7%) |
| $25,000 to $34,999 | 421 (9.0%) | 60 (0.7%) |
| $35,000 to $49,999 | 352 (7.5%) | 86 (1.1%) |
| $50,000 to $74,999 | 503 (10.7%) | 215 (2.6%) |
| $75,000 to $99,999 | 382 (8.1%) | 648 (7.9%) |
| $100,000 to $149,999 | 874 (18.6%) | 1,015 (12.4%) |
| $150,000 or more | 1,669 (35.5%) | 1,492 (18.2%) |
| Total | 4,696 (100.0%) | 8,200 (100.0%) |
Property Value to Household Income Ratio in Towson
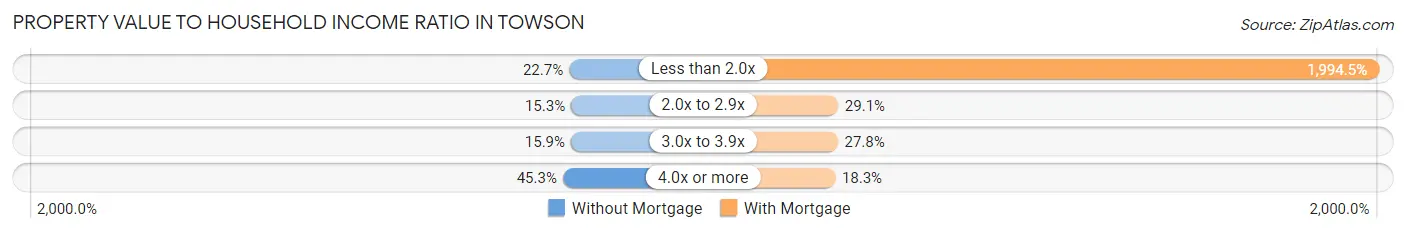
| Value-to-Income Ratio | Without Mortgage | With Mortgage |
| Less than 2.0x | 1,064 (22.7%) | 163,551 (1,994.5%) |
| 2.0x to 2.9x | 720 (15.3%) | 2,383 (29.1%) |
| 3.0x to 3.9x | 745 (15.9%) | 2,279 (27.8%) |
| 4.0x or more | 2,126 (45.3%) | 1,501 (18.3%) |
| Total | 4,696 (100.0%) | 8,200 (100.0%) |
Real Estate Taxes by Mortgage Status in Towson
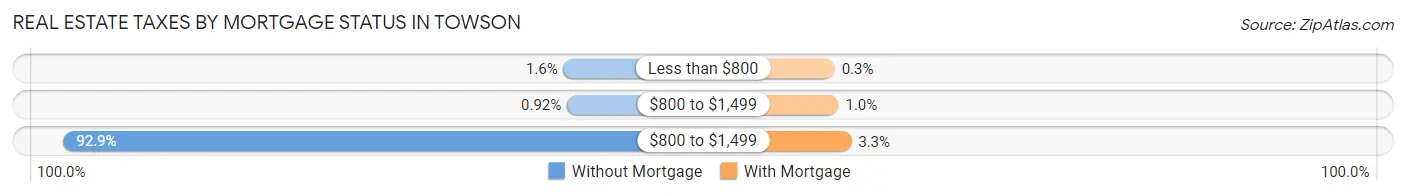
| Property Taxes | Without Mortgage | With Mortgage |
| Less than $800 | 73 (1.5%) | 25 (0.3%) |
| $800 to $1,499 | 43 (0.9%) | 82 (1.0%) |
| $800 to $1,499 | 4,363 (92.9%) | 273 (3.3%) |
| Total | 4,696 (100.0%) | 8,200 (100.0%) |
Health & Disability in Towson
Health Insurance Coverage by Age in Towson
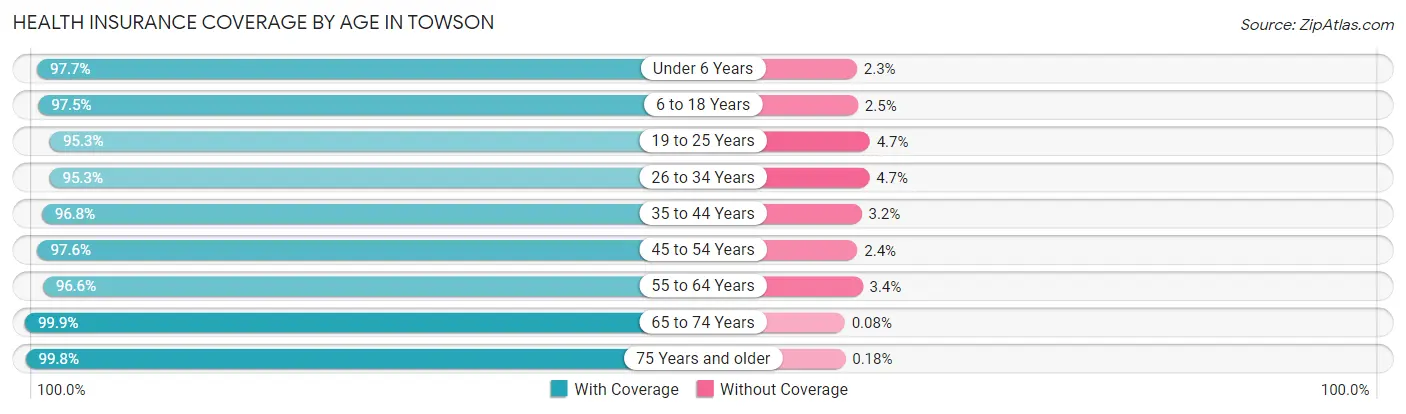
| Age Bracket | With Coverage | Without Coverage |
| Under 6 Years | 2,753 (97.7%) | 66 (2.3%) |
| 6 to 18 Years | 8,855 (97.5%) | 231 (2.5%) |
| 19 to 25 Years | 9,745 (95.3%) | 485 (4.7%) |
| 26 to 34 Years | 6,468 (95.3%) | 316 (4.7%) |
| 35 to 44 Years | 5,606 (96.8%) | 186 (3.2%) |
| 45 to 54 Years | 5,673 (97.6%) | 142 (2.4%) |
| 55 to 64 Years | 5,420 (96.6%) | 191 (3.4%) |
| 65 to 74 Years | 4,861 (99.9%) | 4 (0.1%) |
| 75 Years and older | 4,925 (99.8%) | 9 (0.2%) |
| Total | 54,306 (97.1%) | 1,630 (2.9%) |
Health Insurance Coverage by Citizenship Status in Towson
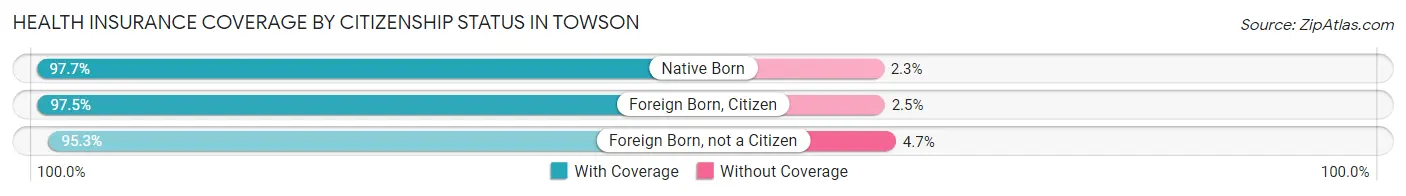
| Citizenship Status | With Coverage | Without Coverage |
| Native Born | 2,753 (97.7%) | 66 (2.3%) |
| Foreign Born, Citizen | 8,855 (97.5%) | 231 (2.5%) |
| Foreign Born, not a Citizen | 9,745 (95.3%) | 485 (4.7%) |
Health Insurance Coverage by Household Income in Towson
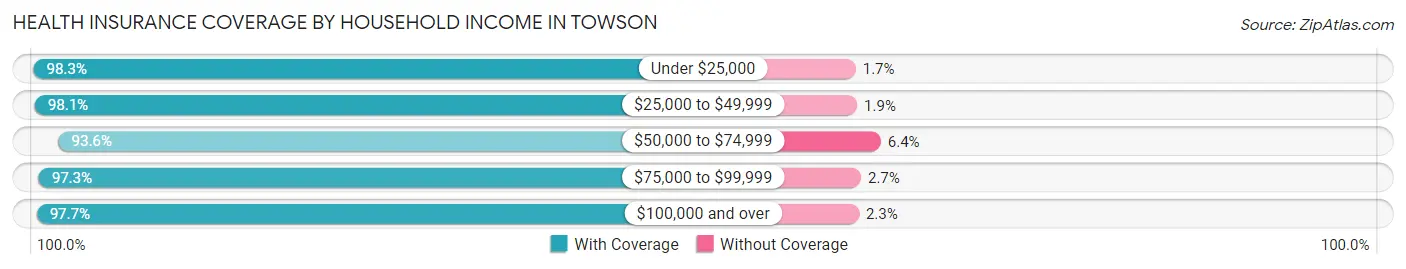
| Household Income | With Coverage | Without Coverage |
| Under $25,000 | 5,276 (98.3%) | 90 (1.7%) |
| $25,000 to $49,999 | 3,391 (98.1%) | 67 (1.9%) |
| $50,000 to $74,999 | 4,666 (93.6%) | 318 (6.4%) |
| $75,000 to $99,999 | 5,429 (97.3%) | 149 (2.7%) |
| $100,000 and over | 30,238 (97.7%) | 704 (2.3%) |
Public vs Private Health Insurance Coverage by Age in Towson
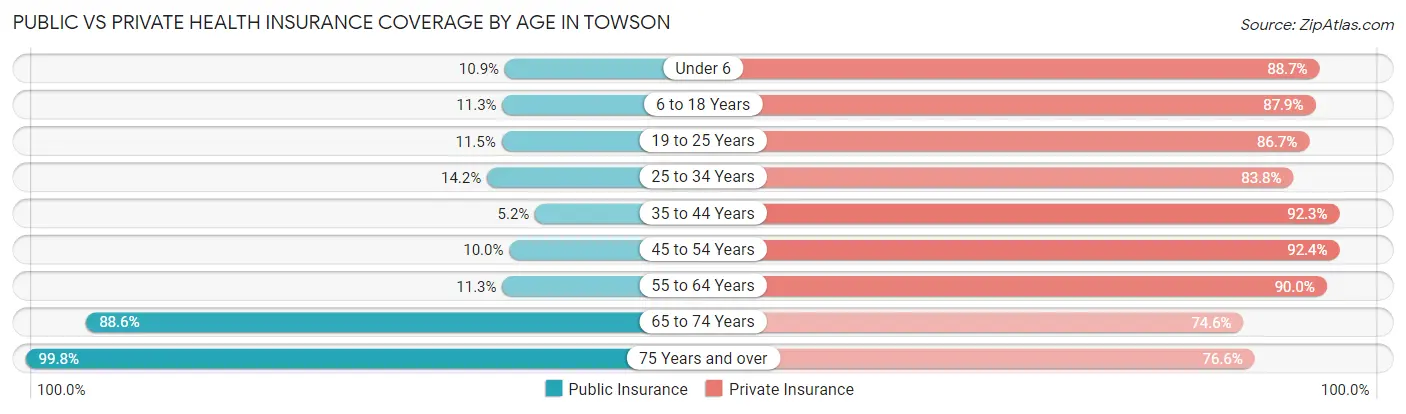
| Age Bracket | Public Insurance | Private Insurance |
| Under 6 | 306 (10.8%) | 2,499 (88.6%) |
| 6 to 18 Years | 1,028 (11.3%) | 7,985 (87.9%) |
| 19 to 25 Years | 1,173 (11.5%) | 8,873 (86.7%) |
| 25 to 34 Years | 961 (14.2%) | 5,686 (83.8%) |
| 35 to 44 Years | 303 (5.2%) | 5,348 (92.3%) |
| 45 to 54 Years | 584 (10.0%) | 5,370 (92.3%) |
| 55 to 64 Years | 635 (11.3%) | 5,050 (90.0%) |
| 65 to 74 Years | 4,308 (88.5%) | 3,627 (74.6%) |
| 75 Years and over | 4,924 (99.8%) | 3,781 (76.6%) |
| Total | 14,222 (25.4%) | 48,219 (86.2%) |
Disability Status by Sex by Age in Towson
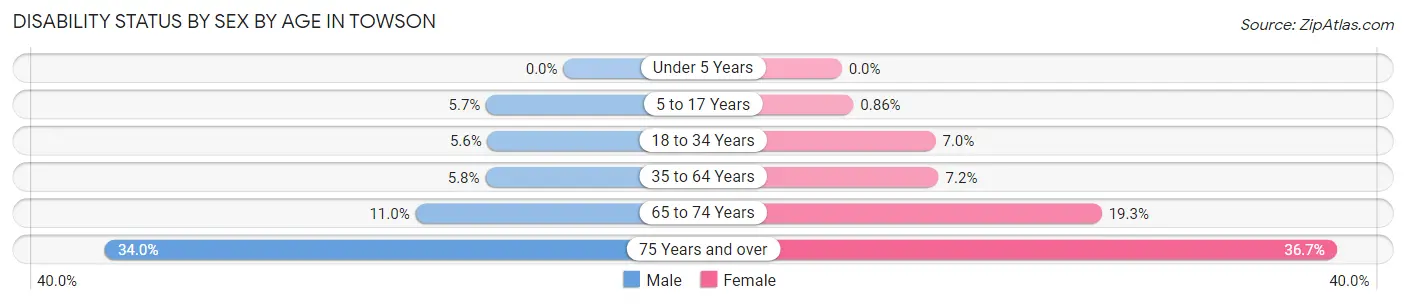
| Age Bracket | Male | Female |
| Under 5 Years | 0 (0.0%) | 0 (0.0%) |
| 5 to 17 Years | 221 (5.7%) | 32 (0.9%) |
| 18 to 34 Years | 457 (5.6%) | 751 (7.0%) |
| 35 to 64 Years | 489 (5.8%) | 631 (7.2%) |
| 65 to 74 Years | 239 (11.0%) | 519 (19.3%) |
| 75 Years and over | 633 (34.0%) | 1,129 (36.7%) |
Disability Class by Sex by Age in Towson
Disability Class: Hearing Difficulty
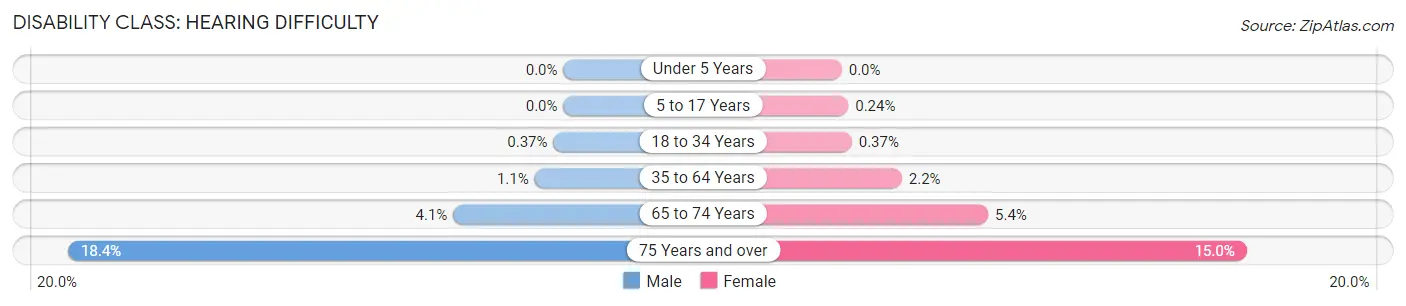
| Age Bracket | Male | Female |
| Under 5 Years | 0 (0.0%) | 0 (0.0%) |
| 5 to 17 Years | 0 (0.0%) | 9 (0.2%) |
| 18 to 34 Years | 30 (0.4%) | 40 (0.4%) |
| 35 to 64 Years | 90 (1.1%) | 196 (2.2%) |
| 65 to 74 Years | 89 (4.1%) | 146 (5.4%) |
| 75 Years and over | 342 (18.4%) | 462 (15.0%) |
Disability Class: Vision Difficulty
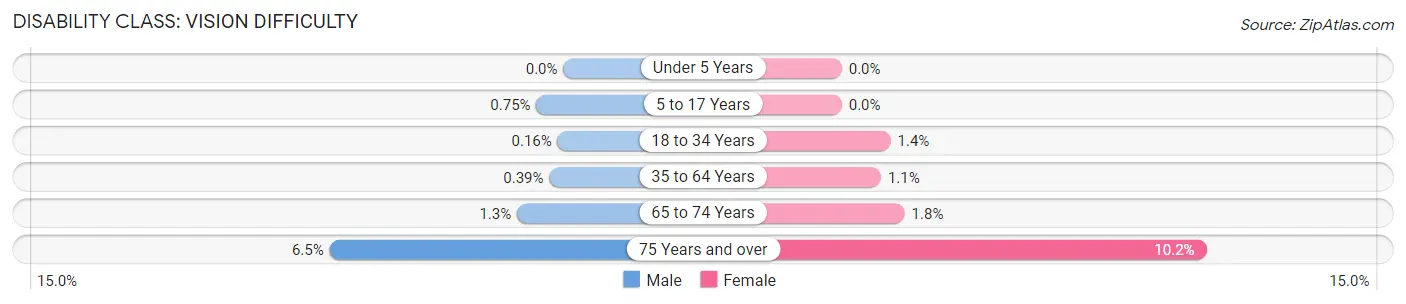
| Age Bracket | Male | Female |
| Under 5 Years | 0 (0.0%) | 0 (0.0%) |
| 5 to 17 Years | 29 (0.7%) | 0 (0.0%) |
| 18 to 34 Years | 13 (0.2%) | 147 (1.4%) |
| 35 to 64 Years | 33 (0.4%) | 96 (1.1%) |
| 65 to 74 Years | 28 (1.3%) | 47 (1.8%) |
| 75 Years and over | 121 (6.5%) | 312 (10.2%) |
Disability Class: Cognitive Difficulty
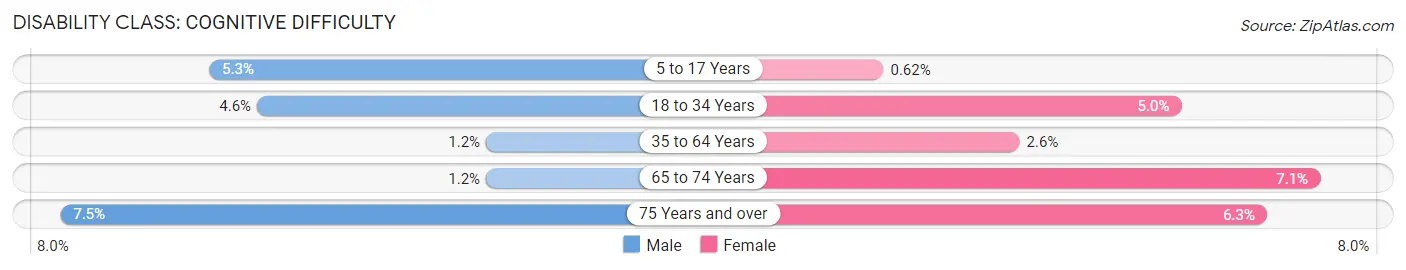
| Age Bracket | Male | Female |
| 5 to 17 Years | 203 (5.3%) | 23 (0.6%) |
| 18 to 34 Years | 369 (4.5%) | 544 (5.0%) |
| 35 to 64 Years | 97 (1.1%) | 232 (2.6%) |
| 65 to 74 Years | 25 (1.1%) | 191 (7.1%) |
| 75 Years and over | 139 (7.5%) | 194 (6.3%) |
Disability Class: Ambulatory Difficulty
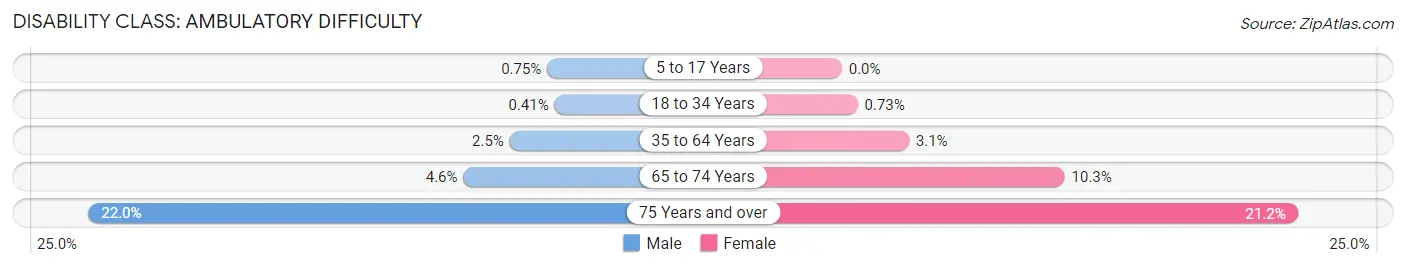
| Age Bracket | Male | Female |
| 5 to 17 Years | 29 (0.7%) | 0 (0.0%) |
| 18 to 34 Years | 33 (0.4%) | 79 (0.7%) |
| 35 to 64 Years | 210 (2.5%) | 273 (3.1%) |
| 65 to 74 Years | 101 (4.6%) | 278 (10.3%) |
| 75 Years and over | 410 (22.0%) | 650 (21.1%) |
Disability Class: Self-Care Difficulty
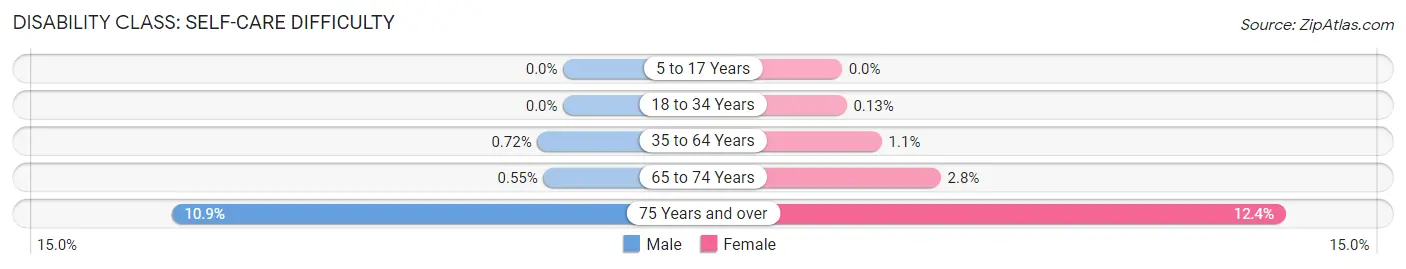
| Age Bracket | Male | Female |
| 5 to 17 Years | 0 (0.0%) | 0 (0.0%) |
| 18 to 34 Years | 0 (0.0%) | 14 (0.1%) |
| 35 to 64 Years | 61 (0.7%) | 97 (1.1%) |
| 65 to 74 Years | 12 (0.5%) | 74 (2.8%) |
| 75 Years and over | 203 (10.9%) | 380 (12.4%) |
Technology Access in Towson
Computing Device Access in Towson
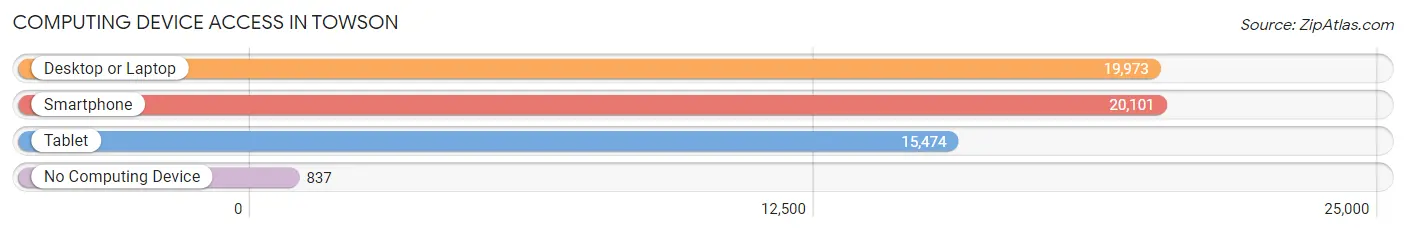
| Device Type | # Households | % Households |
| Desktop or Laptop | 19,973 | 89.0% |
| Smartphone | 20,101 | 89.6% |
| Tablet | 15,474 | 69.0% |
| No Computing Device | 837 | 3.7% |
| Total | 22,430 | 100.0% |
Internet Access in Towson
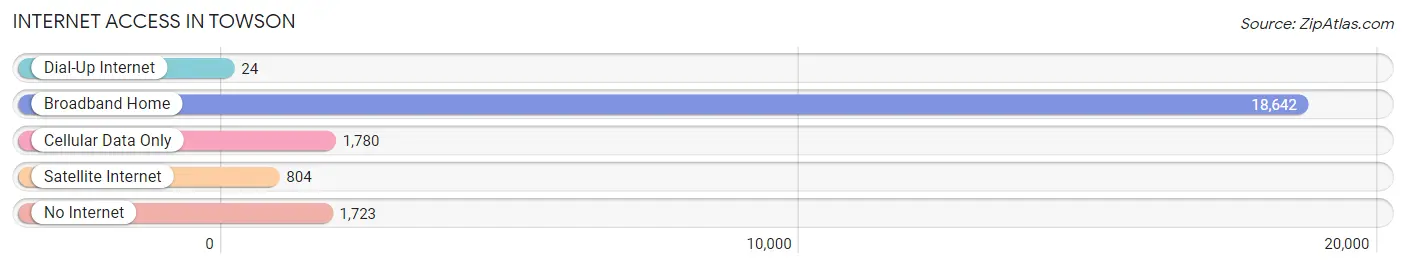
| Internet Type | # Households | % Households |
| Dial-Up Internet | 24 | 0.1% |
| Broadband Home | 18,642 | 83.1% |
| Cellular Data Only | 1,780 | 7.9% |
| Satellite Internet | 804 | 3.6% |
| No Internet | 1,723 | 7.7% |
| Total | 22,430 | 100.0% |
Towson Summary
Towson, Maryland is a suburban community located in Baltimore County, just north of the city of Baltimore. It is the county seat and the second-largest unincorporated county in the state. The population of Towson was 45,619 at the 2010 census, making it the largest unincorporated county seat in the United States.
History
Towson was first settled in 1752 by William Towson, a Quaker from Pennsylvania. He purchased a large tract of land from the local Native Americans and established a trading post. The area was known as Towsontowne until 1854, when it was officially incorporated as Towson.
The town grew rapidly in the 19th century, becoming a center for commerce and industry. The Baltimore and Ohio Railroad opened a station in Towson in 1873, and the town became a popular destination for day-trippers from Baltimore. Towson was also home to a number of prominent businesses, including the Towson Iron Works, the Towson Manufacturing Company, and the Towson Tannery.
Geography
Towson is located in northern Baltimore County, approximately 10 miles north of downtown Baltimore. It is bordered by the city of Baltimore to the south, the city of Lutherville-Timonium to the west, and the communities of Cockeysville and Parkville to the north. The town is situated on the western edge of the Piedmont Plateau, with rolling hills and valleys to the east.
The town is bisected by the Jones Falls, a tributary of the Patapsco River. The Jones Falls flows through the center of Towson, and is a popular spot for fishing and kayaking. The town is also home to several parks, including the Towson Town Center Park, the Towson Commons Park, and the Towson University Park.
Economy
Towson is a major economic center in the Baltimore metropolitan area. The town is home to a number of corporate headquarters, including the headquarters of Under Armour, T. Rowe Price, and CareFirst BlueCross BlueShield. Towson is also home to a number of shopping centers, including the Towson Town Center, the Towson Commons, and the Towson Marketplace.
The town is also home to Towson University, a public university with an enrollment of over 20,000 students. The university is a major employer in the area, and is a major contributor to the local economy.
Demographics
As of the 2010 census, the population of Towson was 45,619. The racial makeup of the town was 79.3% White, 11.2% African American, 4.2% Asian, and 4.3% Hispanic or Latino. The median household income was $76,824, and the median family income was $95,817.
Towson is a diverse community, with a variety of religious and cultural backgrounds. The town is home to a number of churches, synagogues, and mosques, as well as a variety of cultural organizations. The town is also home to a number of festivals and events, including the Towson Arts Festival, the Towson Fourth of July Parade, and the Towson Arts & Crafts Fair.
Common Questions
What is Per Capita Income in Towson?
Per Capita income in Towson is $57,897.
What is the Median Family Income in Towson?
Median Family Income in Towson is $150,639.
What is the Median Household income in Towson?
Median Household Income in Towson is $98,425.
What is Income or Wage Gap in Towson?
Income or Wage Gap in Towson is 45.8%.
Women in Towson earn 54.2 cents for every dollar earned by a man.
What is Family Income Deficit in Towson?
Family Income Deficit in Towson is $13,571.
Families that are below poverty line in Towson earn $13,571 less on average than the poverty threshold level.
What is Inequality or Gini Index in Towson?
Inequality or Gini Index in Towson is 0.50.
What is the Total Population of Towson?
Total Population of Towson is 57,617.
What is the Total Male Population of Towson?
Total Male Population of Towson is 26,596.
What is the Total Female Population of Towson?
Total Female Population of Towson is 31,021.
What is the Ratio of Males per 100 Females in Towson?
There are 85.74 Males per 100 Females in Towson.
What is the Ratio of Females per 100 Males in Towson?
There are 116.64 Females per 100 Males in Towson.
What is the Median Population Age in Towson?
Median Population Age in Towson is 33.9 Years.
What is the Average Family Size in Towson
Average Family Size in Towson is 3.0 People.
What is the Average Household Size in Towson
Average Household Size in Towson is 2.2 People.
How Large is the Labor Force in Towson?
There are 30,161 People in the Labor Forcein in Towson.
What is the Percentage of People in the Labor Force in Towson?
61.9% of People are in the Labor Force in Towson.
What is the Unemployment Rate in Towson?
Unemployment Rate in Towson is 4.6%.