Willow Street, PA Map & Demographics
Willow Street Map
Willow Street Overview
$53,525
PER CAPITA INCOME
$107,696
AVG FAMILY INCOME
$100,727
AVG HOUSEHOLD INCOME
48.8%
WAGE / INCOME GAP [ % ]
51.2¢/ $1
WAGE / INCOME GAP [ $ ]
$13,290
FAMILY INCOME DEFICIT
0.43
INEQUALITY / GINI INDEX
9,640
TOTAL POPULATION
4,485
MALE POPULATION
5,155
FEMALE POPULATION
87.00
MALES / 100 FEMALES
114.94
FEMALES / 100 MALES
52.8
MEDIAN AGE
2.8
AVG FAMILY SIZE
2.2
AVG HOUSEHOLD SIZE
4,227
LABOR FORCE [ PEOPLE ]
49.1%
PERCENT IN LABOR FORCE
1.9%
UNEMPLOYMENT RATE
Willow Street Zip Codes
Willow Street Area Codes
Income in Willow Street
Income Overview in Willow Street
Per Capita Income in Willow Street is $53,525, while median incomes of families and households are $107,696 and $100,727 respectively.
| Characteristic | Number | Measure |
| Per Capita Income | 9,640 | $53,525 |
| Median Family Income | 2,700 | $107,696 |
| Mean Family Income | 2,700 | $134,561 |
| Median Household Income | 4,175 | $100,727 |
| Mean Household Income | 4,175 | $122,738 |
| Income Deficit | 2,700 | $13,290 |
| Wage / Income Gap (%) | 9,640 | 48.85% |
| Wage / Income Gap ($) | 9,640 | 51.15¢ per $1 |
| Gini / Inequality Index | 9,640 | 0.43 |
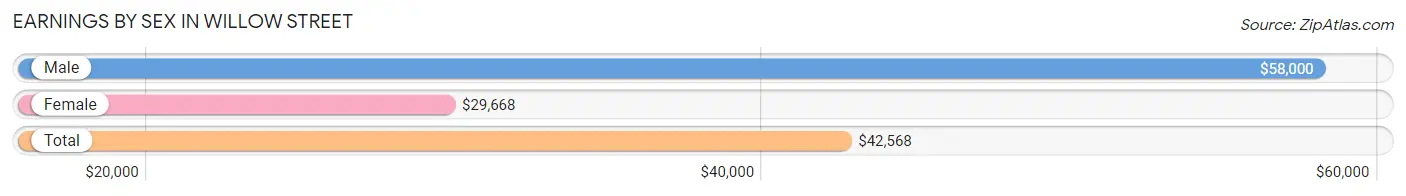
Earnings by Sex in Willow Street
Average Earnings in Willow Street are $42,568, $58,000 for men and $29,668 for women, a difference of 48.8%.
| Sex | Number | Average Earnings |
| Male | 2,310 (52.1%) | $58,000 |
| Female | 2,122 (47.9%) | $29,668 |
| Total | 4,432 (100.0%) | $42,568 |
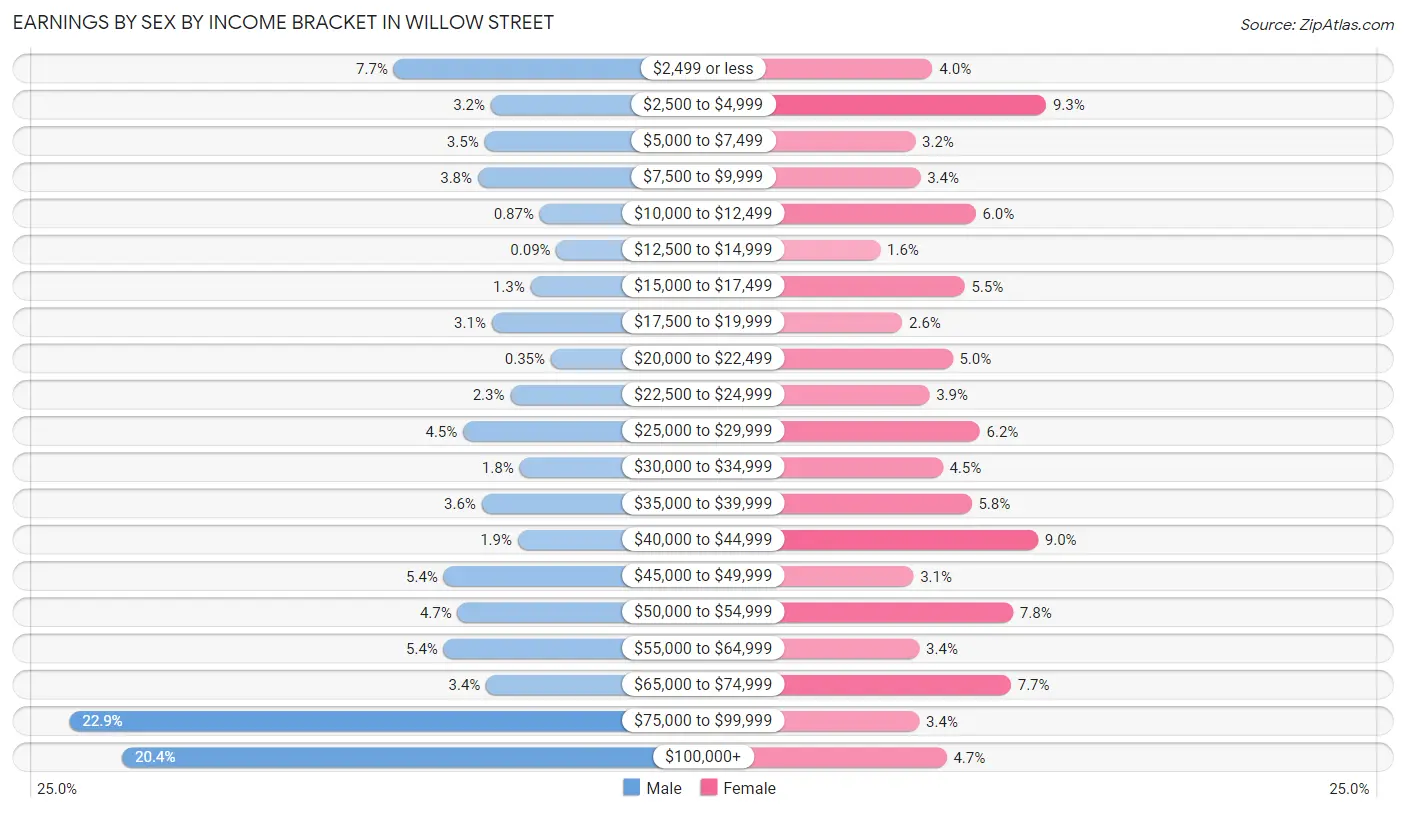
Earnings by Sex by Income Bracket in Willow Street
The most common earnings brackets in Willow Street are $75,000 to $99,999 for men (529 | 22.9%) and $2,500 to $4,999 for women (198 | 9.3%).
| Income | Male | Female |
| $2,499 or less | 178 (7.7%) | 85 (4.0%) |
| $2,500 to $4,999 | 73 (3.2%) | 198 (9.3%) |
| $5,000 to $7,499 | 80 (3.5%) | 68 (3.2%) |
| $7,500 to $9,999 | 87 (3.8%) | 73 (3.4%) |
| $10,000 to $12,499 | 20 (0.9%) | 128 (6.0%) |
| $12,500 to $14,999 | 2 (0.1%) | 33 (1.6%) |
| $15,000 to $17,499 | 30 (1.3%) | 117 (5.5%) |
| $17,500 to $19,999 | 72 (3.1%) | 55 (2.6%) |
| $20,000 to $22,499 | 8 (0.4%) | 105 (5.0%) |
| $22,500 to $24,999 | 52 (2.2%) | 82 (3.9%) |
| $25,000 to $29,999 | 103 (4.5%) | 132 (6.2%) |
| $30,000 to $34,999 | 42 (1.8%) | 95 (4.5%) |
| $35,000 to $39,999 | 83 (3.6%) | 124 (5.8%) |
| $40,000 to $44,999 | 44 (1.9%) | 190 (8.9%) |
| $45,000 to $49,999 | 124 (5.4%) | 66 (3.1%) |
| $50,000 to $54,999 | 109 (4.7%) | 165 (7.8%) |
| $55,000 to $64,999 | 124 (5.4%) | 72 (3.4%) |
| $65,000 to $74,999 | 78 (3.4%) | 163 (7.7%) |
| $75,000 to $99,999 | 529 (22.9%) | 72 (3.4%) |
| $100,000+ | 472 (20.4%) | 99 (4.7%) |
| Total | 2,310 (100.0%) | 2,122 (100.0%) |
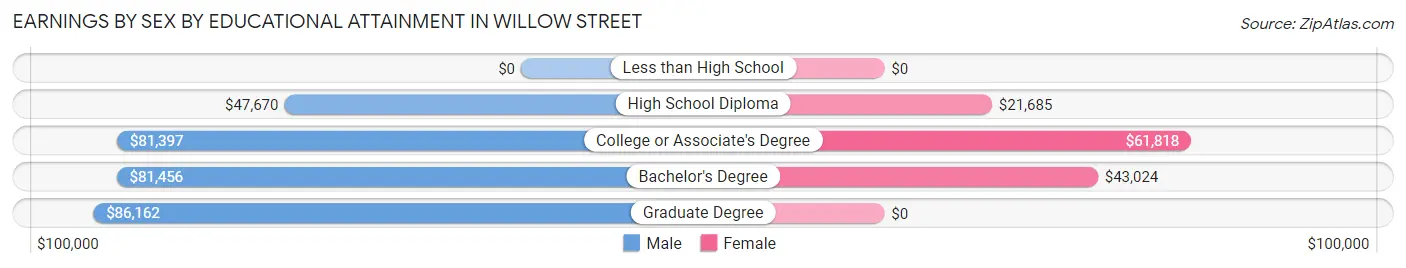
Earnings by Sex by Educational Attainment in Willow Street
Average earnings in Willow Street are $79,044 for men and $32,279 for women, a difference of 59.2%. Men with an educational attainment of graduate degree enjoy the highest average annual earnings of $86,162, while those with high school diploma education earn the least with $47,670. Women with an educational attainment of college or associate's degree earn the most with the average annual earnings of $61,818, while those with high school diploma education have the smallest earnings of $21,685.
| Educational Attainment | Male Income | Female Income |
| Less than High School | - | - |
| High School Diploma | $47,670 | $21,685 |
| College or Associate's Degree | $81,397 | $61,818 |
| Bachelor's Degree | $81,456 | $43,024 |
| Graduate Degree | $86,162 | $0 |
| Total | $79,044 | $32,279 |
Family Income in Willow Street
Family Income Brackets in Willow Street
According to the Willow Street family income data, there are 1,023 families falling into the $100,000 to $149,999 income range, which is the most common income bracket and makes up 37.9% of all families.
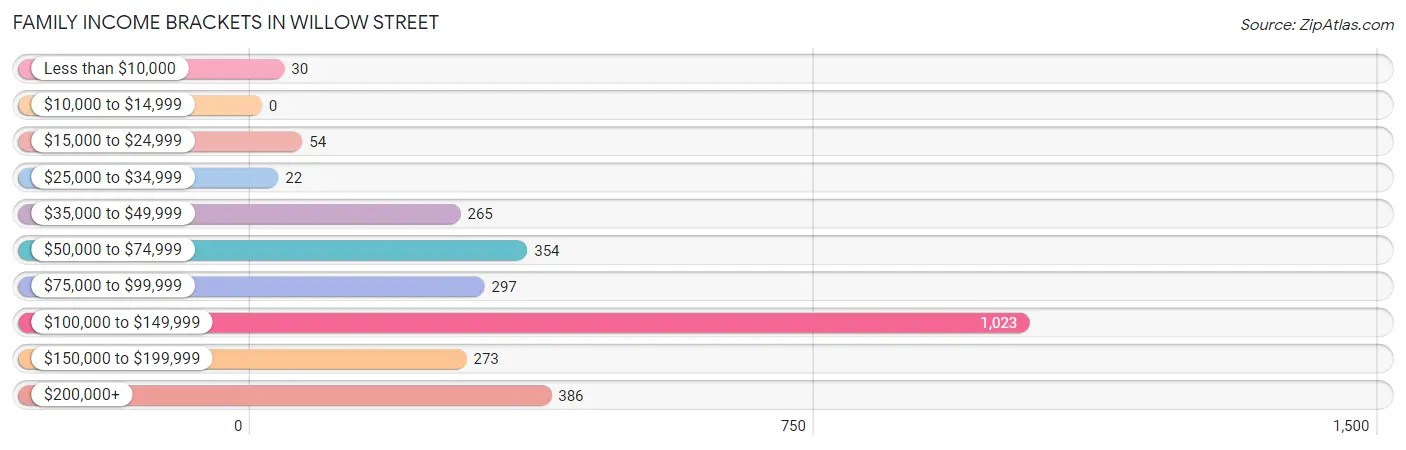
| Income Bracket | # Families | % Families |
| Less than $10,000 | 30 | 1.1% |
| $10,000 to $14,999 | 0 | 0.0% |
| $15,000 to $24,999 | 54 | 2.0% |
| $25,000 to $34,999 | 22 | 0.8% |
| $35,000 to $49,999 | 265 | 9.8% |
| $50,000 to $74,999 | 354 | 13.1% |
| $75,000 to $99,999 | 297 | 11.0% |
| $100,000 to $149,999 | 1,023 | 37.9% |
| $150,000 to $199,999 | 273 | 10.1% |
| $200,000+ | 386 | 14.3% |
Family Income by Famaliy Size in Willow Street
2-person families (1,666 | 61.7%) account for the highest median family income in Willow Street with $111,667 per family, while 2-person families (1,666 | 61.7%) have the highest median income of $55,834 per family member.
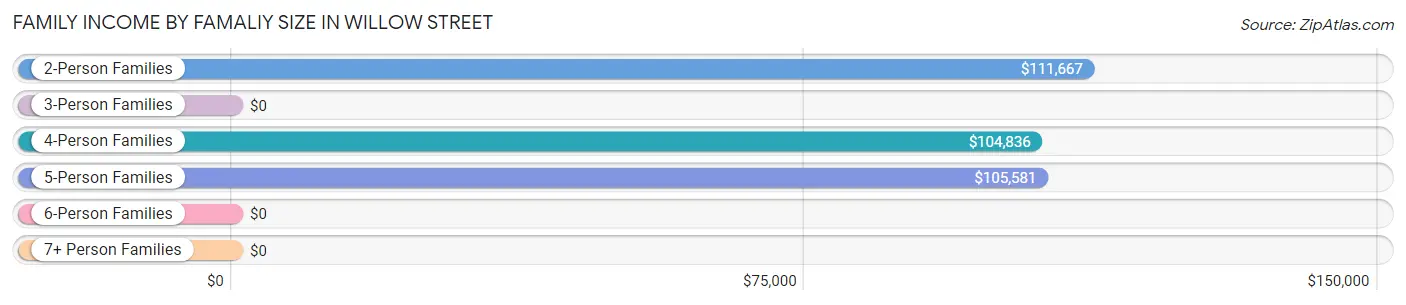
| Income Bracket | # Families | Median Income |
| 2-Person Families | 1,666 (61.7%) | $111,667 |
| 3-Person Families | 267 (9.9%) | $0 |
| 4-Person Families | 584 (21.6%) | $104,836 |
| 5-Person Families | 158 (5.9%) | $105,581 |
| 6-Person Families | 0 (0.0%) | $0 |
| 7+ Person Families | 25 (0.9%) | $0 |
| Total | 2,700 (100.0%) | $107,696 |
Family Income by Number of Earners in Willow Street
The median family income in Willow Street is $107,696, with families comprising 3+ earners (298) having the highest median family income of $134,559, while families with no earners (770) have the lowest median family income of $101,290, accounting for 11.0% and 28.5% of families, respectively.
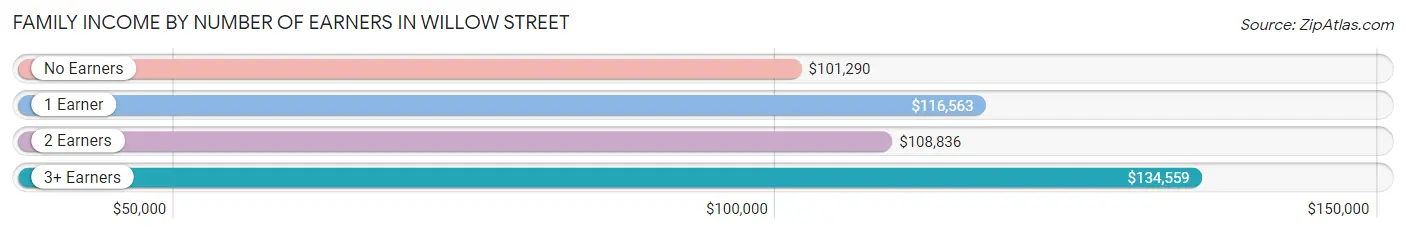
| Number of Earners | # Families | Median Income |
| No Earners | 770 (28.5%) | $101,290 |
| 1 Earner | 535 (19.8%) | $116,563 |
| 2 Earners | 1,097 (40.6%) | $108,836 |
| 3+ Earners | 298 (11.0%) | $134,559 |
| Total | 2,700 (100.0%) | $107,696 |
Household Income in Willow Street
Household Income Brackets in Willow Street
With 1,261 households falling in the category, the $100,000 to $149,999 income range is the most frequent in Willow Street, accounting for 30.2% of all households. In contrast, only 42 households (1.0%) fall into the $10,000 to $14,999 income bracket, making it the least populous group.
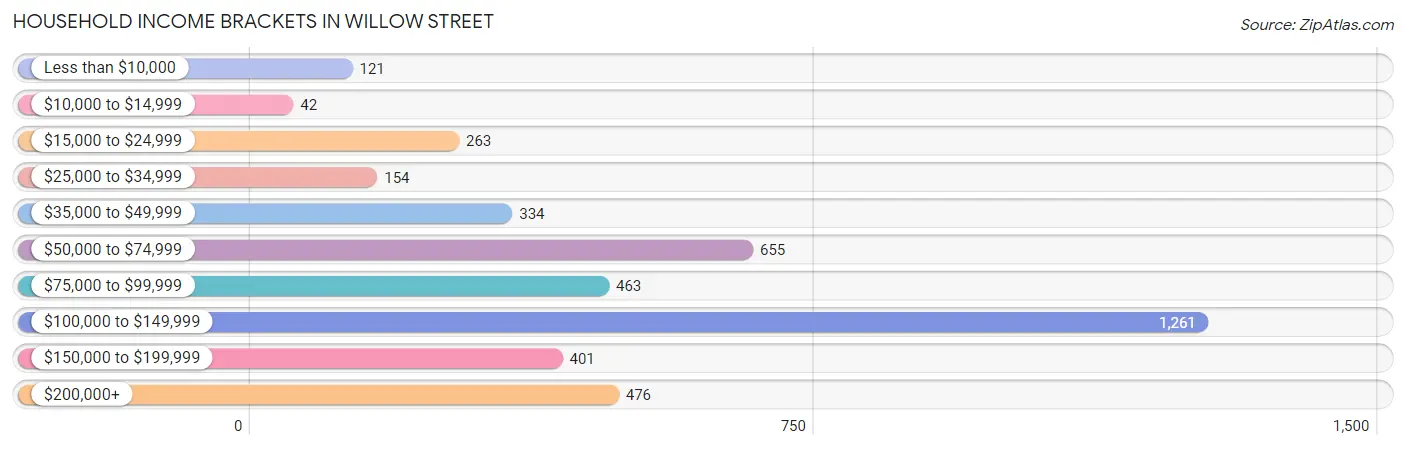
| Income Bracket | # Households | % Households |
| Less than $10,000 | 121 | 2.9% |
| $10,000 to $14,999 | 42 | 1.0% |
| $15,000 to $24,999 | 263 | 6.3% |
| $25,000 to $34,999 | 154 | 3.7% |
| $35,000 to $49,999 | 334 | 8.0% |
| $50,000 to $74,999 | 655 | 15.7% |
| $75,000 to $99,999 | 463 | 11.1% |
| $100,000 to $149,999 | 1,261 | 30.2% |
| $150,000 to $199,999 | 401 | 9.6% |
| $200,000+ | 476 | 11.4% |
Household Income by Householder Age in Willow Street
The median household income in Willow Street is $100,727, with the highest median household income of $111,307 found in the 25 to 44 years age bracket for the primary householder. A total of 839 households (20.1%) fall into this category. Meanwhile, the 15 to 24 years age bracket for the primary householder has the lowest median household income of $0, with 114 households (2.7%) in this group.
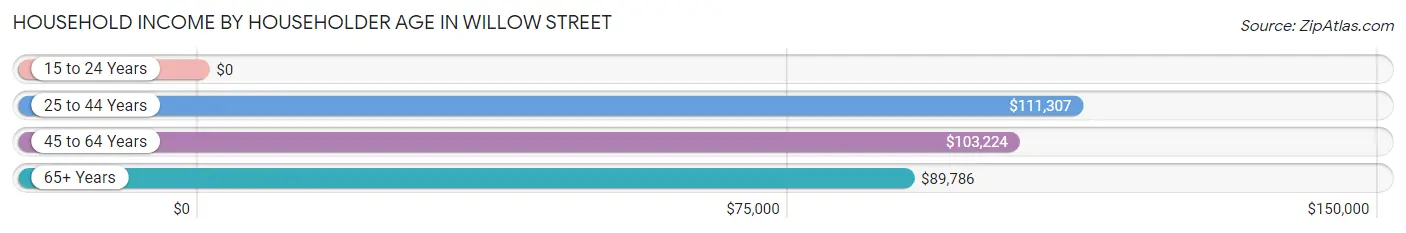
| Income Bracket | # Households | Median Income |
| 15 to 24 Years | 114 (2.7%) | $0 |
| 25 to 44 Years | 839 (20.1%) | $111,307 |
| 45 to 64 Years | 1,020 (24.4%) | $103,224 |
| 65+ Years | 2,202 (52.7%) | $89,786 |
| Total | 4,175 (100.0%) | $100,727 |
Poverty in Willow Street
Income Below Poverty by Sex and Age in Willow Street
With 2.9% poverty level for males and 4.1% for females among the residents of Willow Street, 18 to 24 year old males and 35 to 44 year old females are the most vulnerable to poverty, with 47 males (14.0%) and 42 females (9.7%) in their respective age groups living below the poverty level.
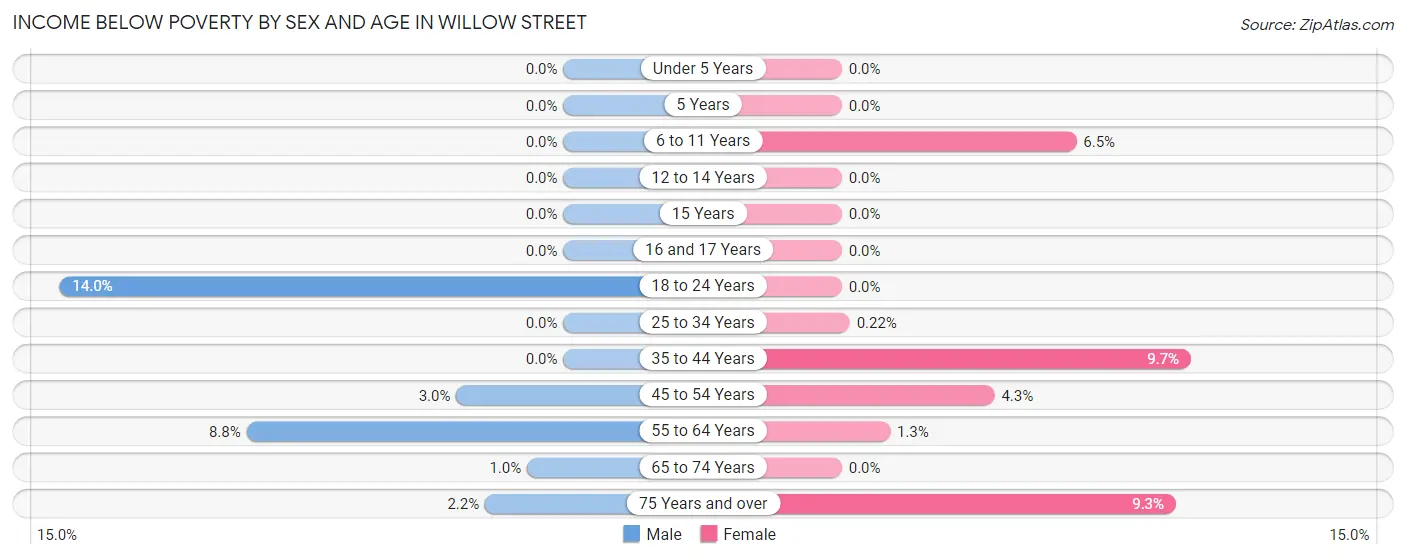
| Age Bracket | Male | Female |
| Under 5 Years | 0 (0.0%) | 0 (0.0%) |
| 5 Years | 0 (0.0%) | 0 (0.0%) |
| 6 to 11 Years | 0 (0.0%) | 13 (6.5%) |
| 12 to 14 Years | 0 (0.0%) | 0 (0.0%) |
| 15 Years | 0 (0.0%) | 0 (0.0%) |
| 16 and 17 Years | 0 (0.0%) | 0 (0.0%) |
| 18 to 24 Years | 47 (14.0%) | 0 (0.0%) |
| 25 to 34 Years | 0 (0.0%) | 1 (0.2%) |
| 35 to 44 Years | 0 (0.0%) | 42 (9.7%) |
| 45 to 54 Years | 12 (3.0%) | 23 (4.3%) |
| 55 to 64 Years | 38 (8.8%) | 7 (1.3%) |
| 65 to 74 Years | 6 (1.0%) | 0 (0.0%) |
| 75 Years and over | 22 (2.2%) | 115 (9.3%) |
| Total | 125 (2.9%) | 201 (4.1%) |
Income Above Poverty by Sex and Age in Willow Street
According to the poverty statistics in Willow Street, males aged under 5 years and females aged under 5 years are the age groups that are most secure financially, with 100.0% of males and 100.0% of females in these age groups living above the poverty line.
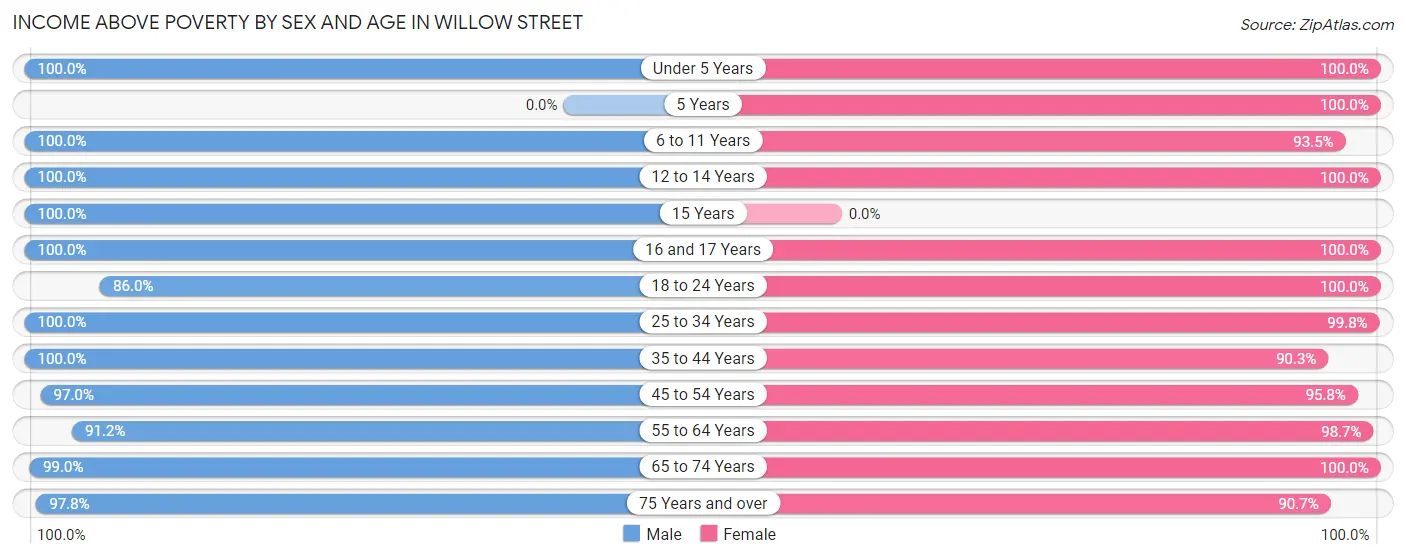
| Age Bracket | Male | Female |
| Under 5 Years | 113 (100.0%) | 188 (100.0%) |
| 5 Years | 0 (0.0%) | 14 (100.0%) |
| 6 to 11 Years | 72 (100.0%) | 186 (93.5%) |
| 12 to 14 Years | 237 (100.0%) | 89 (100.0%) |
| 15 Years | 119 (100.0%) | 0 (0.0%) |
| 16 and 17 Years | 203 (100.0%) | 332 (100.0%) |
| 18 to 24 Years | 288 (86.0%) | 391 (100.0%) |
| 25 to 34 Years | 440 (100.0%) | 464 (99.8%) |
| 35 to 44 Years | 423 (100.0%) | 390 (90.3%) |
| 45 to 54 Years | 391 (97.0%) | 518 (95.8%) |
| 55 to 64 Years | 393 (91.2%) | 514 (98.7%) |
| 65 to 74 Years | 591 (99.0%) | 540 (100.0%) |
| 75 Years and over | 989 (97.8%) | 1,121 (90.7%) |
| Total | 4,259 (97.2%) | 4,747 (95.9%) |
Income Below Poverty Among Married-Couple Families in Willow Street
The poverty statistics for married-couple families in Willow Street show that 1.7% or 41 of the total 2,383 families live below the poverty line. Families with no children have the highest poverty rate of 1.8%, comprising of 29 families. On the other hand, families with 3 or 4 children have the lowest poverty rate of 0.0%, which includes 0 families.
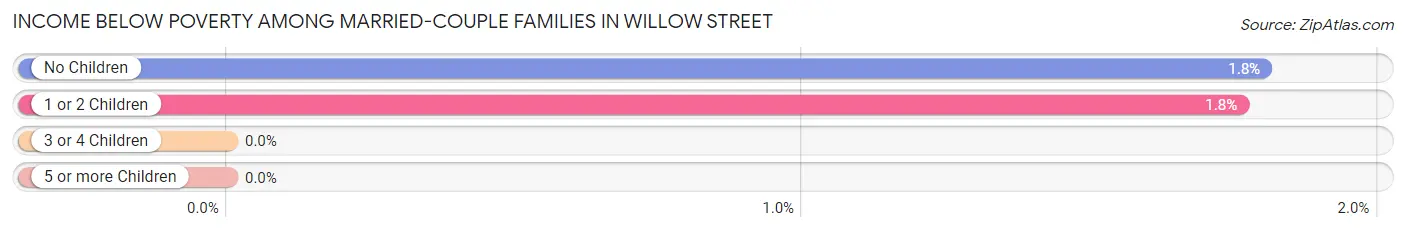
| Children | Above Poverty | Below Poverty |
| No Children | 1,584 (98.2%) | 29 (1.8%) |
| 1 or 2 Children | 671 (98.2%) | 12 (1.8%) |
| 3 or 4 Children | 87 (100.0%) | 0 (0.0%) |
| 5 or more Children | 0 (0.0%) | 0 (0.0%) |
| Total | 2,342 (98.3%) | 41 (1.7%) |
Income Below Poverty Among Single-Parent Households in Willow Street
| Children | Single Father | Single Mother |
| No Children | 0 (0.0%) | 0 (0.0%) |
| 1 or 2 Children | 0 (0.0%) | 0 (0.0%) |
| 3 or 4 Children | 0 (0.0%) | 0 (0.0%) |
| 5 or more Children | 0 (0.0%) | 0 (0.0%) |
| Total | 0 (0.0%) | 0 (0.0%) |
Income Below Poverty Among Married-Couple vs Single-Parent Households in Willow Street
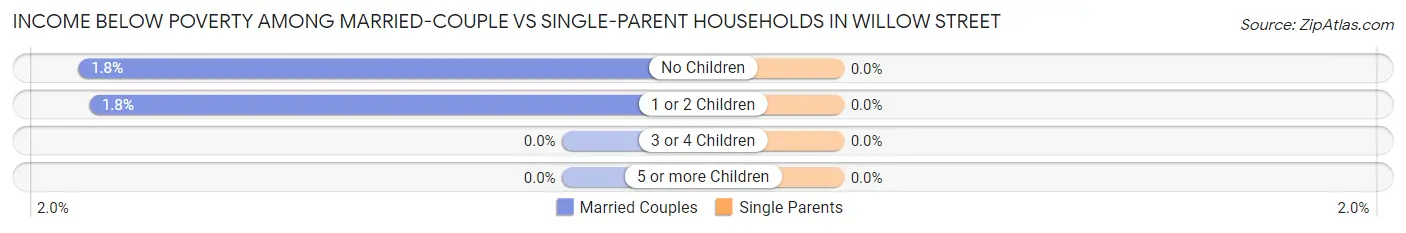
| Children | Married-Couple Families | Single-Parent Households |
| No Children | 29 (1.8%) | 0 (0.0%) |
| 1 or 2 Children | 12 (1.8%) | 0 (0.0%) |
| 3 or 4 Children | 0 (0.0%) | 0 (0.0%) |
| 5 or more Children | 0 (0.0%) | 0 (0.0%) |
| Total | 41 (1.7%) | 0 (0.0%) |
Race in Willow Street
The most populous races in Willow Street are White / Caucasian (8,162 | 84.7%), Hispanic or Latino (659 | 6.8%), and Two or more Races (450 | 4.7%).
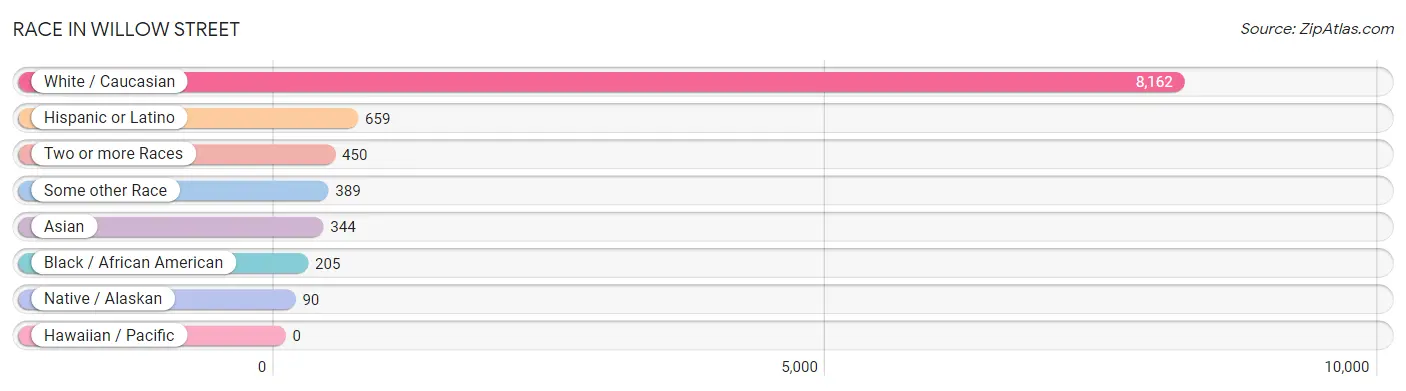
| Race | # Population | % Population |
| Asian | 344 | 3.6% |
| Black / African American | 205 | 2.1% |
| Hawaiian / Pacific | 0 | 0.0% |
| Hispanic or Latino | 659 | 6.8% |
| Native / Alaskan | 90 | 0.9% |
| White / Caucasian | 8,162 | 84.7% |
| Two or more Races | 450 | 4.7% |
| Some other Race | 389 | 4.0% |
| Total | 9,640 | 100.0% |
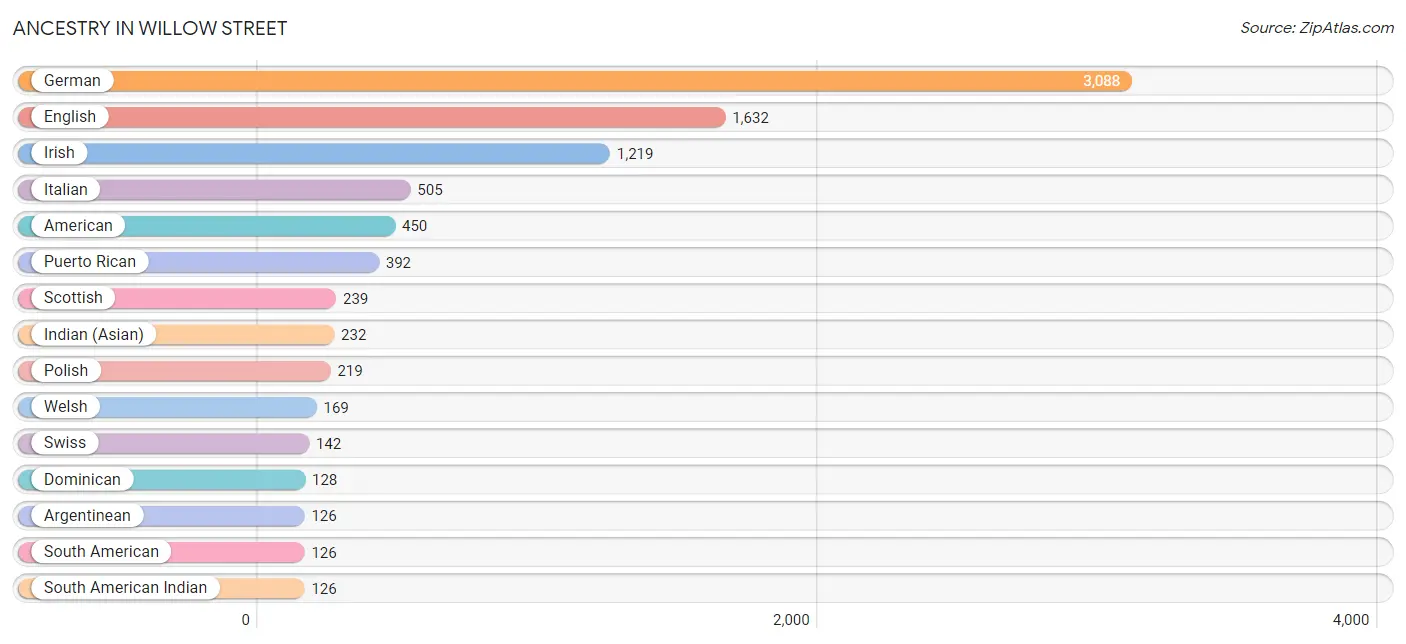
Ancestry in Willow Street
The most populous ancestries reported in Willow Street are German (3,088 | 32.0%), English (1,632 | 16.9%), Irish (1,219 | 12.7%), Italian (505 | 5.2%), and American (450 | 4.7%), together accounting for 71.5% of all Willow Street residents.
| Ancestry | # Population | % Population |
| American | 450 | 4.7% |
| Argentinean | 126 | 1.3% |
| Austrian | 32 | 0.3% |
| British | 111 | 1.1% |
| Burmese | 20 | 0.2% |
| Cherokee | 28 | 0.3% |
| Czech | 6 | 0.1% |
| Danish | 29 | 0.3% |
| Dominican | 128 | 1.3% |
| Dutch | 23 | 0.2% |
| English | 1,632 | 16.9% |
| Estonian | 50 | 0.5% |
| European | 104 | 1.1% |
| Finnish | 12 | 0.1% |
| French | 61 | 0.6% |
| French Canadian | 17 | 0.2% |
| German | 3,088 | 32.0% |
| Greek | 24 | 0.3% |
| Hungarian | 43 | 0.4% |
| Indian (Asian) | 232 | 2.4% |
| Irish | 1,219 | 12.7% |
| Italian | 505 | 5.2% |
| Kenyan | 19 | 0.2% |
| Lithuanian | 10 | 0.1% |
| Mexican | 5 | 0.1% |
| Navajo | 24 | 0.3% |
| Norwegian | 123 | 1.3% |
| Pennsylvania German | 14 | 0.2% |
| Polish | 219 | 2.3% |
| Puerto Rican | 392 | 4.1% |
| Russian | 46 | 0.5% |
| Scandinavian | 16 | 0.2% |
| Scotch-Irish | 63 | 0.6% |
| Scottish | 239 | 2.5% |
| Slovak | 25 | 0.3% |
| South African | 19 | 0.2% |
| South American | 126 | 1.3% |
| South American Indian | 126 | 1.3% |
| Spanish | 8 | 0.1% |
| Subsaharan African | 38 | 0.4% |
| Swedish | 105 | 1.1% |
| Swiss | 142 | 1.5% |
| Thai | 112 | 1.2% |
| Tongan | 24 | 0.3% |
| Ukrainian | 79 | 0.8% |
| Welsh | 169 | 1.8% | View All 46 Rows |
Immigrants in Willow Street
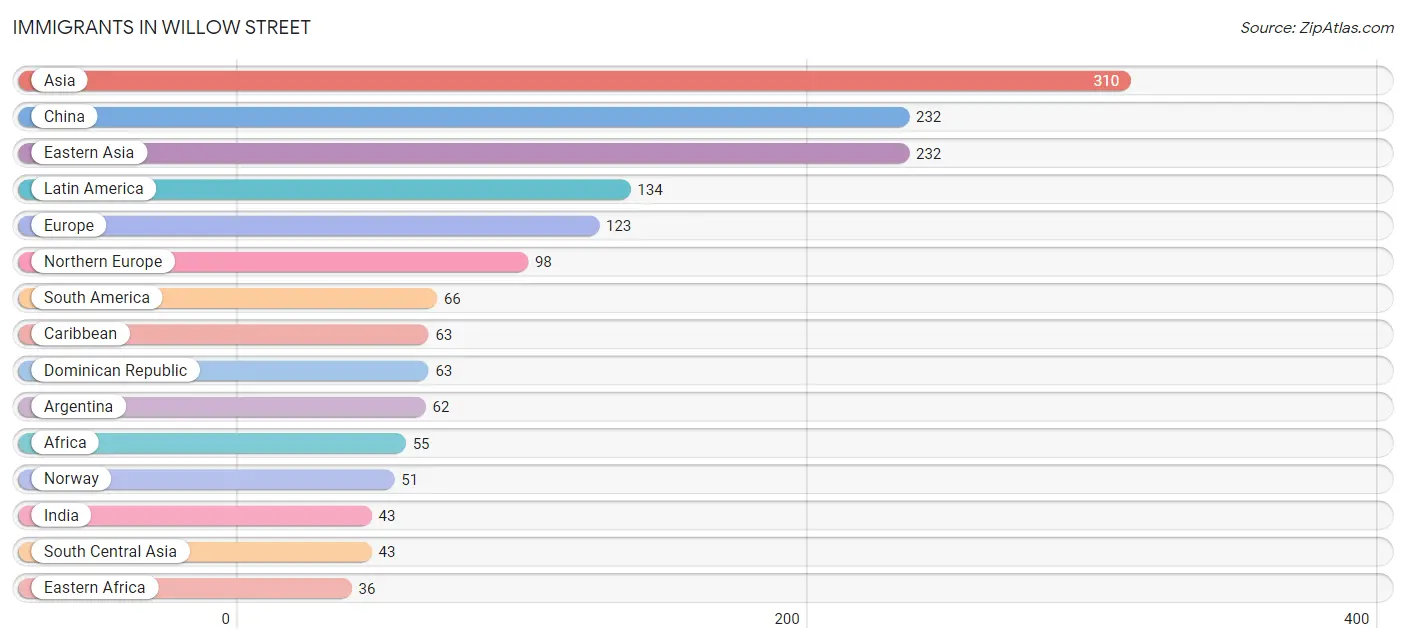
The most numerous immigrant groups reported in Willow Street came from Asia (310 | 3.2%), China (232 | 2.4%), Eastern Asia (232 | 2.4%), Latin America (134 | 1.4%), and Europe (123 | 1.3%), together accounting for 10.7% of all Willow Street residents.
| Immigration Origin | # Population | % Population |
| Africa | 55 | 0.6% |
| Argentina | 62 | 0.6% |
| Asia | 310 | 3.2% |
| Brazil | 4 | 0.0% |
| Cambodia | 35 | 0.4% |
| Canada | 13 | 0.1% |
| Caribbean | 63 | 0.6% |
| Central America | 5 | 0.1% |
| China | 232 | 2.4% |
| Dominican Republic | 63 | 0.6% |
| Eastern Africa | 36 | 0.4% |
| Eastern Asia | 232 | 2.4% |
| England | 27 | 0.3% |
| Europe | 123 | 1.3% |
| Germany | 8 | 0.1% |
| India | 43 | 0.4% |
| Italy | 9 | 0.1% |
| Kenya | 36 | 0.4% |
| Latin America | 134 | 1.4% |
| Mexico | 5 | 0.1% |
| Northern Europe | 98 | 1.0% |
| Norway | 51 | 0.5% |
| Scotland | 7 | 0.1% |
| South Africa | 19 | 0.2% |
| South America | 66 | 0.7% |
| South Central Asia | 43 | 0.4% |
| South Eastern Asia | 35 | 0.4% |
| Southern Europe | 9 | 0.1% |
| Switzerland | 8 | 0.1% |
| Western Europe | 16 | 0.2% | View All 30 Rows |
Sex and Age in Willow Street
Sex and Age in Willow Street
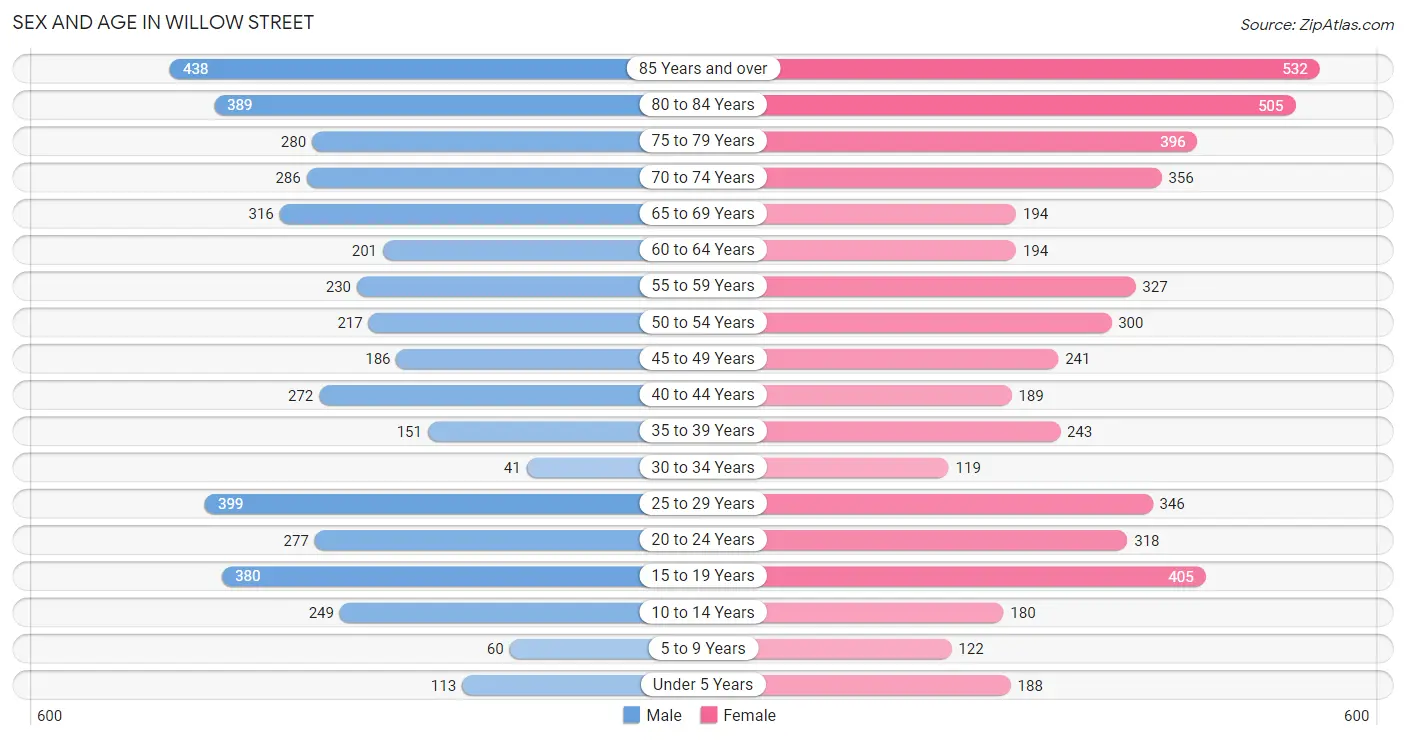
The most populous age groups in Willow Street are 85 Years and over (438 | 9.8%) for men and 85 Years and over (532 | 10.3%) for women.
| Age Bracket | Male | Female |
| Under 5 Years | 113 (2.5%) | 188 (3.6%) |
| 5 to 9 Years | 60 (1.3%) | 122 (2.4%) |
| 10 to 14 Years | 249 (5.6%) | 180 (3.5%) |
| 15 to 19 Years | 380 (8.5%) | 405 (7.9%) |
| 20 to 24 Years | 277 (6.2%) | 318 (6.2%) |
| 25 to 29 Years | 399 (8.9%) | 346 (6.7%) |
| 30 to 34 Years | 41 (0.9%) | 119 (2.3%) |
| 35 to 39 Years | 151 (3.4%) | 243 (4.7%) |
| 40 to 44 Years | 272 (6.1%) | 189 (3.7%) |
| 45 to 49 Years | 186 (4.2%) | 241 (4.7%) |
| 50 to 54 Years | 217 (4.8%) | 300 (5.8%) |
| 55 to 59 Years | 230 (5.1%) | 327 (6.3%) |
| 60 to 64 Years | 201 (4.5%) | 194 (3.8%) |
| 65 to 69 Years | 316 (7.0%) | 194 (3.8%) |
| 70 to 74 Years | 286 (6.4%) | 356 (6.9%) |
| 75 to 79 Years | 280 (6.2%) | 396 (7.7%) |
| 80 to 84 Years | 389 (8.7%) | 505 (9.8%) |
| 85 Years and over | 438 (9.8%) | 532 (10.3%) |
| Total | 4,485 (100.0%) | 5,155 (100.0%) |
Families and Households in Willow Street
Median Family Size in Willow Street
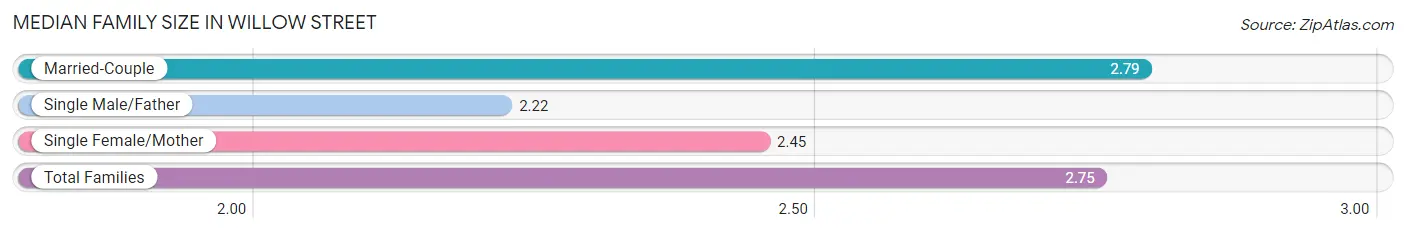
The median family size in Willow Street is 2.75 persons per family, with married-couple families (2,383 | 88.3%) accounting for the largest median family size of 2.79 persons per family. On the other hand, single male/father families (86 | 3.2%) represent the smallest median family size with 2.22 persons per family.
| Family Type | # Families | Family Size |
| Married-Couple | 2,383 (88.3%) | 2.79 |
| Single Male/Father | 86 (3.2%) | 2.22 |
| Single Female/Mother | 231 (8.6%) | 2.45 |
| Total Families | 2,700 (100.0%) | 2.75 |
Median Household Size in Willow Street
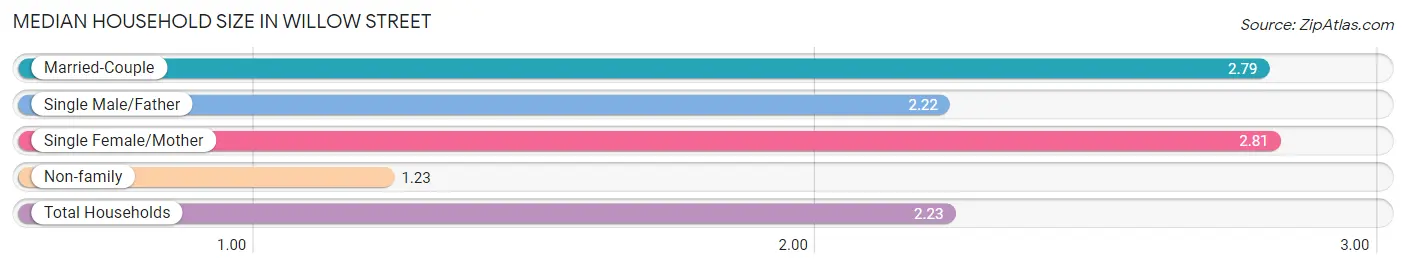
The median household size in Willow Street is 2.23 persons per household, with single female/mother households (231 | 5.5%) accounting for the largest median household size of 2.81 persons per household. non-family households (1,475 | 35.3%) represent the smallest median household size with 1.23 persons per household.
| Household Type | # Households | Household Size |
| Married-Couple | 2,383 (57.1%) | 2.79 |
| Single Male/Father | 86 (2.1%) | 2.22 |
| Single Female/Mother | 231 (5.5%) | 2.81 |
| Non-family | 1,475 (35.3%) | 1.23 |
| Total Households | 4,175 (100.0%) | 2.23 |
Household Size by Marriage Status in Willow Street
Out of a total of 4,175 households in Willow Street, 2,700 (64.7%) are family households, while 1,475 (35.3%) are nonfamily households. The most numerous type of family households are 2-person households, comprising 1,604, and the most common type of nonfamily households are 1-person households, comprising 1,150.
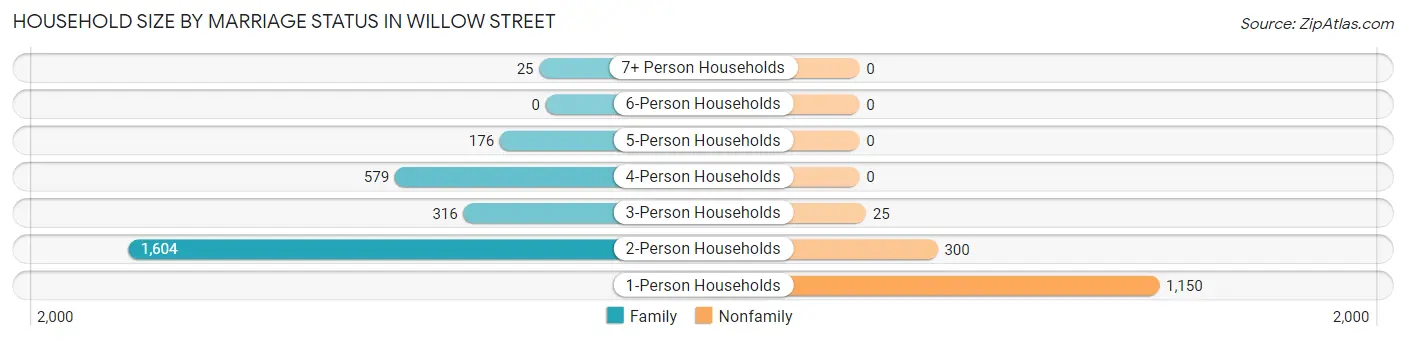
| Household Size | Family Households | Nonfamily Households |
| 1-Person Households | - | 1,150 (27.5%) |
| 2-Person Households | 1,604 (38.4%) | 300 (7.2%) |
| 3-Person Households | 316 (7.6%) | 25 (0.6%) |
| 4-Person Households | 579 (13.9%) | 0 (0.0%) |
| 5-Person Households | 176 (4.2%) | 0 (0.0%) |
| 6-Person Households | 0 (0.0%) | 0 (0.0%) |
| 7+ Person Households | 25 (0.6%) | 0 (0.0%) |
| Total | 2,700 (64.7%) | 1,475 (35.3%) |
Female Fertility in Willow Street
Fertility by Age in Willow Street
Average fertility rate in Willow Street is 34.0 births per 1,000 women. Women in the age bracket of 20 to 34 years have the highest fertility rate with 84.0 births per 1,000 women. Women in the age bracket of 20 to 34 years acount for 100.0% of all women with births.
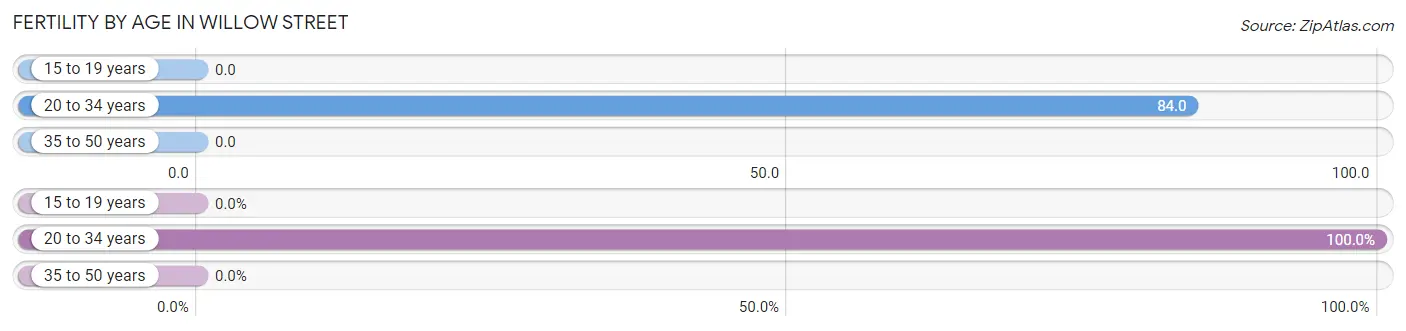
| Age Bracket | Women with Births | Births / 1,000 Women |
| 15 to 19 years | 0 (0.0%) | 0.0 |
| 20 to 34 years | 66 (100.0%) | 84.0 |
| 35 to 50 years | 0 (0.0%) | 0.0 |
| Total | 66 (100.0%) | 34.0 |
Fertility by Age by Marriage Status in Willow Street
98.5% of women with births (66) in Willow Street are married. The highest percentage of unmarried women with births falls into 20 to 34 years age bracket with 1.5% of them unmarried at the time of birth, while the lowest percentage of unmarried women with births belong to 20 to 34 years age bracket with 1.5% of them unmarried.
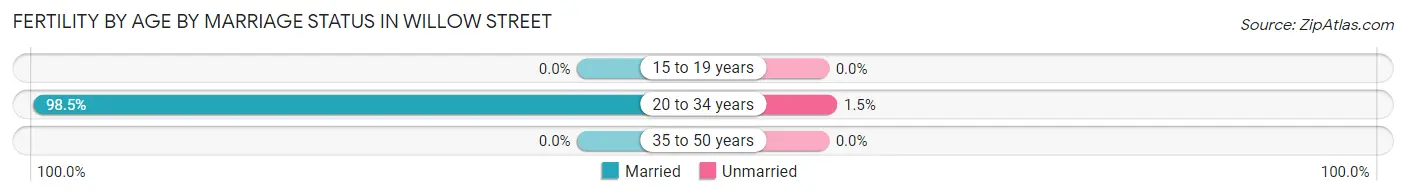
| Age Bracket | Married | Unmarried |
| 15 to 19 years | 0 (0.0%) | 0 (0.0%) |
| 20 to 34 years | 65 (98.5%) | 1 (1.5%) |
| 35 to 50 years | 0 (0.0%) | 0 (0.0%) |
| Total | 65 (98.5%) | 1 (1.5%) |
Fertility by Education in Willow Street
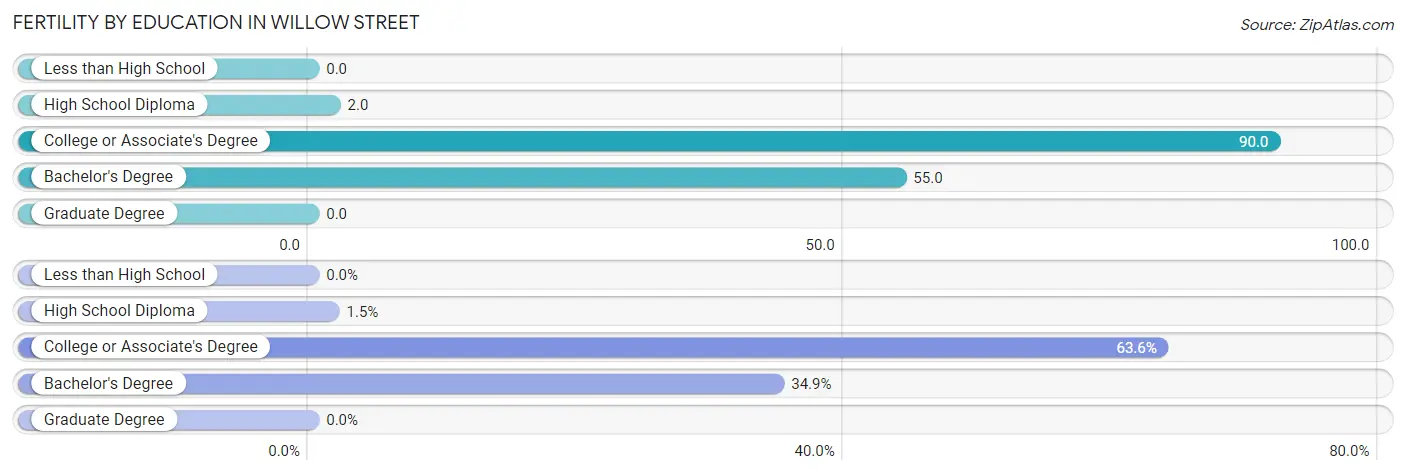
| Educational Attainment | Women with Births | Births / 1,000 Women |
| Less than High School | 0 (0.0%) | 0.0 |
| High School Diploma | 1 (1.5%) | 2.0 |
| College or Associate's Degree | 42 (63.6%) | 90.0 |
| Bachelor's Degree | 23 (34.8%) | 55.0 |
| Graduate Degree | 0 (0.0%) | 0.0 |
| Total | 66 (100.0%) | 34.0 |
Fertility by Education by Marriage Status in Willow Street
1.5% of women with births in Willow Street are unmarried. Women with the educational attainment of college or associate's degree are most likely to be married with 100.0% of them married at childbirth, while women with the educational attainment of high school diploma are least likely to be married with 100.0% of them unmarried at childbirth.
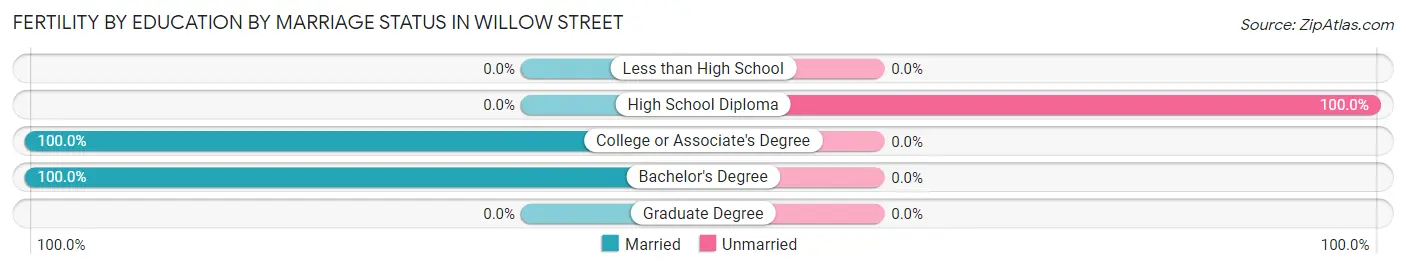
| Educational Attainment | Married | Unmarried |
| Less than High School | 0 (0.0%) | 0 (0.0%) |
| High School Diploma | 0 (0.0%) | 1 (100.0%) |
| College or Associate's Degree | 42 (100.0%) | 0 (0.0%) |
| Bachelor's Degree | 23 (100.0%) | 0 (0.0%) |
| Graduate Degree | 0 (0.0%) | 0 (0.0%) |
| Total | 65 (98.5%) | 1 (1.5%) |
Employment Characteristics in Willow Street
Employment by Class of Employer in Willow Street
Among the 4,139 employed individuals in Willow Street, private company employees (2,909 | 70.3%), not-for-profit organizations (595 | 14.4%), and self-employed (not incorporated) (310 | 7.5%) make up the most common classes of employment.
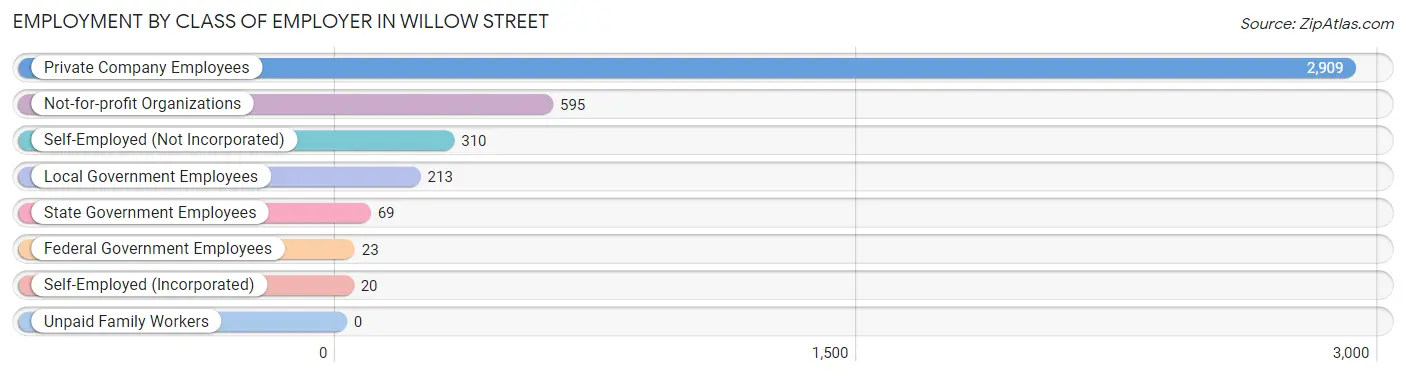
| Employer Class | # Employees | % Employees |
| Private Company Employees | 2,909 | 70.3% |
| Self-Employed (Incorporated) | 20 | 0.5% |
| Self-Employed (Not Incorporated) | 310 | 7.5% |
| Not-for-profit Organizations | 595 | 14.4% |
| Local Government Employees | 213 | 5.1% |
| State Government Employees | 69 | 1.7% |
| Federal Government Employees | 23 | 0.6% |
| Unpaid Family Workers | 0 | 0.0% |
| Total | 4,139 | 100.0% |
Employment Status by Age in Willow Street
According to the labor force statistics for Willow Street, out of the total population over 16 years of age (8,609), 49.1% or 4,227 individuals are in the labor force, with 1.9% or 80 of them unemployed. The age group with the highest labor force participation rate is 25 to 29 years, with 97.9% or 729 individuals in the labor force. Within the labor force, the 16 to 19 years age range has the highest percentage of unemployed individuals, with 21.1% or 80 of them being unemployed.
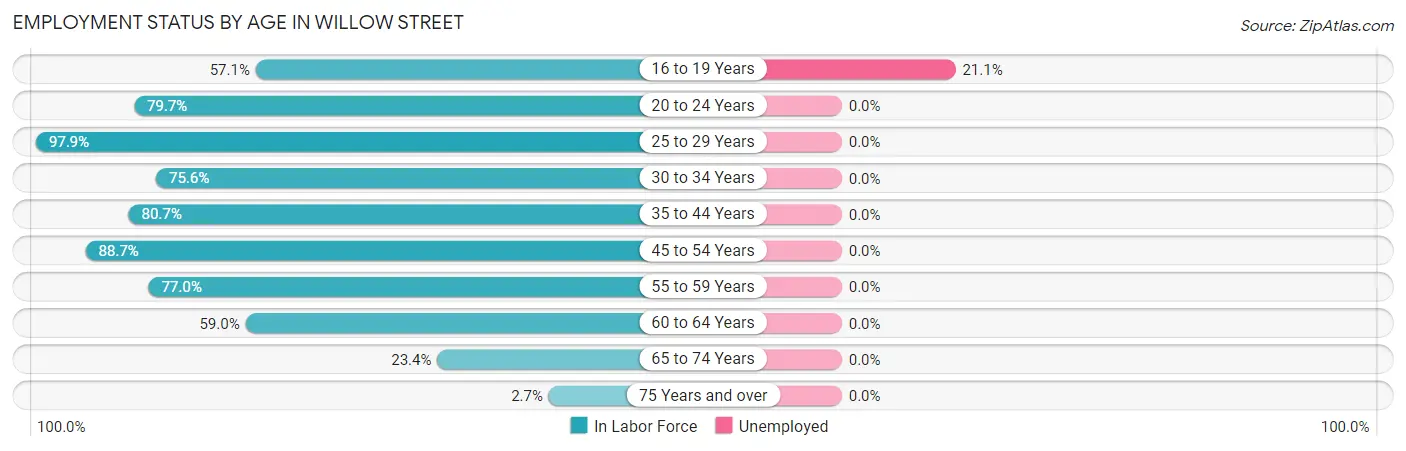
| Age Bracket | In Labor Force | Unemployed |
| 16 to 19 Years | 380 (57.1%) | 80 (21.1%) |
| 20 to 24 Years | 474 (79.7%) | 0 (0.0%) |
| 25 to 29 Years | 729 (97.9%) | 0 (0.0%) |
| 30 to 34 Years | 121 (75.6%) | 0 (0.0%) |
| 35 to 44 Years | 690 (80.7%) | 0 (0.0%) |
| 45 to 54 Years | 837 (88.7%) | 0 (0.0%) |
| 55 to 59 Years | 429 (77.0%) | 0 (0.0%) |
| 60 to 64 Years | 233 (59.0%) | 0 (0.0%) |
| 65 to 74 Years | 270 (23.4%) | 0 (0.0%) |
| 75 Years and over | 69 (2.7%) | 0 (0.0%) |
| Total | 4,227 (49.1%) | 80 (1.9%) |
Employment Status by Educational Attainment in Willow Street
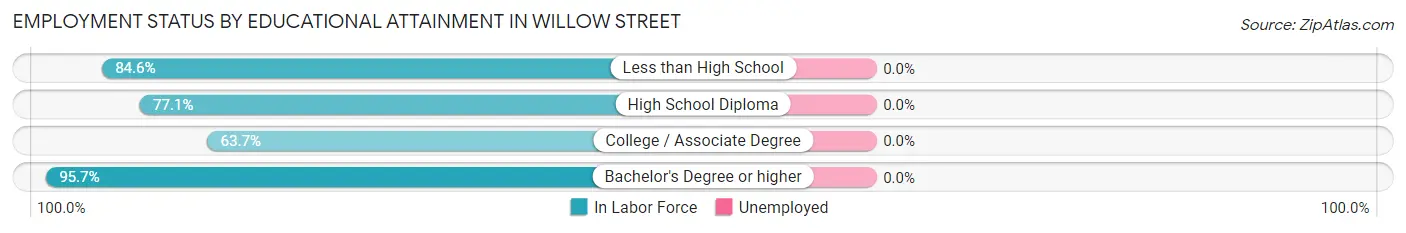
| Educational Attainment | In Labor Force | Unemployed |
| Less than High School | 154 (84.6%) | 0 (0.0%) |
| High School Diploma | 889 (77.1%) | 0 (0.0%) |
| College / Associate Degree | 448 (63.7%) | 0 (0.0%) |
| Bachelor's Degree or higher | 1,548 (95.7%) | 0 (0.0%) |
| Total | 3,038 (83.1%) | 0 (0.0%) |
Employment Occupations by Sex in Willow Street
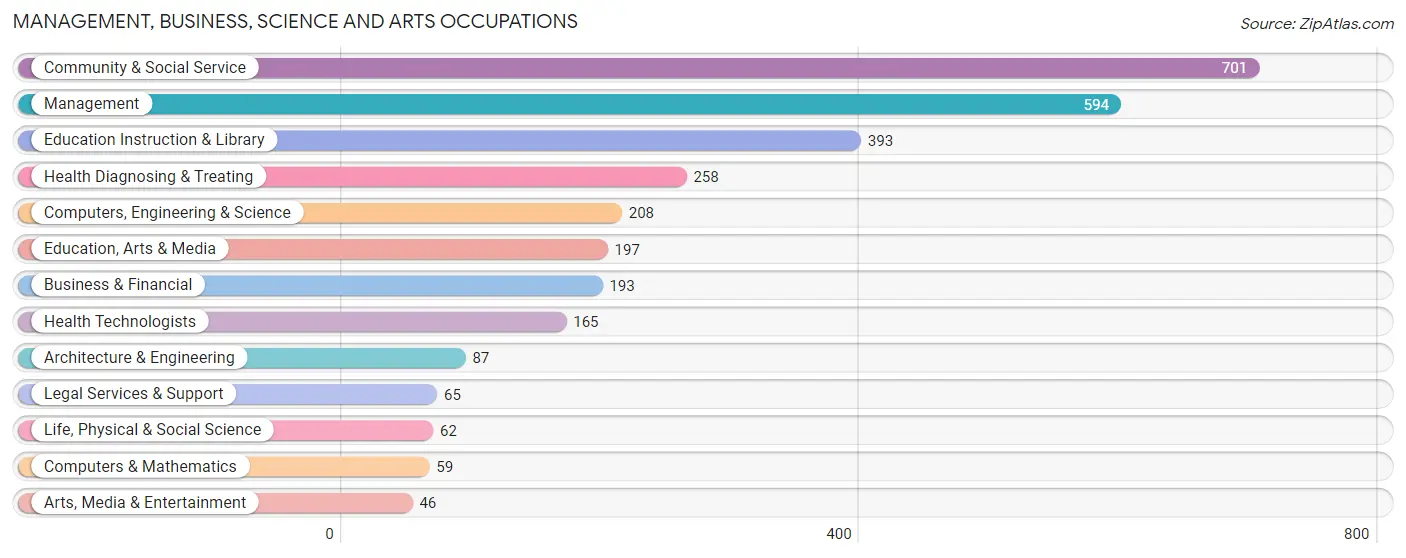
Management, Business, Science and Arts Occupations
The most common Management, Business, Science and Arts occupations in Willow Street are Community & Social Service (701 | 16.9%), Management (594 | 14.3%), Education Instruction & Library (393 | 9.5%), Health Diagnosing & Treating (258 | 6.2%), and Computers, Engineering & Science (208 | 5.0%).
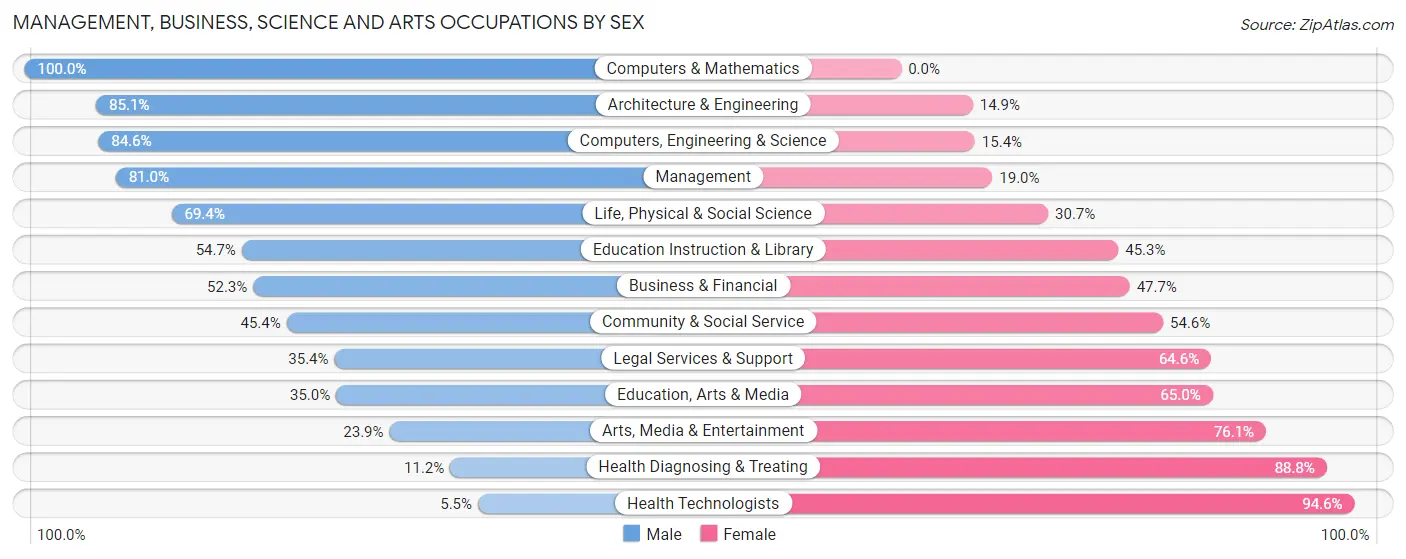
Management, Business, Science and Arts Occupations by Sex
Within the Management, Business, Science and Arts occupations in Willow Street, the most male-oriented occupations are Computers & Mathematics (100.0%), Architecture & Engineering (85.1%), and Computers, Engineering & Science (84.6%), while the most female-oriented occupations are Health Technologists (94.6%), Health Diagnosing & Treating (88.8%), and Arts, Media & Entertainment (76.1%).
| Occupation | Male | Female |
| Management | 481 (81.0%) | 113 (19.0%) |
| Business & Financial | 101 (52.3%) | 92 (47.7%) |
| Computers, Engineering & Science | 176 (84.6%) | 32 (15.4%) |
| Computers & Mathematics | 59 (100.0%) | 0 (0.0%) |
| Architecture & Engineering | 74 (85.1%) | 13 (14.9%) |
| Life, Physical & Social Science | 43 (69.4%) | 19 (30.6%) |
| Community & Social Service | 318 (45.4%) | 383 (54.6%) |
| Education, Arts & Media | 69 (35.0%) | 128 (65.0%) |
| Legal Services & Support | 23 (35.4%) | 42 (64.6%) |
| Education Instruction & Library | 215 (54.7%) | 178 (45.3%) |
| Arts, Media & Entertainment | 11 (23.9%) | 35 (76.1%) |
| Health Diagnosing & Treating | 29 (11.2%) | 229 (88.8%) |
| Health Technologists | 9 (5.4%) | 156 (94.6%) |
| Total (Category) | 1,105 (56.6%) | 849 (43.4%) |
| Total (Overall) | 2,211 (53.3%) | 1,939 (46.7%) |
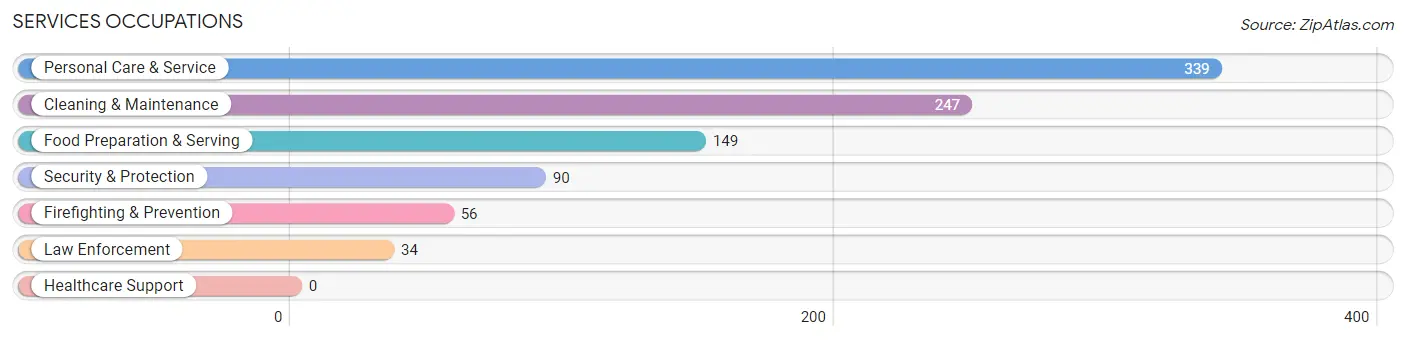
Services Occupations
The most common Services occupations in Willow Street are Personal Care & Service (339 | 8.2%), Cleaning & Maintenance (247 | 5.9%), Food Preparation & Serving (149 | 3.6%), Security & Protection (90 | 2.2%), and Firefighting & Prevention (56 | 1.3%).
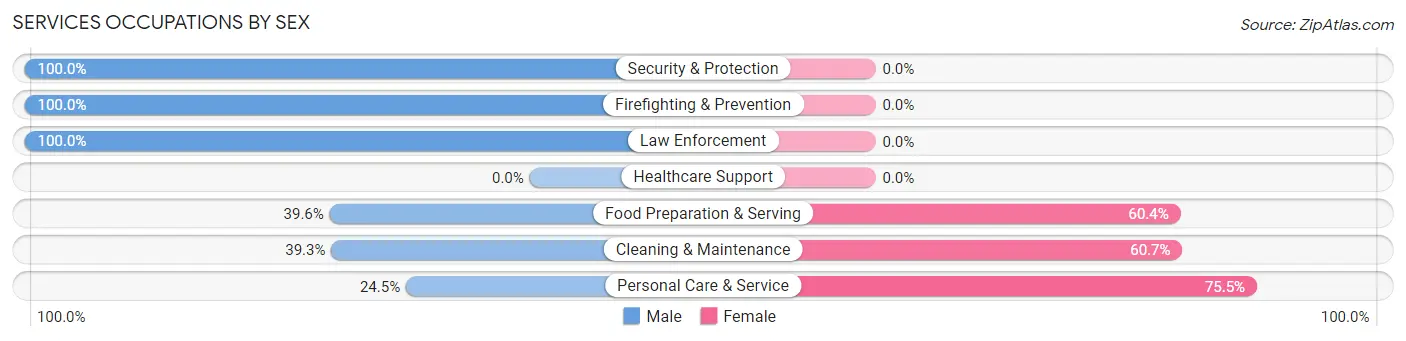
Services Occupations by Sex
Within the Services occupations in Willow Street, the most male-oriented occupations are Security & Protection (100.0%), Firefighting & Prevention (100.0%), and Law Enforcement (100.0%), while the most female-oriented occupations are Personal Care & Service (75.5%), Cleaning & Maintenance (60.7%), and Food Preparation & Serving (60.4%).
| Occupation | Male | Female |
| Healthcare Support | 0 (0.0%) | 0 (0.0%) |
| Security & Protection | 90 (100.0%) | 0 (0.0%) |
| Firefighting & Prevention | 56 (100.0%) | 0 (0.0%) |
| Law Enforcement | 34 (100.0%) | 0 (0.0%) |
| Food Preparation & Serving | 59 (39.6%) | 90 (60.4%) |
| Cleaning & Maintenance | 97 (39.3%) | 150 (60.7%) |
| Personal Care & Service | 83 (24.5%) | 256 (75.5%) |
| Total (Category) | 329 (39.9%) | 496 (60.1%) |
| Total (Overall) | 2,211 (53.3%) | 1,939 (46.7%) |
Sales and Office Occupations
The most common Sales and Office occupations in Willow Street are Sales & Related (335 | 8.1%), and Office & Administration (250 | 6.0%).

Sales and Office Occupations by Sex
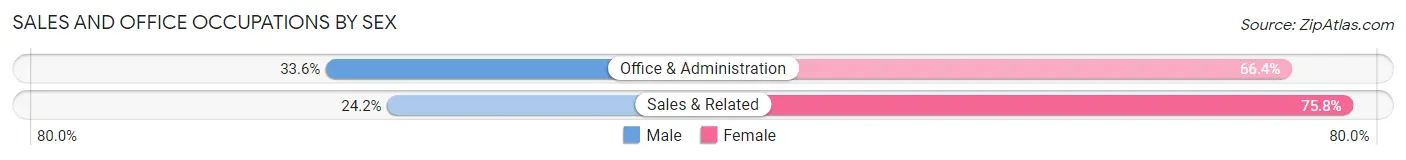
| Occupation | Male | Female |
| Sales & Related | 81 (24.2%) | 254 (75.8%) |
| Office & Administration | 84 (33.6%) | 166 (66.4%) |
| Total (Category) | 165 (28.2%) | 420 (71.8%) |
| Total (Overall) | 2,211 (53.3%) | 1,939 (46.7%) |
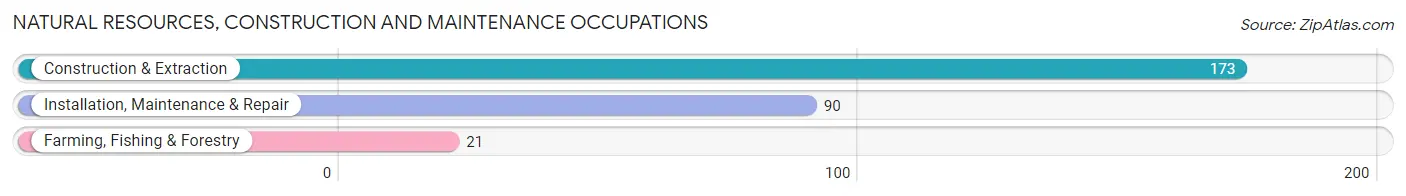
Natural Resources, Construction and Maintenance Occupations
The most common Natural Resources, Construction and Maintenance occupations in Willow Street are Construction & Extraction (173 | 4.2%), Installation, Maintenance & Repair (90 | 2.2%), and Farming, Fishing & Forestry (21 | 0.5%).
Natural Resources, Construction and Maintenance Occupations by Sex
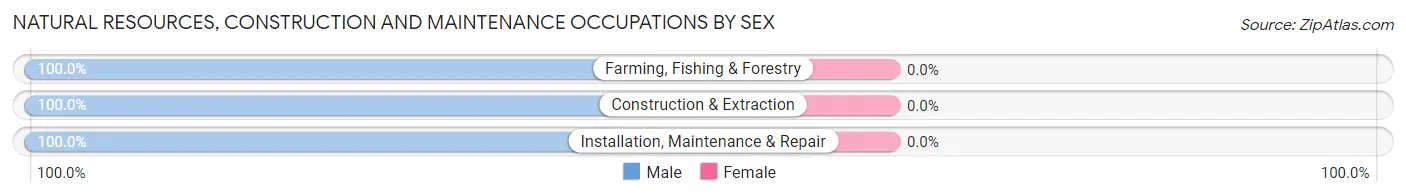
| Occupation | Male | Female |
| Farming, Fishing & Forestry | 21 (100.0%) | 0 (0.0%) |
| Construction & Extraction | 173 (100.0%) | 0 (0.0%) |
| Installation, Maintenance & Repair | 90 (100.0%) | 0 (0.0%) |
| Total (Category) | 284 (100.0%) | 0 (0.0%) |
| Total (Overall) | 2,211 (53.3%) | 1,939 (46.7%) |
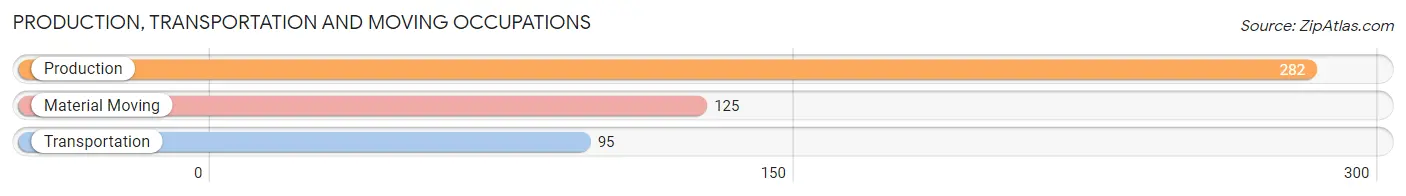
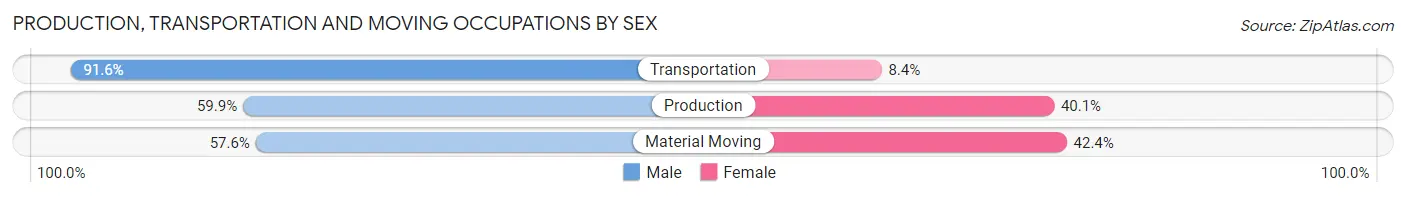
Production, Transportation and Moving Occupations
The most common Production, Transportation and Moving occupations in Willow Street are Production (282 | 6.8%), Material Moving (125 | 3.0%), and Transportation (95 | 2.3%).
Production, Transportation and Moving Occupations by Sex
| Occupation | Male | Female |
| Production | 169 (59.9%) | 113 (40.1%) |
| Transportation | 87 (91.6%) | 8 (8.4%) |
| Material Moving | 72 (57.6%) | 53 (42.4%) |
| Total (Category) | 328 (65.3%) | 174 (34.7%) |
| Total (Overall) | 2,211 (53.3%) | 1,939 (46.7%) |
Employment Industries by Sex in Willow Street
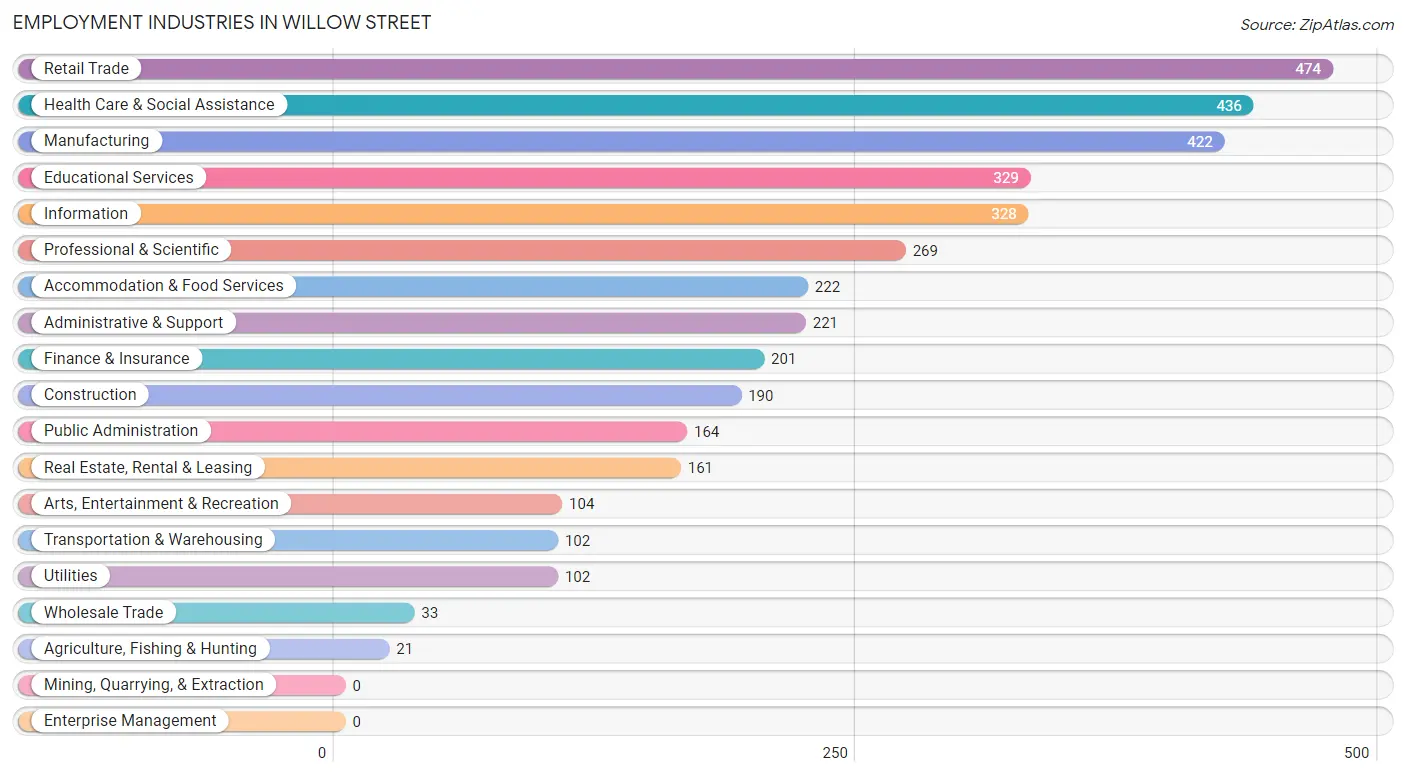
Employment Industries in Willow Street
The major employment industries in Willow Street include Retail Trade (474 | 11.4%), Health Care & Social Assistance (436 | 10.5%), Manufacturing (422 | 10.2%), Educational Services (329 | 7.9%), and Information (328 | 7.9%).
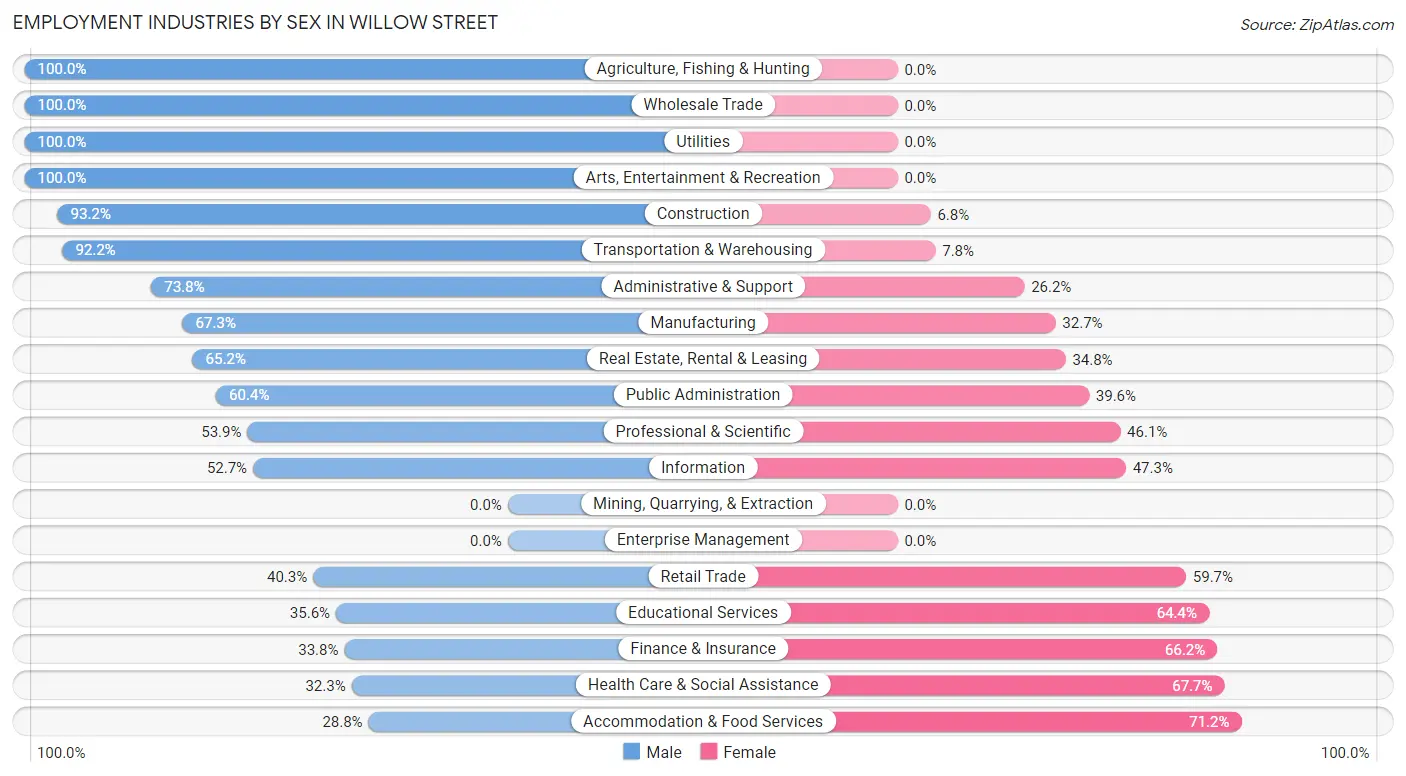
Employment Industries by Sex in Willow Street
The Willow Street industries that see more men than women are Agriculture, Fishing & Hunting (100.0%), Wholesale Trade (100.0%), and Utilities (100.0%), whereas the industries that tend to have a higher number of women are Accommodation & Food Services (71.2%), Health Care & Social Assistance (67.7%), and Finance & Insurance (66.2%).
| Industry | Male | Female |
| Agriculture, Fishing & Hunting | 21 (100.0%) | 0 (0.0%) |
| Mining, Quarrying, & Extraction | 0 (0.0%) | 0 (0.0%) |
| Construction | 177 (93.2%) | 13 (6.8%) |
| Manufacturing | 284 (67.3%) | 138 (32.7%) |
| Wholesale Trade | 33 (100.0%) | 0 (0.0%) |
| Retail Trade | 191 (40.3%) | 283 (59.7%) |
| Transportation & Warehousing | 94 (92.2%) | 8 (7.8%) |
| Utilities | 102 (100.0%) | 0 (0.0%) |
| Information | 173 (52.7%) | 155 (47.3%) |
| Finance & Insurance | 68 (33.8%) | 133 (66.2%) |
| Real Estate, Rental & Leasing | 105 (65.2%) | 56 (34.8%) |
| Professional & Scientific | 145 (53.9%) | 124 (46.1%) |
| Enterprise Management | 0 (0.0%) | 0 (0.0%) |
| Administrative & Support | 163 (73.8%) | 58 (26.2%) |
| Educational Services | 117 (35.6%) | 212 (64.4%) |
| Health Care & Social Assistance | 141 (32.3%) | 295 (67.7%) |
| Arts, Entertainment & Recreation | 104 (100.0%) | 0 (0.0%) |
| Accommodation & Food Services | 64 (28.8%) | 158 (71.2%) |
| Public Administration | 99 (60.4%) | 65 (39.6%) |
| Total | 2,211 (53.3%) | 1,939 (46.7%) |
Education in Willow Street
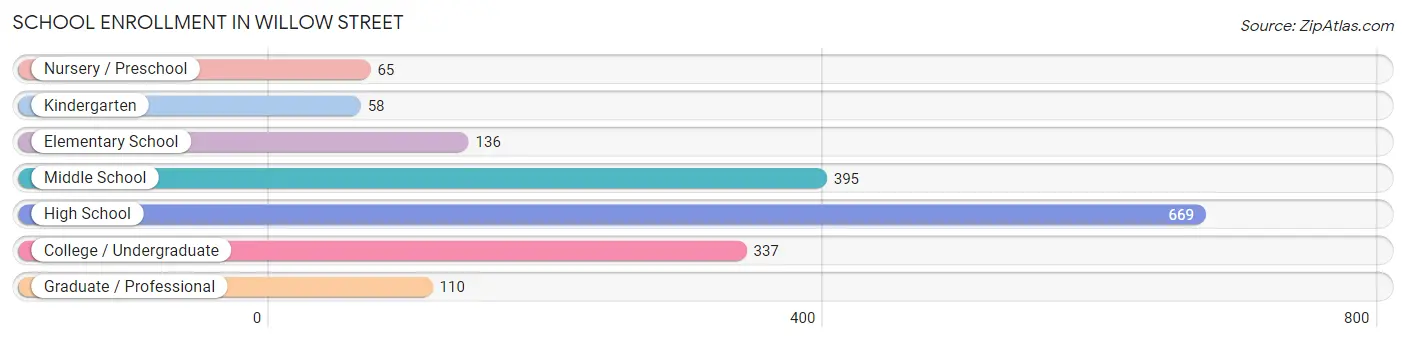
School Enrollment in Willow Street
The most common levels of schooling among the 1,770 students in Willow Street are high school (669 | 37.8%), middle school (395 | 22.3%), and college / undergraduate (337 | 19.0%).
| School Level | # Students | % Students |
| Nursery / Preschool | 65 | 3.7% |
| Kindergarten | 58 | 3.3% |
| Elementary School | 136 | 7.7% |
| Middle School | 395 | 22.3% |
| High School | 669 | 37.8% |
| College / Undergraduate | 337 | 19.0% |
| Graduate / Professional | 110 | 6.2% |
| Total | 1,770 | 100.0% |
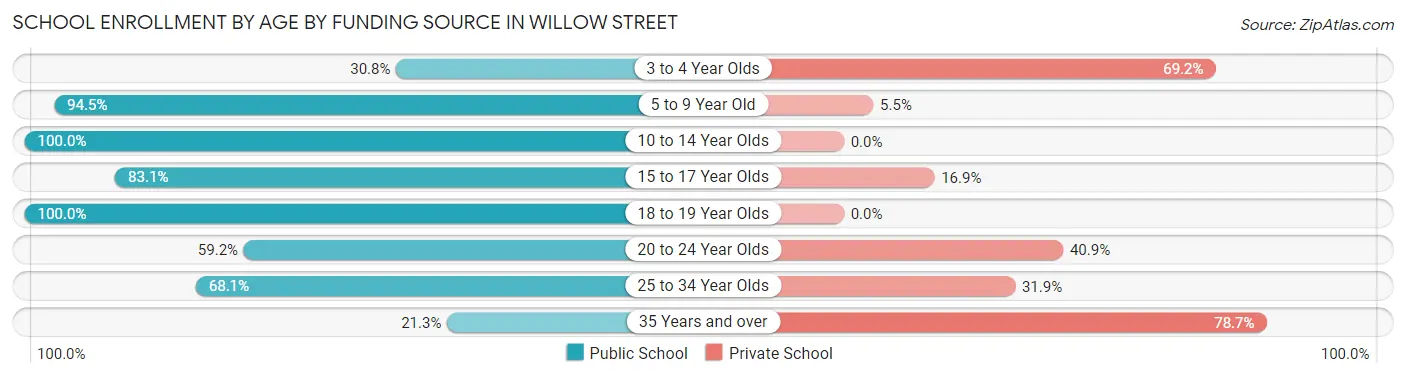
School Enrollment by Age by Funding Source in Willow Street
Out of a total of 1,770 students who are enrolled in schools in Willow Street, 317 (17.9%) attend a private institution, while the remaining 1,453 (82.1%) are enrolled in public schools. The age group of 35 years and over has the highest likelihood of being enrolled in private schools, with 37 (78.7% in the age bracket) enrolled. Conversely, the age group of 10 to 14 year olds has the lowest likelihood of being enrolled in a private school, with 429 (100.0% in the age bracket) attending a public institution.
| Age Bracket | Public School | Private School |
| 3 to 4 Year Olds | 20 (30.8%) | 45 (69.2%) |
| 5 to 9 Year Old | 172 (94.5%) | 10 (5.5%) |
| 10 to 14 Year Olds | 429 (100.0%) | 0 (0.0%) |
| 15 to 17 Year Olds | 488 (83.1%) | 99 (16.9%) |
| 18 to 19 Year Olds | 131 (100.0%) | 0 (0.0%) |
| 20 to 24 Year Olds | 139 (59.2%) | 96 (40.8%) |
| 25 to 34 Year Olds | 64 (68.1%) | 30 (31.9%) |
| 35 Years and over | 10 (21.3%) | 37 (78.7%) |
| Total | 1,453 (82.1%) | 317 (17.9%) |
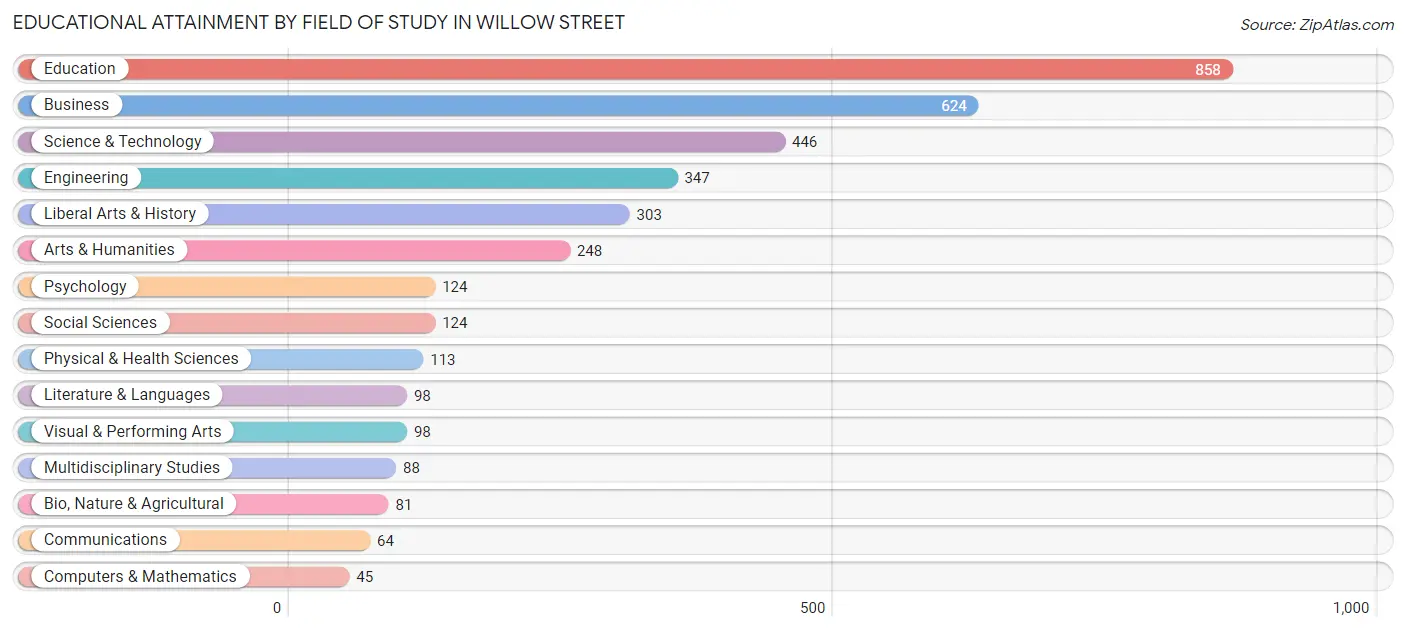
Educational Attainment by Field of Study in Willow Street
Education (858 | 23.4%), business (624 | 17.0%), science & technology (446 | 12.2%), engineering (347 | 9.5%), and liberal arts & history (303 | 8.3%) are the most common fields of study among 3,661 individuals in Willow Street who have obtained a bachelor's degree or higher.
| Field of Study | # Graduates | % Graduates |
| Computers & Mathematics | 45 | 1.2% |
| Bio, Nature & Agricultural | 81 | 2.2% |
| Physical & Health Sciences | 113 | 3.1% |
| Psychology | 124 | 3.4% |
| Social Sciences | 124 | 3.4% |
| Engineering | 347 | 9.5% |
| Multidisciplinary Studies | 88 | 2.4% |
| Science & Technology | 446 | 12.2% |
| Business | 624 | 17.0% |
| Education | 858 | 23.4% |
| Literature & Languages | 98 | 2.7% |
| Liberal Arts & History | 303 | 8.3% |
| Visual & Performing Arts | 98 | 2.7% |
| Communications | 64 | 1.8% |
| Arts & Humanities | 248 | 6.8% |
| Total | 3,661 | 100.0% |
Transportation & Commute in Willow Street
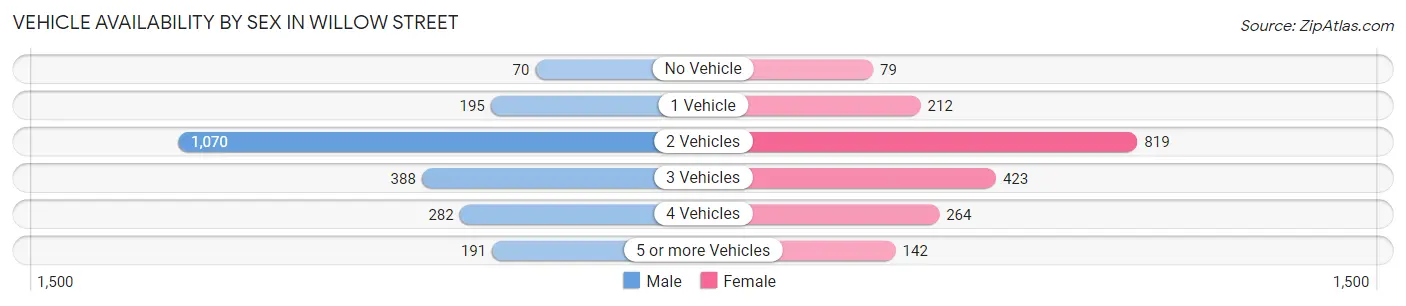
Vehicle Availability by Sex in Willow Street
The most prevalent vehicle ownership categories in Willow Street are males with 2 vehicles (1,070, accounting for 48.7%) and females with 2 vehicles (819, making up 55.2%).
| Vehicles Available | Male | Female |
| No Vehicle | 70 (3.2%) | 79 (4.1%) |
| 1 Vehicle | 195 (8.9%) | 212 (10.9%) |
| 2 Vehicles | 1,070 (48.7%) | 819 (42.2%) |
| 3 Vehicles | 388 (17.7%) | 423 (21.8%) |
| 4 Vehicles | 282 (12.8%) | 264 (13.6%) |
| 5 or more Vehicles | 191 (8.7%) | 142 (7.3%) |
| Total | 2,196 (100.0%) | 1,939 (100.0%) |
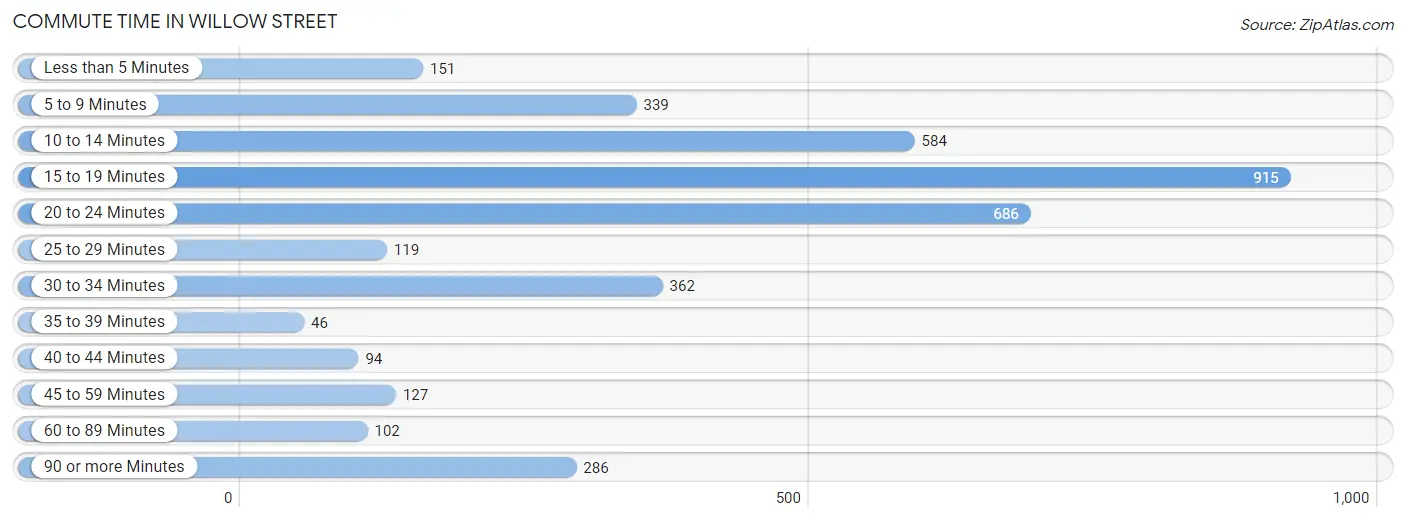
Commute Time in Willow Street
The most frequently occuring commute durations in Willow Street are 15 to 19 minutes (915 commuters, 24.0%), 20 to 24 minutes (686 commuters, 18.0%), and 10 to 14 minutes (584 commuters, 15.3%).
| Commute Time | # Commuters | % Commuters |
| Less than 5 Minutes | 151 | 4.0% |
| 5 to 9 Minutes | 339 | 8.9% |
| 10 to 14 Minutes | 584 | 15.3% |
| 15 to 19 Minutes | 915 | 24.0% |
| 20 to 24 Minutes | 686 | 18.0% |
| 25 to 29 Minutes | 119 | 3.1% |
| 30 to 34 Minutes | 362 | 9.5% |
| 35 to 39 Minutes | 46 | 1.2% |
| 40 to 44 Minutes | 94 | 2.5% |
| 45 to 59 Minutes | 127 | 3.3% |
| 60 to 89 Minutes | 102 | 2.7% |
| 90 or more Minutes | 286 | 7.5% |
Commute Time by Sex in Willow Street
The most common commute times in Willow Street are 15 to 19 minutes (475 commuters, 24.3%) for males and 15 to 19 minutes (440 commuters, 23.7%) for females.
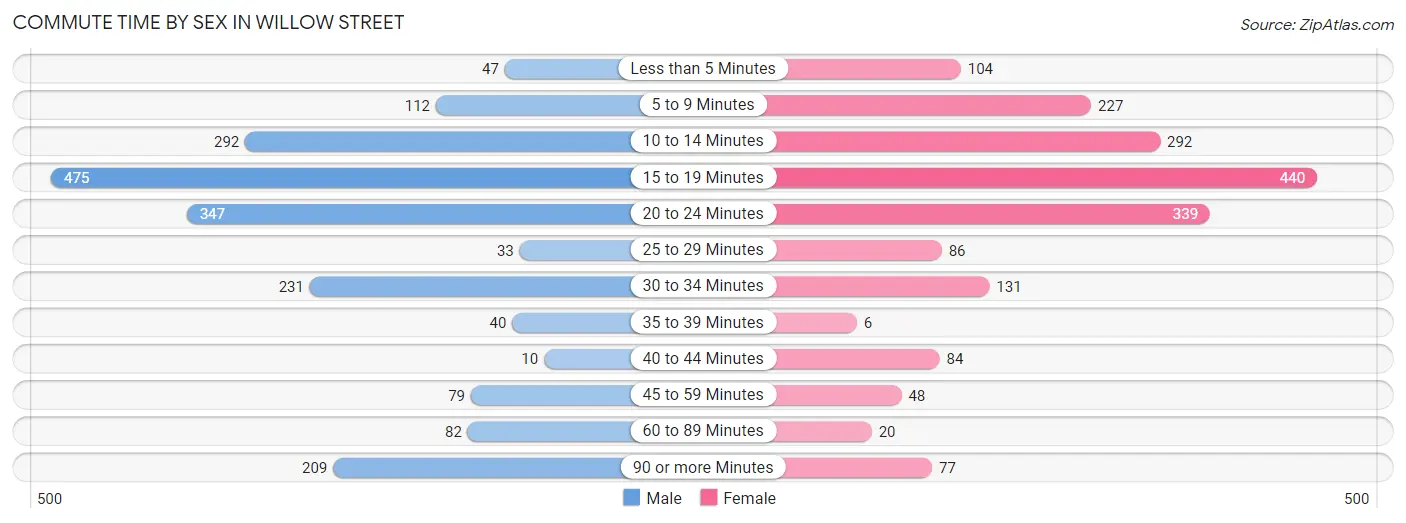
| Commute Time | Male | Female |
| Less than 5 Minutes | 47 (2.4%) | 104 (5.6%) |
| 5 to 9 Minutes | 112 (5.7%) | 227 (12.2%) |
| 10 to 14 Minutes | 292 (14.9%) | 292 (15.8%) |
| 15 to 19 Minutes | 475 (24.3%) | 440 (23.7%) |
| 20 to 24 Minutes | 347 (17.7%) | 339 (18.3%) |
| 25 to 29 Minutes | 33 (1.7%) | 86 (4.6%) |
| 30 to 34 Minutes | 231 (11.8%) | 131 (7.1%) |
| 35 to 39 Minutes | 40 (2.0%) | 6 (0.3%) |
| 40 to 44 Minutes | 10 (0.5%) | 84 (4.5%) |
| 45 to 59 Minutes | 79 (4.0%) | 48 (2.6%) |
| 60 to 89 Minutes | 82 (4.2%) | 20 (1.1%) |
| 90 or more Minutes | 209 (10.7%) | 77 (4.2%) |
Time of Departure to Work by Sex in Willow Street
The most frequent times of departure to work in Willow Street are 6:30 AM to 6:59 AM (333, 17.0%) for males and 6:00 AM to 6:29 AM (363, 19.6%) for females.
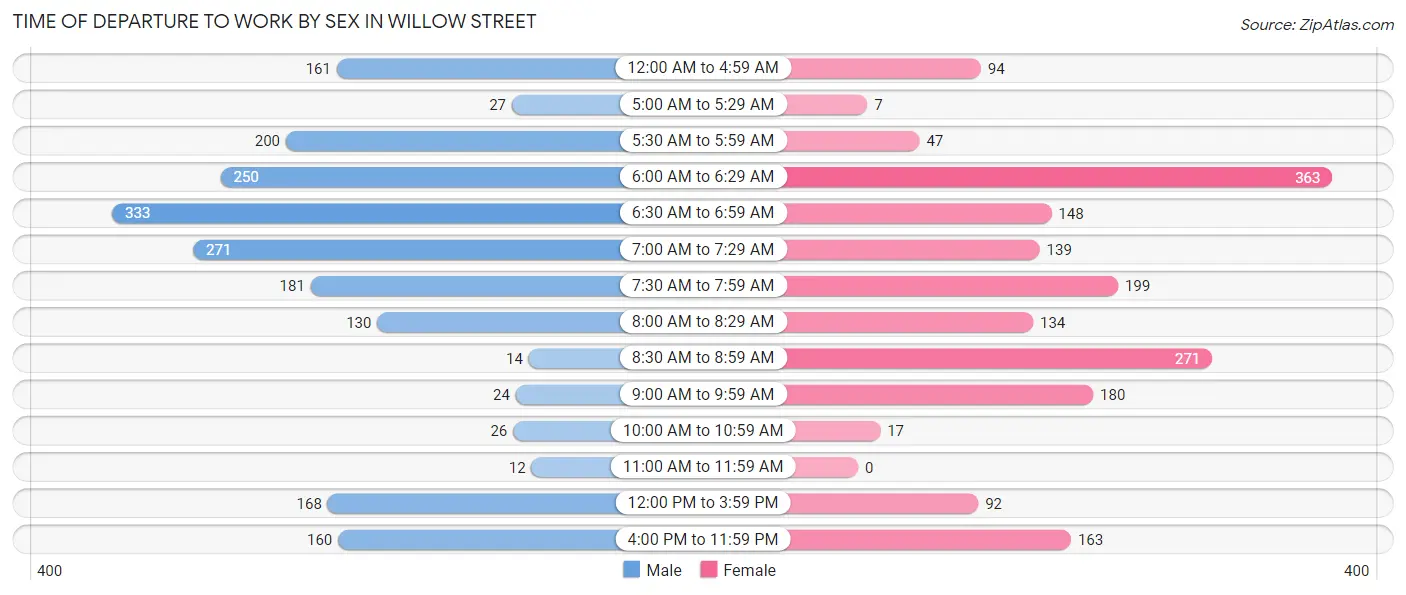
| Time of Departure | Male | Female |
| 12:00 AM to 4:59 AM | 161 (8.2%) | 94 (5.1%) |
| 5:00 AM to 5:29 AM | 27 (1.4%) | 7 (0.4%) |
| 5:30 AM to 5:59 AM | 200 (10.2%) | 47 (2.5%) |
| 6:00 AM to 6:29 AM | 250 (12.8%) | 363 (19.6%) |
| 6:30 AM to 6:59 AM | 333 (17.0%) | 148 (8.0%) |
| 7:00 AM to 7:29 AM | 271 (13.9%) | 139 (7.5%) |
| 7:30 AM to 7:59 AM | 181 (9.2%) | 199 (10.7%) |
| 8:00 AM to 8:29 AM | 130 (6.6%) | 134 (7.2%) |
| 8:30 AM to 8:59 AM | 14 (0.7%) | 271 (14.6%) |
| 9:00 AM to 9:59 AM | 24 (1.2%) | 180 (9.7%) |
| 10:00 AM to 10:59 AM | 26 (1.3%) | 17 (0.9%) |
| 11:00 AM to 11:59 AM | 12 (0.6%) | 0 (0.0%) |
| 12:00 PM to 3:59 PM | 168 (8.6%) | 92 (5.0%) |
| 4:00 PM to 11:59 PM | 160 (8.2%) | 163 (8.8%) |
| Total | 1,957 (100.0%) | 1,854 (100.0%) |
Housing Occupancy in Willow Street
Occupancy by Ownership in Willow Street
Of the total 4,175 dwellings in Willow Street, owner-occupied units account for 1,907 (45.7%), while renter-occupied units make up 2,268 (54.3%).
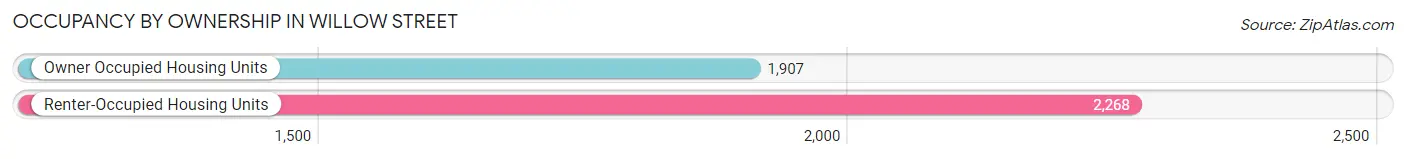
| Occupancy | # Housing Units | % Housing Units |
| Owner Occupied Housing Units | 1,907 | 45.7% |
| Renter-Occupied Housing Units | 2,268 | 54.3% |
| Total Occupied Housing Units | 4,175 | 100.0% |
Occupancy by Household Size in Willow Street
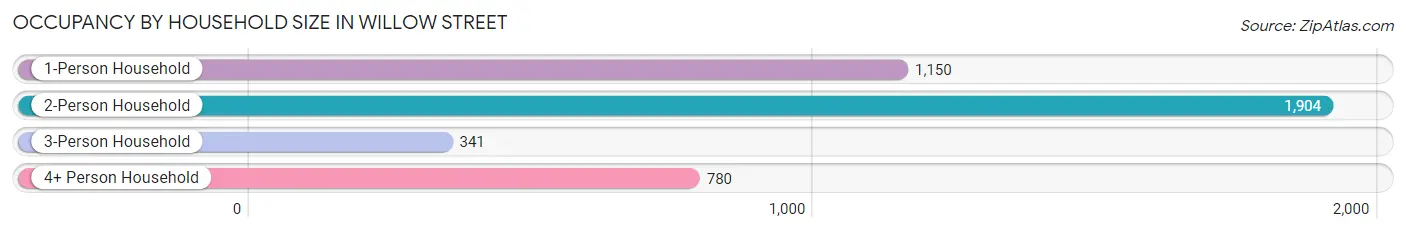
| Household Size | # Housing Units | % Housing Units |
| 1-Person Household | 1,150 | 27.5% |
| 2-Person Household | 1,904 | 45.6% |
| 3-Person Household | 341 | 8.2% |
| 4+ Person Household | 780 | 18.7% |
| Total Housing Units | 4,175 | 100.0% |
Occupancy by Ownership by Household Size in Willow Street
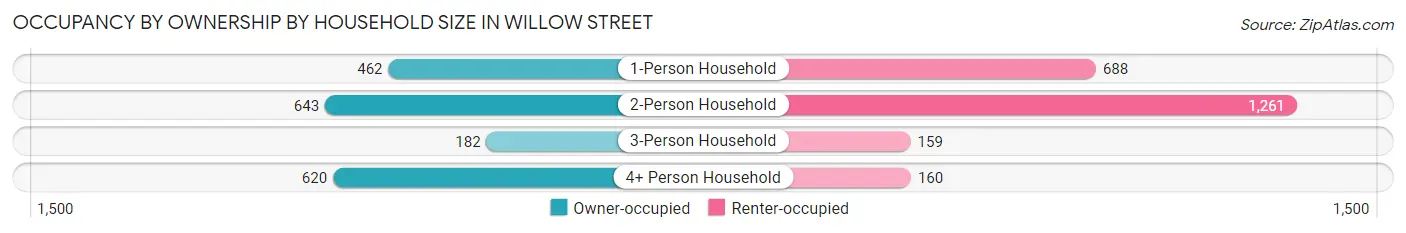
| Household Size | Owner-occupied | Renter-occupied |
| 1-Person Household | 462 (40.2%) | 688 (59.8%) |
| 2-Person Household | 643 (33.8%) | 1,261 (66.2%) |
| 3-Person Household | 182 (53.4%) | 159 (46.6%) |
| 4+ Person Household | 620 (79.5%) | 160 (20.5%) |
| Total Housing Units | 1,907 (45.7%) | 2,268 (54.3%) |
Occupancy by Educational Attainment in Willow Street
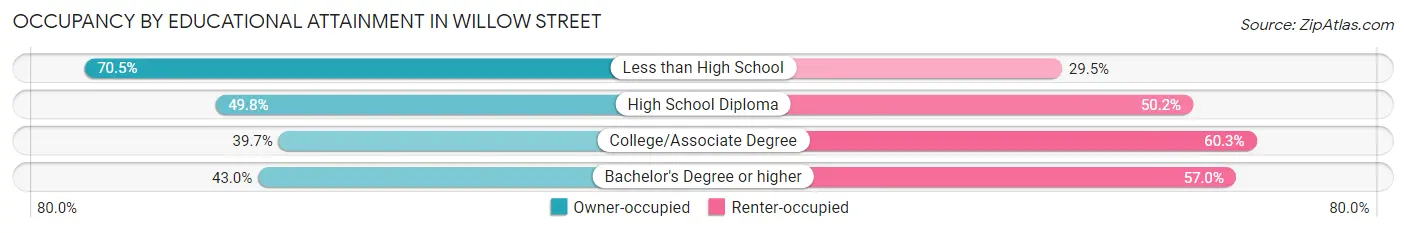
| Household Size | Owner-occupied | Renter-occupied |
| Less than High School | 158 (70.5%) | 66 (29.5%) |
| High School Diploma | 522 (49.8%) | 527 (50.2%) |
| College/Associate Degree | 243 (39.7%) | 369 (60.3%) |
| Bachelor's Degree or higher | 984 (43.0%) | 1,306 (57.0%) |
Occupancy by Age of Householder in Willow Street
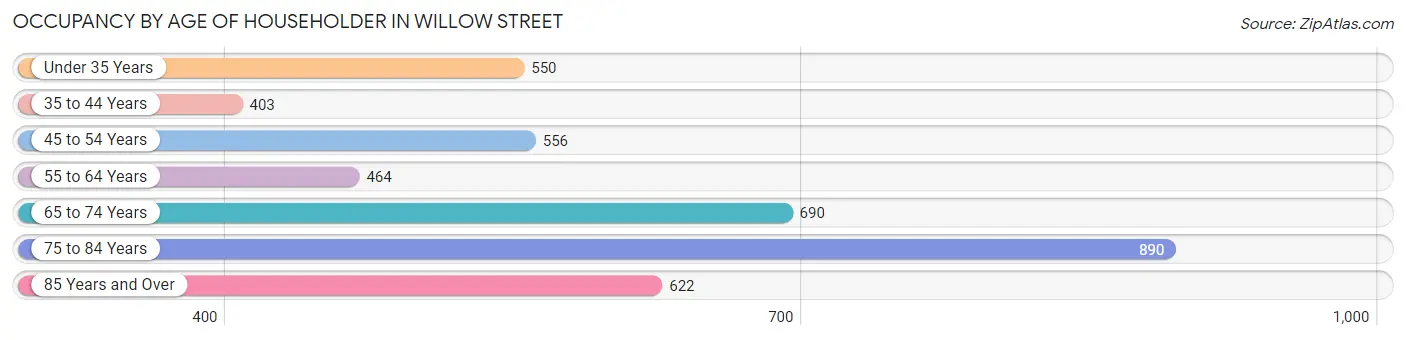
| Age Bracket | # Households | % Households |
| Under 35 Years | 550 | 13.2% |
| 35 to 44 Years | 403 | 9.7% |
| 45 to 54 Years | 556 | 13.3% |
| 55 to 64 Years | 464 | 11.1% |
| 65 to 74 Years | 690 | 16.5% |
| 75 to 84 Years | 890 | 21.3% |
| 85 Years and Over | 622 | 14.9% |
| Total | 4,175 | 100.0% |
Housing Finances in Willow Street
Median Income by Occupancy in Willow Street
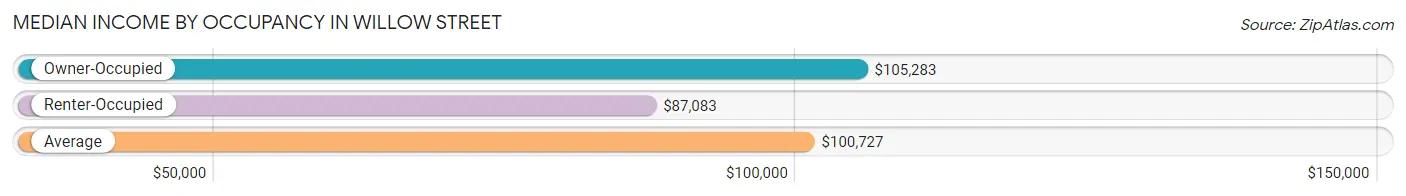
| Occupancy Type | # Households | Median Income |
| Owner-Occupied | 1,907 (45.7%) | $105,283 |
| Renter-Occupied | 2,268 (54.3%) | $87,083 |
| Average | 4,175 (100.0%) | $100,727 |
Occupancy by Householder Income Bracket in Willow Street
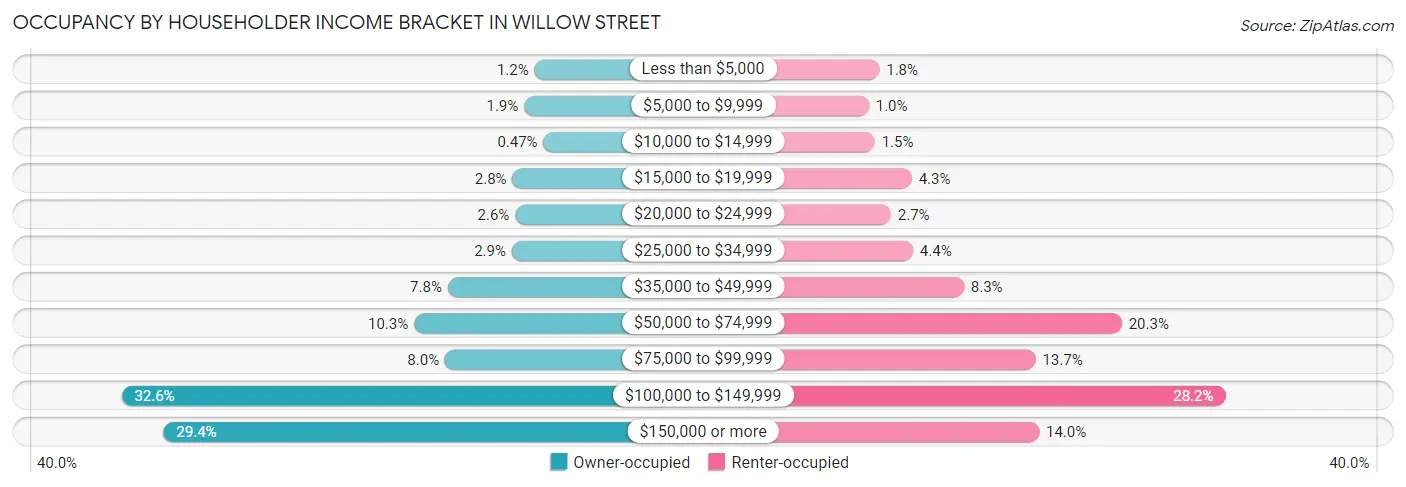
| Income Bracket | Owner-occupied | Renter-occupied |
| Less than $5,000 | 22 (1.1%) | 41 (1.8%) |
| $5,000 to $9,999 | 37 (1.9%) | 23 (1.0%) |
| $10,000 to $14,999 | 9 (0.5%) | 33 (1.5%) |
| $15,000 to $19,999 | 54 (2.8%) | 97 (4.3%) |
| $20,000 to $24,999 | 50 (2.6%) | 61 (2.7%) |
| $25,000 to $34,999 | 55 (2.9%) | 99 (4.4%) |
| $35,000 to $49,999 | 148 (7.8%) | 187 (8.3%) |
| $50,000 to $74,999 | 197 (10.3%) | 460 (20.3%) |
| $75,000 to $99,999 | 152 (8.0%) | 311 (13.7%) |
| $100,000 to $149,999 | 622 (32.6%) | 639 (28.2%) |
| $150,000 or more | 561 (29.4%) | 317 (14.0%) |
| Total | 1,907 (100.0%) | 2,268 (100.0%) |
Monthly Housing Cost Tiers in Willow Street
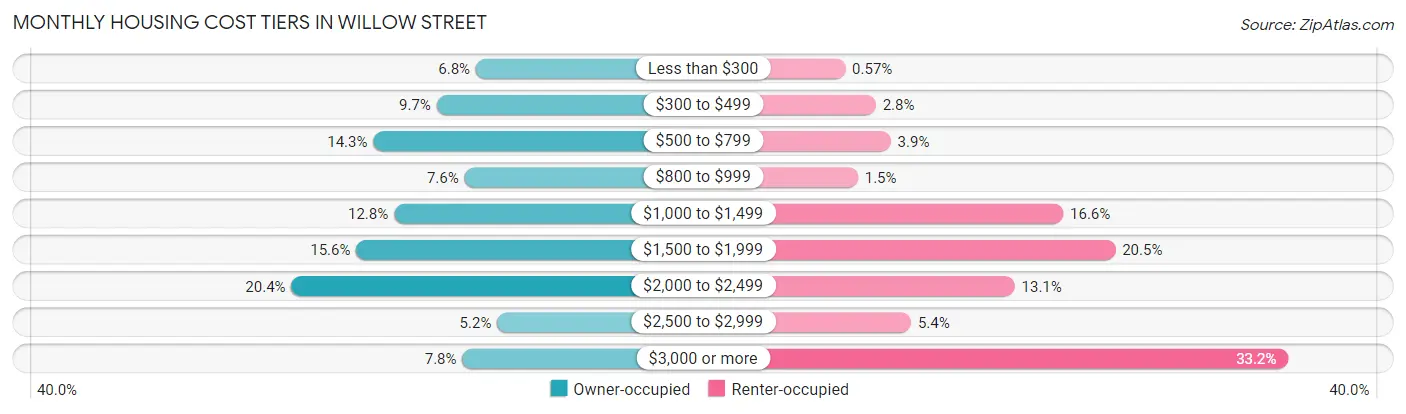
| Monthly Cost | Owner-occupied | Renter-occupied |
| Less than $300 | 129 (6.8%) | 13 (0.6%) |
| $300 to $499 | 184 (9.7%) | 64 (2.8%) |
| $500 to $799 | 273 (14.3%) | 89 (3.9%) |
| $800 to $999 | 145 (7.6%) | 34 (1.5%) |
| $1,000 to $1,499 | 244 (12.8%) | 377 (16.6%) |
| $1,500 to $1,999 | 297 (15.6%) | 464 (20.5%) |
| $2,000 to $2,499 | 388 (20.3%) | 296 (13.1%) |
| $2,500 to $2,999 | 99 (5.2%) | 123 (5.4%) |
| $3,000 or more | 148 (7.8%) | 753 (33.2%) |
| Total | 1,907 (100.0%) | 2,268 (100.0%) |
Physical Housing Characteristics in Willow Street
Housing Structures in Willow Street
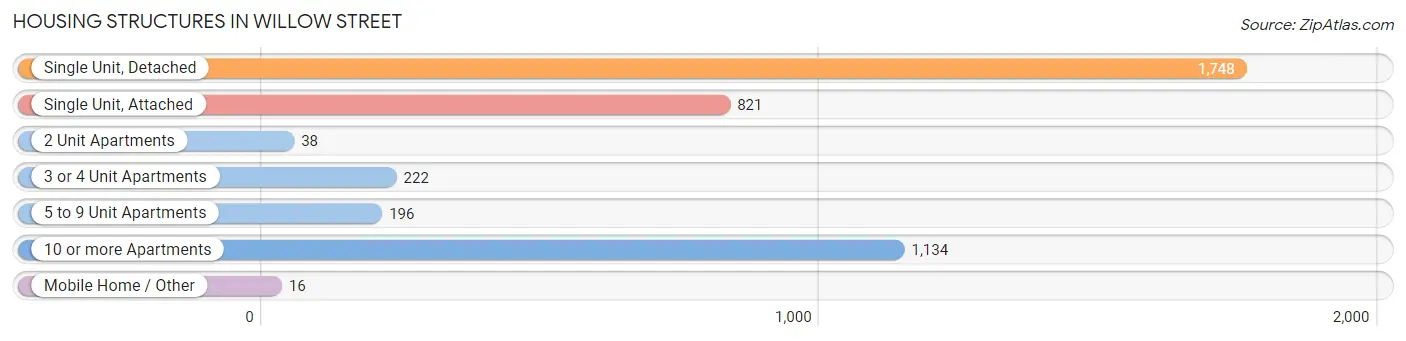
| Structure Type | # Housing Units | % Housing Units |
| Single Unit, Detached | 1,748 | 41.9% |
| Single Unit, Attached | 821 | 19.7% |
| 2 Unit Apartments | 38 | 0.9% |
| 3 or 4 Unit Apartments | 222 | 5.3% |
| 5 to 9 Unit Apartments | 196 | 4.7% |
| 10 or more Apartments | 1,134 | 27.2% |
| Mobile Home / Other | 16 | 0.4% |
| Total | 4,175 | 100.0% |
Housing Structures by Occupancy in Willow Street
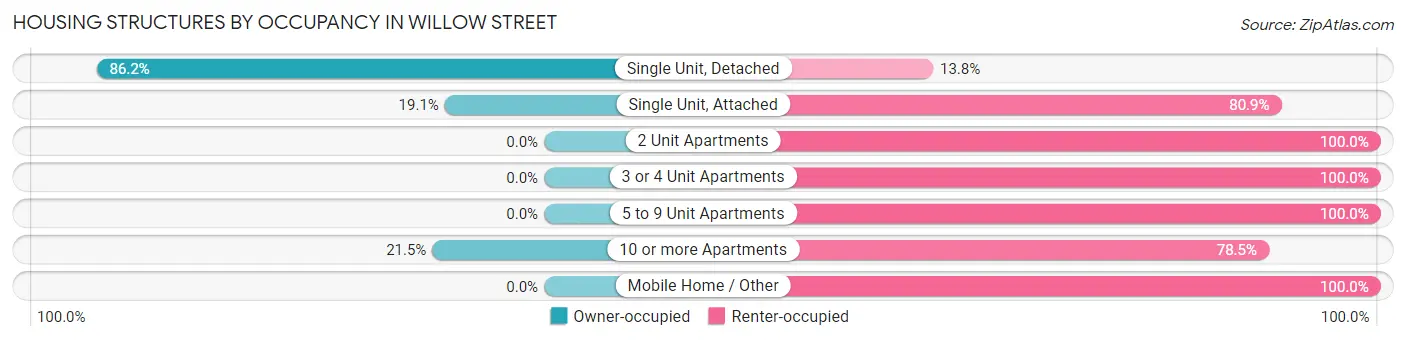
| Structure Type | Owner-occupied | Renter-occupied |
| Single Unit, Detached | 1,506 (86.2%) | 242 (13.8%) |
| Single Unit, Attached | 157 (19.1%) | 664 (80.9%) |
| 2 Unit Apartments | 0 (0.0%) | 38 (100.0%) |
| 3 or 4 Unit Apartments | 0 (0.0%) | 222 (100.0%) |
| 5 to 9 Unit Apartments | 0 (0.0%) | 196 (100.0%) |
| 10 or more Apartments | 244 (21.5%) | 890 (78.5%) |
| Mobile Home / Other | 0 (0.0%) | 16 (100.0%) |
| Total | 1,907 (45.7%) | 2,268 (54.3%) |
Housing Structures by Number of Rooms in Willow Street
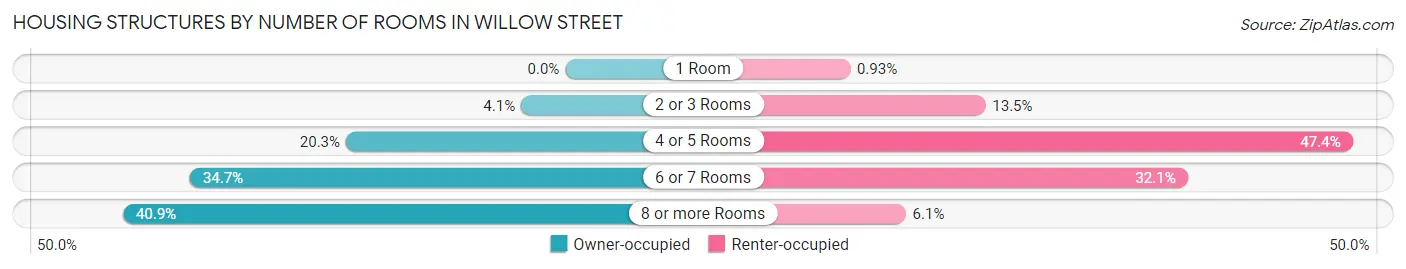
| Number of Rooms | Owner-occupied | Renter-occupied |
| 1 Room | 0 (0.0%) | 21 (0.9%) |
| 2 or 3 Rooms | 78 (4.1%) | 305 (13.5%) |
| 4 or 5 Rooms | 387 (20.3%) | 1,075 (47.4%) |
| 6 or 7 Rooms | 662 (34.7%) | 729 (32.1%) |
| 8 or more Rooms | 780 (40.9%) | 138 (6.1%) |
| Total | 1,907 (100.0%) | 2,268 (100.0%) |
Housing Structure by Heating Type in Willow Street
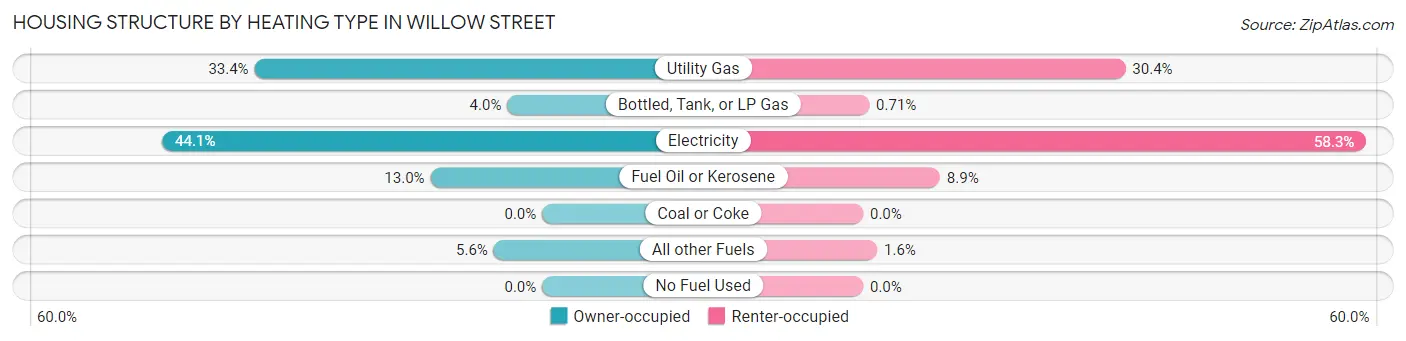
| Heating Type | Owner-occupied | Renter-occupied |
| Utility Gas | 636 (33.4%) | 690 (30.4%) |
| Bottled, Tank, or LP Gas | 77 (4.0%) | 16 (0.7%) |
| Electricity | 840 (44.1%) | 1,323 (58.3%) |
| Fuel Oil or Kerosene | 247 (13.0%) | 202 (8.9%) |
| Coal or Coke | 0 (0.0%) | 0 (0.0%) |
| All other Fuels | 107 (5.6%) | 37 (1.6%) |
| No Fuel Used | 0 (0.0%) | 0 (0.0%) |
| Total | 1,907 (100.0%) | 2,268 (100.0%) |
Household Vehicle Usage in Willow Street
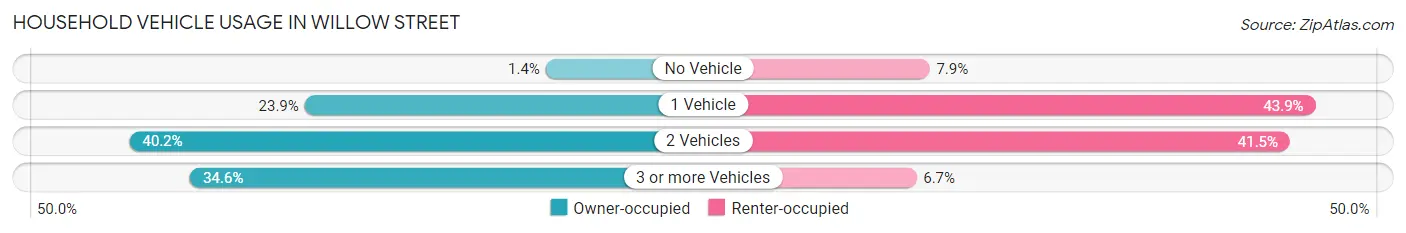
| Vehicles per Household | Owner-occupied | Renter-occupied |
| No Vehicle | 26 (1.4%) | 179 (7.9%) |
| 1 Vehicle | 455 (23.9%) | 996 (43.9%) |
| 2 Vehicles | 767 (40.2%) | 942 (41.5%) |
| 3 or more Vehicles | 659 (34.6%) | 151 (6.7%) |
| Total | 1,907 (100.0%) | 2,268 (100.0%) |
Real Estate & Mortgages in Willow Street
Real Estate and Mortgage Overview in Willow Street
| Characteristic | Without Mortgage | With Mortgage |
| Housing Units | 833 | 1,074 |
| Median Property Value | $274,300 | $293,200 |
| Median Household Income | $99,952 | $359 |
| Monthly Housing Costs | $646 | $132 |
| Real Estate Taxes | $4,292 | $0 |
Property Value by Mortgage Status in Willow Street
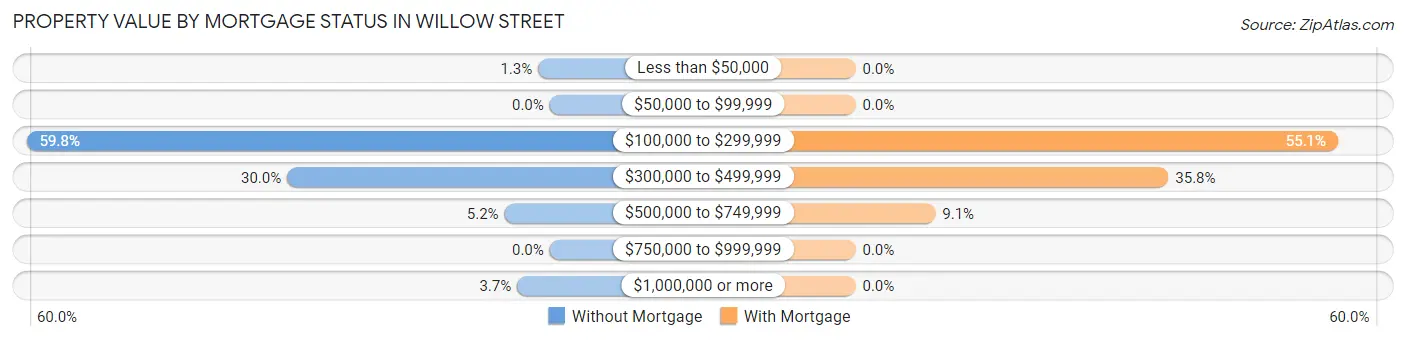
| Property Value | Without Mortgage | With Mortgage |
| Less than $50,000 | 11 (1.3%) | 0 (0.0%) |
| $50,000 to $99,999 | 0 (0.0%) | 0 (0.0%) |
| $100,000 to $299,999 | 498 (59.8%) | 592 (55.1%) |
| $300,000 to $499,999 | 250 (30.0%) | 384 (35.7%) |
| $500,000 to $749,999 | 43 (5.2%) | 98 (9.1%) |
| $750,000 to $999,999 | 0 (0.0%) | 0 (0.0%) |
| $1,000,000 or more | 31 (3.7%) | 0 (0.0%) |
| Total | 833 (100.0%) | 1,074 (100.0%) |
Household Income by Mortgage Status in Willow Street
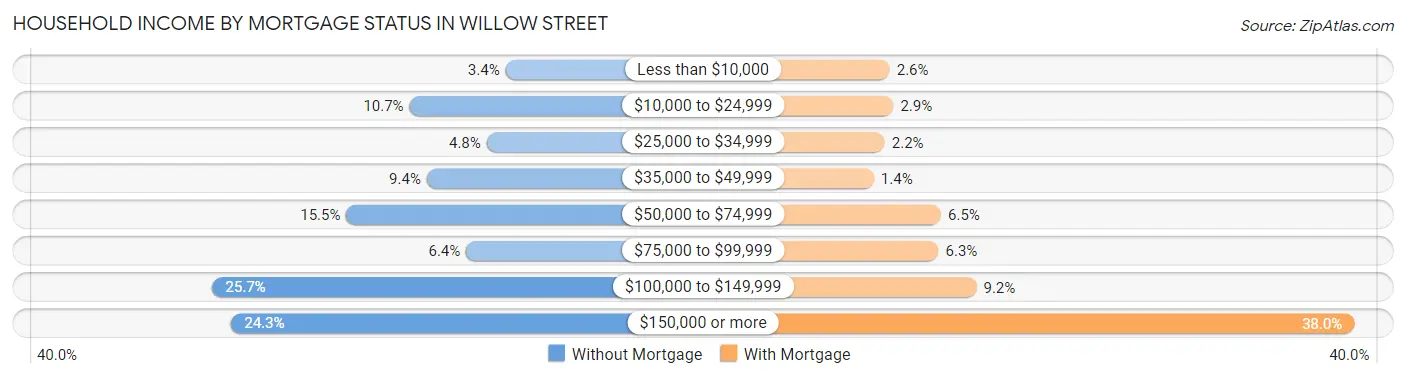
| Household Income | Without Mortgage | With Mortgage |
| Less than $10,000 | 28 (3.4%) | 28 (2.6%) |
| $10,000 to $24,999 | 89 (10.7%) | 31 (2.9%) |
| $25,000 to $34,999 | 40 (4.8%) | 24 (2.2%) |
| $35,000 to $49,999 | 78 (9.4%) | 15 (1.4%) |
| $50,000 to $74,999 | 129 (15.5%) | 70 (6.5%) |
| $75,000 to $99,999 | 53 (6.4%) | 68 (6.3%) |
| $100,000 to $149,999 | 214 (25.7%) | 99 (9.2%) |
| $150,000 or more | 202 (24.2%) | 408 (38.0%) |
| Total | 833 (100.0%) | 1,074 (100.0%) |
Property Value to Household Income Ratio in Willow Street
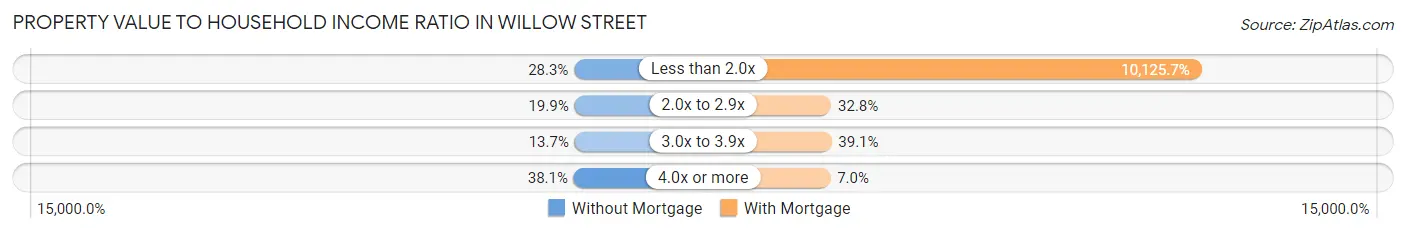
| Value-to-Income Ratio | Without Mortgage | With Mortgage |
| Less than 2.0x | 236 (28.3%) | 108,750 (10,125.7%) |
| 2.0x to 2.9x | 166 (19.9%) | 352 (32.8%) |
| 3.0x to 3.9x | 114 (13.7%) | 420 (39.1%) |
| 4.0x or more | 317 (38.1%) | 75 (7.0%) |
| Total | 833 (100.0%) | 1,074 (100.0%) |
Real Estate Taxes by Mortgage Status in Willow Street
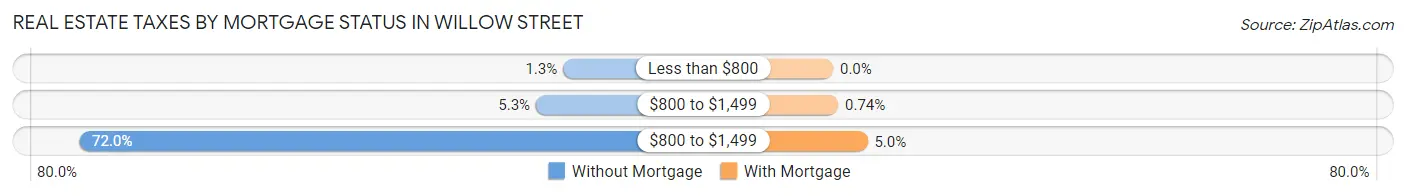
| Property Taxes | Without Mortgage | With Mortgage |
| Less than $800 | 11 (1.3%) | 0 (0.0%) |
| $800 to $1,499 | 44 (5.3%) | 8 (0.7%) |
| $800 to $1,499 | 600 (72.0%) | 54 (5.0%) |
| Total | 833 (100.0%) | 1,074 (100.0%) |
Health & Disability in Willow Street
Health Insurance Coverage by Age in Willow Street
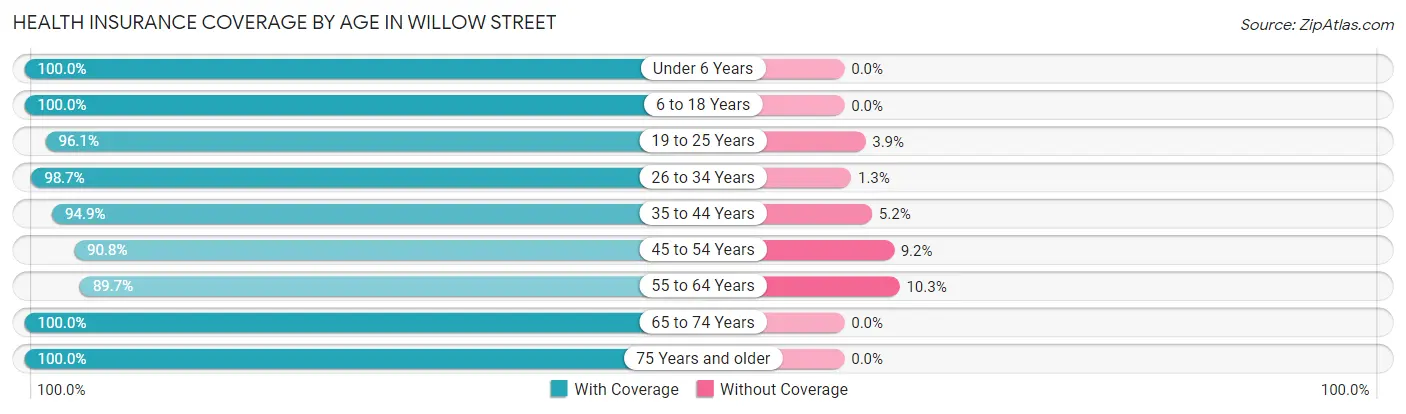
| Age Bracket | With Coverage | Without Coverage |
| Under 6 Years | 315 (100.0%) | 0 (0.0%) |
| 6 to 18 Years | 1,345 (100.0%) | 0 (0.0%) |
| 19 to 25 Years | 639 (96.1%) | 26 (3.9%) |
| 26 to 34 Years | 861 (98.7%) | 11 (1.3%) |
| 35 to 44 Years | 811 (94.9%) | 44 (5.1%) |
| 45 to 54 Years | 857 (90.8%) | 87 (9.2%) |
| 55 to 64 Years | 854 (89.7%) | 98 (10.3%) |
| 65 to 74 Years | 1,137 (100.0%) | 0 (0.0%) |
| 75 Years and older | 2,247 (100.0%) | 0 (0.0%) |
| Total | 9,066 (97.2%) | 266 (2.9%) |
Health Insurance Coverage by Citizenship Status in Willow Street
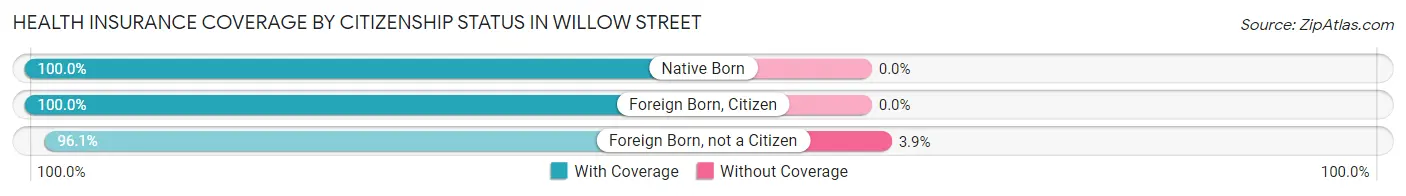
| Citizenship Status | With Coverage | Without Coverage |
| Native Born | 315 (100.0%) | 0 (0.0%) |
| Foreign Born, Citizen | 1,345 (100.0%) | 0 (0.0%) |
| Foreign Born, not a Citizen | 639 (96.1%) | 26 (3.9%) |
Health Insurance Coverage by Household Income in Willow Street
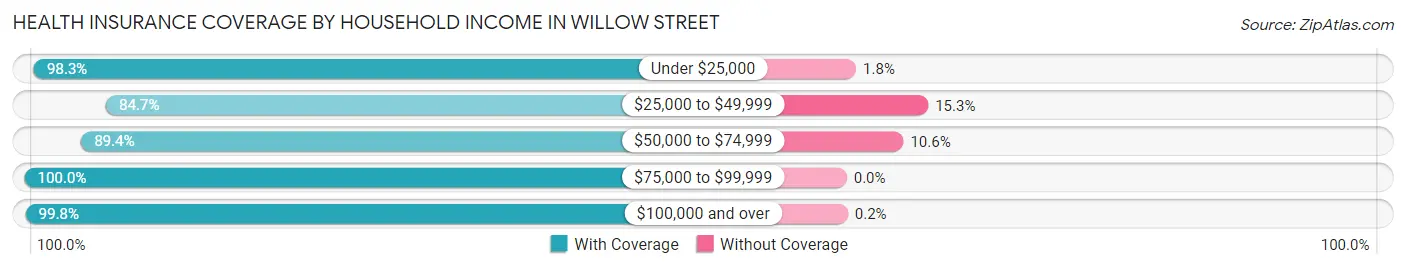
| Household Income | With Coverage | Without Coverage |
| Under $25,000 | 561 (98.3%) | 10 (1.8%) |
| $25,000 to $49,999 | 622 (84.7%) | 112 (15.3%) |
| $50,000 to $74,999 | 1,119 (89.4%) | 133 (10.6%) |
| $75,000 to $99,999 | 1,293 (100.0%) | 0 (0.0%) |
| $100,000 and over | 5,456 (99.8%) | 11 (0.2%) |
Public vs Private Health Insurance Coverage by Age in Willow Street
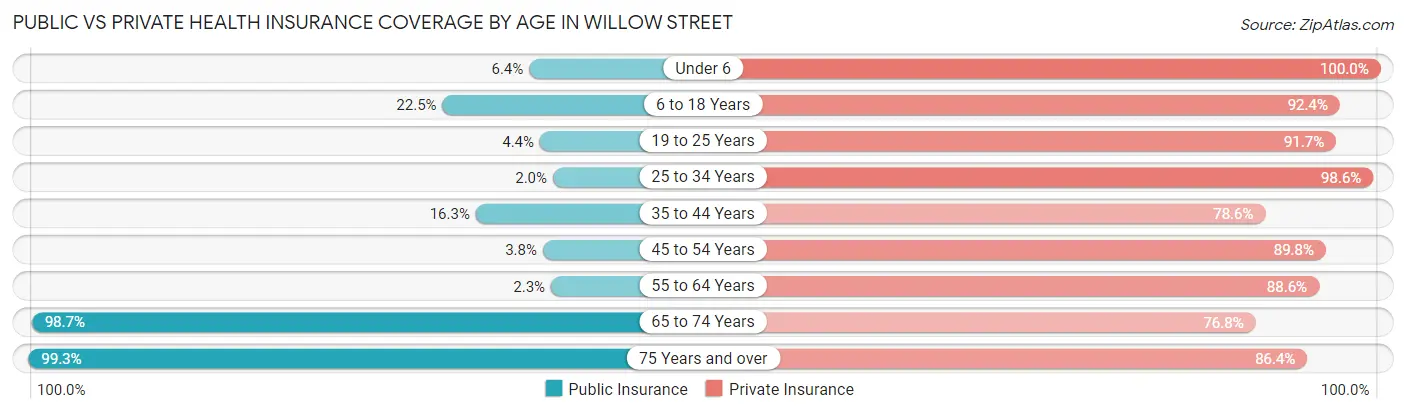
| Age Bracket | Public Insurance | Private Insurance |
| Under 6 | 20 (6.4%) | 315 (100.0%) |
| 6 to 18 Years | 302 (22.5%) | 1,243 (92.4%) |
| 19 to 25 Years | 29 (4.4%) | 610 (91.7%) |
| 25 to 34 Years | 17 (1.9%) | 860 (98.6%) |
| 35 to 44 Years | 139 (16.3%) | 672 (78.6%) |
| 45 to 54 Years | 36 (3.8%) | 848 (89.8%) |
| 55 to 64 Years | 22 (2.3%) | 843 (88.5%) |
| 65 to 74 Years | 1,122 (98.7%) | 873 (76.8%) |
| 75 Years and over | 2,231 (99.3%) | 1,941 (86.4%) |
| Total | 3,918 (42.0%) | 8,205 (87.9%) |
Disability Status by Sex by Age in Willow Street
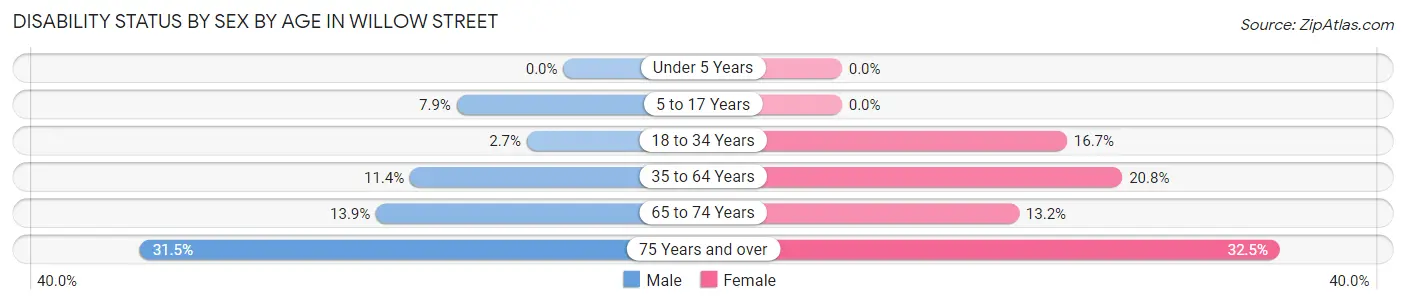
| Age Bracket | Male | Female |
| Under 5 Years | 0 (0.0%) | 0 (0.0%) |
| 5 to 17 Years | 50 (7.9%) | 0 (0.0%) |
| 18 to 34 Years | 21 (2.7%) | 143 (16.7%) |
| 35 to 64 Years | 143 (11.4%) | 311 (20.8%) |
| 65 to 74 Years | 83 (13.9%) | 71 (13.2%) |
| 75 Years and over | 318 (31.5%) | 402 (32.5%) |
Disability Class by Sex by Age in Willow Street
Disability Class: Hearing Difficulty
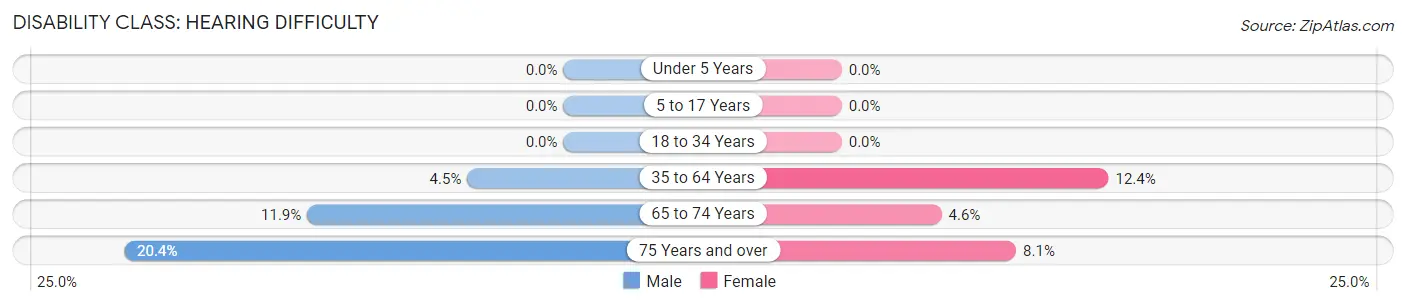
| Age Bracket | Male | Female |
| Under 5 Years | 0 (0.0%) | 0 (0.0%) |
| 5 to 17 Years | 0 (0.0%) | 0 (0.0%) |
| 18 to 34 Years | 0 (0.0%) | 0 (0.0%) |
| 35 to 64 Years | 56 (4.5%) | 185 (12.4%) |
| 65 to 74 Years | 71 (11.9%) | 25 (4.6%) |
| 75 Years and over | 206 (20.4%) | 100 (8.1%) |
Disability Class: Vision Difficulty
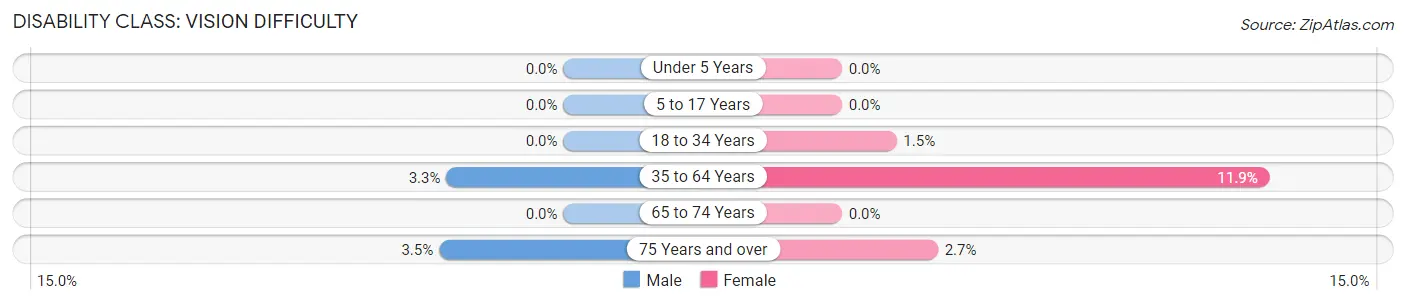
| Age Bracket | Male | Female |
| Under 5 Years | 0 (0.0%) | 0 (0.0%) |
| 5 to 17 Years | 0 (0.0%) | 0 (0.0%) |
| 18 to 34 Years | 0 (0.0%) | 13 (1.5%) |
| 35 to 64 Years | 41 (3.3%) | 178 (11.9%) |
| 65 to 74 Years | 0 (0.0%) | 0 (0.0%) |
| 75 Years and over | 35 (3.5%) | 33 (2.7%) |
Disability Class: Cognitive Difficulty
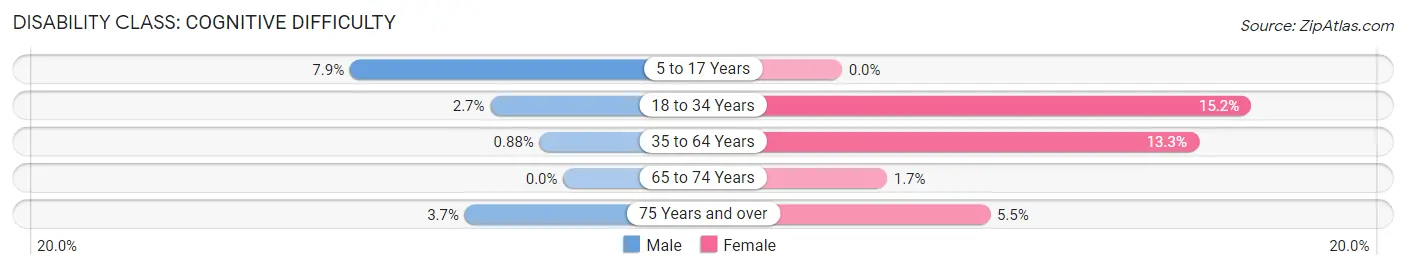
| Age Bracket | Male | Female |
| 5 to 17 Years | 50 (7.9%) | 0 (0.0%) |
| 18 to 34 Years | 21 (2.7%) | 130 (15.2%) |
| 35 to 64 Years | 11 (0.9%) | 198 (13.3%) |
| 65 to 74 Years | 0 (0.0%) | 9 (1.7%) |
| 75 Years and over | 37 (3.7%) | 68 (5.5%) |
Disability Class: Ambulatory Difficulty
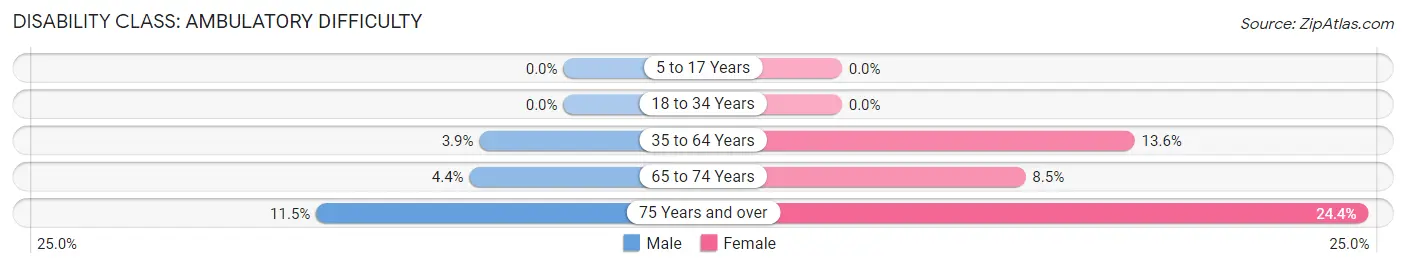
| Age Bracket | Male | Female |
| 5 to 17 Years | 0 (0.0%) | 0 (0.0%) |
| 18 to 34 Years | 0 (0.0%) | 0 (0.0%) |
| 35 to 64 Years | 49 (3.9%) | 203 (13.6%) |
| 65 to 74 Years | 26 (4.4%) | 46 (8.5%) |
| 75 Years and over | 116 (11.5%) | 302 (24.4%) |
Disability Class: Self-Care Difficulty
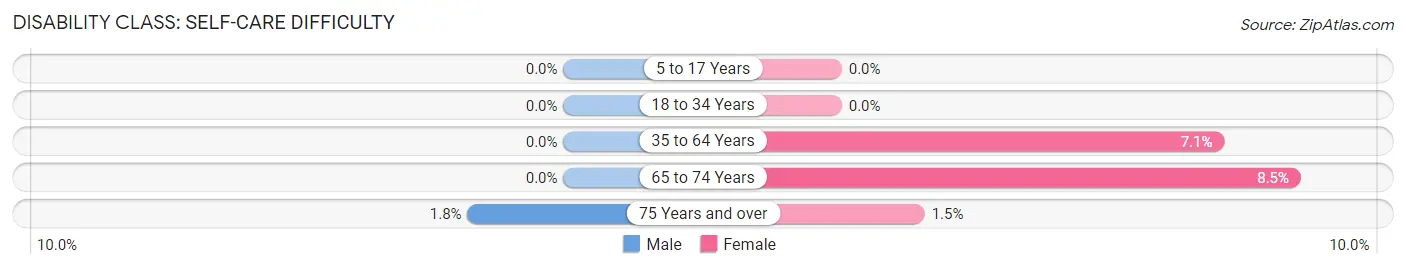
| Age Bracket | Male | Female |
| 5 to 17 Years | 0 (0.0%) | 0 (0.0%) |
| 18 to 34 Years | 0 (0.0%) | 0 (0.0%) |
| 35 to 64 Years | 0 (0.0%) | 106 (7.1%) |
| 65 to 74 Years | 0 (0.0%) | 46 (8.5%) |
| 75 Years and over | 18 (1.8%) | 19 (1.5%) |
Technology Access in Willow Street
Computing Device Access in Willow Street
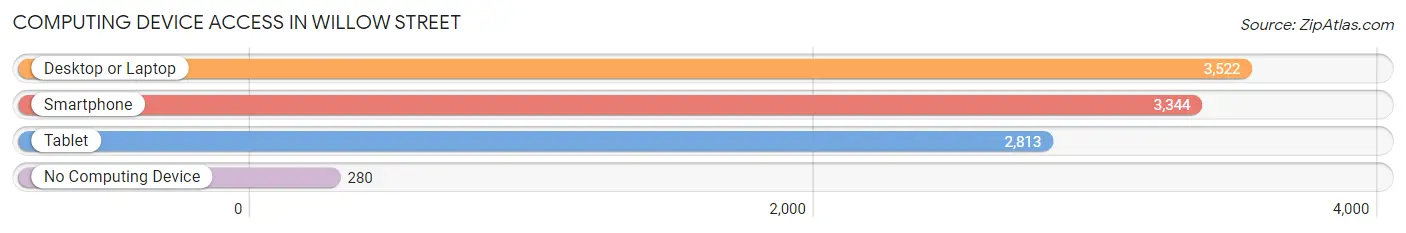
| Device Type | # Households | % Households |
| Desktop or Laptop | 3,522 | 84.4% |
| Smartphone | 3,344 | 80.1% |
| Tablet | 2,813 | 67.4% |
| No Computing Device | 280 | 6.7% |
| Total | 4,175 | 100.0% |
Internet Access in Willow Street
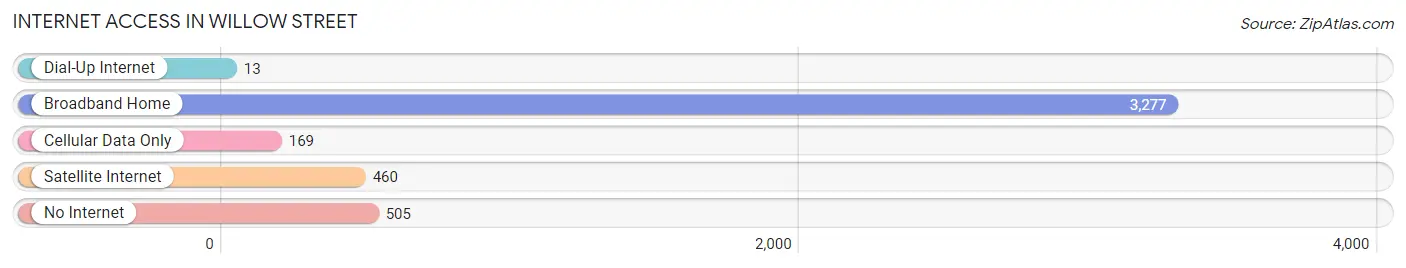
| Internet Type | # Households | % Households |
| Dial-Up Internet | 13 | 0.3% |
| Broadband Home | 3,277 | 78.5% |
| Cellular Data Only | 169 | 4.1% |
| Satellite Internet | 460 | 11.0% |
| No Internet | 505 | 12.1% |
| Total | 4,175 | 100.0% |
Willow Street Summary
Willow Street is a small borough located in Lancaster County, Pennsylvania. It is situated in the southeastern part of the county, approximately 8 miles east of the city of Lancaster. The population of Willow Street was 2,845 as of the 2010 census.
History
Willow Street was first settled in 1730 by a group of Mennonites from Germany. The town was originally known as “Willow Tree” and was later changed to “Willow Street” in 1820. The town was officially incorporated in 1845.
The town was originally a farming community, but in the late 19th century, it began to develop into a small industrial center. The town was home to several small factories, including a paper mill, a brickyard, and a sawmill. The town also had a railroad station, which connected it to the larger cities of Lancaster and Philadelphia.
Geography
Willow Street is located in southeastern Lancaster County, approximately 8 miles east of the city of Lancaster. The town is situated in a rural area, with rolling hills and farmland surrounding it. The town is located along the Conestoga River, which flows through the town and provides a source of recreation for the residents.
The town has a total area of 1.2 square miles, all of which is land. The town is located in the humid continental climate zone, with hot summers and cold winters. The average annual temperature is around 50 degrees Fahrenheit.
Economy
Willow Street’s economy is largely based on agriculture and small businesses. The town is home to several small businesses, including a grocery store, a hardware store, and a few restaurants. The town also has a few small manufacturing companies, including a paper mill and a brickyard.
The town is also home to a few small farms, which produce a variety of crops, including corn, soybeans, and wheat. The town also has a few small wineries, which produce a variety of wines.
Demographics
As of the 2010 census, the population of Willow Street was 2,845. The racial makeup of the town was 95.3% White, 1.2% African American, 0.3% Native American, 0.7% Asian, 0.1% Pacific Islander, and 2.4% from other races. The median household income was $50,945, and the median family income was $60,945.
The town is home to a variety of religious denominations, including Catholic, Lutheran, and Mennonite. The town also has a few small churches, including a Methodist church and a Presbyterian church.
Conclusion
Willow Street is a small borough located in southeastern Lancaster County, Pennsylvania. The town was first settled in 1730 by a group of Mennonites from Germany and was officially incorporated in 1845. The town has a total area of 1.2 square miles and is located along the Conestoga River. The town’s economy is largely based on agriculture and small businesses, and the population of Willow Street was 2,845 as of the 2010 census. The town is home to a variety of religious denominations and has a few small churches.
Common Questions
What is Per Capita Income in Willow Street?
Per Capita income in Willow Street is $53,525.
What is the Median Family Income in Willow Street?
Median Family Income in Willow Street is $107,696.
What is the Median Household income in Willow Street?
Median Household Income in Willow Street is $100,727.
What is Income or Wage Gap in Willow Street?
Income or Wage Gap in Willow Street is 48.8%.
Women in Willow Street earn 51.2 cents for every dollar earned by a man.
What is Family Income Deficit in Willow Street?
Family Income Deficit in Willow Street is $13,290.
Families that are below poverty line in Willow Street earn $13,290 less on average than the poverty threshold level.
What is Inequality or Gini Index in Willow Street?
Inequality or Gini Index in Willow Street is 0.43.
What is the Total Population of Willow Street?
Total Population of Willow Street is 9,640.
What is the Total Male Population of Willow Street?
Total Male Population of Willow Street is 4,485.
What is the Total Female Population of Willow Street?
Total Female Population of Willow Street is 5,155.
What is the Ratio of Males per 100 Females in Willow Street?
There are 87.00 Males per 100 Females in Willow Street.
What is the Ratio of Females per 100 Males in Willow Street?
There are 114.94 Females per 100 Males in Willow Street.
What is the Median Population Age in Willow Street?
Median Population Age in Willow Street is 52.8 Years.
What is the Average Family Size in Willow Street
Average Family Size in Willow Street is 2.8 People.
What is the Average Household Size in Willow Street
Average Household Size in Willow Street is 2.2 People.
How Large is the Labor Force in Willow Street?
There are 4,227 People in the Labor Forcein in Willow Street.
What is the Percentage of People in the Labor Force in Willow Street?
49.1% of People are in the Labor Force in Willow Street.
What is the Unemployment Rate in Willow Street?
Unemployment Rate in Willow Street is 1.9%.