Chapel Hill, NC Map & Demographics
Chapel Hill Map
Chapel Hill Overview
$47,631
PER CAPITA INCOME
$165,154
AVG FAMILY INCOME
$85,940
AVG HOUSEHOLD INCOME
30.0%
WAGE / INCOME GAP [ % ]
70.0¢/ $1
WAGE / INCOME GAP [ $ ]
$9,991
FAMILY INCOME DEFICIT
0.54
INEQUALITY / GINI INDEX
58,919
TOTAL POPULATION
27,817
MALE POPULATION
31,102
FEMALE POPULATION
89.44
MALES / 100 FEMALES
111.81
FEMALES / 100 MALES
25.6
MEDIAN AGE
3.0
AVG FAMILY SIZE
2.4
AVG HOUSEHOLD SIZE
29,645
LABOR FORCE [ PEOPLE ]
58.2%
PERCENT IN LABOR FORCE
4.7%
UNEMPLOYMENT RATE
Chapel Hill Area Codes
Income in Chapel Hill
Income Overview in Chapel Hill
Per Capita Income in Chapel Hill is $47,631, while median incomes of families and households are $165,154 and $85,940 respectively.
| Characteristic | Number | Measure |
| Per Capita Income | 58,919 | $47,631 |
| Median Family Income | 10,374 | $165,154 |
| Mean Family Income | 10,374 | $201,688 |
| Median Household Income | 19,965 | $85,940 |
| Mean Household Income | 19,965 | $137,301 |
| Income Deficit | 10,374 | $9,991 |
| Wage / Income Gap (%) | 58,919 | 29.96% |
| Wage / Income Gap ($) | 58,919 | 70.04¢ per $1 |
| Gini / Inequality Index | 58,919 | 0.54 |
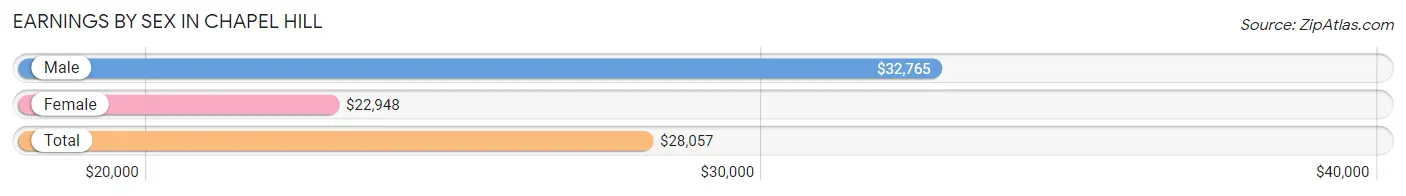
Earnings by Sex in Chapel Hill
Average Earnings in Chapel Hill are $28,057, $32,765 for men and $22,948 for women, a difference of 30.0%.
| Sex | Number | Average Earnings |
| Male | 17,209 (49.1%) | $32,765 |
| Female | 17,825 (50.9%) | $22,948 |
| Total | 35,034 (100.0%) | $28,057 |
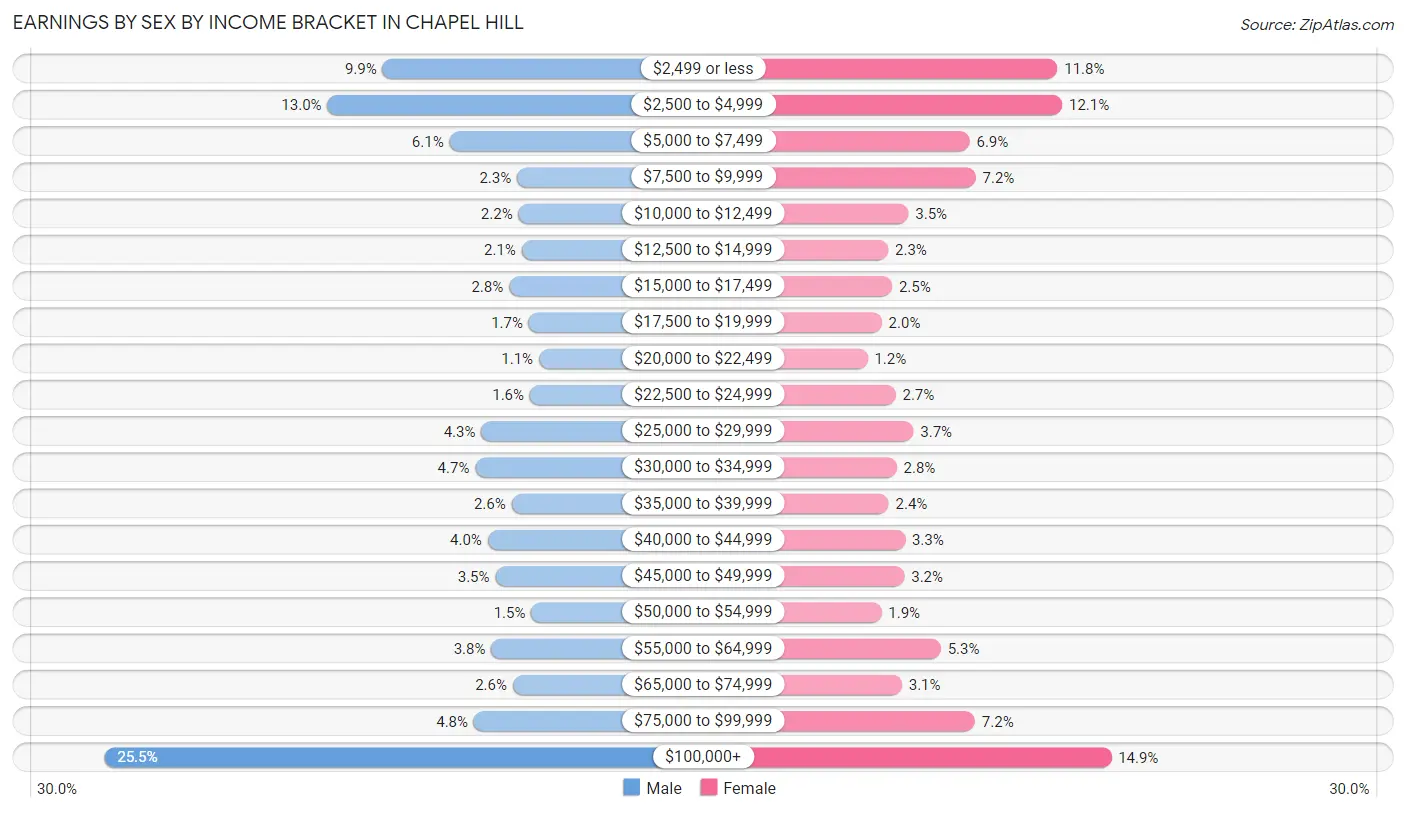
Earnings by Sex by Income Bracket in Chapel Hill
The most common earnings brackets in Chapel Hill are $100,000+ for men (4,392 | 25.5%) and $100,000+ for women (2,649 | 14.9%).
| Income | Male | Female |
| $2,499 or less | 1,701 (9.9%) | 2,108 (11.8%) |
| $2,500 to $4,999 | 2,234 (13.0%) | 2,156 (12.1%) |
| $5,000 to $7,499 | 1,054 (6.1%) | 1,230 (6.9%) |
| $7,500 to $9,999 | 400 (2.3%) | 1,291 (7.2%) |
| $10,000 to $12,499 | 386 (2.2%) | 617 (3.5%) |
| $12,500 to $14,999 | 354 (2.1%) | 414 (2.3%) |
| $15,000 to $17,499 | 476 (2.8%) | 453 (2.5%) |
| $17,500 to $19,999 | 285 (1.7%) | 350 (2.0%) |
| $20,000 to $22,499 | 188 (1.1%) | 206 (1.2%) |
| $22,500 to $24,999 | 276 (1.6%) | 488 (2.7%) |
| $25,000 to $29,999 | 746 (4.3%) | 666 (3.7%) |
| $30,000 to $34,999 | 804 (4.7%) | 499 (2.8%) |
| $35,000 to $39,999 | 453 (2.6%) | 419 (2.4%) |
| $40,000 to $44,999 | 683 (4.0%) | 583 (3.3%) |
| $45,000 to $49,999 | 609 (3.5%) | 576 (3.2%) |
| $50,000 to $54,999 | 261 (1.5%) | 345 (1.9%) |
| $55,000 to $64,999 | 649 (3.8%) | 942 (5.3%) |
| $65,000 to $74,999 | 440 (2.6%) | 550 (3.1%) |
| $75,000 to $99,999 | 818 (4.8%) | 1,283 (7.2%) |
| $100,000+ | 4,392 (25.5%) | 2,649 (14.9%) |
| Total | 17,209 (100.0%) | 17,825 (100.0%) |
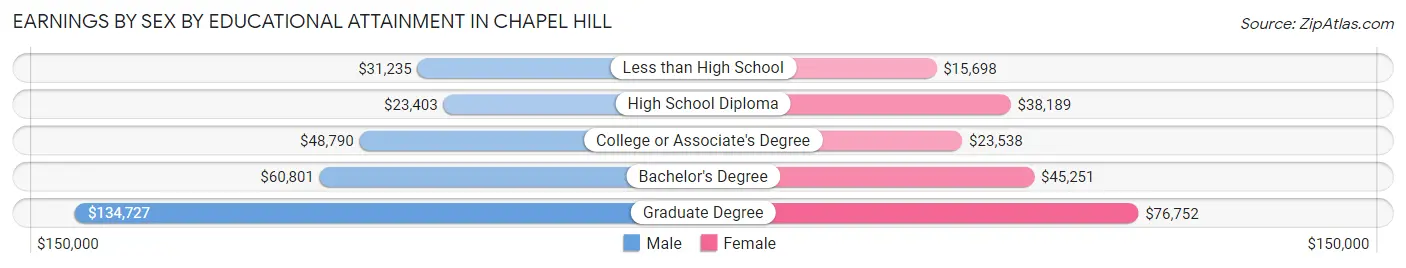
Earnings by Sex by Educational Attainment in Chapel Hill
Average earnings in Chapel Hill are $66,608 for men and $54,760 for women, a difference of 17.8%. Men with an educational attainment of graduate degree enjoy the highest average annual earnings of $134,727, while those with high school diploma education earn the least with $23,403. Women with an educational attainment of graduate degree earn the most with the average annual earnings of $76,752, while those with less than high school education have the smallest earnings of $15,698.
| Educational Attainment | Male Income | Female Income |
| Less than High School | $31,235 | $15,698 |
| High School Diploma | $23,403 | $38,189 |
| College or Associate's Degree | $48,790 | $23,538 |
| Bachelor's Degree | $60,801 | $45,251 |
| Graduate Degree | $134,727 | $76,752 |
| Total | $66,608 | $54,760 |
Family Income in Chapel Hill
Family Income Brackets in Chapel Hill
According to the Chapel Hill family income data, there are 4,160 families falling into the $200,000+ income range, which is the most common income bracket and makes up 40.1% of all families. Conversely, the $10,000 to $14,999 income bracket is the least frequent group with only 52 families (0.5%) belonging to this category.
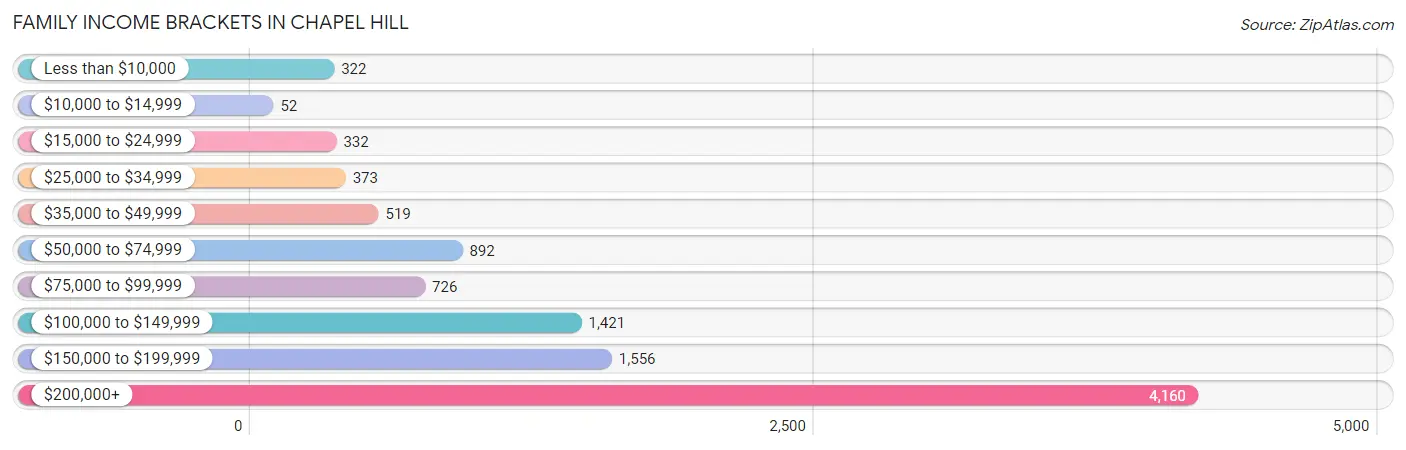
| Income Bracket | # Families | % Families |
| Less than $10,000 | 322 | 3.1% |
| $10,000 to $14,999 | 52 | 0.5% |
| $15,000 to $24,999 | 332 | 3.2% |
| $25,000 to $34,999 | 373 | 3.6% |
| $35,000 to $49,999 | 519 | 5.0% |
| $50,000 to $74,999 | 892 | 8.6% |
| $75,000 to $99,999 | 726 | 7.0% |
| $100,000 to $149,999 | 1,421 | 13.7% |
| $150,000 to $199,999 | 1,556 | 15.0% |
| $200,000+ | 4,160 | 40.1% |
Family Income by Famaliy Size in Chapel Hill
4-person families (2,372 | 22.9%) account for the highest median family income in Chapel Hill with $240,625 per family, while 2-person families (4,657 | 44.9%) have the highest median income of $63,154 per family member.
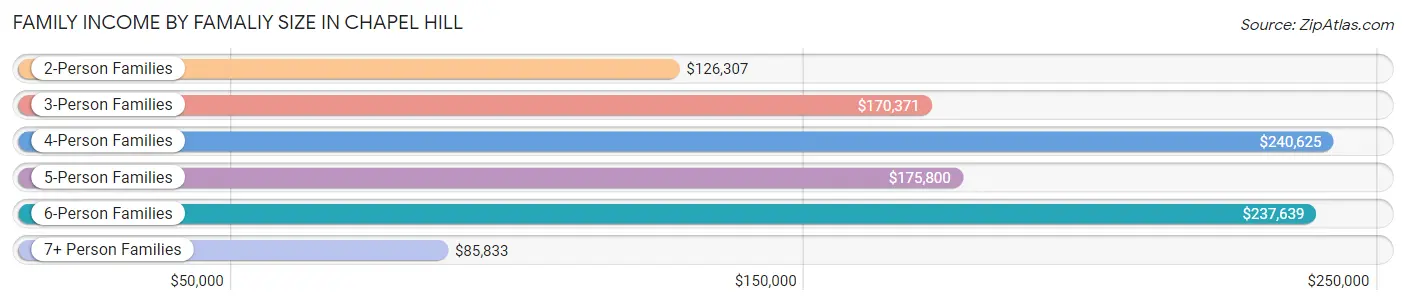
| Income Bracket | # Families | Median Income |
| 2-Person Families | 4,657 (44.9%) | $126,307 |
| 3-Person Families | 2,497 (24.1%) | $170,371 |
| 4-Person Families | 2,372 (22.9%) | $240,625 |
| 5-Person Families | 662 (6.4%) | $175,800 |
| 6-Person Families | 108 (1.0%) | $237,639 |
| 7+ Person Families | 78 (0.7%) | $85,833 |
| Total | 10,374 (100.0%) | $165,154 |
Family Income by Number of Earners in Chapel Hill
The median family income in Chapel Hill is $165,154, with families comprising 3+ earners (1,123) having the highest median family income of $242,529, while families with no earners (1,204) have the lowest median family income of $107,361, accounting for 10.8% and 11.6% of families, respectively.
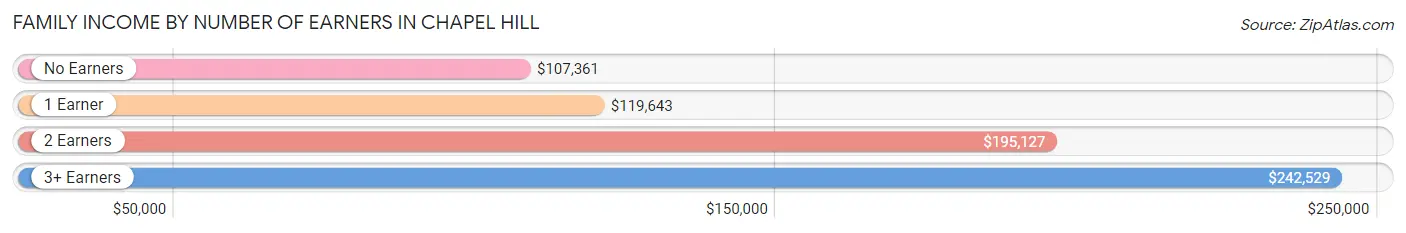
| Number of Earners | # Families | Median Income |
| No Earners | 1,204 (11.6%) | $107,361 |
| 1 Earner | 3,234 (31.2%) | $119,643 |
| 2 Earners | 4,813 (46.4%) | $195,127 |
| 3+ Earners | 1,123 (10.8%) | $242,529 |
| Total | 10,374 (100.0%) | $165,154 |
Household Income in Chapel Hill
Household Income Brackets in Chapel Hill
With 4,652 households falling in the category, the $200,000+ income range is the most frequent in Chapel Hill, accounting for 23.3% of all households. In contrast, only 559 households (2.8%) fall into the $10,000 to $14,999 income bracket, making it the least populous group.
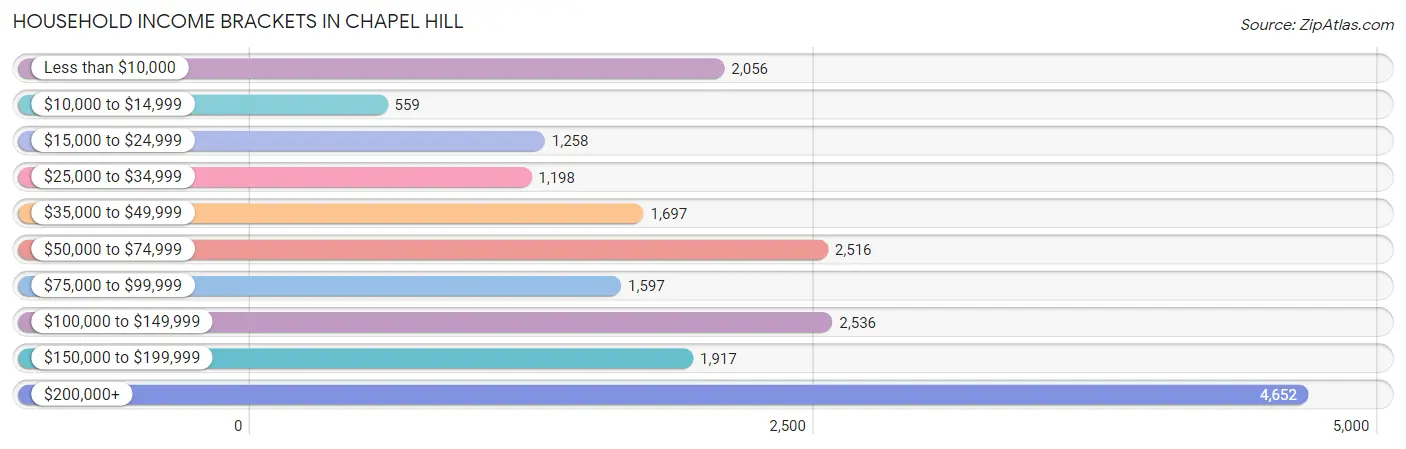
| Income Bracket | # Households | % Households |
| Less than $10,000 | 2,056 | 10.3% |
| $10,000 to $14,999 | 559 | 2.8% |
| $15,000 to $24,999 | 1,258 | 6.3% |
| $25,000 to $34,999 | 1,198 | 6.0% |
| $35,000 to $49,999 | 1,697 | 8.5% |
| $50,000 to $74,999 | 2,516 | 12.6% |
| $75,000 to $99,999 | 1,597 | 8.0% |
| $100,000 to $149,999 | 2,536 | 12.7% |
| $150,000 to $199,999 | 1,917 | 9.6% |
| $200,000+ | 4,652 | 23.3% |
Household Income by Householder Age in Chapel Hill
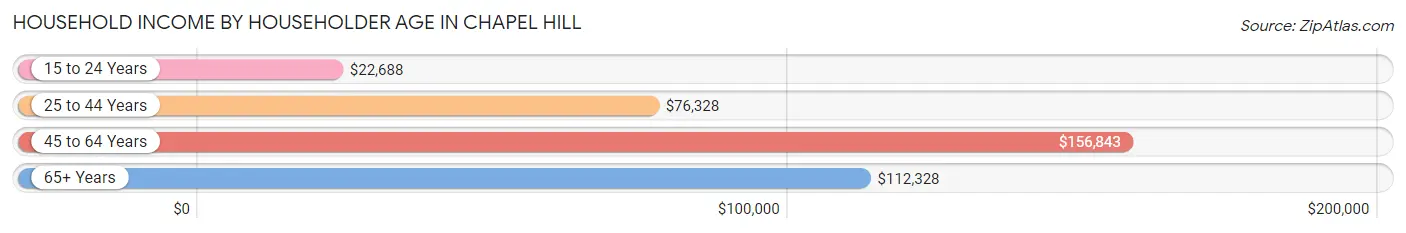
The median household income in Chapel Hill is $85,940, with the highest median household income of $156,843 found in the 45 to 64 years age bracket for the primary householder. A total of 6,184 households (31.0%) fall into this category. Meanwhile, the 15 to 24 years age bracket for the primary householder has the lowest median household income of $22,688, with 2,979 households (14.9%) in this group.
| Income Bracket | # Households | Median Income |
| 15 to 24 Years | 2,979 (14.9%) | $22,688 |
| 25 to 44 Years | 6,436 (32.2%) | $76,328 |
| 45 to 64 Years | 6,184 (31.0%) | $156,843 |
| 65+ Years | 4,366 (21.9%) | $112,328 |
| Total | 19,965 (100.0%) | $85,940 |
Poverty in Chapel Hill
Income Below Poverty by Sex and Age in Chapel Hill
With 14.5% poverty level for males and 22.4% for females among the residents of Chapel Hill, 18 to 24 year old males and 18 to 24 year old females are the most vulnerable to poverty, with 1,852 males (48.0%) and 3,600 females (68.8%) in their respective age groups living below the poverty level.
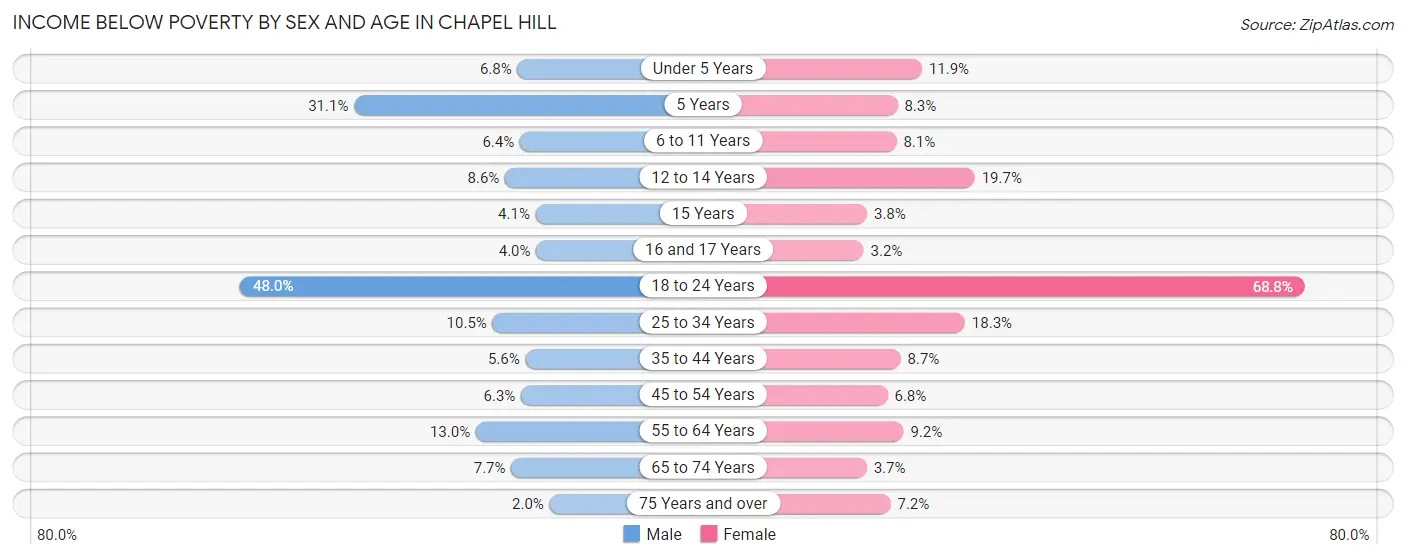
| Age Bracket | Male | Female |
| Under 5 Years | 78 (6.8%) | 94 (11.9%) |
| 5 Years | 68 (31.0%) | 11 (8.3%) |
| 6 to 11 Years | 111 (6.4%) | 94 (8.1%) |
| 12 to 14 Years | 101 (8.6%) | 201 (19.7%) |
| 15 Years | 10 (4.1%) | 12 (3.7%) |
| 16 and 17 Years | 37 (4.0%) | 16 (3.2%) |
| 18 to 24 Years | 1,852 (48.0%) | 3,600 (68.8%) |
| 25 to 34 Years | 349 (10.5%) | 677 (18.3%) |
| 35 to 44 Years | 144 (5.6%) | 229 (8.7%) |
| 45 to 54 Years | 173 (6.3%) | 225 (6.8%) |
| 55 to 64 Years | 304 (13.0%) | 203 (9.2%) |
| 65 to 74 Years | 130 (7.7%) | 83 (3.7%) |
| 75 Years and over | 27 (2.0%) | 119 (7.2%) |
| Total | 3,384 (14.5%) | 5,564 (22.4%) |
Income Above Poverty by Sex and Age in Chapel Hill
According to the poverty statistics in Chapel Hill, males aged 75 years and over and females aged 16 and 17 years are the age groups that are most secure financially, with 98.0% of males and 96.8% of females in these age groups living above the poverty line.
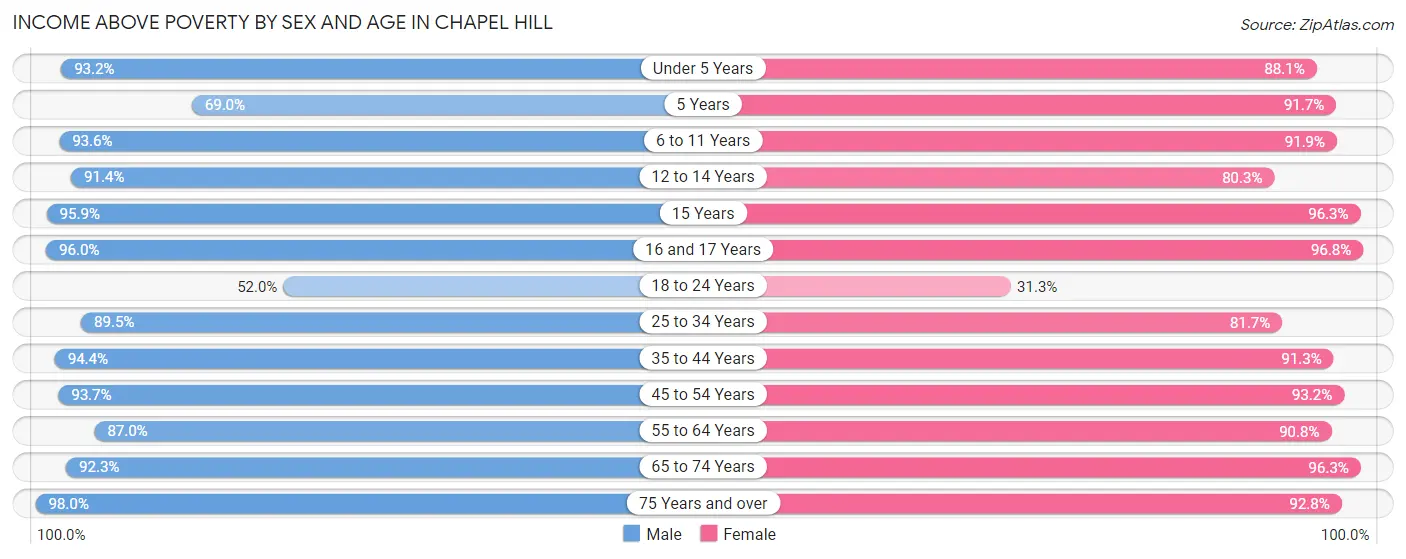
| Age Bracket | Male | Female |
| Under 5 Years | 1,069 (93.2%) | 696 (88.1%) |
| 5 Years | 151 (69.0%) | 122 (91.7%) |
| 6 to 11 Years | 1,614 (93.6%) | 1,063 (91.9%) |
| 12 to 14 Years | 1,068 (91.4%) | 817 (80.3%) |
| 15 Years | 234 (95.9%) | 308 (96.3%) |
| 16 and 17 Years | 886 (96.0%) | 478 (96.8%) |
| 18 to 24 Years | 2,006 (52.0%) | 1,636 (31.2%) |
| 25 to 34 Years | 2,974 (89.5%) | 3,027 (81.7%) |
| 35 to 44 Years | 2,422 (94.4%) | 2,393 (91.3%) |
| 45 to 54 Years | 2,591 (93.7%) | 3,088 (93.2%) |
| 55 to 64 Years | 2,040 (87.0%) | 2,013 (90.8%) |
| 65 to 74 Years | 1,553 (92.3%) | 2,161 (96.3%) |
| 75 Years and over | 1,300 (98.0%) | 1,524 (92.8%) |
| Total | 19,908 (85.5%) | 19,326 (77.6%) |
Income Below Poverty Among Married-Couple Families in Chapel Hill
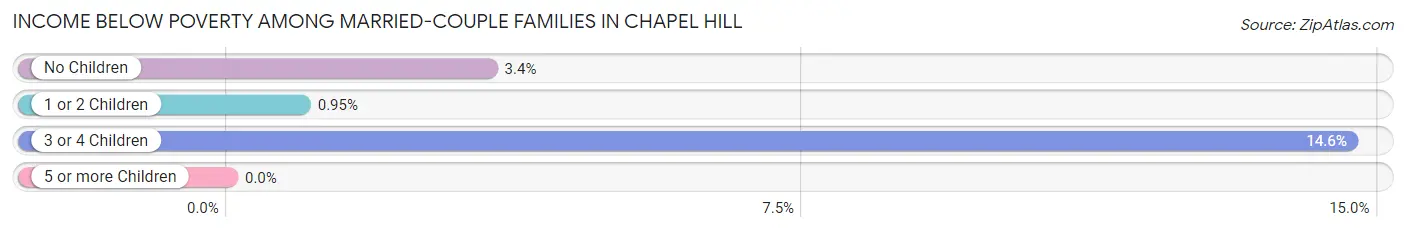
The poverty statistics for married-couple families in Chapel Hill show that 3.1% or 251 of the total 8,167 families live below the poverty line. Families with 3 or 4 children have the highest poverty rate of 14.6%, comprising of 78 families. On the other hand, families with 5 or more children have the lowest poverty rate of 0.0%, which includes 0 families.
| Children | Above Poverty | Below Poverty |
| No Children | 3,994 (96.6%) | 140 (3.4%) |
| 1 or 2 Children | 3,437 (99.1%) | 33 (0.9%) |
| 3 or 4 Children | 455 (85.4%) | 78 (14.6%) |
| 5 or more Children | 30 (100.0%) | 0 (0.0%) |
| Total | 7,916 (96.9%) | 251 (3.1%) |
Income Below Poverty Among Single-Parent Households in Chapel Hill
According to the poverty data in Chapel Hill, 15.7% or 83 single-father households and 17.5% or 294 single-mother households are living below the poverty line. Among single-father households, those with 3 or 4 children have the highest poverty rate, with 13 households (37.1%) experiencing poverty. Likewise, among single-mother households, those with 1 or 2 children have the highest poverty rate, with 285 households (28.0%) falling below the poverty line.
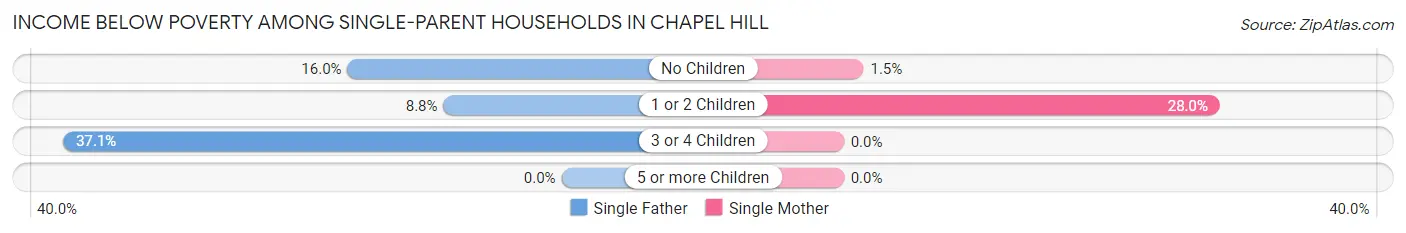
| Children | Single Father | Single Mother |
| No Children | 59 (16.0%) | 9 (1.5%) |
| 1 or 2 Children | 11 (8.8%) | 285 (28.0%) |
| 3 or 4 Children | 13 (37.1%) | 0 (0.0%) |
| 5 or more Children | 0 (0.0%) | 0 (0.0%) |
| Total | 83 (15.7%) | 294 (17.5%) |
Income Below Poverty Among Married-Couple vs Single-Parent Households in Chapel Hill
The poverty data for Chapel Hill shows that 251 of the married-couple family households (3.1%) and 377 of the single-parent households (17.1%) are living below the poverty level. Within the married-couple family households, those with 3 or 4 children have the highest poverty rate, with 78 households (14.6%) falling below the poverty line. Among the single-parent households, those with 1 or 2 children have the highest poverty rate, with 296 household (25.9%) living below poverty.
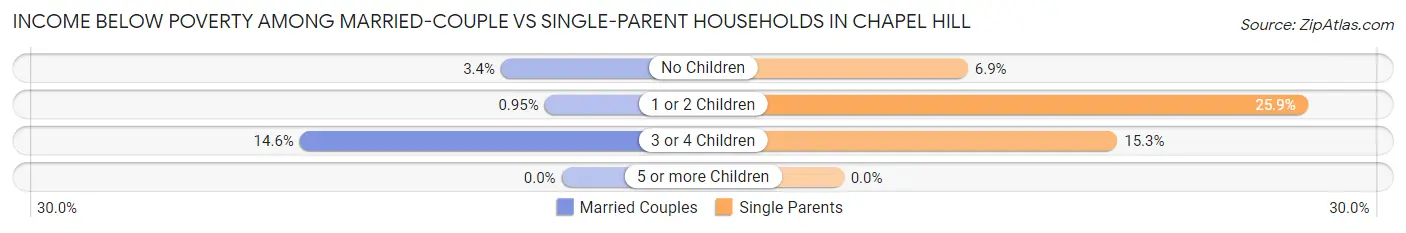
| Children | Married-Couple Families | Single-Parent Households |
| No Children | 140 (3.4%) | 68 (6.9%) |
| 1 or 2 Children | 33 (0.9%) | 296 (25.9%) |
| 3 or 4 Children | 78 (14.6%) | 13 (15.3%) |
| 5 or more Children | 0 (0.0%) | 0 (0.0%) |
| Total | 251 (3.1%) | 377 (17.1%) |
Race in Chapel Hill
The most populous races in Chapel Hill are White / Caucasian (40,055 | 68.0%), Asian (7,900 | 13.4%), and Black / African American (6,161 | 10.5%).
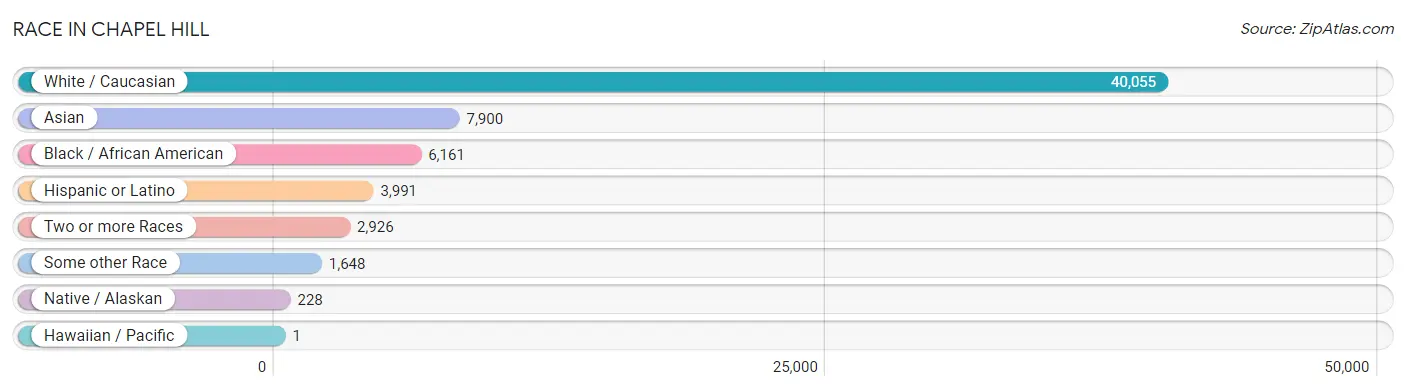
| Race | # Population | % Population |
| Asian | 7,900 | 13.4% |
| Black / African American | 6,161 | 10.5% |
| Hawaiian / Pacific | 1 | 0.0% |
| Hispanic or Latino | 3,991 | 6.8% |
| Native / Alaskan | 228 | 0.4% |
| White / Caucasian | 40,055 | 68.0% |
| Two or more Races | 2,926 | 5.0% |
| Some other Race | 1,648 | 2.8% |
| Total | 58,919 | 100.0% |
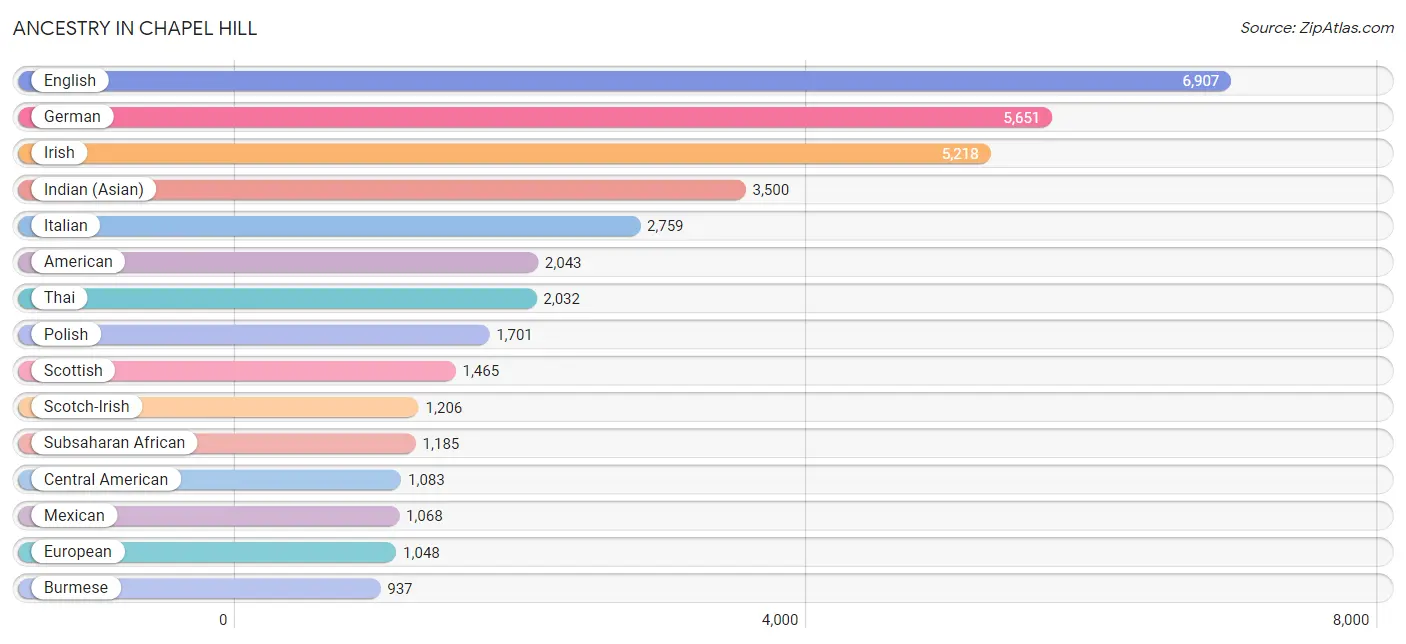
Ancestry in Chapel Hill
The most populous ancestries reported in Chapel Hill are English (6,907 | 11.7%), German (5,651 | 9.6%), Irish (5,218 | 8.9%), Indian (Asian) (3,500 | 5.9%), and Italian (2,759 | 4.7%), together accounting for 40.8% of all Chapel Hill residents.
| Ancestry | # Population | % Population |
| African | 647 | 1.1% |
| Albanian | 26 | 0.0% |
| American | 2,043 | 3.5% |
| Arab | 542 | 0.9% |
| Argentinean | 108 | 0.2% |
| Armenian | 16 | 0.0% |
| Assyrian / Chaldean / Syriac | 12 | 0.0% |
| Austrian | 145 | 0.3% |
| Barbadian | 5 | 0.0% |
| Belgian | 43 | 0.1% |
| Bhutanese | 333 | 0.6% |
| Bolivian | 28 | 0.1% |
| Brazilian | 105 | 0.2% |
| British | 710 | 1.2% |
| British West Indian | 53 | 0.1% |
| Bulgarian | 25 | 0.0% |
| Burmese | 937 | 1.6% |
| Cajun | 22 | 0.0% |
| Canadian | 157 | 0.3% |
| Carpatho Rusyn | 7 | 0.0% |
| Celtic | 5 | 0.0% |
| Central American | 1,083 | 1.8% |
| Cherokee | 283 | 0.5% |
| Chilean | 56 | 0.1% |
| Chippewa | 8 | 0.0% |
| Choctaw | 53 | 0.1% |
| Colombian | 141 | 0.2% |
| Costa Rican | 14 | 0.0% |
| Croatian | 83 | 0.1% |
| Cuban | 178 | 0.3% |
| Czech | 209 | 0.4% |
| Czechoslovakian | 55 | 0.1% |
| Danish | 178 | 0.3% |
| Dominican | 83 | 0.1% |
| Dutch | 383 | 0.6% |
| Eastern European | 366 | 0.6% |
| Ecuadorian | 52 | 0.1% |
| Egyptian | 123 | 0.2% |
| English | 6,907 | 11.7% |
| Estonian | 100 | 0.2% |
| Ethiopian | 137 | 0.2% |
| European | 1,048 | 1.8% |
| Filipino | 111 | 0.2% |
| Finnish | 156 | 0.3% |
| French | 901 | 1.5% |
| French Canadian | 244 | 0.4% |
| German | 5,651 | 9.6% |
| Ghanaian | 85 | 0.1% |
| Greek | 349 | 0.6% |
| Guatemalan | 640 | 1.1% |
| Guyanese | 4 | 0.0% |
| Haitian | 2 | 0.0% |
| Honduran | 365 | 0.6% |
| Hungarian | 359 | 0.6% |
| Indian (Asian) | 3,500 | 5.9% |
| Indonesian | 420 | 0.7% |
| Iranian | 76 | 0.1% |
| Irish | 5,218 | 8.9% |
| Israeli | 15 | 0.0% |
| Italian | 2,759 | 4.7% |
| Jamaican | 118 | 0.2% |
| Japanese | 75 | 0.1% |
| Kenyan | 74 | 0.1% |
| Korean | 310 | 0.5% |
| Lebanese | 170 | 0.3% |
| Lithuanian | 80 | 0.1% |
| Lumbee | 257 | 0.4% |
| Luxembourger | 9 | 0.0% |
| Macedonian | 38 | 0.1% |
| Malaysian | 15 | 0.0% |
| Maltese | 18 | 0.0% |
| Mexican | 1,068 | 1.8% |
| Mexican American Indian | 6 | 0.0% |
| Mongolian | 30 | 0.1% |
| Native Hawaiian | 17 | 0.0% |
| Navajo | 12 | 0.0% |
| Nigerian | 121 | 0.2% |
| Northern European | 282 | 0.5% |
| Norwegian | 422 | 0.7% |
| Pakistani | 11 | 0.0% |
| Palestinian | 63 | 0.1% |
| Panamanian | 26 | 0.0% |
| Peruvian | 13 | 0.0% |
| Polish | 1,701 | 2.9% |
| Portuguese | 117 | 0.2% |
| Puerto Rican | 407 | 0.7% |
| Romanian | 50 | 0.1% |
| Russian | 702 | 1.2% |
| Salvadoran | 38 | 0.1% |
| Samoan | 53 | 0.1% |
| Scandinavian | 98 | 0.2% |
| Scotch-Irish | 1,206 | 2.1% |
| Scottish | 1,465 | 2.5% |
| Serbian | 52 | 0.1% |
| Slavic | 45 | 0.1% |
| Slovak | 243 | 0.4% |
| Slovene | 44 | 0.1% |
| South African | 107 | 0.2% |
| South American | 478 | 0.8% |
| South American Indian | 6 | 0.0% |
| Spaniard | 54 | 0.1% |
| Spanish | 176 | 0.3% |
| Sri Lankan | 187 | 0.3% |
| Subsaharan African | 1,185 | 2.0% |
| Swedish | 529 | 0.9% |
| Swiss | 149 | 0.3% |
| Syrian | 17 | 0.0% |
| Thai | 2,032 | 3.5% |
| Trinidadian and Tobagonian | 9 | 0.0% |
| Turkish | 244 | 0.4% |
| Ugandan | 6 | 0.0% |
| Ukrainian | 268 | 0.4% |
| Uruguayan | 7 | 0.0% |
| Venezuelan | 73 | 0.1% |
| Welsh | 380 | 0.6% |
| West Indian | 28 | 0.1% |
| Yugoslavian | 31 | 0.1% | View All 117 Rows |
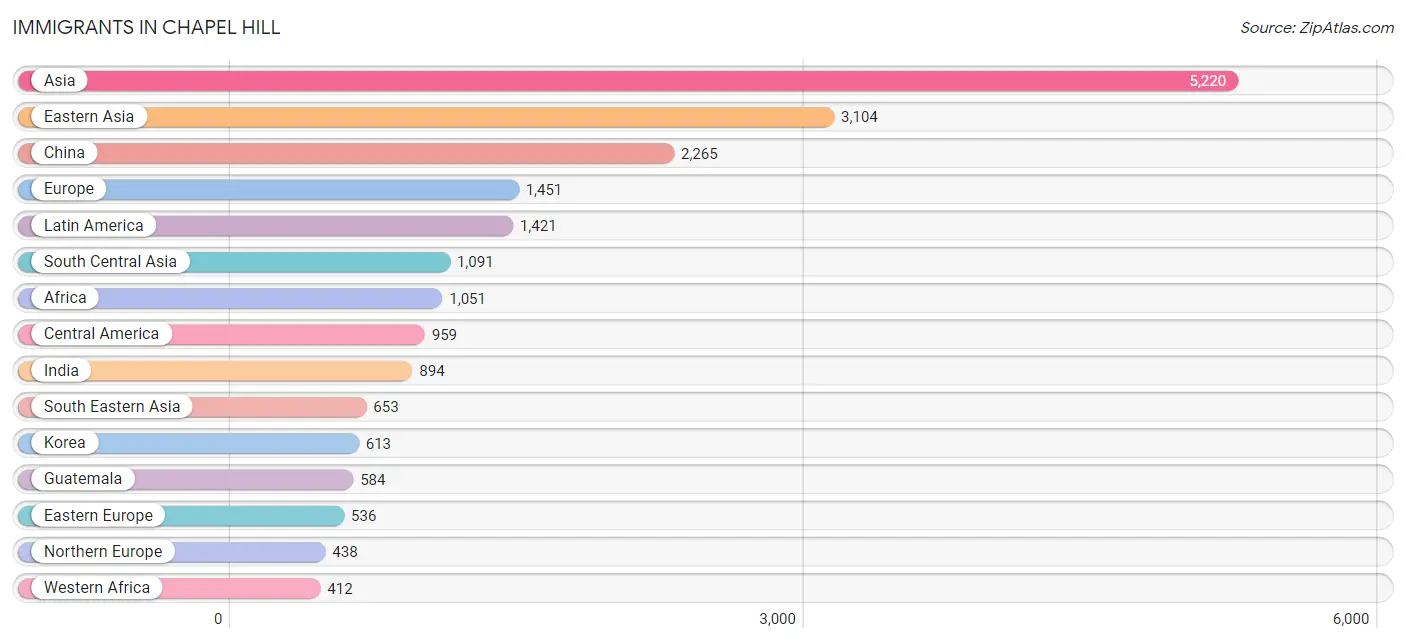
Immigrants in Chapel Hill
The most numerous immigrant groups reported in Chapel Hill came from Asia (5,220 | 8.9%), Eastern Asia (3,104 | 5.3%), China (2,265 | 3.8%), Europe (1,451 | 2.5%), and Latin America (1,421 | 2.4%), together accounting for 22.8% of all Chapel Hill residents.
| Immigration Origin | # Population | % Population |
| Africa | 1,051 | 1.8% |
| Argentina | 68 | 0.1% |
| Armenia | 16 | 0.0% |
| Asia | 5,220 | 8.9% |
| Australia | 39 | 0.1% |
| Austria | 36 | 0.1% |
| Bahamas | 20 | 0.0% |
| Bangladesh | 7 | 0.0% |
| Belarus | 51 | 0.1% |
| Belgium | 13 | 0.0% |
| Brazil | 97 | 0.2% |
| Bulgaria | 26 | 0.0% |
| Cambodia | 4 | 0.0% |
| Cameroon | 18 | 0.0% |
| Canada | 232 | 0.4% |
| Caribbean | 88 | 0.2% |
| Central America | 959 | 1.6% |
| Chile | 26 | 0.0% |
| China | 2,265 | 3.8% |
| Colombia | 72 | 0.1% |
| Costa Rica | 14 | 0.0% |
| Croatia | 7 | 0.0% |
| Czechoslovakia | 6 | 0.0% |
| Dominican Republic | 8 | 0.0% |
| Eastern Africa | 274 | 0.5% |
| Eastern Asia | 3,104 | 5.3% |
| Eastern Europe | 536 | 0.9% |
| Ecuador | 39 | 0.1% |
| Egypt | 235 | 0.4% |
| England | 118 | 0.2% |
| Eritrea | 33 | 0.1% |
| Ethiopia | 41 | 0.1% |
| Europe | 1,451 | 2.5% |
| France | 71 | 0.1% |
| Germany | 87 | 0.2% |
| Ghana | 60 | 0.1% |
| Greece | 22 | 0.0% |
| Guatemala | 584 | 1.0% |
| Honduras | 38 | 0.1% |
| Hong Kong | 23 | 0.0% |
| Hungary | 52 | 0.1% |
| India | 894 | 1.5% |
| Iran | 24 | 0.0% |
| Iraq | 8 | 0.0% |
| Ireland | 44 | 0.1% |
| Israel | 8 | 0.0% |
| Italy | 154 | 0.3% |
| Jamaica | 51 | 0.1% |
| Japan | 226 | 0.4% |
| Kenya | 151 | 0.3% |
| Korea | 613 | 1.0% |
| Kuwait | 11 | 0.0% |
| Latin America | 1,421 | 2.4% |
| Lebanon | 59 | 0.1% |
| Malaysia | 93 | 0.2% |
| Mexico | 323 | 0.5% |
| Middle Africa | 18 | 0.0% |
| Netherlands | 39 | 0.1% |
| Nigeria | 36 | 0.1% |
| Northern Africa | 239 | 0.4% |
| Northern Europe | 438 | 0.7% |
| Oceania | 39 | 0.1% |
| Pakistan | 130 | 0.2% |
| Philippines | 212 | 0.4% |
| Poland | 169 | 0.3% |
| Romania | 31 | 0.1% |
| Russia | 40 | 0.1% |
| Saudi Arabia | 6 | 0.0% |
| Scotland | 15 | 0.0% |
| Serbia | 18 | 0.0% |
| Sierra Leone | 316 | 0.5% |
| Singapore | 22 | 0.0% |
| South Africa | 98 | 0.2% |
| South America | 374 | 0.6% |
| South Central Asia | 1,091 | 1.8% |
| South Eastern Asia | 653 | 1.1% |
| Southern Europe | 199 | 0.3% |
| Spain | 23 | 0.0% |
| Sri Lanka | 34 | 0.1% |
| Switzerland | 32 | 0.1% |
| Taiwan | 153 | 0.3% |
| Thailand | 10 | 0.0% |
| Trinidad and Tobago | 9 | 0.0% |
| Turkey | 210 | 0.4% |
| Uganda | 6 | 0.0% |
| Ukraine | 53 | 0.1% |
| Uruguay | 7 | 0.0% |
| Uzbekistan | 2 | 0.0% |
| Venezuela | 37 | 0.1% |
| Vietnam | 96 | 0.2% |
| Western Africa | 412 | 0.7% |
| Western Asia | 328 | 0.6% |
| Western Europe | 278 | 0.5% | View All 93 Rows |
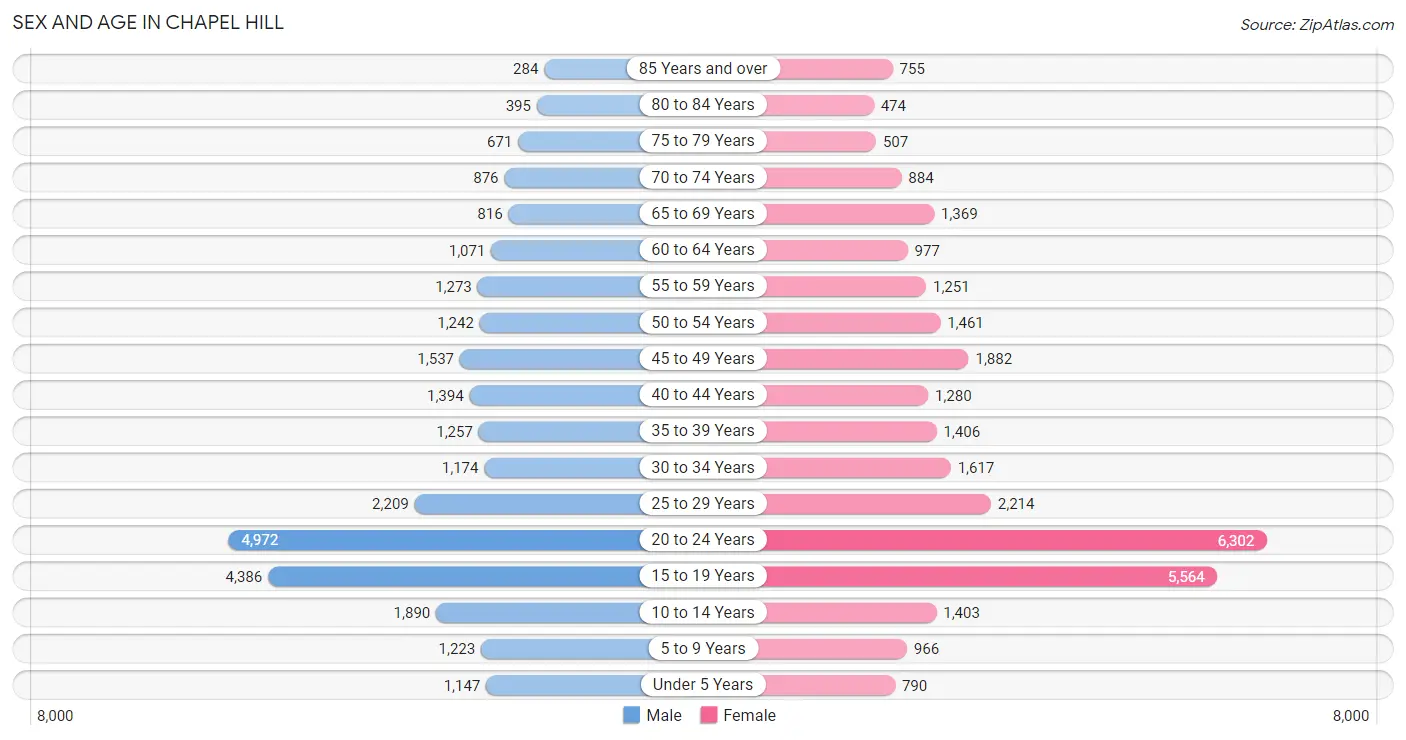
Sex and Age in Chapel Hill
Sex and Age in Chapel Hill
The most populous age groups in Chapel Hill are 20 to 24 Years (4,972 | 17.9%) for men and 20 to 24 Years (6,302 | 20.3%) for women.
| Age Bracket | Male | Female |
| Under 5 Years | 1,147 (4.1%) | 790 (2.5%) |
| 5 to 9 Years | 1,223 (4.4%) | 966 (3.1%) |
| 10 to 14 Years | 1,890 (6.8%) | 1,403 (4.5%) |
| 15 to 19 Years | 4,386 (15.8%) | 5,564 (17.9%) |
| 20 to 24 Years | 4,972 (17.9%) | 6,302 (20.3%) |
| 25 to 29 Years | 2,209 (7.9%) | 2,214 (7.1%) |
| 30 to 34 Years | 1,174 (4.2%) | 1,617 (5.2%) |
| 35 to 39 Years | 1,257 (4.5%) | 1,406 (4.5%) |
| 40 to 44 Years | 1,394 (5.0%) | 1,280 (4.1%) |
| 45 to 49 Years | 1,537 (5.5%) | 1,882 (6.0%) |
| 50 to 54 Years | 1,242 (4.5%) | 1,461 (4.7%) |
| 55 to 59 Years | 1,273 (4.6%) | 1,251 (4.0%) |
| 60 to 64 Years | 1,071 (3.8%) | 977 (3.1%) |
| 65 to 69 Years | 816 (2.9%) | 1,369 (4.4%) |
| 70 to 74 Years | 876 (3.2%) | 884 (2.8%) |
| 75 to 79 Years | 671 (2.4%) | 507 (1.6%) |
| 80 to 84 Years | 395 (1.4%) | 474 (1.5%) |
| 85 Years and over | 284 (1.0%) | 755 (2.4%) |
| Total | 27,817 (100.0%) | 31,102 (100.0%) |
Families and Households in Chapel Hill
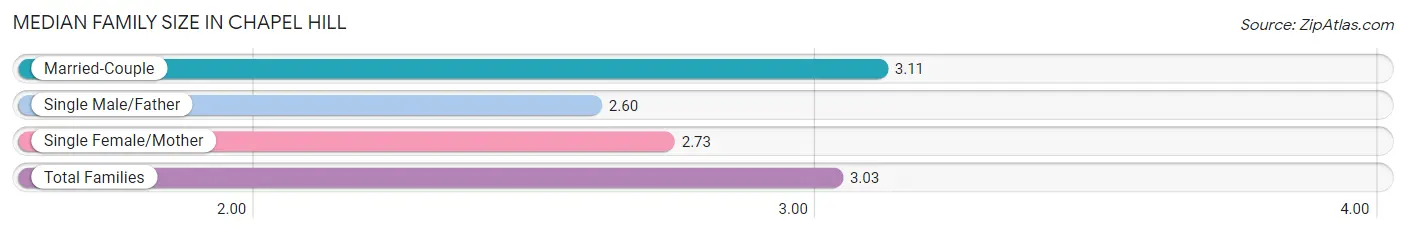
Median Family Size in Chapel Hill
The median family size in Chapel Hill is 3.03 persons per family, with married-couple families (8,167 | 78.7%) accounting for the largest median family size of 3.11 persons per family. On the other hand, single male/father families (530 | 5.1%) represent the smallest median family size with 2.60 persons per family.
| Family Type | # Families | Family Size |
| Married-Couple | 8,167 (78.7%) | 3.11 |
| Single Male/Father | 530 (5.1%) | 2.60 |
| Single Female/Mother | 1,677 (16.2%) | 2.73 |
| Total Families | 10,374 (100.0%) | 3.03 |
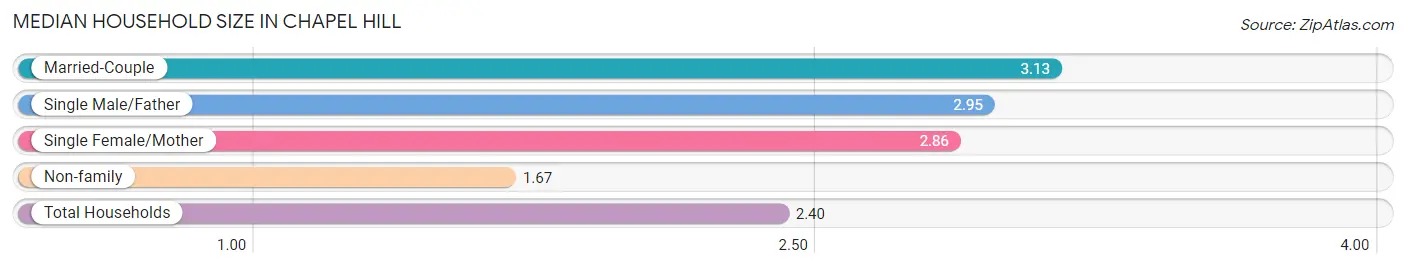
Median Household Size in Chapel Hill
The median household size in Chapel Hill is 2.40 persons per household, with married-couple households (8,167 | 40.9%) accounting for the largest median household size of 3.13 persons per household. non-family households (9,591 | 48.0%) represent the smallest median household size with 1.67 persons per household.
| Household Type | # Households | Household Size |
| Married-Couple | 8,167 (40.9%) | 3.13 |
| Single Male/Father | 530 (2.6%) | 2.95 |
| Single Female/Mother | 1,677 (8.4%) | 2.86 |
| Non-family | 9,591 (48.0%) | 1.67 |
| Total Households | 19,965 (100.0%) | 2.40 |
Household Size by Marriage Status in Chapel Hill
Out of a total of 19,965 households in Chapel Hill, 10,374 (52.0%) are family households, while 9,591 (48.0%) are nonfamily households. The most numerous type of family households are 2-person households, comprising 4,449, and the most common type of nonfamily households are 1-person households, comprising 6,204.
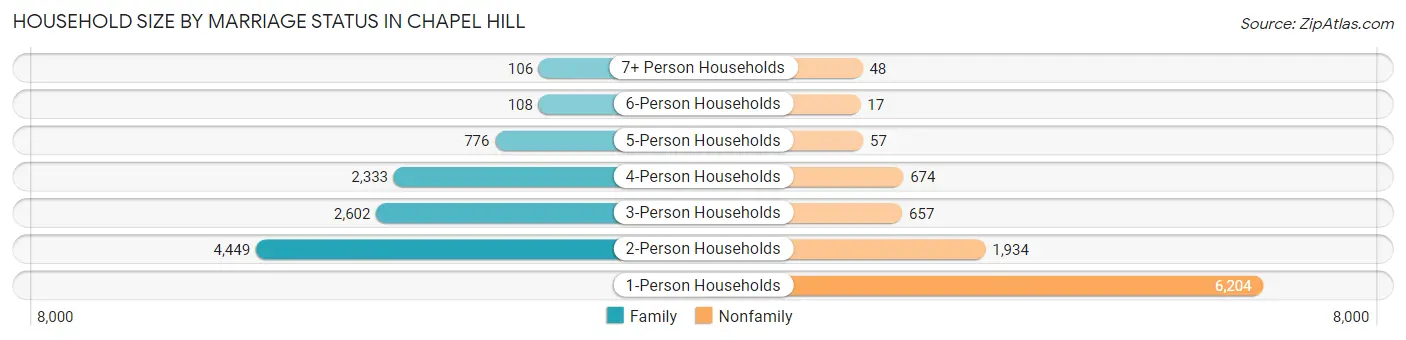
| Household Size | Family Households | Nonfamily Households |
| 1-Person Households | - | 6,204 (31.1%) |
| 2-Person Households | 4,449 (22.3%) | 1,934 (9.7%) |
| 3-Person Households | 2,602 (13.0%) | 657 (3.3%) |
| 4-Person Households | 2,333 (11.7%) | 674 (3.4%) |
| 5-Person Households | 776 (3.9%) | 57 (0.3%) |
| 6-Person Households | 108 (0.5%) | 17 (0.1%) |
| 7+ Person Households | 106 (0.5%) | 48 (0.2%) |
| Total | 10,374 (52.0%) | 9,591 (48.0%) |
Female Fertility in Chapel Hill
Fertility by Age in Chapel Hill
Average fertility rate in Chapel Hill is 10.0 births per 1,000 women. Women in the age bracket of 35 to 50 years have the highest fertility rate with 19.0 births per 1,000 women. Women in the age bracket of 20 to 34 years acount for 56.2% of all women with births.
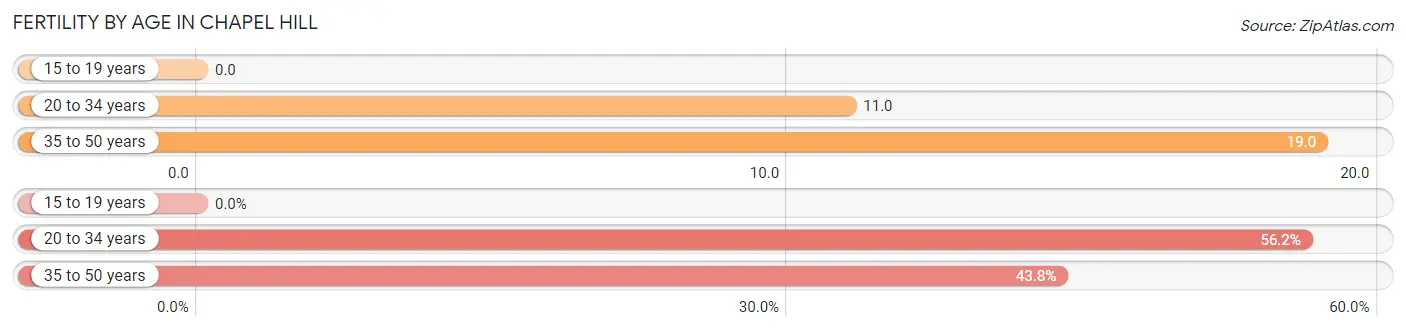
| Age Bracket | Women with Births | Births / 1,000 Women |
| 15 to 19 years | 0 (0.0%) | 0.0 |
| 20 to 34 years | 113 (56.2%) | 11.0 |
| 35 to 50 years | 88 (43.8%) | 19.0 |
| Total | 201 (100.0%) | 10.0 |
Fertility by Age by Marriage Status in Chapel Hill
97.0% of women with births (201) in Chapel Hill are married. The highest percentage of unmarried women with births falls into 20 to 34 years age bracket with 4.4% of them unmarried at the time of birth, while the lowest percentage of unmarried women with births belong to 35 to 50 years age bracket with 1.1% of them unmarried.
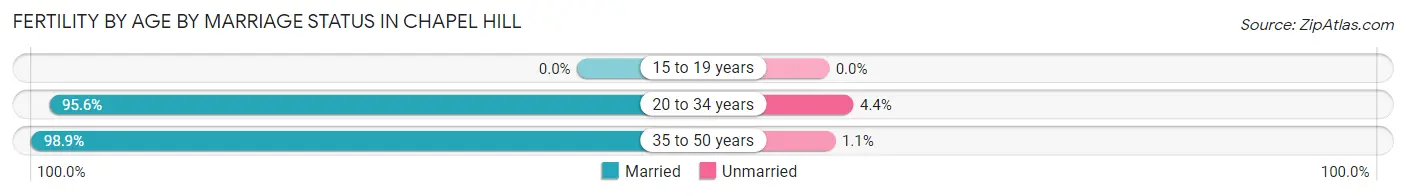
| Age Bracket | Married | Unmarried |
| 15 to 19 years | 0 (0.0%) | 0 (0.0%) |
| 20 to 34 years | 108 (95.6%) | 5 (4.4%) |
| 35 to 50 years | 87 (98.9%) | 1 (1.1%) |
| Total | 195 (97.0%) | 6 (3.0%) |
Fertility by Education in Chapel Hill
Average fertility rate in Chapel Hill is 10.0 births per 1,000 women. Women with the education attainment of graduate degree have the highest fertility rate of 25.0 births per 1,000 women, while women with the education attainment of high school diploma have the lowest fertility at 1.0 births per 1,000 women. Women with the education attainment of graduate degree represent 52.7% of all women with births.
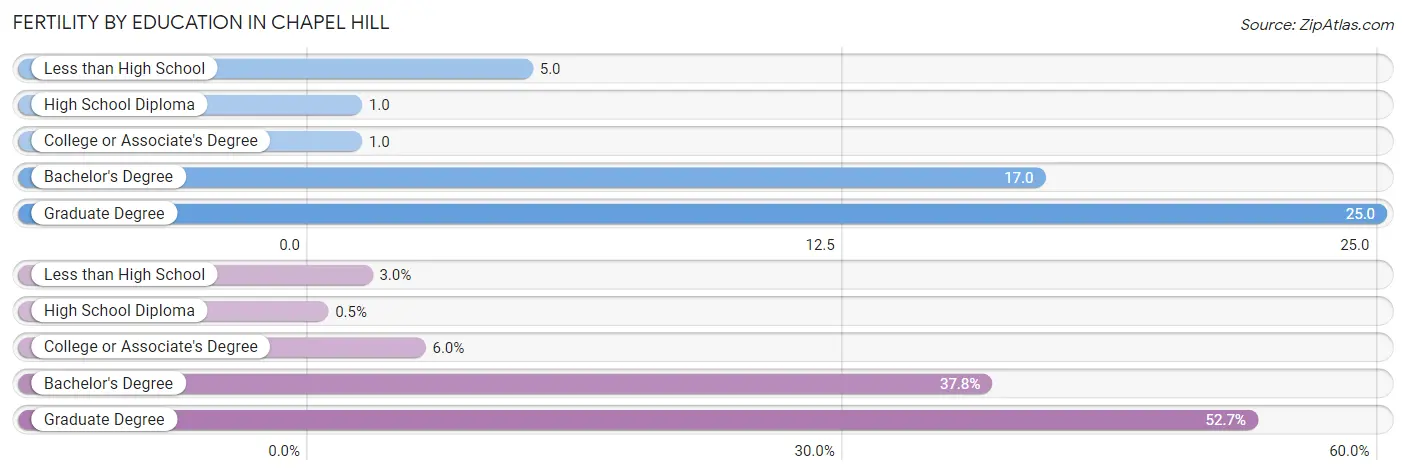
| Educational Attainment | Women with Births | Births / 1,000 Women |
| Less than High School | 6 (3.0%) | 5.0 |
| High School Diploma | 1 (0.5%) | 1.0 |
| College or Associate's Degree | 12 (6.0%) | 1.0 |
| Bachelor's Degree | 76 (37.8%) | 17.0 |
| Graduate Degree | 106 (52.7%) | 25.0 |
| Total | 201 (100.0%) | 10.0 |
Fertility by Education by Marriage Status in Chapel Hill
3.0% of women with births in Chapel Hill are unmarried. Women with the educational attainment of less than high school are most likely to be married with 100.0% of them married at childbirth, while women with the educational attainment of high school diploma are least likely to be married with 100.0% of them unmarried at childbirth.
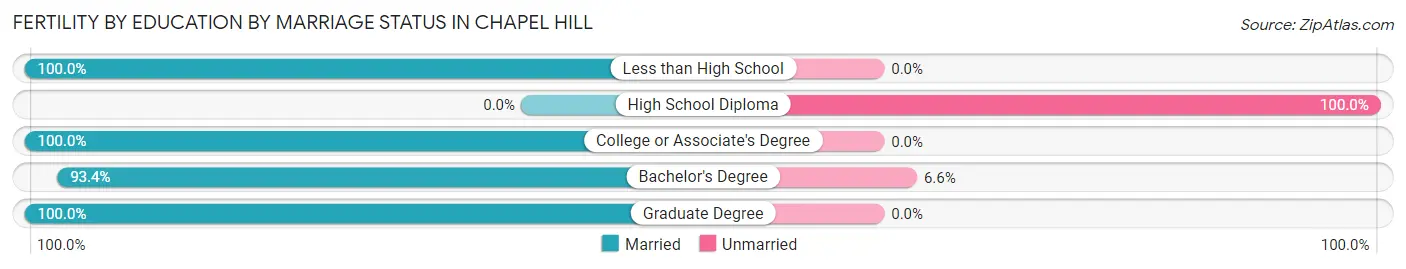
| Educational Attainment | Married | Unmarried |
| Less than High School | 6 (100.0%) | 0 (0.0%) |
| High School Diploma | 0 (0.0%) | 1 (100.0%) |
| College or Associate's Degree | 12 (100.0%) | 0 (0.0%) |
| Bachelor's Degree | 71 (93.4%) | 5 (6.6%) |
| Graduate Degree | 106 (100.0%) | 0 (0.0%) |
| Total | 195 (97.0%) | 6 (3.0%) |
Employment Characteristics in Chapel Hill
Employment by Class of Employer in Chapel Hill
Among the 26,769 employed individuals in Chapel Hill, private company employees (13,788 | 51.5%), state government employees (5,461 | 20.4%), and not-for-profit organizations (3,976 | 14.8%) make up the most common classes of employment.
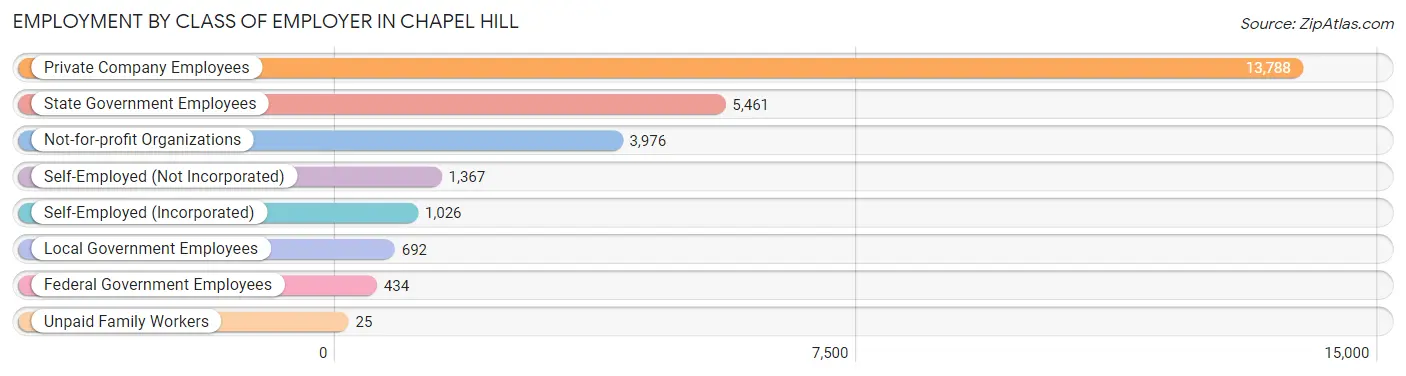
| Employer Class | # Employees | % Employees |
| Private Company Employees | 13,788 | 51.5% |
| Self-Employed (Incorporated) | 1,026 | 3.8% |
| Self-Employed (Not Incorporated) | 1,367 | 5.1% |
| Not-for-profit Organizations | 3,976 | 14.8% |
| Local Government Employees | 692 | 2.6% |
| State Government Employees | 5,461 | 20.4% |
| Federal Government Employees | 434 | 1.6% |
| Unpaid Family Workers | 25 | 0.1% |
| Total | 26,769 | 100.0% |
Employment Status by Age in Chapel Hill
According to the labor force statistics for Chapel Hill, out of the total population over 16 years of age (50,936), 58.2% or 29,645 individuals are in the labor force, with 4.7% or 1,393 of them unemployed. The age group with the highest labor force participation rate is 30 to 34 years, with 88.1% or 2,459 individuals in the labor force. Within the labor force, the 20 to 24 years age range has the highest percentage of unemployed individuals, with 10.4% or 630 of them being unemployed.
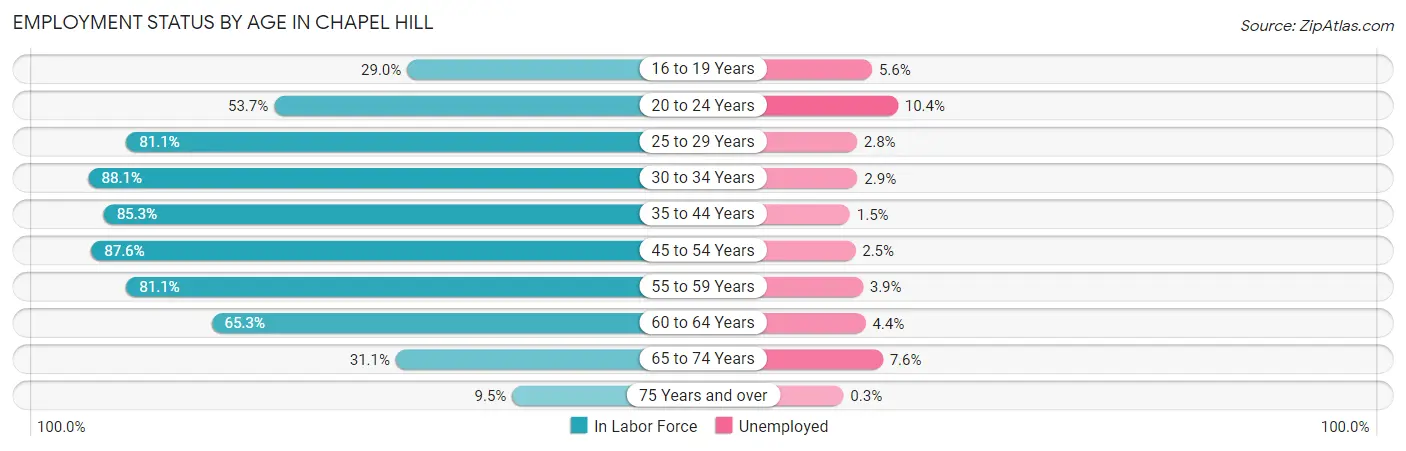
| Age Bracket | In Labor Force | Unemployed |
| 16 to 19 Years | 2,722 (29.0%) | 152 (5.6%) |
| 20 to 24 Years | 6,054 (53.7%) | 630 (10.4%) |
| 25 to 29 Years | 3,587 (81.1%) | 100 (2.8%) |
| 30 to 34 Years | 2,459 (88.1%) | 71 (2.9%) |
| 35 to 44 Years | 4,552 (85.3%) | 68 (1.5%) |
| 45 to 54 Years | 5,363 (87.6%) | 134 (2.5%) |
| 55 to 59 Years | 2,047 (81.1%) | 80 (3.9%) |
| 60 to 64 Years | 1,337 (65.3%) | 59 (4.4%) |
| 65 to 74 Years | 1,227 (31.1%) | 93 (7.6%) |
| 75 Years and over | 293 (9.5%) | 1 (0.3%) |
| Total | 29,645 (58.2%) | 1,393 (4.7%) |
Employment Status by Educational Attainment in Chapel Hill
According to labor force statistics for Chapel Hill, 83.2% of individuals (19,340) out of the total population between 25 and 64 years of age (23,245) are in the labor force, with 2.7% or 522 of them being unemployed. The group with the highest labor force participation rate are those with the educational attainment of bachelor's degree or higher, with 85.0% or 15,199 individuals in the labor force. Within the labor force, individuals with high school diploma education have the highest percentage of unemployment, with 7.9% or 85 of them being unemployed.
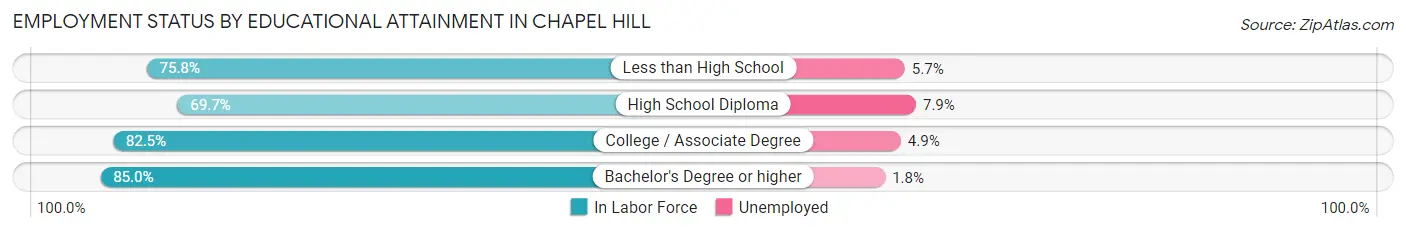
| Educational Attainment | In Labor Force | Unemployed |
| Less than High School | 775 (75.8%) | 58 (5.7%) |
| High School Diploma | 1,082 (69.7%) | 123 (7.9%) |
| College / Associate Degree | 2,301 (82.5%) | 137 (4.9%) |
| Bachelor's Degree or higher | 15,199 (85.0%) | 322 (1.8%) |
| Total | 19,340 (83.2%) | 628 (2.7%) |
Employment Occupations by Sex in Chapel Hill
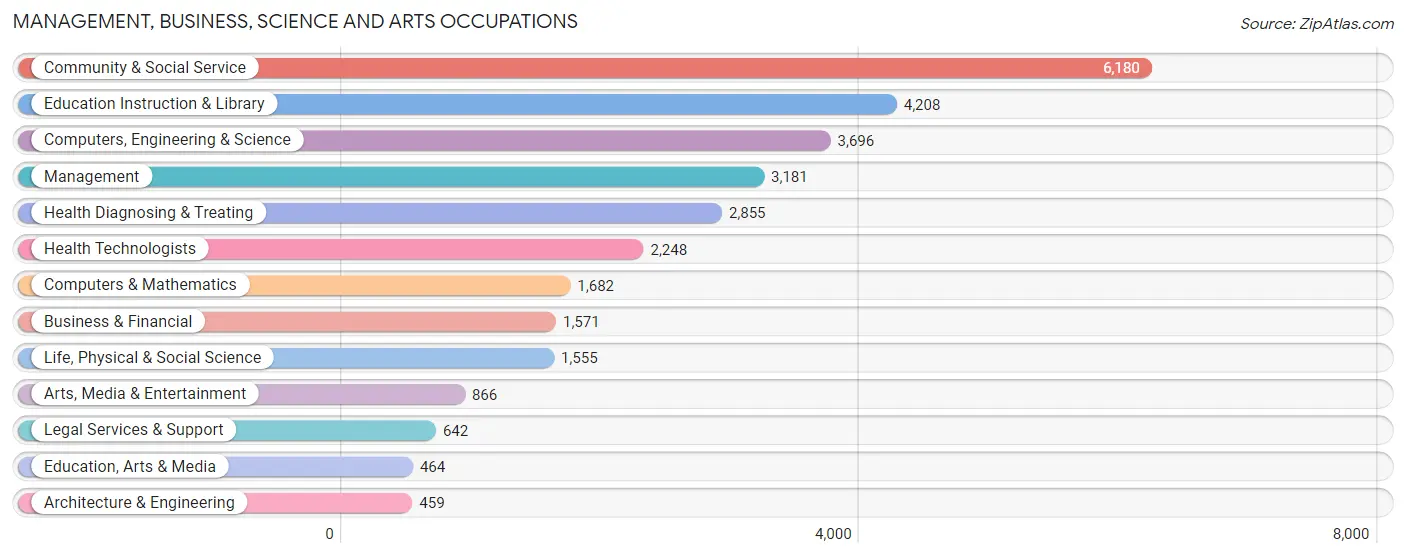
Management, Business, Science and Arts Occupations
The most common Management, Business, Science and Arts occupations in Chapel Hill are Community & Social Service (6,180 | 21.9%), Education Instruction & Library (4,208 | 14.9%), Computers, Engineering & Science (3,696 | 13.1%), Management (3,181 | 11.3%), and Health Diagnosing & Treating (2,855 | 10.1%).
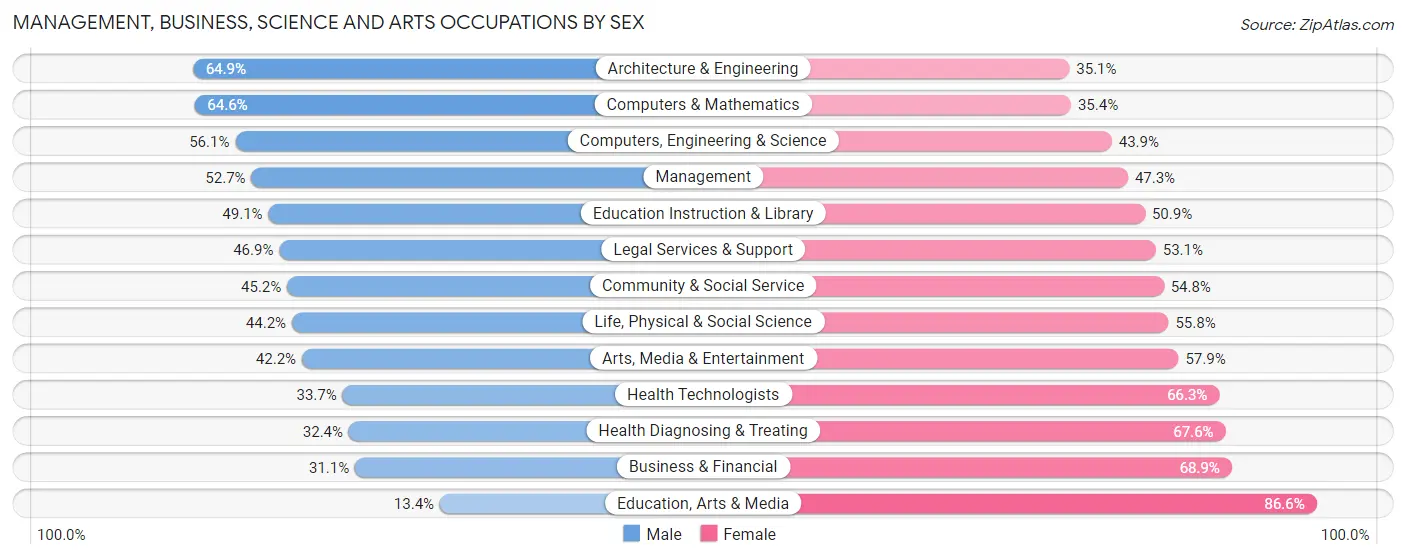
Management, Business, Science and Arts Occupations by Sex
Within the Management, Business, Science and Arts occupations in Chapel Hill, the most male-oriented occupations are Architecture & Engineering (64.9%), Computers & Mathematics (64.6%), and Computers, Engineering & Science (56.1%), while the most female-oriented occupations are Education, Arts & Media (86.6%), Business & Financial (68.9%), and Health Diagnosing & Treating (67.6%).
| Occupation | Male | Female |
| Management | 1,676 (52.7%) | 1,505 (47.3%) |
| Business & Financial | 488 (31.1%) | 1,083 (68.9%) |
| Computers, Engineering & Science | 2,072 (56.1%) | 1,624 (43.9%) |
| Computers & Mathematics | 1,086 (64.6%) | 596 (35.4%) |
| Architecture & Engineering | 298 (64.9%) | 161 (35.1%) |
| Life, Physical & Social Science | 688 (44.2%) | 867 (55.8%) |
| Community & Social Service | 2,796 (45.2%) | 3,384 (54.8%) |
| Education, Arts & Media | 62 (13.4%) | 402 (86.6%) |
| Legal Services & Support | 301 (46.9%) | 341 (53.1%) |
| Education Instruction & Library | 2,068 (49.1%) | 2,140 (50.9%) |
| Arts, Media & Entertainment | 365 (42.1%) | 501 (57.9%) |
| Health Diagnosing & Treating | 924 (32.4%) | 1,931 (67.6%) |
| Health Technologists | 757 (33.7%) | 1,491 (66.3%) |
| Total (Category) | 7,956 (45.5%) | 9,527 (54.5%) |
| Total (Overall) | 13,350 (47.3%) | 14,890 (52.7%) |
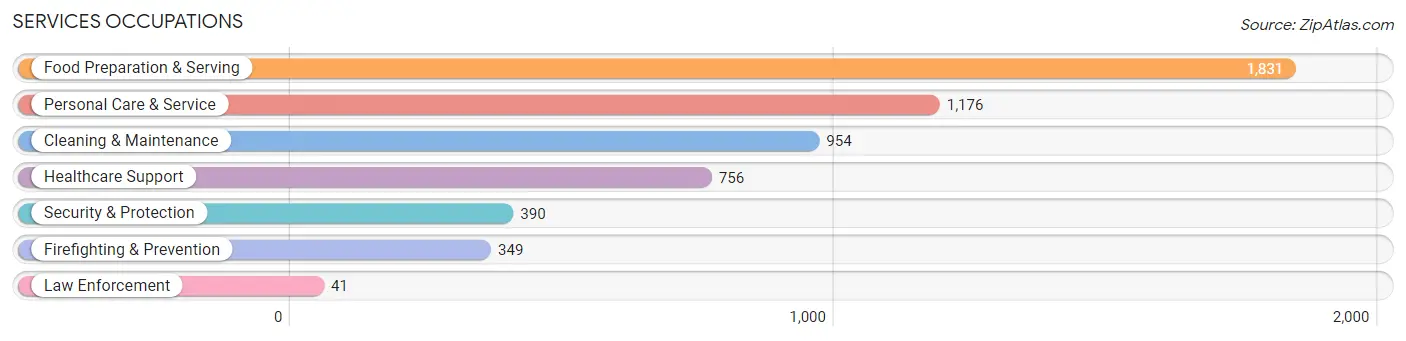
Services Occupations
The most common Services occupations in Chapel Hill are Food Preparation & Serving (1,831 | 6.5%), Personal Care & Service (1,176 | 4.2%), Cleaning & Maintenance (954 | 3.4%), Healthcare Support (756 | 2.7%), and Security & Protection (390 | 1.4%).
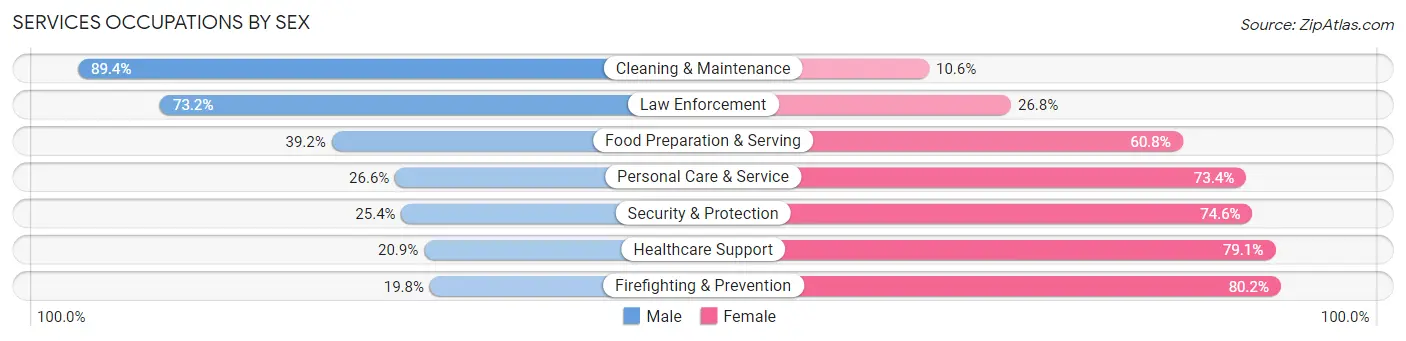
Services Occupations by Sex
Within the Services occupations in Chapel Hill, the most male-oriented occupations are Cleaning & Maintenance (89.4%), Law Enforcement (73.2%), and Food Preparation & Serving (39.2%), while the most female-oriented occupations are Firefighting & Prevention (80.2%), Healthcare Support (79.1%), and Security & Protection (74.6%).
| Occupation | Male | Female |
| Healthcare Support | 158 (20.9%) | 598 (79.1%) |
| Security & Protection | 99 (25.4%) | 291 (74.6%) |
| Firefighting & Prevention | 69 (19.8%) | 280 (80.2%) |
| Law Enforcement | 30 (73.2%) | 11 (26.8%) |
| Food Preparation & Serving | 718 (39.2%) | 1,113 (60.8%) |
| Cleaning & Maintenance | 853 (89.4%) | 101 (10.6%) |
| Personal Care & Service | 313 (26.6%) | 863 (73.4%) |
| Total (Category) | 2,141 (41.9%) | 2,966 (58.1%) |
| Total (Overall) | 13,350 (47.3%) | 14,890 (52.7%) |
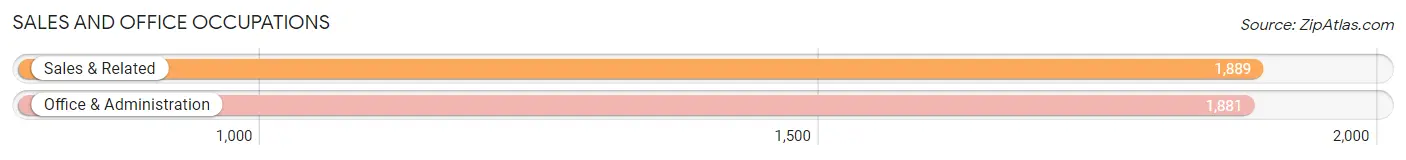
Sales and Office Occupations
The most common Sales and Office occupations in Chapel Hill are Sales & Related (1,889 | 6.7%), and Office & Administration (1,881 | 6.7%).
Sales and Office Occupations by Sex
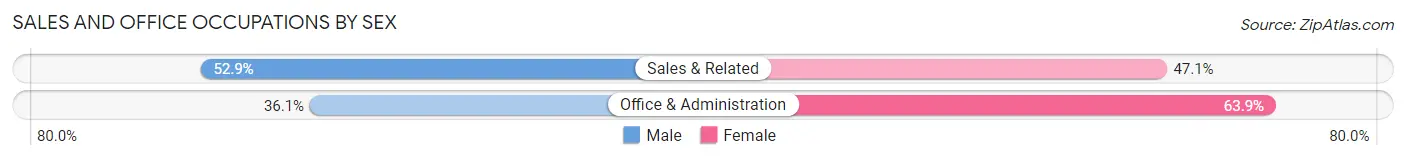
| Occupation | Male | Female |
| Sales & Related | 1,000 (52.9%) | 889 (47.1%) |
| Office & Administration | 679 (36.1%) | 1,202 (63.9%) |
| Total (Category) | 1,679 (44.5%) | 2,091 (55.5%) |
| Total (Overall) | 13,350 (47.3%) | 14,890 (52.7%) |
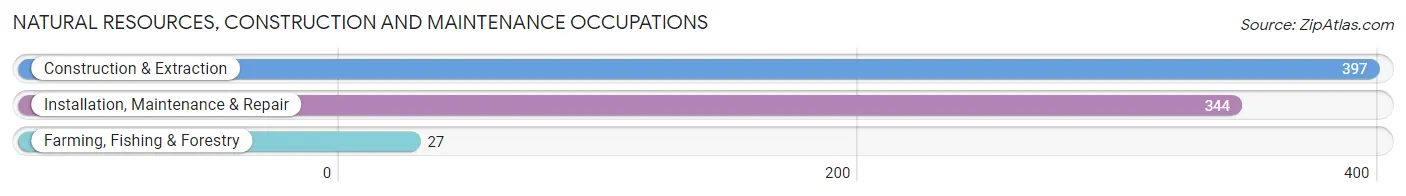
Natural Resources, Construction and Maintenance Occupations
The most common Natural Resources, Construction and Maintenance occupations in Chapel Hill are Construction & Extraction (397 | 1.4%), Installation, Maintenance & Repair (344 | 1.2%), and Farming, Fishing & Forestry (27 | 0.1%).
Natural Resources, Construction and Maintenance Occupations by Sex
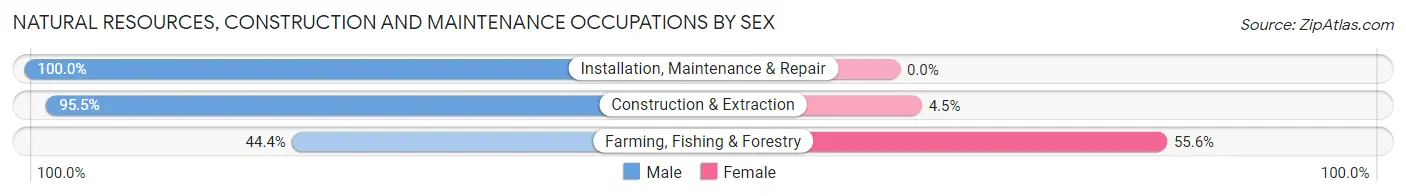
| Occupation | Male | Female |
| Farming, Fishing & Forestry | 12 (44.4%) | 15 (55.6%) |
| Construction & Extraction | 379 (95.5%) | 18 (4.5%) |
| Installation, Maintenance & Repair | 344 (100.0%) | 0 (0.0%) |
| Total (Category) | 735 (95.7%) | 33 (4.3%) |
| Total (Overall) | 13,350 (47.3%) | 14,890 (52.7%) |
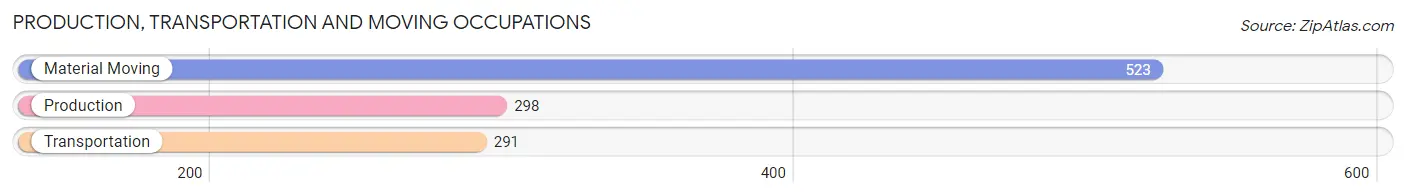
Production, Transportation and Moving Occupations
The most common Production, Transportation and Moving occupations in Chapel Hill are Material Moving (523 | 1.8%), Production (298 | 1.1%), and Transportation (291 | 1.0%).
Production, Transportation and Moving Occupations by Sex
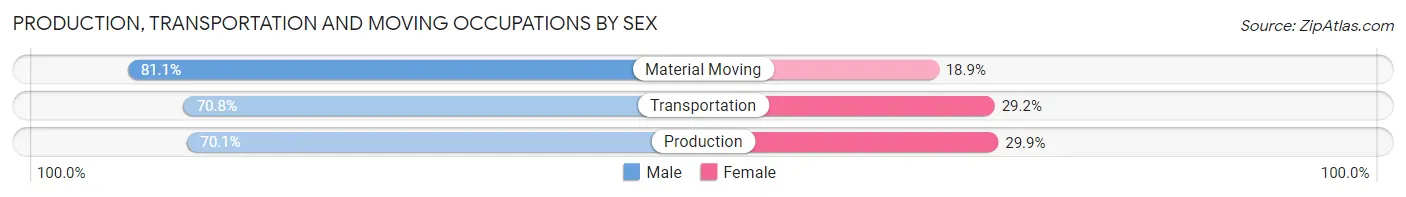
| Occupation | Male | Female |
| Production | 209 (70.1%) | 89 (29.9%) |
| Transportation | 206 (70.8%) | 85 (29.2%) |
| Material Moving | 424 (81.1%) | 99 (18.9%) |
| Total (Category) | 839 (75.4%) | 273 (24.5%) |
| Total (Overall) | 13,350 (47.3%) | 14,890 (52.7%) |
Employment Industries by Sex in Chapel Hill
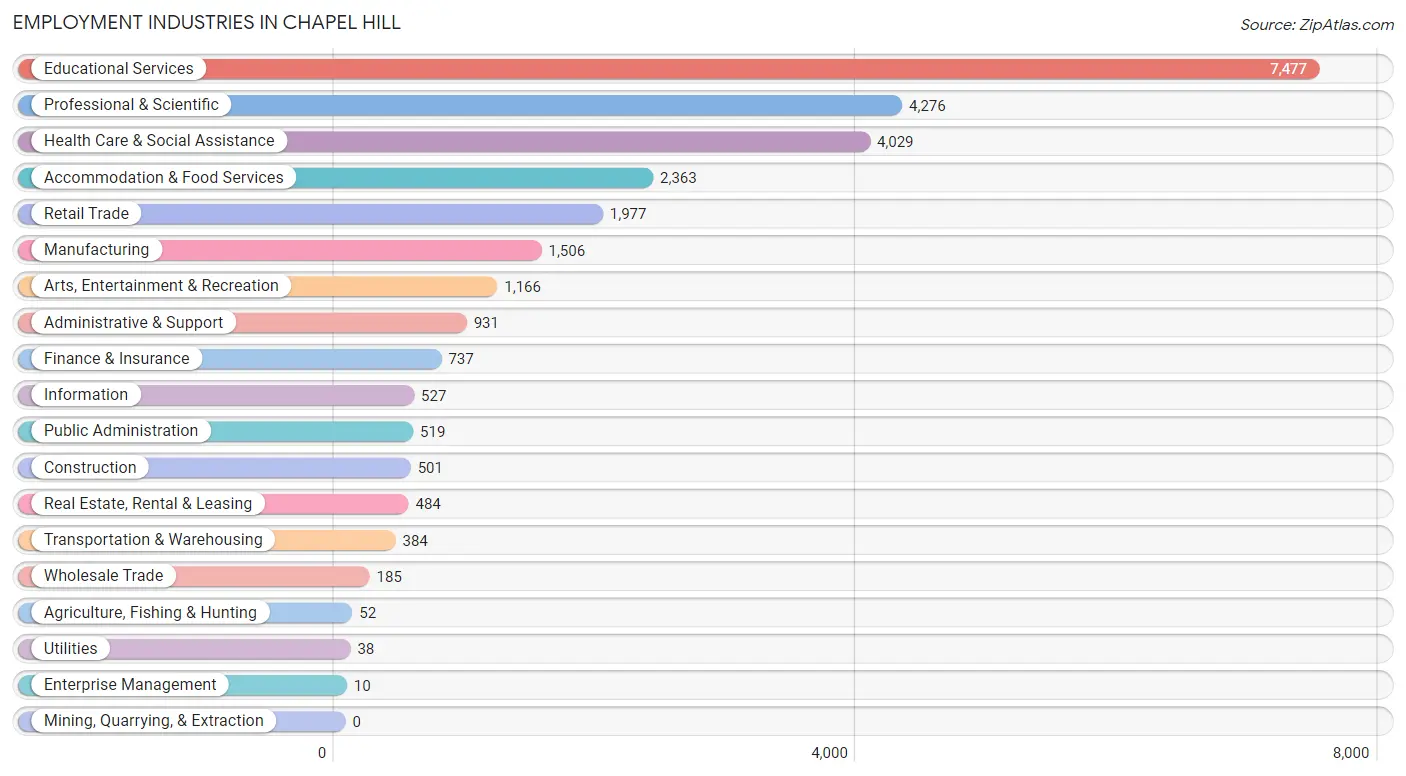
Employment Industries in Chapel Hill
The major employment industries in Chapel Hill include Educational Services (7,477 | 26.5%), Professional & Scientific (4,276 | 15.1%), Health Care & Social Assistance (4,029 | 14.3%), Accommodation & Food Services (2,363 | 8.4%), and Retail Trade (1,977 | 7.0%).
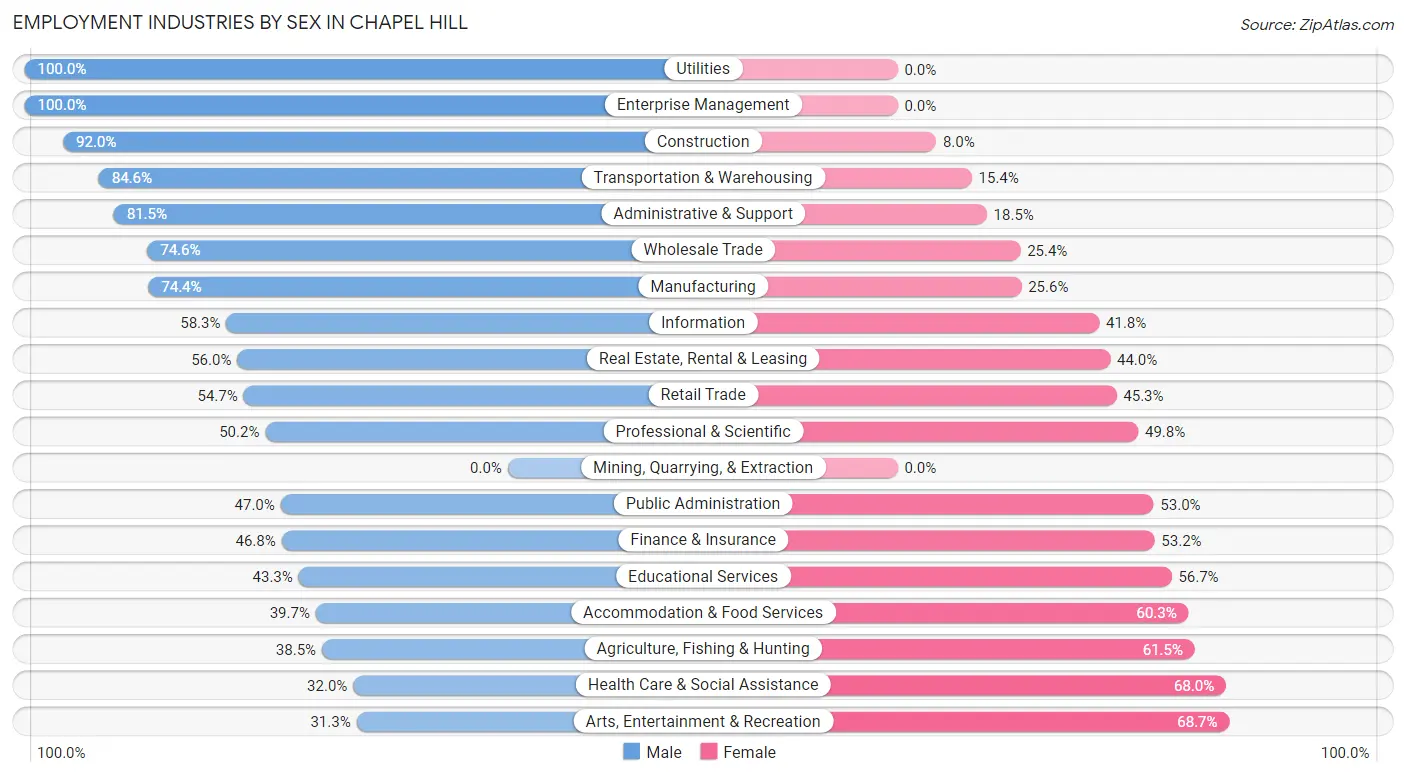
Employment Industries by Sex in Chapel Hill
The Chapel Hill industries that see more men than women are Utilities (100.0%), Enterprise Management (100.0%), and Construction (92.0%), whereas the industries that tend to have a higher number of women are Arts, Entertainment & Recreation (68.7%), Health Care & Social Assistance (68.0%), and Agriculture, Fishing & Hunting (61.5%).
| Industry | Male | Female |
| Agriculture, Fishing & Hunting | 20 (38.5%) | 32 (61.5%) |
| Mining, Quarrying, & Extraction | 0 (0.0%) | 0 (0.0%) |
| Construction | 461 (92.0%) | 40 (8.0%) |
| Manufacturing | 1,120 (74.4%) | 386 (25.6%) |
| Wholesale Trade | 138 (74.6%) | 47 (25.4%) |
| Retail Trade | 1,081 (54.7%) | 896 (45.3%) |
| Transportation & Warehousing | 325 (84.6%) | 59 (15.4%) |
| Utilities | 38 (100.0%) | 0 (0.0%) |
| Information | 307 (58.3%) | 220 (41.7%) |
| Finance & Insurance | 345 (46.8%) | 392 (53.2%) |
| Real Estate, Rental & Leasing | 271 (56.0%) | 213 (44.0%) |
| Professional & Scientific | 2,146 (50.2%) | 2,130 (49.8%) |
| Enterprise Management | 10 (100.0%) | 0 (0.0%) |
| Administrative & Support | 759 (81.5%) | 172 (18.5%) |
| Educational Services | 3,236 (43.3%) | 4,241 (56.7%) |
| Health Care & Social Assistance | 1,289 (32.0%) | 2,740 (68.0%) |
| Arts, Entertainment & Recreation | 365 (31.3%) | 801 (68.7%) |
| Accommodation & Food Services | 939 (39.7%) | 1,424 (60.3%) |
| Public Administration | 244 (47.0%) | 275 (53.0%) |
| Total | 13,350 (47.3%) | 14,890 (52.7%) |
Education in Chapel Hill
School Enrollment in Chapel Hill
The most common levels of schooling among the 28,083 students in Chapel Hill are college / undergraduate (16,268 | 57.9%), graduate / professional (3,741 | 13.3%), and high school (2,762 | 9.8%).
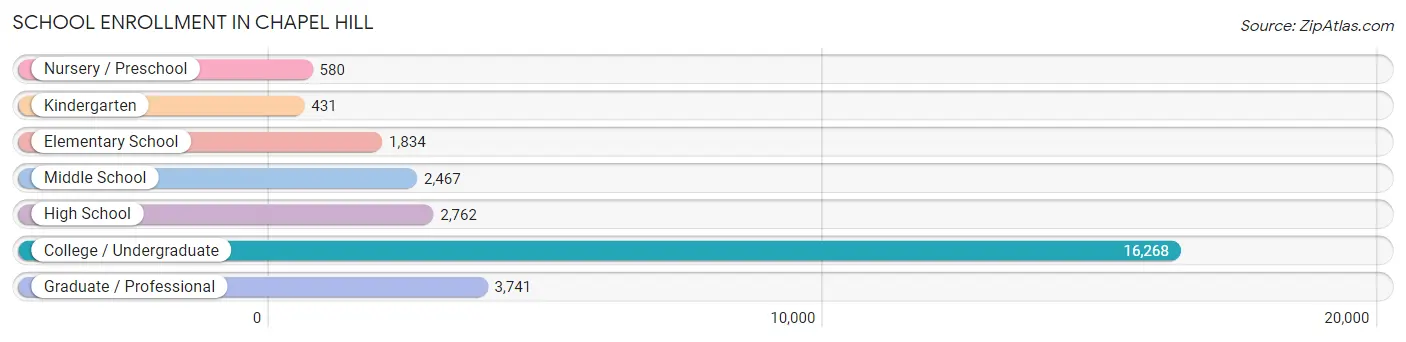
| School Level | # Students | % Students |
| Nursery / Preschool | 580 | 2.1% |
| Kindergarten | 431 | 1.5% |
| Elementary School | 1,834 | 6.5% |
| Middle School | 2,467 | 8.8% |
| High School | 2,762 | 9.8% |
| College / Undergraduate | 16,268 | 57.9% |
| Graduate / Professional | 3,741 | 13.3% |
| Total | 28,083 | 100.0% |
School Enrollment by Age by Funding Source in Chapel Hill
Out of a total of 28,083 students who are enrolled in schools in Chapel Hill, 2,556 (9.1%) attend a private institution, while the remaining 25,527 (90.9%) are enrolled in public schools. The age group of 3 to 4 year olds has the highest likelihood of being enrolled in private schools, with 374 (77.7% in the age bracket) enrolled. Conversely, the age group of 18 to 19 year olds has the lowest likelihood of being enrolled in a private school, with 7,533 (96.9% in the age bracket) attending a public institution.
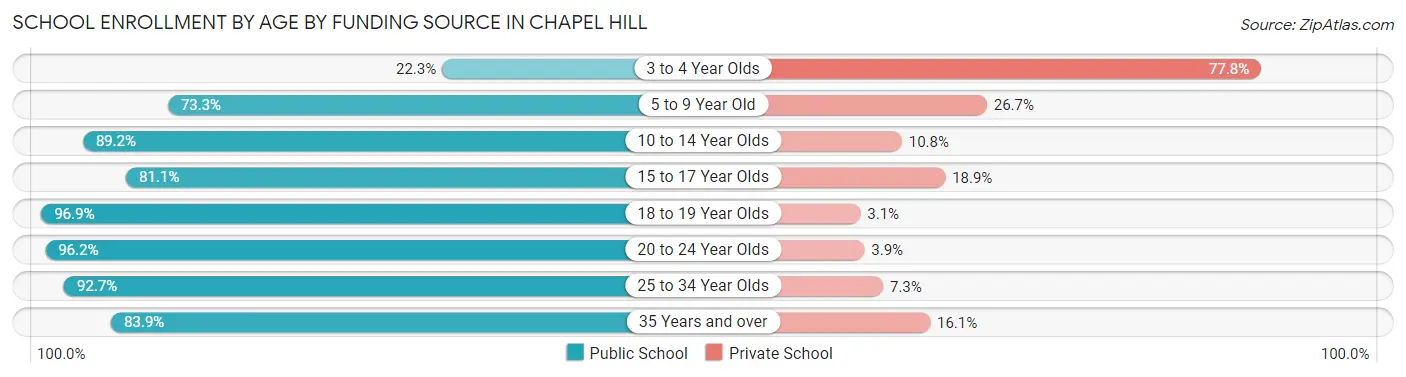
| Age Bracket | Public School | Private School |
| 3 to 4 Year Olds | 107 (22.3%) | 374 (77.7%) |
| 5 to 9 Year Old | 1,538 (73.3%) | 559 (26.7%) |
| 10 to 14 Year Olds | 2,907 (89.2%) | 353 (10.8%) |
| 15 to 17 Year Olds | 1,591 (81.1%) | 371 (18.9%) |
| 18 to 19 Year Olds | 7,533 (96.9%) | 242 (3.1%) |
| 20 to 24 Year Olds | 9,158 (96.2%) | 367 (3.8%) |
| 25 to 34 Year Olds | 2,010 (92.7%) | 159 (7.3%) |
| 35 Years and over | 683 (83.9%) | 131 (16.1%) |
| Total | 25,527 (90.9%) | 2,556 (9.1%) |
Educational Attainment by Field of Study in Chapel Hill
Bio, nature & agricultural (3,540 | 13.6%), social sciences (3,052 | 11.7%), literature & languages (2,311 | 8.9%), business (2,258 | 8.7%), and science & technology (2,089 | 8.0%) are the most common fields of study among 26,033 individuals in Chapel Hill who have obtained a bachelor's degree or higher.
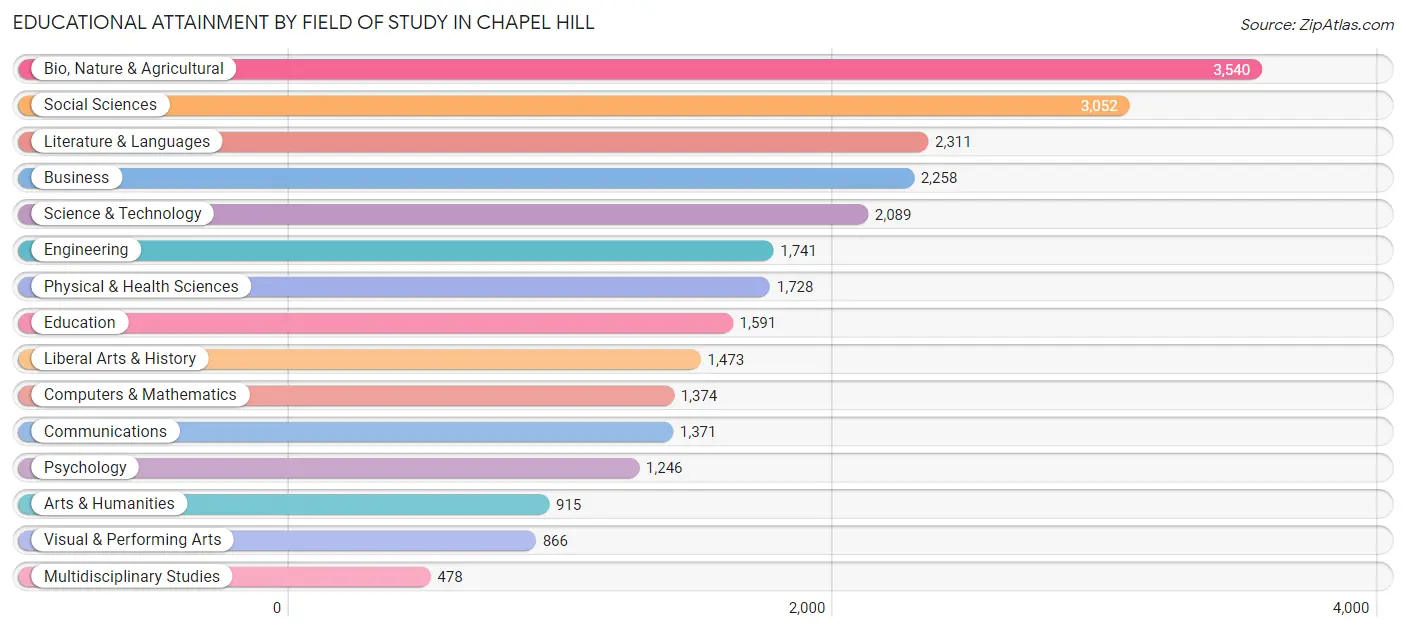
| Field of Study | # Graduates | % Graduates |
| Computers & Mathematics | 1,374 | 5.3% |
| Bio, Nature & Agricultural | 3,540 | 13.6% |
| Physical & Health Sciences | 1,728 | 6.6% |
| Psychology | 1,246 | 4.8% |
| Social Sciences | 3,052 | 11.7% |
| Engineering | 1,741 | 6.7% |
| Multidisciplinary Studies | 478 | 1.8% |
| Science & Technology | 2,089 | 8.0% |
| Business | 2,258 | 8.7% |
| Education | 1,591 | 6.1% |
| Literature & Languages | 2,311 | 8.9% |
| Liberal Arts & History | 1,473 | 5.7% |
| Visual & Performing Arts | 866 | 3.3% |
| Communications | 1,371 | 5.3% |
| Arts & Humanities | 915 | 3.5% |
| Total | 26,033 | 100.0% |
Transportation & Commute in Chapel Hill
Vehicle Availability by Sex in Chapel Hill
The most prevalent vehicle ownership categories in Chapel Hill are males with 2 vehicles (5,258, accounting for 43.6%) and females with 2 vehicles (4,952, making up 43.1%).
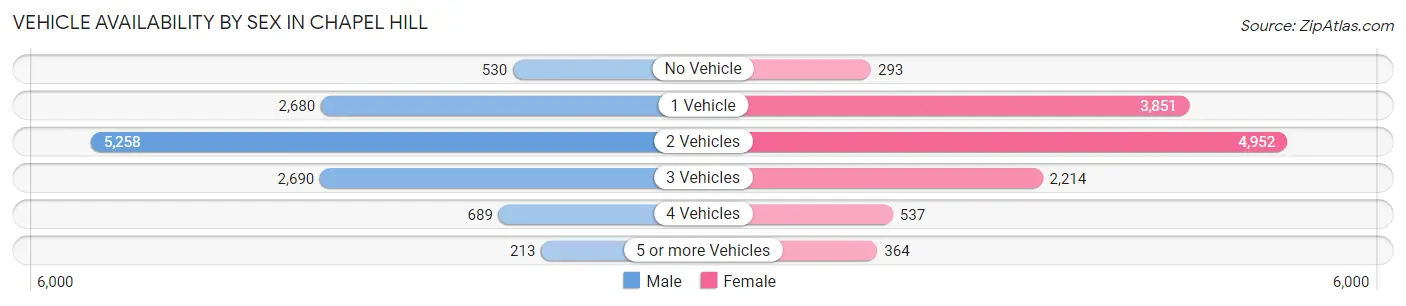
| Vehicles Available | Male | Female |
| No Vehicle | 530 (4.4%) | 293 (2.4%) |
| 1 Vehicle | 2,680 (22.2%) | 3,851 (31.5%) |
| 2 Vehicles | 5,258 (43.6%) | 4,952 (40.6%) |
| 3 Vehicles | 2,690 (22.3%) | 2,214 (18.1%) |
| 4 Vehicles | 689 (5.7%) | 537 (4.4%) |
| 5 or more Vehicles | 213 (1.8%) | 364 (3.0%) |
| Total | 12,060 (100.0%) | 12,211 (100.0%) |
Commute Time in Chapel Hill
The most frequently occuring commute durations in Chapel Hill are 15 to 19 minutes (4,192 commuters, 20.9%), 10 to 14 minutes (3,952 commuters, 19.7%), and 20 to 24 minutes (3,291 commuters, 16.4%).
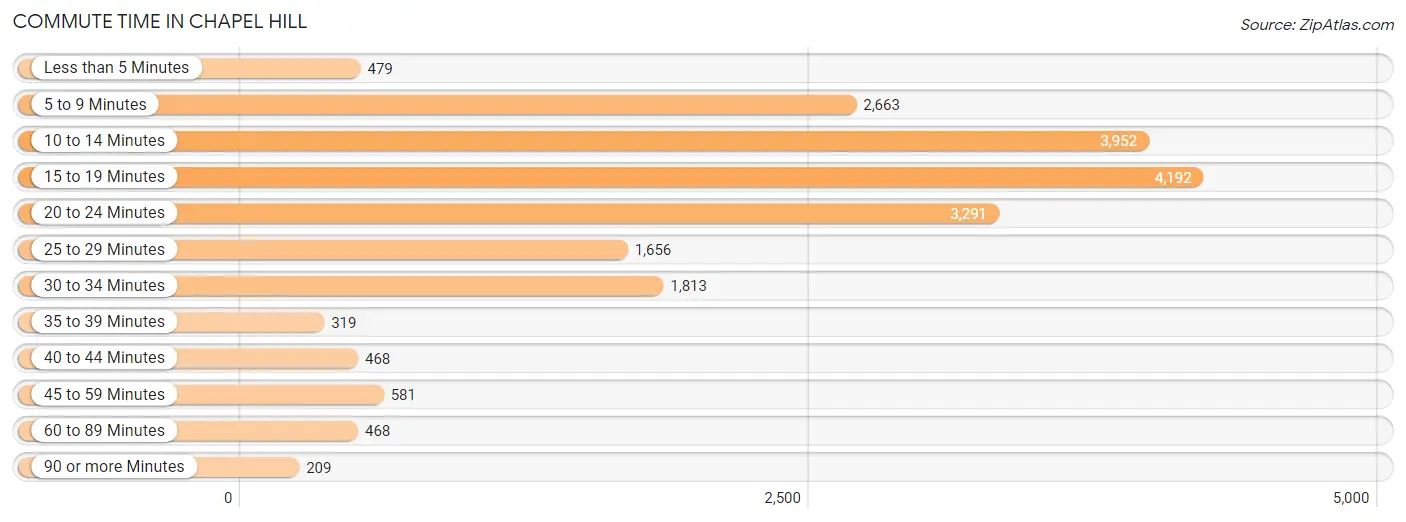
| Commute Time | # Commuters | % Commuters |
| Less than 5 Minutes | 479 | 2.4% |
| 5 to 9 Minutes | 2,663 | 13.3% |
| 10 to 14 Minutes | 3,952 | 19.7% |
| 15 to 19 Minutes | 4,192 | 20.9% |
| 20 to 24 Minutes | 3,291 | 16.4% |
| 25 to 29 Minutes | 1,656 | 8.2% |
| 30 to 34 Minutes | 1,813 | 9.0% |
| 35 to 39 Minutes | 319 | 1.6% |
| 40 to 44 Minutes | 468 | 2.3% |
| 45 to 59 Minutes | 581 | 2.9% |
| 60 to 89 Minutes | 468 | 2.3% |
| 90 or more Minutes | 209 | 1.0% |
Commute Time by Sex in Chapel Hill
The most common commute times in Chapel Hill are 15 to 19 minutes (2,096 commuters, 21.2%) for males and 10 to 14 minutes (2,331 commuters, 22.9%) for females.
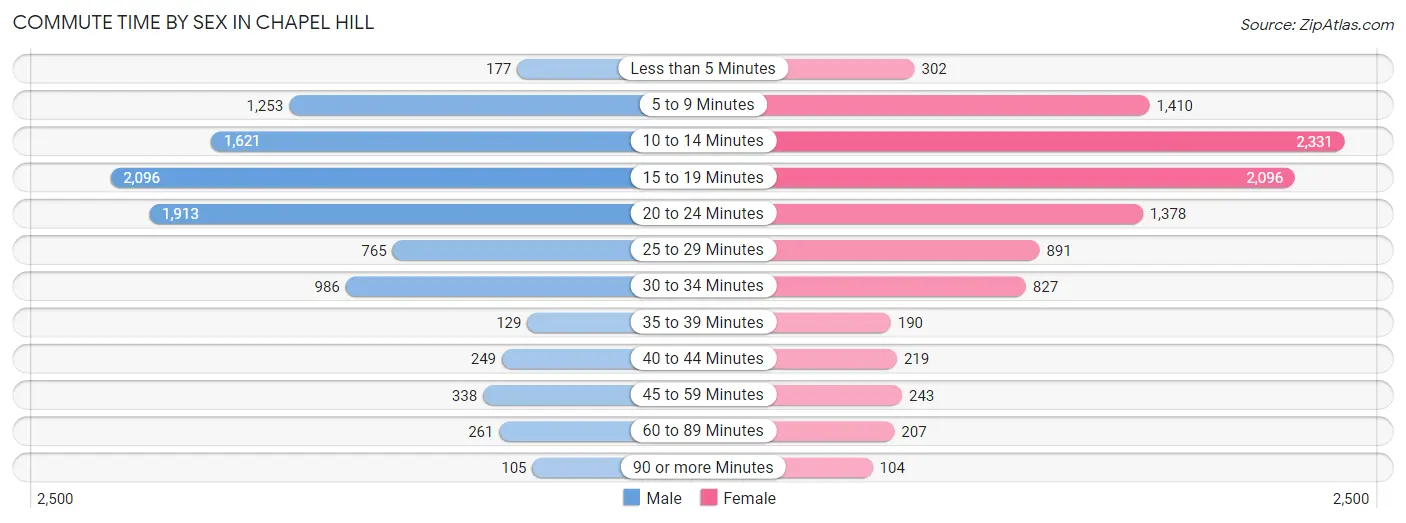
| Commute Time | Male | Female |
| Less than 5 Minutes | 177 (1.8%) | 302 (3.0%) |
| 5 to 9 Minutes | 1,253 (12.7%) | 1,410 (13.8%) |
| 10 to 14 Minutes | 1,621 (16.4%) | 2,331 (22.9%) |
| 15 to 19 Minutes | 2,096 (21.2%) | 2,096 (20.5%) |
| 20 to 24 Minutes | 1,913 (19.3%) | 1,378 (13.5%) |
| 25 to 29 Minutes | 765 (7.7%) | 891 (8.7%) |
| 30 to 34 Minutes | 986 (10.0%) | 827 (8.1%) |
| 35 to 39 Minutes | 129 (1.3%) | 190 (1.9%) |
| 40 to 44 Minutes | 249 (2.5%) | 219 (2.1%) |
| 45 to 59 Minutes | 338 (3.4%) | 243 (2.4%) |
| 60 to 89 Minutes | 261 (2.6%) | 207 (2.0%) |
| 90 or more Minutes | 105 (1.1%) | 104 (1.0%) |
Time of Departure to Work by Sex in Chapel Hill
The most frequent times of departure to work in Chapel Hill are 7:30 AM to 7:59 AM (2,054, 20.8%) for males and 8:00 AM to 8:29 AM (1,481, 14.5%) for females.
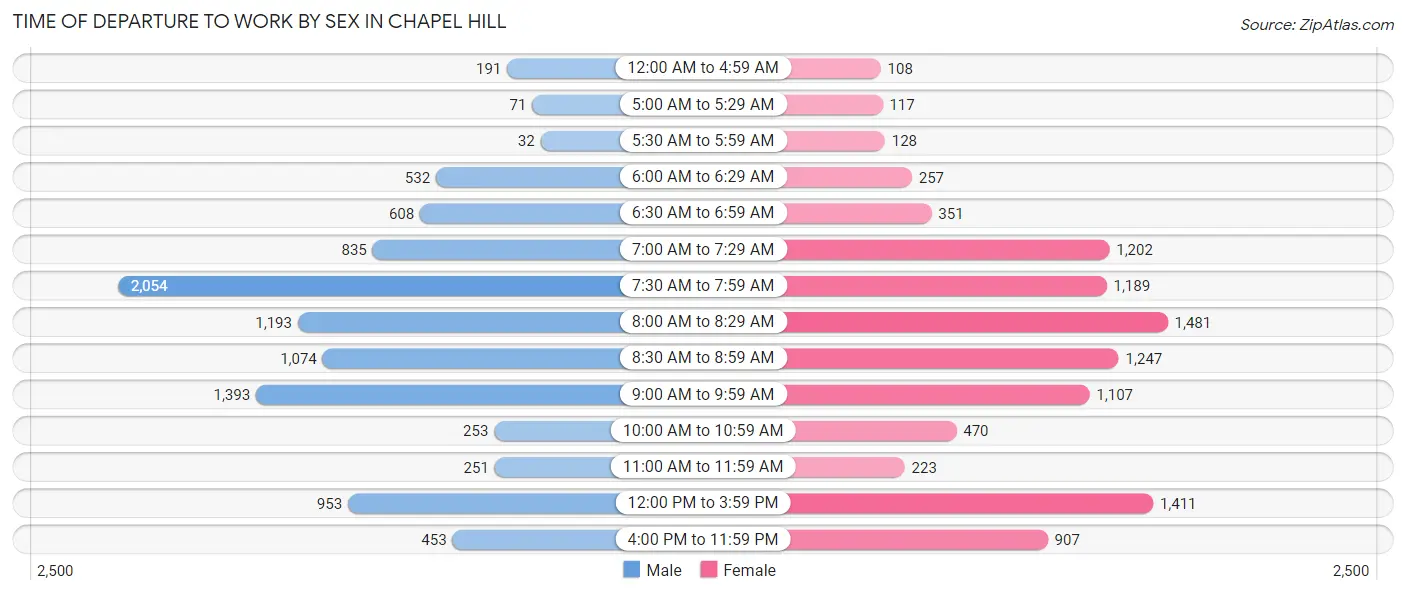
| Time of Departure | Male | Female |
| 12:00 AM to 4:59 AM | 191 (1.9%) | 108 (1.1%) |
| 5:00 AM to 5:29 AM | 71 (0.7%) | 117 (1.1%) |
| 5:30 AM to 5:59 AM | 32 (0.3%) | 128 (1.3%) |
| 6:00 AM to 6:29 AM | 532 (5.4%) | 257 (2.5%) |
| 6:30 AM to 6:59 AM | 608 (6.1%) | 351 (3.4%) |
| 7:00 AM to 7:29 AM | 835 (8.4%) | 1,202 (11.8%) |
| 7:30 AM to 7:59 AM | 2,054 (20.8%) | 1,189 (11.7%) |
| 8:00 AM to 8:29 AM | 1,193 (12.1%) | 1,481 (14.5%) |
| 8:30 AM to 8:59 AM | 1,074 (10.9%) | 1,247 (12.2%) |
| 9:00 AM to 9:59 AM | 1,393 (14.1%) | 1,107 (10.9%) |
| 10:00 AM to 10:59 AM | 253 (2.6%) | 470 (4.6%) |
| 11:00 AM to 11:59 AM | 251 (2.5%) | 223 (2.2%) |
| 12:00 PM to 3:59 PM | 953 (9.6%) | 1,411 (13.8%) |
| 4:00 PM to 11:59 PM | 453 (4.6%) | 907 (8.9%) |
| Total | 9,893 (100.0%) | 10,198 (100.0%) |
Housing Occupancy in Chapel Hill
Occupancy by Ownership in Chapel Hill
Of the total 19,965 dwellings in Chapel Hill, owner-occupied units account for 9,979 (50.0%), while renter-occupied units make up 9,986 (50.0%).
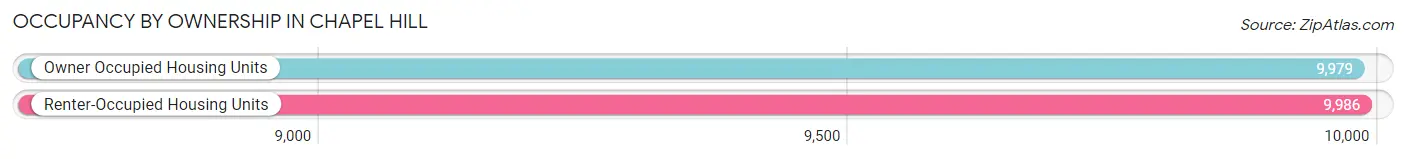
| Occupancy | # Housing Units | % Housing Units |
| Owner Occupied Housing Units | 9,979 | 50.0% |
| Renter-Occupied Housing Units | 9,986 | 50.0% |
| Total Occupied Housing Units | 19,965 | 100.0% |
Occupancy by Household Size in Chapel Hill
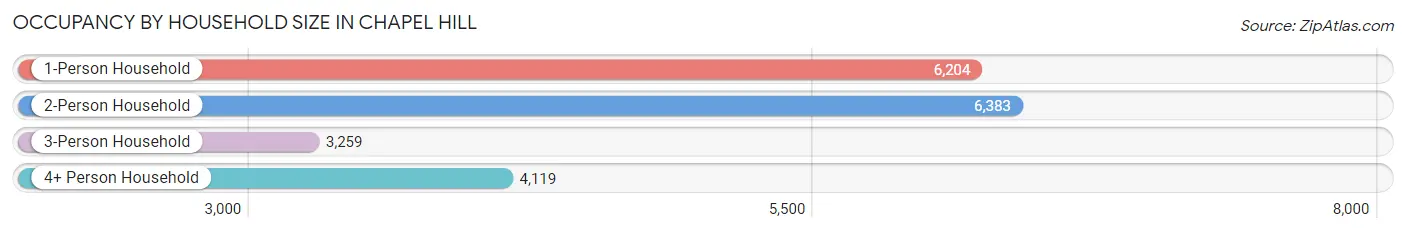
| Household Size | # Housing Units | % Housing Units |
| 1-Person Household | 6,204 | 31.1% |
| 2-Person Household | 6,383 | 32.0% |
| 3-Person Household | 3,259 | 16.3% |
| 4+ Person Household | 4,119 | 20.6% |
| Total Housing Units | 19,965 | 100.0% |
Occupancy by Ownership by Household Size in Chapel Hill
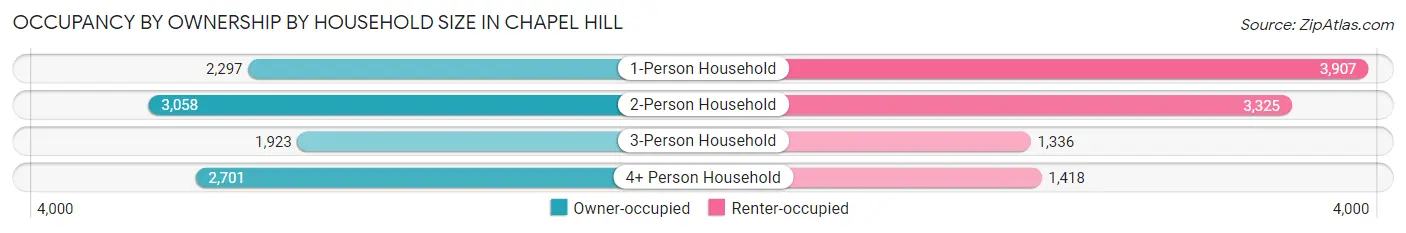
| Household Size | Owner-occupied | Renter-occupied |
| 1-Person Household | 2,297 (37.0%) | 3,907 (63.0%) |
| 2-Person Household | 3,058 (47.9%) | 3,325 (52.1%) |
| 3-Person Household | 1,923 (59.0%) | 1,336 (41.0%) |
| 4+ Person Household | 2,701 (65.6%) | 1,418 (34.4%) |
| Total Housing Units | 9,979 (50.0%) | 9,986 (50.0%) |
Occupancy by Educational Attainment in Chapel Hill
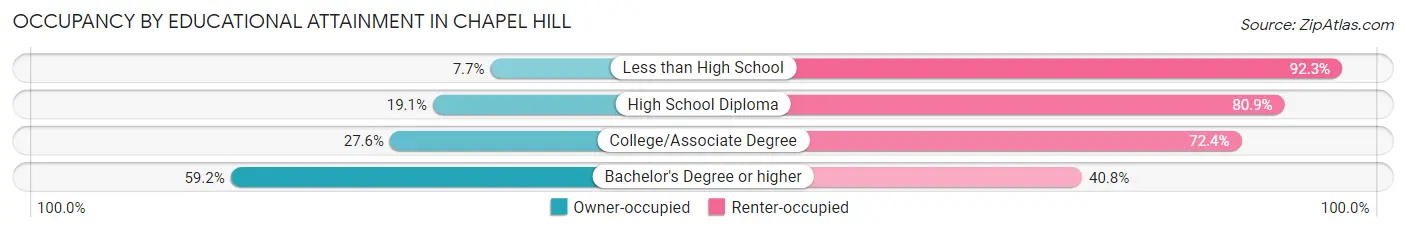
| Household Size | Owner-occupied | Renter-occupied |
| Less than High School | 51 (7.7%) | 614 (92.3%) |
| High School Diploma | 207 (19.1%) | 879 (80.9%) |
| College/Associate Degree | 924 (27.6%) | 2,424 (72.4%) |
| Bachelor's Degree or higher | 8,797 (59.2%) | 6,069 (40.8%) |
Occupancy by Age of Householder in Chapel Hill
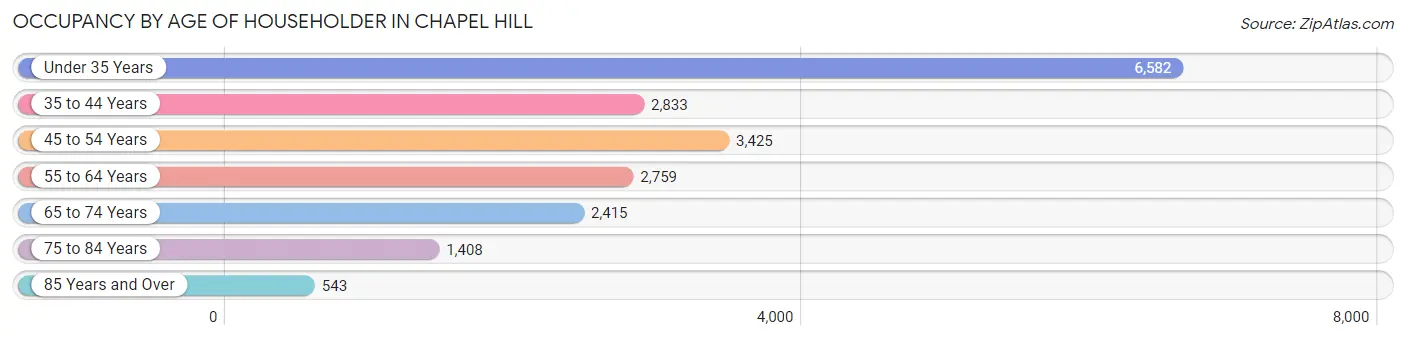
| Age Bracket | # Households | % Households |
| Under 35 Years | 6,582 | 33.0% |
| 35 to 44 Years | 2,833 | 14.2% |
| 45 to 54 Years | 3,425 | 17.2% |
| 55 to 64 Years | 2,759 | 13.8% |
| 65 to 74 Years | 2,415 | 12.1% |
| 75 to 84 Years | 1,408 | 7.0% |
| 85 Years and Over | 543 | 2.7% |
| Total | 19,965 | 100.0% |
Housing Finances in Chapel Hill
Median Income by Occupancy in Chapel Hill
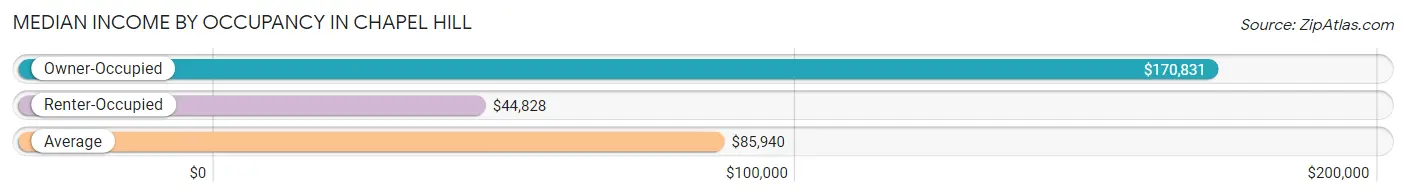
| Occupancy Type | # Households | Median Income |
| Owner-Occupied | 9,979 (50.0%) | $170,831 |
| Renter-Occupied | 9,986 (50.0%) | $44,828 |
| Average | 19,965 (100.0%) | $85,940 |
Occupancy by Householder Income Bracket in Chapel Hill
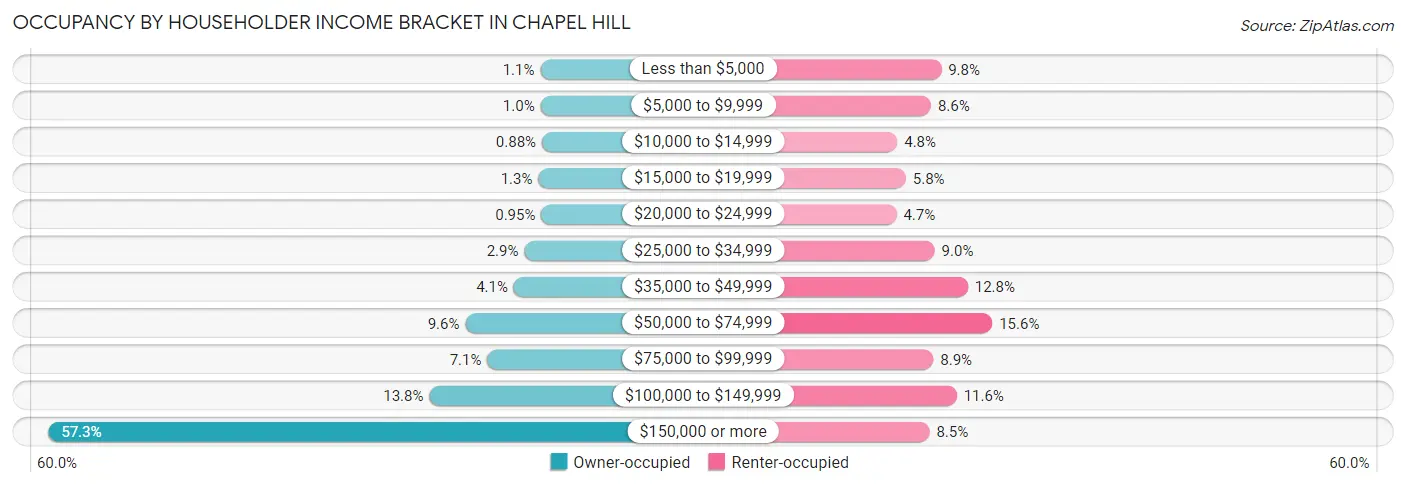
| Income Bracket | Owner-occupied | Renter-occupied |
| Less than $5,000 | 106 (1.1%) | 978 (9.8%) |
| $5,000 to $9,999 | 104 (1.0%) | 861 (8.6%) |
| $10,000 to $14,999 | 88 (0.9%) | 476 (4.8%) |
| $15,000 to $19,999 | 129 (1.3%) | 574 (5.8%) |
| $20,000 to $24,999 | 95 (0.9%) | 467 (4.7%) |
| $25,000 to $34,999 | 288 (2.9%) | 903 (9.0%) |
| $35,000 to $49,999 | 408 (4.1%) | 1,281 (12.8%) |
| $50,000 to $74,999 | 961 (9.6%) | 1,560 (15.6%) |
| $75,000 to $99,999 | 711 (7.1%) | 888 (8.9%) |
| $100,000 to $149,999 | 1,372 (13.8%) | 1,154 (11.6%) |
| $150,000 or more | 5,717 (57.3%) | 844 (8.5%) |
| Total | 9,979 (100.0%) | 9,986 (100.0%) |
Monthly Housing Cost Tiers in Chapel Hill
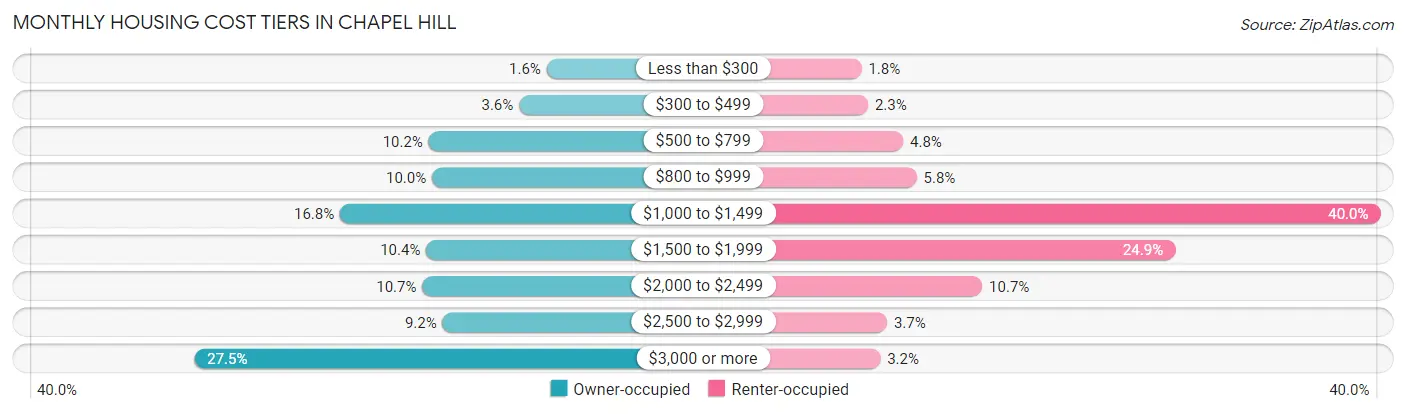
| Monthly Cost | Owner-occupied | Renter-occupied |
| Less than $300 | 155 (1.5%) | 177 (1.8%) |
| $300 to $499 | 357 (3.6%) | 225 (2.2%) |
| $500 to $799 | 1,022 (10.2%) | 483 (4.8%) |
| $800 to $999 | 997 (10.0%) | 582 (5.8%) |
| $1,000 to $1,499 | 1,673 (16.8%) | 3,992 (40.0%) |
| $1,500 to $1,999 | 1,040 (10.4%) | 2,483 (24.9%) |
| $2,000 to $2,499 | 1,069 (10.7%) | 1,065 (10.7%) |
| $2,500 to $2,999 | 920 (9.2%) | 364 (3.6%) |
| $3,000 or more | 2,746 (27.5%) | 315 (3.2%) |
| Total | 9,979 (100.0%) | 9,986 (100.0%) |
Physical Housing Characteristics in Chapel Hill
Housing Structures in Chapel Hill
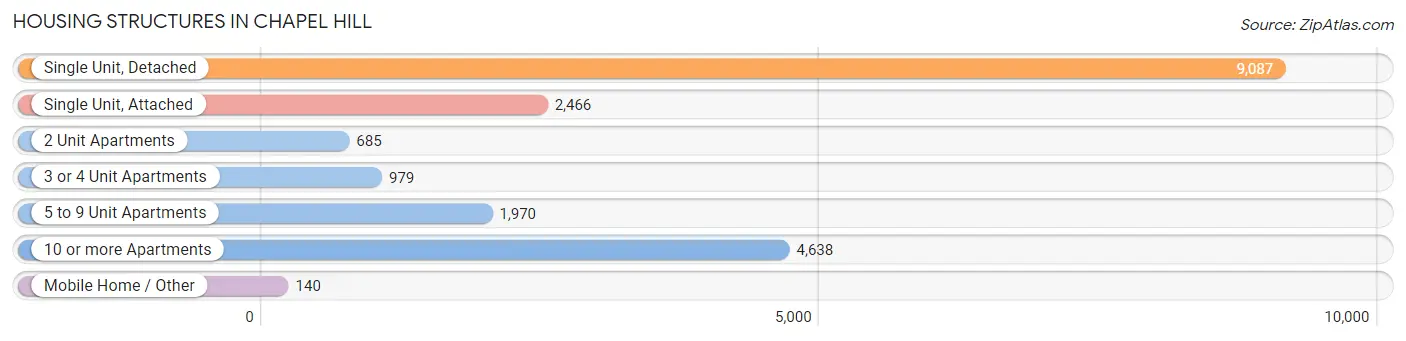
| Structure Type | # Housing Units | % Housing Units |
| Single Unit, Detached | 9,087 | 45.5% |
| Single Unit, Attached | 2,466 | 12.3% |
| 2 Unit Apartments | 685 | 3.4% |
| 3 or 4 Unit Apartments | 979 | 4.9% |
| 5 to 9 Unit Apartments | 1,970 | 9.9% |
| 10 or more Apartments | 4,638 | 23.2% |
| Mobile Home / Other | 140 | 0.7% |
| Total | 19,965 | 100.0% |
Housing Structures by Occupancy in Chapel Hill
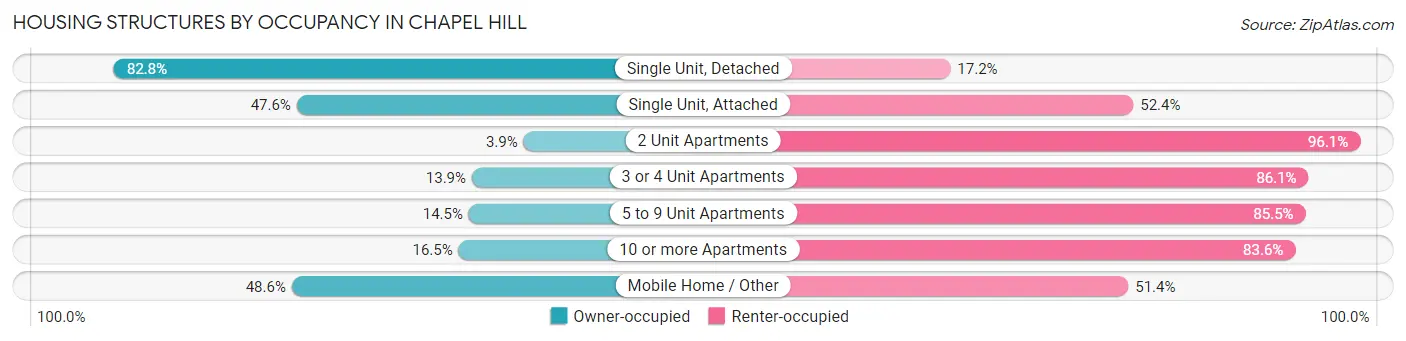
| Structure Type | Owner-occupied | Renter-occupied |
| Single Unit, Detached | 7,526 (82.8%) | 1,561 (17.2%) |
| Single Unit, Attached | 1,174 (47.6%) | 1,292 (52.4%) |
| 2 Unit Apartments | 27 (3.9%) | 658 (96.1%) |
| 3 or 4 Unit Apartments | 136 (13.9%) | 843 (86.1%) |
| 5 to 9 Unit Apartments | 285 (14.5%) | 1,685 (85.5%) |
| 10 or more Apartments | 763 (16.5%) | 3,875 (83.6%) |
| Mobile Home / Other | 68 (48.6%) | 72 (51.4%) |
| Total | 9,979 (50.0%) | 9,986 (50.0%) |
Housing Structures by Number of Rooms in Chapel Hill
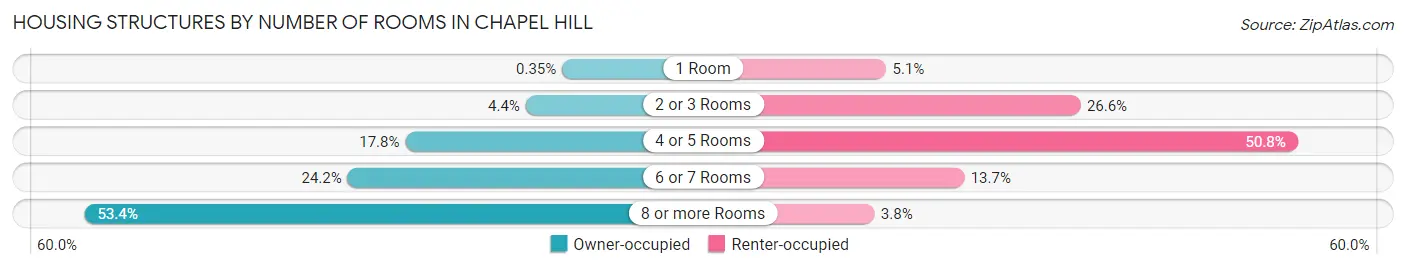
| Number of Rooms | Owner-occupied | Renter-occupied |
| 1 Room | 35 (0.4%) | 506 (5.1%) |
| 2 or 3 Rooms | 438 (4.4%) | 2,660 (26.6%) |
| 4 or 5 Rooms | 1,771 (17.7%) | 5,072 (50.8%) |
| 6 or 7 Rooms | 2,411 (24.2%) | 1,372 (13.7%) |
| 8 or more Rooms | 5,324 (53.3%) | 376 (3.8%) |
| Total | 9,979 (100.0%) | 9,986 (100.0%) |
Housing Structure by Heating Type in Chapel Hill
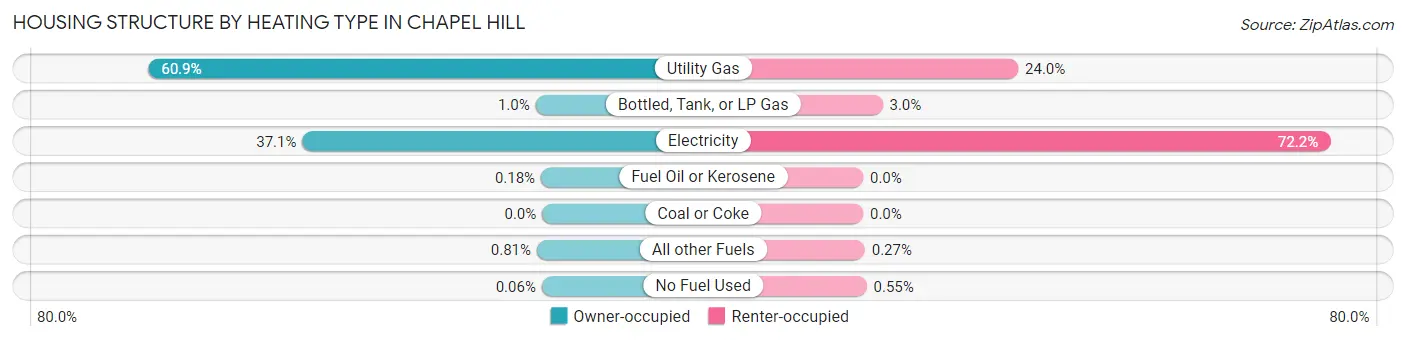
| Heating Type | Owner-occupied | Renter-occupied |
| Utility Gas | 6,074 (60.9%) | 2,394 (24.0%) |
| Bottled, Tank, or LP Gas | 101 (1.0%) | 301 (3.0%) |
| Electricity | 3,699 (37.1%) | 7,209 (72.2%) |
| Fuel Oil or Kerosene | 18 (0.2%) | 0 (0.0%) |
| Coal or Coke | 0 (0.0%) | 0 (0.0%) |
| All other Fuels | 81 (0.8%) | 27 (0.3%) |
| No Fuel Used | 6 (0.1%) | 55 (0.5%) |
| Total | 9,979 (100.0%) | 9,986 (100.0%) |
Household Vehicle Usage in Chapel Hill
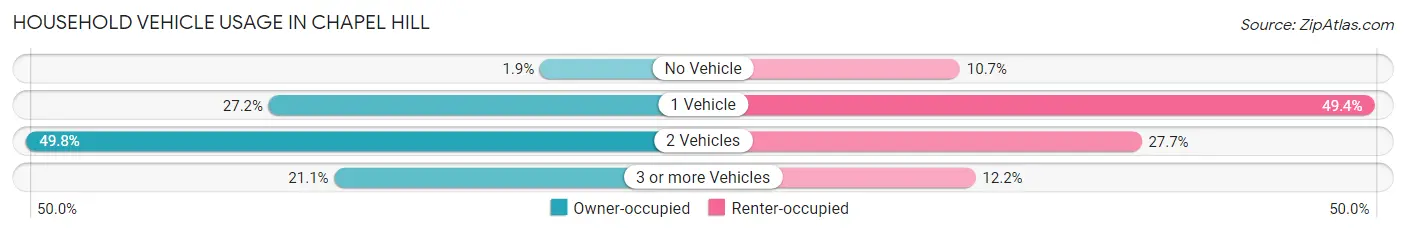
| Vehicles per Household | Owner-occupied | Renter-occupied |
| No Vehicle | 188 (1.9%) | 1,071 (10.7%) |
| 1 Vehicle | 2,714 (27.2%) | 4,935 (49.4%) |
| 2 Vehicles | 4,973 (49.8%) | 2,764 (27.7%) |
| 3 or more Vehicles | 2,104 (21.1%) | 1,216 (12.2%) |
| Total | 9,979 (100.0%) | 9,986 (100.0%) |
Real Estate & Mortgages in Chapel Hill
Real Estate and Mortgage Overview in Chapel Hill
| Characteristic | Without Mortgage | With Mortgage |
| Housing Units | 3,844 | 6,135 |
| Median Property Value | $490,400 | $559,600 |
| Median Household Income | $126,719 | $4,048 |
| Monthly Housing Costs | $941 | $2,578 |
| Real Estate Taxes | $6,816 | $0 |
Property Value by Mortgage Status in Chapel Hill
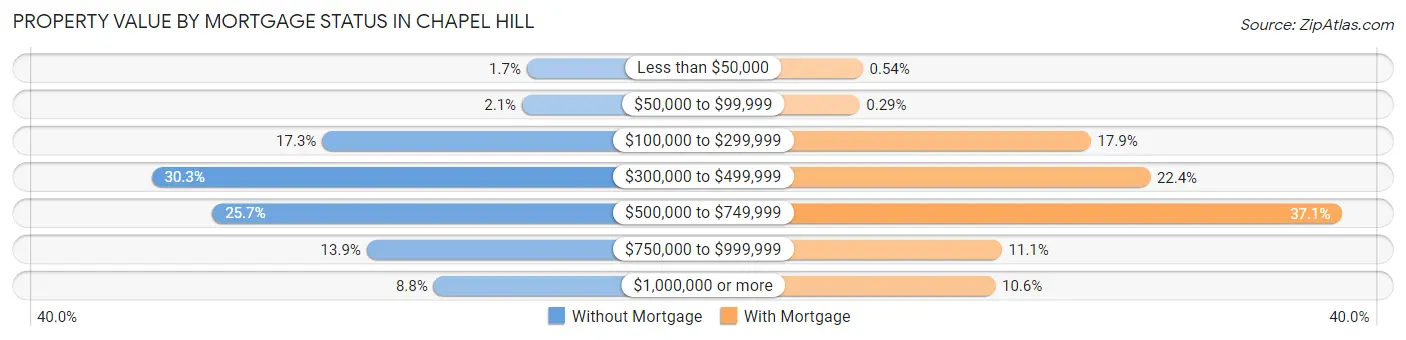
| Property Value | Without Mortgage | With Mortgage |
| Less than $50,000 | 67 (1.7%) | 33 (0.5%) |
| $50,000 to $99,999 | 81 (2.1%) | 18 (0.3%) |
| $100,000 to $299,999 | 666 (17.3%) | 1,098 (17.9%) |
| $300,000 to $499,999 | 1,166 (30.3%) | 1,376 (22.4%) |
| $500,000 to $749,999 | 988 (25.7%) | 2,275 (37.1%) |
| $750,000 to $999,999 | 536 (13.9%) | 683 (11.1%) |
| $1,000,000 or more | 340 (8.8%) | 652 (10.6%) |
| Total | 3,844 (100.0%) | 6,135 (100.0%) |
Household Income by Mortgage Status in Chapel Hill
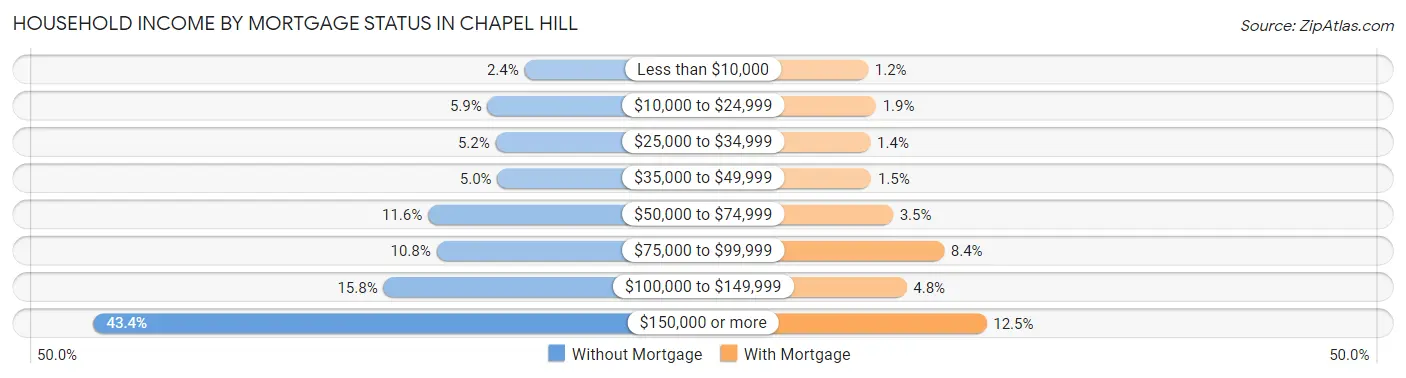
| Household Income | Without Mortgage | With Mortgage |
| Less than $10,000 | 92 (2.4%) | 72 (1.2%) |
| $10,000 to $24,999 | 227 (5.9%) | 118 (1.9%) |
| $25,000 to $34,999 | 198 (5.1%) | 85 (1.4%) |
| $35,000 to $49,999 | 191 (5.0%) | 90 (1.5%) |
| $50,000 to $74,999 | 445 (11.6%) | 217 (3.5%) |
| $75,000 to $99,999 | 414 (10.8%) | 516 (8.4%) |
| $100,000 to $149,999 | 608 (15.8%) | 297 (4.8%) |
| $150,000 or more | 1,669 (43.4%) | 764 (12.4%) |
| Total | 3,844 (100.0%) | 6,135 (100.0%) |
Property Value to Household Income Ratio in Chapel Hill
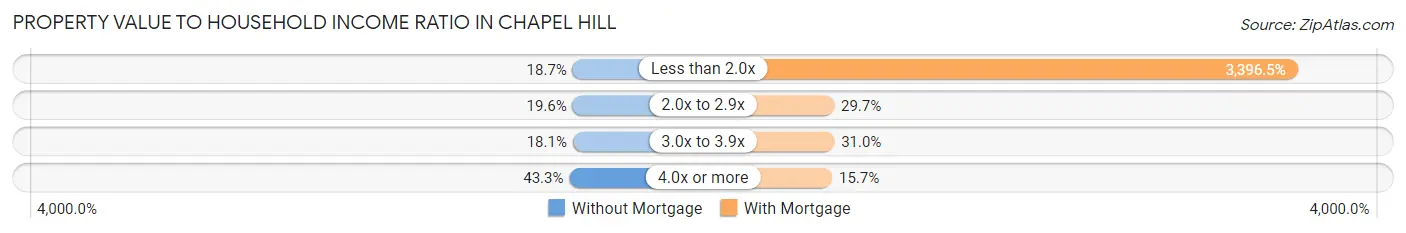
| Value-to-Income Ratio | Without Mortgage | With Mortgage |
| Less than 2.0x | 719 (18.7%) | 208,378 (3,396.5%) |
| 2.0x to 2.9x | 755 (19.6%) | 1,820 (29.7%) |
| 3.0x to 3.9x | 694 (18.0%) | 1,904 (31.0%) |
| 4.0x or more | 1,666 (43.3%) | 960 (15.7%) |
| Total | 3,844 (100.0%) | 6,135 (100.0%) |
Real Estate Taxes by Mortgage Status in Chapel Hill
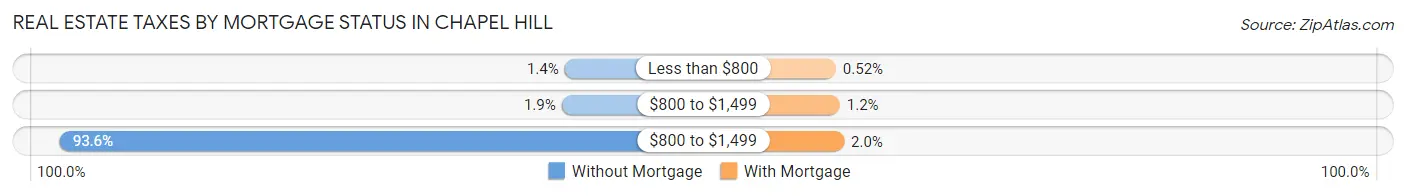
| Property Taxes | Without Mortgage | With Mortgage |
| Less than $800 | 53 (1.4%) | 32 (0.5%) |
| $800 to $1,499 | 74 (1.9%) | 76 (1.2%) |
| $800 to $1,499 | 3,597 (93.6%) | 124 (2.0%) |
| Total | 3,844 (100.0%) | 6,135 (100.0%) |
Health & Disability in Chapel Hill
Health Insurance Coverage by Age in Chapel Hill
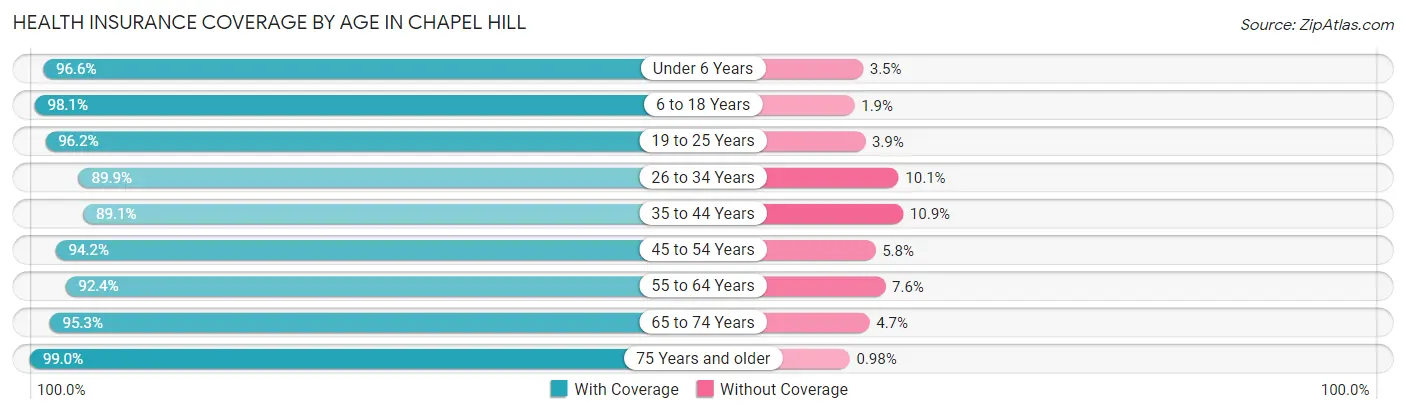
| Age Bracket | With Coverage | Without Coverage |
| Under 6 Years | 2,210 (96.6%) | 79 (3.5%) |
| 6 to 18 Years | 9,575 (98.1%) | 181 (1.9%) |
| 19 to 25 Years | 17,192 (96.2%) | 688 (3.8%) |
| 26 to 34 Years | 5,326 (89.9%) | 598 (10.1%) |
| 35 to 44 Years | 4,745 (89.1%) | 582 (10.9%) |
| 45 to 54 Years | 5,747 (94.2%) | 352 (5.8%) |
| 55 to 64 Years | 4,215 (92.4%) | 347 (7.6%) |
| 65 to 74 Years | 3,744 (95.3%) | 183 (4.7%) |
| 75 Years and older | 2,941 (99.0%) | 29 (1.0%) |
| Total | 55,695 (94.8%) | 3,039 (5.2%) |
Health Insurance Coverage by Citizenship Status in Chapel Hill
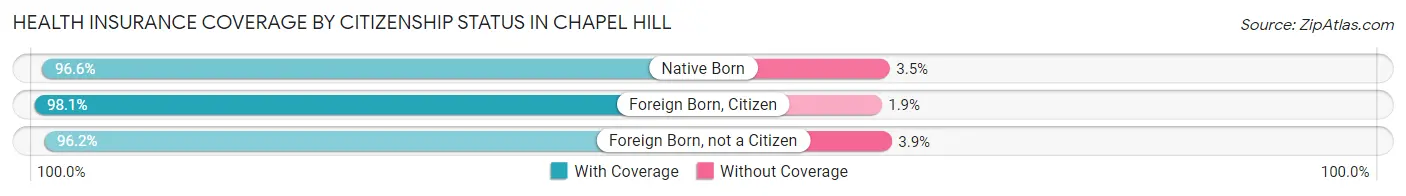
| Citizenship Status | With Coverage | Without Coverage |
| Native Born | 2,210 (96.6%) | 79 (3.5%) |
| Foreign Born, Citizen | 9,575 (98.1%) | 181 (1.9%) |
| Foreign Born, not a Citizen | 17,192 (96.2%) | 688 (3.8%) |
Health Insurance Coverage by Household Income in Chapel Hill
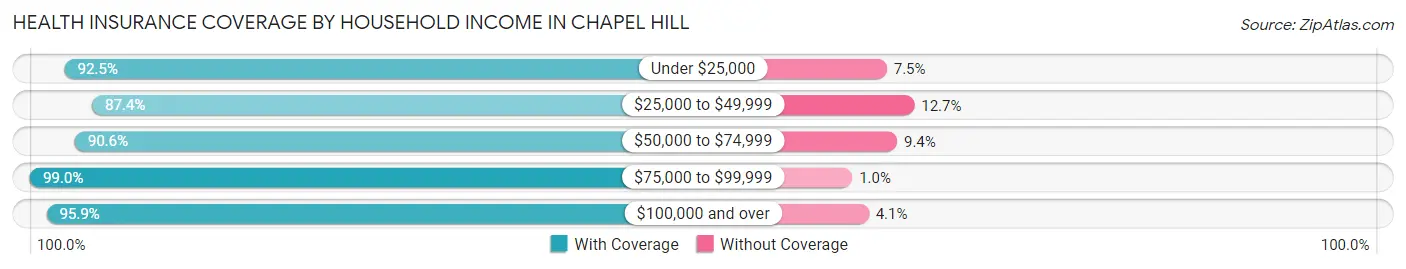
| Household Income | With Coverage | Without Coverage |
| Under $25,000 | 6,575 (92.5%) | 532 (7.5%) |
| $25,000 to $49,999 | 4,964 (87.4%) | 719 (12.7%) |
| $50,000 to $74,999 | 4,409 (90.6%) | 458 (9.4%) |
| $75,000 to $99,999 | 3,913 (99.0%) | 40 (1.0%) |
| $100,000 and over | 25,215 (95.9%) | 1,079 (4.1%) |
Public vs Private Health Insurance Coverage by Age in Chapel Hill
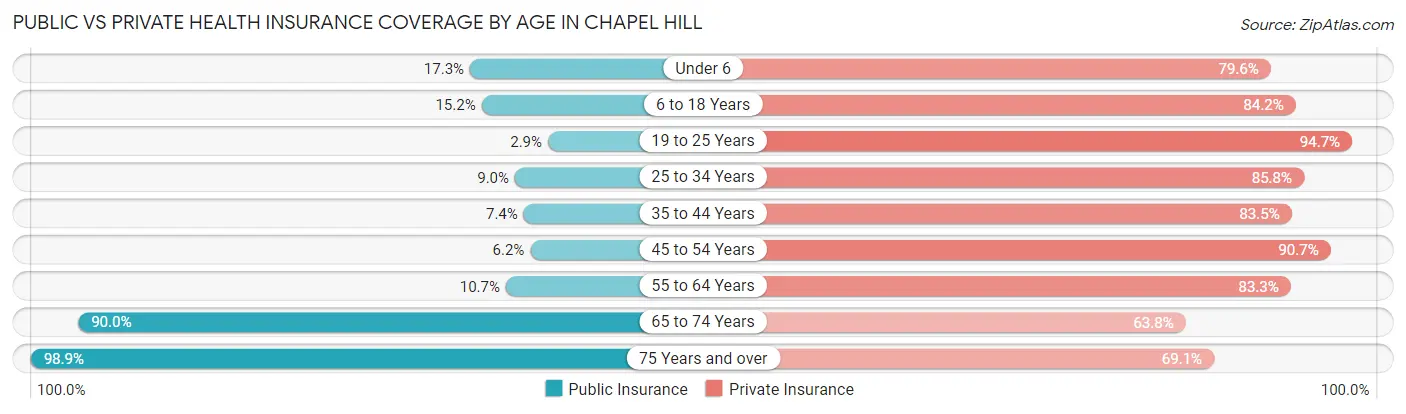
| Age Bracket | Public Insurance | Private Insurance |
| Under 6 | 397 (17.3%) | 1,822 (79.6%) |
| 6 to 18 Years | 1,482 (15.2%) | 8,217 (84.2%) |
| 19 to 25 Years | 514 (2.9%) | 16,928 (94.7%) |
| 25 to 34 Years | 533 (9.0%) | 5,080 (85.8%) |
| 35 to 44 Years | 393 (7.4%) | 4,446 (83.5%) |
| 45 to 54 Years | 375 (6.1%) | 5,532 (90.7%) |
| 55 to 64 Years | 487 (10.7%) | 3,800 (83.3%) |
| 65 to 74 Years | 3,536 (90.0%) | 2,505 (63.8%) |
| 75 Years and over | 2,936 (98.9%) | 2,051 (69.1%) |
| Total | 10,653 (18.1%) | 50,381 (85.8%) |
Disability Status by Sex by Age in Chapel Hill
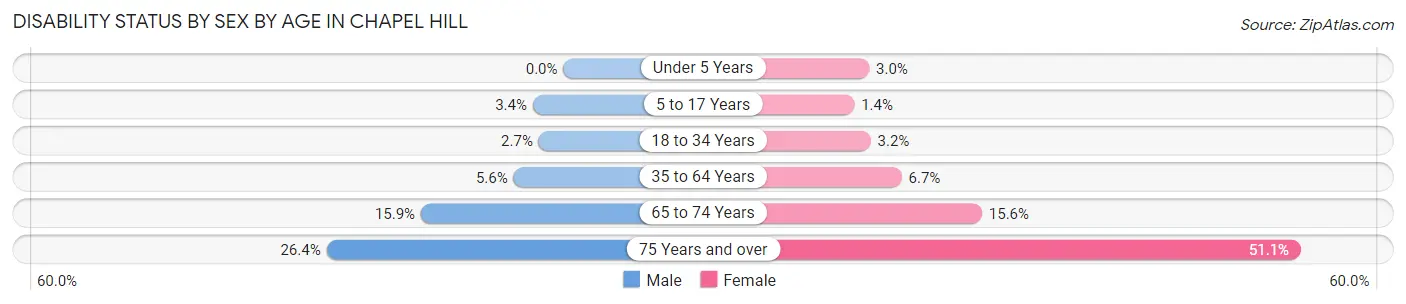
| Age Bracket | Male | Female |
| Under 5 Years | 0 (0.0%) | 24 (3.0%) |
| 5 to 17 Years | 146 (3.4%) | 44 (1.4%) |
| 18 to 34 Years | 316 (2.7%) | 477 (3.2%) |
| 35 to 64 Years | 430 (5.6%) | 549 (6.7%) |
| 65 to 74 Years | 267 (15.9%) | 350 (15.6%) |
| 75 Years and over | 350 (26.4%) | 840 (51.1%) |
Disability Class by Sex by Age in Chapel Hill
Disability Class: Hearing Difficulty
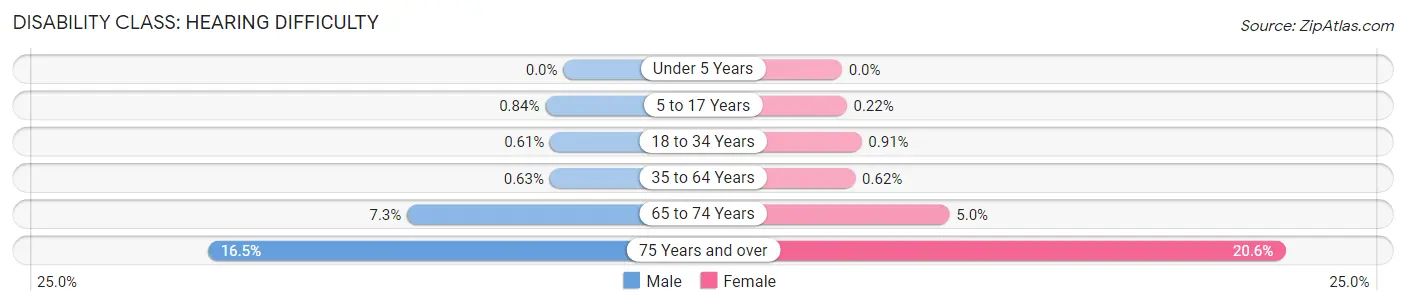
| Age Bracket | Male | Female |
| Under 5 Years | 0 (0.0%) | 0 (0.0%) |
| 5 to 17 Years | 36 (0.8%) | 7 (0.2%) |
| 18 to 34 Years | 71 (0.6%) | 135 (0.9%) |
| 35 to 64 Years | 49 (0.6%) | 51 (0.6%) |
| 65 to 74 Years | 122 (7.2%) | 112 (5.0%) |
| 75 Years and over | 219 (16.5%) | 338 (20.6%) |
Disability Class: Vision Difficulty
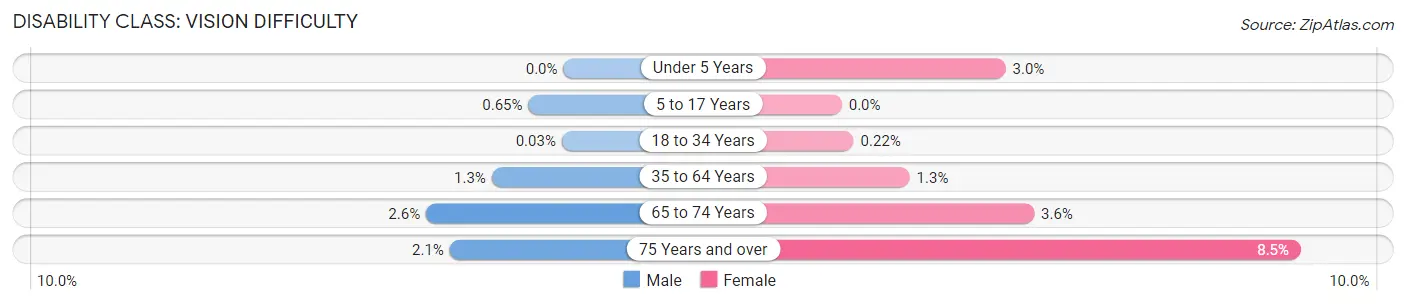
| Age Bracket | Male | Female |
| Under 5 Years | 0 (0.0%) | 24 (3.0%) |
| 5 to 17 Years | 28 (0.6%) | 0 (0.0%) |
| 18 to 34 Years | 3 (0.0%) | 33 (0.2%) |
| 35 to 64 Years | 103 (1.3%) | 104 (1.3%) |
| 65 to 74 Years | 43 (2.5%) | 80 (3.6%) |
| 75 Years and over | 28 (2.1%) | 140 (8.5%) |
Disability Class: Cognitive Difficulty
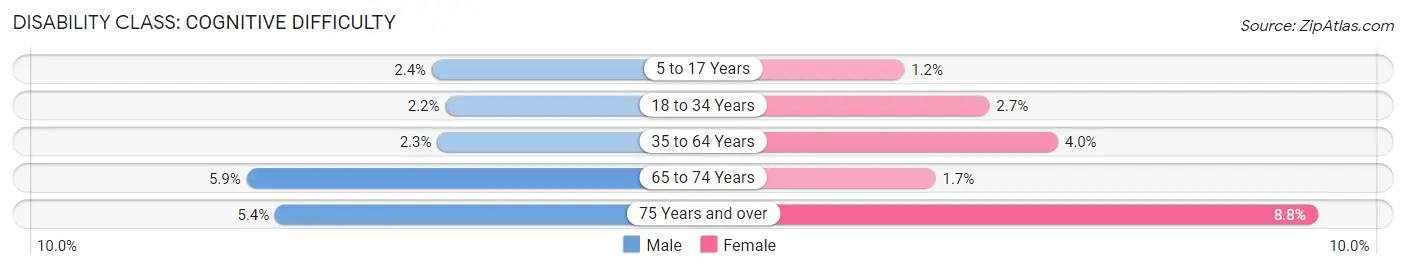
| Age Bracket | Male | Female |
| 5 to 17 Years | 105 (2.4%) | 37 (1.2%) |
| 18 to 34 Years | 253 (2.2%) | 407 (2.7%) |
| 35 to 64 Years | 181 (2.3%) | 330 (4.0%) |
| 65 to 74 Years | 99 (5.9%) | 39 (1.7%) |
| 75 Years and over | 71 (5.3%) | 145 (8.8%) |
Disability Class: Ambulatory Difficulty
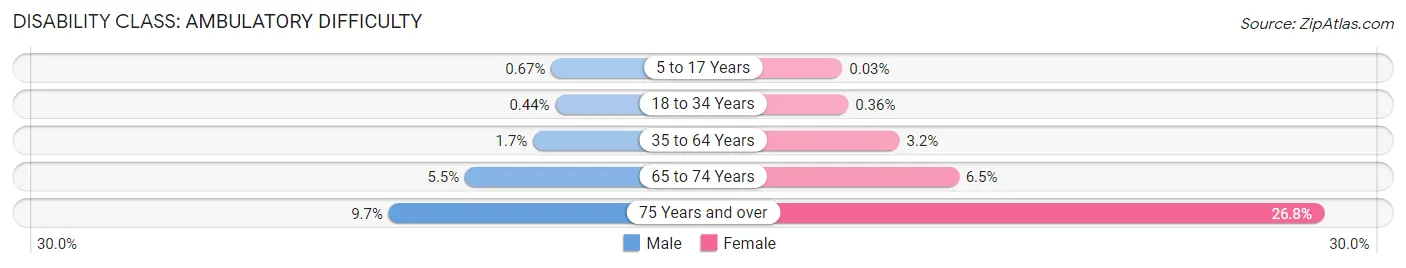
| Age Bracket | Male | Female |
| 5 to 17 Years | 29 (0.7%) | 1 (0.0%) |
| 18 to 34 Years | 51 (0.4%) | 54 (0.4%) |
| 35 to 64 Years | 130 (1.7%) | 265 (3.2%) |
| 65 to 74 Years | 92 (5.5%) | 146 (6.5%) |
| 75 Years and over | 129 (9.7%) | 441 (26.8%) |
Disability Class: Self-Care Difficulty
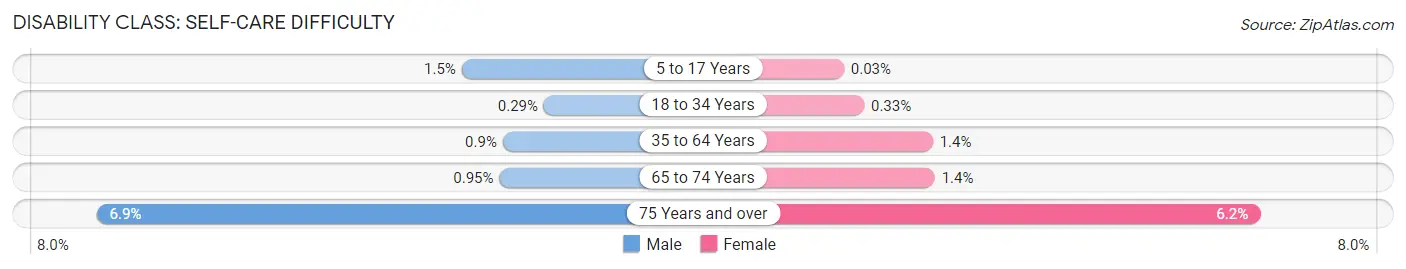
| Age Bracket | Male | Female |
| 5 to 17 Years | 65 (1.5%) | 1 (0.0%) |
| 18 to 34 Years | 33 (0.3%) | 49 (0.3%) |
| 35 to 64 Years | 70 (0.9%) | 111 (1.3%) |
| 65 to 74 Years | 16 (0.9%) | 31 (1.4%) |
| 75 Years and over | 92 (6.9%) | 102 (6.2%) |
Technology Access in Chapel Hill
Computing Device Access in Chapel Hill
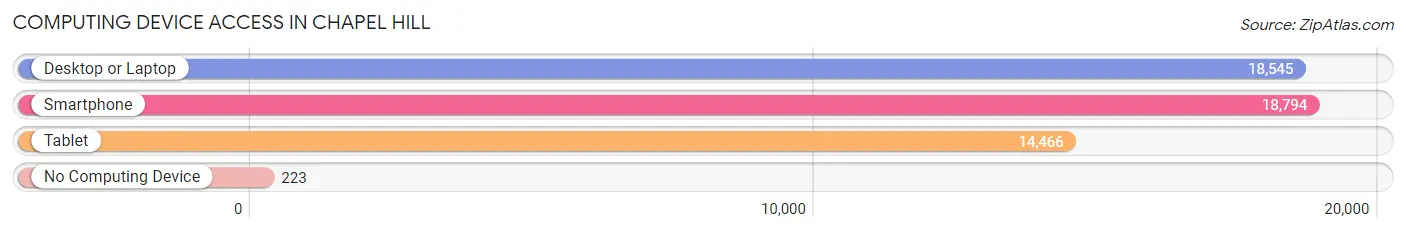
| Device Type | # Households | % Households |
| Desktop or Laptop | 18,545 | 92.9% |
| Smartphone | 18,794 | 94.1% |
| Tablet | 14,466 | 72.5% |
| No Computing Device | 223 | 1.1% |
| Total | 19,965 | 100.0% |
Internet Access in Chapel Hill
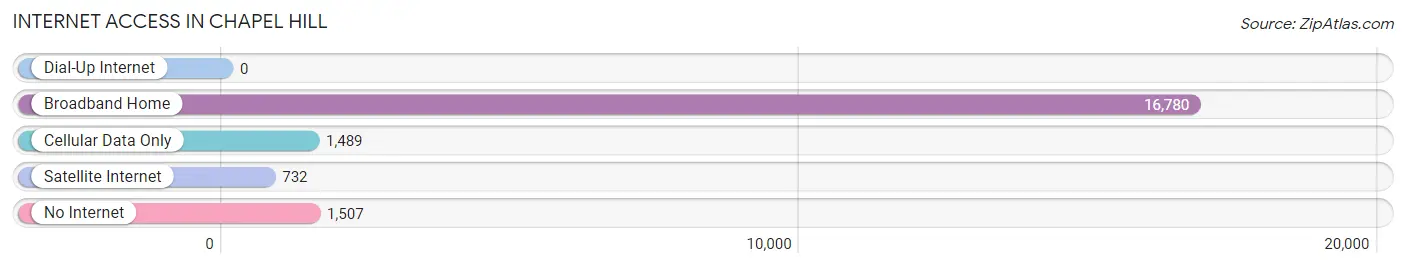
| Internet Type | # Households | % Households |
| Dial-Up Internet | 0 | 0.0% |
| Broadband Home | 16,780 | 84.1% |
| Cellular Data Only | 1,489 | 7.5% |
| Satellite Internet | 732 | 3.7% |
| No Internet | 1,507 | 7.5% |
| Total | 19,965 | 100.0% |
Chapel Hill Summary
Chapel Hill, North Carolina is a vibrant and diverse town located in the heart of the Research Triangle region of North Carolina. It is home to the University of North Carolina at Chapel Hill, one of the oldest public universities in the United States. The town is known for its vibrant culture, excellent educational opportunities, and its commitment to sustainability.
Geography
Chapel Hill is located in Orange County, North Carolina, in the Piedmont region of the state. It is situated at the intersection of Interstate 40 and US 15-501, about 10 miles west of Durham and 25 miles northwest of Raleigh. The town is bordered by the towns of Carrboro, Hillsborough, and Pittsboro. The town covers an area of approximately 21.5 square miles, with a population of 59,000 people as of the 2020 census.
The town is situated on a rolling terrain, with elevations ranging from 400 to 600 feet above sea level. The town is located in the Piedmont region of North Carolina, which is characterized by rolling hills and valleys. The town is located in the watershed of the Haw River, which flows through the town and is a major source of drinking water for the area.
Climate
Chapel Hill has a humid subtropical climate, with hot, humid summers and mild winters. The average annual temperature is around 60°F, with average highs in the summer reaching the mid-80s and lows in the winter reaching the mid-30s. The town receives an average of 48 inches of precipitation per year, with most of it falling in the summer months.
Economy
Chapel Hill is home to a diverse economy, with a mix of industries including education, healthcare, technology, and retail. The University of North Carolina at Chapel Hill is the largest employer in the town, with over 20,000 employees. Other major employers include UNC Health Care, IBM, and GlaxoSmithKline. The town also has a thriving retail sector, with many shops, restaurants, and other businesses located in the downtown area.
Demographics
As of the 2020 census, the population of Chapel Hill was 59,000 people. The town is racially diverse, with a population that is 54.3% White, 22.2% African American, 11.2% Asian, and 8.3% Hispanic or Latino. The median household income in the town is $68,000, and the median home value is $400,000.
Chapel Hill is a vibrant and diverse town with a rich history and a commitment to sustainability. It is home to a thriving economy and excellent educational opportunities, making it an attractive place to live and work.
Common Questions
What is Per Capita Income in Chapel Hill?
Per Capita income in Chapel Hill is $47,631.
What is the Median Family Income in Chapel Hill?
Median Family Income in Chapel Hill is $165,154.
What is the Median Household income in Chapel Hill?
Median Household Income in Chapel Hill is $85,940.
What is Income or Wage Gap in Chapel Hill?
Income or Wage Gap in Chapel Hill is 30.0%.
Women in Chapel Hill earn 70.0 cents for every dollar earned by a man.
What is Family Income Deficit in Chapel Hill?
Family Income Deficit in Chapel Hill is $9,991.
Families that are below poverty line in Chapel Hill earn $9,991 less on average than the poverty threshold level.
What is Inequality or Gini Index in Chapel Hill?
Inequality or Gini Index in Chapel Hill is 0.54.
What is the Total Population of Chapel Hill?
Total Population of Chapel Hill is 58,919.
What is the Total Male Population of Chapel Hill?
Total Male Population of Chapel Hill is 27,817.
What is the Total Female Population of Chapel Hill?
Total Female Population of Chapel Hill is 31,102.
What is the Ratio of Males per 100 Females in Chapel Hill?
There are 89.44 Males per 100 Females in Chapel Hill.
What is the Ratio of Females per 100 Males in Chapel Hill?
There are 111.81 Females per 100 Males in Chapel Hill.
What is the Median Population Age in Chapel Hill?
Median Population Age in Chapel Hill is 25.6 Years.
What is the Average Family Size in Chapel Hill
Average Family Size in Chapel Hill is 3.0 People.
What is the Average Household Size in Chapel Hill
Average Household Size in Chapel Hill is 2.4 People.
How Large is the Labor Force in Chapel Hill?
There are 29,645 People in the Labor Forcein in Chapel Hill.
What is the Percentage of People in the Labor Force in Chapel Hill?
58.2% of People are in the Labor Force in Chapel Hill.
What is the Unemployment Rate in Chapel Hill?
Unemployment Rate in Chapel Hill is 4.7%.