Westminster, CO Map & Demographics
Westminster Map
Westminster Overview
$47,856
PER CAPITA INCOME
$113,832
AVG FAMILY INCOME
$90,651
AVG HOUSEHOLD INCOME
24.4%
WAGE / INCOME GAP [ % ]
75.6¢/ $1
WAGE / INCOME GAP [ $ ]
$8,871
FAMILY INCOME DEFICIT
0.41
INEQUALITY / GINI INDEX
115,502
TOTAL POPULATION
58,547
MALE POPULATION
56,955
FEMALE POPULATION
102.80
MALES / 100 FEMALES
97.28
FEMALES / 100 MALES
37.4
MEDIAN AGE
3.0
AVG FAMILY SIZE
2.5
AVG HOUSEHOLD SIZE
69,921
LABOR FORCE [ PEOPLE ]
73.0%
PERCENT IN LABOR FORCE
4.1%
UNEMPLOYMENT RATE
Income in Westminster
Income Overview in Westminster
Per Capita Income in Westminster is $47,856, while median incomes of families and households are $113,832 and $90,651 respectively.
| Characteristic | Number | Measure |
| Per Capita Income | 115,502 | $47,856 |
| Median Family Income | 29,383 | $113,832 |
| Mean Family Income | 29,383 | $137,327 |
| Median Household Income | 47,030 | $90,651 |
| Mean Household Income | 47,030 | $115,020 |
| Income Deficit | 29,383 | $8,871 |
| Wage / Income Gap (%) | 115,502 | 24.41% |
| Wage / Income Gap ($) | 115,502 | 75.59¢ per $1 |
| Gini / Inequality Index | 115,502 | 0.41 |
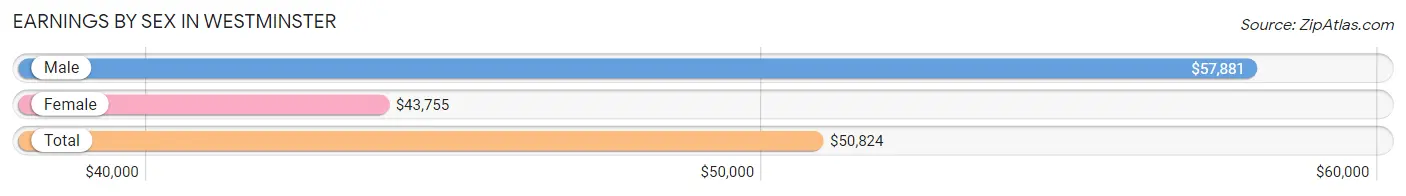
Earnings by Sex in Westminster
Average Earnings in Westminster are $50,824, $57,881 for men and $43,755 for women, a difference of 24.4%.
| Sex | Number | Average Earnings |
| Male | 39,337 (54.5%) | $57,881 |
| Female | 32,796 (45.5%) | $43,755 |
| Total | 72,133 (100.0%) | $50,824 |
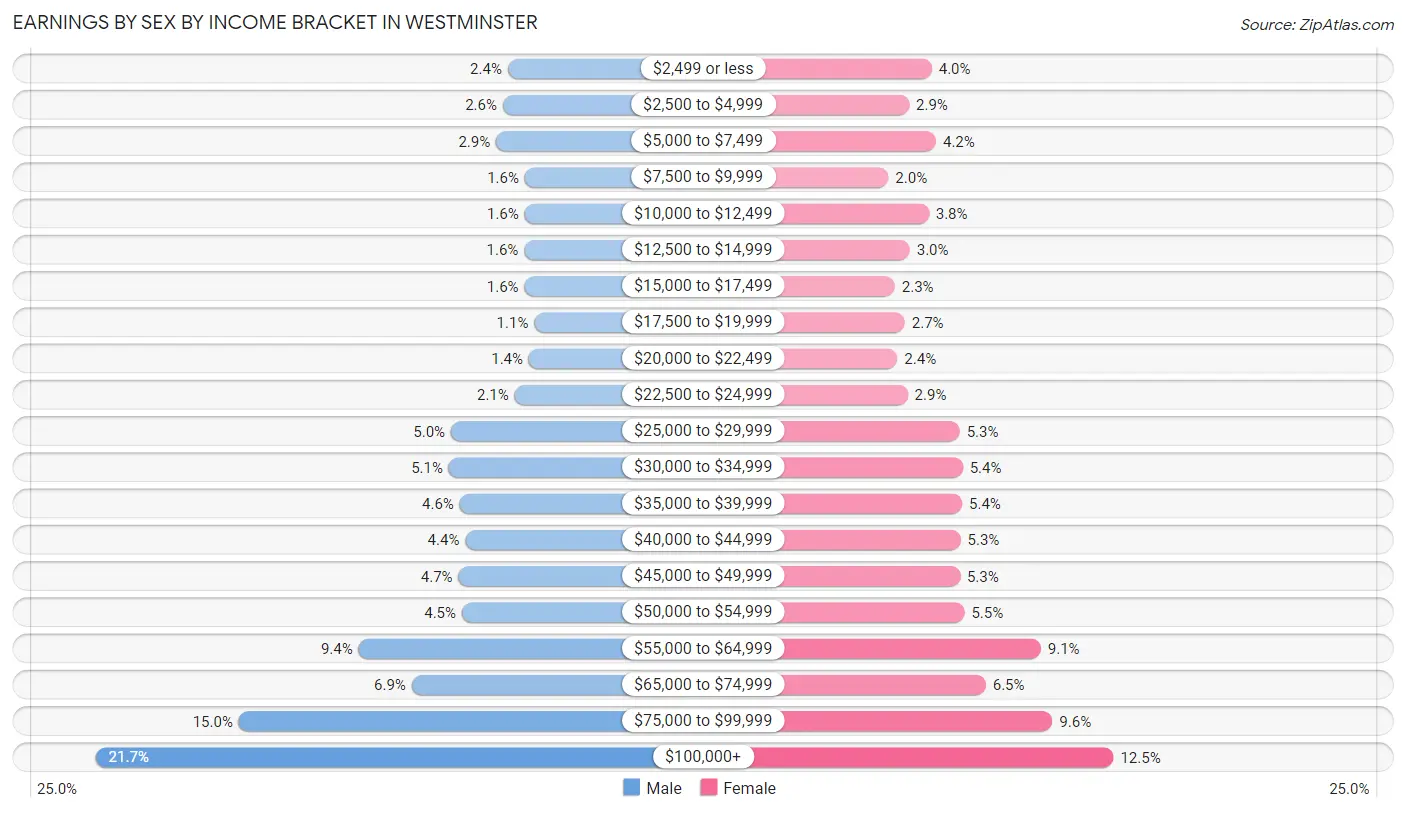
Earnings by Sex by Income Bracket in Westminster
The most common earnings brackets in Westminster are $100,000+ for men (8,525 | 21.7%) and $100,000+ for women (4,097 | 12.5%).
| Income | Male | Female |
| $2,499 or less | 931 (2.4%) | 1,306 (4.0%) |
| $2,500 to $4,999 | 1,023 (2.6%) | 958 (2.9%) |
| $5,000 to $7,499 | 1,148 (2.9%) | 1,370 (4.2%) |
| $7,500 to $9,999 | 619 (1.6%) | 639 (1.9%) |
| $10,000 to $12,499 | 623 (1.6%) | 1,258 (3.8%) |
| $12,500 to $14,999 | 630 (1.6%) | 966 (2.9%) |
| $15,000 to $17,499 | 625 (1.6%) | 739 (2.2%) |
| $17,500 to $19,999 | 443 (1.1%) | 893 (2.7%) |
| $20,000 to $22,499 | 542 (1.4%) | 778 (2.4%) |
| $22,500 to $24,999 | 807 (2.1%) | 935 (2.9%) |
| $25,000 to $29,999 | 1,979 (5.0%) | 1,734 (5.3%) |
| $30,000 to $34,999 | 2,017 (5.1%) | 1,782 (5.4%) |
| $35,000 to $39,999 | 1,818 (4.6%) | 1,771 (5.4%) |
| $40,000 to $44,999 | 1,714 (4.4%) | 1,749 (5.3%) |
| $45,000 to $49,999 | 1,840 (4.7%) | 1,738 (5.3%) |
| $50,000 to $54,999 | 1,779 (4.5%) | 1,806 (5.5%) |
| $55,000 to $64,999 | 3,683 (9.4%) | 2,982 (9.1%) |
| $65,000 to $74,999 | 2,704 (6.9%) | 2,136 (6.5%) |
| $75,000 to $99,999 | 5,887 (15.0%) | 3,159 (9.6%) |
| $100,000+ | 8,525 (21.7%) | 4,097 (12.5%) |
| Total | 39,337 (100.0%) | 32,796 (100.0%) |
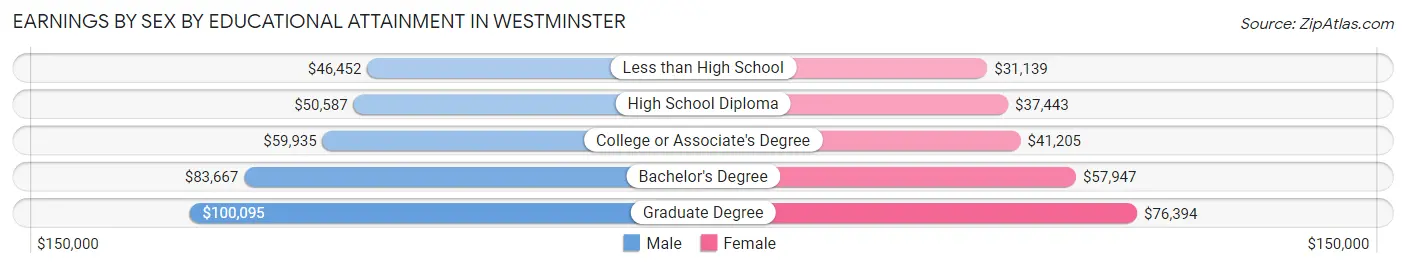
Earnings by Sex by Educational Attainment in Westminster
Average earnings in Westminster are $64,823 for men and $50,077 for women, a difference of 22.8%. Men with an educational attainment of graduate degree enjoy the highest average annual earnings of $100,095, while those with less than high school education earn the least with $46,452. Women with an educational attainment of graduate degree earn the most with the average annual earnings of $76,394, while those with less than high school education have the smallest earnings of $31,139.
| Educational Attainment | Male Income | Female Income |
| Less than High School | $46,452 | $31,139 |
| High School Diploma | $50,587 | $37,443 |
| College or Associate's Degree | $59,935 | $41,205 |
| Bachelor's Degree | $83,667 | $57,947 |
| Graduate Degree | $100,095 | $76,394 |
| Total | $64,823 | $50,077 |
Family Income in Westminster
Family Income Brackets in Westminster
According to the Westminster family income data, there are 6,729 families falling into the $100,000 to $149,999 income range, which is the most common income bracket and makes up 22.9% of all families. Conversely, the $10,000 to $14,999 income bracket is the least frequent group with only 176 families (0.6%) belonging to this category.
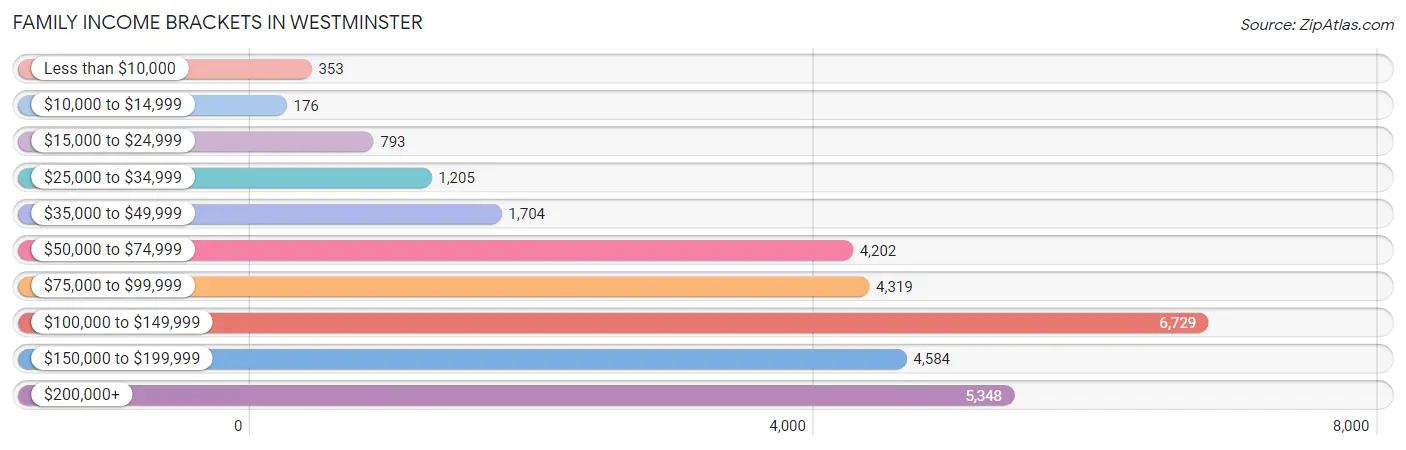
| Income Bracket | # Families | % Families |
| Less than $10,000 | 353 | 1.2% |
| $10,000 to $14,999 | 176 | 0.6% |
| $15,000 to $24,999 | 793 | 2.7% |
| $25,000 to $34,999 | 1,205 | 4.1% |
| $35,000 to $49,999 | 1,704 | 5.8% |
| $50,000 to $74,999 | 4,202 | 14.3% |
| $75,000 to $99,999 | 4,319 | 14.7% |
| $100,000 to $149,999 | 6,729 | 22.9% |
| $150,000 to $199,999 | 4,584 | 15.6% |
| $200,000+ | 5,348 | 18.2% |
Family Income by Famaliy Size in Westminster
5-person families (1,753 | 6.0%) account for the highest median family income in Westminster with $143,983 per family, while 2-person families (14,504 | 49.4%) have the highest median income of $50,240 per family member.
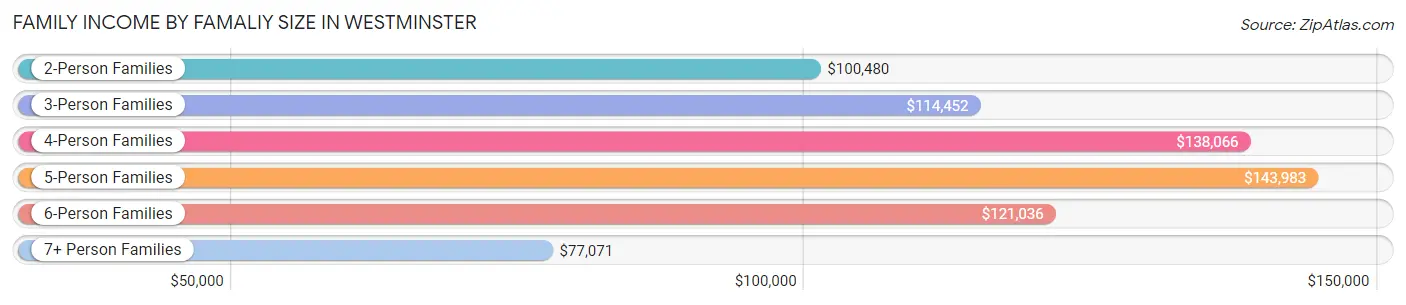
| Income Bracket | # Families | Median Income |
| 2-Person Families | 14,504 (49.4%) | $100,480 |
| 3-Person Families | 6,494 (22.1%) | $114,452 |
| 4-Person Families | 5,543 (18.9%) | $138,066 |
| 5-Person Families | 1,753 (6.0%) | $143,983 |
| 6-Person Families | 809 (2.8%) | $121,036 |
| 7+ Person Families | 280 (0.9%) | $77,071 |
| Total | 29,383 (100.0%) | $113,832 |
Family Income by Number of Earners in Westminster
The median family income in Westminster is $113,832, with families comprising 3+ earners (4,097) having the highest median family income of $154,023, while families with no earners (2,829) have the lowest median family income of $63,807, accounting for 13.9% and 9.6% of families, respectively.
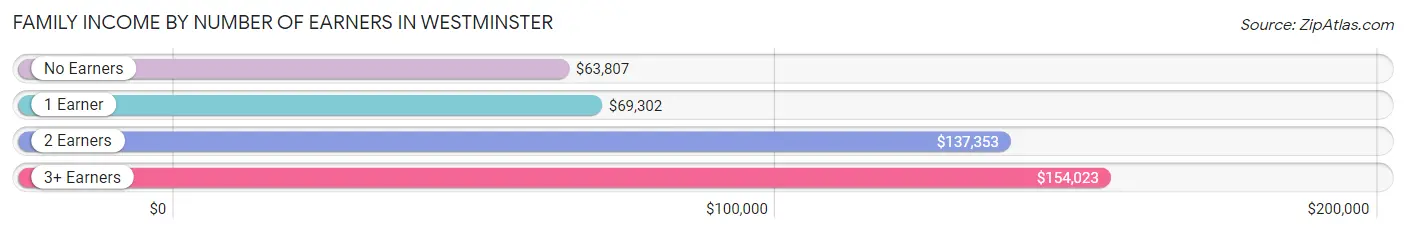
| Number of Earners | # Families | Median Income |
| No Earners | 2,829 (9.6%) | $63,807 |
| 1 Earner | 7,916 (26.9%) | $69,302 |
| 2 Earners | 14,541 (49.5%) | $137,353 |
| 3+ Earners | 4,097 (13.9%) | $154,023 |
| Total | 29,383 (100.0%) | $113,832 |
Household Income in Westminster
Household Income Brackets in Westminster
With 9,547 households falling in the category, the $100,000 to $149,999 income range is the most frequent in Westminster, accounting for 20.3% of all households. In contrast, only 658 households (1.4%) fall into the $10,000 to $14,999 income bracket, making it the least populous group.
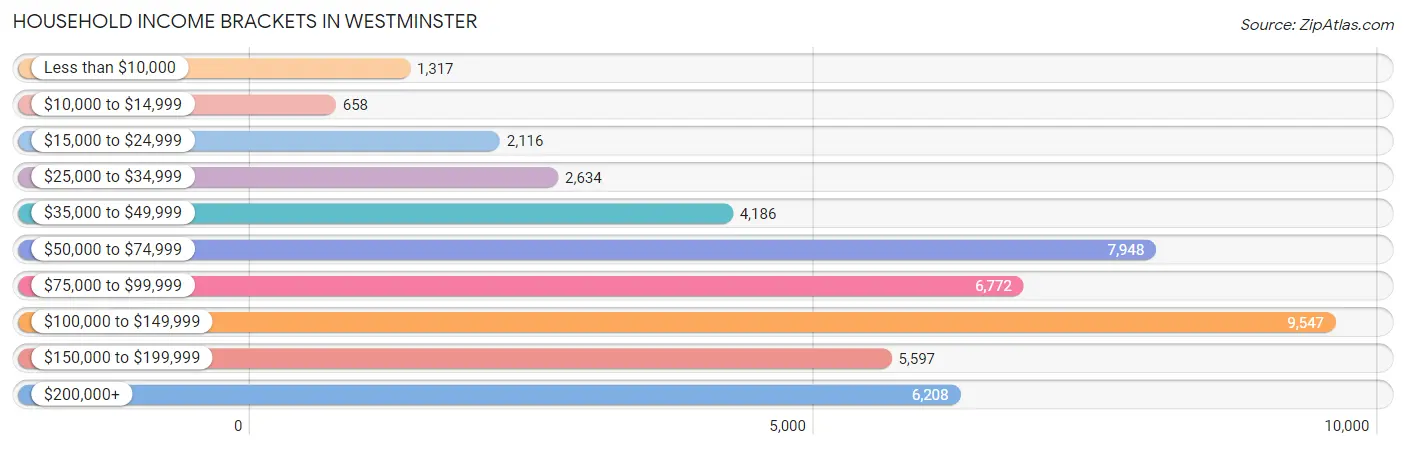
| Income Bracket | # Households | % Households |
| Less than $10,000 | 1,317 | 2.8% |
| $10,000 to $14,999 | 658 | 1.4% |
| $15,000 to $24,999 | 2,116 | 4.5% |
| $25,000 to $34,999 | 2,634 | 5.6% |
| $35,000 to $49,999 | 4,186 | 8.9% |
| $50,000 to $74,999 | 7,948 | 16.9% |
| $75,000 to $99,999 | 6,772 | 14.4% |
| $100,000 to $149,999 | 9,547 | 20.3% |
| $150,000 to $199,999 | 5,597 | 11.9% |
| $200,000+ | 6,208 | 13.2% |
Household Income by Householder Age in Westminster
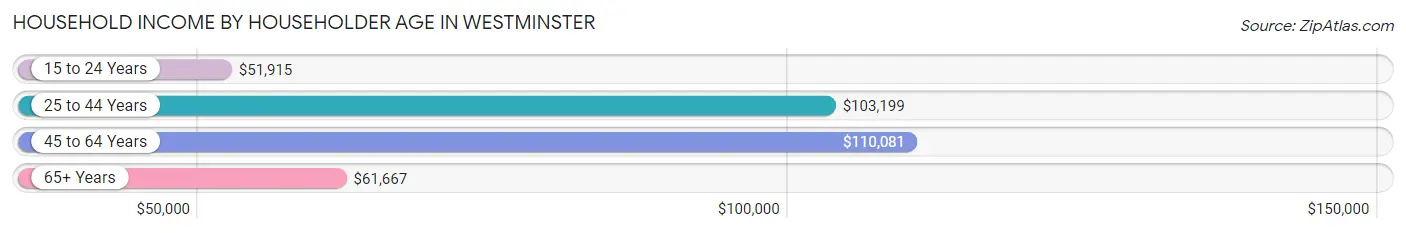
The median household income in Westminster is $90,651, with the highest median household income of $110,081 found in the 45 to 64 years age bracket for the primary householder. A total of 16,073 households (34.2%) fall into this category. Meanwhile, the 15 to 24 years age bracket for the primary householder has the lowest median household income of $51,915, with 1,982 households (4.2%) in this group.
| Income Bracket | # Households | Median Income |
| 15 to 24 Years | 1,982 (4.2%) | $51,915 |
| 25 to 44 Years | 18,379 (39.1%) | $103,199 |
| 45 to 64 Years | 16,073 (34.2%) | $110,081 |
| 65+ Years | 10,596 (22.5%) | $61,667 |
| Total | 47,030 (100.0%) | $90,651 |
Poverty in Westminster
Income Below Poverty by Sex and Age in Westminster
With 5.7% poverty level for males and 7.3% for females among the residents of Westminster, 6 to 11 year old males and 18 to 24 year old females are the most vulnerable to poverty, with 422 males (11.3%) and 518 females (10.8%) in their respective age groups living below the poverty level.
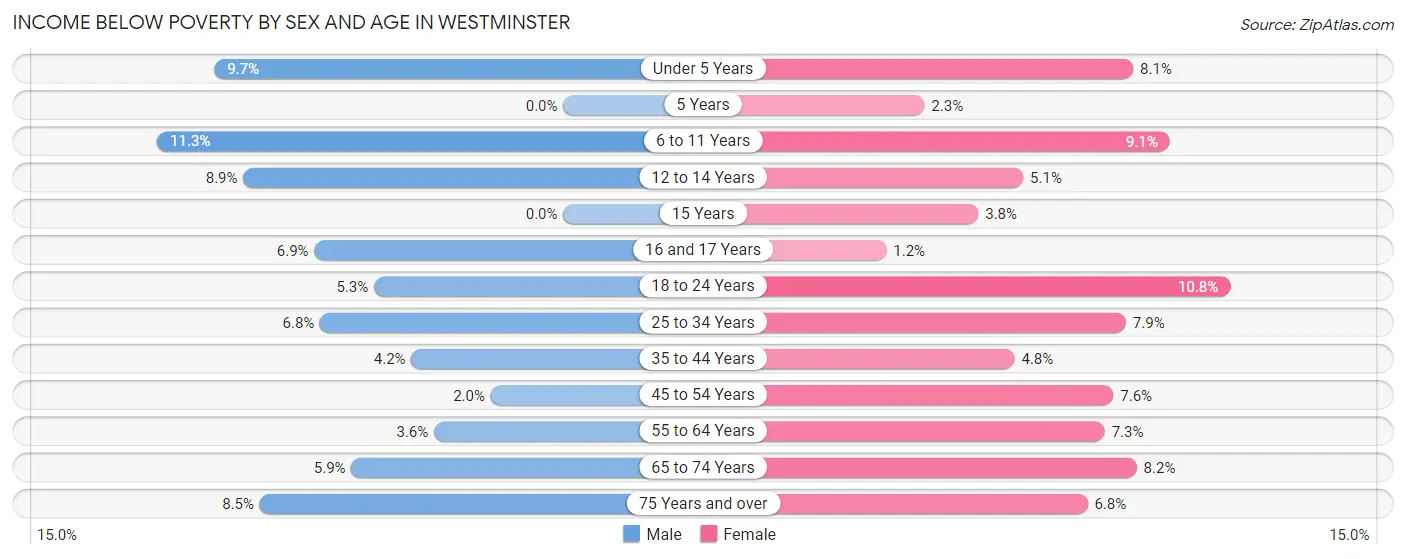
| Age Bracket | Male | Female |
| Under 5 Years | 304 (9.7%) | 216 (8.1%) |
| 5 Years | 0 (0.0%) | 12 (2.3%) |
| 6 to 11 Years | 422 (11.3%) | 327 (9.1%) |
| 12 to 14 Years | 172 (8.9%) | 113 (5.1%) |
| 15 Years | 0 (0.0%) | 24 (3.8%) |
| 16 and 17 Years | 93 (6.9%) | 19 (1.2%) |
| 18 to 24 Years | 313 (5.3%) | 518 (10.8%) |
| 25 to 34 Years | 722 (6.8%) | 748 (7.9%) |
| 35 to 44 Years | 385 (4.2%) | 366 (4.8%) |
| 45 to 54 Years | 145 (2.0%) | 533 (7.6%) |
| 55 to 64 Years | 248 (3.6%) | 550 (7.3%) |
| 65 to 74 Years | 277 (5.9%) | 465 (8.2%) |
| 75 Years and over | 218 (8.5%) | 235 (6.8%) |
| Total | 3,299 (5.7%) | 4,126 (7.3%) |
Income Above Poverty by Sex and Age in Westminster
According to the poverty statistics in Westminster, males aged 5 years and females aged 16 and 17 years are the age groups that are most secure financially, with 100.0% of males and 98.8% of females in these age groups living above the poverty line.
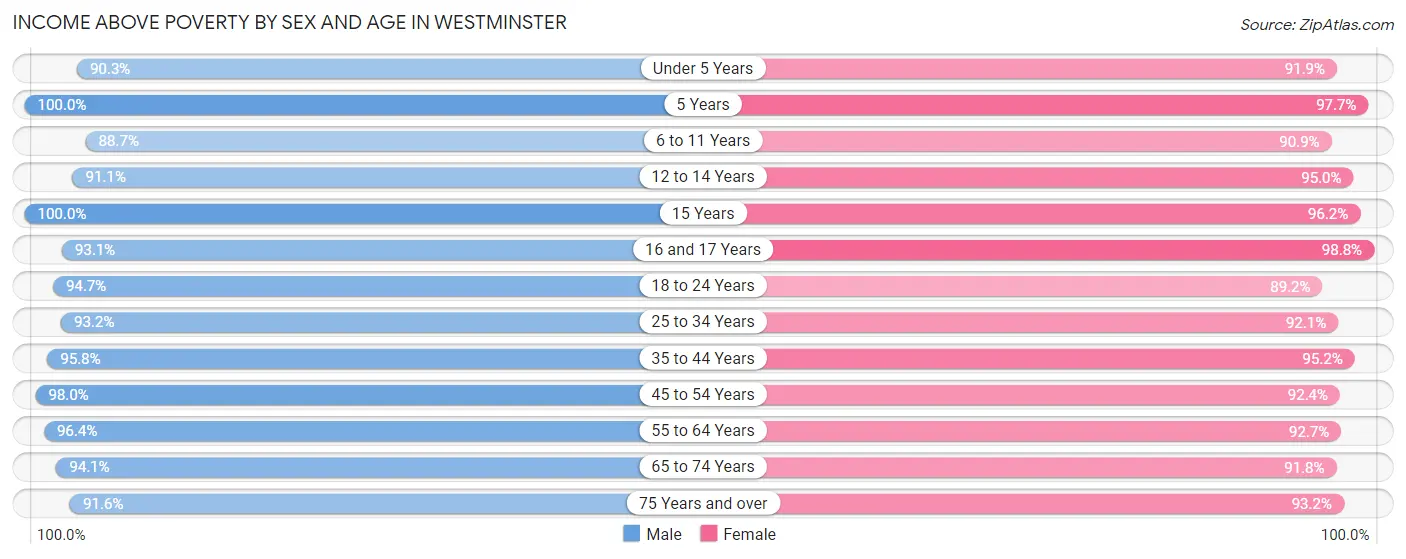
| Age Bracket | Male | Female |
| Under 5 Years | 2,825 (90.3%) | 2,447 (91.9%) |
| 5 Years | 696 (100.0%) | 509 (97.7%) |
| 6 to 11 Years | 3,308 (88.7%) | 3,254 (90.9%) |
| 12 to 14 Years | 1,759 (91.1%) | 2,123 (95.0%) |
| 15 Years | 473 (100.0%) | 608 (96.2%) |
| 16 and 17 Years | 1,249 (93.1%) | 1,515 (98.8%) |
| 18 to 24 Years | 5,627 (94.7%) | 4,275 (89.2%) |
| 25 to 34 Years | 9,944 (93.2%) | 8,706 (92.1%) |
| 35 to 44 Years | 8,713 (95.8%) | 7,245 (95.2%) |
| 45 to 54 Years | 7,021 (98.0%) | 6,519 (92.4%) |
| 55 to 64 Years | 6,639 (96.4%) | 6,966 (92.7%) |
| 65 to 74 Years | 4,416 (94.1%) | 5,201 (91.8%) |
| 75 Years and over | 2,362 (91.5%) | 3,203 (93.2%) |
| Total | 55,032 (94.3%) | 52,571 (92.7%) |
Income Below Poverty Among Married-Couple Families in Westminster
The poverty statistics for married-couple families in Westminster show that 2.2% or 492 of the total 21,911 families live below the poverty line. Families with 3 or 4 children have the highest poverty rate of 8.6%, comprising of 103 families. On the other hand, families with 1 or 2 children have the lowest poverty rate of 0.9%, which includes 69 families.
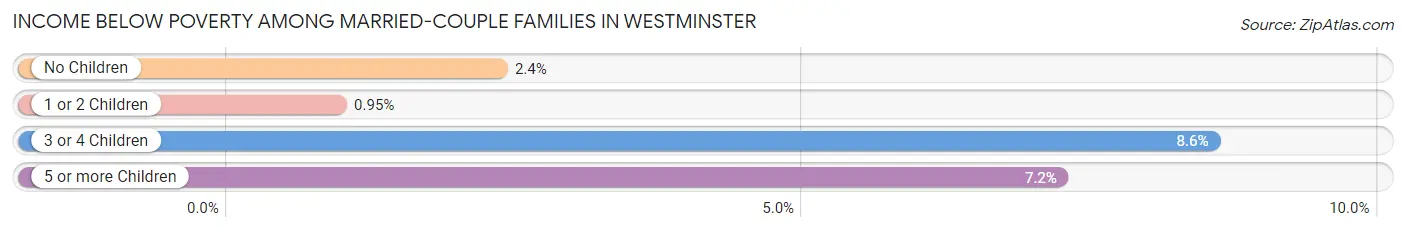
| Children | Above Poverty | Below Poverty |
| No Children | 13,056 (97.7%) | 314 (2.4%) |
| 1 or 2 Children | 7,184 (99.1%) | 69 (0.9%) |
| 3 or 4 Children | 1,102 (91.4%) | 103 (8.6%) |
| 5 or more Children | 77 (92.8%) | 6 (7.2%) |
| Total | 21,419 (97.8%) | 492 (2.2%) |
Income Below Poverty Among Single-Parent Households in Westminster
According to the poverty data in Westminster, 3.3% or 85 single-father households and 12.2% or 601 single-mother households are living below the poverty line. Among single-father households, those with 1 or 2 children have the highest poverty rate, with 54 households (3.7%) experiencing poverty. Likewise, among single-mother households, those with 3 or 4 children have the highest poverty rate, with 150 households (45.6%) falling below the poverty line.

| Children | Single Father | Single Mother |
| No Children | 31 (3.1%) | 78 (3.7%) |
| 1 or 2 Children | 54 (3.7%) | 373 (15.4%) |
| 3 or 4 Children | 0 (0.0%) | 150 (45.6%) |
| 5 or more Children | 0 (0.0%) | 0 (0.0%) |
| Total | 85 (3.3%) | 601 (12.2%) |
Income Below Poverty Among Married-Couple vs Single-Parent Households in Westminster
The poverty data for Westminster shows that 492 of the married-couple family households (2.2%) and 686 of the single-parent households (9.2%) are living below the poverty level. Within the married-couple family households, those with 3 or 4 children have the highest poverty rate, with 103 households (8.6%) falling below the poverty line. Among the single-parent households, those with 3 or 4 children have the highest poverty rate, with 150 household (40.5%) living below poverty.
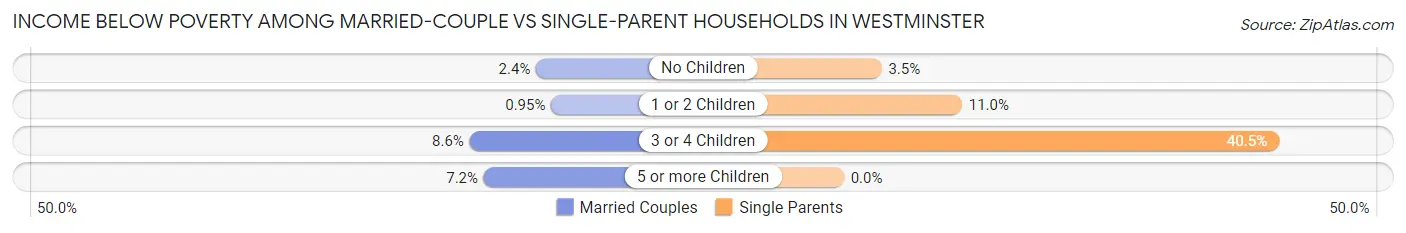
| Children | Married-Couple Families | Single-Parent Households |
| No Children | 314 (2.4%) | 109 (3.5%) |
| 1 or 2 Children | 69 (0.9%) | 427 (11.0%) |
| 3 or 4 Children | 103 (8.6%) | 150 (40.5%) |
| 5 or more Children | 6 (7.2%) | 0 (0.0%) |
| Total | 492 (2.2%) | 686 (9.2%) |
Race in Westminster
The most populous races in Westminster are White / Caucasian (89,397 | 77.4%), Hispanic or Latino (27,791 | 24.1%), and Two or more Races (12,993 | 11.3%).
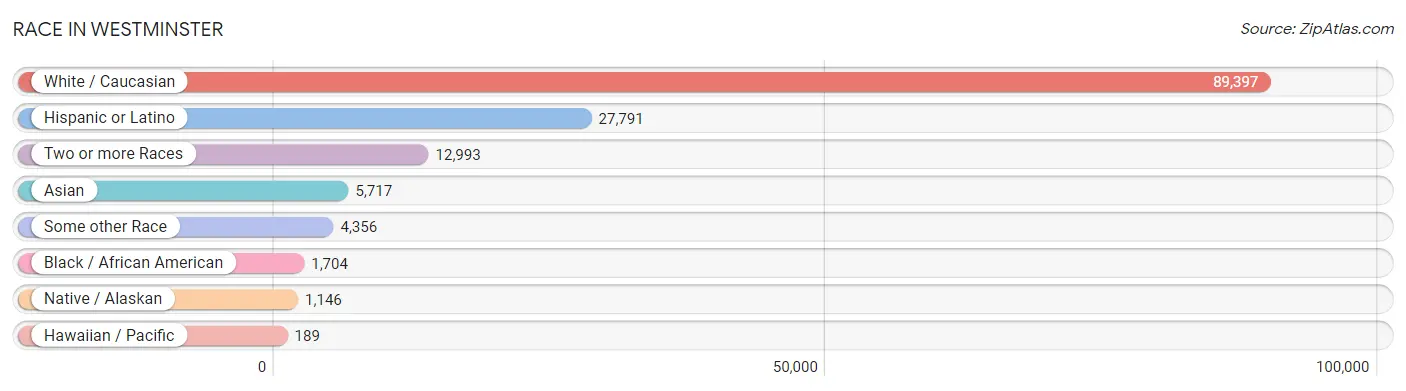
| Race | # Population | % Population |
| Asian | 5,717 | 5.0% |
| Black / African American | 1,704 | 1.5% |
| Hawaiian / Pacific | 189 | 0.2% |
| Hispanic or Latino | 27,791 | 24.1% |
| Native / Alaskan | 1,146 | 1.0% |
| White / Caucasian | 89,397 | 77.4% |
| Two or more Races | 12,993 | 11.3% |
| Some other Race | 4,356 | 3.8% |
| Total | 115,502 | 100.0% |
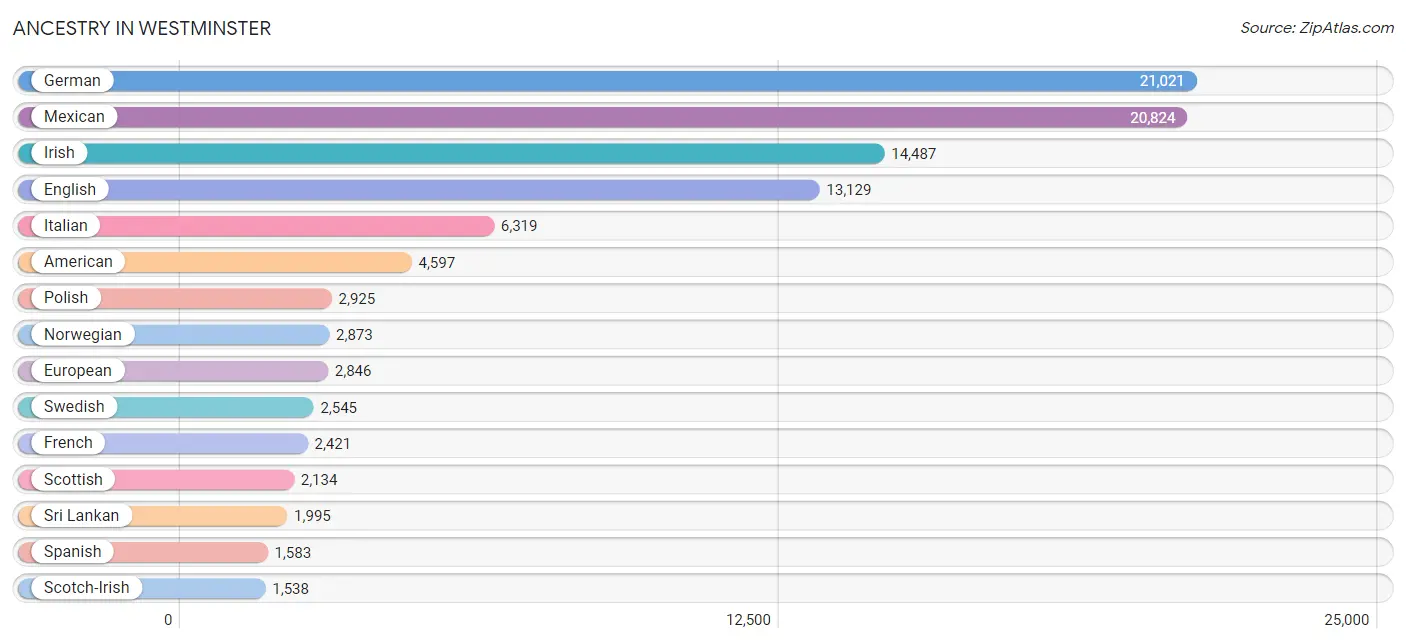
Ancestry in Westminster
The most populous ancestries reported in Westminster are German (21,021 | 18.2%), Mexican (20,824 | 18.0%), Irish (14,487 | 12.5%), English (13,129 | 11.4%), and Italian (6,319 | 5.5%), together accounting for 65.6% of all Westminster residents.
| Ancestry | # Population | % Population |
| African | 181 | 0.2% |
| Albanian | 14 | 0.0% |
| American | 4,597 | 4.0% |
| Apache | 339 | 0.3% |
| Arab | 471 | 0.4% |
| Argentinean | 251 | 0.2% |
| Armenian | 138 | 0.1% |
| Assyrian / Chaldean / Syriac | 15 | 0.0% |
| Australian | 19 | 0.0% |
| Austrian | 450 | 0.4% |
| Bangladeshi | 836 | 0.7% |
| Basque | 33 | 0.0% |
| Belgian | 147 | 0.1% |
| Bhutanese | 801 | 0.7% |
| Blackfeet | 40 | 0.0% |
| Brazilian | 16 | 0.0% |
| British | 626 | 0.5% |
| Bulgarian | 21 | 0.0% |
| Burmese | 631 | 0.5% |
| Cambodian | 141 | 0.1% |
| Canadian | 430 | 0.4% |
| Central American | 667 | 0.6% |
| Central American Indian | 71 | 0.1% |
| Cherokee | 193 | 0.2% |
| Cheyenne | 58 | 0.1% |
| Chippewa | 16 | 0.0% |
| Choctaw | 96 | 0.1% |
| Colombian | 136 | 0.1% |
| Comanche | 7 | 0.0% |
| Costa Rican | 94 | 0.1% |
| Cree | 40 | 0.0% |
| Creek | 32 | 0.0% |
| Croatian | 142 | 0.1% |
| Cuban | 200 | 0.2% |
| Czech | 721 | 0.6% |
| Czechoslovakian | 177 | 0.2% |
| Danish | 870 | 0.7% |
| Dominican | 16 | 0.0% |
| Dutch | 1,332 | 1.1% |
| Eastern European | 417 | 0.4% |
| Ecuadorian | 112 | 0.1% |
| Egyptian | 17 | 0.0% |
| English | 13,129 | 11.4% |
| Estonian | 54 | 0.1% |
| Ethiopian | 17 | 0.0% |
| European | 2,846 | 2.5% |
| Filipino | 19 | 0.0% |
| Finnish | 142 | 0.1% |
| French | 2,421 | 2.1% |
| French American Indian | 12 | 0.0% |
| French Canadian | 542 | 0.5% |
| German | 21,021 | 18.2% |
| German Russian | 20 | 0.0% |
| Ghanaian | 115 | 0.1% |
| Greek | 270 | 0.2% |
| Guamanian / Chamorro | 27 | 0.0% |
| Guatemalan | 55 | 0.1% |
| Haitian | 116 | 0.1% |
| Hmong | 16 | 0.0% |
| Honduran | 137 | 0.1% |
| Hopi | 13 | 0.0% |
| Hungarian | 274 | 0.2% |
| Indian (Asian) | 1,104 | 1.0% |
| Iranian | 219 | 0.2% |
| Irish | 14,487 | 12.5% |
| Iroquois | 81 | 0.1% |
| Israeli | 12 | 0.0% |
| Italian | 6,319 | 5.5% |
| Jamaican | 43 | 0.0% |
| Japanese | 45 | 0.0% |
| Jordanian | 188 | 0.2% |
| Kiowa | 9 | 0.0% |
| Korean | 939 | 0.8% |
| Laotian | 186 | 0.2% |
| Latvian | 37 | 0.0% |
| Lebanese | 178 | 0.2% |
| Lithuanian | 140 | 0.1% |
| Macedonian | 19 | 0.0% |
| Malaysian | 154 | 0.1% |
| Maltese | 17 | 0.0% |
| Menominee | 5 | 0.0% |
| Mexican | 20,824 | 18.0% |
| Mexican American Indian | 278 | 0.2% |
| Mongolian | 14 | 0.0% |
| Native Hawaiian | 232 | 0.2% |
| Navajo | 412 | 0.4% |
| New Zealander | 26 | 0.0% |
| Northern European | 296 | 0.3% |
| Norwegian | 2,873 | 2.5% |
| Osage | 7 | 0.0% |
| Pakistani | 134 | 0.1% |
| Palestinian | 57 | 0.1% |
| Pennsylvania German | 8 | 0.0% |
| Peruvian | 294 | 0.3% |
| Polish | 2,925 | 2.5% |
| Portuguese | 318 | 0.3% |
| Potawatomi | 14 | 0.0% |
| Pueblo | 61 | 0.1% |
| Puerto Rican | 314 | 0.3% |
| Romanian | 123 | 0.1% |
| Russian | 948 | 0.8% |
| Salvadoran | 381 | 0.3% |
| Samoan | 128 | 0.1% |
| Scandinavian | 508 | 0.4% |
| Scotch-Irish | 1,538 | 1.3% |
| Scottish | 2,134 | 1.8% |
| Serbian | 40 | 0.0% |
| Sioux | 374 | 0.3% |
| Slavic | 130 | 0.1% |
| Slovak | 128 | 0.1% |
| Slovene | 98 | 0.1% |
| South African | 7 | 0.0% |
| South American | 968 | 0.8% |
| South American Indian | 23 | 0.0% |
| Spaniard | 1,486 | 1.3% |
| Spanish | 1,583 | 1.4% |
| Spanish American | 73 | 0.1% |
| Sri Lankan | 1,995 | 1.7% |
| Subsaharan African | 632 | 0.5% |
| Swedish | 2,545 | 2.2% |
| Swiss | 383 | 0.3% |
| Syrian | 33 | 0.0% |
| Thai | 528 | 0.5% |
| Turkish | 119 | 0.1% |
| U.S. Virgin Islander | 14 | 0.0% |
| Ukrainian | 442 | 0.4% |
| Ute | 95 | 0.1% |
| Venezuelan | 175 | 0.2% |
| Welsh | 752 | 0.6% |
| West Indian | 23 | 0.0% |
| Yaqui | 49 | 0.0% |
| Yugoslavian | 208 | 0.2% | View All 132 Rows |
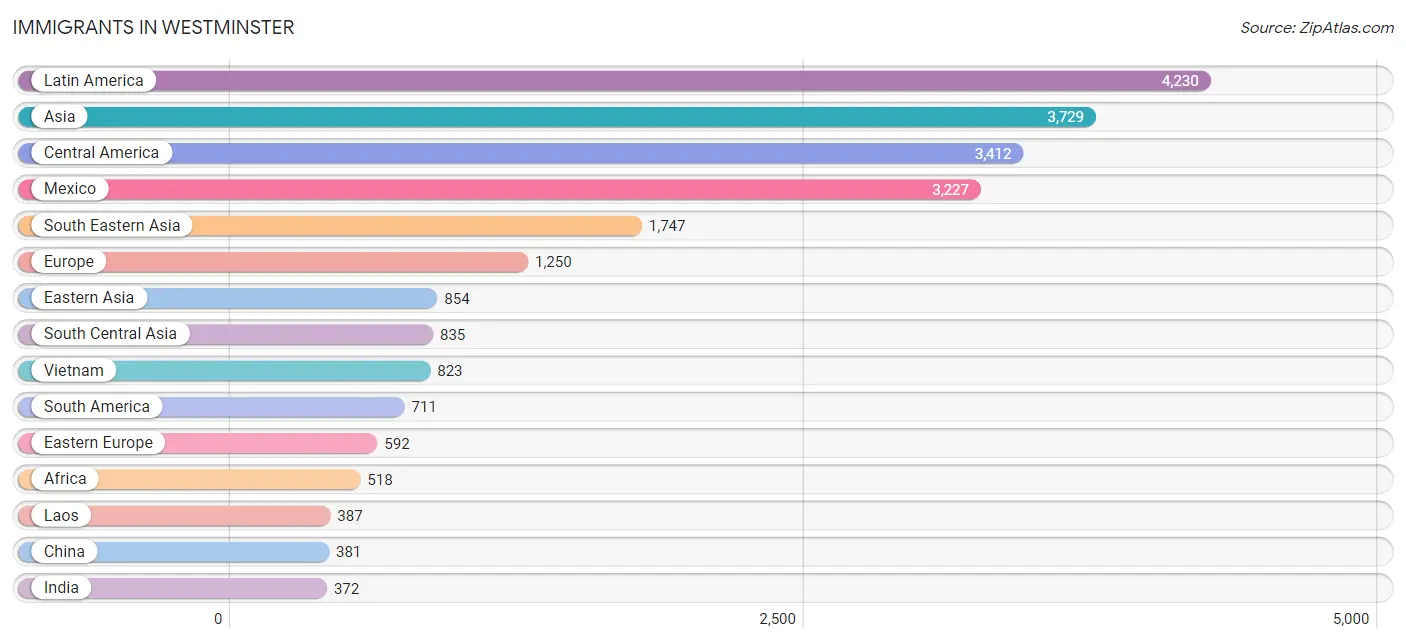
Immigrants in Westminster
The most numerous immigrant groups reported in Westminster came from Latin America (4,230 | 3.7%), Asia (3,729 | 3.2%), Central America (3,412 | 2.9%), Mexico (3,227 | 2.8%), and South Eastern Asia (1,747 | 1.5%), together accounting for 14.1% of all Westminster residents.
| Immigration Origin | # Population | % Population |
| Africa | 518 | 0.4% |
| Argentina | 75 | 0.1% |
| Asia | 3,729 | 3.2% |
| Austria | 7 | 0.0% |
| Belarus | 78 | 0.1% |
| Bosnia and Herzegovina | 74 | 0.1% |
| Brazil | 74 | 0.1% |
| Cambodia | 20 | 0.0% |
| Cameroon | 141 | 0.1% |
| Canada | 215 | 0.2% |
| Caribbean | 107 | 0.1% |
| Central America | 3,412 | 2.9% |
| Chile | 12 | 0.0% |
| China | 381 | 0.3% |
| Colombia | 212 | 0.2% |
| Congo | 108 | 0.1% |
| Croatia | 46 | 0.0% |
| Cuba | 56 | 0.1% |
| Czechoslovakia | 36 | 0.0% |
| Dominican Republic | 16 | 0.0% |
| Eastern Africa | 85 | 0.1% |
| Eastern Asia | 854 | 0.7% |
| Eastern Europe | 592 | 0.5% |
| Ecuador | 22 | 0.0% |
| Egypt | 42 | 0.0% |
| El Salvador | 64 | 0.1% |
| England | 125 | 0.1% |
| Europe | 1,250 | 1.1% |
| France | 35 | 0.0% |
| Germany | 181 | 0.2% |
| Ghana | 115 | 0.1% |
| Guatemala | 51 | 0.0% |
| Honduras | 70 | 0.1% |
| Hong Kong | 18 | 0.0% |
| India | 372 | 0.3% |
| Indonesia | 231 | 0.2% |
| Iran | 134 | 0.1% |
| Ireland | 91 | 0.1% |
| Israel | 61 | 0.1% |
| Italy | 13 | 0.0% |
| Japan | 82 | 0.1% |
| Jordan | 132 | 0.1% |
| Kazakhstan | 27 | 0.0% |
| Kenya | 15 | 0.0% |
| Korea | 323 | 0.3% |
| Kuwait | 16 | 0.0% |
| Laos | 387 | 0.3% |
| Latin America | 4,230 | 3.7% |
| Lebanon | 25 | 0.0% |
| Lithuania | 11 | 0.0% |
| Malaysia | 14 | 0.0% |
| Mexico | 3,227 | 2.8% |
| Micronesia | 40 | 0.0% |
| Middle Africa | 258 | 0.2% |
| Nepal | 252 | 0.2% |
| Netherlands | 11 | 0.0% |
| Northern Africa | 42 | 0.0% |
| Northern Europe | 299 | 0.3% |
| Oceania | 211 | 0.2% |
| Peru | 161 | 0.1% |
| Philippines | 137 | 0.1% |
| Poland | 75 | 0.1% |
| Romania | 26 | 0.0% |
| Russia | 149 | 0.1% |
| South Africa | 18 | 0.0% |
| South America | 711 | 0.6% |
| South Central Asia | 835 | 0.7% |
| South Eastern Asia | 1,747 | 1.5% |
| Southern Europe | 53 | 0.1% |
| Spain | 40 | 0.0% |
| Sweden | 27 | 0.0% |
| Switzerland | 22 | 0.0% |
| Taiwan | 6 | 0.0% |
| Thailand | 135 | 0.1% |
| Trinidad and Tobago | 23 | 0.0% |
| Turkey | 55 | 0.1% |
| Ukraine | 57 | 0.1% |
| Uzbekistan | 18 | 0.0% |
| Venezuela | 155 | 0.1% |
| Vietnam | 823 | 0.7% |
| Western Africa | 115 | 0.1% |
| Western Asia | 289 | 0.3% |
| Western Europe | 256 | 0.2% |
| Zimbabwe | 21 | 0.0% | View All 84 Rows |
Sex and Age in Westminster
Sex and Age in Westminster
The most populous age groups in Westminster are 30 to 34 Years (5,849 | 10.0%) for men and 30 to 34 Years (4,895 | 8.6%) for women.
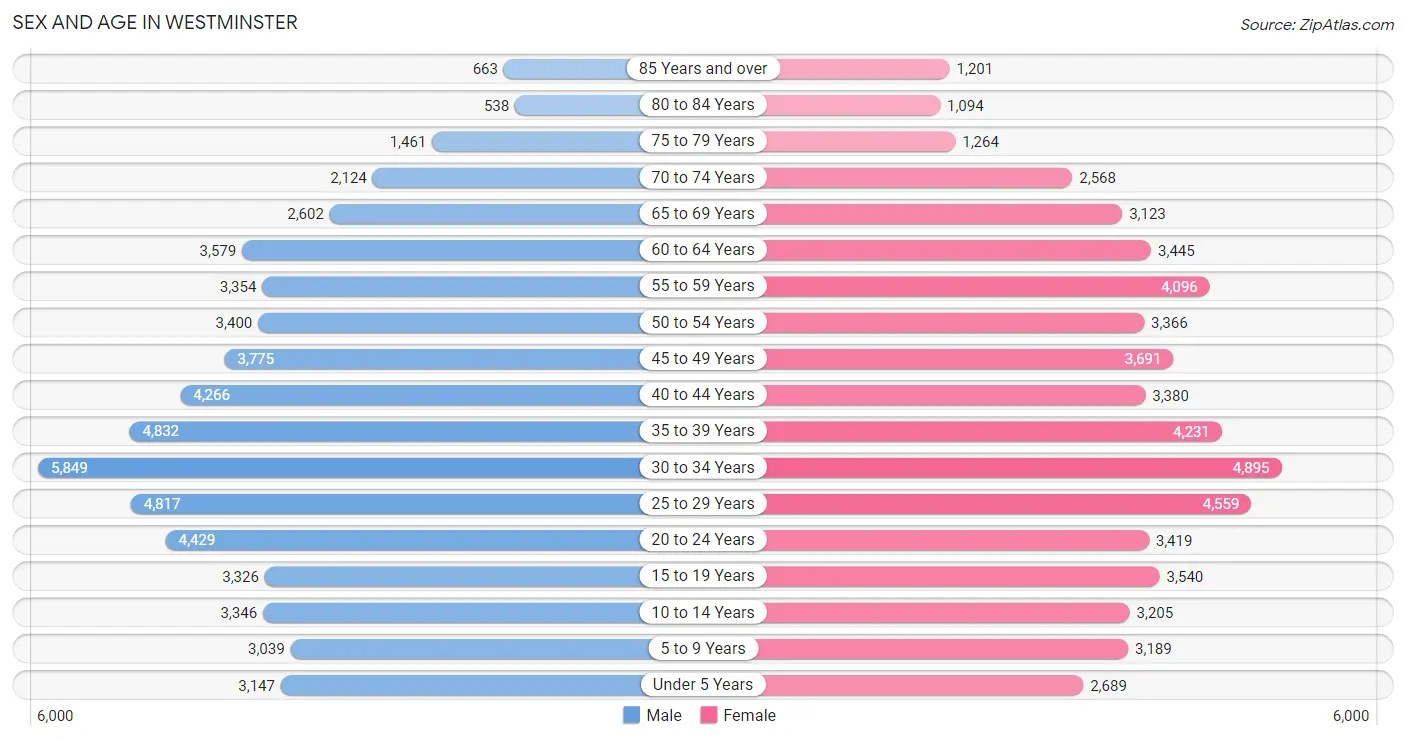
| Age Bracket | Male | Female |
| Under 5 Years | 3,147 (5.4%) | 2,689 (4.7%) |
| 5 to 9 Years | 3,039 (5.2%) | 3,189 (5.6%) |
| 10 to 14 Years | 3,346 (5.7%) | 3,205 (5.6%) |
| 15 to 19 Years | 3,326 (5.7%) | 3,540 (6.2%) |
| 20 to 24 Years | 4,429 (7.6%) | 3,419 (6.0%) |
| 25 to 29 Years | 4,817 (8.2%) | 4,559 (8.0%) |
| 30 to 34 Years | 5,849 (10.0%) | 4,895 (8.6%) |
| 35 to 39 Years | 4,832 (8.3%) | 4,231 (7.4%) |
| 40 to 44 Years | 4,266 (7.3%) | 3,380 (5.9%) |
| 45 to 49 Years | 3,775 (6.5%) | 3,691 (6.5%) |
| 50 to 54 Years | 3,400 (5.8%) | 3,366 (5.9%) |
| 55 to 59 Years | 3,354 (5.7%) | 4,096 (7.2%) |
| 60 to 64 Years | 3,579 (6.1%) | 3,445 (6.0%) |
| 65 to 69 Years | 2,602 (4.4%) | 3,123 (5.5%) |
| 70 to 74 Years | 2,124 (3.6%) | 2,568 (4.5%) |
| 75 to 79 Years | 1,461 (2.5%) | 1,264 (2.2%) |
| 80 to 84 Years | 538 (0.9%) | 1,094 (1.9%) |
| 85 Years and over | 663 (1.1%) | 1,201 (2.1%) |
| Total | 58,547 (100.0%) | 56,955 (100.0%) |
Families and Households in Westminster
Median Family Size in Westminster
The median family size in Westminster is 3.04 persons per family, with single female/mother families (4,906 | 16.7%) accounting for the largest median family size of 3.08 persons per family. On the other hand, single male/father families (2,566 | 8.7%) represent the smallest median family size with 2.81 persons per family.
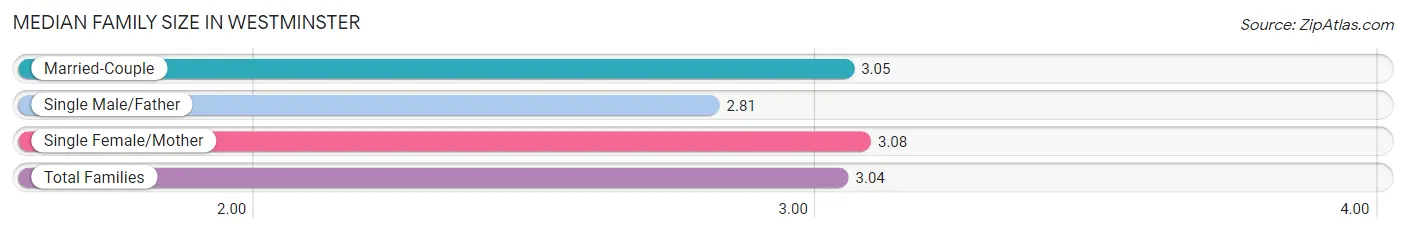
| Family Type | # Families | Family Size |
| Married-Couple | 21,911 (74.6%) | 3.05 |
| Single Male/Father | 2,566 (8.7%) | 2.81 |
| Single Female/Mother | 4,906 (16.7%) | 3.08 |
| Total Families | 29,383 (100.0%) | 3.04 |
Median Household Size in Westminster
The median household size in Westminster is 2.45 persons per household, with single female/mother households (4,906 | 10.4%) accounting for the largest median household size of 3.34 persons per household. non-family households (17,647 | 37.5%) represent the smallest median household size with 1.33 persons per household.
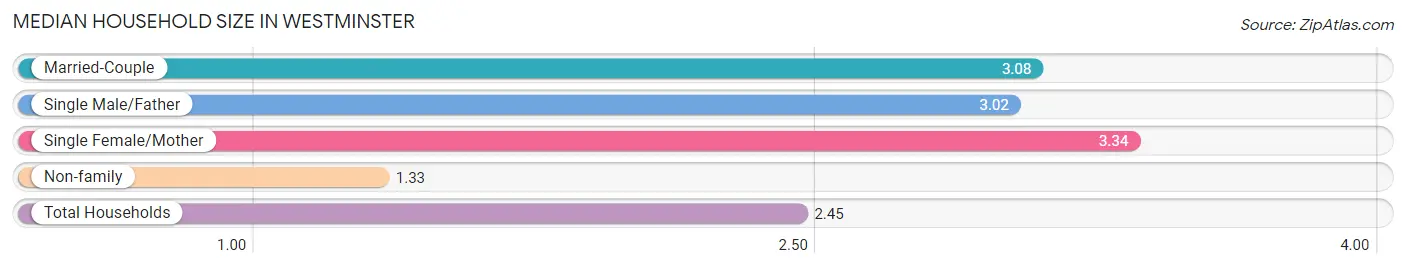
| Household Type | # Households | Household Size |
| Married-Couple | 21,911 (46.6%) | 3.08 |
| Single Male/Father | 2,566 (5.5%) | 3.02 |
| Single Female/Mother | 4,906 (10.4%) | 3.34 |
| Non-family | 17,647 (37.5%) | 1.33 |
| Total Households | 47,030 (100.0%) | 2.45 |
Household Size by Marriage Status in Westminster
Out of a total of 47,030 households in Westminster, 29,383 (62.5%) are family households, while 17,647 (37.5%) are nonfamily households. The most numerous type of family households are 2-person households, comprising 13,457, and the most common type of nonfamily households are 1-person households, comprising 13,099.
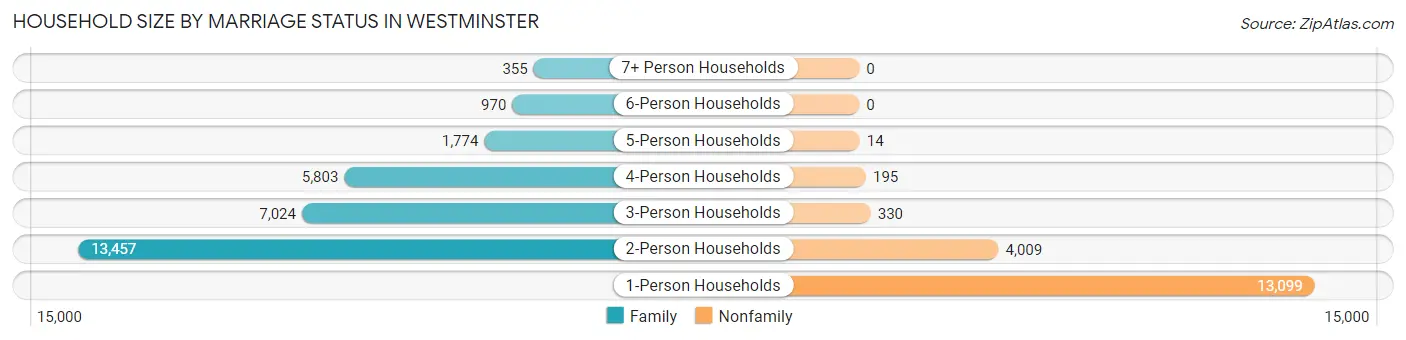
| Household Size | Family Households | Nonfamily Households |
| 1-Person Households | - | 13,099 (27.9%) |
| 2-Person Households | 13,457 (28.6%) | 4,009 (8.5%) |
| 3-Person Households | 7,024 (14.9%) | 330 (0.7%) |
| 4-Person Households | 5,803 (12.3%) | 195 (0.4%) |
| 5-Person Households | 1,774 (3.8%) | 14 (0.0%) |
| 6-Person Households | 970 (2.1%) | 0 (0.0%) |
| 7+ Person Households | 355 (0.7%) | 0 (0.0%) |
| Total | 29,383 (62.5%) | 17,647 (37.5%) |
Female Fertility in Westminster
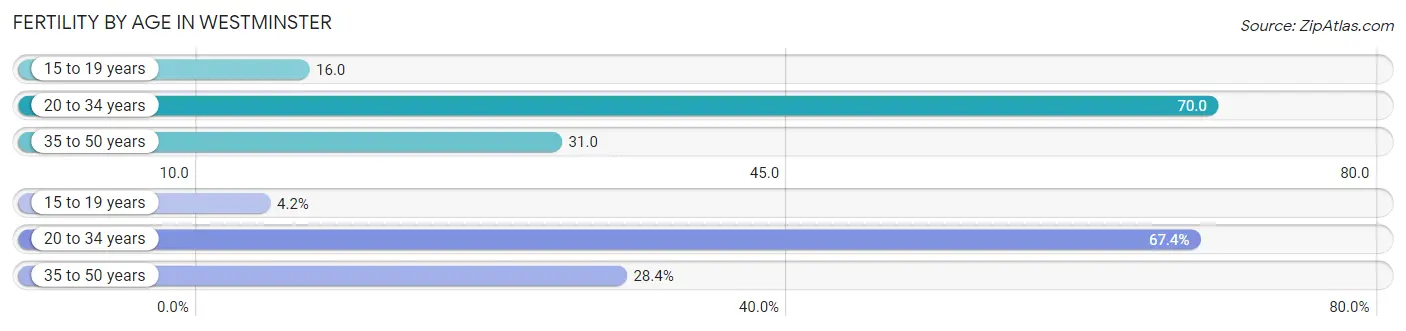
Fertility by Age in Westminster
Average fertility rate in Westminster is 47.0 births per 1,000 women. Women in the age bracket of 20 to 34 years have the highest fertility rate with 70.0 births per 1,000 women. Women in the age bracket of 20 to 34 years acount for 67.4% of all women with births.
| Age Bracket | Women with Births | Births / 1,000 Women |
| 15 to 19 years | 56 (4.2%) | 16.0 |
| 20 to 34 years | 897 (67.4%) | 70.0 |
| 35 to 50 years | 378 (28.4%) | 31.0 |
| Total | 1,331 (100.0%) | 47.0 |
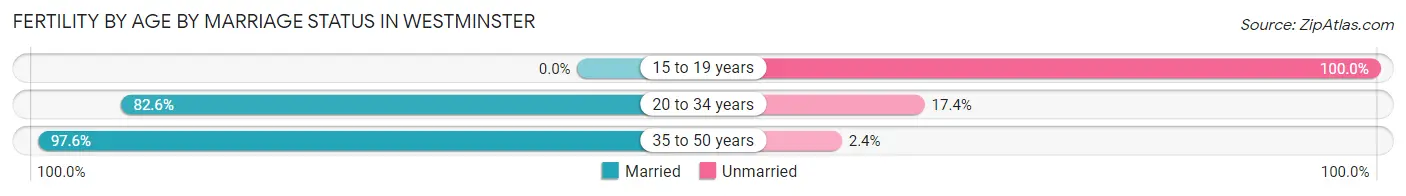
Fertility by Age by Marriage Status in Westminster
83.4% of women with births (1,331) in Westminster are married. The highest percentage of unmarried women with births falls into 15 to 19 years age bracket with 100.0% of them unmarried at the time of birth, while the lowest percentage of unmarried women with births belong to 35 to 50 years age bracket with 2.4% of them unmarried.
| Age Bracket | Married | Unmarried |
| 15 to 19 years | 0 (0.0%) | 56 (100.0%) |
| 20 to 34 years | 741 (82.6%) | 156 (17.4%) |
| 35 to 50 years | 369 (97.6%) | 9 (2.4%) |
| Total | 1,110 (83.4%) | 221 (16.6%) |
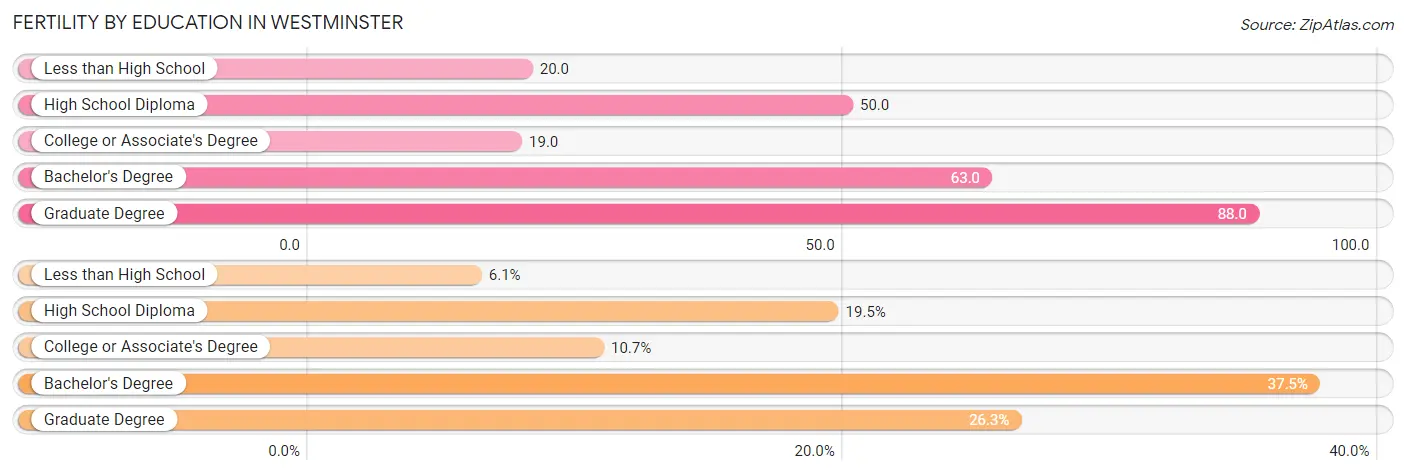
Fertility by Education in Westminster
Average fertility rate in Westminster is 47.0 births per 1,000 women. Women with the education attainment of graduate degree have the highest fertility rate of 88.0 births per 1,000 women, while women with the education attainment of college or associate's degree have the lowest fertility at 19.0 births per 1,000 women. Women with the education attainment of bachelor's degree represent 37.5% of all women with births.
| Educational Attainment | Women with Births | Births / 1,000 Women |
| Less than High School | 81 (6.1%) | 20.0 |
| High School Diploma | 259 (19.5%) | 50.0 |
| College or Associate's Degree | 142 (10.7%) | 19.0 |
| Bachelor's Degree | 499 (37.5%) | 63.0 |
| Graduate Degree | 350 (26.3%) | 88.0 |
| Total | 1,331 (100.0%) | 47.0 |
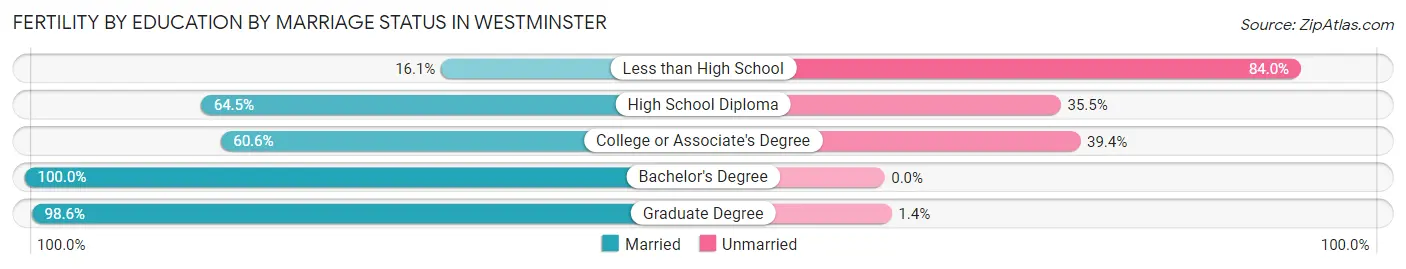
Fertility by Education by Marriage Status in Westminster
16.6% of women with births in Westminster are unmarried. Women with the educational attainment of bachelor's degree are most likely to be married with 100.0% of them married at childbirth, while women with the educational attainment of less than high school are least likely to be married with 84.0% of them unmarried at childbirth.
| Educational Attainment | Married | Unmarried |
| Less than High School | 13 (16.1%) | 68 (84.0%) |
| High School Diploma | 167 (64.5%) | 92 (35.5%) |
| College or Associate's Degree | 86 (60.6%) | 56 (39.4%) |
| Bachelor's Degree | 499 (100.0%) | 0 (0.0%) |
| Graduate Degree | 345 (98.6%) | 5 (1.4%) |
| Total | 1,110 (83.4%) | 221 (16.6%) |
Employment Characteristics in Westminster
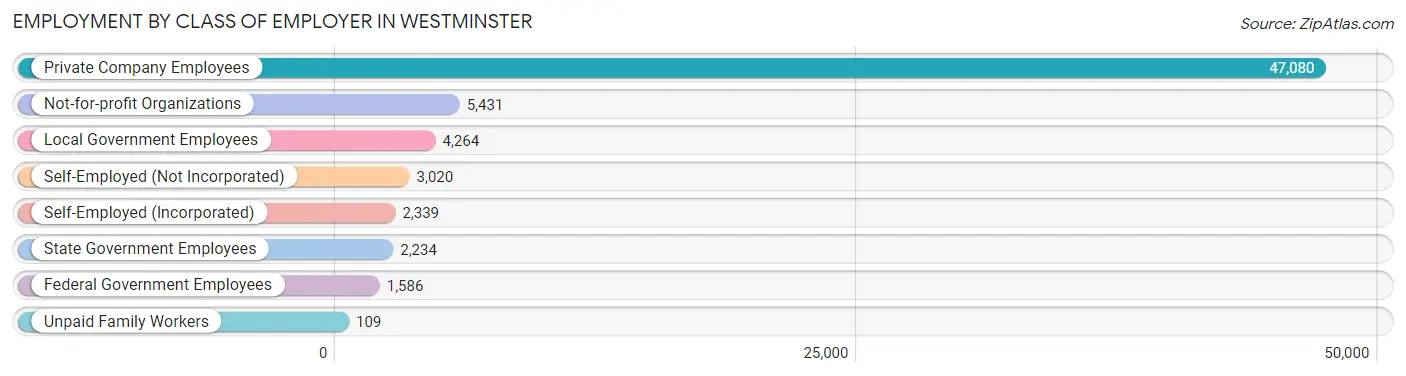
Employment by Class of Employer in Westminster
Among the 66,063 employed individuals in Westminster, private company employees (47,080 | 71.3%), not-for-profit organizations (5,431 | 8.2%), and local government employees (4,264 | 6.5%) make up the most common classes of employment.
| Employer Class | # Employees | % Employees |
| Private Company Employees | 47,080 | 71.3% |
| Self-Employed (Incorporated) | 2,339 | 3.5% |
| Self-Employed (Not Incorporated) | 3,020 | 4.6% |
| Not-for-profit Organizations | 5,431 | 8.2% |
| Local Government Employees | 4,264 | 6.5% |
| State Government Employees | 2,234 | 3.4% |
| Federal Government Employees | 1,586 | 2.4% |
| Unpaid Family Workers | 109 | 0.2% |
| Total | 66,063 | 100.0% |
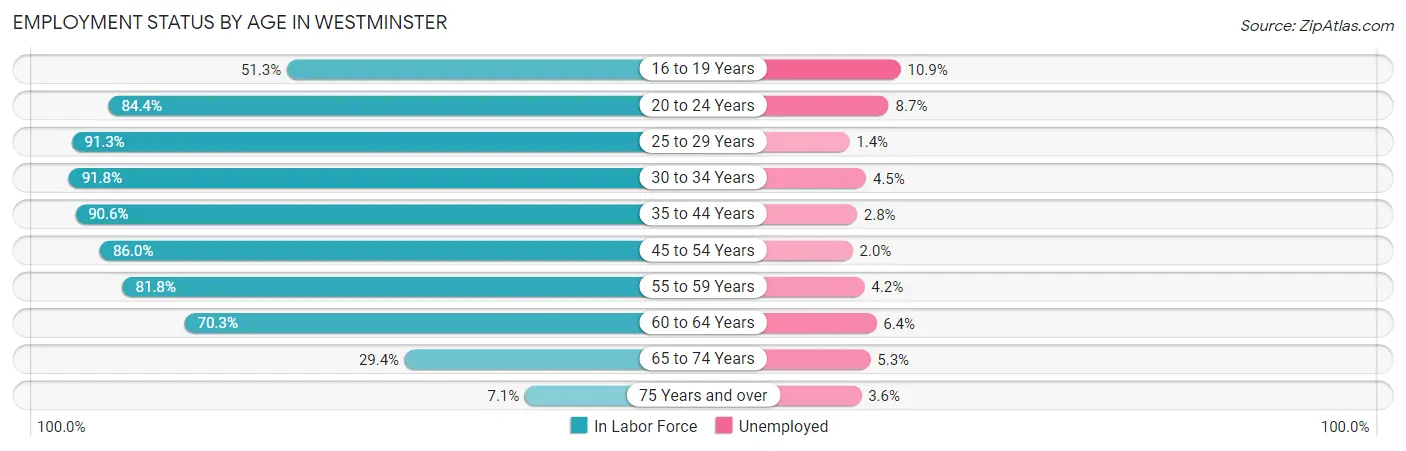
Employment Status by Age in Westminster
According to the labor force statistics for Westminster, out of the total population over 16 years of age (95,782), 73.0% or 69,921 individuals are in the labor force, with 4.1% or 2,867 of them unemployed. The age group with the highest labor force participation rate is 30 to 34 years, with 91.8% or 9,863 individuals in the labor force. Within the labor force, the 16 to 19 years age range has the highest percentage of unemployed individuals, with 10.9% or 322 of them being unemployed.
| Age Bracket | In Labor Force | Unemployed |
| 16 to 19 Years | 2,955 (51.3%) | 322 (10.9%) |
| 20 to 24 Years | 6,624 (84.4%) | 576 (8.7%) |
| 25 to 29 Years | 8,560 (91.3%) | 120 (1.4%) |
| 30 to 34 Years | 9,863 (91.8%) | 444 (4.5%) |
| 35 to 44 Years | 15,138 (90.6%) | 424 (2.8%) |
| 45 to 54 Years | 12,240 (86.0%) | 245 (2.0%) |
| 55 to 59 Years | 6,094 (81.8%) | 256 (4.2%) |
| 60 to 64 Years | 4,938 (70.3%) | 316 (6.4%) |
| 65 to 74 Years | 3,063 (29.4%) | 162 (5.3%) |
| 75 Years and over | 442 (7.1%) | 16 (3.6%) |
| Total | 69,921 (73.0%) | 2,867 (4.1%) |
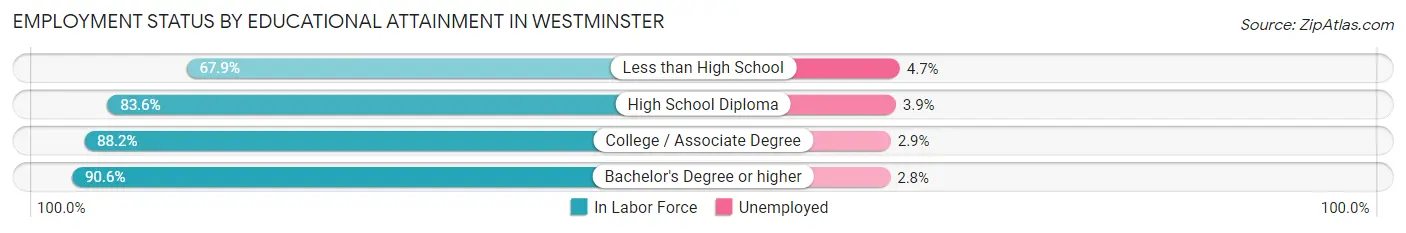
Employment Status by Educational Attainment in Westminster
According to labor force statistics for Westminster, 86.7% of individuals (56,819) out of the total population between 25 and 64 years of age (65,535) are in the labor force, with 3.2% or 1,818 of them being unemployed. The group with the highest labor force participation rate are those with the educational attainment of bachelor's degree or higher, with 90.6% or 25,863 individuals in the labor force. Within the labor force, individuals with less than high school education have the highest percentage of unemployment, with 4.7% or 164 of them being unemployed.
| Educational Attainment | In Labor Force | Unemployed |
| Less than High School | 3,479 (67.9%) | 241 (4.7%) |
| High School Diploma | 10,846 (83.6%) | 506 (3.9%) |
| College / Associate Degree | 16,662 (88.2%) | 548 (2.9%) |
| Bachelor's Degree or higher | 25,863 (90.6%) | 799 (2.8%) |
| Total | 56,819 (86.7%) | 2,097 (3.2%) |
Employment Occupations by Sex in Westminster
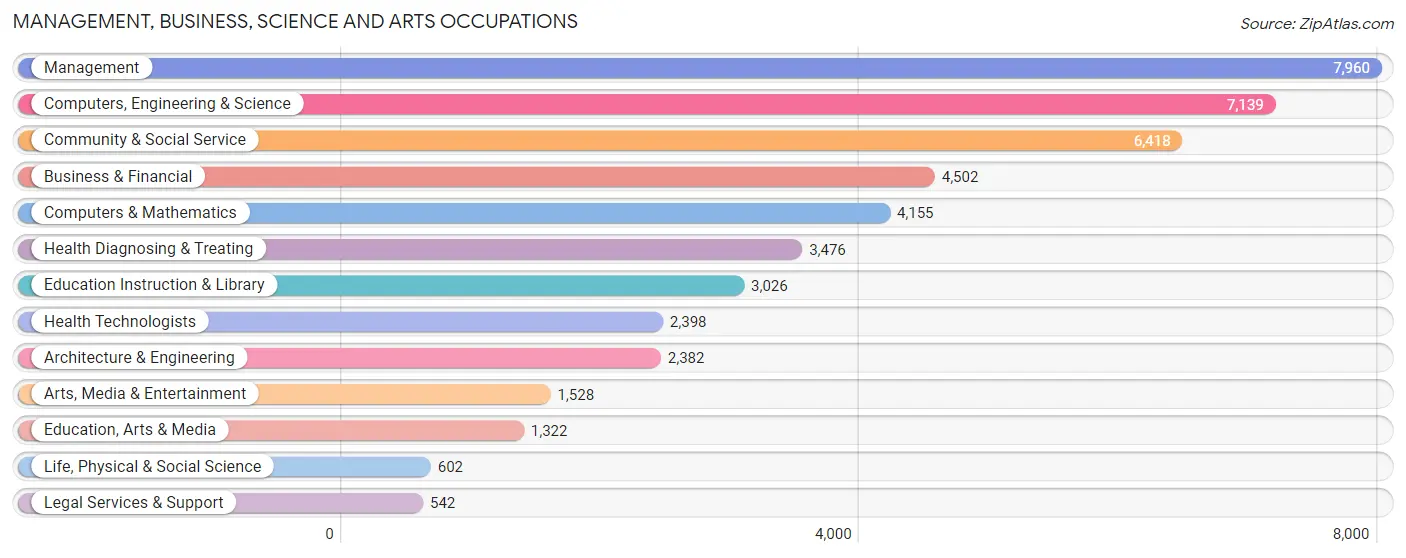
Management, Business, Science and Arts Occupations
The most common Management, Business, Science and Arts occupations in Westminster are Management (7,960 | 11.9%), Computers, Engineering & Science (7,139 | 10.7%), Community & Social Service (6,418 | 9.6%), Business & Financial (4,502 | 6.7%), and Computers & Mathematics (4,155 | 6.2%).
Management, Business, Science and Arts Occupations by Sex
Within the Management, Business, Science and Arts occupations in Westminster, the most male-oriented occupations are Architecture & Engineering (87.0%), Computers & Mathematics (78.5%), and Computers, Engineering & Science (78.2%), while the most female-oriented occupations are Health Technologists (79.1%), Legal Services & Support (77.5%), and Education Instruction & Library (76.6%).
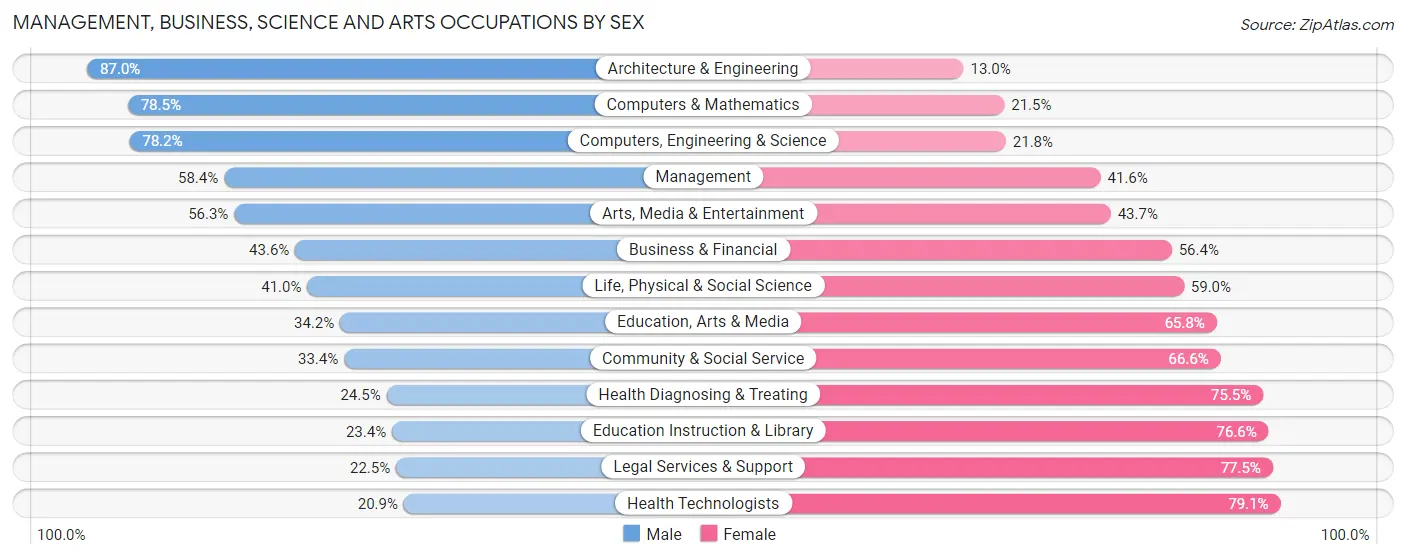
| Occupation | Male | Female |
| Management | 4,648 (58.4%) | 3,312 (41.6%) |
| Business & Financial | 1,961 (43.6%) | 2,541 (56.4%) |
| Computers, Engineering & Science | 5,580 (78.2%) | 1,559 (21.8%) |
| Computers & Mathematics | 3,261 (78.5%) | 894 (21.5%) |
| Architecture & Engineering | 2,072 (87.0%) | 310 (13.0%) |
| Life, Physical & Social Science | 247 (41.0%) | 355 (59.0%) |
| Community & Social Service | 2,141 (33.4%) | 4,277 (66.6%) |
| Education, Arts & Media | 452 (34.2%) | 870 (65.8%) |
| Legal Services & Support | 122 (22.5%) | 420 (77.5%) |
| Education Instruction & Library | 707 (23.4%) | 2,319 (76.6%) |
| Arts, Media & Entertainment | 860 (56.3%) | 668 (43.7%) |
| Health Diagnosing & Treating | 852 (24.5%) | 2,624 (75.5%) |
| Health Technologists | 501 (20.9%) | 1,897 (79.1%) |
| Total (Category) | 15,182 (51.5%) | 14,313 (48.5%) |
| Total (Overall) | 36,992 (55.3%) | 29,934 (44.7%) |
Services Occupations
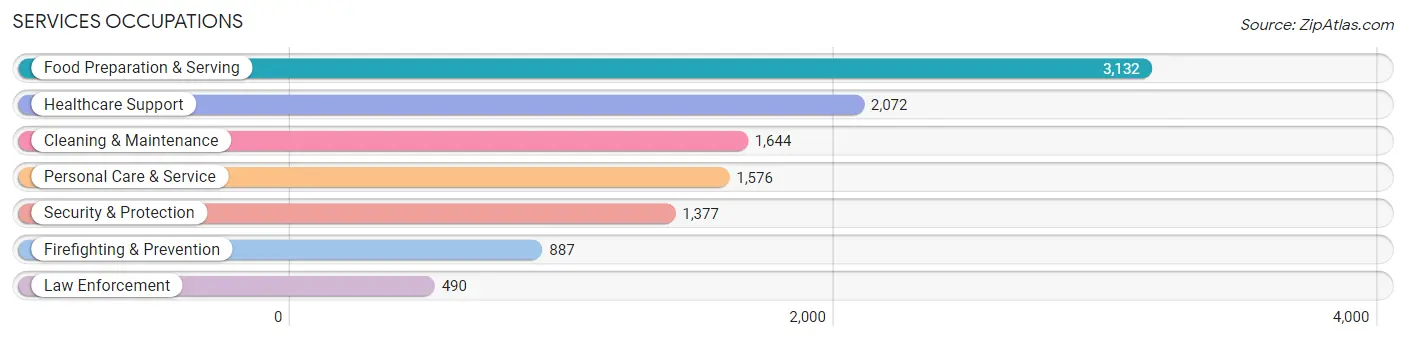
The most common Services occupations in Westminster are Food Preparation & Serving (3,132 | 4.7%), Healthcare Support (2,072 | 3.1%), Cleaning & Maintenance (1,644 | 2.5%), Personal Care & Service (1,576 | 2.4%), and Security & Protection (1,377 | 2.1%).
Services Occupations by Sex
Within the Services occupations in Westminster, the most male-oriented occupations are Law Enforcement (77.5%), Security & Protection (70.7%), and Cleaning & Maintenance (69.3%), while the most female-oriented occupations are Healthcare Support (89.2%), Personal Care & Service (82.5%), and Food Preparation & Serving (55.6%).
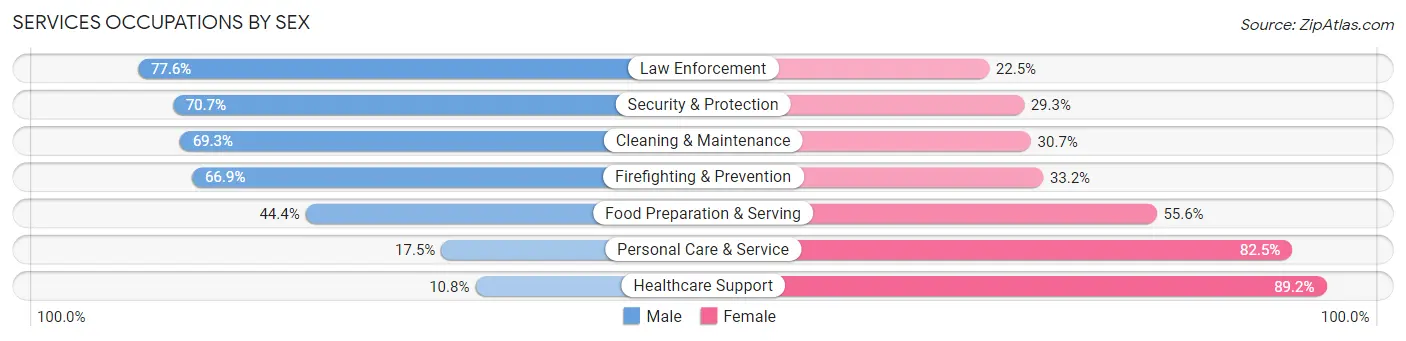
| Occupation | Male | Female |
| Healthcare Support | 223 (10.8%) | 1,849 (89.2%) |
| Security & Protection | 973 (70.7%) | 404 (29.3%) |
| Firefighting & Prevention | 593 (66.8%) | 294 (33.2%) |
| Law Enforcement | 380 (77.5%) | 110 (22.5%) |
| Food Preparation & Serving | 1,390 (44.4%) | 1,742 (55.6%) |
| Cleaning & Maintenance | 1,139 (69.3%) | 505 (30.7%) |
| Personal Care & Service | 276 (17.5%) | 1,300 (82.5%) |
| Total (Category) | 4,001 (40.8%) | 5,800 (59.2%) |
| Total (Overall) | 36,992 (55.3%) | 29,934 (44.7%) |
Sales and Office Occupations
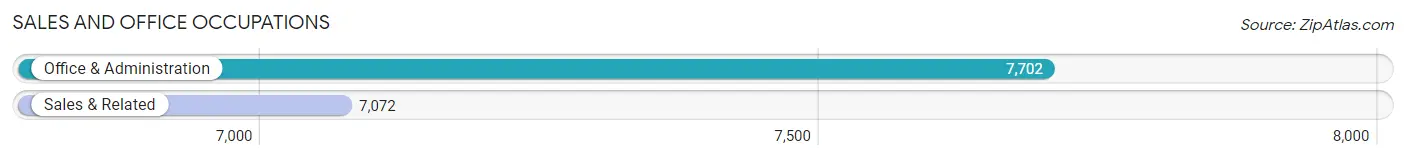
The most common Sales and Office occupations in Westminster are Office & Administration (7,702 | 11.5%), and Sales & Related (7,072 | 10.6%).
Sales and Office Occupations by Sex
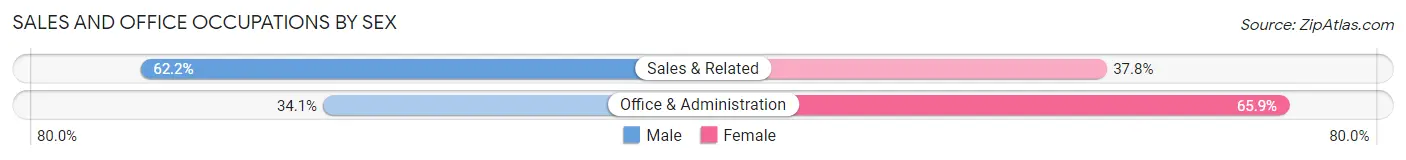
| Occupation | Male | Female |
| Sales & Related | 4,399 (62.2%) | 2,673 (37.8%) |
| Office & Administration | 2,626 (34.1%) | 5,076 (65.9%) |
| Total (Category) | 7,025 (47.5%) | 7,749 (52.4%) |
| Total (Overall) | 36,992 (55.3%) | 29,934 (44.7%) |
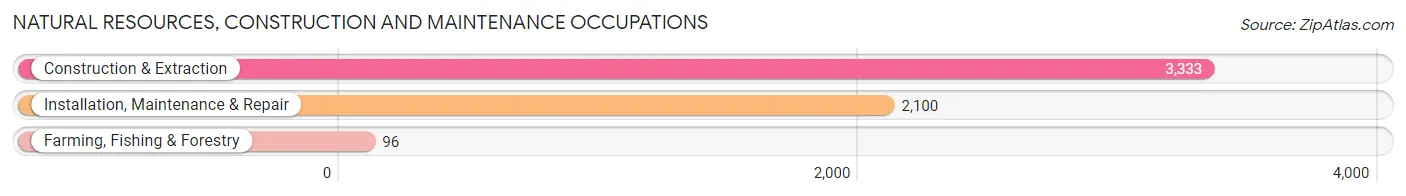
Natural Resources, Construction and Maintenance Occupations
The most common Natural Resources, Construction and Maintenance occupations in Westminster are Construction & Extraction (3,333 | 5.0%), Installation, Maintenance & Repair (2,100 | 3.1%), and Farming, Fishing & Forestry (96 | 0.1%).
Natural Resources, Construction and Maintenance Occupations by Sex
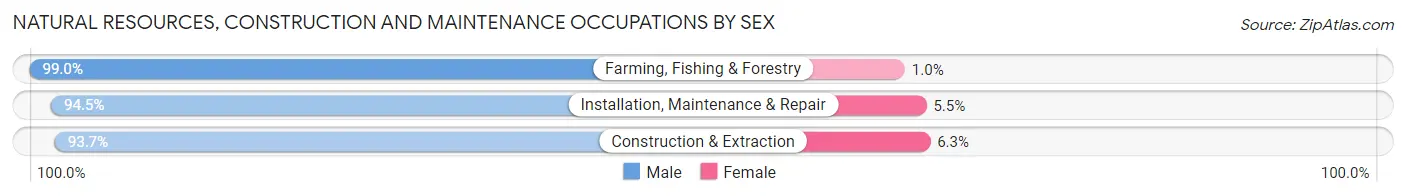
| Occupation | Male | Female |
| Farming, Fishing & Forestry | 95 (99.0%) | 1 (1.0%) |
| Construction & Extraction | 3,123 (93.7%) | 210 (6.3%) |
| Installation, Maintenance & Repair | 1,984 (94.5%) | 116 (5.5%) |
| Total (Category) | 5,202 (94.1%) | 327 (5.9%) |
| Total (Overall) | 36,992 (55.3%) | 29,934 (44.7%) |
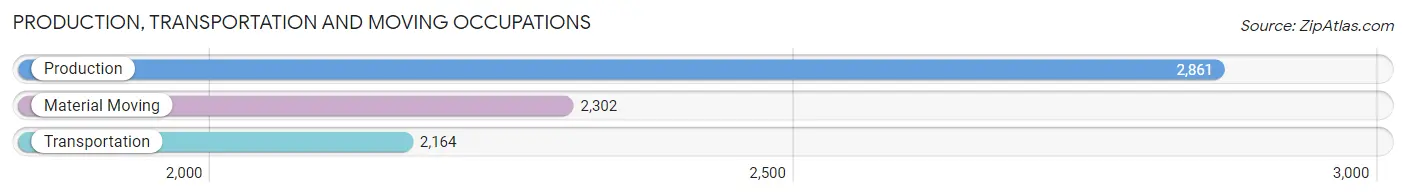
Production, Transportation and Moving Occupations
The most common Production, Transportation and Moving occupations in Westminster are Production (2,861 | 4.3%), Material Moving (2,302 | 3.4%), and Transportation (2,164 | 3.2%).
Production, Transportation and Moving Occupations by Sex
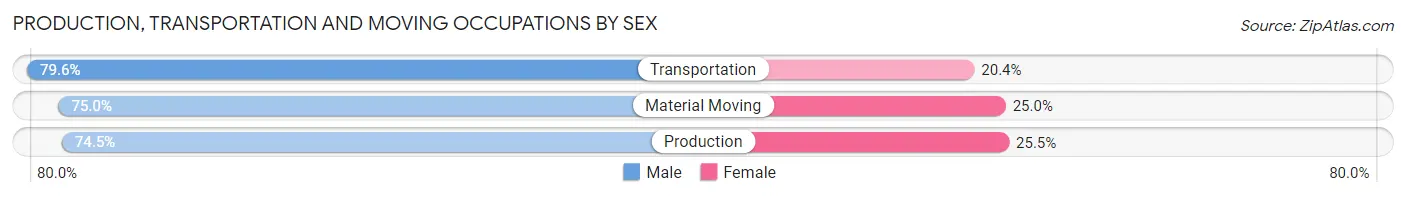
| Occupation | Male | Female |
| Production | 2,132 (74.5%) | 729 (25.5%) |
| Transportation | 1,723 (79.6%) | 441 (20.4%) |
| Material Moving | 1,727 (75.0%) | 575 (25.0%) |
| Total (Category) | 5,582 (76.2%) | 1,745 (23.8%) |
| Total (Overall) | 36,992 (55.3%) | 29,934 (44.7%) |
Employment Industries by Sex in Westminster
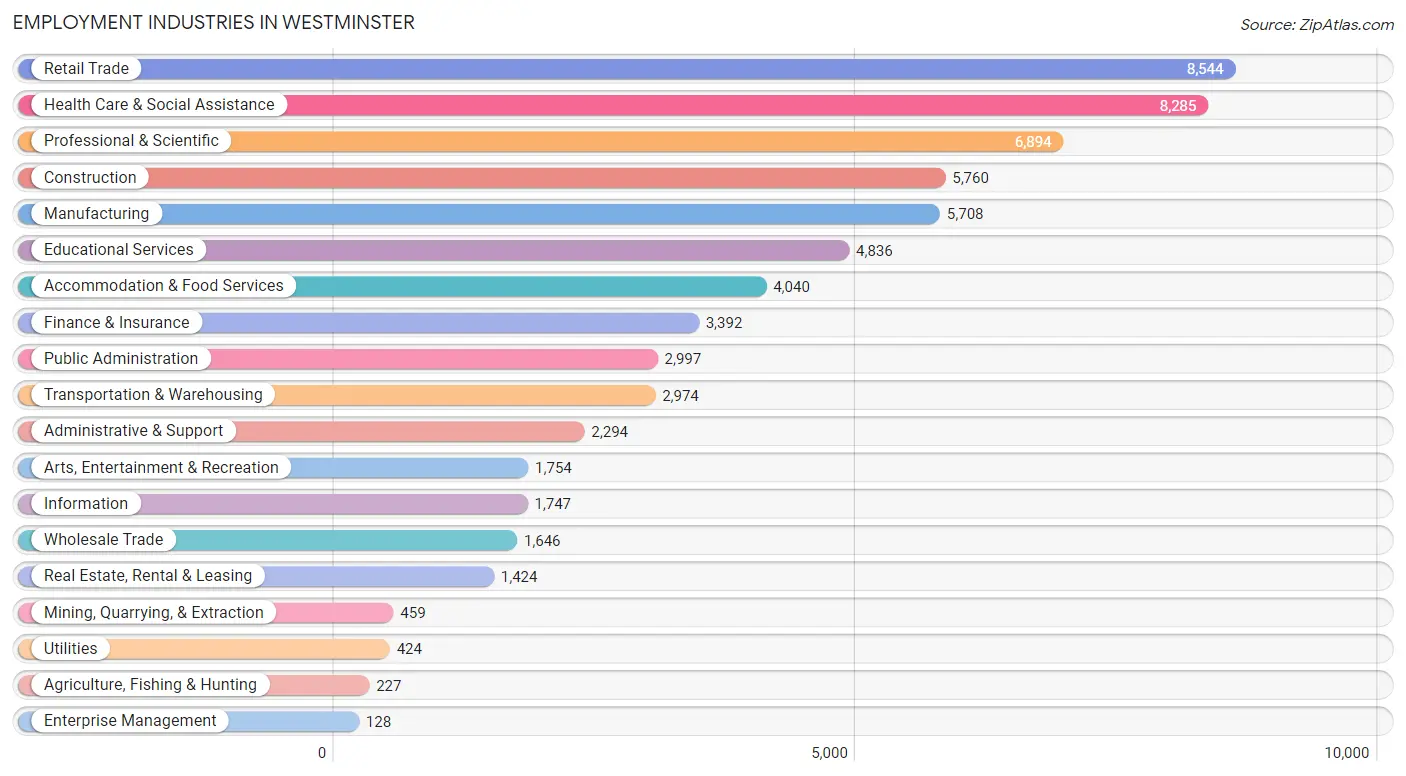
Employment Industries in Westminster
The major employment industries in Westminster include Retail Trade (8,544 | 12.8%), Health Care & Social Assistance (8,285 | 12.4%), Professional & Scientific (6,894 | 10.3%), Construction (5,760 | 8.6%), and Manufacturing (5,708 | 8.5%).
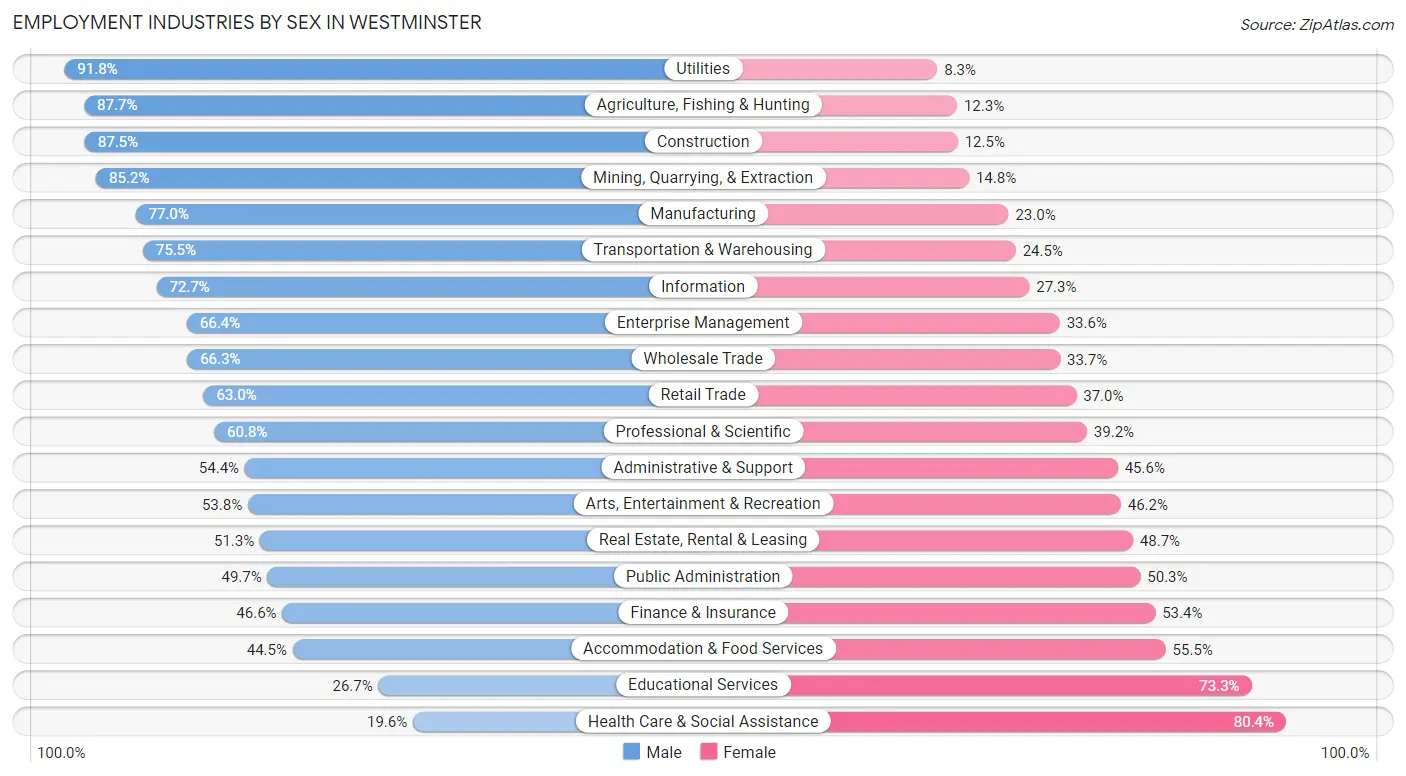
Employment Industries by Sex in Westminster
The Westminster industries that see more men than women are Utilities (91.7%), Agriculture, Fishing & Hunting (87.7%), and Construction (87.5%), whereas the industries that tend to have a higher number of women are Health Care & Social Assistance (80.4%), Educational Services (73.3%), and Accommodation & Food Services (55.5%).
| Industry | Male | Female |
| Agriculture, Fishing & Hunting | 199 (87.7%) | 28 (12.3%) |
| Mining, Quarrying, & Extraction | 391 (85.2%) | 68 (14.8%) |
| Construction | 5,041 (87.5%) | 719 (12.5%) |
| Manufacturing | 4,396 (77.0%) | 1,312 (23.0%) |
| Wholesale Trade | 1,092 (66.3%) | 554 (33.7%) |
| Retail Trade | 5,380 (63.0%) | 3,164 (37.0%) |
| Transportation & Warehousing | 2,246 (75.5%) | 728 (24.5%) |
| Utilities | 389 (91.7%) | 35 (8.3%) |
| Information | 1,270 (72.7%) | 477 (27.3%) |
| Finance & Insurance | 1,582 (46.6%) | 1,810 (53.4%) |
| Real Estate, Rental & Leasing | 730 (51.3%) | 694 (48.7%) |
| Professional & Scientific | 4,190 (60.8%) | 2,704 (39.2%) |
| Enterprise Management | 85 (66.4%) | 43 (33.6%) |
| Administrative & Support | 1,248 (54.4%) | 1,046 (45.6%) |
| Educational Services | 1,293 (26.7%) | 3,543 (73.3%) |
| Health Care & Social Assistance | 1,624 (19.6%) | 6,661 (80.4%) |
| Arts, Entertainment & Recreation | 943 (53.8%) | 811 (46.2%) |
| Accommodation & Food Services | 1,797 (44.5%) | 2,243 (55.5%) |
| Public Administration | 1,490 (49.7%) | 1,507 (50.3%) |
| Total | 36,992 (55.3%) | 29,934 (44.7%) |
Education in Westminster
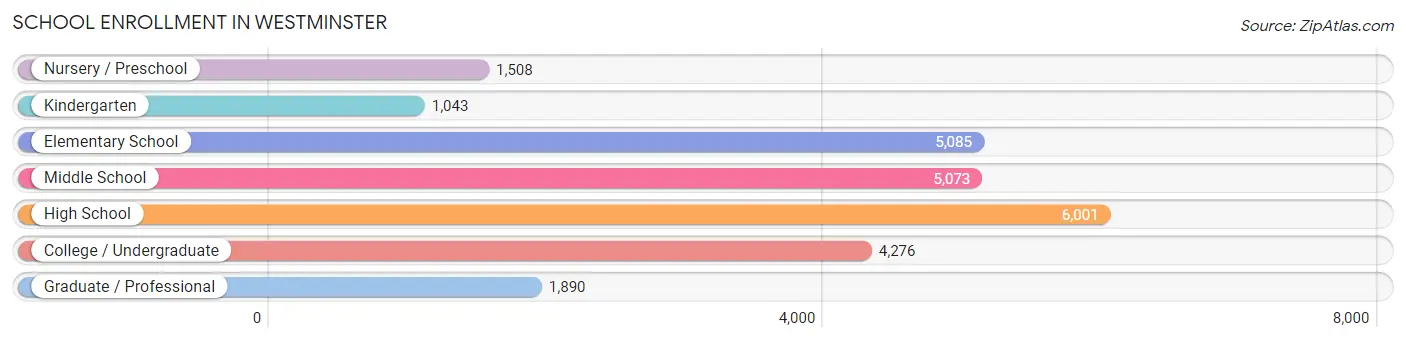
School Enrollment in Westminster
The most common levels of schooling among the 24,876 students in Westminster are high school (6,001 | 24.1%), elementary school (5,085 | 20.4%), and middle school (5,073 | 20.4%).
| School Level | # Students | % Students |
| Nursery / Preschool | 1,508 | 6.1% |
| Kindergarten | 1,043 | 4.2% |
| Elementary School | 5,085 | 20.4% |
| Middle School | 5,073 | 20.4% |
| High School | 6,001 | 24.1% |
| College / Undergraduate | 4,276 | 17.2% |
| Graduate / Professional | 1,890 | 7.6% |
| Total | 24,876 | 100.0% |
School Enrollment by Age by Funding Source in Westminster
Out of a total of 24,876 students who are enrolled in schools in Westminster, 3,259 (13.1%) attend a private institution, while the remaining 21,617 (86.9%) are enrolled in public schools. The age group of 3 to 4 year olds has the highest likelihood of being enrolled in private schools, with 332 (28.8% in the age bracket) enrolled. Conversely, the age group of 18 to 19 year olds has the lowest likelihood of being enrolled in a private school, with 1,613 (92.7% in the age bracket) attending a public institution.
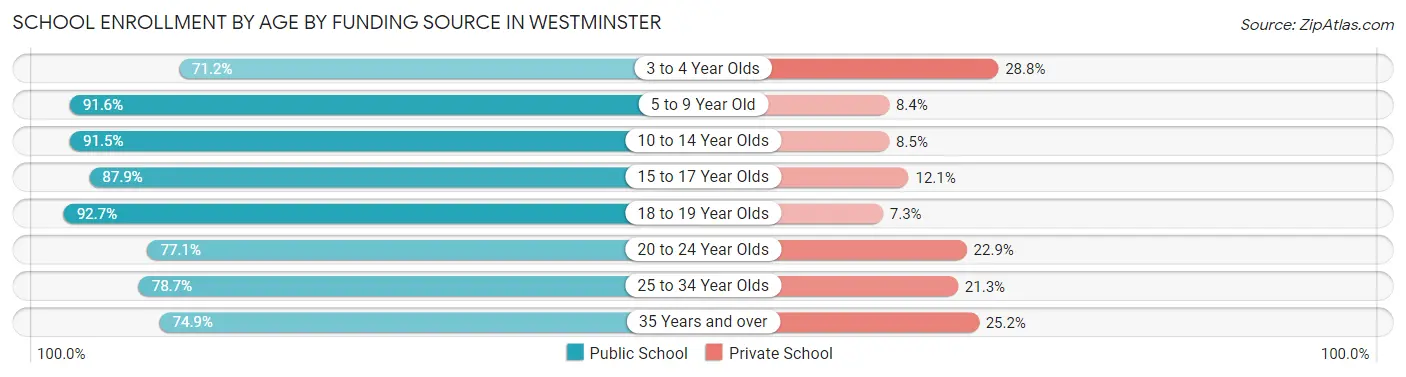
| Age Bracket | Public School | Private School |
| 3 to 4 Year Olds | 821 (71.2%) | 332 (28.8%) |
| 5 to 9 Year Old | 5,468 (91.6%) | 504 (8.4%) |
| 10 to 14 Year Olds | 5,942 (91.5%) | 550 (8.5%) |
| 15 to 17 Year Olds | 3,464 (87.9%) | 476 (12.1%) |
| 18 to 19 Year Olds | 1,613 (92.7%) | 127 (7.3%) |
| 20 to 24 Year Olds | 1,672 (77.1%) | 497 (22.9%) |
| 25 to 34 Year Olds | 1,620 (78.7%) | 438 (21.3%) |
| 35 Years and over | 1,012 (74.9%) | 340 (25.2%) |
| Total | 21,617 (86.9%) | 3,259 (13.1%) |
Educational Attainment by Field of Study in Westminster
Business (7,515 | 19.6%), science & technology (4,055 | 10.6%), engineering (3,251 | 8.5%), education (3,178 | 8.3%), and social sciences (3,053 | 8.0%) are the most common fields of study among 38,258 individuals in Westminster who have obtained a bachelor's degree or higher.
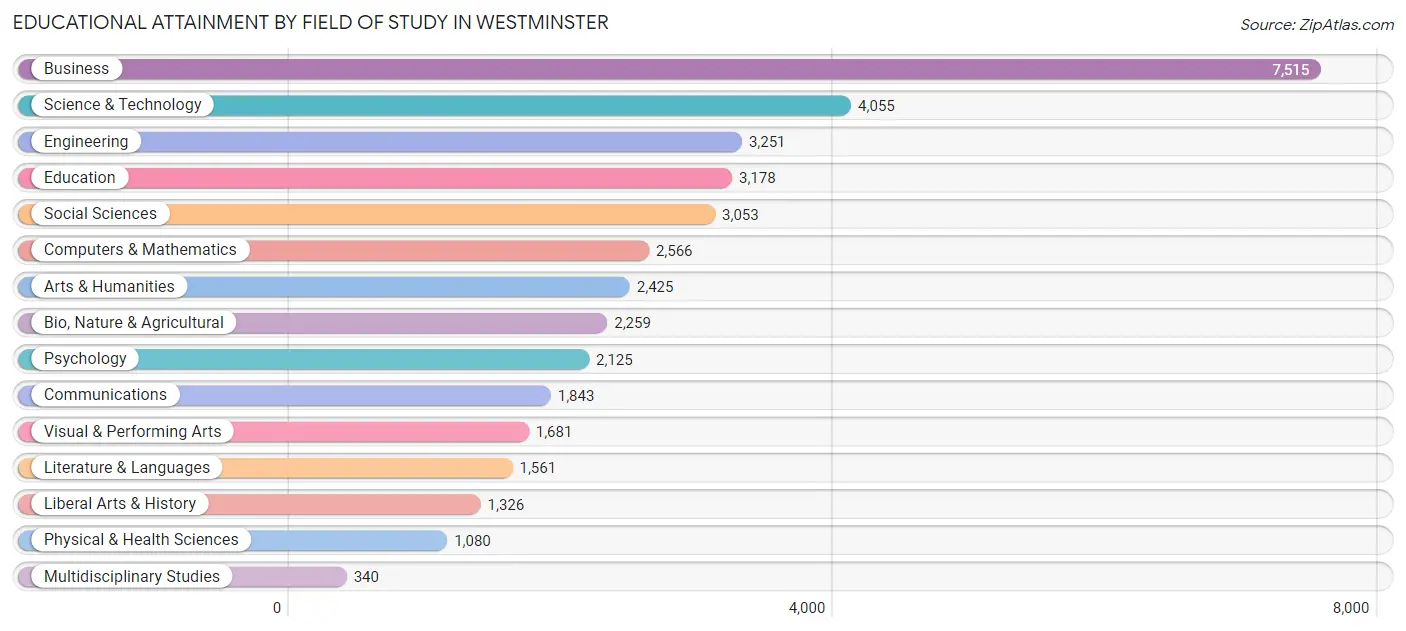
| Field of Study | # Graduates | % Graduates |
| Computers & Mathematics | 2,566 | 6.7% |
| Bio, Nature & Agricultural | 2,259 | 5.9% |
| Physical & Health Sciences | 1,080 | 2.8% |
| Psychology | 2,125 | 5.6% |
| Social Sciences | 3,053 | 8.0% |
| Engineering | 3,251 | 8.5% |
| Multidisciplinary Studies | 340 | 0.9% |
| Science & Technology | 4,055 | 10.6% |
| Business | 7,515 | 19.6% |
| Education | 3,178 | 8.3% |
| Literature & Languages | 1,561 | 4.1% |
| Liberal Arts & History | 1,326 | 3.5% |
| Visual & Performing Arts | 1,681 | 4.4% |
| Communications | 1,843 | 4.8% |
| Arts & Humanities | 2,425 | 6.3% |
| Total | 38,258 | 100.0% |
Transportation & Commute in Westminster
Vehicle Availability by Sex in Westminster
The most prevalent vehicle ownership categories in Westminster are males with 2 vehicles (15,638, accounting for 42.9%) and females with 2 vehicles (12,958, making up 52.9%).
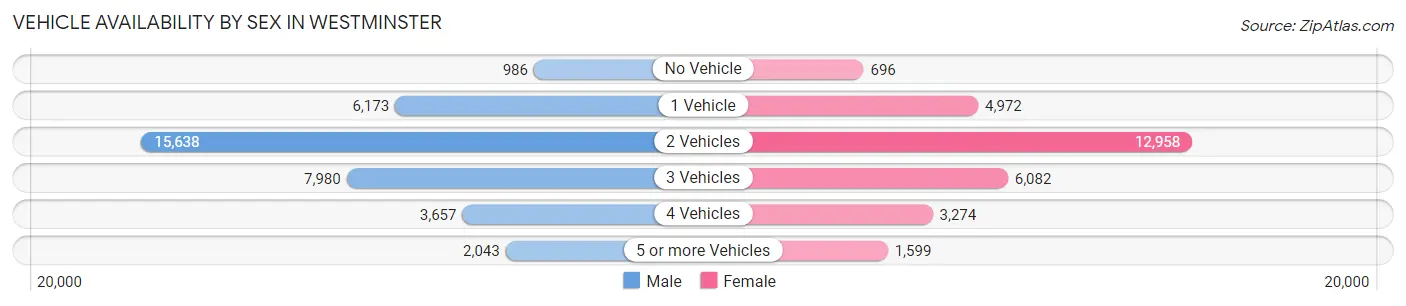
| Vehicles Available | Male | Female |
| No Vehicle | 986 (2.7%) | 696 (2.4%) |
| 1 Vehicle | 6,173 (16.9%) | 4,972 (16.8%) |
| 2 Vehicles | 15,638 (42.9%) | 12,958 (43.8%) |
| 3 Vehicles | 7,980 (21.9%) | 6,082 (20.6%) |
| 4 Vehicles | 3,657 (10.0%) | 3,274 (11.1%) |
| 5 or more Vehicles | 2,043 (5.6%) | 1,599 (5.4%) |
| Total | 36,477 (100.0%) | 29,581 (100.0%) |
Commute Time in Westminster
The most frequently occuring commute durations in Westminster are 30 to 34 minutes (9,281 commuters, 16.7%), 20 to 24 minutes (9,054 commuters, 16.3%), and 15 to 19 minutes (7,244 commuters, 13.0%).
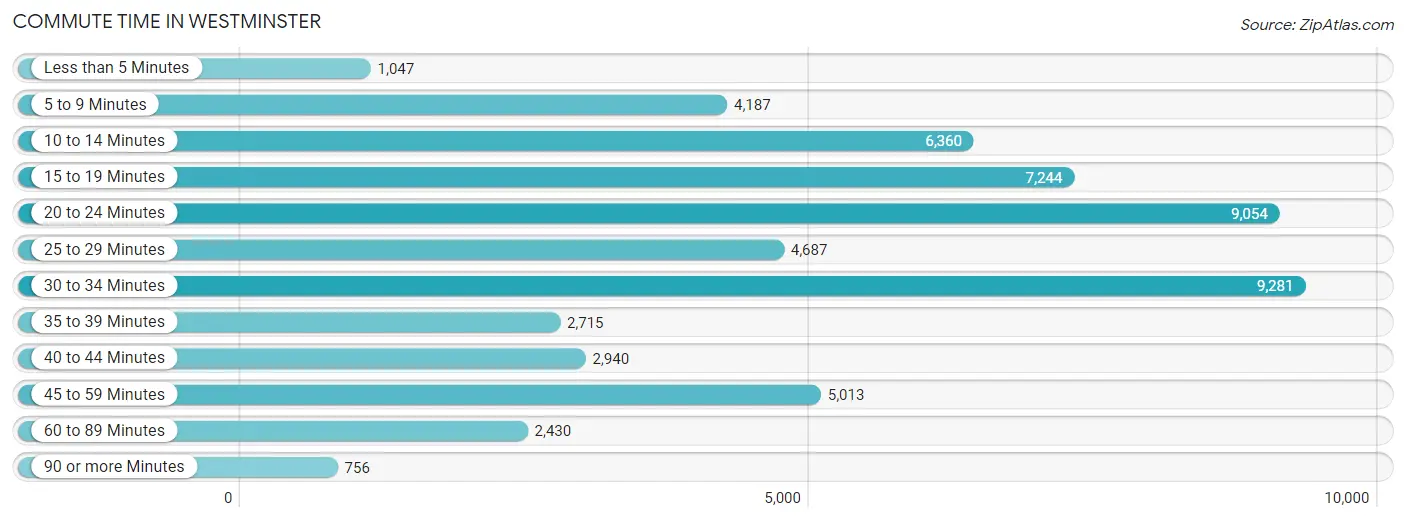
| Commute Time | # Commuters | % Commuters |
| Less than 5 Minutes | 1,047 | 1.9% |
| 5 to 9 Minutes | 4,187 | 7.5% |
| 10 to 14 Minutes | 6,360 | 11.4% |
| 15 to 19 Minutes | 7,244 | 13.0% |
| 20 to 24 Minutes | 9,054 | 16.3% |
| 25 to 29 Minutes | 4,687 | 8.4% |
| 30 to 34 Minutes | 9,281 | 16.7% |
| 35 to 39 Minutes | 2,715 | 4.9% |
| 40 to 44 Minutes | 2,940 | 5.3% |
| 45 to 59 Minutes | 5,013 | 9.0% |
| 60 to 89 Minutes | 2,430 | 4.4% |
| 90 or more Minutes | 756 | 1.4% |
Commute Time by Sex in Westminster
The most common commute times in Westminster are 30 to 34 minutes (5,437 commuters, 17.5%) for males and 30 to 34 minutes (3,844 commuters, 15.5%) for females.
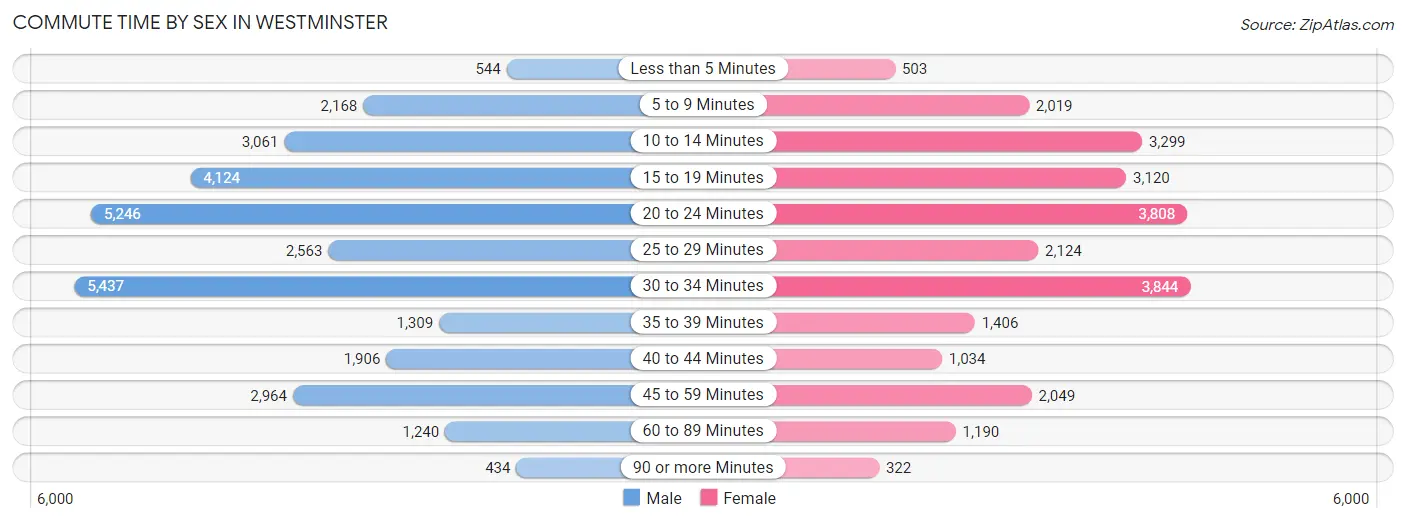
| Commute Time | Male | Female |
| Less than 5 Minutes | 544 (1.8%) | 503 (2.0%) |
| 5 to 9 Minutes | 2,168 (7.0%) | 2,019 (8.2%) |
| 10 to 14 Minutes | 3,061 (9.9%) | 3,299 (13.4%) |
| 15 to 19 Minutes | 4,124 (13.3%) | 3,120 (12.6%) |
| 20 to 24 Minutes | 5,246 (16.9%) | 3,808 (15.4%) |
| 25 to 29 Minutes | 2,563 (8.3%) | 2,124 (8.6%) |
| 30 to 34 Minutes | 5,437 (17.5%) | 3,844 (15.5%) |
| 35 to 39 Minutes | 1,309 (4.2%) | 1,406 (5.7%) |
| 40 to 44 Minutes | 1,906 (6.1%) | 1,034 (4.2%) |
| 45 to 59 Minutes | 2,964 (9.6%) | 2,049 (8.3%) |
| 60 to 89 Minutes | 1,240 (4.0%) | 1,190 (4.8%) |
| 90 or more Minutes | 434 (1.4%) | 322 (1.3%) |
Time of Departure to Work by Sex in Westminster
The most frequent times of departure to work in Westminster are 7:00 AM to 7:29 AM (4,912, 15.9%) for males and 7:00 AM to 7:29 AM (4,331, 17.5%) for females.
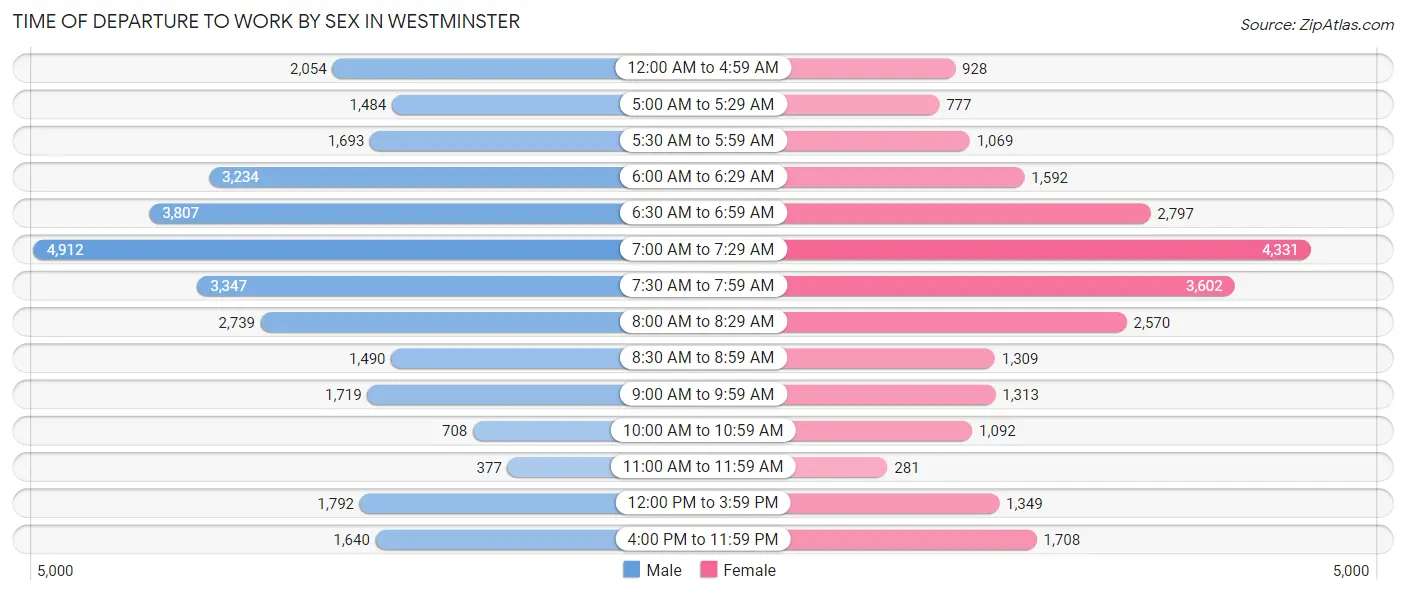
| Time of Departure | Male | Female |
| 12:00 AM to 4:59 AM | 2,054 (6.6%) | 928 (3.7%) |
| 5:00 AM to 5:29 AM | 1,484 (4.8%) | 777 (3.1%) |
| 5:30 AM to 5:59 AM | 1,693 (5.5%) | 1,069 (4.3%) |
| 6:00 AM to 6:29 AM | 3,234 (10.4%) | 1,592 (6.4%) |
| 6:30 AM to 6:59 AM | 3,807 (12.3%) | 2,797 (11.3%) |
| 7:00 AM to 7:29 AM | 4,912 (15.9%) | 4,331 (17.5%) |
| 7:30 AM to 7:59 AM | 3,347 (10.8%) | 3,602 (14.6%) |
| 8:00 AM to 8:29 AM | 2,739 (8.8%) | 2,570 (10.4%) |
| 8:30 AM to 8:59 AM | 1,490 (4.8%) | 1,309 (5.3%) |
| 9:00 AM to 9:59 AM | 1,719 (5.6%) | 1,313 (5.3%) |
| 10:00 AM to 10:59 AM | 708 (2.3%) | 1,092 (4.4%) |
| 11:00 AM to 11:59 AM | 377 (1.2%) | 281 (1.1%) |
| 12:00 PM to 3:59 PM | 1,792 (5.8%) | 1,349 (5.5%) |
| 4:00 PM to 11:59 PM | 1,640 (5.3%) | 1,708 (6.9%) |
| Total | 30,996 (100.0%) | 24,718 (100.0%) |
Housing Occupancy in Westminster
Occupancy by Ownership in Westminster
Of the total 47,030 dwellings in Westminster, owner-occupied units account for 29,995 (63.8%), while renter-occupied units make up 17,035 (36.2%).
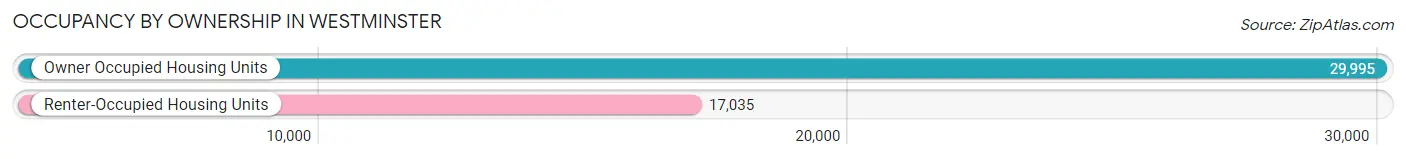
| Occupancy | # Housing Units | % Housing Units |
| Owner Occupied Housing Units | 29,995 | 63.8% |
| Renter-Occupied Housing Units | 17,035 | 36.2% |
| Total Occupied Housing Units | 47,030 | 100.0% |
Occupancy by Household Size in Westminster
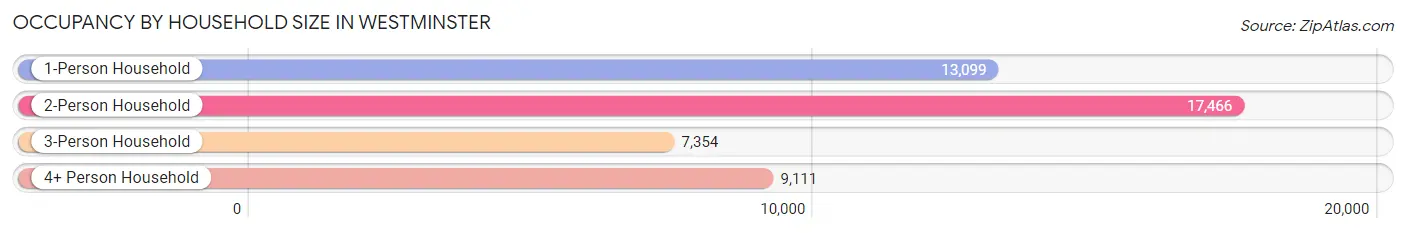
| Household Size | # Housing Units | % Housing Units |
| 1-Person Household | 13,099 | 27.9% |
| 2-Person Household | 17,466 | 37.1% |
| 3-Person Household | 7,354 | 15.6% |
| 4+ Person Household | 9,111 | 19.4% |
| Total Housing Units | 47,030 | 100.0% |
Occupancy by Ownership by Household Size in Westminster
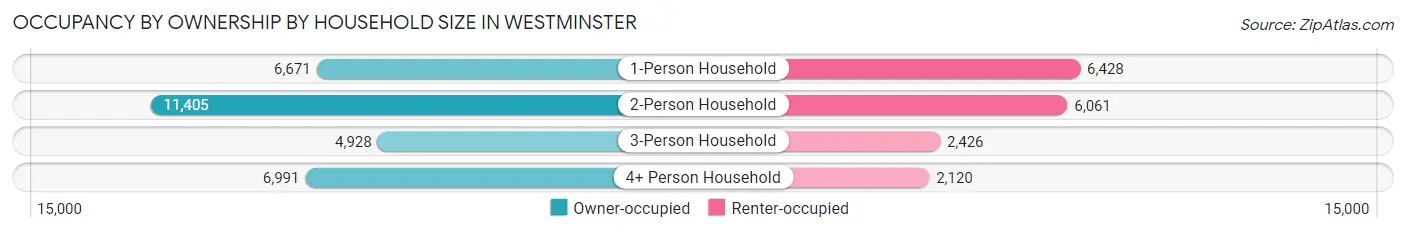
| Household Size | Owner-occupied | Renter-occupied |
| 1-Person Household | 6,671 (50.9%) | 6,428 (49.1%) |
| 2-Person Household | 11,405 (65.3%) | 6,061 (34.7%) |
| 3-Person Household | 4,928 (67.0%) | 2,426 (33.0%) |
| 4+ Person Household | 6,991 (76.7%) | 2,120 (23.3%) |
| Total Housing Units | 29,995 (63.8%) | 17,035 (36.2%) |
Occupancy by Educational Attainment in Westminster
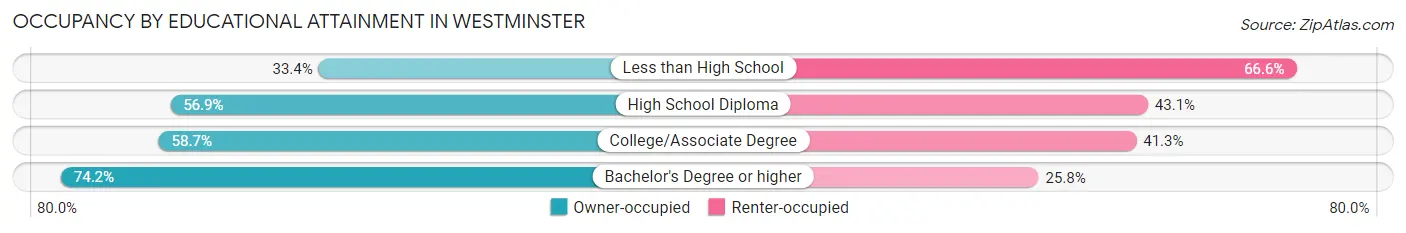
| Household Size | Owner-occupied | Renter-occupied |
| Less than High School | 941 (33.4%) | 1,878 (66.6%) |
| High School Diploma | 5,197 (56.9%) | 3,937 (43.1%) |
| College/Associate Degree | 8,278 (58.7%) | 5,814 (41.3%) |
| Bachelor's Degree or higher | 15,579 (74.2%) | 5,406 (25.8%) |
Occupancy by Age of Householder in Westminster
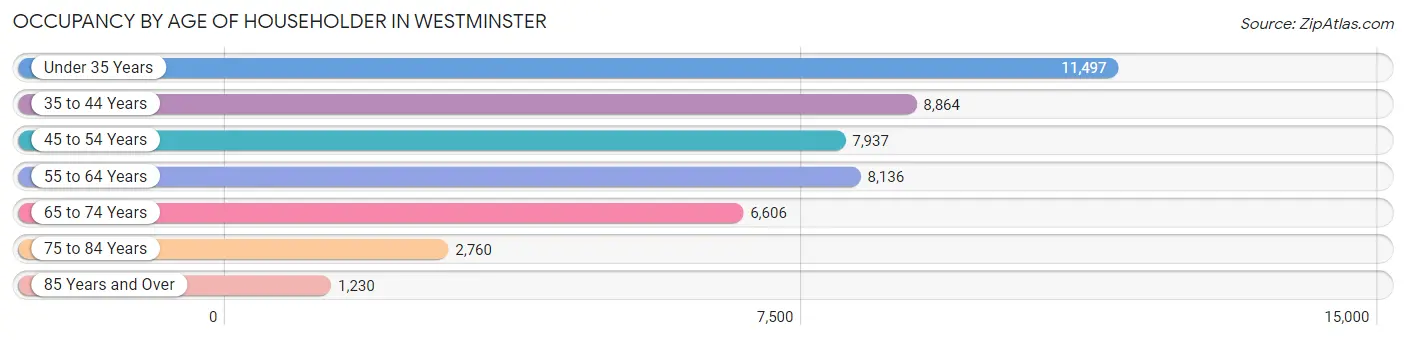
| Age Bracket | # Households | % Households |
| Under 35 Years | 11,497 | 24.4% |
| 35 to 44 Years | 8,864 | 18.9% |
| 45 to 54 Years | 7,937 | 16.9% |
| 55 to 64 Years | 8,136 | 17.3% |
| 65 to 74 Years | 6,606 | 14.1% |
| 75 to 84 Years | 2,760 | 5.9% |
| 85 Years and Over | 1,230 | 2.6% |
| Total | 47,030 | 100.0% |
Housing Finances in Westminster
Median Income by Occupancy in Westminster

| Occupancy Type | # Households | Median Income |
| Owner-Occupied | 29,995 (63.8%) | $112,824 |
| Renter-Occupied | 17,035 (36.2%) | $63,287 |
| Average | 47,030 (100.0%) | $90,651 |
Occupancy by Householder Income Bracket in Westminster
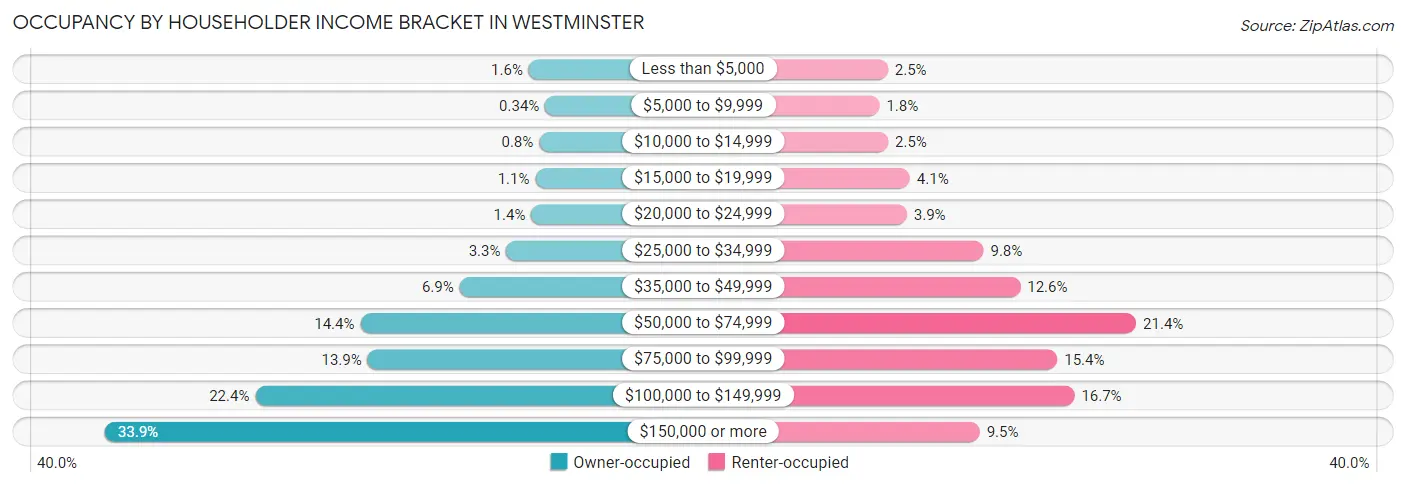
| Income Bracket | Owner-occupied | Renter-occupied |
| Less than $5,000 | 478 (1.6%) | 419 (2.5%) |
| $5,000 to $9,999 | 103 (0.3%) | 310 (1.8%) |
| $10,000 to $14,999 | 239 (0.8%) | 422 (2.5%) |
| $15,000 to $19,999 | 328 (1.1%) | 706 (4.1%) |
| $20,000 to $24,999 | 420 (1.4%) | 666 (3.9%) |
| $25,000 to $34,999 | 991 (3.3%) | 1,661 (9.8%) |
| $35,000 to $49,999 | 2,059 (6.9%) | 2,138 (12.6%) |
| $50,000 to $74,999 | 4,326 (14.4%) | 3,642 (21.4%) |
| $75,000 to $99,999 | 4,161 (13.9%) | 2,618 (15.4%) |
| $100,000 to $149,999 | 6,727 (22.4%) | 2,841 (16.7%) |
| $150,000 or more | 10,163 (33.9%) | 1,612 (9.5%) |
| Total | 29,995 (100.0%) | 17,035 (100.0%) |
Monthly Housing Cost Tiers in Westminster
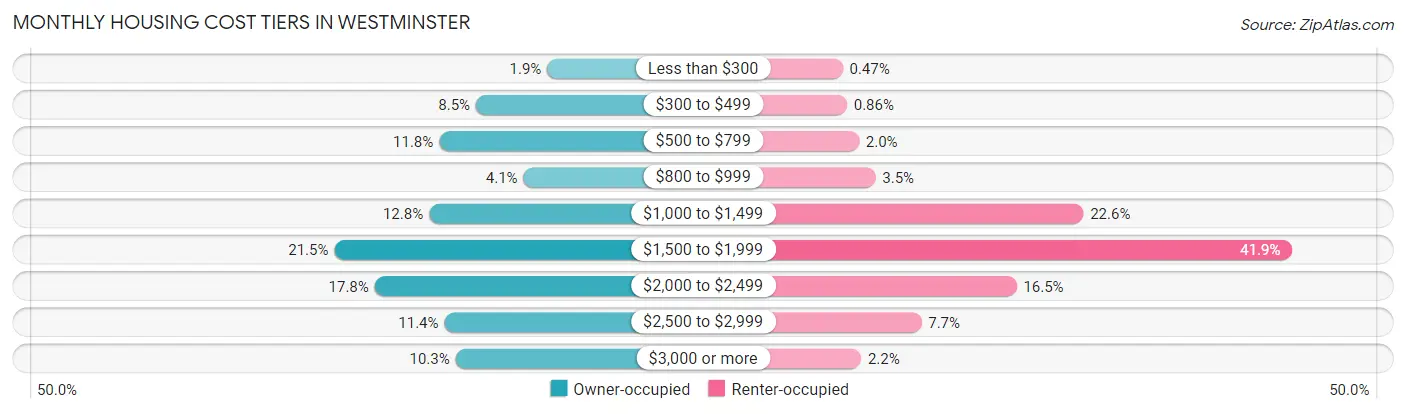
| Monthly Cost | Owner-occupied | Renter-occupied |
| Less than $300 | 567 (1.9%) | 80 (0.5%) |
| $300 to $499 | 2,534 (8.5%) | 146 (0.9%) |
| $500 to $799 | 3,551 (11.8%) | 336 (2.0%) |
| $800 to $999 | 1,225 (4.1%) | 594 (3.5%) |
| $1,000 to $1,499 | 3,830 (12.8%) | 3,855 (22.6%) |
| $1,500 to $1,999 | 6,447 (21.5%) | 7,132 (41.9%) |
| $2,000 to $2,499 | 5,334 (17.8%) | 2,807 (16.5%) |
| $2,500 to $2,999 | 3,408 (11.4%) | 1,315 (7.7%) |
| $3,000 or more | 3,099 (10.3%) | 369 (2.2%) |
| Total | 29,995 (100.0%) | 17,035 (100.0%) |
Physical Housing Characteristics in Westminster
Housing Structures in Westminster
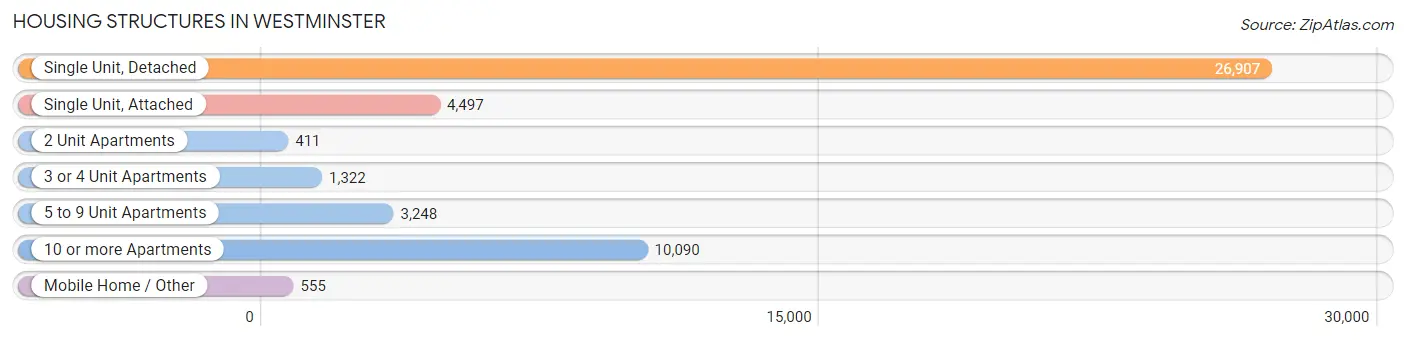
| Structure Type | # Housing Units | % Housing Units |
| Single Unit, Detached | 26,907 | 57.2% |
| Single Unit, Attached | 4,497 | 9.6% |
| 2 Unit Apartments | 411 | 0.9% |
| 3 or 4 Unit Apartments | 1,322 | 2.8% |
| 5 to 9 Unit Apartments | 3,248 | 6.9% |
| 10 or more Apartments | 10,090 | 21.4% |
| Mobile Home / Other | 555 | 1.2% |
| Total | 47,030 | 100.0% |
Housing Structures by Occupancy in Westminster
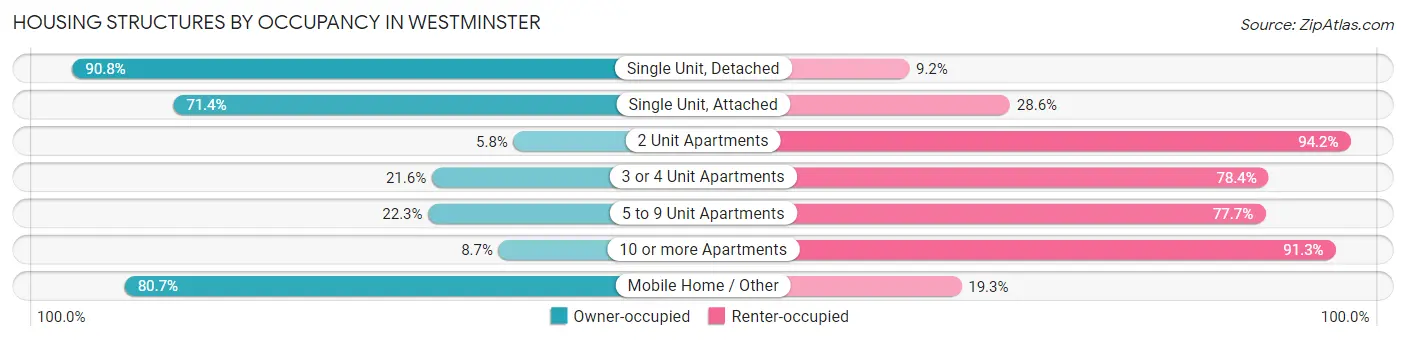
| Structure Type | Owner-occupied | Renter-occupied |
| Single Unit, Detached | 24,428 (90.8%) | 2,479 (9.2%) |
| Single Unit, Attached | 3,209 (71.4%) | 1,288 (28.6%) |
| 2 Unit Apartments | 24 (5.8%) | 387 (94.2%) |
| 3 or 4 Unit Apartments | 285 (21.6%) | 1,037 (78.4%) |
| 5 to 9 Unit Apartments | 723 (22.3%) | 2,525 (77.7%) |
| 10 or more Apartments | 878 (8.7%) | 9,212 (91.3%) |
| Mobile Home / Other | 448 (80.7%) | 107 (19.3%) |
| Total | 29,995 (63.8%) | 17,035 (36.2%) |
Housing Structures by Number of Rooms in Westminster
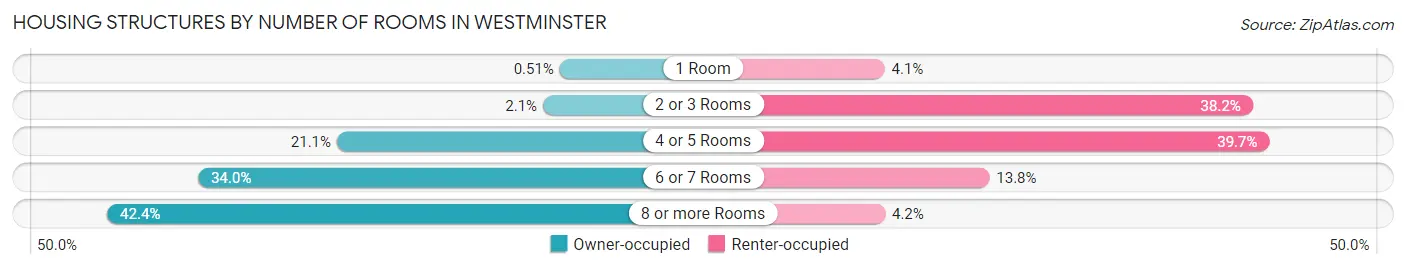
| Number of Rooms | Owner-occupied | Renter-occupied |
| 1 Room | 152 (0.5%) | 703 (4.1%) |
| 2 or 3 Rooms | 618 (2.1%) | 6,503 (38.2%) |
| 4 or 5 Rooms | 6,334 (21.1%) | 6,764 (39.7%) |
| 6 or 7 Rooms | 10,186 (34.0%) | 2,354 (13.8%) |
| 8 or more Rooms | 12,705 (42.4%) | 711 (4.2%) |
| Total | 29,995 (100.0%) | 17,035 (100.0%) |
Housing Structure by Heating Type in Westminster
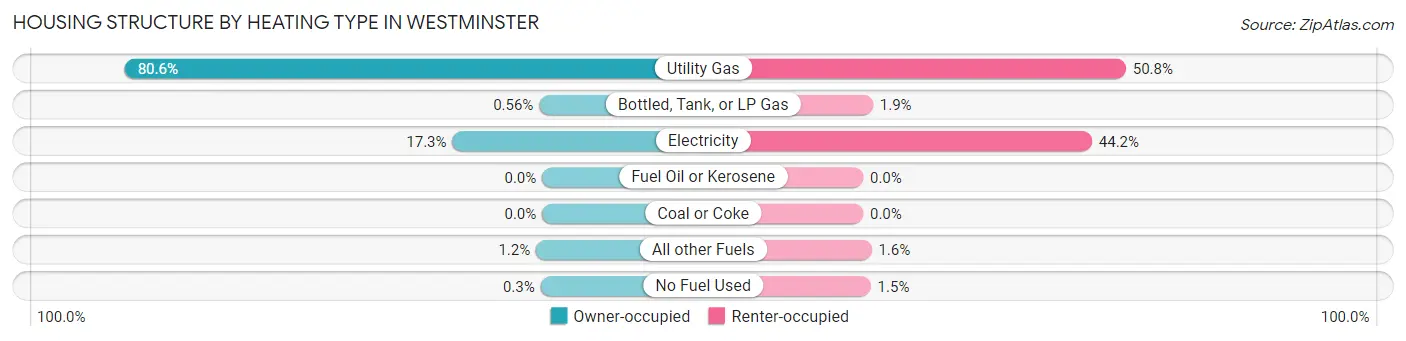
| Heating Type | Owner-occupied | Renter-occupied |
| Utility Gas | 24,188 (80.6%) | 8,651 (50.8%) |
| Bottled, Tank, or LP Gas | 168 (0.6%) | 322 (1.9%) |
| Electricity | 5,200 (17.3%) | 7,533 (44.2%) |
| Fuel Oil or Kerosene | 0 (0.0%) | 0 (0.0%) |
| Coal or Coke | 0 (0.0%) | 0 (0.0%) |
| All other Fuels | 350 (1.2%) | 278 (1.6%) |
| No Fuel Used | 89 (0.3%) | 251 (1.5%) |
| Total | 29,995 (100.0%) | 17,035 (100.0%) |
Household Vehicle Usage in Westminster
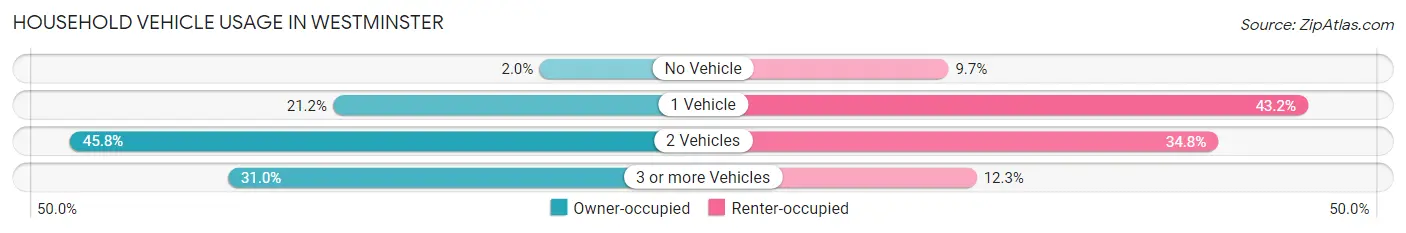
| Vehicles per Household | Owner-occupied | Renter-occupied |
| No Vehicle | 591 (2.0%) | 1,648 (9.7%) |
| 1 Vehicle | 6,369 (21.2%) | 7,359 (43.2%) |
| 2 Vehicles | 13,730 (45.8%) | 5,933 (34.8%) |
| 3 or more Vehicles | 9,305 (31.0%) | 2,095 (12.3%) |
| Total | 29,995 (100.0%) | 17,035 (100.0%) |
Real Estate & Mortgages in Westminster
Real Estate and Mortgage Overview in Westminster
| Characteristic | Without Mortgage | With Mortgage |
| Housing Units | 7,874 | 22,121 |
| Median Property Value | $459,600 | $469,800 |
| Median Household Income | $86,891 | $8,161 |
| Monthly Housing Costs | $573 | $3,099 |
| Real Estate Taxes | $2,421 | $330 |
Property Value by Mortgage Status in Westminster
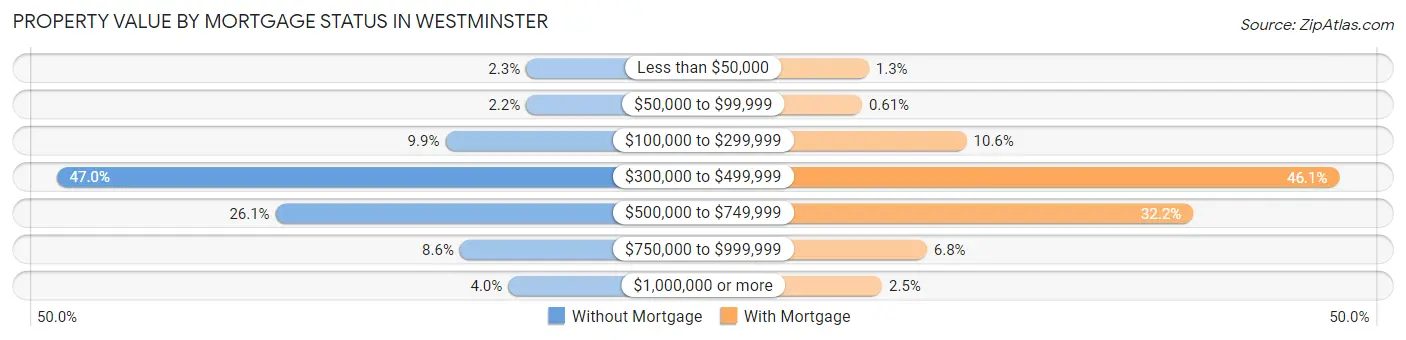
| Property Value | Without Mortgage | With Mortgage |
| Less than $50,000 | 177 (2.2%) | 282 (1.3%) |
| $50,000 to $99,999 | 176 (2.2%) | 134 (0.6%) |
| $100,000 to $299,999 | 783 (9.9%) | 2,341 (10.6%) |
| $300,000 to $499,999 | 3,697 (46.9%) | 10,191 (46.1%) |
| $500,000 to $749,999 | 2,056 (26.1%) | 7,112 (32.2%) |
| $750,000 to $999,999 | 674 (8.6%) | 1,502 (6.8%) |
| $1,000,000 or more | 311 (4.0%) | 559 (2.5%) |
| Total | 7,874 (100.0%) | 22,121 (100.0%) |
Household Income by Mortgage Status in Westminster
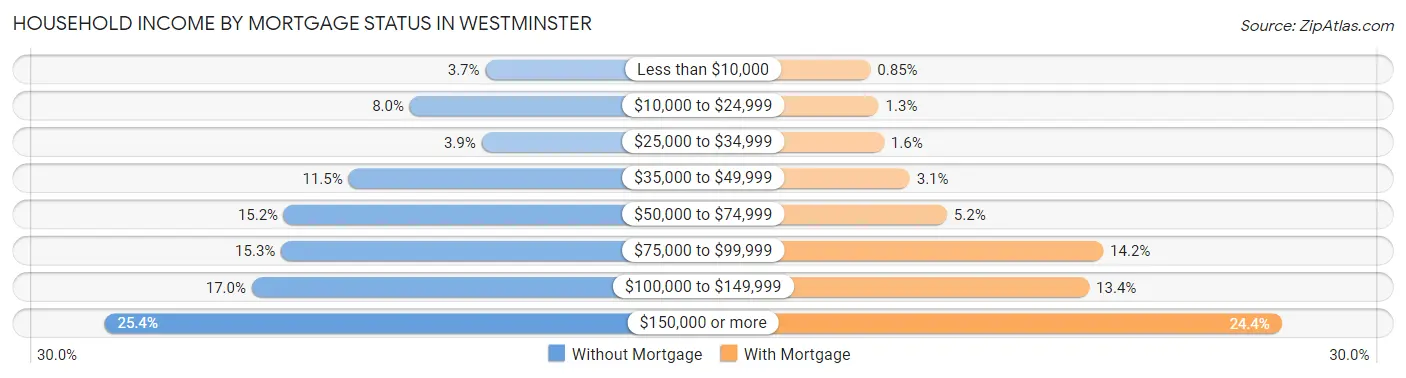
| Household Income | Without Mortgage | With Mortgage |
| Less than $10,000 | 289 (3.7%) | 187 (0.9%) |
| $10,000 to $24,999 | 629 (8.0%) | 292 (1.3%) |
| $25,000 to $34,999 | 306 (3.9%) | 358 (1.6%) |
| $35,000 to $49,999 | 905 (11.5%) | 685 (3.1%) |
| $50,000 to $74,999 | 1,195 (15.2%) | 1,154 (5.2%) |
| $75,000 to $99,999 | 1,208 (15.3%) | 3,131 (14.1%) |
| $100,000 to $149,999 | 1,340 (17.0%) | 2,953 (13.4%) |
| $150,000 or more | 2,002 (25.4%) | 5,387 (24.3%) |
| Total | 7,874 (100.0%) | 22,121 (100.0%) |
Property Value to Household Income Ratio in Westminster
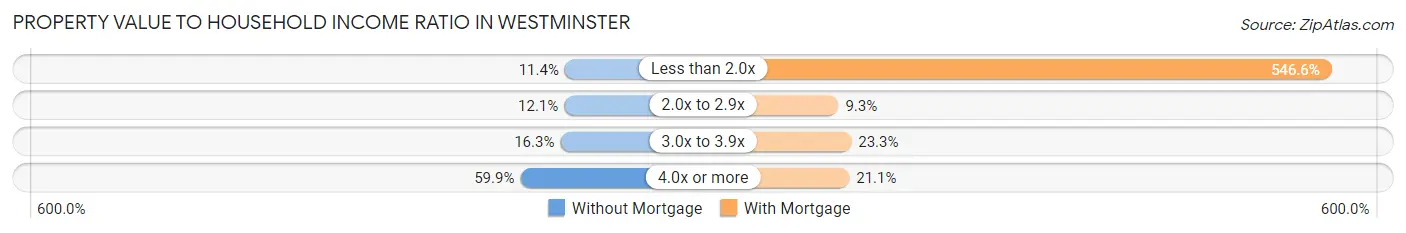
| Value-to-Income Ratio | Without Mortgage | With Mortgage |
| Less than 2.0x | 900 (11.4%) | 120,923 (546.6%) |
| 2.0x to 2.9x | 952 (12.1%) | 2,054 (9.3%) |
| 3.0x to 3.9x | 1,285 (16.3%) | 5,154 (23.3%) |
| 4.0x or more | 4,717 (59.9%) | 4,662 (21.1%) |
| Total | 7,874 (100.0%) | 22,121 (100.0%) |
Real Estate Taxes by Mortgage Status in Westminster
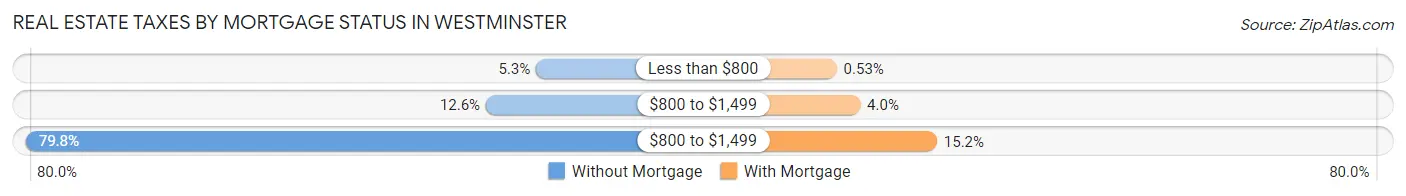
| Property Taxes | Without Mortgage | With Mortgage |
| Less than $800 | 414 (5.3%) | 117 (0.5%) |
| $800 to $1,499 | 991 (12.6%) | 876 (4.0%) |
| $800 to $1,499 | 6,285 (79.8%) | 3,355 (15.2%) |
| Total | 7,874 (100.0%) | 22,121 (100.0%) |
Health & Disability in Westminster
Health Insurance Coverage by Age in Westminster
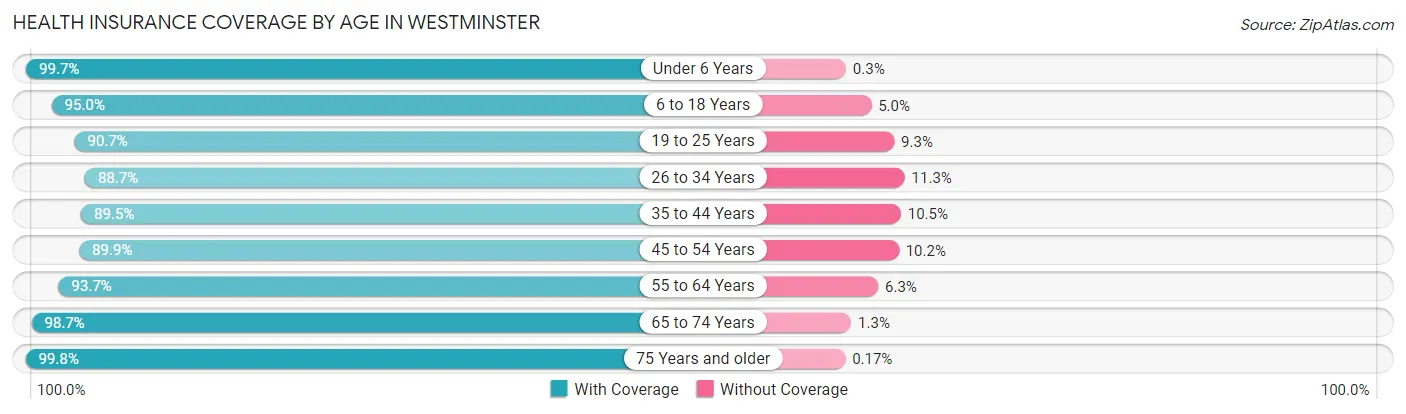
| Age Bracket | With Coverage | Without Coverage |
| Under 6 Years | 7,048 (99.7%) | 21 (0.3%) |
| 6 to 18 Years | 16,303 (95.0%) | 862 (5.0%) |
| 19 to 25 Years | 9,744 (90.7%) | 999 (9.3%) |
| 26 to 34 Years | 16,345 (88.7%) | 2,073 (11.3%) |
| 35 to 44 Years | 14,914 (89.5%) | 1,758 (10.5%) |
| 45 to 54 Years | 12,746 (89.8%) | 1,440 (10.2%) |
| 55 to 64 Years | 13,494 (93.7%) | 909 (6.3%) |
| 65 to 74 Years | 10,226 (98.7%) | 133 (1.3%) |
| 75 Years and older | 6,008 (99.8%) | 10 (0.2%) |
| Total | 106,828 (92.9%) | 8,205 (7.1%) |
Health Insurance Coverage by Citizenship Status in Westminster
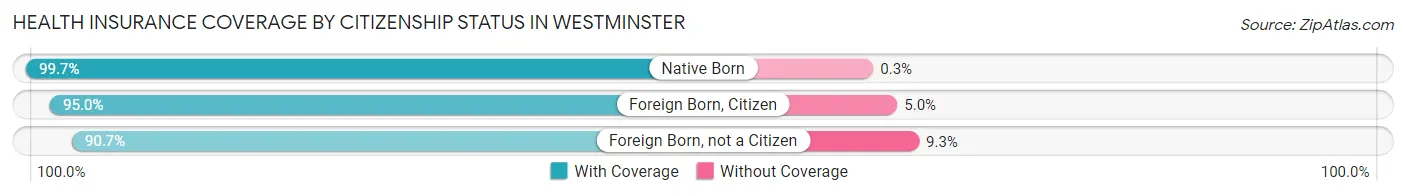
| Citizenship Status | With Coverage | Without Coverage |
| Native Born | 7,048 (99.7%) | 21 (0.3%) |
| Foreign Born, Citizen | 16,303 (95.0%) | 862 (5.0%) |
| Foreign Born, not a Citizen | 9,744 (90.7%) | 999 (9.3%) |
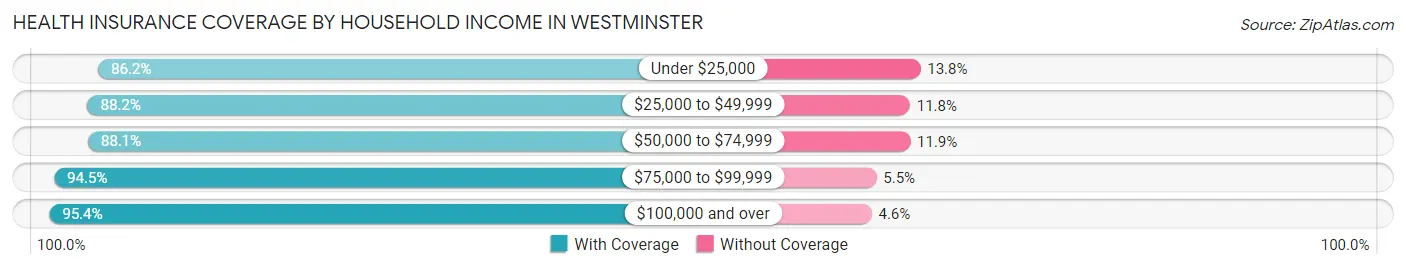
Health Insurance Coverage by Household Income in Westminster
| Household Income | With Coverage | Without Coverage |
| Under $25,000 | 5,347 (86.2%) | 854 (13.8%) |
| $25,000 to $49,999 | 11,119 (88.2%) | 1,487 (11.8%) |
| $50,000 to $74,999 | 15,303 (88.1%) | 2,059 (11.9%) |
| $75,000 to $99,999 | 15,993 (94.5%) | 936 (5.5%) |
| $100,000 and over | 59,021 (95.4%) | 2,868 (4.6%) |
Public vs Private Health Insurance Coverage by Age in Westminster
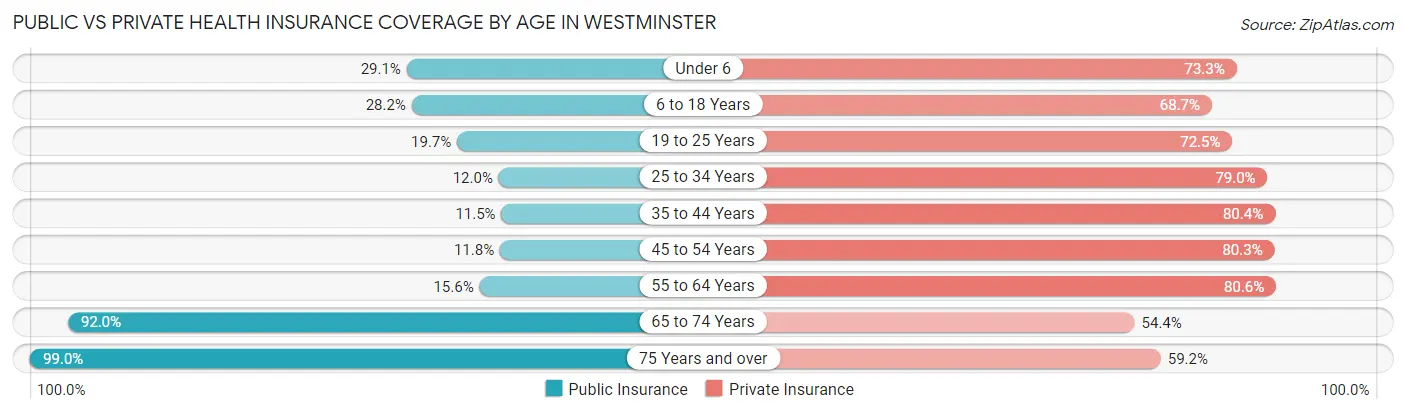
| Age Bracket | Public Insurance | Private Insurance |
| Under 6 | 2,056 (29.1%) | 5,179 (73.3%) |
| 6 to 18 Years | 4,832 (28.1%) | 11,789 (68.7%) |
| 19 to 25 Years | 2,119 (19.7%) | 7,787 (72.5%) |
| 25 to 34 Years | 2,209 (12.0%) | 14,550 (79.0%) |
| 35 to 44 Years | 1,916 (11.5%) | 13,404 (80.4%) |
| 45 to 54 Years | 1,668 (11.8%) | 11,393 (80.3%) |
| 55 to 64 Years | 2,243 (15.6%) | 11,610 (80.6%) |
| 65 to 74 Years | 9,526 (92.0%) | 5,630 (54.3%) |
| 75 Years and over | 5,958 (99.0%) | 3,563 (59.2%) |
| Total | 32,527 (28.3%) | 84,905 (73.8%) |
Disability Status by Sex by Age in Westminster
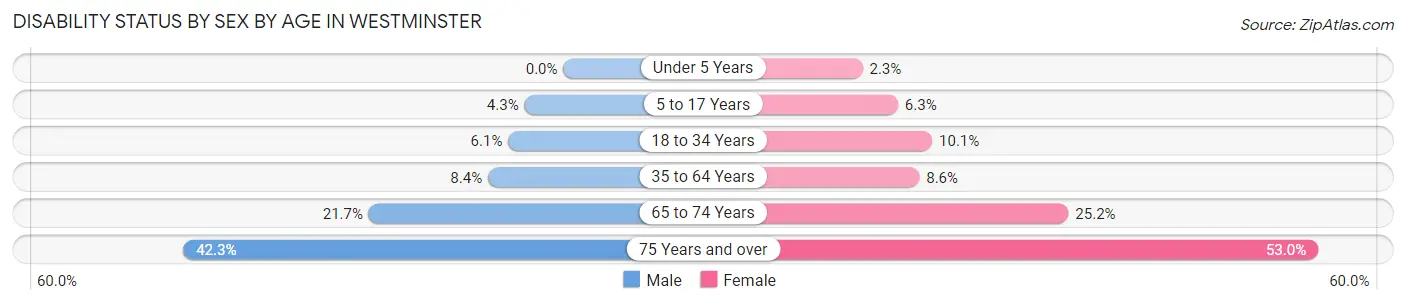
| Age Bracket | Male | Female |
| Under 5 Years | 0 (0.0%) | 62 (2.3%) |
| 5 to 17 Years | 355 (4.3%) | 535 (6.2%) |
| 18 to 34 Years | 1,018 (6.1%) | 1,430 (10.1%) |
| 35 to 64 Years | 1,936 (8.4%) | 1,914 (8.6%) |
| 65 to 74 Years | 1,017 (21.7%) | 1,430 (25.2%) |
| 75 Years and over | 1,092 (42.3%) | 1,823 (53.0%) |
Disability Class by Sex by Age in Westminster
Disability Class: Hearing Difficulty
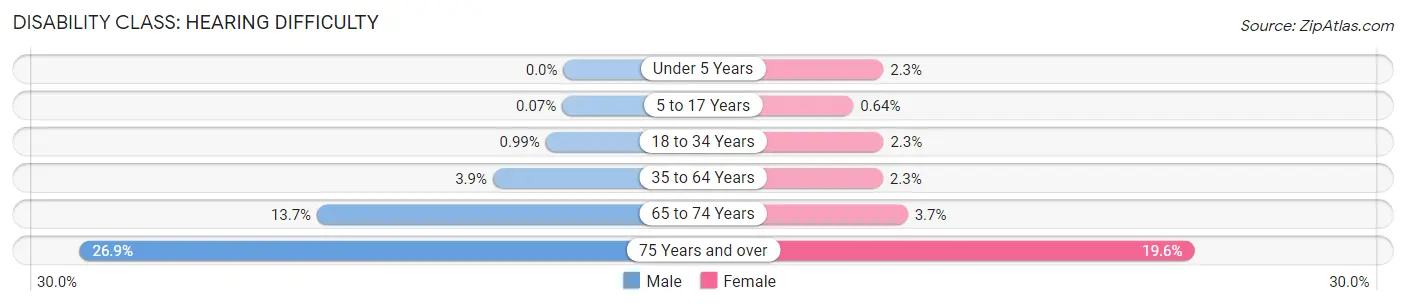
| Age Bracket | Male | Female |
| Under 5 Years | 0 (0.0%) | 62 (2.3%) |
| 5 to 17 Years | 6 (0.1%) | 55 (0.6%) |
| 18 to 34 Years | 164 (1.0%) | 330 (2.3%) |
| 35 to 64 Years | 907 (3.9%) | 509 (2.3%) |
| 65 to 74 Years | 644 (13.7%) | 208 (3.7%) |
| 75 Years and over | 695 (26.9%) | 675 (19.6%) |
Disability Class: Vision Difficulty
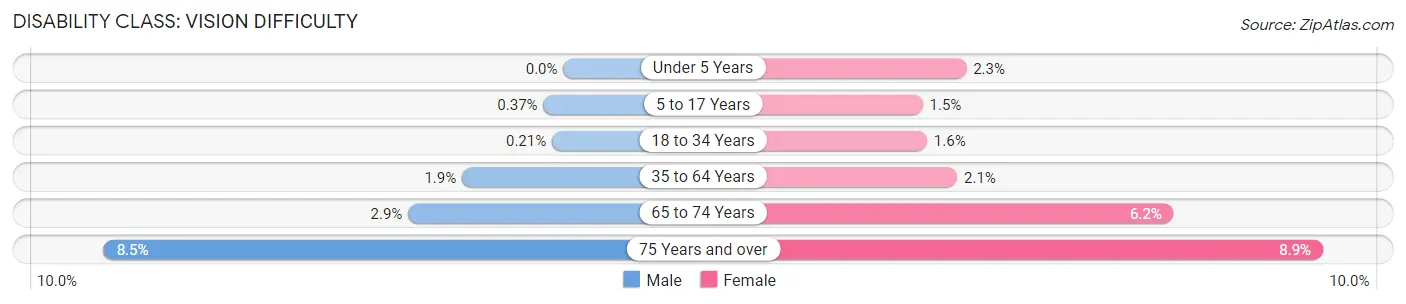
| Age Bracket | Male | Female |
| Under 5 Years | 0 (0.0%) | 62 (2.3%) |
| 5 to 17 Years | 30 (0.4%) | 128 (1.5%) |
| 18 to 34 Years | 35 (0.2%) | 224 (1.6%) |
| 35 to 64 Years | 433 (1.9%) | 475 (2.1%) |
| 65 to 74 Years | 135 (2.9%) | 349 (6.2%) |
| 75 Years and over | 220 (8.5%) | 307 (8.9%) |
Disability Class: Cognitive Difficulty
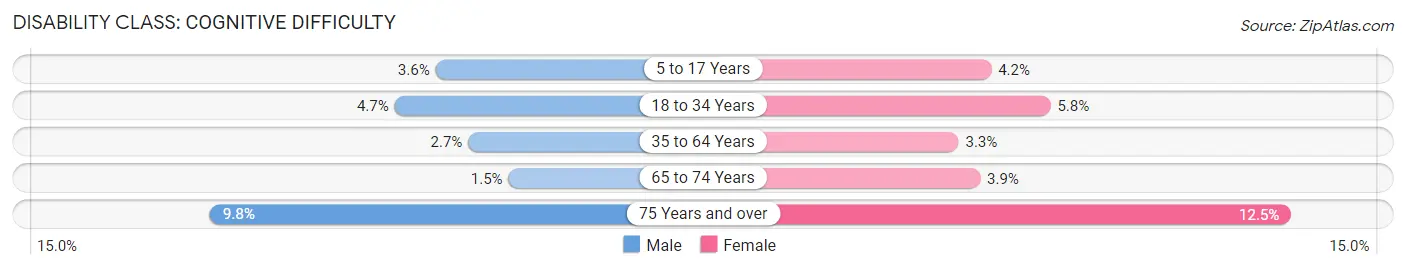
| Age Bracket | Male | Female |
| 5 to 17 Years | 292 (3.6%) | 356 (4.2%) |
| 18 to 34 Years | 779 (4.7%) | 825 (5.8%) |
| 35 to 64 Years | 612 (2.6%) | 721 (3.3%) |
| 65 to 74 Years | 72 (1.5%) | 218 (3.8%) |
| 75 Years and over | 254 (9.8%) | 430 (12.5%) |
Disability Class: Ambulatory Difficulty
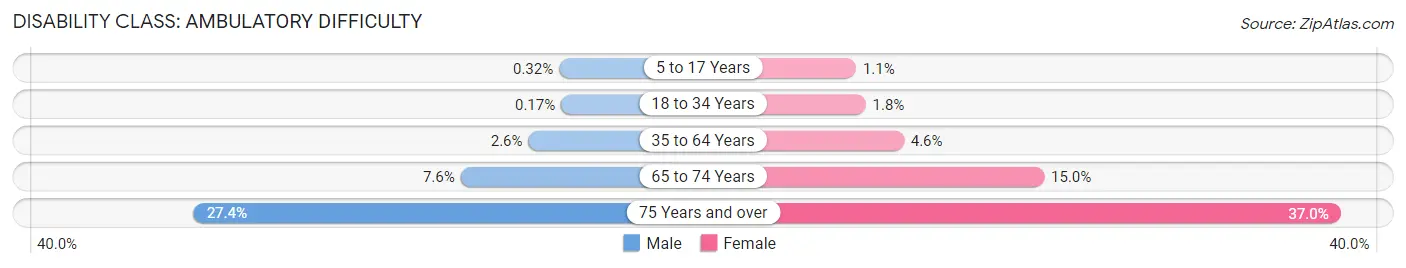
| Age Bracket | Male | Female |
| 5 to 17 Years | 26 (0.3%) | 90 (1.1%) |
| 18 to 34 Years | 28 (0.2%) | 252 (1.8%) |
| 35 to 64 Years | 600 (2.6%) | 1,021 (4.6%) |
| 65 to 74 Years | 358 (7.6%) | 851 (15.0%) |
| 75 Years and over | 708 (27.4%) | 1,273 (37.0%) |
Disability Class: Self-Care Difficulty
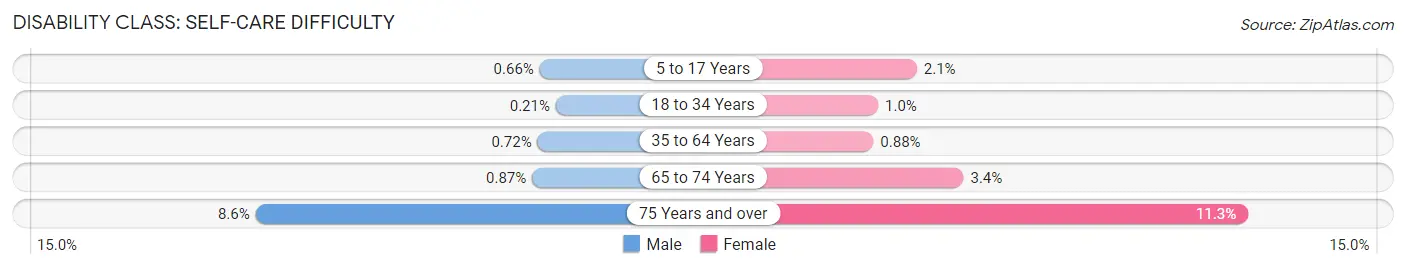
| Age Bracket | Male | Female |
| 5 to 17 Years | 54 (0.7%) | 179 (2.1%) |
| 18 to 34 Years | 35 (0.2%) | 144 (1.0%) |
| 35 to 64 Years | 167 (0.7%) | 195 (0.9%) |
| 65 to 74 Years | 41 (0.9%) | 192 (3.4%) |
| 75 Years and over | 221 (8.6%) | 389 (11.3%) |
Technology Access in Westminster
Computing Device Access in Westminster
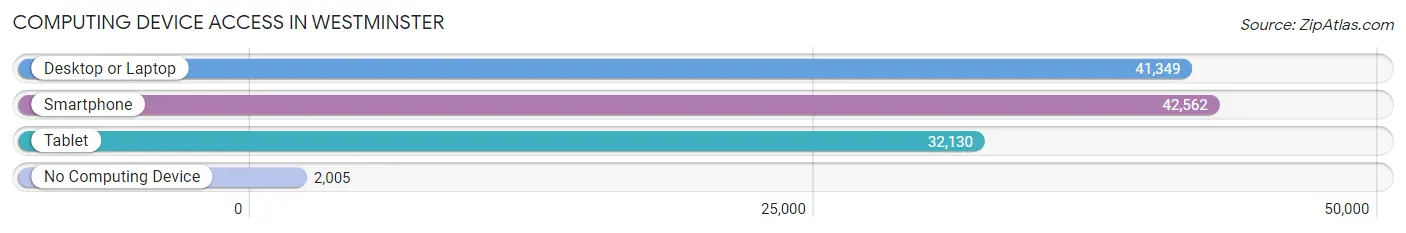
| Device Type | # Households | % Households |
| Desktop or Laptop | 41,349 | 87.9% |
| Smartphone | 42,562 | 90.5% |
| Tablet | 32,130 | 68.3% |
| No Computing Device | 2,005 | 4.3% |
| Total | 47,030 | 100.0% |
Internet Access in Westminster
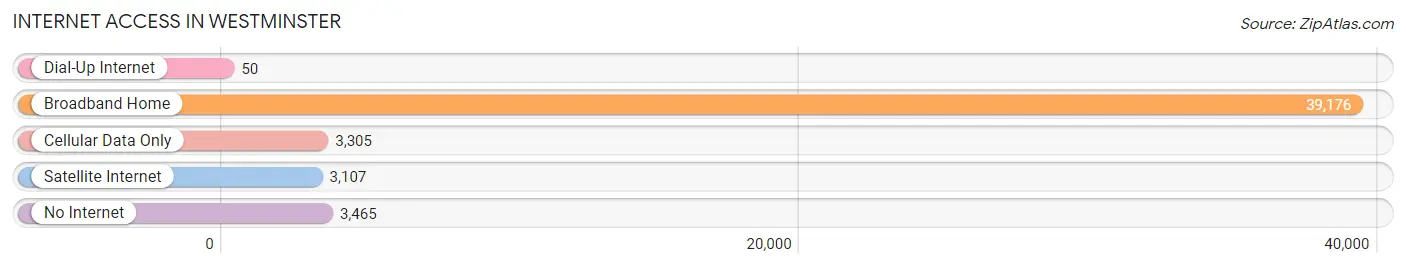
| Internet Type | # Households | % Households |
| Dial-Up Internet | 50 | 0.1% |
| Broadband Home | 39,176 | 83.3% |
| Cellular Data Only | 3,305 | 7.0% |
| Satellite Internet | 3,107 | 6.6% |
| No Internet | 3,465 | 7.4% |
| Total | 47,030 | 100.0% |
Westminster Summary
Westminster is a city located in Adams and Jefferson counties in the state of Colorado. It is a suburb of Denver and is located approximately 10 miles northwest of the city. Westminster was founded in 1911 and incorporated in 1911. As of the 2010 census, the population of Westminster was 106,114.
History
The area that is now Westminster was originally inhabited by the Arapaho and Cheyenne Native American tribes. The first settlers in the area were miners and ranchers who arrived in the late 1800s. The city of Westminster was founded in 1911 and was named after the Westminster Presbyterian Church, which was founded in the area in 1890.
The city was originally a farming community, but in the 1950s, the city began to experience rapid growth due to the development of the Denver-Boulder Turnpike, which connected the city to Denver. This led to an influx of new residents and businesses to the area.
In the 1970s, the city experienced a period of rapid growth and development, which included the construction of the Westminster Mall, the development of the Westminster Promenade, and the construction of the Westminster Center.
Geography
Westminster is located in Adams and Jefferson counties in the state of Colorado. It is located approximately 10 miles northwest of Denver. The city has a total area of 32.2 square miles, of which 31.9 square miles is land and 0.3 square miles is water.
The city is located at the base of the Rocky Mountains and is surrounded by several parks and open spaces, including Standley Lake Regional Park, Big Dry Creek Park, and Westminster Hills Open Space.
Economy
Westminster is a major economic center in the Denver metropolitan area. The city is home to several major employers, including Ball Corporation, Lockheed Martin, and the University of Colorado Health Sciences Center.
The city also has a thriving retail sector, with several major shopping centers, including the Westminster Promenade, the Westminster Mall, and the Westminster Center.
Demographics
As of the 2010 census, the population of Westminster was 106,114. The racial makeup of the city was 73.2% White, 8.2% African American, 0.7% Native American, 8.6% Asian, 0.1% Pacific Islander, 4.7% from other races, and 4.5% from two or more races. Hispanic or Latino of any race were 16.5% of the population.
The median income for a household in the city was $60,945, and the median income for a family was $71,945. The per capita income for the city was $30,945. About 5.2% of families and 7.3% of the population were below the poverty line, including 8.5% of those under age 18 and 6.3% of those age 65 or over.
Common Questions
What is Per Capita Income in Westminster?
Per Capita income in Westminster is $47,856.
What is the Median Family Income in Westminster?
Median Family Income in Westminster is $113,832.
What is the Median Household income in Westminster?
Median Household Income in Westminster is $90,651.
What is Income or Wage Gap in Westminster?
Income or Wage Gap in Westminster is 24.4%.
Women in Westminster earn 75.6 cents for every dollar earned by a man.
What is Family Income Deficit in Westminster?
Family Income Deficit in Westminster is $8,871.
Families that are below poverty line in Westminster earn $8,871 less on average than the poverty threshold level.
What is Inequality or Gini Index in Westminster?
Inequality or Gini Index in Westminster is 0.41.
What is the Total Population of Westminster?
Total Population of Westminster is 115,502.
What is the Total Male Population of Westminster?
Total Male Population of Westminster is 58,547.
What is the Total Female Population of Westminster?
Total Female Population of Westminster is 56,955.
What is the Ratio of Males per 100 Females in Westminster?
There are 102.80 Males per 100 Females in Westminster.
What is the Ratio of Females per 100 Males in Westminster?
There are 97.28 Females per 100 Males in Westminster.
What is the Median Population Age in Westminster?
Median Population Age in Westminster is 37.4 Years.
What is the Average Family Size in Westminster
Average Family Size in Westminster is 3.0 People.
What is the Average Household Size in Westminster
Average Household Size in Westminster is 2.5 People.
How Large is the Labor Force in Westminster?
There are 69,921 People in the Labor Forcein in Westminster.
What is the Percentage of People in the Labor Force in Westminster?
73.0% of People are in the Labor Force in Westminster.
What is the Unemployment Rate in Westminster?
Unemployment Rate in Westminster is 4.1%.