Darien, GA Map & Demographics
Darien Map
Darien Overview
$31,929
PER CAPITA INCOME
$61,250
AVG FAMILY INCOME
$53,325
AVG HOUSEHOLD INCOME
0.46
INEQUALITY / GINI INDEX
1,253
TOTAL POPULATION
621
MALE POPULATION
632
FEMALE POPULATION
98.26
MALES / 100 FEMALES
101.77
FEMALES / 100 MALES
49.4
MEDIAN AGE
2.7
AVG FAMILY SIZE
2.3
AVG HOUSEHOLD SIZE
645
LABOR FORCE [ PEOPLE ]
58.7%
PERCENT IN LABOR FORCE
3.3%
UNEMPLOYMENT RATE
Darien Zip Codes
Darien Area Codes
Income in Darien
Income Overview in Darien
Per Capita Income in Darien is $31,929, while median incomes of families and households are $61,250 and $53,325 respectively.
| Characteristic | Number | Measure |
| Per Capita Income | 1,253 | $31,929 |
| Median Family Income | 370 | $61,250 |
| Mean Family Income | 370 | $78,830 |
| Median Household Income | 549 | $53,325 |
| Mean Household Income | 549 | $67,576 |
| Income Deficit | 370 | $0 |
| Wage / Income Gap (%) | 1,253 | 0.00% |
| Wage / Income Gap ($) | 1,253 | 100.00¢ per $1 |
| Gini / Inequality Index | 1,253 | 0.46 |
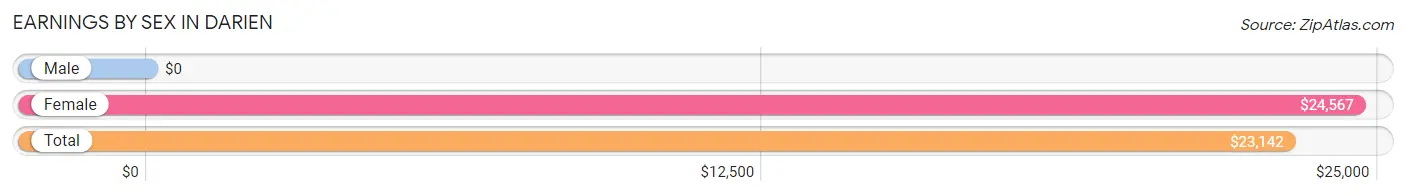
Earnings by Sex in Darien
| Sex | Number | Average Earnings |
| Male | 336 (46.0%) | $0 |
| Female | 395 (54.0%) | $24,567 |
| Total | 731 (100.0%) | $23,142 |
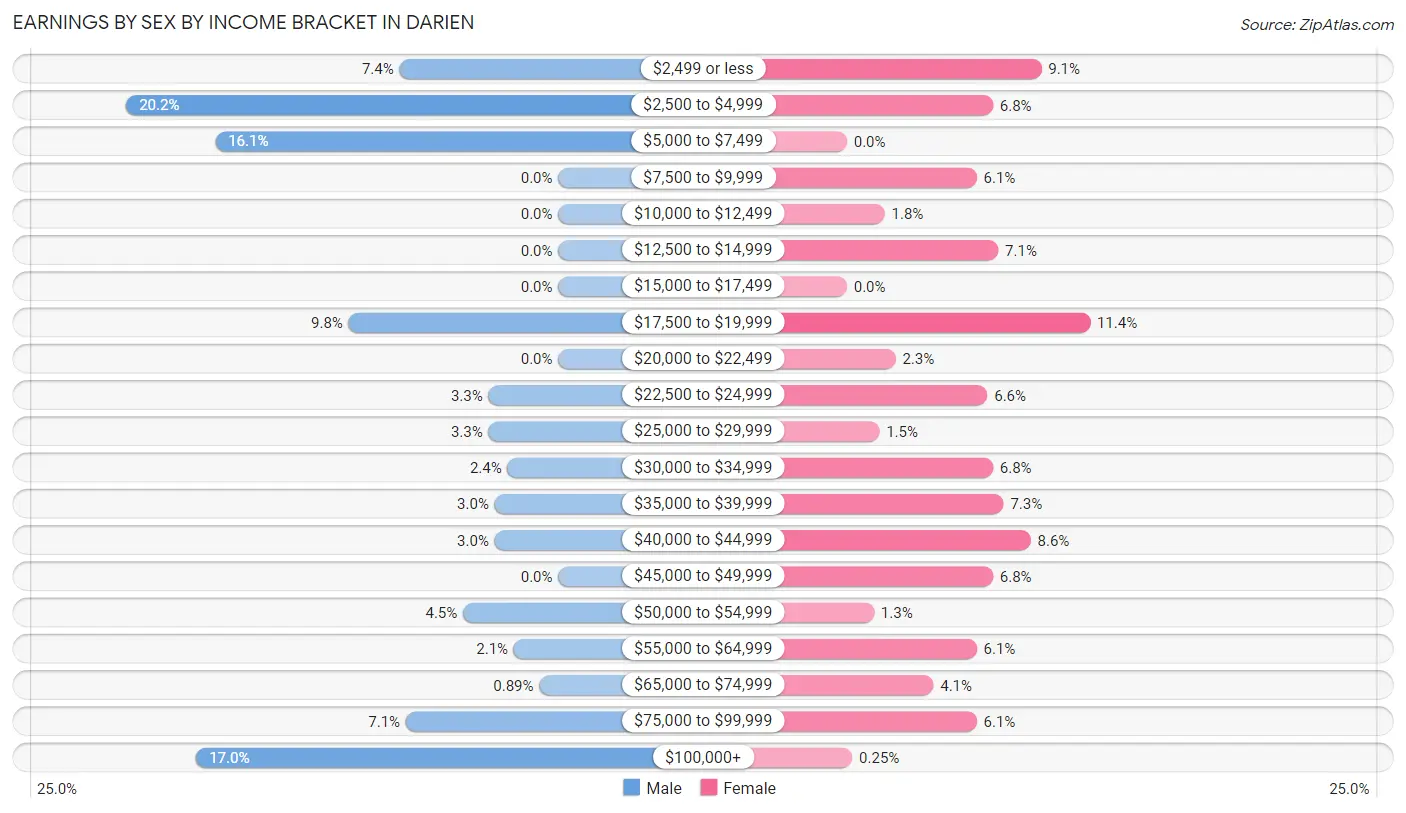
Earnings by Sex by Income Bracket in Darien
The most common earnings brackets in Darien are $2,500 to $4,999 for men (68 | 20.2%) and $17,500 to $19,999 for women (45 | 11.4%).
| Income | Male | Female |
| $2,499 or less | 25 (7.4%) | 36 (9.1%) |
| $2,500 to $4,999 | 68 (20.2%) | 27 (6.8%) |
| $5,000 to $7,499 | 54 (16.1%) | 0 (0.0%) |
| $7,500 to $9,999 | 0 (0.0%) | 24 (6.1%) |
| $10,000 to $12,499 | 0 (0.0%) | 7 (1.8%) |
| $12,500 to $14,999 | 0 (0.0%) | 28 (7.1%) |
| $15,000 to $17,499 | 0 (0.0%) | 0 (0.0%) |
| $17,500 to $19,999 | 33 (9.8%) | 45 (11.4%) |
| $20,000 to $22,499 | 0 (0.0%) | 9 (2.3%) |
| $22,500 to $24,999 | 11 (3.3%) | 26 (6.6%) |
| $25,000 to $29,999 | 11 (3.3%) | 6 (1.5%) |
| $30,000 to $34,999 | 8 (2.4%) | 27 (6.8%) |
| $35,000 to $39,999 | 10 (3.0%) | 29 (7.3%) |
| $40,000 to $44,999 | 10 (3.0%) | 34 (8.6%) |
| $45,000 to $49,999 | 0 (0.0%) | 27 (6.8%) |
| $50,000 to $54,999 | 15 (4.5%) | 5 (1.3%) |
| $55,000 to $64,999 | 7 (2.1%) | 24 (6.1%) |
| $65,000 to $74,999 | 3 (0.9%) | 16 (4.1%) |
| $75,000 to $99,999 | 24 (7.1%) | 24 (6.1%) |
| $100,000+ | 57 (17.0%) | 1 (0.3%) |
| Total | 336 (100.0%) | 395 (100.0%) |
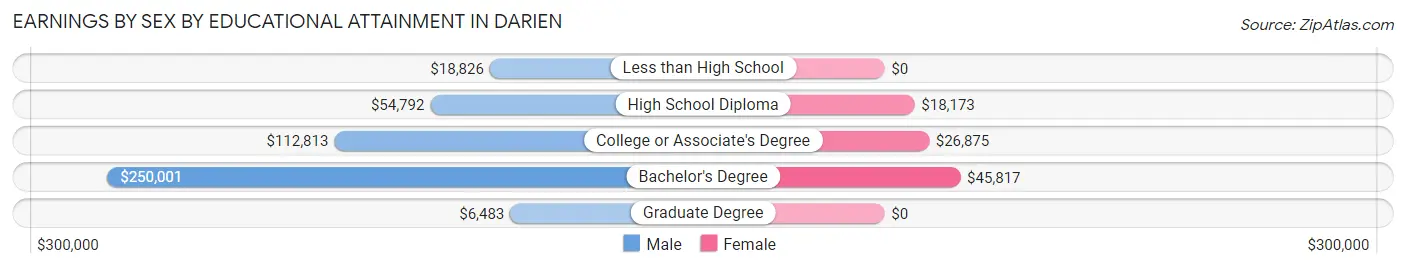
Earnings by Sex by Educational Attainment in Darien
| Educational Attainment | Male Income | Female Income |
| Less than High School | $18,826 | $0 |
| High School Diploma | $54,792 | $18,173 |
| College or Associate's Degree | $112,813 | $26,875 |
| Bachelor's Degree | $250,001 | $45,817 |
| Graduate Degree | $6,483 | $0 |
| Total | - | - |
Family Income in Darien
Family Income Brackets in Darien
According to the Darien family income data, there are 123 families falling into the $50,000 to $74,999 income range, which is the most common income bracket and makes up 33.2% of all families. Conversely, the $35,000 to $49,999 income bracket is the least frequent group with only 8 families (2.2%) belonging to this category.
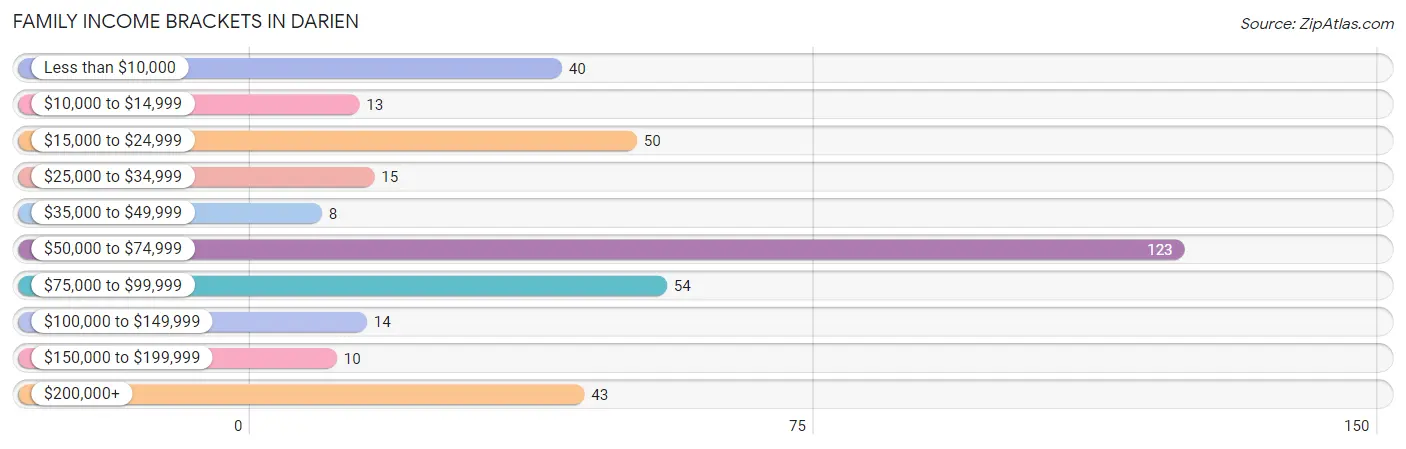
| Income Bracket | # Families | % Families |
| Less than $10,000 | 40 | 10.8% |
| $10,000 to $14,999 | 13 | 3.5% |
| $15,000 to $24,999 | 50 | 13.5% |
| $25,000 to $34,999 | 15 | 4.1% |
| $35,000 to $49,999 | 8 | 2.2% |
| $50,000 to $74,999 | 123 | 33.2% |
| $75,000 to $99,999 | 54 | 14.6% |
| $100,000 to $149,999 | 14 | 3.8% |
| $150,000 to $199,999 | 10 | 2.7% |
| $200,000+ | 43 | 11.6% |
Family Income by Famaliy Size in Darien
4-person families (39 | 10.5%) account for the highest median family income in Darien with $73,239 per family, while 4-person families (39 | 10.5%) have the highest median income of $18,310 per family member.
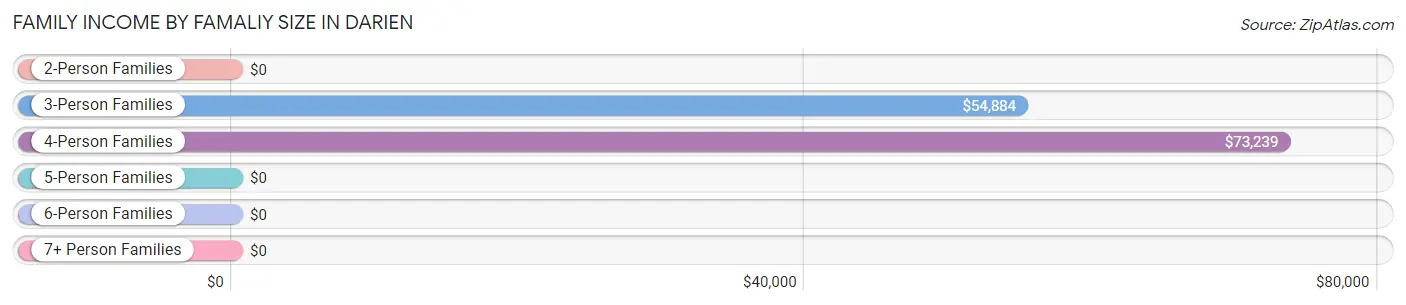
| Income Bracket | # Families | Median Income |
| 2-Person Families | 210 (56.8%) | $0 |
| 3-Person Families | 98 (26.5%) | $54,884 |
| 4-Person Families | 39 (10.5%) | $73,239 |
| 5-Person Families | 20 (5.4%) | $0 |
| 6-Person Families | 3 (0.8%) | $0 |
| 7+ Person Families | 0 (0.0%) | $0 |
| Total | 370 (100.0%) | $61,250 |
Family Income by Number of Earners in Darien
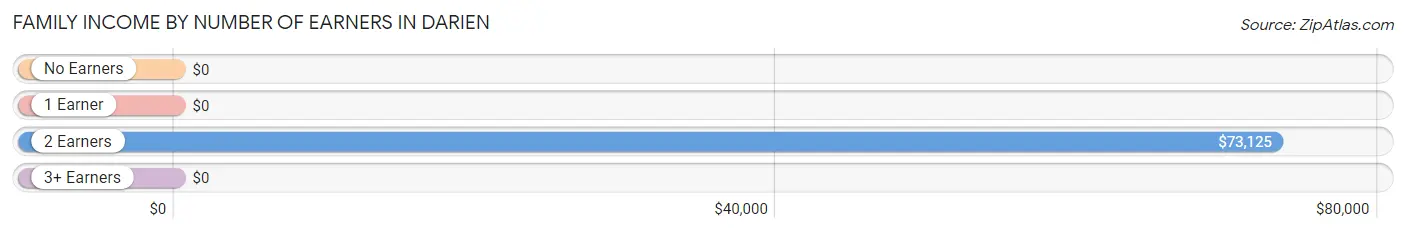
| Number of Earners | # Families | Median Income |
| No Earners | 88 (23.8%) | $0 |
| 1 Earner | 121 (32.7%) | $0 |
| 2 Earners | 75 (20.3%) | $73,125 |
| 3+ Earners | 86 (23.2%) | $0 |
| Total | 370 (100.0%) | $61,250 |
Household Income in Darien
Household Income Brackets in Darien
With 128 households falling in the category, the $50,000 to $74,999 income range is the most frequent in Darien, accounting for 23.3% of all households. In contrast, only 10 households (1.8%) fall into the $150,000 to $199,999 income bracket, making it the least populous group.
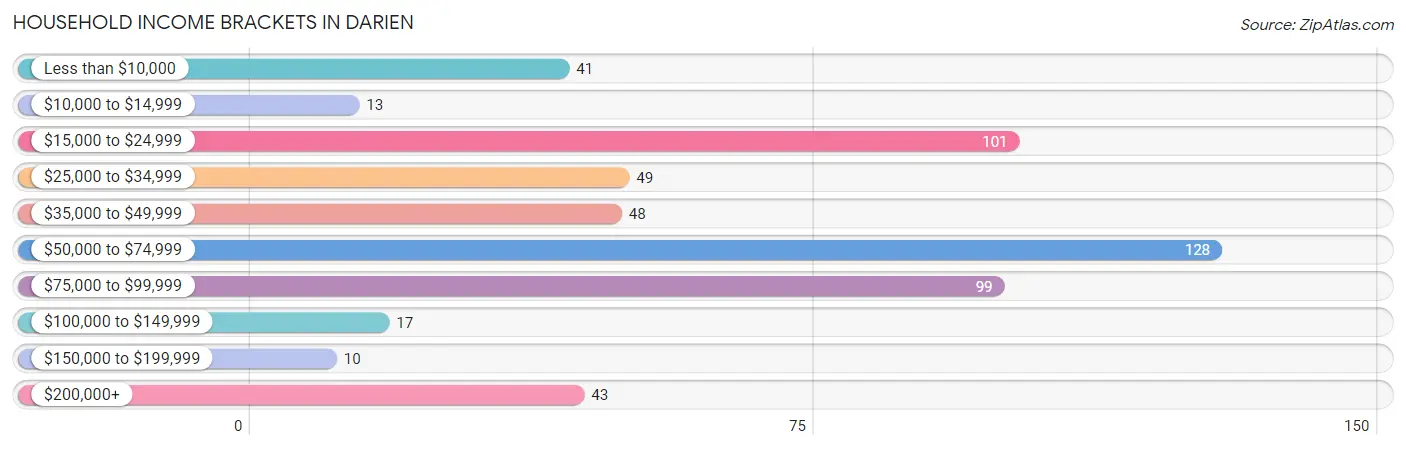
| Income Bracket | # Households | % Households |
| Less than $10,000 | 41 | 7.5% |
| $10,000 to $14,999 | 13 | 2.4% |
| $15,000 to $24,999 | 101 | 18.4% |
| $25,000 to $34,999 | 49 | 8.9% |
| $35,000 to $49,999 | 48 | 8.7% |
| $50,000 to $74,999 | 128 | 23.3% |
| $75,000 to $99,999 | 99 | 18.0% |
| $100,000 to $149,999 | 17 | 3.1% |
| $150,000 to $199,999 | 10 | 1.8% |
| $200,000+ | 43 | 7.8% |
Household Income by Householder Age in Darien
The median household income in Darien is $53,325, with the highest median household income of $73,295 found in the 45 to 64 years age bracket for the primary householder. A total of 228 households (41.5%) fall into this category.
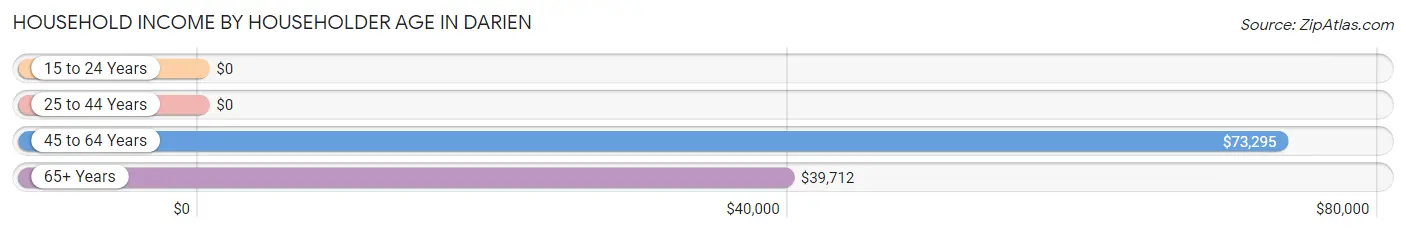
| Income Bracket | # Households | Median Income |
| 15 to 24 Years | 0 (0.0%) | $0 |
| 25 to 44 Years | 84 (15.3%) | $0 |
| 45 to 64 Years | 228 (41.5%) | $73,295 |
| 65+ Years | 237 (43.2%) | $39,712 |
| Total | 549 (100.0%) | $53,325 |
Poverty in Darien
Income Below Poverty by Sex and Age in Darien
With 16.6% poverty level for males and 16.9% for females among the residents of Darien, 12 to 14 year old males and 16 and 17 year old females are the most vulnerable to poverty, with 1 males (100.0%) and 10 females (90.9%) in their respective age groups living below the poverty level.
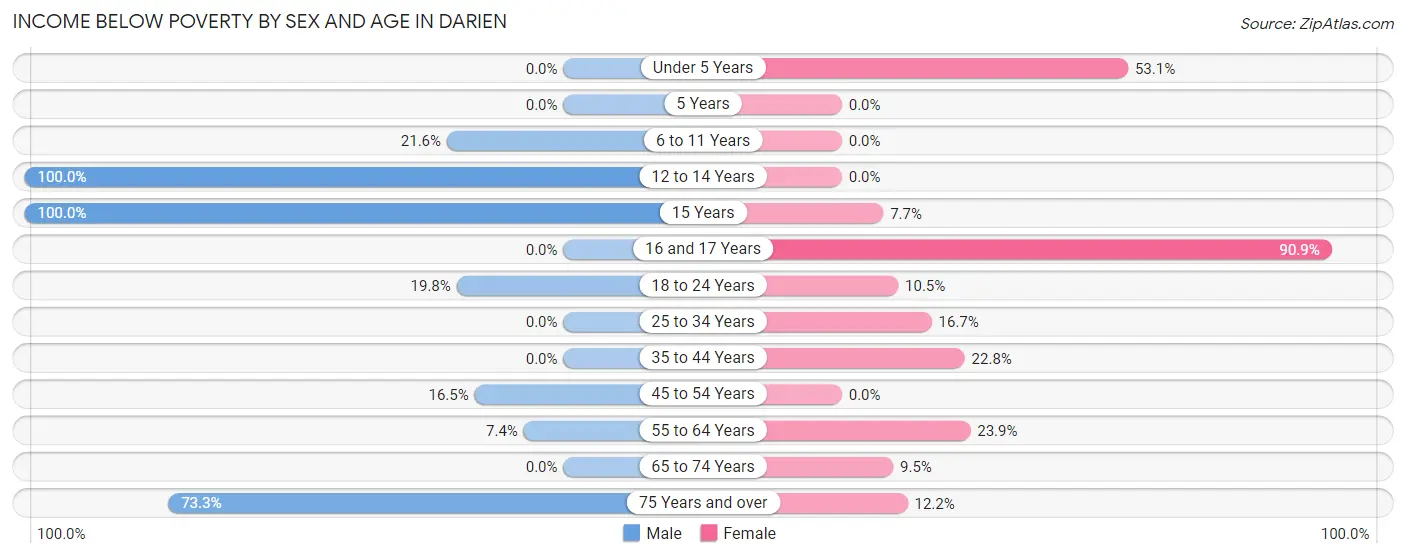
| Age Bracket | Male | Female |
| Under 5 Years | 0 (0.0%) | 17 (53.1%) |
| 5 Years | 0 (0.0%) | 0 (0.0%) |
| 6 to 11 Years | 16 (21.6%) | 0 (0.0%) |
| 12 to 14 Years | 1 (100.0%) | 0 (0.0%) |
| 15 Years | 10 (100.0%) | 1 (7.7%) |
| 16 and 17 Years | 0 (0.0%) | 10 (90.9%) |
| 18 to 24 Years | 21 (19.8%) | 7 (10.4%) |
| 25 to 34 Years | 0 (0.0%) | 18 (16.7%) |
| 35 to 44 Years | 0 (0.0%) | 13 (22.8%) |
| 45 to 54 Years | 15 (16.5%) | 0 (0.0%) |
| 55 to 64 Years | 7 (7.4%) | 26 (23.8%) |
| 65 to 74 Years | 0 (0.0%) | 10 (9.5%) |
| 75 Years and over | 33 (73.3%) | 5 (12.2%) |
| Total | 103 (16.6%) | 107 (16.9%) |
Income Above Poverty by Sex and Age in Darien
According to the poverty statistics in Darien, males aged under 5 years and females aged 6 to 11 years are the age groups that are most secure financially, with 100.0% of males and 100.0% of females in these age groups living above the poverty line.
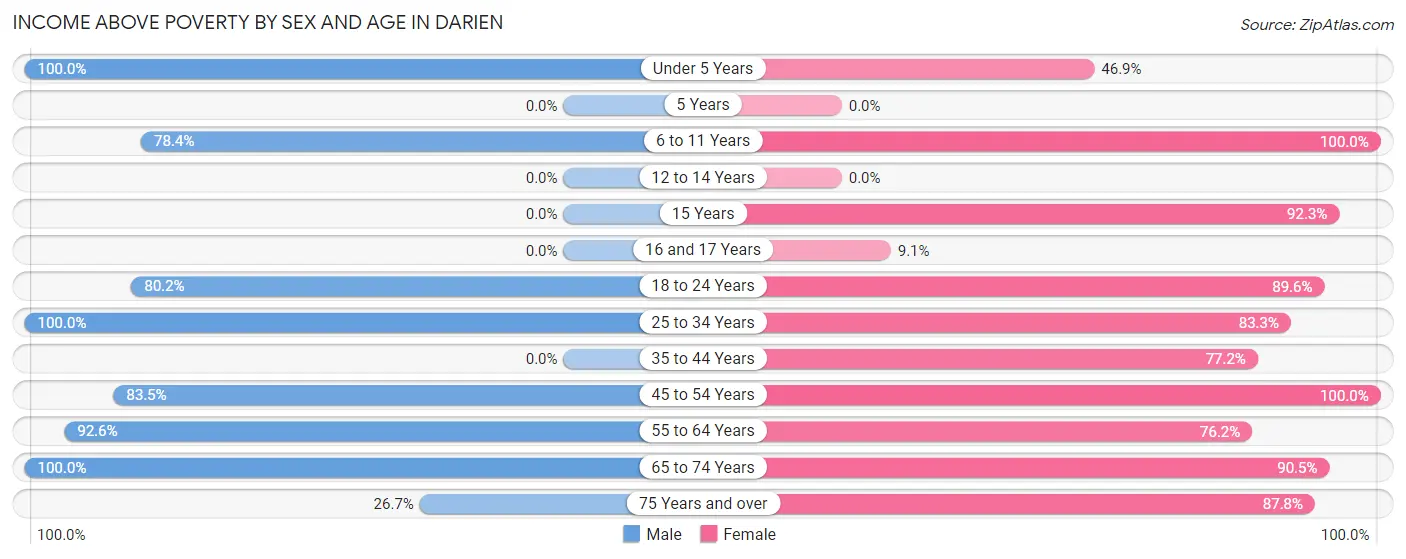
| Age Bracket | Male | Female |
| Under 5 Years | 15 (100.0%) | 15 (46.9%) |
| 5 Years | 0 (0.0%) | 0 (0.0%) |
| 6 to 11 Years | 58 (78.4%) | 9 (100.0%) |
| 12 to 14 Years | 0 (0.0%) | 0 (0.0%) |
| 15 Years | 0 (0.0%) | 12 (92.3%) |
| 16 and 17 Years | 0 (0.0%) | 1 (9.1%) |
| 18 to 24 Years | 85 (80.2%) | 60 (89.5%) |
| 25 to 34 Years | 40 (100.0%) | 90 (83.3%) |
| 35 to 44 Years | 0 (0.0%) | 44 (77.2%) |
| 45 to 54 Years | 76 (83.5%) | 80 (100.0%) |
| 55 to 64 Years | 88 (92.6%) | 83 (76.1%) |
| 65 to 74 Years | 144 (100.0%) | 95 (90.5%) |
| 75 Years and over | 12 (26.7%) | 36 (87.8%) |
| Total | 518 (83.4%) | 525 (83.1%) |
Income Below Poverty Among Married-Couple Families in Darien
The poverty statistics for married-couple families in Darien show that 4.6% or 8 of the total 174 families live below the poverty line. Families with no children have the highest poverty rate of 5.6%, comprising of 8 families. On the other hand, families with 1 or 2 children have the lowest poverty rate of 0.0%, which includes 0 families.
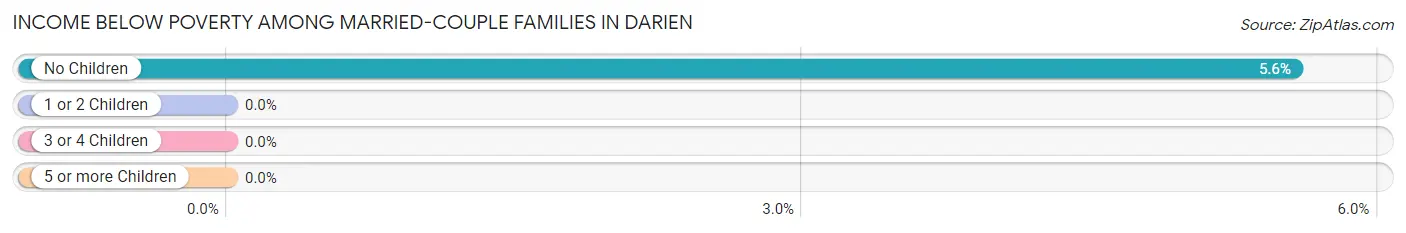
| Children | Above Poverty | Below Poverty |
| No Children | 136 (94.4%) | 8 (5.6%) |
| 1 or 2 Children | 27 (100.0%) | 0 (0.0%) |
| 3 or 4 Children | 3 (100.0%) | 0 (0.0%) |
| 5 or more Children | 0 (0.0%) | 0 (0.0%) |
| Total | 166 (95.4%) | 8 (4.6%) |
Income Below Poverty Among Single-Parent Households in Darien
According to the poverty data in Darien, 19.5% or 15 single-father households and 48.7% or 58 single-mother households are living below the poverty line. Among single-father households, those with no children have the highest poverty rate, with 14 households (20.6%) experiencing poverty. Likewise, among single-mother households, those with 3 or 4 children have the highest poverty rate, with 13 households (100.0%) falling below the poverty line.
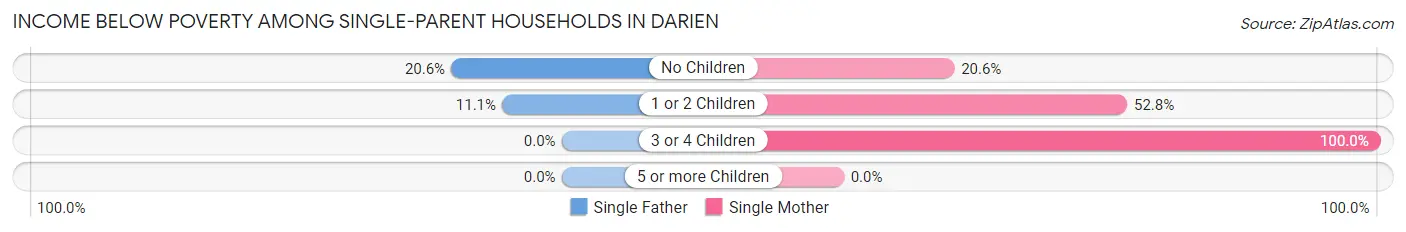
| Children | Single Father | Single Mother |
| No Children | 14 (20.6%) | 7 (20.6%) |
| 1 or 2 Children | 1 (11.1%) | 38 (52.8%) |
| 3 or 4 Children | 0 (0.0%) | 13 (100.0%) |
| 5 or more Children | 0 (0.0%) | 0 (0.0%) |
| Total | 15 (19.5%) | 58 (48.7%) |
Income Below Poverty Among Married-Couple vs Single-Parent Households in Darien
The poverty data for Darien shows that 8 of the married-couple family households (4.6%) and 73 of the single-parent households (37.2%) are living below the poverty level. Within the married-couple family households, those with no children have the highest poverty rate, with 8 households (5.6%) falling below the poverty line. Among the single-parent households, those with 3 or 4 children have the highest poverty rate, with 13 household (100.0%) living below poverty.
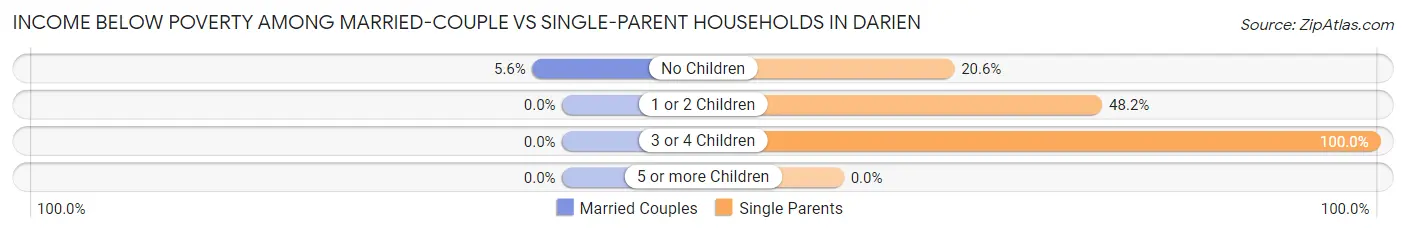
| Children | Married-Couple Families | Single-Parent Households |
| No Children | 8 (5.6%) | 21 (20.6%) |
| 1 or 2 Children | 0 (0.0%) | 39 (48.1%) |
| 3 or 4 Children | 0 (0.0%) | 13 (100.0%) |
| 5 or more Children | 0 (0.0%) | 0 (0.0%) |
| Total | 8 (4.6%) | 73 (37.2%) |
Race in Darien
The most populous races in Darien are White / Caucasian (604 | 48.2%), Black / African American (511 | 40.8%), and Two or more Races (137 | 10.9%).
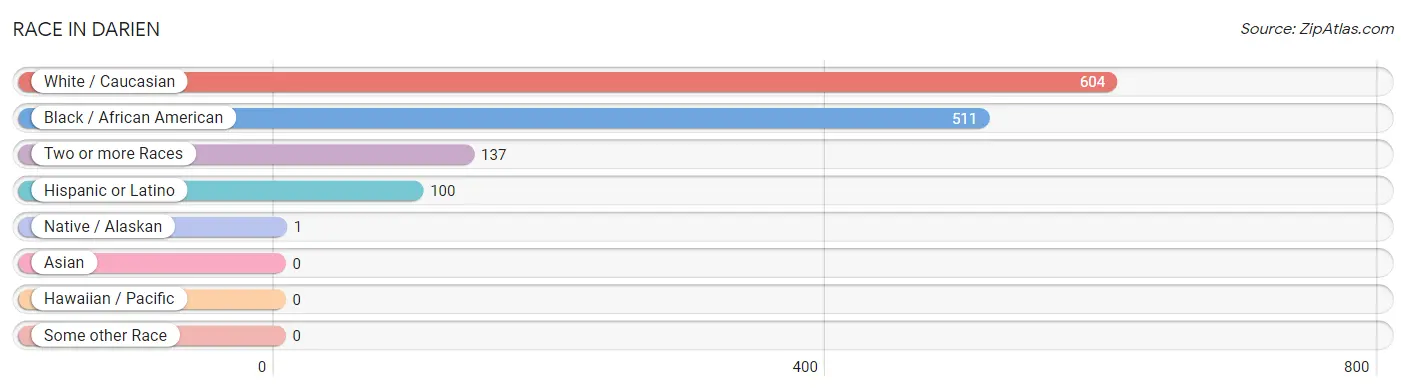
| Race | # Population | % Population |
| Asian | 0 | 0.0% |
| Black / African American | 511 | 40.8% |
| Hawaiian / Pacific | 0 | 0.0% |
| Hispanic or Latino | 100 | 8.0% |
| Native / Alaskan | 1 | 0.1% |
| White / Caucasian | 604 | 48.2% |
| Two or more Races | 137 | 10.9% |
| Some other Race | 0 | 0.0% |
| Total | 1,253 | 100.0% |
Ancestry in Darien
The most populous ancestries reported in Darien are English (118 | 9.4%), Irish (105 | 8.4%), German (101 | 8.1%), Puerto Rican (89 | 7.1%), and American (80 | 6.4%), together accounting for 39.3% of all Darien residents.
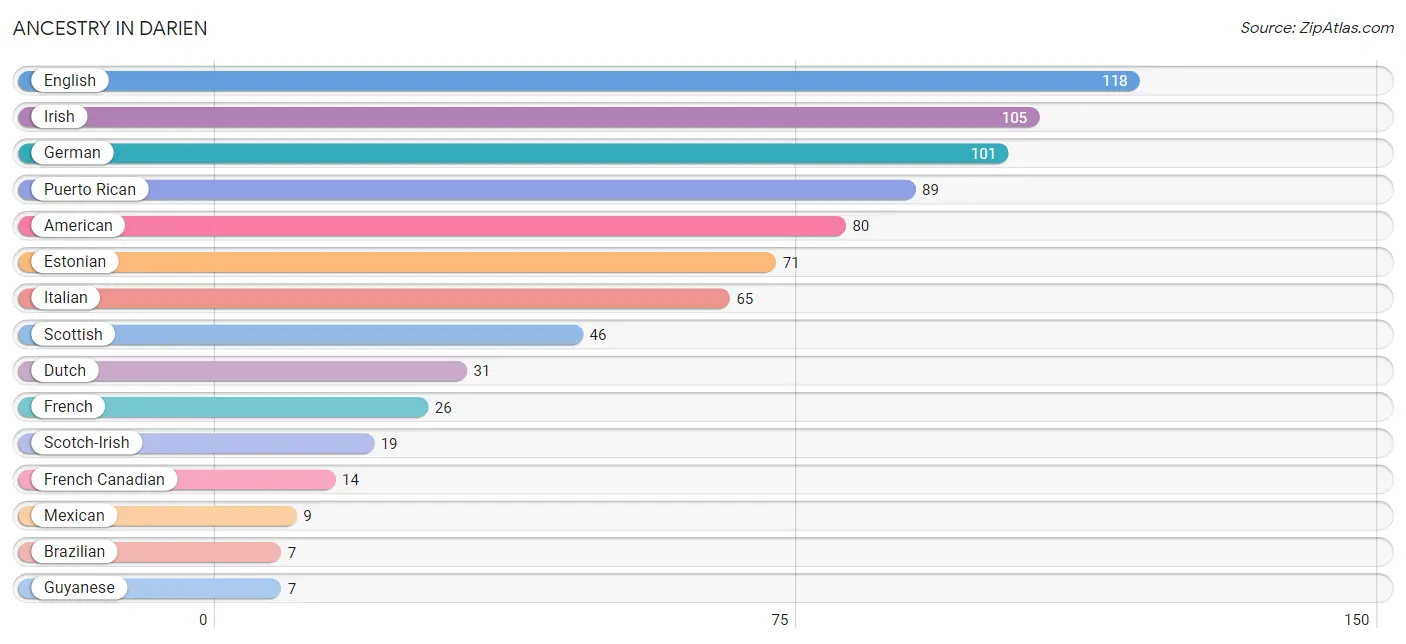
| Ancestry | # Population | % Population |
| American | 80 | 6.4% |
| Brazilian | 7 | 0.6% |
| Cherokee | 4 | 0.3% |
| Danish | 4 | 0.3% |
| Dutch | 31 | 2.5% |
| English | 118 | 9.4% |
| Estonian | 71 | 5.7% |
| European | 6 | 0.5% |
| French | 26 | 2.1% |
| French Canadian | 14 | 1.1% |
| German | 101 | 8.1% |
| Guyanese | 7 | 0.6% |
| Irish | 105 | 8.4% |
| Italian | 65 | 5.2% |
| Mexican | 9 | 0.7% |
| Navajo | 4 | 0.3% |
| Puerto Rican | 89 | 7.1% |
| Scotch-Irish | 19 | 1.5% |
| Scottish | 46 | 3.7% |
| Spanish | 2 | 0.2% | View All 20 Rows |
Immigrants in Darien
The most numerous immigrant groups reported in Darien came from Latin America (23 | 1.8%), South America (14 | 1.1%), Central America (9 | 0.7%), Mexico (9 | 0.7%), and Asia (7 | 0.6%), together accounting for 5.0% of all Darien residents.
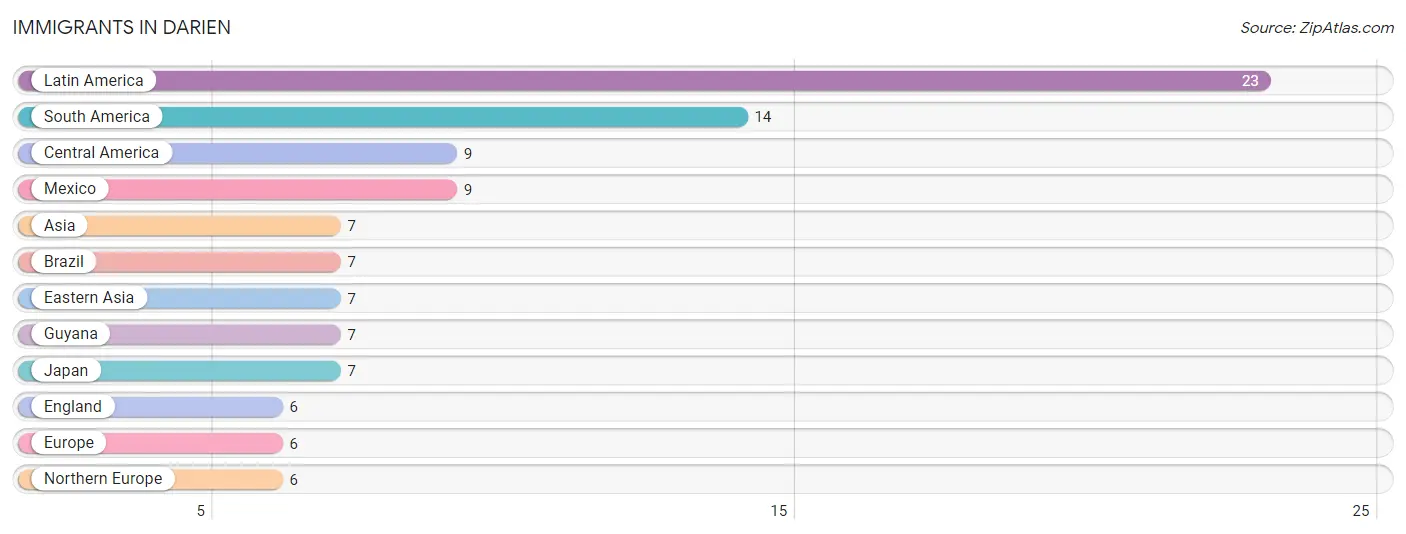
| Immigration Origin | # Population | % Population |
| Asia | 7 | 0.6% |
| Brazil | 7 | 0.6% |
| Central America | 9 | 0.7% |
| Eastern Asia | 7 | 0.6% |
| England | 6 | 0.5% |
| Europe | 6 | 0.5% |
| Guyana | 7 | 0.6% |
| Japan | 7 | 0.6% |
| Latin America | 23 | 1.8% |
| Mexico | 9 | 0.7% |
| Northern Europe | 6 | 0.5% |
| South America | 14 | 1.1% | View All 12 Rows |
Sex and Age in Darien
Sex and Age in Darien
The most populous age groups in Darien are 70 to 74 Years (103 | 16.6%) for men and 25 to 29 Years (102 | 16.1%) for women.
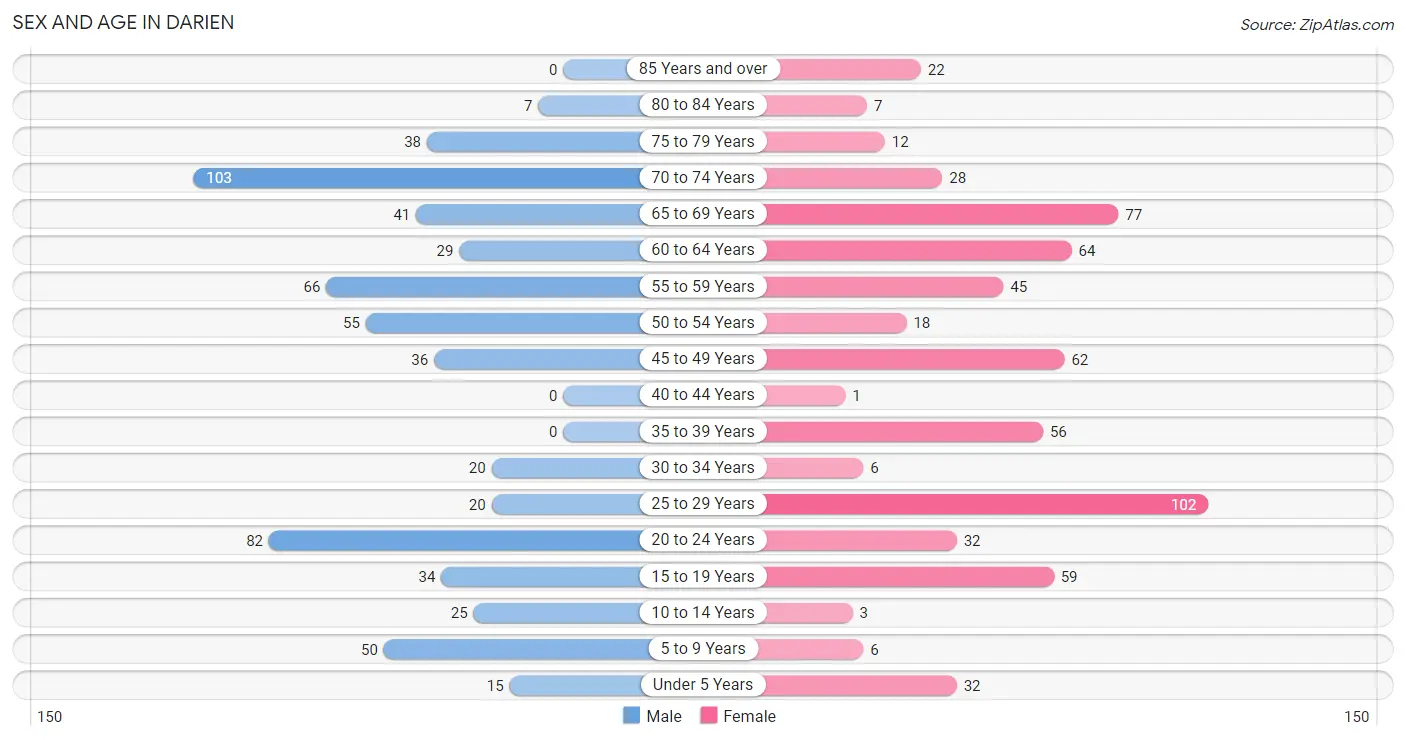
| Age Bracket | Male | Female |
| Under 5 Years | 15 (2.4%) | 32 (5.1%) |
| 5 to 9 Years | 50 (8.1%) | 6 (0.9%) |
| 10 to 14 Years | 25 (4.0%) | 3 (0.5%) |
| 15 to 19 Years | 34 (5.5%) | 59 (9.3%) |
| 20 to 24 Years | 82 (13.2%) | 32 (5.1%) |
| 25 to 29 Years | 20 (3.2%) | 102 (16.1%) |
| 30 to 34 Years | 20 (3.2%) | 6 (0.9%) |
| 35 to 39 Years | 0 (0.0%) | 56 (8.9%) |
| 40 to 44 Years | 0 (0.0%) | 1 (0.2%) |
| 45 to 49 Years | 36 (5.8%) | 62 (9.8%) |
| 50 to 54 Years | 55 (8.9%) | 18 (2.9%) |
| 55 to 59 Years | 66 (10.6%) | 45 (7.1%) |
| 60 to 64 Years | 29 (4.7%) | 64 (10.1%) |
| 65 to 69 Years | 41 (6.6%) | 77 (12.2%) |
| 70 to 74 Years | 103 (16.6%) | 28 (4.4%) |
| 75 to 79 Years | 38 (6.1%) | 12 (1.9%) |
| 80 to 84 Years | 7 (1.1%) | 7 (1.1%) |
| 85 Years and over | 0 (0.0%) | 22 (3.5%) |
| Total | 621 (100.0%) | 632 (100.0%) |
Families and Households in Darien
Median Family Size in Darien
The median family size in Darien is 2.72 persons per family, with single male/father families (77 | 20.8%) accounting for the largest median family size of 2.99 persons per family. On the other hand, single female/mother families (119 | 32.2%) represent the smallest median family size with 2.45 persons per family.
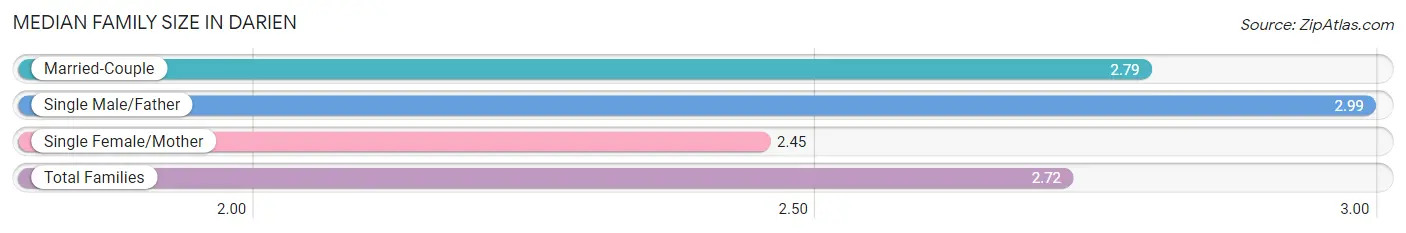
| Family Type | # Families | Family Size |
| Married-Couple | 174 (47.0%) | 2.79 |
| Single Male/Father | 77 (20.8%) | 2.99 |
| Single Female/Mother | 119 (32.2%) | 2.45 |
| Total Families | 370 (100.0%) | 2.72 |
Median Household Size in Darien
The median household size in Darien is 2.28 persons per household, with single male/father households (77 | 14.0%) accounting for the largest median household size of 3.1 persons per household. non-family households (179 | 32.6%) represent the smallest median household size with 1.16 persons per household.
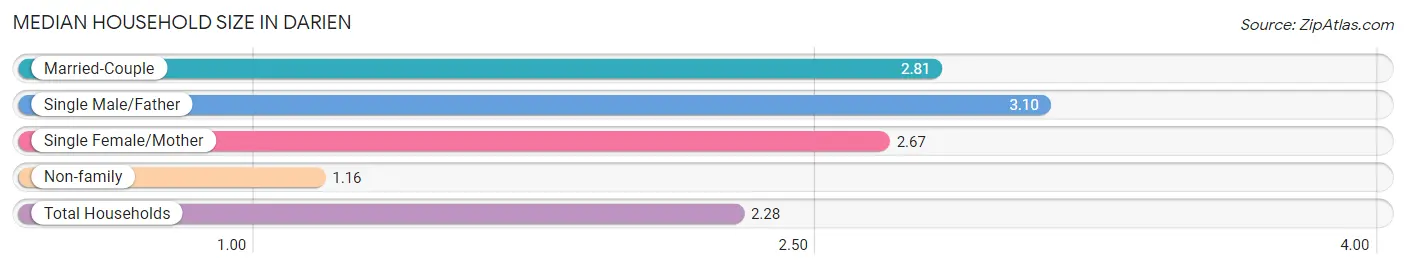
| Household Type | # Households | Household Size |
| Married-Couple | 174 (31.7%) | 2.81 |
| Single Male/Father | 77 (14.0%) | 3.10 |
| Single Female/Mother | 119 (21.7%) | 2.67 |
| Non-family | 179 (32.6%) | 1.16 |
| Total Households | 549 (100.0%) | 2.28 |
Household Size by Marriage Status in Darien
Out of a total of 549 households in Darien, 370 (67.4%) are family households, while 179 (32.6%) are nonfamily households. The most numerous type of family households are 2-person households, comprising 194, and the most common type of nonfamily households are 1-person households, comprising 156.
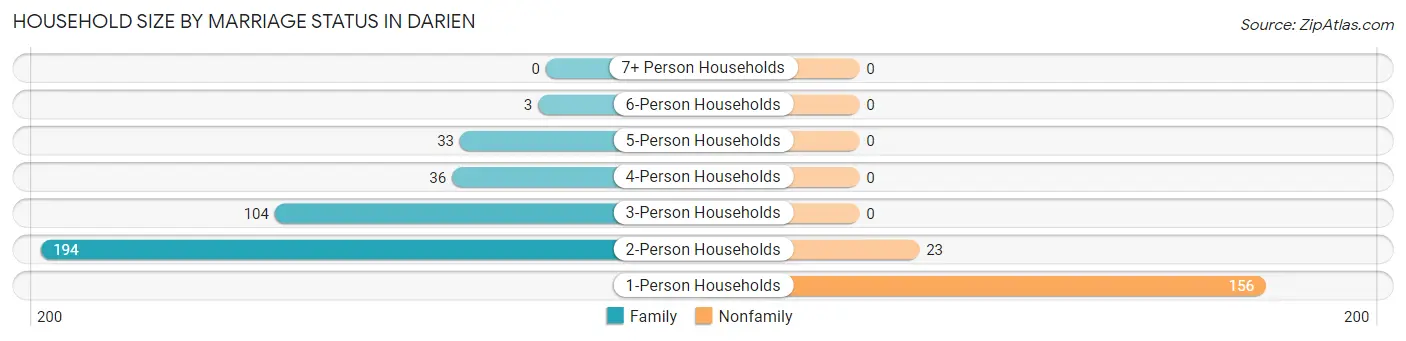
| Household Size | Family Households | Nonfamily Households |
| 1-Person Households | - | 156 (28.4%) |
| 2-Person Households | 194 (35.3%) | 23 (4.2%) |
| 3-Person Households | 104 (18.9%) | 0 (0.0%) |
| 4-Person Households | 36 (6.6%) | 0 (0.0%) |
| 5-Person Households | 33 (6.0%) | 0 (0.0%) |
| 6-Person Households | 3 (0.5%) | 0 (0.0%) |
| 7+ Person Households | 0 (0.0%) | 0 (0.0%) |
| Total | 370 (67.4%) | 179 (32.6%) |
Female Fertility in Darien
Fertility by Age in Darien
Average fertility rate in Darien is 44.0 births per 1,000 women. Women in the age bracket of 20 to 34 years have the highest fertility rate with 64.0 births per 1,000 women. Women in the age bracket of 20 to 34 years acount for 64.3% of all women with births.
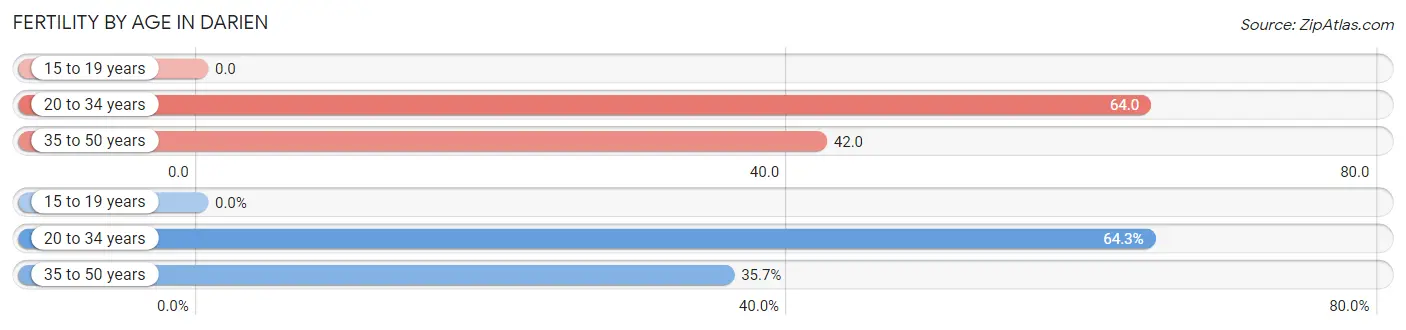
| Age Bracket | Women with Births | Births / 1,000 Women |
| 15 to 19 years | 0 (0.0%) | 0.0 |
| 20 to 34 years | 9 (64.3%) | 64.0 |
| 35 to 50 years | 5 (35.7%) | 42.0 |
| Total | 14 (100.0%) | 44.0 |
Fertility by Age by Marriage Status in Darien
35.7% of women with births (14) in Darien are married. The highest percentage of unmarried women with births falls into 20 to 34 years age bracket with 100.0% of them unmarried at the time of birth, while the lowest percentage of unmarried women with births belong to 35 to 50 years age bracket with 0.0% of them unmarried.
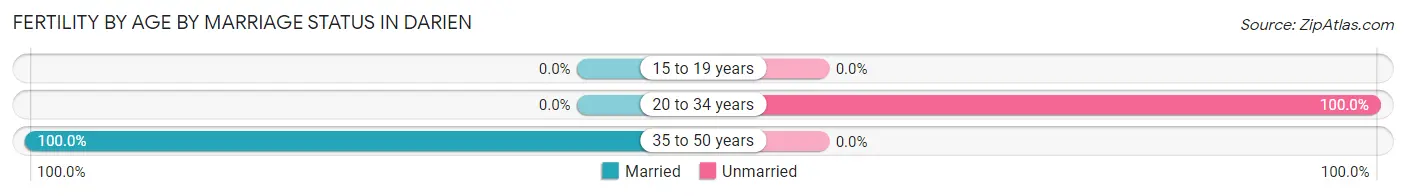
| Age Bracket | Married | Unmarried |
| 15 to 19 years | 0 (0.0%) | 0 (0.0%) |
| 20 to 34 years | 0 (0.0%) | 9 (100.0%) |
| 35 to 50 years | 5 (100.0%) | 0 (0.0%) |
| Total | 5 (35.7%) | 9 (64.3%) |
Fertility by Education in Darien
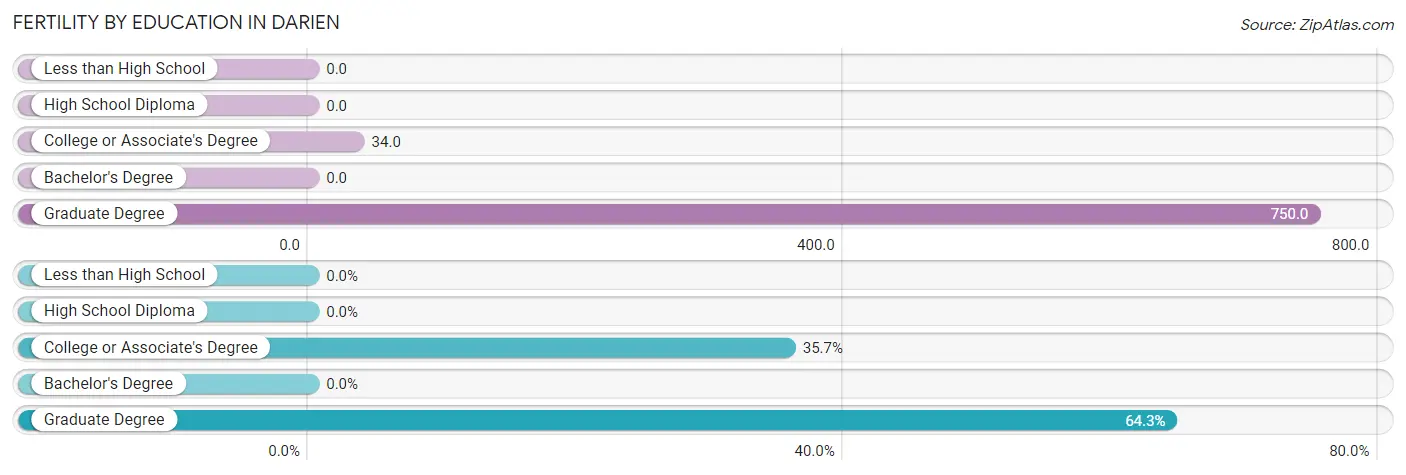
| Educational Attainment | Women with Births | Births / 1,000 Women |
| Less than High School | 0 (0.0%) | 0.0 |
| High School Diploma | 0 (0.0%) | 0.0 |
| College or Associate's Degree | 5 (35.7%) | 34.0 |
| Bachelor's Degree | 0 (0.0%) | 0.0 |
| Graduate Degree | 9 (64.3%) | 750.0 |
| Total | 14 (100.0%) | 44.0 |
Fertility by Education by Marriage Status in Darien
64.3% of women with births in Darien are unmarried. Women with the educational attainment of college or associate's degree are most likely to be married with 100.0% of them married at childbirth, while women with the educational attainment of graduate degree are least likely to be married with 100.0% of them unmarried at childbirth.
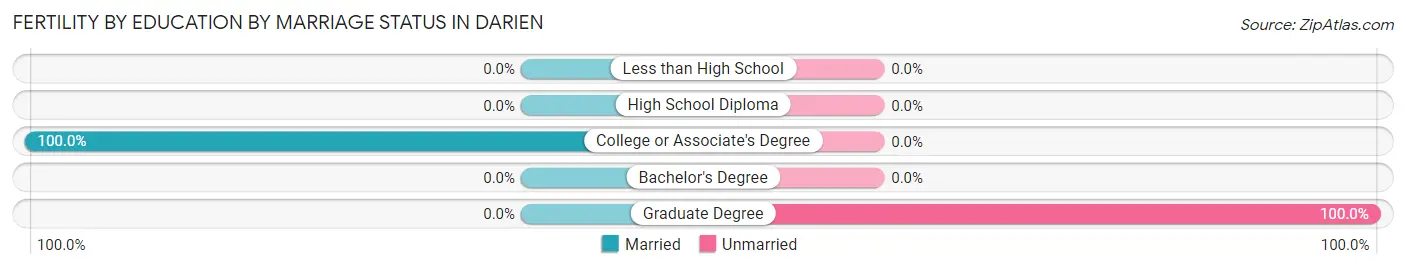
| Educational Attainment | Married | Unmarried |
| Less than High School | 0 (0.0%) | 0 (0.0%) |
| High School Diploma | 0 (0.0%) | 0 (0.0%) |
| College or Associate's Degree | 5 (100.0%) | 0 (0.0%) |
| Bachelor's Degree | 0 (0.0%) | 0 (0.0%) |
| Graduate Degree | 0 (0.0%) | 9 (100.0%) |
| Total | 5 (35.7%) | 9 (64.3%) |
Employment Characteristics in Darien
Employment by Class of Employer in Darien
Among the 600 employed individuals in Darien, private company employees (294 | 49.0%), local government employees (138 | 23.0%), and state government employees (54 | 9.0%) make up the most common classes of employment.
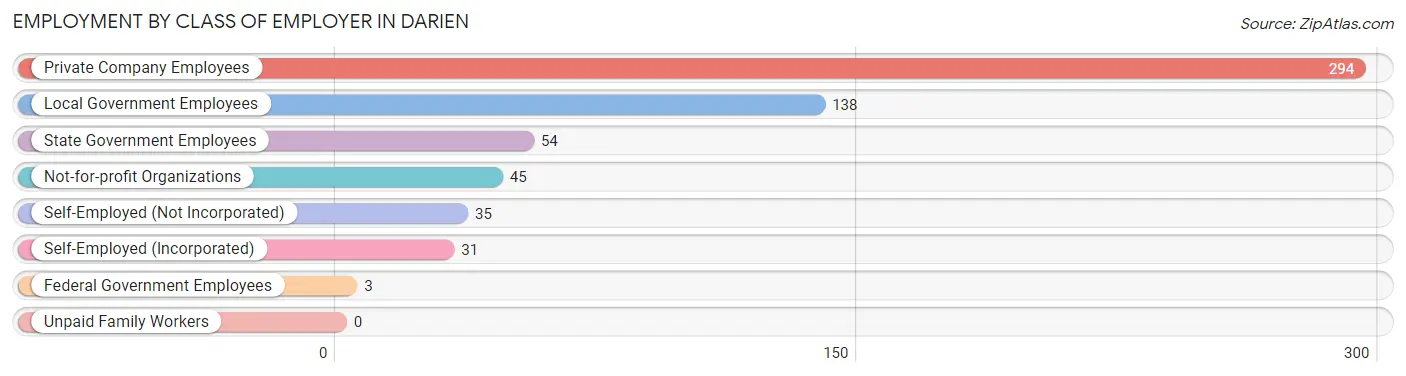
| Employer Class | # Employees | % Employees |
| Private Company Employees | 294 | 49.0% |
| Self-Employed (Incorporated) | 31 | 5.2% |
| Self-Employed (Not Incorporated) | 35 | 5.8% |
| Not-for-profit Organizations | 45 | 7.5% |
| Local Government Employees | 138 | 23.0% |
| State Government Employees | 54 | 9.0% |
| Federal Government Employees | 3 | 0.5% |
| Unpaid Family Workers | 0 | 0.0% |
| Total | 600 | 100.0% |
Employment Status by Age in Darien
According to the labor force statistics for Darien, out of the total population over 16 years of age (1,099), 58.7% or 645 individuals are in the labor force, with 3.3% or 21 of them unemployed. The age group with the highest labor force participation rate is 25 to 29 years, with 100.0% or 122 individuals in the labor force. Within the labor force, the 16 to 19 years age range has the highest percentage of unemployed individuals, with 90.9% or 10 of them being unemployed.
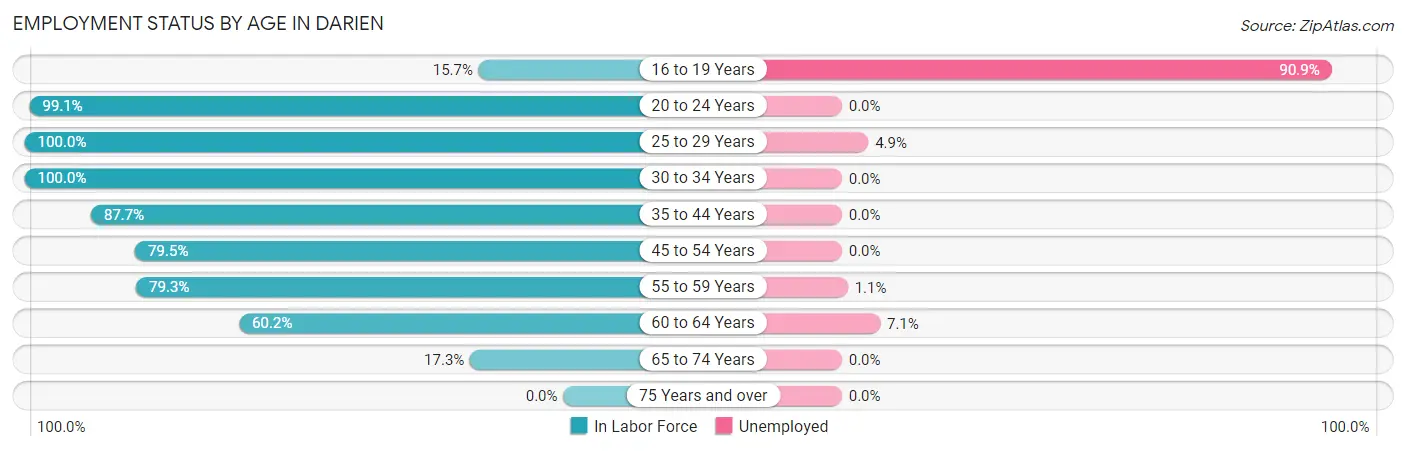
| Age Bracket | In Labor Force | Unemployed |
| 16 to 19 Years | 11 (15.7%) | 10 (90.9%) |
| 20 to 24 Years | 113 (99.1%) | 0 (0.0%) |
| 25 to 29 Years | 122 (100.0%) | 6 (4.9%) |
| 30 to 34 Years | 26 (100.0%) | 0 (0.0%) |
| 35 to 44 Years | 50 (87.7%) | 0 (0.0%) |
| 45 to 54 Years | 136 (79.5%) | 0 (0.0%) |
| 55 to 59 Years | 88 (79.3%) | 1 (1.1%) |
| 60 to 64 Years | 56 (60.2%) | 4 (7.1%) |
| 65 to 74 Years | 43 (17.3%) | 0 (0.0%) |
| 75 Years and over | 0 (0.0%) | 0 (0.0%) |
| Total | 645 (58.7%) | 21 (3.3%) |
Employment Status by Educational Attainment in Darien
According to labor force statistics for Darien, 82.4% of individuals (478) out of the total population between 25 and 64 years of age (580) are in the labor force, with 2.3% or 11 of them being unemployed. The group with the highest labor force participation rate are those with the educational attainment of college / associate degree, with 98.6% or 212 individuals in the labor force. Within the labor force, individuals with high school diploma education have the highest percentage of unemployment, with 11.9% or 10 of them being unemployed.

| Educational Attainment | In Labor Force | Unemployed |
| Less than High School | 47 (82.5%) | 0 (0.0%) |
| High School Diploma | 84 (55.6%) | 18 (11.9%) |
| College / Associate Degree | 212 (98.6%) | 0 (0.0%) |
| Bachelor's Degree or higher | 135 (86.0%) | 1 (0.7%) |
| Total | 478 (82.4%) | 13 (2.3%) |
Employment Occupations by Sex in Darien
Management, Business, Science and Arts Occupations
The most common Management, Business, Science and Arts occupations in Darien are Community & Social Service (141 | 22.6%), Education Instruction & Library (86 | 13.8%), Education, Arts & Media (31 | 5.0%), Management (30 | 4.8%), and Arts, Media & Entertainment (24 | 3.8%).
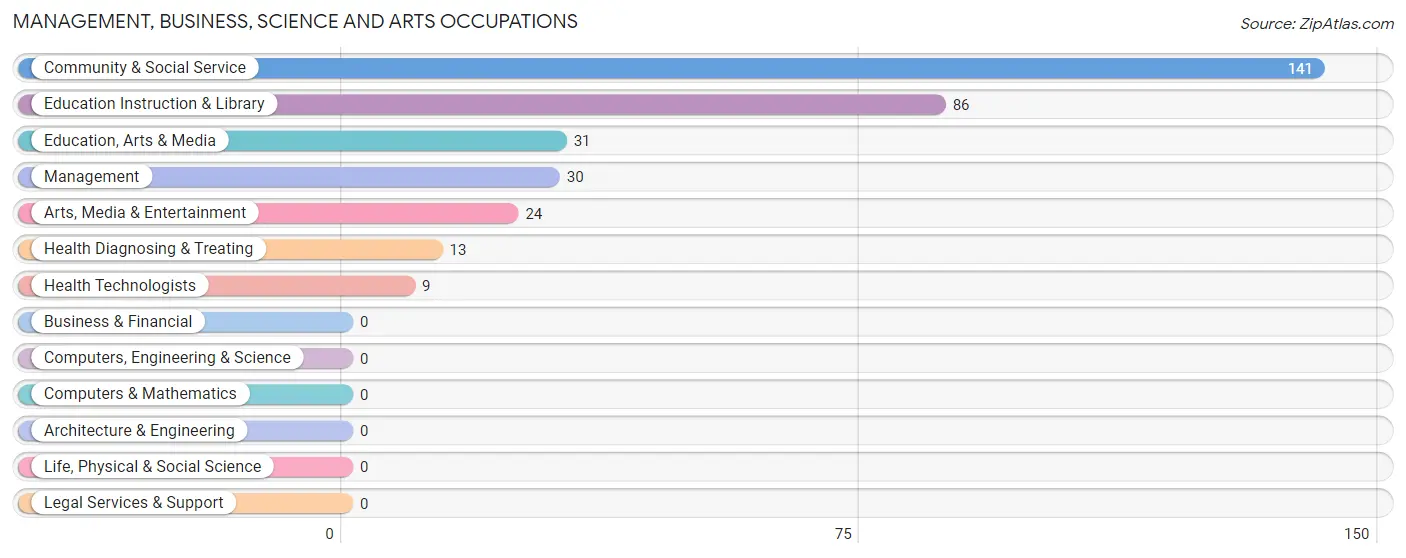
Management, Business, Science and Arts Occupations by Sex
Within the Management, Business, Science and Arts occupations in Darien, the most male-oriented occupations are Management (53.3%), Education Instruction & Library (50.0%), and Community & Social Service (30.5%), while the most female-oriented occupations are Education, Arts & Media (100.0%), Arts, Media & Entertainment (100.0%), and Health Diagnosing & Treating (100.0%).
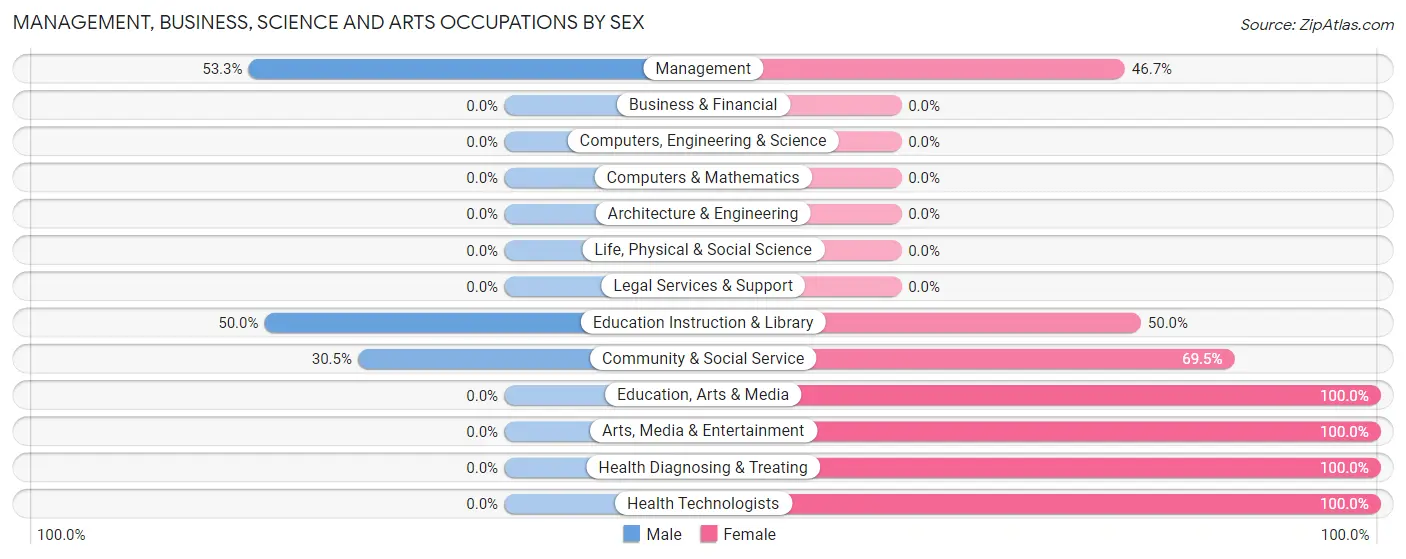
| Occupation | Male | Female |
| Management | 16 (53.3%) | 14 (46.7%) |
| Business & Financial | 0 (0.0%) | 0 (0.0%) |
| Computers, Engineering & Science | 0 (0.0%) | 0 (0.0%) |
| Computers & Mathematics | 0 (0.0%) | 0 (0.0%) |
| Architecture & Engineering | 0 (0.0%) | 0 (0.0%) |
| Life, Physical & Social Science | 0 (0.0%) | 0 (0.0%) |
| Community & Social Service | 43 (30.5%) | 98 (69.5%) |
| Education, Arts & Media | 0 (0.0%) | 31 (100.0%) |
| Legal Services & Support | 0 (0.0%) | 0 (0.0%) |
| Education Instruction & Library | 43 (50.0%) | 43 (50.0%) |
| Arts, Media & Entertainment | 0 (0.0%) | 24 (100.0%) |
| Health Diagnosing & Treating | 0 (0.0%) | 13 (100.0%) |
| Health Technologists | 0 (0.0%) | 9 (100.0%) |
| Total (Category) | 59 (32.1%) | 125 (67.9%) |
| Total (Overall) | 305 (48.9%) | 319 (51.1%) |
Services Occupations
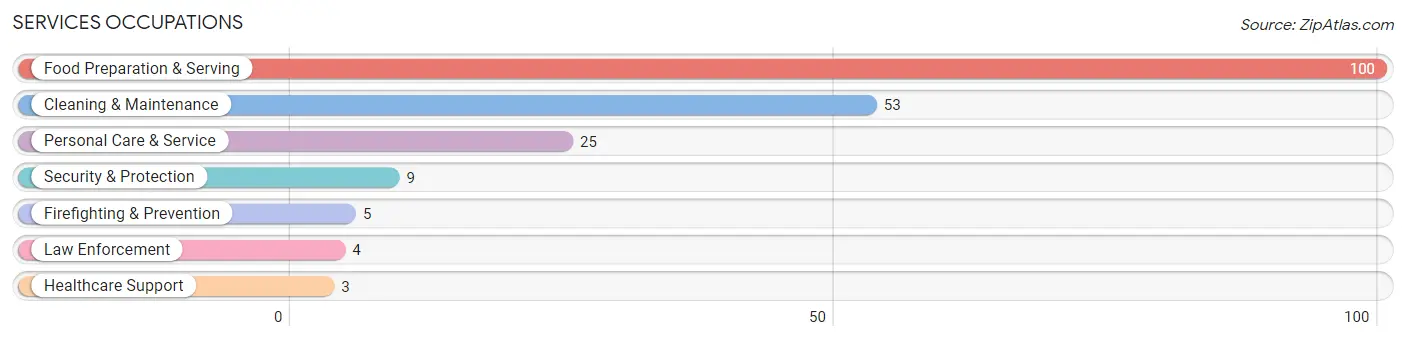
The most common Services occupations in Darien are Food Preparation & Serving (100 | 16.0%), Cleaning & Maintenance (53 | 8.5%), Personal Care & Service (25 | 4.0%), Security & Protection (9 | 1.4%), and Firefighting & Prevention (5 | 0.8%).
Services Occupations by Sex
Within the Services occupations in Darien, the most male-oriented occupations are Security & Protection (100.0%), Firefighting & Prevention (100.0%), and Law Enforcement (100.0%), while the most female-oriented occupations are Healthcare Support (100.0%), Personal Care & Service (100.0%), and Food Preparation & Serving (31.0%).
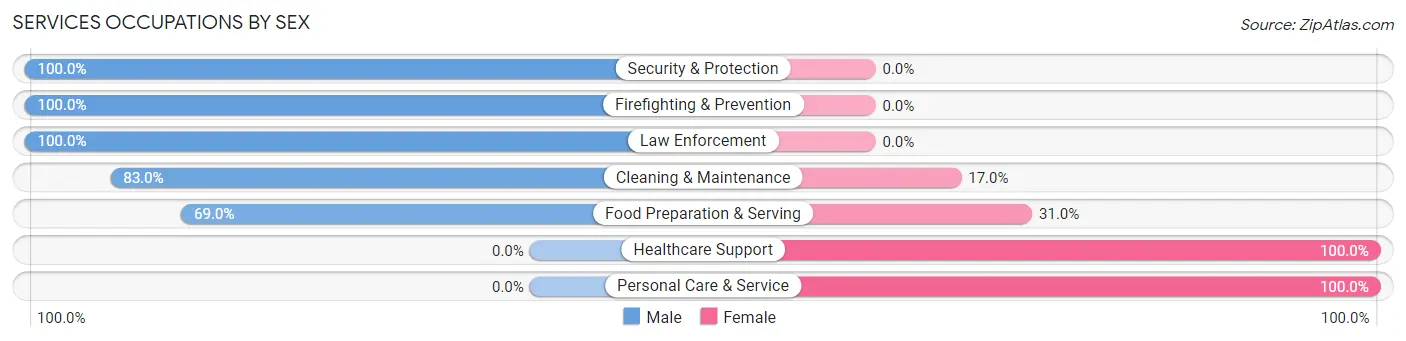
| Occupation | Male | Female |
| Healthcare Support | 0 (0.0%) | 3 (100.0%) |
| Security & Protection | 9 (100.0%) | 0 (0.0%) |
| Firefighting & Prevention | 5 (100.0%) | 0 (0.0%) |
| Law Enforcement | 4 (100.0%) | 0 (0.0%) |
| Food Preparation & Serving | 69 (69.0%) | 31 (31.0%) |
| Cleaning & Maintenance | 44 (83.0%) | 9 (17.0%) |
| Personal Care & Service | 0 (0.0%) | 25 (100.0%) |
| Total (Category) | 122 (64.2%) | 68 (35.8%) |
| Total (Overall) | 305 (48.9%) | 319 (51.1%) |
Sales and Office Occupations
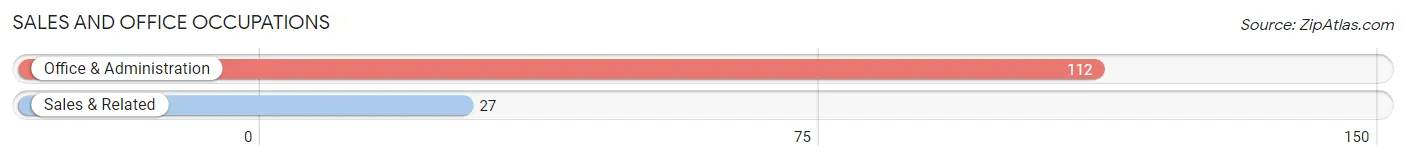
The most common Sales and Office occupations in Darien are Office & Administration (112 | 17.9%), and Sales & Related (27 | 4.3%).
Sales and Office Occupations by Sex
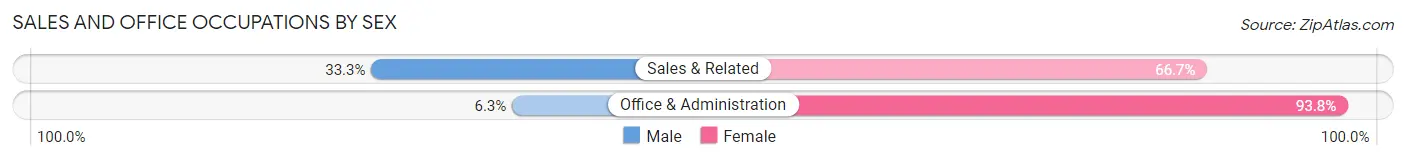
| Occupation | Male | Female |
| Sales & Related | 9 (33.3%) | 18 (66.7%) |
| Office & Administration | 7 (6.2%) | 105 (93.8%) |
| Total (Category) | 16 (11.5%) | 123 (88.5%) |
| Total (Overall) | 305 (48.9%) | 319 (51.1%) |
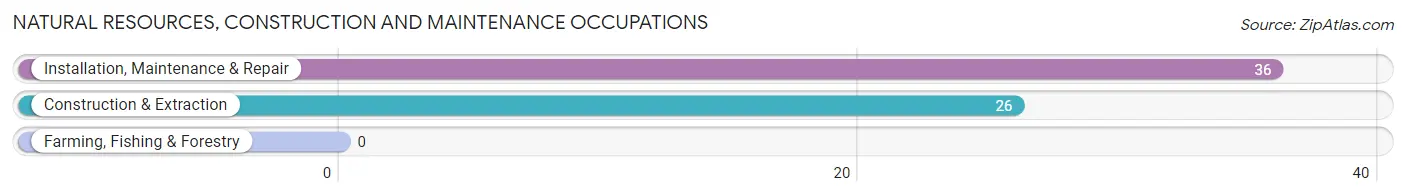
Natural Resources, Construction and Maintenance Occupations
The most common Natural Resources, Construction and Maintenance occupations in Darien are Installation, Maintenance & Repair (36 | 5.8%), and Construction & Extraction (26 | 4.2%).
Natural Resources, Construction and Maintenance Occupations by Sex
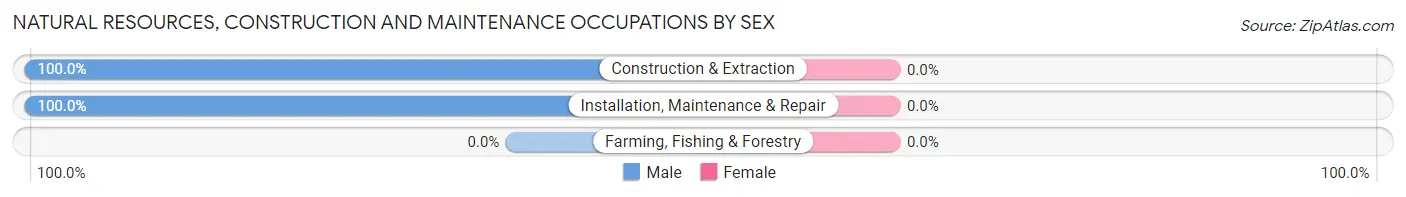
| Occupation | Male | Female |
| Farming, Fishing & Forestry | 0 (0.0%) | 0 (0.0%) |
| Construction & Extraction | 26 (100.0%) | 0 (0.0%) |
| Installation, Maintenance & Repair | 36 (100.0%) | 0 (0.0%) |
| Total (Category) | 62 (100.0%) | 0 (0.0%) |
| Total (Overall) | 305 (48.9%) | 319 (51.1%) |
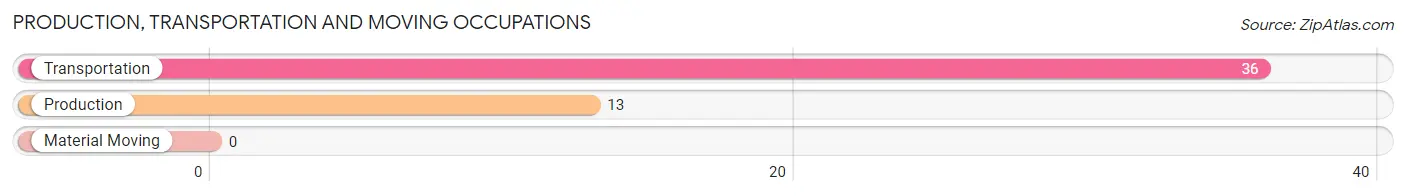
Production, Transportation and Moving Occupations
The most common Production, Transportation and Moving occupations in Darien are Transportation (36 | 5.8%), and Production (13 | 2.1%).
Production, Transportation and Moving Occupations by Sex
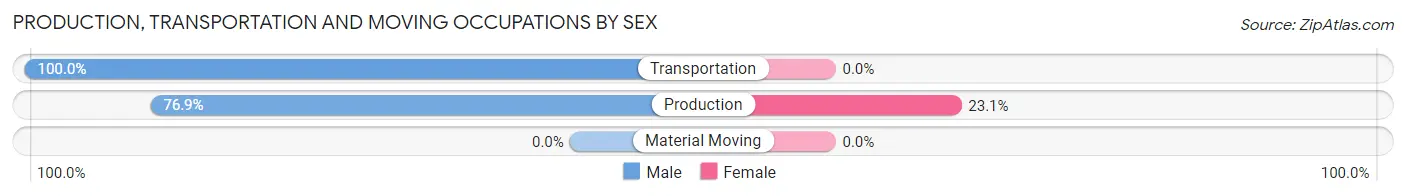
| Occupation | Male | Female |
| Production | 10 (76.9%) | 3 (23.1%) |
| Transportation | 36 (100.0%) | 0 (0.0%) |
| Material Moving | 0 (0.0%) | 0 (0.0%) |
| Total (Category) | 46 (93.9%) | 3 (6.1%) |
| Total (Overall) | 305 (48.9%) | 319 (51.1%) |
Employment Industries by Sex in Darien
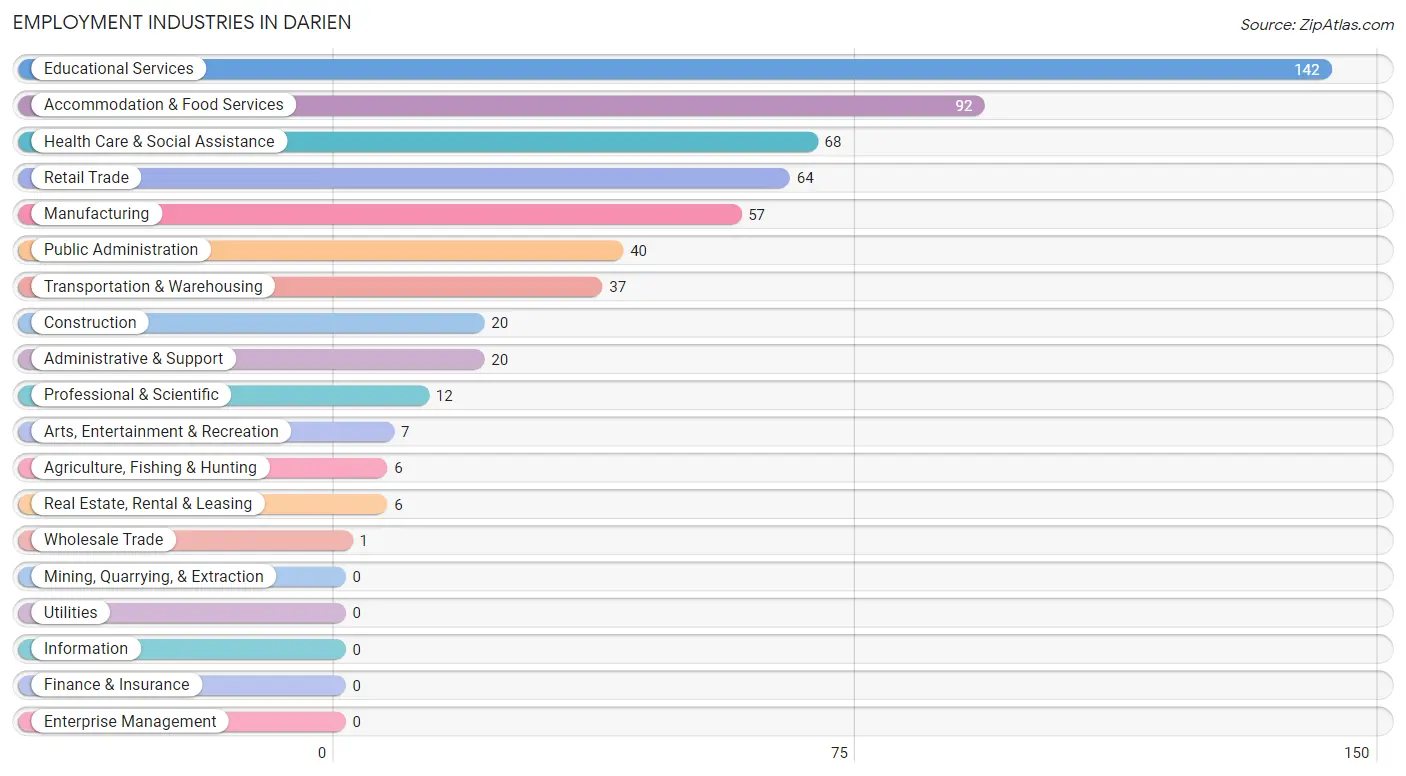
Employment Industries in Darien
The major employment industries in Darien include Educational Services (142 | 22.8%), Accommodation & Food Services (92 | 14.7%), Health Care & Social Assistance (68 | 10.9%), Retail Trade (64 | 10.3%), and Manufacturing (57 | 9.1%).
Employment Industries by Sex in Darien
The Darien industries that see more men than women are Agriculture, Fishing & Hunting (100.0%), Construction (100.0%), and Transportation & Warehousing (100.0%), whereas the industries that tend to have a higher number of women are Wholesale Trade (100.0%), Real Estate, Rental & Leasing (100.0%), and Professional & Scientific (100.0%).
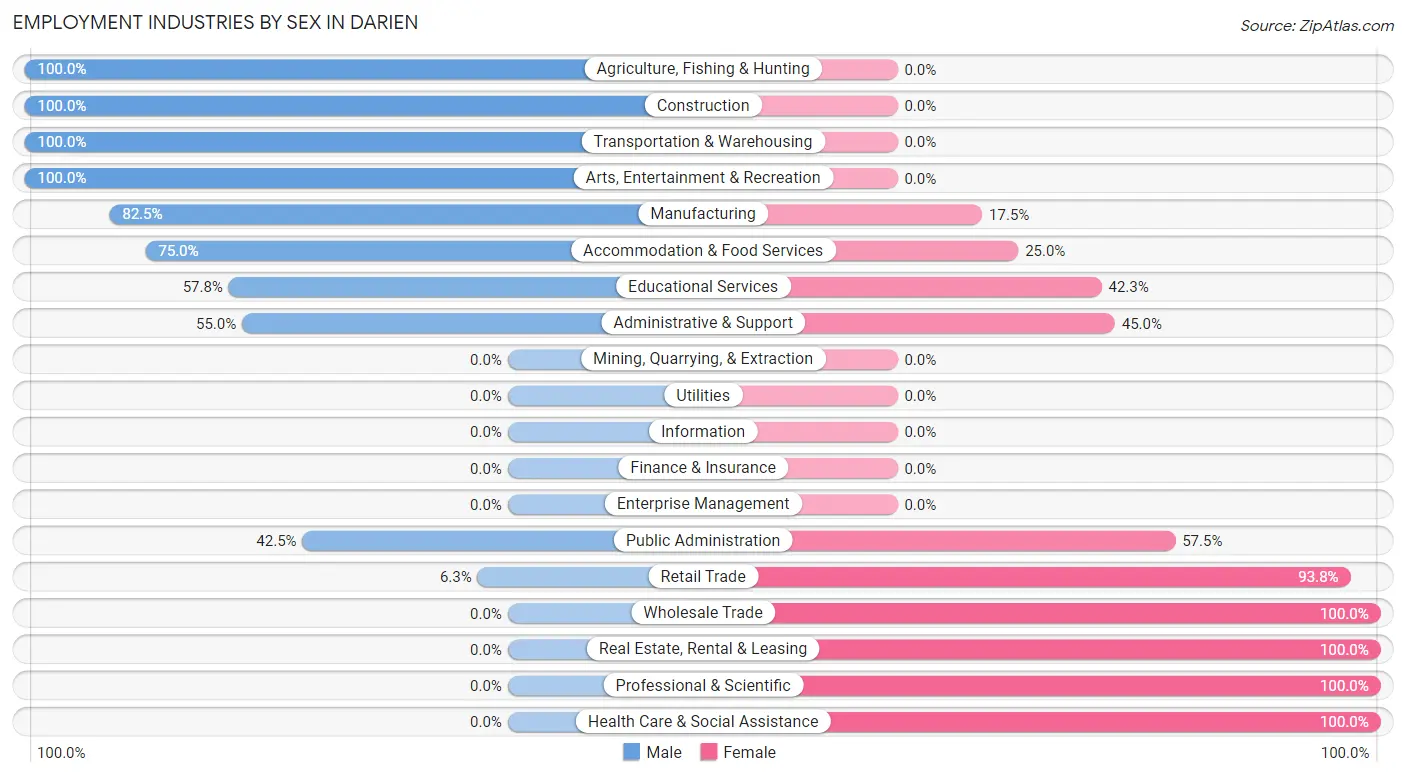
| Industry | Male | Female |
| Agriculture, Fishing & Hunting | 6 (100.0%) | 0 (0.0%) |
| Mining, Quarrying, & Extraction | 0 (0.0%) | 0 (0.0%) |
| Construction | 20 (100.0%) | 0 (0.0%) |
| Manufacturing | 47 (82.5%) | 10 (17.5%) |
| Wholesale Trade | 0 (0.0%) | 1 (100.0%) |
| Retail Trade | 4 (6.2%) | 60 (93.8%) |
| Transportation & Warehousing | 37 (100.0%) | 0 (0.0%) |
| Utilities | 0 (0.0%) | 0 (0.0%) |
| Information | 0 (0.0%) | 0 (0.0%) |
| Finance & Insurance | 0 (0.0%) | 0 (0.0%) |
| Real Estate, Rental & Leasing | 0 (0.0%) | 6 (100.0%) |
| Professional & Scientific | 0 (0.0%) | 12 (100.0%) |
| Enterprise Management | 0 (0.0%) | 0 (0.0%) |
| Administrative & Support | 11 (55.0%) | 9 (45.0%) |
| Educational Services | 82 (57.8%) | 60 (42.2%) |
| Health Care & Social Assistance | 0 (0.0%) | 68 (100.0%) |
| Arts, Entertainment & Recreation | 7 (100.0%) | 0 (0.0%) |
| Accommodation & Food Services | 69 (75.0%) | 23 (25.0%) |
| Public Administration | 17 (42.5%) | 23 (57.5%) |
| Total | 305 (48.9%) | 319 (51.1%) |
Education in Darien
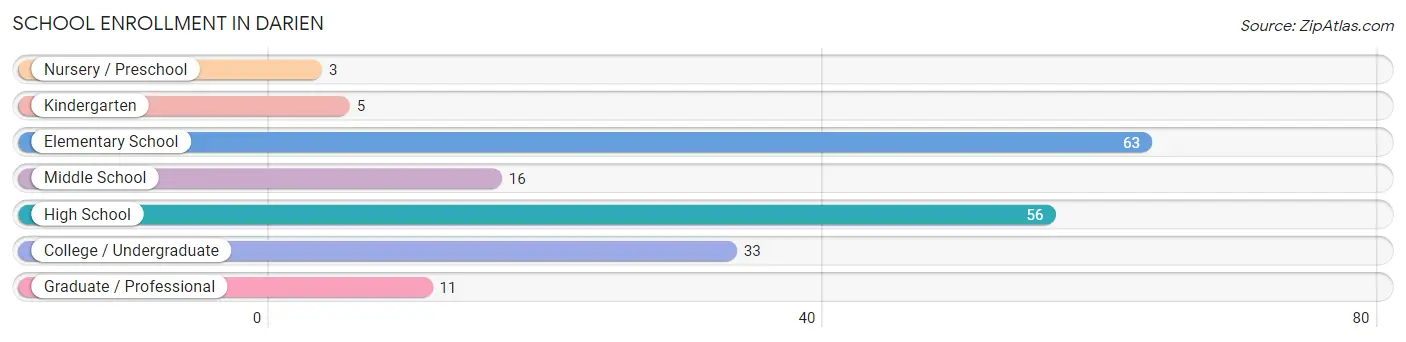
School Enrollment in Darien
The most common levels of schooling among the 187 students in Darien are elementary school (63 | 33.7%), high school (56 | 29.9%), and college / undergraduate (33 | 17.6%).
| School Level | # Students | % Students |
| Nursery / Preschool | 3 | 1.6% |
| Kindergarten | 5 | 2.7% |
| Elementary School | 63 | 33.7% |
| Middle School | 16 | 8.6% |
| High School | 56 | 29.9% |
| College / Undergraduate | 33 | 17.6% |
| Graduate / Professional | 11 | 5.9% |
| Total | 187 | 100.0% |
School Enrollment by Age by Funding Source in Darien
Out of a total of 187 students who are enrolled in schools in Darien, 4 (2.1%) attend a private institution, while the remaining 183 (97.9%) are enrolled in public schools. The age group of 3 to 4 year olds has the highest likelihood of being enrolled in private schools, with 3 (100.0% in the age bracket) enrolled. Conversely, the age group of 5 to 9 year old has the lowest likelihood of being enrolled in a private school, with 56 (100.0% in the age bracket) attending a public institution.
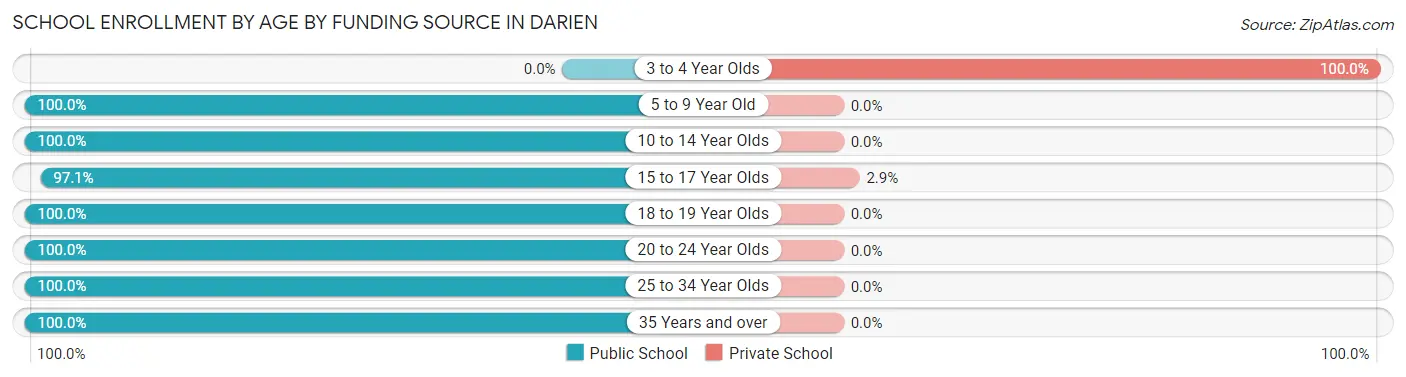
| Age Bracket | Public School | Private School |
| 3 to 4 Year Olds | 0 (0.0%) | 3 (100.0%) |
| 5 to 9 Year Old | 56 (100.0%) | 0 (0.0%) |
| 10 to 14 Year Olds | 28 (100.0%) | 0 (0.0%) |
| 15 to 17 Year Olds | 33 (97.1%) | 1 (2.9%) |
| 18 to 19 Year Olds | 48 (100.0%) | 0 (0.0%) |
| 20 to 24 Year Olds | 7 (100.0%) | 0 (0.0%) |
| 25 to 34 Year Olds | 9 (100.0%) | 0 (0.0%) |
| 35 Years and over | 2 (100.0%) | 0 (0.0%) |
| Total | 183 (97.9%) | 4 (2.1%) |
Educational Attainment by Field of Study in Darien
Science & technology (72 | 28.3%), business (55 | 21.6%), education (42 | 16.5%), arts & humanities (31 | 12.2%), and psychology (12 | 4.7%) are the most common fields of study among 254 individuals in Darien who have obtained a bachelor's degree or higher.
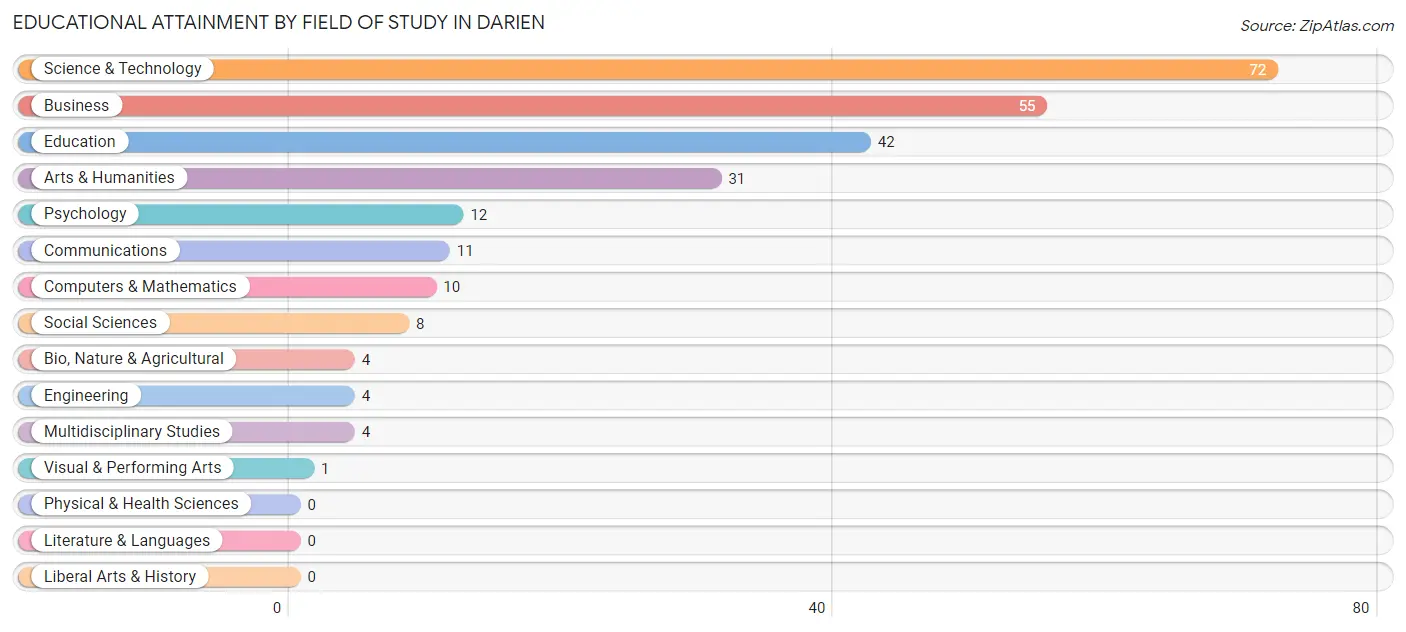
| Field of Study | # Graduates | % Graduates |
| Computers & Mathematics | 10 | 3.9% |
| Bio, Nature & Agricultural | 4 | 1.6% |
| Physical & Health Sciences | 0 | 0.0% |
| Psychology | 12 | 4.7% |
| Social Sciences | 8 | 3.2% |
| Engineering | 4 | 1.6% |
| Multidisciplinary Studies | 4 | 1.6% |
| Science & Technology | 72 | 28.3% |
| Business | 55 | 21.6% |
| Education | 42 | 16.5% |
| Literature & Languages | 0 | 0.0% |
| Liberal Arts & History | 0 | 0.0% |
| Visual & Performing Arts | 1 | 0.4% |
| Communications | 11 | 4.3% |
| Arts & Humanities | 31 | 12.2% |
| Total | 254 | 100.0% |
Transportation & Commute in Darien
Vehicle Availability by Sex in Darien
The most prevalent vehicle ownership categories in Darien are males with 2 vehicles (172, accounting for 56.4%) and females with 2 vehicles (123, making up 58.3%).
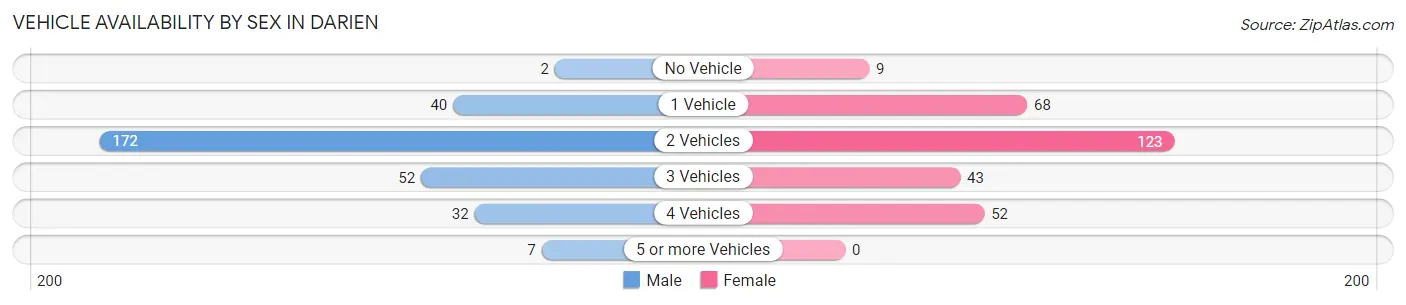
| Vehicles Available | Male | Female |
| No Vehicle | 2 (0.7%) | 9 (3.0%) |
| 1 Vehicle | 40 (13.1%) | 68 (23.1%) |
| 2 Vehicles | 172 (56.4%) | 123 (41.7%) |
| 3 Vehicles | 52 (17.1%) | 43 (14.6%) |
| 4 Vehicles | 32 (10.5%) | 52 (17.6%) |
| 5 or more Vehicles | 7 (2.3%) | 0 (0.0%) |
| Total | 305 (100.0%) | 295 (100.0%) |
Commute Time in Darien
The most frequently occuring commute durations in Darien are 15 to 19 minutes (154 commuters, 27.8%), 20 to 24 minutes (67 commuters, 12.1%), and 5 to 9 minutes (66 commuters, 11.9%).
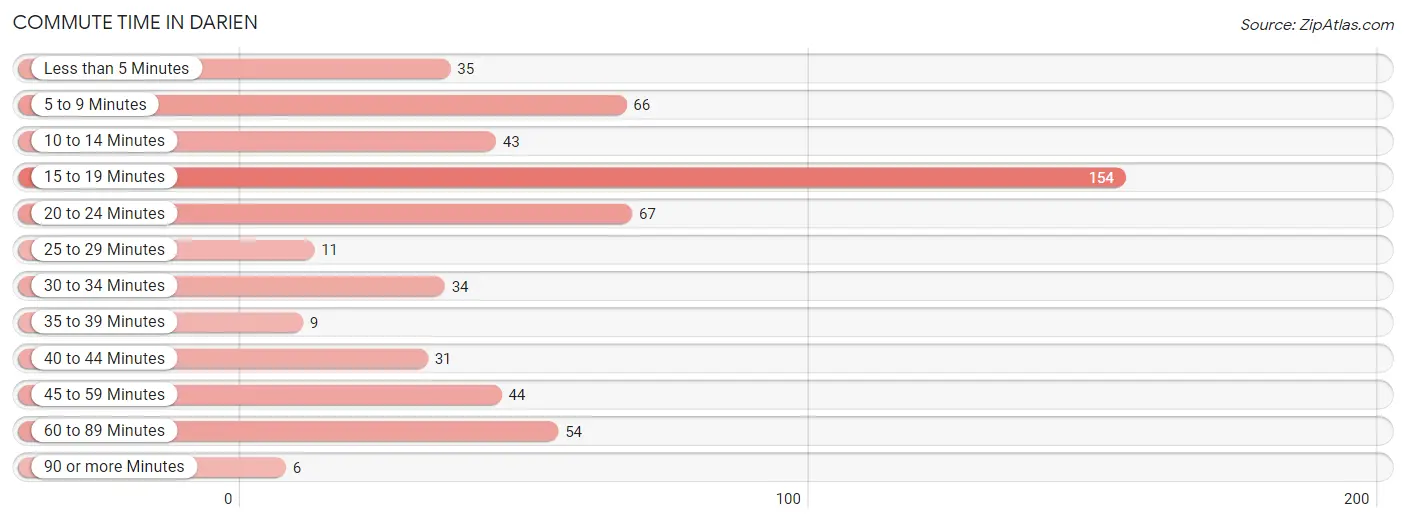
| Commute Time | # Commuters | % Commuters |
| Less than 5 Minutes | 35 | 6.3% |
| 5 to 9 Minutes | 66 | 11.9% |
| 10 to 14 Minutes | 43 | 7.8% |
| 15 to 19 Minutes | 154 | 27.8% |
| 20 to 24 Minutes | 67 | 12.1% |
| 25 to 29 Minutes | 11 | 2.0% |
| 30 to 34 Minutes | 34 | 6.1% |
| 35 to 39 Minutes | 9 | 1.6% |
| 40 to 44 Minutes | 31 | 5.6% |
| 45 to 59 Minutes | 44 | 7.9% |
| 60 to 89 Minutes | 54 | 9.8% |
| 90 or more Minutes | 6 | 1.1% |
Commute Time by Sex in Darien
The most common commute times in Darien are 15 to 19 minutes (101 commuters, 34.8%) for males and 15 to 19 minutes (53 commuters, 20.1%) for females.
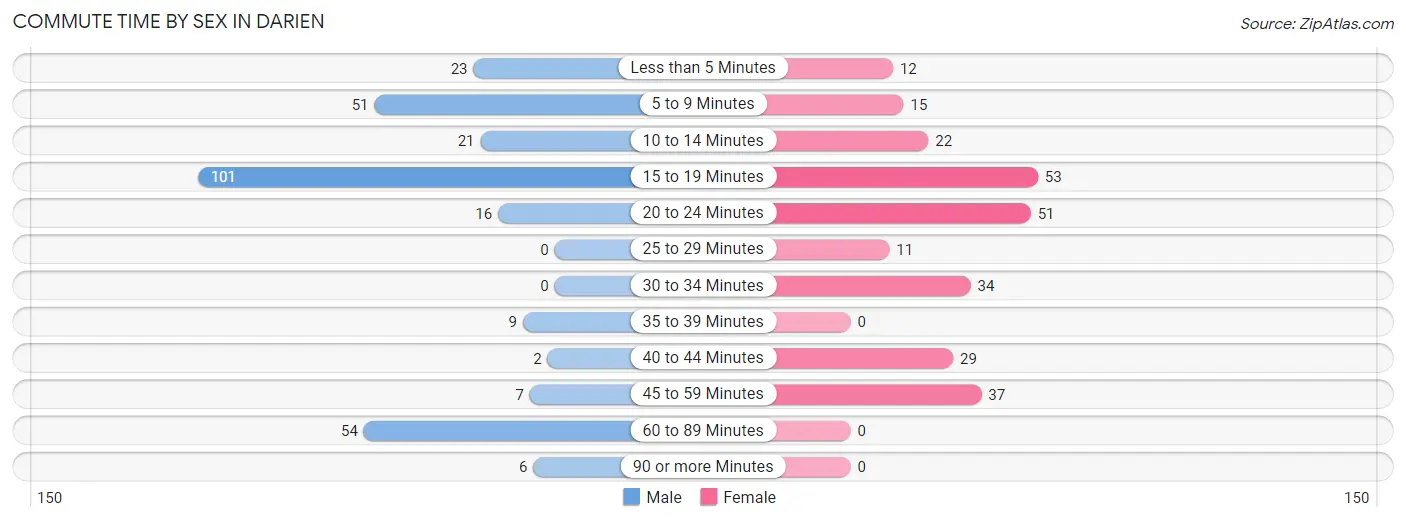
| Commute Time | Male | Female |
| Less than 5 Minutes | 23 (7.9%) | 12 (4.5%) |
| 5 to 9 Minutes | 51 (17.6%) | 15 (5.7%) |
| 10 to 14 Minutes | 21 (7.2%) | 22 (8.3%) |
| 15 to 19 Minutes | 101 (34.8%) | 53 (20.1%) |
| 20 to 24 Minutes | 16 (5.5%) | 51 (19.3%) |
| 25 to 29 Minutes | 0 (0.0%) | 11 (4.2%) |
| 30 to 34 Minutes | 0 (0.0%) | 34 (12.9%) |
| 35 to 39 Minutes | 9 (3.1%) | 0 (0.0%) |
| 40 to 44 Minutes | 2 (0.7%) | 29 (11.0%) |
| 45 to 59 Minutes | 7 (2.4%) | 37 (14.0%) |
| 60 to 89 Minutes | 54 (18.6%) | 0 (0.0%) |
| 90 or more Minutes | 6 (2.1%) | 0 (0.0%) |
Time of Departure to Work by Sex in Darien
The most frequent times of departure to work in Darien are 9:00 AM to 9:59 AM (65, 22.4%) for males and 7:00 AM to 7:29 AM (84, 31.8%) for females.
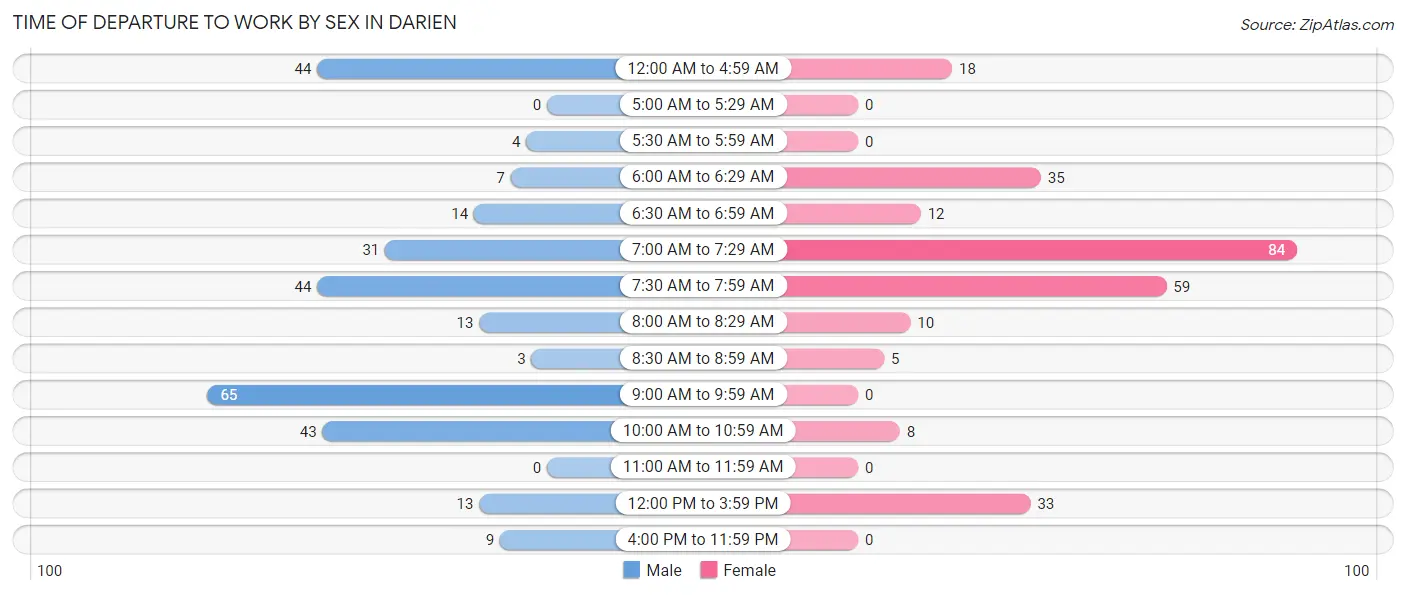
| Time of Departure | Male | Female |
| 12:00 AM to 4:59 AM | 44 (15.2%) | 18 (6.8%) |
| 5:00 AM to 5:29 AM | 0 (0.0%) | 0 (0.0%) |
| 5:30 AM to 5:59 AM | 4 (1.4%) | 0 (0.0%) |
| 6:00 AM to 6:29 AM | 7 (2.4%) | 35 (13.3%) |
| 6:30 AM to 6:59 AM | 14 (4.8%) | 12 (4.5%) |
| 7:00 AM to 7:29 AM | 31 (10.7%) | 84 (31.8%) |
| 7:30 AM to 7:59 AM | 44 (15.2%) | 59 (22.4%) |
| 8:00 AM to 8:29 AM | 13 (4.5%) | 10 (3.8%) |
| 8:30 AM to 8:59 AM | 3 (1.0%) | 5 (1.9%) |
| 9:00 AM to 9:59 AM | 65 (22.4%) | 0 (0.0%) |
| 10:00 AM to 10:59 AM | 43 (14.8%) | 8 (3.0%) |
| 11:00 AM to 11:59 AM | 0 (0.0%) | 0 (0.0%) |
| 12:00 PM to 3:59 PM | 13 (4.5%) | 33 (12.5%) |
| 4:00 PM to 11:59 PM | 9 (3.1%) | 0 (0.0%) |
| Total | 290 (100.0%) | 264 (100.0%) |
Housing Occupancy in Darien
Occupancy by Ownership in Darien
Of the total 549 dwellings in Darien, owner-occupied units account for 379 (69.0%), while renter-occupied units make up 170 (31.0%).
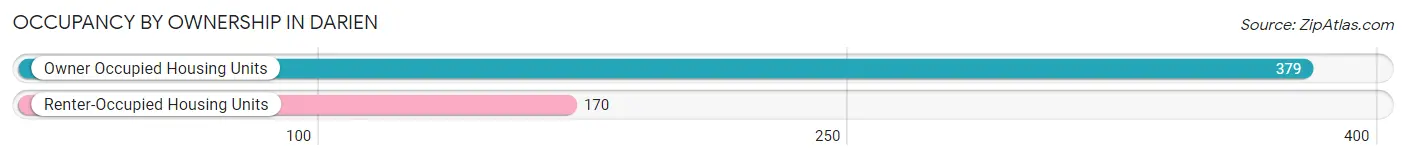
| Occupancy | # Housing Units | % Housing Units |
| Owner Occupied Housing Units | 379 | 69.0% |
| Renter-Occupied Housing Units | 170 | 31.0% |
| Total Occupied Housing Units | 549 | 100.0% |
Occupancy by Household Size in Darien
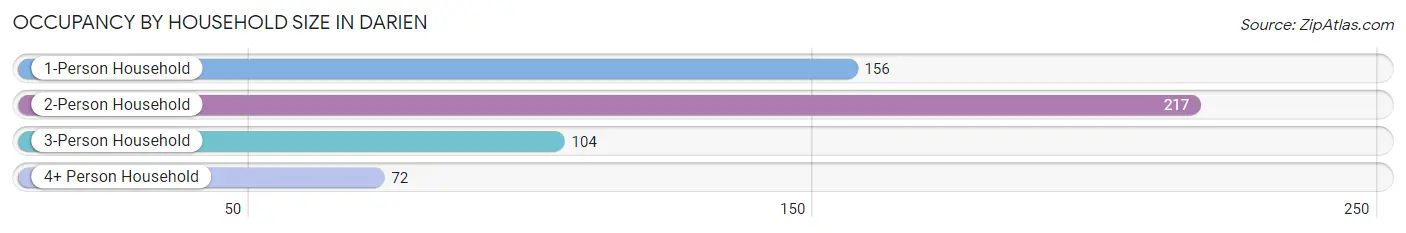
| Household Size | # Housing Units | % Housing Units |
| 1-Person Household | 156 | 28.4% |
| 2-Person Household | 217 | 39.5% |
| 3-Person Household | 104 | 18.9% |
| 4+ Person Household | 72 | 13.1% |
| Total Housing Units | 549 | 100.0% |
Occupancy by Ownership by Household Size in Darien
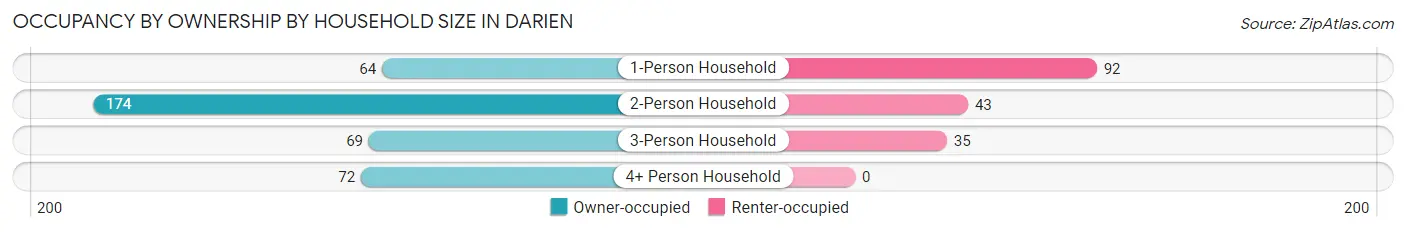
| Household Size | Owner-occupied | Renter-occupied |
| 1-Person Household | 64 (41.0%) | 92 (59.0%) |
| 2-Person Household | 174 (80.2%) | 43 (19.8%) |
| 3-Person Household | 69 (66.3%) | 35 (33.7%) |
| 4+ Person Household | 72 (100.0%) | 0 (0.0%) |
| Total Housing Units | 379 (69.0%) | 170 (31.0%) |
Occupancy by Educational Attainment in Darien
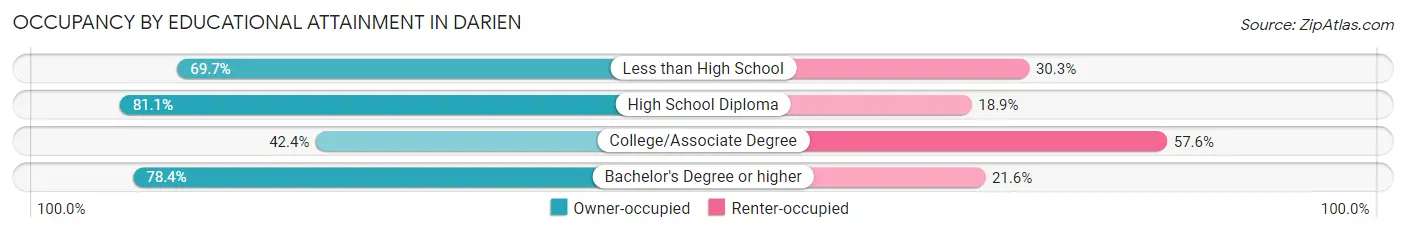
| Household Size | Owner-occupied | Renter-occupied |
| Less than High School | 23 (69.7%) | 10 (30.3%) |
| High School Diploma | 172 (81.1%) | 40 (18.9%) |
| College/Associate Degree | 64 (42.4%) | 87 (57.6%) |
| Bachelor's Degree or higher | 120 (78.4%) | 33 (21.6%) |
Occupancy by Age of Householder in Darien
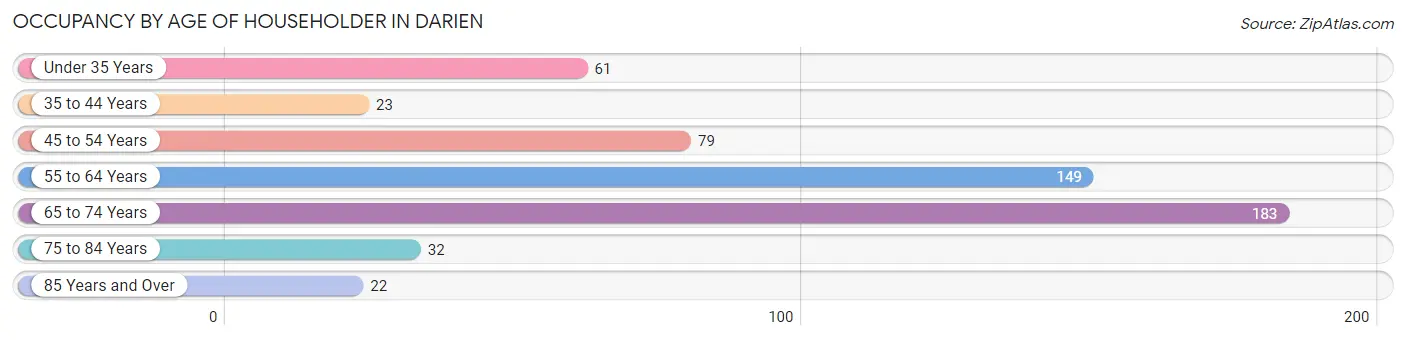
| Age Bracket | # Households | % Households |
| Under 35 Years | 61 | 11.1% |
| 35 to 44 Years | 23 | 4.2% |
| 45 to 54 Years | 79 | 14.4% |
| 55 to 64 Years | 149 | 27.1% |
| 65 to 74 Years | 183 | 33.3% |
| 75 to 84 Years | 32 | 5.8% |
| 85 Years and Over | 22 | 4.0% |
| Total | 549 | 100.0% |
Housing Finances in Darien
Median Income by Occupancy in Darien
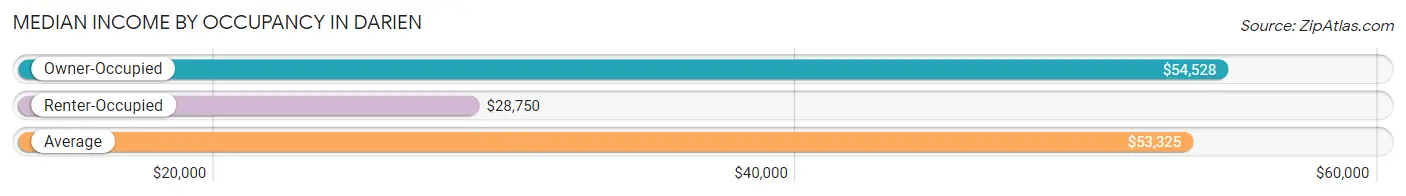
| Occupancy Type | # Households | Median Income |
| Owner-Occupied | 379 (69.0%) | $54,528 |
| Renter-Occupied | 170 (31.0%) | $28,750 |
| Average | 549 (100.0%) | $53,325 |
Occupancy by Householder Income Bracket in Darien
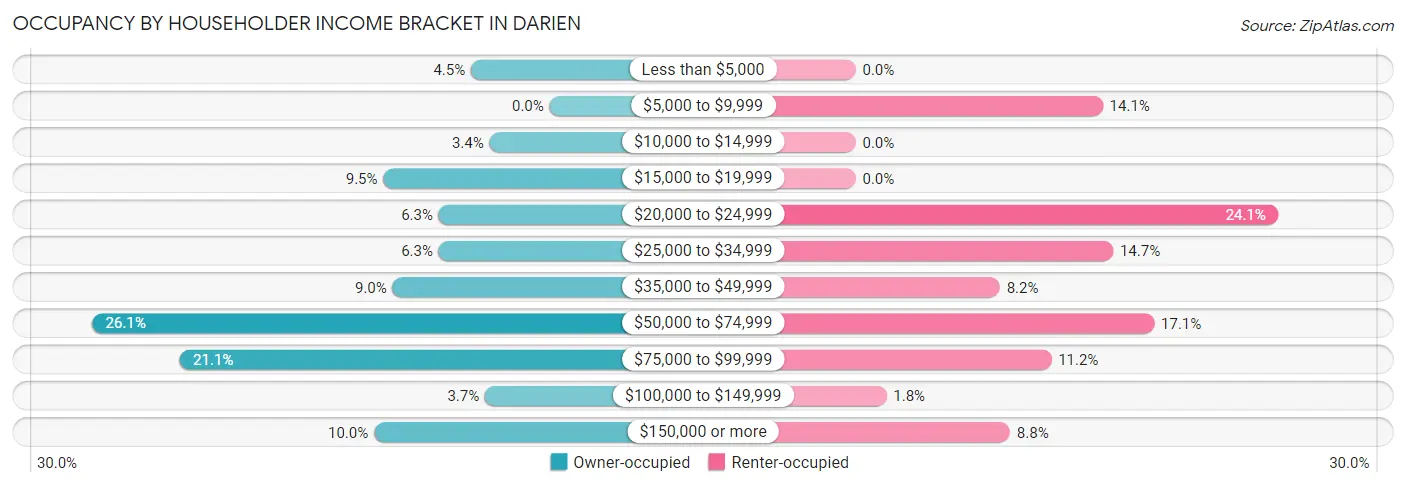
| Income Bracket | Owner-occupied | Renter-occupied |
| Less than $5,000 | 17 (4.5%) | 0 (0.0%) |
| $5,000 to $9,999 | 0 (0.0%) | 24 (14.1%) |
| $10,000 to $14,999 | 13 (3.4%) | 0 (0.0%) |
| $15,000 to $19,999 | 36 (9.5%) | 0 (0.0%) |
| $20,000 to $24,999 | 24 (6.3%) | 41 (24.1%) |
| $25,000 to $34,999 | 24 (6.3%) | 25 (14.7%) |
| $35,000 to $49,999 | 34 (9.0%) | 14 (8.2%) |
| $50,000 to $74,999 | 99 (26.1%) | 29 (17.1%) |
| $75,000 to $99,999 | 80 (21.1%) | 19 (11.2%) |
| $100,000 to $149,999 | 14 (3.7%) | 3 (1.8%) |
| $150,000 or more | 38 (10.0%) | 15 (8.8%) |
| Total | 379 (100.0%) | 170 (100.0%) |
Monthly Housing Cost Tiers in Darien
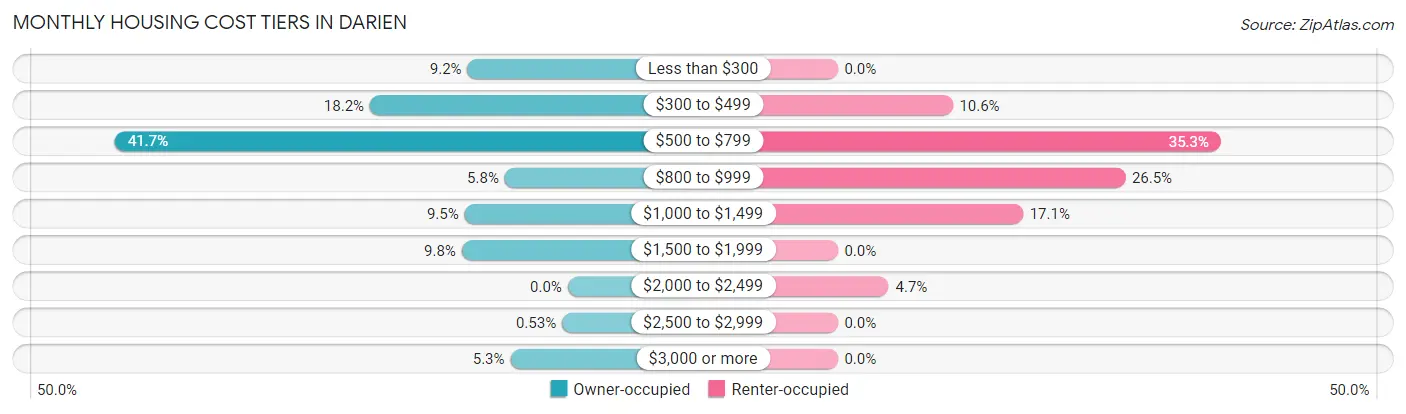
| Monthly Cost | Owner-occupied | Renter-occupied |
| Less than $300 | 35 (9.2%) | 0 (0.0%) |
| $300 to $499 | 69 (18.2%) | 18 (10.6%) |
| $500 to $799 | 158 (41.7%) | 60 (35.3%) |
| $800 to $999 | 22 (5.8%) | 45 (26.5%) |
| $1,000 to $1,499 | 36 (9.5%) | 29 (17.1%) |
| $1,500 to $1,999 | 37 (9.8%) | 0 (0.0%) |
| $2,000 to $2,499 | 0 (0.0%) | 8 (4.7%) |
| $2,500 to $2,999 | 2 (0.5%) | 0 (0.0%) |
| $3,000 or more | 20 (5.3%) | 0 (0.0%) |
| Total | 379 (100.0%) | 170 (100.0%) |
Physical Housing Characteristics in Darien
Housing Structures in Darien
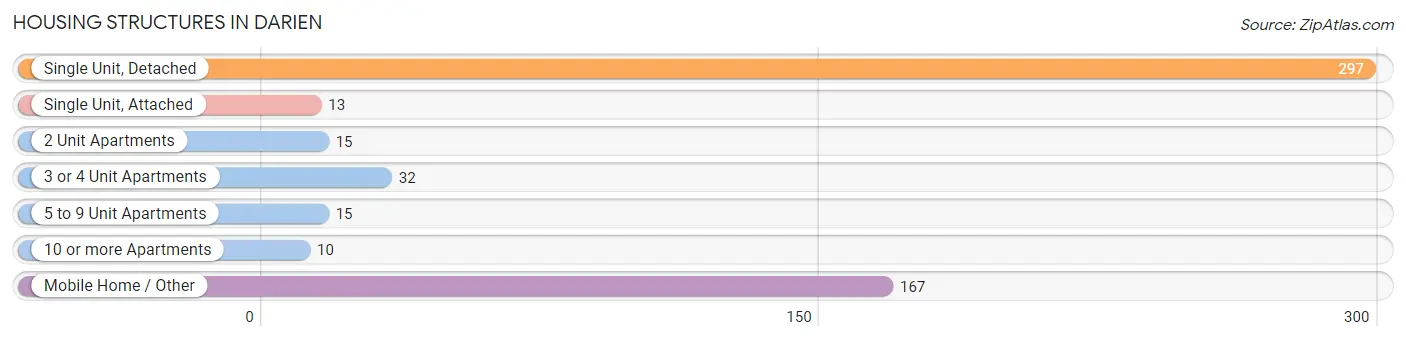
| Structure Type | # Housing Units | % Housing Units |
| Single Unit, Detached | 297 | 54.1% |
| Single Unit, Attached | 13 | 2.4% |
| 2 Unit Apartments | 15 | 2.7% |
| 3 or 4 Unit Apartments | 32 | 5.8% |
| 5 to 9 Unit Apartments | 15 | 2.7% |
| 10 or more Apartments | 10 | 1.8% |
| Mobile Home / Other | 167 | 30.4% |
| Total | 549 | 100.0% |
Housing Structures by Occupancy in Darien
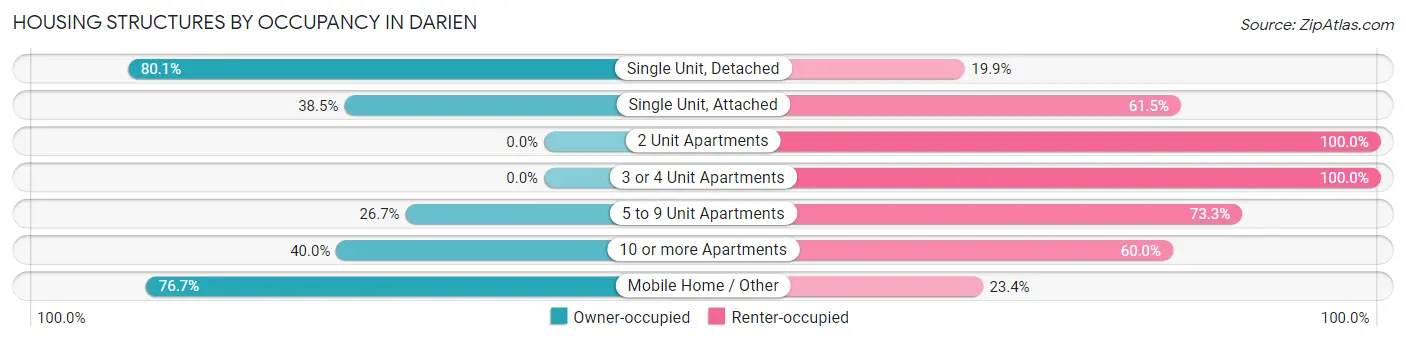
| Structure Type | Owner-occupied | Renter-occupied |
| Single Unit, Detached | 238 (80.1%) | 59 (19.9%) |
| Single Unit, Attached | 5 (38.5%) | 8 (61.5%) |
| 2 Unit Apartments | 0 (0.0%) | 15 (100.0%) |
| 3 or 4 Unit Apartments | 0 (0.0%) | 32 (100.0%) |
| 5 to 9 Unit Apartments | 4 (26.7%) | 11 (73.3%) |
| 10 or more Apartments | 4 (40.0%) | 6 (60.0%) |
| Mobile Home / Other | 128 (76.6%) | 39 (23.4%) |
| Total | 379 (69.0%) | 170 (31.0%) |
Housing Structures by Number of Rooms in Darien
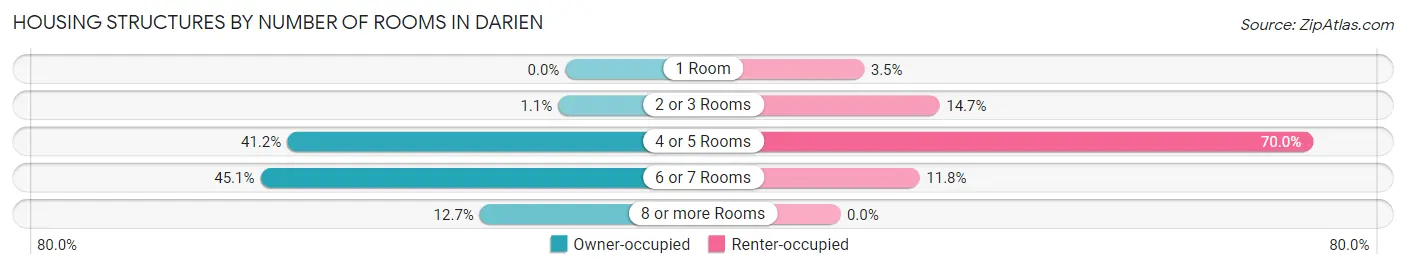
| Number of Rooms | Owner-occupied | Renter-occupied |
| 1 Room | 0 (0.0%) | 6 (3.5%) |
| 2 or 3 Rooms | 4 (1.1%) | 25 (14.7%) |
| 4 or 5 Rooms | 156 (41.2%) | 119 (70.0%) |
| 6 or 7 Rooms | 171 (45.1%) | 20 (11.8%) |
| 8 or more Rooms | 48 (12.7%) | 0 (0.0%) |
| Total | 379 (100.0%) | 170 (100.0%) |
Housing Structure by Heating Type in Darien
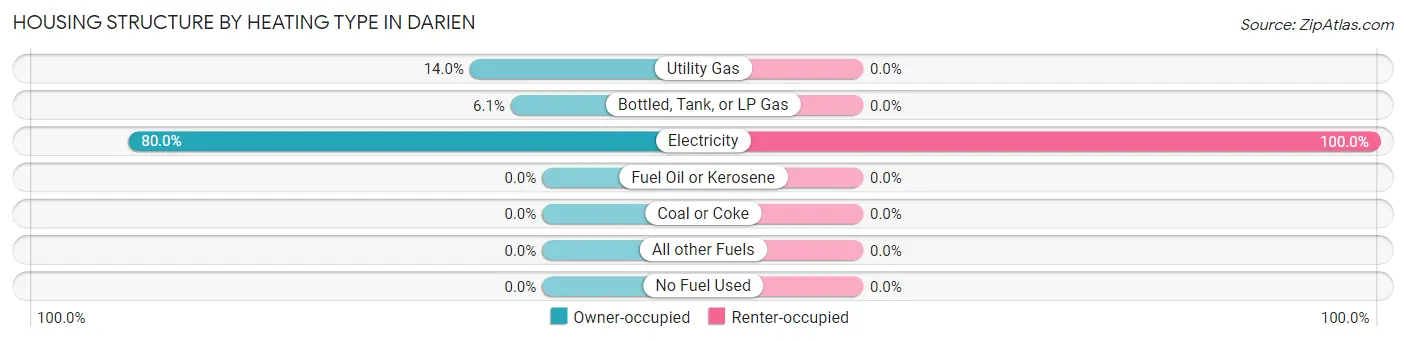
| Heating Type | Owner-occupied | Renter-occupied |
| Utility Gas | 53 (14.0%) | 0 (0.0%) |
| Bottled, Tank, or LP Gas | 23 (6.1%) | 0 (0.0%) |
| Electricity | 303 (79.9%) | 170 (100.0%) |
| Fuel Oil or Kerosene | 0 (0.0%) | 0 (0.0%) |
| Coal or Coke | 0 (0.0%) | 0 (0.0%) |
| All other Fuels | 0 (0.0%) | 0 (0.0%) |
| No Fuel Used | 0 (0.0%) | 0 (0.0%) |
| Total | 379 (100.0%) | 170 (100.0%) |
Household Vehicle Usage in Darien
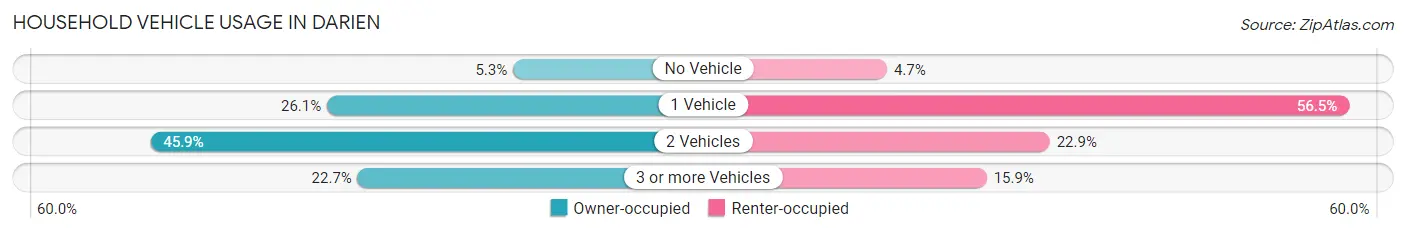
| Vehicles per Household | Owner-occupied | Renter-occupied |
| No Vehicle | 20 (5.3%) | 8 (4.7%) |
| 1 Vehicle | 99 (26.1%) | 96 (56.5%) |
| 2 Vehicles | 174 (45.9%) | 39 (22.9%) |
| 3 or more Vehicles | 86 (22.7%) | 27 (15.9%) |
| Total | 379 (100.0%) | 170 (100.0%) |
Real Estate & Mortgages in Darien
Real Estate and Mortgage Overview in Darien
| Characteristic | Without Mortgage | With Mortgage |
| Housing Units | 242 | 137 |
| Median Property Value | $126,200 | $230,800 |
| Median Household Income | $54,000 | $27 |
| Monthly Housing Costs | $563 | $20 |
| Real Estate Taxes | $922 | $0 |
Property Value by Mortgage Status in Darien
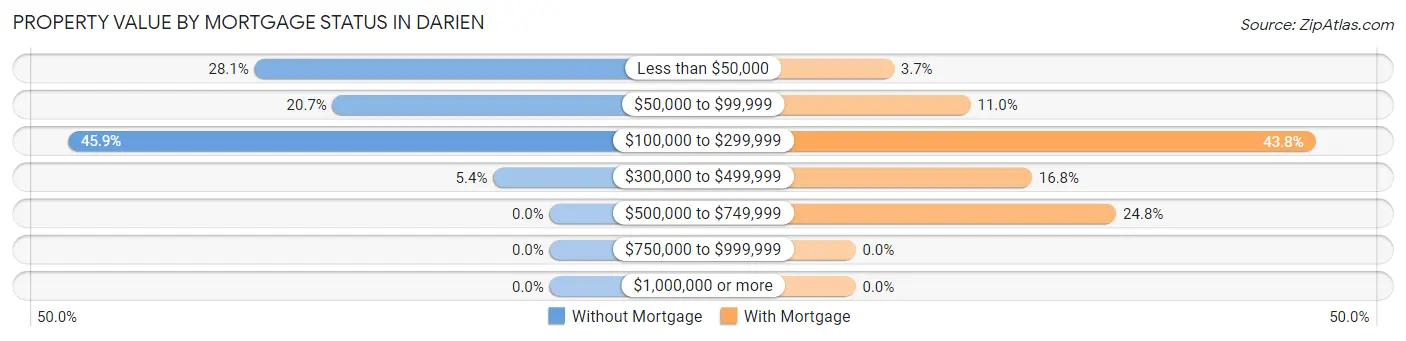
| Property Value | Without Mortgage | With Mortgage |
| Less than $50,000 | 68 (28.1%) | 5 (3.6%) |
| $50,000 to $99,999 | 50 (20.7%) | 15 (11.0%) |
| $100,000 to $299,999 | 111 (45.9%) | 60 (43.8%) |
| $300,000 to $499,999 | 13 (5.4%) | 23 (16.8%) |
| $500,000 to $749,999 | 0 (0.0%) | 34 (24.8%) |
| $750,000 to $999,999 | 0 (0.0%) | 0 (0.0%) |
| $1,000,000 or more | 0 (0.0%) | 0 (0.0%) |
| Total | 242 (100.0%) | 137 (100.0%) |
Household Income by Mortgage Status in Darien
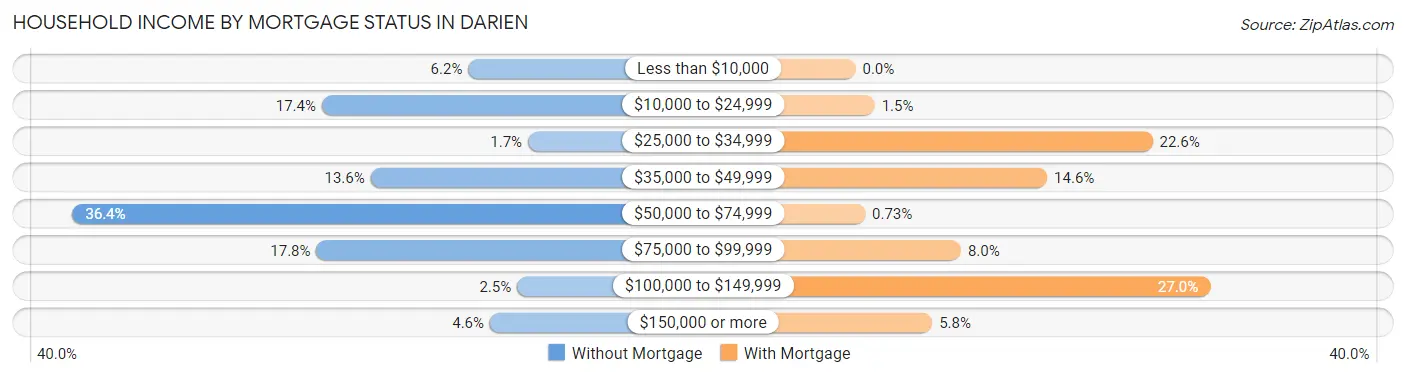
| Household Income | Without Mortgage | With Mortgage |
| Less than $10,000 | 15 (6.2%) | 0 (0.0%) |
| $10,000 to $24,999 | 42 (17.4%) | 2 (1.5%) |
| $25,000 to $34,999 | 4 (1.7%) | 31 (22.6%) |
| $35,000 to $49,999 | 33 (13.6%) | 20 (14.6%) |
| $50,000 to $74,999 | 88 (36.4%) | 1 (0.7%) |
| $75,000 to $99,999 | 43 (17.8%) | 11 (8.0%) |
| $100,000 to $149,999 | 6 (2.5%) | 37 (27.0%) |
| $150,000 or more | 11 (4.5%) | 8 (5.8%) |
| Total | 242 (100.0%) | 137 (100.0%) |
Property Value to Household Income Ratio in Darien
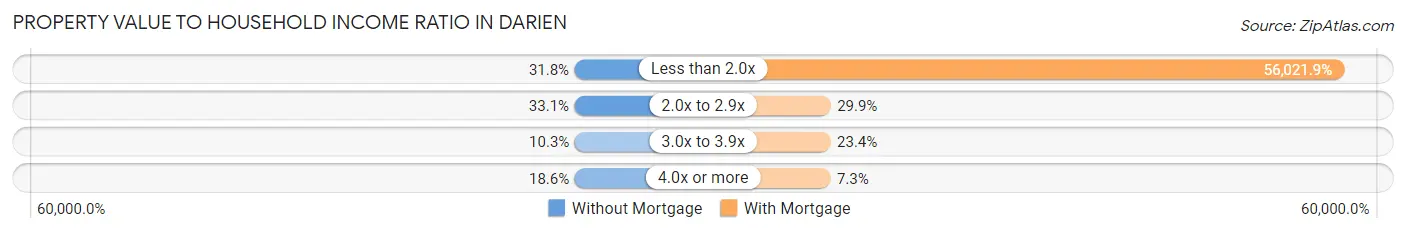
| Value-to-Income Ratio | Without Mortgage | With Mortgage |
| Less than 2.0x | 77 (31.8%) | 76,750 (56,021.9%) |
| 2.0x to 2.9x | 80 (33.1%) | 41 (29.9%) |
| 3.0x to 3.9x | 25 (10.3%) | 32 (23.4%) |
| 4.0x or more | 45 (18.6%) | 10 (7.3%) |
| Total | 242 (100.0%) | 137 (100.0%) |
Real Estate Taxes by Mortgage Status in Darien
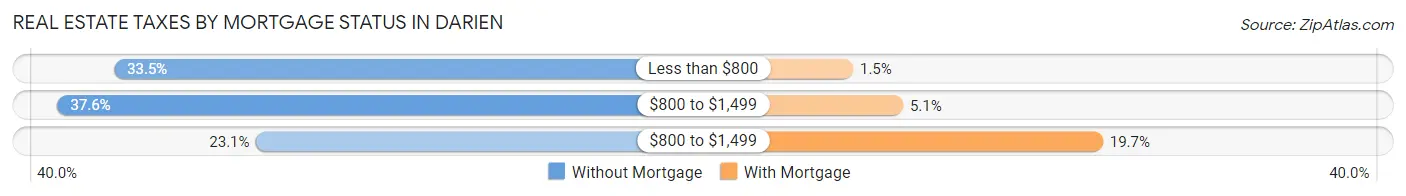
| Property Taxes | Without Mortgage | With Mortgage |
| Less than $800 | 81 (33.5%) | 2 (1.5%) |
| $800 to $1,499 | 91 (37.6%) | 7 (5.1%) |
| $800 to $1,499 | 56 (23.1%) | 27 (19.7%) |
| Total | 242 (100.0%) | 137 (100.0%) |
Health & Disability in Darien
Health Insurance Coverage by Age in Darien
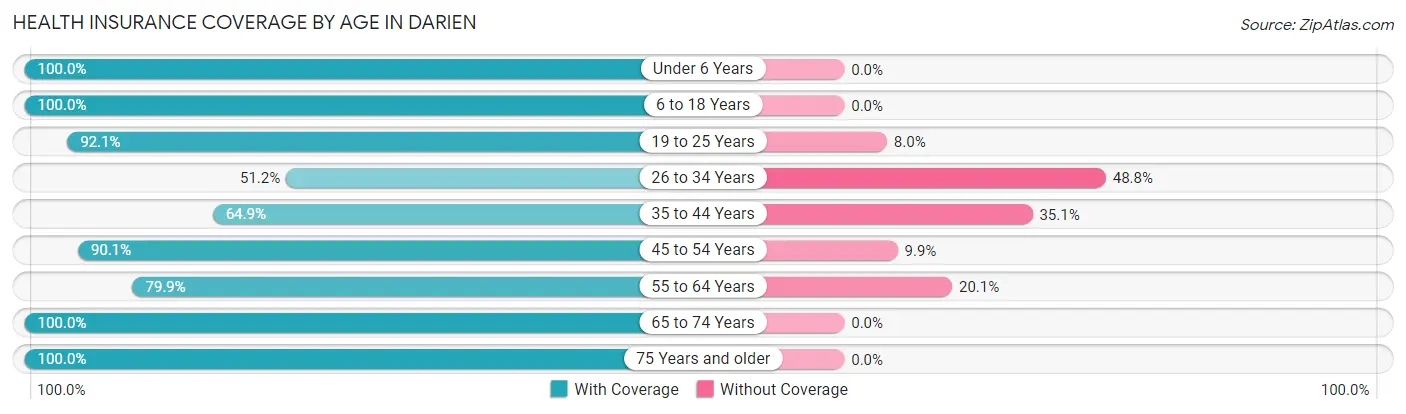
| Age Bracket | With Coverage | Without Coverage |
| Under 6 Years | 47 (100.0%) | 0 (0.0%) |
| 6 to 18 Years | 167 (100.0%) | 0 (0.0%) |
| 19 to 25 Years | 139 (92.0%) | 12 (8.0%) |
| 26 to 34 Years | 62 (51.2%) | 59 (48.8%) |
| 35 to 44 Years | 37 (64.9%) | 20 (35.1%) |
| 45 to 54 Years | 154 (90.1%) | 17 (9.9%) |
| 55 to 64 Years | 163 (79.9%) | 41 (20.1%) |
| 65 to 74 Years | 249 (100.0%) | 0 (0.0%) |
| 75 Years and older | 86 (100.0%) | 0 (0.0%) |
| Total | 1,104 (88.1%) | 149 (11.9%) |
Health Insurance Coverage by Citizenship Status in Darien
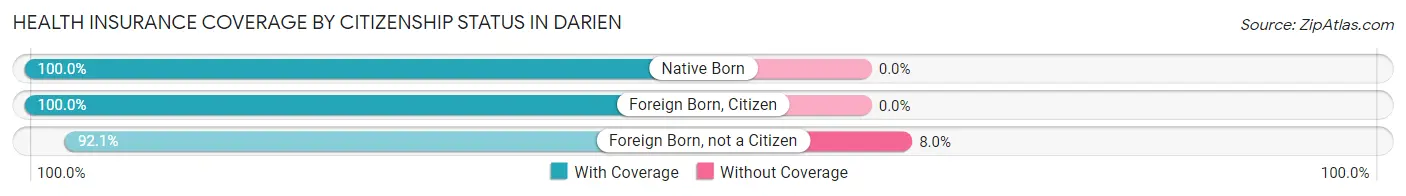
| Citizenship Status | With Coverage | Without Coverage |
| Native Born | 47 (100.0%) | 0 (0.0%) |
| Foreign Born, Citizen | 167 (100.0%) | 0 (0.0%) |
| Foreign Born, not a Citizen | 139 (92.0%) | 12 (8.0%) |
Health Insurance Coverage by Household Income in Darien
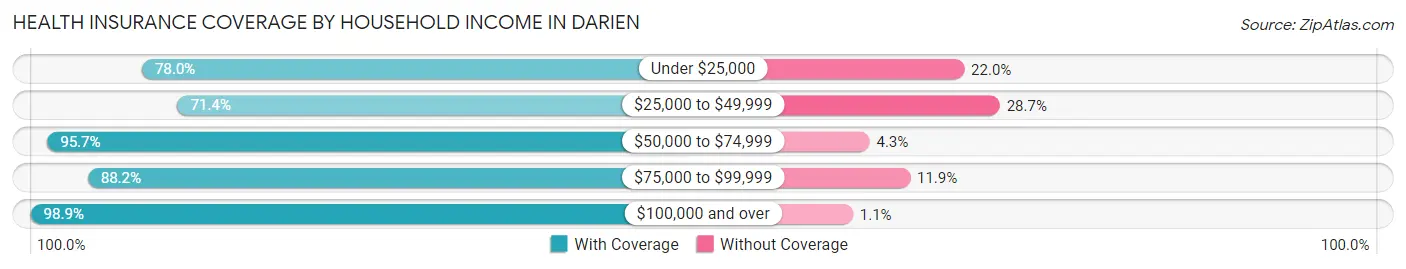
| Household Income | With Coverage | Without Coverage |
| Under $25,000 | 188 (78.0%) | 53 (22.0%) |
| $25,000 to $49,999 | 132 (71.4%) | 53 (28.6%) |
| $50,000 to $74,999 | 337 (95.7%) | 15 (4.3%) |
| $75,000 to $99,999 | 186 (88.1%) | 25 (11.8%) |
| $100,000 and over | 261 (98.9%) | 3 (1.1%) |
Public vs Private Health Insurance Coverage by Age in Darien
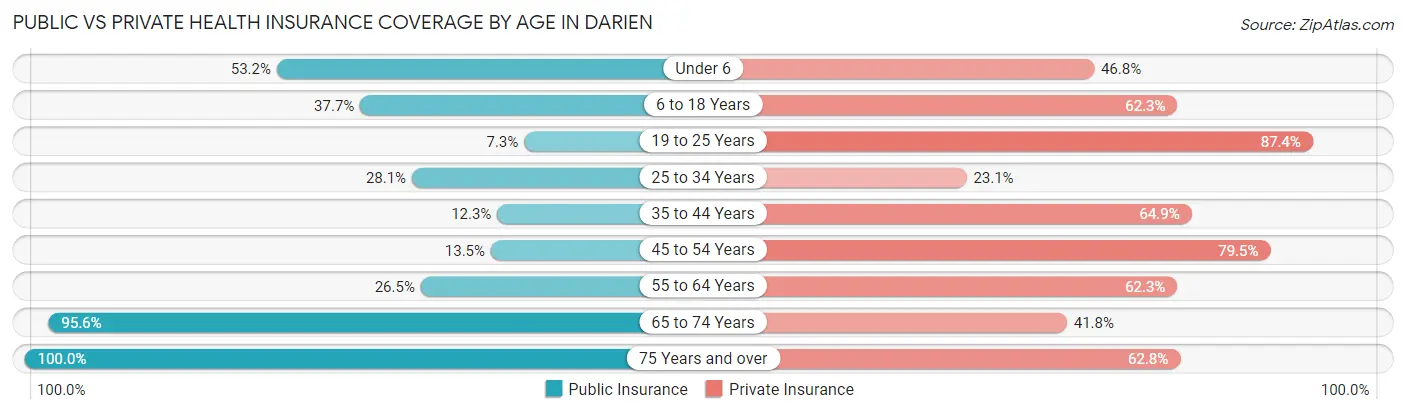
| Age Bracket | Public Insurance | Private Insurance |
| Under 6 | 25 (53.2%) | 22 (46.8%) |
| 6 to 18 Years | 63 (37.7%) | 104 (62.3%) |
| 19 to 25 Years | 11 (7.3%) | 132 (87.4%) |
| 25 to 34 Years | 34 (28.1%) | 28 (23.1%) |
| 35 to 44 Years | 7 (12.3%) | 37 (64.9%) |
| 45 to 54 Years | 23 (13.5%) | 136 (79.5%) |
| 55 to 64 Years | 54 (26.5%) | 127 (62.3%) |
| 65 to 74 Years | 238 (95.6%) | 104 (41.8%) |
| 75 Years and over | 86 (100.0%) | 54 (62.8%) |
| Total | 541 (43.2%) | 744 (59.4%) |
Disability Status by Sex by Age in Darien
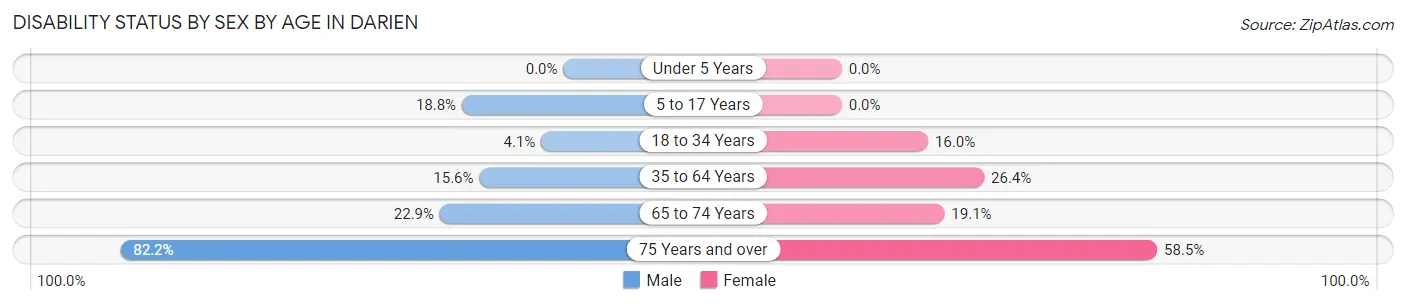
| Age Bracket | Male | Female |
| Under 5 Years | 0 (0.0%) | 0 (0.0%) |
| 5 to 17 Years | 16 (18.8%) | 0 (0.0%) |
| 18 to 34 Years | 6 (4.1%) | 28 (16.0%) |
| 35 to 64 Years | 29 (15.6%) | 65 (26.4%) |
| 65 to 74 Years | 33 (22.9%) | 20 (19.1%) |
| 75 Years and over | 37 (82.2%) | 24 (58.5%) |
Disability Class by Sex by Age in Darien
Disability Class: Hearing Difficulty
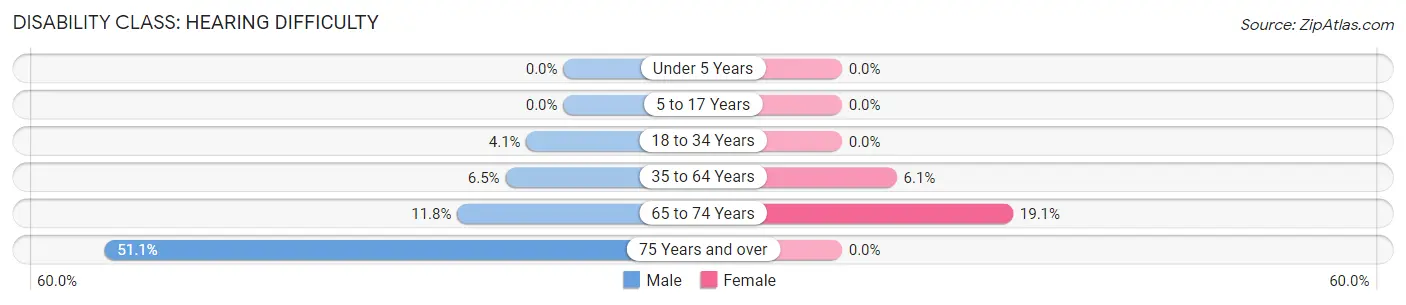
| Age Bracket | Male | Female |
| Under 5 Years | 0 (0.0%) | 0 (0.0%) |
| 5 to 17 Years | 0 (0.0%) | 0 (0.0%) |
| 18 to 34 Years | 6 (4.1%) | 0 (0.0%) |
| 35 to 64 Years | 12 (6.5%) | 15 (6.1%) |
| 65 to 74 Years | 17 (11.8%) | 20 (19.1%) |
| 75 Years and over | 23 (51.1%) | 0 (0.0%) |
Disability Class: Vision Difficulty
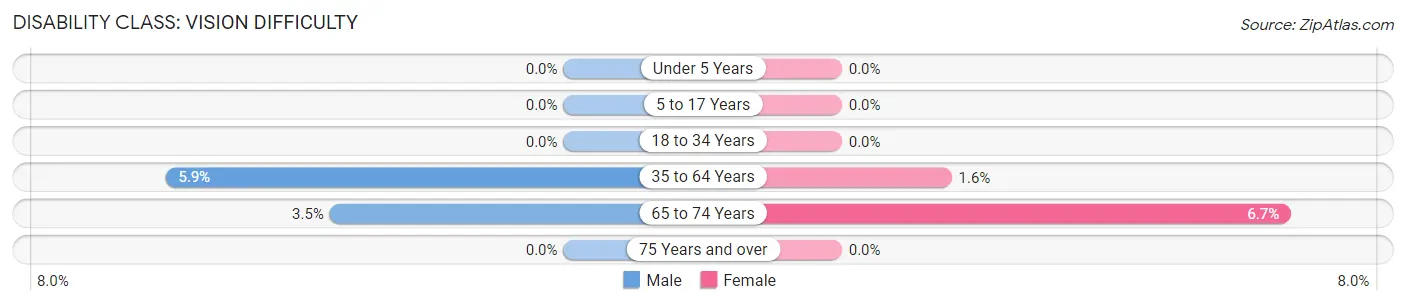
| Age Bracket | Male | Female |
| Under 5 Years | 0 (0.0%) | 0 (0.0%) |
| 5 to 17 Years | 0 (0.0%) | 0 (0.0%) |
| 18 to 34 Years | 0 (0.0%) | 0 (0.0%) |
| 35 to 64 Years | 11 (5.9%) | 4 (1.6%) |
| 65 to 74 Years | 5 (3.5%) | 7 (6.7%) |
| 75 Years and over | 0 (0.0%) | 0 (0.0%) |
Disability Class: Cognitive Difficulty
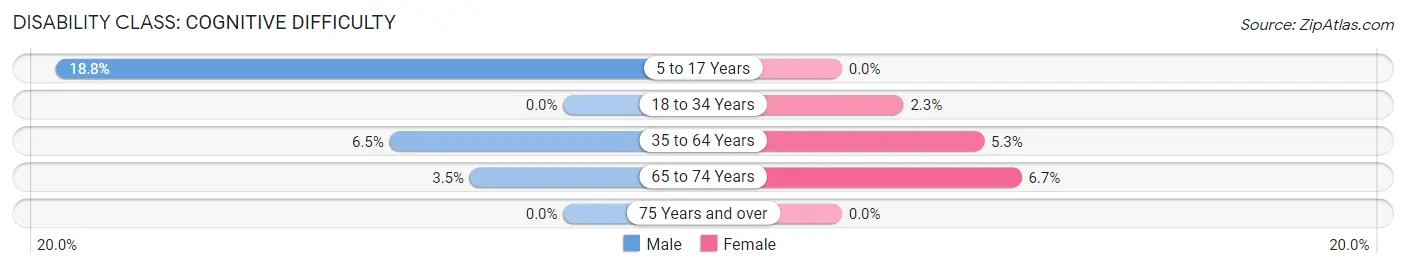
| Age Bracket | Male | Female |
| 5 to 17 Years | 16 (18.8%) | 0 (0.0%) |
| 18 to 34 Years | 0 (0.0%) | 4 (2.3%) |
| 35 to 64 Years | 12 (6.5%) | 13 (5.3%) |
| 65 to 74 Years | 5 (3.5%) | 7 (6.7%) |
| 75 Years and over | 0 (0.0%) | 0 (0.0%) |
Disability Class: Ambulatory Difficulty
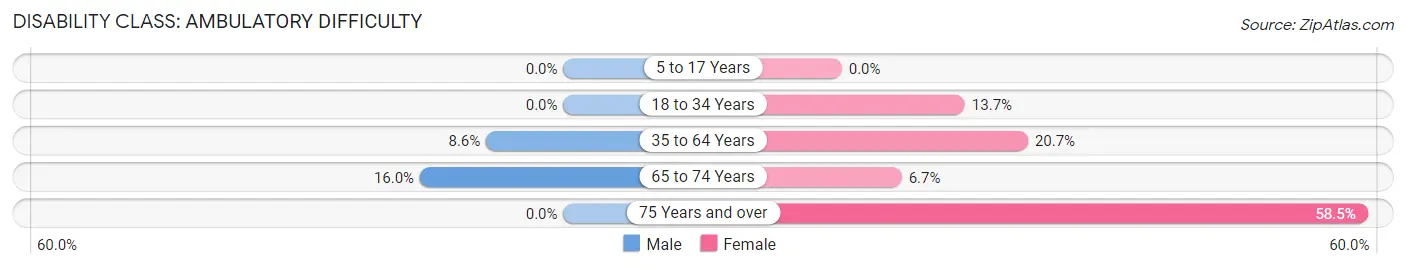
| Age Bracket | Male | Female |
| 5 to 17 Years | 0 (0.0%) | 0 (0.0%) |
| 18 to 34 Years | 0 (0.0%) | 24 (13.7%) |
| 35 to 64 Years | 16 (8.6%) | 51 (20.7%) |
| 65 to 74 Years | 23 (16.0%) | 7 (6.7%) |
| 75 Years and over | 0 (0.0%) | 24 (58.5%) |
Disability Class: Self-Care Difficulty
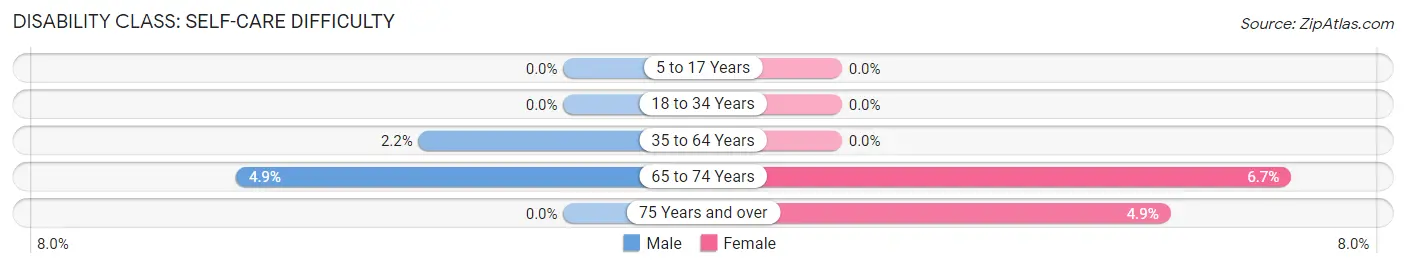
| Age Bracket | Male | Female |
| 5 to 17 Years | 0 (0.0%) | 0 (0.0%) |
| 18 to 34 Years | 0 (0.0%) | 0 (0.0%) |
| 35 to 64 Years | 4 (2.1%) | 0 (0.0%) |
| 65 to 74 Years | 7 (4.9%) | 7 (6.7%) |
| 75 Years and over | 0 (0.0%) | 2 (4.9%) |
Technology Access in Darien
Computing Device Access in Darien
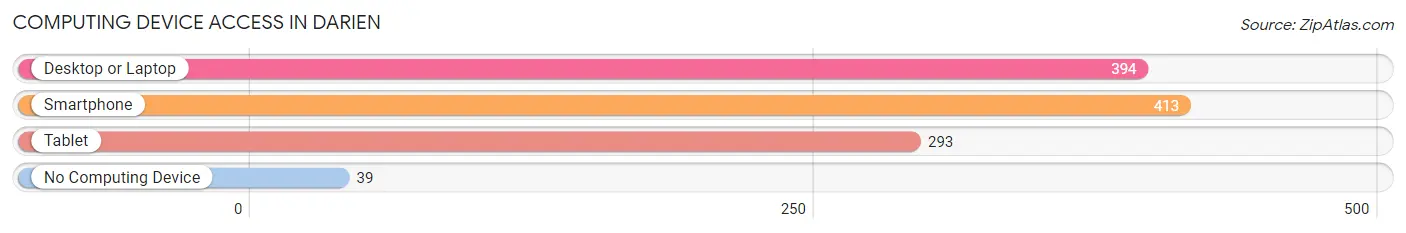
| Device Type | # Households | % Households |
| Desktop or Laptop | 394 | 71.8% |
| Smartphone | 413 | 75.2% |
| Tablet | 293 | 53.4% |
| No Computing Device | 39 | 7.1% |
| Total | 549 | 100.0% |
Internet Access in Darien
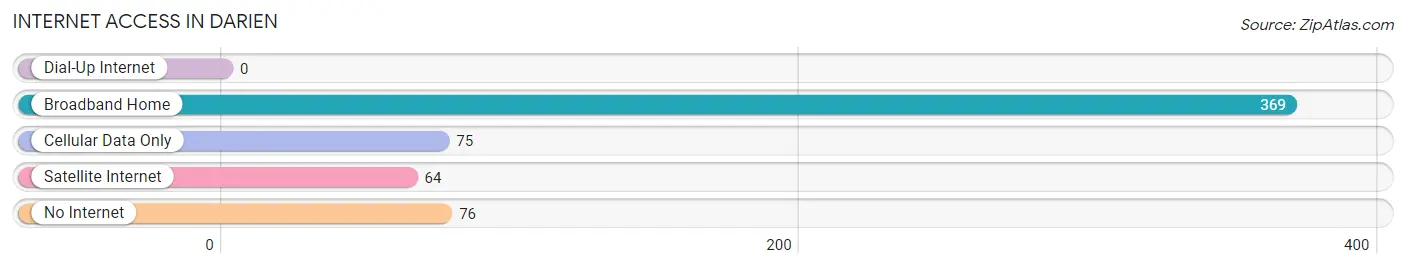
| Internet Type | # Households | % Households |
| Dial-Up Internet | 0 | 0.0% |
| Broadband Home | 369 | 67.2% |
| Cellular Data Only | 75 | 13.7% |
| Satellite Internet | 64 | 11.7% |
| No Internet | 76 | 13.8% |
| Total | 549 | 100.0% |
Darien Summary
Darien, Georgia is a small city located in McIntosh County, Georgia, United States. It is situated on the banks of the Altamaha River, approximately 30 miles south of Savannah and 60 miles north of Jacksonville, Florida. The city has a population of around 2,000 people and is the county seat of McIntosh County.
History
The area that is now Darien was first inhabited by the Guale Indians, who were part of the Creek Nation. The area was part of the Spanish colony of Florida until 1763, when it became part of the British colony of Georgia. The town of Darien was founded in 1736 by Scottish settlers, who named it after the city of Darien in Scotland. The town was incorporated in 1818 and became the county seat of McIntosh County in 1820.
During the Civil War, Darien was a major port for blockade runners, and the town was occupied by Union forces in 1863. After the war, the town experienced a period of economic growth, with the establishment of several sawmills, a cotton gin, and a turpentine distillery. The town also became a popular tourist destination, with the opening of several hotels and resorts.
Geography
Darien is located in southeastern Georgia, on the banks of the Altamaha River. The city is situated at an elevation of 15 feet above sea level. The city covers an area of 4.2 square miles, with 0.2 square miles of water. The city is located in a humid subtropical climate zone, with hot, humid summers and mild winters.
Economy
The economy of Darien is largely based on tourism and agriculture. The city is home to several resorts and hotels, as well as several restaurants and shops. The city is also home to several marinas, which provide access to the Altamaha River. Agriculture is also an important part of the local economy, with the production of cotton, corn, soybeans, and peanuts.
Demographics
As of the 2010 census, the population of Darien was 2,017. The racial makeup of the city was 57.3% White, 37.2% African American, 0.7% Native American, 0.7% Asian, 0.1% Pacific Islander, and 3.9% from other races. The median household income was $30,938, and the median family income was $37,813. The per capita income was $17,845.
Conclusion
Darien, Georgia is a small city located in McIntosh County, Georgia, United States. It is situated on the banks of the Altamaha River, approximately 30 miles south of Savannah and 60 miles north of Jacksonville, Florida. The city has a population of around 2,000 people and is the county seat of McIntosh County. The economy of Darien is largely based on tourism and agriculture, with the production of cotton, corn, soybeans, and peanuts. As of the 2010 census, the population of Darien was 2,017, with a median household income of $30,938 and a median family income of $37,813.
Common Questions
What is Per Capita Income in Darien?
Per Capita income in Darien is $31,929.
What is the Median Family Income in Darien?
Median Family Income in Darien is $61,250.
What is the Median Household income in Darien?
Median Household Income in Darien is $53,325.
What is Inequality or Gini Index in Darien?
Inequality or Gini Index in Darien is 0.46.
What is the Total Population of Darien?
Total Population of Darien is 1,253.
What is the Total Male Population of Darien?
Total Male Population of Darien is 621.
What is the Total Female Population of Darien?
Total Female Population of Darien is 632.
What is the Ratio of Males per 100 Females in Darien?
There are 98.26 Males per 100 Females in Darien.
What is the Ratio of Females per 100 Males in Darien?
There are 101.77 Females per 100 Males in Darien.
What is the Median Population Age in Darien?
Median Population Age in Darien is 49.4 Years.
What is the Average Family Size in Darien
Average Family Size in Darien is 2.7 People.
What is the Average Household Size in Darien
Average Household Size in Darien is 2.3 People.
How Large is the Labor Force in Darien?
There are 645 People in the Labor Forcein in Darien.
What is the Percentage of People in the Labor Force in Darien?
58.7% of People are in the Labor Force in Darien.
What is the Unemployment Rate in Darien?
Unemployment Rate in Darien is 3.3%.