Arlington, MA Map & Demographics
Arlington Map
Arlington Overview
$77,043
PER CAPITA INCOME
$177,107
AVG FAMILY INCOME
$136,312
AVG HOUSEHOLD INCOME
30.6%
WAGE / INCOME GAP [ % ]
69.4¢/ $1
WAGE / INCOME GAP [ $ ]
$12,425
FAMILY INCOME DEFICIT
0.47
INEQUALITY / GINI INDEX
45,906
TOTAL POPULATION
21,710
MALE POPULATION
24,196
FEMALE POPULATION
89.73
MALES / 100 FEMALES
111.45
FEMALES / 100 MALES
40.7
MEDIAN AGE
3.0
AVG FAMILY SIZE
2.3
AVG HOUSEHOLD SIZE
27,347
LABOR FORCE [ PEOPLE ]
73.3%
PERCENT IN LABOR FORCE
3.6%
UNEMPLOYMENT RATE
Income in Arlington
Income Overview in Arlington
Per Capita Income in Arlington is $77,043, while median incomes of families and households are $177,107 and $136,312 respectively.
| Characteristic | Number | Measure |
| Per Capita Income | 45,906 | $77,043 |
| Median Family Income | 11,878 | $177,107 |
| Mean Family Income | 11,878 | $226,502 |
| Median Household Income | 19,451 | $136,312 |
| Mean Household Income | 19,451 | $180,576 |
| Income Deficit | 11,878 | $12,425 |
| Wage / Income Gap (%) | 45,906 | 30.59% |
| Wage / Income Gap ($) | 45,906 | 69.41¢ per $1 |
| Gini / Inequality Index | 45,906 | 0.47 |
Earnings by Sex in Arlington
Average Earnings in Arlington are $77,874, $97,130 for men and $67,421 for women, a difference of 30.6%.
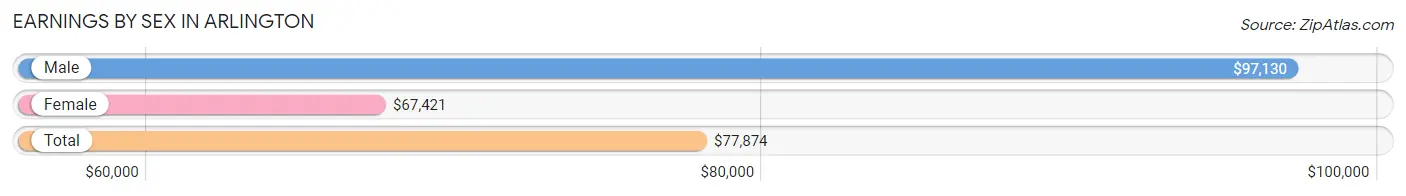
| Sex | Number | Average Earnings |
| Male | 13,862 (48.5%) | $97,130 |
| Female | 14,741 (51.5%) | $67,421 |
| Total | 28,603 (100.0%) | $77,874 |
Earnings by Sex by Income Bracket in Arlington
The most common earnings brackets in Arlington are $100,000+ for men (6,816 | 49.2%) and $100,000+ for women (4,708 | 31.9%).
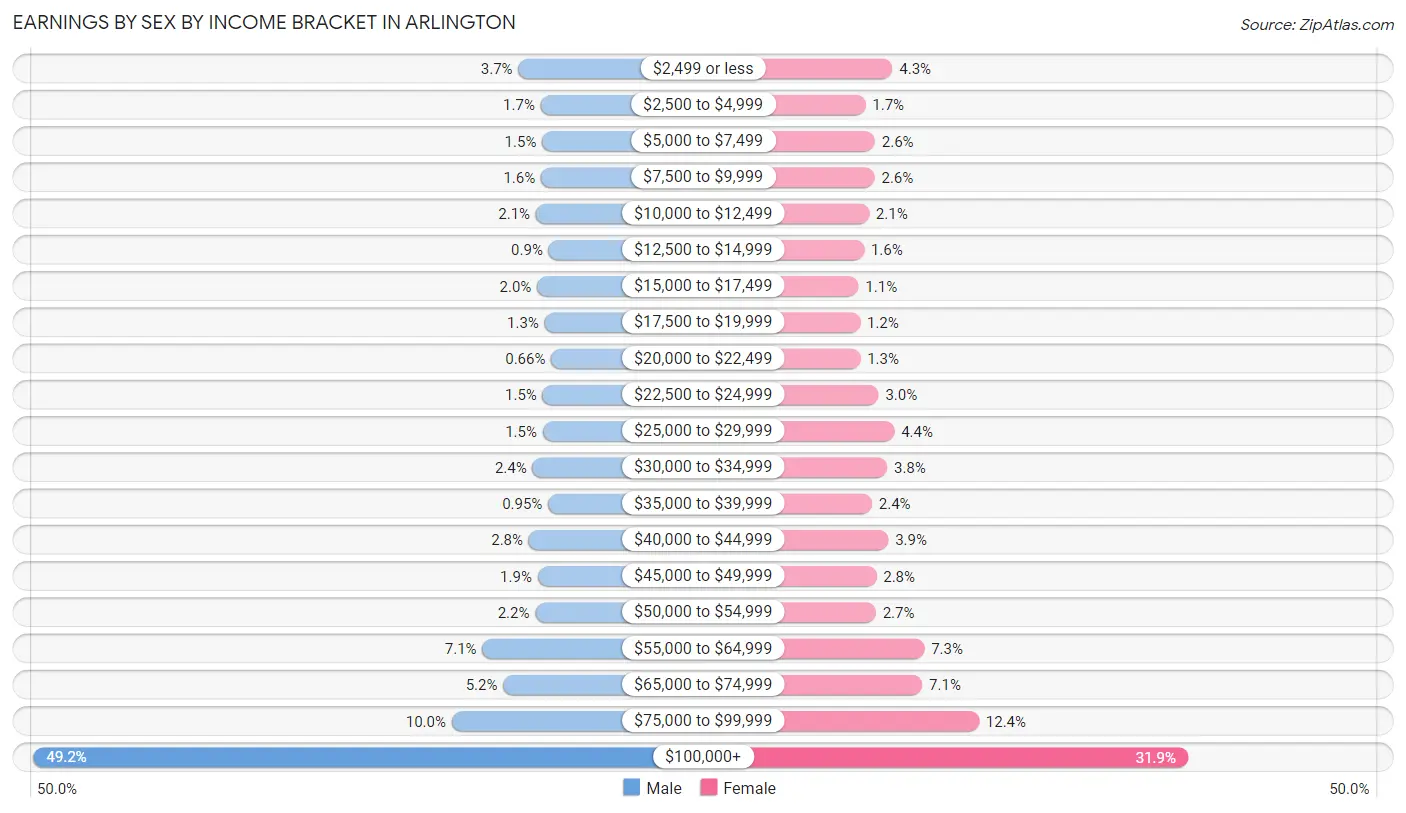
| Income | Male | Female |
| $2,499 or less | 518 (3.7%) | 630 (4.3%) |
| $2,500 to $4,999 | 229 (1.7%) | 256 (1.7%) |
| $5,000 to $7,499 | 209 (1.5%) | 387 (2.6%) |
| $7,500 to $9,999 | 224 (1.6%) | 383 (2.6%) |
| $10,000 to $12,499 | 291 (2.1%) | 305 (2.1%) |
| $12,500 to $14,999 | 125 (0.9%) | 237 (1.6%) |
| $15,000 to $17,499 | 275 (2.0%) | 161 (1.1%) |
| $17,500 to $19,999 | 178 (1.3%) | 183 (1.2%) |
| $20,000 to $22,499 | 91 (0.7%) | 186 (1.3%) |
| $22,500 to $24,999 | 204 (1.5%) | 438 (3.0%) |
| $25,000 to $29,999 | 203 (1.5%) | 655 (4.4%) |
| $30,000 to $34,999 | 335 (2.4%) | 555 (3.8%) |
| $35,000 to $39,999 | 131 (0.9%) | 346 (2.4%) |
| $40,000 to $44,999 | 382 (2.8%) | 572 (3.9%) |
| $45,000 to $49,999 | 268 (1.9%) | 407 (2.8%) |
| $50,000 to $54,999 | 300 (2.2%) | 400 (2.7%) |
| $55,000 to $64,999 | 985 (7.1%) | 1,069 (7.2%) |
| $65,000 to $74,999 | 715 (5.2%) | 1,040 (7.1%) |
| $75,000 to $99,999 | 1,383 (10.0%) | 1,823 (12.4%) |
| $100,000+ | 6,816 (49.2%) | 4,708 (31.9%) |
| Total | 13,862 (100.0%) | 14,741 (100.0%) |
Earnings by Sex by Educational Attainment in Arlington
Average earnings in Arlington are $105,669 for men and $71,996 for women, a difference of 31.9%. Men with an educational attainment of graduate degree enjoy the highest average annual earnings of $132,500, while those with less than high school education earn the least with $33,214. Women with an educational attainment of graduate degree earn the most with the average annual earnings of $100,443, while those with high school diploma education have the smallest earnings of $35,278.
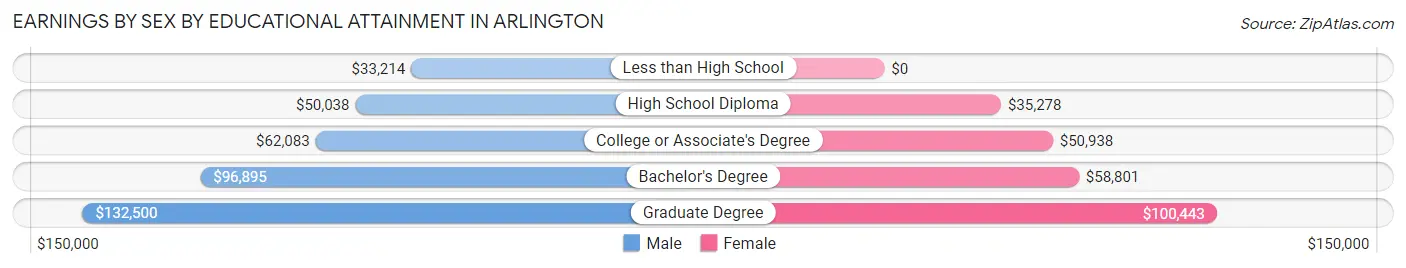
| Educational Attainment | Male Income | Female Income |
| Less than High School | $33,214 | $0 |
| High School Diploma | $50,038 | $35,278 |
| College or Associate's Degree | $62,083 | $50,938 |
| Bachelor's Degree | $96,895 | $58,801 |
| Graduate Degree | $132,500 | $100,443 |
| Total | $105,669 | $71,996 |
Family Income in Arlington
Family Income Brackets in Arlington
According to the Arlington family income data, there are 5,167 families falling into the $200,000+ income range, which is the most common income bracket and makes up 43.5% of all families. Conversely, the $10,000 to $14,999 income bracket is the least frequent group with only 24 families (0.2%) belonging to this category.
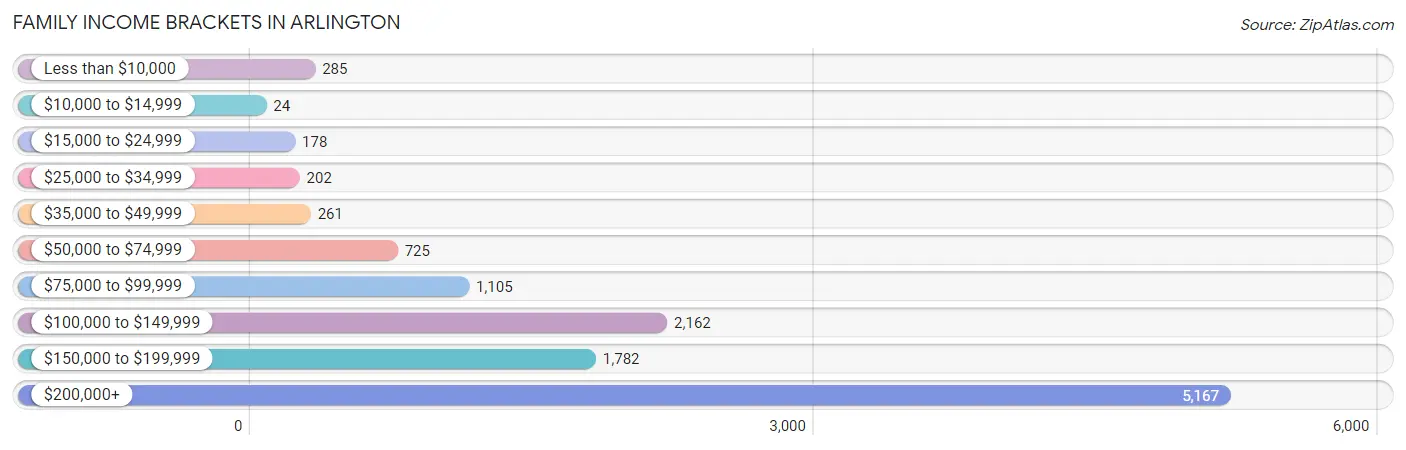
| Income Bracket | # Families | % Families |
| Less than $10,000 | 285 | 2.4% |
| $10,000 to $14,999 | 24 | 0.2% |
| $15,000 to $24,999 | 178 | 1.5% |
| $25,000 to $34,999 | 202 | 1.7% |
| $35,000 to $49,999 | 261 | 2.2% |
| $50,000 to $74,999 | 725 | 6.1% |
| $75,000 to $99,999 | 1,105 | 9.3% |
| $100,000 to $149,999 | 2,162 | 18.2% |
| $150,000 to $199,999 | 1,782 | 15.0% |
| $200,000+ | 5,167 | 43.5% |
Family Income by Famaliy Size in Arlington
6-person families (86 | 0.7%) account for the highest median family income in Arlington with $250,001 per family, while 2-person families (5,289 | 44.5%) have the highest median income of $68,625 per family member.
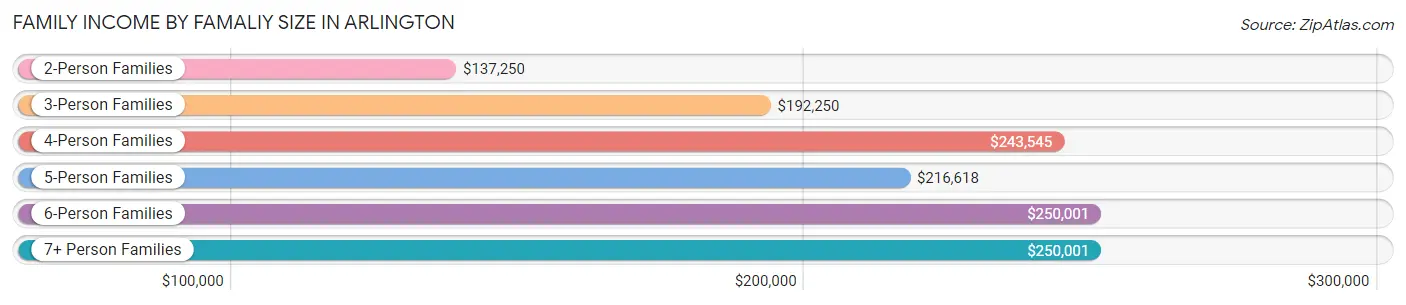
| Income Bracket | # Families | Median Income |
| 2-Person Families | 5,289 (44.5%) | $137,250 |
| 3-Person Families | 2,964 (24.9%) | $192,250 |
| 4-Person Families | 2,762 (23.3%) | $243,545 |
| 5-Person Families | 710 (6.0%) | $216,618 |
| 6-Person Families | 86 (0.7%) | $250,001 |
| 7+ Person Families | 67 (0.6%) | $250,001 |
| Total | 11,878 (100.0%) | $177,107 |
Family Income by Number of Earners in Arlington
The median family income in Arlington is $177,107, with families comprising 3+ earners (1,357) having the highest median family income of $228,750, while families with no earners (1,009) have the lowest median family income of $81,806, accounting for 11.4% and 8.5% of families, respectively.
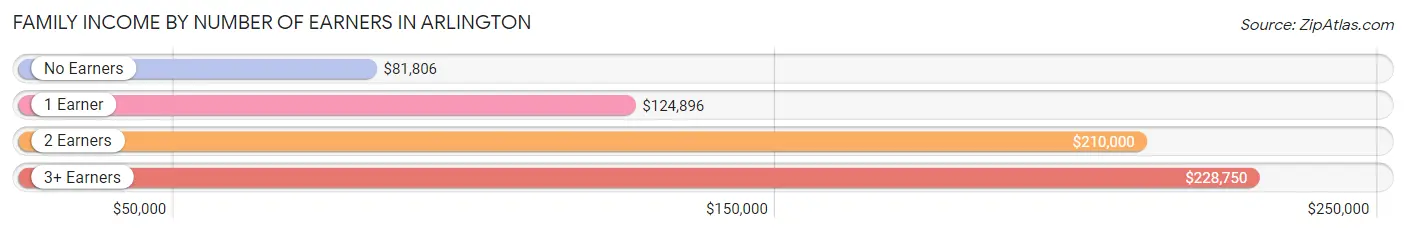
| Number of Earners | # Families | Median Income |
| No Earners | 1,009 (8.5%) | $81,806 |
| 1 Earner | 2,446 (20.6%) | $124,896 |
| 2 Earners | 7,066 (59.5%) | $210,000 |
| 3+ Earners | 1,357 (11.4%) | $228,750 |
| Total | 11,878 (100.0%) | $177,107 |
Household Income in Arlington
Household Income Brackets in Arlington
With 6,224 households falling in the category, the $200,000+ income range is the most frequent in Arlington, accounting for 32.0% of all households. In contrast, only 467 households (2.4%) fall into the $10,000 to $14,999 income bracket, making it the least populous group.
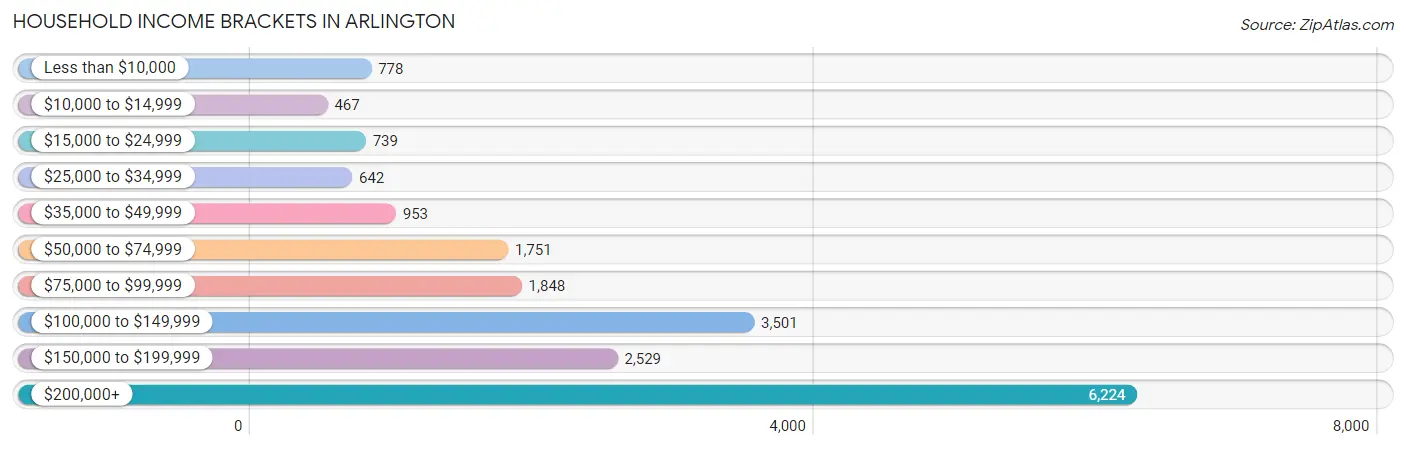
| Income Bracket | # Households | % Households |
| Less than $10,000 | 778 | 4.0% |
| $10,000 to $14,999 | 467 | 2.4% |
| $15,000 to $24,999 | 739 | 3.8% |
| $25,000 to $34,999 | 642 | 3.3% |
| $35,000 to $49,999 | 953 | 4.9% |
| $50,000 to $74,999 | 1,751 | 9.0% |
| $75,000 to $99,999 | 1,848 | 9.5% |
| $100,000 to $149,999 | 3,501 | 18.0% |
| $150,000 to $199,999 | 2,529 | 13.0% |
| $200,000+ | 6,224 | 32.0% |
Household Income by Householder Age in Arlington
The median household income in Arlington is $136,312, with the highest median household income of $161,400 found in the 45 to 64 years age bracket for the primary householder. A total of 7,182 households (36.9%) fall into this category. Meanwhile, the 15 to 24 years age bracket for the primary householder has the lowest median household income of $0, with 260 households (1.3%) in this group.
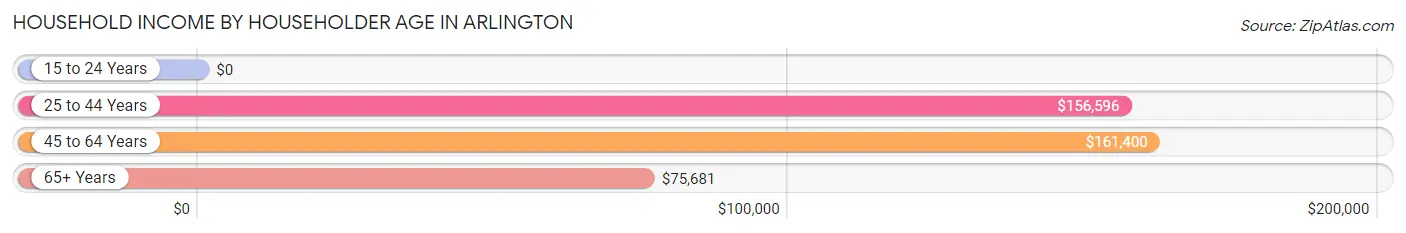
| Income Bracket | # Households | Median Income |
| 15 to 24 Years | 260 (1.3%) | $0 |
| 25 to 44 Years | 6,860 (35.3%) | $156,596 |
| 45 to 64 Years | 7,182 (36.9%) | $161,400 |
| 65+ Years | 5,149 (26.5%) | $75,681 |
| Total | 19,451 (100.0%) | $136,312 |
Poverty in Arlington
Income Below Poverty by Sex and Age in Arlington
With 4.9% poverty level for males and 5.9% for females among the residents of Arlington, 5 year old males and 18 to 24 year old females are the most vulnerable to poverty, with 48 males (18.0%) and 185 females (16.8%) in their respective age groups living below the poverty level.
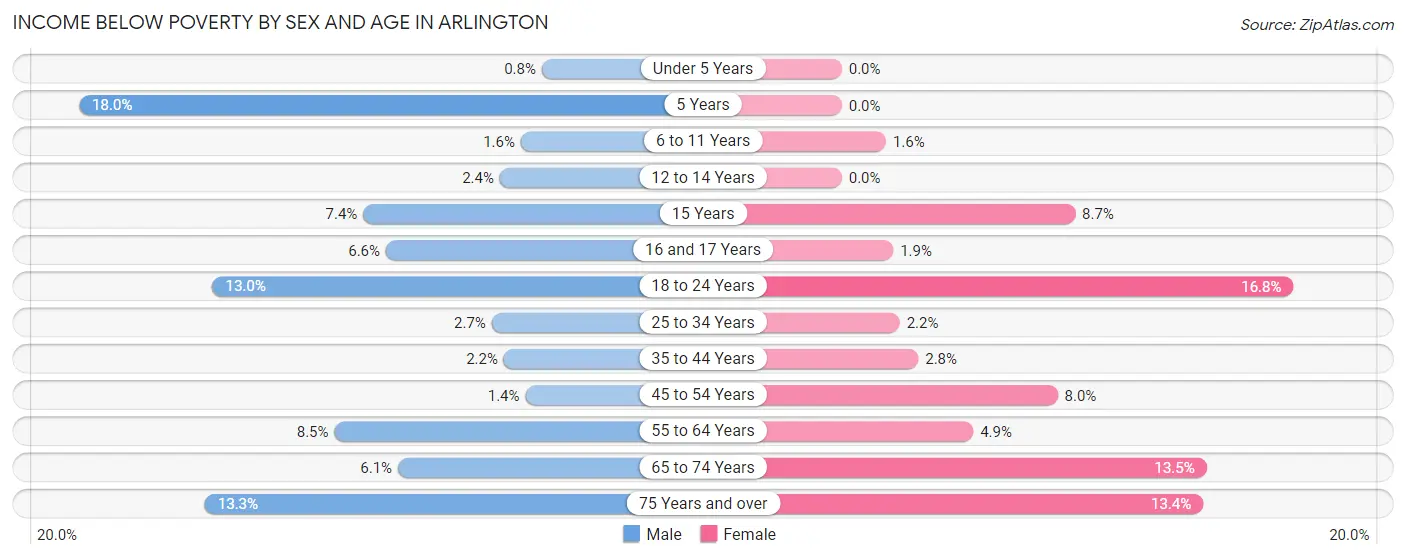
| Age Bracket | Male | Female |
| Under 5 Years | 10 (0.8%) | 0 (0.0%) |
| 5 Years | 48 (18.0%) | 0 (0.0%) |
| 6 to 11 Years | 22 (1.6%) | 28 (1.6%) |
| 12 to 14 Years | 21 (2.4%) | 0 (0.0%) |
| 15 Years | 22 (7.4%) | 20 (8.7%) |
| 16 and 17 Years | 40 (6.6%) | 11 (1.9%) |
| 18 to 24 Years | 164 (13.0%) | 185 (16.8%) |
| 25 to 34 Years | 84 (2.7%) | 74 (2.1%) |
| 35 to 44 Years | 68 (2.2%) | 107 (2.8%) |
| 45 to 54 Years | 47 (1.4%) | 289 (8.0%) |
| 55 to 64 Years | 223 (8.5%) | 150 (4.9%) |
| 65 to 74 Years | 127 (6.1%) | 313 (13.5%) |
| 75 Years and over | 186 (13.3%) | 233 (13.4%) |
| Total | 1,062 (4.9%) | 1,410 (5.9%) |
Income Above Poverty by Sex and Age in Arlington
According to the poverty statistics in Arlington, males aged under 5 years and females aged under 5 years are the age groups that are most secure financially, with 99.2% of males and 100.0% of females in these age groups living above the poverty line.
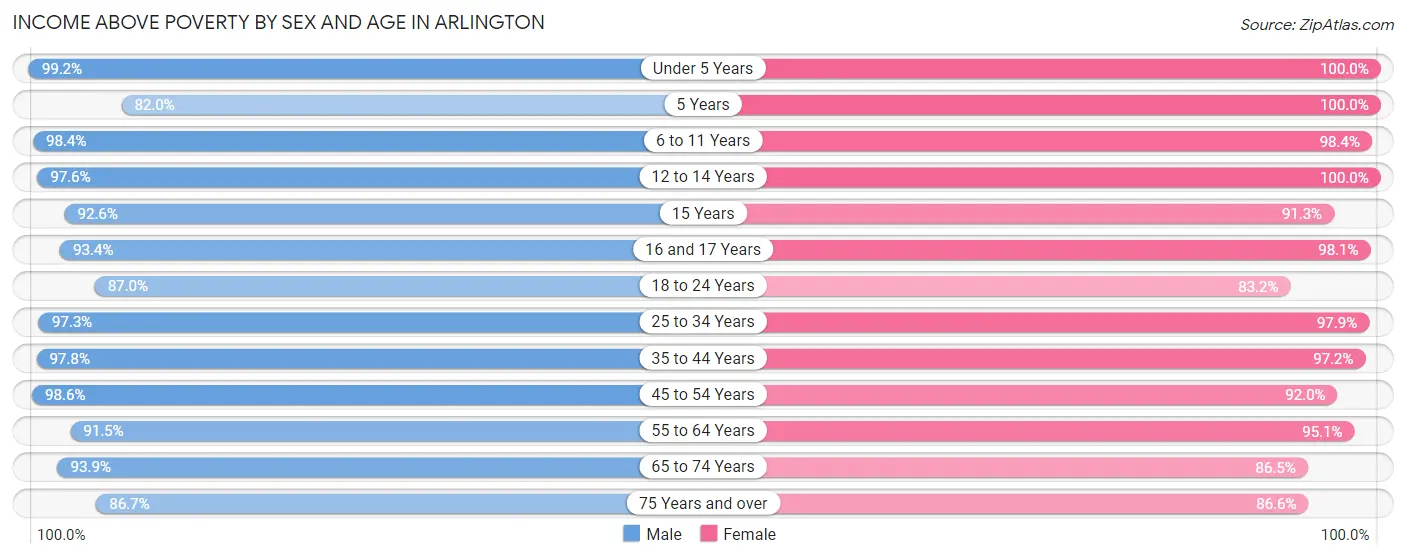
| Age Bracket | Male | Female |
| Under 5 Years | 1,243 (99.2%) | 1,151 (100.0%) |
| 5 Years | 219 (82.0%) | 335 (100.0%) |
| 6 to 11 Years | 1,370 (98.4%) | 1,676 (98.4%) |
| 12 to 14 Years | 868 (97.6%) | 922 (100.0%) |
| 15 Years | 274 (92.6%) | 211 (91.3%) |
| 16 and 17 Years | 567 (93.4%) | 566 (98.1%) |
| 18 to 24 Years | 1,096 (87.0%) | 919 (83.2%) |
| 25 to 34 Years | 3,077 (97.3%) | 3,362 (97.9%) |
| 35 to 44 Years | 3,003 (97.8%) | 3,663 (97.2%) |
| 45 to 54 Years | 3,277 (98.6%) | 3,318 (92.0%) |
| 55 to 64 Years | 2,400 (91.5%) | 2,923 (95.1%) |
| 65 to 74 Years | 1,941 (93.9%) | 1,998 (86.5%) |
| 75 Years and over | 1,211 (86.7%) | 1,504 (86.6%) |
| Total | 20,546 (95.1%) | 22,548 (94.1%) |
Income Below Poverty Among Married-Couple Families in Arlington
The poverty statistics for married-couple families in Arlington show that 2.3% or 220 of the total 9,626 families live below the poverty line. Families with no children have the highest poverty rate of 4.0%, comprising of 190 families. On the other hand, families with 3 or 4 children have the lowest poverty rate of 0.0%, which includes 0 families.
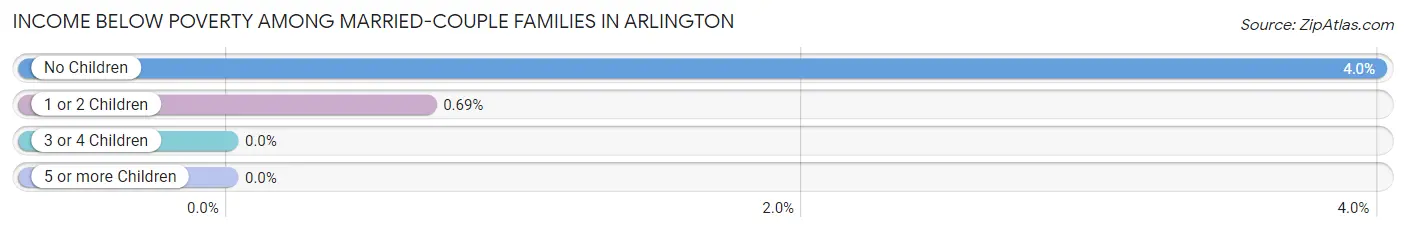
| Children | Above Poverty | Below Poverty |
| No Children | 4,565 (96.0%) | 190 (4.0%) |
| 1 or 2 Children | 4,330 (99.3%) | 30 (0.7%) |
| 3 or 4 Children | 511 (100.0%) | 0 (0.0%) |
| 5 or more Children | 0 (0.0%) | 0 (0.0%) |
| Total | 9,406 (97.7%) | 220 (2.3%) |
Income Below Poverty Among Single-Parent Households in Arlington
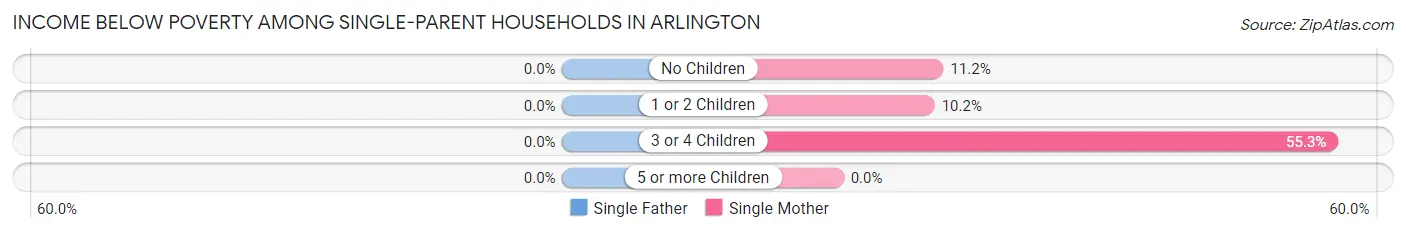
| Children | Single Father | Single Mother |
| No Children | 0 (0.0%) | 99 (11.2%) |
| 1 or 2 Children | 0 (0.0%) | 79 (10.2%) |
| 3 or 4 Children | 0 (0.0%) | 21 (55.3%) |
| 5 or more Children | 0 (0.0%) | 0 (0.0%) |
| Total | 0 (0.0%) | 199 (11.7%) |
Income Below Poverty Among Married-Couple vs Single-Parent Households in Arlington
The poverty data for Arlington shows that 220 of the married-couple family households (2.3%) and 199 of the single-parent households (8.8%) are living below the poverty level. Within the married-couple family households, those with no children have the highest poverty rate, with 190 households (4.0%) falling below the poverty line. Among the single-parent households, those with 3 or 4 children have the highest poverty rate, with 21 household (33.9%) living below poverty.
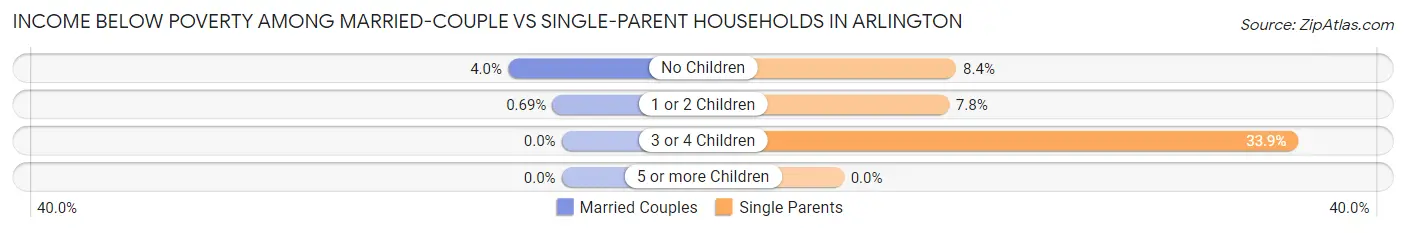
| Children | Married-Couple Families | Single-Parent Households |
| No Children | 190 (4.0%) | 99 (8.4%) |
| 1 or 2 Children | 30 (0.7%) | 79 (7.8%) |
| 3 or 4 Children | 0 (0.0%) | 21 (33.9%) |
| 5 or more Children | 0 (0.0%) | 0 (0.0%) |
| Total | 220 (2.3%) | 199 (8.8%) |
Race in Arlington
The most populous races in Arlington are White / Caucasian (34,836 | 75.9%), Asian (6,105 | 13.3%), and Two or more Races (2,848 | 6.2%).
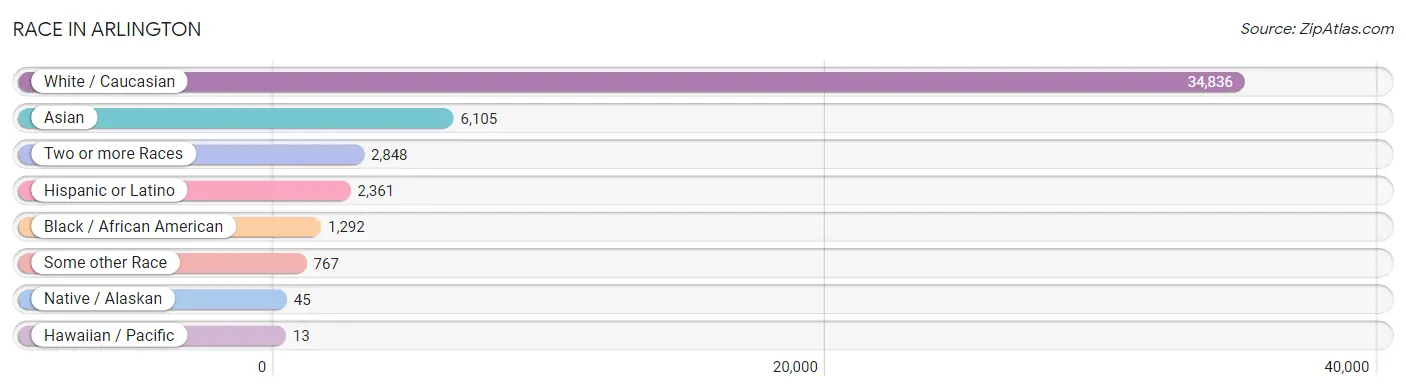
| Race | # Population | % Population |
| Asian | 6,105 | 13.3% |
| Black / African American | 1,292 | 2.8% |
| Hawaiian / Pacific | 13 | 0.0% |
| Hispanic or Latino | 2,361 | 5.1% |
| Native / Alaskan | 45 | 0.1% |
| White / Caucasian | 34,836 | 75.9% |
| Two or more Races | 2,848 | 6.2% |
| Some other Race | 767 | 1.7% |
| Total | 45,906 | 100.0% |
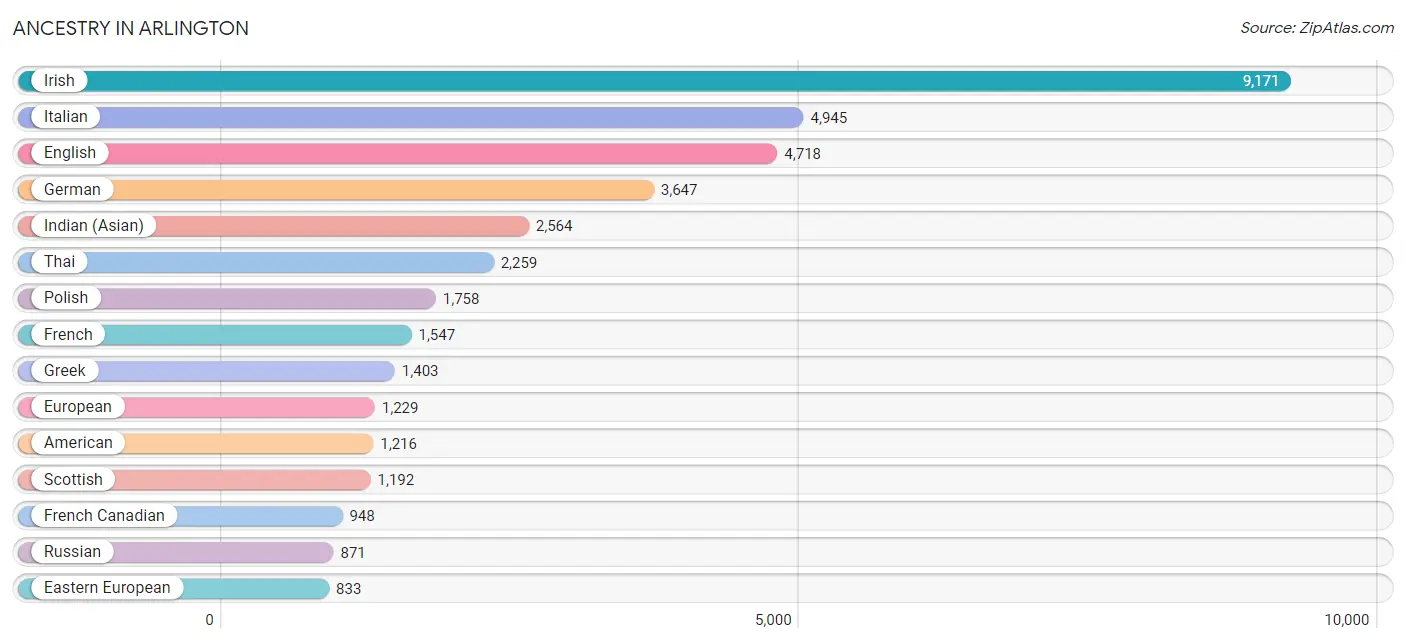
Ancestry in Arlington
The most populous ancestries reported in Arlington are Irish (9,171 | 20.0%), Italian (4,945 | 10.8%), English (4,718 | 10.3%), German (3,647 | 7.9%), and Indian (Asian) (2,564 | 5.6%), together accounting for 54.6% of all Arlington residents.
| Ancestry | # Population | % Population |
| African | 109 | 0.2% |
| Albanian | 184 | 0.4% |
| American | 1,216 | 2.6% |
| Arab | 420 | 0.9% |
| Argentinean | 66 | 0.1% |
| Armenian | 479 | 1.0% |
| Assyrian / Chaldean / Syriac | 8 | 0.0% |
| Australian | 21 | 0.1% |
| Austrian | 254 | 0.5% |
| Belgian | 27 | 0.1% |
| Bhutanese | 785 | 1.7% |
| Brazilian | 104 | 0.2% |
| British | 562 | 1.2% |
| British West Indian | 26 | 0.1% |
| Bulgarian | 74 | 0.2% |
| Burmese | 477 | 1.0% |
| Cambodian | 35 | 0.1% |
| Canadian | 548 | 1.2% |
| Cape Verdean | 12 | 0.0% |
| Celtic | 23 | 0.1% |
| Central American | 208 | 0.4% |
| Chilean | 69 | 0.2% |
| Chippewa | 14 | 0.0% |
| Colombian | 167 | 0.4% |
| Croatian | 104 | 0.2% |
| Cuban | 161 | 0.4% |
| Czech | 125 | 0.3% |
| Czechoslovakian | 27 | 0.1% |
| Danish | 184 | 0.4% |
| Dominican | 86 | 0.2% |
| Dutch | 325 | 0.7% |
| Eastern European | 833 | 1.8% |
| Ecuadorian | 65 | 0.1% |
| Egyptian | 15 | 0.0% |
| English | 4,718 | 10.3% |
| Estonian | 50 | 0.1% |
| Ethiopian | 16 | 0.0% |
| European | 1,229 | 2.7% |
| Filipino | 177 | 0.4% |
| Finnish | 126 | 0.3% |
| French | 1,547 | 3.4% |
| French Canadian | 948 | 2.1% |
| German | 3,647 | 7.9% |
| Ghanaian | 123 | 0.3% |
| Greek | 1,403 | 3.1% |
| Guatemalan | 32 | 0.1% |
| Haitian | 106 | 0.2% |
| Honduran | 18 | 0.0% |
| Hungarian | 136 | 0.3% |
| Icelander | 35 | 0.1% |
| Indian (Asian) | 2,564 | 5.6% |
| Iranian | 304 | 0.7% |
| Irish | 9,171 | 20.0% |
| Israeli | 102 | 0.2% |
| Italian | 4,945 | 10.8% |
| Jamaican | 61 | 0.1% |
| Japanese | 19 | 0.0% |
| Jordanian | 27 | 0.1% |
| Korean | 266 | 0.6% |
| Laotian | 109 | 0.2% |
| Latvian | 10 | 0.0% |
| Lebanese | 220 | 0.5% |
| Lithuanian | 463 | 1.0% |
| Macedonian | 12 | 0.0% |
| Mexican | 574 | 1.3% |
| Mexican American Indian | 33 | 0.1% |
| Moroccan | 13 | 0.0% |
| Native Hawaiian | 7 | 0.0% |
| New Zealander | 31 | 0.1% |
| Nicaraguan | 23 | 0.1% |
| Northern European | 295 | 0.6% |
| Norwegian | 173 | 0.4% |
| Pakistani | 244 | 0.5% |
| Palestinian | 38 | 0.1% |
| Panamanian | 10 | 0.0% |
| Peruvian | 11 | 0.0% |
| Polish | 1,758 | 3.8% |
| Portuguese | 539 | 1.2% |
| Potawatomi | 10 | 0.0% |
| Puerto Rican | 557 | 1.2% |
| Romanian | 37 | 0.1% |
| Russian | 871 | 1.9% |
| Salvadoran | 120 | 0.3% |
| Scandinavian | 32 | 0.1% |
| Scotch-Irish | 409 | 0.9% |
| Scottish | 1,192 | 2.6% |
| Slovak | 135 | 0.3% |
| Slovene | 27 | 0.1% |
| South American | 410 | 0.9% |
| South American Indian | 12 | 0.0% |
| Spaniard | 137 | 0.3% |
| Spanish | 78 | 0.2% |
| Sri Lankan | 83 | 0.2% |
| Subsaharan African | 314 | 0.7% |
| Swedish | 480 | 1.1% |
| Swiss | 155 | 0.3% |
| Syrian | 117 | 0.3% |
| Thai | 2,259 | 4.9% |
| Turkish | 109 | 0.2% |
| Ukrainian | 491 | 1.1% |
| Venezuelan | 20 | 0.0% |
| Vietnamese | 82 | 0.2% |
| Welsh | 385 | 0.8% |
| West Indian | 14 | 0.0% |
| Yugoslavian | 15 | 0.0% | View All 105 Rows |
Immigrants in Arlington
The most numerous immigrant groups reported in Arlington came from Asia (4,727 | 10.3%), Europe (2,141 | 4.7%), Eastern Asia (2,030 | 4.4%), South Central Asia (2,002 | 4.4%), and India (1,405 | 3.1%), together accounting for 26.8% of all Arlington residents.
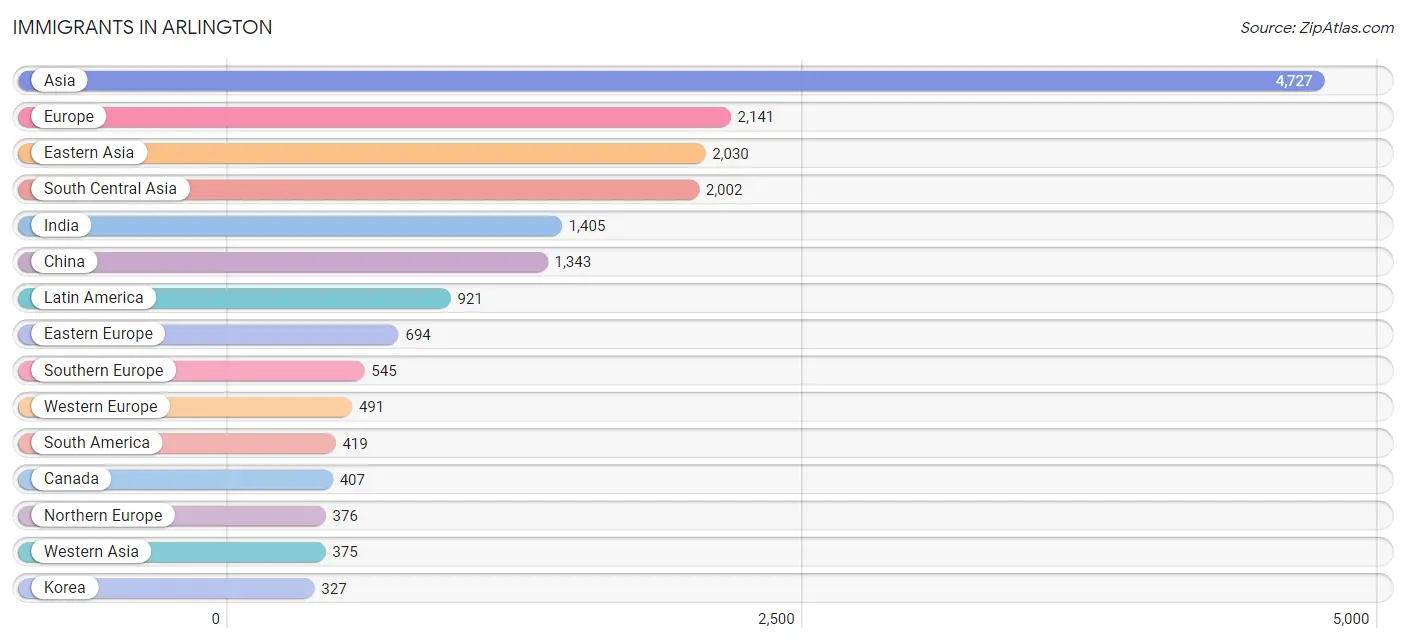
| Immigration Origin | # Population | % Population |
| Africa | 257 | 0.6% |
| Albania | 80 | 0.2% |
| Argentina | 32 | 0.1% |
| Armenia | 16 | 0.0% |
| Asia | 4,727 | 10.3% |
| Azores | 18 | 0.0% |
| Bangladesh | 82 | 0.2% |
| Belarus | 10 | 0.0% |
| Brazil | 106 | 0.2% |
| Bulgaria | 74 | 0.2% |
| Canada | 407 | 0.9% |
| Caribbean | 259 | 0.6% |
| Central America | 243 | 0.5% |
| Chile | 69 | 0.2% |
| China | 1,343 | 2.9% |
| Colombia | 75 | 0.2% |
| Cuba | 7 | 0.0% |
| Czechoslovakia | 20 | 0.0% |
| Denmark | 13 | 0.0% |
| Dominican Republic | 52 | 0.1% |
| Eastern Africa | 31 | 0.1% |
| Eastern Asia | 2,030 | 4.4% |
| Eastern Europe | 694 | 1.5% |
| El Salvador | 65 | 0.1% |
| England | 89 | 0.2% |
| Ethiopia | 16 | 0.0% |
| Europe | 2,141 | 4.7% |
| France | 250 | 0.5% |
| Germany | 159 | 0.4% |
| Ghana | 69 | 0.2% |
| Greece | 317 | 0.7% |
| Guatemala | 61 | 0.1% |
| Haiti | 93 | 0.2% |
| Honduras | 32 | 0.1% |
| Hong Kong | 111 | 0.2% |
| India | 1,405 | 3.1% |
| Indonesia | 65 | 0.1% |
| Iran | 138 | 0.3% |
| Ireland | 83 | 0.2% |
| Israel | 112 | 0.2% |
| Italy | 174 | 0.4% |
| Jamaica | 75 | 0.2% |
| Japan | 325 | 0.7% |
| Jordan | 6 | 0.0% |
| Kazakhstan | 15 | 0.0% |
| Kenya | 15 | 0.0% |
| Korea | 327 | 0.7% |
| Kuwait | 11 | 0.0% |
| Latin America | 921 | 2.0% |
| Lebanon | 30 | 0.1% |
| Liberia | 40 | 0.1% |
| Lithuania | 19 | 0.0% |
| Malaysia | 11 | 0.0% |
| Mexico | 85 | 0.2% |
| Morocco | 15 | 0.0% |
| Nepal | 193 | 0.4% |
| Netherlands | 82 | 0.2% |
| Northern Africa | 29 | 0.1% |
| Northern Europe | 376 | 0.8% |
| Norway | 20 | 0.0% |
| Oceania | 32 | 0.1% |
| Pakistan | 89 | 0.2% |
| Peru | 81 | 0.2% |
| Philippines | 67 | 0.2% |
| Poland | 105 | 0.2% |
| Portugal | 41 | 0.1% |
| Romania | 13 | 0.0% |
| Russia | 99 | 0.2% |
| Scotland | 61 | 0.1% |
| South Africa | 88 | 0.2% |
| South America | 419 | 0.9% |
| South Central Asia | 2,002 | 4.4% |
| South Eastern Asia | 320 | 0.7% |
| Southern Europe | 545 | 1.2% |
| Spain | 13 | 0.0% |
| Sri Lanka | 80 | 0.2% |
| Sweden | 60 | 0.1% |
| Syria | 84 | 0.2% |
| Taiwan | 102 | 0.2% |
| Thailand | 162 | 0.4% |
| Trinidad and Tobago | 6 | 0.0% |
| Turkey | 61 | 0.1% |
| Ukraine | 241 | 0.5% |
| Venezuela | 56 | 0.1% |
| Vietnam | 15 | 0.0% |
| Western Africa | 109 | 0.2% |
| Western Asia | 375 | 0.8% |
| Western Europe | 491 | 1.1% | View All 88 Rows |
Sex and Age in Arlington
Sex and Age in Arlington
The most populous age groups in Arlington are 30 to 34 Years (1,799 | 8.3%) for men and 30 to 34 Years (1,985 | 8.2%) for women.

| Age Bracket | Male | Female |
| Under 5 Years | 1,272 (5.9%) | 1,207 (5.0%) |
| 5 to 9 Years | 1,160 (5.3%) | 1,339 (5.5%) |
| 10 to 14 Years | 1,411 (6.5%) | 1,681 (7.0%) |
| 15 to 19 Years | 1,290 (5.9%) | 999 (4.1%) |
| 20 to 24 Years | 884 (4.1%) | 954 (3.9%) |
| 25 to 29 Years | 1,362 (6.3%) | 1,451 (6.0%) |
| 30 to 34 Years | 1,799 (8.3%) | 1,985 (8.2%) |
| 35 to 39 Years | 1,720 (7.9%) | 1,905 (7.9%) |
| 40 to 44 Years | 1,351 (6.2%) | 1,865 (7.7%) |
| 45 to 49 Years | 1,621 (7.5%) | 1,706 (7.0%) |
| 50 to 54 Years | 1,703 (7.8%) | 1,906 (7.9%) |
| 55 to 59 Years | 1,506 (6.9%) | 1,362 (5.6%) |
| 60 to 64 Years | 1,124 (5.2%) | 1,720 (7.1%) |
| 65 to 69 Years | 1,210 (5.6%) | 1,204 (5.0%) |
| 70 to 74 Years | 858 (4.0%) | 1,117 (4.6%) |
| 75 to 79 Years | 704 (3.2%) | 704 (2.9%) |
| 80 to 84 Years | 428 (2.0%) | 497 (2.1%) |
| 85 Years and over | 307 (1.4%) | 594 (2.5%) |
| Total | 21,710 (100.0%) | 24,196 (100.0%) |
Families and Households in Arlington
Median Family Size in Arlington
The median family size in Arlington is 2.97 persons per family, with married-couple families (9,626 | 81.0%) accounting for the largest median family size of 3.11 persons per family. On the other hand, single female/mother families (1,701 | 14.3%) represent the smallest median family size with 2.34 persons per family.
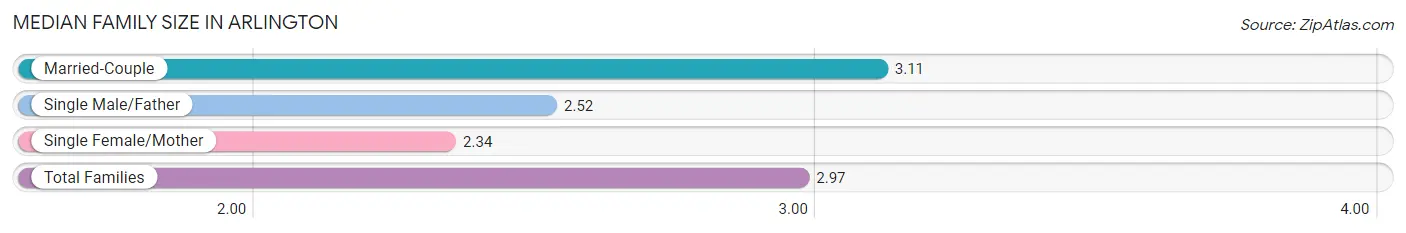
| Family Type | # Families | Family Size |
| Married-Couple | 9,626 (81.0%) | 3.11 |
| Single Male/Father | 551 (4.6%) | 2.52 |
| Single Female/Mother | 1,701 (14.3%) | 2.34 |
| Total Families | 11,878 (100.0%) | 2.97 |
Median Household Size in Arlington
The median household size in Arlington is 2.34 persons per household, with married-couple households (9,626 | 49.5%) accounting for the largest median household size of 3.14 persons per household. non-family households (7,573 | 38.9%) represent the smallest median household size with 1.28 persons per household.
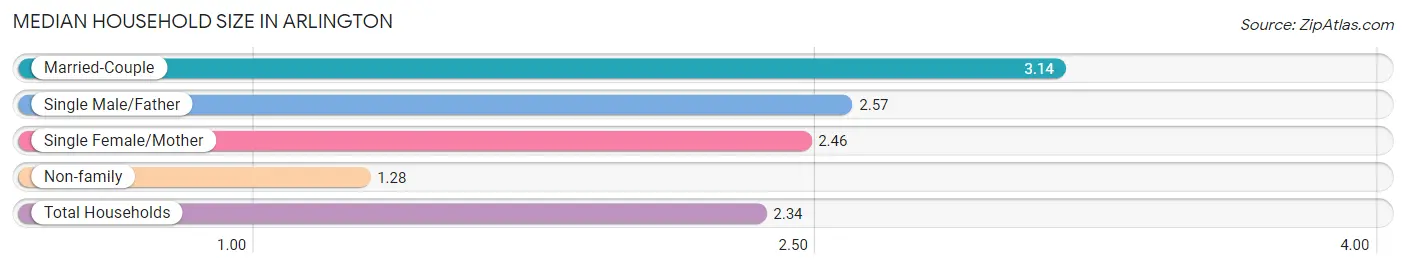
| Household Type | # Households | Household Size |
| Married-Couple | 9,626 (49.5%) | 3.14 |
| Single Male/Father | 551 (2.8%) | 2.57 |
| Single Female/Mother | 1,701 (8.7%) | 2.46 |
| Non-family | 7,573 (38.9%) | 1.28 |
| Total Households | 19,451 (100.0%) | 2.34 |
Household Size by Marriage Status in Arlington
Out of a total of 19,451 households in Arlington, 11,878 (61.1%) are family households, while 7,573 (38.9%) are nonfamily households. The most numerous type of family households are 2-person households, comprising 5,045, and the most common type of nonfamily households are 1-person households, comprising 6,028.
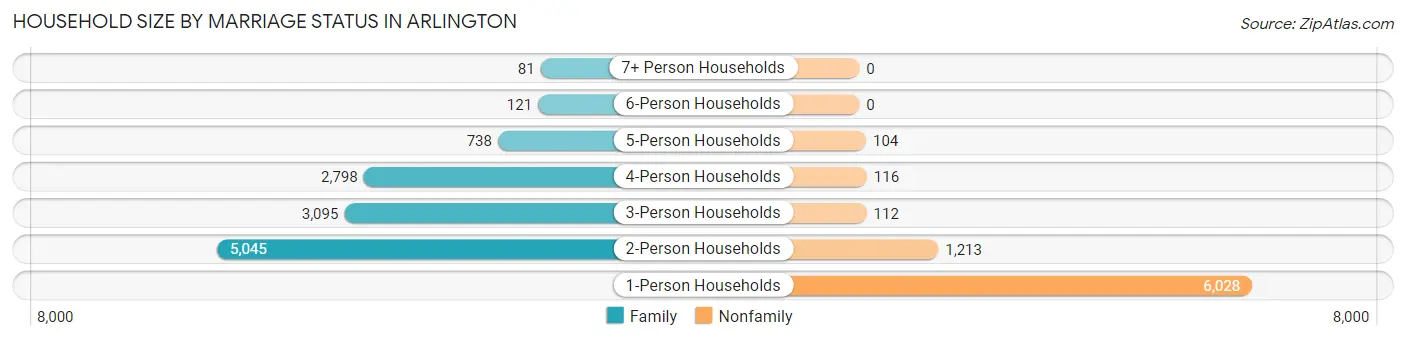
| Household Size | Family Households | Nonfamily Households |
| 1-Person Households | - | 6,028 (31.0%) |
| 2-Person Households | 5,045 (25.9%) | 1,213 (6.2%) |
| 3-Person Households | 3,095 (15.9%) | 112 (0.6%) |
| 4-Person Households | 2,798 (14.4%) | 116 (0.6%) |
| 5-Person Households | 738 (3.8%) | 104 (0.5%) |
| 6-Person Households | 121 (0.6%) | 0 (0.0%) |
| 7+ Person Households | 81 (0.4%) | 0 (0.0%) |
| Total | 11,878 (61.1%) | 7,573 (38.9%) |
Female Fertility in Arlington
Fertility by Age in Arlington
Average fertility rate in Arlington is 47.0 births per 1,000 women. Women in the age bracket of 20 to 34 years have the highest fertility rate with 64.0 births per 1,000 women. Women in the age bracket of 20 to 34 years acount for 53.5% of all women with births.
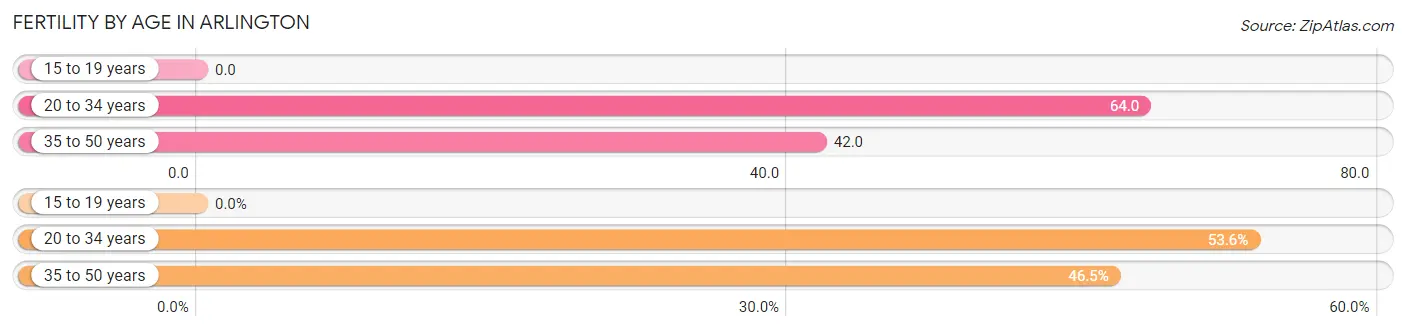
| Age Bracket | Women with Births | Births / 1,000 Women |
| 15 to 19 years | 0 (0.0%) | 0.0 |
| 20 to 34 years | 279 (53.5%) | 64.0 |
| 35 to 50 years | 242 (46.5%) | 42.0 |
| Total | 521 (100.0%) | 47.0 |
Fertility by Age by Marriage Status in Arlington
88.5% of women with births (521) in Arlington are married. The highest percentage of unmarried women with births falls into 20 to 34 years age bracket with 21.5% of them unmarried at the time of birth, while the lowest percentage of unmarried women with births belong to 35 to 50 years age bracket with 0.0% of them unmarried.
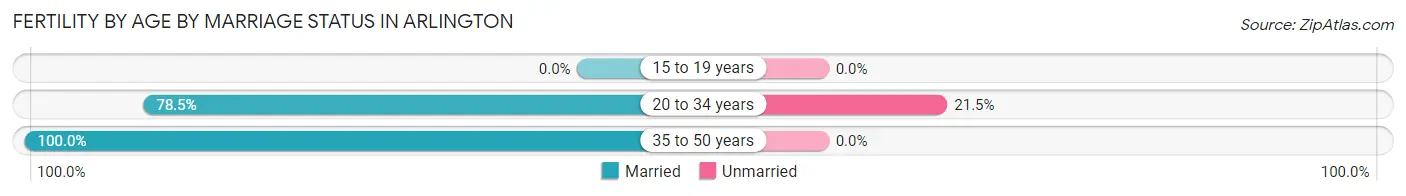
| Age Bracket | Married | Unmarried |
| 15 to 19 years | 0 (0.0%) | 0 (0.0%) |
| 20 to 34 years | 219 (78.5%) | 60 (21.5%) |
| 35 to 50 years | 242 (100.0%) | 0 (0.0%) |
| Total | 461 (88.5%) | 60 (11.5%) |
Fertility by Education in Arlington
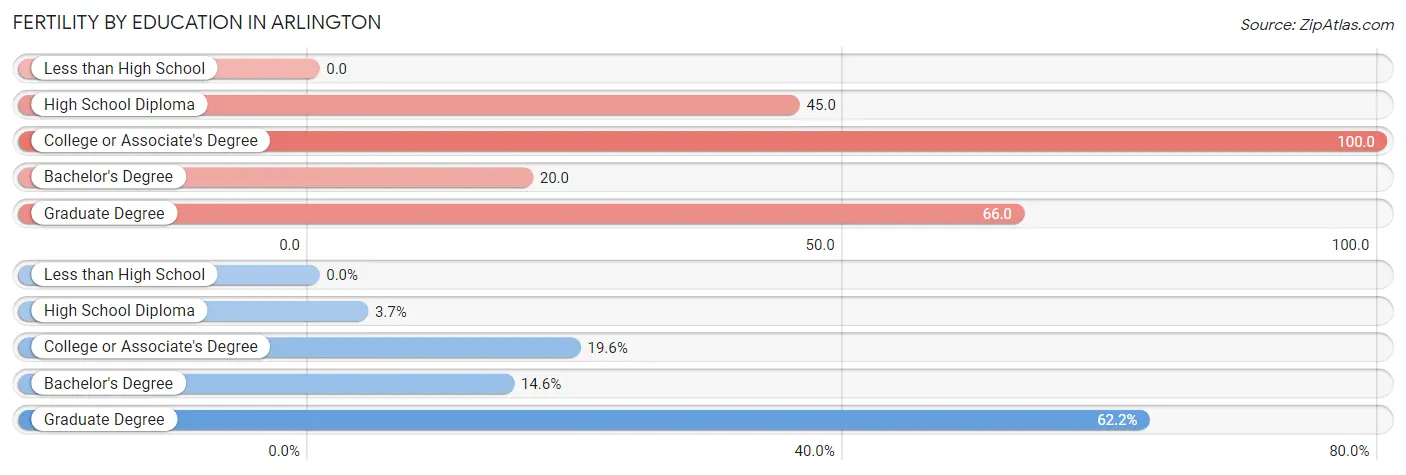
| Educational Attainment | Women with Births | Births / 1,000 Women |
| Less than High School | 0 (0.0%) | 0.0 |
| High School Diploma | 19 (3.6%) | 45.0 |
| College or Associate's Degree | 102 (19.6%) | 100.0 |
| Bachelor's Degree | 76 (14.6%) | 20.0 |
| Graduate Degree | 324 (62.2%) | 66.0 |
| Total | 521 (100.0%) | 47.0 |
Fertility by Education by Marriage Status in Arlington
11.5% of women with births in Arlington are unmarried. Women with the educational attainment of bachelor's degree are most likely to be married with 100.0% of them married at childbirth, while women with the educational attainment of high school diploma are least likely to be married with 100.0% of them unmarried at childbirth.
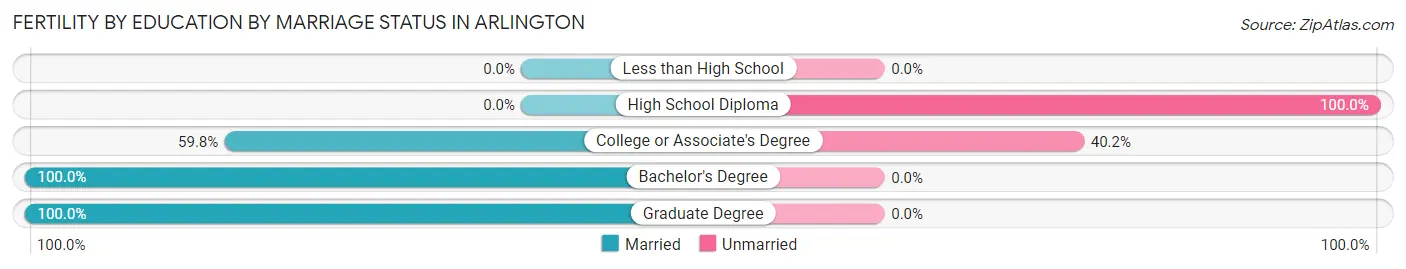
| Educational Attainment | Married | Unmarried |
| Less than High School | 0 (0.0%) | 0 (0.0%) |
| High School Diploma | 0 (0.0%) | 19 (100.0%) |
| College or Associate's Degree | 61 (59.8%) | 41 (40.2%) |
| Bachelor's Degree | 76 (100.0%) | 0 (0.0%) |
| Graduate Degree | 324 (100.0%) | 0 (0.0%) |
| Total | 461 (88.5%) | 60 (11.5%) |
Employment Characteristics in Arlington
Employment by Class of Employer in Arlington
Among the 26,128 employed individuals in Arlington, private company employees (15,802 | 60.5%), not-for-profit organizations (5,311 | 20.3%), and self-employed (not incorporated) (1,596 | 6.1%) make up the most common classes of employment.
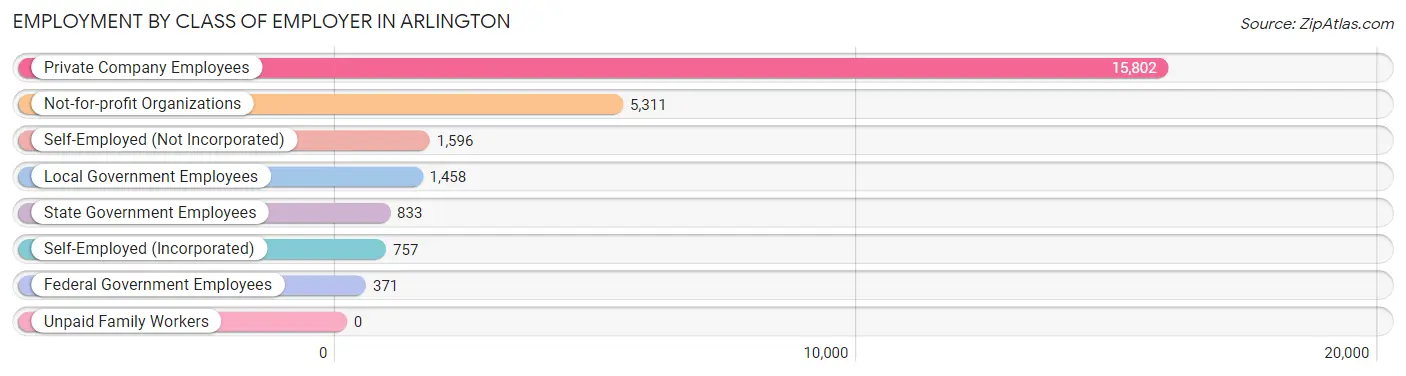
| Employer Class | # Employees | % Employees |
| Private Company Employees | 15,802 | 60.5% |
| Self-Employed (Incorporated) | 757 | 2.9% |
| Self-Employed (Not Incorporated) | 1,596 | 6.1% |
| Not-for-profit Organizations | 5,311 | 20.3% |
| Local Government Employees | 1,458 | 5.6% |
| State Government Employees | 833 | 3.2% |
| Federal Government Employees | 371 | 1.4% |
| Unpaid Family Workers | 0 | 0.0% |
| Total | 26,128 | 100.0% |
Employment Status by Age in Arlington
According to the labor force statistics for Arlington, out of the total population over 16 years of age (37,309), 73.3% or 27,347 individuals are in the labor force, with 3.6% or 984 of them unemployed. The age group with the highest labor force participation rate is 30 to 34 years, with 96.6% or 3,655 individuals in the labor force. Within the labor force, the 20 to 24 years age range has the highest percentage of unemployed individuals, with 13.9% or 201 of them being unemployed.
| Age Bracket | In Labor Force | Unemployed |
| 16 to 19 Years | 539 (30.6%) | 22 (4.1%) |
| 20 to 24 Years | 1,447 (78.7%) | 201 (13.9%) |
| 25 to 29 Years | 2,686 (95.5%) | 81 (3.0%) |
| 30 to 34 Years | 3,655 (96.6%) | 7 (0.2%) |
| 35 to 44 Years | 6,362 (93.0%) | 165 (2.6%) |
| 45 to 54 Years | 6,222 (89.7%) | 131 (2.1%) |
| 55 to 59 Years | 2,429 (84.7%) | 185 (7.6%) |
| 60 to 64 Years | 2,042 (71.8%) | 125 (6.1%) |
| 65 to 74 Years | 1,716 (39.1%) | 58 (3.4%) |
| 75 Years and over | 243 (7.5%) | 0 (0.0%) |
| Total | 27,347 (73.3%) | 984 (3.6%) |
Employment Status by Educational Attainment in Arlington
According to labor force statistics for Arlington, 89.7% of individuals (23,399) out of the total population between 25 and 64 years of age (26,086) are in the labor force, with 3.0% or 702 of them being unemployed. The group with the highest labor force participation rate are those with the educational attainment of bachelor's degree or higher, with 93.1% or 19,504 individuals in the labor force. Within the labor force, individuals with high school diploma education have the highest percentage of unemployment, with 8.9% or 119 of them being unemployed.
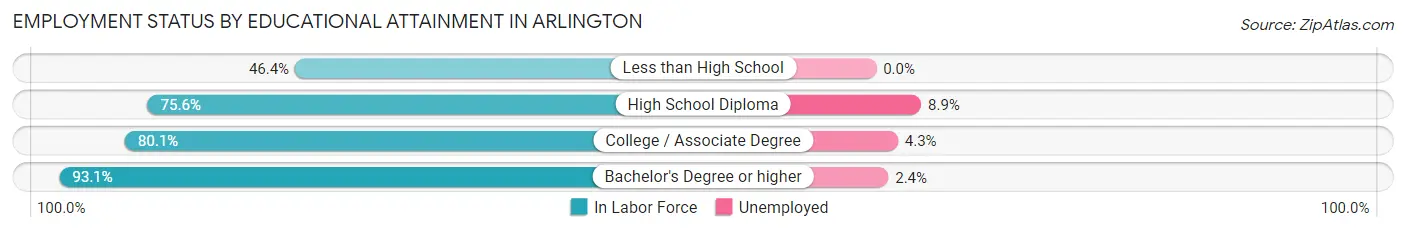
| Educational Attainment | In Labor Force | Unemployed |
| Less than High School | 182 (46.4%) | 0 (0.0%) |
| High School Diploma | 1,337 (75.6%) | 157 (8.9%) |
| College / Associate Degree | 2,384 (80.1%) | 128 (4.3%) |
| Bachelor's Degree or higher | 19,504 (93.1%) | 503 (2.4%) |
| Total | 23,399 (89.7%) | 783 (3.0%) |
Employment Occupations by Sex in Arlington
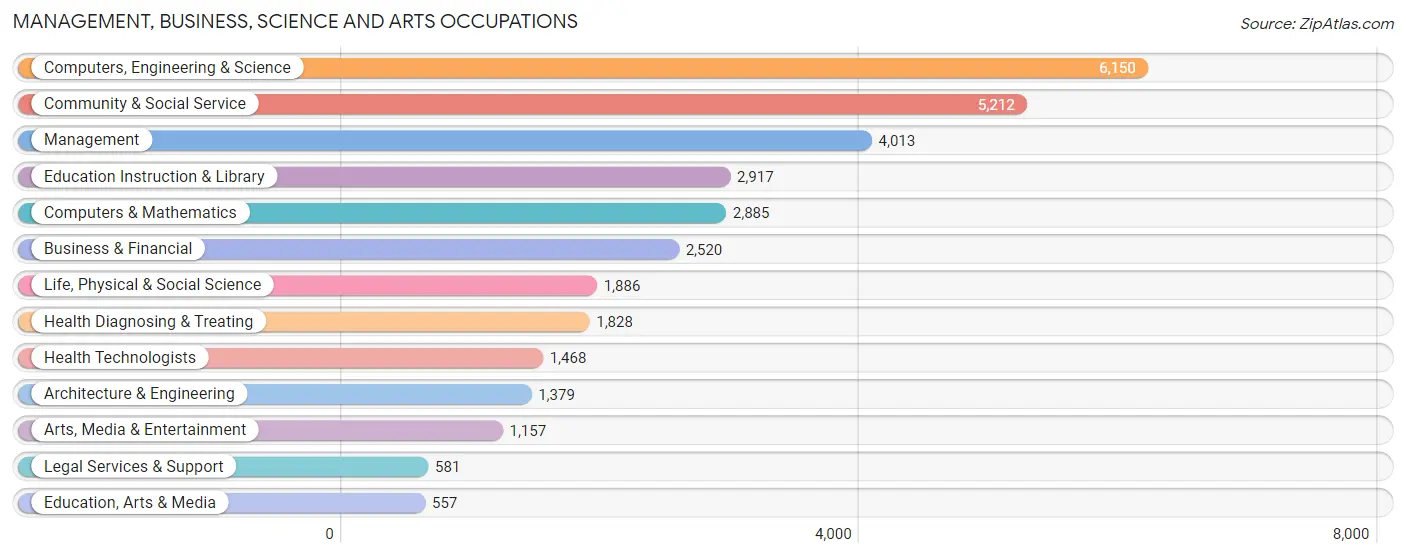
Management, Business, Science and Arts Occupations
The most common Management, Business, Science and Arts occupations in Arlington are Computers, Engineering & Science (6,150 | 23.3%), Community & Social Service (5,212 | 19.8%), Management (4,013 | 15.2%), Education Instruction & Library (2,917 | 11.1%), and Computers & Mathematics (2,885 | 10.9%).
Management, Business, Science and Arts Occupations by Sex
Within the Management, Business, Science and Arts occupations in Arlington, the most male-oriented occupations are Architecture & Engineering (81.8%), Computers & Mathematics (73.0%), and Computers, Engineering & Science (68.1%), while the most female-oriented occupations are Health Technologists (80.9%), Education, Arts & Media (79.2%), and Health Diagnosing & Treating (78.1%).
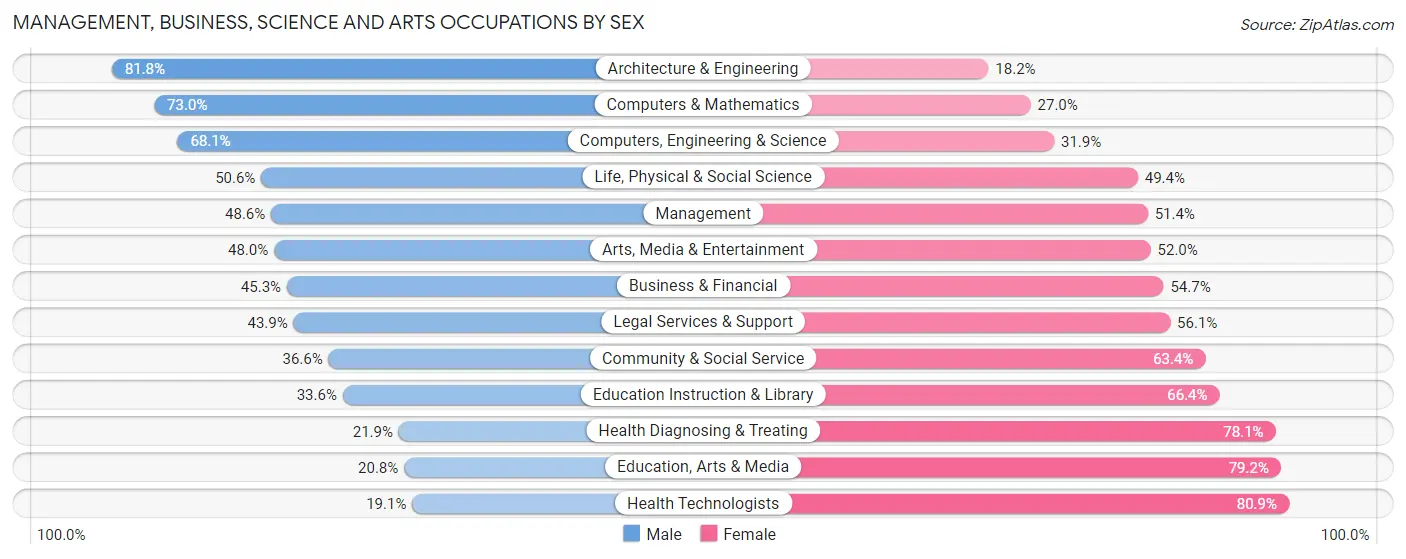
| Occupation | Male | Female |
| Management | 1,949 (48.6%) | 2,064 (51.4%) |
| Business & Financial | 1,141 (45.3%) | 1,379 (54.7%) |
| Computers, Engineering & Science | 4,189 (68.1%) | 1,961 (31.9%) |
| Computers & Mathematics | 2,106 (73.0%) | 779 (27.0%) |
| Architecture & Engineering | 1,128 (81.8%) | 251 (18.2%) |
| Life, Physical & Social Science | 955 (50.6%) | 931 (49.4%) |
| Community & Social Service | 1,907 (36.6%) | 3,305 (63.4%) |
| Education, Arts & Media | 116 (20.8%) | 441 (79.2%) |
| Legal Services & Support | 255 (43.9%) | 326 (56.1%) |
| Education Instruction & Library | 981 (33.6%) | 1,936 (66.4%) |
| Arts, Media & Entertainment | 555 (48.0%) | 602 (52.0%) |
| Health Diagnosing & Treating | 401 (21.9%) | 1,427 (78.1%) |
| Health Technologists | 281 (19.1%) | 1,187 (80.9%) |
| Total (Category) | 9,587 (48.6%) | 10,136 (51.4%) |
| Total (Overall) | 12,887 (48.9%) | 13,481 (51.1%) |
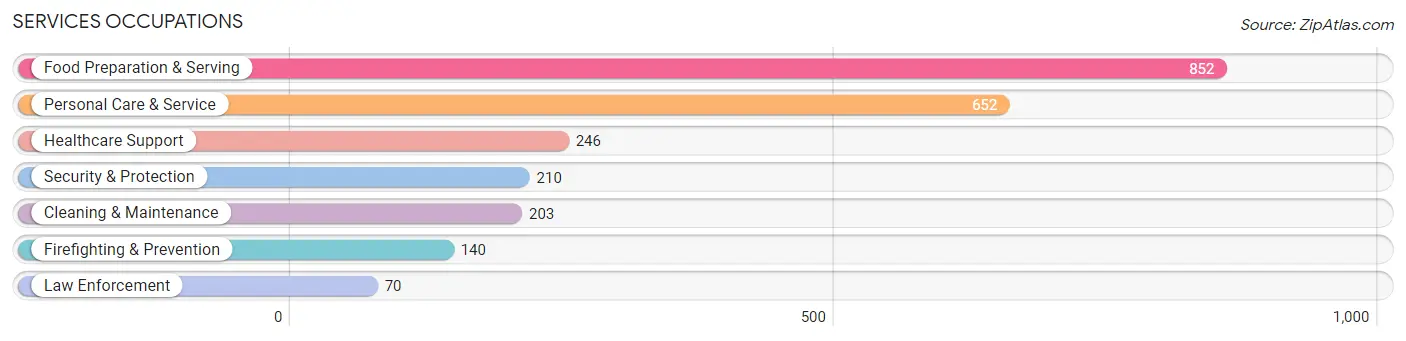
Services Occupations
The most common Services occupations in Arlington are Food Preparation & Serving (852 | 3.2%), Personal Care & Service (652 | 2.5%), Healthcare Support (246 | 0.9%), Security & Protection (210 | 0.8%), and Cleaning & Maintenance (203 | 0.8%).
Services Occupations by Sex
Within the Services occupations in Arlington, the most male-oriented occupations are Law Enforcement (88.6%), Cleaning & Maintenance (79.8%), and Security & Protection (77.1%), while the most female-oriented occupations are Healthcare Support (95.1%), Personal Care & Service (83.0%), and Food Preparation & Serving (49.1%).
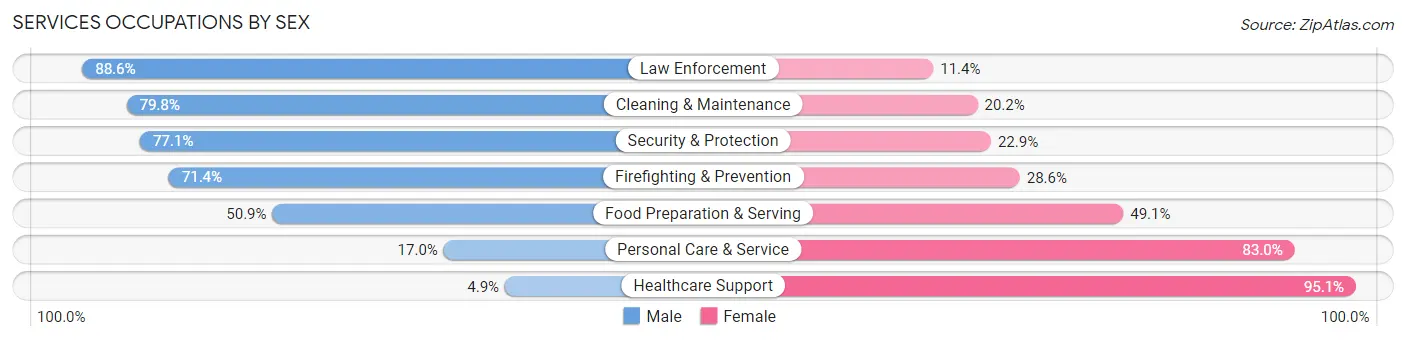
| Occupation | Male | Female |
| Healthcare Support | 12 (4.9%) | 234 (95.1%) |
| Security & Protection | 162 (77.1%) | 48 (22.9%) |
| Firefighting & Prevention | 100 (71.4%) | 40 (28.6%) |
| Law Enforcement | 62 (88.6%) | 8 (11.4%) |
| Food Preparation & Serving | 434 (50.9%) | 418 (49.1%) |
| Cleaning & Maintenance | 162 (79.8%) | 41 (20.2%) |
| Personal Care & Service | 111 (17.0%) | 541 (83.0%) |
| Total (Category) | 881 (40.7%) | 1,282 (59.3%) |
| Total (Overall) | 12,887 (48.9%) | 13,481 (51.1%) |
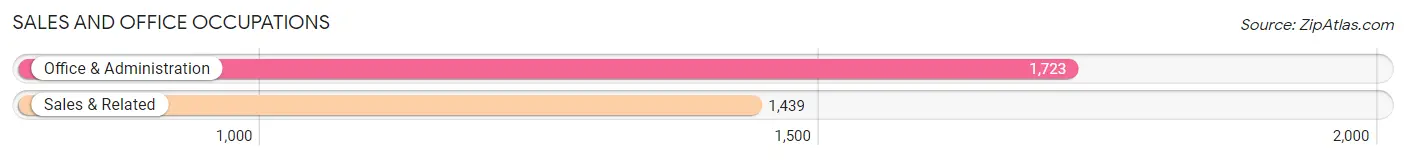
Sales and Office Occupations
The most common Sales and Office occupations in Arlington are Office & Administration (1,723 | 6.5%), and Sales & Related (1,439 | 5.5%).
Sales and Office Occupations by Sex
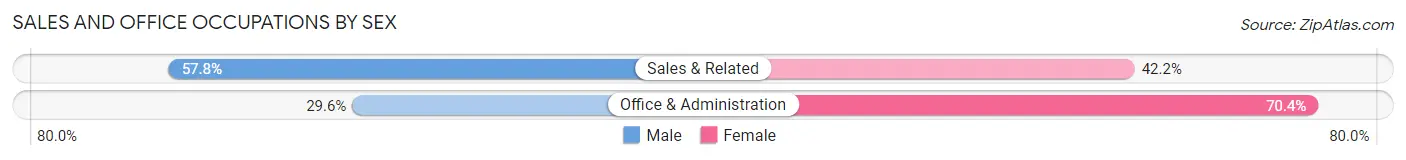
| Occupation | Male | Female |
| Sales & Related | 832 (57.8%) | 607 (42.2%) |
| Office & Administration | 510 (29.6%) | 1,213 (70.4%) |
| Total (Category) | 1,342 (42.4%) | 1,820 (57.6%) |
| Total (Overall) | 12,887 (48.9%) | 13,481 (51.1%) |
Natural Resources, Construction and Maintenance Occupations
The most common Natural Resources, Construction and Maintenance occupations in Arlington are Construction & Extraction (462 | 1.8%), Installation, Maintenance & Repair (115 | 0.4%), and Farming, Fishing & Forestry (84 | 0.3%).
Natural Resources, Construction and Maintenance Occupations by Sex
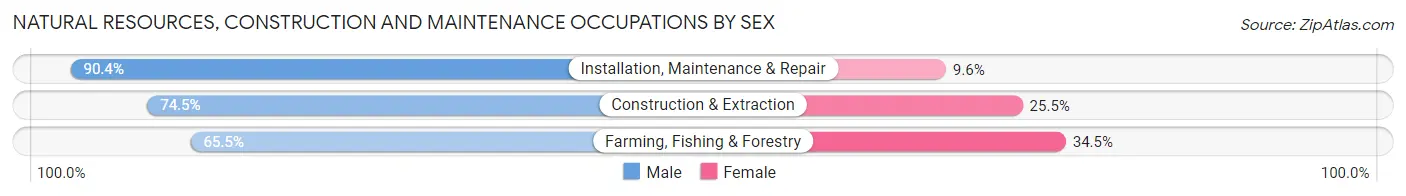
| Occupation | Male | Female |
| Farming, Fishing & Forestry | 55 (65.5%) | 29 (34.5%) |
| Construction & Extraction | 344 (74.5%) | 118 (25.5%) |
| Installation, Maintenance & Repair | 104 (90.4%) | 11 (9.6%) |
| Total (Category) | 503 (76.1%) | 158 (23.9%) |
| Total (Overall) | 12,887 (48.9%) | 13,481 (51.1%) |
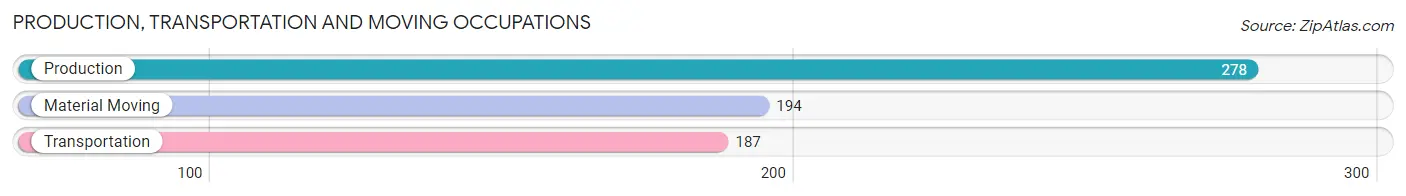
Production, Transportation and Moving Occupations
The most common Production, Transportation and Moving occupations in Arlington are Production (278 | 1.1%), Material Moving (194 | 0.7%), and Transportation (187 | 0.7%).
Production, Transportation and Moving Occupations by Sex
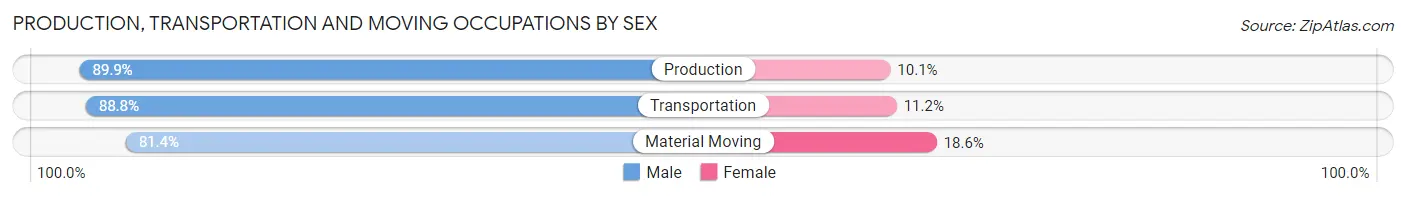
| Occupation | Male | Female |
| Production | 250 (89.9%) | 28 (10.1%) |
| Transportation | 166 (88.8%) | 21 (11.2%) |
| Material Moving | 158 (81.4%) | 36 (18.6%) |
| Total (Category) | 574 (87.1%) | 85 (12.9%) |
| Total (Overall) | 12,887 (48.9%) | 13,481 (51.1%) |
Employment Industries by Sex in Arlington
Employment Industries in Arlington
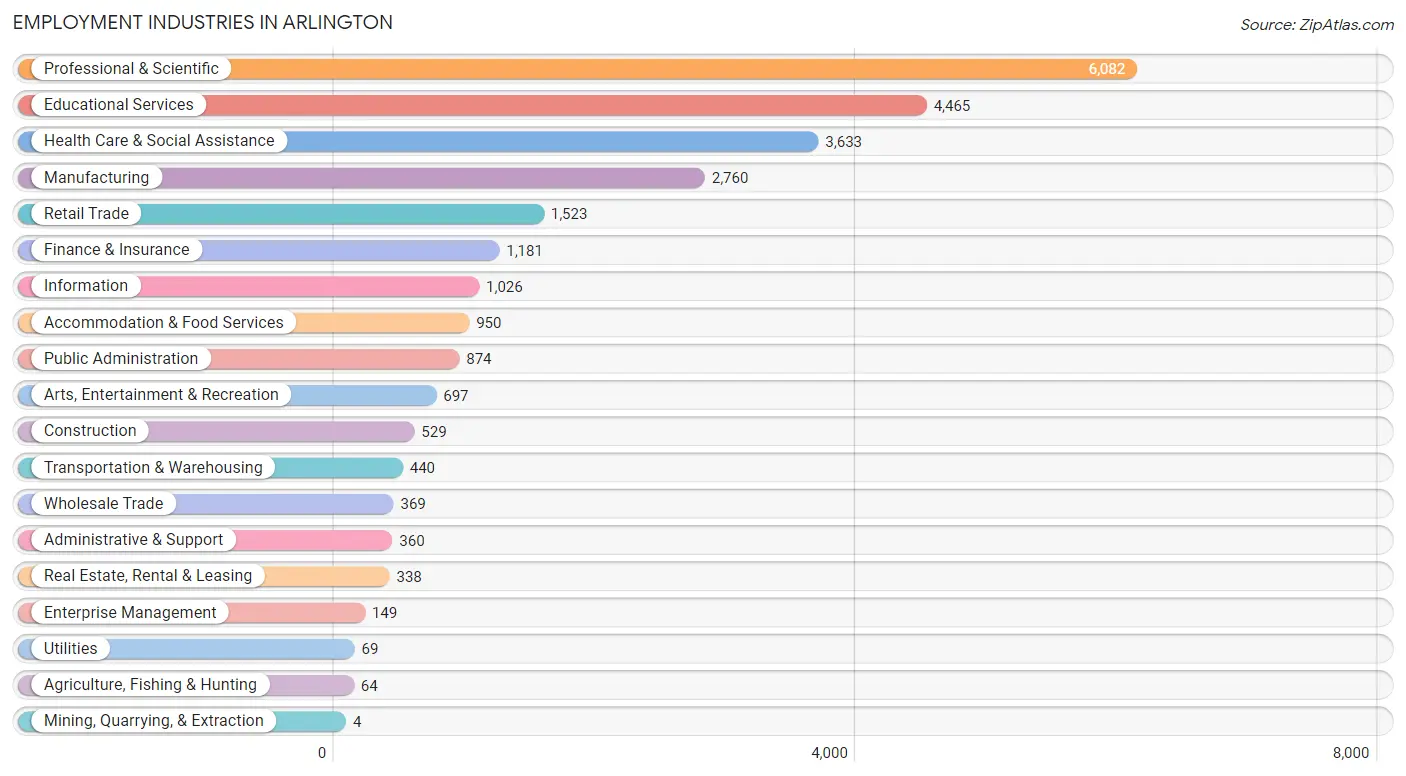
The major employment industries in Arlington include Professional & Scientific (6,082 | 23.1%), Educational Services (4,465 | 16.9%), Health Care & Social Assistance (3,633 | 13.8%), Manufacturing (2,760 | 10.5%), and Retail Trade (1,523 | 5.8%).
Employment Industries by Sex in Arlington
The Arlington industries that see more men than women are Enterprise Management (100.0%), Utilities (75.4%), and Transportation & Warehousing (75.2%), whereas the industries that tend to have a higher number of women are Mining, Quarrying, & Extraction (100.0%), Real Estate, Rental & Leasing (79.9%), and Health Care & Social Assistance (78.6%).
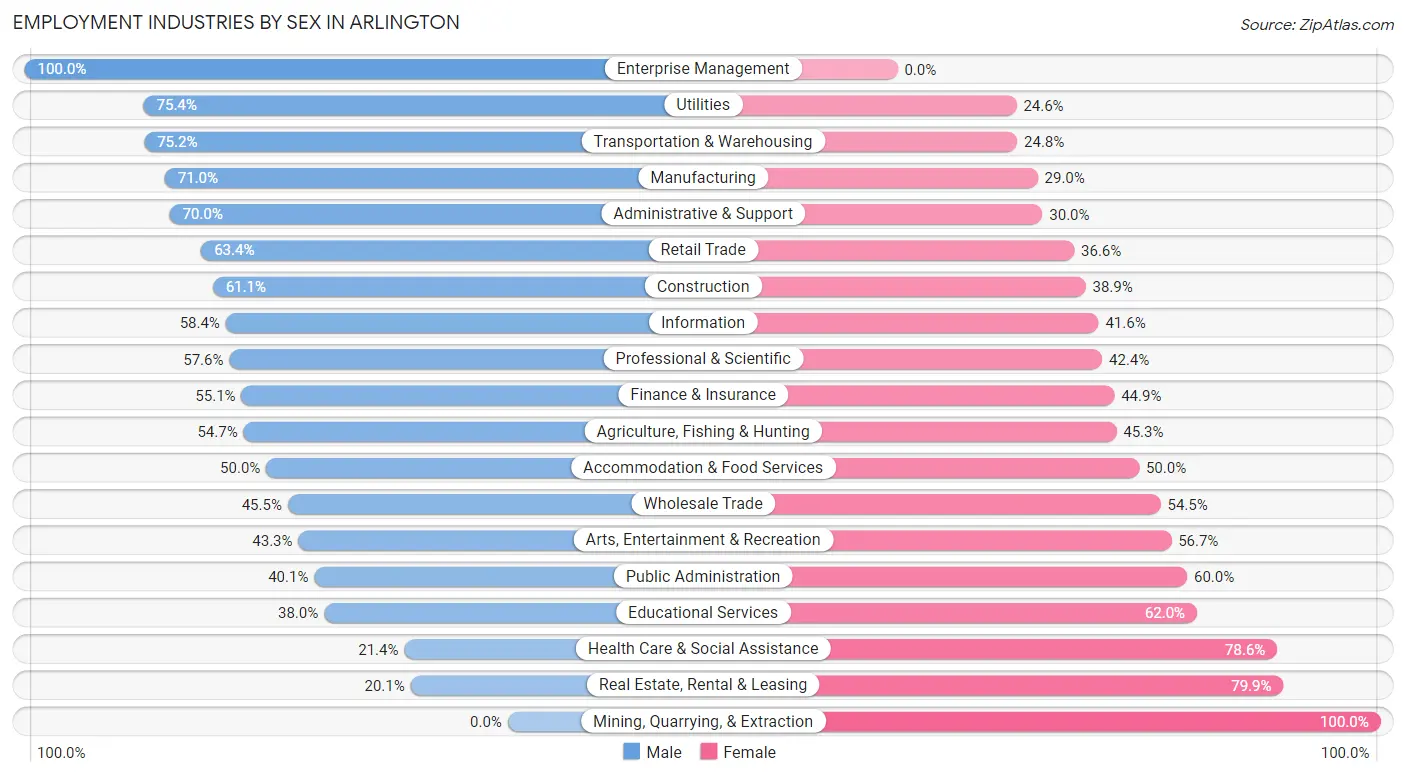
| Industry | Male | Female |
| Agriculture, Fishing & Hunting | 35 (54.7%) | 29 (45.3%) |
| Mining, Quarrying, & Extraction | 0 (0.0%) | 4 (100.0%) |
| Construction | 323 (61.1%) | 206 (38.9%) |
| Manufacturing | 1,959 (71.0%) | 801 (29.0%) |
| Wholesale Trade | 168 (45.5%) | 201 (54.5%) |
| Retail Trade | 966 (63.4%) | 557 (36.6%) |
| Transportation & Warehousing | 331 (75.2%) | 109 (24.8%) |
| Utilities | 52 (75.4%) | 17 (24.6%) |
| Information | 599 (58.4%) | 427 (41.6%) |
| Finance & Insurance | 651 (55.1%) | 530 (44.9%) |
| Real Estate, Rental & Leasing | 68 (20.1%) | 270 (79.9%) |
| Professional & Scientific | 3,505 (57.6%) | 2,577 (42.4%) |
| Enterprise Management | 149 (100.0%) | 0 (0.0%) |
| Administrative & Support | 252 (70.0%) | 108 (30.0%) |
| Educational Services | 1,697 (38.0%) | 2,768 (62.0%) |
| Health Care & Social Assistance | 778 (21.4%) | 2,855 (78.6%) |
| Arts, Entertainment & Recreation | 302 (43.3%) | 395 (56.7%) |
| Accommodation & Food Services | 475 (50.0%) | 475 (50.0%) |
| Public Administration | 350 (40.1%) | 524 (60.0%) |
| Total | 12,887 (48.9%) | 13,481 (51.1%) |
Education in Arlington
School Enrollment in Arlington
The most common levels of schooling among the 10,880 students in Arlington are middle school (2,373 | 21.8%), high school (2,124 | 19.5%), and elementary school (2,049 | 18.8%).
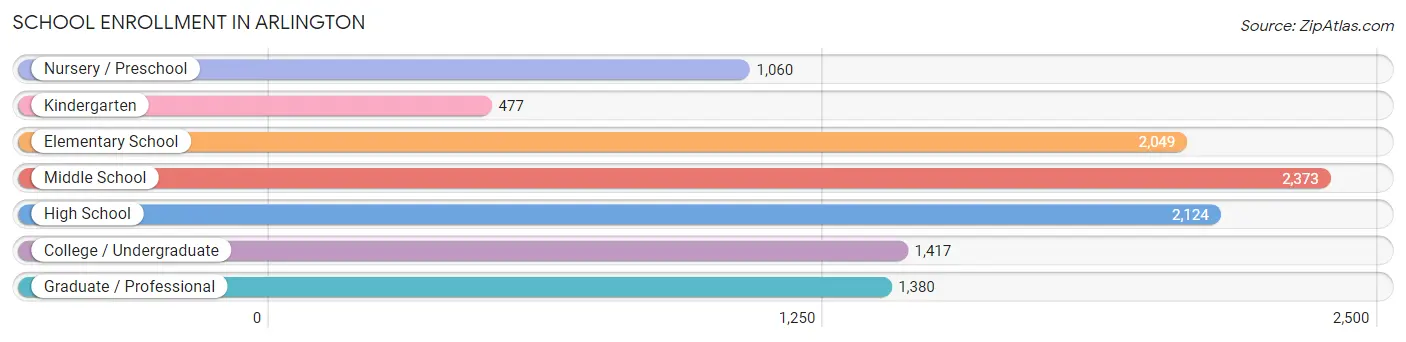
| School Level | # Students | % Students |
| Nursery / Preschool | 1,060 | 9.7% |
| Kindergarten | 477 | 4.4% |
| Elementary School | 2,049 | 18.8% |
| Middle School | 2,373 | 21.8% |
| High School | 2,124 | 19.5% |
| College / Undergraduate | 1,417 | 13.0% |
| Graduate / Professional | 1,380 | 12.7% |
| Total | 10,880 | 100.0% |
School Enrollment by Age by Funding Source in Arlington
Out of a total of 10,880 students who are enrolled in schools in Arlington, 3,580 (32.9%) attend a private institution, while the remaining 7,300 (67.1%) are enrolled in public schools. The age group of 25 to 34 year olds has the highest likelihood of being enrolled in private schools, with 687 (67.4% in the age bracket) enrolled. Conversely, the age group of 15 to 17 year olds has the lowest likelihood of being enrolled in a private school, with 1,526 (89.0% in the age bracket) attending a public institution.
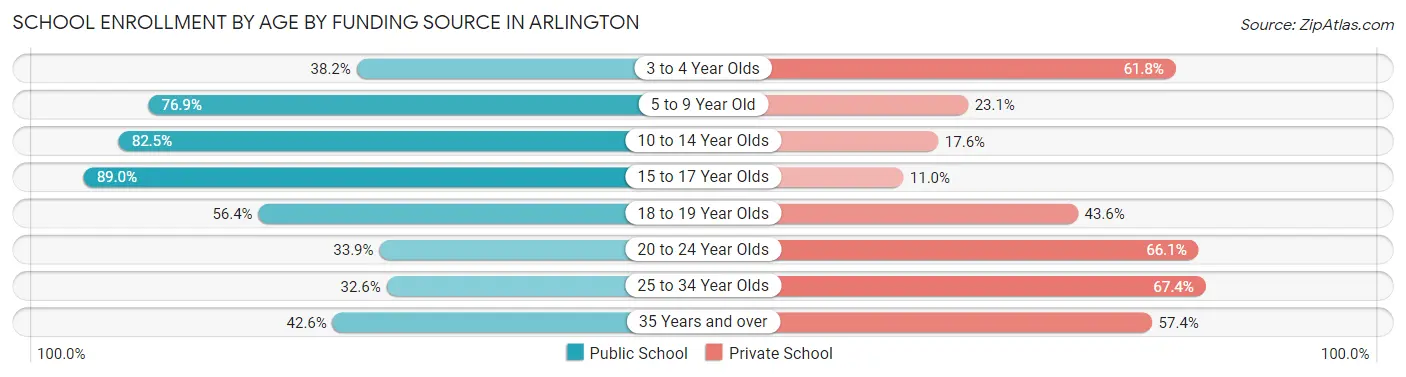
| Age Bracket | Public School | Private School |
| 3 to 4 Year Olds | 295 (38.2%) | 478 (61.8%) |
| 5 to 9 Year Old | 1,828 (76.9%) | 549 (23.1%) |
| 10 to 14 Year Olds | 2,462 (82.5%) | 524 (17.5%) |
| 15 to 17 Year Olds | 1,526 (89.0%) | 189 (11.0%) |
| 18 to 19 Year Olds | 263 (56.4%) | 203 (43.6%) |
| 20 to 24 Year Olds | 250 (33.9%) | 487 (66.1%) |
| 25 to 34 Year Olds | 332 (32.6%) | 687 (67.4%) |
| 35 Years and over | 344 (42.6%) | 463 (57.4%) |
| Total | 7,300 (67.1%) | 3,580 (32.9%) |
Educational Attainment by Field of Study in Arlington
Engineering (3,269 | 11.7%), business (3,007 | 10.8%), social sciences (3,004 | 10.8%), literature & languages (2,293 | 8.2%), and bio, nature & agricultural (2,245 | 8.1%) are the most common fields of study among 27,894 individuals in Arlington who have obtained a bachelor's degree or higher.
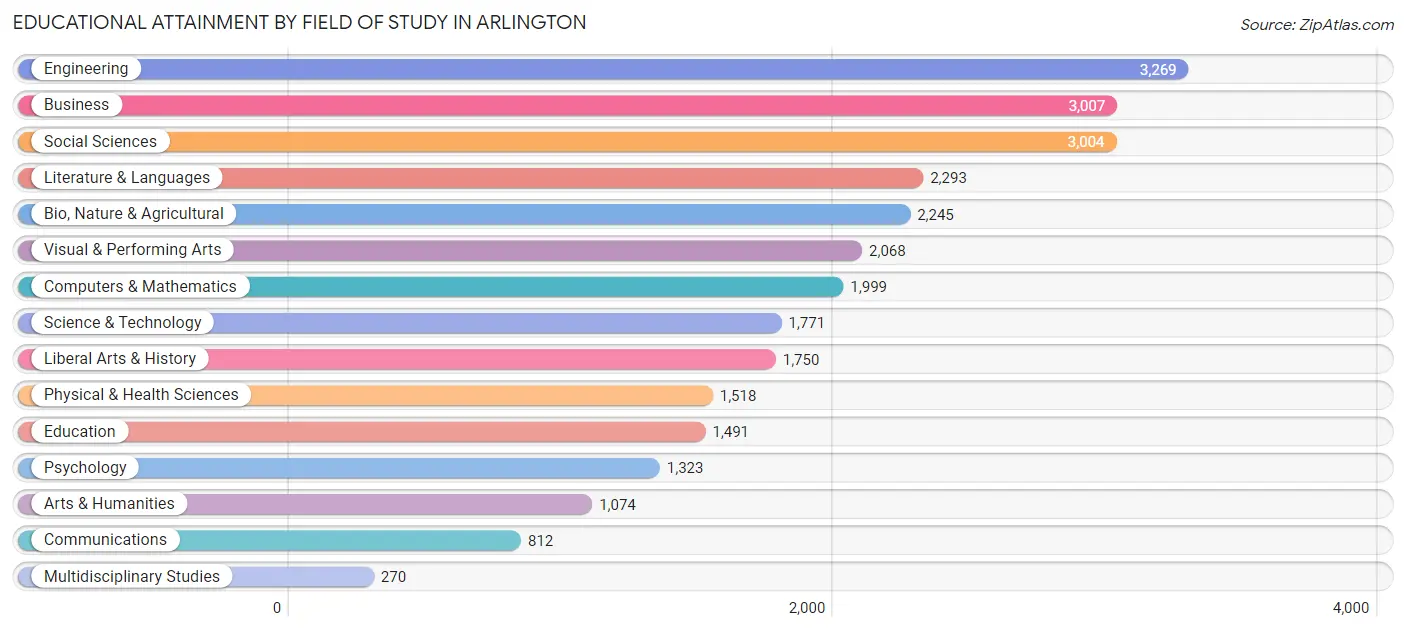
| Field of Study | # Graduates | % Graduates |
| Computers & Mathematics | 1,999 | 7.2% |
| Bio, Nature & Agricultural | 2,245 | 8.1% |
| Physical & Health Sciences | 1,518 | 5.4% |
| Psychology | 1,323 | 4.7% |
| Social Sciences | 3,004 | 10.8% |
| Engineering | 3,269 | 11.7% |
| Multidisciplinary Studies | 270 | 1.0% |
| Science & Technology | 1,771 | 6.4% |
| Business | 3,007 | 10.8% |
| Education | 1,491 | 5.3% |
| Literature & Languages | 2,293 | 8.2% |
| Liberal Arts & History | 1,750 | 6.3% |
| Visual & Performing Arts | 2,068 | 7.4% |
| Communications | 812 | 2.9% |
| Arts & Humanities | 1,074 | 3.8% |
| Total | 27,894 | 100.0% |
Transportation & Commute in Arlington
Vehicle Availability by Sex in Arlington
The most prevalent vehicle ownership categories in Arlington are males with 2 vehicles (5,870, accounting for 45.8%) and females with 2 vehicles (5,667, making up 44.2%).
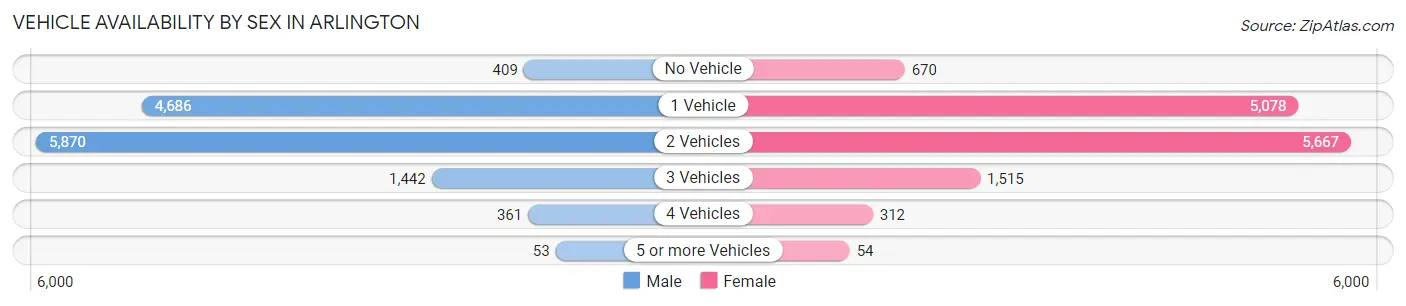
| Vehicles Available | Male | Female |
| No Vehicle | 409 (3.2%) | 670 (5.0%) |
| 1 Vehicle | 4,686 (36.5%) | 5,078 (38.2%) |
| 2 Vehicles | 5,870 (45.8%) | 5,667 (42.6%) |
| 3 Vehicles | 1,442 (11.3%) | 1,515 (11.4%) |
| 4 Vehicles | 361 (2.8%) | 312 (2.4%) |
| 5 or more Vehicles | 53 (0.4%) | 54 (0.4%) |
| Total | 12,821 (100.0%) | 13,296 (100.0%) |
Commute Time in Arlington
The most frequently occuring commute durations in Arlington are 30 to 34 minutes (3,196 commuters, 16.6%), 45 to 59 minutes (2,887 commuters, 15.0%), and 20 to 24 minutes (2,462 commuters, 12.8%).
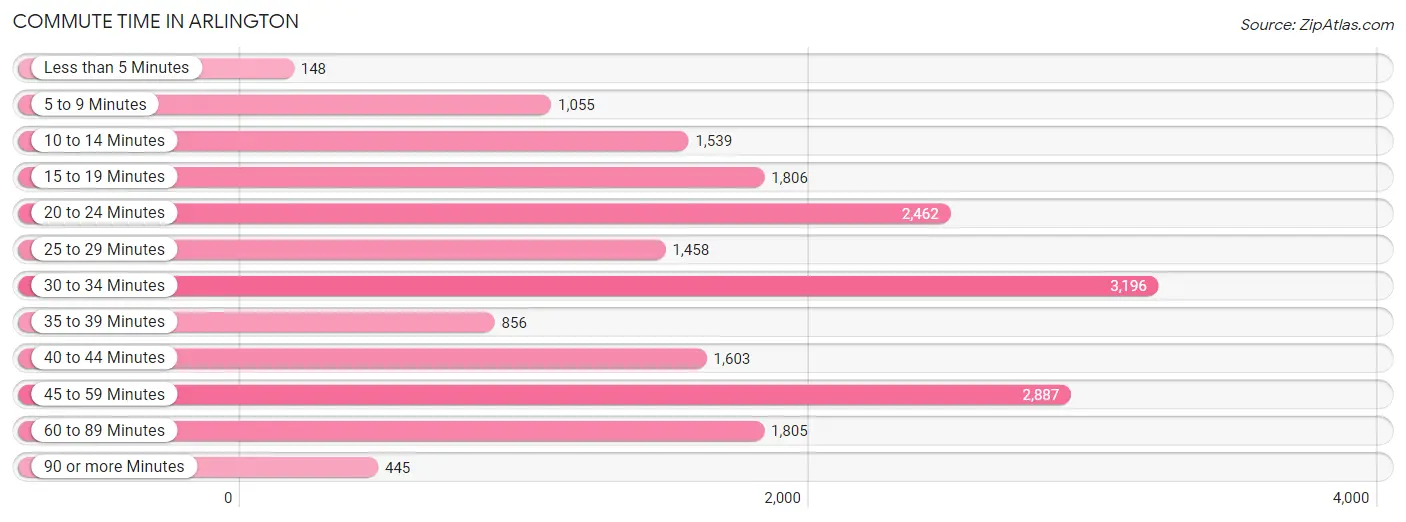
| Commute Time | # Commuters | % Commuters |
| Less than 5 Minutes | 148 | 0.8% |
| 5 to 9 Minutes | 1,055 | 5.5% |
| 10 to 14 Minutes | 1,539 | 8.0% |
| 15 to 19 Minutes | 1,806 | 9.4% |
| 20 to 24 Minutes | 2,462 | 12.8% |
| 25 to 29 Minutes | 1,458 | 7.6% |
| 30 to 34 Minutes | 3,196 | 16.6% |
| 35 to 39 Minutes | 856 | 4.4% |
| 40 to 44 Minutes | 1,603 | 8.3% |
| 45 to 59 Minutes | 2,887 | 15.0% |
| 60 to 89 Minutes | 1,805 | 9.4% |
| 90 or more Minutes | 445 | 2.3% |
Commute Time by Sex in Arlington
The most common commute times in Arlington are 30 to 34 minutes (1,944 commuters, 20.4%) for males and 45 to 59 minutes (1,463 commuters, 15.0%) for females.
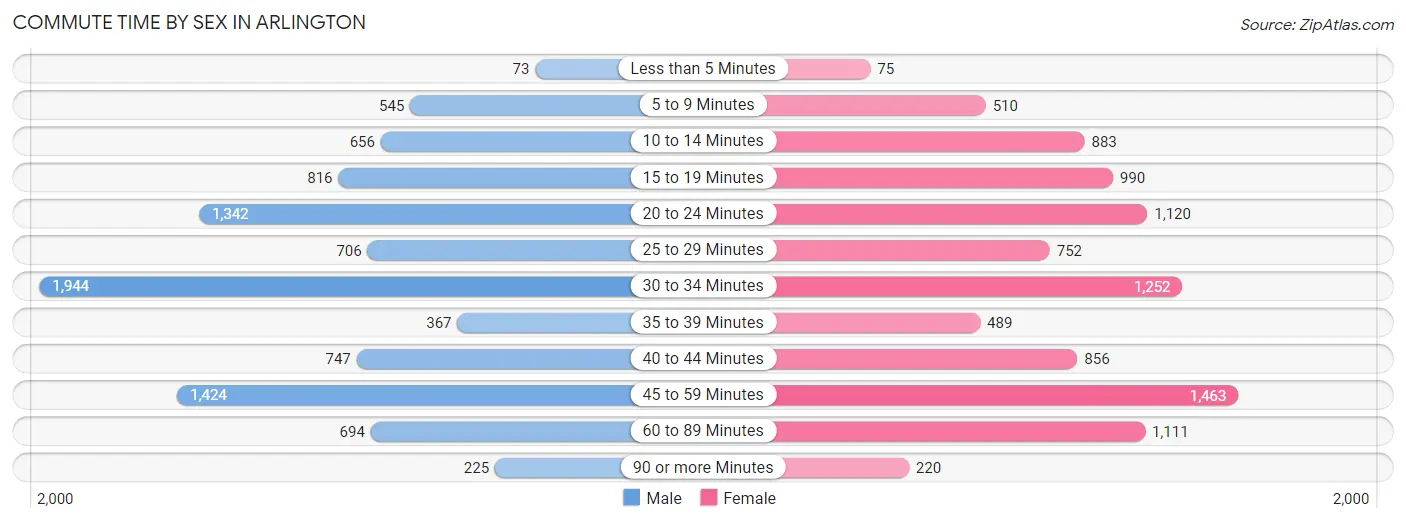
| Commute Time | Male | Female |
| Less than 5 Minutes | 73 (0.8%) | 75 (0.8%) |
| 5 to 9 Minutes | 545 (5.7%) | 510 (5.2%) |
| 10 to 14 Minutes | 656 (6.9%) | 883 (9.1%) |
| 15 to 19 Minutes | 816 (8.6%) | 990 (10.2%) |
| 20 to 24 Minutes | 1,342 (14.1%) | 1,120 (11.5%) |
| 25 to 29 Minutes | 706 (7.4%) | 752 (7.7%) |
| 30 to 34 Minutes | 1,944 (20.4%) | 1,252 (12.9%) |
| 35 to 39 Minutes | 367 (3.8%) | 489 (5.0%) |
| 40 to 44 Minutes | 747 (7.8%) | 856 (8.8%) |
| 45 to 59 Minutes | 1,424 (14.9%) | 1,463 (15.0%) |
| 60 to 89 Minutes | 694 (7.3%) | 1,111 (11.4%) |
| 90 or more Minutes | 225 (2.4%) | 220 (2.3%) |
Time of Departure to Work by Sex in Arlington
The most frequent times of departure to work in Arlington are 7:30 AM to 7:59 AM (1,649, 17.3%) for males and 8:00 AM to 8:29 AM (1,729, 17.8%) for females.
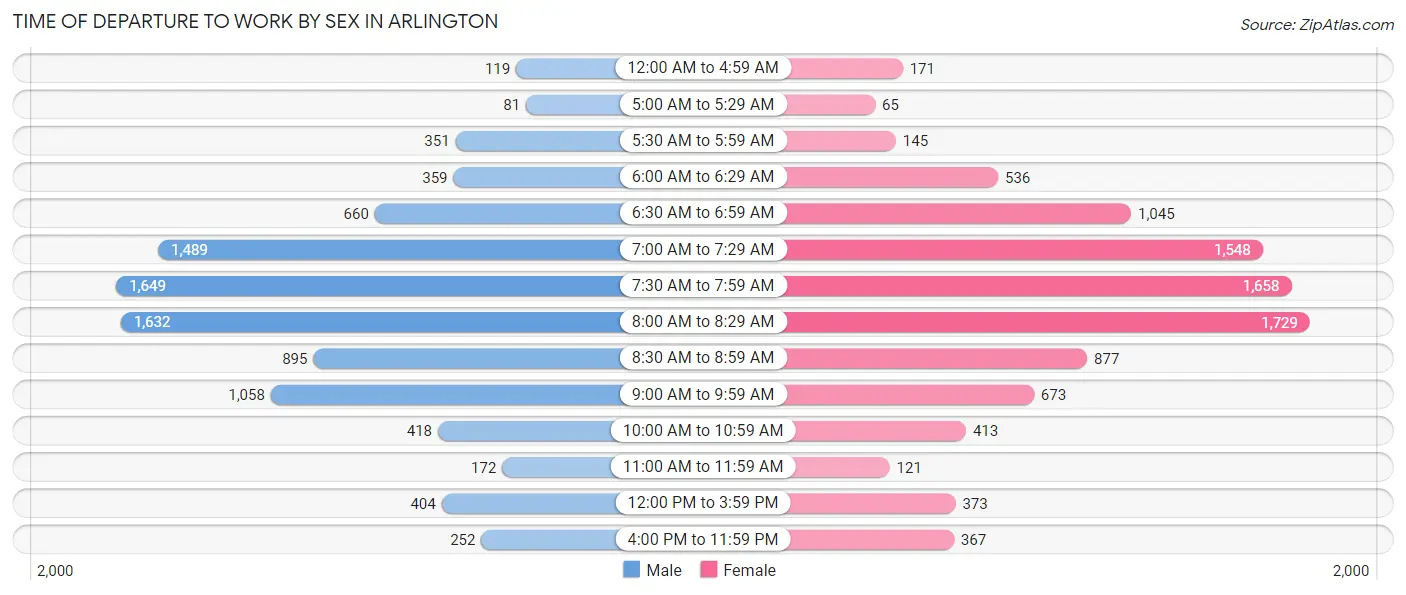
| Time of Departure | Male | Female |
| 12:00 AM to 4:59 AM | 119 (1.3%) | 171 (1.8%) |
| 5:00 AM to 5:29 AM | 81 (0.9%) | 65 (0.7%) |
| 5:30 AM to 5:59 AM | 351 (3.7%) | 145 (1.5%) |
| 6:00 AM to 6:29 AM | 359 (3.8%) | 536 (5.5%) |
| 6:30 AM to 6:59 AM | 660 (6.9%) | 1,045 (10.7%) |
| 7:00 AM to 7:29 AM | 1,489 (15.6%) | 1,548 (15.9%) |
| 7:30 AM to 7:59 AM | 1,649 (17.3%) | 1,658 (17.1%) |
| 8:00 AM to 8:29 AM | 1,632 (17.1%) | 1,729 (17.8%) |
| 8:30 AM to 8:59 AM | 895 (9.4%) | 877 (9.0%) |
| 9:00 AM to 9:59 AM | 1,058 (11.1%) | 673 (6.9%) |
| 10:00 AM to 10:59 AM | 418 (4.4%) | 413 (4.3%) |
| 11:00 AM to 11:59 AM | 172 (1.8%) | 121 (1.2%) |
| 12:00 PM to 3:59 PM | 404 (4.2%) | 373 (3.8%) |
| 4:00 PM to 11:59 PM | 252 (2.6%) | 367 (3.8%) |
| Total | 9,539 (100.0%) | 9,721 (100.0%) |
Housing Occupancy in Arlington
Occupancy by Ownership in Arlington
Of the total 19,451 dwellings in Arlington, owner-occupied units account for 11,812 (60.7%), while renter-occupied units make up 7,639 (39.3%).
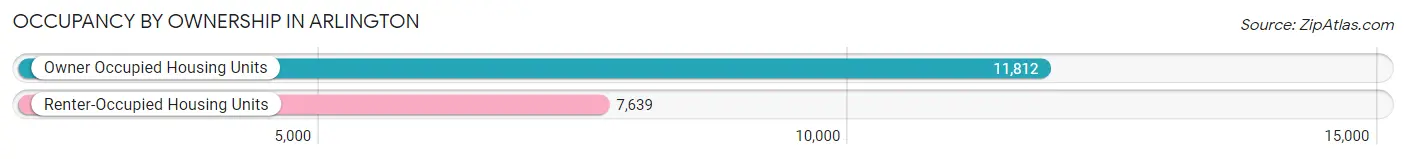
| Occupancy | # Housing Units | % Housing Units |
| Owner Occupied Housing Units | 11,812 | 60.7% |
| Renter-Occupied Housing Units | 7,639 | 39.3% |
| Total Occupied Housing Units | 19,451 | 100.0% |
Occupancy by Household Size in Arlington
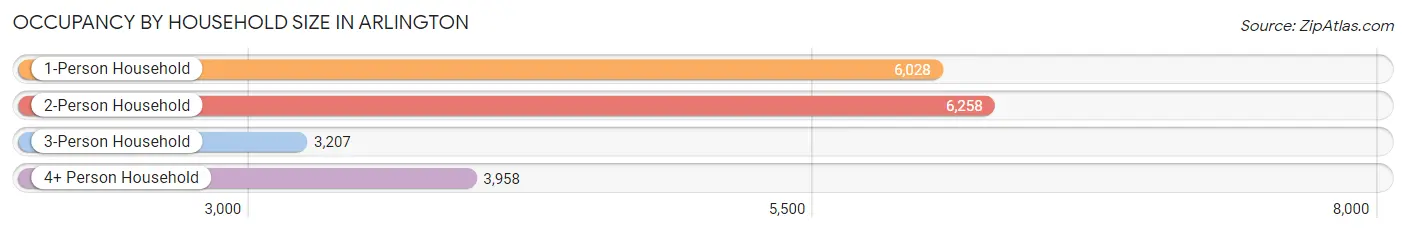
| Household Size | # Housing Units | % Housing Units |
| 1-Person Household | 6,028 | 31.0% |
| 2-Person Household | 6,258 | 32.2% |
| 3-Person Household | 3,207 | 16.5% |
| 4+ Person Household | 3,958 | 20.3% |
| Total Housing Units | 19,451 | 100.0% |
Occupancy by Ownership by Household Size in Arlington
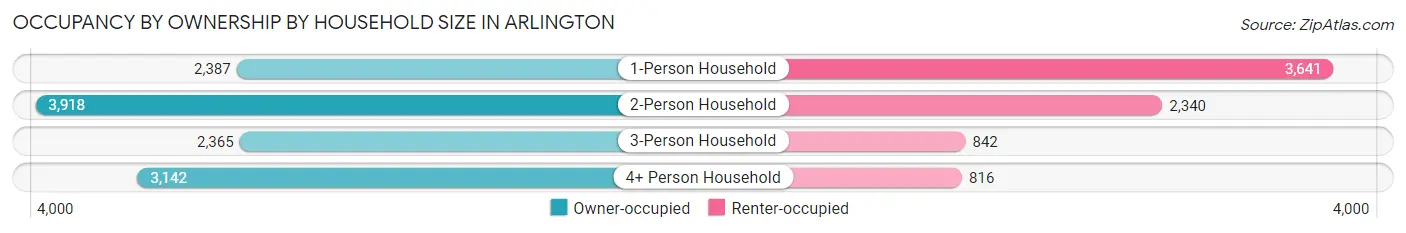
| Household Size | Owner-occupied | Renter-occupied |
| 1-Person Household | 2,387 (39.6%) | 3,641 (60.4%) |
| 2-Person Household | 3,918 (62.6%) | 2,340 (37.4%) |
| 3-Person Household | 2,365 (73.7%) | 842 (26.3%) |
| 4+ Person Household | 3,142 (79.4%) | 816 (20.6%) |
| Total Housing Units | 11,812 (60.7%) | 7,639 (39.3%) |
Occupancy by Educational Attainment in Arlington
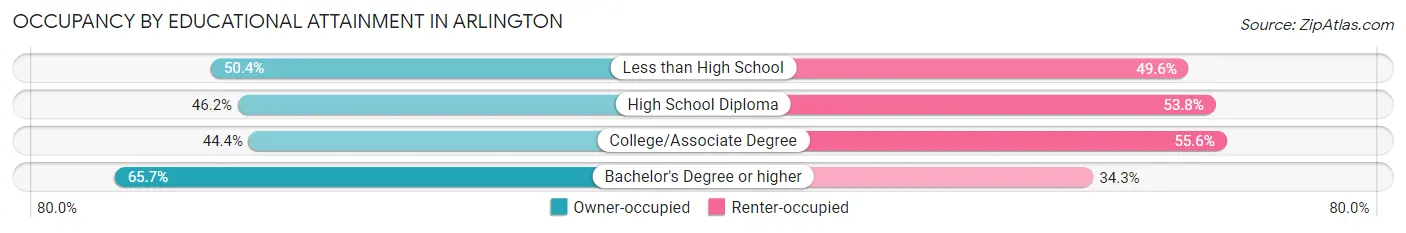
| Household Size | Owner-occupied | Renter-occupied |
| Less than High School | 172 (50.4%) | 169 (49.6%) |
| High School Diploma | 1,024 (46.2%) | 1,194 (53.8%) |
| College/Associate Degree | 1,007 (44.4%) | 1,259 (55.6%) |
| Bachelor's Degree or higher | 9,609 (65.7%) | 5,017 (34.3%) |
Occupancy by Age of Householder in Arlington
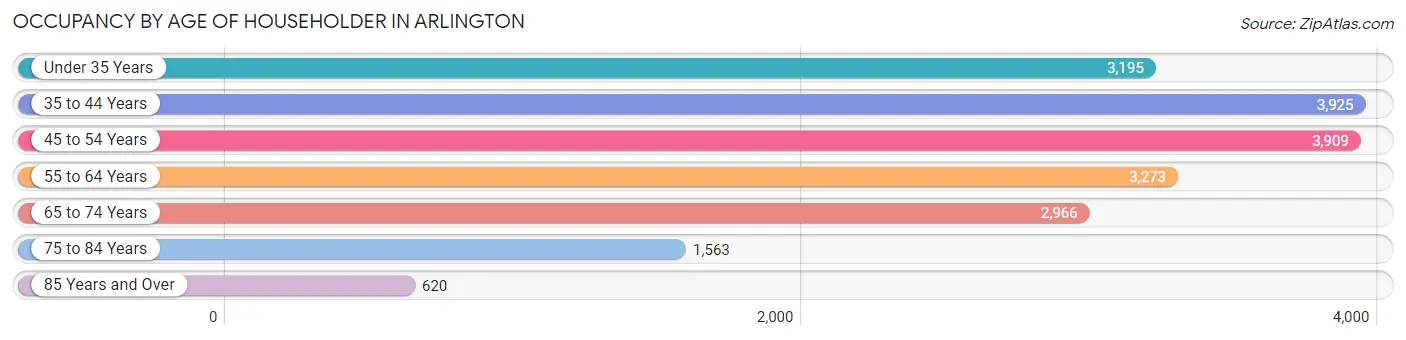
| Age Bracket | # Households | % Households |
| Under 35 Years | 3,195 | 16.4% |
| 35 to 44 Years | 3,925 | 20.2% |
| 45 to 54 Years | 3,909 | 20.1% |
| 55 to 64 Years | 3,273 | 16.8% |
| 65 to 74 Years | 2,966 | 15.2% |
| 75 to 84 Years | 1,563 | 8.0% |
| 85 Years and Over | 620 | 3.2% |
| Total | 19,451 | 100.0% |
Housing Finances in Arlington
Median Income by Occupancy in Arlington
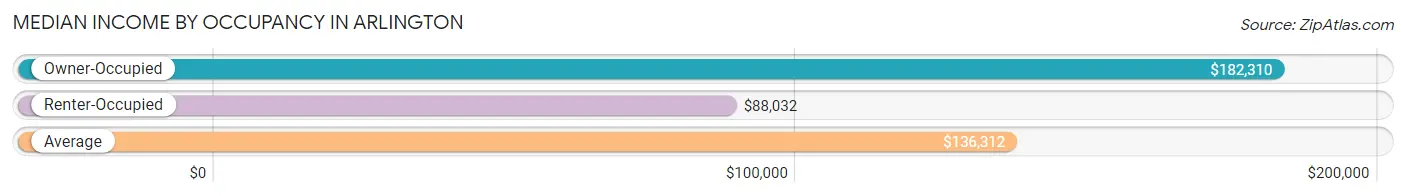
| Occupancy Type | # Households | Median Income |
| Owner-Occupied | 11,812 (60.7%) | $182,310 |
| Renter-Occupied | 7,639 (39.3%) | $88,032 |
| Average | 19,451 (100.0%) | $136,312 |
Occupancy by Householder Income Bracket in Arlington
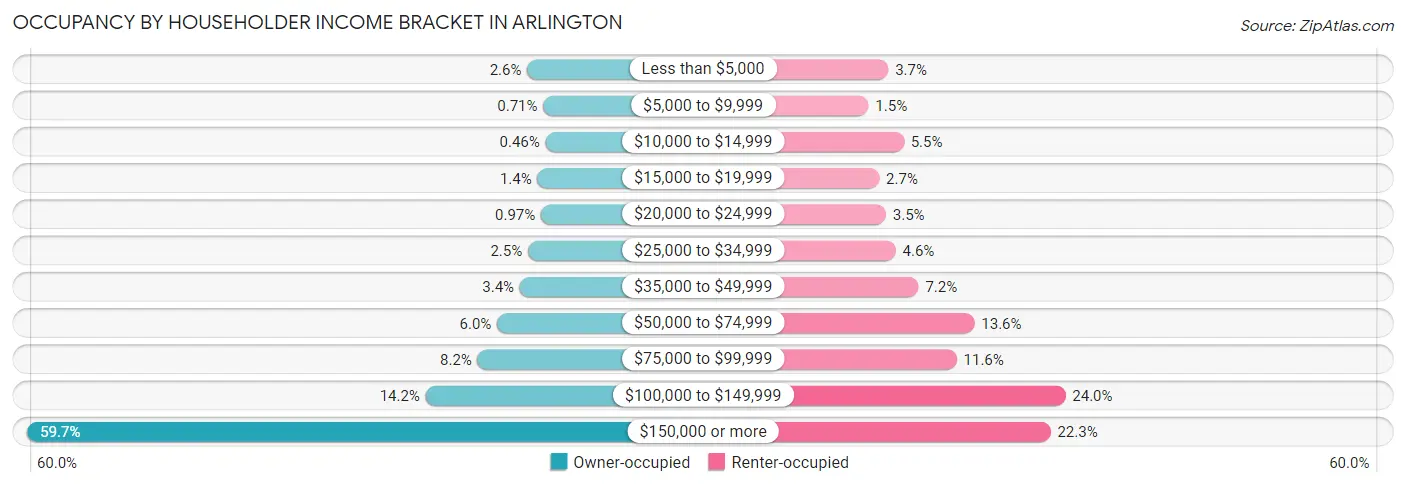
| Income Bracket | Owner-occupied | Renter-occupied |
| Less than $5,000 | 301 (2.5%) | 285 (3.7%) |
| $5,000 to $9,999 | 84 (0.7%) | 112 (1.5%) |
| $10,000 to $14,999 | 54 (0.5%) | 420 (5.5%) |
| $15,000 to $19,999 | 163 (1.4%) | 206 (2.7%) |
| $20,000 to $24,999 | 115 (1.0%) | 264 (3.5%) |
| $25,000 to $34,999 | 291 (2.5%) | 350 (4.6%) |
| $35,000 to $49,999 | 400 (3.4%) | 549 (7.2%) |
| $50,000 to $74,999 | 707 (6.0%) | 1,037 (13.6%) |
| $75,000 to $99,999 | 971 (8.2%) | 882 (11.6%) |
| $100,000 to $149,999 | 1,672 (14.2%) | 1,832 (24.0%) |
| $150,000 or more | 7,054 (59.7%) | 1,702 (22.3%) |
| Total | 11,812 (100.0%) | 7,639 (100.0%) |
Monthly Housing Cost Tiers in Arlington
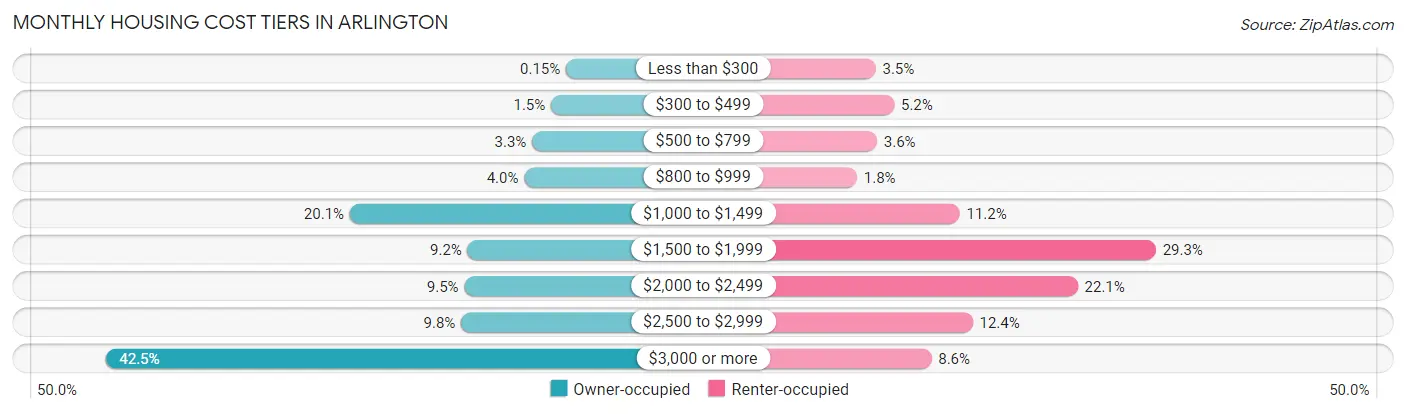
| Monthly Cost | Owner-occupied | Renter-occupied |
| Less than $300 | 18 (0.2%) | 268 (3.5%) |
| $300 to $499 | 181 (1.5%) | 398 (5.2%) |
| $500 to $799 | 386 (3.3%) | 277 (3.6%) |
| $800 to $999 | 473 (4.0%) | 137 (1.8%) |
| $1,000 to $1,499 | 2,368 (20.1%) | 859 (11.2%) |
| $1,500 to $1,999 | 1,088 (9.2%) | 2,238 (29.3%) |
| $2,000 to $2,499 | 1,123 (9.5%) | 1,689 (22.1%) |
| $2,500 to $2,999 | 1,159 (9.8%) | 950 (12.4%) |
| $3,000 or more | 5,016 (42.5%) | 660 (8.6%) |
| Total | 11,812 (100.0%) | 7,639 (100.0%) |
Physical Housing Characteristics in Arlington
Housing Structures in Arlington
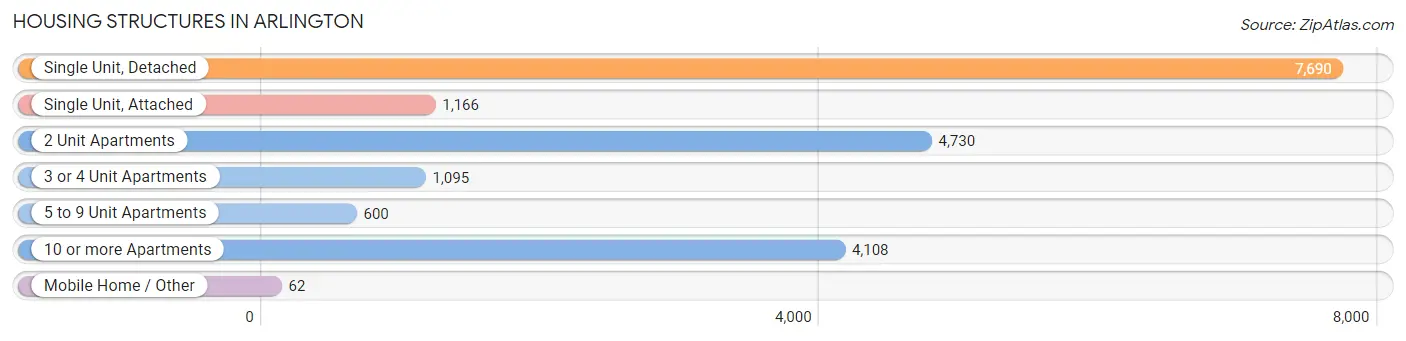
| Structure Type | # Housing Units | % Housing Units |
| Single Unit, Detached | 7,690 | 39.5% |
| Single Unit, Attached | 1,166 | 6.0% |
| 2 Unit Apartments | 4,730 | 24.3% |
| 3 or 4 Unit Apartments | 1,095 | 5.6% |
| 5 to 9 Unit Apartments | 600 | 3.1% |
| 10 or more Apartments | 4,108 | 21.1% |
| Mobile Home / Other | 62 | 0.3% |
| Total | 19,451 | 100.0% |
Housing Structures by Occupancy in Arlington
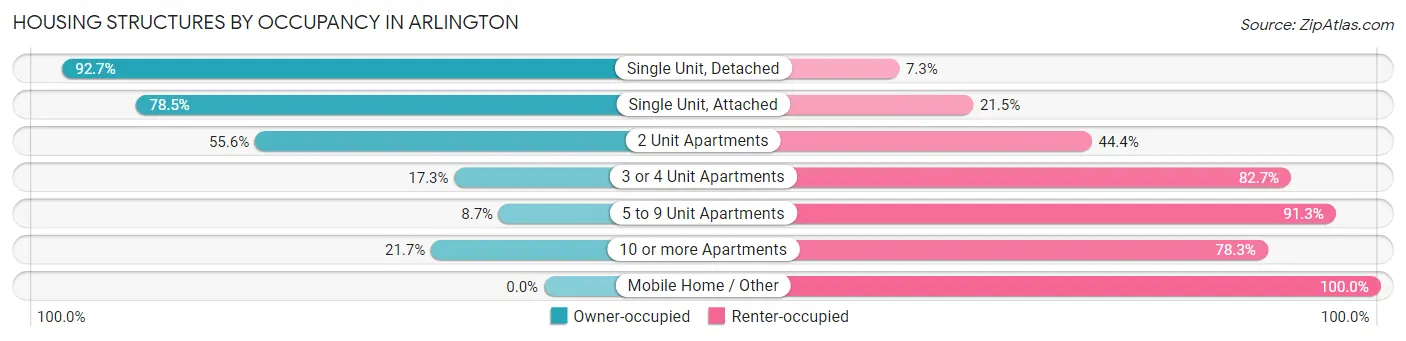
| Structure Type | Owner-occupied | Renter-occupied |
| Single Unit, Detached | 7,131 (92.7%) | 559 (7.3%) |
| Single Unit, Attached | 915 (78.5%) | 251 (21.5%) |
| 2 Unit Apartments | 2,632 (55.6%) | 2,098 (44.4%) |
| 3 or 4 Unit Apartments | 189 (17.3%) | 906 (82.7%) |
| 5 to 9 Unit Apartments | 52 (8.7%) | 548 (91.3%) |
| 10 or more Apartments | 893 (21.7%) | 3,215 (78.3%) |
| Mobile Home / Other | 0 (0.0%) | 62 (100.0%) |
| Total | 11,812 (60.7%) | 7,639 (39.3%) |
Housing Structures by Number of Rooms in Arlington
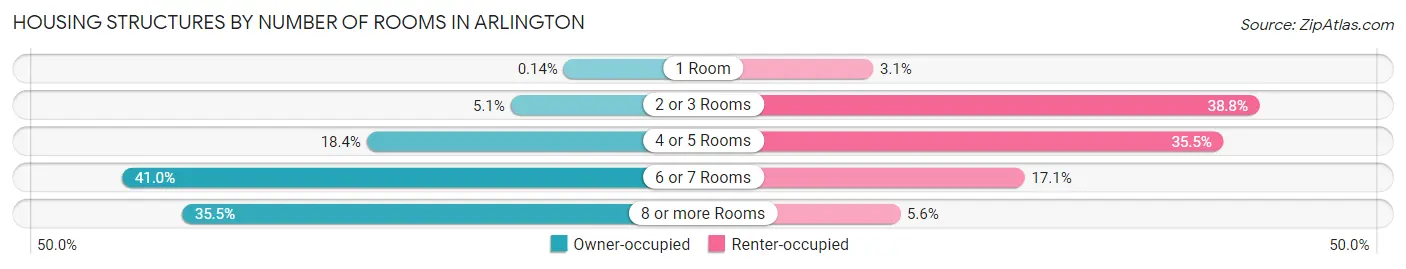
| Number of Rooms | Owner-occupied | Renter-occupied |
| 1 Room | 16 (0.1%) | 234 (3.1%) |
| 2 or 3 Rooms | 596 (5.1%) | 2,966 (38.8%) |
| 4 or 5 Rooms | 2,169 (18.4%) | 2,711 (35.5%) |
| 6 or 7 Rooms | 4,843 (41.0%) | 1,304 (17.1%) |
| 8 or more Rooms | 4,188 (35.5%) | 424 (5.6%) |
| Total | 11,812 (100.0%) | 7,639 (100.0%) |
Housing Structure by Heating Type in Arlington
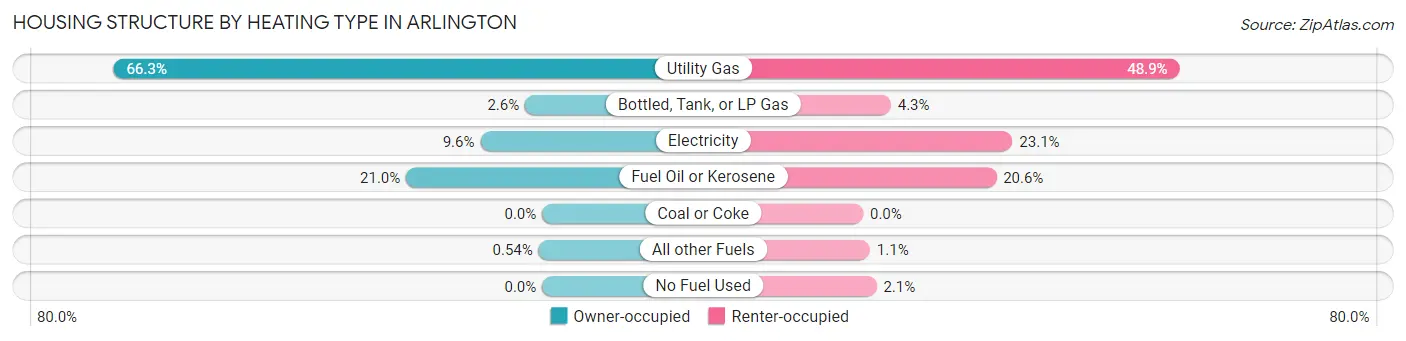
| Heating Type | Owner-occupied | Renter-occupied |
| Utility Gas | 7,825 (66.2%) | 3,736 (48.9%) |
| Bottled, Tank, or LP Gas | 312 (2.6%) | 328 (4.3%) |
| Electricity | 1,128 (9.6%) | 1,764 (23.1%) |
| Fuel Oil or Kerosene | 2,483 (21.0%) | 1,572 (20.6%) |
| Coal or Coke | 0 (0.0%) | 0 (0.0%) |
| All other Fuels | 64 (0.5%) | 81 (1.1%) |
| No Fuel Used | 0 (0.0%) | 158 (2.1%) |
| Total | 11,812 (100.0%) | 7,639 (100.0%) |
Household Vehicle Usage in Arlington
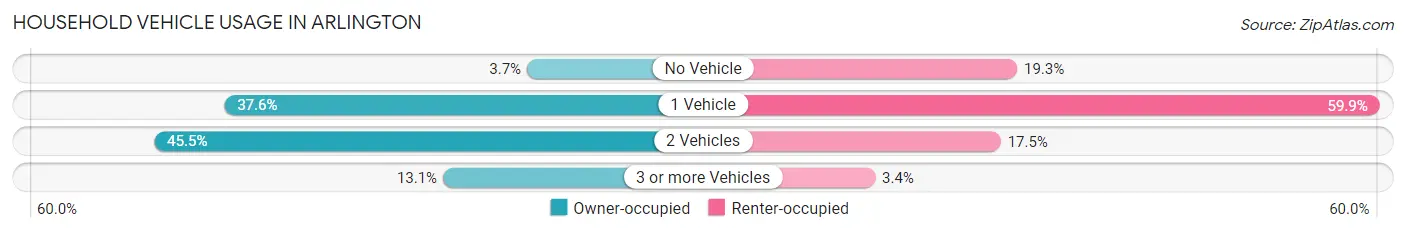
| Vehicles per Household | Owner-occupied | Renter-occupied |
| No Vehicle | 441 (3.7%) | 1,473 (19.3%) |
| 1 Vehicle | 4,446 (37.6%) | 4,575 (59.9%) |
| 2 Vehicles | 5,373 (45.5%) | 1,333 (17.4%) |
| 3 or more Vehicles | 1,552 (13.1%) | 258 (3.4%) |
| Total | 11,812 (100.0%) | 7,639 (100.0%) |
Real Estate & Mortgages in Arlington
Real Estate and Mortgage Overview in Arlington
| Characteristic | Without Mortgage | With Mortgage |
| Housing Units | 4,183 | 7,629 |
| Median Property Value | $781,000 | $868,300 |
| Median Household Income | $117,813 | $5,494 |
| Monthly Housing Costs | $1,222 | $4,939 |
| Real Estate Taxes | $9,002 | $35 |
Property Value by Mortgage Status in Arlington
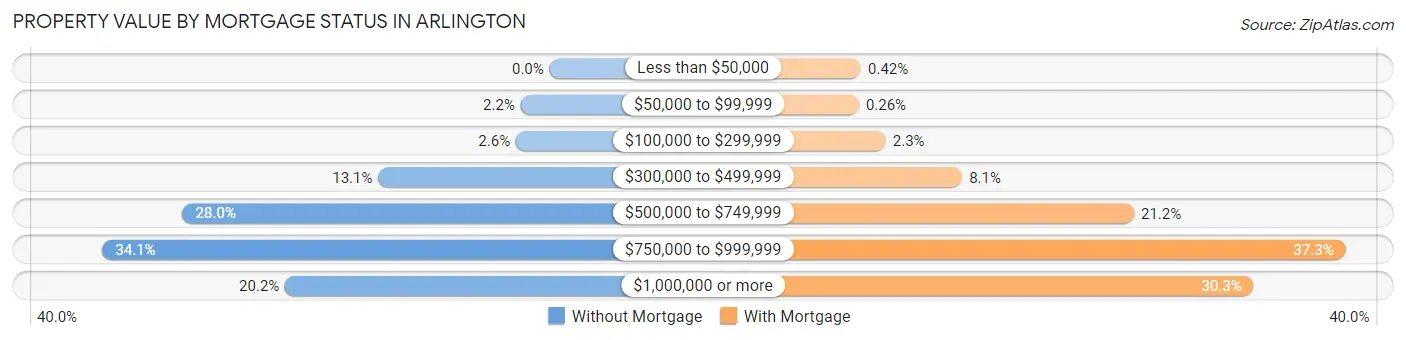
| Property Value | Without Mortgage | With Mortgage |
| Less than $50,000 | 0 (0.0%) | 32 (0.4%) |
| $50,000 to $99,999 | 92 (2.2%) | 20 (0.3%) |
| $100,000 to $299,999 | 107 (2.6%) | 176 (2.3%) |
| $300,000 to $499,999 | 546 (13.1%) | 620 (8.1%) |
| $500,000 to $749,999 | 1,170 (28.0%) | 1,619 (21.2%) |
| $750,000 to $999,999 | 1,425 (34.1%) | 2,848 (37.3%) |
| $1,000,000 or more | 843 (20.2%) | 2,314 (30.3%) |
| Total | 4,183 (100.0%) | 7,629 (100.0%) |
Household Income by Mortgage Status in Arlington
| Household Income | Without Mortgage | With Mortgage |
| Less than $10,000 | 256 (6.1%) | 137 (1.8%) |
| $10,000 to $24,999 | 246 (5.9%) | 129 (1.7%) |
| $25,000 to $34,999 | 201 (4.8%) | 86 (1.1%) |
| $35,000 to $49,999 | 338 (8.1%) | 90 (1.2%) |
| $50,000 to $74,999 | 425 (10.2%) | 62 (0.8%) |
| $75,000 to $99,999 | 425 (10.2%) | 282 (3.7%) |
| $100,000 to $149,999 | 732 (17.5%) | 546 (7.2%) |
| $150,000 or more | 1,560 (37.3%) | 940 (12.3%) |
| Total | 4,183 (100.0%) | 7,629 (100.0%) |
Property Value to Household Income Ratio in Arlington
| Value-to-Income Ratio | Without Mortgage | With Mortgage |
| Less than 2.0x | 354 (8.5%) | 220,531 (2,890.7%) |
| 2.0x to 2.9x | 461 (11.0%) | 754 (9.9%) |
| 3.0x to 3.9x | 413 (9.9%) | 1,637 (21.5%) |
| 4.0x or more | 2,812 (67.2%) | 1,680 (22.0%) |
| Total | 4,183 (100.0%) | 7,629 (100.0%) |
Real Estate Taxes by Mortgage Status in Arlington
| Property Taxes | Without Mortgage | With Mortgage |
| Less than $800 | 77 (1.8%) | 18 (0.2%) |
| $800 to $1,499 | 58 (1.4%) | 26 (0.3%) |
| $800 to $1,499 | 3,978 (95.1%) | 10 (0.1%) |
| Total | 4,183 (100.0%) | 7,629 (100.0%) |
Health & Disability in Arlington
Health Insurance Coverage by Age in Arlington
| Age Bracket | With Coverage | Without Coverage |
| Under 6 Years | 3,081 (100.0%) | 0 (0.0%) |
| 6 to 18 Years | 6,894 (99.4%) | 41 (0.6%) |
| 19 to 25 Years | 2,657 (100.0%) | 0 (0.0%) |
| 26 to 34 Years | 5,904 (98.2%) | 111 (1.8%) |
| 35 to 44 Years | 6,638 (97.0%) | 203 (3.0%) |
| 45 to 54 Years | 6,896 (99.5%) | 35 (0.5%) |
| 55 to 64 Years | 5,623 (98.7%) | 73 (1.3%) |
| 65 to 74 Years | 4,352 (99.4%) | 27 (0.6%) |
| 75 Years and older | 3,124 (99.7%) | 10 (0.3%) |
| Total | 45,169 (98.9%) | 500 (1.1%) |
Health Insurance Coverage by Citizenship Status in Arlington
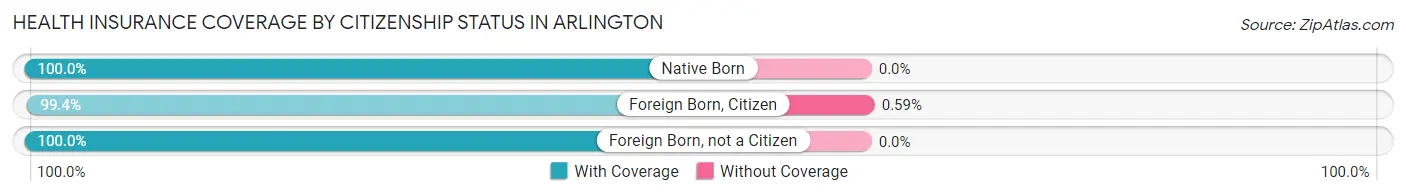
| Citizenship Status | With Coverage | Without Coverage |
| Native Born | 3,081 (100.0%) | 0 (0.0%) |
| Foreign Born, Citizen | 6,894 (99.4%) | 41 (0.6%) |
| Foreign Born, not a Citizen | 2,657 (100.0%) | 0 (0.0%) |
Health Insurance Coverage by Household Income in Arlington
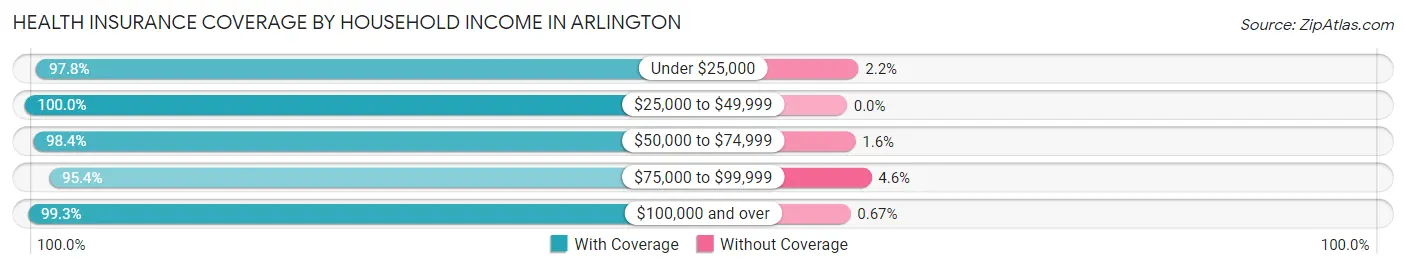
| Household Income | With Coverage | Without Coverage |
| Under $25,000 | 2,674 (97.8%) | 59 (2.2%) |
| $25,000 to $49,999 | 2,324 (100.0%) | 0 (0.0%) |
| $50,000 to $74,999 | 2,891 (98.4%) | 47 (1.6%) |
| $75,000 to $99,999 | 3,405 (95.4%) | 164 (4.6%) |
| $100,000 and over | 33,744 (99.3%) | 229 (0.7%) |
Public vs Private Health Insurance Coverage by Age in Arlington
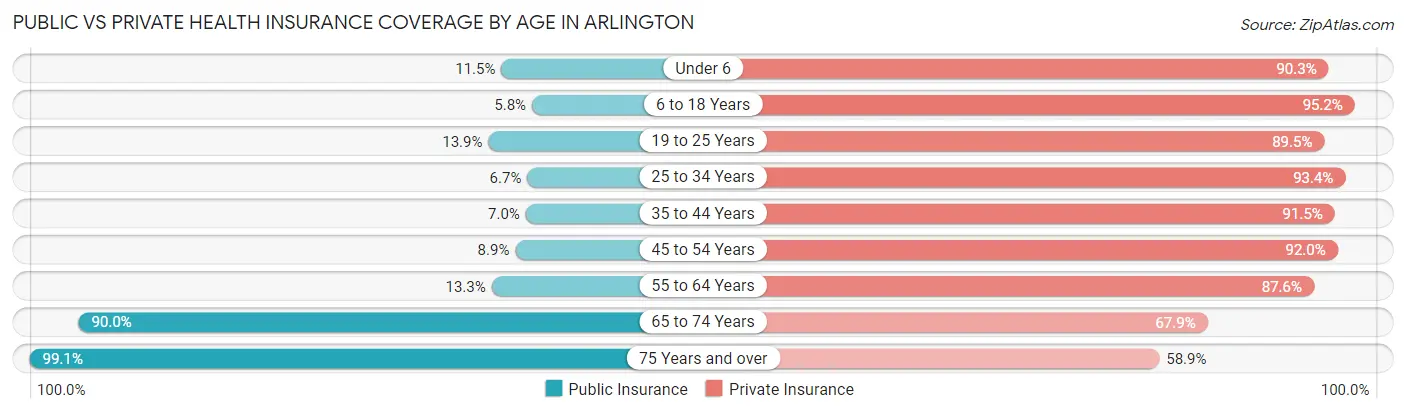
| Age Bracket | Public Insurance | Private Insurance |
| Under 6 | 355 (11.5%) | 2,783 (90.3%) |
| 6 to 18 Years | 405 (5.8%) | 6,602 (95.2%) |
| 19 to 25 Years | 370 (13.9%) | 2,379 (89.5%) |
| 25 to 34 Years | 403 (6.7%) | 5,620 (93.4%) |
| 35 to 44 Years | 478 (7.0%) | 6,258 (91.5%) |
| 45 to 54 Years | 619 (8.9%) | 6,378 (92.0%) |
| 55 to 64 Years | 759 (13.3%) | 4,990 (87.6%) |
| 65 to 74 Years | 3,941 (90.0%) | 2,972 (67.9%) |
| 75 Years and over | 3,105 (99.1%) | 1,847 (58.9%) |
| Total | 10,435 (22.9%) | 39,829 (87.2%) |
Disability Status by Sex by Age in Arlington
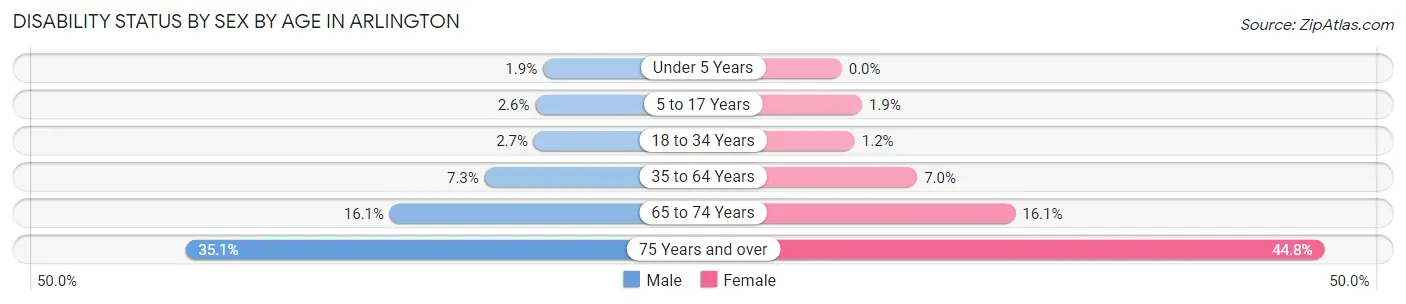
| Age Bracket | Male | Female |
| Under 5 Years | 24 (1.9%) | 0 (0.0%) |
| 5 to 17 Years | 90 (2.6%) | 71 (1.9%) |
| 18 to 34 Years | 121 (2.7%) | 55 (1.2%) |
| 35 to 64 Years | 659 (7.3%) | 731 (7.0%) |
| 65 to 74 Years | 333 (16.1%) | 372 (16.1%) |
| 75 Years and over | 490 (35.1%) | 778 (44.8%) |
Disability Class by Sex by Age in Arlington
Disability Class: Hearing Difficulty
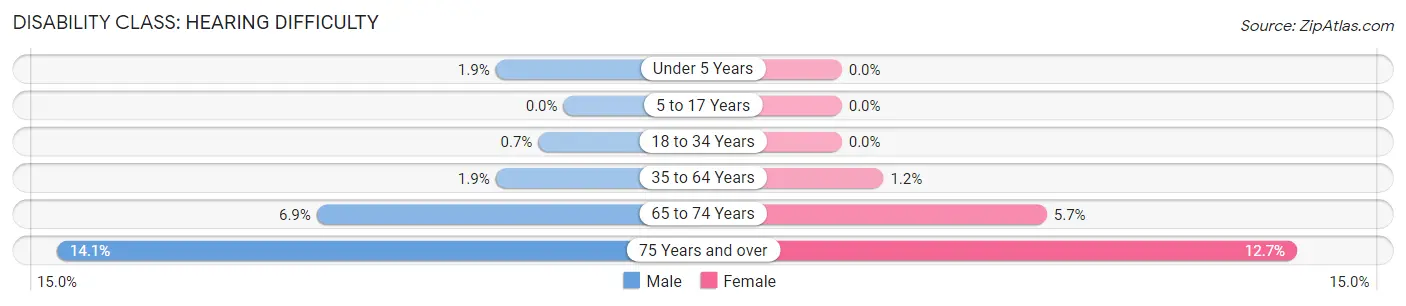
| Age Bracket | Male | Female |
| Under 5 Years | 24 (1.9%) | 0 (0.0%) |
| 5 to 17 Years | 0 (0.0%) | 0 (0.0%) |
| 18 to 34 Years | 31 (0.7%) | 0 (0.0%) |
| 35 to 64 Years | 170 (1.9%) | 121 (1.2%) |
| 65 to 74 Years | 142 (6.9%) | 132 (5.7%) |
| 75 Years and over | 197 (14.1%) | 220 (12.7%) |
Disability Class: Vision Difficulty
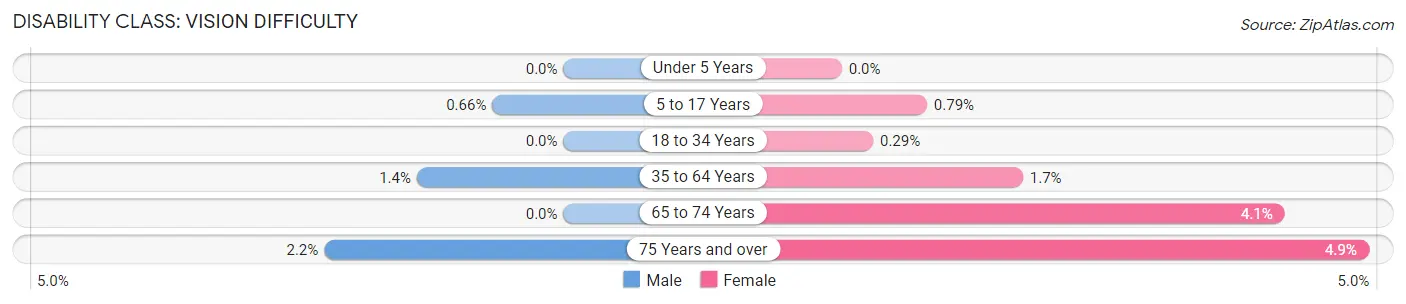
| Age Bracket | Male | Female |
| Under 5 Years | 0 (0.0%) | 0 (0.0%) |
| 5 to 17 Years | 23 (0.7%) | 30 (0.8%) |
| 18 to 34 Years | 0 (0.0%) | 13 (0.3%) |
| 35 to 64 Years | 123 (1.4%) | 176 (1.7%) |
| 65 to 74 Years | 0 (0.0%) | 95 (4.1%) |
| 75 Years and over | 31 (2.2%) | 85 (4.9%) |
Disability Class: Cognitive Difficulty
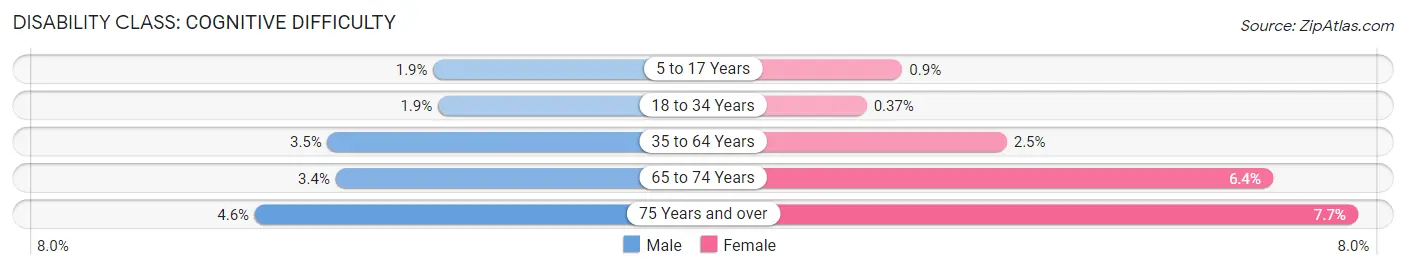
| Age Bracket | Male | Female |
| 5 to 17 Years | 67 (1.9%) | 34 (0.9%) |
| 18 to 34 Years | 82 (1.9%) | 17 (0.4%) |
| 35 to 64 Years | 316 (3.5%) | 256 (2.5%) |
| 65 to 74 Years | 70 (3.4%) | 148 (6.4%) |
| 75 Years and over | 64 (4.6%) | 133 (7.7%) |
Disability Class: Ambulatory Difficulty
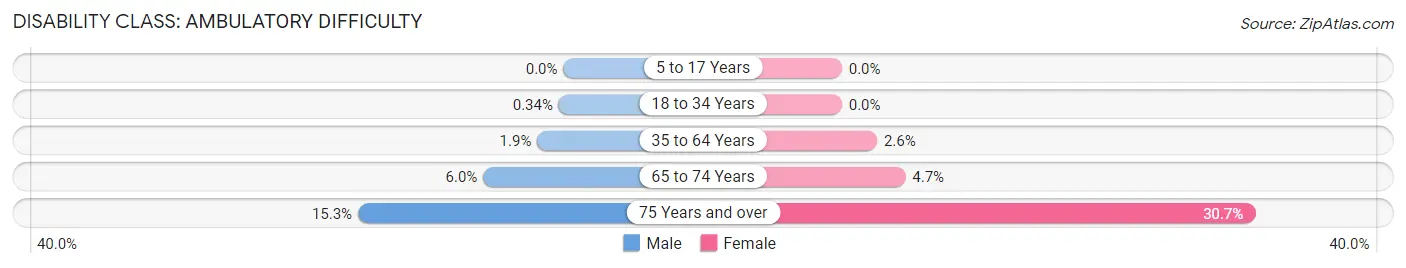
| Age Bracket | Male | Female |
| 5 to 17 Years | 0 (0.0%) | 0 (0.0%) |
| 18 to 34 Years | 15 (0.3%) | 0 (0.0%) |
| 35 to 64 Years | 175 (1.9%) | 273 (2.6%) |
| 65 to 74 Years | 123 (5.9%) | 109 (4.7%) |
| 75 Years and over | 213 (15.2%) | 533 (30.7%) |
Disability Class: Self-Care Difficulty
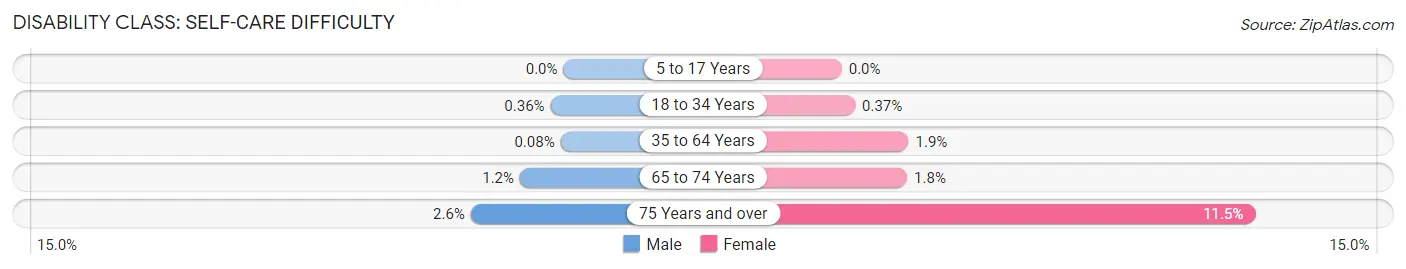
| Age Bracket | Male | Female |
| 5 to 17 Years | 0 (0.0%) | 0 (0.0%) |
| 18 to 34 Years | 16 (0.4%) | 17 (0.4%) |
| 35 to 64 Years | 7 (0.1%) | 194 (1.9%) |
| 65 to 74 Years | 25 (1.2%) | 42 (1.8%) |
| 75 Years and over | 36 (2.6%) | 200 (11.5%) |
Technology Access in Arlington
Computing Device Access in Arlington
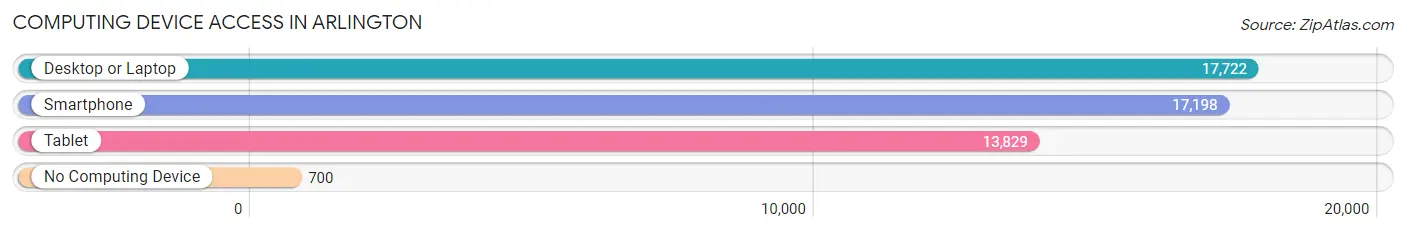
| Device Type | # Households | % Households |
| Desktop or Laptop | 17,722 | 91.1% |
| Smartphone | 17,198 | 88.4% |
| Tablet | 13,829 | 71.1% |
| No Computing Device | 700 | 3.6% |
| Total | 19,451 | 100.0% |
Internet Access in Arlington
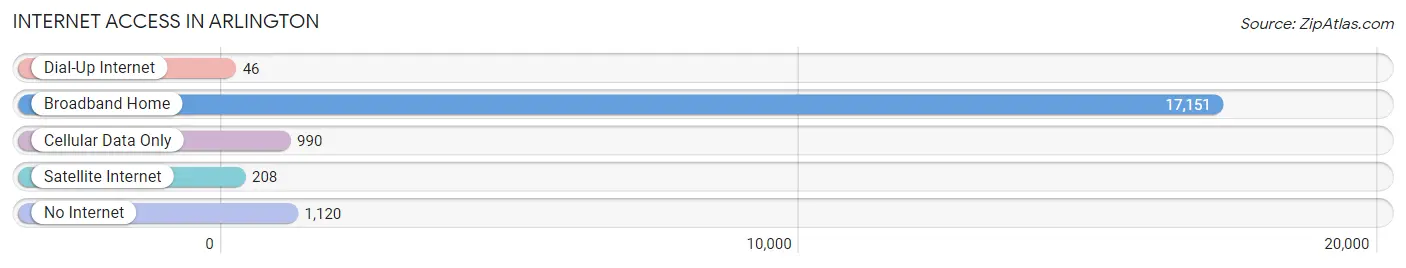
| Internet Type | # Households | % Households |
| Dial-Up Internet | 46 | 0.2% |
| Broadband Home | 17,151 | 88.2% |
| Cellular Data Only | 990 | 5.1% |
| Satellite Internet | 208 | 1.1% |
| No Internet | 1,120 | 5.8% |
| Total | 19,451 | 100.0% |
Arlington Summary
Arlington is a town located in Middlesex County, Massachusetts, United States, six miles northwest of Boston. It is part of the Greater Boston metropolitan area. The population was 42,844 at the 2010 census.
History
Arlington was first settled in 1635 as a part of Cambridge, Massachusetts. It was incorporated as a separate town in 1807. The town was named after Edward Arlington, a local landowner.
The town was originally an agricultural community, but it began to develop into a residential suburb of Boston in the late 19th century. The town was home to a number of prominent families, including the Cabots, the Lowells, and the Saltonstalls.
Geography
Arlington is located in eastern Massachusetts, bordered by the towns of Belmont to the north, Cambridge to the east, Somerville to the southeast, Medford to the south, and Lexington to the west. It is 6 miles northwest of Boston.
The town is located on the Mystic River, which flows through the town from north to south. The Mystic Lakes are located in the northern part of the town.
The town is hilly, with elevations ranging from 20 to 200 feet above sea level. The highest point in the town is Spy Pond Hill, at 200 feet.
Economy
Arlington is a primarily residential community, with a small commercial district located in the center of town. The town is home to a number of small businesses, including restaurants, retail stores, and professional services.
The town is also home to a number of large employers, including the Massachusetts Institute of Technology (MIT), Harvard University, and the Cambridge Health Alliance.
Demographics
As of the 2010 census, there were 42,844 people, 17,945 households, and 10,845 families residing in the town. The population density was 4,837.3 people per square mile.
The racial makeup of the town was 79.2% White, 8.2% African American, 0.3% Native American, 8.3% Asian, 0.1% Pacific Islander, 1.3% from other races, and 2.6% from two or more races. Hispanic or Latino of any race were 3.7% of the population.
The median income for a household in the town was $76,867, and the median income for a family was $97,817. The per capita income for the town was $41,945. About 4.2% of families and 6.2% of the population were below the poverty line, including 7.2% of those under age 18 and 5.2% of those age 65 or over.
Common Questions
What is Per Capita Income in Arlington?
Per Capita income in Arlington is $77,043.
What is the Median Family Income in Arlington?
Median Family Income in Arlington is $177,107.
What is the Median Household income in Arlington?
Median Household Income in Arlington is $136,312.
What is Income or Wage Gap in Arlington?
Income or Wage Gap in Arlington is 30.6%.
Women in Arlington earn 69.4 cents for every dollar earned by a man.
What is Family Income Deficit in Arlington?
Family Income Deficit in Arlington is $12,425.
Families that are below poverty line in Arlington earn $12,425 less on average than the poverty threshold level.
What is Inequality or Gini Index in Arlington?
Inequality or Gini Index in Arlington is 0.47.
What is the Total Population of Arlington?
Total Population of Arlington is 45,906.
What is the Total Male Population of Arlington?
Total Male Population of Arlington is 21,710.
What is the Total Female Population of Arlington?
Total Female Population of Arlington is 24,196.
What is the Ratio of Males per 100 Females in Arlington?
There are 89.73 Males per 100 Females in Arlington.
What is the Ratio of Females per 100 Males in Arlington?
There are 111.45 Females per 100 Males in Arlington.
What is the Median Population Age in Arlington?
Median Population Age in Arlington is 40.7 Years.
What is the Average Family Size in Arlington
Average Family Size in Arlington is 3.0 People.
What is the Average Household Size in Arlington
Average Household Size in Arlington is 2.3 People.
How Large is the Labor Force in Arlington?
There are 27,347 People in the Labor Forcein in Arlington.
What is the Percentage of People in the Labor Force in Arlington?
73.3% of People are in the Labor Force in Arlington.
What is the Unemployment Rate in Arlington?
Unemployment Rate in Arlington is 3.6%.