Northbrook, IL Map & Demographics
Northbrook Map
Northbrook Overview
$83,750
PER CAPITA INCOME
$210,123
AVG FAMILY INCOME
$150,236
AVG HOUSEHOLD INCOME
46.8%
WAGE / INCOME GAP [ % ]
53.2¢/ $1
WAGE / INCOME GAP [ $ ]
0.47
INEQUALITY / GINI INDEX
34,950
TOTAL POPULATION
16,736
MALE POPULATION
18,214
FEMALE POPULATION
91.89
MALES / 100 FEMALES
108.83
FEMALES / 100 MALES
49.4
MEDIAN AGE
3.0
AVG FAMILY SIZE
2.5
AVG HOUSEHOLD SIZE
17,276
LABOR FORCE [ PEOPLE ]
60.2%
PERCENT IN LABOR FORCE
3.2%
UNEMPLOYMENT RATE
Northbrook Zip Codes
Income in Northbrook
Income Overview in Northbrook
Per Capita Income in Northbrook is $83,750, while median incomes of families and households are $210,123 and $150,236 respectively.
| Characteristic | Number | Measure |
| Per Capita Income | 34,950 | $83,750 |
| Median Family Income | 9,770 | $210,123 |
| Mean Family Income | 9,770 | $259,250 |
| Median Household Income | 13,481 | $150,236 |
| Mean Household Income | 13,481 | $212,149 |
| Income Deficit | 9,770 | $0 |
| Wage / Income Gap (%) | 34,950 | 46.79% |
| Wage / Income Gap ($) | 34,950 | 53.21¢ per $1 |
| Gini / Inequality Index | 34,950 | 0.47 |
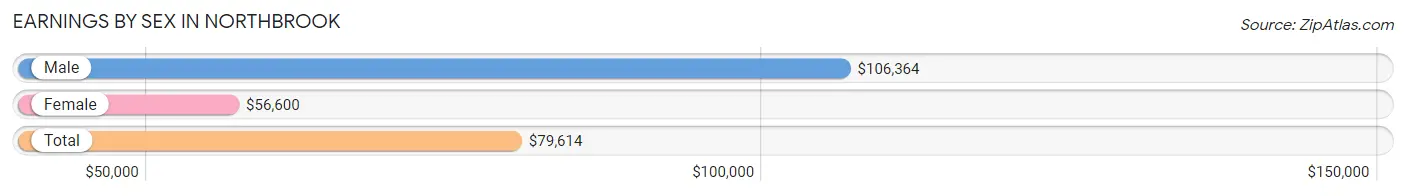
Earnings by Sex in Northbrook
Average Earnings in Northbrook are $79,614, $106,364 for men and $56,600 for women, a difference of 46.8%.
| Sex | Number | Average Earnings |
| Male | 9,814 (54.0%) | $106,364 |
| Female | 8,364 (46.0%) | $56,600 |
| Total | 18,178 (100.0%) | $79,614 |
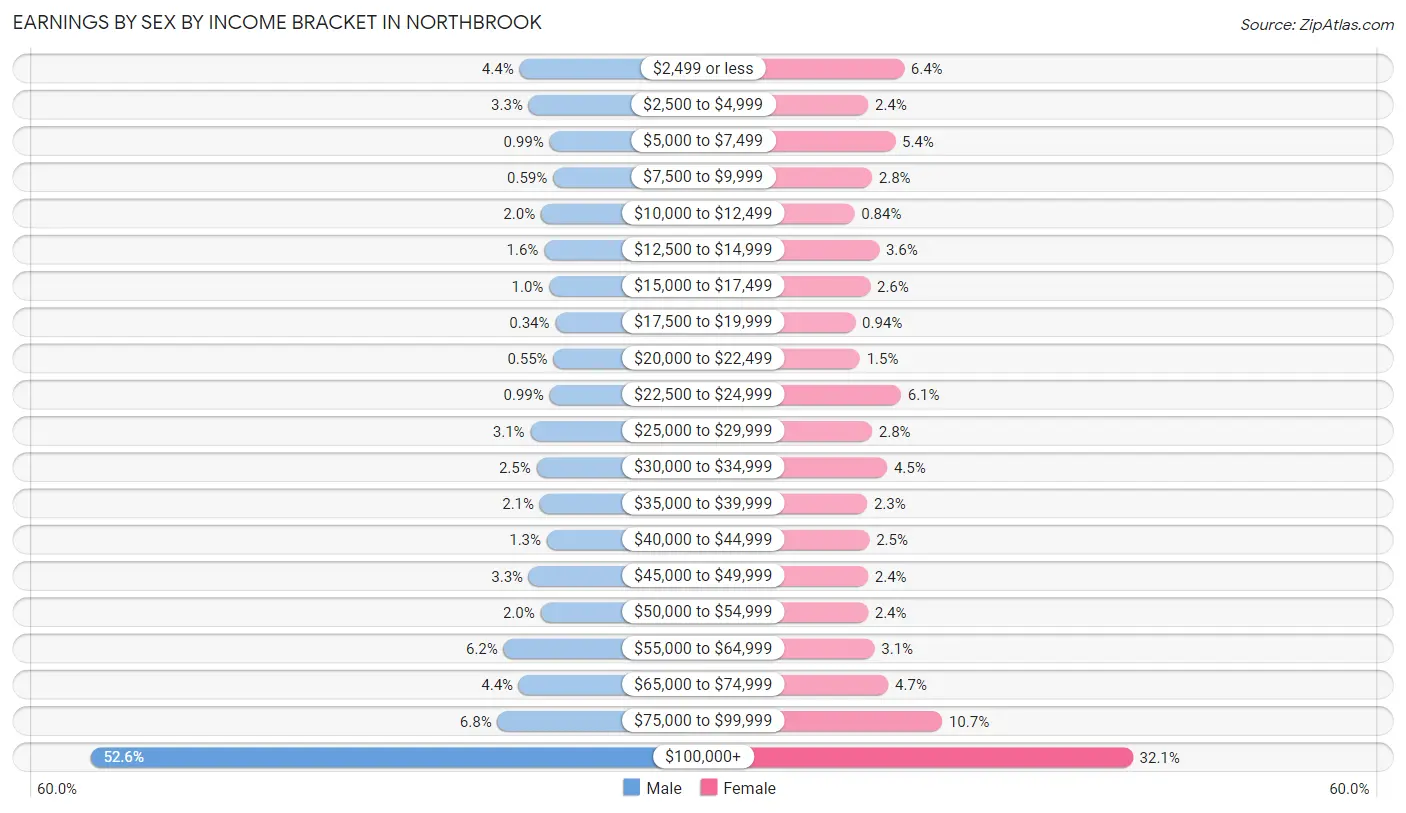
Earnings by Sex by Income Bracket in Northbrook
The most common earnings brackets in Northbrook are $100,000+ for men (5,161 | 52.6%) and $100,000+ for women (2,687 | 32.1%).
| Income | Male | Female |
| $2,499 or less | 429 (4.4%) | 536 (6.4%) |
| $2,500 to $4,999 | 327 (3.3%) | 200 (2.4%) |
| $5,000 to $7,499 | 97 (1.0%) | 453 (5.4%) |
| $7,500 to $9,999 | 58 (0.6%) | 236 (2.8%) |
| $10,000 to $12,499 | 191 (1.9%) | 70 (0.8%) |
| $12,500 to $14,999 | 156 (1.6%) | 303 (3.6%) |
| $15,000 to $17,499 | 101 (1.0%) | 218 (2.6%) |
| $17,500 to $19,999 | 33 (0.3%) | 79 (0.9%) |
| $20,000 to $22,499 | 54 (0.5%) | 121 (1.5%) |
| $22,500 to $24,999 | 97 (1.0%) | 508 (6.1%) |
| $25,000 to $29,999 | 308 (3.1%) | 236 (2.8%) |
| $30,000 to $34,999 | 240 (2.5%) | 378 (4.5%) |
| $35,000 to $39,999 | 204 (2.1%) | 190 (2.3%) |
| $40,000 to $44,999 | 127 (1.3%) | 211 (2.5%) |
| $45,000 to $49,999 | 325 (3.3%) | 198 (2.4%) |
| $50,000 to $54,999 | 196 (2.0%) | 197 (2.4%) |
| $55,000 to $64,999 | 604 (6.1%) | 259 (3.1%) |
| $65,000 to $74,999 | 435 (4.4%) | 389 (4.6%) |
| $75,000 to $99,999 | 671 (6.8%) | 895 (10.7%) |
| $100,000+ | 5,161 (52.6%) | 2,687 (32.1%) |
| Total | 9,814 (100.0%) | 8,364 (100.0%) |
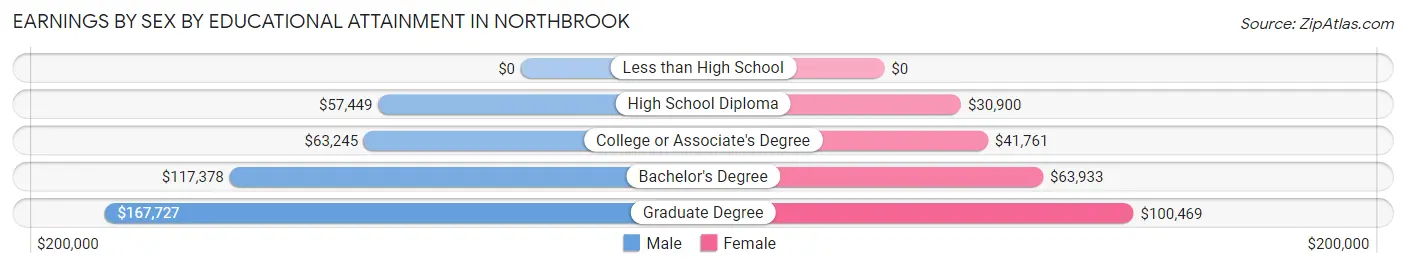
Earnings by Sex by Educational Attainment in Northbrook
Average earnings in Northbrook are $119,625 for men and $67,620 for women, a difference of 43.5%. Men with an educational attainment of graduate degree enjoy the highest average annual earnings of $167,727, while those with high school diploma education earn the least with $57,449. Women with an educational attainment of graduate degree earn the most with the average annual earnings of $100,469, while those with high school diploma education have the smallest earnings of $30,900.
| Educational Attainment | Male Income | Female Income |
| Less than High School | - | - |
| High School Diploma | $57,449 | $30,900 |
| College or Associate's Degree | $63,245 | $41,761 |
| Bachelor's Degree | $117,378 | $63,933 |
| Graduate Degree | $167,727 | $100,469 |
| Total | $119,625 | $67,620 |
Family Income in Northbrook
Family Income Brackets in Northbrook
According to the Northbrook family income data, there are 5,002 families falling into the $200,000+ income range, which is the most common income bracket and makes up 51.2% of all families. Conversely, the $10,000 to $14,999 income bracket is the least frequent group with only 39 families (0.4%) belonging to this category.
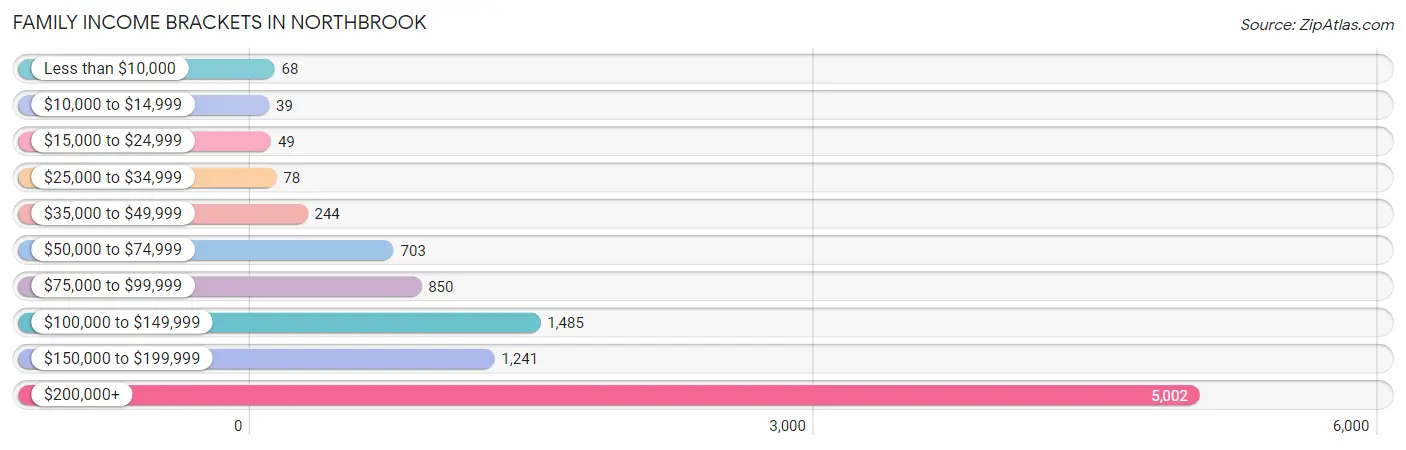
| Income Bracket | # Families | % Families |
| Less than $10,000 | 68 | 0.7% |
| $10,000 to $14,999 | 39 | 0.4% |
| $15,000 to $24,999 | 49 | 0.5% |
| $25,000 to $34,999 | 78 | 0.8% |
| $35,000 to $49,999 | 244 | 2.5% |
| $50,000 to $74,999 | 703 | 7.2% |
| $75,000 to $99,999 | 850 | 8.7% |
| $100,000 to $149,999 | 1,485 | 15.2% |
| $150,000 to $199,999 | 1,241 | 12.7% |
| $200,000+ | 5,002 | 51.2% |
Family Income by Famaliy Size in Northbrook
4-person families (2,571 | 26.3%) account for the highest median family income in Northbrook with $250,001 per family, while 3-person families (1,592 | 16.3%) have the highest median income of $73,929 per family member.
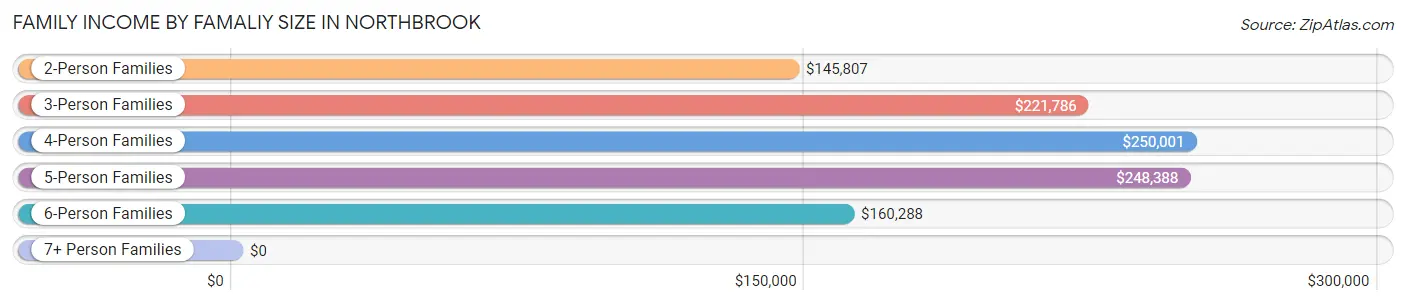
| Income Bracket | # Families | Median Income |
| 2-Person Families | 4,765 (48.8%) | $145,807 |
| 3-Person Families | 1,592 (16.3%) | $221,786 |
| 4-Person Families | 2,571 (26.3%) | $250,001 |
| 5-Person Families | 705 (7.2%) | $248,388 |
| 6-Person Families | 125 (1.3%) | $160,288 |
| 7+ Person Families | 12 (0.1%) | $0 |
| Total | 9,770 (100.0%) | $210,123 |
Family Income by Number of Earners in Northbrook
The median family income in Northbrook is $210,123, with families comprising 2 earners (4,814) having the highest median family income of $247,639, while families with no earners (1,442) have the lowest median family income of $105,685, accounting for 49.3% and 14.8% of families, respectively.
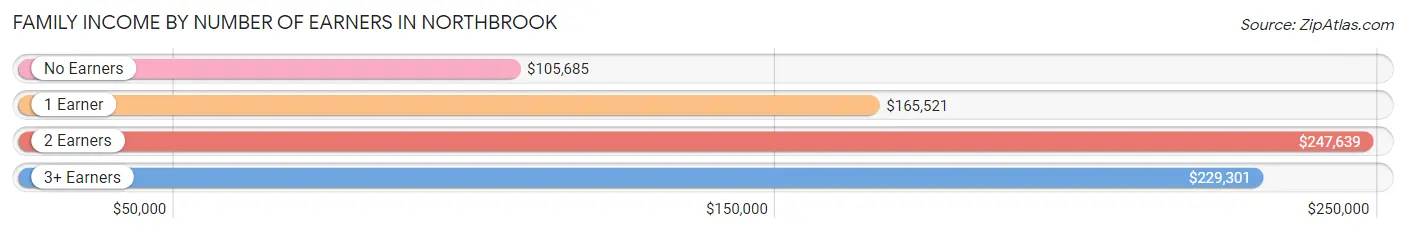
| Number of Earners | # Families | Median Income |
| No Earners | 1,442 (14.8%) | $105,685 |
| 1 Earner | 2,522 (25.8%) | $165,521 |
| 2 Earners | 4,814 (49.3%) | $247,639 |
| 3+ Earners | 992 (10.2%) | $229,301 |
| Total | 9,770 (100.0%) | $210,123 |
Household Income in Northbrook
Household Income Brackets in Northbrook
With 5,406 households falling in the category, the $200,000+ income range is the most frequent in Northbrook, accounting for 40.1% of all households. In contrast, only 81 households (0.6%) fall into the $10,000 to $14,999 income bracket, making it the least populous group.
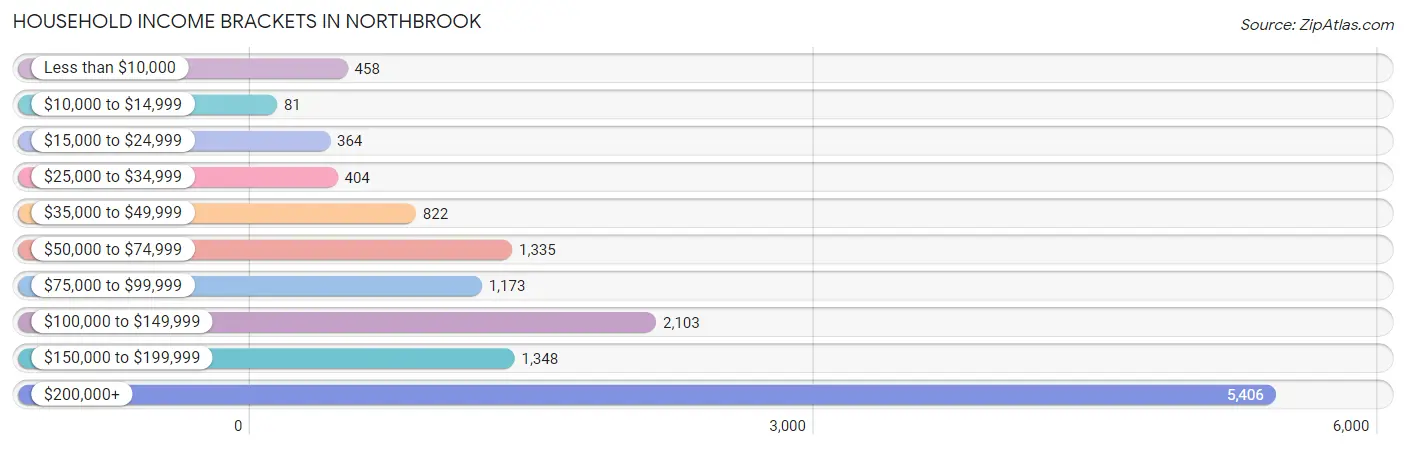
| Income Bracket | # Households | % Households |
| Less than $10,000 | 458 | 3.4% |
| $10,000 to $14,999 | 81 | 0.6% |
| $15,000 to $24,999 | 364 | 2.7% |
| $25,000 to $34,999 | 404 | 3.0% |
| $35,000 to $49,999 | 822 | 6.1% |
| $50,000 to $74,999 | 1,335 | 9.9% |
| $75,000 to $99,999 | 1,173 | 8.7% |
| $100,000 to $149,999 | 2,103 | 15.6% |
| $150,000 to $199,999 | 1,348 | 10.0% |
| $200,000+ | 5,406 | 40.1% |
Household Income by Householder Age in Northbrook
The median household income in Northbrook is $150,236, with the highest median household income of $220,098 found in the 25 to 44 years age bracket for the primary householder. A total of 2,824 households (20.9%) fall into this category. Meanwhile, the 15 to 24 years age bracket for the primary householder has the lowest median household income of $32,038, with 106 households (0.8%) in this group.
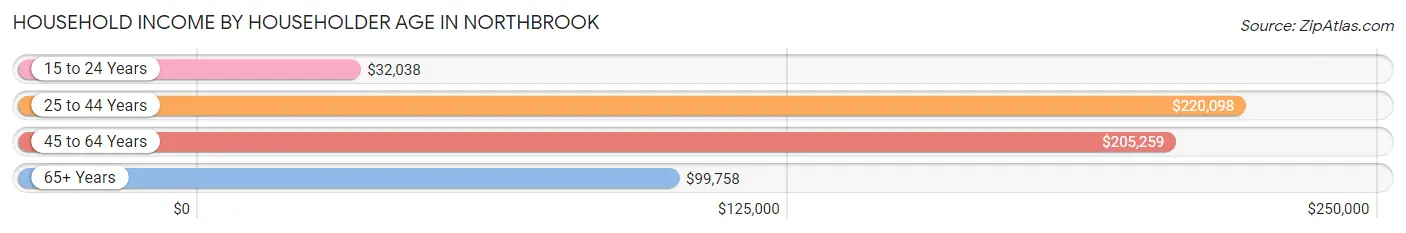
| Income Bracket | # Households | Median Income |
| 15 to 24 Years | 106 (0.8%) | $32,038 |
| 25 to 44 Years | 2,824 (20.9%) | $220,098 |
| 45 to 64 Years | 5,138 (38.1%) | $205,259 |
| 65+ Years | 5,413 (40.2%) | $99,758 |
| Total | 13,481 (100.0%) | $150,236 |
Poverty in Northbrook
Income Below Poverty by Sex and Age in Northbrook
With 2.1% poverty level for males and 5.1% for females among the residents of Northbrook, 5 year old males and 25 to 34 year old females are the most vulnerable to poverty, with 11 males (8.9%) and 159 females (15.8%) in their respective age groups living below the poverty level.
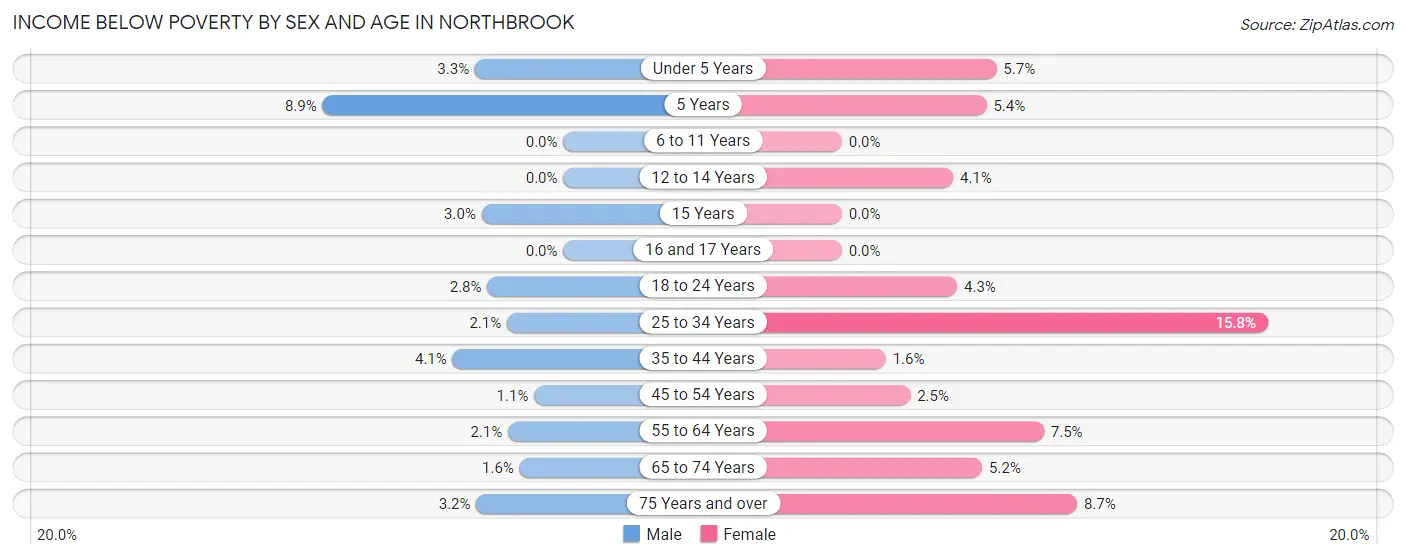
| Age Bracket | Male | Female |
| Under 5 Years | 28 (3.3%) | 43 (5.7%) |
| 5 Years | 11 (8.9%) | 11 (5.4%) |
| 6 to 11 Years | 0 (0.0%) | 0 (0.0%) |
| 12 to 14 Years | 0 (0.0%) | 28 (4.1%) |
| 15 Years | 7 (3.0%) | 0 (0.0%) |
| 16 and 17 Years | 0 (0.0%) | 0 (0.0%) |
| 18 to 24 Years | 30 (2.8%) | 46 (4.3%) |
| 25 to 34 Years | 28 (2.1%) | 159 (15.8%) |
| 35 to 44 Years | 76 (4.1%) | 34 (1.6%) |
| 45 to 54 Years | 24 (1.1%) | 68 (2.5%) |
| 55 to 64 Years | 56 (2.1%) | 208 (7.5%) |
| 65 to 74 Years | 32 (1.6%) | 110 (5.2%) |
| 75 Years and over | 60 (3.2%) | 207 (8.7%) |
| Total | 352 (2.1%) | 914 (5.1%) |
Income Above Poverty by Sex and Age in Northbrook
According to the poverty statistics in Northbrook, males aged 6 to 11 years and females aged 6 to 11 years are the age groups that are most secure financially, with 100.0% of males and 100.0% of females in these age groups living above the poverty line.
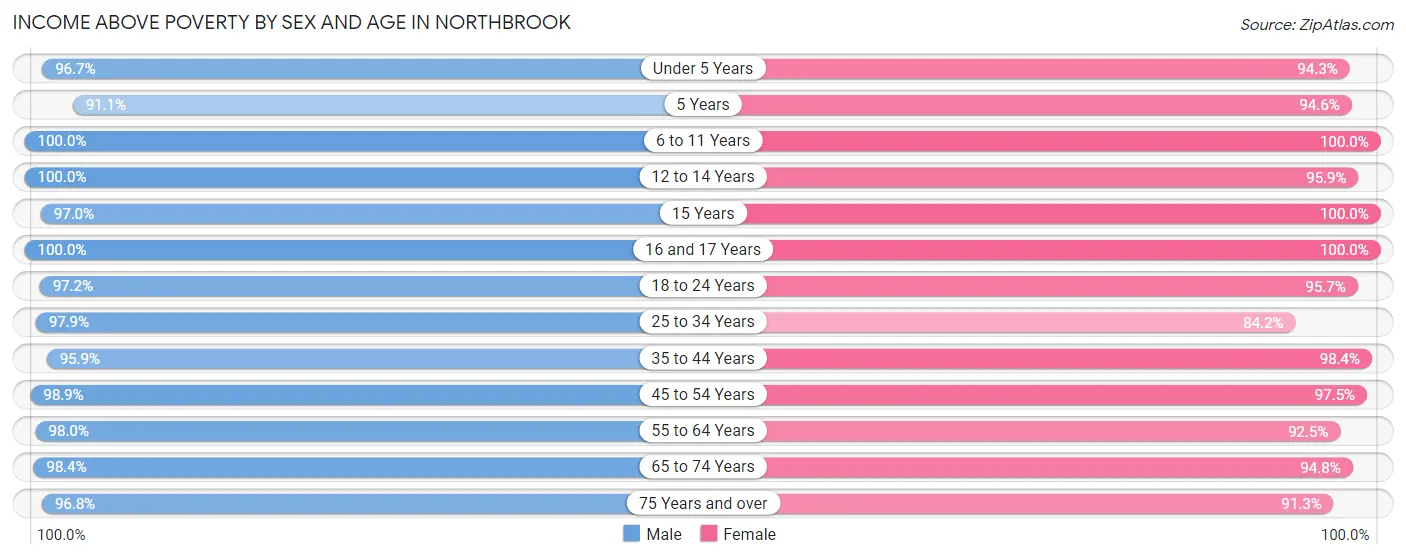
| Age Bracket | Male | Female |
| Under 5 Years | 825 (96.7%) | 706 (94.3%) |
| 5 Years | 112 (91.1%) | 194 (94.6%) |
| 6 to 11 Years | 1,205 (100.0%) | 1,531 (100.0%) |
| 12 to 14 Years | 518 (100.0%) | 650 (95.9%) |
| 15 Years | 224 (97.0%) | 123 (100.0%) |
| 16 and 17 Years | 502 (100.0%) | 454 (100.0%) |
| 18 to 24 Years | 1,034 (97.2%) | 1,030 (95.7%) |
| 25 to 34 Years | 1,311 (97.9%) | 847 (84.2%) |
| 35 to 44 Years | 1,771 (95.9%) | 2,053 (98.4%) |
| 45 to 54 Years | 2,203 (98.9%) | 2,613 (97.5%) |
| 55 to 64 Years | 2,679 (98.0%) | 2,566 (92.5%) |
| 65 to 74 Years | 1,939 (98.4%) | 2,002 (94.8%) |
| 75 Years and over | 1,795 (96.8%) | 2,164 (91.3%) |
| Total | 16,118 (97.9%) | 16,933 (94.9%) |
Income Below Poverty Among Married-Couple Families in Northbrook
The poverty statistics for married-couple families in Northbrook show that 0.9% or 83 of the total 8,715 families live below the poverty line. Families with 3 or 4 children have the highest poverty rate of 2.0%, comprising of 11 families. On the other hand, families with no children have the lowest poverty rate of 0.9%, which includes 47 families.
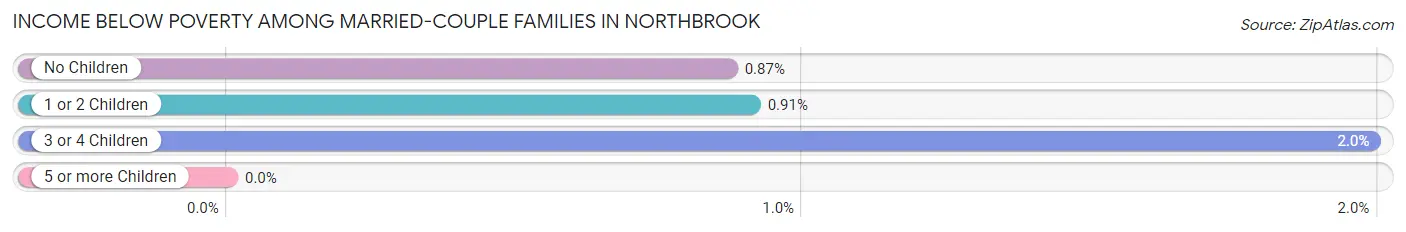
| Children | Above Poverty | Below Poverty |
| No Children | 5,361 (99.1%) | 47 (0.9%) |
| 1 or 2 Children | 2,729 (99.1%) | 25 (0.9%) |
| 3 or 4 Children | 542 (98.0%) | 11 (2.0%) |
| 5 or more Children | 0 (0.0%) | 0 (0.0%) |
| Total | 8,632 (99.1%) | 83 (0.9%) |
Income Below Poverty Among Single-Parent Households in Northbrook
According to the poverty data in Northbrook, 15.2% or 36 single-father households and 2.8% or 23 single-mother households are living below the poverty line. Among single-father households, those with 1 or 2 children have the highest poverty rate, with 14 households (20.0%) experiencing poverty. Likewise, among single-mother households, those with no children have the highest poverty rate, with 23 households (5.2%) falling below the poverty line.
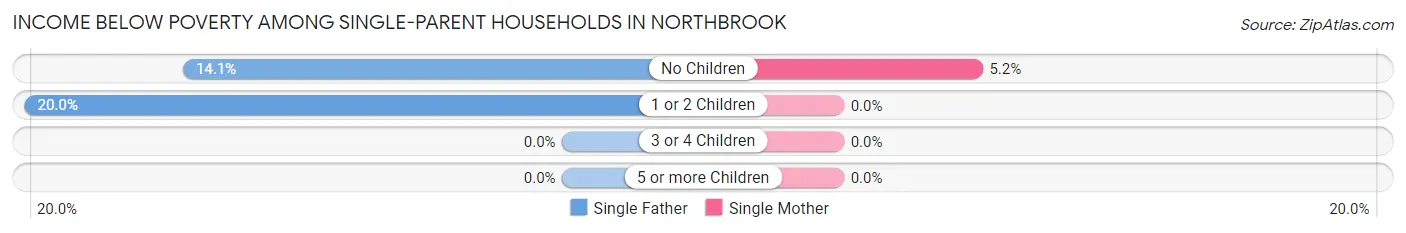
| Children | Single Father | Single Mother |
| No Children | 22 (14.1%) | 23 (5.2%) |
| 1 or 2 Children | 14 (20.0%) | 0 (0.0%) |
| 3 or 4 Children | 0 (0.0%) | 0 (0.0%) |
| 5 or more Children | 0 (0.0%) | 0 (0.0%) |
| Total | 36 (15.2%) | 23 (2.8%) |
Income Below Poverty Among Married-Couple vs Single-Parent Households in Northbrook
The poverty data for Northbrook shows that 83 of the married-couple family households (0.9%) and 59 of the single-parent households (5.6%) are living below the poverty level. Within the married-couple family households, those with 3 or 4 children have the highest poverty rate, with 11 households (2.0%) falling below the poverty line. Among the single-parent households, those with no children have the highest poverty rate, with 45 household (7.5%) living below poverty.
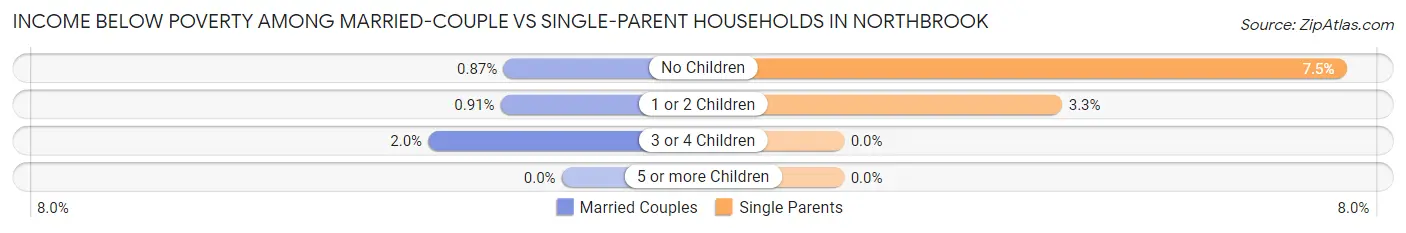
| Children | Married-Couple Families | Single-Parent Households |
| No Children | 47 (0.9%) | 45 (7.5%) |
| 1 or 2 Children | 25 (0.9%) | 14 (3.3%) |
| 3 or 4 Children | 11 (2.0%) | 0 (0.0%) |
| 5 or more Children | 0 (0.0%) | 0 (0.0%) |
| Total | 83 (0.9%) | 59 (5.6%) |
Race in Northbrook
The most populous races in Northbrook are White / Caucasian (26,987 | 77.2%), Asian (5,708 | 16.3%), and Hispanic or Latino (1,472 | 4.2%).
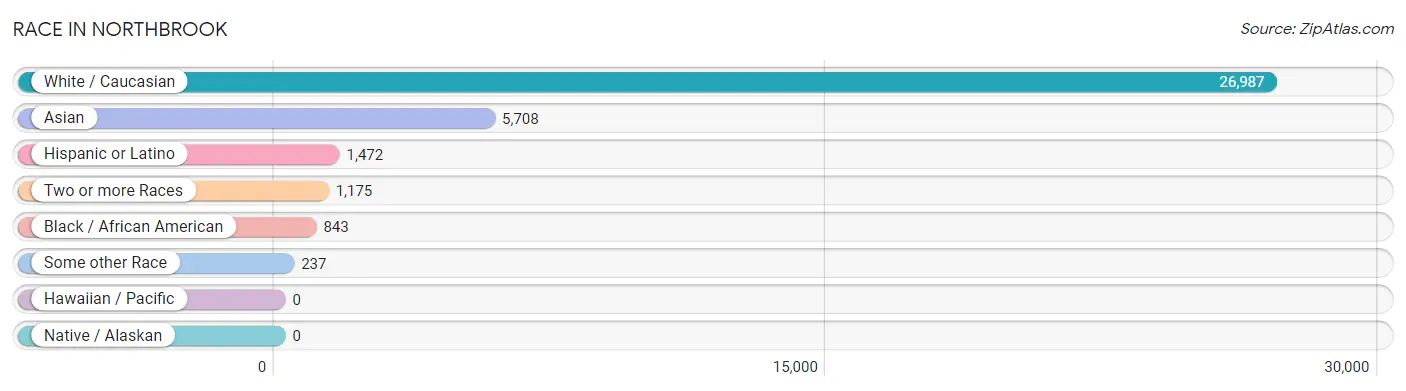
| Race | # Population | % Population |
| Asian | 5,708 | 16.3% |
| Black / African American | 843 | 2.4% |
| Hawaiian / Pacific | 0 | 0.0% |
| Hispanic or Latino | 1,472 | 4.2% |
| Native / Alaskan | 0 | 0.0% |
| White / Caucasian | 26,987 | 77.2% |
| Two or more Races | 1,175 | 3.4% |
| Some other Race | 237 | 0.7% |
| Total | 34,950 | 100.0% |
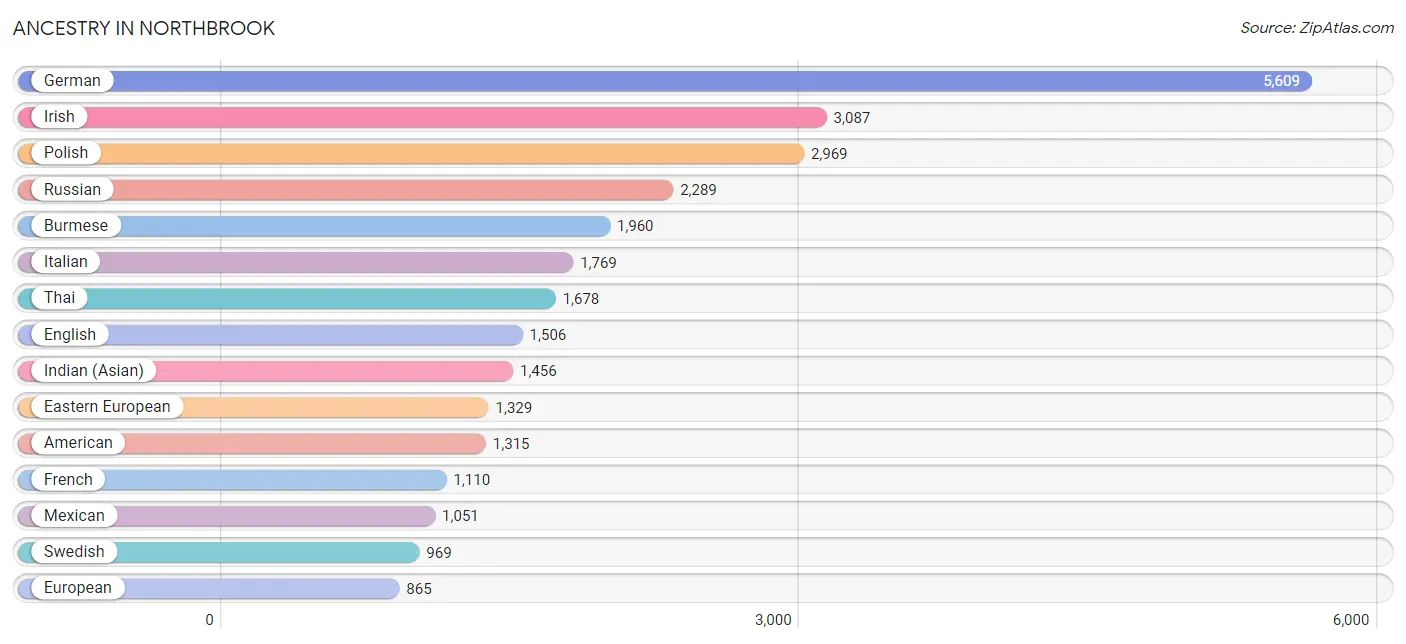
Ancestry in Northbrook
The most populous ancestries reported in Northbrook are German (5,609 | 16.1%), Irish (3,087 | 8.8%), Polish (2,969 | 8.5%), Russian (2,289 | 6.6%), and Burmese (1,960 | 5.6%), together accounting for 45.5% of all Northbrook residents.
| Ancestry | # Population | % Population |
| African | 49 | 0.1% |
| Albanian | 6 | 0.0% |
| American | 1,315 | 3.8% |
| Arab | 385 | 1.1% |
| Argentinean | 16 | 0.1% |
| Armenian | 147 | 0.4% |
| Assyrian / Chaldean / Syriac | 127 | 0.4% |
| Australian | 40 | 0.1% |
| Austrian | 276 | 0.8% |
| Belgian | 260 | 0.7% |
| Bhutanese | 249 | 0.7% |
| British | 132 | 0.4% |
| Bulgarian | 67 | 0.2% |
| Burmese | 1,960 | 5.6% |
| Cambodian | 17 | 0.1% |
| Canadian | 57 | 0.2% |
| Central American | 14 | 0.0% |
| Cherokee | 15 | 0.0% |
| Chilean | 32 | 0.1% |
| Colombian | 85 | 0.2% |
| Croatian | 44 | 0.1% |
| Cuban | 32 | 0.1% |
| Czech | 752 | 2.1% |
| Czechoslovakian | 149 | 0.4% |
| Danish | 244 | 0.7% |
| Dutch | 231 | 0.7% |
| Eastern European | 1,329 | 3.8% |
| Egyptian | 50 | 0.1% |
| English | 1,506 | 4.3% |
| Estonian | 66 | 0.2% |
| European | 865 | 2.5% |
| Filipino | 76 | 0.2% |
| Finnish | 111 | 0.3% |
| French | 1,110 | 3.2% |
| French Canadian | 96 | 0.3% |
| German | 5,609 | 16.1% |
| Greek | 770 | 2.2% |
| Guyanese | 53 | 0.2% |
| Haitian | 7 | 0.0% |
| Hungarian | 153 | 0.4% |
| Indian (Asian) | 1,456 | 4.2% |
| Iranian | 344 | 1.0% |
| Iraqi | 58 | 0.2% |
| Irish | 3,087 | 8.8% |
| Israeli | 78 | 0.2% |
| Italian | 1,769 | 5.1% |
| Jamaican | 26 | 0.1% |
| Japanese | 29 | 0.1% |
| Jordanian | 7 | 0.0% |
| Kenyan | 4 | 0.0% |
| Korean | 328 | 0.9% |
| Laotian | 56 | 0.2% |
| Latvian | 57 | 0.2% |
| Lebanese | 65 | 0.2% |
| Lithuanian | 379 | 1.1% |
| Luxembourger | 68 | 0.2% |
| Mexican | 1,051 | 3.0% |
| Native Hawaiian | 16 | 0.1% |
| Navajo | 6 | 0.0% |
| New Zealander | 7 | 0.0% |
| Northern European | 16 | 0.1% |
| Norwegian | 389 | 1.1% |
| Pakistani | 192 | 0.5% |
| Paraguayan | 10 | 0.0% |
| Peruvian | 12 | 0.0% |
| Polish | 2,969 | 8.5% |
| Portuguese | 57 | 0.2% |
| Puerto Rican | 147 | 0.4% |
| Romanian | 288 | 0.8% |
| Russian | 2,289 | 6.6% |
| Salvadoran | 14 | 0.0% |
| Scandinavian | 193 | 0.5% |
| Scotch-Irish | 149 | 0.4% |
| Scottish | 256 | 0.7% |
| Serbian | 147 | 0.4% |
| Slavic | 9 | 0.0% |
| Slovak | 32 | 0.1% |
| Slovene | 20 | 0.1% |
| South American | 178 | 0.5% |
| Soviet Union | 32 | 0.1% |
| Spaniard | 12 | 0.0% |
| Spanish | 9 | 0.0% |
| Sri Lankan | 7 | 0.0% |
| Subsaharan African | 60 | 0.2% |
| Swedish | 969 | 2.8% |
| Swiss | 313 | 0.9% |
| Thai | 1,678 | 4.8% |
| Turkish | 16 | 0.1% |
| Ukrainian | 688 | 2.0% |
| Uruguayan | 23 | 0.1% |
| Welsh | 74 | 0.2% |
| Yugoslavian | 14 | 0.0% | View All 92 Rows |
Immigrants in Northbrook
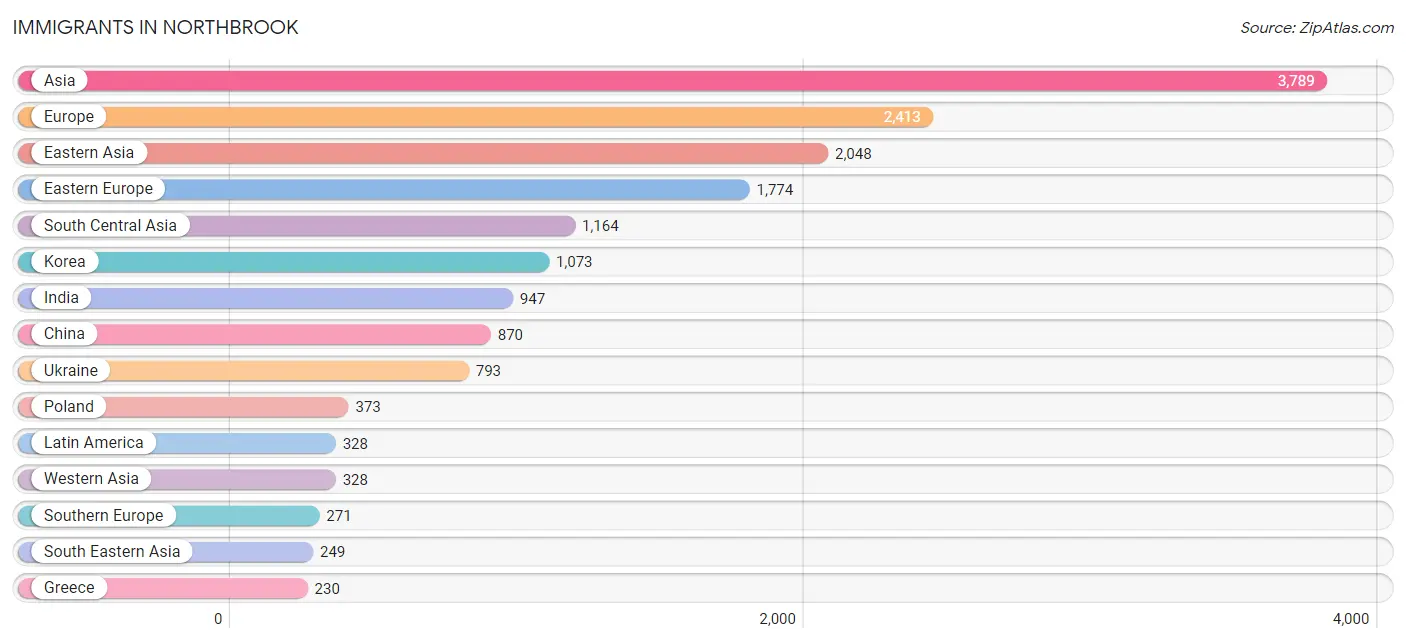
The most numerous immigrant groups reported in Northbrook came from Asia (3,789 | 10.8%), Europe (2,413 | 6.9%), Eastern Asia (2,048 | 5.9%), Eastern Europe (1,774 | 5.1%), and South Central Asia (1,164 | 3.3%), together accounting for 32.0% of all Northbrook residents.
| Immigration Origin | # Population | % Population |
| Africa | 221 | 0.6% |
| Albania | 13 | 0.0% |
| Argentina | 16 | 0.1% |
| Asia | 3,789 | 10.8% |
| Australia | 21 | 0.1% |
| Belarus | 29 | 0.1% |
| Belgium | 9 | 0.0% |
| Bulgaria | 88 | 0.3% |
| Cambodia | 15 | 0.0% |
| Canada | 207 | 0.6% |
| Caribbean | 63 | 0.2% |
| Central America | 192 | 0.5% |
| Chile | 32 | 0.1% |
| China | 870 | 2.5% |
| Cuba | 23 | 0.1% |
| Denmark | 34 | 0.1% |
| Eastern Africa | 53 | 0.2% |
| Eastern Asia | 2,048 | 5.9% |
| Eastern Europe | 1,774 | 5.1% |
| Egypt | 99 | 0.3% |
| El Salvador | 14 | 0.0% |
| England | 19 | 0.1% |
| Europe | 2,413 | 6.9% |
| Germany | 154 | 0.4% |
| Greece | 230 | 0.7% |
| Haiti | 7 | 0.0% |
| Hong Kong | 142 | 0.4% |
| Hungary | 6 | 0.0% |
| India | 947 | 2.7% |
| Iran | 116 | 0.3% |
| Iraq | 91 | 0.3% |
| Ireland | 9 | 0.0% |
| Israel | 46 | 0.1% |
| Italy | 13 | 0.0% |
| Jamaica | 26 | 0.1% |
| Japan | 88 | 0.3% |
| Jordan | 4 | 0.0% |
| Kenya | 26 | 0.1% |
| Korea | 1,073 | 3.1% |
| Kuwait | 53 | 0.2% |
| Latin America | 328 | 0.9% |
| Latvia | 32 | 0.1% |
| Lebanon | 65 | 0.2% |
| Mexico | 155 | 0.4% |
| Nepal | 28 | 0.1% |
| Netherlands | 12 | 0.0% |
| North Macedonia | 7 | 0.0% |
| Northern Africa | 99 | 0.3% |
| Northern Europe | 139 | 0.4% |
| Norway | 22 | 0.1% |
| Oceania | 21 | 0.1% |
| Pakistan | 18 | 0.1% |
| Panama | 23 | 0.1% |
| Peru | 12 | 0.0% |
| Philippines | 157 | 0.4% |
| Poland | 373 | 1.1% |
| Portugal | 28 | 0.1% |
| Romania | 73 | 0.2% |
| Russia | 223 | 0.6% |
| Saudi Arabia | 46 | 0.1% |
| Serbia | 24 | 0.1% |
| Singapore | 17 | 0.1% |
| South Africa | 62 | 0.2% |
| South America | 73 | 0.2% |
| South Central Asia | 1,164 | 3.3% |
| South Eastern Asia | 249 | 0.7% |
| Southern Europe | 271 | 0.8% |
| Syria | 9 | 0.0% |
| Taiwan | 171 | 0.5% |
| Thailand | 38 | 0.1% |
| Trinidad and Tobago | 7 | 0.0% |
| Uganda | 22 | 0.1% |
| Ukraine | 793 | 2.3% |
| Uzbekistan | 55 | 0.2% |
| Venezuela | 13 | 0.0% |
| Vietnam | 22 | 0.1% |
| Western Africa | 7 | 0.0% |
| Western Asia | 328 | 0.9% |
| Western Europe | 175 | 0.5% |
| Zimbabwe | 5 | 0.0% | View All 80 Rows |
Sex and Age in Northbrook
Sex and Age in Northbrook
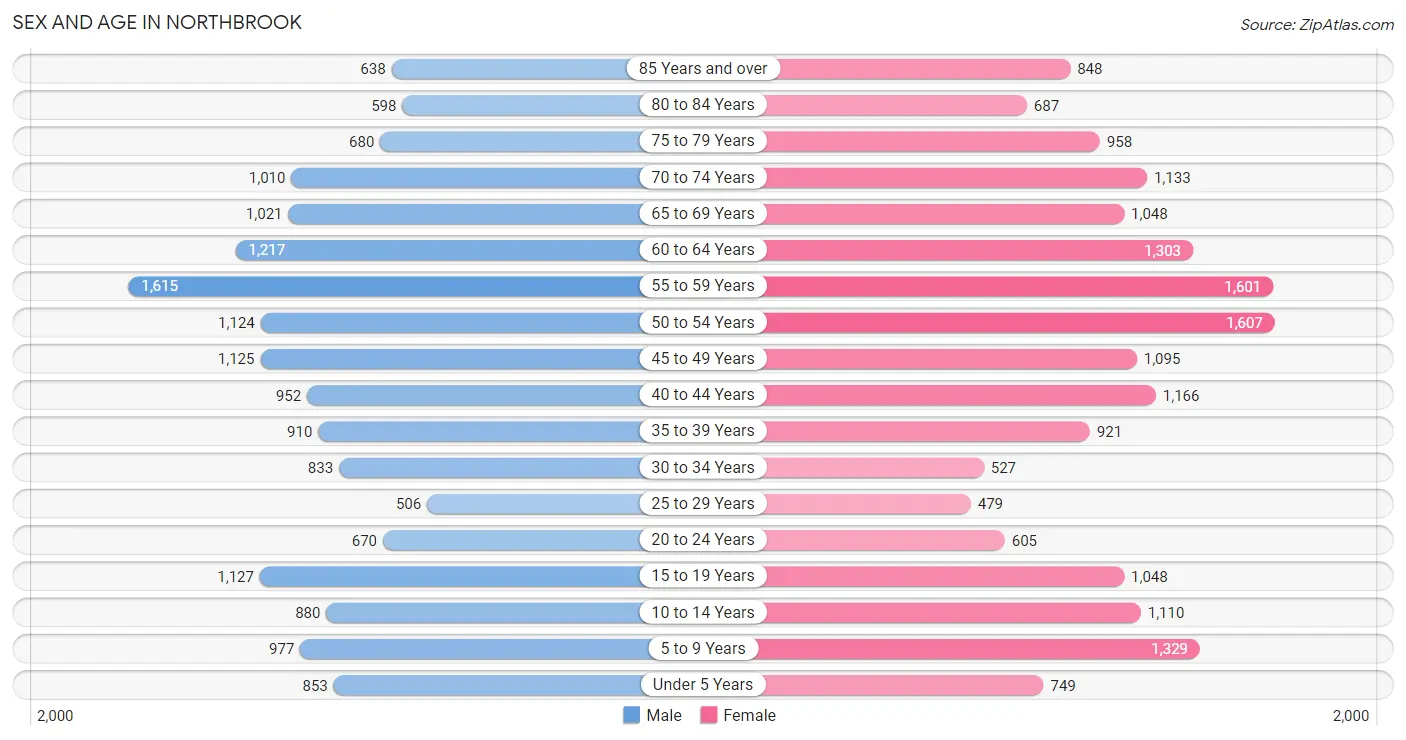
The most populous age groups in Northbrook are 55 to 59 Years (1,615 | 9.7%) for men and 50 to 54 Years (1,607 | 8.8%) for women.
| Age Bracket | Male | Female |
| Under 5 Years | 853 (5.1%) | 749 (4.1%) |
| 5 to 9 Years | 977 (5.8%) | 1,329 (7.3%) |
| 10 to 14 Years | 880 (5.3%) | 1,110 (6.1%) |
| 15 to 19 Years | 1,127 (6.7%) | 1,048 (5.8%) |
| 20 to 24 Years | 670 (4.0%) | 605 (3.3%) |
| 25 to 29 Years | 506 (3.0%) | 479 (2.6%) |
| 30 to 34 Years | 833 (5.0%) | 527 (2.9%) |
| 35 to 39 Years | 910 (5.4%) | 921 (5.1%) |
| 40 to 44 Years | 952 (5.7%) | 1,166 (6.4%) |
| 45 to 49 Years | 1,125 (6.7%) | 1,095 (6.0%) |
| 50 to 54 Years | 1,124 (6.7%) | 1,607 (8.8%) |
| 55 to 59 Years | 1,615 (9.7%) | 1,601 (8.8%) |
| 60 to 64 Years | 1,217 (7.3%) | 1,303 (7.1%) |
| 65 to 69 Years | 1,021 (6.1%) | 1,048 (5.8%) |
| 70 to 74 Years | 1,010 (6.0%) | 1,133 (6.2%) |
| 75 to 79 Years | 680 (4.1%) | 958 (5.3%) |
| 80 to 84 Years | 598 (3.6%) | 687 (3.8%) |
| 85 Years and over | 638 (3.8%) | 848 (4.7%) |
| Total | 16,736 (100.0%) | 18,214 (100.0%) |
Families and Households in Northbrook
Median Family Size in Northbrook
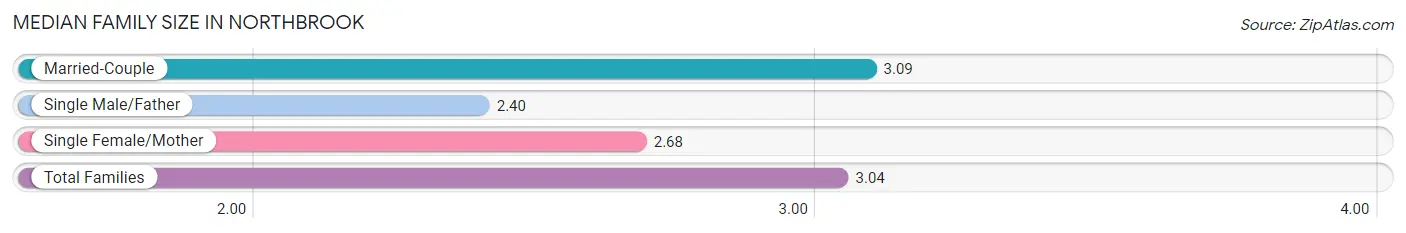
The median family size in Northbrook is 3.04 persons per family, with married-couple families (8,715 | 89.2%) accounting for the largest median family size of 3.09 persons per family. On the other hand, single male/father families (236 | 2.4%) represent the smallest median family size with 2.40 persons per family.
| Family Type | # Families | Family Size |
| Married-Couple | 8,715 (89.2%) | 3.09 |
| Single Male/Father | 236 (2.4%) | 2.40 |
| Single Female/Mother | 819 (8.4%) | 2.68 |
| Total Families | 9,770 (100.0%) | 3.04 |
Median Household Size in Northbrook
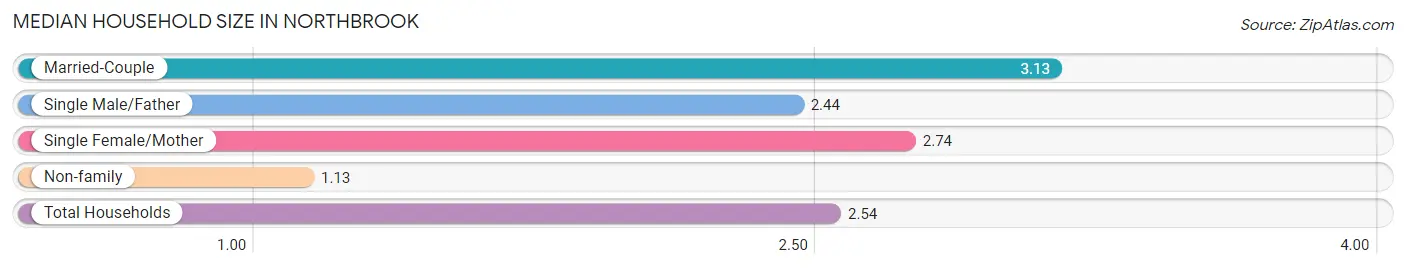
The median household size in Northbrook is 2.54 persons per household, with married-couple households (8,715 | 64.6%) accounting for the largest median household size of 3.13 persons per household. non-family households (3,711 | 27.5%) represent the smallest median household size with 1.13 persons per household.
| Household Type | # Households | Household Size |
| Married-Couple | 8,715 (64.6%) | 3.13 |
| Single Male/Father | 236 (1.8%) | 2.44 |
| Single Female/Mother | 819 (6.1%) | 2.74 |
| Non-family | 3,711 (27.5%) | 1.13 |
| Total Households | 13,481 (100.0%) | 2.54 |
Household Size by Marriage Status in Northbrook
Out of a total of 13,481 households in Northbrook, 9,770 (72.5%) are family households, while 3,711 (27.5%) are nonfamily households. The most numerous type of family households are 2-person households, comprising 4,701, and the most common type of nonfamily households are 1-person households, comprising 3,225.
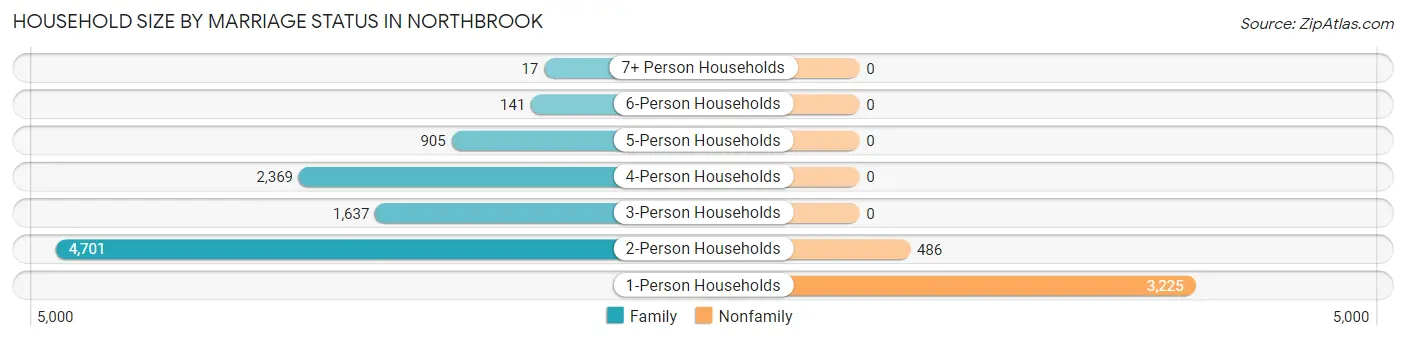
| Household Size | Family Households | Nonfamily Households |
| 1-Person Households | - | 3,225 (23.9%) |
| 2-Person Households | 4,701 (34.9%) | 486 (3.6%) |
| 3-Person Households | 1,637 (12.1%) | 0 (0.0%) |
| 4-Person Households | 2,369 (17.6%) | 0 (0.0%) |
| 5-Person Households | 905 (6.7%) | 0 (0.0%) |
| 6-Person Households | 141 (1.1%) | 0 (0.0%) |
| 7+ Person Households | 17 (0.1%) | 0 (0.0%) |
| Total | 9,770 (72.5%) | 3,711 (27.5%) |
Female Fertility in Northbrook
Fertility by Age in Northbrook
Average fertility rate in Northbrook is 46.0 births per 1,000 women. Women in the age bracket of 20 to 34 years have the highest fertility rate with 109.0 births per 1,000 women. Women in the age bracket of 20 to 34 years acount for 61.1% of all women with births.
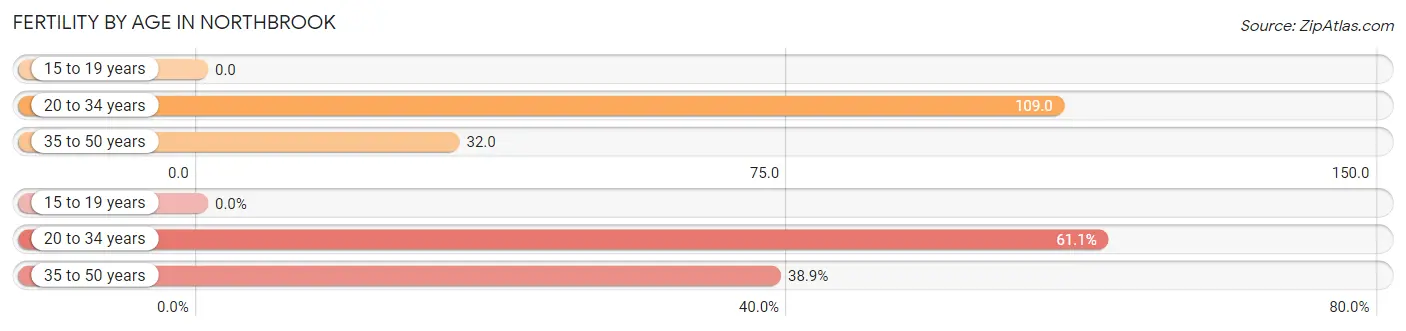
| Age Bracket | Women with Births | Births / 1,000 Women |
| 15 to 19 years | 0 (0.0%) | 0.0 |
| 20 to 34 years | 176 (61.1%) | 109.0 |
| 35 to 50 years | 112 (38.9%) | 32.0 |
| Total | 288 (100.0%) | 46.0 |
Fertility by Age by Marriage Status in Northbrook
95.5% of women with births (288) in Northbrook are married. The highest percentage of unmarried women with births falls into 20 to 34 years age bracket with 7.4% of them unmarried at the time of birth, while the lowest percentage of unmarried women with births belong to 35 to 50 years age bracket with 0.0% of them unmarried.
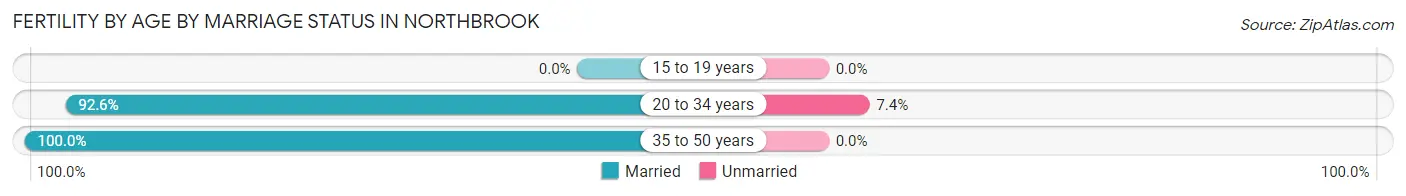
| Age Bracket | Married | Unmarried |
| 15 to 19 years | 0 (0.0%) | 0 (0.0%) |
| 20 to 34 years | 163 (92.6%) | 13 (7.4%) |
| 35 to 50 years | 112 (100.0%) | 0 (0.0%) |
| Total | 275 (95.5%) | 13 (4.5%) |
Fertility by Education in Northbrook
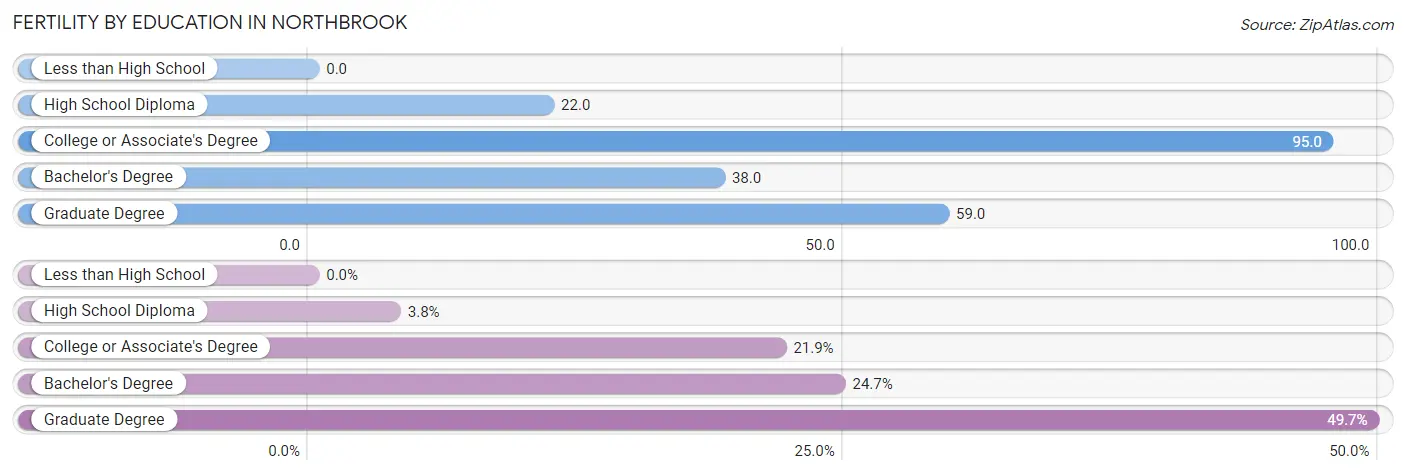
| Educational Attainment | Women with Births | Births / 1,000 Women |
| Less than High School | 0 (0.0%) | 0.0 |
| High School Diploma | 11 (3.8%) | 22.0 |
| College or Associate's Degree | 63 (21.9%) | 95.0 |
| Bachelor's Degree | 71 (24.6%) | 38.0 |
| Graduate Degree | 143 (49.6%) | 59.0 |
| Total | 288 (100.0%) | 46.0 |
Fertility by Education by Marriage Status in Northbrook
4.5% of women with births in Northbrook are unmarried. Women with the educational attainment of high school diploma are most likely to be married with 100.0% of them married at childbirth, while women with the educational attainment of college or associate's degree are least likely to be married with 20.6% of them unmarried at childbirth.
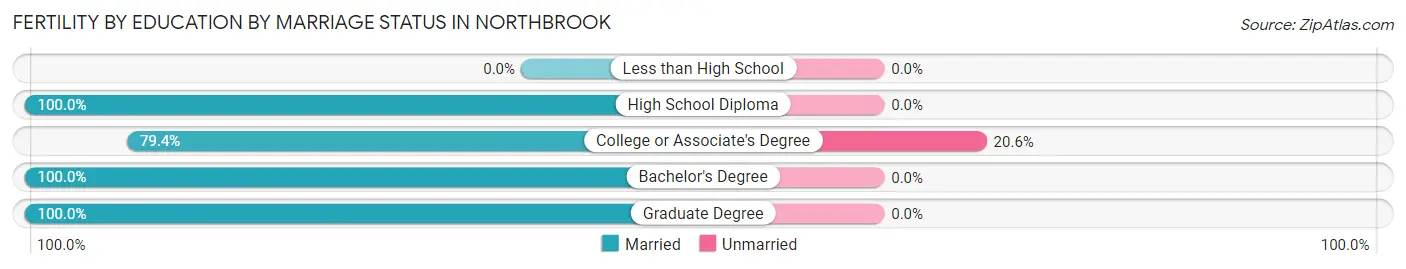
| Educational Attainment | Married | Unmarried |
| Less than High School | 0 (0.0%) | 0 (0.0%) |
| High School Diploma | 11 (100.0%) | 0 (0.0%) |
| College or Associate's Degree | 50 (79.4%) | 13 (20.6%) |
| Bachelor's Degree | 71 (100.0%) | 0 (0.0%) |
| Graduate Degree | 143 (100.0%) | 0 (0.0%) |
| Total | 275 (95.5%) | 13 (4.5%) |
Employment Characteristics in Northbrook
Employment by Class of Employer in Northbrook
Among the 16,523 employed individuals in Northbrook, private company employees (10,452 | 63.3%), self-employed (incorporated) (2,330 | 14.1%), and not-for-profit organizations (1,455 | 8.8%) make up the most common classes of employment.
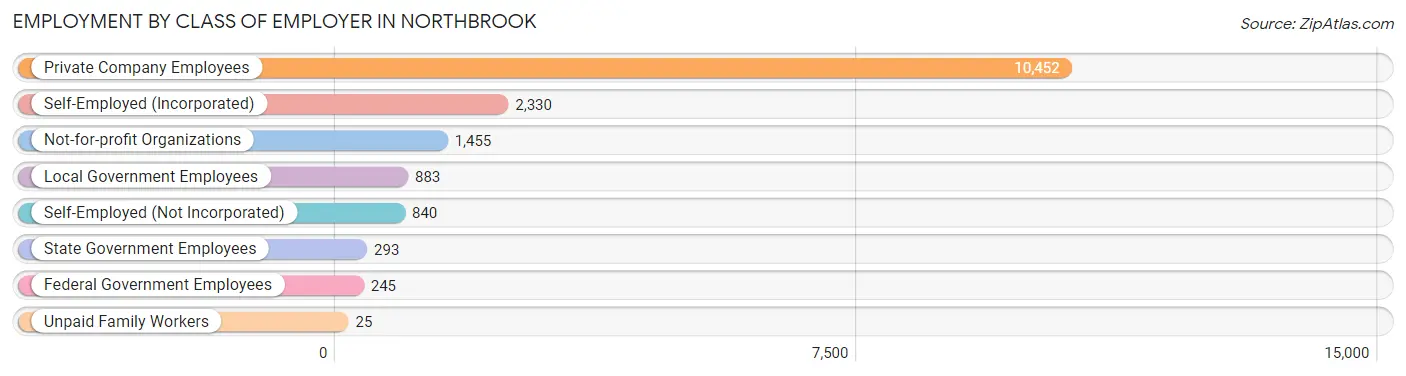
| Employer Class | # Employees | % Employees |
| Private Company Employees | 10,452 | 63.3% |
| Self-Employed (Incorporated) | 2,330 | 14.1% |
| Self-Employed (Not Incorporated) | 840 | 5.1% |
| Not-for-profit Organizations | 1,455 | 8.8% |
| Local Government Employees | 883 | 5.3% |
| State Government Employees | 293 | 1.8% |
| Federal Government Employees | 245 | 1.5% |
| Unpaid Family Workers | 25 | 0.2% |
| Total | 16,523 | 100.0% |
Employment Status by Age in Northbrook
According to the labor force statistics for Northbrook, out of the total population over 16 years of age (28,698), 60.2% or 17,276 individuals are in the labor force, with 3.2% or 553 of them unemployed. The age group with the highest labor force participation rate is 35 to 44 years, with 90.0% or 3,554 individuals in the labor force. Within the labor force, the 16 to 19 years age range has the highest percentage of unemployed individuals, with 13.8% or 69 of them being unemployed.
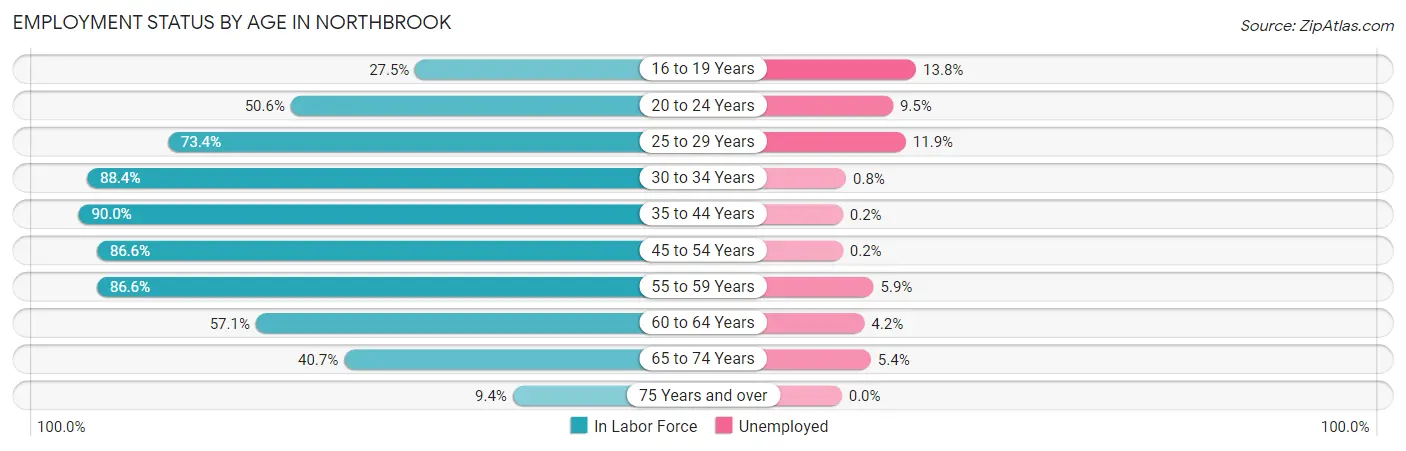
| Age Bracket | In Labor Force | Unemployed |
| 16 to 19 Years | 501 (27.5%) | 69 (13.8%) |
| 20 to 24 Years | 645 (50.6%) | 61 (9.5%) |
| 25 to 29 Years | 723 (73.4%) | 86 (11.9%) |
| 30 to 34 Years | 1,202 (88.4%) | 10 (0.8%) |
| 35 to 44 Years | 3,554 (90.0%) | 7 (0.2%) |
| 45 to 54 Years | 4,288 (86.6%) | 9 (0.2%) |
| 55 to 59 Years | 2,785 (86.6%) | 164 (5.9%) |
| 60 to 64 Years | 1,439 (57.1%) | 60 (4.2%) |
| 65 to 74 Years | 1,714 (40.7%) | 93 (5.4%) |
| 75 Years and over | 414 (9.4%) | 0 (0.0%) |
| Total | 17,276 (60.2%) | 553 (3.2%) |
Employment Status by Educational Attainment in Northbrook
According to labor force statistics for Northbrook, 82.4% of individuals (13,992) out of the total population between 25 and 64 years of age (16,981) are in the labor force, with 2.4% or 336 of them being unemployed. The group with the highest labor force participation rate are those with the educational attainment of bachelor's degree or higher, with 84.1% or 11,004 individuals in the labor force. Within the labor force, individuals with less than high school education have the highest percentage of unemployment, with 20.1% or 54 of them being unemployed.
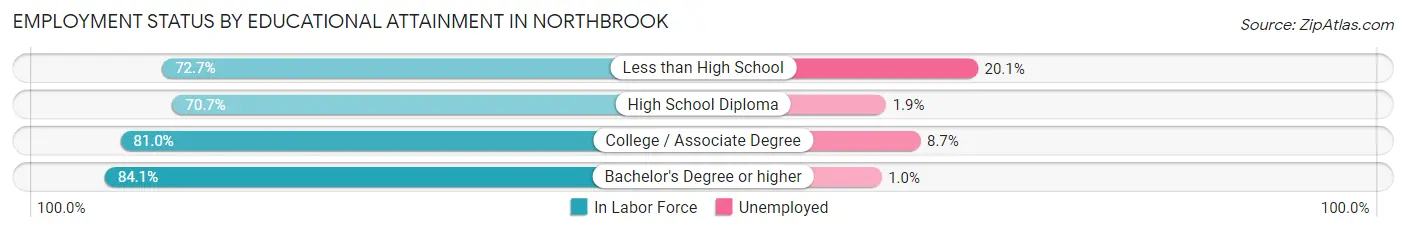
| Educational Attainment | In Labor Force | Unemployed |
| Less than High School | 269 (72.7%) | 74 (20.1%) |
| High School Diploma | 930 (70.7%) | 25 (1.9%) |
| College / Associate Degree | 1,792 (81.0%) | 192 (8.7%) |
| Bachelor's Degree or higher | 11,004 (84.1%) | 131 (1.0%) |
| Total | 13,992 (82.4%) | 408 (2.4%) |
Employment Occupations by Sex in Northbrook
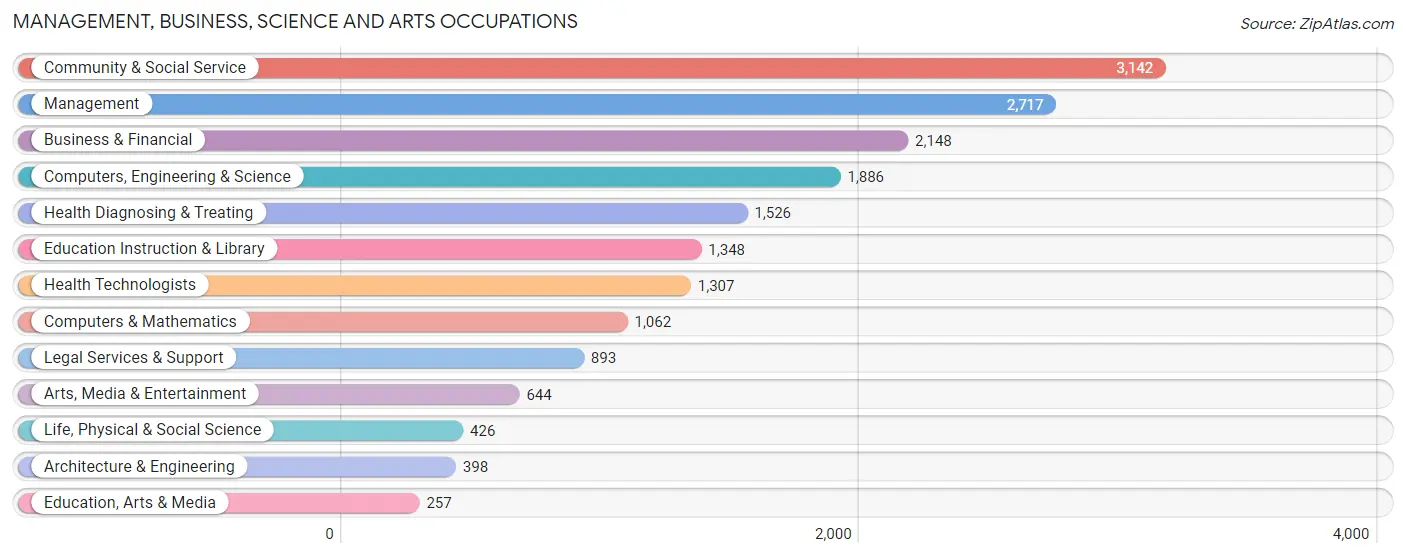
Management, Business, Science and Arts Occupations
The most common Management, Business, Science and Arts occupations in Northbrook are Community & Social Service (3,142 | 18.8%), Management (2,717 | 16.3%), Business & Financial (2,148 | 12.9%), Computers, Engineering & Science (1,886 | 11.3%), and Health Diagnosing & Treating (1,526 | 9.1%).
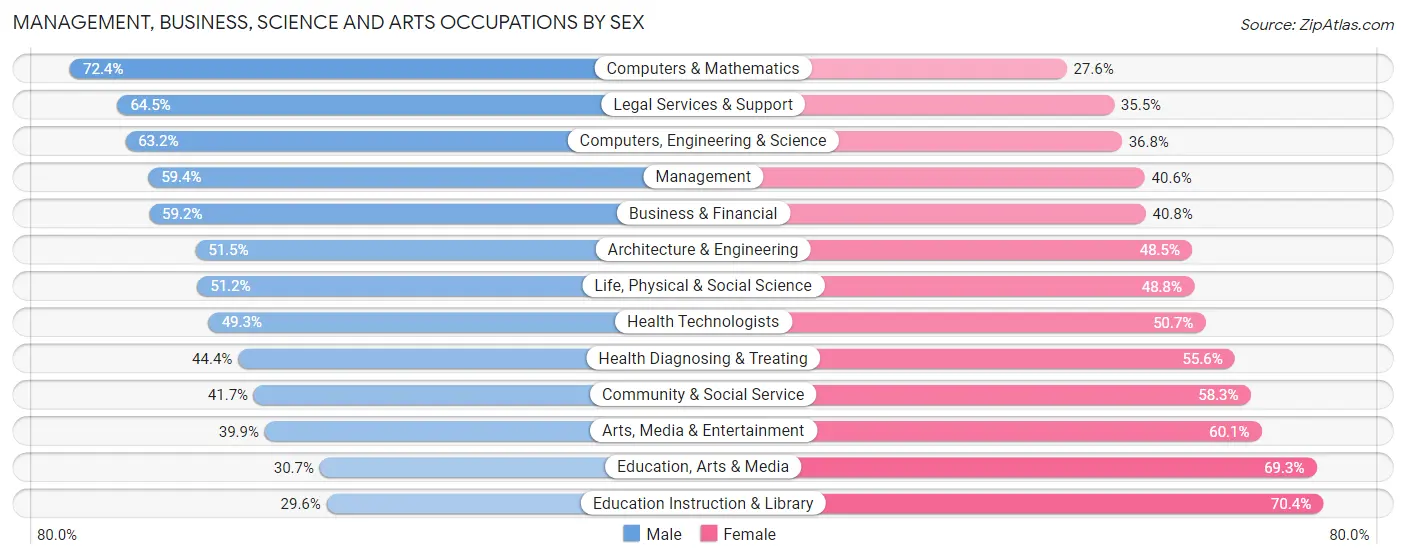
Management, Business, Science and Arts Occupations by Sex
Within the Management, Business, Science and Arts occupations in Northbrook, the most male-oriented occupations are Computers & Mathematics (72.4%), Legal Services & Support (64.5%), and Computers, Engineering & Science (63.2%), while the most female-oriented occupations are Education Instruction & Library (70.4%), Education, Arts & Media (69.3%), and Arts, Media & Entertainment (60.1%).
| Occupation | Male | Female |
| Management | 1,613 (59.4%) | 1,104 (40.6%) |
| Business & Financial | 1,272 (59.2%) | 876 (40.8%) |
| Computers, Engineering & Science | 1,192 (63.2%) | 694 (36.8%) |
| Computers & Mathematics | 769 (72.4%) | 293 (27.6%) |
| Architecture & Engineering | 205 (51.5%) | 193 (48.5%) |
| Life, Physical & Social Science | 218 (51.2%) | 208 (48.8%) |
| Community & Social Service | 1,311 (41.7%) | 1,831 (58.3%) |
| Education, Arts & Media | 79 (30.7%) | 178 (69.3%) |
| Legal Services & Support | 576 (64.5%) | 317 (35.5%) |
| Education Instruction & Library | 399 (29.6%) | 949 (70.4%) |
| Arts, Media & Entertainment | 257 (39.9%) | 387 (60.1%) |
| Health Diagnosing & Treating | 677 (44.4%) | 849 (55.6%) |
| Health Technologists | 644 (49.3%) | 663 (50.7%) |
| Total (Category) | 6,065 (53.1%) | 5,354 (46.9%) |
| Total (Overall) | 9,042 (54.1%) | 7,666 (45.9%) |
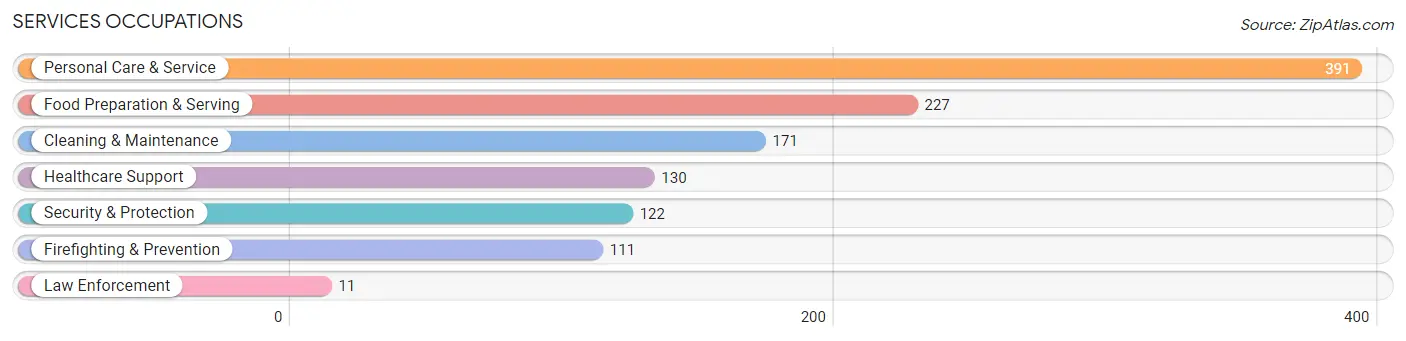
Services Occupations
The most common Services occupations in Northbrook are Personal Care & Service (391 | 2.3%), Food Preparation & Serving (227 | 1.4%), Cleaning & Maintenance (171 | 1.0%), Healthcare Support (130 | 0.8%), and Security & Protection (122 | 0.7%).
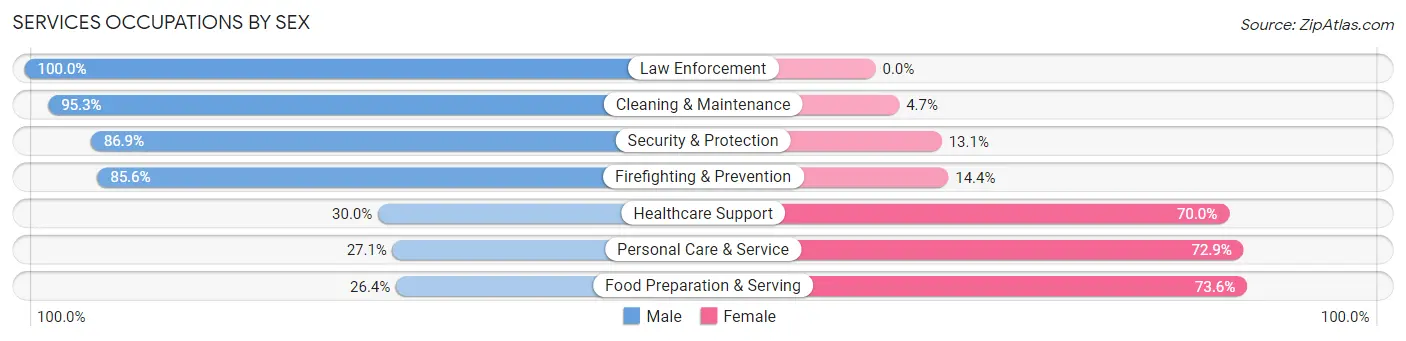
Services Occupations by Sex
Within the Services occupations in Northbrook, the most male-oriented occupations are Law Enforcement (100.0%), Cleaning & Maintenance (95.3%), and Security & Protection (86.9%), while the most female-oriented occupations are Food Preparation & Serving (73.6%), Personal Care & Service (72.9%), and Healthcare Support (70.0%).
| Occupation | Male | Female |
| Healthcare Support | 39 (30.0%) | 91 (70.0%) |
| Security & Protection | 106 (86.9%) | 16 (13.1%) |
| Firefighting & Prevention | 95 (85.6%) | 16 (14.4%) |
| Law Enforcement | 11 (100.0%) | 0 (0.0%) |
| Food Preparation & Serving | 60 (26.4%) | 167 (73.6%) |
| Cleaning & Maintenance | 163 (95.3%) | 8 (4.7%) |
| Personal Care & Service | 106 (27.1%) | 285 (72.9%) |
| Total (Category) | 474 (45.5%) | 567 (54.5%) |
| Total (Overall) | 9,042 (54.1%) | 7,666 (45.9%) |
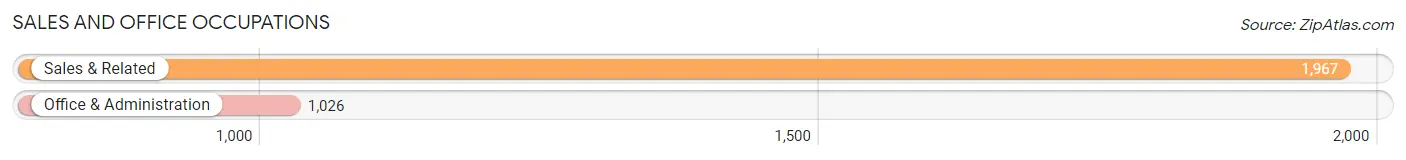
Sales and Office Occupations
The most common Sales and Office occupations in Northbrook are Sales & Related (1,967 | 11.8%), and Office & Administration (1,026 | 6.1%).
Sales and Office Occupations by Sex
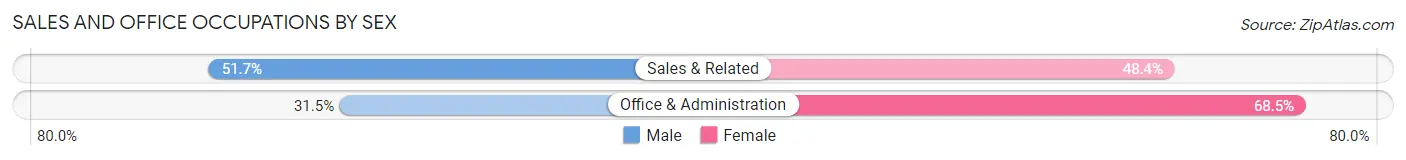
| Occupation | Male | Female |
| Sales & Related | 1,016 (51.6%) | 951 (48.3%) |
| Office & Administration | 323 (31.5%) | 703 (68.5%) |
| Total (Category) | 1,339 (44.7%) | 1,654 (55.3%) |
| Total (Overall) | 9,042 (54.1%) | 7,666 (45.9%) |
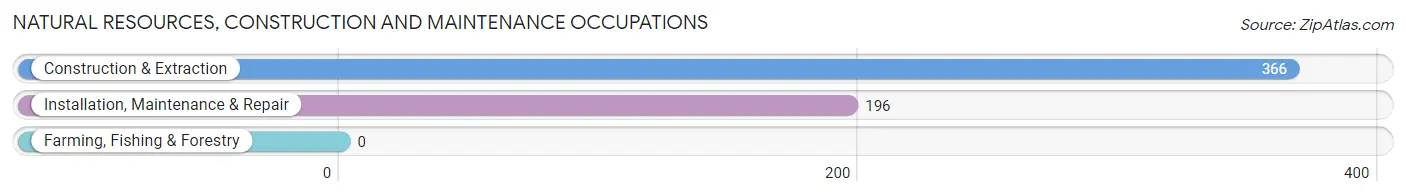
Natural Resources, Construction and Maintenance Occupations
The most common Natural Resources, Construction and Maintenance occupations in Northbrook are Construction & Extraction (366 | 2.2%), and Installation, Maintenance & Repair (196 | 1.2%).
Natural Resources, Construction and Maintenance Occupations by Sex
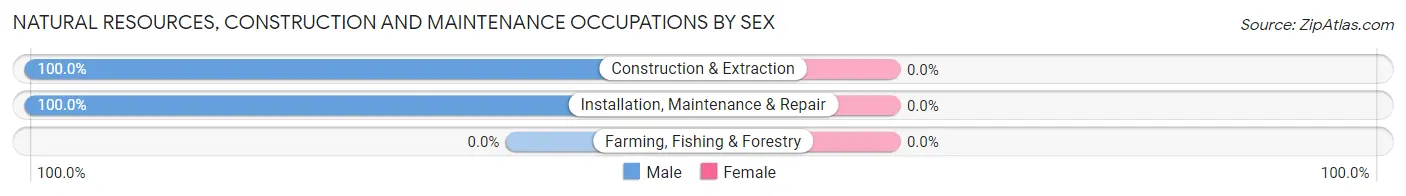
| Occupation | Male | Female |
| Farming, Fishing & Forestry | 0 (0.0%) | 0 (0.0%) |
| Construction & Extraction | 366 (100.0%) | 0 (0.0%) |
| Installation, Maintenance & Repair | 196 (100.0%) | 0 (0.0%) |
| Total (Category) | 562 (100.0%) | 0 (0.0%) |
| Total (Overall) | 9,042 (54.1%) | 7,666 (45.9%) |
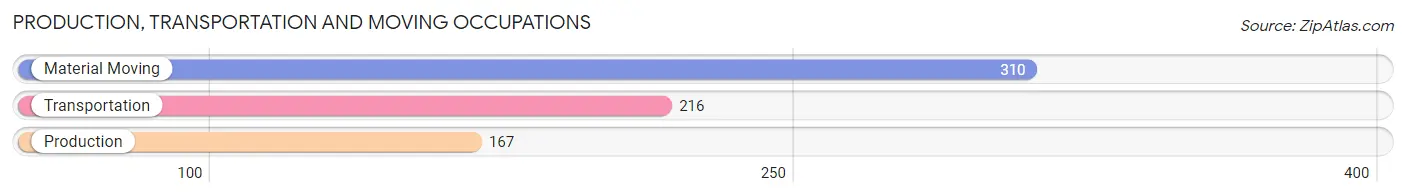
Production, Transportation and Moving Occupations
The most common Production, Transportation and Moving occupations in Northbrook are Material Moving (310 | 1.9%), Transportation (216 | 1.3%), and Production (167 | 1.0%).
Production, Transportation and Moving Occupations by Sex
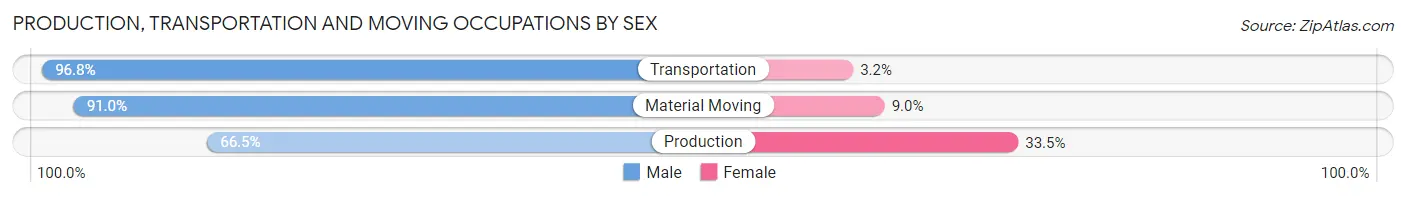
| Occupation | Male | Female |
| Production | 111 (66.5%) | 56 (33.5%) |
| Transportation | 209 (96.8%) | 7 (3.2%) |
| Material Moving | 282 (91.0%) | 28 (9.0%) |
| Total (Category) | 602 (86.9%) | 91 (13.1%) |
| Total (Overall) | 9,042 (54.1%) | 7,666 (45.9%) |
Employment Industries by Sex in Northbrook
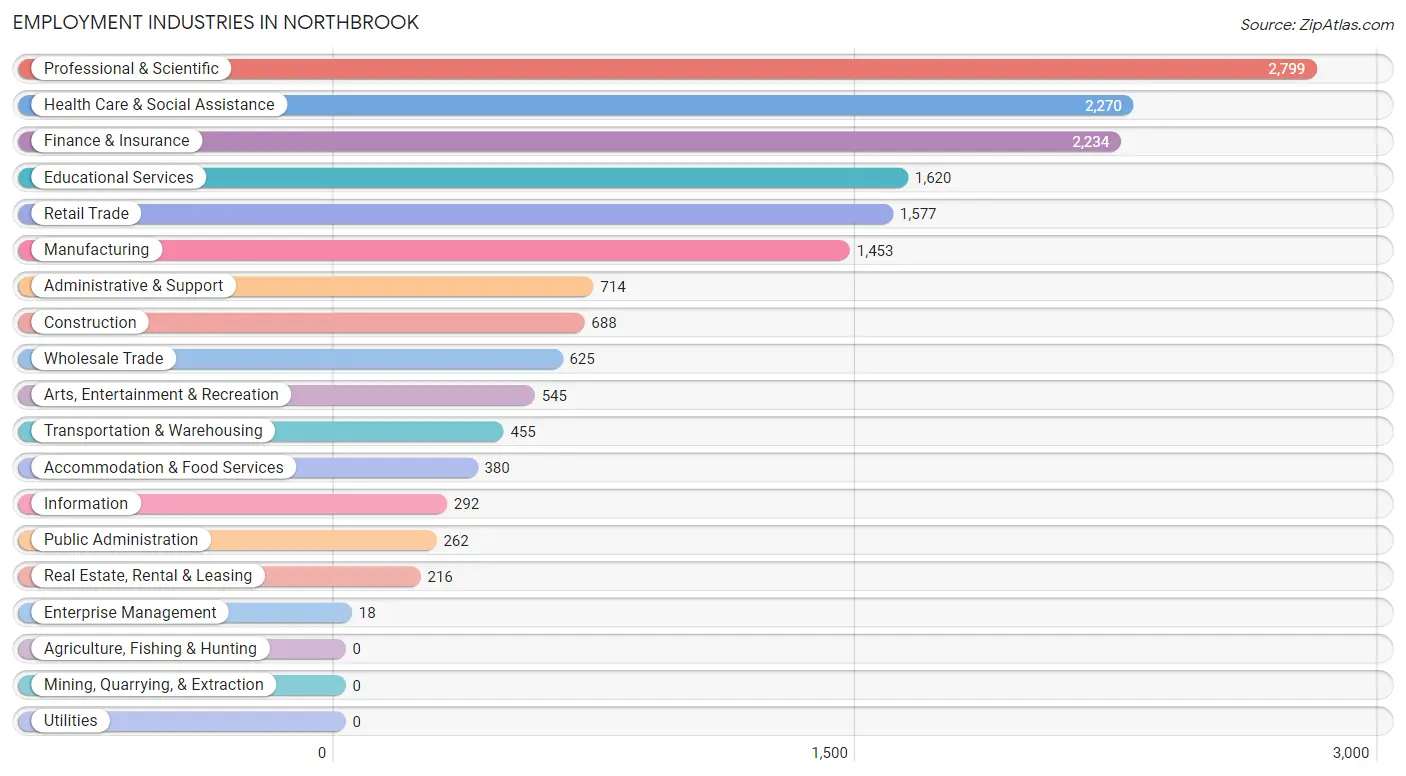
Employment Industries in Northbrook
The major employment industries in Northbrook include Professional & Scientific (2,799 | 16.8%), Health Care & Social Assistance (2,270 | 13.6%), Finance & Insurance (2,234 | 13.4%), Educational Services (1,620 | 9.7%), and Retail Trade (1,577 | 9.4%).
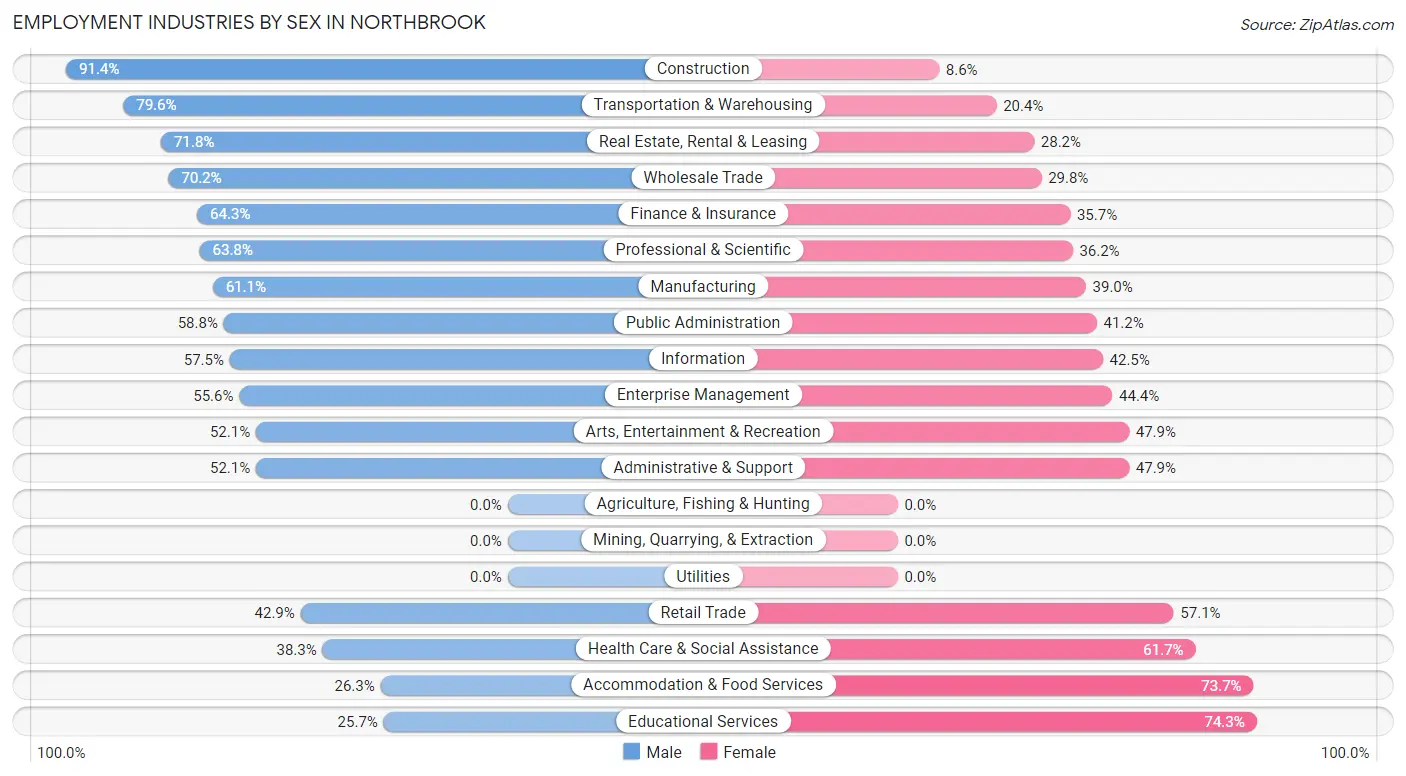
Employment Industries by Sex in Northbrook
The Northbrook industries that see more men than women are Construction (91.4%), Transportation & Warehousing (79.6%), and Real Estate, Rental & Leasing (71.8%), whereas the industries that tend to have a higher number of women are Educational Services (74.3%), Accommodation & Food Services (73.7%), and Health Care & Social Assistance (61.7%).
| Industry | Male | Female |
| Agriculture, Fishing & Hunting | 0 (0.0%) | 0 (0.0%) |
| Mining, Quarrying, & Extraction | 0 (0.0%) | 0 (0.0%) |
| Construction | 629 (91.4%) | 59 (8.6%) |
| Manufacturing | 887 (61.1%) | 566 (39.0%) |
| Wholesale Trade | 439 (70.2%) | 186 (29.8%) |
| Retail Trade | 676 (42.9%) | 901 (57.1%) |
| Transportation & Warehousing | 362 (79.6%) | 93 (20.4%) |
| Utilities | 0 (0.0%) | 0 (0.0%) |
| Information | 168 (57.5%) | 124 (42.5%) |
| Finance & Insurance | 1,436 (64.3%) | 798 (35.7%) |
| Real Estate, Rental & Leasing | 155 (71.8%) | 61 (28.2%) |
| Professional & Scientific | 1,785 (63.8%) | 1,014 (36.2%) |
| Enterprise Management | 10 (55.6%) | 8 (44.4%) |
| Administrative & Support | 372 (52.1%) | 342 (47.9%) |
| Educational Services | 416 (25.7%) | 1,204 (74.3%) |
| Health Care & Social Assistance | 870 (38.3%) | 1,400 (61.7%) |
| Arts, Entertainment & Recreation | 284 (52.1%) | 261 (47.9%) |
| Accommodation & Food Services | 100 (26.3%) | 280 (73.7%) |
| Public Administration | 154 (58.8%) | 108 (41.2%) |
| Total | 9,042 (54.1%) | 7,666 (45.9%) |
Education in Northbrook
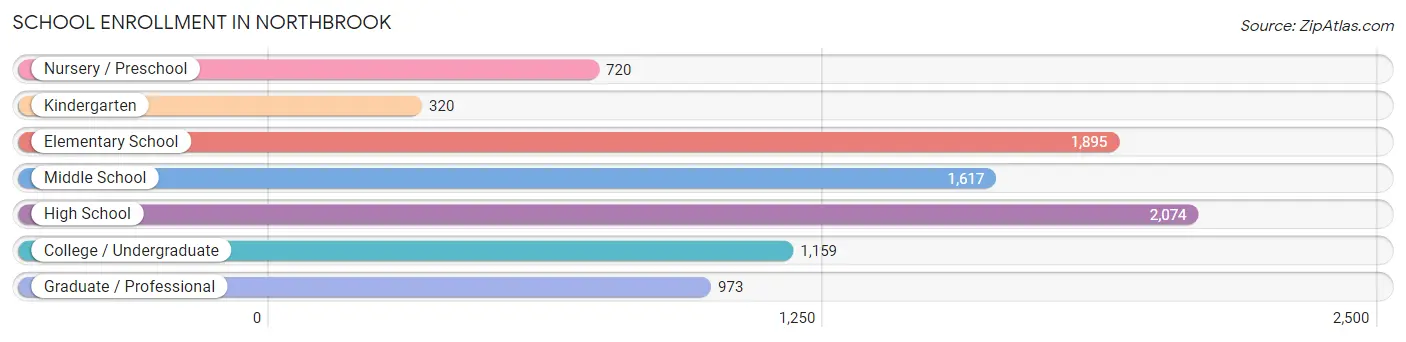
School Enrollment in Northbrook
The most common levels of schooling among the 8,758 students in Northbrook are high school (2,074 | 23.7%), elementary school (1,895 | 21.6%), and middle school (1,617 | 18.5%).
| School Level | # Students | % Students |
| Nursery / Preschool | 720 | 8.2% |
| Kindergarten | 320 | 3.6% |
| Elementary School | 1,895 | 21.6% |
| Middle School | 1,617 | 18.5% |
| High School | 2,074 | 23.7% |
| College / Undergraduate | 1,159 | 13.2% |
| Graduate / Professional | 973 | 11.1% |
| Total | 8,758 | 100.0% |
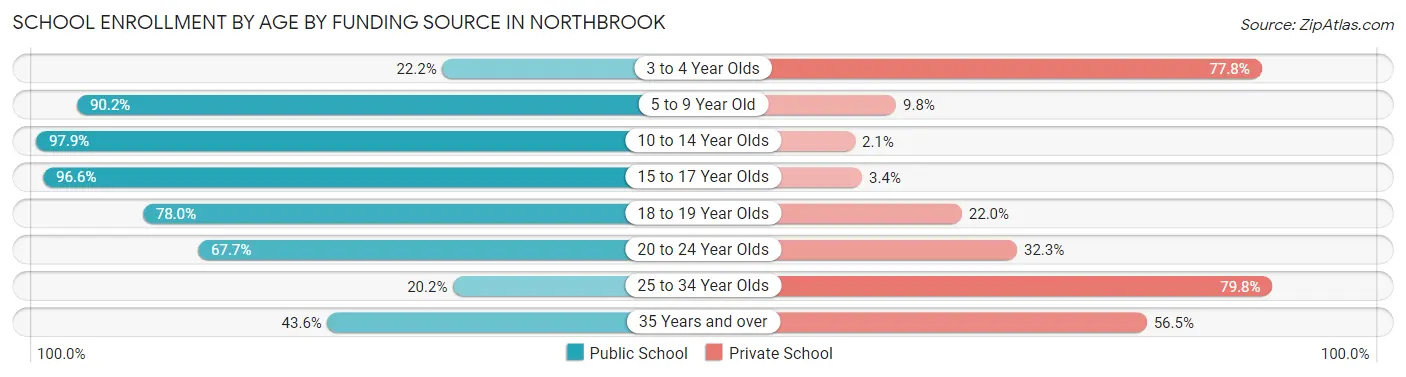
School Enrollment by Age by Funding Source in Northbrook
Out of a total of 8,758 students who are enrolled in schools in Northbrook, 1,909 (21.8%) attend a private institution, while the remaining 6,849 (78.2%) are enrolled in public schools. The age group of 25 to 34 year olds has the highest likelihood of being enrolled in private schools, with 491 (79.8% in the age bracket) enrolled. Conversely, the age group of 10 to 14 year olds has the lowest likelihood of being enrolled in a private school, with 1,896 (97.9% in the age bracket) attending a public institution.
| Age Bracket | Public School | Private School |
| 3 to 4 Year Olds | 129 (22.2%) | 453 (77.8%) |
| 5 to 9 Year Old | 2,025 (90.2%) | 219 (9.8%) |
| 10 to 14 Year Olds | 1,896 (97.9%) | 41 (2.1%) |
| 15 to 17 Year Olds | 1,265 (96.6%) | 45 (3.4%) |
| 18 to 19 Year Olds | 641 (78.0%) | 181 (22.0%) |
| 20 to 24 Year Olds | 635 (67.7%) | 303 (32.3%) |
| 25 to 34 Year Olds | 124 (20.2%) | 491 (79.8%) |
| 35 Years and over | 135 (43.5%) | 175 (56.5%) |
| Total | 6,849 (78.2%) | 1,909 (21.8%) |
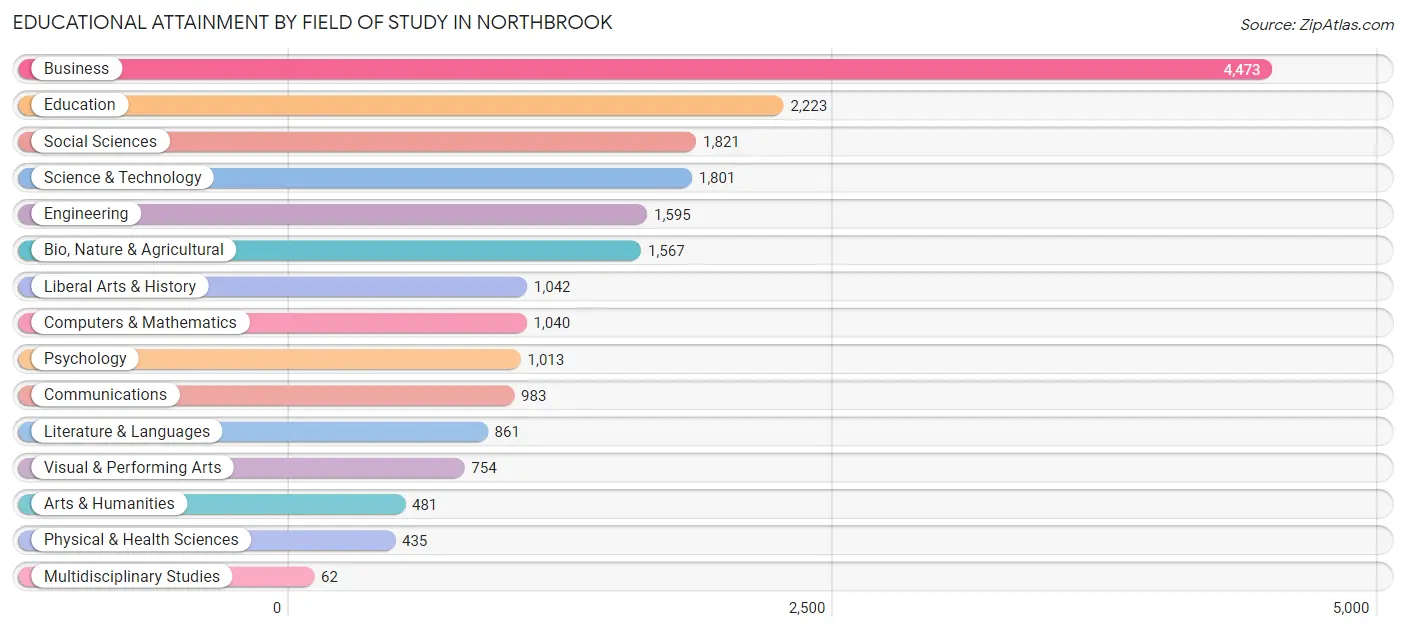
Educational Attainment by Field of Study in Northbrook
Business (4,473 | 22.2%), education (2,223 | 11.0%), social sciences (1,821 | 9.0%), science & technology (1,801 | 8.9%), and engineering (1,595 | 7.9%) are the most common fields of study among 20,151 individuals in Northbrook who have obtained a bachelor's degree or higher.
| Field of Study | # Graduates | % Graduates |
| Computers & Mathematics | 1,040 | 5.2% |
| Bio, Nature & Agricultural | 1,567 | 7.8% |
| Physical & Health Sciences | 435 | 2.2% |
| Psychology | 1,013 | 5.0% |
| Social Sciences | 1,821 | 9.0% |
| Engineering | 1,595 | 7.9% |
| Multidisciplinary Studies | 62 | 0.3% |
| Science & Technology | 1,801 | 8.9% |
| Business | 4,473 | 22.2% |
| Education | 2,223 | 11.0% |
| Literature & Languages | 861 | 4.3% |
| Liberal Arts & History | 1,042 | 5.2% |
| Visual & Performing Arts | 754 | 3.7% |
| Communications | 983 | 4.9% |
| Arts & Humanities | 481 | 2.4% |
| Total | 20,151 | 100.0% |
Transportation & Commute in Northbrook
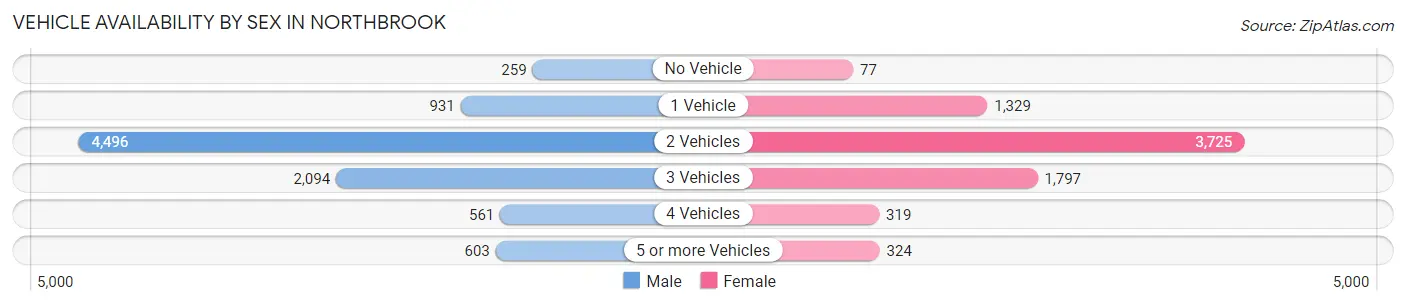
Vehicle Availability by Sex in Northbrook
The most prevalent vehicle ownership categories in Northbrook are males with 2 vehicles (4,496, accounting for 50.3%) and females with 2 vehicles (3,725, making up 59.4%).
| Vehicles Available | Male | Female |
| No Vehicle | 259 (2.9%) | 77 (1.0%) |
| 1 Vehicle | 931 (10.4%) | 1,329 (17.5%) |
| 2 Vehicles | 4,496 (50.3%) | 3,725 (49.2%) |
| 3 Vehicles | 2,094 (23.4%) | 1,797 (23.7%) |
| 4 Vehicles | 561 (6.3%) | 319 (4.2%) |
| 5 or more Vehicles | 603 (6.7%) | 324 (4.3%) |
| Total | 8,944 (100.0%) | 7,571 (100.0%) |
Commute Time in Northbrook
The most frequently occuring commute durations in Northbrook are 10 to 14 minutes (1,838 commuters, 14.8%), 20 to 24 minutes (1,640 commuters, 13.2%), and 60 to 89 minutes (1,418 commuters, 11.4%).
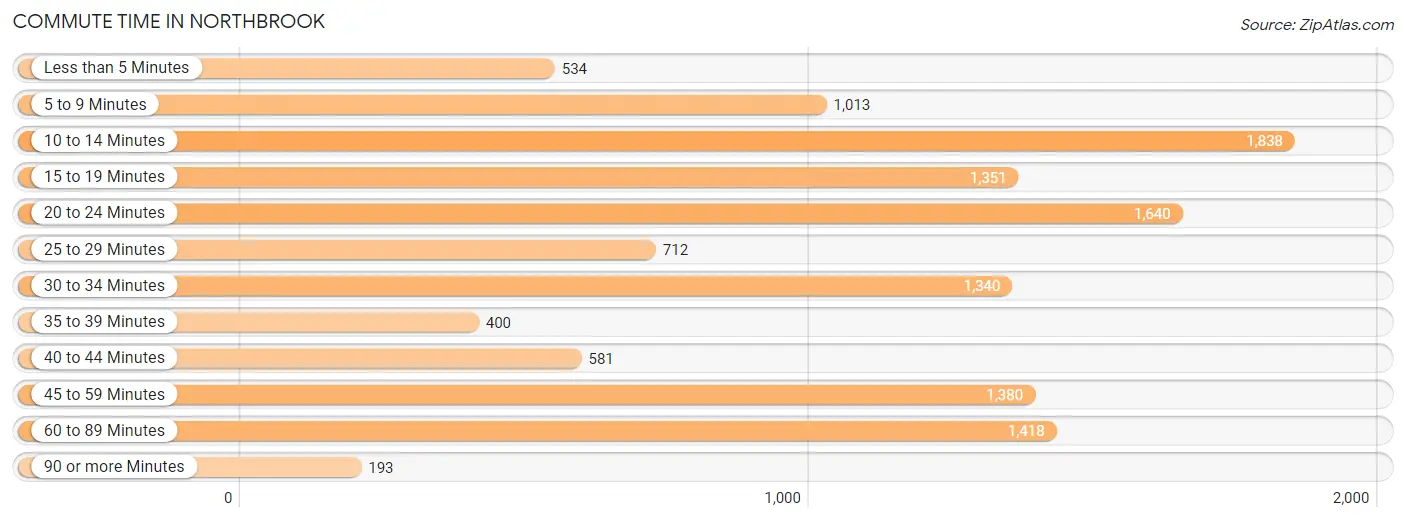
| Commute Time | # Commuters | % Commuters |
| Less than 5 Minutes | 534 | 4.3% |
| 5 to 9 Minutes | 1,013 | 8.2% |
| 10 to 14 Minutes | 1,838 | 14.8% |
| 15 to 19 Minutes | 1,351 | 10.9% |
| 20 to 24 Minutes | 1,640 | 13.2% |
| 25 to 29 Minutes | 712 | 5.7% |
| 30 to 34 Minutes | 1,340 | 10.8% |
| 35 to 39 Minutes | 400 | 3.2% |
| 40 to 44 Minutes | 581 | 4.7% |
| 45 to 59 Minutes | 1,380 | 11.1% |
| 60 to 89 Minutes | 1,418 | 11.4% |
| 90 or more Minutes | 193 | 1.6% |
Commute Time by Sex in Northbrook
The most common commute times in Northbrook are 10 to 14 minutes (1,208 commuters, 17.8%) for males and 15 to 19 minutes (925 commuters, 16.5%) for females.
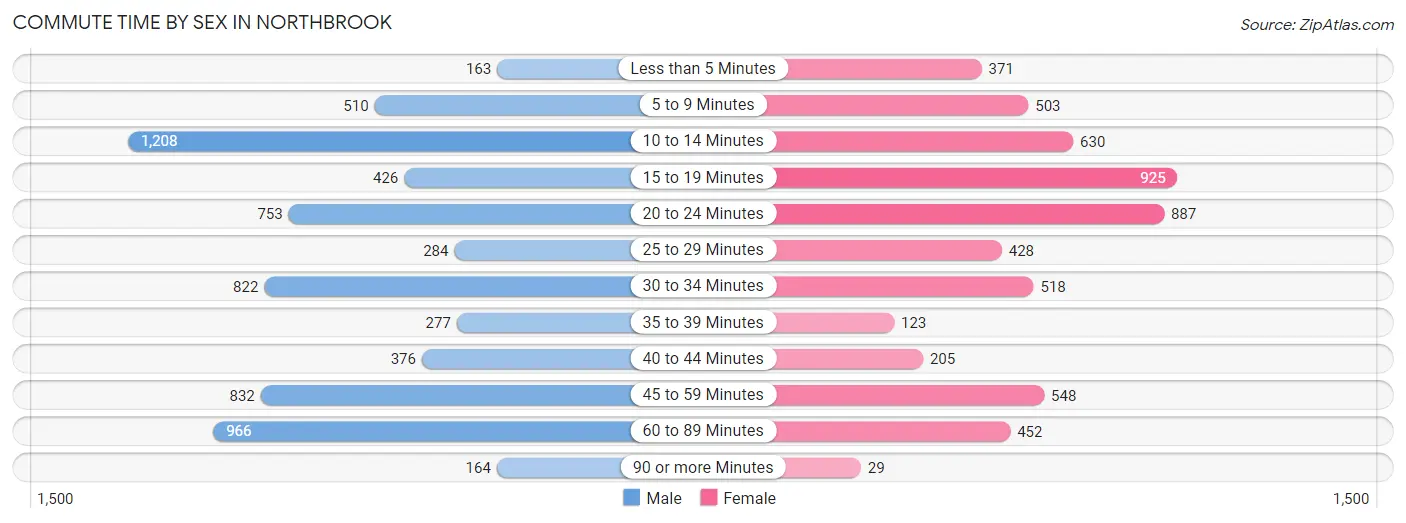
| Commute Time | Male | Female |
| Less than 5 Minutes | 163 (2.4%) | 371 (6.6%) |
| 5 to 9 Minutes | 510 (7.5%) | 503 (8.9%) |
| 10 to 14 Minutes | 1,208 (17.8%) | 630 (11.2%) |
| 15 to 19 Minutes | 426 (6.3%) | 925 (16.5%) |
| 20 to 24 Minutes | 753 (11.1%) | 887 (15.8%) |
| 25 to 29 Minutes | 284 (4.2%) | 428 (7.6%) |
| 30 to 34 Minutes | 822 (12.1%) | 518 (9.2%) |
| 35 to 39 Minutes | 277 (4.1%) | 123 (2.2%) |
| 40 to 44 Minutes | 376 (5.5%) | 205 (3.6%) |
| 45 to 59 Minutes | 832 (12.3%) | 548 (9.8%) |
| 60 to 89 Minutes | 966 (14.2%) | 452 (8.0%) |
| 90 or more Minutes | 164 (2.4%) | 29 (0.5%) |
Time of Departure to Work by Sex in Northbrook
The most frequent times of departure to work in Northbrook are 8:00 AM to 8:29 AM (1,219, 18.0%) for males and 7:30 AM to 7:59 AM (1,237, 22.0%) for females.
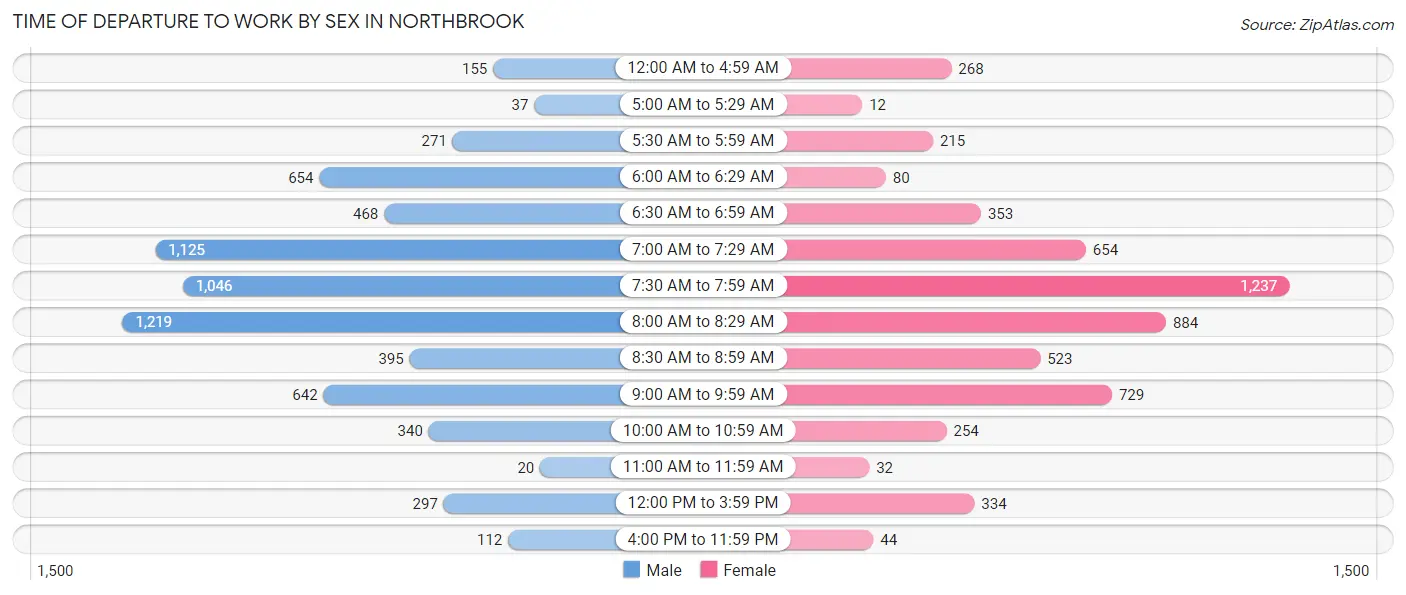
| Time of Departure | Male | Female |
| 12:00 AM to 4:59 AM | 155 (2.3%) | 268 (4.8%) |
| 5:00 AM to 5:29 AM | 37 (0.5%) | 12 (0.2%) |
| 5:30 AM to 5:59 AM | 271 (4.0%) | 215 (3.8%) |
| 6:00 AM to 6:29 AM | 654 (9.6%) | 80 (1.4%) |
| 6:30 AM to 6:59 AM | 468 (6.9%) | 353 (6.3%) |
| 7:00 AM to 7:29 AM | 1,125 (16.6%) | 654 (11.6%) |
| 7:30 AM to 7:59 AM | 1,046 (15.4%) | 1,237 (22.0%) |
| 8:00 AM to 8:29 AM | 1,219 (18.0%) | 884 (15.7%) |
| 8:30 AM to 8:59 AM | 395 (5.8%) | 523 (9.3%) |
| 9:00 AM to 9:59 AM | 642 (9.5%) | 729 (13.0%) |
| 10:00 AM to 10:59 AM | 340 (5.0%) | 254 (4.5%) |
| 11:00 AM to 11:59 AM | 20 (0.3%) | 32 (0.6%) |
| 12:00 PM to 3:59 PM | 297 (4.4%) | 334 (5.9%) |
| 4:00 PM to 11:59 PM | 112 (1.7%) | 44 (0.8%) |
| Total | 6,781 (100.0%) | 5,619 (100.0%) |
Housing Occupancy in Northbrook
Occupancy by Ownership in Northbrook
Of the total 13,481 dwellings in Northbrook, owner-occupied units account for 11,776 (87.4%), while renter-occupied units make up 1,705 (12.7%).
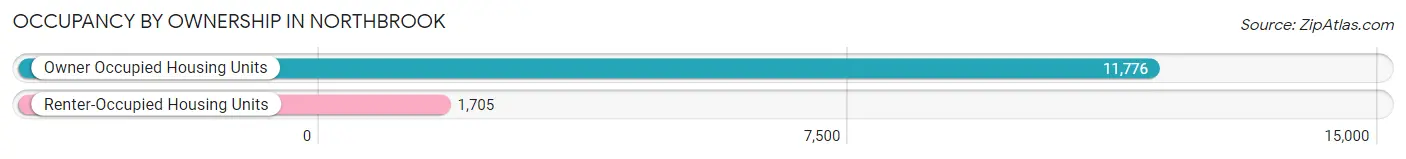
| Occupancy | # Housing Units | % Housing Units |
| Owner Occupied Housing Units | 11,776 | 87.4% |
| Renter-Occupied Housing Units | 1,705 | 12.7% |
| Total Occupied Housing Units | 13,481 | 100.0% |
Occupancy by Household Size in Northbrook
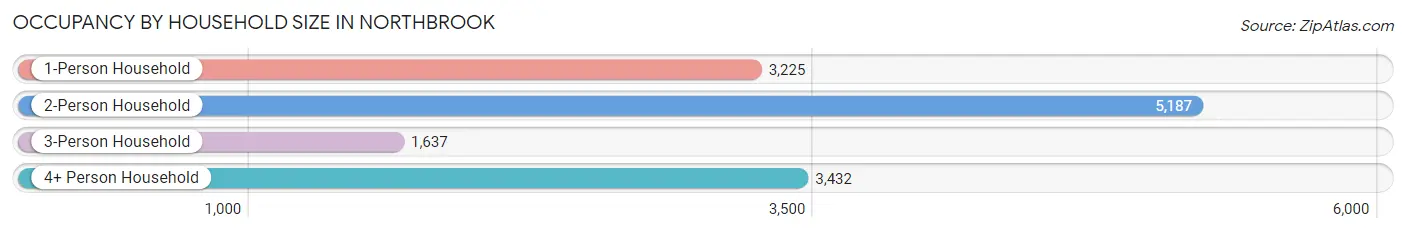
| Household Size | # Housing Units | % Housing Units |
| 1-Person Household | 3,225 | 23.9% |
| 2-Person Household | 5,187 | 38.5% |
| 3-Person Household | 1,637 | 12.1% |
| 4+ Person Household | 3,432 | 25.5% |
| Total Housing Units | 13,481 | 100.0% |
Occupancy by Ownership by Household Size in Northbrook
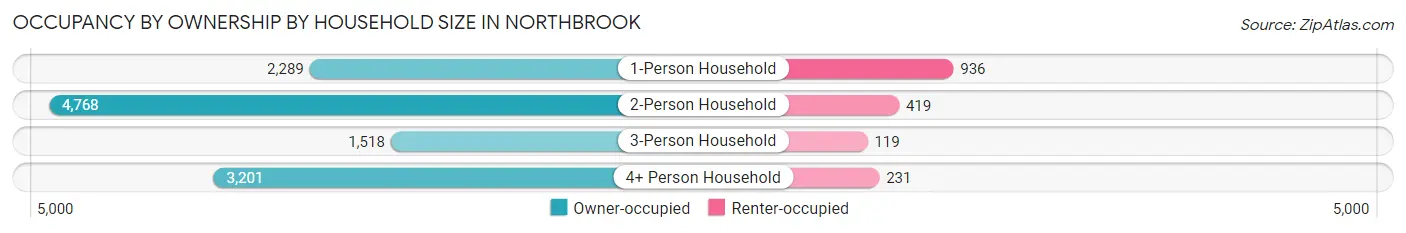
| Household Size | Owner-occupied | Renter-occupied |
| 1-Person Household | 2,289 (71.0%) | 936 (29.0%) |
| 2-Person Household | 4,768 (91.9%) | 419 (8.1%) |
| 3-Person Household | 1,518 (92.7%) | 119 (7.3%) |
| 4+ Person Household | 3,201 (93.3%) | 231 (6.7%) |
| Total Housing Units | 11,776 (87.4%) | 1,705 (12.7%) |
Occupancy by Educational Attainment in Northbrook
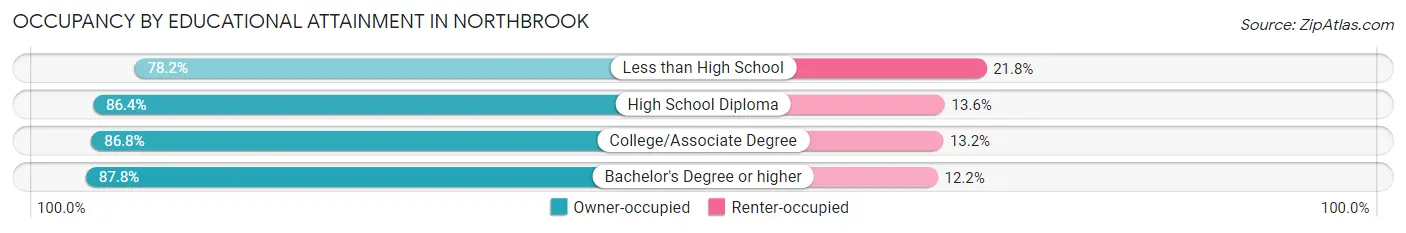
| Household Size | Owner-occupied | Renter-occupied |
| Less than High School | 233 (78.2%) | 65 (21.8%) |
| High School Diploma | 948 (86.4%) | 149 (13.6%) |
| College/Associate Degree | 1,730 (86.8%) | 264 (13.2%) |
| Bachelor's Degree or higher | 8,865 (87.8%) | 1,227 (12.2%) |
Occupancy by Age of Householder in Northbrook
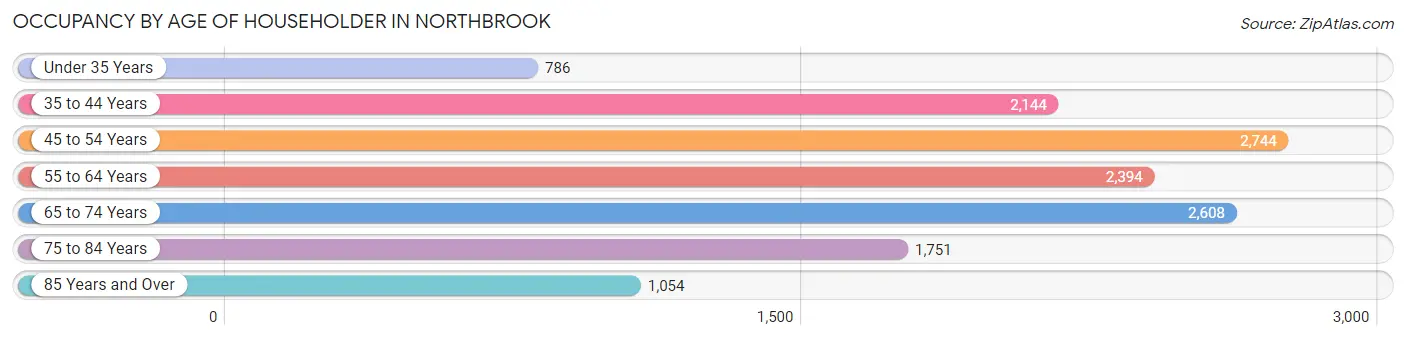
| Age Bracket | # Households | % Households |
| Under 35 Years | 786 | 5.8% |
| 35 to 44 Years | 2,144 | 15.9% |
| 45 to 54 Years | 2,744 | 20.3% |
| 55 to 64 Years | 2,394 | 17.8% |
| 65 to 74 Years | 2,608 | 19.4% |
| 75 to 84 Years | 1,751 | 13.0% |
| 85 Years and Over | 1,054 | 7.8% |
| Total | 13,481 | 100.0% |
Housing Finances in Northbrook
Median Income by Occupancy in Northbrook
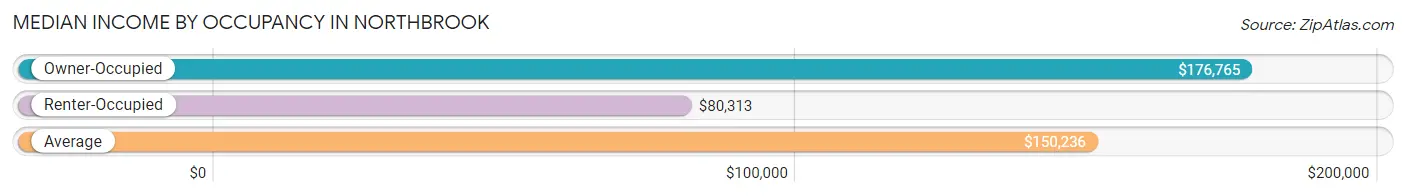
| Occupancy Type | # Households | Median Income |
| Owner-Occupied | 11,776 (87.4%) | $176,765 |
| Renter-Occupied | 1,705 (12.7%) | $80,313 |
| Average | 13,481 (100.0%) | $150,236 |
Occupancy by Householder Income Bracket in Northbrook
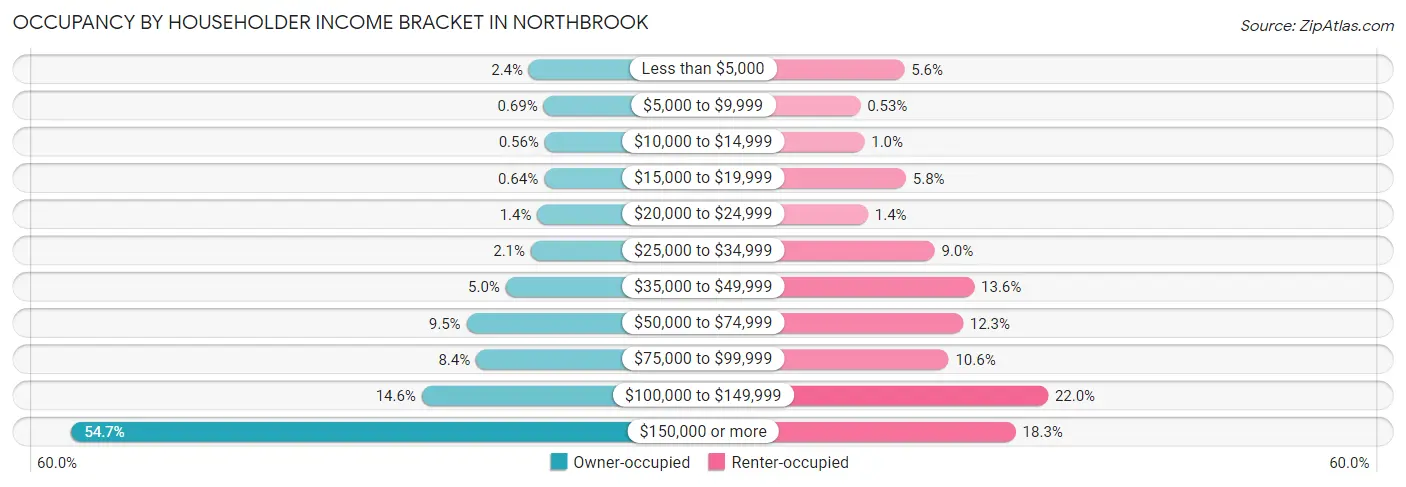
| Income Bracket | Owner-occupied | Renter-occupied |
| Less than $5,000 | 279 (2.4%) | 95 (5.6%) |
| $5,000 to $9,999 | 81 (0.7%) | 9 (0.5%) |
| $10,000 to $14,999 | 66 (0.6%) | 17 (1.0%) |
| $15,000 to $19,999 | 75 (0.6%) | 98 (5.8%) |
| $20,000 to $24,999 | 166 (1.4%) | 24 (1.4%) |
| $25,000 to $34,999 | 252 (2.1%) | 154 (9.0%) |
| $35,000 to $49,999 | 591 (5.0%) | 231 (13.6%) |
| $50,000 to $74,999 | 1,119 (9.5%) | 209 (12.3%) |
| $75,000 to $99,999 | 990 (8.4%) | 181 (10.6%) |
| $100,000 to $149,999 | 1,722 (14.6%) | 375 (22.0%) |
| $150,000 or more | 6,435 (54.6%) | 312 (18.3%) |
| Total | 11,776 (100.0%) | 1,705 (100.0%) |
Monthly Housing Cost Tiers in Northbrook
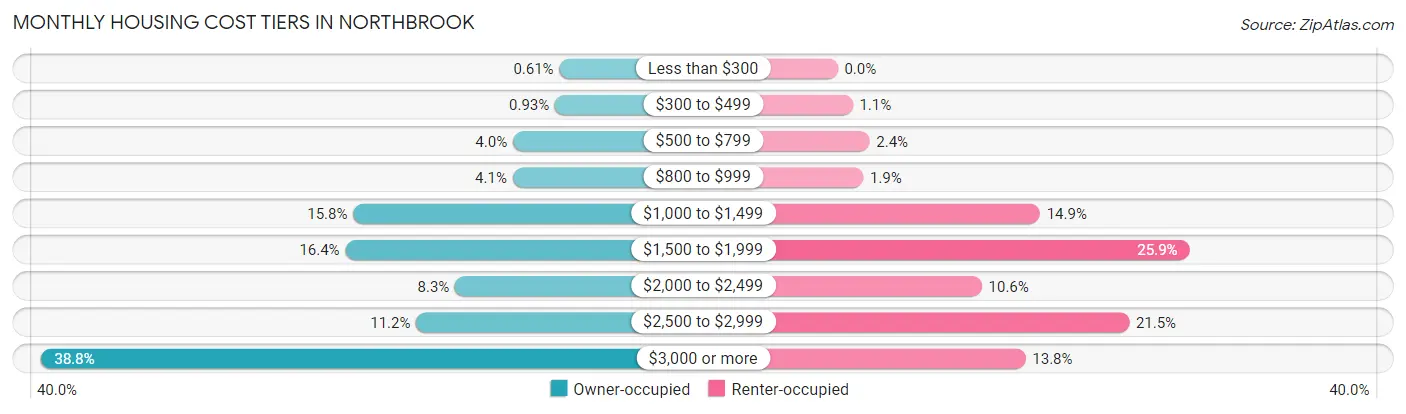
| Monthly Cost | Owner-occupied | Renter-occupied |
| Less than $300 | 72 (0.6%) | 0 (0.0%) |
| $300 to $499 | 110 (0.9%) | 19 (1.1%) |
| $500 to $799 | 474 (4.0%) | 40 (2.4%) |
| $800 to $999 | 477 (4.1%) | 32 (1.9%) |
| $1,000 to $1,499 | 1,860 (15.8%) | 254 (14.9%) |
| $1,500 to $1,999 | 1,928 (16.4%) | 442 (25.9%) |
| $2,000 to $2,499 | 976 (8.3%) | 181 (10.6%) |
| $2,500 to $2,999 | 1,313 (11.2%) | 366 (21.5%) |
| $3,000 or more | 4,566 (38.8%) | 236 (13.8%) |
| Total | 11,776 (100.0%) | 1,705 (100.0%) |
Physical Housing Characteristics in Northbrook
Housing Structures in Northbrook
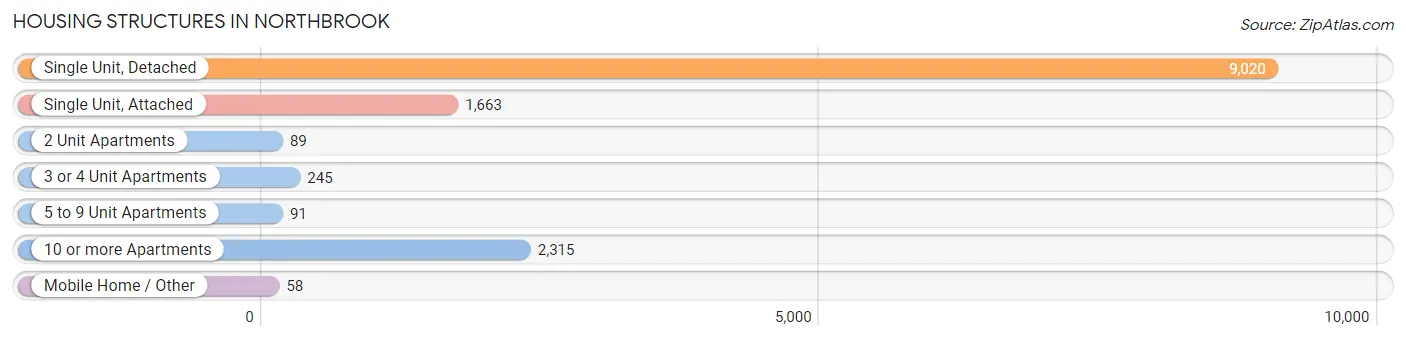
| Structure Type | # Housing Units | % Housing Units |
| Single Unit, Detached | 9,020 | 66.9% |
| Single Unit, Attached | 1,663 | 12.3% |
| 2 Unit Apartments | 89 | 0.7% |
| 3 or 4 Unit Apartments | 245 | 1.8% |
| 5 to 9 Unit Apartments | 91 | 0.7% |
| 10 or more Apartments | 2,315 | 17.2% |
| Mobile Home / Other | 58 | 0.4% |
| Total | 13,481 | 100.0% |
Housing Structures by Occupancy in Northbrook
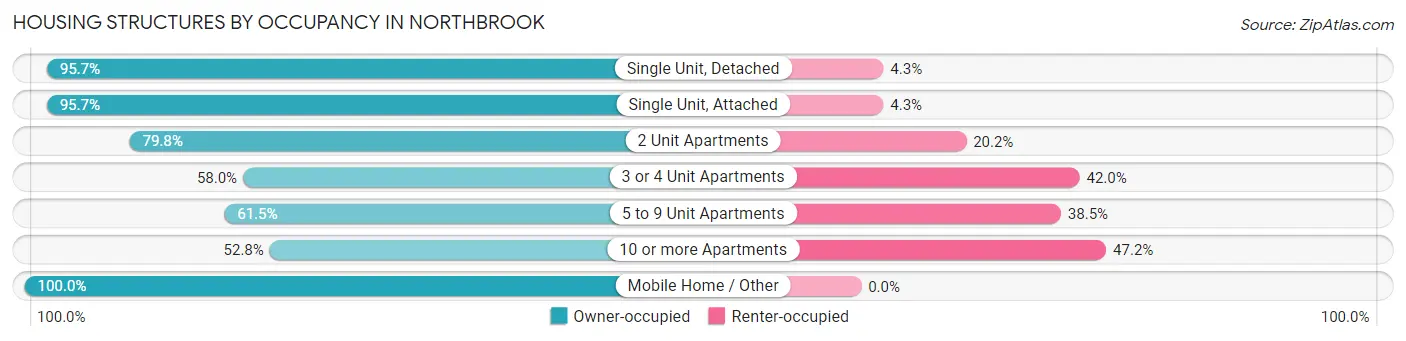
| Structure Type | Owner-occupied | Renter-occupied |
| Single Unit, Detached | 8,634 (95.7%) | 386 (4.3%) |
| Single Unit, Attached | 1,592 (95.7%) | 71 (4.3%) |
| 2 Unit Apartments | 71 (79.8%) | 18 (20.2%) |
| 3 or 4 Unit Apartments | 142 (58.0%) | 103 (42.0%) |
| 5 to 9 Unit Apartments | 56 (61.5%) | 35 (38.5%) |
| 10 or more Apartments | 1,223 (52.8%) | 1,092 (47.2%) |
| Mobile Home / Other | 58 (100.0%) | 0 (0.0%) |
| Total | 11,776 (87.4%) | 1,705 (12.7%) |
Housing Structures by Number of Rooms in Northbrook
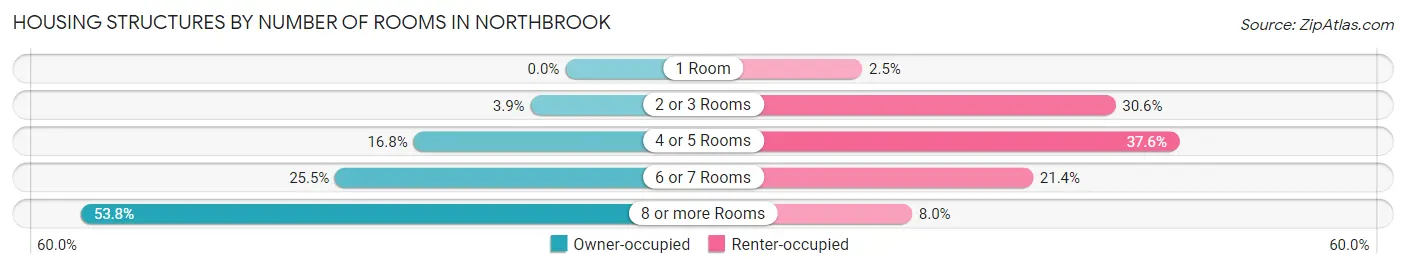
| Number of Rooms | Owner-occupied | Renter-occupied |
| 1 Room | 0 (0.0%) | 42 (2.5%) |
| 2 or 3 Rooms | 455 (3.9%) | 521 (30.6%) |
| 4 or 5 Rooms | 1,983 (16.8%) | 641 (37.6%) |
| 6 or 7 Rooms | 3,007 (25.5%) | 365 (21.4%) |
| 8 or more Rooms | 6,331 (53.8%) | 136 (8.0%) |
| Total | 11,776 (100.0%) | 1,705 (100.0%) |
Housing Structure by Heating Type in Northbrook
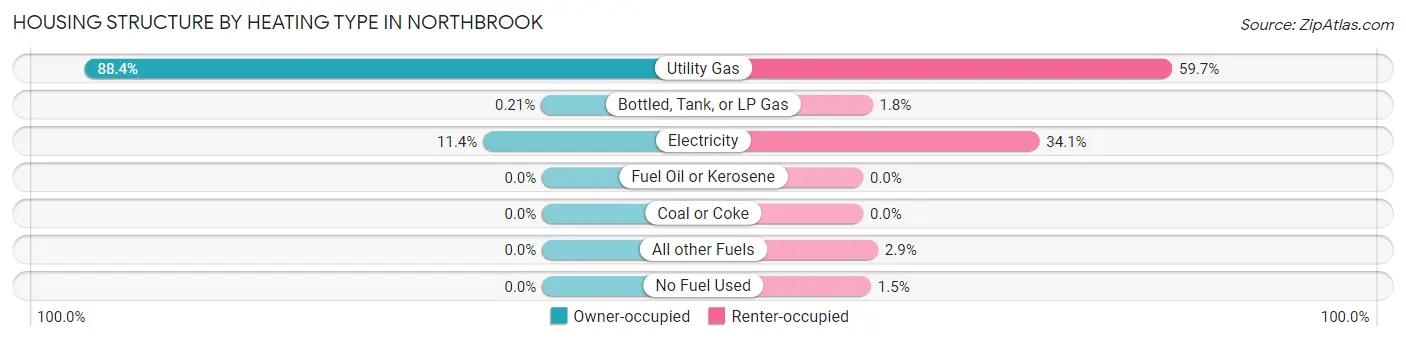
| Heating Type | Owner-occupied | Renter-occupied |
| Utility Gas | 10,409 (88.4%) | 1,018 (59.7%) |
| Bottled, Tank, or LP Gas | 25 (0.2%) | 31 (1.8%) |
| Electricity | 1,342 (11.4%) | 581 (34.1%) |
| Fuel Oil or Kerosene | 0 (0.0%) | 0 (0.0%) |
| Coal or Coke | 0 (0.0%) | 0 (0.0%) |
| All other Fuels | 0 (0.0%) | 49 (2.9%) |
| No Fuel Used | 0 (0.0%) | 26 (1.5%) |
| Total | 11,776 (100.0%) | 1,705 (100.0%) |
Household Vehicle Usage in Northbrook
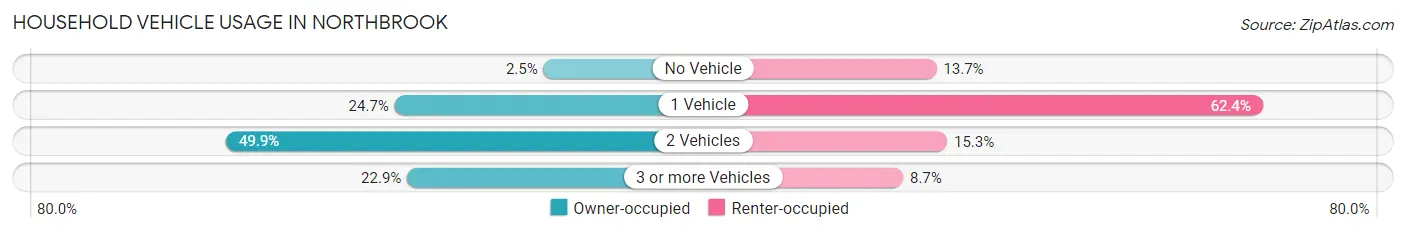
| Vehicles per Household | Owner-occupied | Renter-occupied |
| No Vehicle | 293 (2.5%) | 233 (13.7%) |
| 1 Vehicle | 2,912 (24.7%) | 1,064 (62.4%) |
| 2 Vehicles | 5,879 (49.9%) | 260 (15.2%) |
| 3 or more Vehicles | 2,692 (22.9%) | 148 (8.7%) |
| Total | 11,776 (100.0%) | 1,705 (100.0%) |
Real Estate & Mortgages in Northbrook
Real Estate and Mortgage Overview in Northbrook
| Characteristic | Without Mortgage | With Mortgage |
| Housing Units | 4,767 | 7,009 |
| Median Property Value | $582,700 | $645,200 |
| Median Household Income | $126,472 | $4,504 |
| Monthly Housing Costs | $1,415 | $4,416 |
| Real Estate Taxes | $10,001 | $60 |
Property Value by Mortgage Status in Northbrook
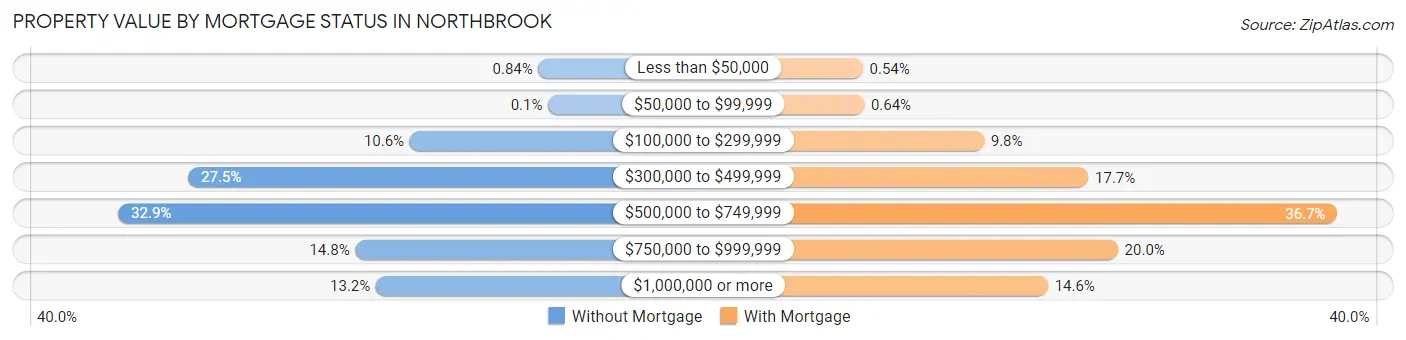
| Property Value | Without Mortgage | With Mortgage |
| Less than $50,000 | 40 (0.8%) | 38 (0.5%) |
| $50,000 to $99,999 | 5 (0.1%) | 45 (0.6%) |
| $100,000 to $299,999 | 507 (10.6%) | 685 (9.8%) |
| $300,000 to $499,999 | 1,313 (27.5%) | 1,242 (17.7%) |
| $500,000 to $749,999 | 1,567 (32.9%) | 2,573 (36.7%) |
| $750,000 to $999,999 | 705 (14.8%) | 1,400 (20.0%) |
| $1,000,000 or more | 630 (13.2%) | 1,026 (14.6%) |
| Total | 4,767 (100.0%) | 7,009 (100.0%) |
Household Income by Mortgage Status in Northbrook
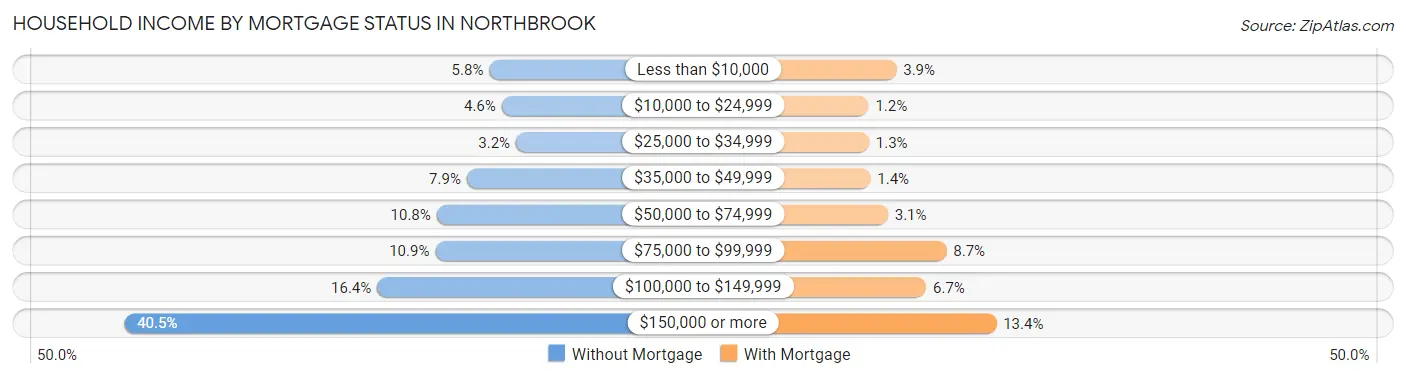
| Household Income | Without Mortgage | With Mortgage |
| Less than $10,000 | 274 (5.8%) | 272 (3.9%) |
| $10,000 to $24,999 | 218 (4.6%) | 86 (1.2%) |
| $25,000 to $34,999 | 153 (3.2%) | 89 (1.3%) |
| $35,000 to $49,999 | 376 (7.9%) | 99 (1.4%) |
| $50,000 to $74,999 | 513 (10.8%) | 215 (3.1%) |
| $75,000 to $99,999 | 519 (10.9%) | 606 (8.6%) |
| $100,000 to $149,999 | 783 (16.4%) | 471 (6.7%) |
| $150,000 or more | 1,931 (40.5%) | 939 (13.4%) |
| Total | 4,767 (100.0%) | 7,009 (100.0%) |
Property Value to Household Income Ratio in Northbrook
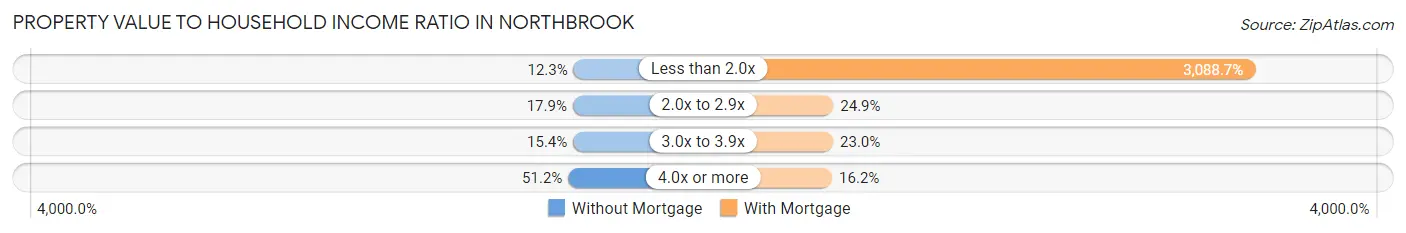
| Value-to-Income Ratio | Without Mortgage | With Mortgage |
| Less than 2.0x | 585 (12.3%) | 216,484 (3,088.7%) |
| 2.0x to 2.9x | 855 (17.9%) | 1,745 (24.9%) |
| 3.0x to 3.9x | 736 (15.4%) | 1,612 (23.0%) |
| 4.0x or more | 2,442 (51.2%) | 1,134 (16.2%) |
| Total | 4,767 (100.0%) | 7,009 (100.0%) |
Real Estate Taxes by Mortgage Status in Northbrook
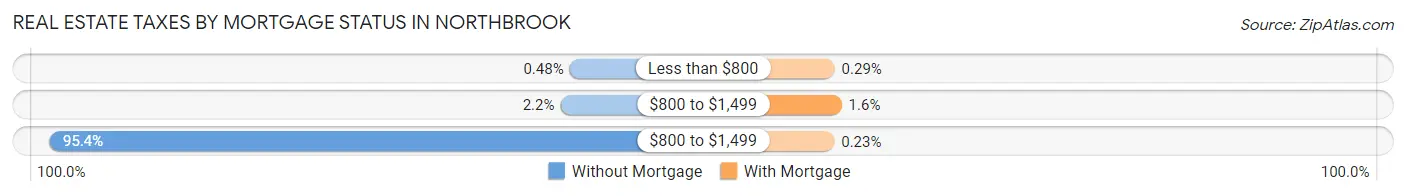
| Property Taxes | Without Mortgage | With Mortgage |
| Less than $800 | 23 (0.5%) | 20 (0.3%) |
| $800 to $1,499 | 103 (2.2%) | 110 (1.6%) |
| $800 to $1,499 | 4,547 (95.4%) | 16 (0.2%) |
| Total | 4,767 (100.0%) | 7,009 (100.0%) |
Health & Disability in Northbrook
Health Insurance Coverage by Age in Northbrook
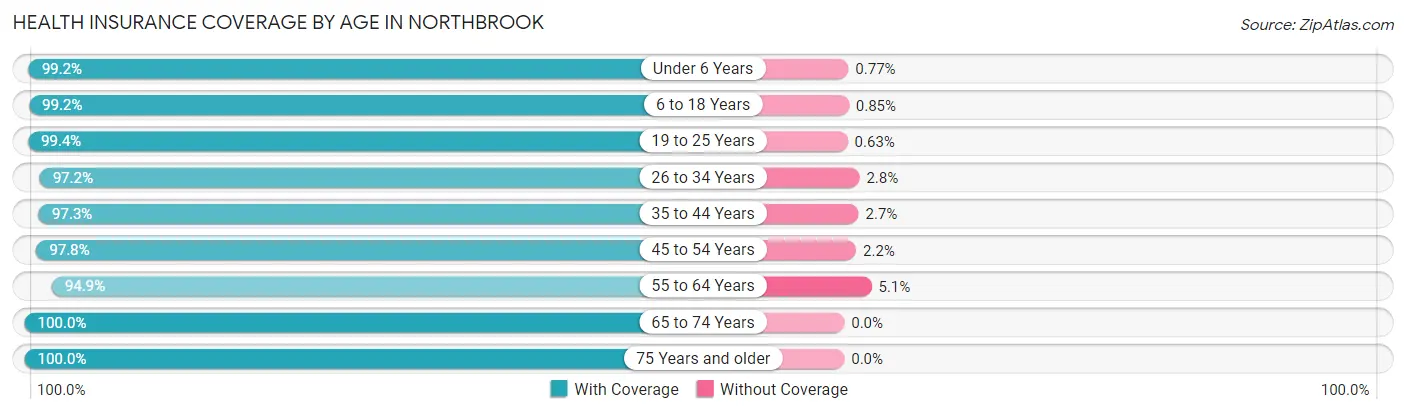
| Age Bracket | With Coverage | Without Coverage |
| Under 6 Years | 1,929 (99.2%) | 15 (0.8%) |
| 6 to 18 Years | 5,830 (99.2%) | 50 (0.9%) |
| 19 to 25 Years | 1,740 (99.4%) | 11 (0.6%) |
| 26 to 34 Years | 2,058 (97.2%) | 60 (2.8%) |
| 35 to 44 Years | 3,829 (97.3%) | 105 (2.7%) |
| 45 to 54 Years | 4,800 (97.8%) | 108 (2.2%) |
| 55 to 64 Years | 5,229 (94.9%) | 280 (5.1%) |
| 65 to 74 Years | 4,083 (100.0%) | 0 (0.0%) |
| 75 Years and older | 4,226 (100.0%) | 0 (0.0%) |
| Total | 33,724 (98.2%) | 629 (1.8%) |
Health Insurance Coverage by Citizenship Status in Northbrook
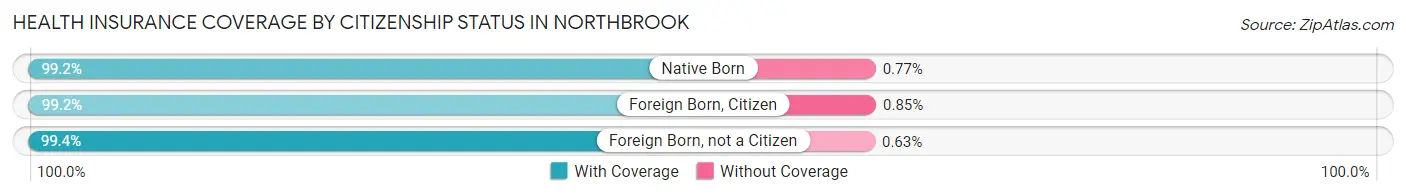
| Citizenship Status | With Coverage | Without Coverage |
| Native Born | 1,929 (99.2%) | 15 (0.8%) |
| Foreign Born, Citizen | 5,830 (99.2%) | 50 (0.9%) |
| Foreign Born, not a Citizen | 1,740 (99.4%) | 11 (0.6%) |
Health Insurance Coverage by Household Income in Northbrook
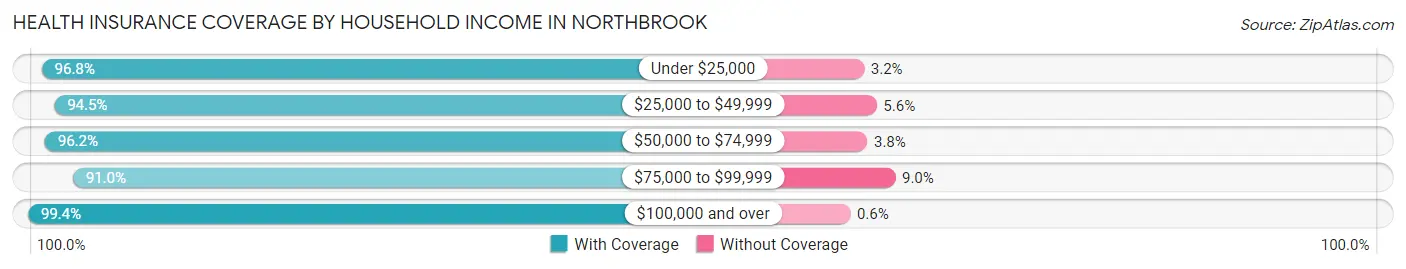
| Household Income | With Coverage | Without Coverage |
| Under $25,000 | 1,213 (96.8%) | 40 (3.2%) |
| $25,000 to $49,999 | 1,582 (94.5%) | 93 (5.6%) |
| $50,000 to $74,999 | 2,438 (96.2%) | 96 (3.8%) |
| $75,000 to $99,999 | 2,404 (91.0%) | 239 (9.0%) |
| $100,000 and over | 25,998 (99.4%) | 157 (0.6%) |
Public vs Private Health Insurance Coverage by Age in Northbrook
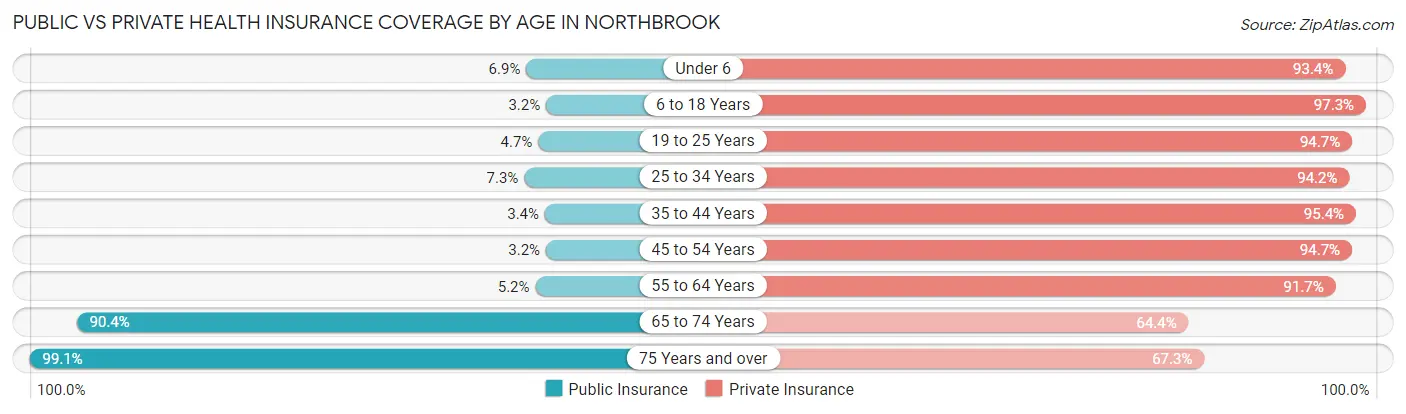
| Age Bracket | Public Insurance | Private Insurance |
| Under 6 | 134 (6.9%) | 1,816 (93.4%) |
| 6 to 18 Years | 189 (3.2%) | 5,720 (97.3%) |
| 19 to 25 Years | 82 (4.7%) | 1,658 (94.7%) |
| 25 to 34 Years | 154 (7.3%) | 1,995 (94.2%) |
| 35 to 44 Years | 135 (3.4%) | 3,754 (95.4%) |
| 45 to 54 Years | 159 (3.2%) | 4,647 (94.7%) |
| 55 to 64 Years | 286 (5.2%) | 5,049 (91.6%) |
| 65 to 74 Years | 3,690 (90.4%) | 2,628 (64.4%) |
| 75 Years and over | 4,188 (99.1%) | 2,843 (67.3%) |
| Total | 9,017 (26.3%) | 30,110 (87.6%) |
Disability Status by Sex by Age in Northbrook
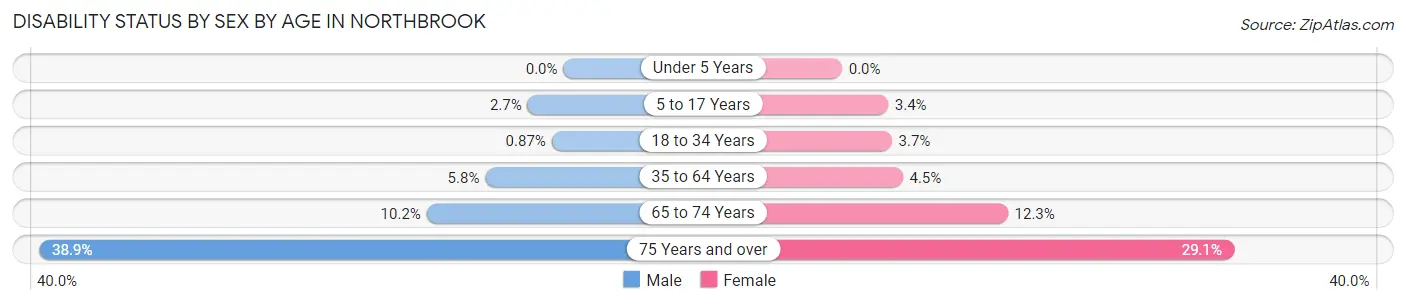
| Age Bracket | Male | Female |
| Under 5 Years | 0 (0.0%) | 0 (0.0%) |
| 5 to 17 Years | 69 (2.7%) | 103 (3.4%) |
| 18 to 34 Years | 21 (0.9%) | 77 (3.7%) |
| 35 to 64 Years | 395 (5.8%) | 340 (4.5%) |
| 65 to 74 Years | 200 (10.2%) | 260 (12.3%) |
| 75 Years and over | 722 (38.9%) | 690 (29.1%) |
Disability Class by Sex by Age in Northbrook
Disability Class: Hearing Difficulty
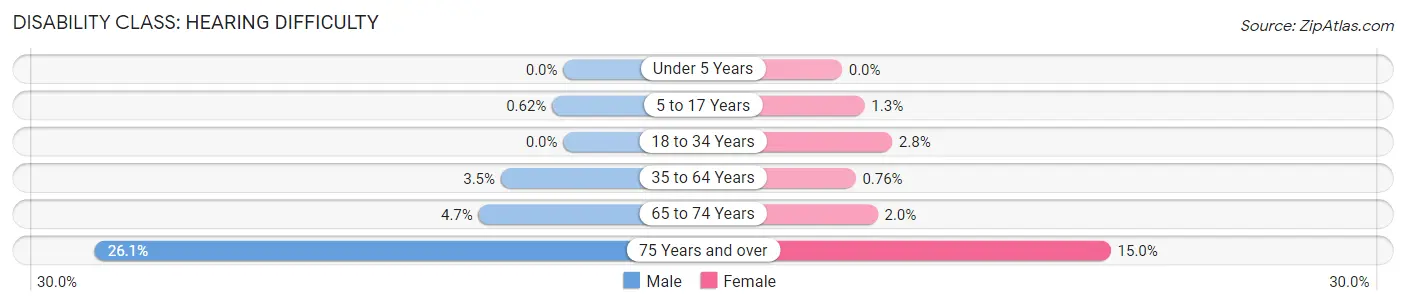
| Age Bracket | Male | Female |
| Under 5 Years | 0 (0.0%) | 0 (0.0%) |
| 5 to 17 Years | 16 (0.6%) | 38 (1.3%) |
| 18 to 34 Years | 0 (0.0%) | 58 (2.8%) |
| 35 to 64 Years | 237 (3.5%) | 57 (0.8%) |
| 65 to 74 Years | 93 (4.7%) | 42 (2.0%) |
| 75 Years and over | 484 (26.1%) | 355 (15.0%) |
Disability Class: Vision Difficulty
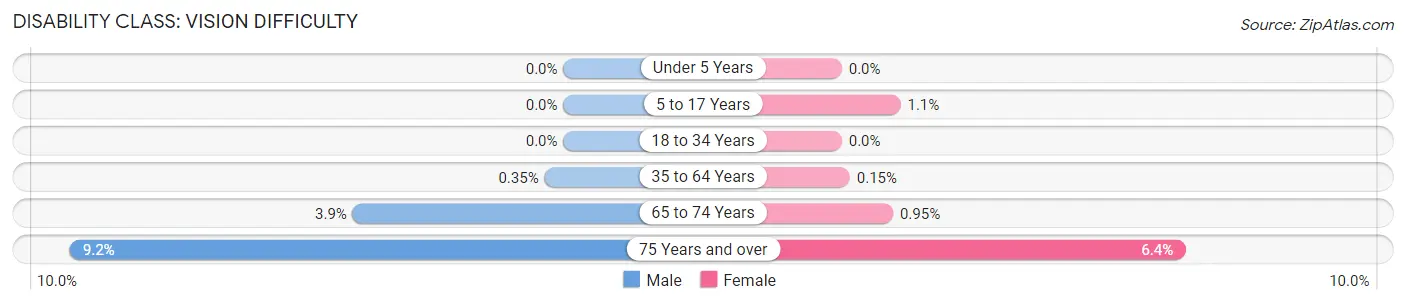
| Age Bracket | Male | Female |
| Under 5 Years | 0 (0.0%) | 0 (0.0%) |
| 5 to 17 Years | 0 (0.0%) | 33 (1.1%) |
| 18 to 34 Years | 0 (0.0%) | 0 (0.0%) |
| 35 to 64 Years | 24 (0.4%) | 11 (0.2%) |
| 65 to 74 Years | 77 (3.9%) | 20 (0.9%) |
| 75 Years and over | 170 (9.2%) | 151 (6.4%) |
Disability Class: Cognitive Difficulty
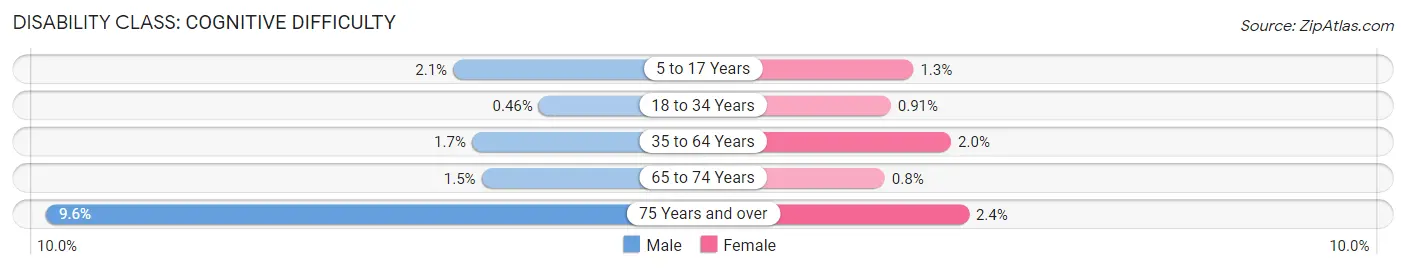
| Age Bracket | Male | Female |
| 5 to 17 Years | 53 (2.1%) | 40 (1.3%) |
| 18 to 34 Years | 11 (0.5%) | 19 (0.9%) |
| 35 to 64 Years | 116 (1.7%) | 153 (2.0%) |
| 65 to 74 Years | 30 (1.5%) | 17 (0.8%) |
| 75 Years and over | 178 (9.6%) | 56 (2.4%) |
Disability Class: Ambulatory Difficulty
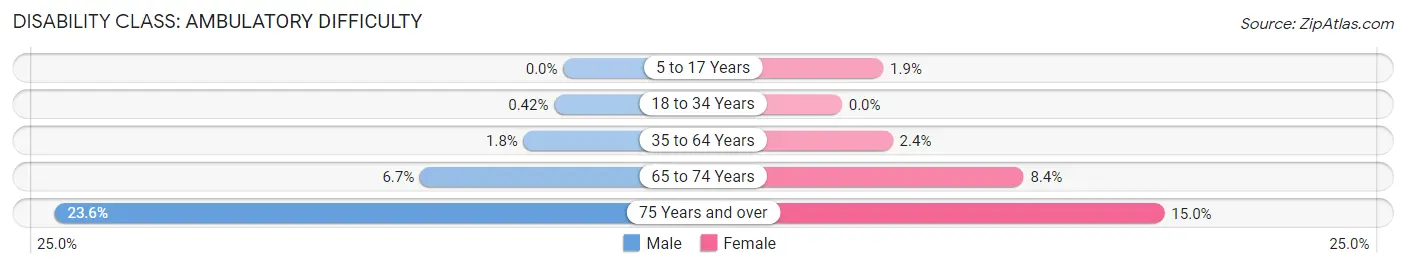
| Age Bracket | Male | Female |
| 5 to 17 Years | 0 (0.0%) | 58 (1.9%) |
| 18 to 34 Years | 10 (0.4%) | 0 (0.0%) |
| 35 to 64 Years | 125 (1.8%) | 178 (2.4%) |
| 65 to 74 Years | 131 (6.7%) | 178 (8.4%) |
| 75 Years and over | 438 (23.6%) | 355 (15.0%) |
Disability Class: Self-Care Difficulty
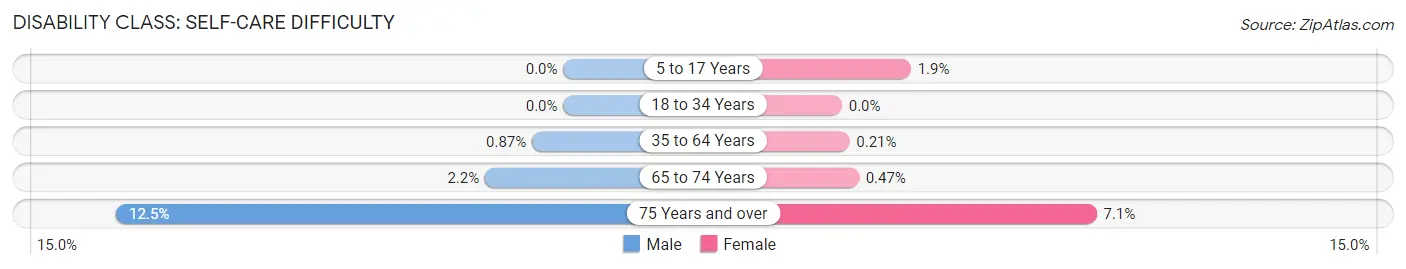
| Age Bracket | Male | Female |
| 5 to 17 Years | 0 (0.0%) | 58 (1.9%) |
| 18 to 34 Years | 0 (0.0%) | 0 (0.0%) |
| 35 to 64 Years | 59 (0.9%) | 16 (0.2%) |
| 65 to 74 Years | 43 (2.2%) | 10 (0.5%) |
| 75 Years and over | 231 (12.4%) | 168 (7.1%) |
Technology Access in Northbrook
Computing Device Access in Northbrook
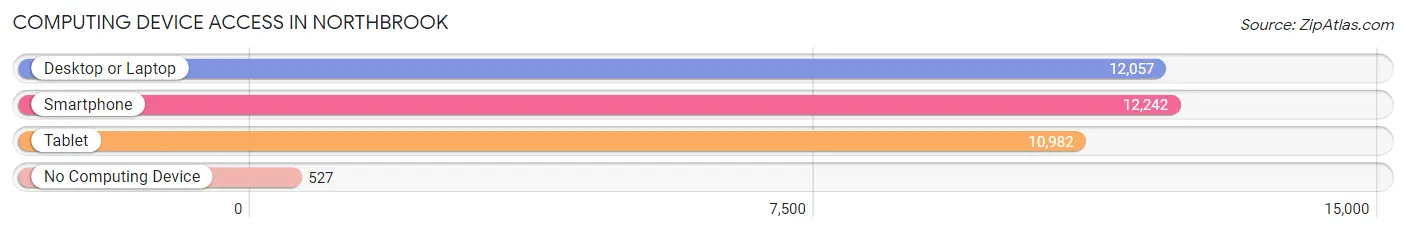
| Device Type | # Households | % Households |
| Desktop or Laptop | 12,057 | 89.4% |
| Smartphone | 12,242 | 90.8% |
| Tablet | 10,982 | 81.5% |
| No Computing Device | 527 | 3.9% |
| Total | 13,481 | 100.0% |
Internet Access in Northbrook
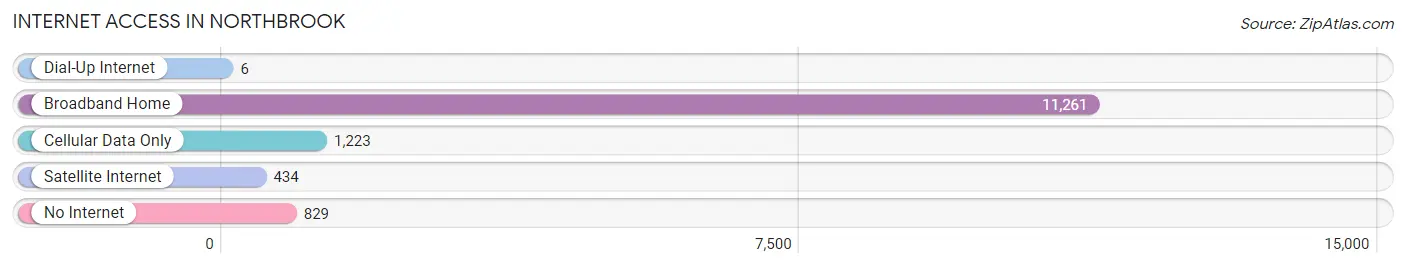
| Internet Type | # Households | % Households |
| Dial-Up Internet | 6 | 0.0% |
| Broadband Home | 11,261 | 83.5% |
| Cellular Data Only | 1,223 | 9.1% |
| Satellite Internet | 434 | 3.2% |
| No Internet | 829 | 6.1% |
| Total | 13,481 | 100.0% |
Northbrook Summary
History
Northbrook, Illinois is a village located in Cook and Lake counties in the northern suburbs of Chicago. It is a part of the North Shore region of the Chicago metropolitan area. The village was incorporated in 1901 and has a population of 33,170 as of the 2010 census.
The area that is now Northbrook was originally inhabited by the Potawatomi Native Americans. The first European settlers arrived in the area in the early 19th century. The first settler was a man named John Millen, who arrived in 1833. He built a log cabin and began farming the land. Other settlers soon followed, and the area began to grow.
In 1872, the Chicago and North Western Railway built a station in the area, which helped to spur growth. The village was officially incorporated in 1901 and was named after the North Branch of the Chicago River, which runs through the village.
Geography
Northbrook is located in Cook and Lake counties in the northern suburbs of Chicago. It is situated on the North Branch of the Chicago River, which runs through the village. The village is bordered by the villages of Glenview, Northfield, and Wheeling.
The village has a total area of 8.9 square miles, of which 8.7 square miles is land and 0.2 square miles is water. The village is located at an elevation of 645 feet above sea level.
Economy
Northbrook is a major economic center in the Chicago metropolitan area. The village is home to a number of corporate headquarters, including Allstate Insurance, Crate & Barrel, and Underwriters Laboratories. The village is also home to a number of shopping centers, including Northbrook Court and Northbrook Plaza.
The village is served by the Metra commuter rail system, which provides access to downtown Chicago. The village is also served by the Chicago Transit Authority, which provides bus service to the area.
Demographics
As of the 2010 census, Northbrook had a population of 33,170. The racial makeup of the village was 81.2% White, 5.3% African American, 0.2% Native American, 9.2% Asian, 0.1% Pacific Islander, 1.7% from other races, and 2.4% from two or more races. Hispanic or Latino of any race were 5.3% of the population.
The median household income in Northbrook was $97,837 in 2019. The median home value was $541,945 in 2019. The median age of the village was 44.2 years.
Conclusion
Northbrook, Illinois is a village located in Cook and Lake counties in the northern suburbs of Chicago. It is a part of the North Shore region of the Chicago metropolitan area. The village was incorporated in 1901 and has a population of 33,170 as of the 2010 census. Northbrook is a major economic center in the Chicago metropolitan area, with a number of corporate headquarters and shopping centers located in the village. The village has a diverse population, with a median household income of $97,837 and a median home value of $541,945 in 2019.
Common Questions
What is Per Capita Income in Northbrook?
Per Capita income in Northbrook is $83,750.
What is the Median Family Income in Northbrook?
Median Family Income in Northbrook is $210,123.
What is the Median Household income in Northbrook?
Median Household Income in Northbrook is $150,236.
What is Income or Wage Gap in Northbrook?
Income or Wage Gap in Northbrook is 46.8%.
Women in Northbrook earn 53.2 cents for every dollar earned by a man.
What is Inequality or Gini Index in Northbrook?
Inequality or Gini Index in Northbrook is 0.47.
What is the Total Population of Northbrook?
Total Population of Northbrook is 34,950.
What is the Total Male Population of Northbrook?
Total Male Population of Northbrook is 16,736.
What is the Total Female Population of Northbrook?
Total Female Population of Northbrook is 18,214.
What is the Ratio of Males per 100 Females in Northbrook?
There are 91.89 Males per 100 Females in Northbrook.
What is the Ratio of Females per 100 Males in Northbrook?
There are 108.83 Females per 100 Males in Northbrook.
What is the Median Population Age in Northbrook?
Median Population Age in Northbrook is 49.4 Years.
What is the Average Family Size in Northbrook
Average Family Size in Northbrook is 3.0 People.
What is the Average Household Size in Northbrook
Average Household Size in Northbrook is 2.5 People.
How Large is the Labor Force in Northbrook?
There are 17,276 People in the Labor Forcein in Northbrook.
What is the Percentage of People in the Labor Force in Northbrook?
60.2% of People are in the Labor Force in Northbrook.
What is the Unemployment Rate in Northbrook?
Unemployment Rate in Northbrook is 3.2%.