Indian Lake, TX Map & Demographics
Indian Lake Map
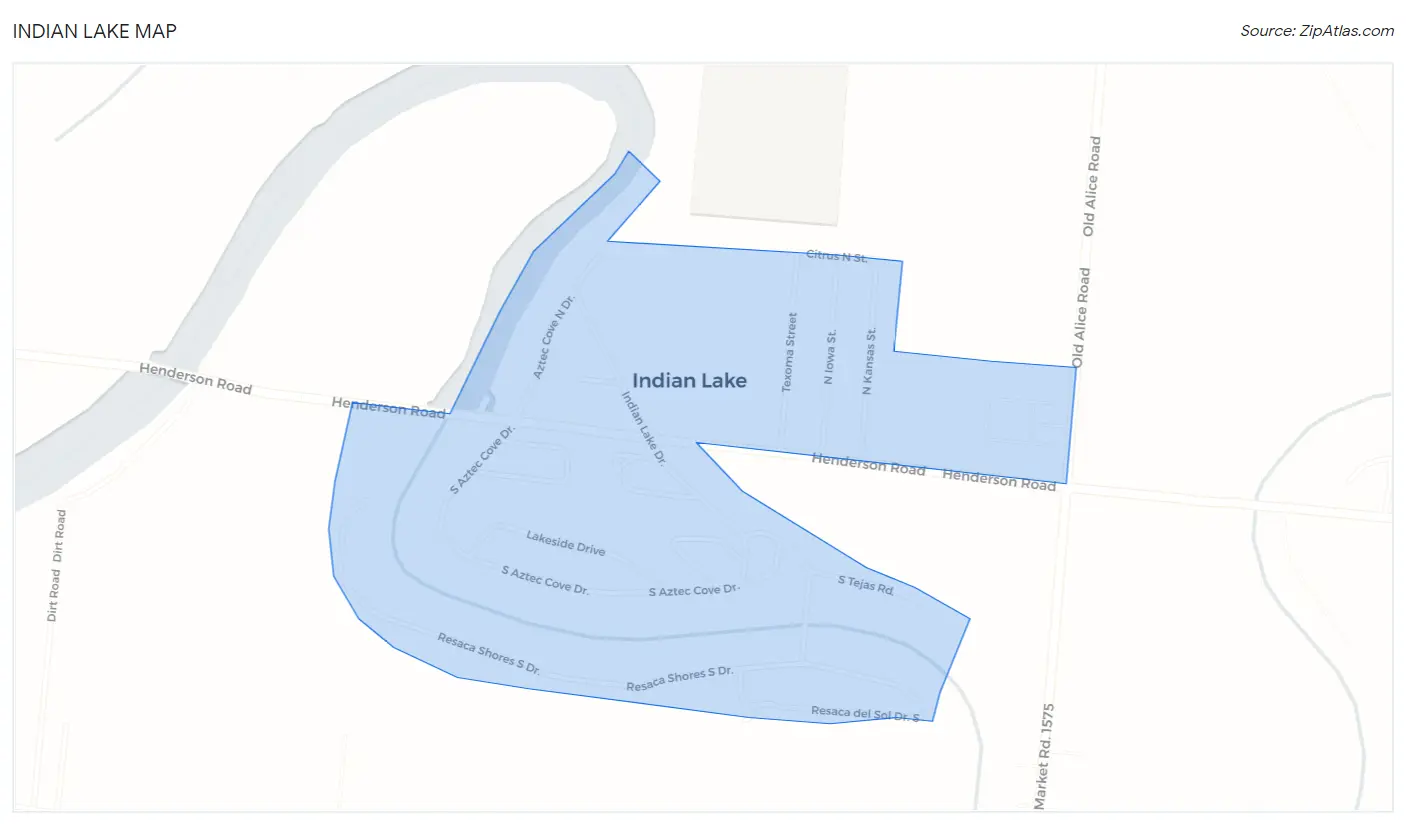
Indian Lake Overview
$17,596
PER CAPITA INCOME
$35,313
AVG FAMILY INCOME
$24,000
AVG HOUSEHOLD INCOME
33.9%
WAGE / INCOME GAP [ % ]
66.1¢/ $1
WAGE / INCOME GAP [ $ ]
$9,345
FAMILY INCOME DEFICIT
0.56
INEQUALITY / GINI INDEX
1,231
TOTAL POPULATION
696
MALE POPULATION
535
FEMALE POPULATION
130.09
MALES / 100 FEMALES
76.87
FEMALES / 100 MALES
29.3
MEDIAN AGE
3.6
AVG FAMILY SIZE
3.1
AVG HOUSEHOLD SIZE
430
LABOR FORCE [ PEOPLE ]
54.2%
PERCENT IN LABOR FORCE
6.0%
UNEMPLOYMENT RATE
Indian Lake Area Codes
Income in Indian Lake
Income Overview in Indian Lake
Per Capita Income in Indian Lake is $17,596, while median incomes of families and households are $35,313 and $24,000 respectively.
| Characteristic | Number | Measure |
| Per Capita Income | 1,231 | $17,596 |
| Median Family Income | 313 | $35,313 |
| Mean Family Income | 313 | $57,557 |
| Median Household Income | 396 | $24,000 |
| Mean Household Income | 396 | $50,629 |
| Income Deficit | 313 | $9,345 |
| Wage / Income Gap (%) | 1,231 | 33.86% |
| Wage / Income Gap ($) | 1,231 | 66.14¢ per $1 |
| Gini / Inequality Index | 1,231 | 0.56 |
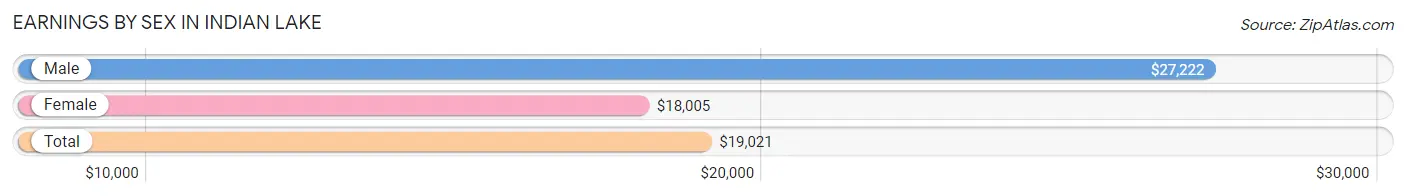
Earnings by Sex in Indian Lake
Average Earnings in Indian Lake are $19,021, $27,222 for men and $18,005 for women, a difference of 33.9%.
| Sex | Number | Average Earnings |
| Male | 288 (64.4%) | $27,222 |
| Female | 159 (35.6%) | $18,005 |
| Total | 447 (100.0%) | $19,021 |
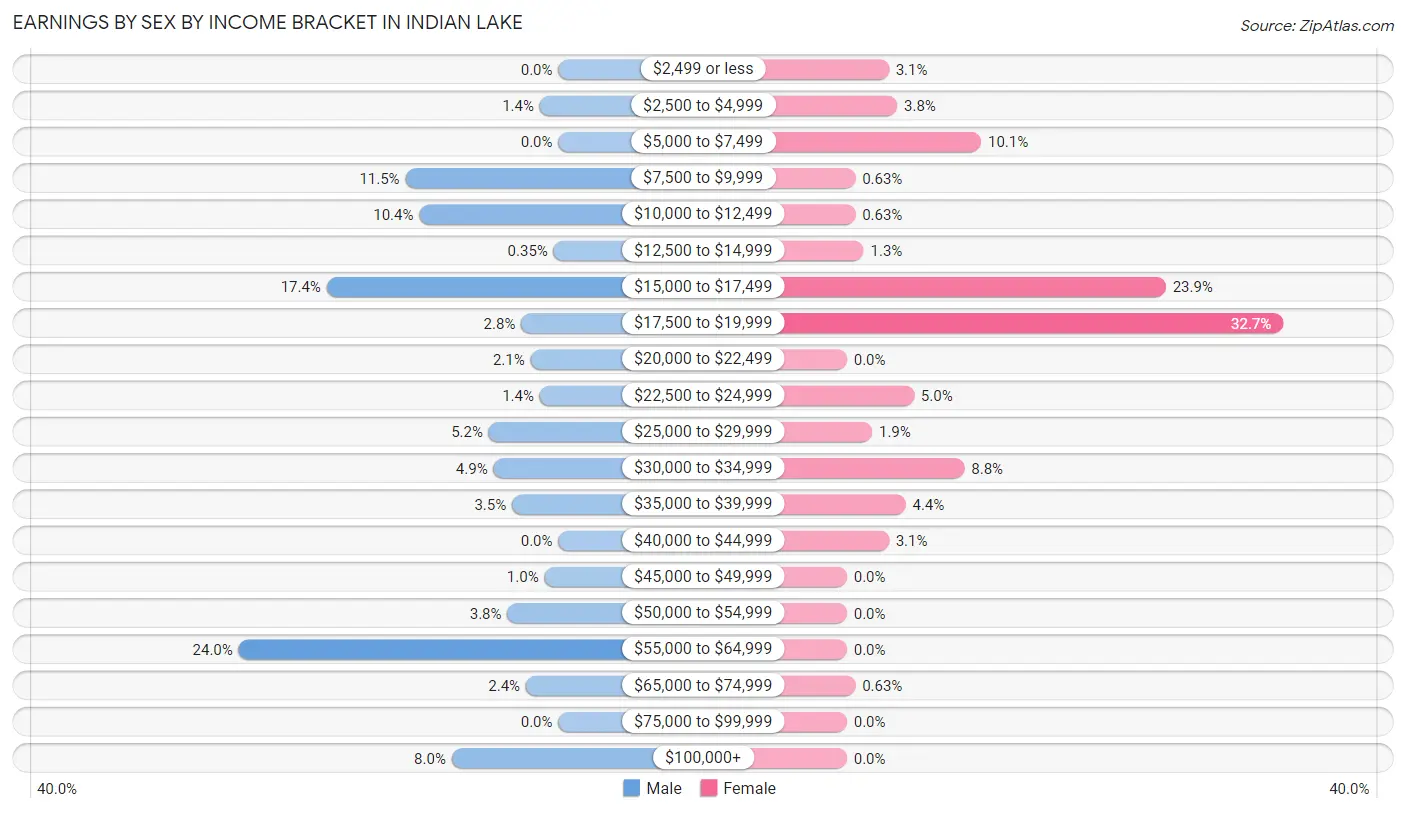
Earnings by Sex by Income Bracket in Indian Lake
The most common earnings brackets in Indian Lake are $55,000 to $64,999 for men (69 | 24.0%) and $17,500 to $19,999 for women (52 | 32.7%).
| Income | Male | Female |
| $2,499 or less | 0 (0.0%) | 5 (3.1%) |
| $2,500 to $4,999 | 4 (1.4%) | 6 (3.8%) |
| $5,000 to $7,499 | 0 (0.0%) | 16 (10.1%) |
| $7,500 to $9,999 | 33 (11.5%) | 1 (0.6%) |
| $10,000 to $12,499 | 30 (10.4%) | 1 (0.6%) |
| $12,500 to $14,999 | 1 (0.4%) | 2 (1.3%) |
| $15,000 to $17,499 | 50 (17.4%) | 38 (23.9%) |
| $17,500 to $19,999 | 8 (2.8%) | 52 (32.7%) |
| $20,000 to $22,499 | 6 (2.1%) | 0 (0.0%) |
| $22,500 to $24,999 | 4 (1.4%) | 8 (5.0%) |
| $25,000 to $29,999 | 15 (5.2%) | 3 (1.9%) |
| $30,000 to $34,999 | 14 (4.9%) | 14 (8.8%) |
| $35,000 to $39,999 | 10 (3.5%) | 7 (4.4%) |
| $40,000 to $44,999 | 0 (0.0%) | 5 (3.1%) |
| $45,000 to $49,999 | 3 (1.0%) | 0 (0.0%) |
| $50,000 to $54,999 | 11 (3.8%) | 0 (0.0%) |
| $55,000 to $64,999 | 69 (24.0%) | 0 (0.0%) |
| $65,000 to $74,999 | 7 (2.4%) | 1 (0.6%) |
| $75,000 to $99,999 | 0 (0.0%) | 0 (0.0%) |
| $100,000+ | 23 (8.0%) | 0 (0.0%) |
| Total | 288 (100.0%) | 159 (100.0%) |
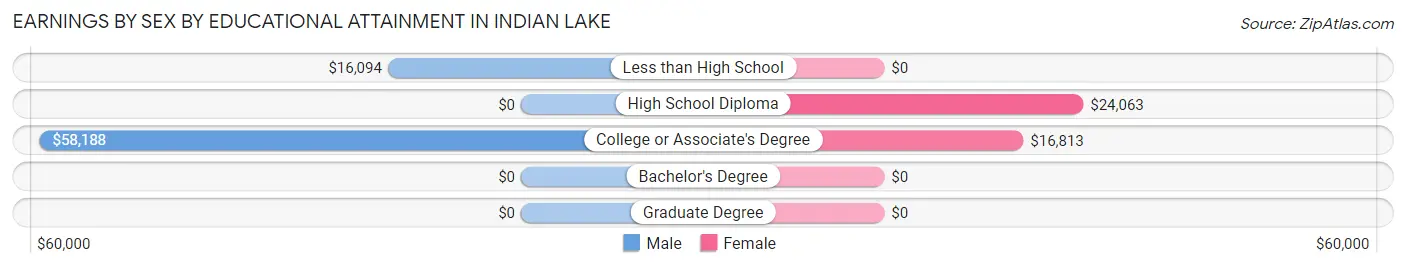
Earnings by Sex by Educational Attainment in Indian Lake
| Educational Attainment | Male Income | Female Income |
| Less than High School | $16,094 | $0 |
| High School Diploma | - | - |
| College or Associate's Degree | $58,188 | $16,813 |
| Bachelor's Degree | - | - |
| Graduate Degree | - | - |
| Total | - | - |
Family Income in Indian Lake
Family Income Brackets in Indian Lake
According to the Indian Lake family income data, there are 73 families falling into the $15,000 to $24,999 income range, which is the most common income bracket and makes up 23.3% of all families. Conversely, the $10,000 to $14,999 income bracket is the least frequent group with only 11 families (3.5%) belonging to this category.
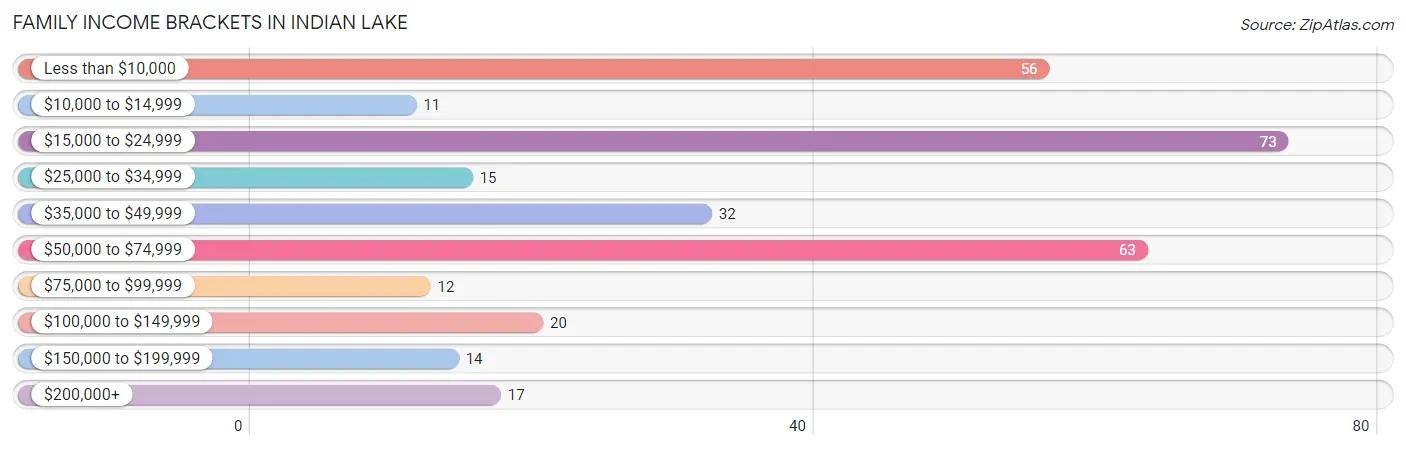
| Income Bracket | # Families | % Families |
| Less than $10,000 | 56 | 17.9% |
| $10,000 to $14,999 | 11 | 3.5% |
| $15,000 to $24,999 | 73 | 23.3% |
| $25,000 to $34,999 | 15 | 4.8% |
| $35,000 to $49,999 | 32 | 10.2% |
| $50,000 to $74,999 | 63 | 20.1% |
| $75,000 to $99,999 | 12 | 3.8% |
| $100,000 to $149,999 | 20 | 6.4% |
| $150,000 to $199,999 | 14 | 4.5% |
| $200,000+ | 17 | 5.4% |
Family Income by Famaliy Size in Indian Lake
5-person families (57 | 18.2%) account for the highest median family income in Indian Lake with $58,547 per family, while 5-person families (57 | 18.2%) have the highest median income of $11,709 per family member.
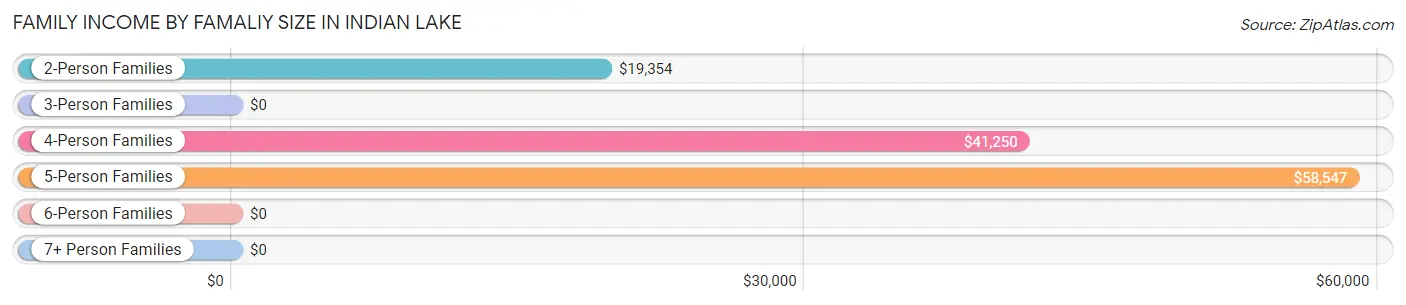
| Income Bracket | # Families | Median Income |
| 2-Person Families | 153 (48.9%) | $19,354 |
| 3-Person Families | 41 (13.1%) | $0 |
| 4-Person Families | 33 (10.5%) | $41,250 |
| 5-Person Families | 57 (18.2%) | $58,547 |
| 6-Person Families | 5 (1.6%) | $0 |
| 7+ Person Families | 24 (7.7%) | $0 |
| Total | 313 (100.0%) | $35,313 |
Family Income by Number of Earners in Indian Lake
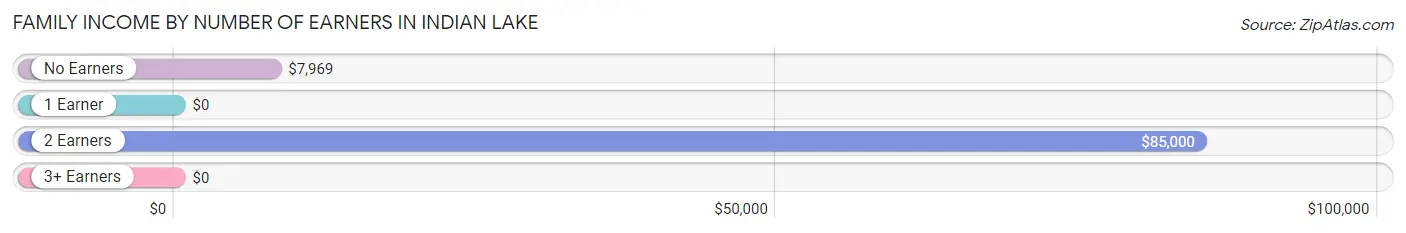
| Number of Earners | # Families | Median Income |
| No Earners | 56 (17.9%) | $7,969 |
| 1 Earner | 174 (55.6%) | $0 |
| 2 Earners | 76 (24.3%) | $85,000 |
| 3+ Earners | 7 (2.2%) | $0 |
| Total | 313 (100.0%) | $35,313 |
Household Income in Indian Lake
Household Income Brackets in Indian Lake
With 113 households falling in the category, the $15,000 to $24,999 income range is the most frequent in Indian Lake, accounting for 28.5% of all households. In contrast, only 12 households (3.0%) fall into the $75,000 to $99,999 income bracket, making it the least populous group.
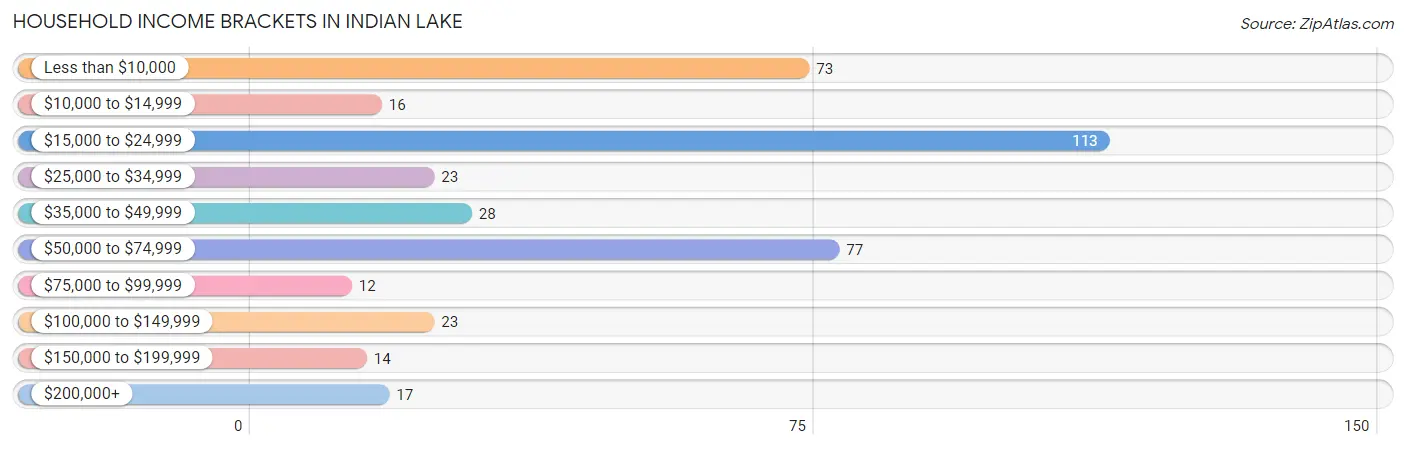
| Income Bracket | # Households | % Households |
| Less than $10,000 | 73 | 18.4% |
| $10,000 to $14,999 | 16 | 4.0% |
| $15,000 to $24,999 | 113 | 28.5% |
| $25,000 to $34,999 | 23 | 5.8% |
| $35,000 to $49,999 | 28 | 7.1% |
| $50,000 to $74,999 | 77 | 19.4% |
| $75,000 to $99,999 | 12 | 3.0% |
| $100,000 to $149,999 | 23 | 5.8% |
| $150,000 to $199,999 | 14 | 3.5% |
| $200,000+ | 17 | 4.3% |
Household Income by Householder Age in Indian Lake
The median household income in Indian Lake is $24,000, with the highest median household income of $37,375 found in the 25 to 44 years age bracket for the primary householder. A total of 133 households (33.6%) fall into this category. Meanwhile, the 15 to 24 years age bracket for the primary householder has the lowest median household income of $0, with 52 households (13.1%) in this group.
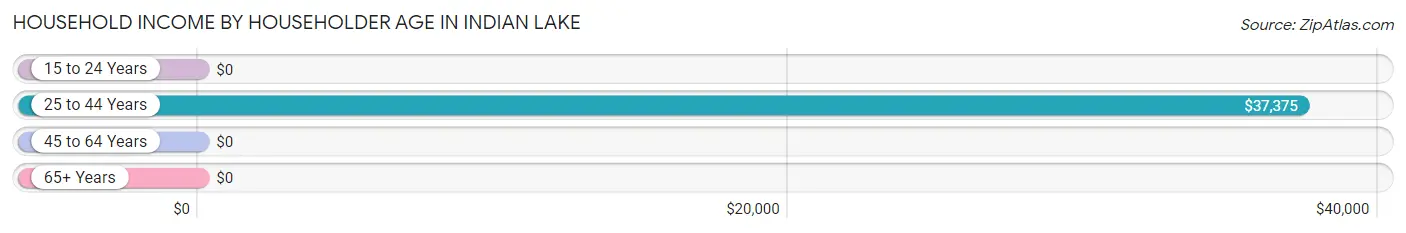
| Income Bracket | # Households | Median Income |
| 15 to 24 Years | 52 (13.1%) | $0 |
| 25 to 44 Years | 133 (33.6%) | $37,375 |
| 45 to 64 Years | 103 (26.0%) | $0 |
| 65+ Years | 108 (27.3%) | $0 |
| Total | 396 (100.0%) | $24,000 |
Poverty in Indian Lake
Income Below Poverty by Sex and Age in Indian Lake
With 27.4% poverty level for males and 45.1% for females among the residents of Indian Lake, 5 year old males and 5 year old females are the most vulnerable to poverty, with 1 males (100.0%) and 9 females (100.0%) in their respective age groups living below the poverty level.
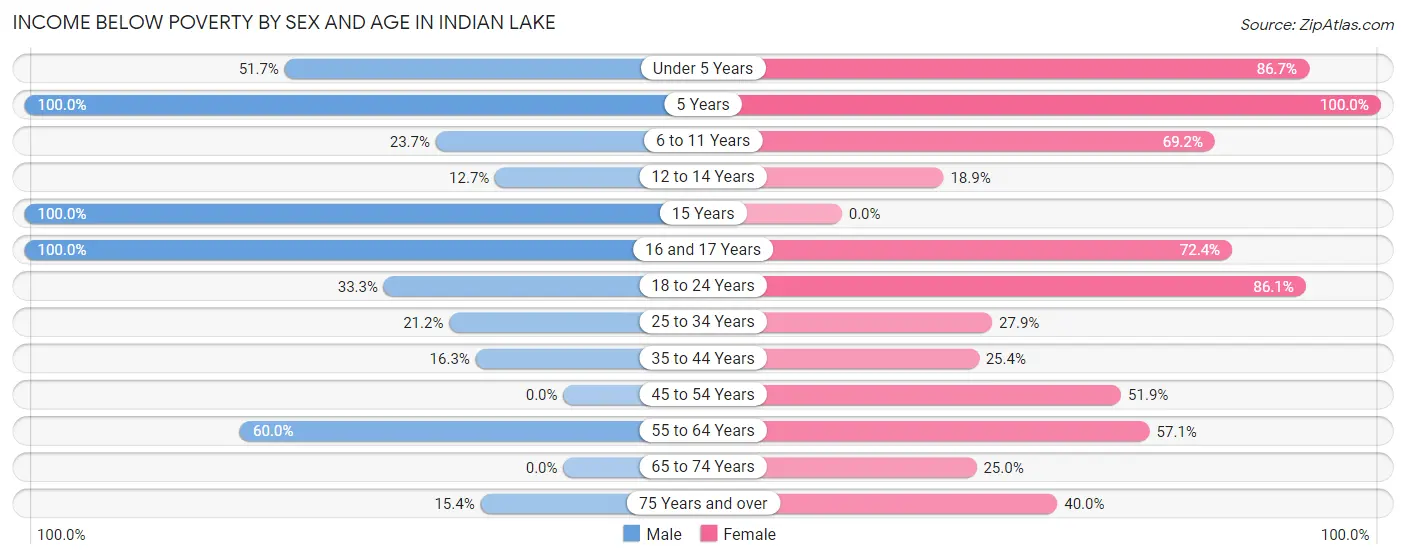
| Age Bracket | Male | Female |
| Under 5 Years | 75 (51.7%) | 13 (86.7%) |
| 5 Years | 1 (100.0%) | 9 (100.0%) |
| 6 to 11 Years | 18 (23.7%) | 18 (69.2%) |
| 12 to 14 Years | 10 (12.7%) | 10 (18.9%) |
| 15 Years | 3 (100.0%) | 0 (0.0%) |
| 16 and 17 Years | 3 (100.0%) | 21 (72.4%) |
| 18 to 24 Years | 4 (33.3%) | 68 (86.1%) |
| 25 to 34 Years | 18 (21.2%) | 24 (27.9%) |
| 35 to 44 Years | 21 (16.3%) | 15 (25.4%) |
| 45 to 54 Years | 0 (0.0%) | 14 (51.8%) |
| 55 to 64 Years | 36 (60.0%) | 28 (57.1%) |
| 65 to 74 Years | 0 (0.0%) | 13 (25.0%) |
| 75 Years and over | 2 (15.4%) | 8 (40.0%) |
| Total | 191 (27.4%) | 241 (45.1%) |
Income Above Poverty by Sex and Age in Indian Lake
According to the poverty statistics in Indian Lake, males aged 45 to 54 years and females aged 15 years are the age groups that are most secure financially, with 100.0% of males and 100.0% of females in these age groups living above the poverty line.
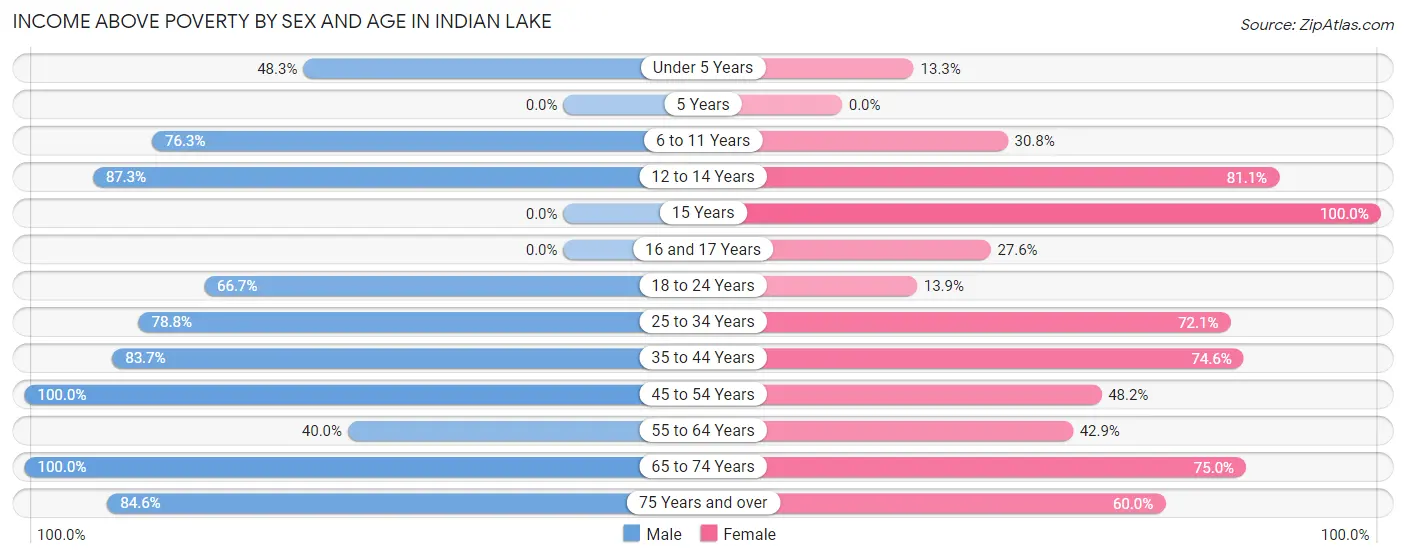
| Age Bracket | Male | Female |
| Under 5 Years | 70 (48.3%) | 2 (13.3%) |
| 5 Years | 0 (0.0%) | 0 (0.0%) |
| 6 to 11 Years | 58 (76.3%) | 8 (30.8%) |
| 12 to 14 Years | 69 (87.3%) | 43 (81.1%) |
| 15 Years | 0 (0.0%) | 31 (100.0%) |
| 16 and 17 Years | 0 (0.0%) | 8 (27.6%) |
| 18 to 24 Years | 8 (66.7%) | 11 (13.9%) |
| 25 to 34 Years | 67 (78.8%) | 62 (72.1%) |
| 35 to 44 Years | 108 (83.7%) | 44 (74.6%) |
| 45 to 54 Years | 17 (100.0%) | 13 (48.1%) |
| 55 to 64 Years | 24 (40.0%) | 21 (42.9%) |
| 65 to 74 Years | 73 (100.0%) | 39 (75.0%) |
| 75 Years and over | 11 (84.6%) | 12 (60.0%) |
| Total | 505 (72.6%) | 294 (54.9%) |
Income Below Poverty Among Married-Couple Families in Indian Lake
The poverty statistics for married-couple families in Indian Lake show that 22.9% or 44 of the total 192 families live below the poverty line. Families with no children have the highest poverty rate of 33.7%, comprising of 28 families. On the other hand, families with 1 or 2 children have the lowest poverty rate of 0.0%, which includes 0 families.
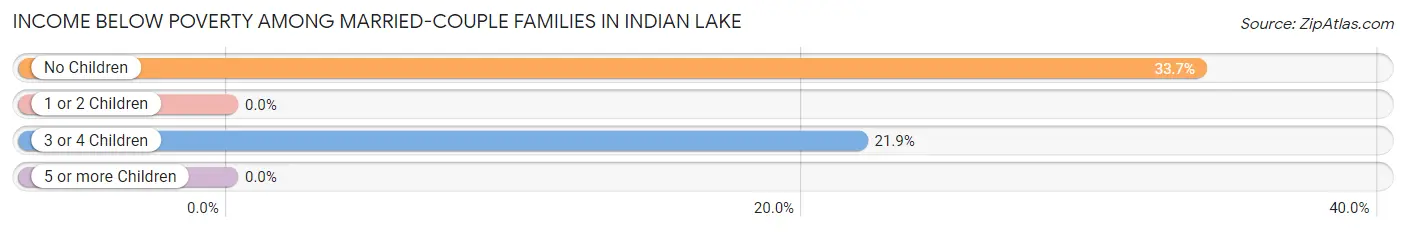
| Children | Above Poverty | Below Poverty |
| No Children | 55 (66.3%) | 28 (33.7%) |
| 1 or 2 Children | 36 (100.0%) | 0 (0.0%) |
| 3 or 4 Children | 57 (78.1%) | 16 (21.9%) |
| 5 or more Children | 0 (0.0%) | 0 (0.0%) |
| Total | 148 (77.1%) | 44 (22.9%) |
Income Below Poverty Among Single-Parent Households in Indian Lake
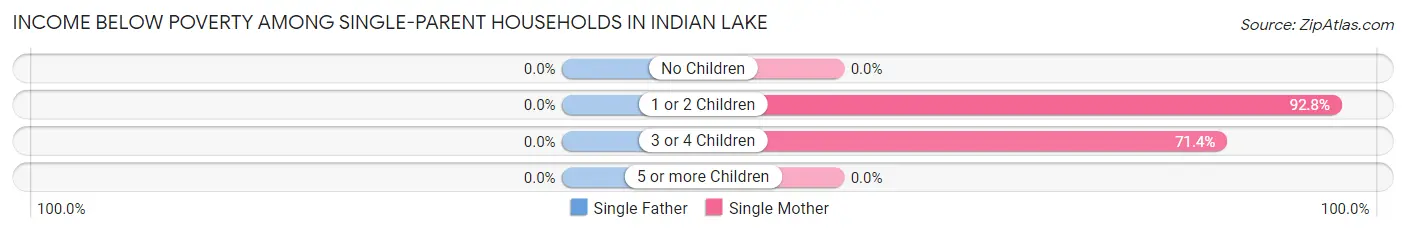
| Children | Single Father | Single Mother |
| No Children | 0 (0.0%) | 0 (0.0%) |
| 1 or 2 Children | 0 (0.0%) | 90 (92.8%) |
| 3 or 4 Children | 0 (0.0%) | 5 (71.4%) |
| 5 or more Children | 0 (0.0%) | 0 (0.0%) |
| Total | 0 (0.0%) | 95 (87.2%) |
Income Below Poverty Among Married-Couple vs Single-Parent Households in Indian Lake
The poverty data for Indian Lake shows that 44 of the married-couple family households (22.9%) and 95 of the single-parent households (78.5%) are living below the poverty level. Within the married-couple family households, those with no children have the highest poverty rate, with 28 households (33.7%) falling below the poverty line. Among the single-parent households, those with 1 or 2 children have the highest poverty rate, with 90 household (92.8%) living below poverty.
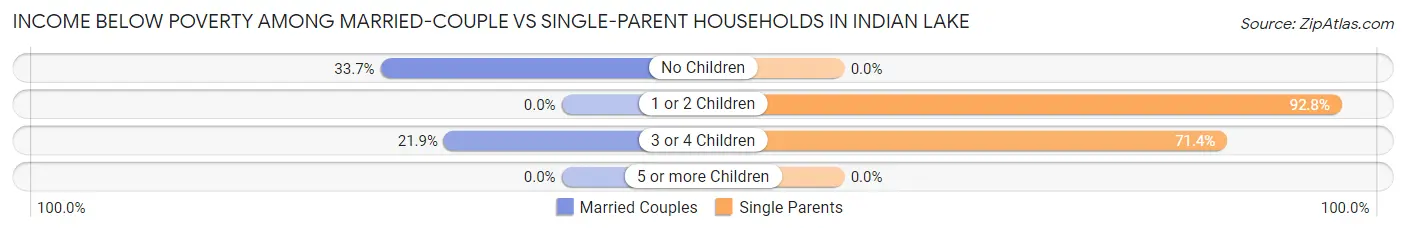
| Children | Married-Couple Families | Single-Parent Households |
| No Children | 28 (33.7%) | 0 (0.0%) |
| 1 or 2 Children | 0 (0.0%) | 90 (92.8%) |
| 3 or 4 Children | 16 (21.9%) | 5 (71.4%) |
| 5 or more Children | 0 (0.0%) | 0 (0.0%) |
| Total | 44 (22.9%) | 95 (78.5%) |
Race in Indian Lake
The most populous races in Indian Lake are White / Caucasian (692 | 56.2%), Hispanic or Latino (654 | 53.1%), and Black / African American (231 | 18.8%).
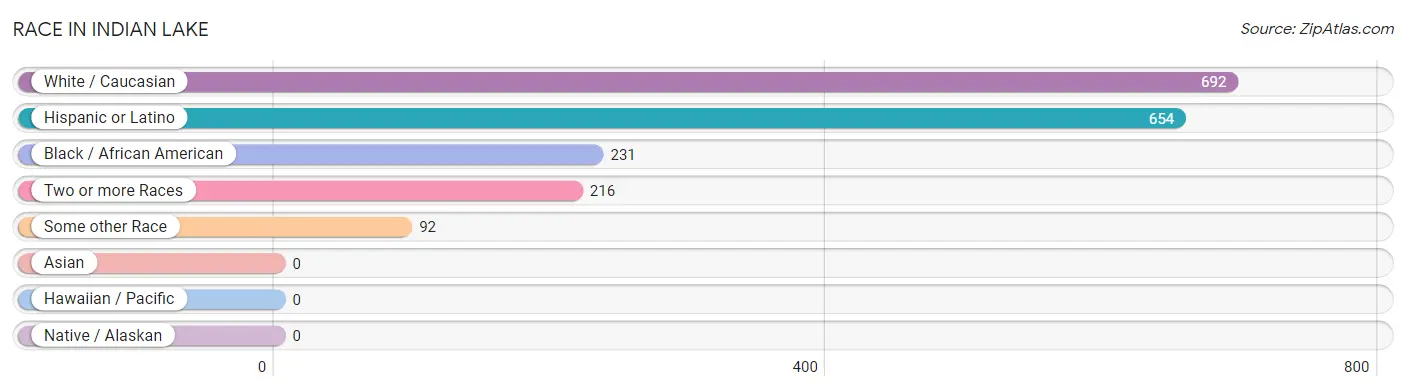
| Race | # Population | % Population |
| Asian | 0 | 0.0% |
| Black / African American | 231 | 18.8% |
| Hawaiian / Pacific | 0 | 0.0% |
| Hispanic or Latino | 654 | 53.1% |
| Native / Alaskan | 0 | 0.0% |
| White / Caucasian | 692 | 56.2% |
| Two or more Races | 216 | 17.5% |
| Some other Race | 92 | 7.5% |
| Total | 1,231 | 100.0% |
Ancestry in Indian Lake
The most populous ancestries reported in Indian Lake are Mexican (619 | 50.3%), German (201 | 16.3%), Irish (168 | 13.7%), English (32 | 2.6%), and Central American (30 | 2.4%), together accounting for 85.3% of all Indian Lake residents.
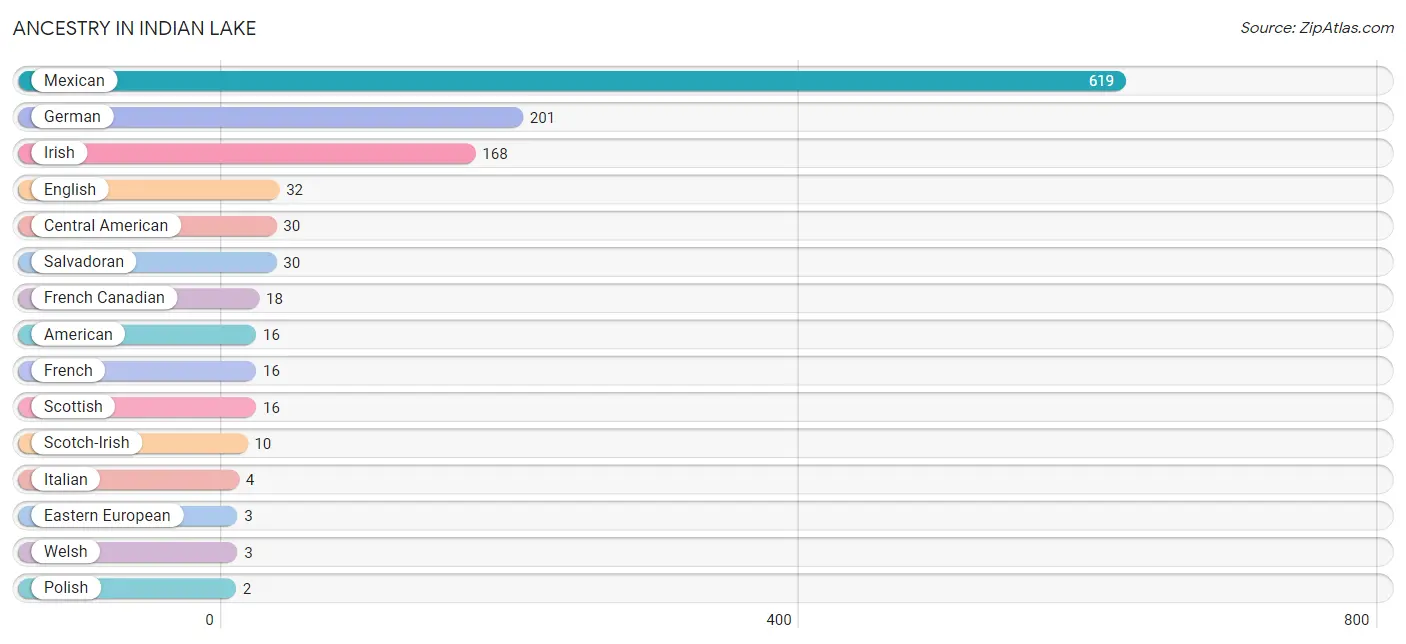
| Ancestry | # Population | % Population |
| American | 16 | 1.3% |
| Central American | 30 | 2.4% |
| Cuban | 1 | 0.1% |
| Eastern European | 3 | 0.2% |
| English | 32 | 2.6% |
| French | 16 | 1.3% |
| French Canadian | 18 | 1.5% |
| German | 201 | 16.3% |
| Irish | 168 | 13.7% |
| Italian | 4 | 0.3% |
| Mexican | 619 | 50.3% |
| Polish | 2 | 0.2% |
| Salvadoran | 30 | 2.4% |
| Scotch-Irish | 10 | 0.8% |
| Scottish | 16 | 1.3% |
| Spanish | 2 | 0.2% |
| Welsh | 3 | 0.2% | View All 17 Rows |
Immigrants in Indian Lake
The most numerous immigrant groups reported in Indian Lake came from Latin America (156 | 12.7%), Central America (155 | 12.6%), Mexico (142 | 11.5%), El Salvador (13 | 1.1%), and Caribbean (1 | 0.1%), together accounting for 37.9% of all Indian Lake residents.
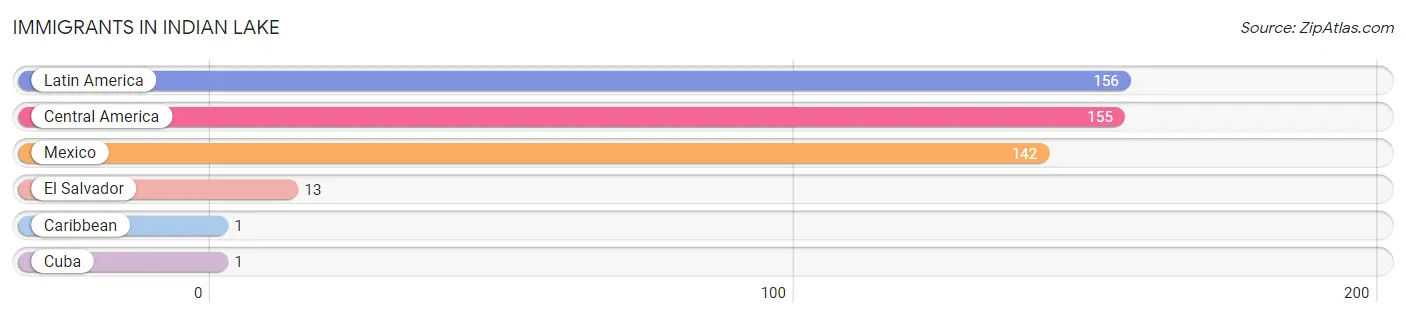
| Immigration Origin | # Population | % Population |
| Caribbean | 1 | 0.1% |
| Central America | 155 | 12.6% |
| Cuba | 1 | 0.1% |
| El Salvador | 13 | 1.1% |
| Latin America | 156 | 12.7% |
| Mexico | 142 | 11.5% | View All 6 Rows |
Sex and Age in Indian Lake
Sex and Age in Indian Lake
The most populous age groups in Indian Lake are Under 5 Years (145 | 20.8%) for men and 15 to 19 Years (76 | 14.2%) for women.
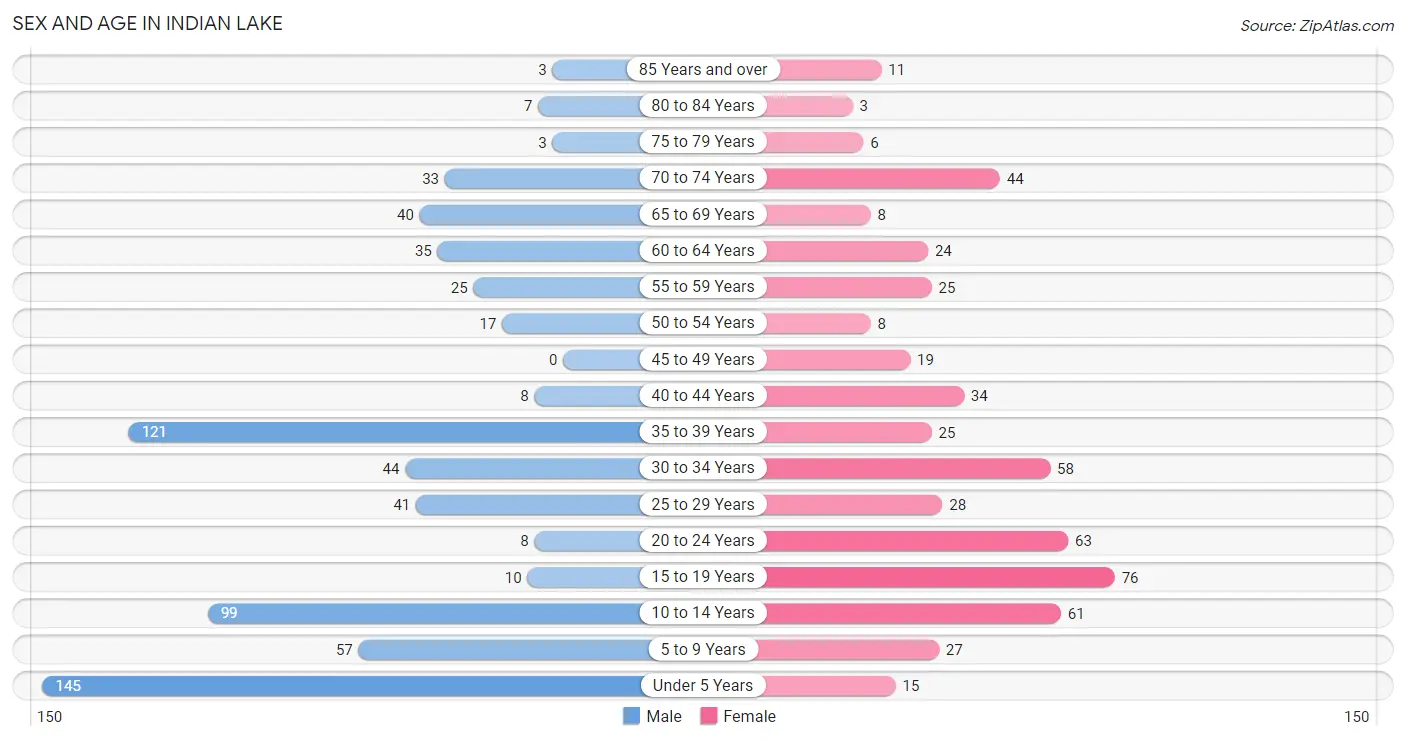
| Age Bracket | Male | Female |
| Under 5 Years | 145 (20.8%) | 15 (2.8%) |
| 5 to 9 Years | 57 (8.2%) | 27 (5.1%) |
| 10 to 14 Years | 99 (14.2%) | 61 (11.4%) |
| 15 to 19 Years | 10 (1.4%) | 76 (14.2%) |
| 20 to 24 Years | 8 (1.1%) | 63 (11.8%) |
| 25 to 29 Years | 41 (5.9%) | 28 (5.2%) |
| 30 to 34 Years | 44 (6.3%) | 58 (10.8%) |
| 35 to 39 Years | 121 (17.4%) | 25 (4.7%) |
| 40 to 44 Years | 8 (1.1%) | 34 (6.4%) |
| 45 to 49 Years | 0 (0.0%) | 19 (3.5%) |
| 50 to 54 Years | 17 (2.4%) | 8 (1.5%) |
| 55 to 59 Years | 25 (3.6%) | 25 (4.7%) |
| 60 to 64 Years | 35 (5.0%) | 24 (4.5%) |
| 65 to 69 Years | 40 (5.8%) | 8 (1.5%) |
| 70 to 74 Years | 33 (4.7%) | 44 (8.2%) |
| 75 to 79 Years | 3 (0.4%) | 6 (1.1%) |
| 80 to 84 Years | 7 (1.0%) | 3 (0.6%) |
| 85 Years and over | 3 (0.4%) | 11 (2.1%) |
| Total | 696 (100.0%) | 535 (100.0%) |
Families and Households in Indian Lake
Median Family Size in Indian Lake
The median family size in Indian Lake is 3.63 persons per family, with married-couple families (192 | 61.3%) accounting for the largest median family size of 4.17 persons per family. On the other hand, single female/mother families (109 | 34.8%) represent the smallest median family size with 2.67 persons per family.
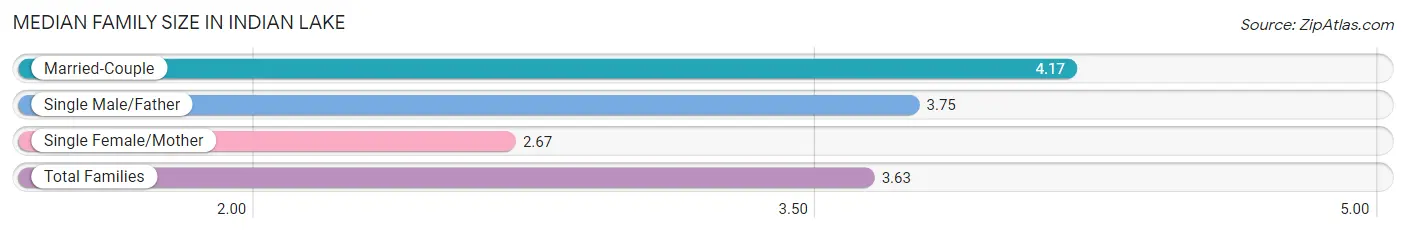
| Family Type | # Families | Family Size |
| Married-Couple | 192 (61.3%) | 4.17 |
| Single Male/Father | 12 (3.8%) | 3.75 |
| Single Female/Mother | 109 (34.8%) | 2.67 |
| Total Families | 313 (100.0%) | 3.63 |
Median Household Size in Indian Lake
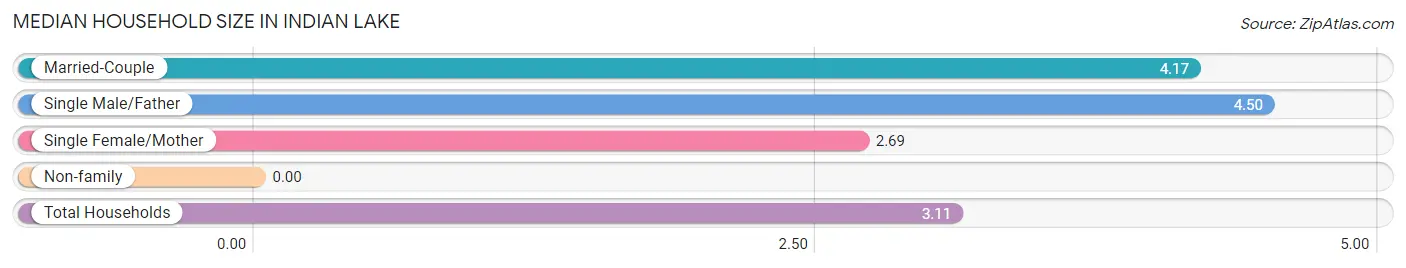
| Household Type | # Households | Household Size |
| Married-Couple | 192 (48.5%) | 4.17 |
| Single Male/Father | 12 (3.0%) | 4.50 |
| Single Female/Mother | 109 (27.5%) | 2.69 |
| Non-family | 83 (21.0%) | - |
| Total Households | 396 (100.0%) | 3.11 |
Household Size by Marriage Status in Indian Lake
Out of a total of 396 households in Indian Lake, 313 (79.0%) are family households, while 83 (21.0%) are nonfamily households. The most numerous type of family households are 2-person households, comprising 153, and the most common type of nonfamily households are 1-person households, comprising 83.
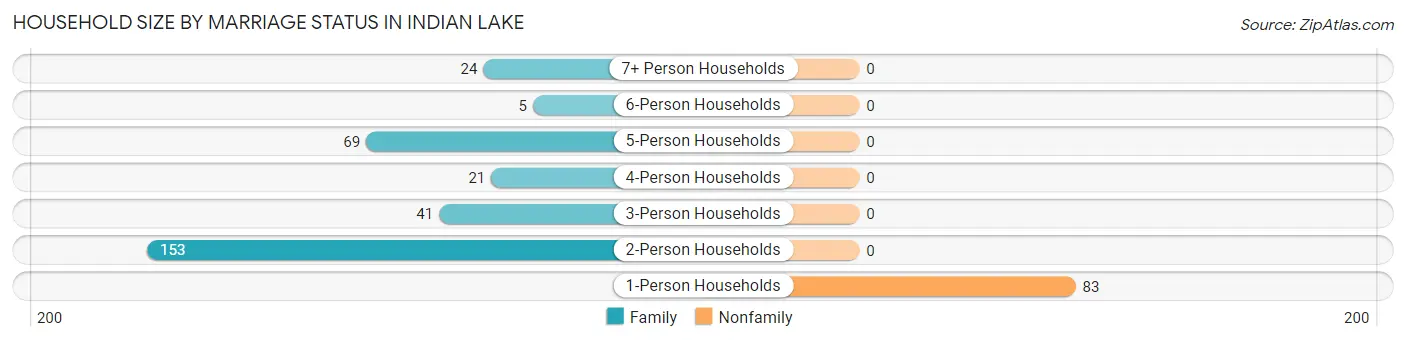
| Household Size | Family Households | Nonfamily Households |
| 1-Person Households | - | 83 (21.0%) |
| 2-Person Households | 153 (38.6%) | 0 (0.0%) |
| 3-Person Households | 41 (10.3%) | 0 (0.0%) |
| 4-Person Households | 21 (5.3%) | 0 (0.0%) |
| 5-Person Households | 69 (17.4%) | 0 (0.0%) |
| 6-Person Households | 5 (1.3%) | 0 (0.0%) |
| 7+ Person Households | 24 (6.1%) | 0 (0.0%) |
| Total | 313 (79.0%) | 83 (21.0%) |
Female Fertility in Indian Lake
Fertility by Age in Indian Lake
Average fertility rate in Indian Lake is 59.0 births per 1,000 women. Women in the age bracket of 20 to 34 years have the highest fertility rate with 107.0 births per 1,000 women. Women in the age bracket of 20 to 34 years acount for 88.9% of all women with births.
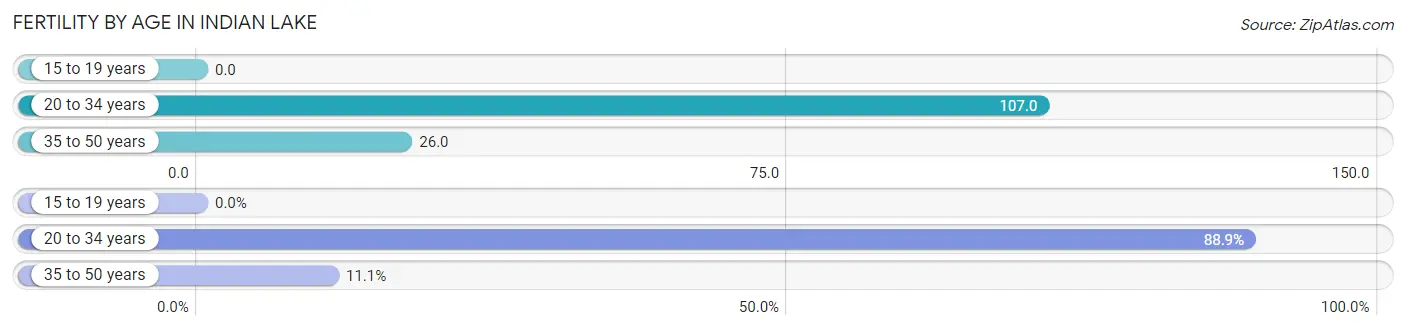
| Age Bracket | Women with Births | Births / 1,000 Women |
| 15 to 19 years | 0 (0.0%) | 0.0 |
| 20 to 34 years | 16 (88.9%) | 107.0 |
| 35 to 50 years | 2 (11.1%) | 26.0 |
| Total | 18 (100.0%) | 59.0 |
Fertility by Age by Marriage Status in Indian Lake
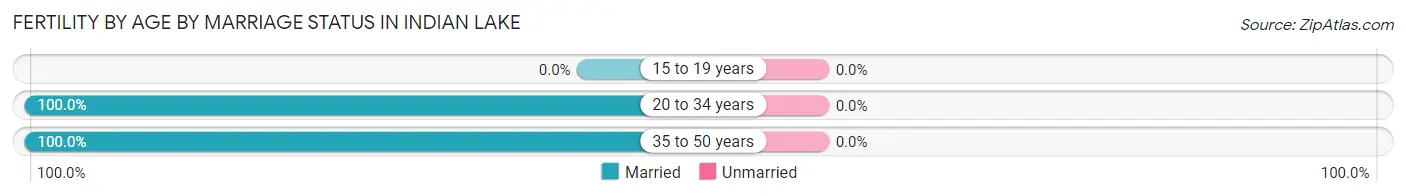
| Age Bracket | Married | Unmarried |
| 15 to 19 years | 0 (0.0%) | 0 (0.0%) |
| 20 to 34 years | 16 (100.0%) | 0 (0.0%) |
| 35 to 50 years | 2 (100.0%) | 0 (0.0%) |
| Total | 18 (100.0%) | 0 (0.0%) |
Fertility by Education in Indian Lake
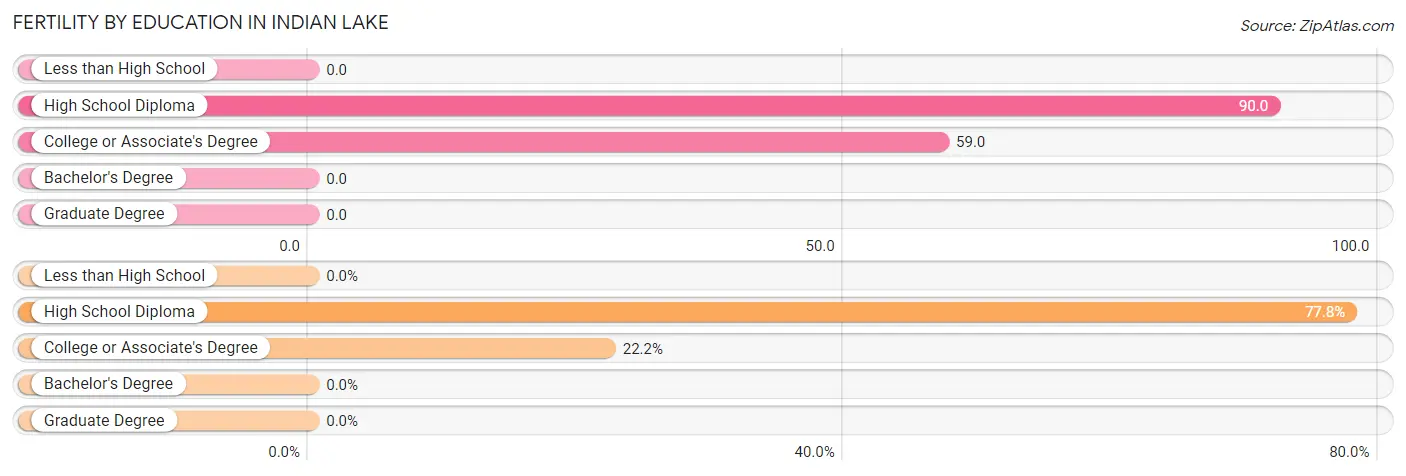
| Educational Attainment | Women with Births | Births / 1,000 Women |
| Less than High School | 0 (0.0%) | 0.0 |
| High School Diploma | 14 (77.8%) | 90.0 |
| College or Associate's Degree | 4 (22.2%) | 59.0 |
| Bachelor's Degree | 0 (0.0%) | 0.0 |
| Graduate Degree | 0 (0.0%) | 0.0 |
| Total | 18 (100.0%) | 59.0 |
Fertility by Education by Marriage Status in Indian Lake
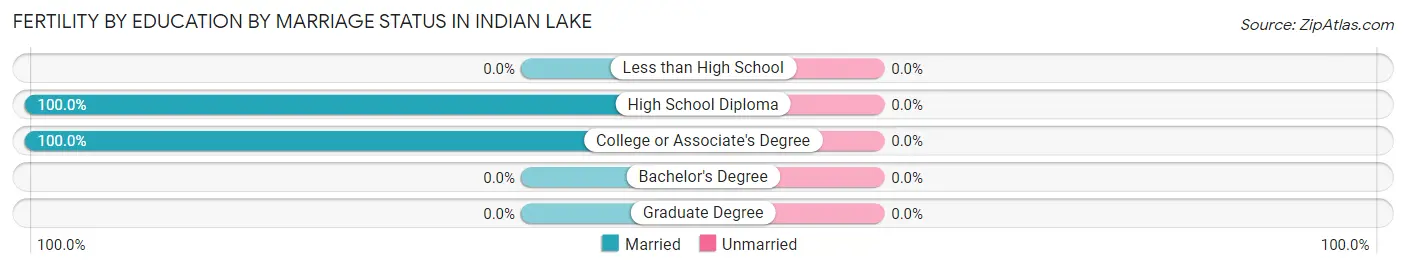
| Educational Attainment | Married | Unmarried |
| Less than High School | 0 (0.0%) | 0 (0.0%) |
| High School Diploma | 14 (100.0%) | 0 (0.0%) |
| College or Associate's Degree | 4 (100.0%) | 0 (0.0%) |
| Bachelor's Degree | 0 (0.0%) | 0 (0.0%) |
| Graduate Degree | 0 (0.0%) | 0 (0.0%) |
| Total | 18 (100.0%) | 0 (0.0%) |
Employment Characteristics in Indian Lake
Employment by Class of Employer in Indian Lake
Among the 399 employed individuals in Indian Lake, private company employees (341 | 85.5%), self-employed (not incorporated) (21 | 5.3%), and local government employees (18 | 4.5%) make up the most common classes of employment.
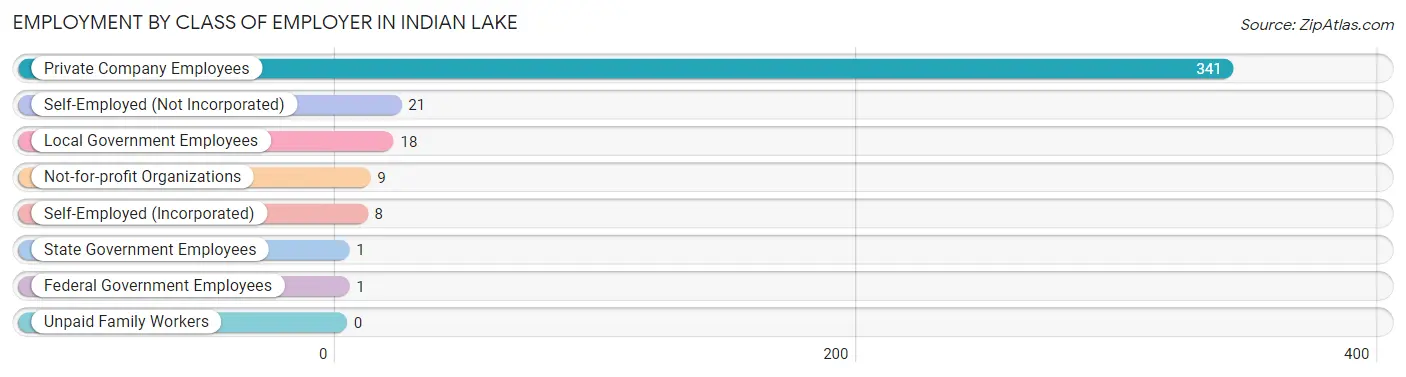
| Employer Class | # Employees | % Employees |
| Private Company Employees | 341 | 85.5% |
| Self-Employed (Incorporated) | 8 | 2.0% |
| Self-Employed (Not Incorporated) | 21 | 5.3% |
| Not-for-profit Organizations | 9 | 2.3% |
| Local Government Employees | 18 | 4.5% |
| State Government Employees | 1 | 0.3% |
| Federal Government Employees | 1 | 0.3% |
| Unpaid Family Workers | 0 | 0.0% |
| Total | 399 | 100.0% |
Employment Status by Age in Indian Lake
According to the labor force statistics for Indian Lake, out of the total population over 16 years of age (793), 54.2% or 430 individuals are in the labor force, with 6.0% or 26 of them unemployed. The age group with the highest labor force participation rate is 20 to 24 years, with 84.5% or 60 individuals in the labor force. Within the labor force, the 35 to 44 years age range has the highest percentage of unemployed individuals, with 16.4% or 24 of them being unemployed.
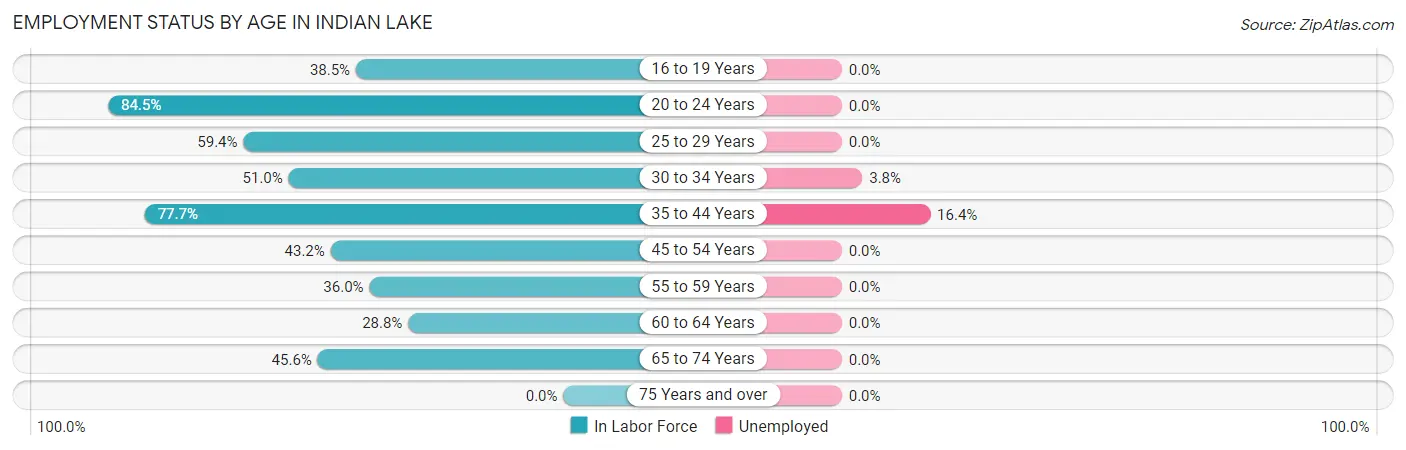
| Age Bracket | In Labor Force | Unemployed |
| 16 to 19 Years | 20 (38.5%) | 0 (0.0%) |
| 20 to 24 Years | 60 (84.5%) | 0 (0.0%) |
| 25 to 29 Years | 41 (59.4%) | 0 (0.0%) |
| 30 to 34 Years | 52 (51.0%) | 2 (3.8%) |
| 35 to 44 Years | 146 (77.7%) | 24 (16.4%) |
| 45 to 54 Years | 19 (43.2%) | 0 (0.0%) |
| 55 to 59 Years | 18 (36.0%) | 0 (0.0%) |
| 60 to 64 Years | 17 (28.8%) | 0 (0.0%) |
| 65 to 74 Years | 57 (45.6%) | 0 (0.0%) |
| 75 Years and over | 0 (0.0%) | 0 (0.0%) |
| Total | 430 (54.2%) | 26 (6.0%) |
Employment Status by Educational Attainment in Indian Lake
According to labor force statistics for Indian Lake, 57.2% of individuals (293) out of the total population between 25 and 64 years of age (512) are in the labor force, with 8.9% or 26 of them being unemployed. The group with the highest labor force participation rate are those with the educational attainment of college / associate degree, with 87.5% or 119 individuals in the labor force. Within the labor force, individuals with less than high school education have the highest percentage of unemployment, with 38.2% or 26 of them being unemployed.
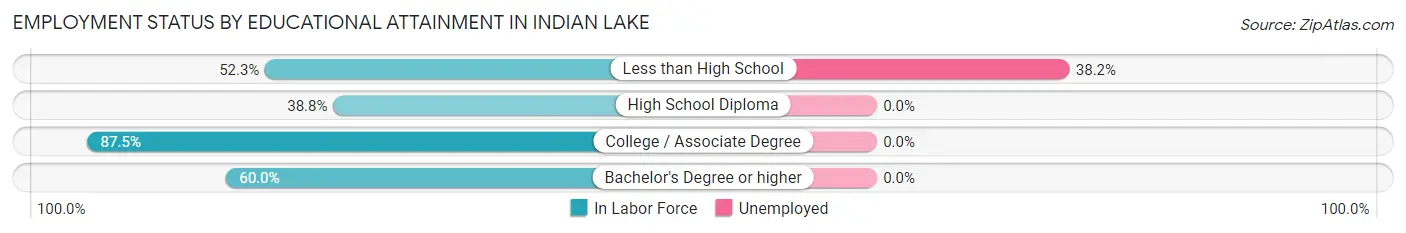
| Educational Attainment | In Labor Force | Unemployed |
| Less than High School | 68 (52.3%) | 50 (38.2%) |
| High School Diploma | 76 (38.8%) | 0 (0.0%) |
| College / Associate Degree | 119 (87.5%) | 0 (0.0%) |
| Bachelor's Degree or higher | 30 (60.0%) | 0 (0.0%) |
| Total | 293 (57.2%) | 46 (8.9%) |
Employment Occupations by Sex in Indian Lake
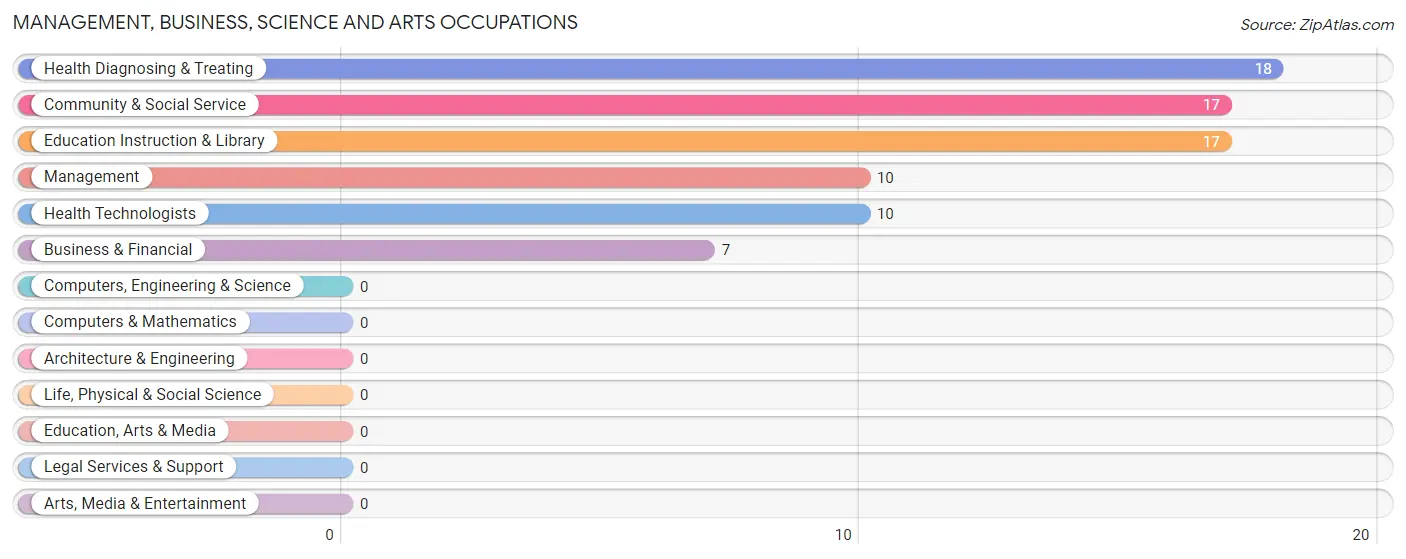
Management, Business, Science and Arts Occupations
The most common Management, Business, Science and Arts occupations in Indian Lake are Health Diagnosing & Treating (18 | 4.5%), Community & Social Service (17 | 4.2%), Education Instruction & Library (17 | 4.2%), Management (10 | 2.5%), and Health Technologists (10 | 2.5%).
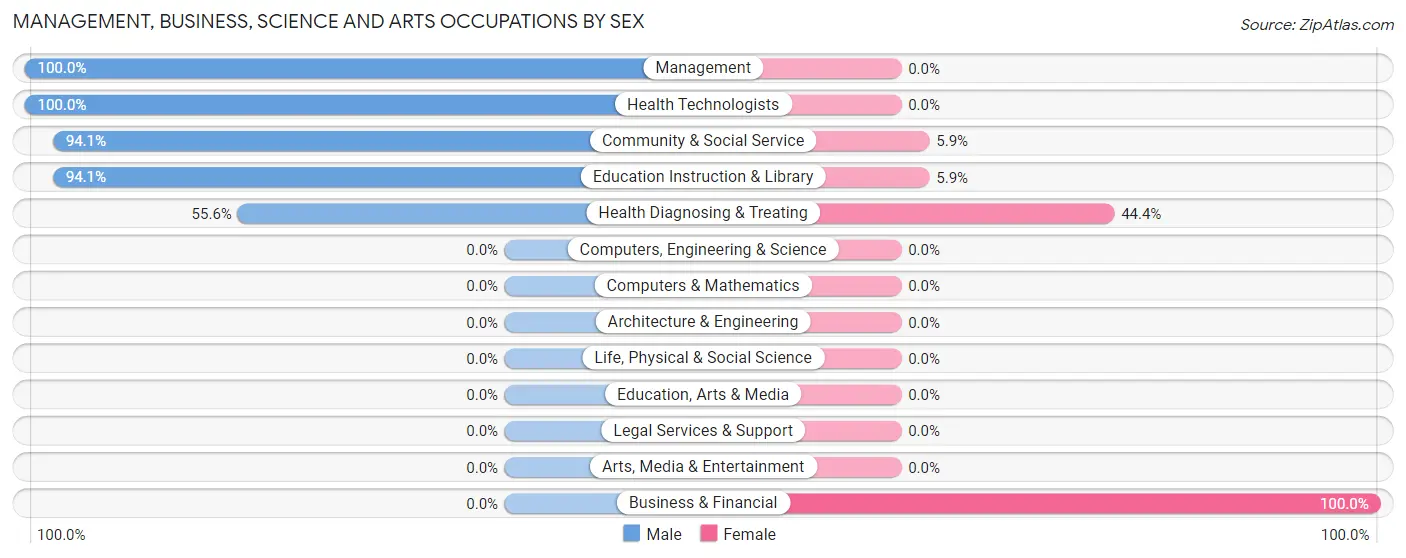
Management, Business, Science and Arts Occupations by Sex
Within the Management, Business, Science and Arts occupations in Indian Lake, the most male-oriented occupations are Management (100.0%), Health Technologists (100.0%), and Community & Social Service (94.1%), while the most female-oriented occupations are Business & Financial (100.0%), Health Diagnosing & Treating (44.4%), and Community & Social Service (5.9%).
| Occupation | Male | Female |
| Management | 10 (100.0%) | 0 (0.0%) |
| Business & Financial | 0 (0.0%) | 7 (100.0%) |
| Computers, Engineering & Science | 0 (0.0%) | 0 (0.0%) |
| Computers & Mathematics | 0 (0.0%) | 0 (0.0%) |
| Architecture & Engineering | 0 (0.0%) | 0 (0.0%) |
| Life, Physical & Social Science | 0 (0.0%) | 0 (0.0%) |
| Community & Social Service | 16 (94.1%) | 1 (5.9%) |
| Education, Arts & Media | 0 (0.0%) | 0 (0.0%) |
| Legal Services & Support | 0 (0.0%) | 0 (0.0%) |
| Education Instruction & Library | 16 (94.1%) | 1 (5.9%) |
| Arts, Media & Entertainment | 0 (0.0%) | 0 (0.0%) |
| Health Diagnosing & Treating | 10 (55.6%) | 8 (44.4%) |
| Health Technologists | 10 (100.0%) | 0 (0.0%) |
| Total (Category) | 36 (69.2%) | 16 (30.8%) |
| Total (Overall) | 263 (65.1%) | 141 (34.9%) |
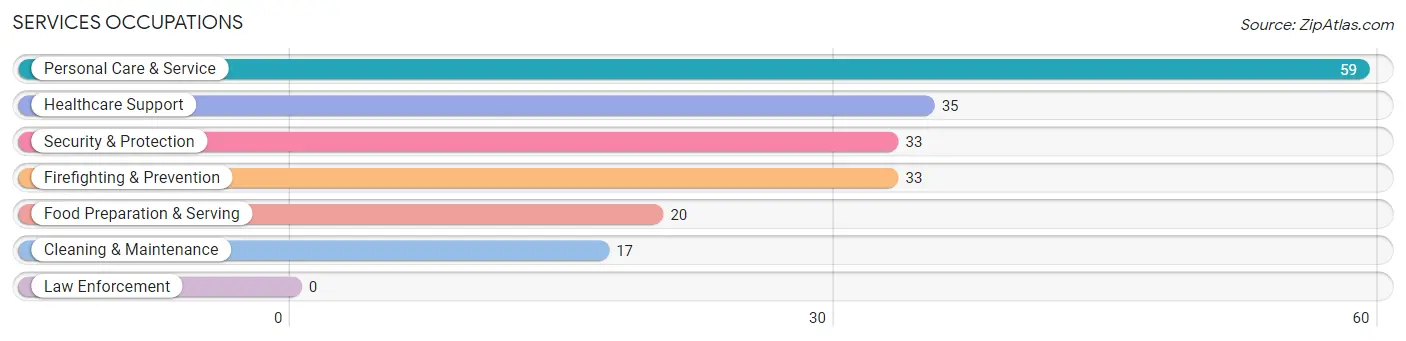
Services Occupations
The most common Services occupations in Indian Lake are Personal Care & Service (59 | 14.6%), Healthcare Support (35 | 8.7%), Security & Protection (33 | 8.2%), Firefighting & Prevention (33 | 8.2%), and Food Preparation & Serving (20 | 5.0%).
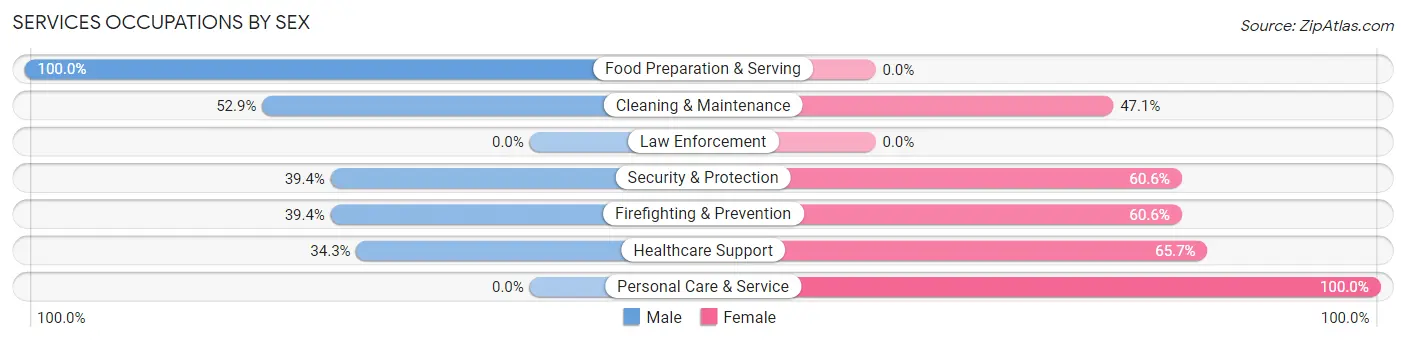
Services Occupations by Sex
Within the Services occupations in Indian Lake, the most male-oriented occupations are Food Preparation & Serving (100.0%), Cleaning & Maintenance (52.9%), and Security & Protection (39.4%), while the most female-oriented occupations are Personal Care & Service (100.0%), Healthcare Support (65.7%), and Security & Protection (60.6%).
| Occupation | Male | Female |
| Healthcare Support | 12 (34.3%) | 23 (65.7%) |
| Security & Protection | 13 (39.4%) | 20 (60.6%) |
| Firefighting & Prevention | 13 (39.4%) | 20 (60.6%) |
| Law Enforcement | 0 (0.0%) | 0 (0.0%) |
| Food Preparation & Serving | 20 (100.0%) | 0 (0.0%) |
| Cleaning & Maintenance | 9 (52.9%) | 8 (47.1%) |
| Personal Care & Service | 0 (0.0%) | 59 (100.0%) |
| Total (Category) | 54 (32.9%) | 110 (67.1%) |
| Total (Overall) | 263 (65.1%) | 141 (34.9%) |
Sales and Office Occupations
The most common Sales and Office occupations in Indian Lake are Sales & Related (28 | 6.9%), and Office & Administration (14 | 3.5%).
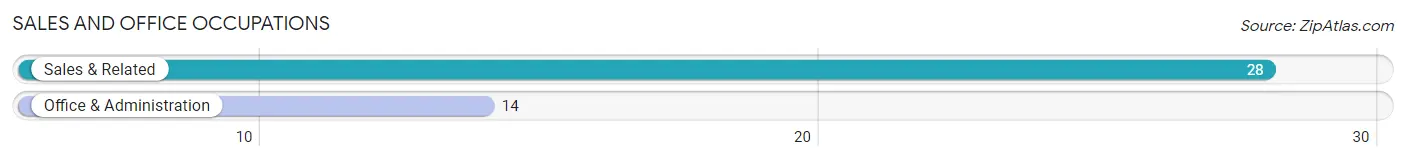
Sales and Office Occupations by Sex
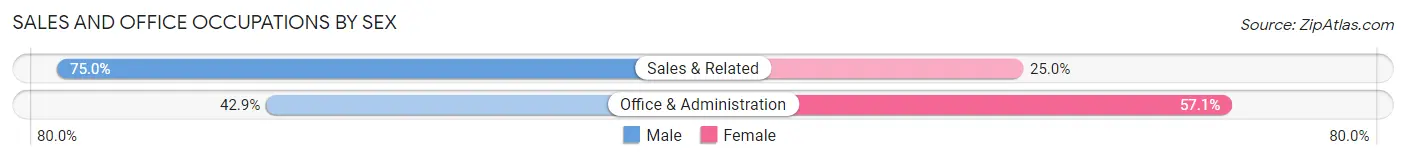
| Occupation | Male | Female |
| Sales & Related | 21 (75.0%) | 7 (25.0%) |
| Office & Administration | 6 (42.9%) | 8 (57.1%) |
| Total (Category) | 27 (64.3%) | 15 (35.7%) |
| Total (Overall) | 263 (65.1%) | 141 (34.9%) |
Natural Resources, Construction and Maintenance Occupations
The most common Natural Resources, Construction and Maintenance occupations in Indian Lake are Farming, Fishing & Forestry (30 | 7.4%), Construction & Extraction (23 | 5.7%), and Installation, Maintenance & Repair (15 | 3.7%).
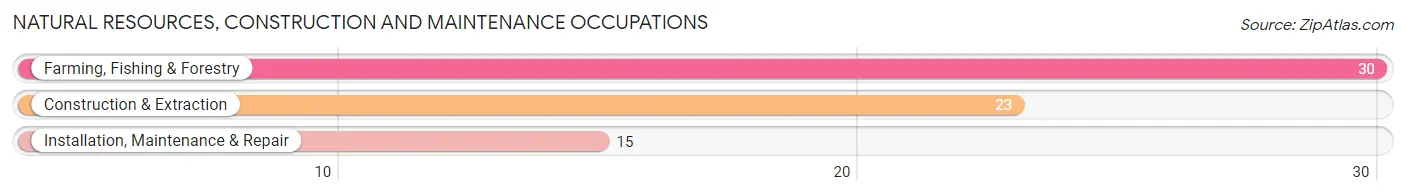
Natural Resources, Construction and Maintenance Occupations by Sex
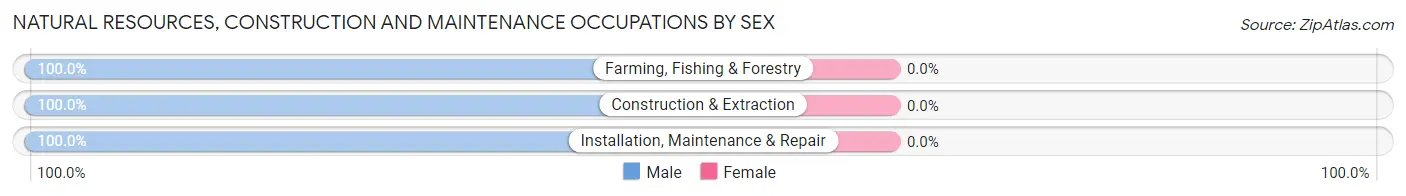
| Occupation | Male | Female |
| Farming, Fishing & Forestry | 30 (100.0%) | 0 (0.0%) |
| Construction & Extraction | 23 (100.0%) | 0 (0.0%) |
| Installation, Maintenance & Repair | 15 (100.0%) | 0 (0.0%) |
| Total (Category) | 68 (100.0%) | 0 (0.0%) |
| Total (Overall) | 263 (65.1%) | 141 (34.9%) |
Production, Transportation and Moving Occupations
The most common Production, Transportation and Moving occupations in Indian Lake are Transportation (75 | 18.6%), and Production (3 | 0.7%).
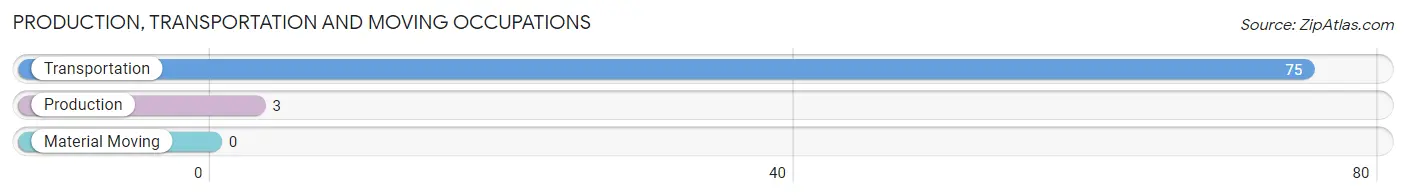
Production, Transportation and Moving Occupations by Sex

| Occupation | Male | Female |
| Production | 3 (100.0%) | 0 (0.0%) |
| Transportation | 75 (100.0%) | 0 (0.0%) |
| Material Moving | 0 (0.0%) | 0 (0.0%) |
| Total (Category) | 78 (100.0%) | 0 (0.0%) |
| Total (Overall) | 263 (65.1%) | 141 (34.9%) |
Employment Industries by Sex in Indian Lake
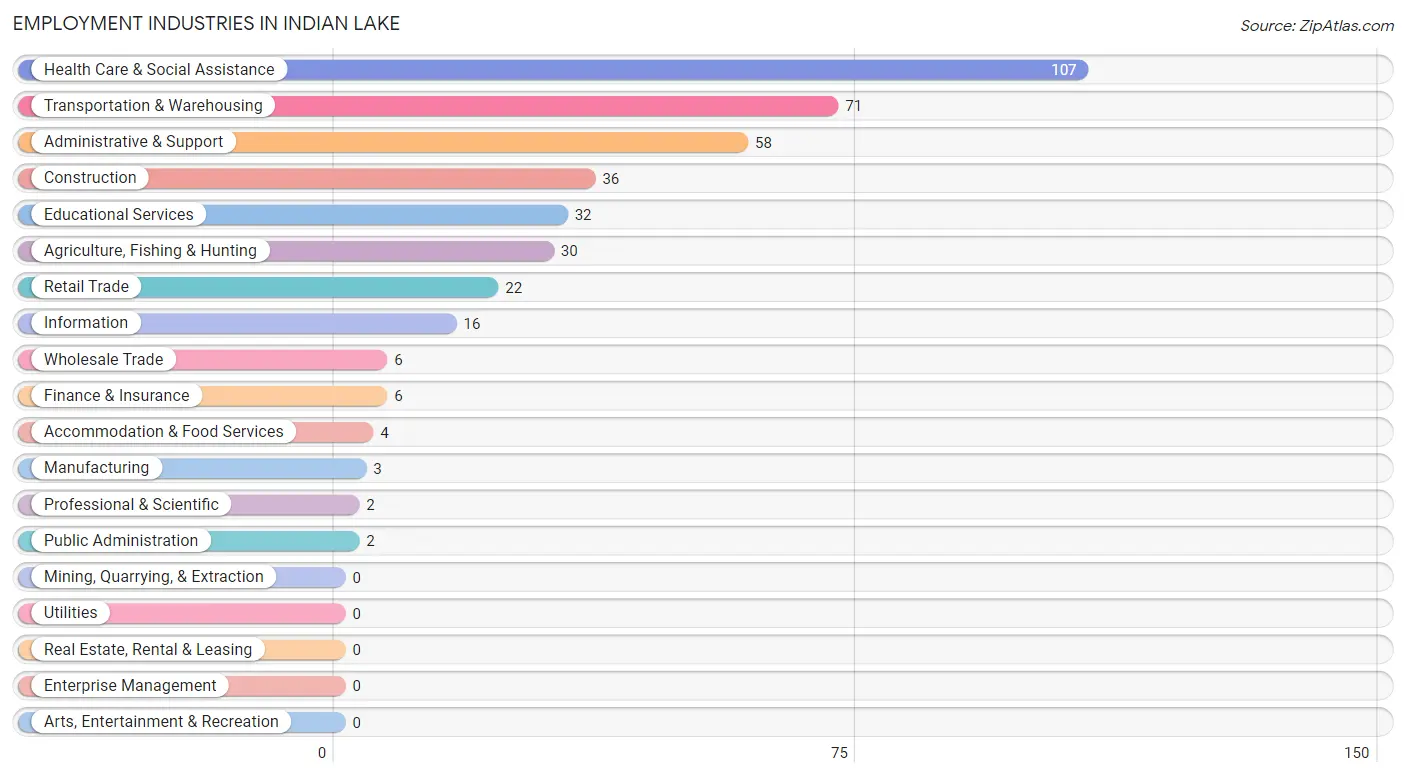
Employment Industries in Indian Lake
The major employment industries in Indian Lake include Health Care & Social Assistance (107 | 26.5%), Transportation & Warehousing (71 | 17.6%), Administrative & Support (58 | 14.4%), Construction (36 | 8.9%), and Educational Services (32 | 7.9%).
Employment Industries by Sex in Indian Lake
The Indian Lake industries that see more men than women are Agriculture, Fishing & Hunting (100.0%), Construction (100.0%), and Manufacturing (100.0%), whereas the industries that tend to have a higher number of women are Finance & Insurance (100.0%), Public Administration (100.0%), and Health Care & Social Assistance (87.8%).
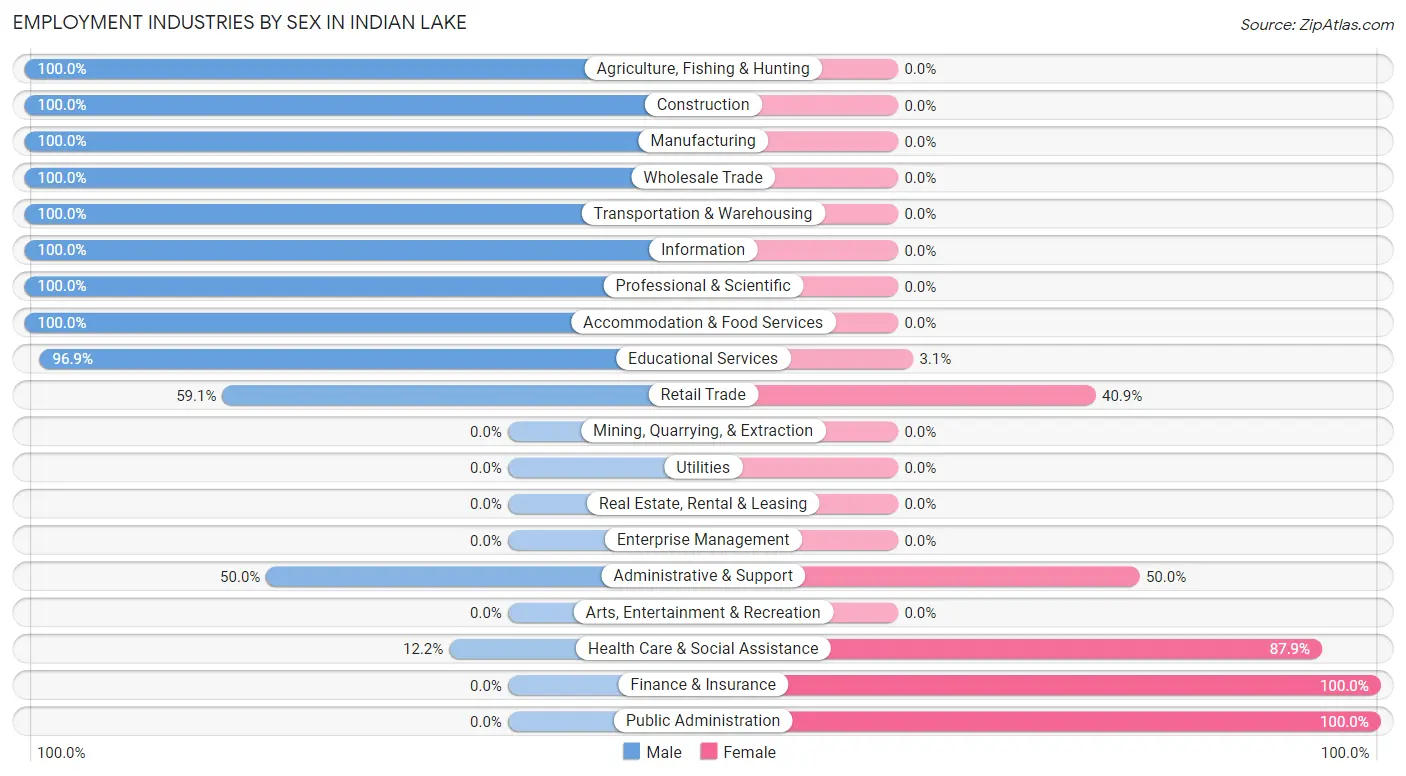
| Industry | Male | Female |
| Agriculture, Fishing & Hunting | 30 (100.0%) | 0 (0.0%) |
| Mining, Quarrying, & Extraction | 0 (0.0%) | 0 (0.0%) |
| Construction | 36 (100.0%) | 0 (0.0%) |
| Manufacturing | 3 (100.0%) | 0 (0.0%) |
| Wholesale Trade | 6 (100.0%) | 0 (0.0%) |
| Retail Trade | 13 (59.1%) | 9 (40.9%) |
| Transportation & Warehousing | 71 (100.0%) | 0 (0.0%) |
| Utilities | 0 (0.0%) | 0 (0.0%) |
| Information | 16 (100.0%) | 0 (0.0%) |
| Finance & Insurance | 0 (0.0%) | 6 (100.0%) |
| Real Estate, Rental & Leasing | 0 (0.0%) | 0 (0.0%) |
| Professional & Scientific | 2 (100.0%) | 0 (0.0%) |
| Enterprise Management | 0 (0.0%) | 0 (0.0%) |
| Administrative & Support | 29 (50.0%) | 29 (50.0%) |
| Educational Services | 31 (96.9%) | 1 (3.1%) |
| Health Care & Social Assistance | 13 (12.1%) | 94 (87.8%) |
| Arts, Entertainment & Recreation | 0 (0.0%) | 0 (0.0%) |
| Accommodation & Food Services | 4 (100.0%) | 0 (0.0%) |
| Public Administration | 0 (0.0%) | 2 (100.0%) |
| Total | 263 (65.1%) | 141 (34.9%) |
Education in Indian Lake
School Enrollment in Indian Lake
The most common levels of schooling among the 406 students in Indian Lake are middle school (152 | 37.4%), high school (77 | 19.0%), and kindergarten (64 | 15.8%).
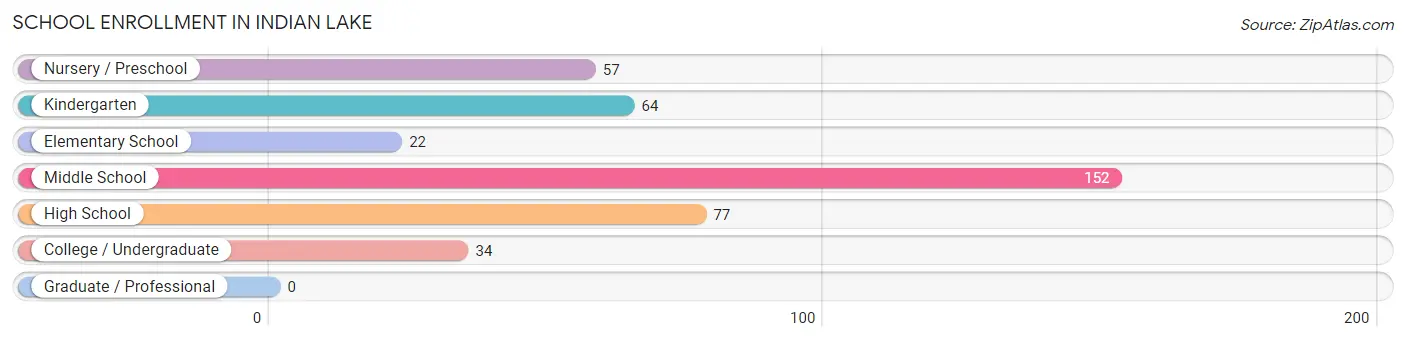
| School Level | # Students | % Students |
| Nursery / Preschool | 57 | 14.0% |
| Kindergarten | 64 | 15.8% |
| Elementary School | 22 | 5.4% |
| Middle School | 152 | 37.4% |
| High School | 77 | 19.0% |
| College / Undergraduate | 34 | 8.4% |
| Graduate / Professional | 0 | 0.0% |
| Total | 406 | 100.0% |
School Enrollment by Age by Funding Source in Indian Lake
Out of a total of 406 students who are enrolled in schools in Indian Lake, 42 (10.3%) attend a private institution, while the remaining 364 (89.7%) are enrolled in public schools. The age group of 35 years and over has the highest likelihood of being enrolled in private schools, with 11 (100.0% in the age bracket) enrolled. Conversely, the age group of 3 to 4 year olds has the lowest likelihood of being enrolled in a private school, with 56 (100.0% in the age bracket) attending a public institution.
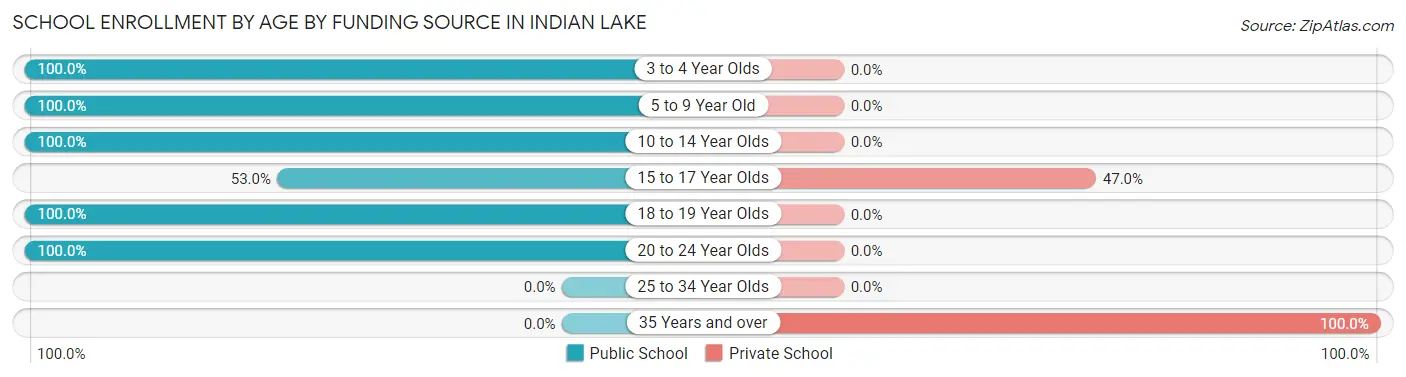
| Age Bracket | Public School | Private School |
| 3 to 4 Year Olds | 56 (100.0%) | 0 (0.0%) |
| 5 to 9 Year Old | 84 (100.0%) | 0 (0.0%) |
| 10 to 14 Year Olds | 160 (100.0%) | 0 (0.0%) |
| 15 to 17 Year Olds | 35 (53.0%) | 31 (47.0%) |
| 18 to 19 Year Olds | 20 (100.0%) | 0 (0.0%) |
| 20 to 24 Year Olds | 9 (100.0%) | 0 (0.0%) |
| 25 to 34 Year Olds | 0 (0.0%) | 0 (0.0%) |
| 35 Years and over | 0 (0.0%) | 11 (100.0%) |
| Total | 364 (89.7%) | 42 (10.3%) |
Educational Attainment by Field of Study in Indian Lake
Education (30 | 51.7%), science & technology (13 | 22.4%), psychology (7 | 12.1%), physical & health sciences (3 | 5.2%), and social sciences (3 | 5.2%) are the most common fields of study among 58 individuals in Indian Lake who have obtained a bachelor's degree or higher.
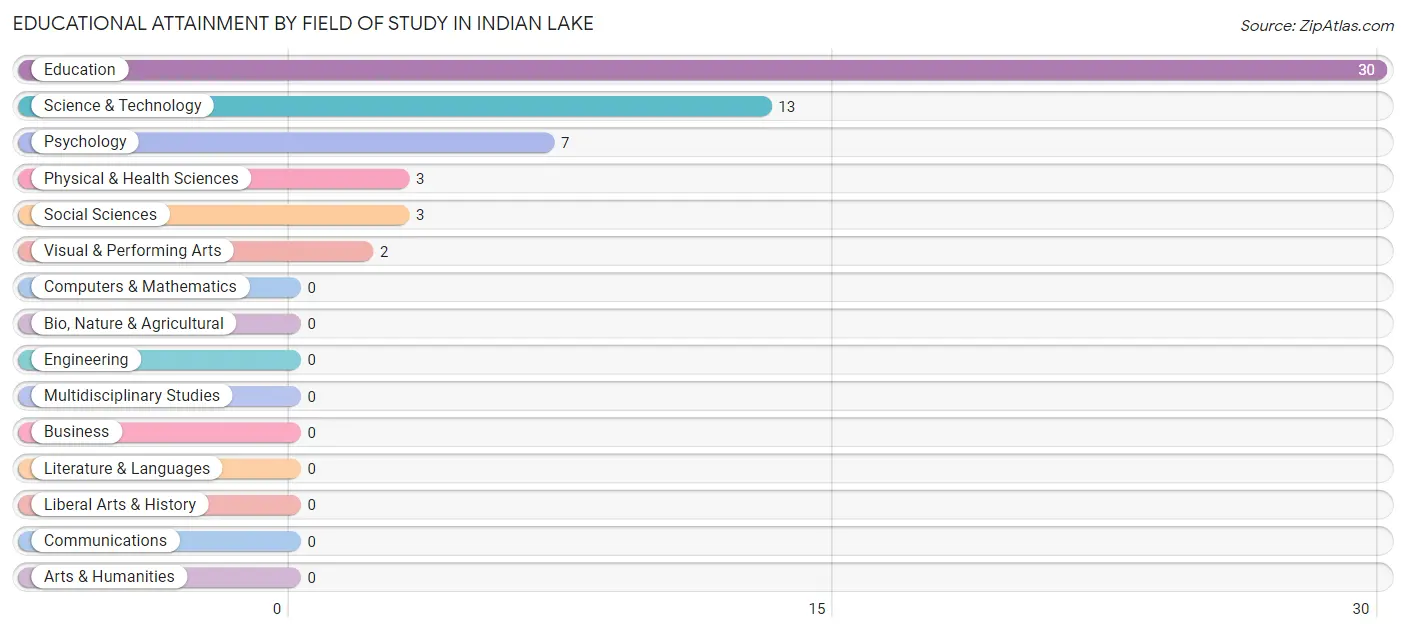
| Field of Study | # Graduates | % Graduates |
| Computers & Mathematics | 0 | 0.0% |
| Bio, Nature & Agricultural | 0 | 0.0% |
| Physical & Health Sciences | 3 | 5.2% |
| Psychology | 7 | 12.1% |
| Social Sciences | 3 | 5.2% |
| Engineering | 0 | 0.0% |
| Multidisciplinary Studies | 0 | 0.0% |
| Science & Technology | 13 | 22.4% |
| Business | 0 | 0.0% |
| Education | 30 | 51.7% |
| Literature & Languages | 0 | 0.0% |
| Liberal Arts & History | 0 | 0.0% |
| Visual & Performing Arts | 2 | 3.5% |
| Communications | 0 | 0.0% |
| Arts & Humanities | 0 | 0.0% |
| Total | 58 | 100.0% |
Transportation & Commute in Indian Lake
Vehicle Availability by Sex in Indian Lake
The most prevalent vehicle ownership categories in Indian Lake are males with 1 vehicle (78, accounting for 29.7%) and females with 1 vehicle (91, making up 57.4%).
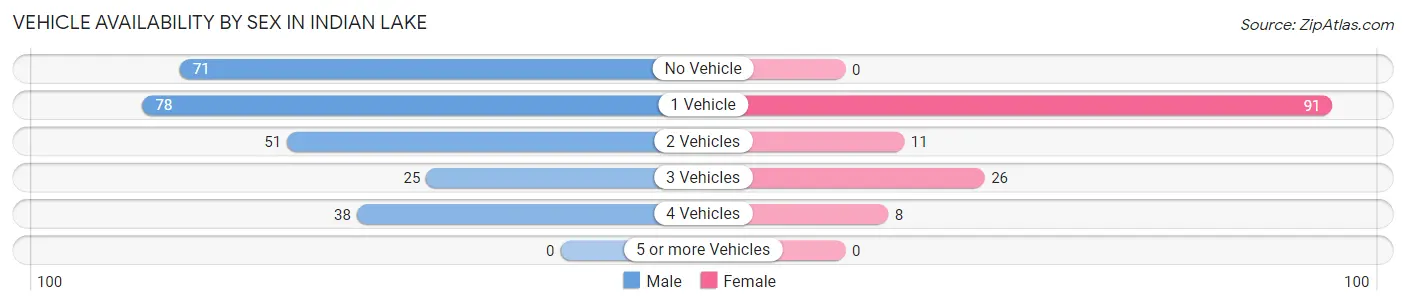
| Vehicles Available | Male | Female |
| No Vehicle | 71 (27.0%) | 0 (0.0%) |
| 1 Vehicle | 78 (29.7%) | 91 (66.9%) |
| 2 Vehicles | 51 (19.4%) | 11 (8.1%) |
| 3 Vehicles | 25 (9.5%) | 26 (19.1%) |
| 4 Vehicles | 38 (14.4%) | 8 (5.9%) |
| 5 or more Vehicles | 0 (0.0%) | 0 (0.0%) |
| Total | 263 (100.0%) | 136 (100.0%) |
Commute Time in Indian Lake
The most frequently occuring commute durations in Indian Lake are 30 to 34 minutes (124 commuters, 31.6%), 20 to 24 minutes (71 commuters, 18.1%), and 15 to 19 minutes (49 commuters, 12.5%).
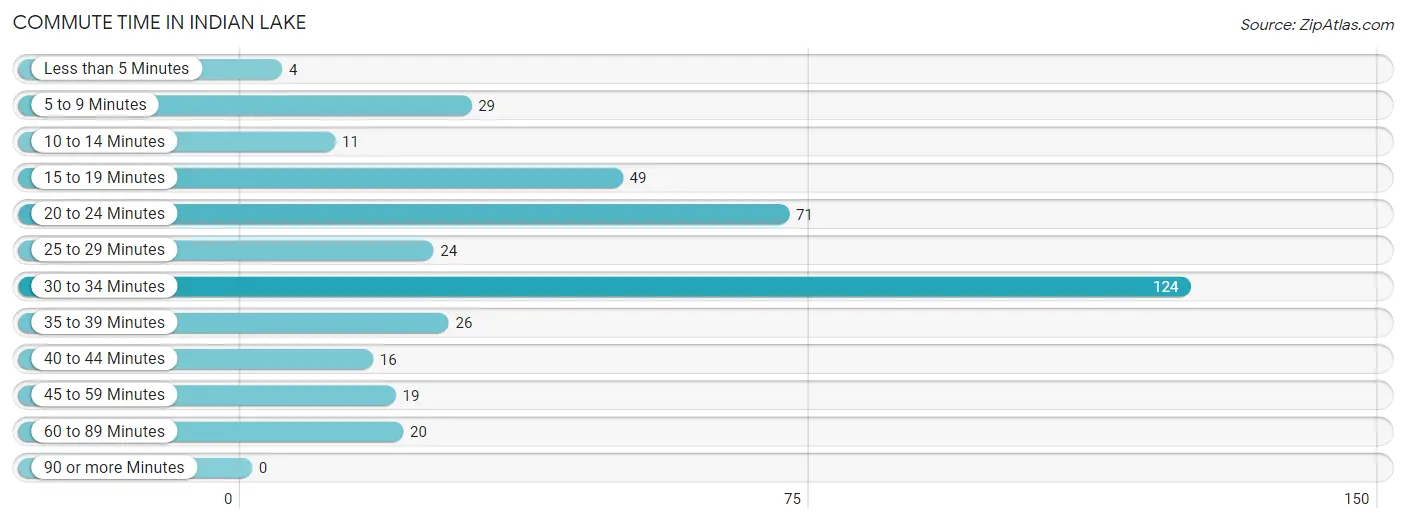
| Commute Time | # Commuters | % Commuters |
| Less than 5 Minutes | 4 | 1.0% |
| 5 to 9 Minutes | 29 | 7.4% |
| 10 to 14 Minutes | 11 | 2.8% |
| 15 to 19 Minutes | 49 | 12.5% |
| 20 to 24 Minutes | 71 | 18.1% |
| 25 to 29 Minutes | 24 | 6.1% |
| 30 to 34 Minutes | 124 | 31.6% |
| 35 to 39 Minutes | 26 | 6.6% |
| 40 to 44 Minutes | 16 | 4.1% |
| 45 to 59 Minutes | 19 | 4.8% |
| 60 to 89 Minutes | 20 | 5.1% |
| 90 or more Minutes | 0 | 0.0% |
Commute Time by Sex in Indian Lake
The most common commute times in Indian Lake are 20 to 24 minutes (71 commuters, 27.0%) for males and 30 to 34 minutes (83 commuters, 63.8%) for females.
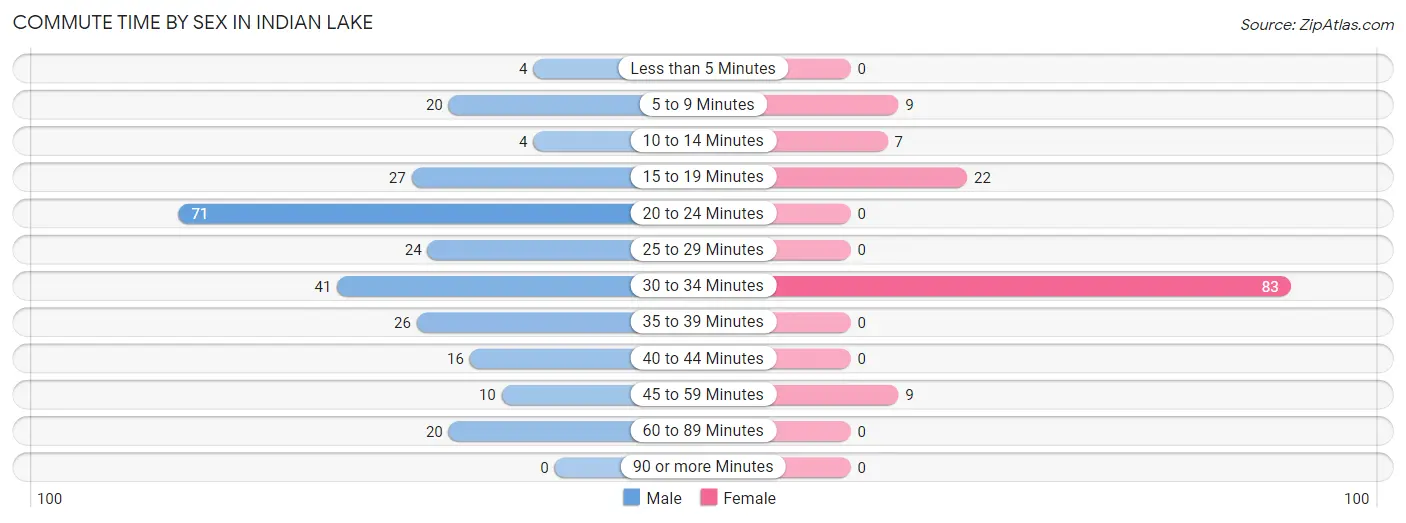
| Commute Time | Male | Female |
| Less than 5 Minutes | 4 (1.5%) | 0 (0.0%) |
| 5 to 9 Minutes | 20 (7.6%) | 9 (6.9%) |
| 10 to 14 Minutes | 4 (1.5%) | 7 (5.4%) |
| 15 to 19 Minutes | 27 (10.3%) | 22 (16.9%) |
| 20 to 24 Minutes | 71 (27.0%) | 0 (0.0%) |
| 25 to 29 Minutes | 24 (9.1%) | 0 (0.0%) |
| 30 to 34 Minutes | 41 (15.6%) | 83 (63.8%) |
| 35 to 39 Minutes | 26 (9.9%) | 0 (0.0%) |
| 40 to 44 Minutes | 16 (6.1%) | 0 (0.0%) |
| 45 to 59 Minutes | 10 (3.8%) | 9 (6.9%) |
| 60 to 89 Minutes | 20 (7.6%) | 0 (0.0%) |
| 90 or more Minutes | 0 (0.0%) | 0 (0.0%) |
Time of Departure to Work by Sex in Indian Lake
The most frequent times of departure to work in Indian Lake are 9:00 AM to 9:59 AM (96, 36.5%) for males and 12:00 PM to 3:59 PM (68, 52.3%) for females.
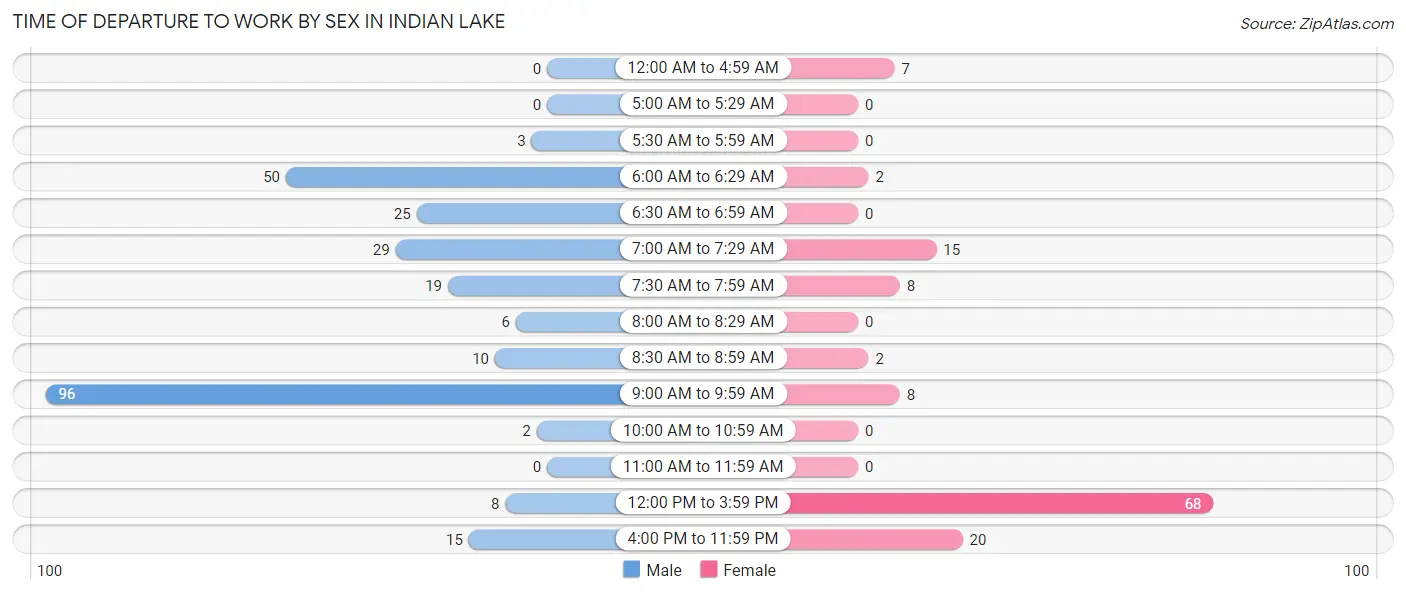
| Time of Departure | Male | Female |
| 12:00 AM to 4:59 AM | 0 (0.0%) | 7 (5.4%) |
| 5:00 AM to 5:29 AM | 0 (0.0%) | 0 (0.0%) |
| 5:30 AM to 5:59 AM | 3 (1.1%) | 0 (0.0%) |
| 6:00 AM to 6:29 AM | 50 (19.0%) | 2 (1.5%) |
| 6:30 AM to 6:59 AM | 25 (9.5%) | 0 (0.0%) |
| 7:00 AM to 7:29 AM | 29 (11.0%) | 15 (11.5%) |
| 7:30 AM to 7:59 AM | 19 (7.2%) | 8 (6.1%) |
| 8:00 AM to 8:29 AM | 6 (2.3%) | 0 (0.0%) |
| 8:30 AM to 8:59 AM | 10 (3.8%) | 2 (1.5%) |
| 9:00 AM to 9:59 AM | 96 (36.5%) | 8 (6.1%) |
| 10:00 AM to 10:59 AM | 2 (0.8%) | 0 (0.0%) |
| 11:00 AM to 11:59 AM | 0 (0.0%) | 0 (0.0%) |
| 12:00 PM to 3:59 PM | 8 (3.0%) | 68 (52.3%) |
| 4:00 PM to 11:59 PM | 15 (5.7%) | 20 (15.4%) |
| Total | 263 (100.0%) | 130 (100.0%) |
Housing Occupancy in Indian Lake
Occupancy by Ownership in Indian Lake
Of the total 396 dwellings in Indian Lake, owner-occupied units account for 232 (58.6%), while renter-occupied units make up 164 (41.4%).
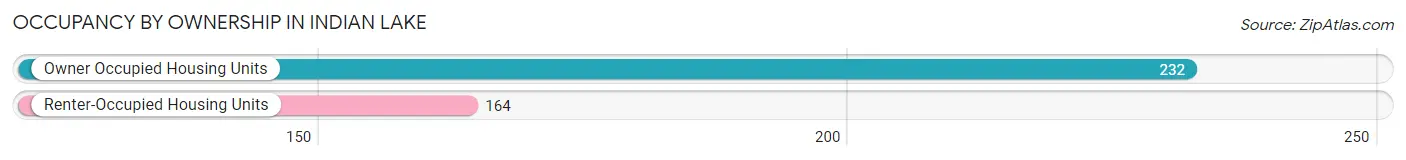
| Occupancy | # Housing Units | % Housing Units |
| Owner Occupied Housing Units | 232 | 58.6% |
| Renter-Occupied Housing Units | 164 | 41.4% |
| Total Occupied Housing Units | 396 | 100.0% |
Occupancy by Household Size in Indian Lake
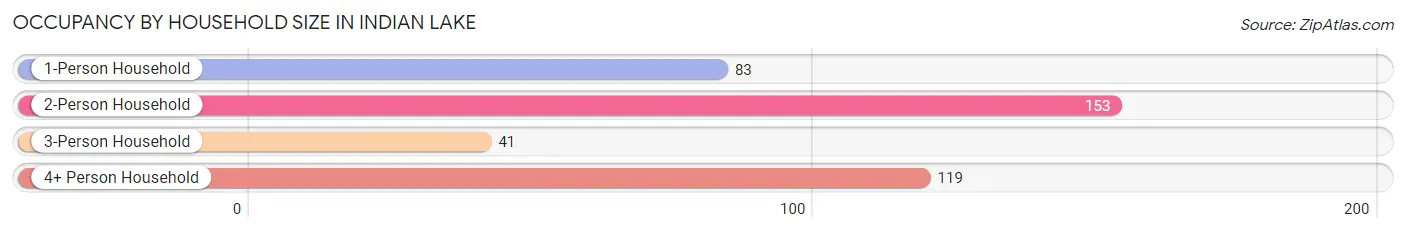
| Household Size | # Housing Units | % Housing Units |
| 1-Person Household | 83 | 21.0% |
| 2-Person Household | 153 | 38.6% |
| 3-Person Household | 41 | 10.3% |
| 4+ Person Household | 119 | 30.0% |
| Total Housing Units | 396 | 100.0% |
Occupancy by Ownership by Household Size in Indian Lake
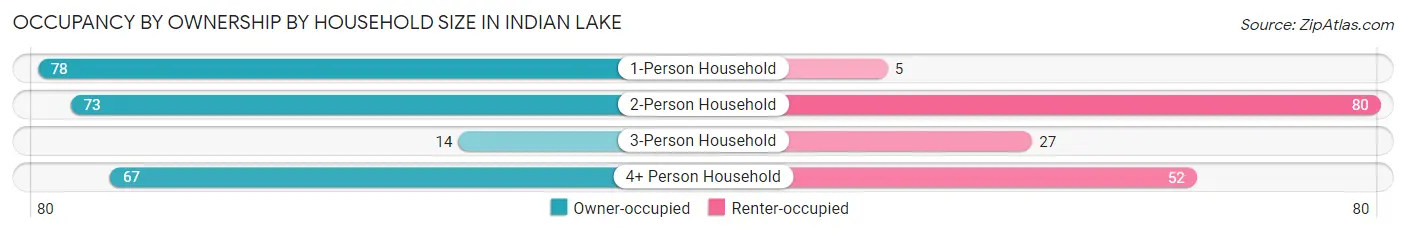
| Household Size | Owner-occupied | Renter-occupied |
| 1-Person Household | 78 (94.0%) | 5 (6.0%) |
| 2-Person Household | 73 (47.7%) | 80 (52.3%) |
| 3-Person Household | 14 (34.2%) | 27 (65.8%) |
| 4+ Person Household | 67 (56.3%) | 52 (43.7%) |
| Total Housing Units | 232 (58.6%) | 164 (41.4%) |
Occupancy by Educational Attainment in Indian Lake
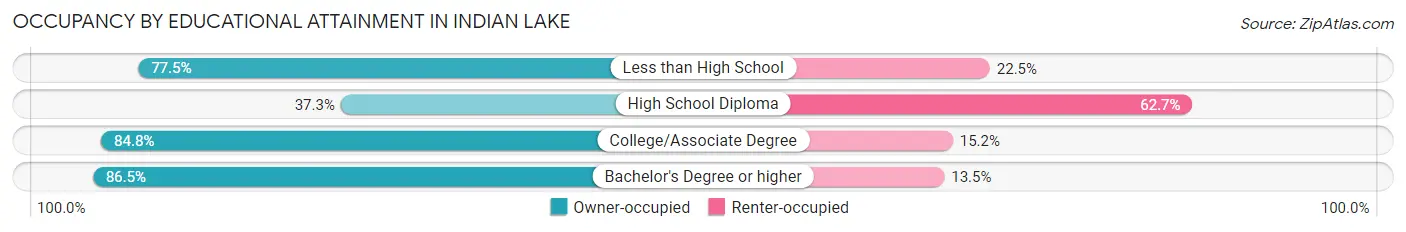
| Household Size | Owner-occupied | Renter-occupied |
| Less than High School | 55 (77.5%) | 16 (22.5%) |
| High School Diploma | 78 (37.3%) | 131 (62.7%) |
| College/Associate Degree | 67 (84.8%) | 12 (15.2%) |
| Bachelor's Degree or higher | 32 (86.5%) | 5 (13.5%) |
Occupancy by Age of Householder in Indian Lake
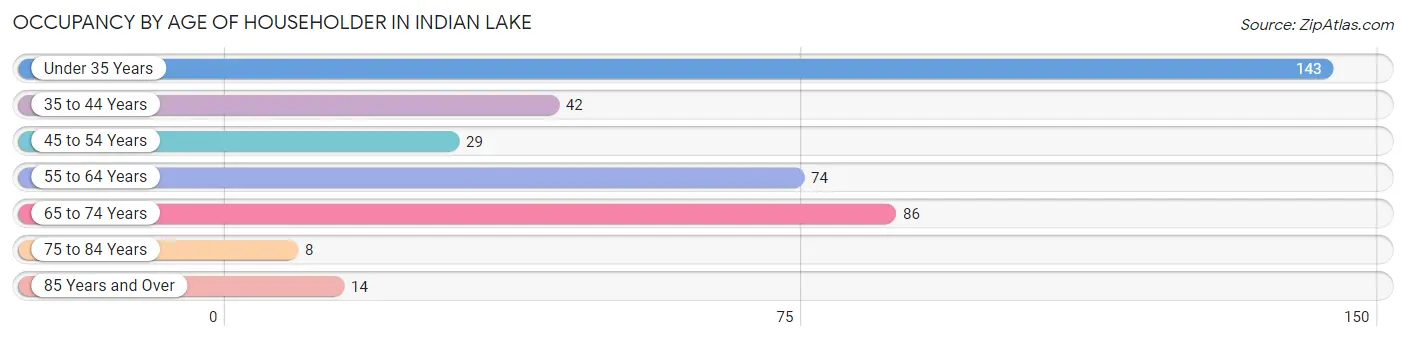
| Age Bracket | # Households | % Households |
| Under 35 Years | 143 | 36.1% |
| 35 to 44 Years | 42 | 10.6% |
| 45 to 54 Years | 29 | 7.3% |
| 55 to 64 Years | 74 | 18.7% |
| 65 to 74 Years | 86 | 21.7% |
| 75 to 84 Years | 8 | 2.0% |
| 85 Years and Over | 14 | 3.5% |
| Total | 396 | 100.0% |
Housing Finances in Indian Lake
Median Income by Occupancy in Indian Lake
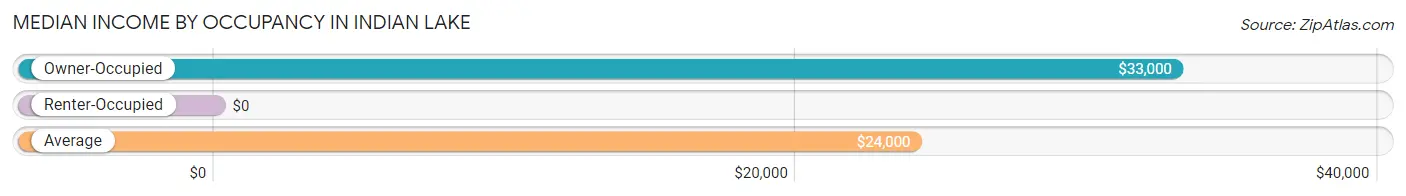
| Occupancy Type | # Households | Median Income |
| Owner-Occupied | 232 (58.6%) | $33,000 |
| Renter-Occupied | 164 (41.4%) | $0 |
| Average | 396 (100.0%) | $24,000 |
Occupancy by Householder Income Bracket in Indian Lake
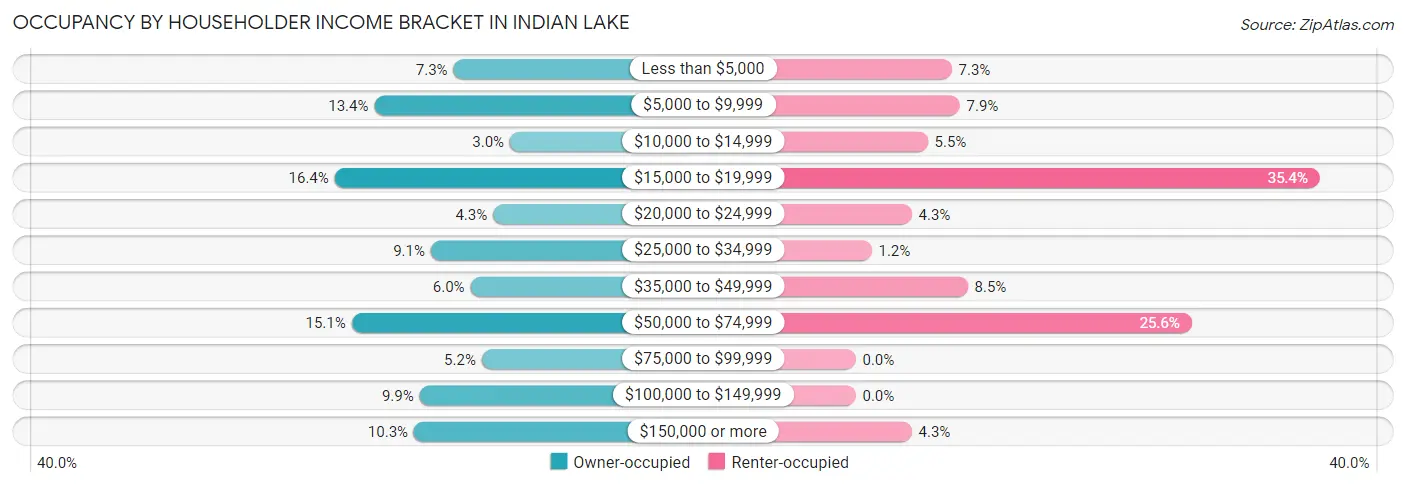
| Income Bracket | Owner-occupied | Renter-occupied |
| Less than $5,000 | 17 (7.3%) | 12 (7.3%) |
| $5,000 to $9,999 | 31 (13.4%) | 13 (7.9%) |
| $10,000 to $14,999 | 7 (3.0%) | 9 (5.5%) |
| $15,000 to $19,999 | 38 (16.4%) | 58 (35.4%) |
| $20,000 to $24,999 | 10 (4.3%) | 7 (4.3%) |
| $25,000 to $34,999 | 21 (9.0%) | 2 (1.2%) |
| $35,000 to $49,999 | 14 (6.0%) | 14 (8.5%) |
| $50,000 to $74,999 | 35 (15.1%) | 42 (25.6%) |
| $75,000 to $99,999 | 12 (5.2%) | 0 (0.0%) |
| $100,000 to $149,999 | 23 (9.9%) | 0 (0.0%) |
| $150,000 or more | 24 (10.3%) | 7 (4.3%) |
| Total | 232 (100.0%) | 164 (100.0%) |
Monthly Housing Cost Tiers in Indian Lake
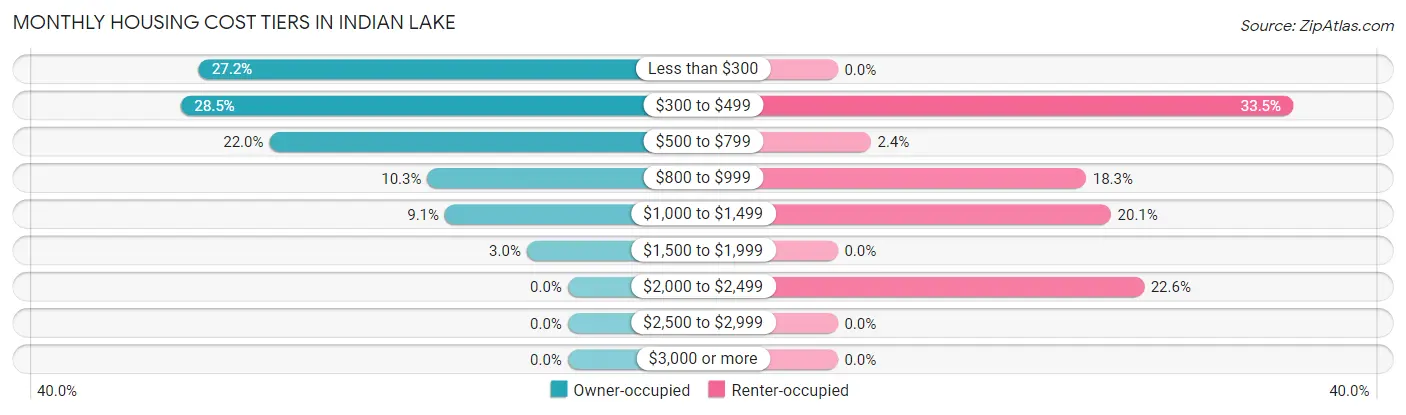
| Monthly Cost | Owner-occupied | Renter-occupied |
| Less than $300 | 63 (27.2%) | 0 (0.0%) |
| $300 to $499 | 66 (28.4%) | 55 (33.5%) |
| $500 to $799 | 51 (22.0%) | 4 (2.4%) |
| $800 to $999 | 24 (10.3%) | 30 (18.3%) |
| $1,000 to $1,499 | 21 (9.0%) | 33 (20.1%) |
| $1,500 to $1,999 | 7 (3.0%) | 0 (0.0%) |
| $2,000 to $2,499 | 0 (0.0%) | 37 (22.6%) |
| $2,500 to $2,999 | 0 (0.0%) | 0 (0.0%) |
| $3,000 or more | 0 (0.0%) | 0 (0.0%) |
| Total | 232 (100.0%) | 164 (100.0%) |
Physical Housing Characteristics in Indian Lake
Housing Structures in Indian Lake
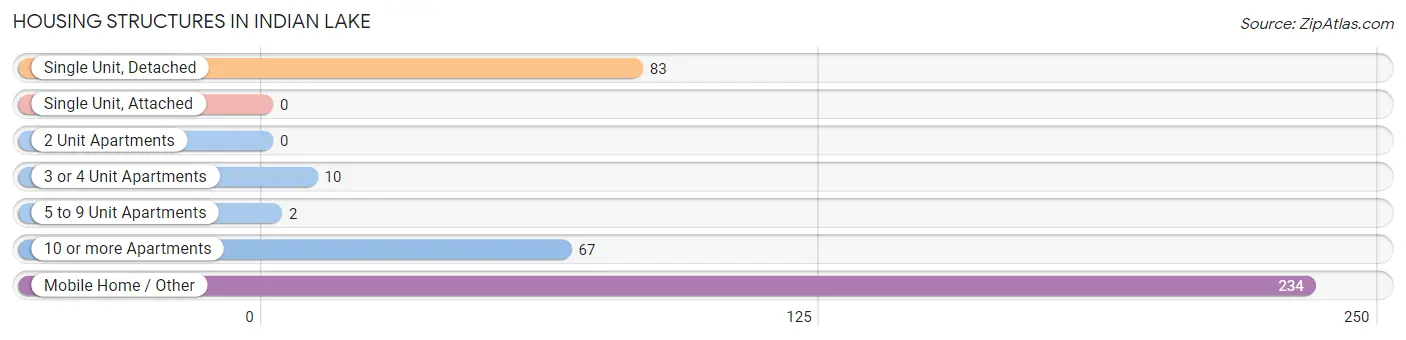
| Structure Type | # Housing Units | % Housing Units |
| Single Unit, Detached | 83 | 21.0% |
| Single Unit, Attached | 0 | 0.0% |
| 2 Unit Apartments | 0 | 0.0% |
| 3 or 4 Unit Apartments | 10 | 2.5% |
| 5 to 9 Unit Apartments | 2 | 0.5% |
| 10 or more Apartments | 67 | 16.9% |
| Mobile Home / Other | 234 | 59.1% |
| Total | 396 | 100.0% |
Housing Structures by Occupancy in Indian Lake
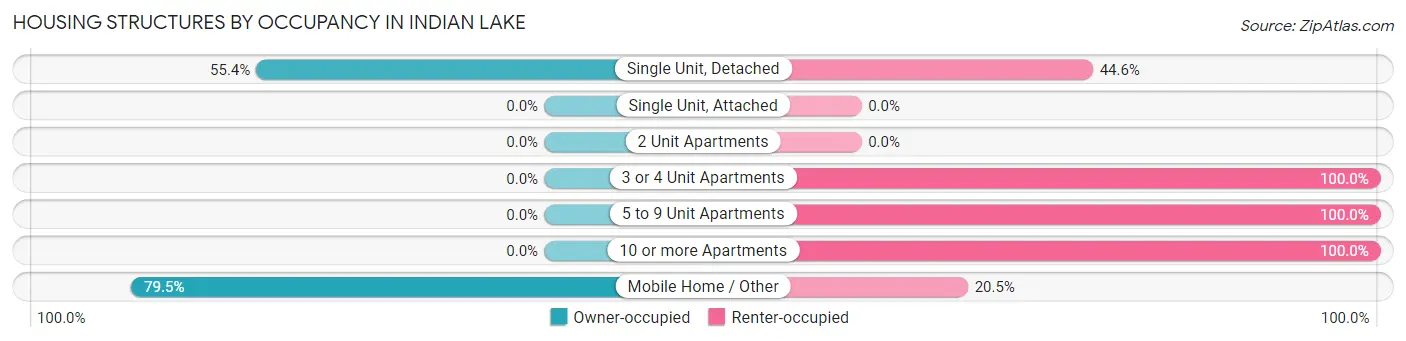
| Structure Type | Owner-occupied | Renter-occupied |
| Single Unit, Detached | 46 (55.4%) | 37 (44.6%) |
| Single Unit, Attached | 0 (0.0%) | 0 (0.0%) |
| 2 Unit Apartments | 0 (0.0%) | 0 (0.0%) |
| 3 or 4 Unit Apartments | 0 (0.0%) | 10 (100.0%) |
| 5 to 9 Unit Apartments | 0 (0.0%) | 2 (100.0%) |
| 10 or more Apartments | 0 (0.0%) | 67 (100.0%) |
| Mobile Home / Other | 186 (79.5%) | 48 (20.5%) |
| Total | 232 (58.6%) | 164 (41.4%) |
Housing Structures by Number of Rooms in Indian Lake
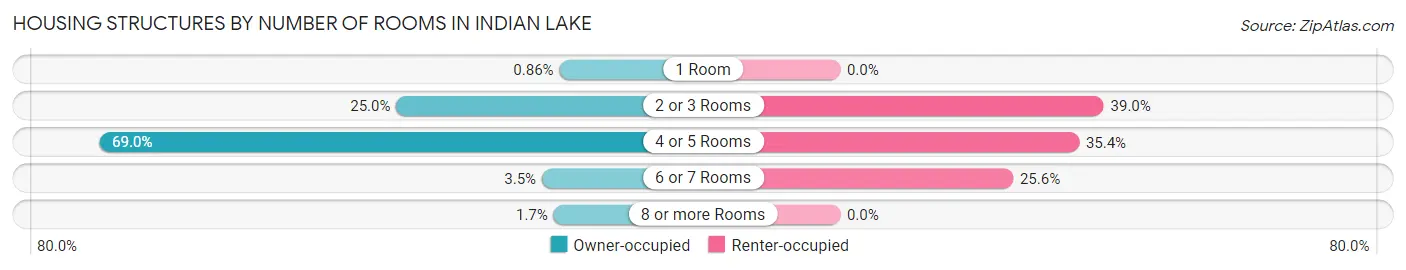
| Number of Rooms | Owner-occupied | Renter-occupied |
| 1 Room | 2 (0.9%) | 0 (0.0%) |
| 2 or 3 Rooms | 58 (25.0%) | 64 (39.0%) |
| 4 or 5 Rooms | 160 (69.0%) | 58 (35.4%) |
| 6 or 7 Rooms | 8 (3.5%) | 42 (25.6%) |
| 8 or more Rooms | 4 (1.7%) | 0 (0.0%) |
| Total | 232 (100.0%) | 164 (100.0%) |
Housing Structure by Heating Type in Indian Lake
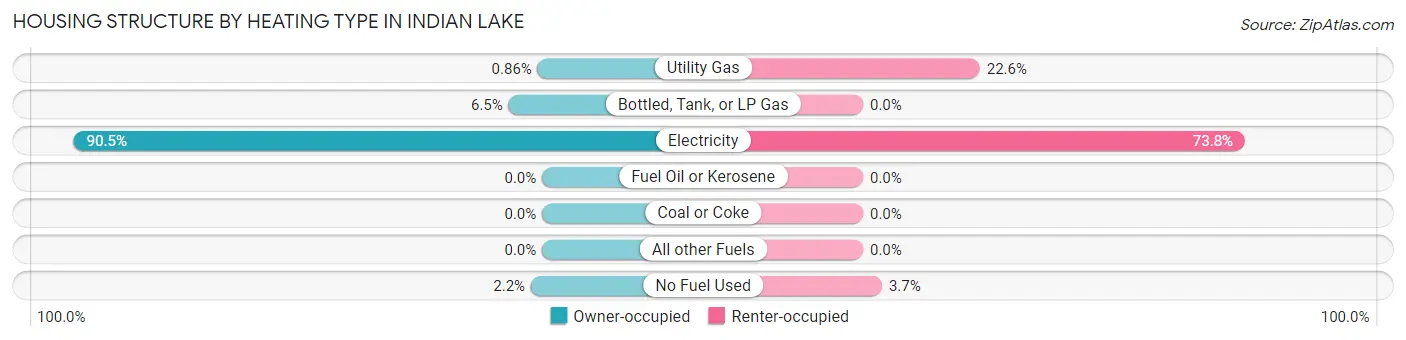
| Heating Type | Owner-occupied | Renter-occupied |
| Utility Gas | 2 (0.9%) | 37 (22.6%) |
| Bottled, Tank, or LP Gas | 15 (6.5%) | 0 (0.0%) |
| Electricity | 210 (90.5%) | 121 (73.8%) |
| Fuel Oil or Kerosene | 0 (0.0%) | 0 (0.0%) |
| Coal or Coke | 0 (0.0%) | 0 (0.0%) |
| All other Fuels | 0 (0.0%) | 0 (0.0%) |
| No Fuel Used | 5 (2.2%) | 6 (3.7%) |
| Total | 232 (100.0%) | 164 (100.0%) |
Household Vehicle Usage in Indian Lake
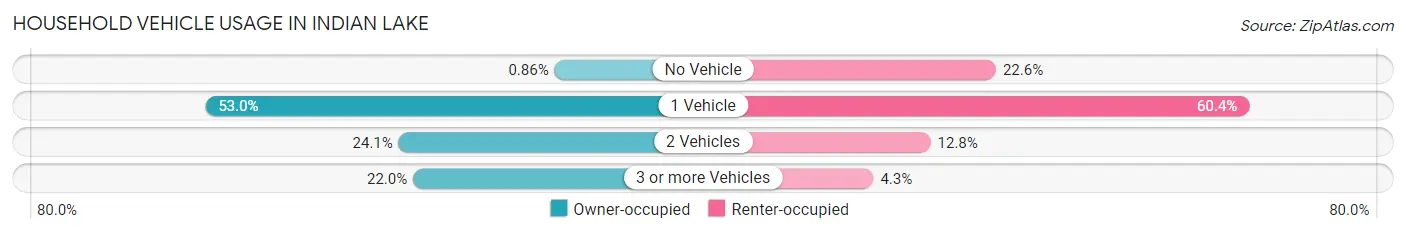
| Vehicles per Household | Owner-occupied | Renter-occupied |
| No Vehicle | 2 (0.9%) | 37 (22.6%) |
| 1 Vehicle | 123 (53.0%) | 99 (60.4%) |
| 2 Vehicles | 56 (24.1%) | 21 (12.8%) |
| 3 or more Vehicles | 51 (22.0%) | 7 (4.3%) |
| Total | 232 (100.0%) | 164 (100.0%) |
Real Estate & Mortgages in Indian Lake
Real Estate and Mortgage Overview in Indian Lake
| Characteristic | Without Mortgage | With Mortgage |
| Housing Units | 206 | 26 |
| Median Property Value | $58,400 | $0 |
| Median Household Income | $26,136 | $8 |
| Monthly Housing Costs | $357 | $0 |
| Real Estate Taxes | $1,206 | $5 |
Property Value by Mortgage Status in Indian Lake
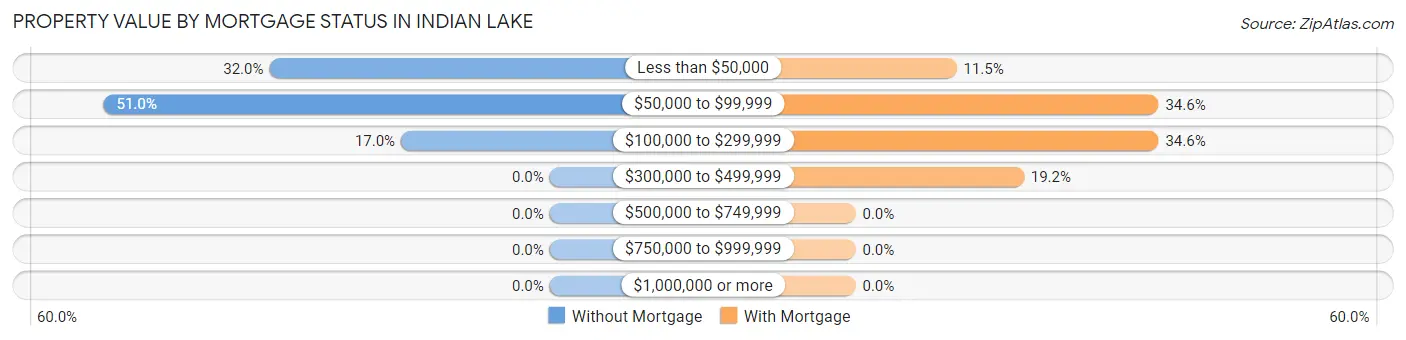
| Property Value | Without Mortgage | With Mortgage |
| Less than $50,000 | 66 (32.0%) | 3 (11.5%) |
| $50,000 to $99,999 | 105 (51.0%) | 9 (34.6%) |
| $100,000 to $299,999 | 35 (17.0%) | 9 (34.6%) |
| $300,000 to $499,999 | 0 (0.0%) | 5 (19.2%) |
| $500,000 to $749,999 | 0 (0.0%) | 0 (0.0%) |
| $750,000 to $999,999 | 0 (0.0%) | 0 (0.0%) |
| $1,000,000 or more | 0 (0.0%) | 0 (0.0%) |
| Total | 206 (100.0%) | 26 (100.0%) |
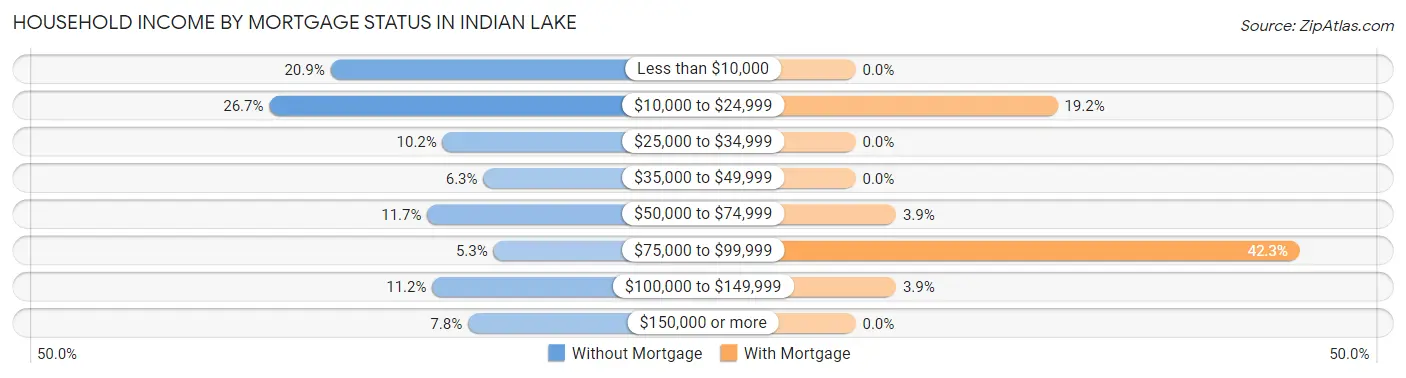
Household Income by Mortgage Status in Indian Lake
| Household Income | Without Mortgage | With Mortgage |
| Less than $10,000 | 43 (20.9%) | 0 (0.0%) |
| $10,000 to $24,999 | 55 (26.7%) | 5 (19.2%) |
| $25,000 to $34,999 | 21 (10.2%) | 0 (0.0%) |
| $35,000 to $49,999 | 13 (6.3%) | 0 (0.0%) |
| $50,000 to $74,999 | 24 (11.7%) | 1 (3.8%) |
| $75,000 to $99,999 | 11 (5.3%) | 11 (42.3%) |
| $100,000 to $149,999 | 23 (11.2%) | 1 (3.8%) |
| $150,000 or more | 16 (7.8%) | 0 (0.0%) |
| Total | 206 (100.0%) | 26 (100.0%) |
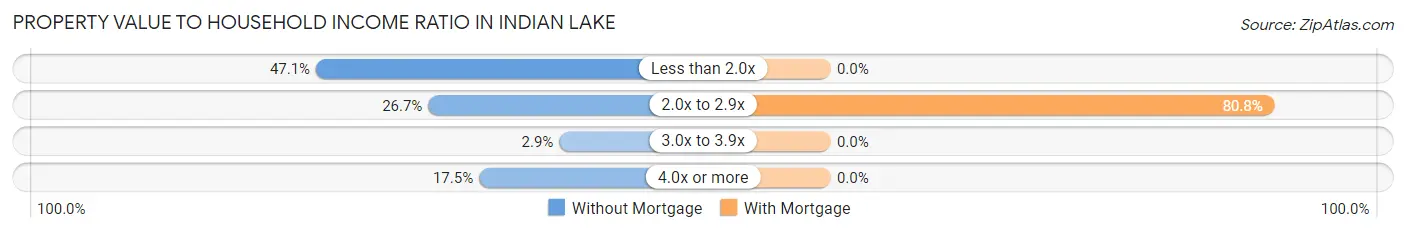
Property Value to Household Income Ratio in Indian Lake
| Value-to-Income Ratio | Without Mortgage | With Mortgage |
| Less than 2.0x | 97 (47.1%) | 0 (0.0%) |
| 2.0x to 2.9x | 55 (26.7%) | 21 (80.8%) |
| 3.0x to 3.9x | 6 (2.9%) | 0 (0.0%) |
| 4.0x or more | 36 (17.5%) | 0 (0.0%) |
| Total | 206 (100.0%) | 26 (100.0%) |
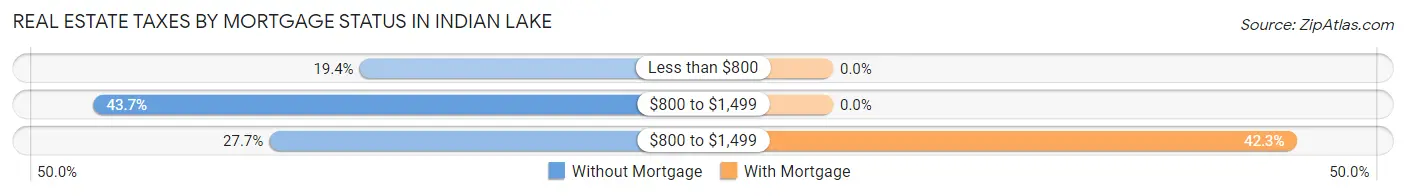
Real Estate Taxes by Mortgage Status in Indian Lake
| Property Taxes | Without Mortgage | With Mortgage |
| Less than $800 | 40 (19.4%) | 0 (0.0%) |
| $800 to $1,499 | 90 (43.7%) | 0 (0.0%) |
| $800 to $1,499 | 57 (27.7%) | 11 (42.3%) |
| Total | 206 (100.0%) | 26 (100.0%) |
Health & Disability in Indian Lake
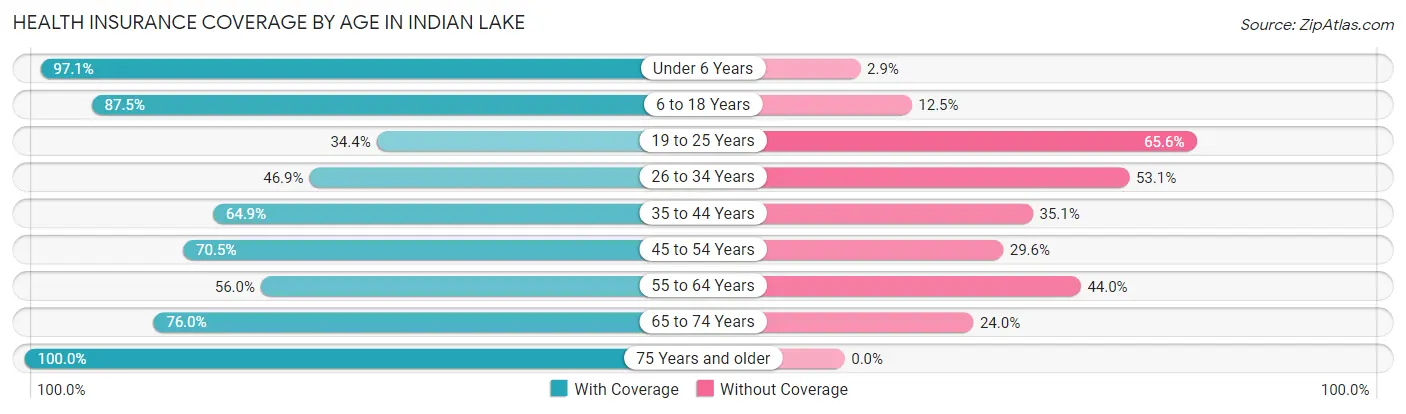
Health Insurance Coverage by Age in Indian Lake
| Age Bracket | With Coverage | Without Coverage |
| Under 6 Years | 165 (97.1%) | 5 (2.9%) |
| 6 to 18 Years | 266 (87.5%) | 38 (12.5%) |
| 19 to 25 Years | 33 (34.4%) | 63 (65.6%) |
| 26 to 34 Years | 76 (46.9%) | 86 (53.1%) |
| 35 to 44 Years | 122 (64.9%) | 66 (35.1%) |
| 45 to 54 Years | 31 (70.5%) | 13 (29.5%) |
| 55 to 64 Years | 61 (56.0%) | 48 (44.0%) |
| 65 to 74 Years | 95 (76.0%) | 30 (24.0%) |
| 75 Years and older | 33 (100.0%) | 0 (0.0%) |
| Total | 882 (71.7%) | 349 (28.3%) |
Health Insurance Coverage by Citizenship Status in Indian Lake
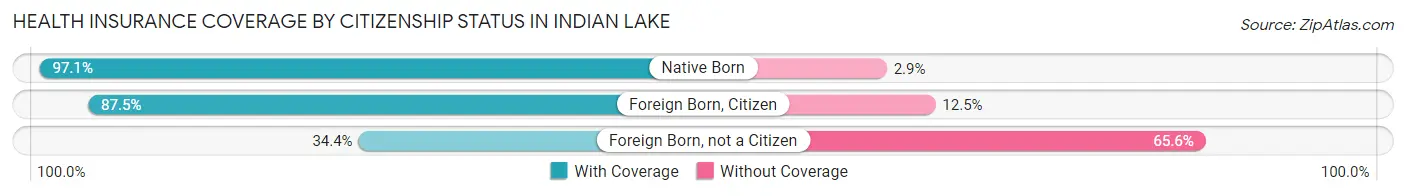
| Citizenship Status | With Coverage | Without Coverage |
| Native Born | 165 (97.1%) | 5 (2.9%) |
| Foreign Born, Citizen | 266 (87.5%) | 38 (12.5%) |
| Foreign Born, not a Citizen | 33 (34.4%) | 63 (65.6%) |
Health Insurance Coverage by Household Income in Indian Lake
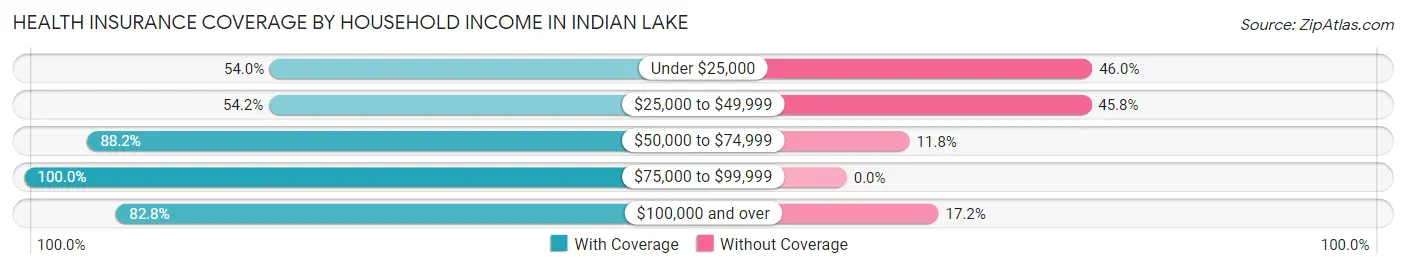
| Household Income | With Coverage | Without Coverage |
| Under $25,000 | 235 (54.0%) | 200 (46.0%) |
| $25,000 to $49,999 | 71 (54.2%) | 60 (45.8%) |
| $50,000 to $74,999 | 337 (88.2%) | 45 (11.8%) |
| $75,000 to $99,999 | 27 (100.0%) | 0 (0.0%) |
| $100,000 and over | 212 (82.8%) | 44 (17.2%) |
Public vs Private Health Insurance Coverage by Age in Indian Lake
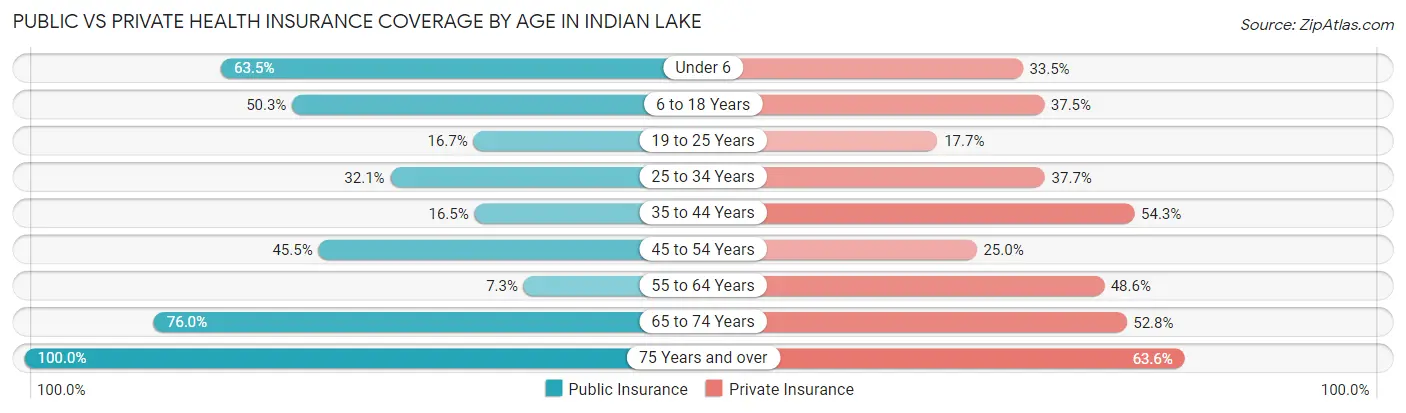
| Age Bracket | Public Insurance | Private Insurance |
| Under 6 | 108 (63.5%) | 57 (33.5%) |
| 6 to 18 Years | 153 (50.3%) | 114 (37.5%) |
| 19 to 25 Years | 16 (16.7%) | 17 (17.7%) |
| 25 to 34 Years | 52 (32.1%) | 61 (37.7%) |
| 35 to 44 Years | 31 (16.5%) | 102 (54.3%) |
| 45 to 54 Years | 20 (45.5%) | 11 (25.0%) |
| 55 to 64 Years | 8 (7.3%) | 53 (48.6%) |
| 65 to 74 Years | 95 (76.0%) | 66 (52.8%) |
| 75 Years and over | 33 (100.0%) | 21 (63.6%) |
| Total | 516 (41.9%) | 502 (40.8%) |
Disability Status by Sex by Age in Indian Lake
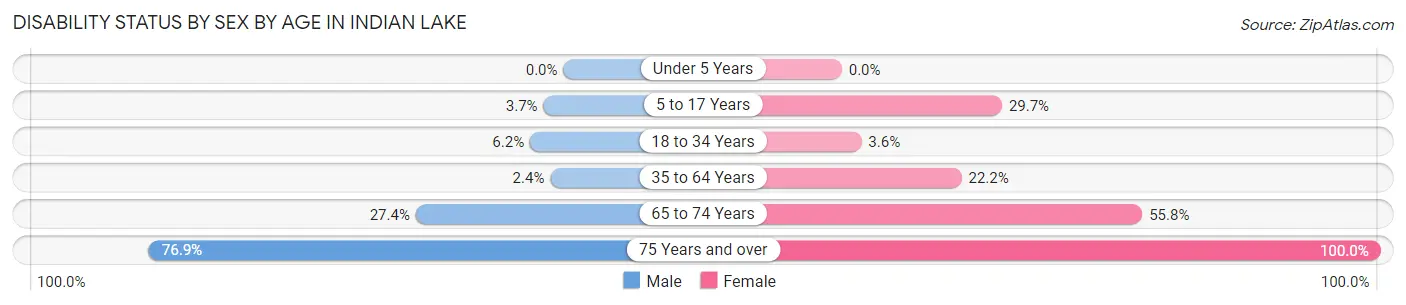
| Age Bracket | Male | Female |
| Under 5 Years | 0 (0.0%) | 0 (0.0%) |
| 5 to 17 Years | 6 (3.7%) | 44 (29.7%) |
| 18 to 34 Years | 6 (6.2%) | 6 (3.6%) |
| 35 to 64 Years | 5 (2.4%) | 30 (22.2%) |
| 65 to 74 Years | 20 (27.4%) | 29 (55.8%) |
| 75 Years and over | 10 (76.9%) | 20 (100.0%) |
Disability Class by Sex by Age in Indian Lake
Disability Class: Hearing Difficulty
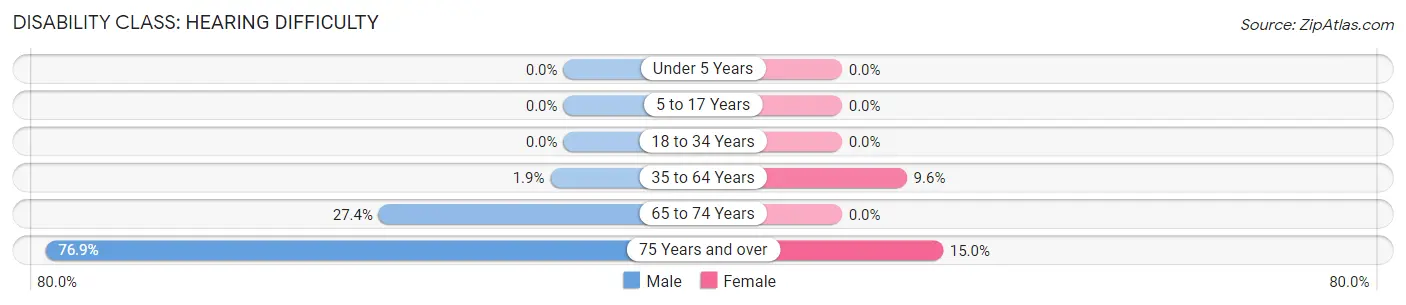
| Age Bracket | Male | Female |
| Under 5 Years | 0 (0.0%) | 0 (0.0%) |
| 5 to 17 Years | 0 (0.0%) | 0 (0.0%) |
| 18 to 34 Years | 0 (0.0%) | 0 (0.0%) |
| 35 to 64 Years | 4 (1.9%) | 13 (9.6%) |
| 65 to 74 Years | 20 (27.4%) | 0 (0.0%) |
| 75 Years and over | 10 (76.9%) | 3 (15.0%) |
Disability Class: Vision Difficulty
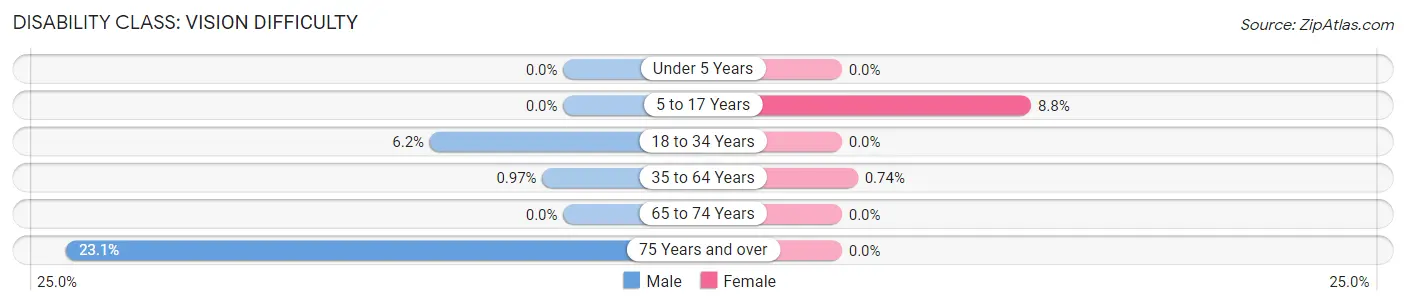
| Age Bracket | Male | Female |
| Under 5 Years | 0 (0.0%) | 0 (0.0%) |
| 5 to 17 Years | 0 (0.0%) | 13 (8.8%) |
| 18 to 34 Years | 6 (6.2%) | 0 (0.0%) |
| 35 to 64 Years | 2 (1.0%) | 1 (0.7%) |
| 65 to 74 Years | 0 (0.0%) | 0 (0.0%) |
| 75 Years and over | 3 (23.1%) | 0 (0.0%) |
Disability Class: Cognitive Difficulty
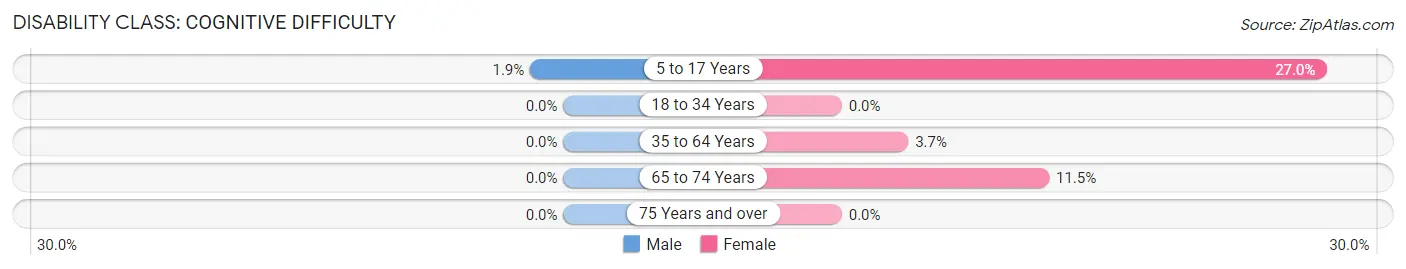
| Age Bracket | Male | Female |
| 5 to 17 Years | 3 (1.8%) | 40 (27.0%) |
| 18 to 34 Years | 0 (0.0%) | 0 (0.0%) |
| 35 to 64 Years | 0 (0.0%) | 5 (3.7%) |
| 65 to 74 Years | 0 (0.0%) | 6 (11.5%) |
| 75 Years and over | 0 (0.0%) | 0 (0.0%) |
Disability Class: Ambulatory Difficulty
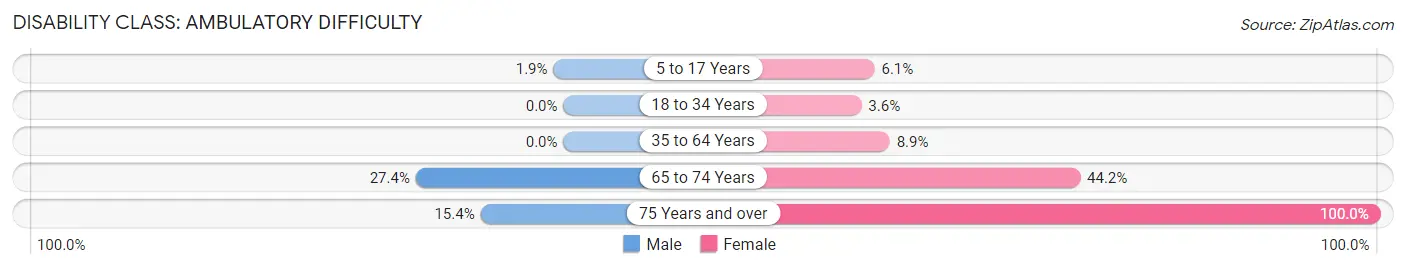
| Age Bracket | Male | Female |
| 5 to 17 Years | 3 (1.8%) | 9 (6.1%) |
| 18 to 34 Years | 0 (0.0%) | 6 (3.6%) |
| 35 to 64 Years | 0 (0.0%) | 12 (8.9%) |
| 65 to 74 Years | 20 (27.4%) | 23 (44.2%) |
| 75 Years and over | 2 (15.4%) | 20 (100.0%) |
Disability Class: Self-Care Difficulty
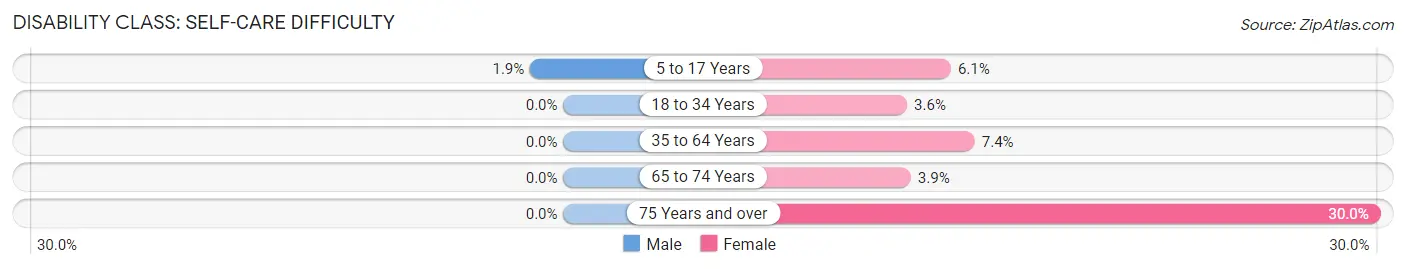
| Age Bracket | Male | Female |
| 5 to 17 Years | 3 (1.8%) | 9 (6.1%) |
| 18 to 34 Years | 0 (0.0%) | 6 (3.6%) |
| 35 to 64 Years | 0 (0.0%) | 10 (7.4%) |
| 65 to 74 Years | 0 (0.0%) | 2 (3.8%) |
| 75 Years and over | 0 (0.0%) | 6 (30.0%) |
Technology Access in Indian Lake
Computing Device Access in Indian Lake
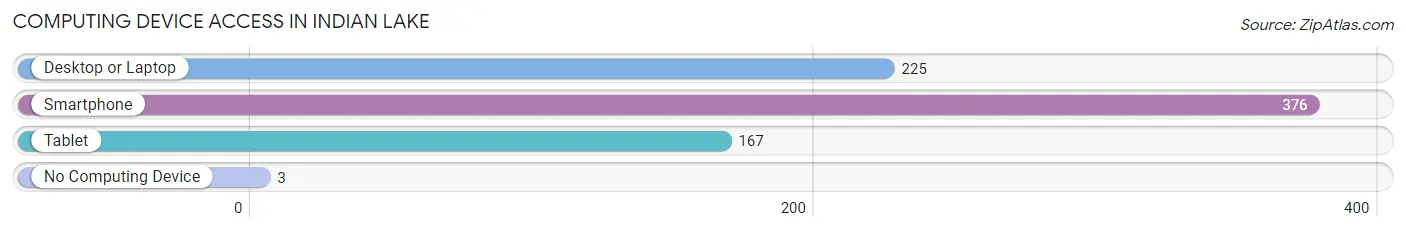
| Device Type | # Households | % Households |
| Desktop or Laptop | 225 | 56.8% |
| Smartphone | 376 | 95.0% |
| Tablet | 167 | 42.2% |
| No Computing Device | 3 | 0.8% |
| Total | 396 | 100.0% |
Internet Access in Indian Lake
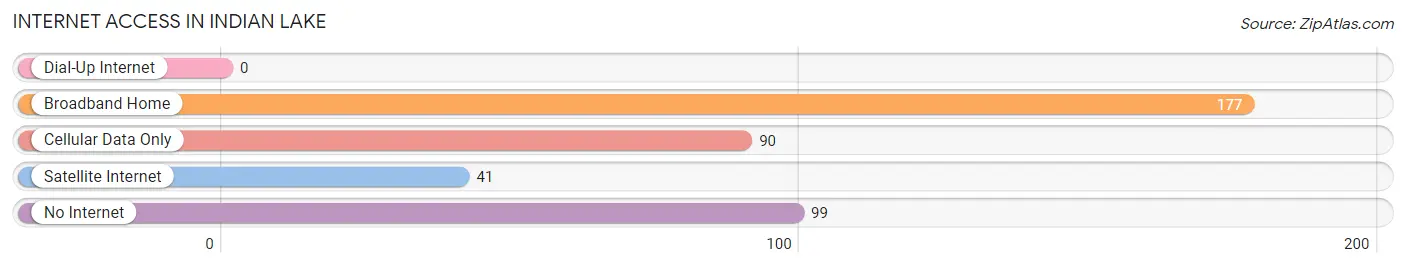
| Internet Type | # Households | % Households |
| Dial-Up Internet | 0 | 0.0% |
| Broadband Home | 177 | 44.7% |
| Cellular Data Only | 90 | 22.7% |
| Satellite Internet | 41 | 10.3% |
| No Internet | 99 | 25.0% |
| Total | 396 | 100.0% |
Indian Lake Summary
History
The small town of Indian Lake, Texas is located in the southeastern corner of the state, just north of the Gulf of Mexico. It is a rural community with a population of just over 1,000 people. The town was founded in the late 1800s by settlers from the nearby town of Indianola. The settlers were looking for a place to settle and raise their families, and Indian Lake provided them with the perfect opportunity.
The town was originally called Indianola Lake, but the name was changed to Indian Lake in the early 1900s. The name was chosen to honor the Native American tribes that had once lived in the area.
The town was a small farming community until the 1950s, when the oil industry began to boom in the area. This brought a new wave of settlers to the area, and the population of Indian Lake began to grow.
In the 1960s, the town was incorporated and the population continued to grow. The town was home to several businesses, including a grocery store, a bank, and a post office.
The town was also home to a number of churches, including the First Baptist Church of Indian Lake, which was founded in 1891.
Geography
Indian Lake is located in the southeastern corner of Texas, just north of the Gulf of Mexico. It is situated in the coastal plains region of the state, and is surrounded by the cities of Port Arthur, Beaumont, and Orange.
The town is located on the banks of Indian Lake, a small lake that was created by the damming of the Neches River. The lake is a popular spot for fishing and other recreational activities.
The town is located in Jefferson County and is part of the Beaumont Port Arthur metropolitan area
Economy
The economy of Indian Lake is largely based on the oil industry. The town is home to several oil refineries, and the local economy is heavily reliant on the oil industry.
In addition to the oil industry, the town is also home to several small businesses, including a grocery store, a bank, and a post office.
The town is also home to a number of churches, including the First Baptist Church of Indian Lake, which was founded in 1891.
Demographics
As of the 2010 census, the population of Indian Lake was 1,072. The racial makeup of the town was 79.3% White, 15.2% African American, 0.7% Native American, 0.3% Asian, and 4.5% from other races.
The median household income in Indian Lake was $37,917, and the median family income was $45,625. The per capita income was $19,945.
Conclusion
Indian Lake, Texas is a small rural town located in the southeastern corner of the state. It is a largely agricultural community, but the oil industry has had a major impact on the local economy. The town is home to several small businesses, churches, and a post office. The population of Indian Lake is just over 1,000 people, and the town is part of the Beaumont-Port Arthur metropolitan area.
Common Questions
What is Per Capita Income in Indian Lake?
Per Capita income in Indian Lake is $17,596.
What is the Median Family Income in Indian Lake?
Median Family Income in Indian Lake is $35,313.
What is the Median Household income in Indian Lake?
Median Household Income in Indian Lake is $24,000.
What is Income or Wage Gap in Indian Lake?
Income or Wage Gap in Indian Lake is 33.9%.
Women in Indian Lake earn 66.1 cents for every dollar earned by a man.
What is Family Income Deficit in Indian Lake?
Family Income Deficit in Indian Lake is $9,345.
Families that are below poverty line in Indian Lake earn $9,345 less on average than the poverty threshold level.
What is Inequality or Gini Index in Indian Lake?
Inequality or Gini Index in Indian Lake is 0.56.
What is the Total Population of Indian Lake?
Total Population of Indian Lake is 1,231.
What is the Total Male Population of Indian Lake?
Total Male Population of Indian Lake is 696.
What is the Total Female Population of Indian Lake?
Total Female Population of Indian Lake is 535.
What is the Ratio of Males per 100 Females in Indian Lake?
There are 130.09 Males per 100 Females in Indian Lake.
What is the Ratio of Females per 100 Males in Indian Lake?
There are 76.87 Females per 100 Males in Indian Lake.
What is the Median Population Age in Indian Lake?
Median Population Age in Indian Lake is 29.3 Years.
What is the Average Family Size in Indian Lake
Average Family Size in Indian Lake is 3.6 People.
What is the Average Household Size in Indian Lake
Average Household Size in Indian Lake is 3.1 People.
How Large is the Labor Force in Indian Lake?
There are 430 People in the Labor Forcein in Indian Lake.
What is the Percentage of People in the Labor Force in Indian Lake?
54.2% of People are in the Labor Force in Indian Lake.
What is the Unemployment Rate in Indian Lake?
Unemployment Rate in Indian Lake is 6.0%.