Plum Grove, TX Map & Demographics
Plum Grove Map
Plum Grove Overview
$21,620
PER CAPITA INCOME
$61,689
AVG FAMILY INCOME
$61,982
AVG HOUSEHOLD INCOME
12.7%
WAGE / INCOME GAP [ % ]
87.3¢/ $1
WAGE / INCOME GAP [ $ ]
0.35
INEQUALITY / GINI INDEX
1,613
TOTAL POPULATION
665
MALE POPULATION
948
FEMALE POPULATION
70.15
MALES / 100 FEMALES
142.56
FEMALES / 100 MALES
28.2
MEDIAN AGE
3.7
AVG FAMILY SIZE
3.4
AVG HOUSEHOLD SIZE
732
LABOR FORCE [ PEOPLE ]
67.0%
PERCENT IN LABOR FORCE
Income in Plum Grove
Income Overview in Plum Grove
Per Capita Income in Plum Grove is $21,620, while median incomes of families and households are $61,689 and $61,982 respectively.
| Characteristic | Number | Measure |
| Per Capita Income | 1,613 | $21,620 |
| Median Family Income | 402 | $61,689 |
| Mean Family Income | 402 | $70,554 |
| Median Household Income | 481 | $61,982 |
| Mean Household Income | 481 | $69,403 |
| Income Deficit | 402 | $0 |
| Wage / Income Gap (%) | 1,613 | 12.65% |
| Wage / Income Gap ($) | 1,613 | 87.35¢ per $1 |
| Gini / Inequality Index | 1,613 | 0.35 |
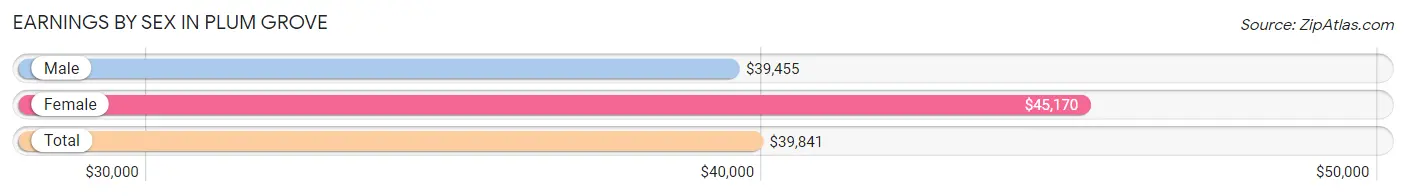
Earnings by Sex in Plum Grove
Average Earnings in Plum Grove are $39,841, $39,455 for men and $45,170 for women, a difference of 12.7%.
| Sex | Number | Average Earnings |
| Male | 460 (60.6%) | $39,455 |
| Female | 299 (39.4%) | $45,170 |
| Total | 759 (100.0%) | $39,841 |
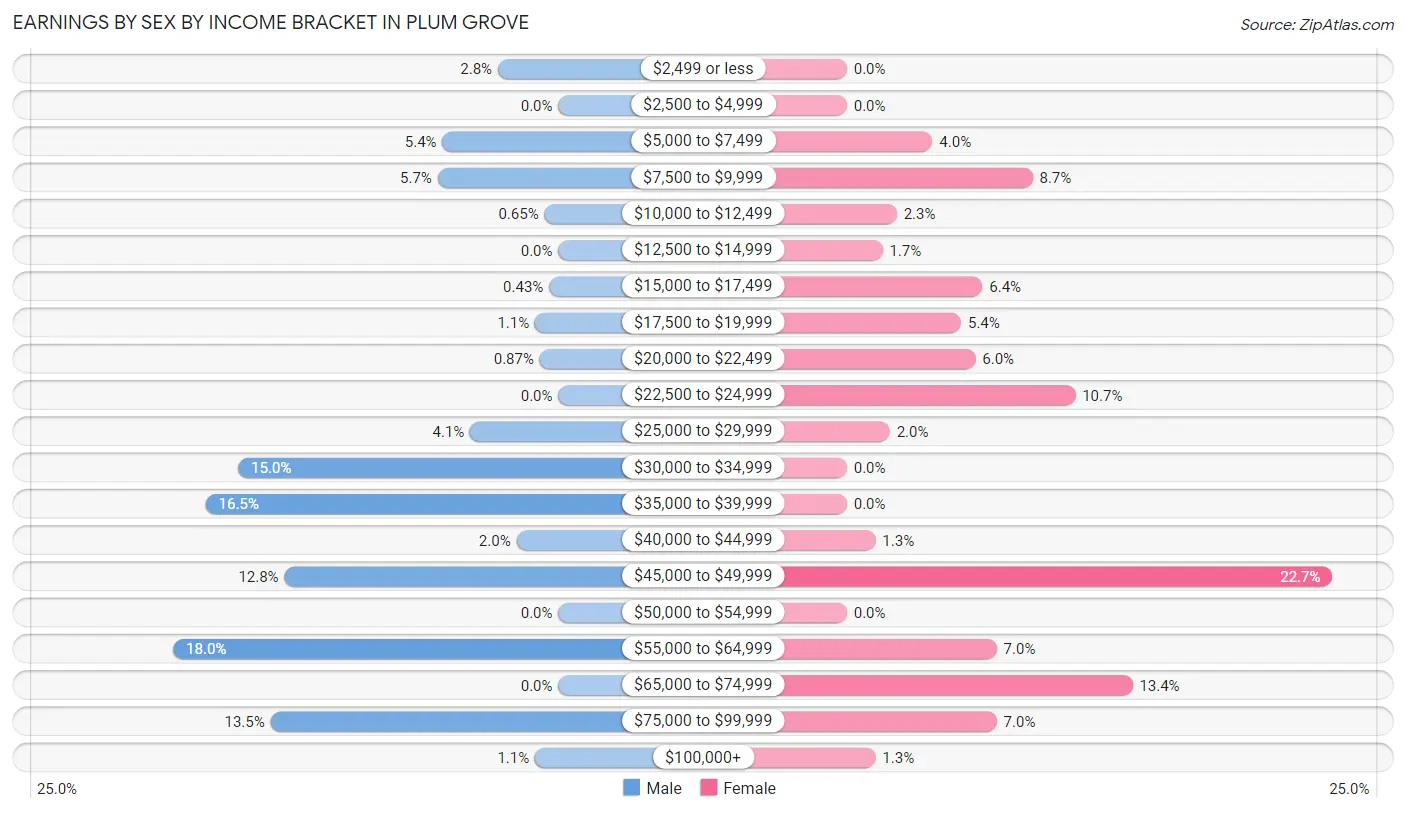
Earnings by Sex by Income Bracket in Plum Grove
The most common earnings brackets in Plum Grove are $55,000 to $64,999 for men (83 | 18.0%) and $45,000 to $49,999 for women (68 | 22.7%).
| Income | Male | Female |
| $2,499 or less | 13 (2.8%) | 0 (0.0%) |
| $2,500 to $4,999 | 0 (0.0%) | 0 (0.0%) |
| $5,000 to $7,499 | 25 (5.4%) | 12 (4.0%) |
| $7,500 to $9,999 | 26 (5.7%) | 26 (8.7%) |
| $10,000 to $12,499 | 3 (0.6%) | 7 (2.3%) |
| $12,500 to $14,999 | 0 (0.0%) | 5 (1.7%) |
| $15,000 to $17,499 | 2 (0.4%) | 19 (6.4%) |
| $17,500 to $19,999 | 5 (1.1%) | 16 (5.3%) |
| $20,000 to $22,499 | 4 (0.9%) | 18 (6.0%) |
| $22,500 to $24,999 | 0 (0.0%) | 32 (10.7%) |
| $25,000 to $29,999 | 19 (4.1%) | 6 (2.0%) |
| $30,000 to $34,999 | 69 (15.0%) | 0 (0.0%) |
| $35,000 to $39,999 | 76 (16.5%) | 0 (0.0%) |
| $40,000 to $44,999 | 9 (2.0%) | 4 (1.3%) |
| $45,000 to $49,999 | 59 (12.8%) | 68 (22.7%) |
| $50,000 to $54,999 | 0 (0.0%) | 0 (0.0%) |
| $55,000 to $64,999 | 83 (18.0%) | 21 (7.0%) |
| $65,000 to $74,999 | 0 (0.0%) | 40 (13.4%) |
| $75,000 to $99,999 | 62 (13.5%) | 21 (7.0%) |
| $100,000+ | 5 (1.1%) | 4 (1.3%) |
| Total | 460 (100.0%) | 299 (100.0%) |
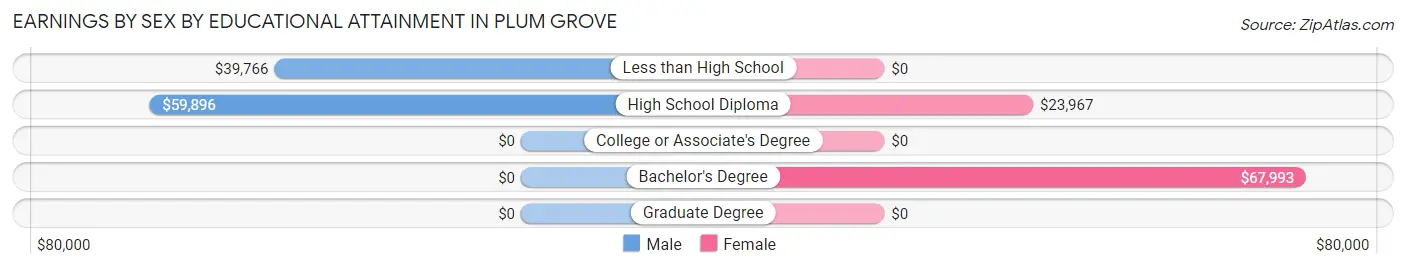
Earnings by Sex by Educational Attainment in Plum Grove
Average earnings in Plum Grove are $46,111 for men and $45,814 for women, a difference of 0.6%. Men with an educational attainment of high school diploma enjoy the highest average annual earnings of $59,896, while those with less than high school education earn the least with $39,766. Women with an educational attainment of bachelor's degree earn the most with the average annual earnings of $67,993, while those with high school diploma education have the smallest earnings of $23,967.
| Educational Attainment | Male Income | Female Income |
| Less than High School | $39,766 | $0 |
| High School Diploma | $59,896 | $23,967 |
| College or Associate's Degree | - | - |
| Bachelor's Degree | - | - |
| Graduate Degree | - | - |
| Total | $46,111 | $45,814 |
Family Income in Plum Grove
Family Income Brackets in Plum Grove
According to the Plum Grove family income data, there are 95 families falling into the $50,000 to $74,999 income range, which is the most common income bracket and makes up 23.6% of all families.
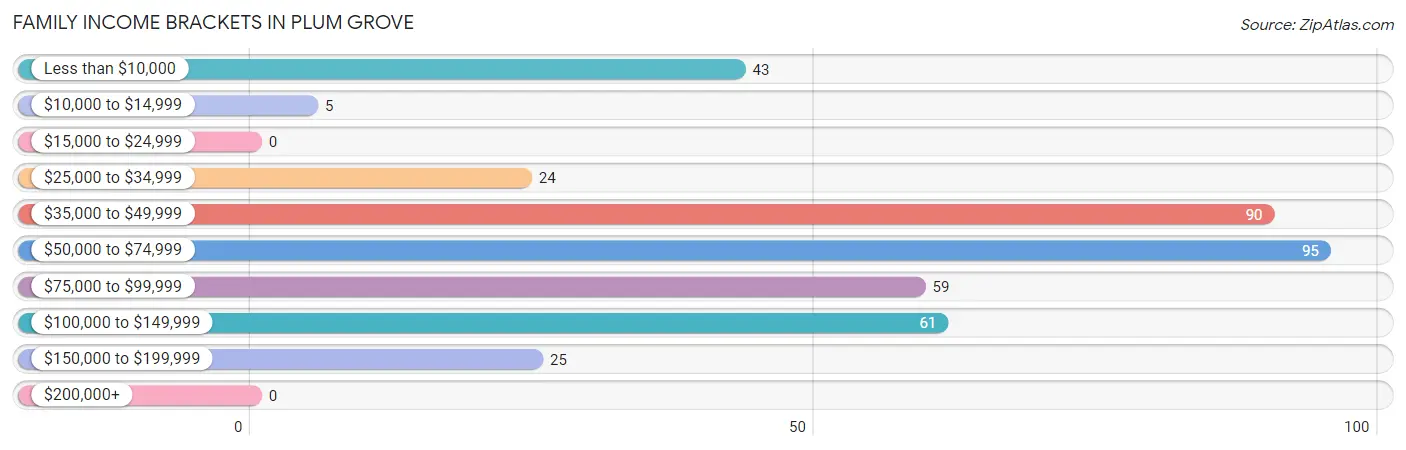
| Income Bracket | # Families | % Families |
| Less than $10,000 | 43 | 10.7% |
| $10,000 to $14,999 | 5 | 1.2% |
| $15,000 to $24,999 | 0 | 0.0% |
| $25,000 to $34,999 | 24 | 6.0% |
| $35,000 to $49,999 | 90 | 22.4% |
| $50,000 to $74,999 | 95 | 23.6% |
| $75,000 to $99,999 | 59 | 14.7% |
| $100,000 to $149,999 | 61 | 15.2% |
| $150,000 to $199,999 | 25 | 6.2% |
| $200,000+ | 0 | 0.0% |
Family Income by Famaliy Size in Plum Grove
3-person families (155 | 38.6%) account for the highest median family income in Plum Grove with $92,926 per family, while 3-person families (155 | 38.6%) have the highest median income of $30,975 per family member.
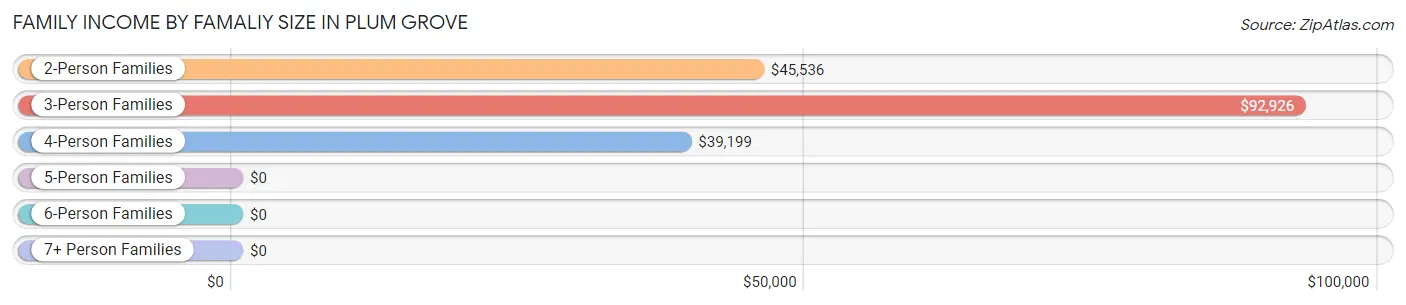
| Income Bracket | # Families | Median Income |
| 2-Person Families | 135 (33.6%) | $45,536 |
| 3-Person Families | 155 (38.6%) | $92,926 |
| 4-Person Families | 57 (14.2%) | $39,199 |
| 5-Person Families | 7 (1.7%) | $0 |
| 6-Person Families | 6 (1.5%) | $0 |
| 7+ Person Families | 42 (10.4%) | $0 |
| Total | 402 (100.0%) | $61,689 |
Family Income by Number of Earners in Plum Grove
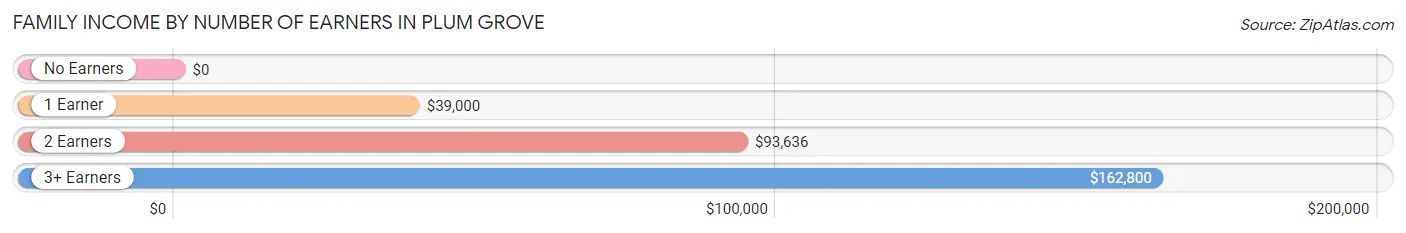
| Number of Earners | # Families | Median Income |
| No Earners | 20 (5.0%) | $0 |
| 1 Earner | 188 (46.8%) | $39,000 |
| 2 Earners | 150 (37.3%) | $93,636 |
| 3+ Earners | 44 (11.0%) | $162,800 |
| Total | 402 (100.0%) | $61,689 |
Household Income in Plum Grove
Household Income Brackets in Plum Grove
With 103 households falling in the category, the $50,000 to $74,999 income range is the most frequent in Plum Grove, accounting for 21.4% of all households.
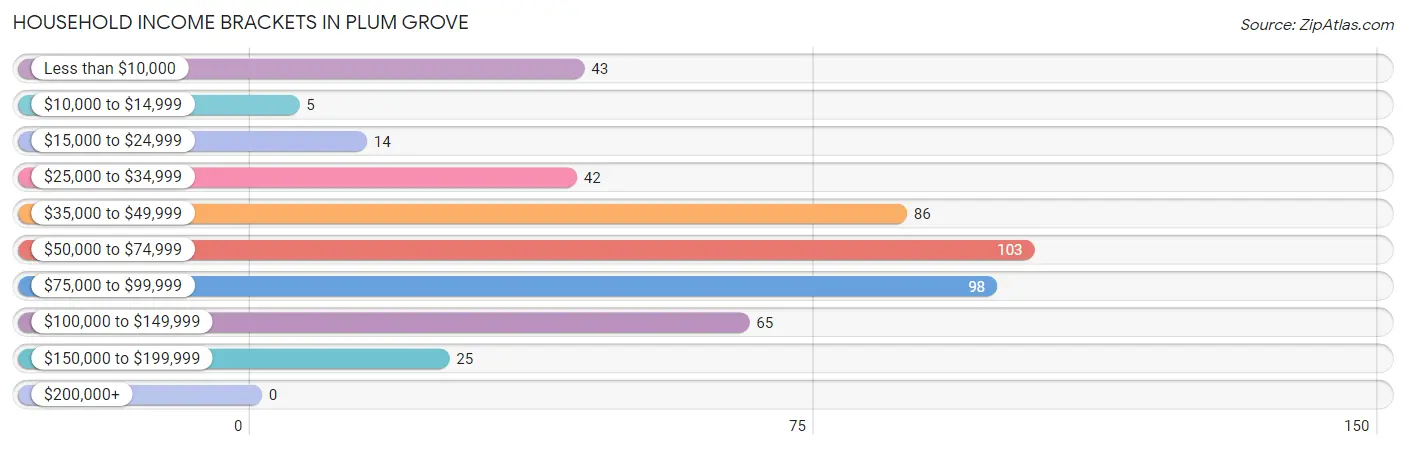
| Income Bracket | # Households | % Households |
| Less than $10,000 | 43 | 8.9% |
| $10,000 to $14,999 | 5 | 1.0% |
| $15,000 to $24,999 | 14 | 2.9% |
| $25,000 to $34,999 | 42 | 8.7% |
| $35,000 to $49,999 | 86 | 17.9% |
| $50,000 to $74,999 | 103 | 21.4% |
| $75,000 to $99,999 | 98 | 20.4% |
| $100,000 to $149,999 | 65 | 13.5% |
| $150,000 to $199,999 | 25 | 5.2% |
| $200,000+ | 0 | 0.0% |
Household Income by Householder Age in Plum Grove
The median household income in Plum Grove is $61,982, with the highest median household income of $93,125 found in the 25 to 44 years age bracket for the primary householder. A total of 150 households (31.2%) fall into this category. Meanwhile, the 15 to 24 years age bracket for the primary householder has the lowest median household income of $0, with 10 households (2.1%) in this group.
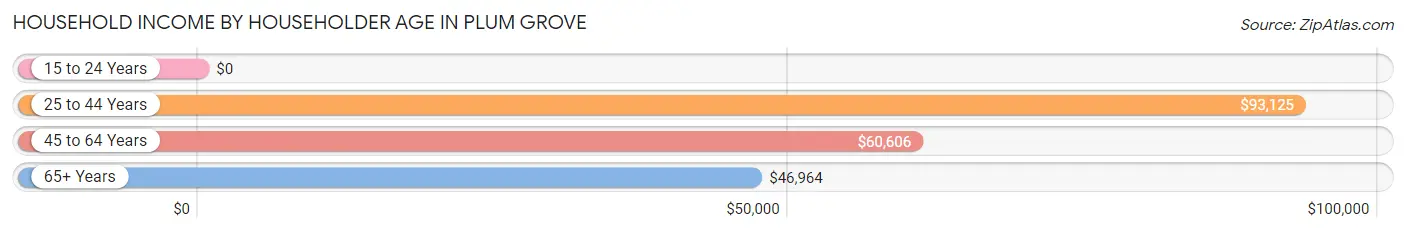
| Income Bracket | # Households | Median Income |
| 15 to 24 Years | 10 (2.1%) | $0 |
| 25 to 44 Years | 150 (31.2%) | $93,125 |
| 45 to 64 Years | 252 (52.4%) | $60,606 |
| 65+ Years | 69 (14.3%) | $46,964 |
| Total | 481 (100.0%) | $61,982 |
Poverty in Plum Grove
Income Below Poverty by Sex and Age in Plum Grove
With 7.8% poverty level for males and 20.3% for females among the residents of Plum Grove, 5 year old males and 12 to 14 year old females are the most vulnerable to poverty, with 4 males (50.0%) and 26 females (76.5%) in their respective age groups living below the poverty level.
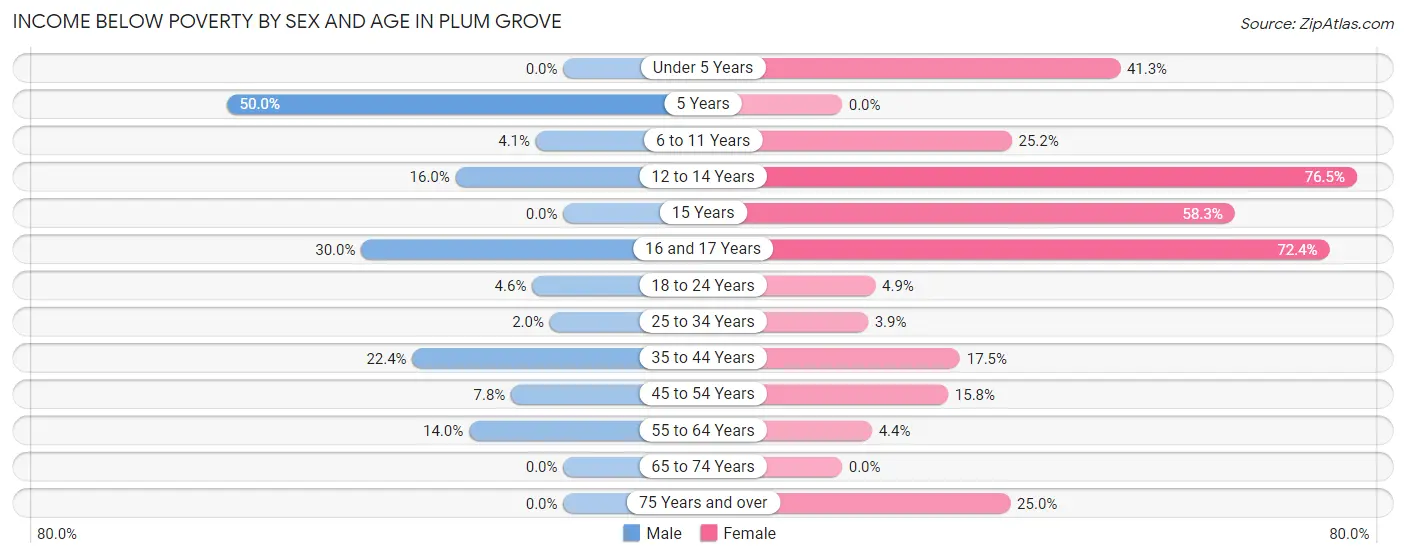
| Age Bracket | Male | Female |
| Under 5 Years | 0 (0.0%) | 38 (41.3%) |
| 5 Years | 4 (50.0%) | 0 (0.0%) |
| 6 to 11 Years | 4 (4.1%) | 30 (25.2%) |
| 12 to 14 Years | 4 (16.0%) | 26 (76.5%) |
| 15 Years | 0 (0.0%) | 21 (58.3%) |
| 16 and 17 Years | 3 (30.0%) | 21 (72.4%) |
| 18 to 24 Years | 3 (4.6%) | 4 (4.9%) |
| 25 to 34 Years | 3 (2.0%) | 4 (3.8%) |
| 35 to 44 Years | 13 (22.4%) | 17 (17.5%) |
| 45 to 54 Years | 11 (7.7%) | 23 (15.8%) |
| 55 to 64 Years | 7 (14.0%) | 2 (4.4%) |
| 65 to 74 Years | 0 (0.0%) | 0 (0.0%) |
| 75 Years and over | 0 (0.0%) | 5 (25.0%) |
| Total | 52 (7.8%) | 191 (20.3%) |
Income Above Poverty by Sex and Age in Plum Grove
According to the poverty statistics in Plum Grove, males aged 15 years and females aged 5 years are the age groups that are most secure financially, with 100.0% of males and 100.0% of females in these age groups living above the poverty line.
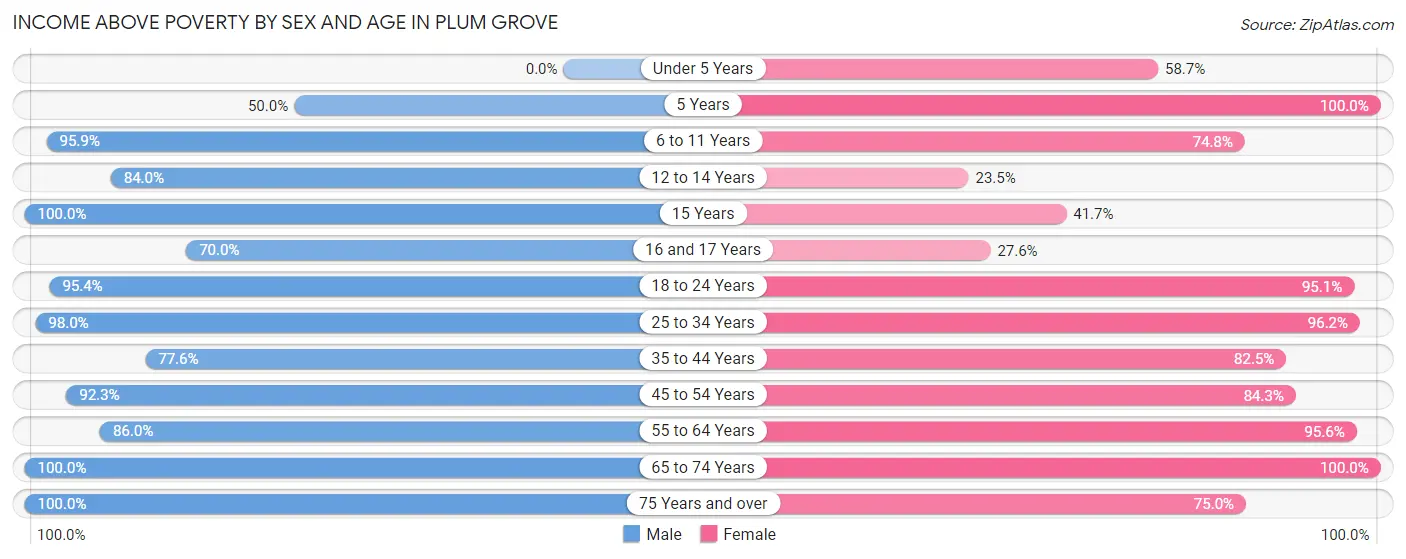
| Age Bracket | Male | Female |
| Under 5 Years | 0 (0.0%) | 54 (58.7%) |
| 5 Years | 4 (50.0%) | 97 (100.0%) |
| 6 to 11 Years | 94 (95.9%) | 89 (74.8%) |
| 12 to 14 Years | 21 (84.0%) | 8 (23.5%) |
| 15 Years | 3 (100.0%) | 15 (41.7%) |
| 16 and 17 Years | 7 (70.0%) | 8 (27.6%) |
| 18 to 24 Years | 62 (95.4%) | 77 (95.1%) |
| 25 to 34 Years | 146 (98.0%) | 100 (96.2%) |
| 35 to 44 Years | 45 (77.6%) | 80 (82.5%) |
| 45 to 54 Years | 131 (92.2%) | 123 (84.3%) |
| 55 to 64 Years | 43 (86.0%) | 43 (95.6%) |
| 65 to 74 Years | 43 (100.0%) | 39 (100.0%) |
| 75 Years and over | 14 (100.0%) | 15 (75.0%) |
| Total | 613 (92.2%) | 748 (79.7%) |
Income Below Poverty Among Married-Couple Families in Plum Grove
The poverty statistics for married-couple families in Plum Grove show that 5.5% or 16 of the total 292 families live below the poverty line. Families with 5 or more children have the highest poverty rate of 100.0%, comprising of 14 families. On the other hand, families with no children have the lowest poverty rate of 0.0%, which includes 0 families.
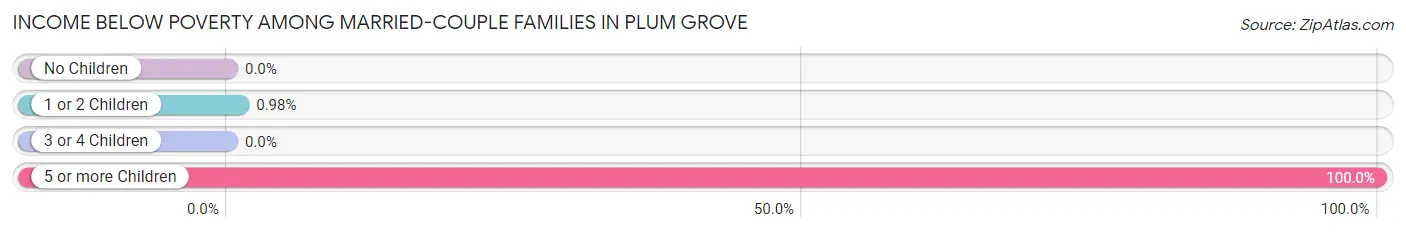
| Children | Above Poverty | Below Poverty |
| No Children | 67 (100.0%) | 0 (0.0%) |
| 1 or 2 Children | 203 (99.0%) | 2 (1.0%) |
| 3 or 4 Children | 6 (100.0%) | 0 (0.0%) |
| 5 or more Children | 0 (0.0%) | 14 (100.0%) |
| Total | 276 (94.5%) | 16 (5.5%) |
Income Below Poverty Among Single-Parent Households in Plum Grove
According to the poverty data in Plum Grove, 29.2% or 7 single-father households and 31.4% or 27 single-mother households are living below the poverty line. Among single-father households, those with 1 or 2 children have the highest poverty rate, with 7 households (100.0%) experiencing poverty. Likewise, among single-mother households, those with 5 or more children have the highest poverty rate, with 3 households (100.0%) falling below the poverty line.
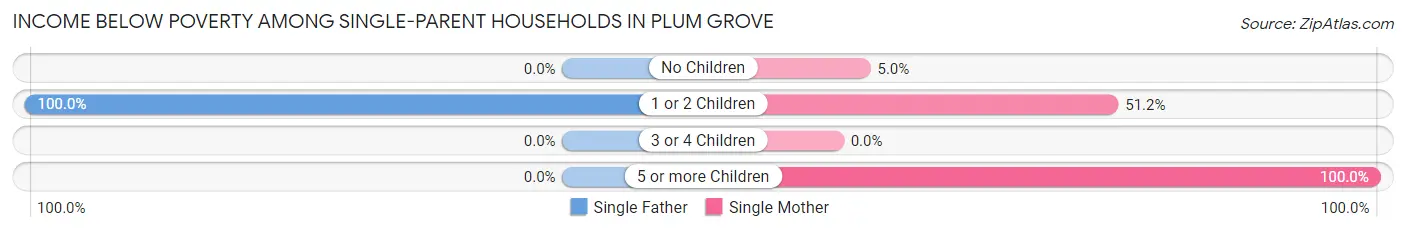
| Children | Single Father | Single Mother |
| No Children | 0 (0.0%) | 2 (5.0%) |
| 1 or 2 Children | 7 (100.0%) | 22 (51.2%) |
| 3 or 4 Children | 0 (0.0%) | 0 (0.0%) |
| 5 or more Children | 0 (0.0%) | 3 (100.0%) |
| Total | 7 (29.2%) | 27 (31.4%) |
Income Below Poverty Among Married-Couple vs Single-Parent Households in Plum Grove
The poverty data for Plum Grove shows that 16 of the married-couple family households (5.5%) and 34 of the single-parent households (30.9%) are living below the poverty level. Within the married-couple family households, those with 5 or more children have the highest poverty rate, with 14 households (100.0%) falling below the poverty line. Among the single-parent households, those with 5 or more children have the highest poverty rate, with 3 household (100.0%) living below poverty.
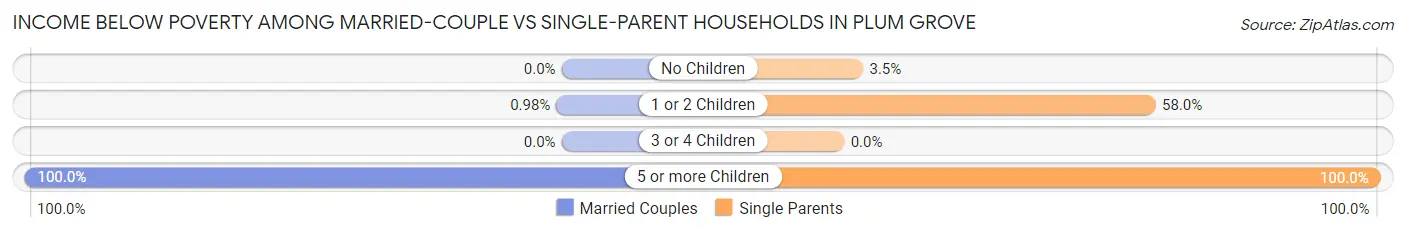
| Children | Married-Couple Families | Single-Parent Households |
| No Children | 0 (0.0%) | 2 (3.5%) |
| 1 or 2 Children | 2 (1.0%) | 29 (58.0%) |
| 3 or 4 Children | 0 (0.0%) | 0 (0.0%) |
| 5 or more Children | 14 (100.0%) | 3 (100.0%) |
| Total | 16 (5.5%) | 34 (30.9%) |
Race in Plum Grove
The most populous races in Plum Grove are Hispanic or Latino (1,146 | 71.1%), White / Caucasian (694 | 43.0%), and Two or more Races (541 | 33.5%).
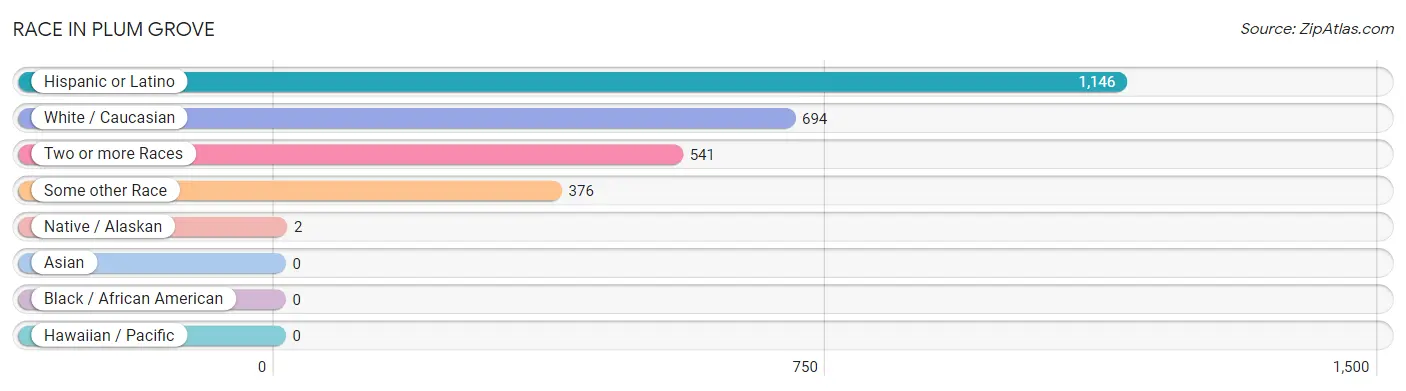
| Race | # Population | % Population |
| Asian | 0 | 0.0% |
| Black / African American | 0 | 0.0% |
| Hawaiian / Pacific | 0 | 0.0% |
| Hispanic or Latino | 1,146 | 71.1% |
| Native / Alaskan | 2 | 0.1% |
| White / Caucasian | 694 | 43.0% |
| Two or more Races | 541 | 33.5% |
| Some other Race | 376 | 23.3% |
| Total | 1,613 | 100.0% |
Ancestry in Plum Grove
The most populous ancestries reported in Plum Grove are Mexican (949 | 58.8%), English (196 | 12.1%), Central American (90 | 5.6%), Irish (68 | 4.2%), and Salvadoran (65 | 4.0%), together accounting for 84.8% of all Plum Grove residents.
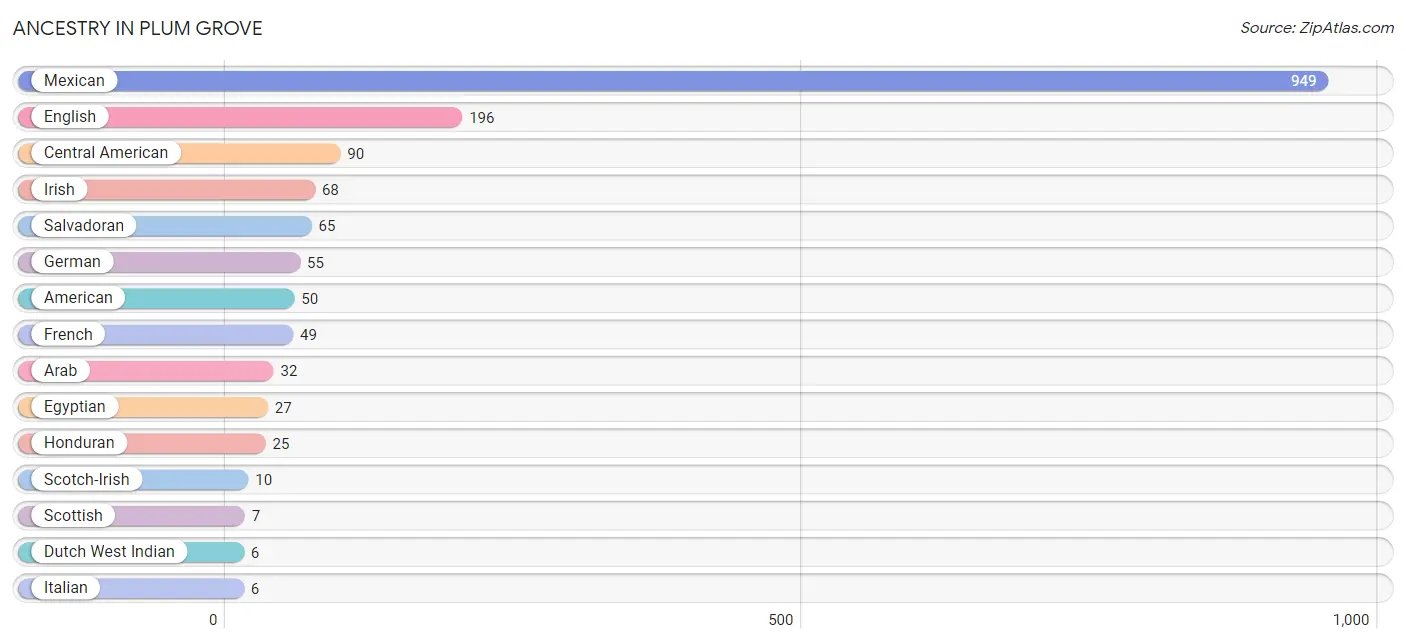
| Ancestry | # Population | % Population |
| American | 50 | 3.1% |
| Arab | 32 | 2.0% |
| Central American | 90 | 5.6% |
| Choctaw | 2 | 0.1% |
| Dutch West Indian | 6 | 0.4% |
| Egyptian | 27 | 1.7% |
| English | 196 | 12.1% |
| French | 49 | 3.0% |
| German | 55 | 3.4% |
| Honduran | 25 | 1.5% |
| Irish | 68 | 4.2% |
| Italian | 6 | 0.4% |
| Lebanese | 5 | 0.3% |
| Mexican | 949 | 58.8% |
| Norwegian | 3 | 0.2% |
| Salvadoran | 65 | 4.0% |
| Scotch-Irish | 10 | 0.6% |
| Scottish | 7 | 0.4% | View All 18 Rows |
Immigrants in Plum Grove
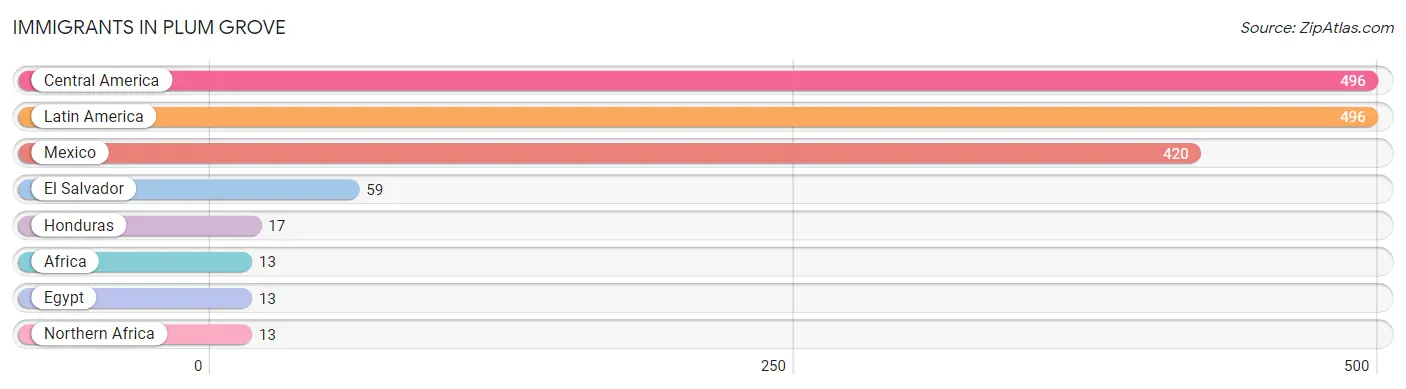
The most numerous immigrant groups reported in Plum Grove came from Central America (496 | 30.7%), Latin America (496 | 30.7%), Mexico (420 | 26.0%), El Salvador (59 | 3.7%), and Honduras (17 | 1.1%), together accounting for 92.2% of all Plum Grove residents.
| Immigration Origin | # Population | % Population |
| Africa | 13 | 0.8% |
| Central America | 496 | 30.7% |
| Egypt | 13 | 0.8% |
| El Salvador | 59 | 3.7% |
| Honduras | 17 | 1.1% |
| Latin America | 496 | 30.7% |
| Mexico | 420 | 26.0% |
| Northern Africa | 13 | 0.8% | View All 8 Rows |
Sex and Age in Plum Grove
Sex and Age in Plum Grove
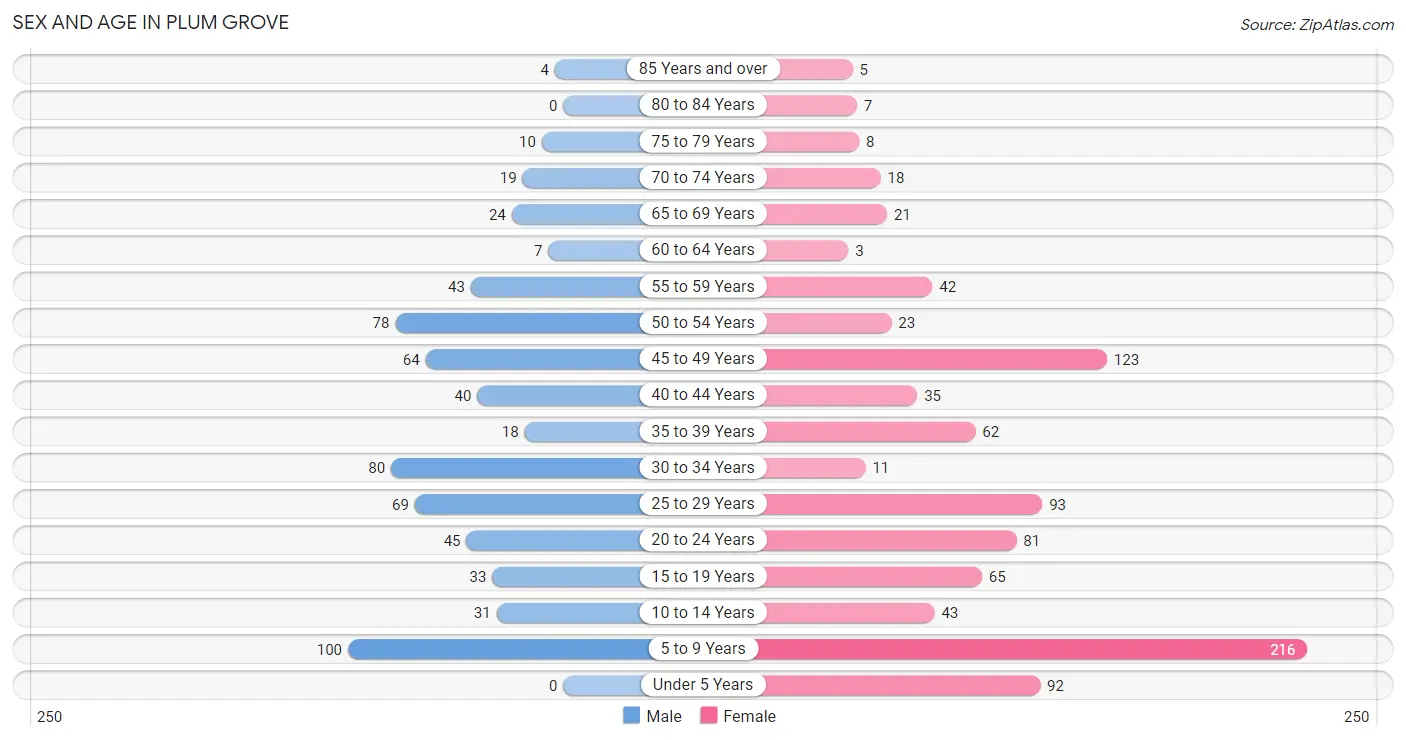
The most populous age groups in Plum Grove are 5 to 9 Years (100 | 15.0%) for men and 5 to 9 Years (216 | 22.8%) for women.
| Age Bracket | Male | Female |
| Under 5 Years | 0 (0.0%) | 92 (9.7%) |
| 5 to 9 Years | 100 (15.0%) | 216 (22.8%) |
| 10 to 14 Years | 31 (4.7%) | 43 (4.5%) |
| 15 to 19 Years | 33 (5.0%) | 65 (6.9%) |
| 20 to 24 Years | 45 (6.8%) | 81 (8.5%) |
| 25 to 29 Years | 69 (10.4%) | 93 (9.8%) |
| 30 to 34 Years | 80 (12.0%) | 11 (1.2%) |
| 35 to 39 Years | 18 (2.7%) | 62 (6.5%) |
| 40 to 44 Years | 40 (6.0%) | 35 (3.7%) |
| 45 to 49 Years | 64 (9.6%) | 123 (13.0%) |
| 50 to 54 Years | 78 (11.7%) | 23 (2.4%) |
| 55 to 59 Years | 43 (6.5%) | 42 (4.4%) |
| 60 to 64 Years | 7 (1.1%) | 3 (0.3%) |
| 65 to 69 Years | 24 (3.6%) | 21 (2.2%) |
| 70 to 74 Years | 19 (2.9%) | 18 (1.9%) |
| 75 to 79 Years | 10 (1.5%) | 8 (0.8%) |
| 80 to 84 Years | 0 (0.0%) | 7 (0.7%) |
| 85 Years and over | 4 (0.6%) | 5 (0.5%) |
| Total | 665 (100.0%) | 948 (100.0%) |
Families and Households in Plum Grove
Median Family Size in Plum Grove
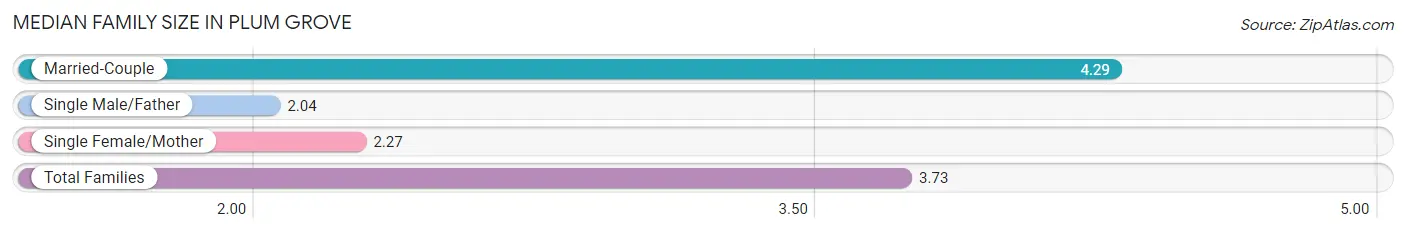
The median family size in Plum Grove is 3.73 persons per family, with married-couple families (292 | 72.6%) accounting for the largest median family size of 4.29 persons per family. On the other hand, single male/father families (24 | 6.0%) represent the smallest median family size with 2.04 persons per family.
| Family Type | # Families | Family Size |
| Married-Couple | 292 (72.6%) | 4.29 |
| Single Male/Father | 24 (6.0%) | 2.04 |
| Single Female/Mother | 86 (21.4%) | 2.27 |
| Total Families | 402 (100.0%) | 3.73 |
Median Household Size in Plum Grove
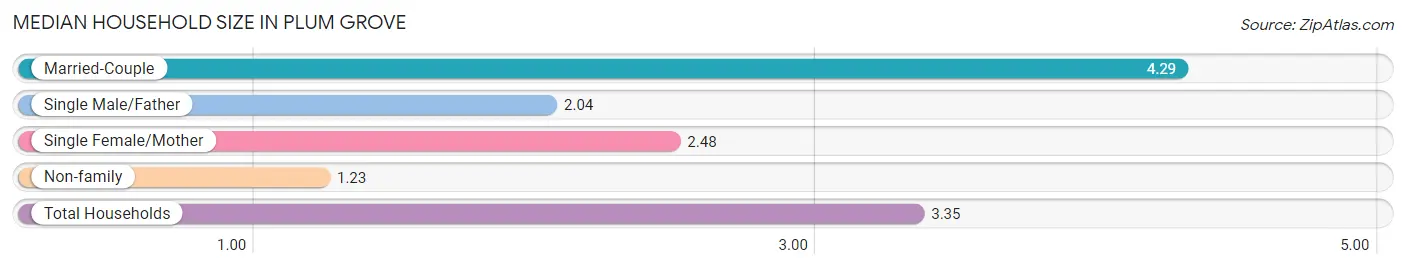
The median household size in Plum Grove is 3.35 persons per household, with married-couple households (292 | 60.7%) accounting for the largest median household size of 4.29 persons per household. non-family households (79 | 16.4%) represent the smallest median household size with 1.23 persons per household.
| Household Type | # Households | Household Size |
| Married-Couple | 292 (60.7%) | 4.29 |
| Single Male/Father | 24 (5.0%) | 2.04 |
| Single Female/Mother | 86 (17.9%) | 2.48 |
| Non-family | 79 (16.4%) | 1.23 |
| Total Households | 481 (100.0%) | 3.35 |
Household Size by Marriage Status in Plum Grove
Out of a total of 481 households in Plum Grove, 402 (83.6%) are family households, while 79 (16.4%) are nonfamily households. The most numerous type of family households are 3-person households, comprising 170, and the most common type of nonfamily households are 1-person households, comprising 63.
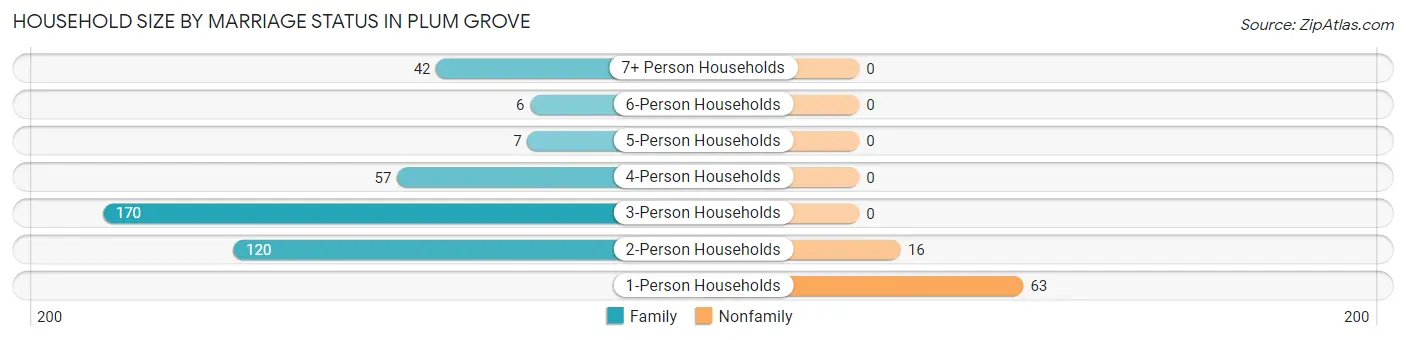
| Household Size | Family Households | Nonfamily Households |
| 1-Person Households | - | 63 (13.1%) |
| 2-Person Households | 120 (24.9%) | 16 (3.3%) |
| 3-Person Households | 170 (35.3%) | 0 (0.0%) |
| 4-Person Households | 57 (11.8%) | 0 (0.0%) |
| 5-Person Households | 7 (1.5%) | 0 (0.0%) |
| 6-Person Households | 6 (1.3%) | 0 (0.0%) |
| 7+ Person Households | 42 (8.7%) | 0 (0.0%) |
| Total | 402 (83.6%) | 79 (16.4%) |
Female Fertility in Plum Grove
Fertility by Age in Plum Grove
Average fertility rate in Plum Grove is 49.0 births per 1,000 women. Women in the age bracket of 35 to 50 years have the highest fertility rate with 63.0 births per 1,000 women. Women in the age bracket of 35 to 50 years acount for 60.9% of all women with births.
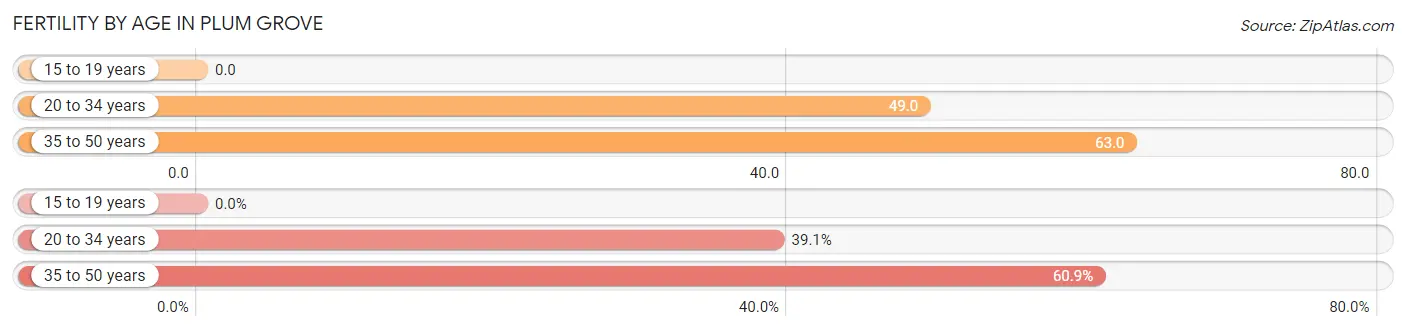
| Age Bracket | Women with Births | Births / 1,000 Women |
| 15 to 19 years | 0 (0.0%) | 0.0 |
| 20 to 34 years | 9 (39.1%) | 49.0 |
| 35 to 50 years | 14 (60.9%) | 63.0 |
| Total | 23 (100.0%) | 49.0 |
Fertility by Age by Marriage Status in Plum Grove
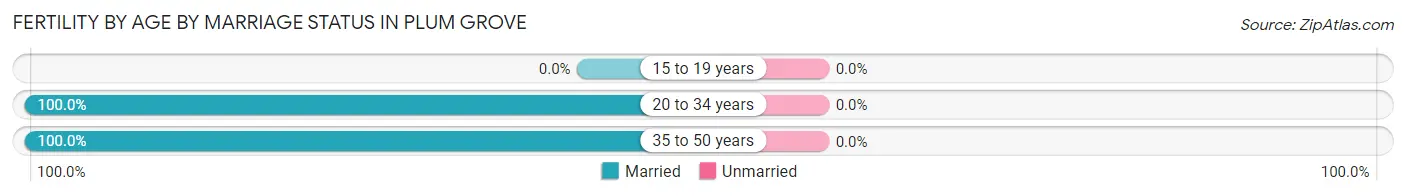
| Age Bracket | Married | Unmarried |
| 15 to 19 years | 0 (0.0%) | 0 (0.0%) |
| 20 to 34 years | 9 (100.0%) | 0 (0.0%) |
| 35 to 50 years | 14 (100.0%) | 0 (0.0%) |
| Total | 23 (100.0%) | 0 (0.0%) |
Fertility by Education in Plum Grove
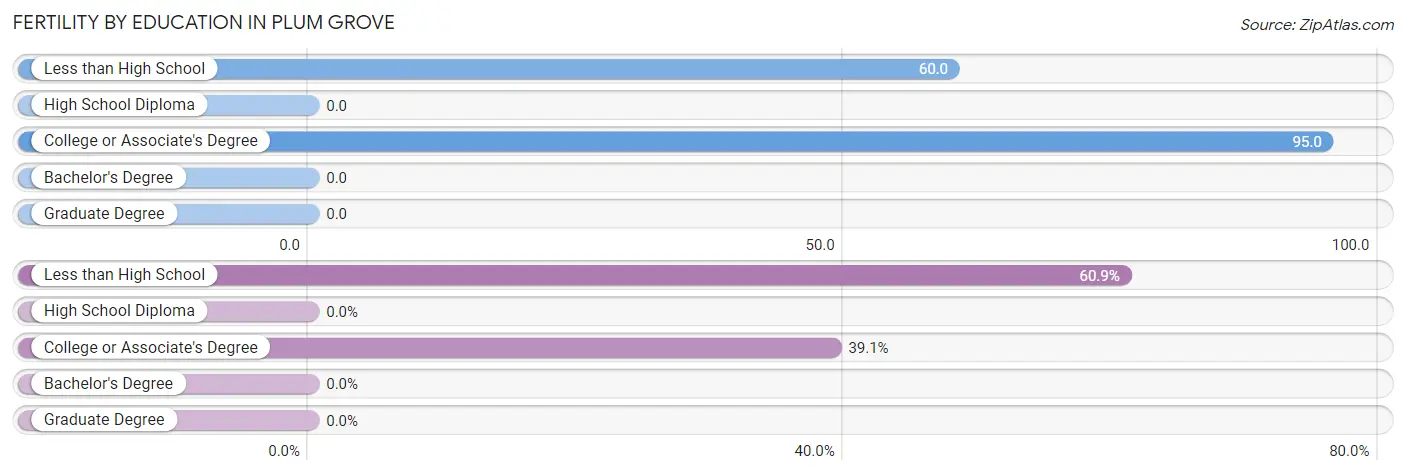
| Educational Attainment | Women with Births | Births / 1,000 Women |
| Less than High School | 14 (60.9%) | 60.0 |
| High School Diploma | 0 (0.0%) | 0.0 |
| College or Associate's Degree | 9 (39.1%) | 95.0 |
| Bachelor's Degree | 0 (0.0%) | 0.0 |
| Graduate Degree | 0 (0.0%) | 0.0 |
| Total | 23 (100.0%) | 49.0 |
Fertility by Education by Marriage Status in Plum Grove
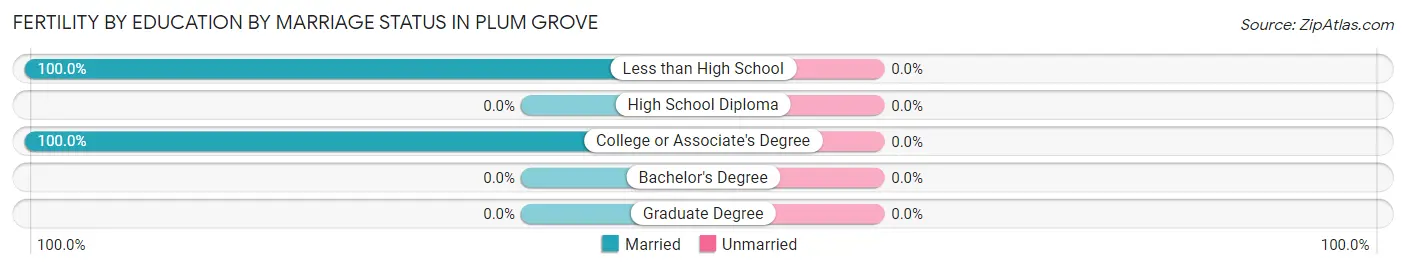
| Educational Attainment | Married | Unmarried |
| Less than High School | 14 (100.0%) | 0 (0.0%) |
| High School Diploma | 0 (0.0%) | 0 (0.0%) |
| College or Associate's Degree | 9 (100.0%) | 0 (0.0%) |
| Bachelor's Degree | 0 (0.0%) | 0 (0.0%) |
| Graduate Degree | 0 (0.0%) | 0 (0.0%) |
| Total | 23 (100.0%) | 0 (0.0%) |
Employment Characteristics in Plum Grove
Employment by Class of Employer in Plum Grove
Among the 714 employed individuals in Plum Grove, private company employees (531 | 74.4%), self-employed (not incorporated) (109 | 15.3%), and local government employees (43 | 6.0%) make up the most common classes of employment.
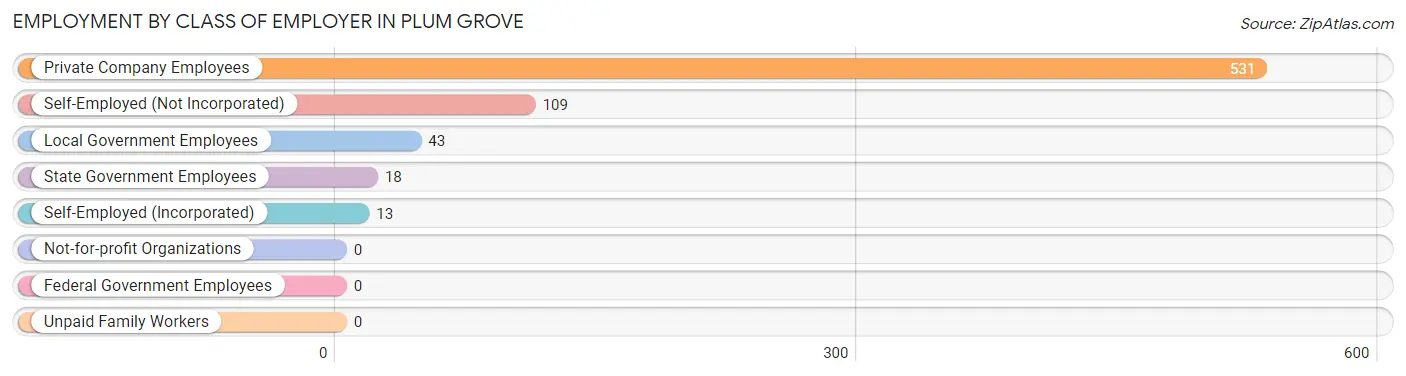
| Employer Class | # Employees | % Employees |
| Private Company Employees | 531 | 74.4% |
| Self-Employed (Incorporated) | 13 | 1.8% |
| Self-Employed (Not Incorporated) | 109 | 15.3% |
| Not-for-profit Organizations | 0 | 0.0% |
| Local Government Employees | 43 | 6.0% |
| State Government Employees | 18 | 2.5% |
| Federal Government Employees | 0 | 0.0% |
| Unpaid Family Workers | 0 | 0.0% |
| Total | 714 | 100.0% |
Employment Status by Age in Plum Grove
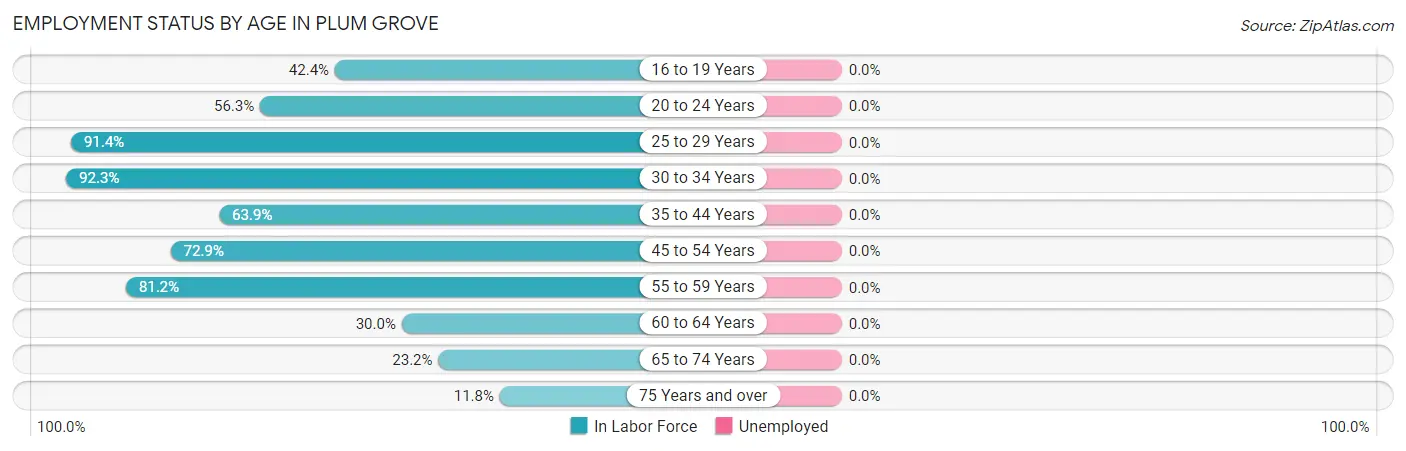
| Age Bracket | In Labor Force | Unemployed |
| 16 to 19 Years | 25 (42.4%) | 0 (0.0%) |
| 20 to 24 Years | 71 (56.3%) | 0 (0.0%) |
| 25 to 29 Years | 148 (91.4%) | 0 (0.0%) |
| 30 to 34 Years | 84 (92.3%) | 0 (0.0%) |
| 35 to 44 Years | 99 (63.9%) | 0 (0.0%) |
| 45 to 54 Years | 210 (72.9%) | 0 (0.0%) |
| 55 to 59 Years | 69 (81.2%) | 0 (0.0%) |
| 60 to 64 Years | 3 (30.0%) | 0 (0.0%) |
| 65 to 74 Years | 19 (23.2%) | 0 (0.0%) |
| 75 Years and over | 4 (11.8%) | 0 (0.0%) |
| Total | 732 (67.0%) | 0 (0.0%) |
Employment Status by Educational Attainment in Plum Grove
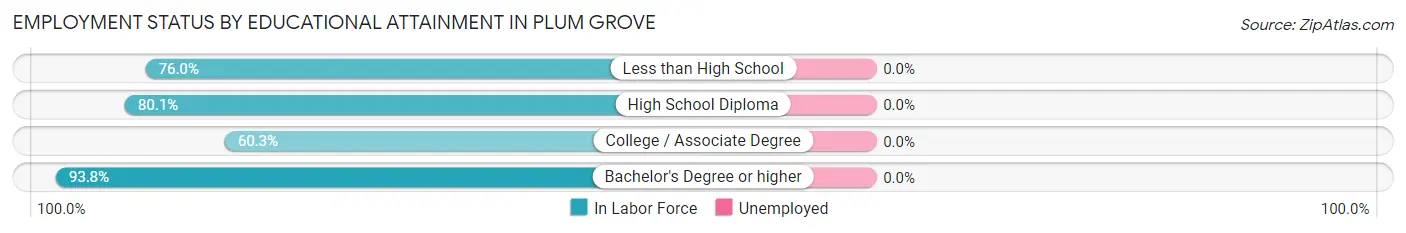
| Educational Attainment | In Labor Force | Unemployed |
| Less than High School | 275 (76.0%) | 0 (0.0%) |
| High School Diploma | 233 (80.1%) | 0 (0.0%) |
| College / Associate Degree | 44 (60.3%) | 0 (0.0%) |
| Bachelor's Degree or higher | 61 (93.8%) | 0 (0.0%) |
| Total | 613 (77.5%) | 0 (0.0%) |
Employment Occupations by Sex in Plum Grove
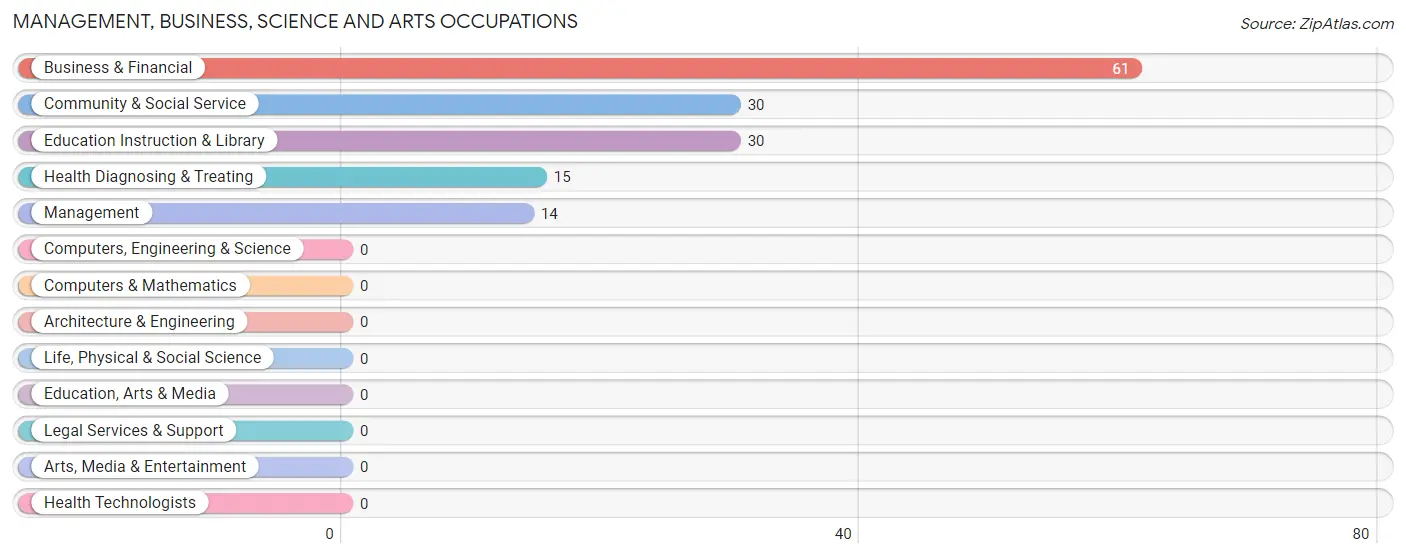
Management, Business, Science and Arts Occupations
The most common Management, Business, Science and Arts occupations in Plum Grove are Business & Financial (61 | 8.3%), Community & Social Service (30 | 4.1%), Education Instruction & Library (30 | 4.1%), Health Diagnosing & Treating (15 | 2.1%), and Management (14 | 1.9%).
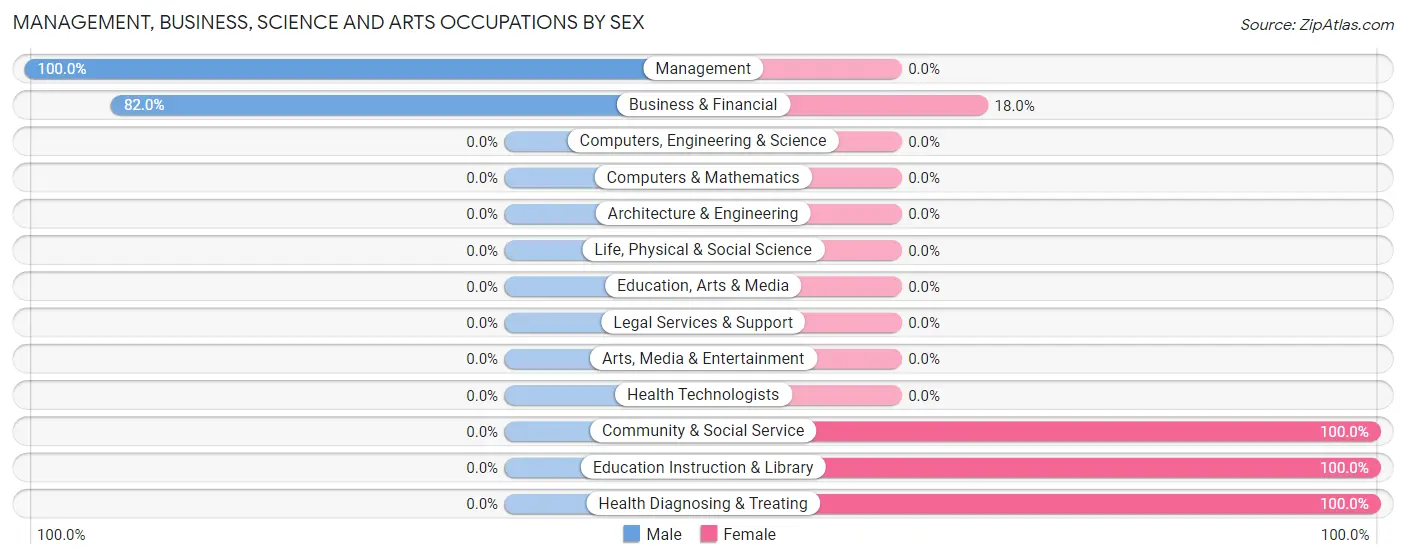
Management, Business, Science and Arts Occupations by Sex
Within the Management, Business, Science and Arts occupations in Plum Grove, the most male-oriented occupations are Management (100.0%), and Business & Financial (82.0%), while the most female-oriented occupations are Community & Social Service (100.0%), Education Instruction & Library (100.0%), and Health Diagnosing & Treating (100.0%).
| Occupation | Male | Female |
| Management | 14 (100.0%) | 0 (0.0%) |
| Business & Financial | 50 (82.0%) | 11 (18.0%) |
| Computers, Engineering & Science | 0 (0.0%) | 0 (0.0%) |
| Computers & Mathematics | 0 (0.0%) | 0 (0.0%) |
| Architecture & Engineering | 0 (0.0%) | 0 (0.0%) |
| Life, Physical & Social Science | 0 (0.0%) | 0 (0.0%) |
| Community & Social Service | 0 (0.0%) | 30 (100.0%) |
| Education, Arts & Media | 0 (0.0%) | 0 (0.0%) |
| Legal Services & Support | 0 (0.0%) | 0 (0.0%) |
| Education Instruction & Library | 0 (0.0%) | 30 (100.0%) |
| Arts, Media & Entertainment | 0 (0.0%) | 0 (0.0%) |
| Health Diagnosing & Treating | 0 (0.0%) | 15 (100.0%) |
| Health Technologists | 0 (0.0%) | 0 (0.0%) |
| Total (Category) | 64 (53.3%) | 56 (46.7%) |
| Total (Overall) | 441 (60.3%) | 291 (39.8%) |
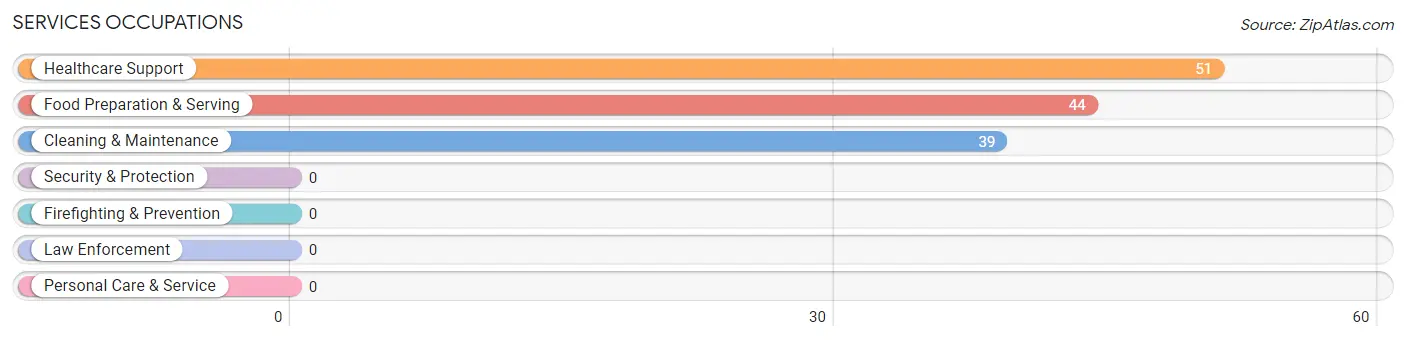
Services Occupations
The most common Services occupations in Plum Grove are Healthcare Support (51 | 7.0%), Food Preparation & Serving (44 | 6.0%), and Cleaning & Maintenance (39 | 5.3%).
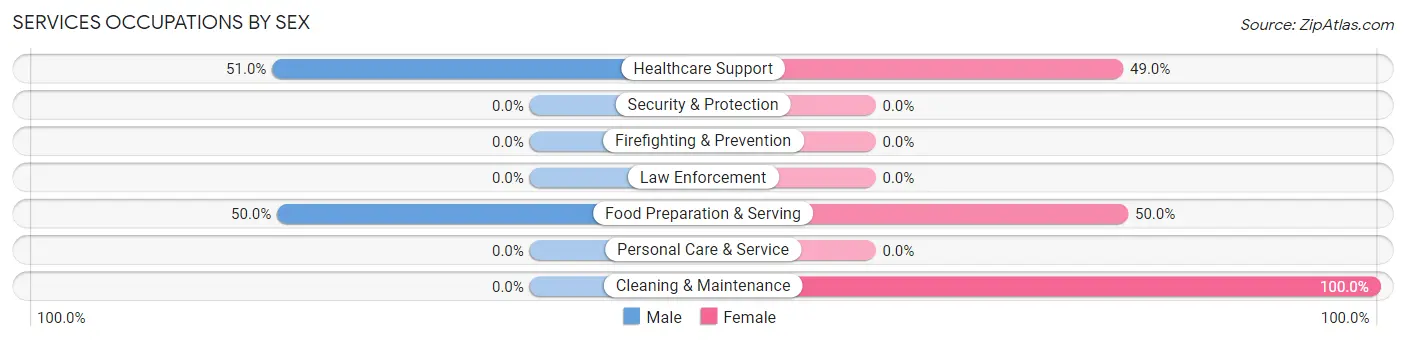
Services Occupations by Sex
Within the Services occupations in Plum Grove, the most male-oriented occupations are Healthcare Support (51.0%), and Food Preparation & Serving (50.0%), while the most female-oriented occupations are Cleaning & Maintenance (100.0%), Food Preparation & Serving (50.0%), and Healthcare Support (49.0%).
| Occupation | Male | Female |
| Healthcare Support | 26 (51.0%) | 25 (49.0%) |
| Security & Protection | 0 (0.0%) | 0 (0.0%) |
| Firefighting & Prevention | 0 (0.0%) | 0 (0.0%) |
| Law Enforcement | 0 (0.0%) | 0 (0.0%) |
| Food Preparation & Serving | 22 (50.0%) | 22 (50.0%) |
| Cleaning & Maintenance | 0 (0.0%) | 39 (100.0%) |
| Personal Care & Service | 0 (0.0%) | 0 (0.0%) |
| Total (Category) | 48 (35.8%) | 86 (64.2%) |
| Total (Overall) | 441 (60.3%) | 291 (39.8%) |
Sales and Office Occupations
The most common Sales and Office occupations in Plum Grove are Office & Administration (60 | 8.2%), and Sales & Related (26 | 3.5%).
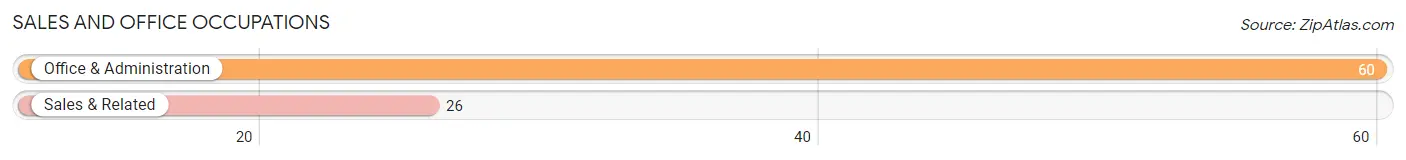
Sales and Office Occupations by Sex

| Occupation | Male | Female |
| Sales & Related | 5 (19.2%) | 21 (80.8%) |
| Office & Administration | 11 (18.3%) | 49 (81.7%) |
| Total (Category) | 16 (18.6%) | 70 (81.4%) |
| Total (Overall) | 441 (60.3%) | 291 (39.8%) |
Natural Resources, Construction and Maintenance Occupations
The most common Natural Resources, Construction and Maintenance occupations in Plum Grove are Construction & Extraction (210 | 28.7%), Installation, Maintenance & Repair (17 | 2.3%), and Farming, Fishing & Forestry (2 | 0.3%).

Natural Resources, Construction and Maintenance Occupations by Sex

| Occupation | Male | Female |
| Farming, Fishing & Forestry | 2 (100.0%) | 0 (0.0%) |
| Construction & Extraction | 144 (68.6%) | 66 (31.4%) |
| Installation, Maintenance & Repair | 17 (100.0%) | 0 (0.0%) |
| Total (Category) | 163 (71.2%) | 66 (28.8%) |
| Total (Overall) | 441 (60.3%) | 291 (39.8%) |
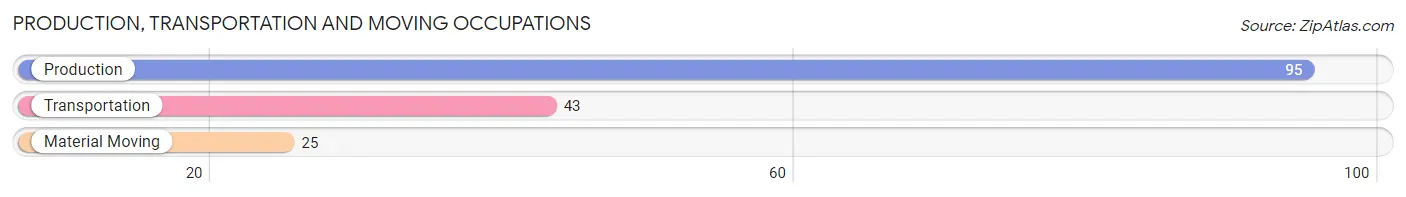
Production, Transportation and Moving Occupations
The most common Production, Transportation and Moving occupations in Plum Grove are Production (95 | 13.0%), Transportation (43 | 5.9%), and Material Moving (25 | 3.4%).
Production, Transportation and Moving Occupations by Sex
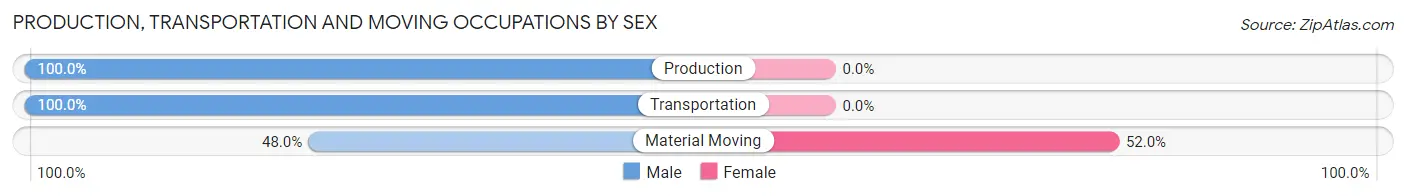
| Occupation | Male | Female |
| Production | 95 (100.0%) | 0 (0.0%) |
| Transportation | 43 (100.0%) | 0 (0.0%) |
| Material Moving | 12 (48.0%) | 13 (52.0%) |
| Total (Category) | 150 (92.0%) | 13 (8.0%) |
| Total (Overall) | 441 (60.3%) | 291 (39.8%) |
Employment Industries by Sex in Plum Grove
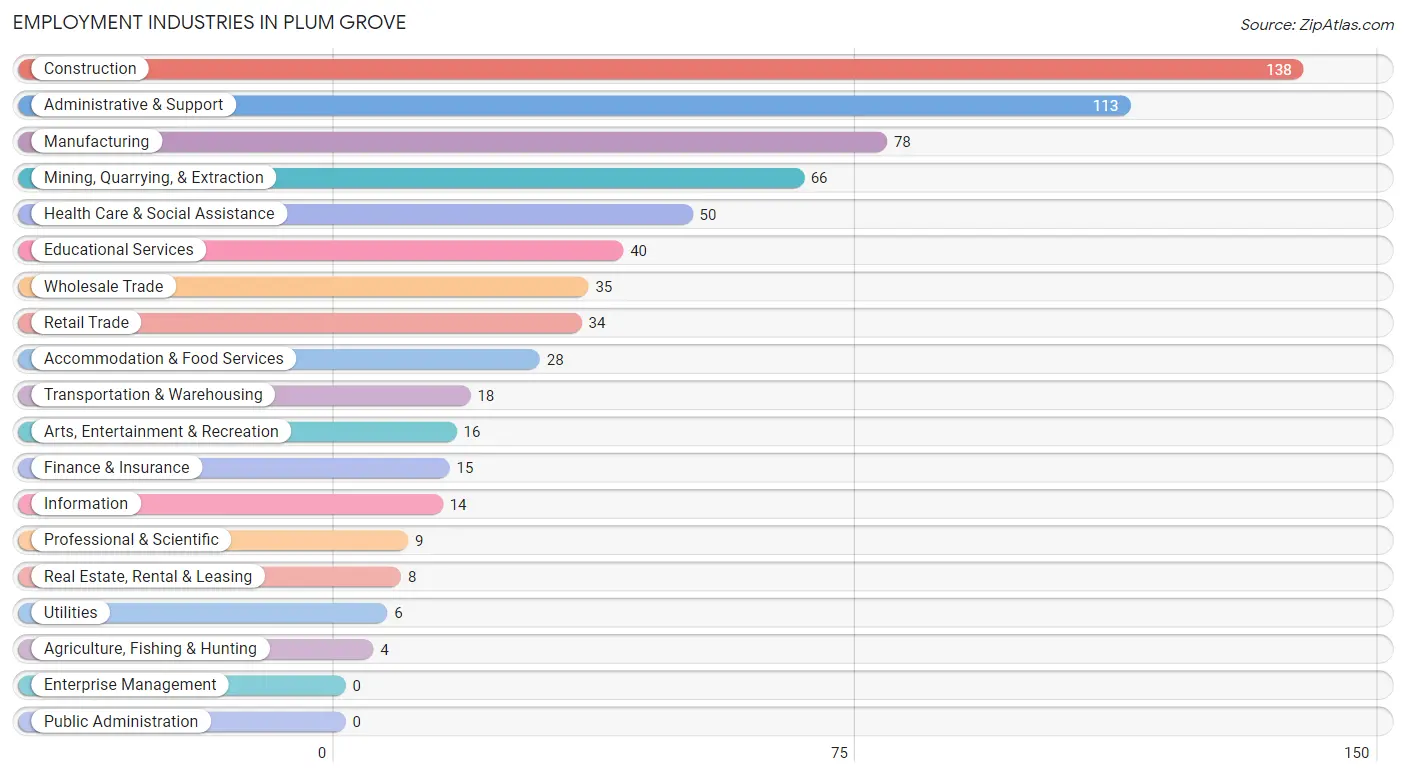
Employment Industries in Plum Grove
The major employment industries in Plum Grove include Construction (138 | 18.9%), Administrative & Support (113 | 15.4%), Manufacturing (78 | 10.7%), Mining, Quarrying, & Extraction (66 | 9.0%), and Health Care & Social Assistance (50 | 6.8%).
Employment Industries by Sex in Plum Grove
The Plum Grove industries that see more men than women are Agriculture, Fishing & Hunting (100.0%), Manufacturing (100.0%), and Transportation & Warehousing (100.0%), whereas the industries that tend to have a higher number of women are Mining, Quarrying, & Extraction (100.0%), Real Estate, Rental & Leasing (100.0%), and Professional & Scientific (100.0%).
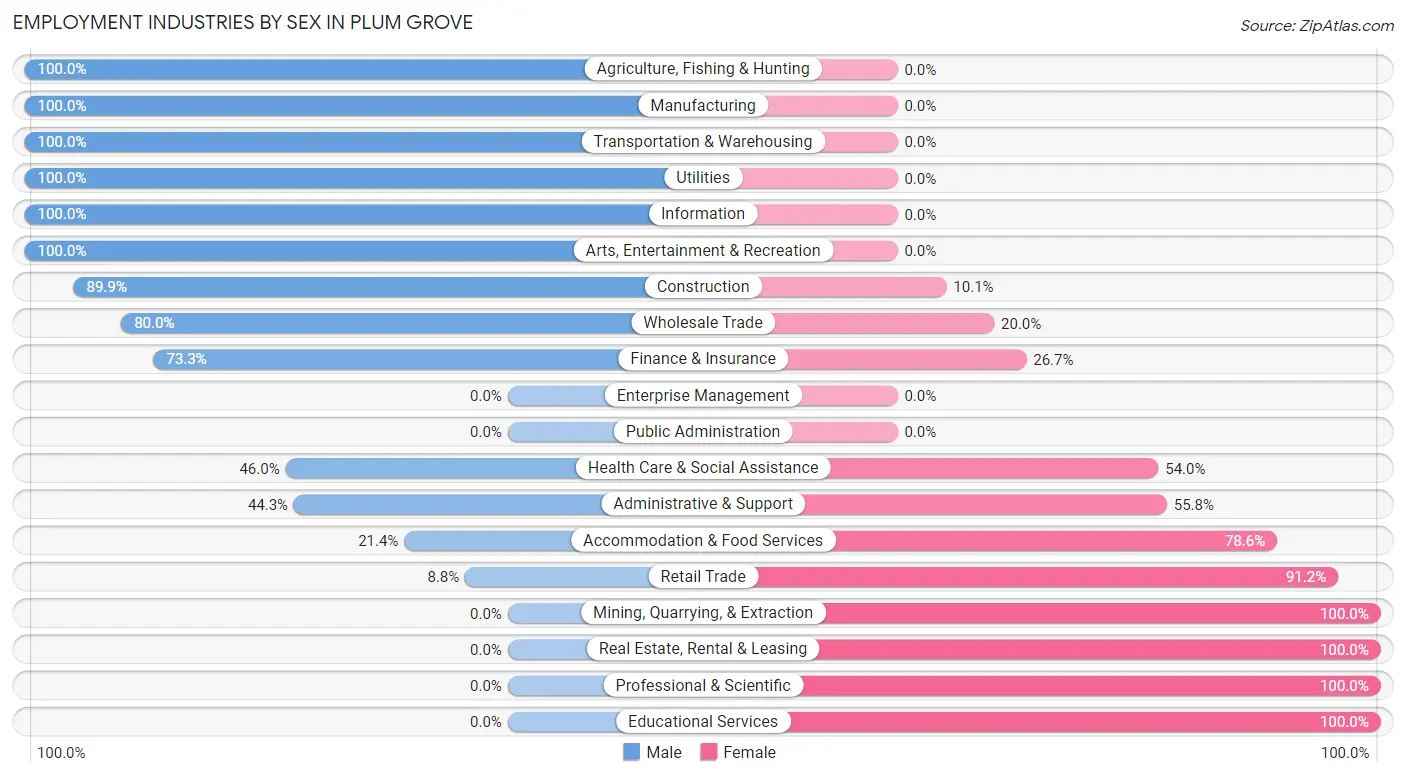
| Industry | Male | Female |
| Agriculture, Fishing & Hunting | 4 (100.0%) | 0 (0.0%) |
| Mining, Quarrying, & Extraction | 0 (0.0%) | 66 (100.0%) |
| Construction | 124 (89.9%) | 14 (10.1%) |
| Manufacturing | 78 (100.0%) | 0 (0.0%) |
| Wholesale Trade | 28 (80.0%) | 7 (20.0%) |
| Retail Trade | 3 (8.8%) | 31 (91.2%) |
| Transportation & Warehousing | 18 (100.0%) | 0 (0.0%) |
| Utilities | 6 (100.0%) | 0 (0.0%) |
| Information | 14 (100.0%) | 0 (0.0%) |
| Finance & Insurance | 11 (73.3%) | 4 (26.7%) |
| Real Estate, Rental & Leasing | 0 (0.0%) | 8 (100.0%) |
| Professional & Scientific | 0 (0.0%) | 9 (100.0%) |
| Enterprise Management | 0 (0.0%) | 0 (0.0%) |
| Administrative & Support | 50 (44.3%) | 63 (55.7%) |
| Educational Services | 0 (0.0%) | 40 (100.0%) |
| Health Care & Social Assistance | 23 (46.0%) | 27 (54.0%) |
| Arts, Entertainment & Recreation | 16 (100.0%) | 0 (0.0%) |
| Accommodation & Food Services | 6 (21.4%) | 22 (78.6%) |
| Public Administration | 0 (0.0%) | 0 (0.0%) |
| Total | 441 (60.3%) | 291 (39.8%) |
Education in Plum Grove
School Enrollment in Plum Grove
The most common levels of schooling among the 441 students in Plum Grove are elementary school (164 | 37.2%), high school (84 | 19.1%), and middle school (74 | 16.8%).
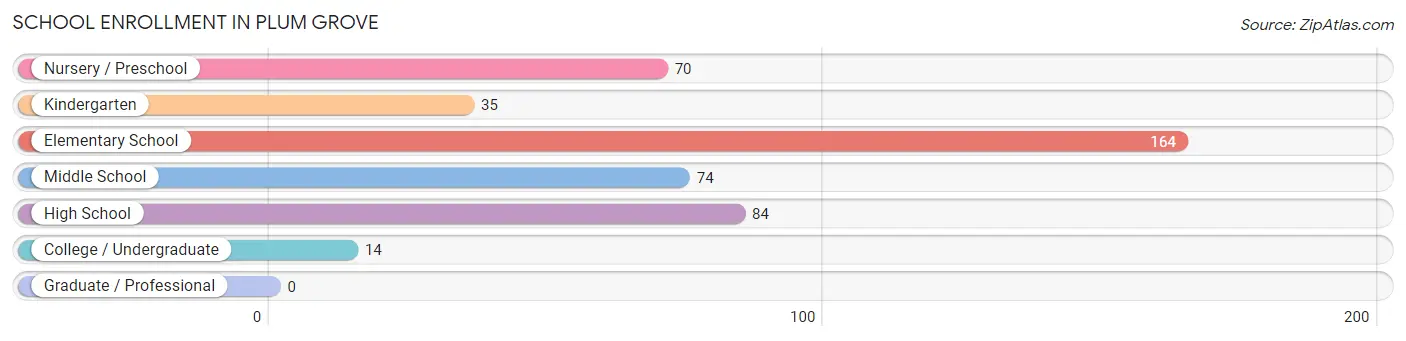
| School Level | # Students | % Students |
| Nursery / Preschool | 70 | 15.9% |
| Kindergarten | 35 | 7.9% |
| Elementary School | 164 | 37.2% |
| Middle School | 74 | 16.8% |
| High School | 84 | 19.1% |
| College / Undergraduate | 14 | 3.2% |
| Graduate / Professional | 0 | 0.0% |
| Total | 441 | 100.0% |
School Enrollment by Age by Funding Source in Plum Grove
Out of a total of 441 students who are enrolled in schools in Plum Grove, 80 (18.1%) attend a private institution, while the remaining 361 (81.9%) are enrolled in public schools. The age group of 20 to 24 year olds has the highest likelihood of being enrolled in private schools, with 6 (42.9% in the age bracket) enrolled. Conversely, the age group of 10 to 14 year olds has the lowest likelihood of being enrolled in a private school, with 74 (100.0% in the age bracket) attending a public institution.
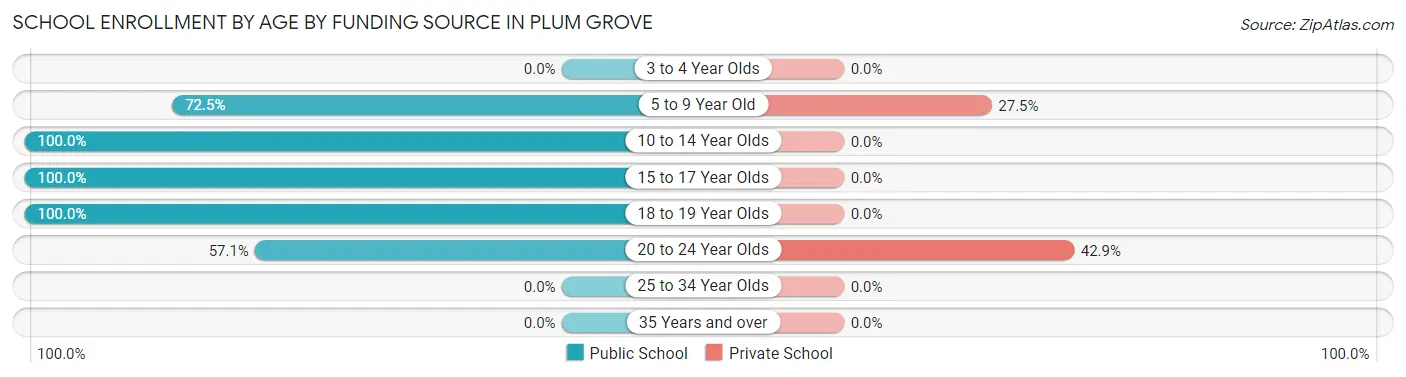
| Age Bracket | Public School | Private School |
| 3 to 4 Year Olds | 0 (0.0%) | 0 (0.0%) |
| 5 to 9 Year Old | 195 (72.5%) | 74 (27.5%) |
| 10 to 14 Year Olds | 74 (100.0%) | 0 (0.0%) |
| 15 to 17 Year Olds | 78 (100.0%) | 0 (0.0%) |
| 18 to 19 Year Olds | 6 (100.0%) | 0 (0.0%) |
| 20 to 24 Year Olds | 8 (57.1%) | 6 (42.9%) |
| 25 to 34 Year Olds | 0 (0.0%) | 0 (0.0%) |
| 35 Years and over | 0 (0.0%) | 0 (0.0%) |
| Total | 361 (81.9%) | 80 (18.1%) |
Educational Attainment by Field of Study in Plum Grove
Business (72 | 92.3%), computers & mathematics (4 | 5.1%), and multidisciplinary studies (2 | 2.6%) are the most common fields of study among 78 individuals in Plum Grove who have obtained a bachelor's degree or higher.
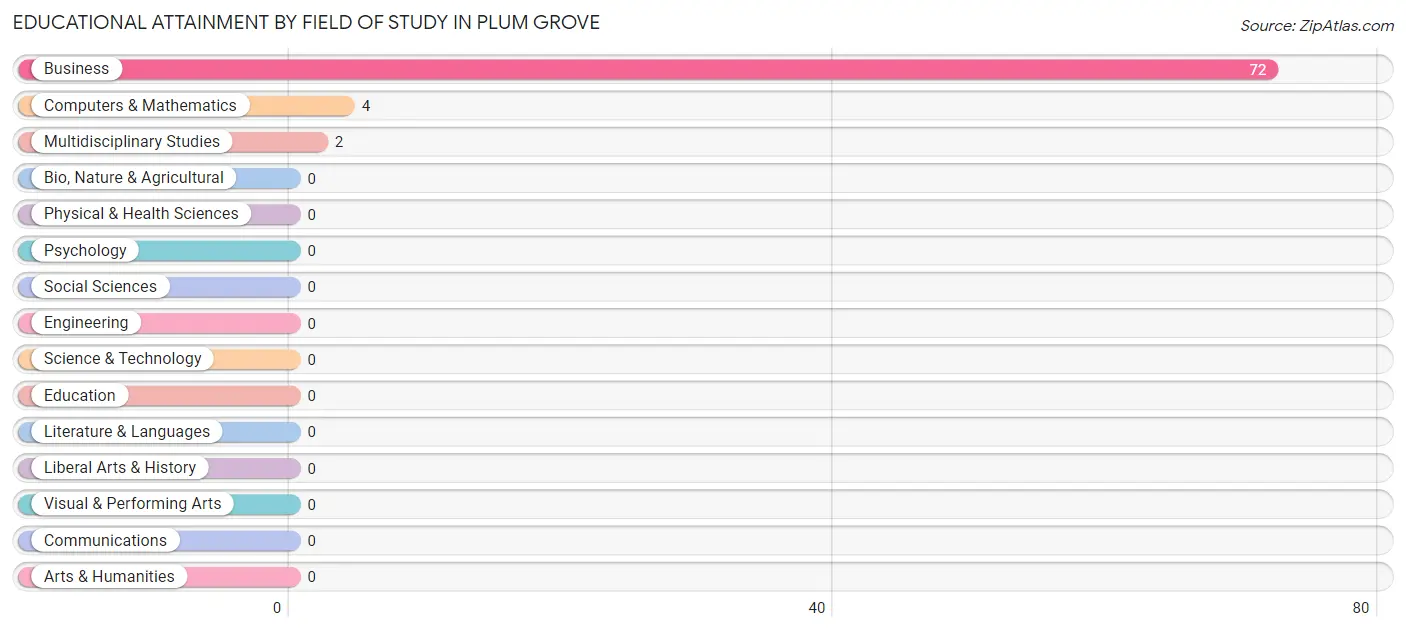
| Field of Study | # Graduates | % Graduates |
| Computers & Mathematics | 4 | 5.1% |
| Bio, Nature & Agricultural | 0 | 0.0% |
| Physical & Health Sciences | 0 | 0.0% |
| Psychology | 0 | 0.0% |
| Social Sciences | 0 | 0.0% |
| Engineering | 0 | 0.0% |
| Multidisciplinary Studies | 2 | 2.6% |
| Science & Technology | 0 | 0.0% |
| Business | 72 | 92.3% |
| Education | 0 | 0.0% |
| Literature & Languages | 0 | 0.0% |
| Liberal Arts & History | 0 | 0.0% |
| Visual & Performing Arts | 0 | 0.0% |
| Communications | 0 | 0.0% |
| Arts & Humanities | 0 | 0.0% |
| Total | 78 | 100.0% |
Transportation & Commute in Plum Grove
Vehicle Availability by Sex in Plum Grove
The most prevalent vehicle ownership categories in Plum Grove are males with 2 vehicles (177, accounting for 40.1%) and females with 2 vehicles (109, making up 64.8%).
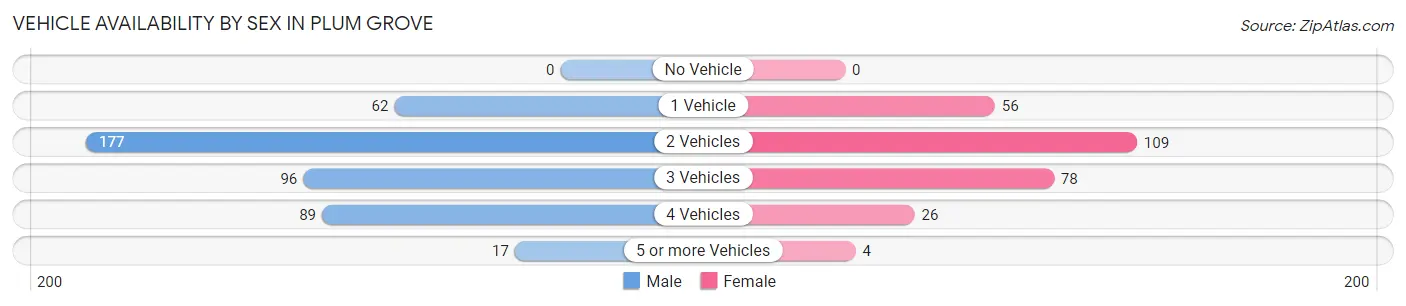
| Vehicles Available | Male | Female |
| No Vehicle | 0 (0.0%) | 0 (0.0%) |
| 1 Vehicle | 62 (14.1%) | 56 (20.5%) |
| 2 Vehicles | 177 (40.1%) | 109 (39.9%) |
| 3 Vehicles | 96 (21.8%) | 78 (28.6%) |
| 4 Vehicles | 89 (20.2%) | 26 (9.5%) |
| 5 or more Vehicles | 17 (3.8%) | 4 (1.5%) |
| Total | 441 (100.0%) | 273 (100.0%) |
Commute Time in Plum Grove
The most frequently occuring commute durations in Plum Grove are 60 to 89 minutes (232 commuters, 34.8%), 45 to 59 minutes (118 commuters, 17.7%), and 40 to 44 minutes (108 commuters, 16.2%).
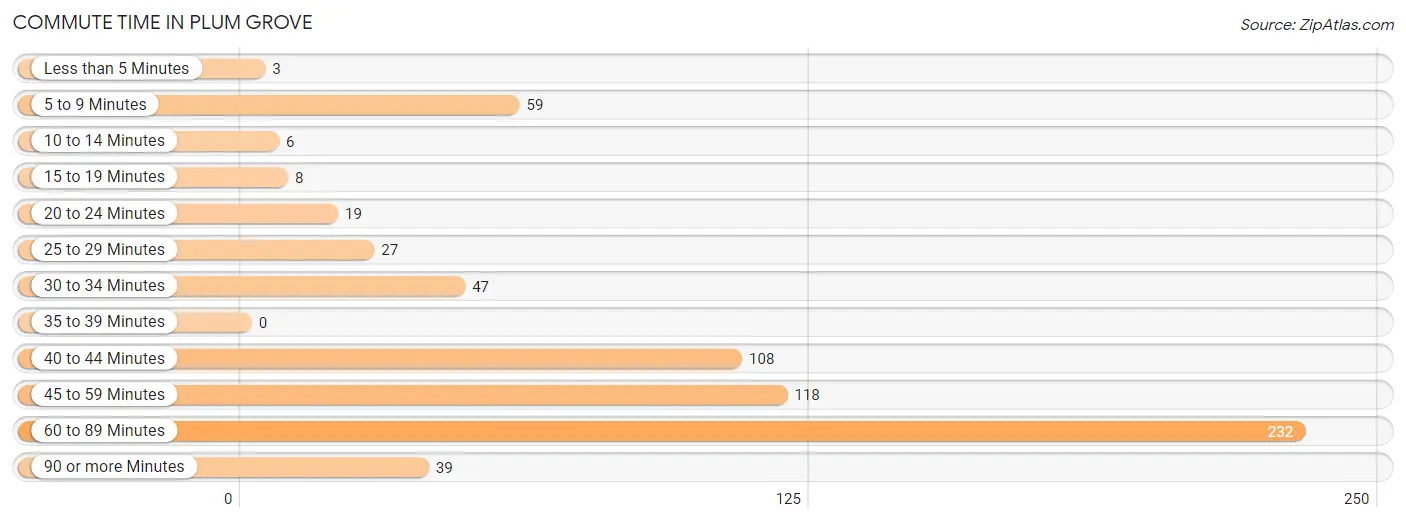
| Commute Time | # Commuters | % Commuters |
| Less than 5 Minutes | 3 | 0.4% |
| 5 to 9 Minutes | 59 | 8.9% |
| 10 to 14 Minutes | 6 | 0.9% |
| 15 to 19 Minutes | 8 | 1.2% |
| 20 to 24 Minutes | 19 | 2.9% |
| 25 to 29 Minutes | 27 | 4.1% |
| 30 to 34 Minutes | 47 | 7.1% |
| 35 to 39 Minutes | 0 | 0.0% |
| 40 to 44 Minutes | 108 | 16.2% |
| 45 to 59 Minutes | 118 | 17.7% |
| 60 to 89 Minutes | 232 | 34.8% |
| 90 or more Minutes | 39 | 5.9% |
Commute Time by Sex in Plum Grove
The most common commute times in Plum Grove are 60 to 89 minutes (217 commuters, 53.2%) for males and 40 to 44 minutes (90 commuters, 34.9%) for females.
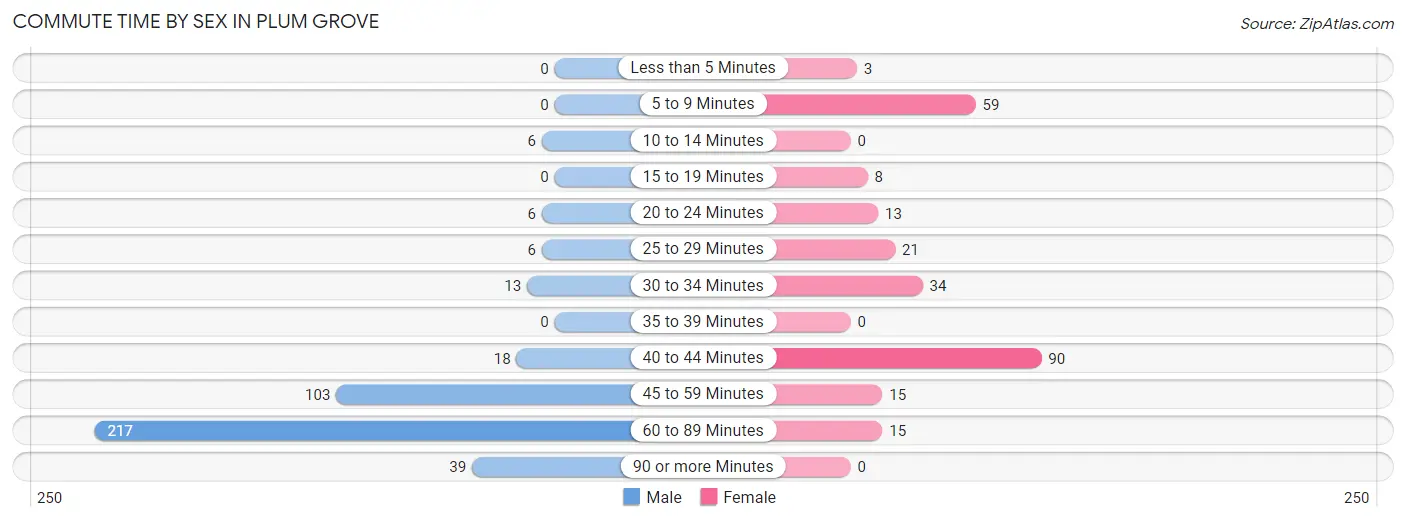
| Commute Time | Male | Female |
| Less than 5 Minutes | 0 (0.0%) | 3 (1.2%) |
| 5 to 9 Minutes | 0 (0.0%) | 59 (22.9%) |
| 10 to 14 Minutes | 6 (1.5%) | 0 (0.0%) |
| 15 to 19 Minutes | 0 (0.0%) | 8 (3.1%) |
| 20 to 24 Minutes | 6 (1.5%) | 13 (5.0%) |
| 25 to 29 Minutes | 6 (1.5%) | 21 (8.1%) |
| 30 to 34 Minutes | 13 (3.2%) | 34 (13.2%) |
| 35 to 39 Minutes | 0 (0.0%) | 0 (0.0%) |
| 40 to 44 Minutes | 18 (4.4%) | 90 (34.9%) |
| 45 to 59 Minutes | 103 (25.3%) | 15 (5.8%) |
| 60 to 89 Minutes | 217 (53.2%) | 15 (5.8%) |
| 90 or more Minutes | 39 (9.6%) | 0 (0.0%) |
Time of Departure to Work by Sex in Plum Grove
The most frequent times of departure to work in Plum Grove are 12:00 AM to 4:59 AM (105, 25.7%) for males and 5:00 AM to 5:29 AM (82, 31.8%) for females.
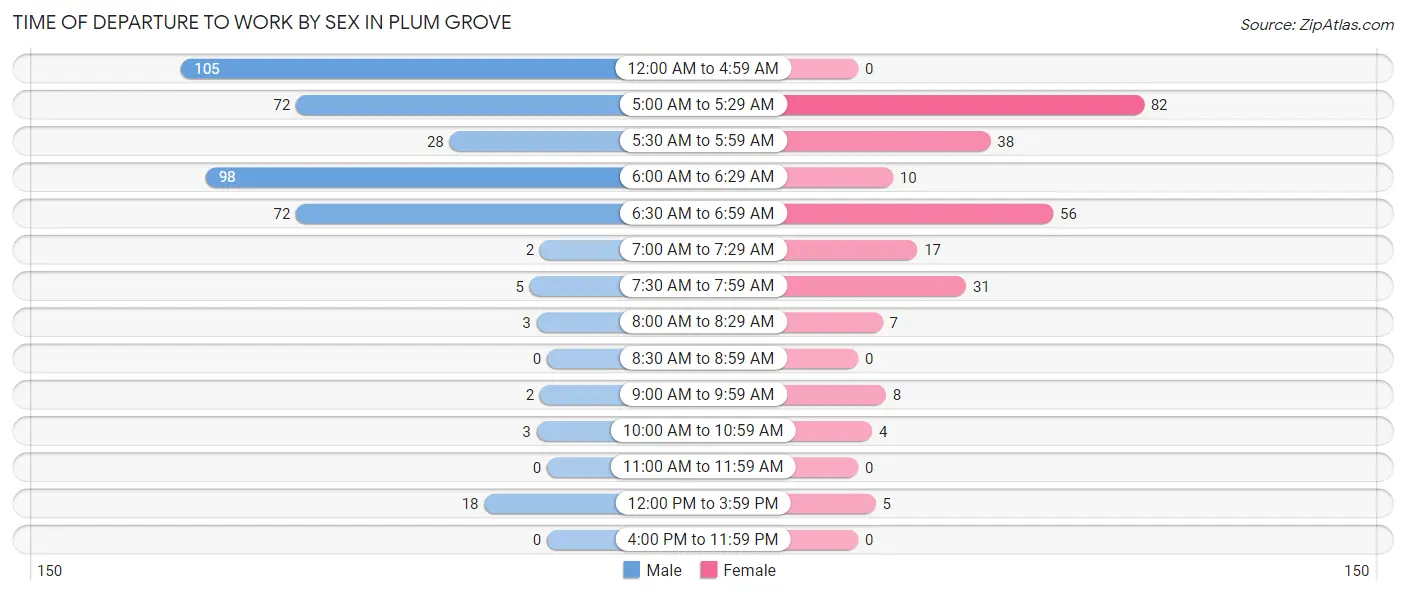
| Time of Departure | Male | Female |
| 12:00 AM to 4:59 AM | 105 (25.7%) | 0 (0.0%) |
| 5:00 AM to 5:29 AM | 72 (17.6%) | 82 (31.8%) |
| 5:30 AM to 5:59 AM | 28 (6.9%) | 38 (14.7%) |
| 6:00 AM to 6:29 AM | 98 (24.0%) | 10 (3.9%) |
| 6:30 AM to 6:59 AM | 72 (17.6%) | 56 (21.7%) |
| 7:00 AM to 7:29 AM | 2 (0.5%) | 17 (6.6%) |
| 7:30 AM to 7:59 AM | 5 (1.2%) | 31 (12.0%) |
| 8:00 AM to 8:29 AM | 3 (0.7%) | 7 (2.7%) |
| 8:30 AM to 8:59 AM | 0 (0.0%) | 0 (0.0%) |
| 9:00 AM to 9:59 AM | 2 (0.5%) | 8 (3.1%) |
| 10:00 AM to 10:59 AM | 3 (0.7%) | 4 (1.5%) |
| 11:00 AM to 11:59 AM | 0 (0.0%) | 0 (0.0%) |
| 12:00 PM to 3:59 PM | 18 (4.4%) | 5 (1.9%) |
| 4:00 PM to 11:59 PM | 0 (0.0%) | 0 (0.0%) |
| Total | 408 (100.0%) | 258 (100.0%) |
Housing Occupancy in Plum Grove
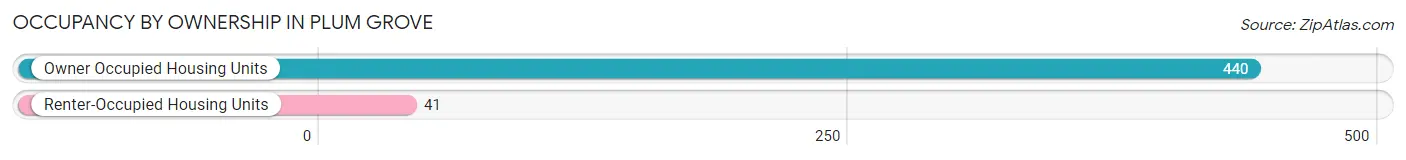
Occupancy by Ownership in Plum Grove
Of the total 481 dwellings in Plum Grove, owner-occupied units account for 440 (91.5%), while renter-occupied units make up 41 (8.5%).
| Occupancy | # Housing Units | % Housing Units |
| Owner Occupied Housing Units | 440 | 91.5% |
| Renter-Occupied Housing Units | 41 | 8.5% |
| Total Occupied Housing Units | 481 | 100.0% |
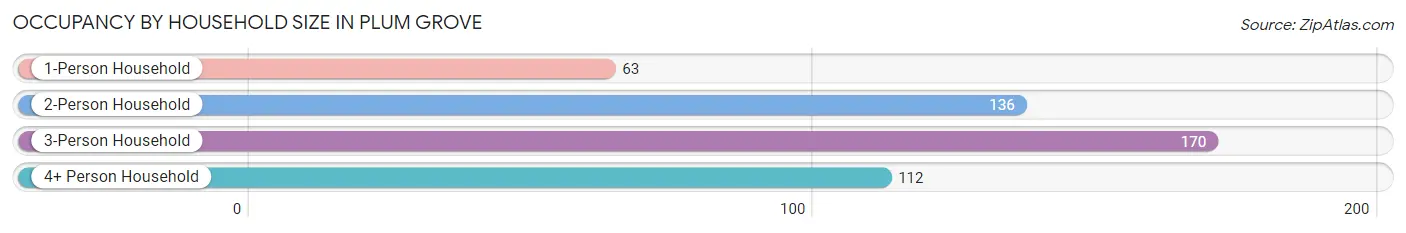
Occupancy by Household Size in Plum Grove
| Household Size | # Housing Units | % Housing Units |
| 1-Person Household | 63 | 13.1% |
| 2-Person Household | 136 | 28.3% |
| 3-Person Household | 170 | 35.3% |
| 4+ Person Household | 112 | 23.3% |
| Total Housing Units | 481 | 100.0% |
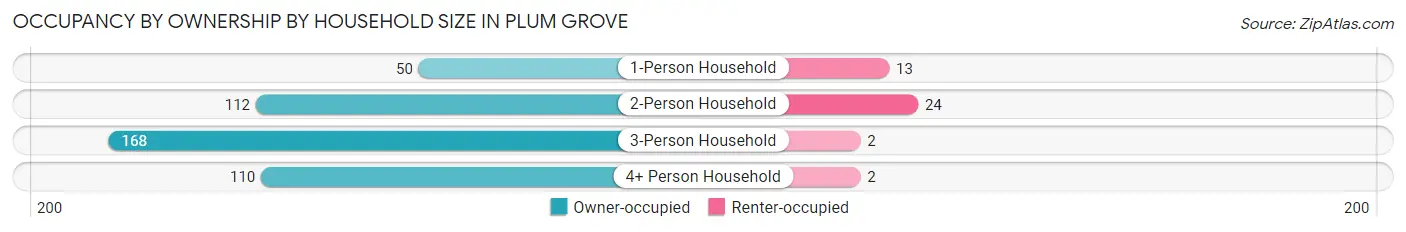
Occupancy by Ownership by Household Size in Plum Grove
| Household Size | Owner-occupied | Renter-occupied |
| 1-Person Household | 50 (79.4%) | 13 (20.6%) |
| 2-Person Household | 112 (82.4%) | 24 (17.6%) |
| 3-Person Household | 168 (98.8%) | 2 (1.2%) |
| 4+ Person Household | 110 (98.2%) | 2 (1.8%) |
| Total Housing Units | 440 (91.5%) | 41 (8.5%) |
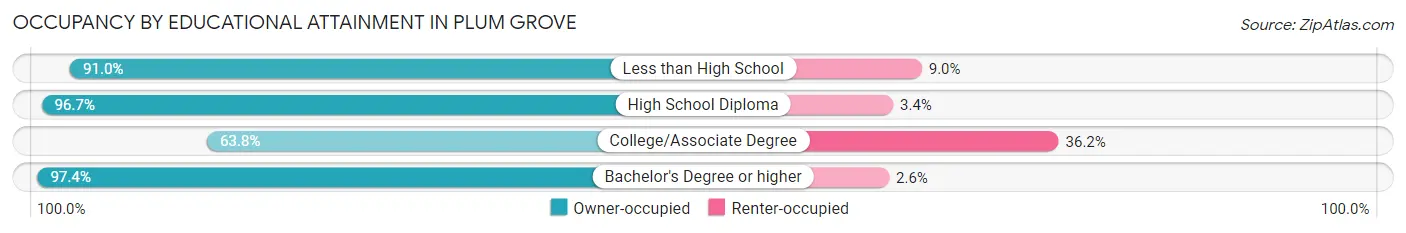
Occupancy by Educational Attainment in Plum Grove
| Household Size | Owner-occupied | Renter-occupied |
| Less than High School | 161 (91.0%) | 16 (9.0%) |
| High School Diploma | 173 (96.7%) | 6 (3.4%) |
| College/Associate Degree | 30 (63.8%) | 17 (36.2%) |
| Bachelor's Degree or higher | 76 (97.4%) | 2 (2.6%) |
Occupancy by Age of Householder in Plum Grove
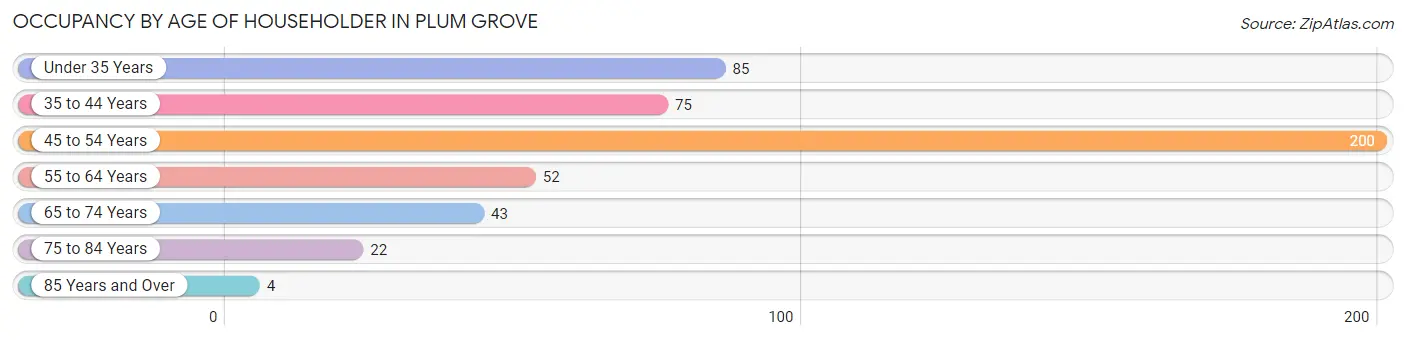
| Age Bracket | # Households | % Households |
| Under 35 Years | 85 | 17.7% |
| 35 to 44 Years | 75 | 15.6% |
| 45 to 54 Years | 200 | 41.6% |
| 55 to 64 Years | 52 | 10.8% |
| 65 to 74 Years | 43 | 8.9% |
| 75 to 84 Years | 22 | 4.6% |
| 85 Years and Over | 4 | 0.8% |
| Total | 481 | 100.0% |
Housing Finances in Plum Grove
Median Income by Occupancy in Plum Grove
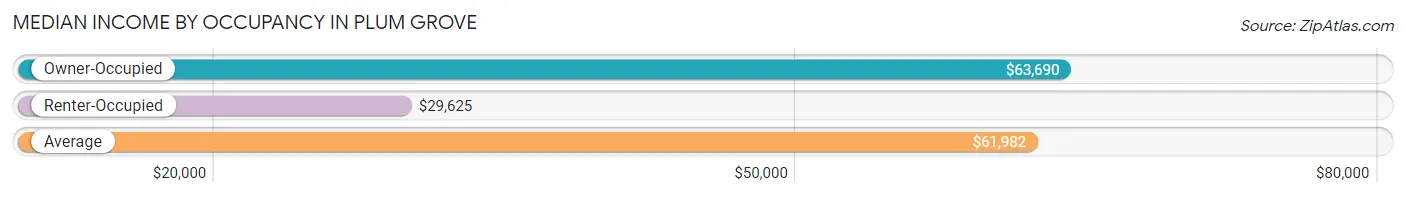
| Occupancy Type | # Households | Median Income |
| Owner-Occupied | 440 (91.5%) | $63,690 |
| Renter-Occupied | 41 (8.5%) | $29,625 |
| Average | 481 (100.0%) | $61,982 |
Occupancy by Householder Income Bracket in Plum Grove
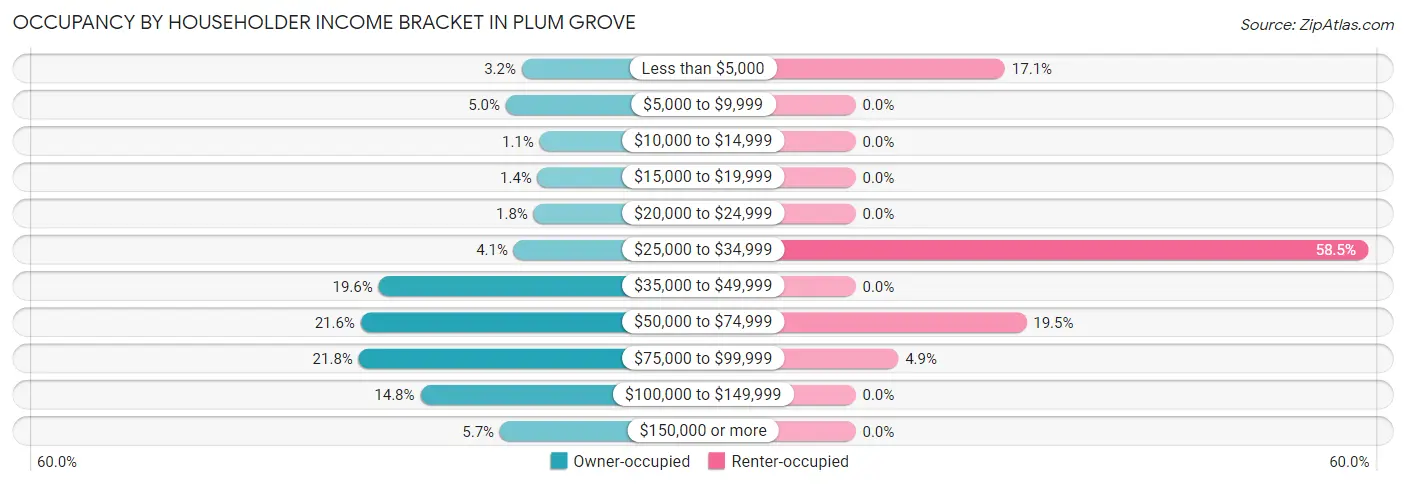
| Income Bracket | Owner-occupied | Renter-occupied |
| Less than $5,000 | 14 (3.2%) | 7 (17.1%) |
| $5,000 to $9,999 | 22 (5.0%) | 0 (0.0%) |
| $10,000 to $14,999 | 5 (1.1%) | 0 (0.0%) |
| $15,000 to $19,999 | 6 (1.4%) | 0 (0.0%) |
| $20,000 to $24,999 | 8 (1.8%) | 0 (0.0%) |
| $25,000 to $34,999 | 18 (4.1%) | 24 (58.5%) |
| $35,000 to $49,999 | 86 (19.6%) | 0 (0.0%) |
| $50,000 to $74,999 | 95 (21.6%) | 8 (19.5%) |
| $75,000 to $99,999 | 96 (21.8%) | 2 (4.9%) |
| $100,000 to $149,999 | 65 (14.8%) | 0 (0.0%) |
| $150,000 or more | 25 (5.7%) | 0 (0.0%) |
| Total | 440 (100.0%) | 41 (100.0%) |
Monthly Housing Cost Tiers in Plum Grove
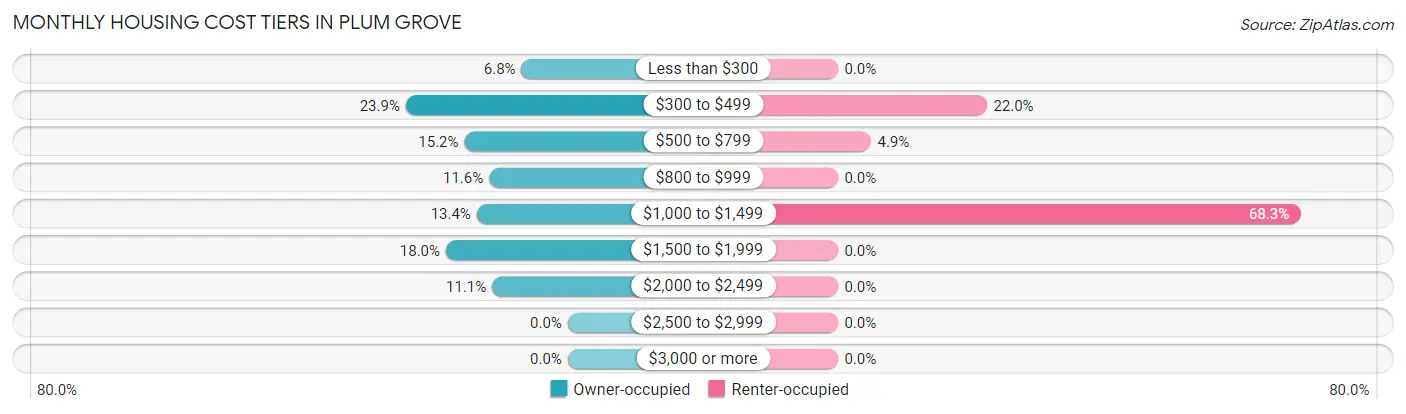
| Monthly Cost | Owner-occupied | Renter-occupied |
| Less than $300 | 30 (6.8%) | 0 (0.0%) |
| $300 to $499 | 105 (23.9%) | 9 (22.0%) |
| $500 to $799 | 67 (15.2%) | 2 (4.9%) |
| $800 to $999 | 51 (11.6%) | 0 (0.0%) |
| $1,000 to $1,499 | 59 (13.4%) | 28 (68.3%) |
| $1,500 to $1,999 | 79 (17.9%) | 0 (0.0%) |
| $2,000 to $2,499 | 49 (11.1%) | 0 (0.0%) |
| $2,500 to $2,999 | 0 (0.0%) | 0 (0.0%) |
| $3,000 or more | 0 (0.0%) | 0 (0.0%) |
| Total | 440 (100.0%) | 41 (100.0%) |
Physical Housing Characteristics in Plum Grove
Housing Structures in Plum Grove
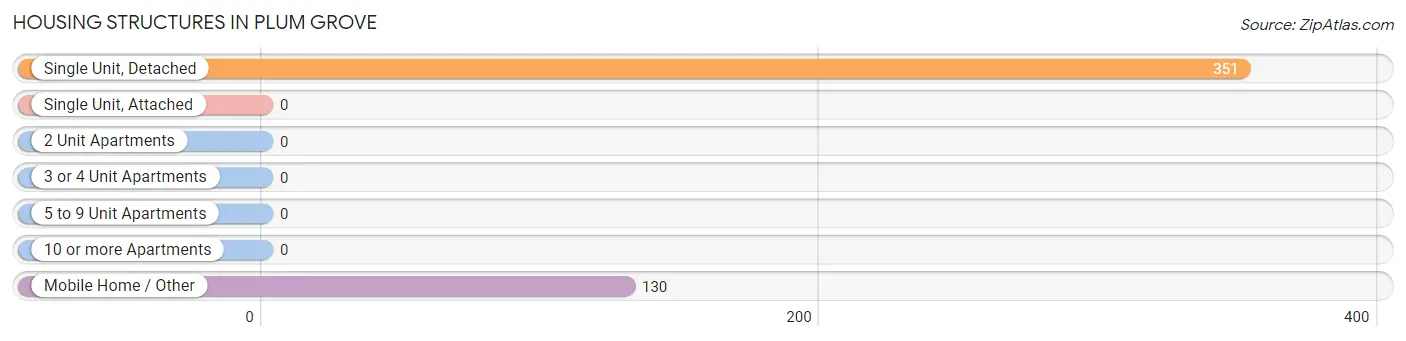
| Structure Type | # Housing Units | % Housing Units |
| Single Unit, Detached | 351 | 73.0% |
| Single Unit, Attached | 0 | 0.0% |
| 2 Unit Apartments | 0 | 0.0% |
| 3 or 4 Unit Apartments | 0 | 0.0% |
| 5 to 9 Unit Apartments | 0 | 0.0% |
| 10 or more Apartments | 0 | 0.0% |
| Mobile Home / Other | 130 | 27.0% |
| Total | 481 | 100.0% |
Housing Structures by Occupancy in Plum Grove
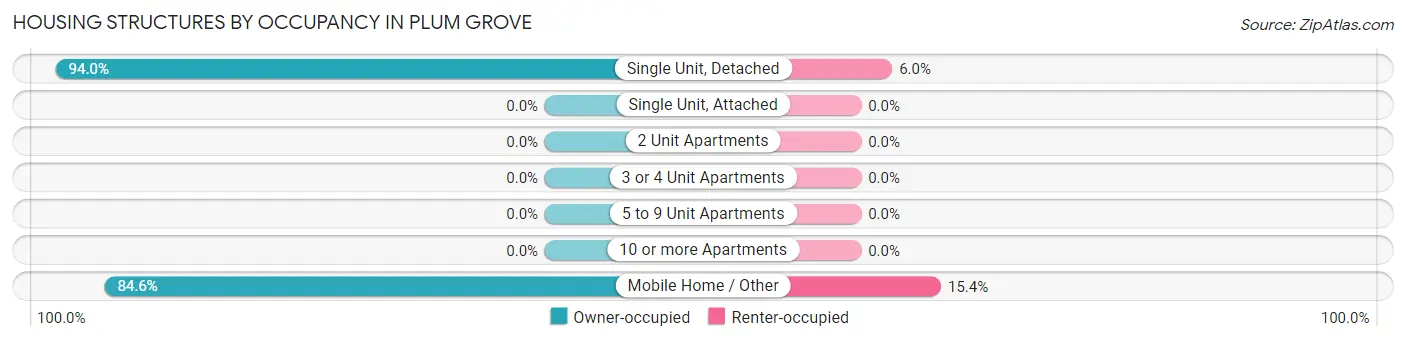
| Structure Type | Owner-occupied | Renter-occupied |
| Single Unit, Detached | 330 (94.0%) | 21 (6.0%) |
| Single Unit, Attached | 0 (0.0%) | 0 (0.0%) |
| 2 Unit Apartments | 0 (0.0%) | 0 (0.0%) |
| 3 or 4 Unit Apartments | 0 (0.0%) | 0 (0.0%) |
| 5 to 9 Unit Apartments | 0 (0.0%) | 0 (0.0%) |
| 10 or more Apartments | 0 (0.0%) | 0 (0.0%) |
| Mobile Home / Other | 110 (84.6%) | 20 (15.4%) |
| Total | 440 (91.5%) | 41 (8.5%) |
Housing Structures by Number of Rooms in Plum Grove
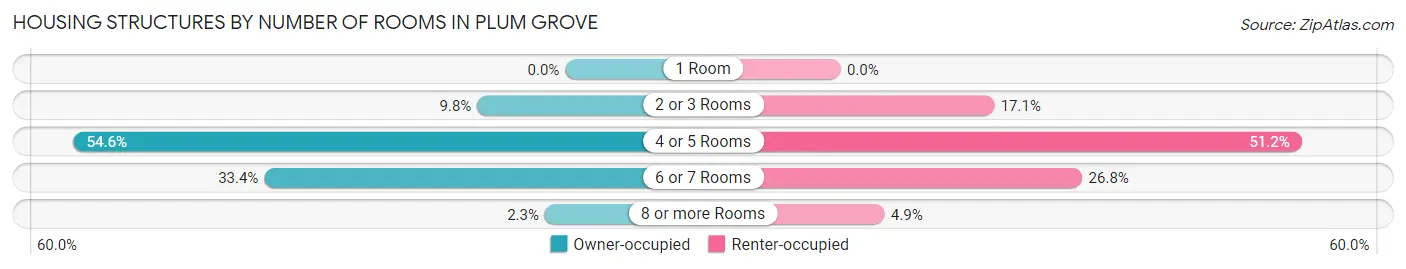
| Number of Rooms | Owner-occupied | Renter-occupied |
| 1 Room | 0 (0.0%) | 0 (0.0%) |
| 2 or 3 Rooms | 43 (9.8%) | 7 (17.1%) |
| 4 or 5 Rooms | 240 (54.5%) | 21 (51.2%) |
| 6 or 7 Rooms | 147 (33.4%) | 11 (26.8%) |
| 8 or more Rooms | 10 (2.3%) | 2 (4.9%) |
| Total | 440 (100.0%) | 41 (100.0%) |
Housing Structure by Heating Type in Plum Grove
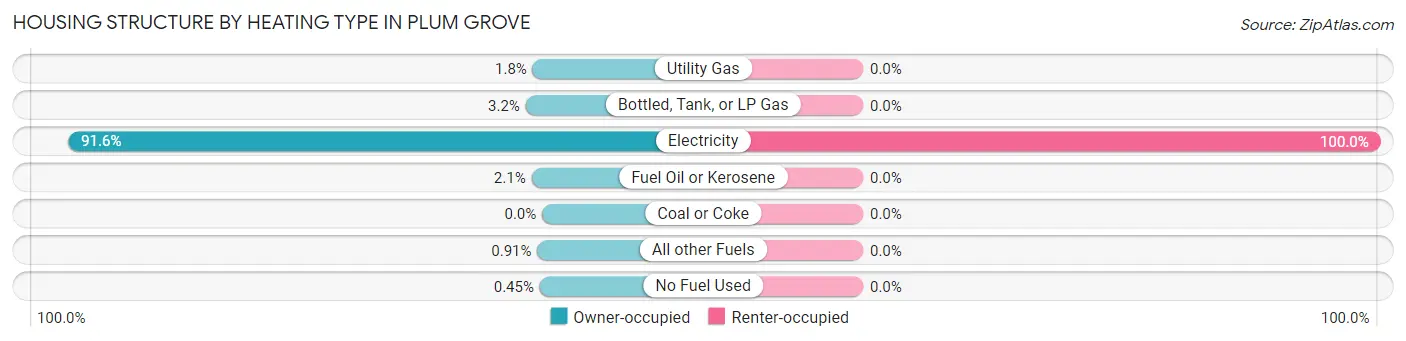
| Heating Type | Owner-occupied | Renter-occupied |
| Utility Gas | 8 (1.8%) | 0 (0.0%) |
| Bottled, Tank, or LP Gas | 14 (3.2%) | 0 (0.0%) |
| Electricity | 403 (91.6%) | 41 (100.0%) |
| Fuel Oil or Kerosene | 9 (2.1%) | 0 (0.0%) |
| Coal or Coke | 0 (0.0%) | 0 (0.0%) |
| All other Fuels | 4 (0.9%) | 0 (0.0%) |
| No Fuel Used | 2 (0.4%) | 0 (0.0%) |
| Total | 440 (100.0%) | 41 (100.0%) |
Household Vehicle Usage in Plum Grove
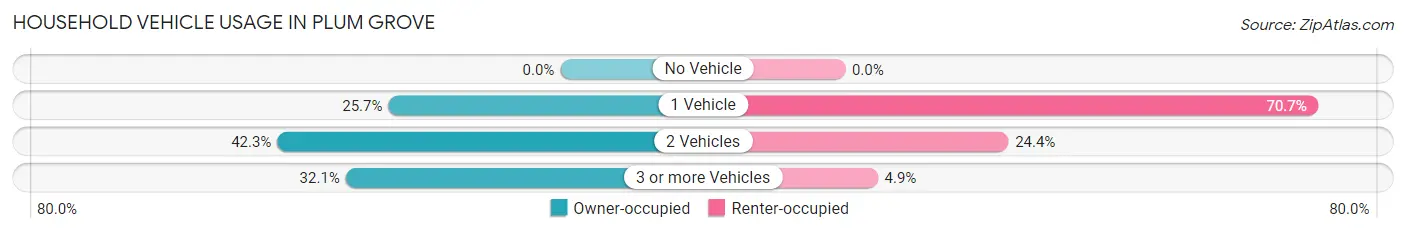
| Vehicles per Household | Owner-occupied | Renter-occupied |
| No Vehicle | 0 (0.0%) | 0 (0.0%) |
| 1 Vehicle | 113 (25.7%) | 29 (70.7%) |
| 2 Vehicles | 186 (42.3%) | 10 (24.4%) |
| 3 or more Vehicles | 141 (32.1%) | 2 (4.9%) |
| Total | 440 (100.0%) | 41 (100.0%) |
Real Estate & Mortgages in Plum Grove
Real Estate and Mortgage Overview in Plum Grove
| Characteristic | Without Mortgage | With Mortgage |
| Housing Units | 194 | 246 |
| Median Property Value | $115,600 | $210,700 |
| Median Household Income | $48,056 | $25 |
| Monthly Housing Costs | $394 | $0 |
| Real Estate Taxes | $2,095 | $0 |
Property Value by Mortgage Status in Plum Grove
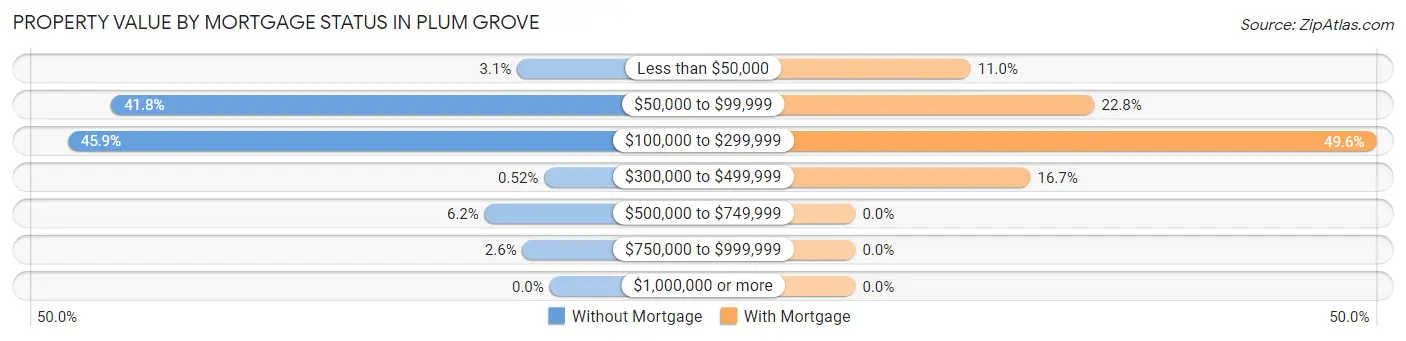
| Property Value | Without Mortgage | With Mortgage |
| Less than $50,000 | 6 (3.1%) | 27 (11.0%) |
| $50,000 to $99,999 | 81 (41.7%) | 56 (22.8%) |
| $100,000 to $299,999 | 89 (45.9%) | 122 (49.6%) |
| $300,000 to $499,999 | 1 (0.5%) | 41 (16.7%) |
| $500,000 to $749,999 | 12 (6.2%) | 0 (0.0%) |
| $750,000 to $999,999 | 5 (2.6%) | 0 (0.0%) |
| $1,000,000 or more | 0 (0.0%) | 0 (0.0%) |
| Total | 194 (100.0%) | 246 (100.0%) |
Household Income by Mortgage Status in Plum Grove
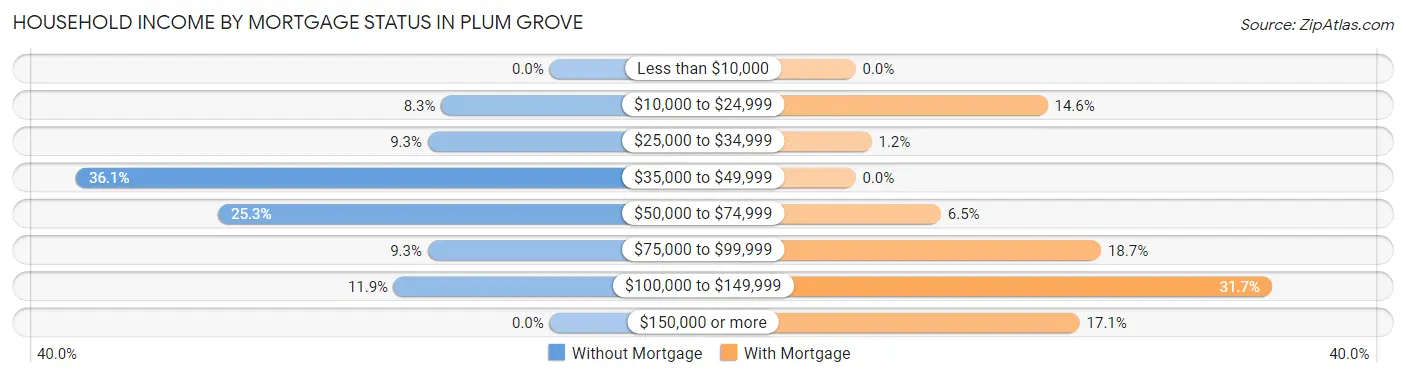
| Household Income | Without Mortgage | With Mortgage |
| Less than $10,000 | 0 (0.0%) | 0 (0.0%) |
| $10,000 to $24,999 | 16 (8.3%) | 36 (14.6%) |
| $25,000 to $34,999 | 18 (9.3%) | 3 (1.2%) |
| $35,000 to $49,999 | 70 (36.1%) | 0 (0.0%) |
| $50,000 to $74,999 | 49 (25.3%) | 16 (6.5%) |
| $75,000 to $99,999 | 18 (9.3%) | 46 (18.7%) |
| $100,000 to $149,999 | 23 (11.9%) | 78 (31.7%) |
| $150,000 or more | 0 (0.0%) | 42 (17.1%) |
| Total | 194 (100.0%) | 246 (100.0%) |
Property Value to Household Income Ratio in Plum Grove
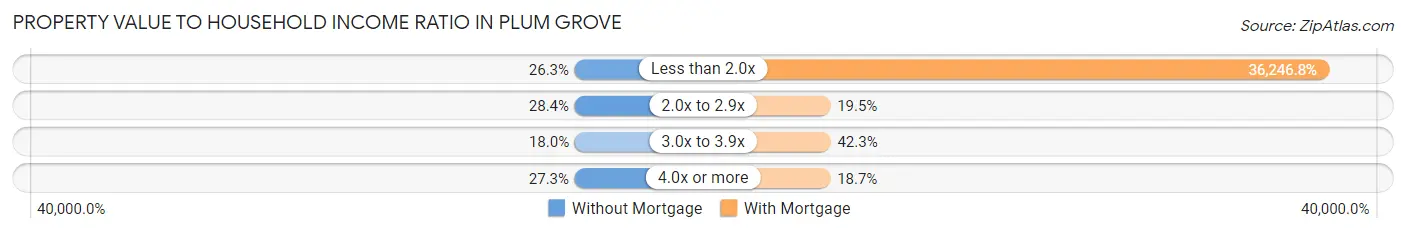
| Value-to-Income Ratio | Without Mortgage | With Mortgage |
| Less than 2.0x | 51 (26.3%) | 89,167 (36,246.7%) |
| 2.0x to 2.9x | 55 (28.3%) | 48 (19.5%) |
| 3.0x to 3.9x | 35 (18.0%) | 104 (42.3%) |
| 4.0x or more | 53 (27.3%) | 46 (18.7%) |
| Total | 194 (100.0%) | 246 (100.0%) |
Real Estate Taxes by Mortgage Status in Plum Grove
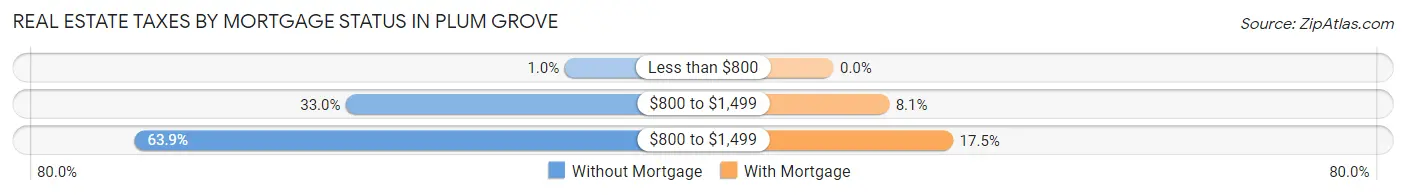
| Property Taxes | Without Mortgage | With Mortgage |
| Less than $800 | 2 (1.0%) | 0 (0.0%) |
| $800 to $1,499 | 64 (33.0%) | 20 (8.1%) |
| $800 to $1,499 | 124 (63.9%) | 43 (17.5%) |
| Total | 194 (100.0%) | 246 (100.0%) |
Health & Disability in Plum Grove
Health Insurance Coverage by Age in Plum Grove
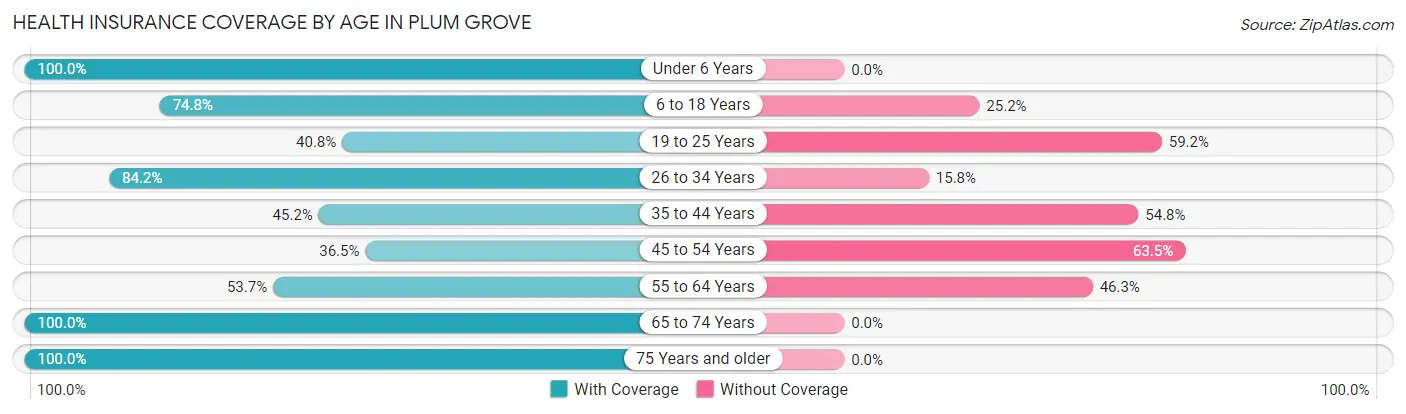
| Age Bracket | With Coverage | Without Coverage |
| Under 6 Years | 197 (100.0%) | 0 (0.0%) |
| 6 to 18 Years | 276 (74.8%) | 93 (25.2%) |
| 19 to 25 Years | 62 (40.8%) | 90 (59.2%) |
| 26 to 34 Years | 203 (84.2%) | 38 (15.8%) |
| 35 to 44 Years | 70 (45.2%) | 85 (54.8%) |
| 45 to 54 Years | 105 (36.5%) | 183 (63.5%) |
| 55 to 64 Years | 51 (53.7%) | 44 (46.3%) |
| 65 to 74 Years | 82 (100.0%) | 0 (0.0%) |
| 75 Years and older | 34 (100.0%) | 0 (0.0%) |
| Total | 1,080 (67.0%) | 533 (33.0%) |
Health Insurance Coverage by Citizenship Status in Plum Grove
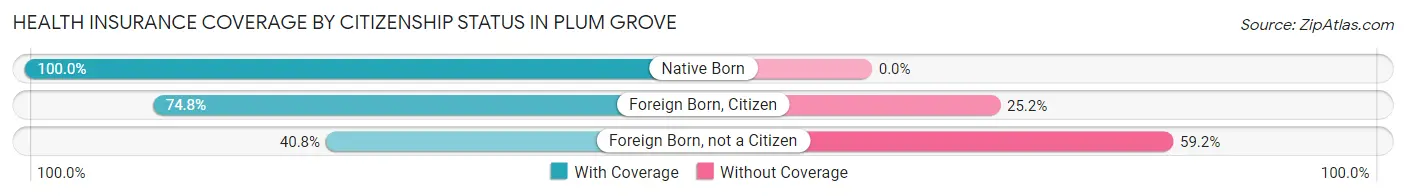
| Citizenship Status | With Coverage | Without Coverage |
| Native Born | 197 (100.0%) | 0 (0.0%) |
| Foreign Born, Citizen | 276 (74.8%) | 93 (25.2%) |
| Foreign Born, not a Citizen | 62 (40.8%) | 90 (59.2%) |
Health Insurance Coverage by Household Income in Plum Grove
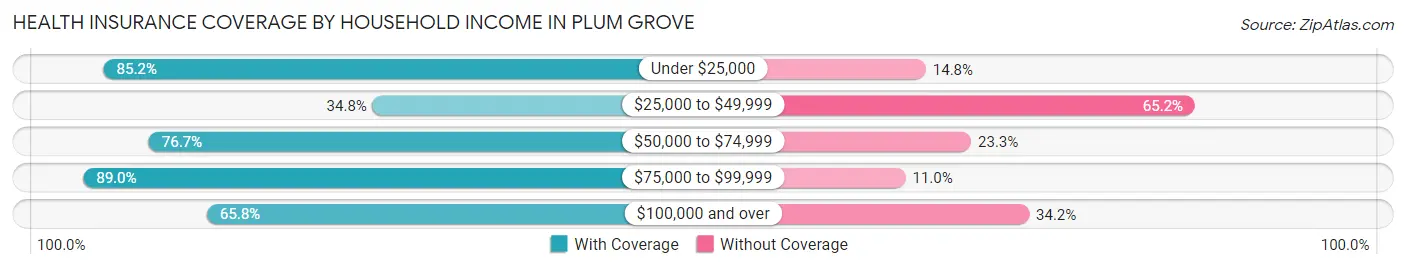
| Household Income | With Coverage | Without Coverage |
| Under $25,000 | 207 (85.2%) | 36 (14.8%) |
| $25,000 to $49,999 | 143 (34.8%) | 268 (65.2%) |
| $50,000 to $74,999 | 191 (76.7%) | 58 (23.3%) |
| $75,000 to $99,999 | 275 (89.0%) | 34 (11.0%) |
| $100,000 and over | 264 (65.8%) | 137 (34.2%) |
Public vs Private Health Insurance Coverage by Age in Plum Grove
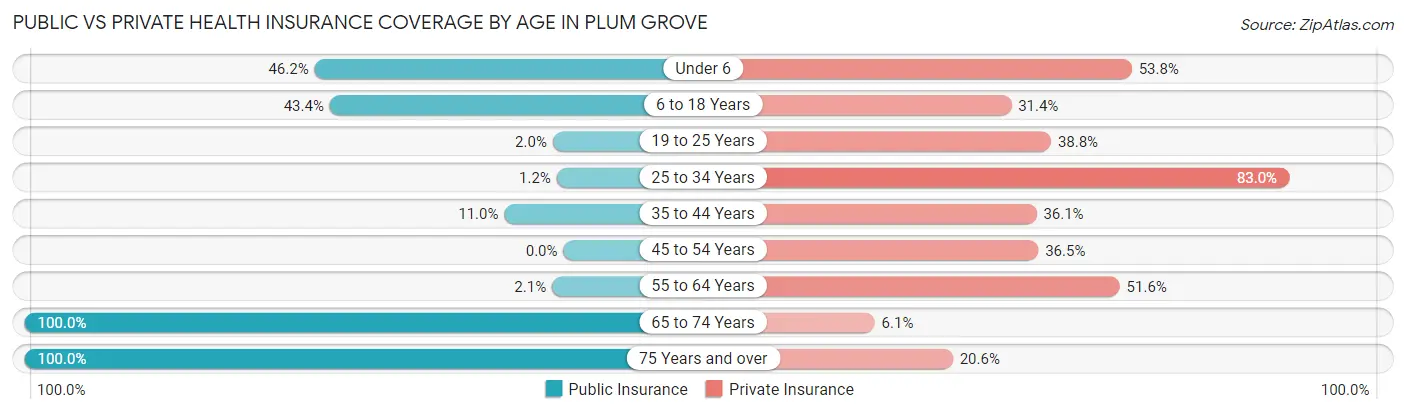
| Age Bracket | Public Insurance | Private Insurance |
| Under 6 | 91 (46.2%) | 106 (53.8%) |
| 6 to 18 Years | 160 (43.4%) | 116 (31.4%) |
| 19 to 25 Years | 3 (2.0%) | 59 (38.8%) |
| 25 to 34 Years | 3 (1.2%) | 200 (83.0%) |
| 35 to 44 Years | 17 (11.0%) | 56 (36.1%) |
| 45 to 54 Years | 0 (0.0%) | 105 (36.5%) |
| 55 to 64 Years | 2 (2.1%) | 49 (51.6%) |
| 65 to 74 Years | 82 (100.0%) | 5 (6.1%) |
| 75 Years and over | 34 (100.0%) | 7 (20.6%) |
| Total | 392 (24.3%) | 703 (43.6%) |
Disability Status by Sex by Age in Plum Grove
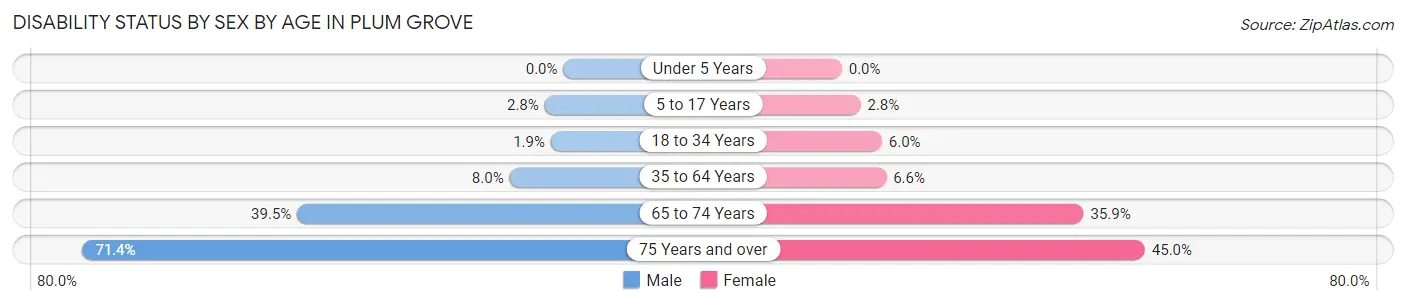
| Age Bracket | Male | Female |
| Under 5 Years | 0 (0.0%) | 0 (0.0%) |
| 5 to 17 Years | 4 (2.8%) | 9 (2.8%) |
| 18 to 34 Years | 4 (1.9%) | 11 (5.9%) |
| 35 to 64 Years | 20 (8.0%) | 19 (6.6%) |
| 65 to 74 Years | 17 (39.5%) | 14 (35.9%) |
| 75 Years and over | 10 (71.4%) | 9 (45.0%) |
Disability Class by Sex by Age in Plum Grove
Disability Class: Hearing Difficulty
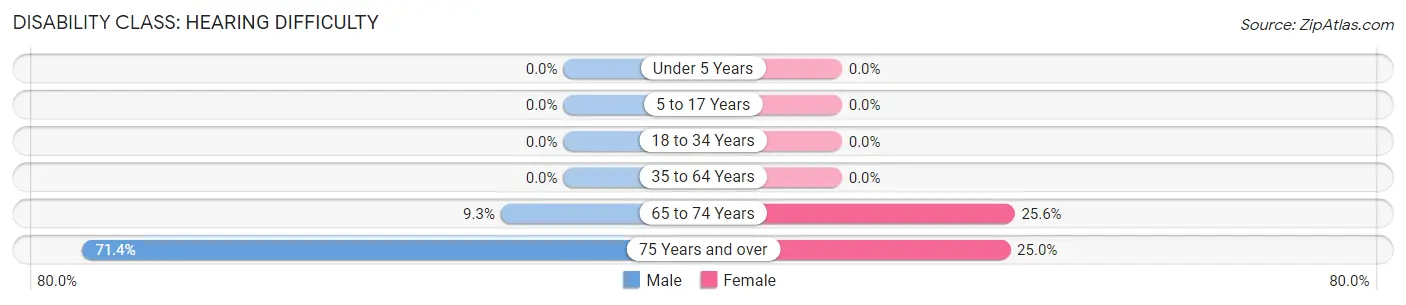
| Age Bracket | Male | Female |
| Under 5 Years | 0 (0.0%) | 0 (0.0%) |
| 5 to 17 Years | 0 (0.0%) | 0 (0.0%) |
| 18 to 34 Years | 0 (0.0%) | 0 (0.0%) |
| 35 to 64 Years | 0 (0.0%) | 0 (0.0%) |
| 65 to 74 Years | 4 (9.3%) | 10 (25.6%) |
| 75 Years and over | 10 (71.4%) | 5 (25.0%) |
Disability Class: Vision Difficulty
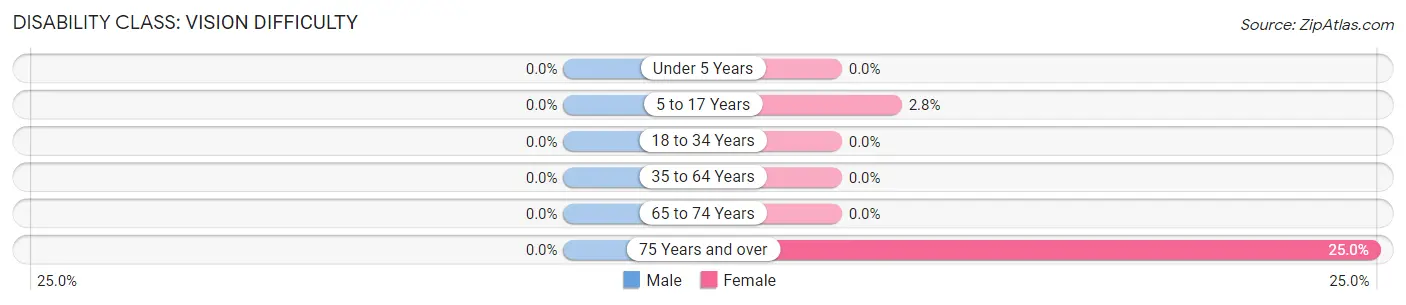
| Age Bracket | Male | Female |
| Under 5 Years | 0 (0.0%) | 0 (0.0%) |
| 5 to 17 Years | 0 (0.0%) | 9 (2.8%) |
| 18 to 34 Years | 0 (0.0%) | 0 (0.0%) |
| 35 to 64 Years | 0 (0.0%) | 0 (0.0%) |
| 65 to 74 Years | 0 (0.0%) | 0 (0.0%) |
| 75 Years and over | 0 (0.0%) | 5 (25.0%) |
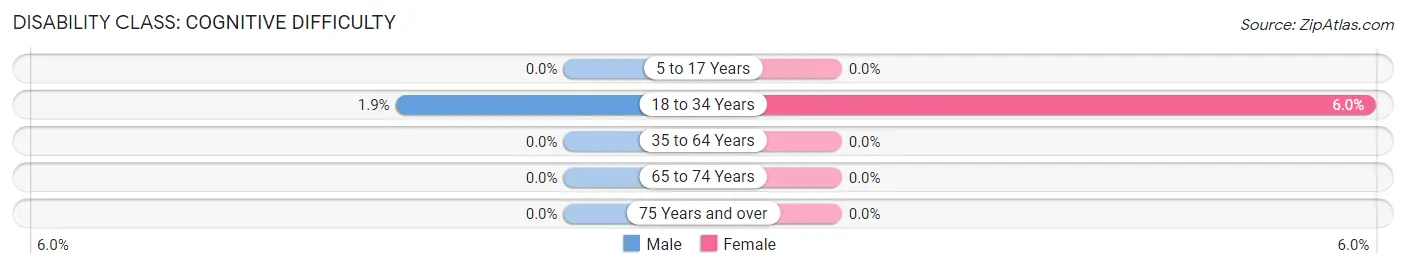
Disability Class: Cognitive Difficulty
| Age Bracket | Male | Female |
| 5 to 17 Years | 0 (0.0%) | 0 (0.0%) |
| 18 to 34 Years | 4 (1.9%) | 11 (5.9%) |
| 35 to 64 Years | 0 (0.0%) | 0 (0.0%) |
| 65 to 74 Years | 0 (0.0%) | 0 (0.0%) |
| 75 Years and over | 0 (0.0%) | 0 (0.0%) |
Disability Class: Ambulatory Difficulty
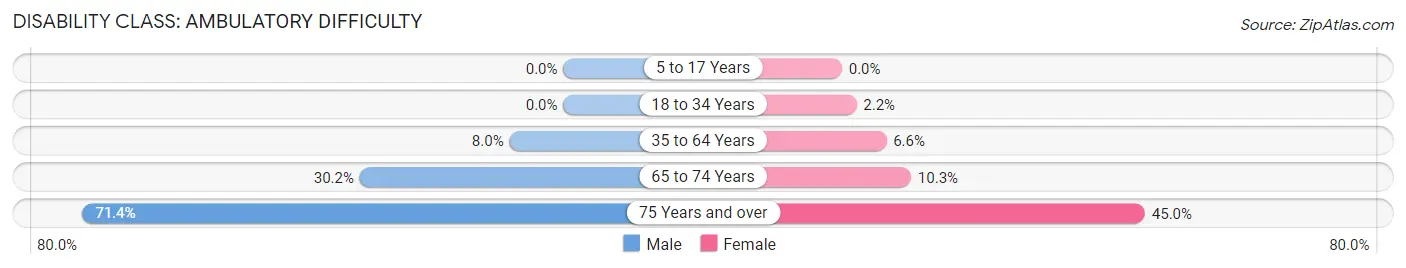
| Age Bracket | Male | Female |
| 5 to 17 Years | 0 (0.0%) | 0 (0.0%) |
| 18 to 34 Years | 0 (0.0%) | 4 (2.2%) |
| 35 to 64 Years | 20 (8.0%) | 19 (6.6%) |
| 65 to 74 Years | 13 (30.2%) | 4 (10.3%) |
| 75 Years and over | 10 (71.4%) | 9 (45.0%) |
Disability Class: Self-Care Difficulty
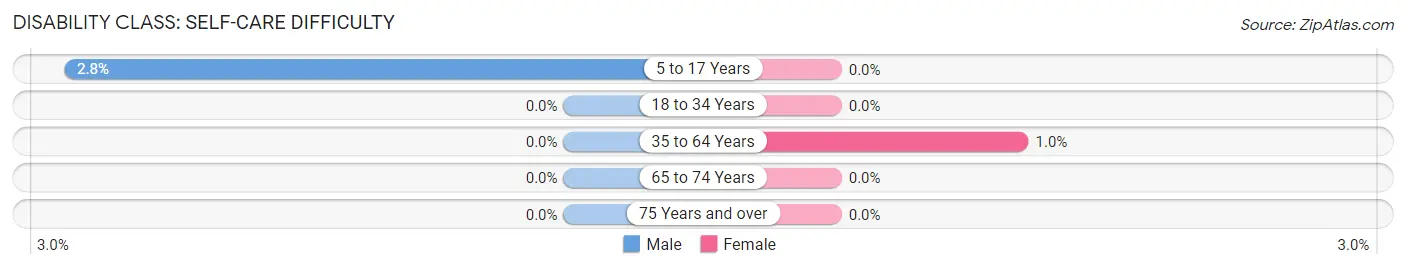
| Age Bracket | Male | Female |
| 5 to 17 Years | 4 (2.8%) | 0 (0.0%) |
| 18 to 34 Years | 0 (0.0%) | 0 (0.0%) |
| 35 to 64 Years | 0 (0.0%) | 3 (1.0%) |
| 65 to 74 Years | 0 (0.0%) | 0 (0.0%) |
| 75 Years and over | 0 (0.0%) | 0 (0.0%) |
Technology Access in Plum Grove
Computing Device Access in Plum Grove
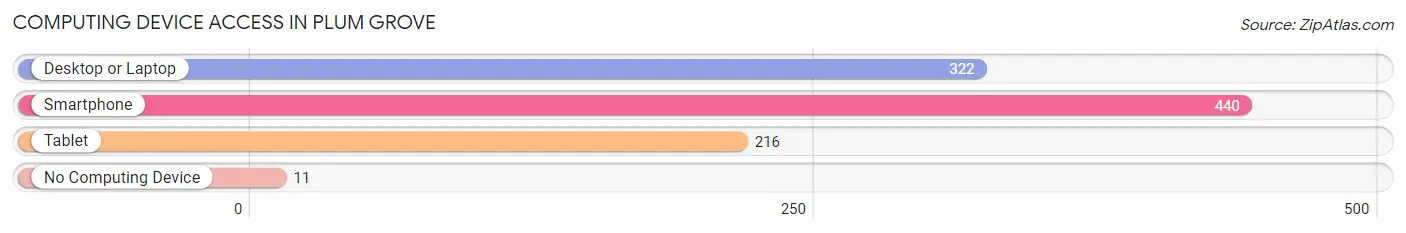
| Device Type | # Households | % Households |
| Desktop or Laptop | 322 | 66.9% |
| Smartphone | 440 | 91.5% |
| Tablet | 216 | 44.9% |
| No Computing Device | 11 | 2.3% |
| Total | 481 | 100.0% |
Internet Access in Plum Grove
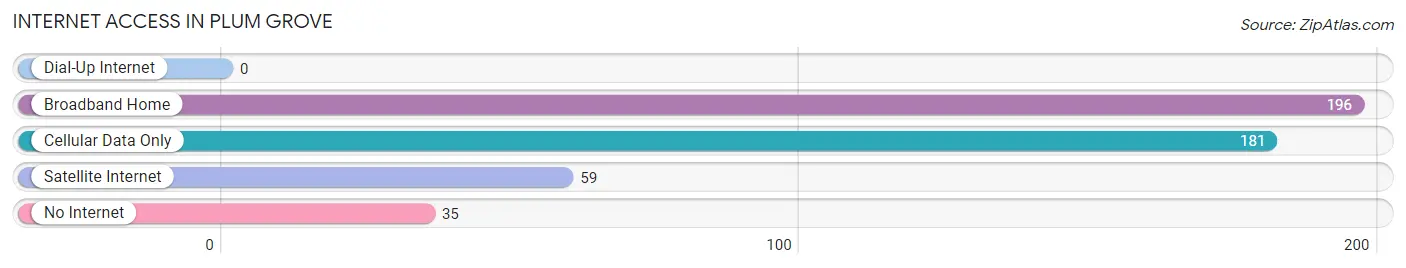
| Internet Type | # Households | % Households |
| Dial-Up Internet | 0 | 0.0% |
| Broadband Home | 196 | 40.7% |
| Cellular Data Only | 181 | 37.6% |
| Satellite Internet | 59 | 12.3% |
| No Internet | 35 | 7.3% |
| Total | 481 | 100.0% |
Plum Grove Summary
Plum Grove, Texas is a small unincorporated community located in Liberty County, Texas. It is situated about 25 miles northeast of Houston and is part of the Houston–The Woodlands–Sugar Land metropolitan area. The population of Plum Grove was estimated to be 1,093 in 2019.
History
Plum Grove was founded in 1835 by a group of settlers from the United States. The settlement was originally known as “Plum Grove Settlement” and was located on the banks of the Trinity River. The settlement was named after the wild plum trees that grew in the area.
In 1836, the Texas Revolution began and the settlers of Plum Grove joined the fight for independence from Mexico. After the war, the settlement was officially recognized as a town and was renamed Plum Grove.
In 1845, Plum Grove was annexed by the newly formed Liberty County. The town continued to grow and by the late 19th century, it had become a thriving agricultural community.
Geography
Plum Grove is located in the southeastern part of Liberty County, Texas. It is situated about 25 miles northeast of Houston and is part of the Houston–The Woodlands–Sugar Land metropolitan area.
The town is situated on the banks of the Trinity River and is surrounded by rolling hills and wooded areas. The climate in Plum Grove is humid subtropical, with hot summers and mild winters.
Economy
The economy of Plum Grove is largely based on agriculture. The town is home to several farms and ranches that produce a variety of crops, including corn, cotton, soybeans, and wheat.
In addition to agriculture, Plum Grove also has a few small businesses, including a gas station, a convenience store, and a few restaurants.
Demographics
As of 2019, the population of Plum Grove was estimated to be 1,093. The racial makeup of the town was 79.2% White, 15.2% Hispanic or Latino, 2.2% African American, and 3.4% other.
The median household income in Plum Grove was $45,938 in 2019. The median home value was $117,400. The town has a poverty rate of 16.2%.
Conclusion
Plum Grove, Texas is a small unincorporated community located in Liberty County, Texas. It is situated about 25 miles northeast of Houston and is part of the Houston–The Woodlands–Sugar Land metropolitan area. The population of Plum Grove was estimated to be 1,093 in 2019. The town is situated on the banks of the Trinity River and is surrounded by rolling hills and wooded areas. The economy of Plum Grove is largely based on agriculture, with a few small businesses also operating in the area. The racial makeup of the town was 79.2% White, 15.2% Hispanic or Latino, 2.2% African American, and 3.4% other. The median household income in Plum Grove was $45,938 in 2019. The median home value was $117,400. The town has a poverty rate of 16.2%.
Common Questions
What is Per Capita Income in Plum Grove?
Per Capita income in Plum Grove is $21,620.
What is the Median Family Income in Plum Grove?
Median Family Income in Plum Grove is $61,689.
What is the Median Household income in Plum Grove?
Median Household Income in Plum Grove is $61,982.
What is Income or Wage Gap in Plum Grove?
Income or Wage Gap in Plum Grove is 12.7%.
Women in Plum Grove earn 87.3 cents for every dollar earned by a man.
What is Inequality or Gini Index in Plum Grove?
Inequality or Gini Index in Plum Grove is 0.35.
What is the Total Population of Plum Grove?
Total Population of Plum Grove is 1,613.
What is the Total Male Population of Plum Grove?
Total Male Population of Plum Grove is 665.
What is the Total Female Population of Plum Grove?
Total Female Population of Plum Grove is 948.
What is the Ratio of Males per 100 Females in Plum Grove?
There are 70.15 Males per 100 Females in Plum Grove.
What is the Ratio of Females per 100 Males in Plum Grove?
There are 142.56 Females per 100 Males in Plum Grove.
What is the Median Population Age in Plum Grove?
Median Population Age in Plum Grove is 28.2 Years.
What is the Average Family Size in Plum Grove
Average Family Size in Plum Grove is 3.7 People.
What is the Average Household Size in Plum Grove
Average Household Size in Plum Grove is 3.4 People.
How Large is the Labor Force in Plum Grove?
There are 732 People in the Labor Forcein in Plum Grove.
What is the Percentage of People in the Labor Force in Plum Grove?
67.0% of People are in the Labor Force in Plum Grove.