South Toledo Bend, TX Map & Demographics
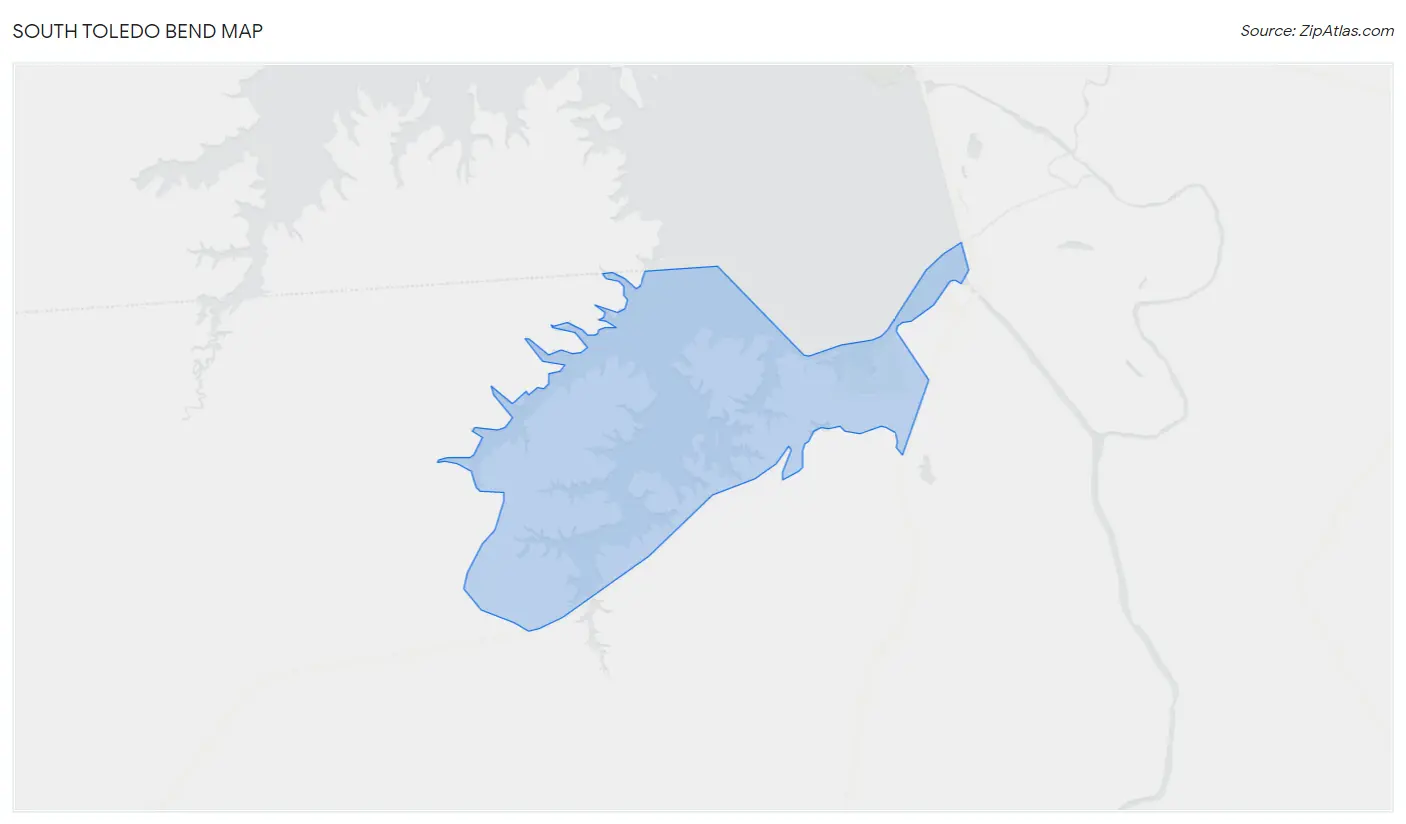
South Toledo Bend Map
South Toledo Bend Overview
$45,222
PER CAPITA INCOME
$62,750
AVG HOUSEHOLD INCOME
0.48
INEQUALITY / GINI INDEX
372
TOTAL POPULATION
218
MALE POPULATION
154
FEMALE POPULATION
141.56
MALES / 100 FEMALES
70.64
FEMALES / 100 MALES
60.8
MEDIAN AGE
2.4
AVG FAMILY SIZE
2.2
AVG HOUSEHOLD SIZE
111
LABOR FORCE [ PEOPLE ]
30.2%
PERCENT IN LABOR FORCE
4.5%
UNEMPLOYMENT RATE
Income in South Toledo Bend
Income Overview in South Toledo Bend
| Characteristic | Number | Measure |
| Per Capita Income | 372 | $45,222 |
| Median Family Income | 142 | $0 |
| Mean Family Income | 142 | $111,939 |
| Median Household Income | 172 | $62,750 |
| Mean Household Income | 172 | $97,352 |
| Income Deficit | 142 | $0 |
| Wage / Income Gap (%) | 372 | 0.00% |
| Wage / Income Gap ($) | 372 | 100.00¢ per $1 |
| Gini / Inequality Index | 372 | 0.48 |
Earnings by Sex in South Toledo Bend
| Sex | Number | Average Earnings |
| Male | 109 (90.1%) | $0 |
| Female | 12 (9.9%) | $0 |
| Total | 121 (100.0%) | $0 |
Earnings by Sex by Income Bracket in South Toledo Bend
The most common earnings brackets in South Toledo Bend are $2,500 to $4,999 for men (35 | 32.1%) and $2,499 or less for women (6 | 50.0%).
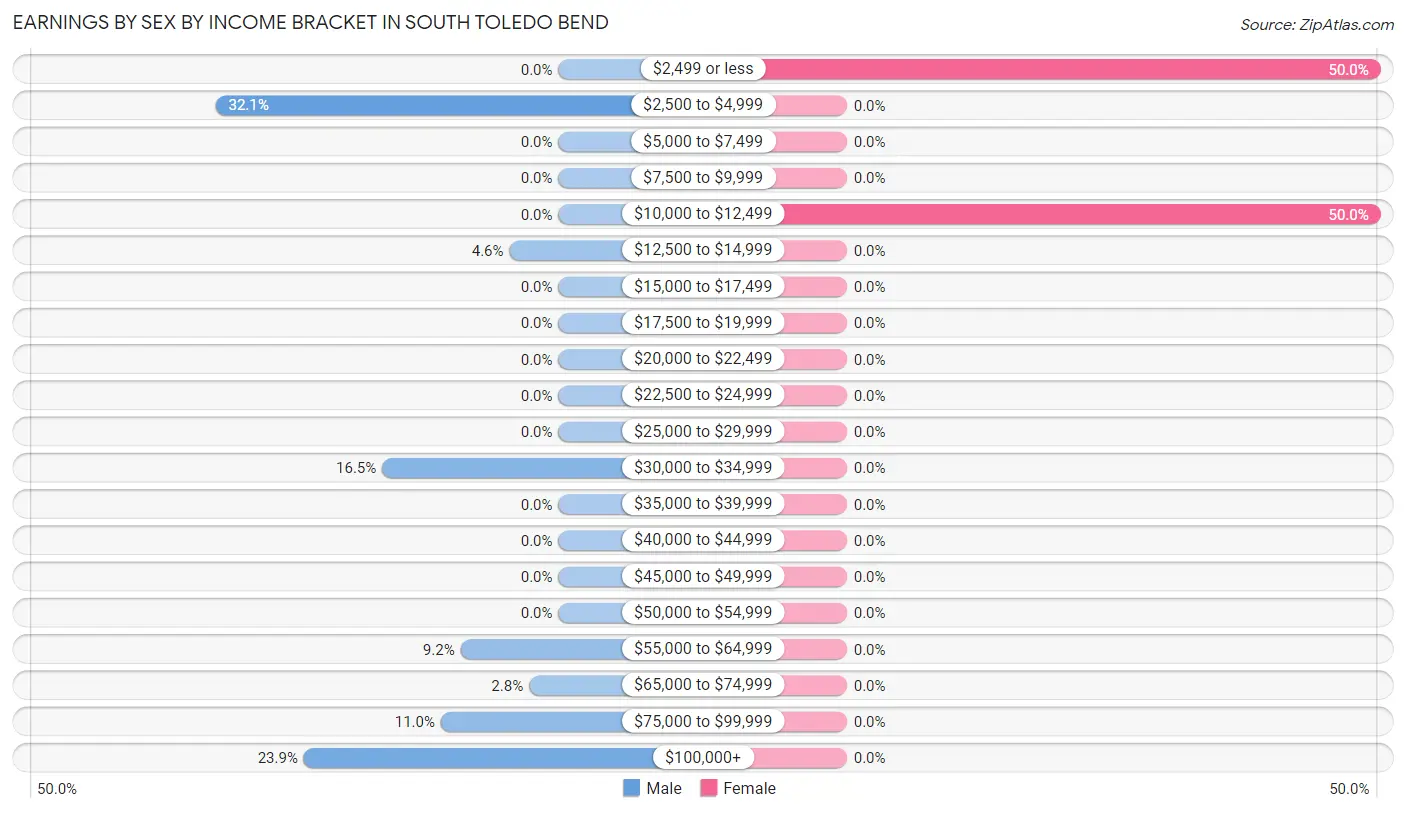
| Income | Male | Female |
| $2,499 or less | 0 (0.0%) | 6 (50.0%) |
| $2,500 to $4,999 | 35 (32.1%) | 0 (0.0%) |
| $5,000 to $7,499 | 0 (0.0%) | 0 (0.0%) |
| $7,500 to $9,999 | 0 (0.0%) | 0 (0.0%) |
| $10,000 to $12,499 | 0 (0.0%) | 6 (50.0%) |
| $12,500 to $14,999 | 5 (4.6%) | 0 (0.0%) |
| $15,000 to $17,499 | 0 (0.0%) | 0 (0.0%) |
| $17,500 to $19,999 | 0 (0.0%) | 0 (0.0%) |
| $20,000 to $22,499 | 0 (0.0%) | 0 (0.0%) |
| $22,500 to $24,999 | 0 (0.0%) | 0 (0.0%) |
| $25,000 to $29,999 | 0 (0.0%) | 0 (0.0%) |
| $30,000 to $34,999 | 18 (16.5%) | 0 (0.0%) |
| $35,000 to $39,999 | 0 (0.0%) | 0 (0.0%) |
| $40,000 to $44,999 | 0 (0.0%) | 0 (0.0%) |
| $45,000 to $49,999 | 0 (0.0%) | 0 (0.0%) |
| $50,000 to $54,999 | 0 (0.0%) | 0 (0.0%) |
| $55,000 to $64,999 | 10 (9.2%) | 0 (0.0%) |
| $65,000 to $74,999 | 3 (2.8%) | 0 (0.0%) |
| $75,000 to $99,999 | 12 (11.0%) | 0 (0.0%) |
| $100,000+ | 26 (23.8%) | 0 (0.0%) |
| Total | 109 (100.0%) | 12 (100.0%) |
Earnings by Sex by Educational Attainment in South Toledo Bend
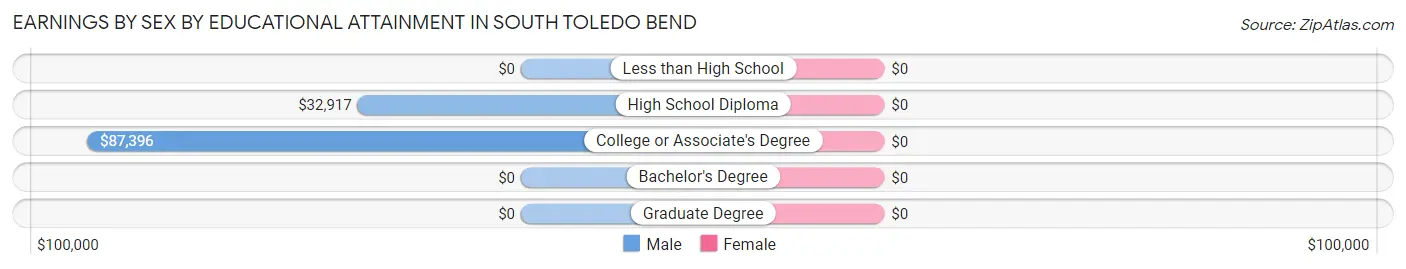
| Educational Attainment | Male Income | Female Income |
| Less than High School | - | - |
| High School Diploma | $32,917 | $0 |
| College or Associate's Degree | $87,396 | $0 |
| Bachelor's Degree | - | - |
| Graduate Degree | - | - |
| Total | $85,208 | $0 |
Family Income in South Toledo Bend
Family Income Brackets in South Toledo Bend
According to the South Toledo Bend family income data, there are 40 families falling into the $50,000 to $74,999 income range, which is the most common income bracket and makes up 28.2% of all families.
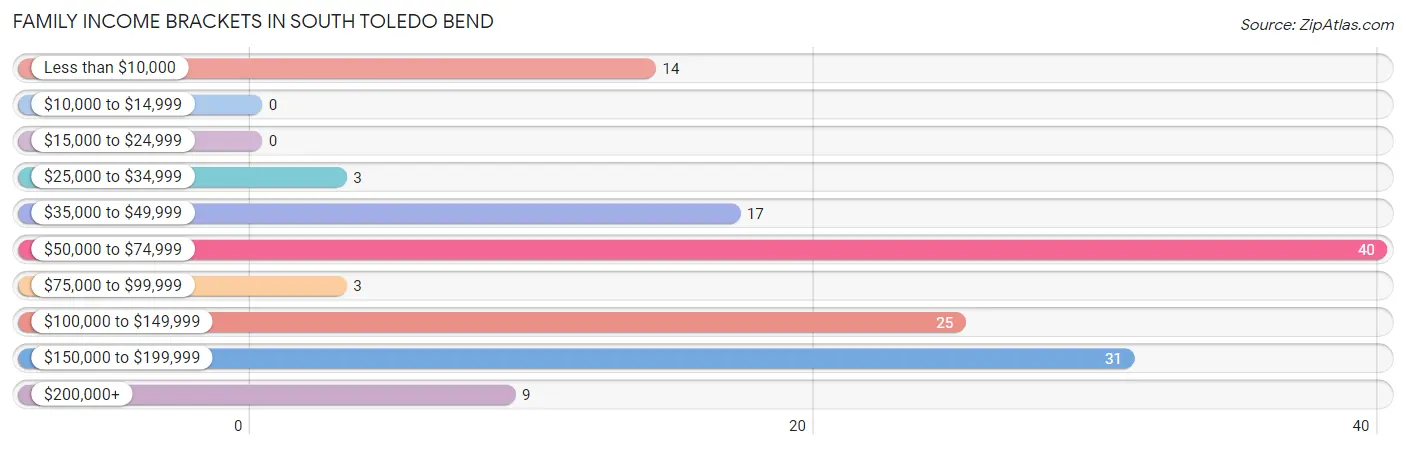
| Income Bracket | # Families | % Families |
| Less than $10,000 | 14 | 9.9% |
| $10,000 to $14,999 | 0 | 0.0% |
| $15,000 to $24,999 | 0 | 0.0% |
| $25,000 to $34,999 | 3 | 2.1% |
| $35,000 to $49,999 | 17 | 12.0% |
| $50,000 to $74,999 | 40 | 28.2% |
| $75,000 to $99,999 | 3 | 2.1% |
| $100,000 to $149,999 | 25 | 17.6% |
| $150,000 to $199,999 | 31 | 21.8% |
| $200,000+ | 9 | 6.3% |
Family Income by Famaliy Size in South Toledo Bend
3-person families (38 | 26.8%) account for the highest median family income in South Toledo Bend with $185,741 per family, while 3-person families (38 | 26.8%) have the highest median income of $61,914 per family member.
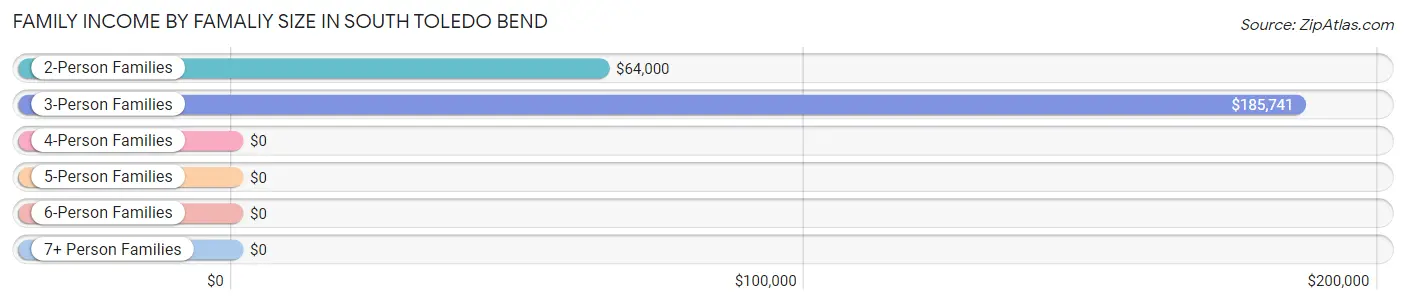
| Income Bracket | # Families | Median Income |
| 2-Person Families | 104 (73.2%) | $64,000 |
| 3-Person Families | 38 (26.8%) | $185,741 |
| 4-Person Families | 0 (0.0%) | $0 |
| 5-Person Families | 0 (0.0%) | $0 |
| 6-Person Families | 0 (0.0%) | $0 |
| 7+ Person Families | 0 (0.0%) | $0 |
| Total | 142 (100.0%) | $0 |
Family Income by Number of Earners in South Toledo Bend
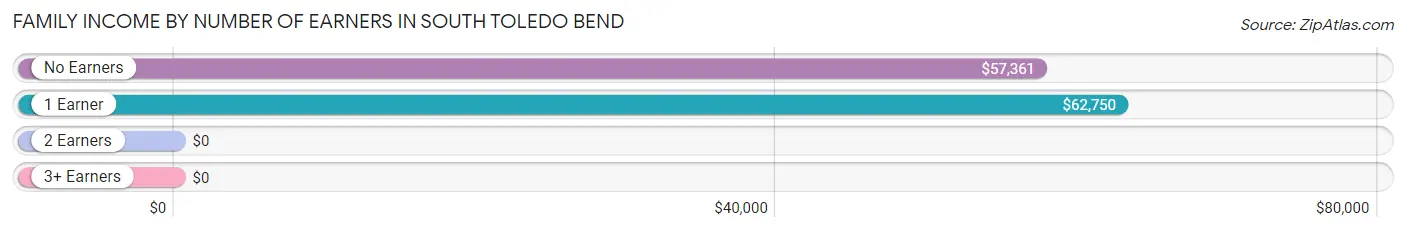
| Number of Earners | # Families | Median Income |
| No Earners | 67 (47.2%) | $57,361 |
| 1 Earner | 48 (33.8%) | $62,750 |
| 2 Earners | 27 (19.0%) | $0 |
| 3+ Earners | 0 (0.0%) | $0 |
| Total | 142 (100.0%) | $0 |
Household Income in South Toledo Bend
Household Income Brackets in South Toledo Bend
With 40 households falling in the category, the $50,000 to $74,999 income range is the most frequent in South Toledo Bend, accounting for 23.3% of all households. In contrast, only 3 households (1.7%) fall into the $15,000 to $24,999 income bracket, making it the least populous group.
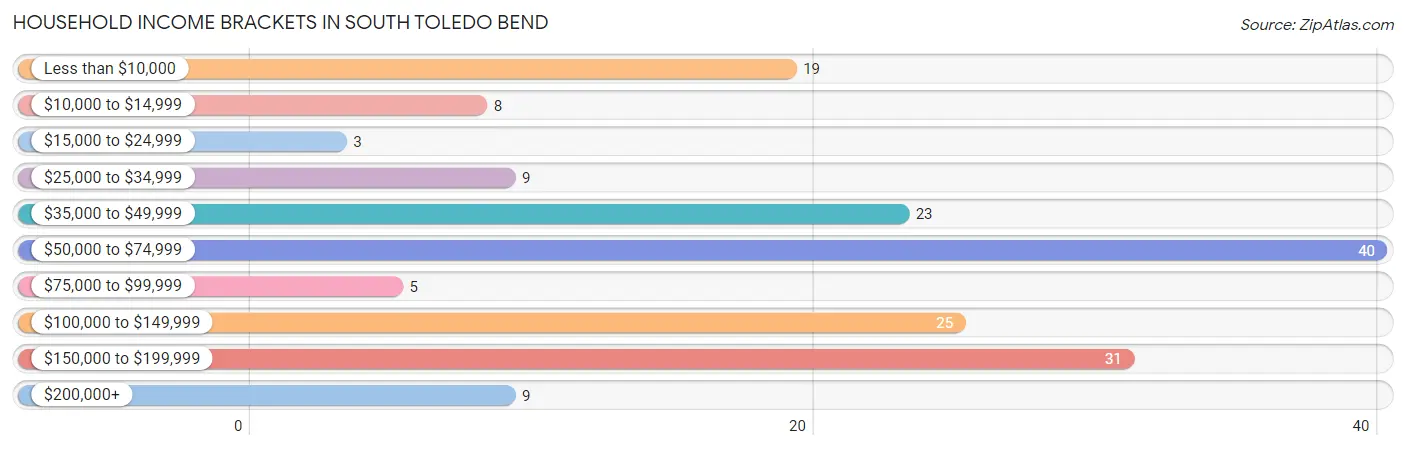
| Income Bracket | # Households | % Households |
| Less than $10,000 | 19 | 11.0% |
| $10,000 to $14,999 | 8 | 4.7% |
| $15,000 to $24,999 | 3 | 1.7% |
| $25,000 to $34,999 | 9 | 5.2% |
| $35,000 to $49,999 | 23 | 13.4% |
| $50,000 to $74,999 | 40 | 23.3% |
| $75,000 to $99,999 | 5 | 2.9% |
| $100,000 to $149,999 | 25 | 14.5% |
| $150,000 to $199,999 | 31 | 18.0% |
| $200,000+ | 9 | 5.2% |
Household Income by Householder Age in South Toledo Bend
The median household income in South Toledo Bend is $62,750, with the highest median household income of $65,536 found in the 65+ years age bracket for the primary householder. A total of 79 households (45.9%) fall into this category.
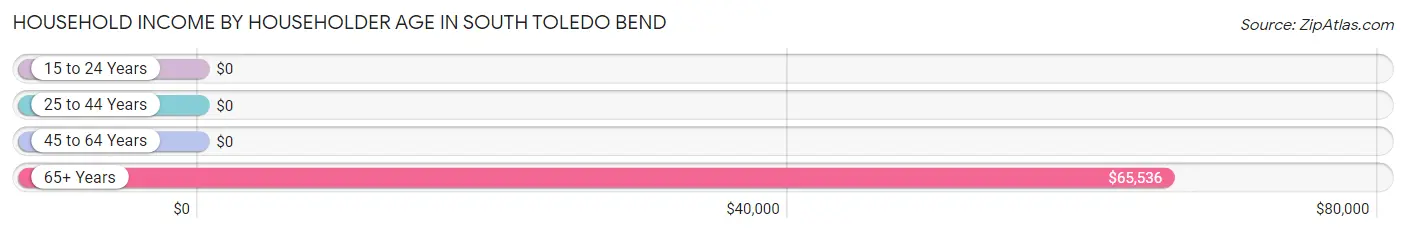
| Income Bracket | # Households | Median Income |
| 15 to 24 Years | 0 (0.0%) | $0 |
| 25 to 44 Years | 0 (0.0%) | $0 |
| 45 to 64 Years | 93 (54.1%) | $0 |
| 65+ Years | 79 (45.9%) | $65,536 |
| Total | 172 (100.0%) | $62,750 |
Poverty in South Toledo Bend
Income Below Poverty by Sex and Age in South Toledo Bend
With 10.1% poverty level for males and 15.6% for females among the residents of South Toledo Bend, 55 to 64 year old males and 55 to 64 year old females are the most vulnerable to poverty, with 22 males (41.5%) and 19 females (31.1%) in their respective age groups living below the poverty level.
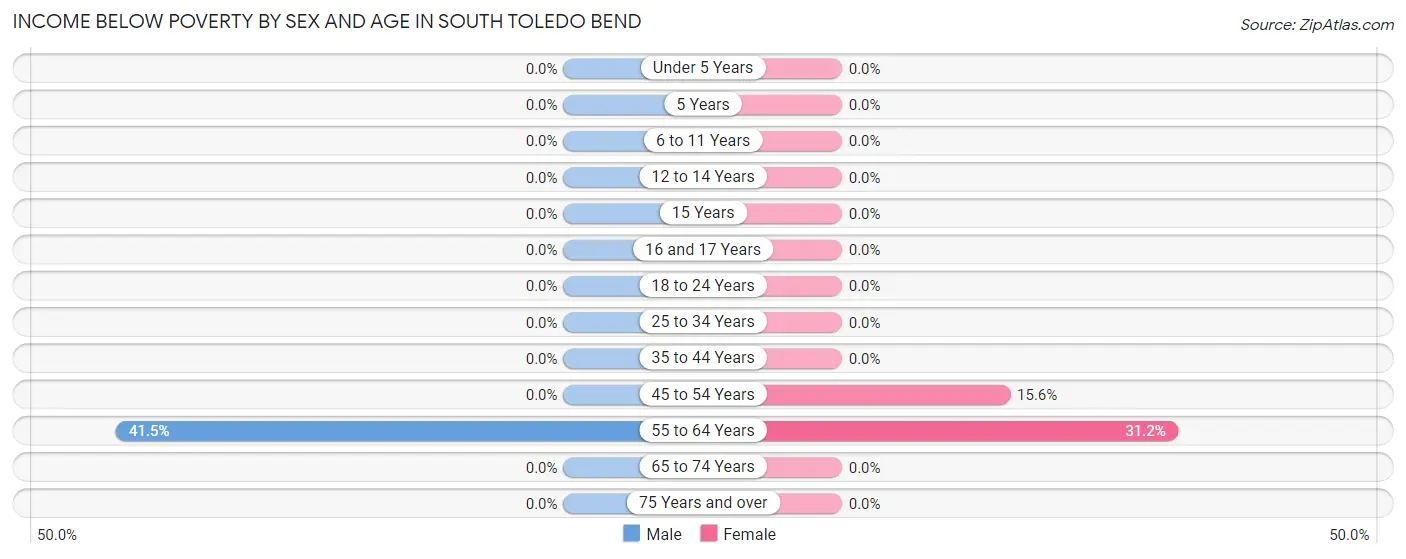
| Age Bracket | Male | Female |
| Under 5 Years | 0 (0.0%) | 0 (0.0%) |
| 5 Years | 0 (0.0%) | 0 (0.0%) |
| 6 to 11 Years | 0 (0.0%) | 0 (0.0%) |
| 12 to 14 Years | 0 (0.0%) | 0 (0.0%) |
| 15 Years | 0 (0.0%) | 0 (0.0%) |
| 16 and 17 Years | 0 (0.0%) | 0 (0.0%) |
| 18 to 24 Years | 0 (0.0%) | 0 (0.0%) |
| 25 to 34 Years | 0 (0.0%) | 0 (0.0%) |
| 35 to 44 Years | 0 (0.0%) | 0 (0.0%) |
| 45 to 54 Years | 0 (0.0%) | 5 (15.6%) |
| 55 to 64 Years | 22 (41.5%) | 19 (31.1%) |
| 65 to 74 Years | 0 (0.0%) | 0 (0.0%) |
| 75 Years and over | 0 (0.0%) | 0 (0.0%) |
| Total | 22 (10.1%) | 24 (15.6%) |
Income Above Poverty by Sex and Age in South Toledo Bend
According to the poverty statistics in South Toledo Bend, males aged under 5 years and females aged 65 to 74 years are the age groups that are most secure financially, with 100.0% of males and 100.0% of females in these age groups living above the poverty line.
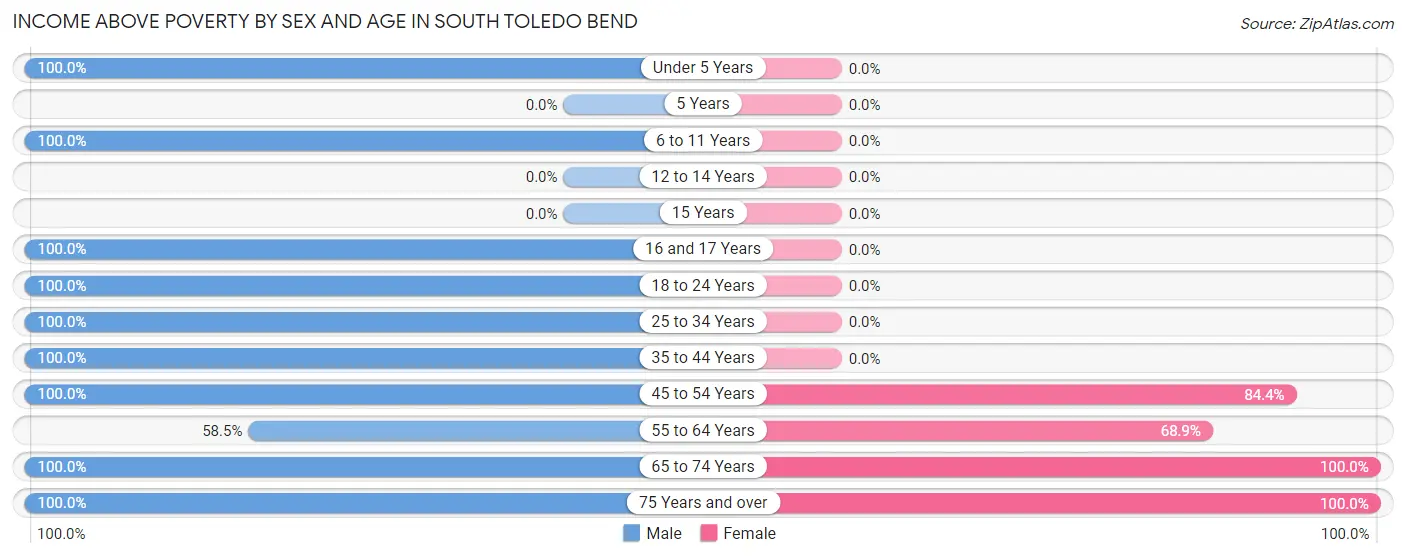
| Age Bracket | Male | Female |
| Under 5 Years | 2 (100.0%) | 0 (0.0%) |
| 5 Years | 0 (0.0%) | 0 (0.0%) |
| 6 to 11 Years | 2 (100.0%) | 0 (0.0%) |
| 12 to 14 Years | 0 (0.0%) | 0 (0.0%) |
| 15 Years | 0 (0.0%) | 0 (0.0%) |
| 16 and 17 Years | 8 (100.0%) | 0 (0.0%) |
| 18 to 24 Years | 35 (100.0%) | 0 (0.0%) |
| 25 to 34 Years | 9 (100.0%) | 0 (0.0%) |
| 35 to 44 Years | 5 (100.0%) | 0 (0.0%) |
| 45 to 54 Years | 36 (100.0%) | 27 (84.4%) |
| 55 to 64 Years | 31 (58.5%) | 42 (68.9%) |
| 65 to 74 Years | 51 (100.0%) | 35 (100.0%) |
| 75 Years and over | 17 (100.0%) | 26 (100.0%) |
| Total | 196 (89.9%) | 130 (84.4%) |
Income Below Poverty Among Married-Couple Families in South Toledo Bend
The poverty statistics for married-couple families in South Toledo Bend show that 11.6% or 14 of the total 121 families live below the poverty line. Families with no children have the highest poverty rate of 12.2%, comprising of 14 families. On the other hand, families with 1 or 2 children have the lowest poverty rate of 0.0%, which includes 0 families.
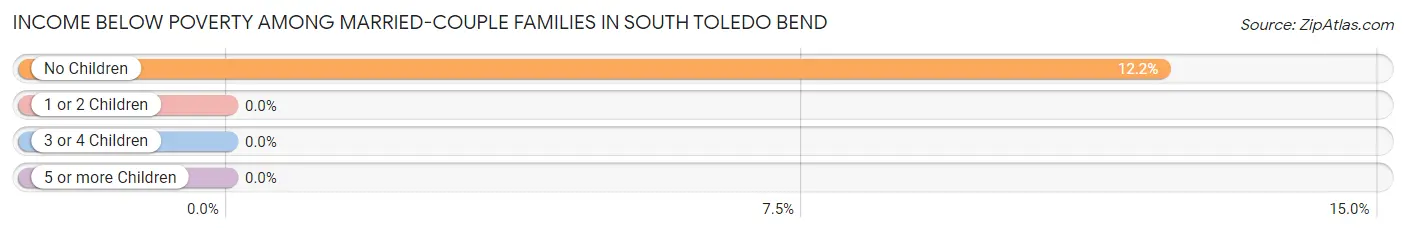
| Children | Above Poverty | Below Poverty |
| No Children | 101 (87.8%) | 14 (12.2%) |
| 1 or 2 Children | 6 (100.0%) | 0 (0.0%) |
| 3 or 4 Children | 0 (0.0%) | 0 (0.0%) |
| 5 or more Children | 0 (0.0%) | 0 (0.0%) |
| Total | 107 (88.4%) | 14 (11.6%) |
Income Below Poverty Among Single-Parent Households in South Toledo Bend
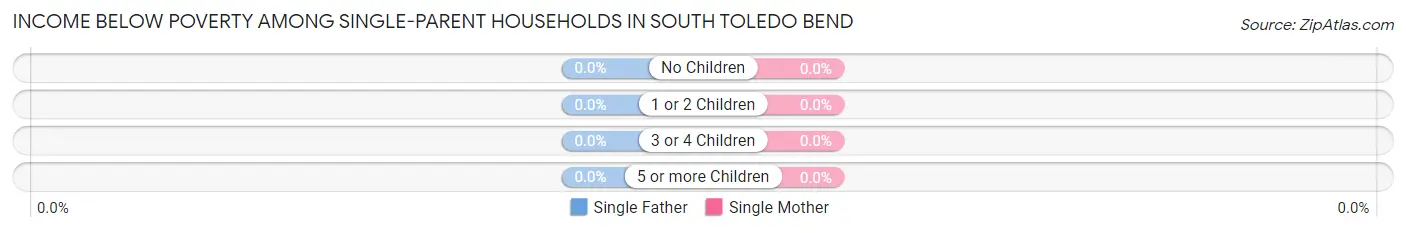
| Children | Single Father | Single Mother |
| No Children | 0 (0.0%) | 0 (0.0%) |
| 1 or 2 Children | 0 (0.0%) | 0 (0.0%) |
| 3 or 4 Children | 0 (0.0%) | 0 (0.0%) |
| 5 or more Children | 0 (0.0%) | 0 (0.0%) |
| Total | 0 (0.0%) | 0 (0.0%) |
Income Below Poverty Among Married-Couple vs Single-Parent Households in South Toledo Bend
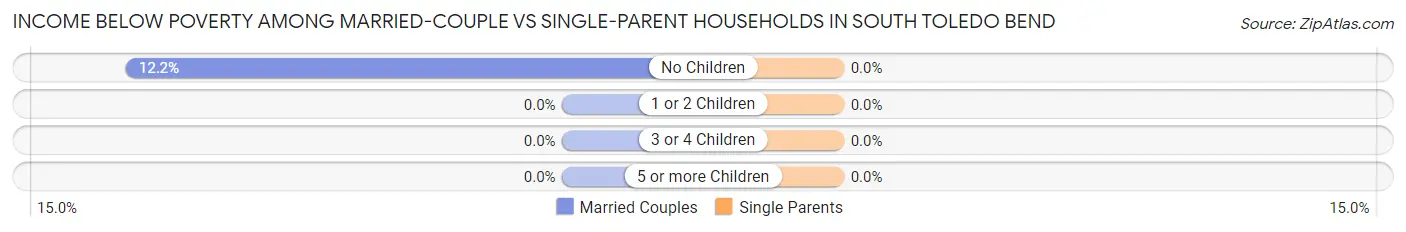
| Children | Married-Couple Families | Single-Parent Households |
| No Children | 14 (12.2%) | 0 (0.0%) |
| 1 or 2 Children | 0 (0.0%) | 0 (0.0%) |
| 3 or 4 Children | 0 (0.0%) | 0 (0.0%) |
| 5 or more Children | 0 (0.0%) | 0 (0.0%) |
| Total | 14 (11.6%) | 0 (0.0%) |
Race in South Toledo Bend
The most populous races in South Toledo Bend are , and White / Caucasian (372 | 100.0%).
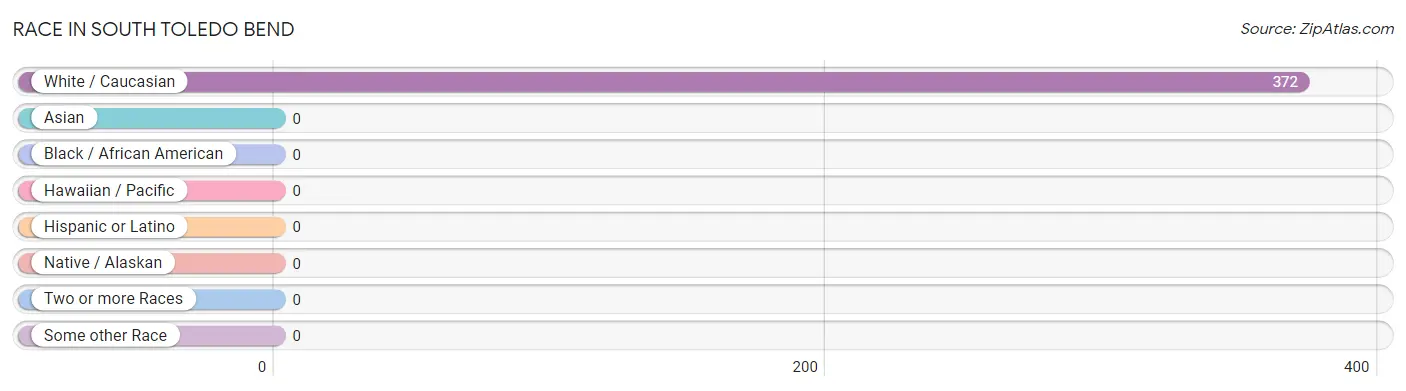
| Race | # Population | % Population |
| Asian | 0 | 0.0% |
| Black / African American | 0 | 0.0% |
| Hawaiian / Pacific | 0 | 0.0% |
| Hispanic or Latino | 0 | 0.0% |
| Native / Alaskan | 0 | 0.0% |
| White / Caucasian | 372 | 100.0% |
| Two or more Races | 0 | 0.0% |
| Some other Race | 0 | 0.0% |
| Total | 372 | 100.0% |
Ancestry in South Toledo Bend
The most populous ancestries reported in South Toledo Bend are American (92 | 24.7%), French (77 | 20.7%), Irish (66 | 17.7%), English (50 | 13.4%), and German (27 | 7.3%), together accounting for 83.9% of all South Toledo Bend residents.
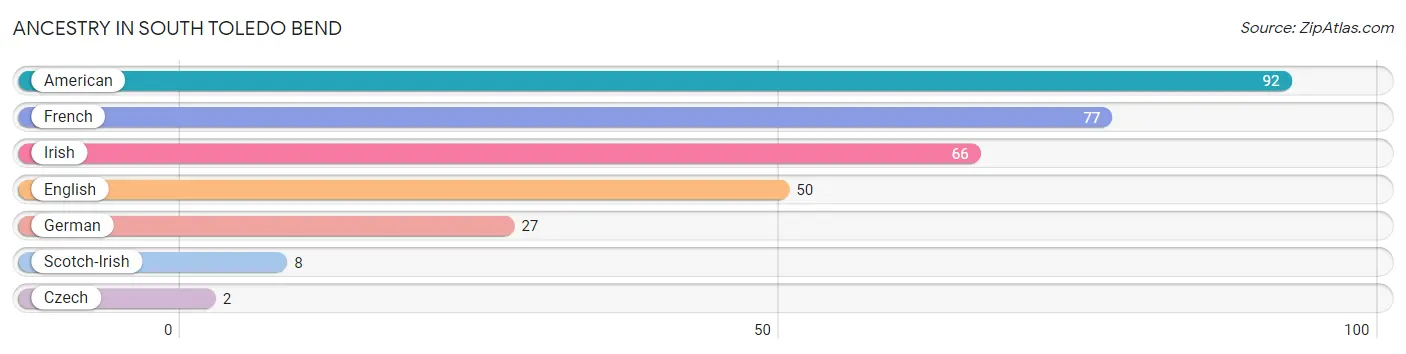
| Ancestry | # Population | % Population |
| American | 92 | 24.7% |
| Czech | 2 | 0.5% |
| English | 50 | 13.4% |
| French | 77 | 20.7% |
| German | 27 | 7.3% |
| Irish | 66 | 17.7% |
| Scotch-Irish | 8 | 2.1% | View All 7 Rows |
Immigrants in South Toledo Bend

| Immigration Origin | # Population | % Population | View All 0 Rows |
Sex and Age in South Toledo Bend
Sex and Age in South Toledo Bend
The most populous age groups in South Toledo Bend are 20 to 24 Years (35 | 16.1%) for men and 60 to 64 Years (50 | 32.5%) for women.
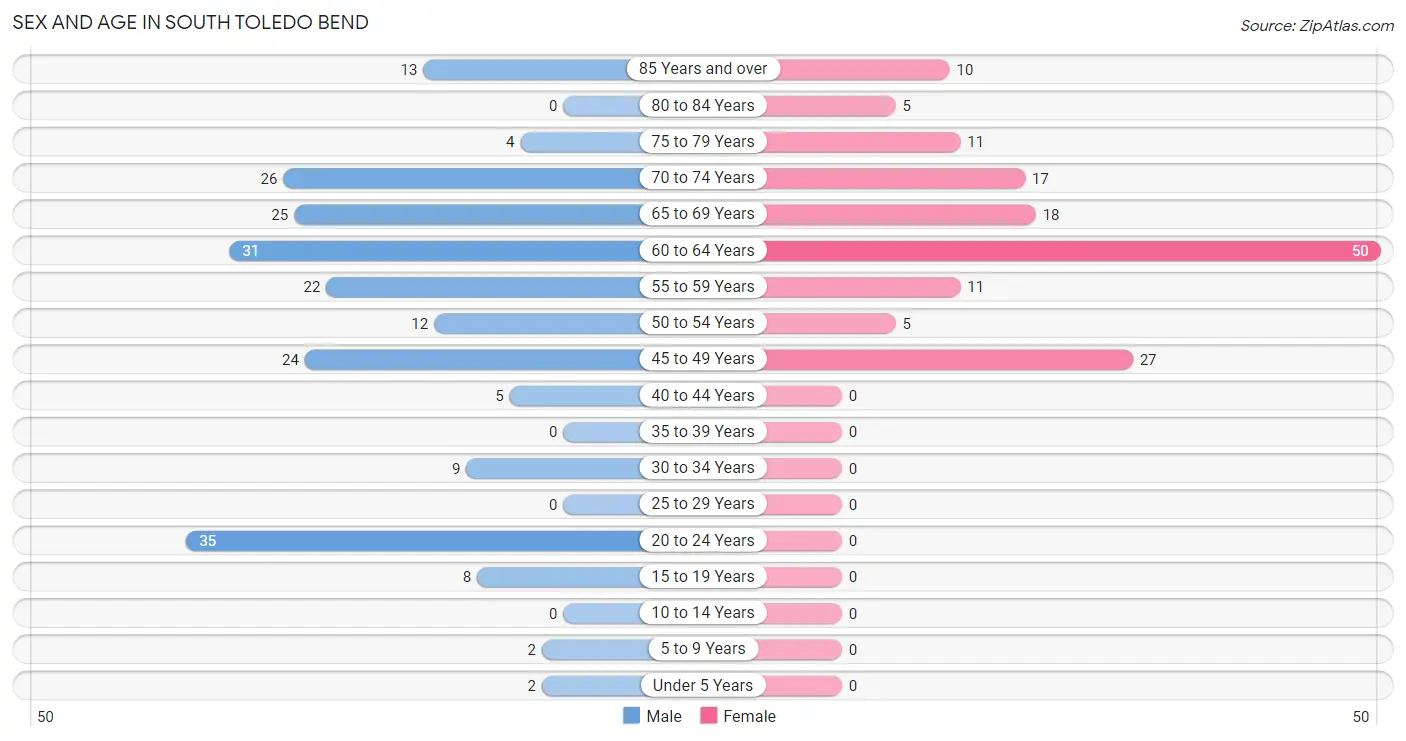
| Age Bracket | Male | Female |
| Under 5 Years | 2 (0.9%) | 0 (0.0%) |
| 5 to 9 Years | 2 (0.9%) | 0 (0.0%) |
| 10 to 14 Years | 0 (0.0%) | 0 (0.0%) |
| 15 to 19 Years | 8 (3.7%) | 0 (0.0%) |
| 20 to 24 Years | 35 (16.1%) | 0 (0.0%) |
| 25 to 29 Years | 0 (0.0%) | 0 (0.0%) |
| 30 to 34 Years | 9 (4.1%) | 0 (0.0%) |
| 35 to 39 Years | 0 (0.0%) | 0 (0.0%) |
| 40 to 44 Years | 5 (2.3%) | 0 (0.0%) |
| 45 to 49 Years | 24 (11.0%) | 27 (17.5%) |
| 50 to 54 Years | 12 (5.5%) | 5 (3.3%) |
| 55 to 59 Years | 22 (10.1%) | 11 (7.1%) |
| 60 to 64 Years | 31 (14.2%) | 50 (32.5%) |
| 65 to 69 Years | 25 (11.5%) | 18 (11.7%) |
| 70 to 74 Years | 26 (11.9%) | 17 (11.0%) |
| 75 to 79 Years | 4 (1.8%) | 11 (7.1%) |
| 80 to 84 Years | 0 (0.0%) | 5 (3.3%) |
| 85 Years and over | 13 (6.0%) | 10 (6.5%) |
| Total | 218 (100.0%) | 154 (100.0%) |
Families and Households in South Toledo Bend
Median Family Size in South Toledo Bend
The median family size in South Toledo Bend is 2.41 persons per family, with married-couple families (121 | 85.2%) accounting for the largest median family size of 2.52 persons per family. On the other hand, single female/mother families (11 | 7.7%) represent the smallest median family size with 1.73 persons per family.
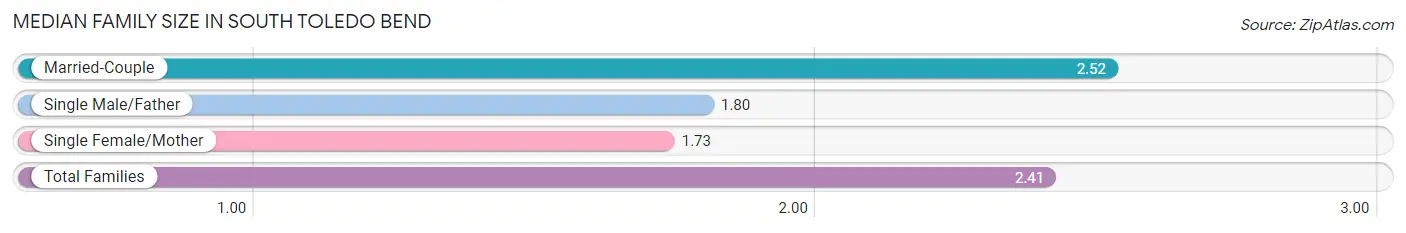
| Family Type | # Families | Family Size |
| Married-Couple | 121 (85.2%) | 2.52 |
| Single Male/Father | 10 (7.0%) | 1.80 |
| Single Female/Mother | 11 (7.7%) | 1.73 |
| Total Families | 142 (100.0%) | 2.41 |
Median Household Size in South Toledo Bend
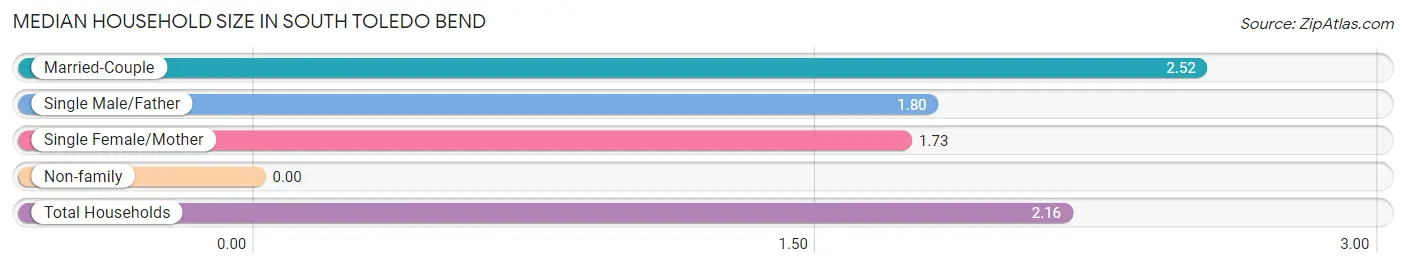
| Household Type | # Households | Household Size |
| Married-Couple | 121 (70.4%) | 2.52 |
| Single Male/Father | 10 (5.8%) | 1.80 |
| Single Female/Mother | 11 (6.4%) | 1.73 |
| Non-family | 30 (17.4%) | - |
| Total Households | 172 (100.0%) | 2.16 |
Household Size by Marriage Status in South Toledo Bend
Out of a total of 172 households in South Toledo Bend, 142 (82.6%) are family households, while 30 (17.4%) are nonfamily households. The most numerous type of family households are 2-person households, comprising 104, and the most common type of nonfamily households are 1-person households, comprising 30.
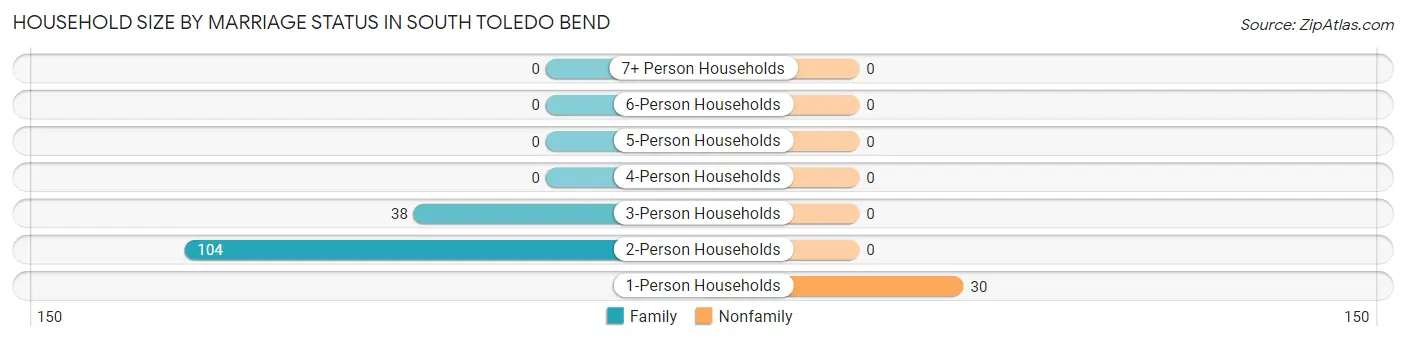
| Household Size | Family Households | Nonfamily Households |
| 1-Person Households | - | 30 (17.4%) |
| 2-Person Households | 104 (60.5%) | 0 (0.0%) |
| 3-Person Households | 38 (22.1%) | 0 (0.0%) |
| 4-Person Households | 0 (0.0%) | 0 (0.0%) |
| 5-Person Households | 0 (0.0%) | 0 (0.0%) |
| 6-Person Households | 0 (0.0%) | 0 (0.0%) |
| 7+ Person Households | 0 (0.0%) | 0 (0.0%) |
| Total | 142 (82.6%) | 30 (17.4%) |
Female Fertility in South Toledo Bend
Fertility by Age in South Toledo Bend
| Age Bracket | Women with Births | Births / 1,000 Women |
| 15 to 19 years | 0 (0.0%) | 0.0 |
| 20 to 34 years | 0 (0.0%) | 0.0 |
| 35 to 50 years | 0 (0.0%) | 0.0 |
| Total | 0 (0.0%) | 0.0 |
Fertility by Age by Marriage Status in South Toledo Bend
| Age Bracket | Married | Unmarried |
| 15 to 19 years | 0 (0.0%) | 0 (0.0%) |
| 20 to 34 years | 0 (0.0%) | 0 (0.0%) |
| 35 to 50 years | 0 (0.0%) | 0 (0.0%) |
| Total | 0 (0.0%) | 0 (0.0%) |
Fertility by Education in South Toledo Bend
| Educational Attainment | Women with Births | Births / 1,000 Women |
| Less than High School | 0 (0.0%) | 0.0 |
| High School Diploma | 0 (0.0%) | 0.0 |
| College or Associate's Degree | 0 (0.0%) | 0.0 |
| Bachelor's Degree | 0 (0.0%) | 0.0 |
| Graduate Degree | 0 (0.0%) | 0.0 |
| Total | 0 (0.0%) | 0.0 |
Fertility by Education by Marriage Status in South Toledo Bend
| Educational Attainment | Married | Unmarried |
| Less than High School | 0 (0.0%) | 0 (0.0%) |
| High School Diploma | 0 (0.0%) | 0 (0.0%) |
| College or Associate's Degree | 0 (0.0%) | 0 (0.0%) |
| Bachelor's Degree | 0 (0.0%) | 0 (0.0%) |
| Graduate Degree | 0 (0.0%) | 0 (0.0%) |
| Total | 0 (0.0%) | 0 (0.0%) |
Employment Characteristics in South Toledo Bend
Employment by Class of Employer in South Toledo Bend
Among the 71 employed individuals in South Toledo Bend, private company employees (63 | 88.7%), self-employed (not incorporated) (5 | 7.0%), and federal government employees (3 | 4.2%) make up the most common classes of employment.
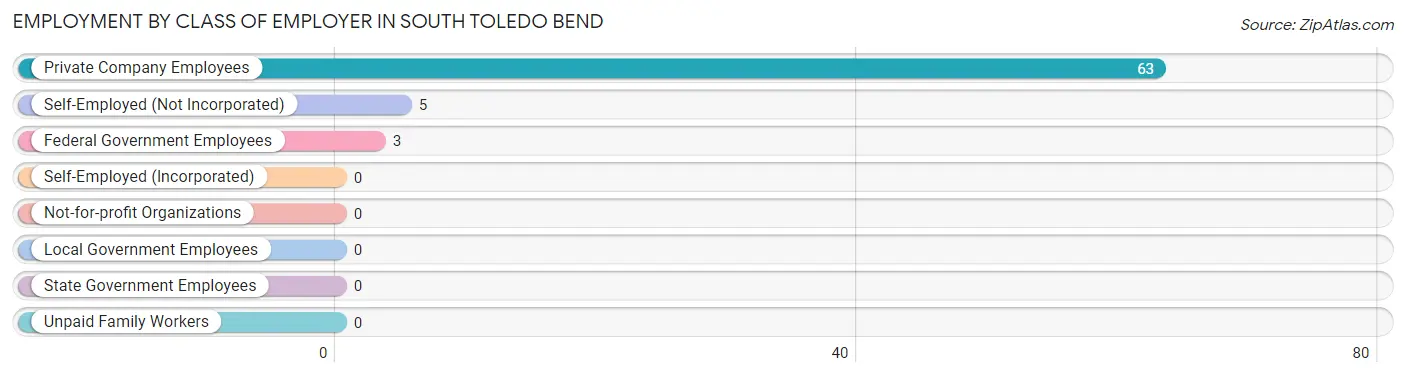
| Employer Class | # Employees | % Employees |
| Private Company Employees | 63 | 88.7% |
| Self-Employed (Incorporated) | 0 | 0.0% |
| Self-Employed (Not Incorporated) | 5 | 7.0% |
| Not-for-profit Organizations | 0 | 0.0% |
| Local Government Employees | 0 | 0.0% |
| State Government Employees | 0 | 0.0% |
| Federal Government Employees | 3 | 4.2% |
| Unpaid Family Workers | 0 | 0.0% |
| Total | 71 | 100.0% |
Employment Status by Age in South Toledo Bend
According to the labor force statistics for South Toledo Bend, out of the total population over 16 years of age (368), 30.2% or 111 individuals are in the labor force, with 4.5% or 5 of them unemployed. The age group with the highest labor force participation rate is 20 to 24 years, with 100.0% or 35 individuals in the labor force. Within the labor force, the 45 to 54 years age range has the highest percentage of unemployed individuals, with 12.2% or 5 of them being unemployed.
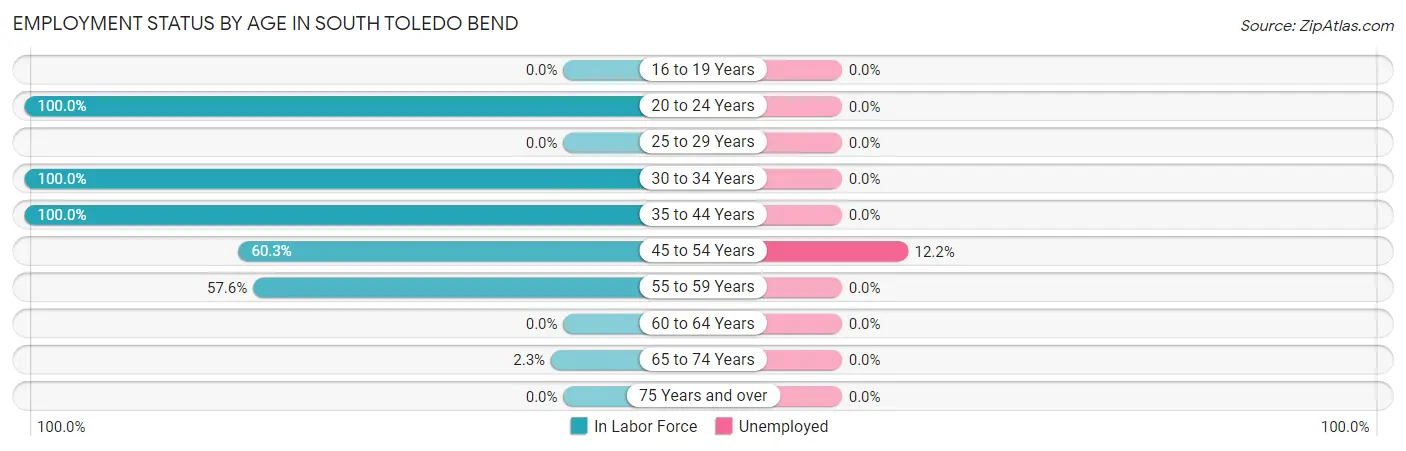
| Age Bracket | In Labor Force | Unemployed |
| 16 to 19 Years | 0 (0.0%) | 0 (0.0%) |
| 20 to 24 Years | 35 (100.0%) | 0 (0.0%) |
| 25 to 29 Years | 0 (0.0%) | 0 (0.0%) |
| 30 to 34 Years | 9 (100.0%) | 0 (0.0%) |
| 35 to 44 Years | 5 (100.0%) | 0 (0.0%) |
| 45 to 54 Years | 41 (60.3%) | 5 (12.2%) |
| 55 to 59 Years | 19 (57.6%) | 0 (0.0%) |
| 60 to 64 Years | 0 (0.0%) | 0 (0.0%) |
| 65 to 74 Years | 2 (2.3%) | 0 (0.0%) |
| 75 Years and over | 0 (0.0%) | 0 (0.0%) |
| Total | 111 (30.2%) | 5 (4.5%) |
Employment Status by Educational Attainment in South Toledo Bend
According to labor force statistics for South Toledo Bend, 37.8% of individuals (74) out of the total population between 25 and 64 years of age (196) are in the labor force, with 6.8% or 5 of them being unemployed. The group with the highest labor force participation rate are those with the educational attainment of college / associate degree, with 49.0% or 51 individuals in the labor force. Within the labor force, individuals with less than high school education have the highest percentage of unemployment, with 100.0% or 5 of them being unemployed.
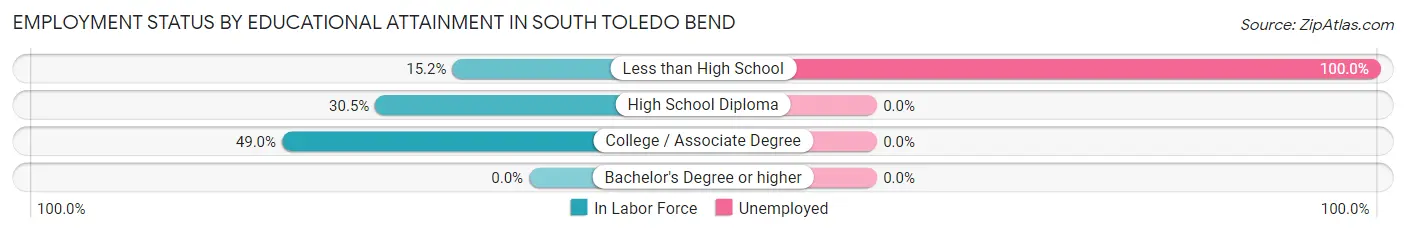
| Educational Attainment | In Labor Force | Unemployed |
| Less than High School | 5 (15.2%) | 33 (100.0%) |
| High School Diploma | 18 (30.5%) | 0 (0.0%) |
| College / Associate Degree | 51 (49.0%) | 0 (0.0%) |
| Bachelor's Degree or higher | 0 (0.0%) | 0 (0.0%) |
| Total | 74 (37.8%) | 13 (6.8%) |
Employment Occupations by Sex in South Toledo Bend
Management, Business, Science and Arts Occupations
The most common Management, Business, Science and Arts occupations in South Toledo Bend are , and Management (2 | 1.9%).
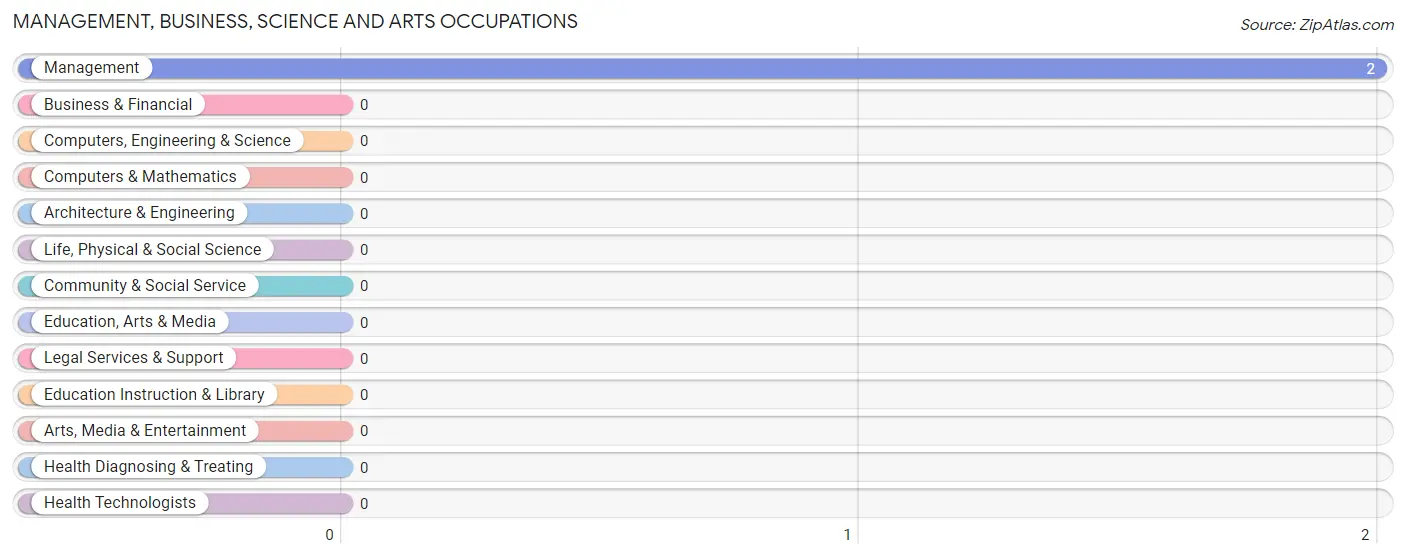
Management, Business, Science and Arts Occupations by Sex
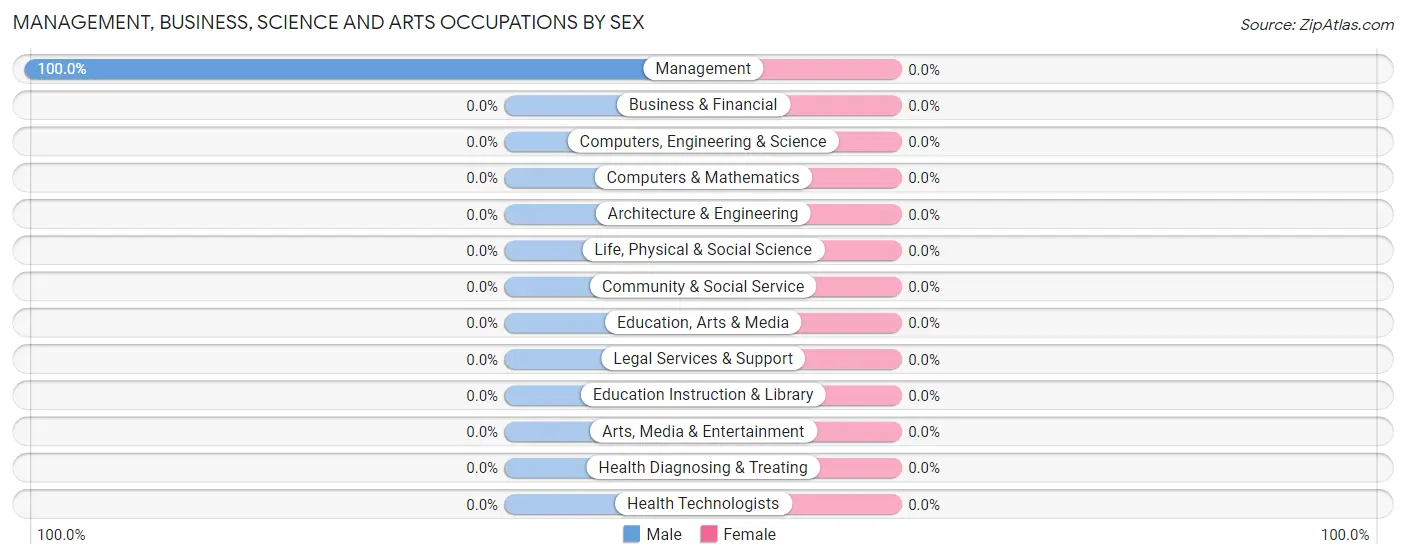
| Occupation | Male | Female |
| Management | 2 (100.0%) | 0 (0.0%) |
| Business & Financial | 0 (0.0%) | 0 (0.0%) |
| Computers, Engineering & Science | 0 (0.0%) | 0 (0.0%) |
| Computers & Mathematics | 0 (0.0%) | 0 (0.0%) |
| Architecture & Engineering | 0 (0.0%) | 0 (0.0%) |
| Life, Physical & Social Science | 0 (0.0%) | 0 (0.0%) |
| Community & Social Service | 0 (0.0%) | 0 (0.0%) |
| Education, Arts & Media | 0 (0.0%) | 0 (0.0%) |
| Legal Services & Support | 0 (0.0%) | 0 (0.0%) |
| Education Instruction & Library | 0 (0.0%) | 0 (0.0%) |
| Arts, Media & Entertainment | 0 (0.0%) | 0 (0.0%) |
| Health Diagnosing & Treating | 0 (0.0%) | 0 (0.0%) |
| Health Technologists | 0 (0.0%) | 0 (0.0%) |
| Total (Category) | 2 (100.0%) | 0 (0.0%) |
| Total (Overall) | 100 (94.3%) | 6 (5.7%) |
Services Occupations
The most common Services occupations in South Toledo Bend are , and Cleaning & Maintenance (5 | 4.7%).
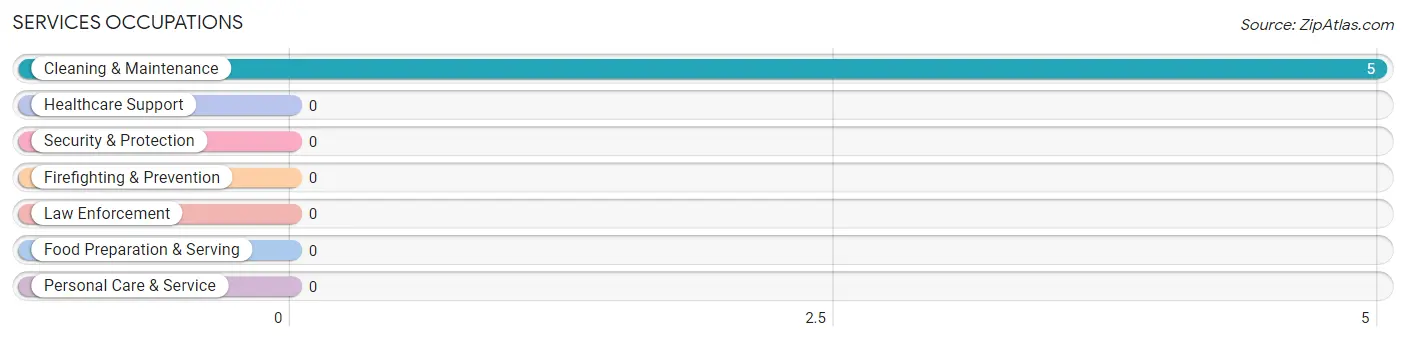
Services Occupations by Sex
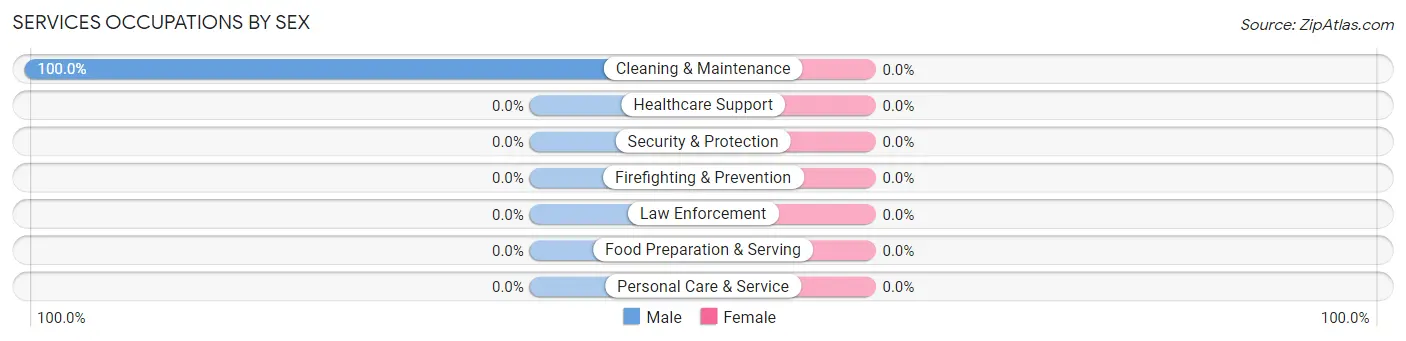
| Occupation | Male | Female |
| Healthcare Support | 0 (0.0%) | 0 (0.0%) |
| Security & Protection | 0 (0.0%) | 0 (0.0%) |
| Firefighting & Prevention | 0 (0.0%) | 0 (0.0%) |
| Law Enforcement | 0 (0.0%) | 0 (0.0%) |
| Food Preparation & Serving | 0 (0.0%) | 0 (0.0%) |
| Cleaning & Maintenance | 5 (100.0%) | 0 (0.0%) |
| Personal Care & Service | 0 (0.0%) | 0 (0.0%) |
| Total (Category) | 5 (100.0%) | 0 (0.0%) |
| Total (Overall) | 100 (94.3%) | 6 (5.7%) |
Sales and Office Occupations
The most common Sales and Office occupations in South Toledo Bend are , and Sales & Related (6 | 5.7%).
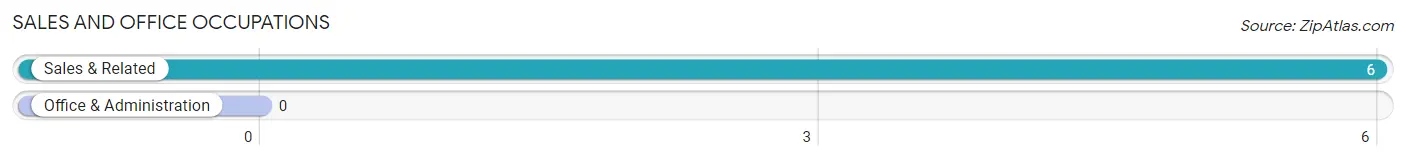
Sales and Office Occupations by Sex
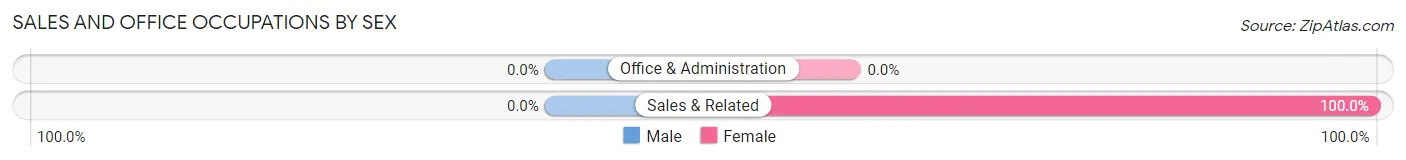
| Occupation | Male | Female |
| Sales & Related | 0 (0.0%) | 6 (100.0%) |
| Office & Administration | 0 (0.0%) | 0 (0.0%) |
| Total (Category) | 0 (0.0%) | 6 (100.0%) |
| Total (Overall) | 100 (94.3%) | 6 (5.7%) |
Natural Resources, Construction and Maintenance Occupations
The most common Natural Resources, Construction and Maintenance occupations in South Toledo Bend are Installation, Maintenance & Repair (36 | 34.0%), Construction & Extraction (12 | 11.3%), and Farming, Fishing & Forestry (10 | 9.4%).
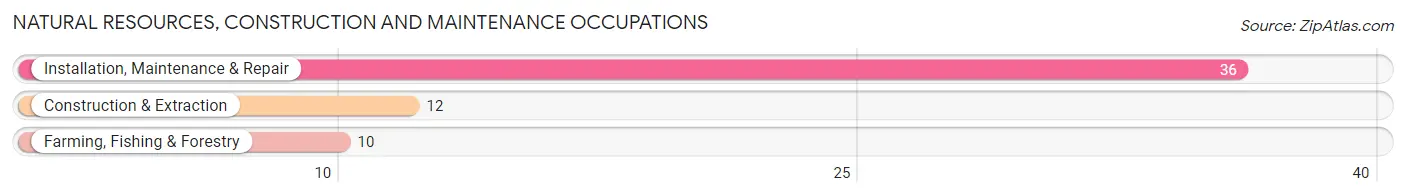
Natural Resources, Construction and Maintenance Occupations by Sex
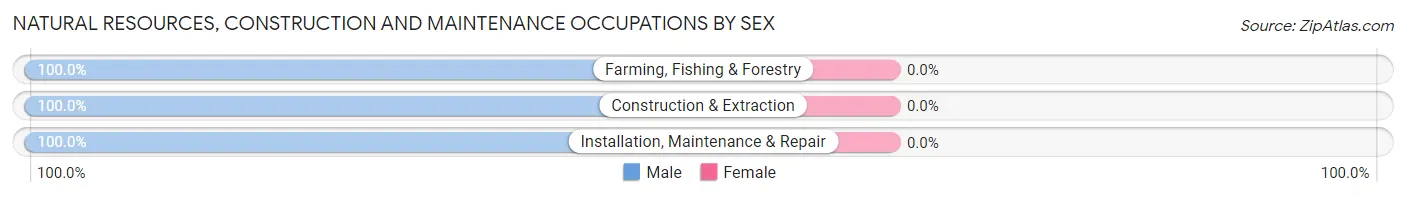
| Occupation | Male | Female |
| Farming, Fishing & Forestry | 10 (100.0%) | 0 (0.0%) |
| Construction & Extraction | 12 (100.0%) | 0 (0.0%) |
| Installation, Maintenance & Repair | 36 (100.0%) | 0 (0.0%) |
| Total (Category) | 58 (100.0%) | 0 (0.0%) |
| Total (Overall) | 100 (94.3%) | 6 (5.7%) |
Production, Transportation and Moving Occupations
The most common Production, Transportation and Moving occupations in South Toledo Bend are , and Material Moving (35 | 33.0%).
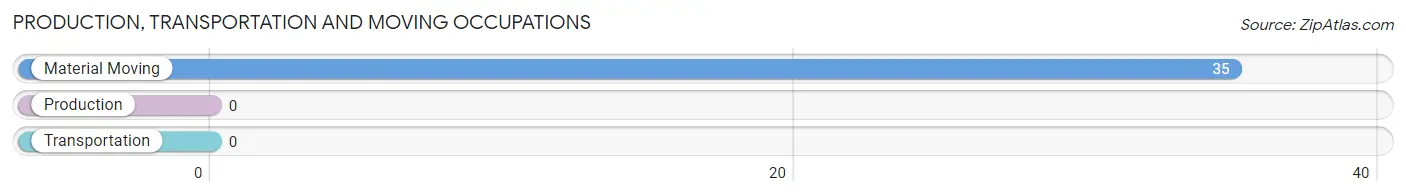
Production, Transportation and Moving Occupations by Sex
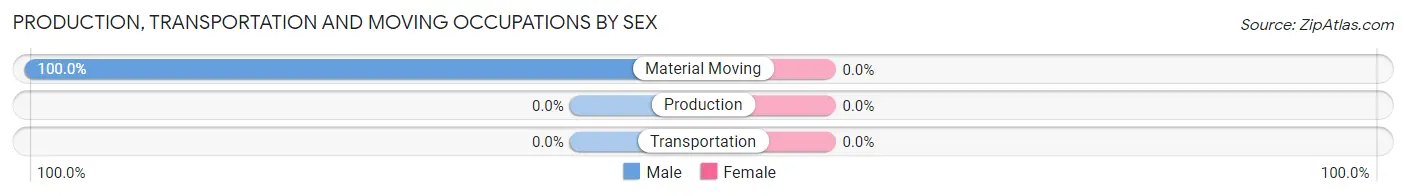
| Occupation | Male | Female |
| Production | 0 (0.0%) | 0 (0.0%) |
| Transportation | 0 (0.0%) | 0 (0.0%) |
| Material Moving | 35 (100.0%) | 0 (0.0%) |
| Total (Category) | 35 (100.0%) | 0 (0.0%) |
| Total (Overall) | 100 (94.3%) | 6 (5.7%) |
Employment Industries by Sex in South Toledo Bend
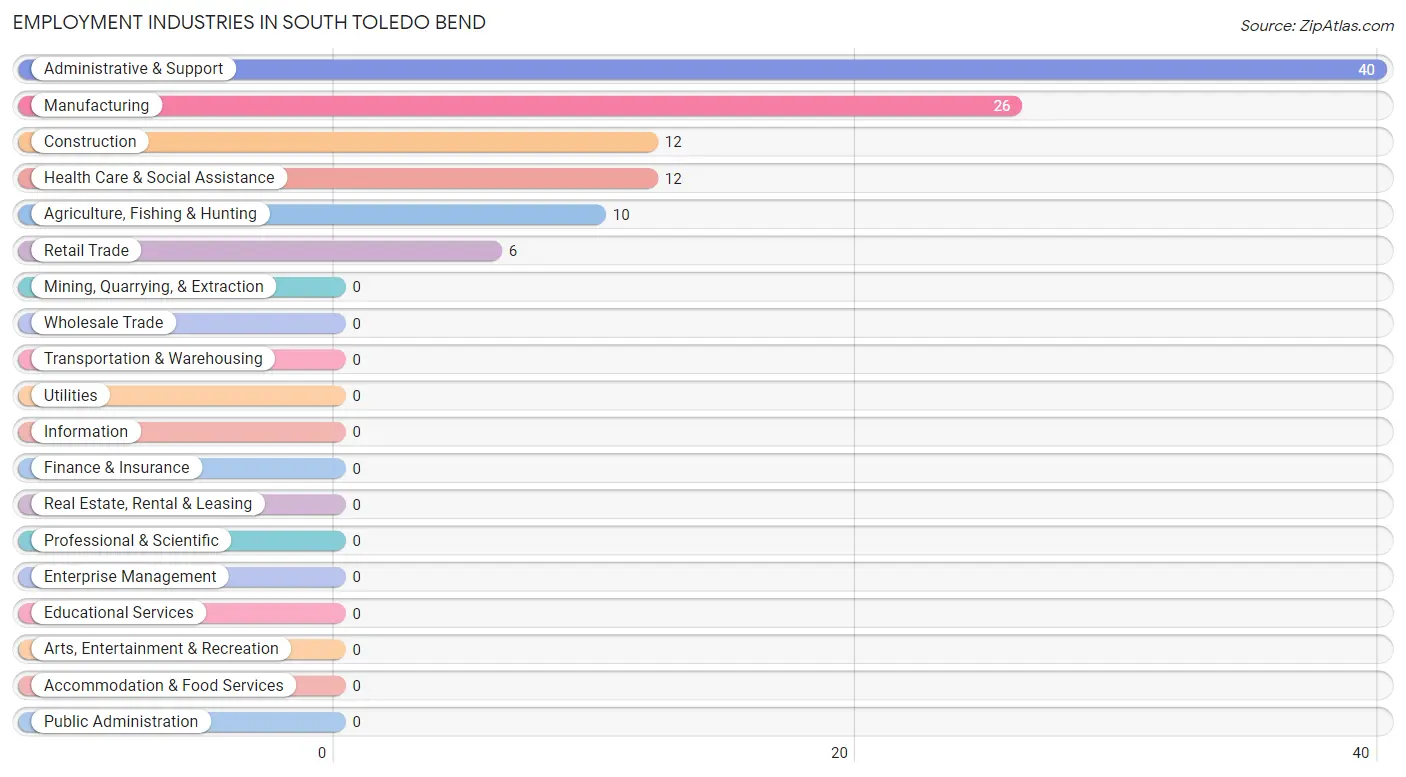
Employment Industries in South Toledo Bend
The major employment industries in South Toledo Bend include Administrative & Support (40 | 37.7%), Manufacturing (26 | 24.5%), Construction (12 | 11.3%), Health Care & Social Assistance (12 | 11.3%), and Agriculture, Fishing & Hunting (10 | 9.4%).
Employment Industries by Sex in South Toledo Bend
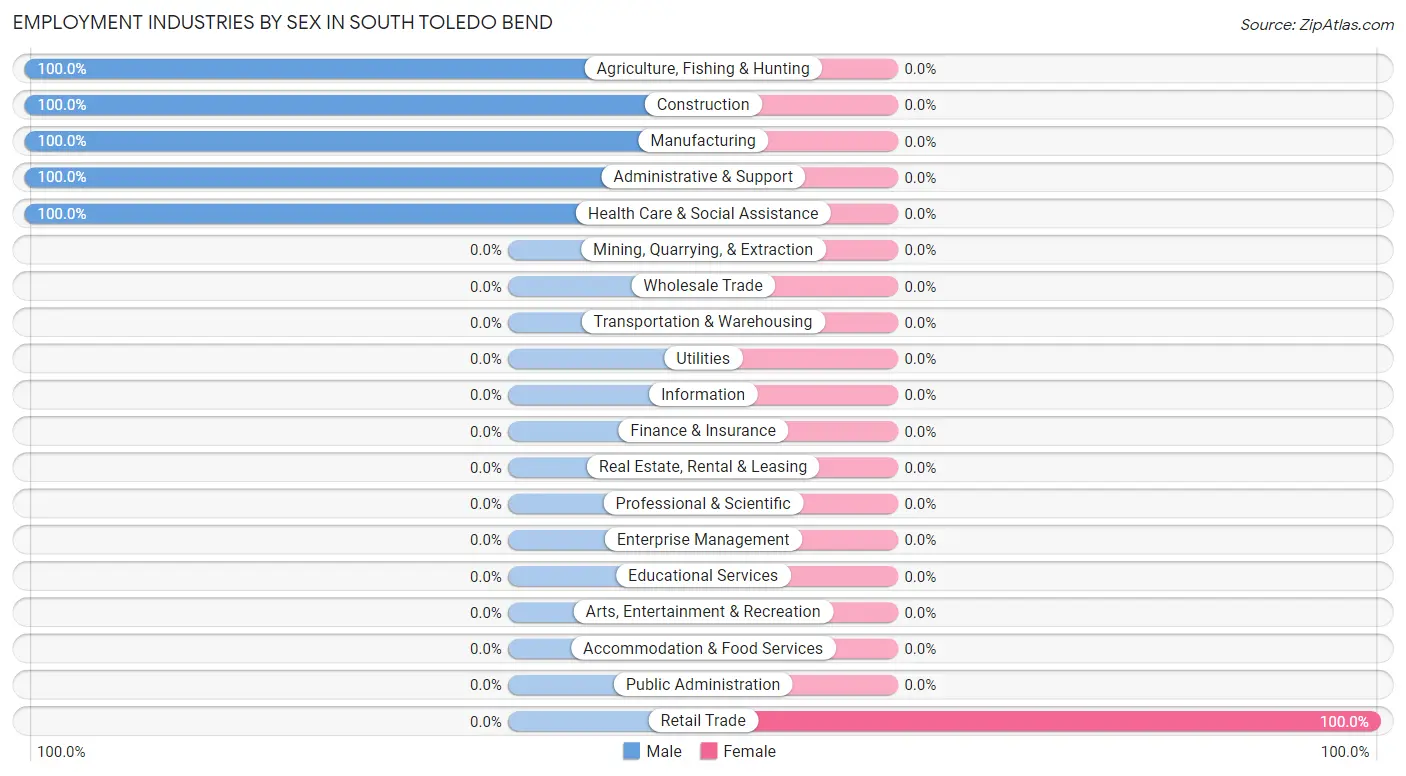
| Industry | Male | Female |
| Agriculture, Fishing & Hunting | 10 (100.0%) | 0 (0.0%) |
| Mining, Quarrying, & Extraction | 0 (0.0%) | 0 (0.0%) |
| Construction | 12 (100.0%) | 0 (0.0%) |
| Manufacturing | 26 (100.0%) | 0 (0.0%) |
| Wholesale Trade | 0 (0.0%) | 0 (0.0%) |
| Retail Trade | 0 (0.0%) | 6 (100.0%) |
| Transportation & Warehousing | 0 (0.0%) | 0 (0.0%) |
| Utilities | 0 (0.0%) | 0 (0.0%) |
| Information | 0 (0.0%) | 0 (0.0%) |
| Finance & Insurance | 0 (0.0%) | 0 (0.0%) |
| Real Estate, Rental & Leasing | 0 (0.0%) | 0 (0.0%) |
| Professional & Scientific | 0 (0.0%) | 0 (0.0%) |
| Enterprise Management | 0 (0.0%) | 0 (0.0%) |
| Administrative & Support | 40 (100.0%) | 0 (0.0%) |
| Educational Services | 0 (0.0%) | 0 (0.0%) |
| Health Care & Social Assistance | 12 (100.0%) | 0 (0.0%) |
| Arts, Entertainment & Recreation | 0 (0.0%) | 0 (0.0%) |
| Accommodation & Food Services | 0 (0.0%) | 0 (0.0%) |
| Public Administration | 0 (0.0%) | 0 (0.0%) |
| Total | 100 (94.3%) | 6 (5.7%) |
Education in South Toledo Bend
School Enrollment in South Toledo Bend
The most common levels of schooling among the 10 students in South Toledo Bend are high school (8 | 80.0%), and elementary school (2 | 20.0%).
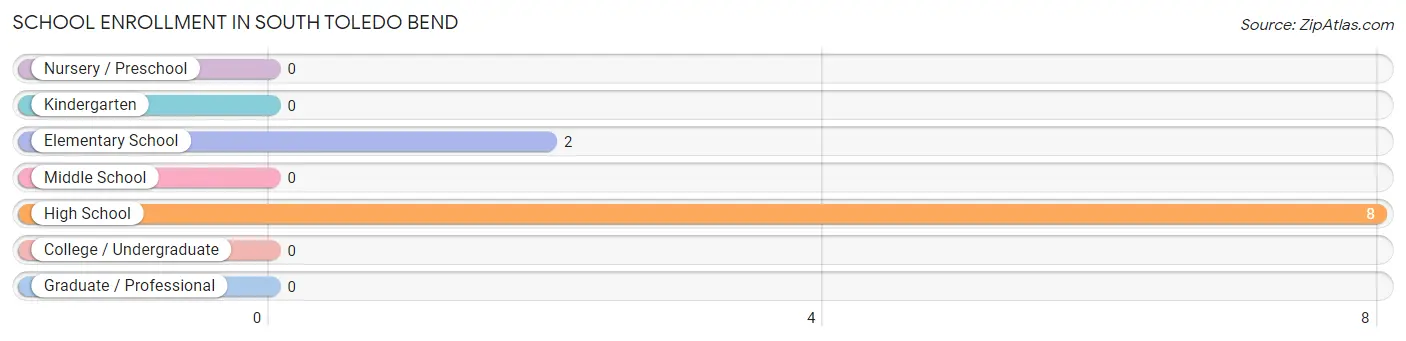
| School Level | # Students | % Students |
| Nursery / Preschool | 0 | 0.0% |
| Kindergarten | 0 | 0.0% |
| Elementary School | 2 | 20.0% |
| Middle School | 0 | 0.0% |
| High School | 8 | 80.0% |
| College / Undergraduate | 0 | 0.0% |
| Graduate / Professional | 0 | 0.0% |
| Total | 10 | 100.0% |
School Enrollment by Age by Funding Source in South Toledo Bend
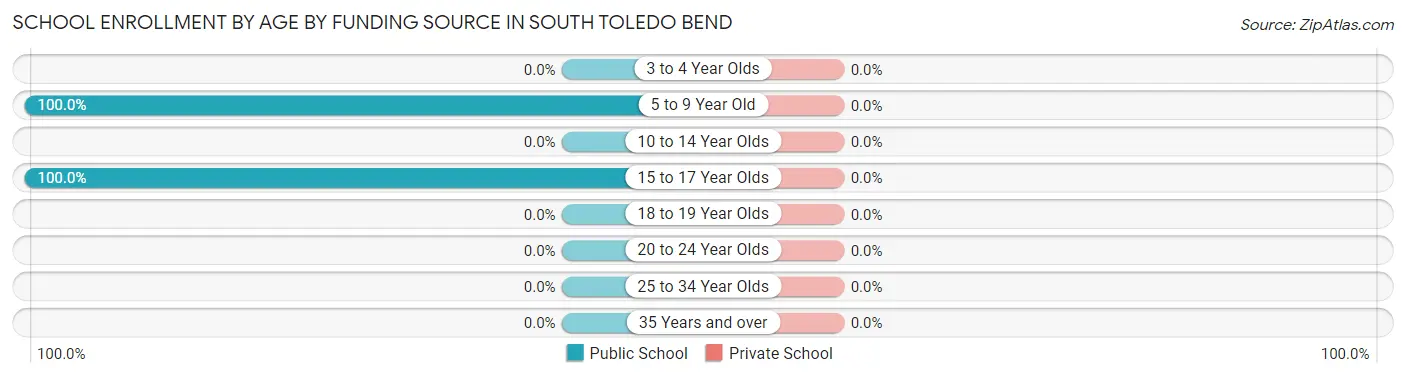
| Age Bracket | Public School | Private School |
| 3 to 4 Year Olds | 0 (0.0%) | 0 (0.0%) |
| 5 to 9 Year Old | 2 (100.0%) | 0 (0.0%) |
| 10 to 14 Year Olds | 0 (0.0%) | 0 (0.0%) |
| 15 to 17 Year Olds | 8 (100.0%) | 0 (0.0%) |
| 18 to 19 Year Olds | 0 (0.0%) | 0 (0.0%) |
| 20 to 24 Year Olds | 0 (0.0%) | 0 (0.0%) |
| 25 to 34 Year Olds | 0 (0.0%) | 0 (0.0%) |
| 35 Years and over | 0 (0.0%) | 0 (0.0%) |
| Total | 10 (100.0%) | 0 (0.0%) |
Educational Attainment by Field of Study in South Toledo Bend
Education (22 | 47.8%), business (15 | 32.6%), psychology (5 | 10.9%), and engineering (4 | 8.7%) are the most common fields of study among 46 individuals in South Toledo Bend who have obtained a bachelor's degree or higher.
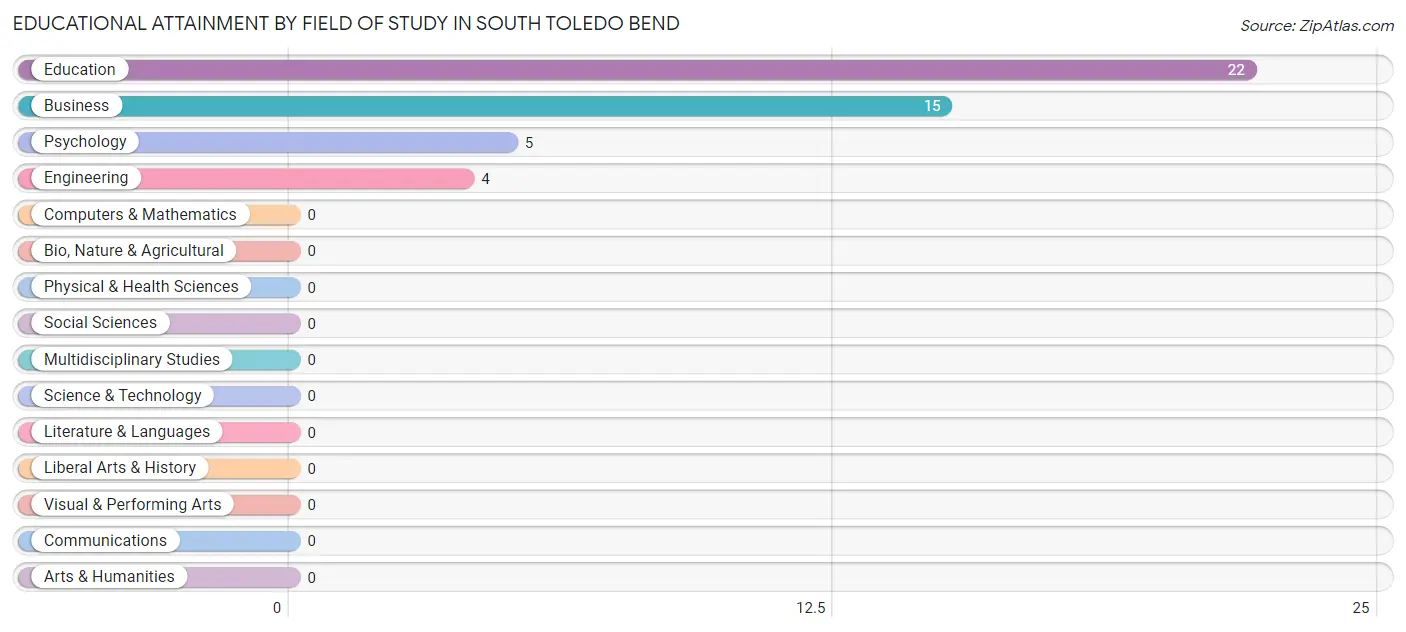
| Field of Study | # Graduates | % Graduates |
| Computers & Mathematics | 0 | 0.0% |
| Bio, Nature & Agricultural | 0 | 0.0% |
| Physical & Health Sciences | 0 | 0.0% |
| Psychology | 5 | 10.9% |
| Social Sciences | 0 | 0.0% |
| Engineering | 4 | 8.7% |
| Multidisciplinary Studies | 0 | 0.0% |
| Science & Technology | 0 | 0.0% |
| Business | 15 | 32.6% |
| Education | 22 | 47.8% |
| Literature & Languages | 0 | 0.0% |
| Liberal Arts & History | 0 | 0.0% |
| Visual & Performing Arts | 0 | 0.0% |
| Communications | 0 | 0.0% |
| Arts & Humanities | 0 | 0.0% |
| Total | 46 | 100.0% |
Transportation & Commute in South Toledo Bend
Vehicle Availability by Sex in South Toledo Bend
The most prevalent vehicle ownership categories in South Toledo Bend are males with 2 vehicles (41, accounting for 63.1%) and females with 2 vehicles (6, making up 683.3%).
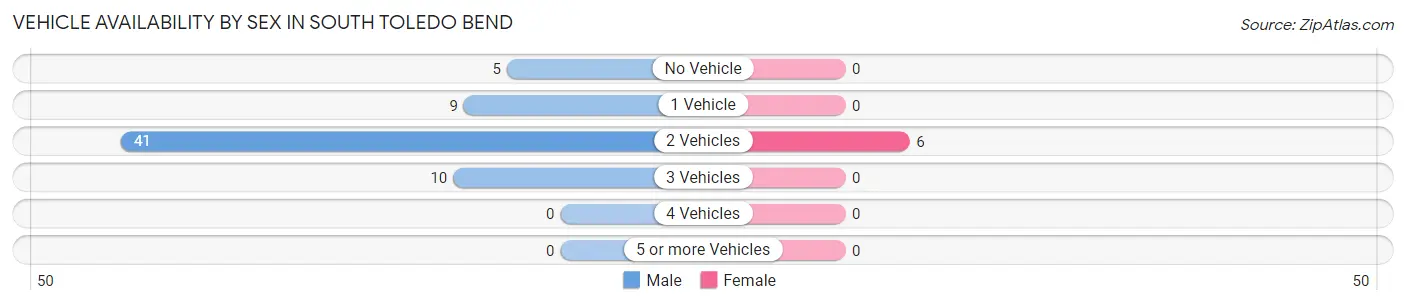
| Vehicles Available | Male | Female |
| No Vehicle | 5 (7.7%) | 0 (0.0%) |
| 1 Vehicle | 9 (13.9%) | 0 (0.0%) |
| 2 Vehicles | 41 (63.1%) | 6 (100.0%) |
| 3 Vehicles | 10 (15.4%) | 0 (0.0%) |
| 4 Vehicles | 0 (0.0%) | 0 (0.0%) |
| 5 or more Vehicles | 0 (0.0%) | 0 (0.0%) |
| Total | 65 (100.0%) | 6 (100.0%) |
Commute Time in South Toledo Bend
The most frequently occuring commute durations in South Toledo Bend are 15 to 19 minutes (14 commuters, 37.8%), 90 or more minutes (9 commuters, 24.3%), and 20 to 24 minutes (6 commuters, 16.2%).
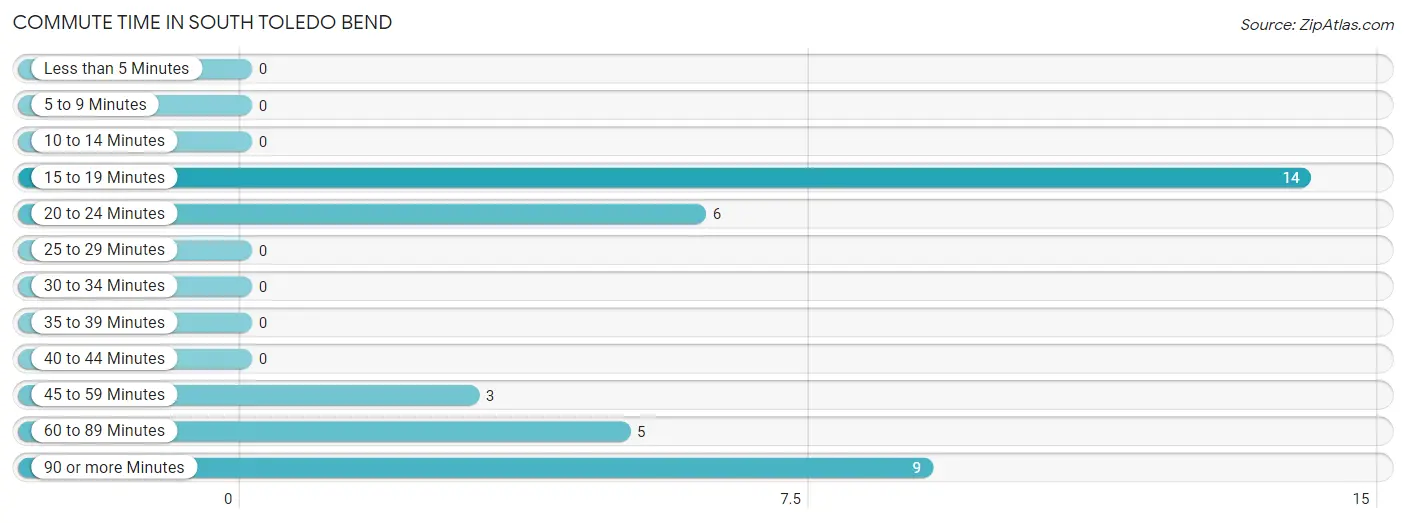
| Commute Time | # Commuters | % Commuters |
| Less than 5 Minutes | 0 | 0.0% |
| 5 to 9 Minutes | 0 | 0.0% |
| 10 to 14 Minutes | 0 | 0.0% |
| 15 to 19 Minutes | 14 | 37.8% |
| 20 to 24 Minutes | 6 | 16.2% |
| 25 to 29 Minutes | 0 | 0.0% |
| 30 to 34 Minutes | 0 | 0.0% |
| 35 to 39 Minutes | 0 | 0.0% |
| 40 to 44 Minutes | 0 | 0.0% |
| 45 to 59 Minutes | 3 | 8.1% |
| 60 to 89 Minutes | 5 | 13.5% |
| 90 or more Minutes | 9 | 24.3% |
Commute Time by Sex in South Toledo Bend
The most common commute times in South Toledo Bend are 15 to 19 minutes (14 commuters, 45.2%) for males and 20 to 24 minutes (6 commuters, 100.0%) for females.
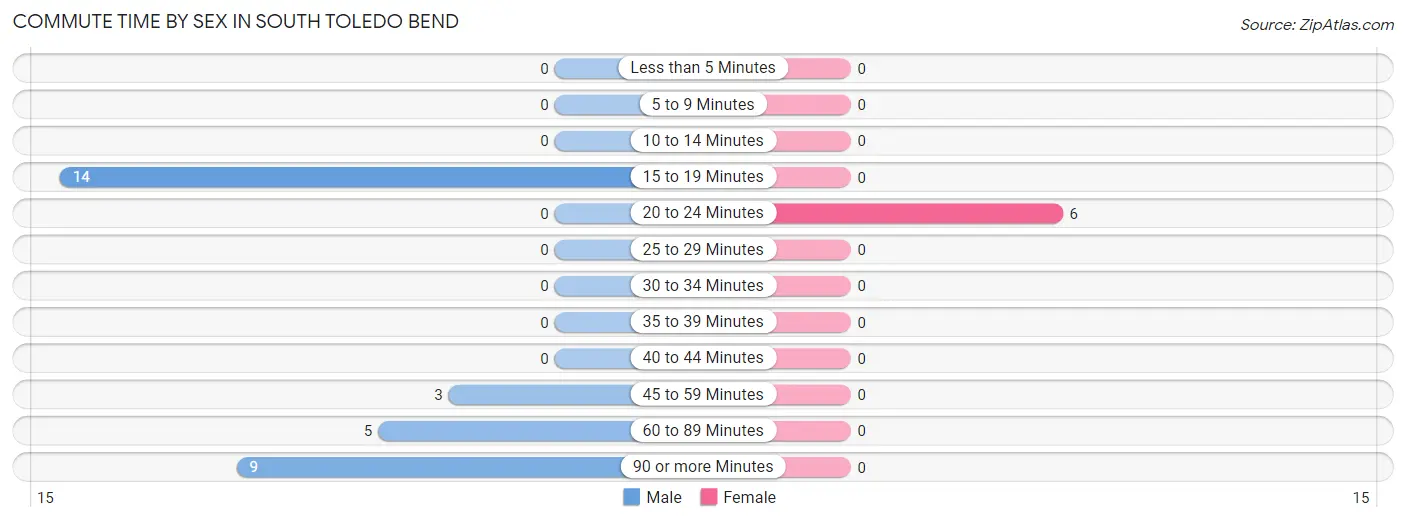
| Commute Time | Male | Female |
| Less than 5 Minutes | 0 (0.0%) | 0 (0.0%) |
| 5 to 9 Minutes | 0 (0.0%) | 0 (0.0%) |
| 10 to 14 Minutes | 0 (0.0%) | 0 (0.0%) |
| 15 to 19 Minutes | 14 (45.2%) | 0 (0.0%) |
| 20 to 24 Minutes | 0 (0.0%) | 6 (100.0%) |
| 25 to 29 Minutes | 0 (0.0%) | 0 (0.0%) |
| 30 to 34 Minutes | 0 (0.0%) | 0 (0.0%) |
| 35 to 39 Minutes | 0 (0.0%) | 0 (0.0%) |
| 40 to 44 Minutes | 0 (0.0%) | 0 (0.0%) |
| 45 to 59 Minutes | 3 (9.7%) | 0 (0.0%) |
| 60 to 89 Minutes | 5 (16.1%) | 0 (0.0%) |
| 90 or more Minutes | 9 (29.0%) | 0 (0.0%) |
Time of Departure to Work by Sex in South Toledo Bend
The most frequent times of departure to work in South Toledo Bend are 7:00 AM to 7:29 AM (12, 38.7%) for males and 12:00 PM to 3:59 PM (6, 100.0%) for females.
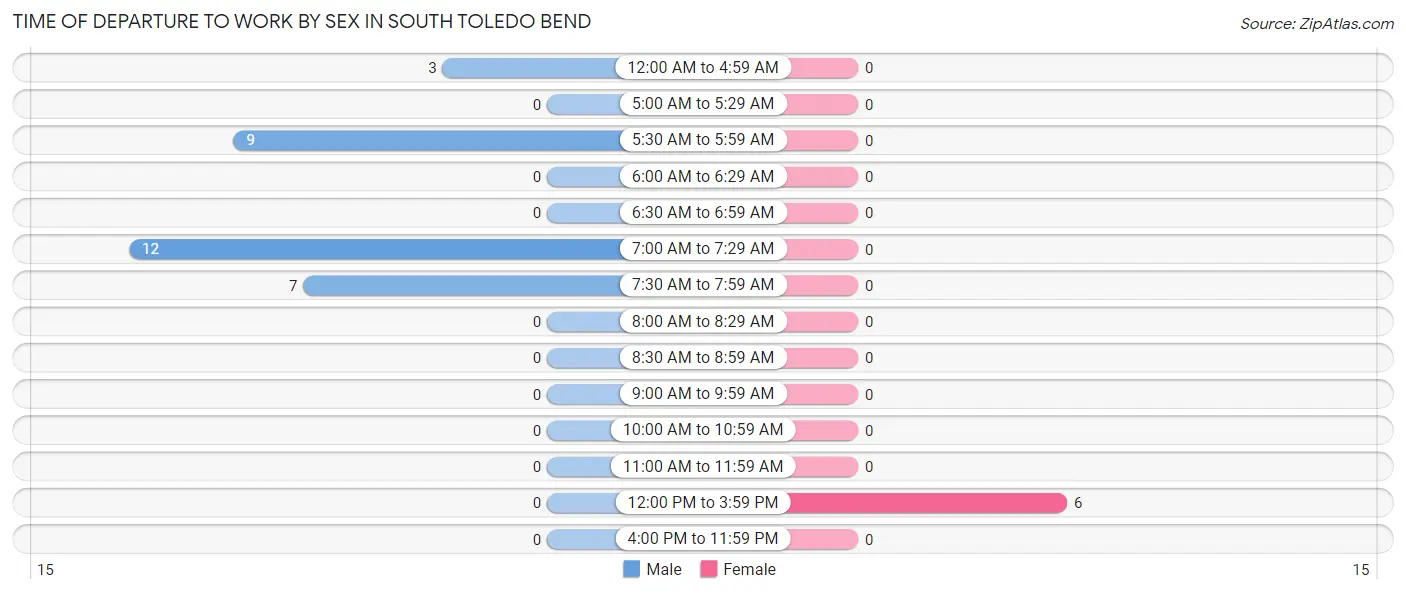
| Time of Departure | Male | Female |
| 12:00 AM to 4:59 AM | 3 (9.7%) | 0 (0.0%) |
| 5:00 AM to 5:29 AM | 0 (0.0%) | 0 (0.0%) |
| 5:30 AM to 5:59 AM | 9 (29.0%) | 0 (0.0%) |
| 6:00 AM to 6:29 AM | 0 (0.0%) | 0 (0.0%) |
| 6:30 AM to 6:59 AM | 0 (0.0%) | 0 (0.0%) |
| 7:00 AM to 7:29 AM | 12 (38.7%) | 0 (0.0%) |
| 7:30 AM to 7:59 AM | 7 (22.6%) | 0 (0.0%) |
| 8:00 AM to 8:29 AM | 0 (0.0%) | 0 (0.0%) |
| 8:30 AM to 8:59 AM | 0 (0.0%) | 0 (0.0%) |
| 9:00 AM to 9:59 AM | 0 (0.0%) | 0 (0.0%) |
| 10:00 AM to 10:59 AM | 0 (0.0%) | 0 (0.0%) |
| 11:00 AM to 11:59 AM | 0 (0.0%) | 0 (0.0%) |
| 12:00 PM to 3:59 PM | 0 (0.0%) | 6 (100.0%) |
| 4:00 PM to 11:59 PM | 0 (0.0%) | 0 (0.0%) |
| Total | 31 (100.0%) | 6 (100.0%) |
Housing Occupancy in South Toledo Bend
Occupancy by Ownership in South Toledo Bend
Of the total 172 dwellings in South Toledo Bend, owner-occupied units account for 156 (90.7%), while renter-occupied units make up 16 (9.3%).
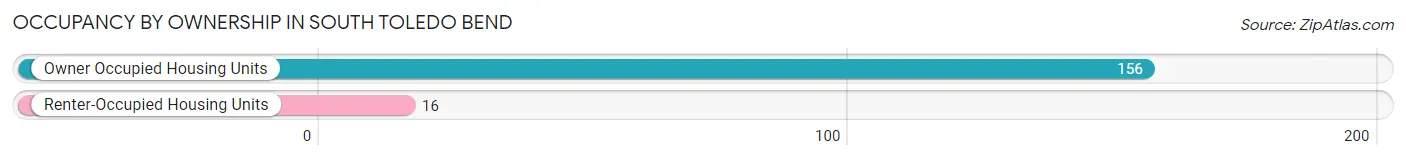
| Occupancy | # Housing Units | % Housing Units |
| Owner Occupied Housing Units | 156 | 90.7% |
| Renter-Occupied Housing Units | 16 | 9.3% |
| Total Occupied Housing Units | 172 | 100.0% |
Occupancy by Household Size in South Toledo Bend
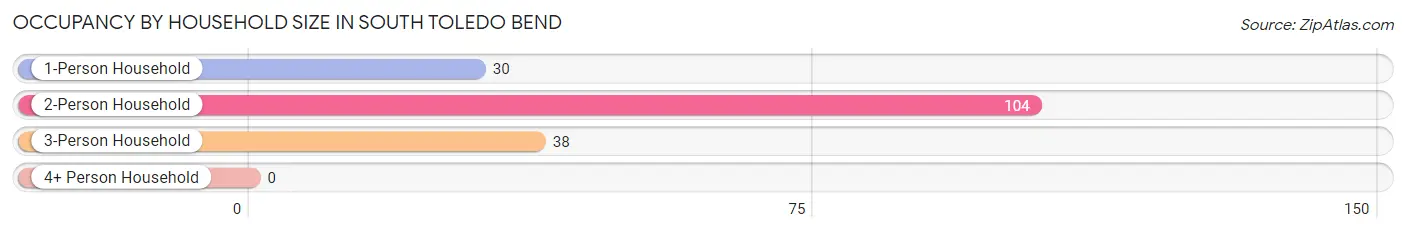
| Household Size | # Housing Units | % Housing Units |
| 1-Person Household | 30 | 17.4% |
| 2-Person Household | 104 | 60.5% |
| 3-Person Household | 38 | 22.1% |
| 4+ Person Household | 0 | 0.0% |
| Total Housing Units | 172 | 100.0% |
Occupancy by Ownership by Household Size in South Toledo Bend
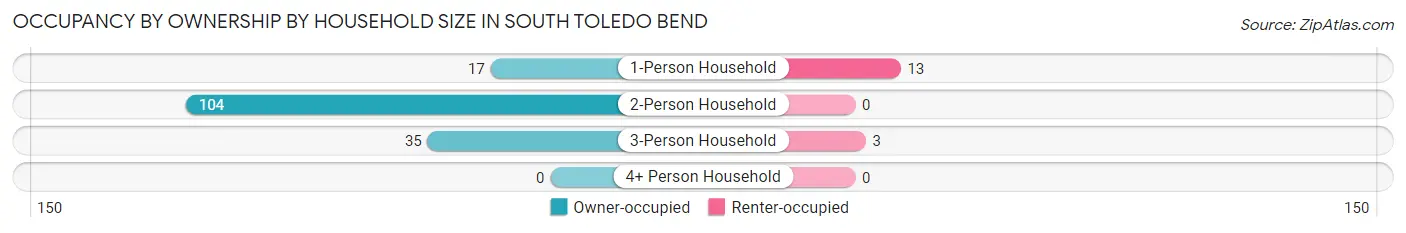
| Household Size | Owner-occupied | Renter-occupied |
| 1-Person Household | 17 (56.7%) | 13 (43.3%) |
| 2-Person Household | 104 (100.0%) | 0 (0.0%) |
| 3-Person Household | 35 (92.1%) | 3 (7.9%) |
| 4+ Person Household | 0 (0.0%) | 0 (0.0%) |
| Total Housing Units | 156 (90.7%) | 16 (9.3%) |
Occupancy by Educational Attainment in South Toledo Bend
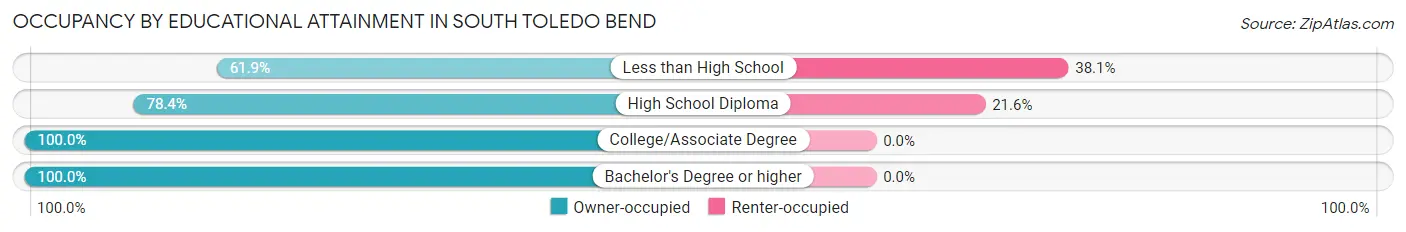
| Household Size | Owner-occupied | Renter-occupied |
| Less than High School | 13 (61.9%) | 8 (38.1%) |
| High School Diploma | 29 (78.4%) | 8 (21.6%) |
| College/Associate Degree | 86 (100.0%) | 0 (0.0%) |
| Bachelor's Degree or higher | 28 (100.0%) | 0 (0.0%) |
Occupancy by Age of Householder in South Toledo Bend
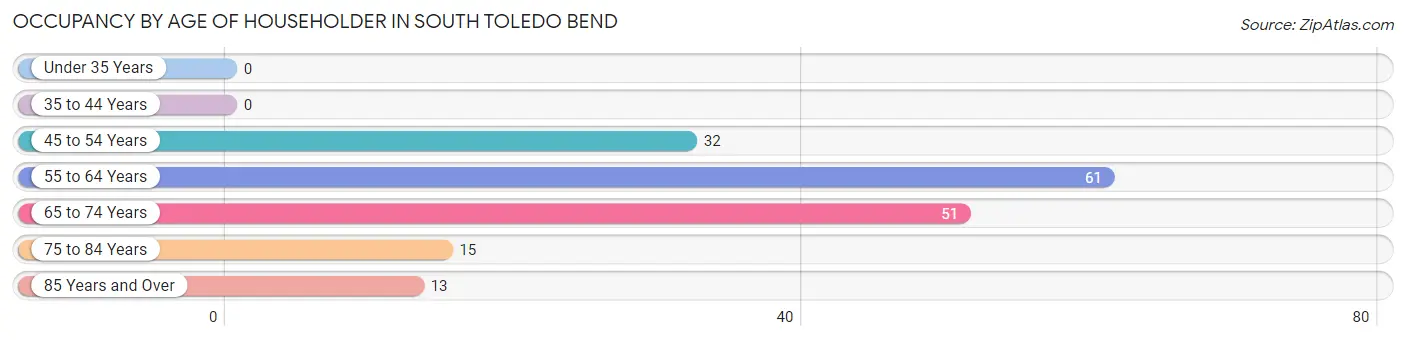
| Age Bracket | # Households | % Households |
| Under 35 Years | 0 | 0.0% |
| 35 to 44 Years | 0 | 0.0% |
| 45 to 54 Years | 32 | 18.6% |
| 55 to 64 Years | 61 | 35.5% |
| 65 to 74 Years | 51 | 29.6% |
| 75 to 84 Years | 15 | 8.7% |
| 85 Years and Over | 13 | 7.6% |
| Total | 172 | 100.0% |
Housing Finances in South Toledo Bend
Median Income by Occupancy in South Toledo Bend
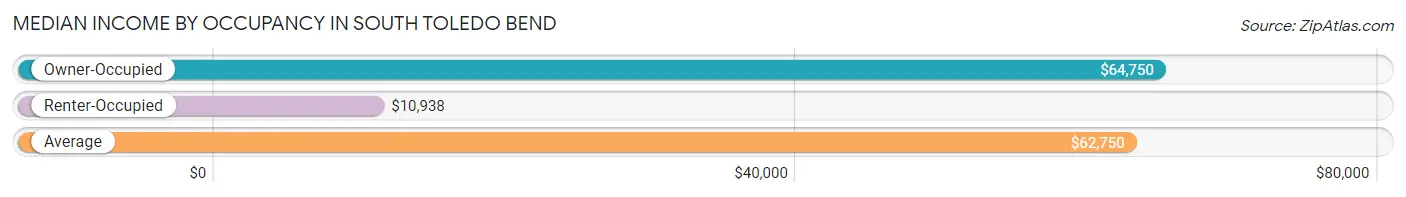
| Occupancy Type | # Households | Median Income |
| Owner-Occupied | 156 (90.7%) | $64,750 |
| Renter-Occupied | 16 (9.3%) | $10,938 |
| Average | 172 (100.0%) | $62,750 |
Occupancy by Householder Income Bracket in South Toledo Bend
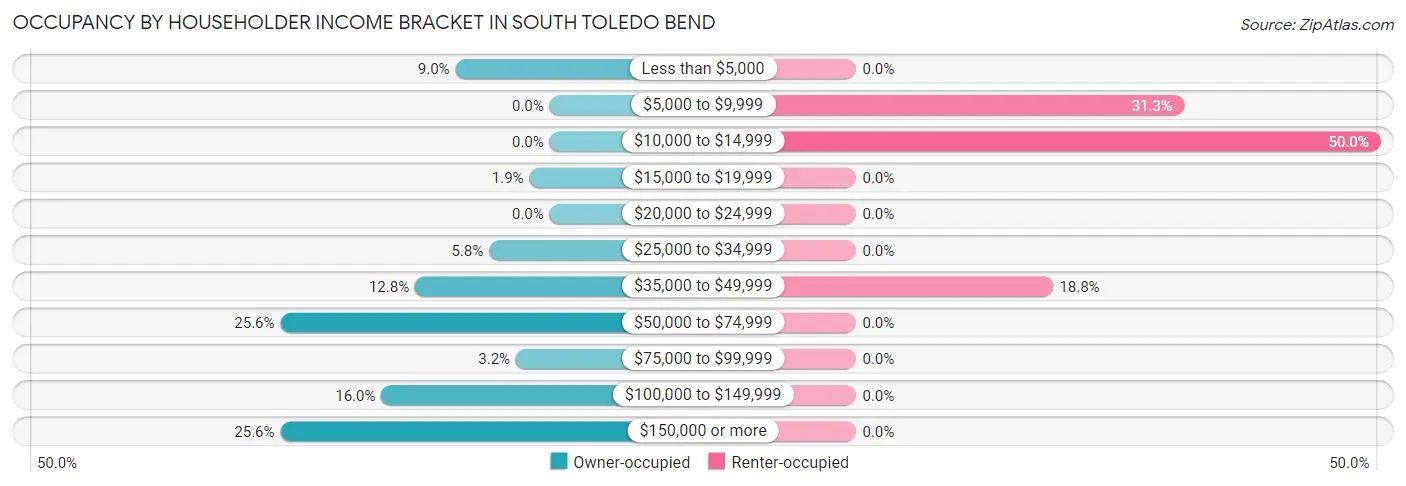
| Income Bracket | Owner-occupied | Renter-occupied |
| Less than $5,000 | 14 (9.0%) | 0 (0.0%) |
| $5,000 to $9,999 | 0 (0.0%) | 5 (31.2%) |
| $10,000 to $14,999 | 0 (0.0%) | 8 (50.0%) |
| $15,000 to $19,999 | 3 (1.9%) | 0 (0.0%) |
| $20,000 to $24,999 | 0 (0.0%) | 0 (0.0%) |
| $25,000 to $34,999 | 9 (5.8%) | 0 (0.0%) |
| $35,000 to $49,999 | 20 (12.8%) | 3 (18.8%) |
| $50,000 to $74,999 | 40 (25.6%) | 0 (0.0%) |
| $75,000 to $99,999 | 5 (3.2%) | 0 (0.0%) |
| $100,000 to $149,999 | 25 (16.0%) | 0 (0.0%) |
| $150,000 or more | 40 (25.6%) | 0 (0.0%) |
| Total | 156 (100.0%) | 16 (100.0%) |
Monthly Housing Cost Tiers in South Toledo Bend
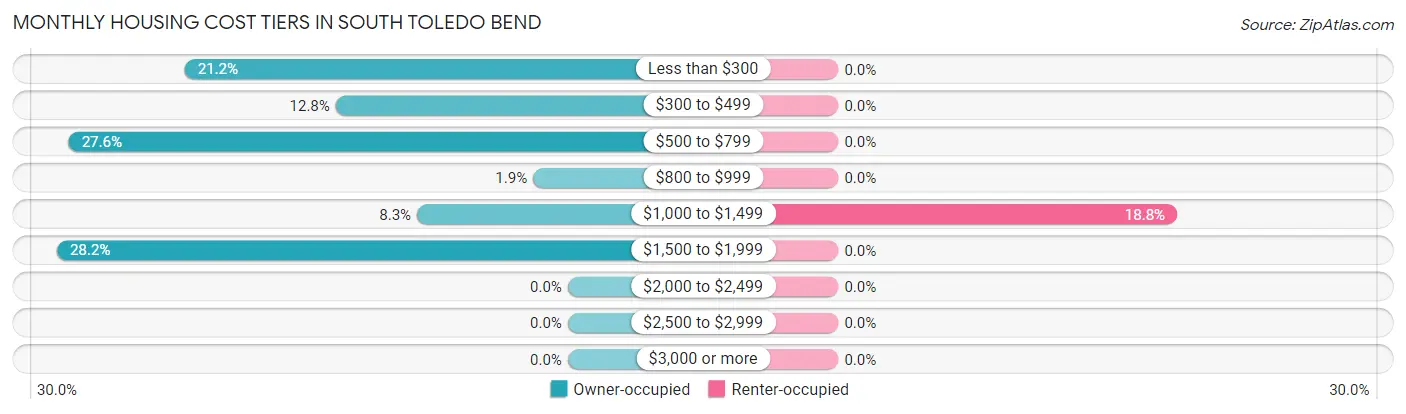
| Monthly Cost | Owner-occupied | Renter-occupied |
| Less than $300 | 33 (21.1%) | 0 (0.0%) |
| $300 to $499 | 20 (12.8%) | 0 (0.0%) |
| $500 to $799 | 43 (27.6%) | 0 (0.0%) |
| $800 to $999 | 3 (1.9%) | 0 (0.0%) |
| $1,000 to $1,499 | 13 (8.3%) | 3 (18.8%) |
| $1,500 to $1,999 | 44 (28.2%) | 0 (0.0%) |
| $2,000 to $2,499 | 0 (0.0%) | 0 (0.0%) |
| $2,500 to $2,999 | 0 (0.0%) | 0 (0.0%) |
| $3,000 or more | 0 (0.0%) | 0 (0.0%) |
| Total | 156 (100.0%) | 16 (100.0%) |
Physical Housing Characteristics in South Toledo Bend
Housing Structures in South Toledo Bend
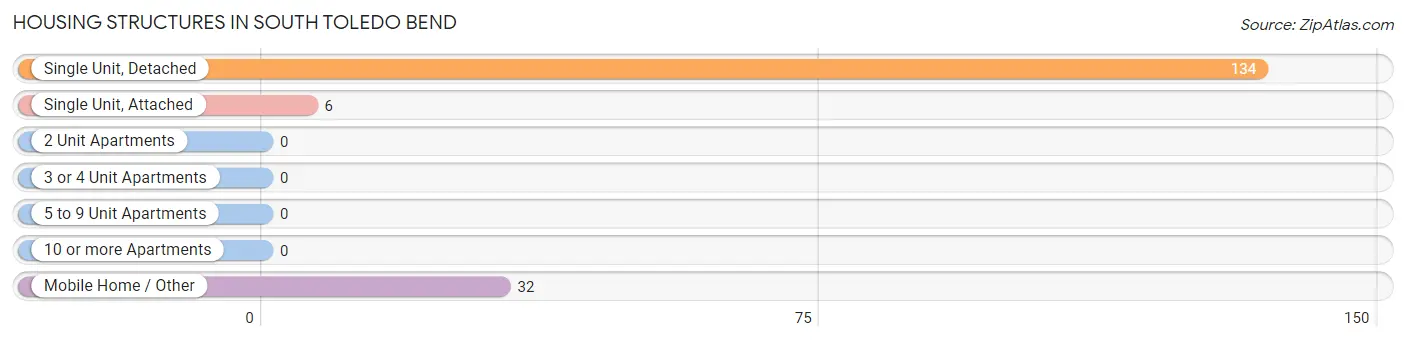
| Structure Type | # Housing Units | % Housing Units |
| Single Unit, Detached | 134 | 77.9% |
| Single Unit, Attached | 6 | 3.5% |
| 2 Unit Apartments | 0 | 0.0% |
| 3 or 4 Unit Apartments | 0 | 0.0% |
| 5 to 9 Unit Apartments | 0 | 0.0% |
| 10 or more Apartments | 0 | 0.0% |
| Mobile Home / Other | 32 | 18.6% |
| Total | 172 | 100.0% |
Housing Structures by Occupancy in South Toledo Bend
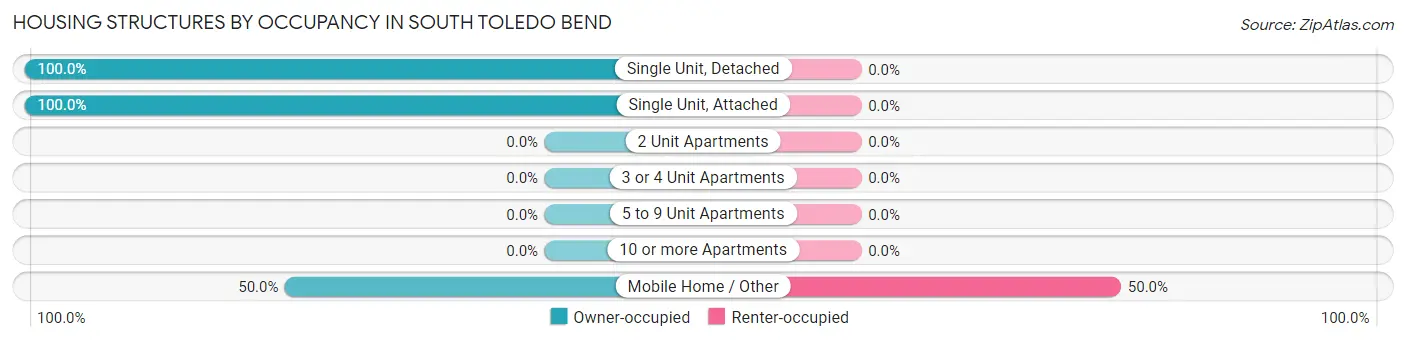
| Structure Type | Owner-occupied | Renter-occupied |
| Single Unit, Detached | 134 (100.0%) | 0 (0.0%) |
| Single Unit, Attached | 6 (100.0%) | 0 (0.0%) |
| 2 Unit Apartments | 0 (0.0%) | 0 (0.0%) |
| 3 or 4 Unit Apartments | 0 (0.0%) | 0 (0.0%) |
| 5 to 9 Unit Apartments | 0 (0.0%) | 0 (0.0%) |
| 10 or more Apartments | 0 (0.0%) | 0 (0.0%) |
| Mobile Home / Other | 16 (50.0%) | 16 (50.0%) |
| Total | 156 (90.7%) | 16 (9.3%) |
Housing Structures by Number of Rooms in South Toledo Bend
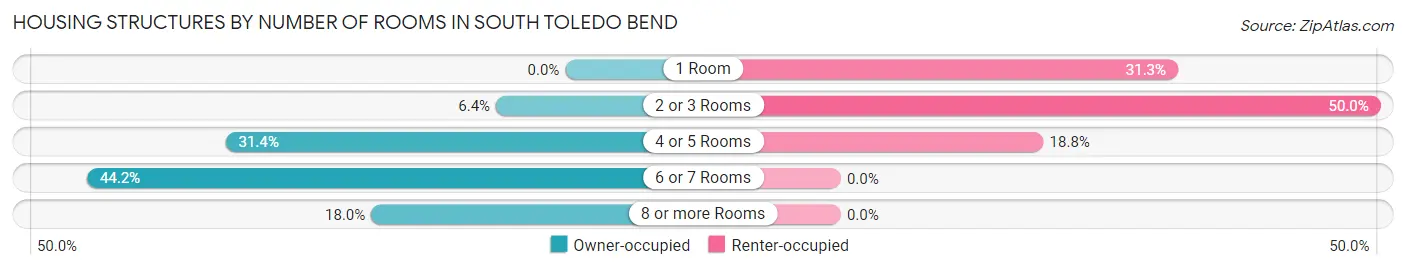
| Number of Rooms | Owner-occupied | Renter-occupied |
| 1 Room | 0 (0.0%) | 5 (31.2%) |
| 2 or 3 Rooms | 10 (6.4%) | 8 (50.0%) |
| 4 or 5 Rooms | 49 (31.4%) | 3 (18.8%) |
| 6 or 7 Rooms | 69 (44.2%) | 0 (0.0%) |
| 8 or more Rooms | 28 (17.9%) | 0 (0.0%) |
| Total | 156 (100.0%) | 16 (100.0%) |
Housing Structure by Heating Type in South Toledo Bend
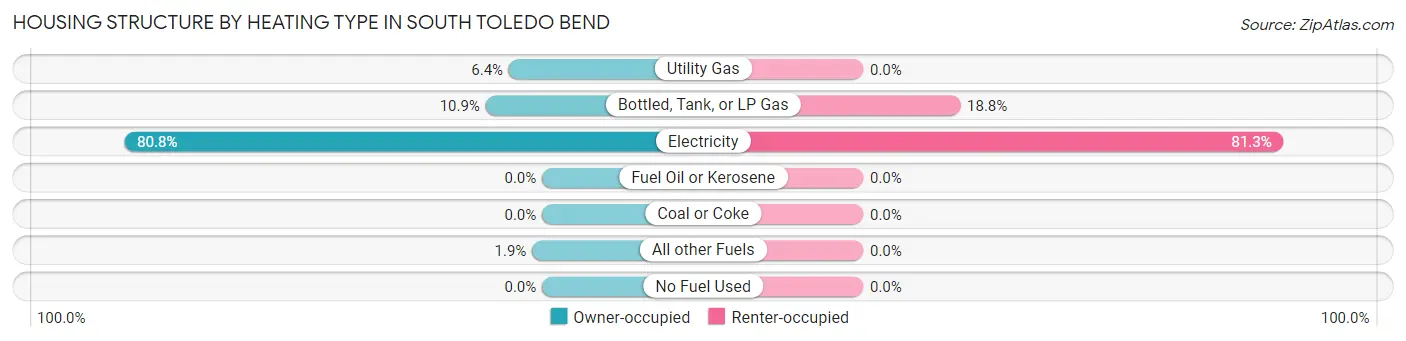
| Heating Type | Owner-occupied | Renter-occupied |
| Utility Gas | 10 (6.4%) | 0 (0.0%) |
| Bottled, Tank, or LP Gas | 17 (10.9%) | 3 (18.8%) |
| Electricity | 126 (80.8%) | 13 (81.2%) |
| Fuel Oil or Kerosene | 0 (0.0%) | 0 (0.0%) |
| Coal or Coke | 0 (0.0%) | 0 (0.0%) |
| All other Fuels | 3 (1.9%) | 0 (0.0%) |
| No Fuel Used | 0 (0.0%) | 0 (0.0%) |
| Total | 156 (100.0%) | 16 (100.0%) |
Household Vehicle Usage in South Toledo Bend
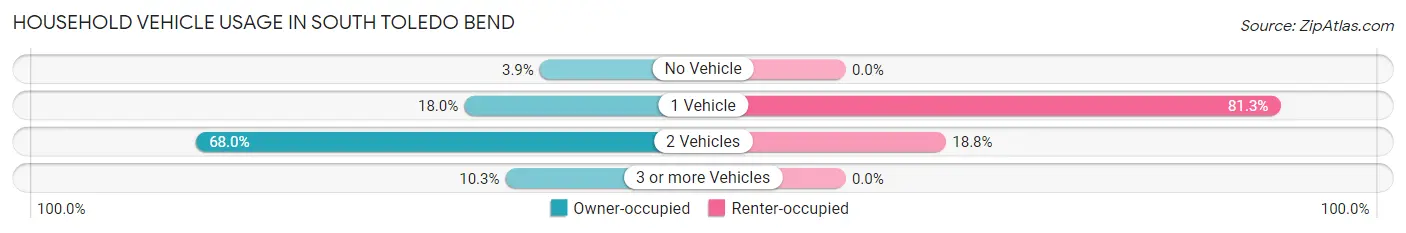
| Vehicles per Household | Owner-occupied | Renter-occupied |
| No Vehicle | 6 (3.8%) | 0 (0.0%) |
| 1 Vehicle | 28 (17.9%) | 13 (81.2%) |
| 2 Vehicles | 106 (67.9%) | 3 (18.8%) |
| 3 or more Vehicles | 16 (10.3%) | 0 (0.0%) |
| Total | 156 (100.0%) | 16 (100.0%) |
Real Estate & Mortgages in South Toledo Bend
Real Estate and Mortgage Overview in South Toledo Bend
| Characteristic | Without Mortgage | With Mortgage |
| Housing Units | 89 | 67 |
| Median Property Value | $108,600 | $0 |
| Median Household Income | $63,125 | $27 |
| Monthly Housing Costs | $439 | $0 |
| Real Estate Taxes | $771 | $0 |
Property Value by Mortgage Status in South Toledo Bend
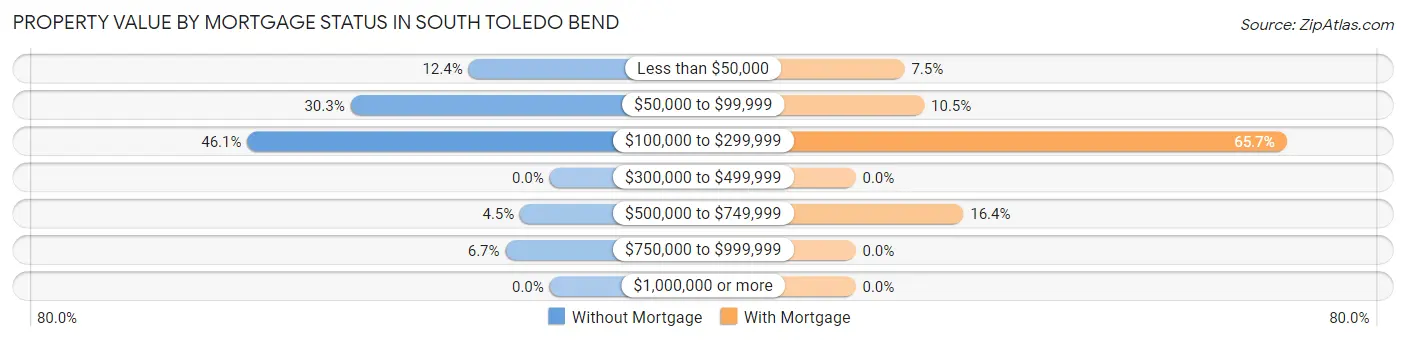
| Property Value | Without Mortgage | With Mortgage |
| Less than $50,000 | 11 (12.4%) | 5 (7.5%) |
| $50,000 to $99,999 | 27 (30.3%) | 7 (10.4%) |
| $100,000 to $299,999 | 41 (46.1%) | 44 (65.7%) |
| $300,000 to $499,999 | 0 (0.0%) | 0 (0.0%) |
| $500,000 to $749,999 | 4 (4.5%) | 11 (16.4%) |
| $750,000 to $999,999 | 6 (6.7%) | 0 (0.0%) |
| $1,000,000 or more | 0 (0.0%) | 0 (0.0%) |
| Total | 89 (100.0%) | 67 (100.0%) |
Household Income by Mortgage Status in South Toledo Bend
| Household Income | Without Mortgage | With Mortgage |
| Less than $10,000 | 14 (15.7%) | 0 (0.0%) |
| $10,000 to $24,999 | 3 (3.4%) | 0 (0.0%) |
| $25,000 to $34,999 | 9 (10.1%) | 0 (0.0%) |
| $35,000 to $49,999 | 12 (13.5%) | 0 (0.0%) |
| $50,000 to $74,999 | 21 (23.6%) | 8 (11.9%) |
| $75,000 to $99,999 | 3 (3.4%) | 19 (28.4%) |
| $100,000 to $149,999 | 14 (15.7%) | 2 (3.0%) |
| $150,000 or more | 13 (14.6%) | 11 (16.4%) |
| Total | 89 (100.0%) | 67 (100.0%) |
Property Value to Household Income Ratio in South Toledo Bend
| Value-to-Income Ratio | Without Mortgage | With Mortgage |
| Less than 2.0x | 49 (55.1%) | 121,023 (180,631.3%) |
| 2.0x to 2.9x | 0 (0.0%) | 39 (58.2%) |
| 3.0x to 3.9x | 16 (18.0%) | 2 (3.0%) |
| 4.0x or more | 24 (27.0%) | 0 (0.0%) |
| Total | 89 (100.0%) | 67 (100.0%) |
Real Estate Taxes by Mortgage Status in South Toledo Bend
| Property Taxes | Without Mortgage | With Mortgage |
| Less than $800 | 39 (43.8%) | 0 (0.0%) |
| $800 to $1,499 | 11 (12.4%) | 5 (7.5%) |
| $800 to $1,499 | 24 (27.0%) | 9 (13.4%) |
| Total | 89 (100.0%) | 67 (100.0%) |
Health & Disability in South Toledo Bend
Health Insurance Coverage by Age in South Toledo Bend
| Age Bracket | With Coverage | Without Coverage |
| Under 6 Years | 2 (100.0%) | 0 (0.0%) |
| 6 to 18 Years | 10 (100.0%) | 0 (0.0%) |
| 19 to 25 Years | 0 (0.0%) | 35 (100.0%) |
| 26 to 34 Years | 9 (100.0%) | 0 (0.0%) |
| 35 to 44 Years | 5 (100.0%) | 0 (0.0%) |
| 45 to 54 Years | 63 (92.6%) | 5 (7.3%) |
| 55 to 64 Years | 93 (81.6%) | 21 (18.4%) |
| 65 to 74 Years | 86 (100.0%) | 0 (0.0%) |
| 75 Years and older | 43 (100.0%) | 0 (0.0%) |
| Total | 311 (83.6%) | 61 (16.4%) |
Health Insurance Coverage by Citizenship Status in South Toledo Bend
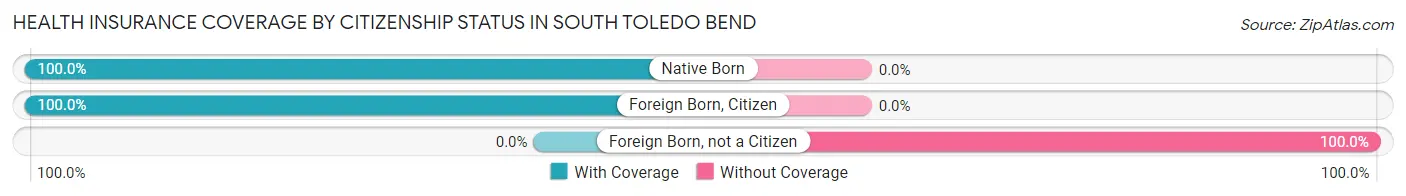
| Citizenship Status | With Coverage | Without Coverage |
| Native Born | 2 (100.0%) | 0 (0.0%) |
| Foreign Born, Citizen | 10 (100.0%) | 0 (0.0%) |
| Foreign Born, not a Citizen | 0 (0.0%) | 35 (100.0%) |
Health Insurance Coverage by Household Income in South Toledo Bend
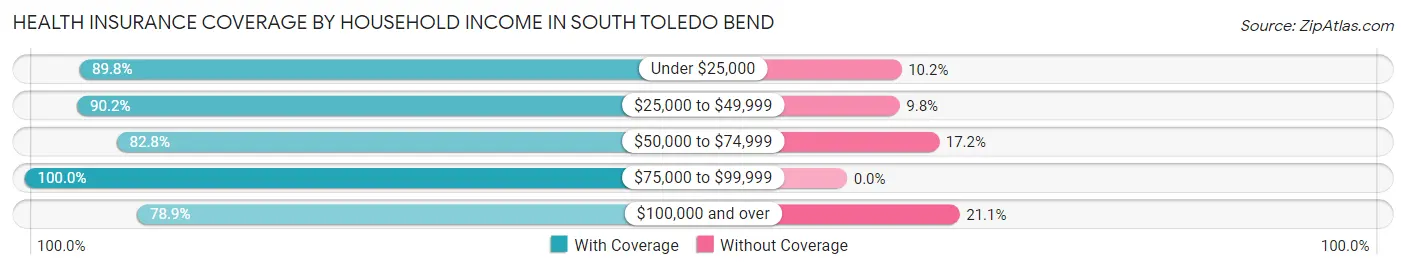
| Household Income | With Coverage | Without Coverage |
| Under $25,000 | 44 (89.8%) | 5 (10.2%) |
| $25,000 to $49,999 | 55 (90.2%) | 6 (9.8%) |
| $50,000 to $74,999 | 72 (82.8%) | 15 (17.2%) |
| $75,000 to $99,999 | 9 (100.0%) | 0 (0.0%) |
| $100,000 and over | 131 (78.9%) | 35 (21.1%) |
Public vs Private Health Insurance Coverage by Age in South Toledo Bend
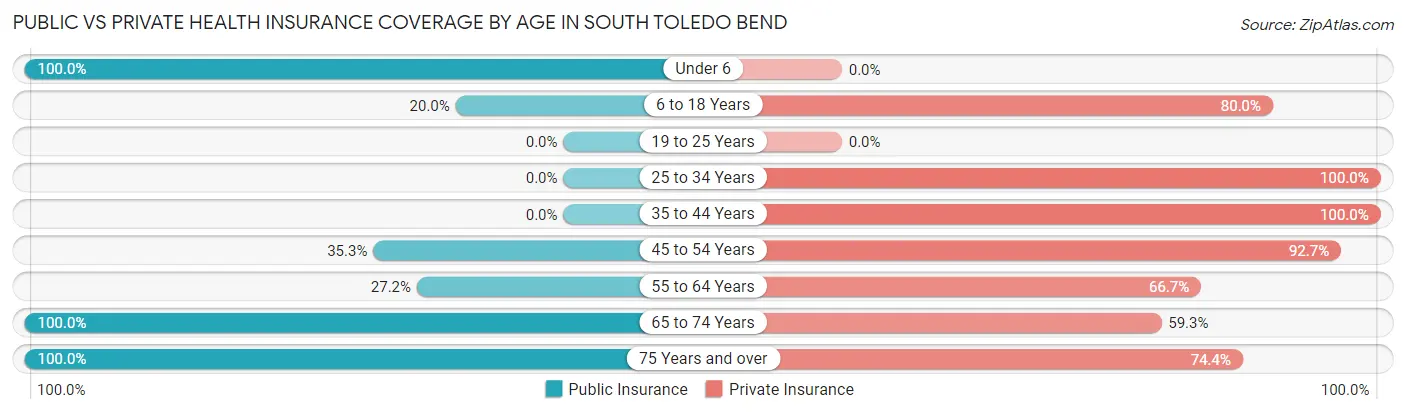
| Age Bracket | Public Insurance | Private Insurance |
| Under 6 | 2 (100.0%) | 0 (0.0%) |
| 6 to 18 Years | 2 (20.0%) | 8 (80.0%) |
| 19 to 25 Years | 0 (0.0%) | 0 (0.0%) |
| 25 to 34 Years | 0 (0.0%) | 9 (100.0%) |
| 35 to 44 Years | 0 (0.0%) | 5 (100.0%) |
| 45 to 54 Years | 24 (35.3%) | 63 (92.6%) |
| 55 to 64 Years | 31 (27.2%) | 76 (66.7%) |
| 65 to 74 Years | 86 (100.0%) | 51 (59.3%) |
| 75 Years and over | 43 (100.0%) | 32 (74.4%) |
| Total | 188 (50.5%) | 244 (65.6%) |
Disability Status by Sex by Age in South Toledo Bend
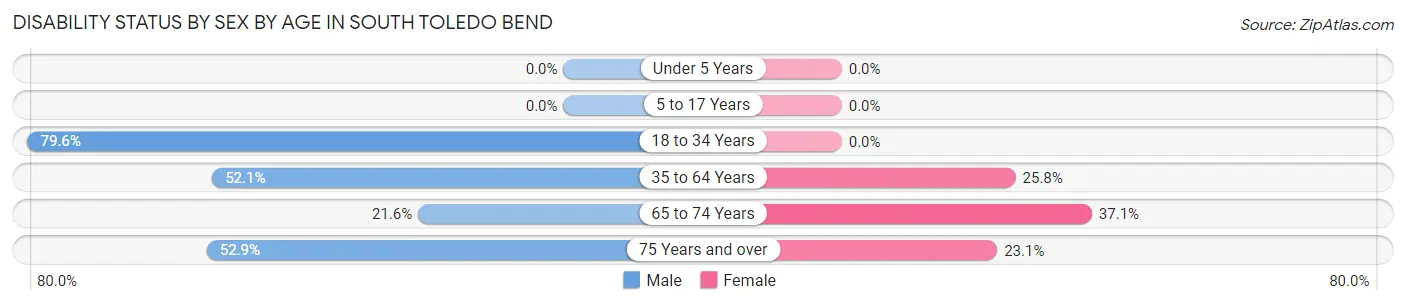
| Age Bracket | Male | Female |
| Under 5 Years | 0 (0.0%) | 0 (0.0%) |
| 5 to 17 Years | 0 (0.0%) | 0 (0.0%) |
| 18 to 34 Years | 35 (79.5%) | 0 (0.0%) |
| 35 to 64 Years | 49 (52.1%) | 24 (25.8%) |
| 65 to 74 Years | 11 (21.6%) | 13 (37.1%) |
| 75 Years and over | 9 (52.9%) | 6 (23.1%) |
Disability Class by Sex by Age in South Toledo Bend
Disability Class: Hearing Difficulty
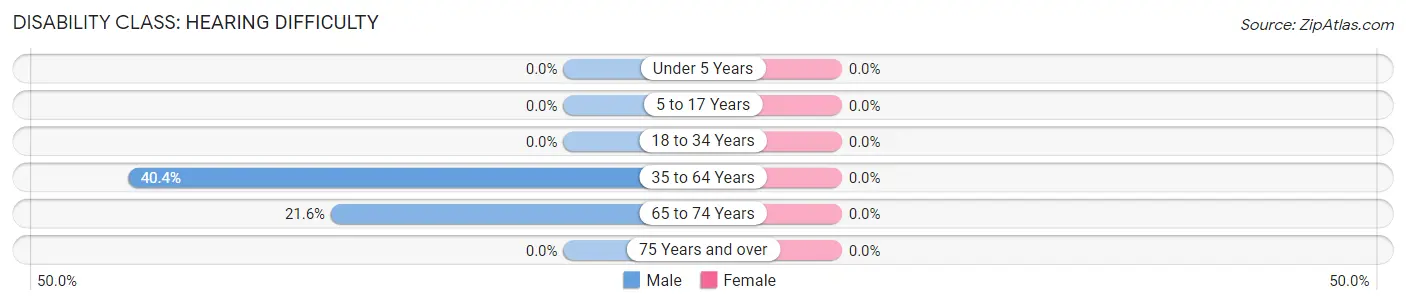
| Age Bracket | Male | Female |
| Under 5 Years | 0 (0.0%) | 0 (0.0%) |
| 5 to 17 Years | 0 (0.0%) | 0 (0.0%) |
| 18 to 34 Years | 0 (0.0%) | 0 (0.0%) |
| 35 to 64 Years | 38 (40.4%) | 0 (0.0%) |
| 65 to 74 Years | 11 (21.6%) | 0 (0.0%) |
| 75 Years and over | 0 (0.0%) | 0 (0.0%) |
Disability Class: Vision Difficulty
| Age Bracket | Male | Female |
| Under 5 Years | 0 (0.0%) | 0 (0.0%) |
| 5 to 17 Years | 0 (0.0%) | 0 (0.0%) |
| 18 to 34 Years | 0 (0.0%) | 0 (0.0%) |
| 35 to 64 Years | 0 (0.0%) | 0 (0.0%) |
| 65 to 74 Years | 0 (0.0%) | 0 (0.0%) |
| 75 Years and over | 0 (0.0%) | 0 (0.0%) |
Disability Class: Cognitive Difficulty
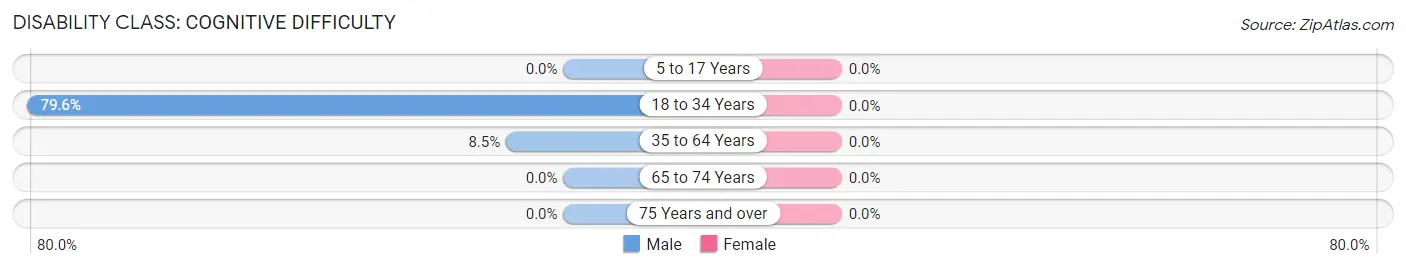
| Age Bracket | Male | Female |
| 5 to 17 Years | 0 (0.0%) | 0 (0.0%) |
| 18 to 34 Years | 35 (79.5%) | 0 (0.0%) |
| 35 to 64 Years | 8 (8.5%) | 0 (0.0%) |
| 65 to 74 Years | 0 (0.0%) | 0 (0.0%) |
| 75 Years and over | 0 (0.0%) | 0 (0.0%) |
Disability Class: Ambulatory Difficulty
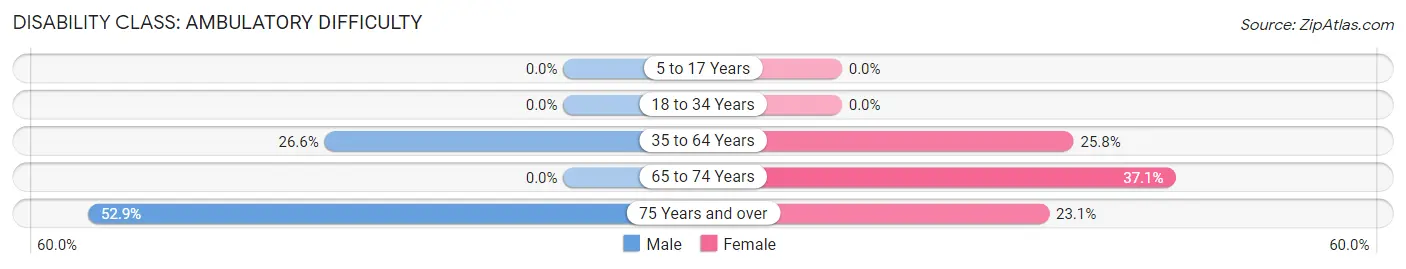
| Age Bracket | Male | Female |
| 5 to 17 Years | 0 (0.0%) | 0 (0.0%) |
| 18 to 34 Years | 0 (0.0%) | 0 (0.0%) |
| 35 to 64 Years | 25 (26.6%) | 24 (25.8%) |
| 65 to 74 Years | 0 (0.0%) | 13 (37.1%) |
| 75 Years and over | 9 (52.9%) | 6 (23.1%) |
Disability Class: Self-Care Difficulty
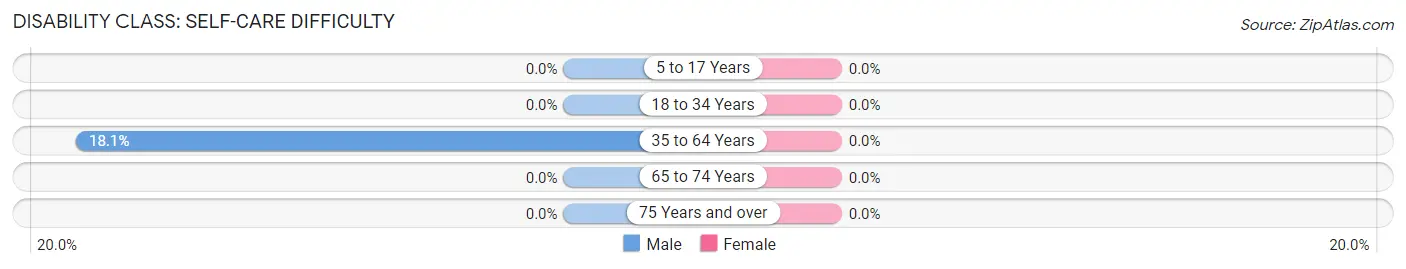
| Age Bracket | Male | Female |
| 5 to 17 Years | 0 (0.0%) | 0 (0.0%) |
| 18 to 34 Years | 0 (0.0%) | 0 (0.0%) |
| 35 to 64 Years | 17 (18.1%) | 0 (0.0%) |
| 65 to 74 Years | 0 (0.0%) | 0 (0.0%) |
| 75 Years and over | 0 (0.0%) | 0 (0.0%) |
Technology Access in South Toledo Bend
Computing Device Access in South Toledo Bend
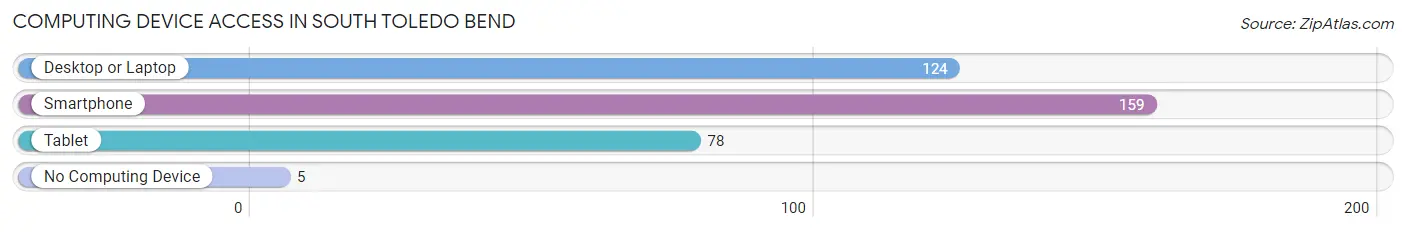
| Device Type | # Households | % Households |
| Desktop or Laptop | 124 | 72.1% |
| Smartphone | 159 | 92.4% |
| Tablet | 78 | 45.4% |
| No Computing Device | 5 | 2.9% |
| Total | 172 | 100.0% |
Internet Access in South Toledo Bend
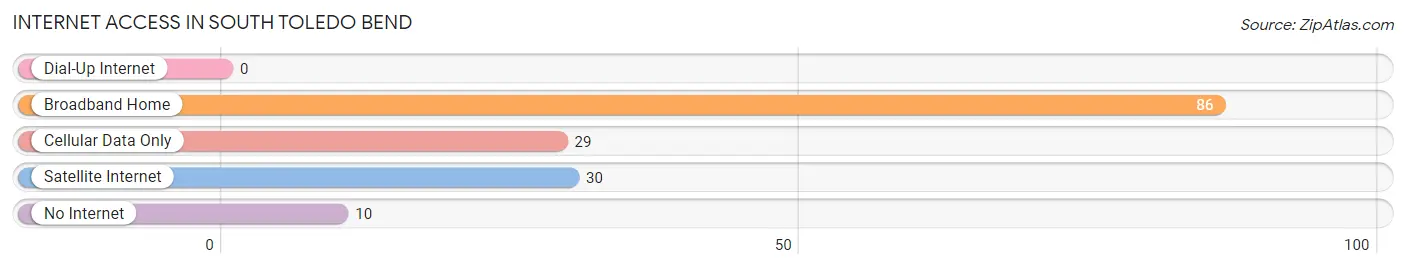
| Internet Type | # Households | % Households |
| Dial-Up Internet | 0 | 0.0% |
| Broadband Home | 86 | 50.0% |
| Cellular Data Only | 29 | 16.9% |
| Satellite Internet | 30 | 17.4% |
| No Internet | 10 | 5.8% |
| Total | 172 | 100.0% |
South Toledo Bend Summary
Toledo Bend is a reservoir located on the Sabine River, which forms the border between Texas and Louisiana. It is the largest man-made body of water in the southern United States and the fifth largest in the nation. The lake was created in 1969 when the Sabine River Authority of Texas and the Sabine River Authority of Louisiana built the Toledo Bend Dam. The lake is named after the nearby town of Toledo Bend, Texas, which was established in the late 1800s.
Geography
Toledo Bend is located in the Sabine River Basin, which is part of the Gulf Coastal Plain. The lake is located in the eastern part of Texas and western part of Louisiana. It is approximately 85 miles long and covers an area of 185,000 acres. The lake has over 1,200 miles of shoreline and is the largest man-made body of water in the southern United States. The lake is fed by the Sabine River and several other smaller rivers and streams.
The lake is surrounded by the Sabine National Forest, which is a protected area of over 160,000 acres. The forest is home to a variety of wildlife, including white-tailed deer, wild turkeys, and bald eagles. The lake is also home to a variety of fish, including largemouth bass, crappie, catfish, and sunfish.
Economy
Toledo Bend is a popular destination for fishing, boating, and other recreational activities. The lake is home to several marinas, boat ramps, and campgrounds. The lake is also a popular destination for water sports, such as wakeboarding, water skiing, and tubing.
The lake is also home to several businesses, including restaurants, hotels, and resorts. The lake is also home to several golf courses, including the Toledo Bend Country Club.
Demographics
The population of Toledo Bend is estimated to be around 10,000 people. The majority of the population is white, with a small percentage of African Americans and Hispanics. The median household income is around $50,000.
The lake is home to several small towns, including Burkeville, Pineland, and South Toledo Bend. The towns are home to a variety of businesses, including restaurants, stores, and gas stations.
Conclusion
Toledo Bend is a popular destination for fishing, boating, and other recreational activities. The lake is home to several businesses, including restaurants, hotels, and resorts. The lake is also home to several small towns, including Burkeville, Pineland, and South Toledo Bend. The population of Toledo Bend is estimated to be around 10,000 people. The lake is surrounded by the Sabine National Forest, which is a protected area of over 160,000 acres. The lake is also home to a variety of fish, including largemouth bass, crappie, catfish, and sunfish.
Common Questions
What is Per Capita Income in South Toledo Bend?
Per Capita income in South Toledo Bend is $45,222.
What is the Median Household income in South Toledo Bend?
Median Household Income in South Toledo Bend is $62,750.
What is Inequality or Gini Index in South Toledo Bend?
Inequality or Gini Index in South Toledo Bend is 0.48.
What is the Total Population of South Toledo Bend?
Total Population of South Toledo Bend is 372.
What is the Total Male Population of South Toledo Bend?
Total Male Population of South Toledo Bend is 218.
What is the Total Female Population of South Toledo Bend?
Total Female Population of South Toledo Bend is 154.
What is the Ratio of Males per 100 Females in South Toledo Bend?
There are 141.56 Males per 100 Females in South Toledo Bend.
What is the Ratio of Females per 100 Males in South Toledo Bend?
There are 70.64 Females per 100 Males in South Toledo Bend.
What is the Median Population Age in South Toledo Bend?
Median Population Age in South Toledo Bend is 60.8 Years.
What is the Average Family Size in South Toledo Bend
Average Family Size in South Toledo Bend is 2.4 People.
What is the Average Household Size in South Toledo Bend
Average Household Size in South Toledo Bend is 2.2 People.
How Large is the Labor Force in South Toledo Bend?
There are 111 People in the Labor Forcein in South Toledo Bend.
What is the Percentage of People in the Labor Force in South Toledo Bend?
30.2% of People are in the Labor Force in South Toledo Bend.
What is the Unemployment Rate in South Toledo Bend?
Unemployment Rate in South Toledo Bend is 4.5%.