Myrtle Springs, TX Map & Demographics
Myrtle Springs Map
Myrtle Springs Overview
$23,477
PER CAPITA INCOME
$48,690
AVG FAMILY INCOME
$41,170
AVG HOUSEHOLD INCOME
0.36
INEQUALITY / GINI INDEX
628
TOTAL POPULATION
350
MALE POPULATION
278
FEMALE POPULATION
125.90
MALES / 100 FEMALES
79.43
FEMALES / 100 MALES
36.8
MEDIAN AGE
2.3
AVG FAMILY SIZE
1.8
AVG HOUSEHOLD SIZE
286
LABOR FORCE [ PEOPLE ]
48.8%
PERCENT IN LABOR FORCE
Income in Myrtle Springs
Income Overview in Myrtle Springs
Per Capita Income in Myrtle Springs is $23,477, while median incomes of families and households are $48,690 and $41,170 respectively.
| Characteristic | Number | Measure |
| Per Capita Income | 628 | $23,477 |
| Median Family Income | 114 | $48,690 |
| Mean Family Income | 114 | $60,029 |
| Median Household Income | 356 | $41,170 |
| Mean Household Income | 356 | $41,922 |
| Income Deficit | 114 | $0 |
| Wage / Income Gap (%) | 628 | 0.00% |
| Wage / Income Gap ($) | 628 | 100.00¢ per $1 |
| Gini / Inequality Index | 628 | 0.36 |
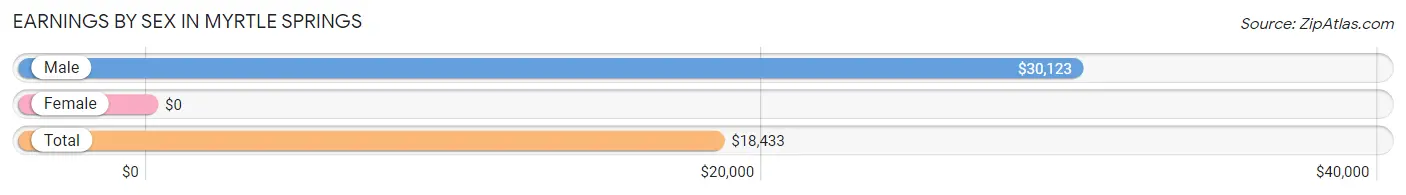
Earnings by Sex in Myrtle Springs
| Sex | Number | Average Earnings |
| Male | 210 (60.3%) | $30,123 |
| Female | 138 (39.7%) | $0 |
| Total | 348 (100.0%) | $18,433 |
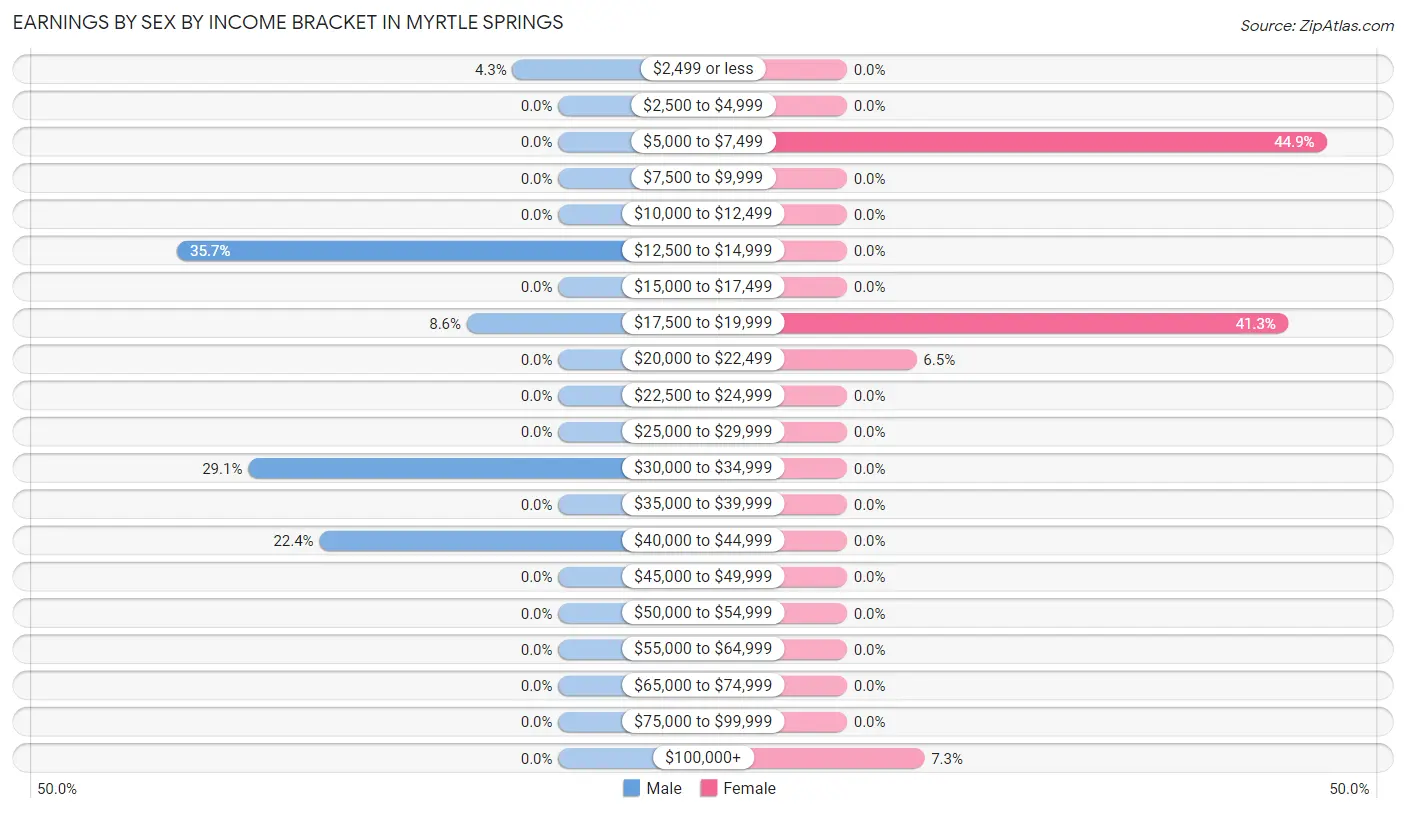
Earnings by Sex by Income Bracket in Myrtle Springs
The most common earnings brackets in Myrtle Springs are $12,500 to $14,999 for men (75 | 35.7%) and $5,000 to $7,499 for women (62 | 44.9%).
| Income | Male | Female |
| $2,499 or less | 9 (4.3%) | 0 (0.0%) |
| $2,500 to $4,999 | 0 (0.0%) | 0 (0.0%) |
| $5,000 to $7,499 | 0 (0.0%) | 62 (44.9%) |
| $7,500 to $9,999 | 0 (0.0%) | 0 (0.0%) |
| $10,000 to $12,499 | 0 (0.0%) | 0 (0.0%) |
| $12,500 to $14,999 | 75 (35.7%) | 0 (0.0%) |
| $15,000 to $17,499 | 0 (0.0%) | 0 (0.0%) |
| $17,500 to $19,999 | 18 (8.6%) | 57 (41.3%) |
| $20,000 to $22,499 | 0 (0.0%) | 9 (6.5%) |
| $22,500 to $24,999 | 0 (0.0%) | 0 (0.0%) |
| $25,000 to $29,999 | 0 (0.0%) | 0 (0.0%) |
| $30,000 to $34,999 | 61 (29.0%) | 0 (0.0%) |
| $35,000 to $39,999 | 0 (0.0%) | 0 (0.0%) |
| $40,000 to $44,999 | 47 (22.4%) | 0 (0.0%) |
| $45,000 to $49,999 | 0 (0.0%) | 0 (0.0%) |
| $50,000 to $54,999 | 0 (0.0%) | 0 (0.0%) |
| $55,000 to $64,999 | 0 (0.0%) | 0 (0.0%) |
| $65,000 to $74,999 | 0 (0.0%) | 0 (0.0%) |
| $75,000 to $99,999 | 0 (0.0%) | 0 (0.0%) |
| $100,000+ | 0 (0.0%) | 10 (7.2%) |
| Total | 210 (100.0%) | 138 (100.0%) |
Earnings by Sex by Educational Attainment in Myrtle Springs
| Educational Attainment | Male Income | Female Income |
| Less than High School | - | - |
| High School Diploma | - | - |
| College or Associate's Degree | - | - |
| Bachelor's Degree | - | - |
| Graduate Degree | - | - |
| Total | $30,123 | $19,167 |
Family Income in Myrtle Springs
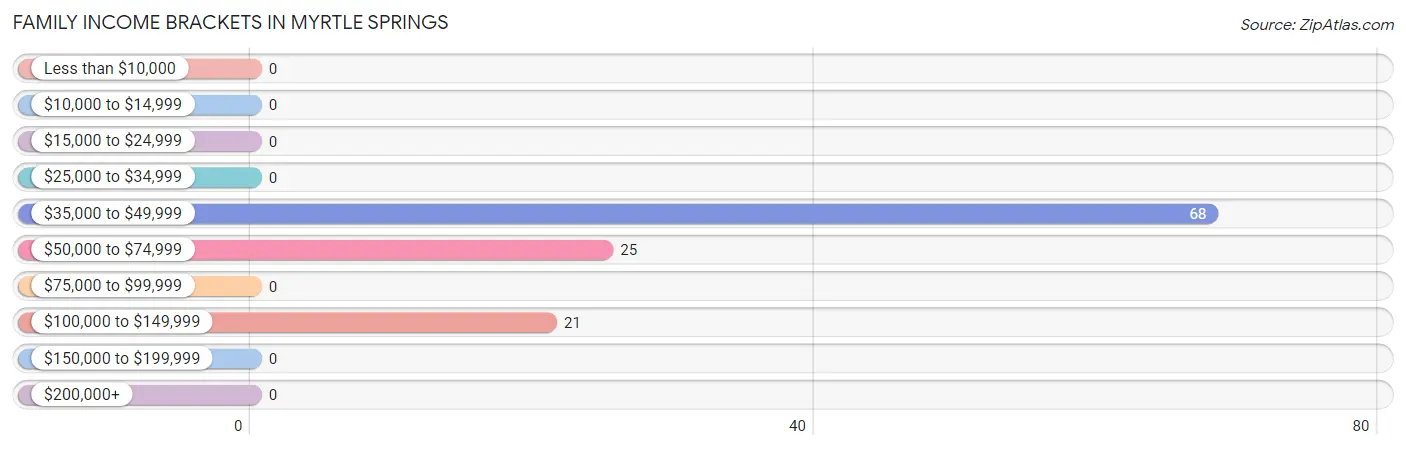
Family Income Brackets in Myrtle Springs
According to the Myrtle Springs family income data, there are 68 families falling into the $35,000 to $49,999 income range, which is the most common income bracket and makes up 59.7% of all families.
| Income Bracket | # Families | % Families |
| Less than $10,000 | 0 | 0.0% |
| $10,000 to $14,999 | 0 | 0.0% |
| $15,000 to $24,999 | 0 | 0.0% |
| $25,000 to $34,999 | 0 | 0.0% |
| $35,000 to $49,999 | 68 | 59.6% |
| $50,000 to $74,999 | 25 | 21.9% |
| $75,000 to $99,999 | 0 | 0.0% |
| $100,000 to $149,999 | 21 | 18.4% |
| $150,000 to $199,999 | 0 | 0.0% |
| $200,000+ | 0 | 0.0% |
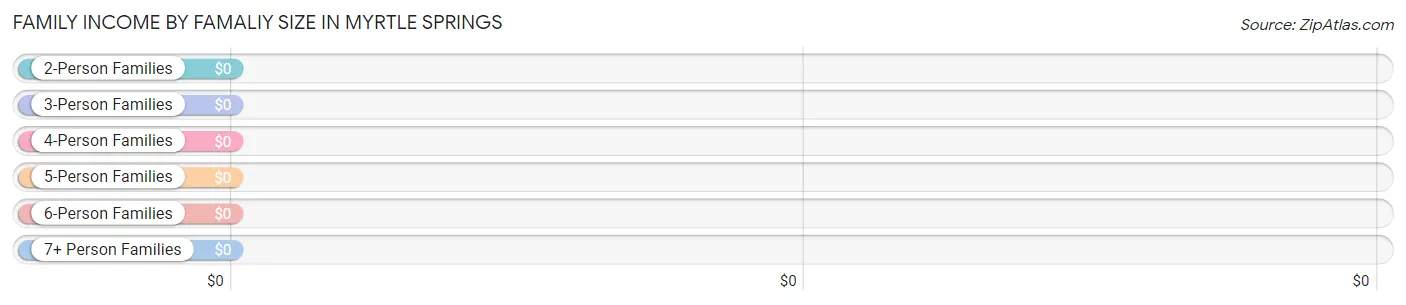
Family Income by Famaliy Size in Myrtle Springs
| Income Bracket | # Families | Median Income |
| 2-Person Families | 93 (81.6%) | $0 |
| 3-Person Families | 0 (0.0%) | $0 |
| 4-Person Families | 21 (18.4%) | $0 |
| 5-Person Families | 0 (0.0%) | $0 |
| 6-Person Families | 0 (0.0%) | $0 |
| 7+ Person Families | 0 (0.0%) | $0 |
| Total | 114 (100.0%) | $48,690 |
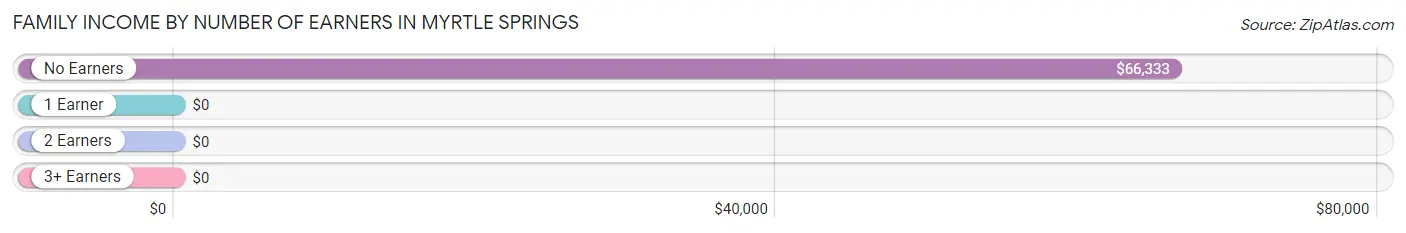
Family Income by Number of Earners in Myrtle Springs
| Number of Earners | # Families | Median Income |
| No Earners | 58 (50.9%) | $66,333 |
| 1 Earner | 47 (41.2%) | $0 |
| 2 Earners | 9 (7.9%) | $0 |
| 3+ Earners | 0 (0.0%) | $0 |
| Total | 114 (100.0%) | $48,690 |
Household Income in Myrtle Springs
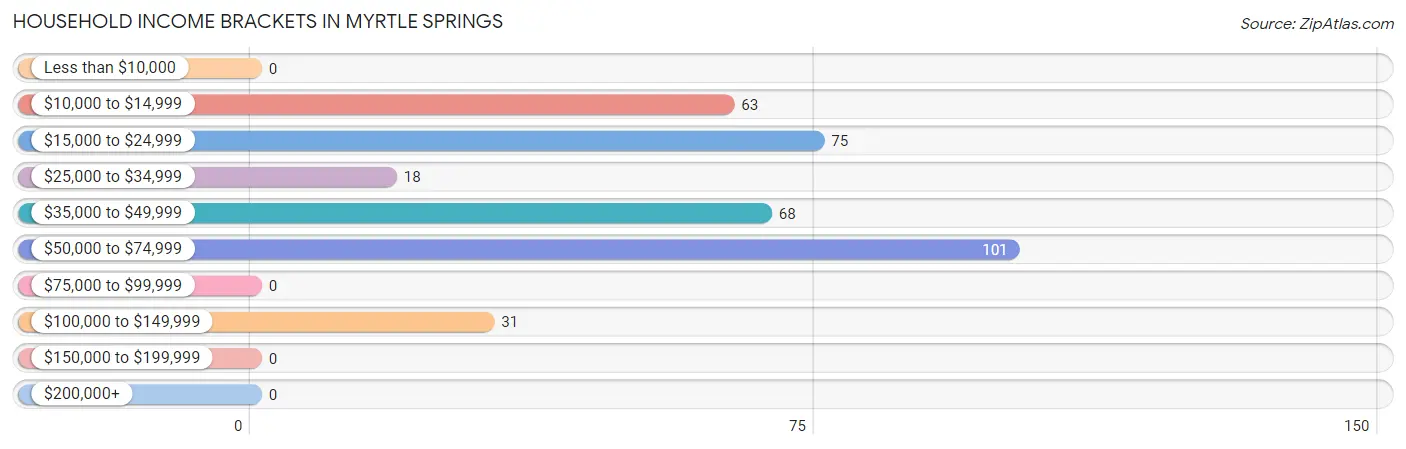
Household Income Brackets in Myrtle Springs
With 101 households falling in the category, the $50,000 to $74,999 income range is the most frequent in Myrtle Springs, accounting for 28.4% of all households.
| Income Bracket | # Households | % Households |
| Less than $10,000 | 0 | 0.0% |
| $10,000 to $14,999 | 63 | 17.7% |
| $15,000 to $24,999 | 75 | 21.1% |
| $25,000 to $34,999 | 18 | 5.1% |
| $35,000 to $49,999 | 68 | 19.1% |
| $50,000 to $74,999 | 101 | 28.4% |
| $75,000 to $99,999 | 0 | 0.0% |
| $100,000 to $149,999 | 31 | 8.7% |
| $150,000 to $199,999 | 0 | 0.0% |
| $200,000+ | 0 | 0.0% |
Household Income by Householder Age in Myrtle Springs
The median household income in Myrtle Springs is $41,170, with the highest median household income of $42,074 found in the 45 to 64 years age bracket for the primary householder. A total of 78 households (21.9%) fall into this category.
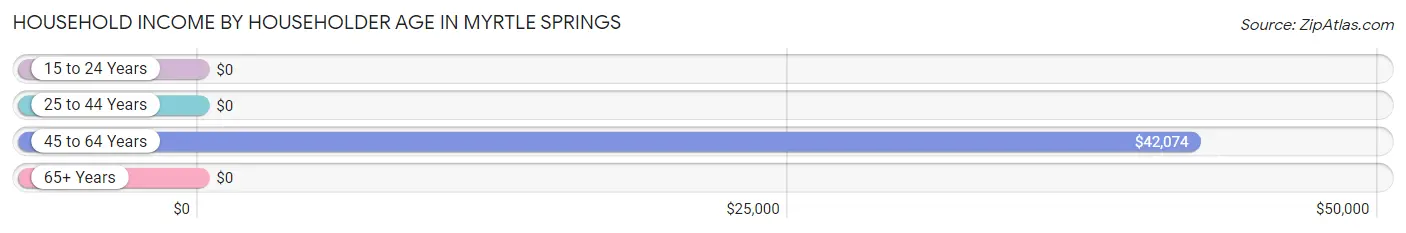
| Income Bracket | # Households | Median Income |
| 15 to 24 Years | 0 (0.0%) | $0 |
| 25 to 44 Years | 136 (38.2%) | $0 |
| 45 to 64 Years | 78 (21.9%) | $42,074 |
| 65+ Years | 142 (39.9%) | $0 |
| Total | 356 (100.0%) | $41,170 |
Poverty in Myrtle Springs
Income Below Poverty by Sex and Age in Myrtle Springs
With 21.4% poverty level for males and 45.0% for females among the residents of Myrtle Springs, 25 to 34 year old males and 18 to 24 year old females are the most vulnerable to poverty, with 75 males (55.1%) and 62 females (100.0%) in their respective age groups living below the poverty level.
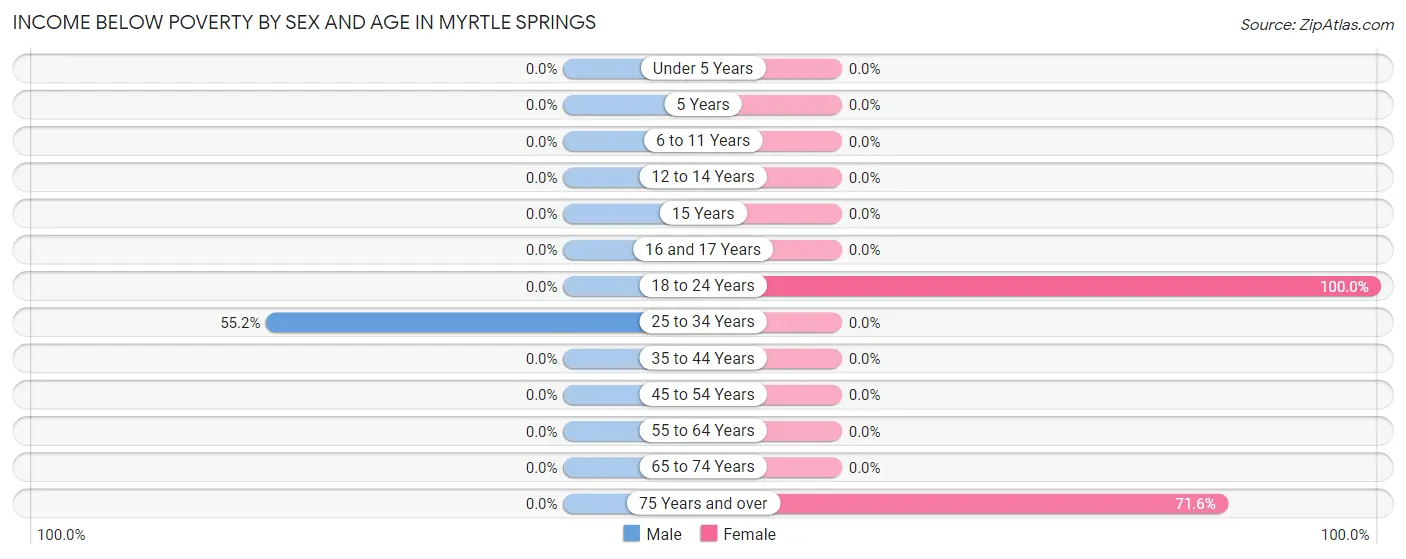
| Age Bracket | Male | Female |
| Under 5 Years | 0 (0.0%) | 0 (0.0%) |
| 5 Years | 0 (0.0%) | 0 (0.0%) |
| 6 to 11 Years | 0 (0.0%) | 0 (0.0%) |
| 12 to 14 Years | 0 (0.0%) | 0 (0.0%) |
| 15 Years | 0 (0.0%) | 0 (0.0%) |
| 16 and 17 Years | 0 (0.0%) | 0 (0.0%) |
| 18 to 24 Years | 0 (0.0%) | 62 (100.0%) |
| 25 to 34 Years | 75 (55.1%) | 0 (0.0%) |
| 35 to 44 Years | 0 (0.0%) | 0 (0.0%) |
| 45 to 54 Years | 0 (0.0%) | 0 (0.0%) |
| 55 to 64 Years | 0 (0.0%) | 0 (0.0%) |
| 65 to 74 Years | 0 (0.0%) | 0 (0.0%) |
| 75 Years and over | 0 (0.0%) | 63 (71.6%) |
| Total | 75 (21.4%) | 125 (45.0%) |
Income Above Poverty by Sex and Age in Myrtle Springs
According to the poverty statistics in Myrtle Springs, males aged 12 to 14 years and females aged 25 to 34 years are the age groups that are most secure financially, with 100.0% of males and 100.0% of females in these age groups living above the poverty line.
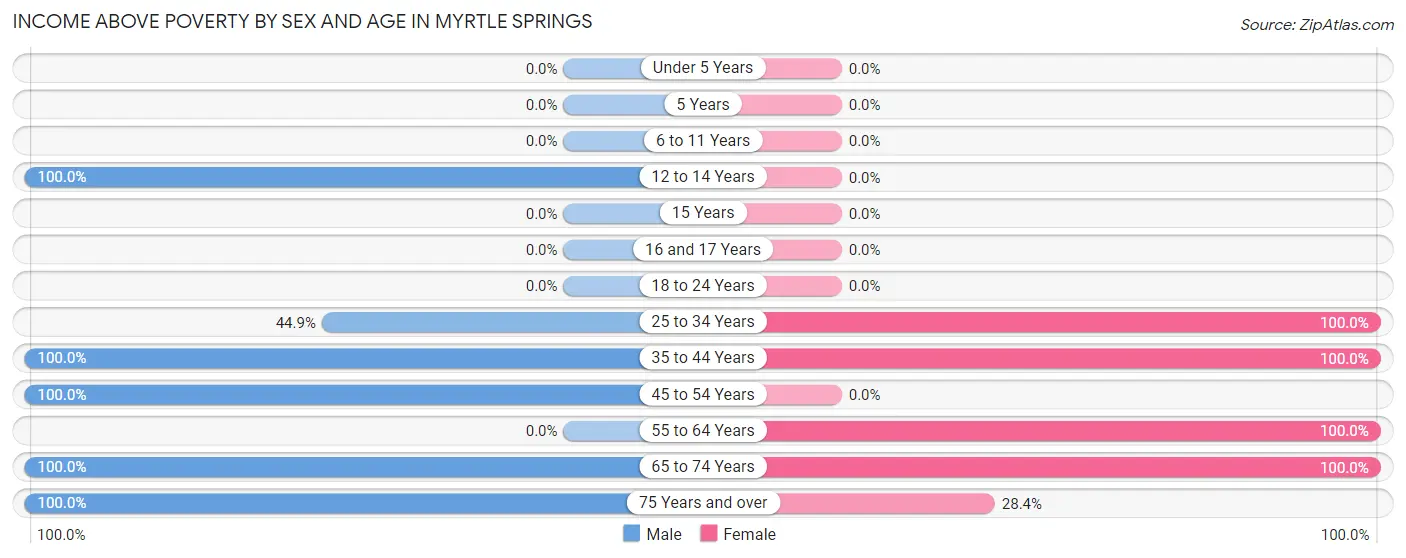
| Age Bracket | Male | Female |
| Under 5 Years | 0 (0.0%) | 0 (0.0%) |
| 5 Years | 0 (0.0%) | 0 (0.0%) |
| 6 to 11 Years | 0 (0.0%) | 0 (0.0%) |
| 12 to 14 Years | 42 (100.0%) | 0 (0.0%) |
| 15 Years | 0 (0.0%) | 0 (0.0%) |
| 16 and 17 Years | 0 (0.0%) | 0 (0.0%) |
| 18 to 24 Years | 0 (0.0%) | 0 (0.0%) |
| 25 to 34 Years | 61 (44.9%) | 57 (100.0%) |
| 35 to 44 Years | 27 (100.0%) | 21 (100.0%) |
| 45 to 54 Years | 66 (100.0%) | 0 (0.0%) |
| 55 to 64 Years | 0 (0.0%) | 31 (100.0%) |
| 65 to 74 Years | 39 (100.0%) | 19 (100.0%) |
| 75 Years and over | 40 (100.0%) | 25 (28.4%) |
| Total | 275 (78.6%) | 153 (55.0%) |
Income Below Poverty Among Married-Couple Families in Myrtle Springs
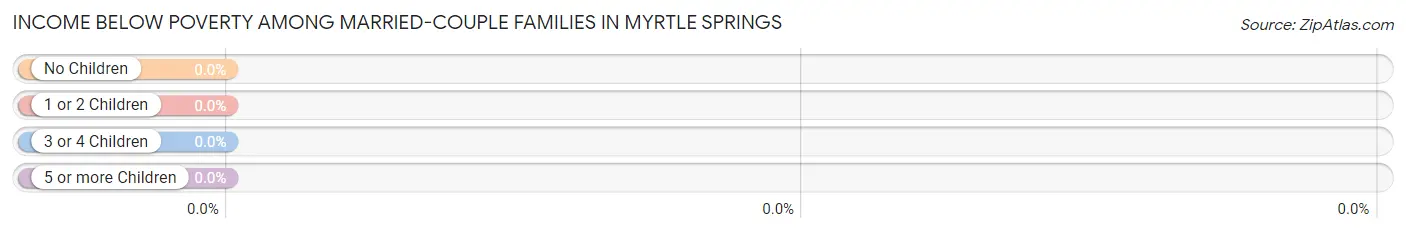
| Children | Above Poverty | Below Poverty |
| No Children | 46 (100.0%) | 0 (0.0%) |
| 1 or 2 Children | 0 (0.0%) | 0 (0.0%) |
| 3 or 4 Children | 0 (0.0%) | 0 (0.0%) |
| 5 or more Children | 0 (0.0%) | 0 (0.0%) |
| Total | 46 (100.0%) | 0 (0.0%) |
Income Below Poverty Among Single-Parent Households in Myrtle Springs
| Children | Single Father | Single Mother |
| No Children | 0 (0.0%) | 0 (0.0%) |
| 1 or 2 Children | 0 (0.0%) | 0 (0.0%) |
| 3 or 4 Children | 0 (0.0%) | 0 (0.0%) |
| 5 or more Children | 0 (0.0%) | 0 (0.0%) |
| Total | 0 (0.0%) | 0 (0.0%) |
Income Below Poverty Among Married-Couple vs Single-Parent Households in Myrtle Springs
| Children | Married-Couple Families | Single-Parent Households |
| No Children | 0 (0.0%) | 0 (0.0%) |
| 1 or 2 Children | 0 (0.0%) | 0 (0.0%) |
| 3 or 4 Children | 0 (0.0%) | 0 (0.0%) |
| 5 or more Children | 0 (0.0%) | 0 (0.0%) |
| Total | 0 (0.0%) | 0 (0.0%) |
Race in Myrtle Springs
The most populous races in Myrtle Springs are , and White / Caucasian (628 | 100.0%).
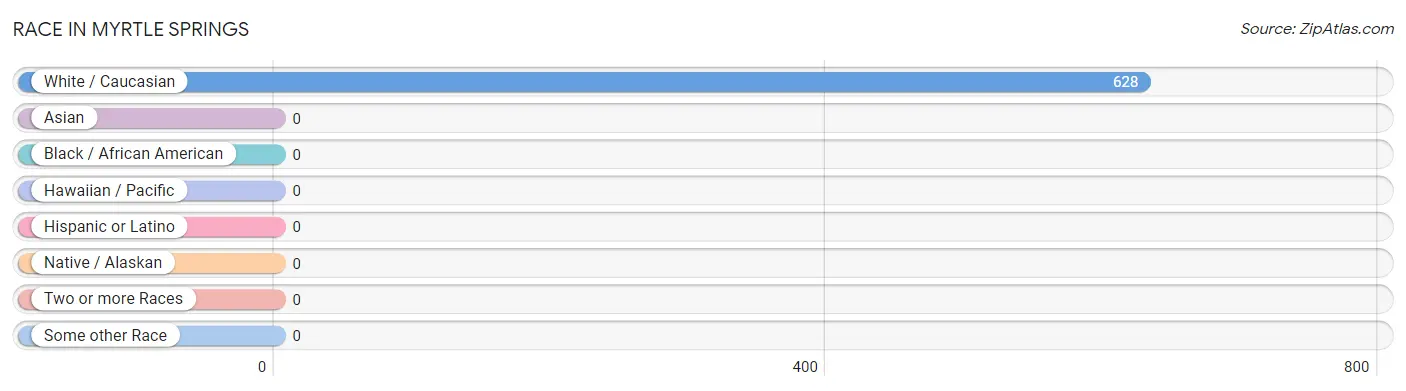
| Race | # Population | % Population |
| Asian | 0 | 0.0% |
| Black / African American | 0 | 0.0% |
| Hawaiian / Pacific | 0 | 0.0% |
| Hispanic or Latino | 0 | 0.0% |
| Native / Alaskan | 0 | 0.0% |
| White / Caucasian | 628 | 100.0% |
| Two or more Races | 0 | 0.0% |
| Some other Race | 0 | 0.0% |
| Total | 628 | 100.0% |
Ancestry in Myrtle Springs
The most populous ancestries reported in Myrtle Springs are American (243 | 38.7%), English (198 | 31.5%), German (19 | 3.0%), Irish (19 | 3.0%), and Czechoslovakian (12 | 1.9%), together accounting for 78.2% of all Myrtle Springs residents.
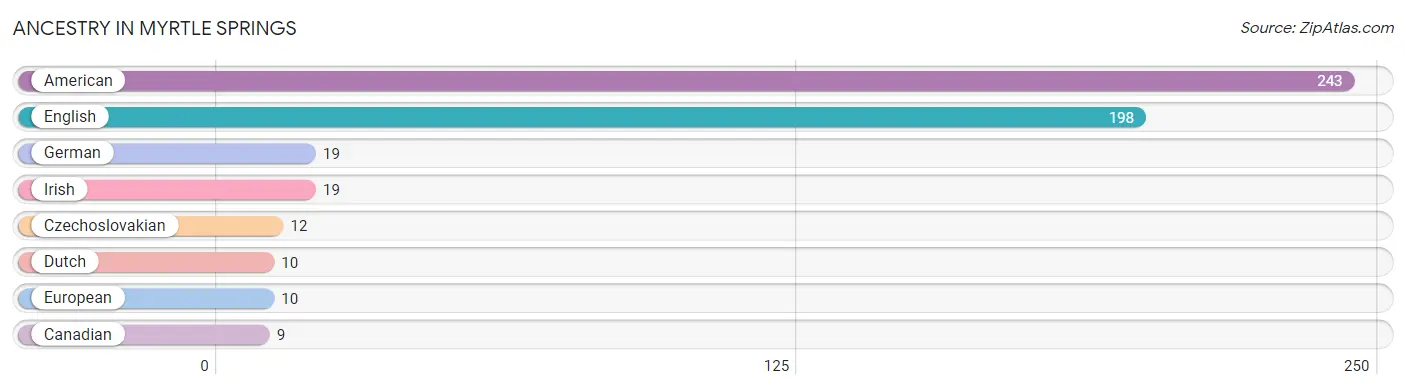
| Ancestry | # Population | % Population |
| American | 243 | 38.7% |
| Canadian | 9 | 1.4% |
| Czechoslovakian | 12 | 1.9% |
| Dutch | 10 | 1.6% |
| English | 198 | 31.5% |
| European | 10 | 1.6% |
| German | 19 | 3.0% |
| Irish | 19 | 3.0% | View All 8 Rows |
Immigrants in Myrtle Springs

| Immigration Origin | # Population | % Population | View All 0 Rows |
Sex and Age in Myrtle Springs
Sex and Age in Myrtle Springs
The most populous age groups in Myrtle Springs are 25 to 29 Years (75 | 21.4%) for men and 80 to 84 Years (73 | 26.3%) for women.
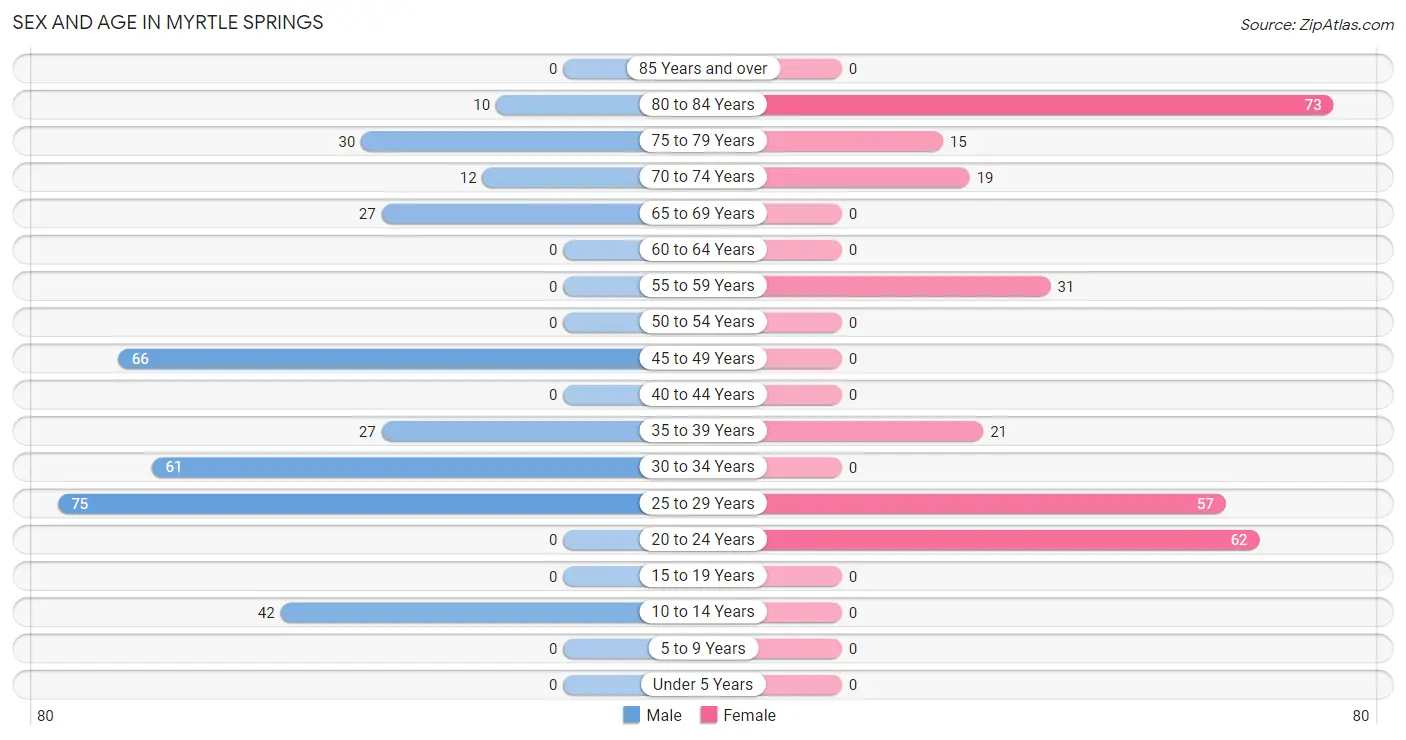
| Age Bracket | Male | Female |
| Under 5 Years | 0 (0.0%) | 0 (0.0%) |
| 5 to 9 Years | 0 (0.0%) | 0 (0.0%) |
| 10 to 14 Years | 42 (12.0%) | 0 (0.0%) |
| 15 to 19 Years | 0 (0.0%) | 0 (0.0%) |
| 20 to 24 Years | 0 (0.0%) | 62 (22.3%) |
| 25 to 29 Years | 75 (21.4%) | 57 (20.5%) |
| 30 to 34 Years | 61 (17.4%) | 0 (0.0%) |
| 35 to 39 Years | 27 (7.7%) | 21 (7.5%) |
| 40 to 44 Years | 0 (0.0%) | 0 (0.0%) |
| 45 to 49 Years | 66 (18.9%) | 0 (0.0%) |
| 50 to 54 Years | 0 (0.0%) | 0 (0.0%) |
| 55 to 59 Years | 0 (0.0%) | 31 (11.2%) |
| 60 to 64 Years | 0 (0.0%) | 0 (0.0%) |
| 65 to 69 Years | 27 (7.7%) | 0 (0.0%) |
| 70 to 74 Years | 12 (3.4%) | 19 (6.8%) |
| 75 to 79 Years | 30 (8.6%) | 15 (5.4%) |
| 80 to 84 Years | 10 (2.9%) | 73 (26.3%) |
| 85 Years and over | 0 (0.0%) | 0 (0.0%) |
| Total | 350 (100.0%) | 278 (100.0%) |
Families and Households in Myrtle Springs
Median Family Size in Myrtle Springs
The median family size in Myrtle Springs is 2.34 persons per family, with single female/mother families (21 | 18.4%) accounting for the largest median family size of 4.19 persons per family. On the other hand, single male/father families (47 | 41.2%) represent the smallest median family size with 1.89 persons per family.
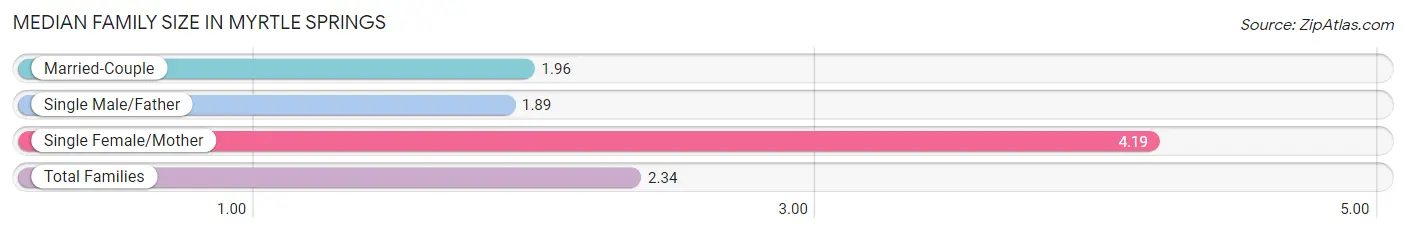
| Family Type | # Families | Family Size |
| Married-Couple | 46 (40.4%) | 1.96 |
| Single Male/Father | 47 (41.2%) | 1.89 |
| Single Female/Mother | 21 (18.4%) | 4.19 |
| Total Families | 114 (100.0%) | 2.34 |
Median Household Size in Myrtle Springs
The median household size in Myrtle Springs is 1.76 persons per household, with single female/mother households (21 | 5.9%) accounting for the largest median household size of 4.19 persons per household. non-family households (242 | 68.0%) represent the smallest median household size with 1.49 persons per household.
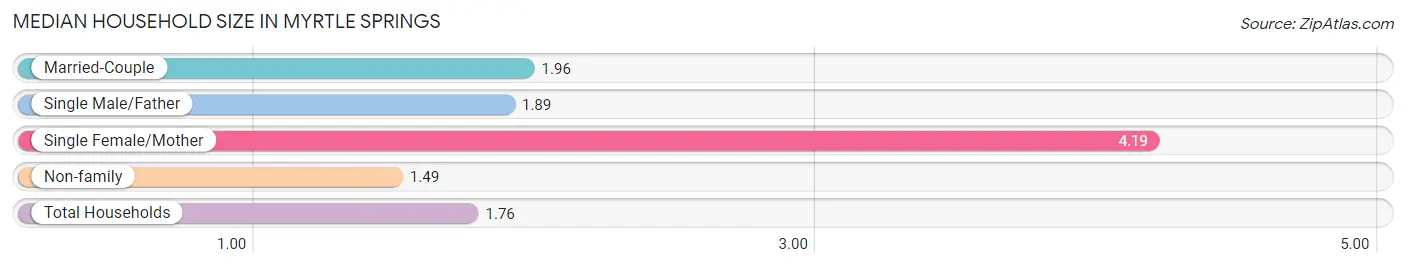
| Household Type | # Households | Household Size |
| Married-Couple | 46 (12.9%) | 1.96 |
| Single Male/Father | 47 (13.2%) | 1.89 |
| Single Female/Mother | 21 (5.9%) | 4.19 |
| Non-family | 242 (68.0%) | 1.49 |
| Total Households | 356 (100.0%) | 1.76 |
Household Size by Marriage Status in Myrtle Springs
Out of a total of 356 households in Myrtle Springs, 114 (32.0%) are family households, while 242 (68.0%) are nonfamily households. The most numerous type of family households are 2-person households, comprising 93, and the most common type of nonfamily households are 2-person households, comprising 136.
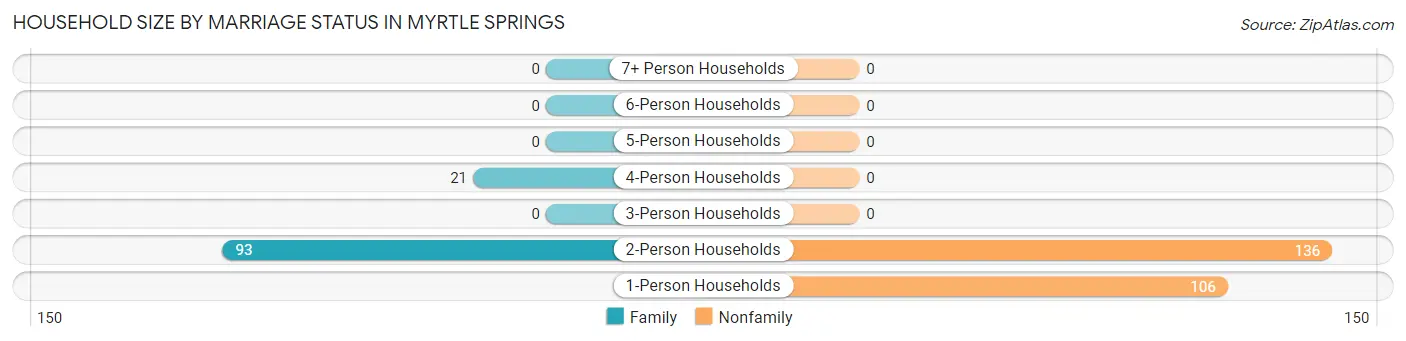
| Household Size | Family Households | Nonfamily Households |
| 1-Person Households | - | 106 (29.8%) |
| 2-Person Households | 93 (26.1%) | 136 (38.2%) |
| 3-Person Households | 0 (0.0%) | 0 (0.0%) |
| 4-Person Households | 21 (5.9%) | 0 (0.0%) |
| 5-Person Households | 0 (0.0%) | 0 (0.0%) |
| 6-Person Households | 0 (0.0%) | 0 (0.0%) |
| 7+ Person Households | 0 (0.0%) | 0 (0.0%) |
| Total | 114 (32.0%) | 242 (68.0%) |
Female Fertility in Myrtle Springs
Fertility by Age in Myrtle Springs
| Age Bracket | Women with Births | Births / 1,000 Women |
| 15 to 19 years | 0 (0.0%) | 0.0 |
| 20 to 34 years | 0 (0.0%) | 0.0 |
| 35 to 50 years | 0 (0.0%) | 0.0 |
| Total | 0 (0.0%) | 0.0 |
Fertility by Age by Marriage Status in Myrtle Springs
| Age Bracket | Married | Unmarried |
| 15 to 19 years | 0 (0.0%) | 0 (0.0%) |
| 20 to 34 years | 0 (0.0%) | 0 (0.0%) |
| 35 to 50 years | 0 (0.0%) | 0 (0.0%) |
| Total | 0 (0.0%) | 0 (0.0%) |
Fertility by Education in Myrtle Springs
| Educational Attainment | Women with Births | Births / 1,000 Women |
| Less than High School | 0 (0.0%) | 0.0 |
| High School Diploma | 0 (0.0%) | 0.0 |
| College or Associate's Degree | 0 (0.0%) | 0.0 |
| Bachelor's Degree | 0 (0.0%) | 0.0 |
| Graduate Degree | 0 (0.0%) | 0.0 |
| Total | 0 (0.0%) | 0.0 |
Fertility by Education by Marriage Status in Myrtle Springs
| Educational Attainment | Married | Unmarried |
| Less than High School | 0 (0.0%) | 0 (0.0%) |
| High School Diploma | 0 (0.0%) | 0 (0.0%) |
| College or Associate's Degree | 0 (0.0%) | 0 (0.0%) |
| Bachelor's Degree | 0 (0.0%) | 0 (0.0%) |
| Graduate Degree | 0 (0.0%) | 0 (0.0%) |
| Total | 0 (0.0%) | 0 (0.0%) |
Employment Characteristics in Myrtle Springs
Employment by Class of Employer in Myrtle Springs
Among the 286 employed individuals in Myrtle Springs, private company employees (277 | 96.9%), and self-employed (not incorporated) (9 | 3.2%) make up the most common classes of employment.
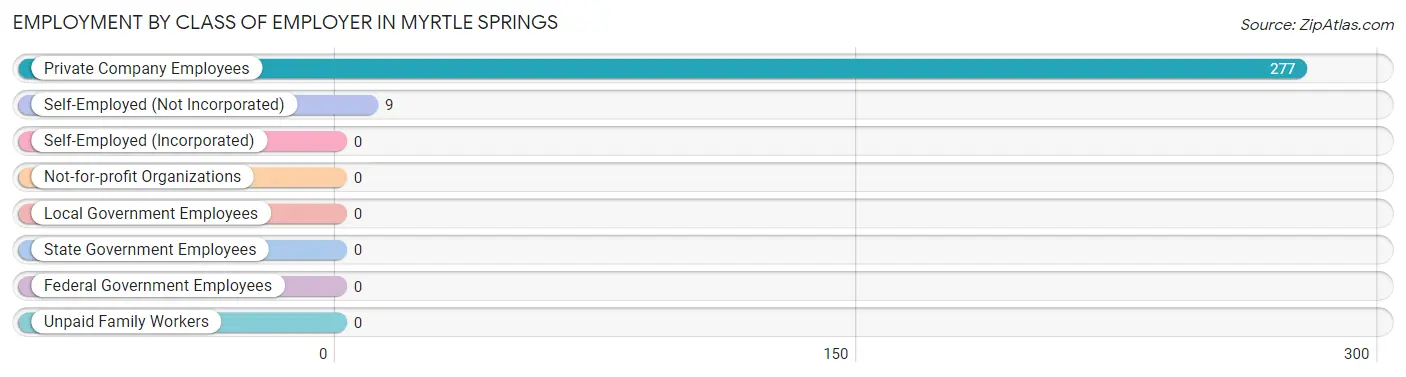
| Employer Class | # Employees | % Employees |
| Private Company Employees | 277 | 96.9% |
| Self-Employed (Incorporated) | 0 | 0.0% |
| Self-Employed (Not Incorporated) | 9 | 3.2% |
| Not-for-profit Organizations | 0 | 0.0% |
| Local Government Employees | 0 | 0.0% |
| State Government Employees | 0 | 0.0% |
| Federal Government Employees | 0 | 0.0% |
| Unpaid Family Workers | 0 | 0.0% |
| Total | 286 | 100.0% |
Employment Status by Age in Myrtle Springs
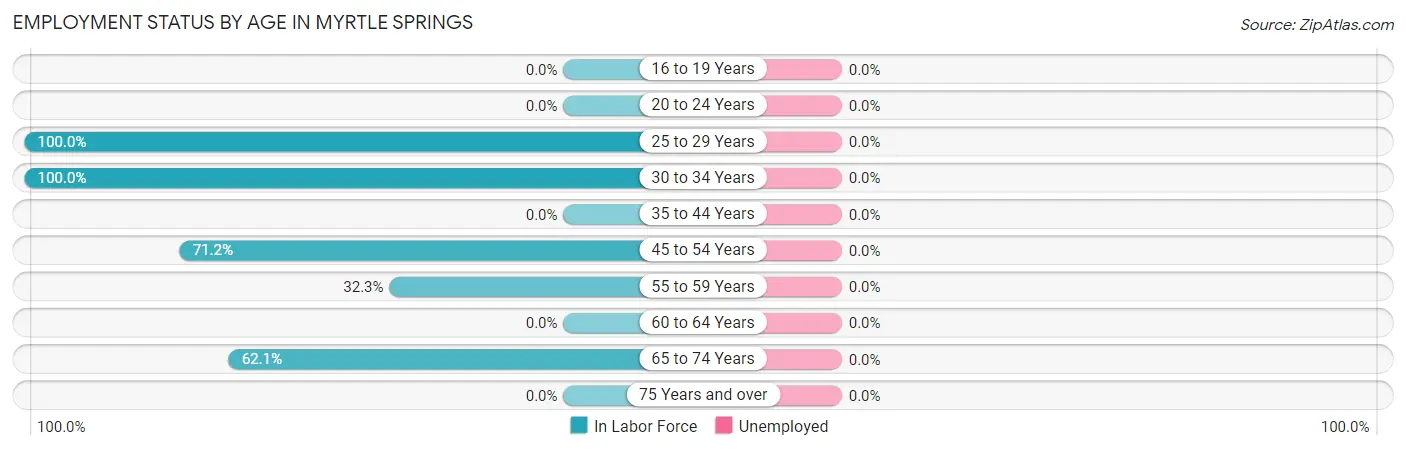
| Age Bracket | In Labor Force | Unemployed |
| 16 to 19 Years | 0 (0.0%) | 0 (0.0%) |
| 20 to 24 Years | 0 (0.0%) | 0 (0.0%) |
| 25 to 29 Years | 132 (100.0%) | 0 (0.0%) |
| 30 to 34 Years | 61 (100.0%) | 0 (0.0%) |
| 35 to 44 Years | 0 (0.0%) | 0 (0.0%) |
| 45 to 54 Years | 47 (71.2%) | 0 (0.0%) |
| 55 to 59 Years | 10 (32.3%) | 0 (0.0%) |
| 60 to 64 Years | 0 (0.0%) | 0 (0.0%) |
| 65 to 74 Years | 36 (62.1%) | 0 (0.0%) |
| 75 Years and over | 0 (0.0%) | 0 (0.0%) |
| Total | 286 (48.8%) | 0 (0.0%) |
Employment Status by Educational Attainment in Myrtle Springs
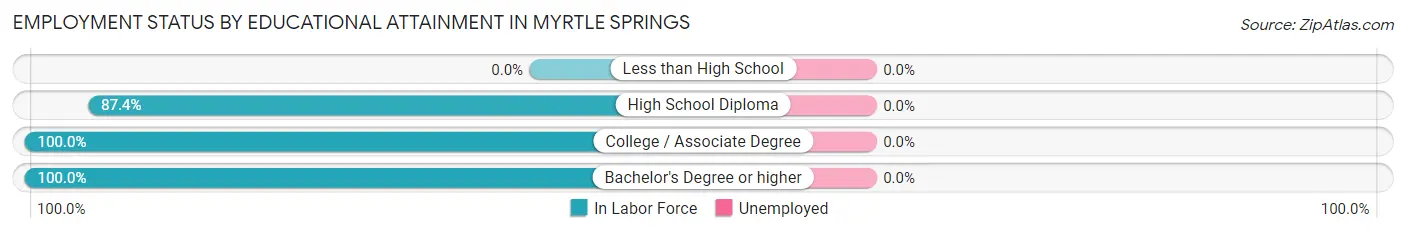
| Educational Attainment | In Labor Force | Unemployed |
| Less than High School | 0 (0.0%) | 0 (0.0%) |
| High School Diploma | 132 (87.4%) | 0 (0.0%) |
| College / Associate Degree | 108 (100.0%) | 0 (0.0%) |
| Bachelor's Degree or higher | 10 (100.0%) | 0 (0.0%) |
| Total | 250 (74.0%) | 0 (0.0%) |
Employment Occupations by Sex in Myrtle Springs
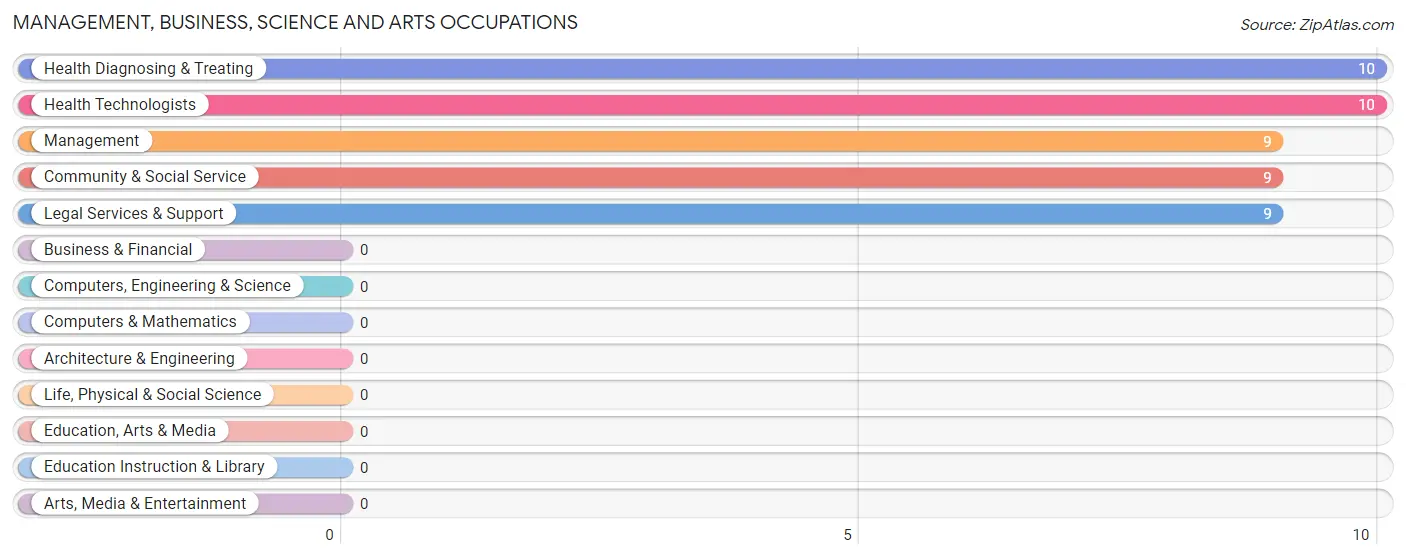
Management, Business, Science and Arts Occupations
The most common Management, Business, Science and Arts occupations in Myrtle Springs are Health Diagnosing & Treating (10 | 3.5%), Health Technologists (10 | 3.5%), Management (9 | 3.2%), Community & Social Service (9 | 3.2%), and Legal Services & Support (9 | 3.2%).
Management, Business, Science and Arts Occupations by Sex
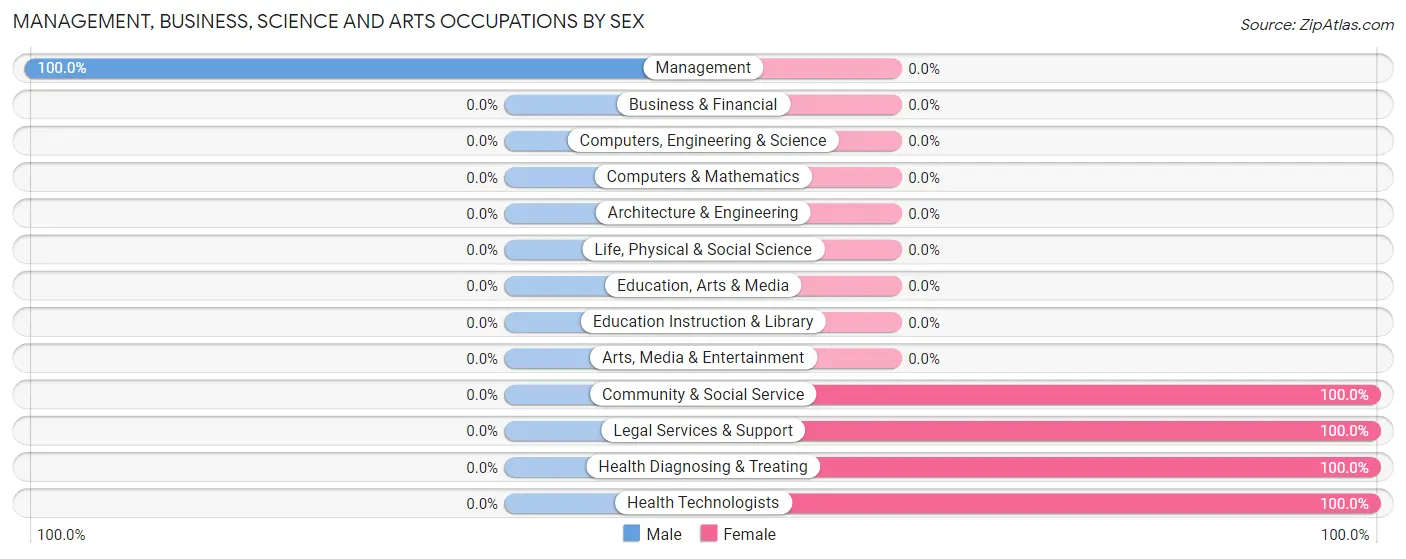
| Occupation | Male | Female |
| Management | 9 (100.0%) | 0 (0.0%) |
| Business & Financial | 0 (0.0%) | 0 (0.0%) |
| Computers, Engineering & Science | 0 (0.0%) | 0 (0.0%) |
| Computers & Mathematics | 0 (0.0%) | 0 (0.0%) |
| Architecture & Engineering | 0 (0.0%) | 0 (0.0%) |
| Life, Physical & Social Science | 0 (0.0%) | 0 (0.0%) |
| Community & Social Service | 0 (0.0%) | 9 (100.0%) |
| Education, Arts & Media | 0 (0.0%) | 0 (0.0%) |
| Legal Services & Support | 0 (0.0%) | 9 (100.0%) |
| Education Instruction & Library | 0 (0.0%) | 0 (0.0%) |
| Arts, Media & Entertainment | 0 (0.0%) | 0 (0.0%) |
| Health Diagnosing & Treating | 0 (0.0%) | 10 (100.0%) |
| Health Technologists | 0 (0.0%) | 10 (100.0%) |
| Total (Category) | 9 (32.1%) | 19 (67.9%) |
| Total (Overall) | 210 (73.4%) | 76 (26.6%) |
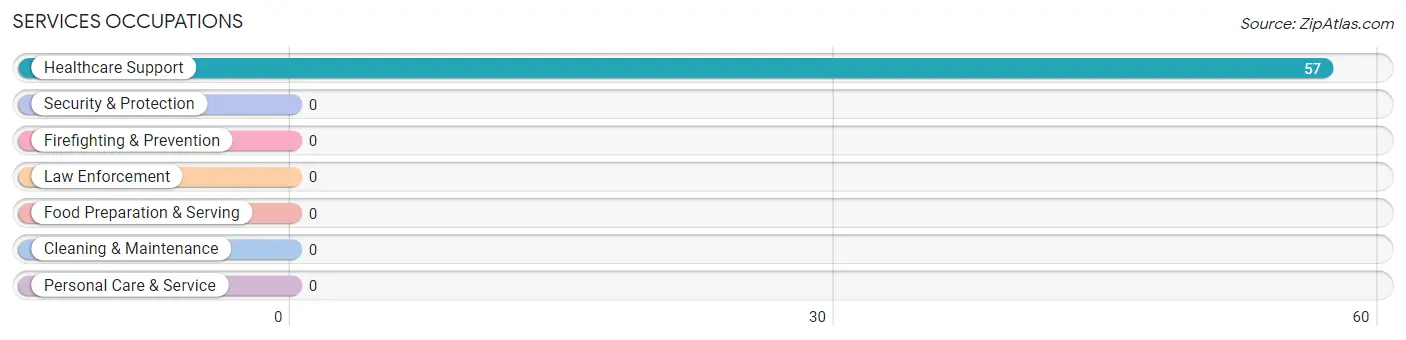
Services Occupations
The most common Services occupations in Myrtle Springs are , and Healthcare Support (57 | 19.9%).
Services Occupations by Sex
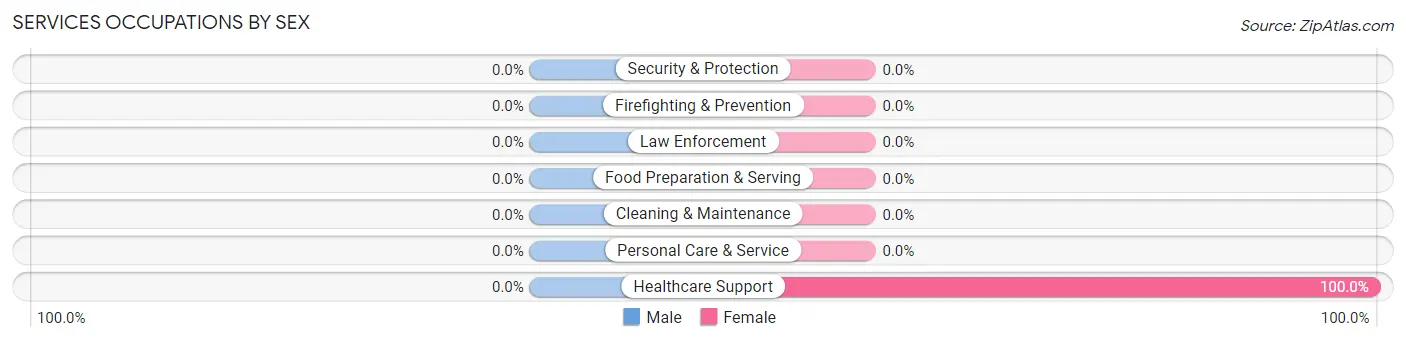
| Occupation | Male | Female |
| Healthcare Support | 0 (0.0%) | 57 (100.0%) |
| Security & Protection | 0 (0.0%) | 0 (0.0%) |
| Firefighting & Prevention | 0 (0.0%) | 0 (0.0%) |
| Law Enforcement | 0 (0.0%) | 0 (0.0%) |
| Food Preparation & Serving | 0 (0.0%) | 0 (0.0%) |
| Cleaning & Maintenance | 0 (0.0%) | 0 (0.0%) |
| Personal Care & Service | 0 (0.0%) | 0 (0.0%) |
| Total (Category) | 0 (0.0%) | 57 (100.0%) |
| Total (Overall) | 210 (73.4%) | 76 (26.6%) |
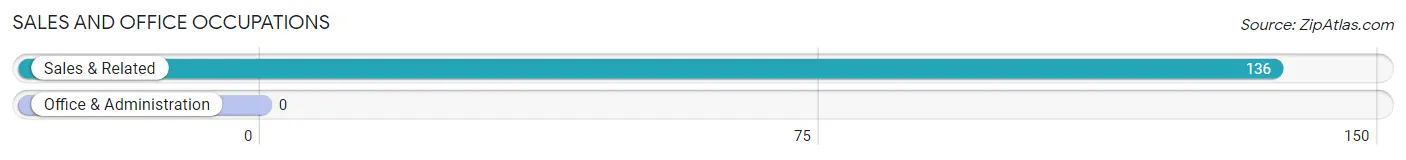
Sales and Office Occupations
The most common Sales and Office occupations in Myrtle Springs are , and Sales & Related (136 | 47.5%).
Sales and Office Occupations by Sex
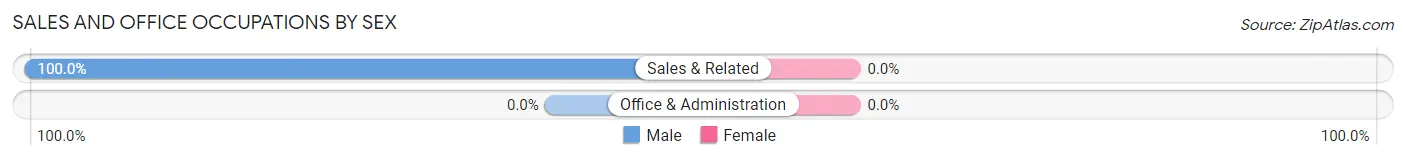
| Occupation | Male | Female |
| Sales & Related | 136 (100.0%) | 0 (0.0%) |
| Office & Administration | 0 (0.0%) | 0 (0.0%) |
| Total (Category) | 136 (100.0%) | 0 (0.0%) |
| Total (Overall) | 210 (73.4%) | 76 (26.6%) |
Natural Resources, Construction and Maintenance Occupations
The most common Natural Resources, Construction and Maintenance occupations in Myrtle Springs are , and Construction & Extraction (18 | 6.3%).
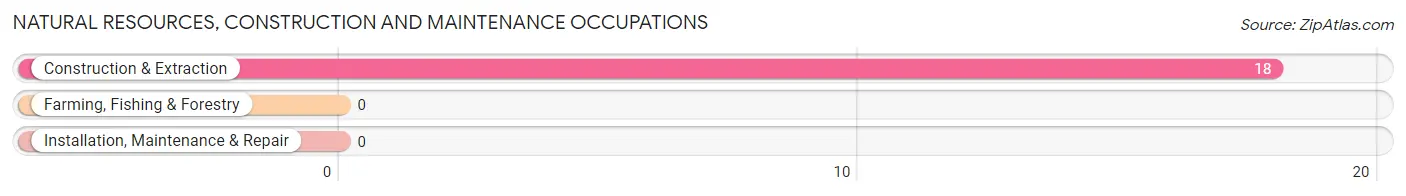
Natural Resources, Construction and Maintenance Occupations by Sex
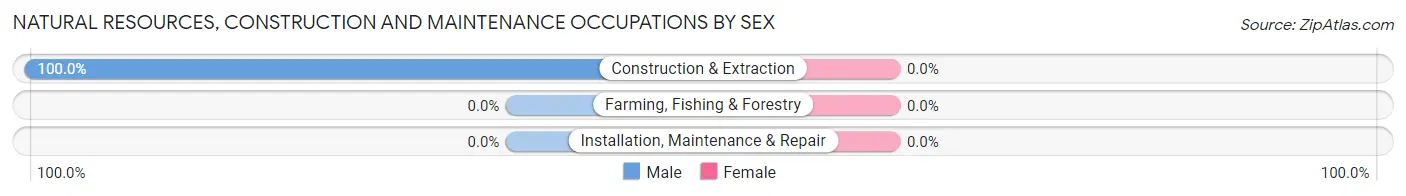
| Occupation | Male | Female |
| Farming, Fishing & Forestry | 0 (0.0%) | 0 (0.0%) |
| Construction & Extraction | 18 (100.0%) | 0 (0.0%) |
| Installation, Maintenance & Repair | 0 (0.0%) | 0 (0.0%) |
| Total (Category) | 18 (100.0%) | 0 (0.0%) |
| Total (Overall) | 210 (73.4%) | 76 (26.6%) |
Production, Transportation and Moving Occupations
The most common Production, Transportation and Moving occupations in Myrtle Springs are , and Material Moving (47 | 16.4%).
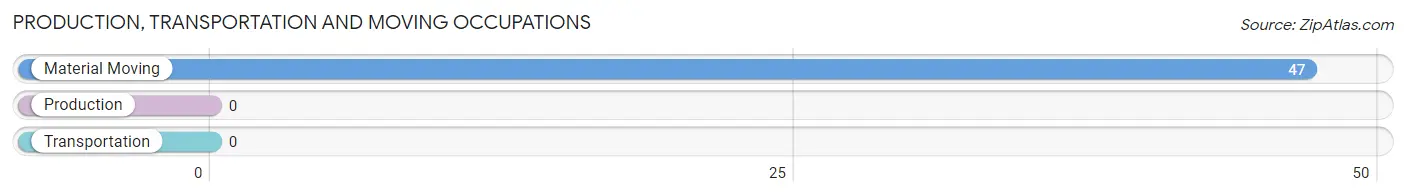
Production, Transportation and Moving Occupations by Sex
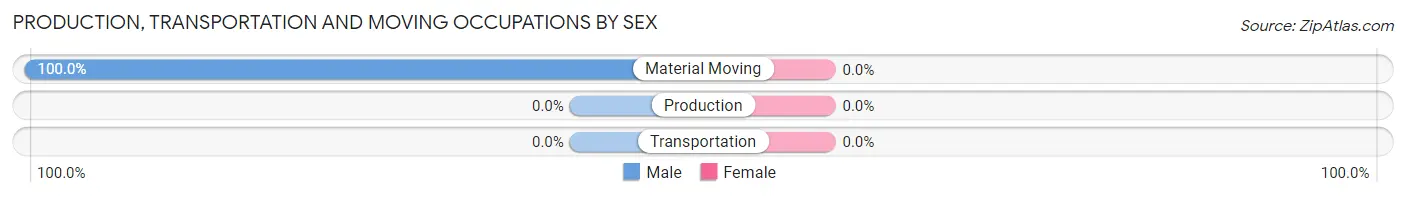
| Occupation | Male | Female |
| Production | 0 (0.0%) | 0 (0.0%) |
| Transportation | 0 (0.0%) | 0 (0.0%) |
| Material Moving | 47 (100.0%) | 0 (0.0%) |
| Total (Category) | 47 (100.0%) | 0 (0.0%) |
| Total (Overall) | 210 (73.4%) | 76 (26.6%) |
Employment Industries by Sex in Myrtle Springs
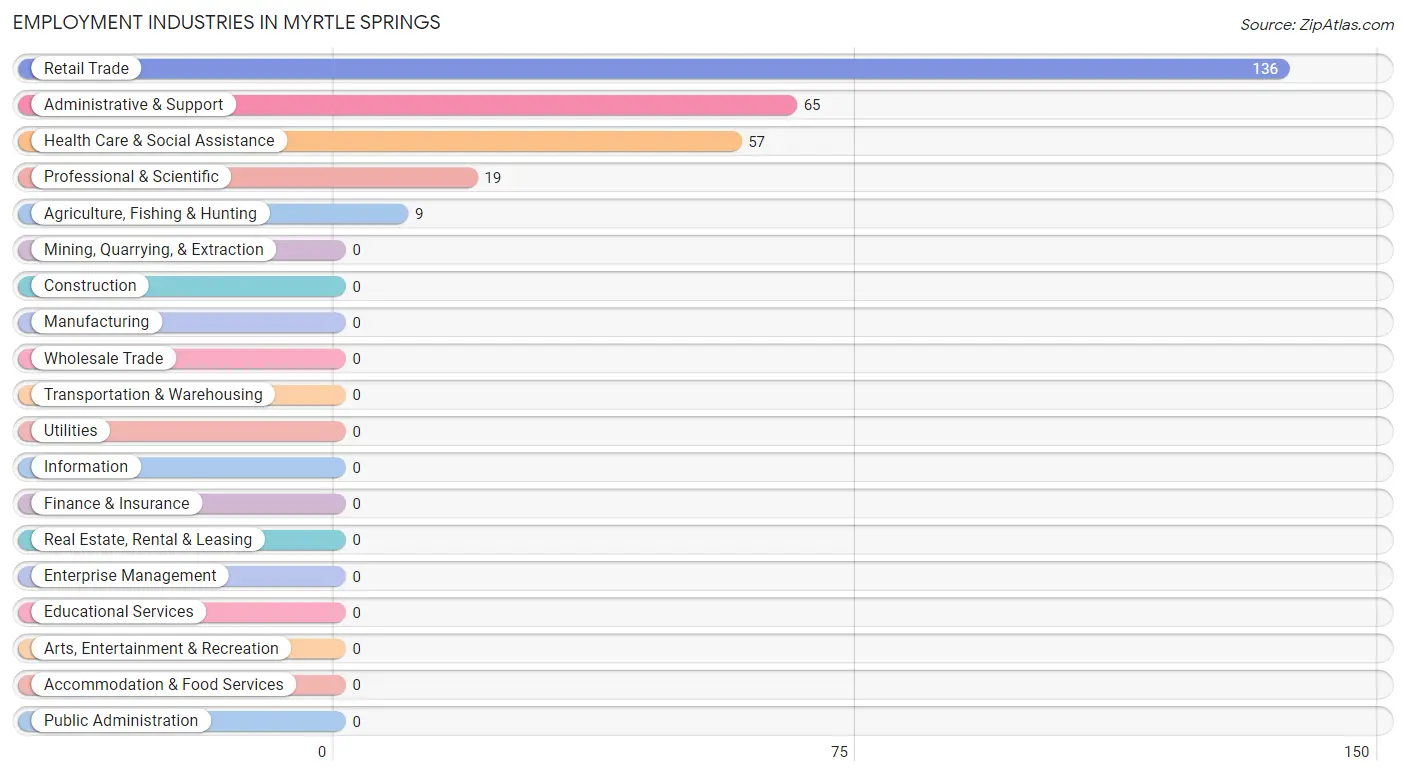
Employment Industries in Myrtle Springs
The major employment industries in Myrtle Springs include Retail Trade (136 | 47.5%), Administrative & Support (65 | 22.7%), Health Care & Social Assistance (57 | 19.9%), Professional & Scientific (19 | 6.6%), and Agriculture, Fishing & Hunting (9 | 3.2%).
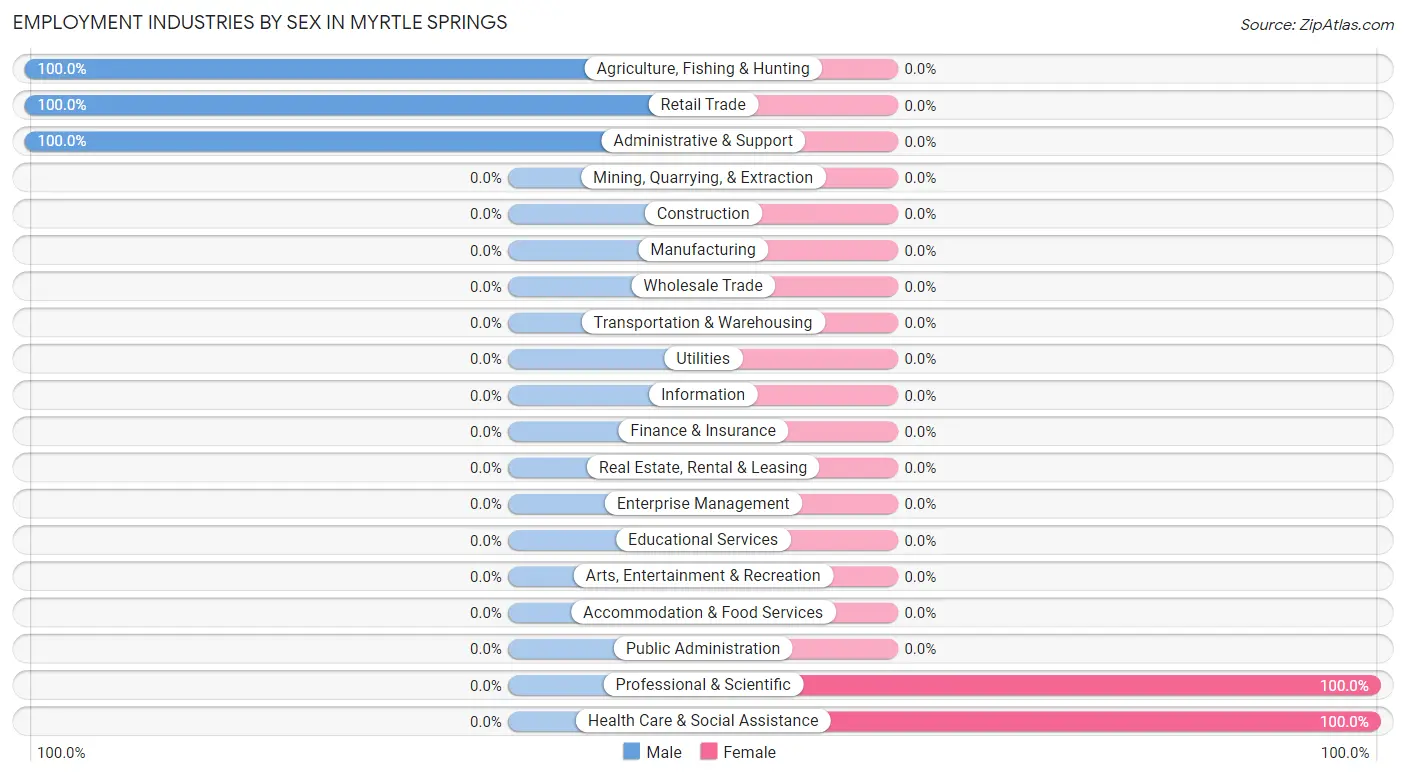
Employment Industries by Sex in Myrtle Springs
The Myrtle Springs industries that see more men than women are Agriculture, Fishing & Hunting (100.0%), Retail Trade (100.0%), and Administrative & Support (100.0%), whereas the industries that tend to have a higher number of women are Professional & Scientific (100.0%), and Health Care & Social Assistance (100.0%).
| Industry | Male | Female |
| Agriculture, Fishing & Hunting | 9 (100.0%) | 0 (0.0%) |
| Mining, Quarrying, & Extraction | 0 (0.0%) | 0 (0.0%) |
| Construction | 0 (0.0%) | 0 (0.0%) |
| Manufacturing | 0 (0.0%) | 0 (0.0%) |
| Wholesale Trade | 0 (0.0%) | 0 (0.0%) |
| Retail Trade | 136 (100.0%) | 0 (0.0%) |
| Transportation & Warehousing | 0 (0.0%) | 0 (0.0%) |
| Utilities | 0 (0.0%) | 0 (0.0%) |
| Information | 0 (0.0%) | 0 (0.0%) |
| Finance & Insurance | 0 (0.0%) | 0 (0.0%) |
| Real Estate, Rental & Leasing | 0 (0.0%) | 0 (0.0%) |
| Professional & Scientific | 0 (0.0%) | 19 (100.0%) |
| Enterprise Management | 0 (0.0%) | 0 (0.0%) |
| Administrative & Support | 65 (100.0%) | 0 (0.0%) |
| Educational Services | 0 (0.0%) | 0 (0.0%) |
| Health Care & Social Assistance | 0 (0.0%) | 57 (100.0%) |
| Arts, Entertainment & Recreation | 0 (0.0%) | 0 (0.0%) |
| Accommodation & Food Services | 0 (0.0%) | 0 (0.0%) |
| Public Administration | 0 (0.0%) | 0 (0.0%) |
| Total | 210 (73.4%) | 76 (26.6%) |
Education in Myrtle Springs
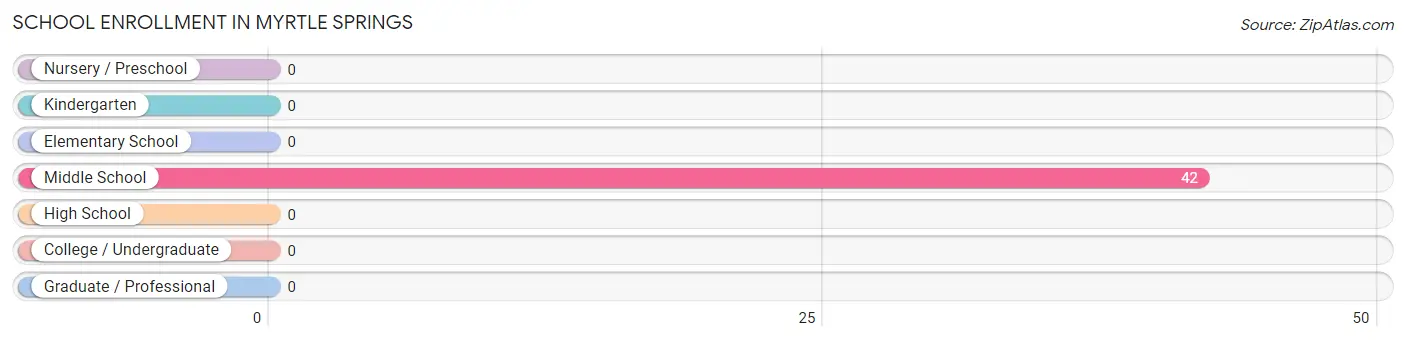
School Enrollment in Myrtle Springs
| School Level | # Students | % Students |
| Nursery / Preschool | 0 | 0.0% |
| Kindergarten | 0 | 0.0% |
| Elementary School | 0 | 0.0% |
| Middle School | 42 | 100.0% |
| High School | 0 | 0.0% |
| College / Undergraduate | 0 | 0.0% |
| Graduate / Professional | 0 | 0.0% |
| Total | 42 | 100.0% |
School Enrollment by Age by Funding Source in Myrtle Springs
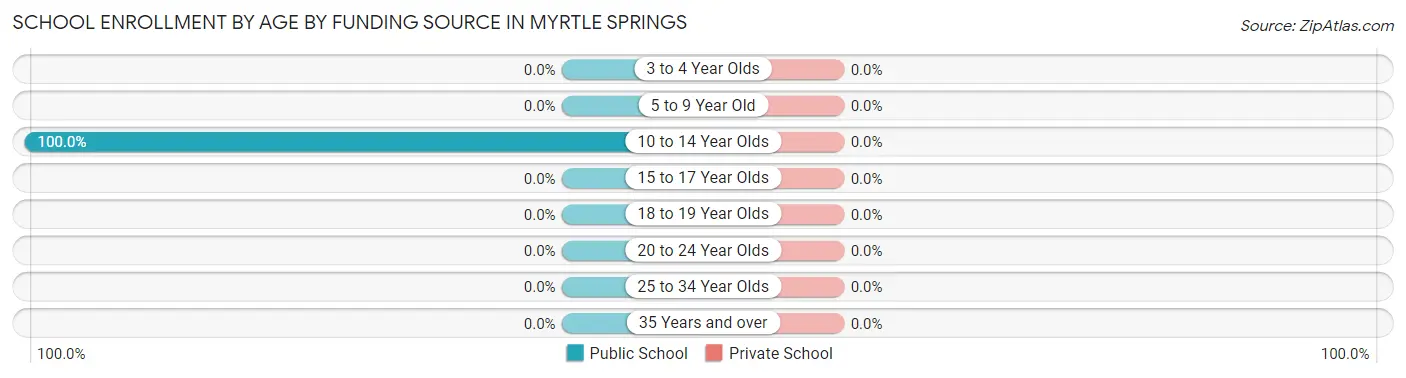
| Age Bracket | Public School | Private School |
| 3 to 4 Year Olds | 0 (0.0%) | 0 (0.0%) |
| 5 to 9 Year Old | 0 (0.0%) | 0 (0.0%) |
| 10 to 14 Year Olds | 42 (100.0%) | 0 (0.0%) |
| 15 to 17 Year Olds | 0 (0.0%) | 0 (0.0%) |
| 18 to 19 Year Olds | 0 (0.0%) | 0 (0.0%) |
| 20 to 24 Year Olds | 0 (0.0%) | 0 (0.0%) |
| 25 to 34 Year Olds | 0 (0.0%) | 0 (0.0%) |
| 35 Years and over | 0 (0.0%) | 0 (0.0%) |
| Total | 42 (100.0%) | 0 (0.0%) |
Educational Attainment by Field of Study in Myrtle Springs
Bio, nature & agricultural (10 | 17.5%), engineering (10 | 17.5%), business (10 | 17.5%), computers & mathematics (9 | 15.8%), and visual & performing arts (9 | 15.8%) are the most common fields of study among 57 individuals in Myrtle Springs who have obtained a bachelor's degree or higher.
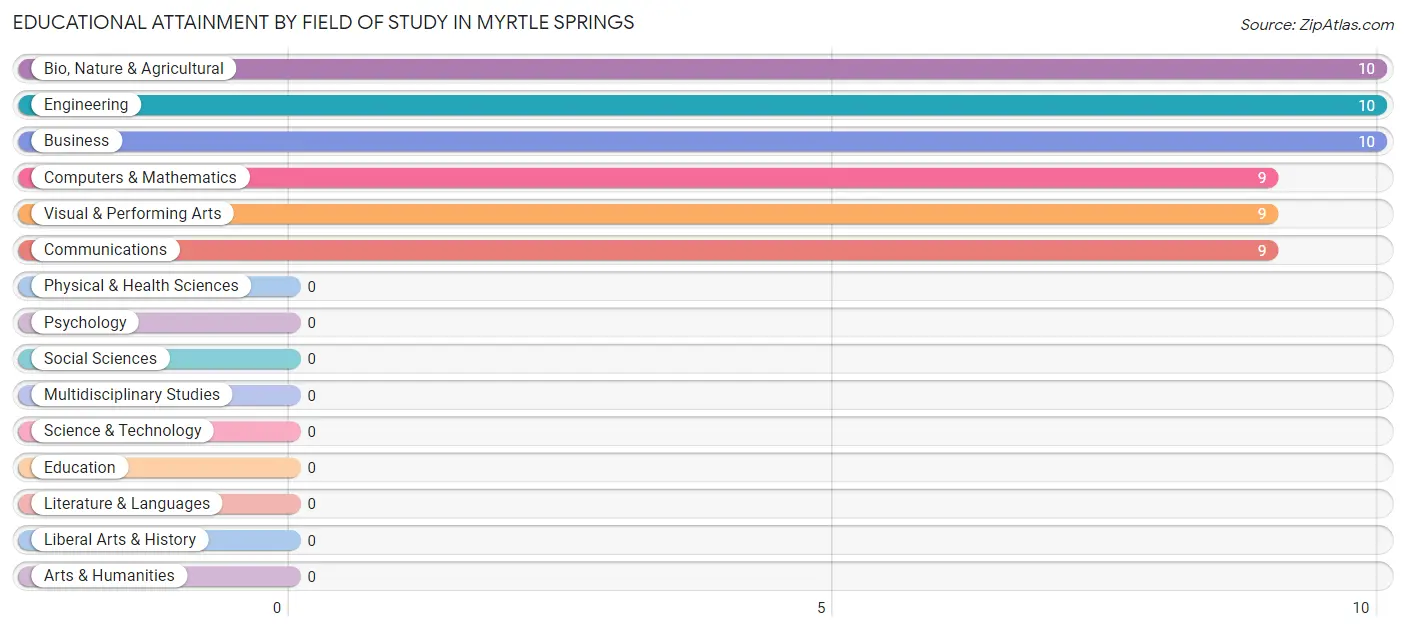
| Field of Study | # Graduates | % Graduates |
| Computers & Mathematics | 9 | 15.8% |
| Bio, Nature & Agricultural | 10 | 17.5% |
| Physical & Health Sciences | 0 | 0.0% |
| Psychology | 0 | 0.0% |
| Social Sciences | 0 | 0.0% |
| Engineering | 10 | 17.5% |
| Multidisciplinary Studies | 0 | 0.0% |
| Science & Technology | 0 | 0.0% |
| Business | 10 | 17.5% |
| Education | 0 | 0.0% |
| Literature & Languages | 0 | 0.0% |
| Liberal Arts & History | 0 | 0.0% |
| Visual & Performing Arts | 9 | 15.8% |
| Communications | 9 | 15.8% |
| Arts & Humanities | 0 | 0.0% |
| Total | 57 | 100.0% |
Transportation & Commute in Myrtle Springs
Vehicle Availability by Sex in Myrtle Springs
The most prevalent vehicle ownership categories in Myrtle Springs are males with 1 vehicle (122, accounting for 58.1%) and females with 1 vehicle (0, making up 160.5%).
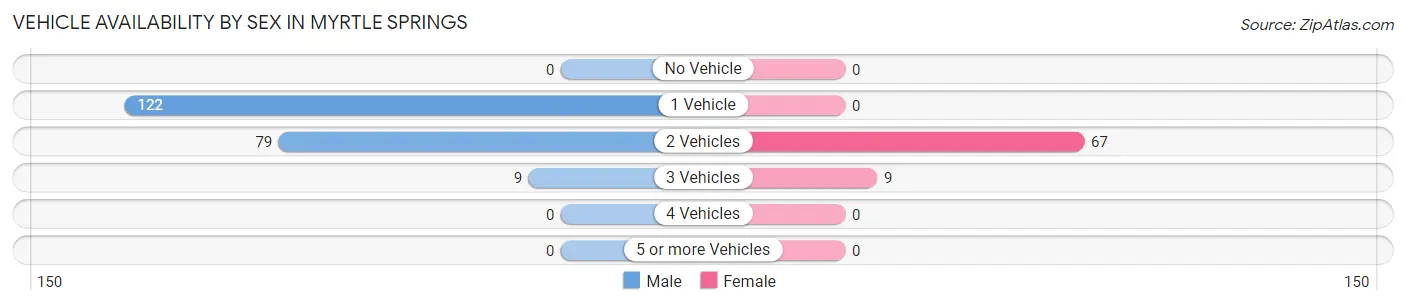
| Vehicles Available | Male | Female |
| No Vehicle | 0 (0.0%) | 0 (0.0%) |
| 1 Vehicle | 122 (58.1%) | 0 (0.0%) |
| 2 Vehicles | 79 (37.6%) | 67 (88.2%) |
| 3 Vehicles | 9 (4.3%) | 9 (11.8%) |
| 4 Vehicles | 0 (0.0%) | 0 (0.0%) |
| 5 or more Vehicles | 0 (0.0%) | 0 (0.0%) |
| Total | 210 (100.0%) | 76 (100.0%) |
Commute Time in Myrtle Springs
The most frequently occuring commute durations in Myrtle Springs are 10 to 14 minutes (75 commuters, 26.2%), 5 to 9 minutes (65 commuters, 22.7%), and 20 to 24 minutes (61 commuters, 21.3%).
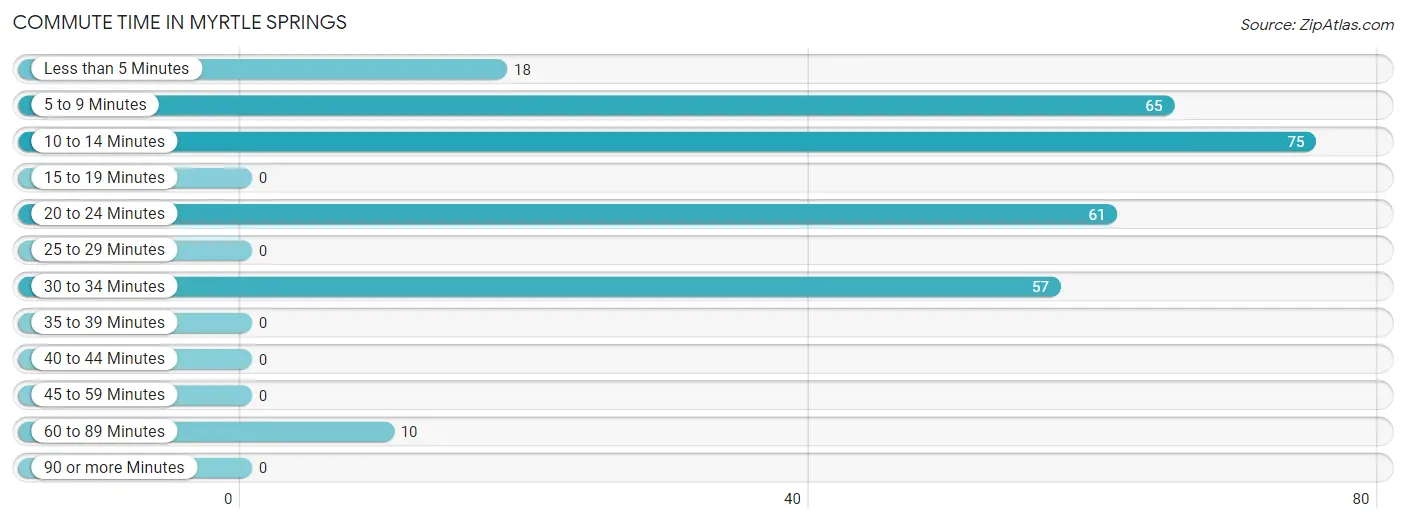
| Commute Time | # Commuters | % Commuters |
| Less than 5 Minutes | 18 | 6.3% |
| 5 to 9 Minutes | 65 | 22.7% |
| 10 to 14 Minutes | 75 | 26.2% |
| 15 to 19 Minutes | 0 | 0.0% |
| 20 to 24 Minutes | 61 | 21.3% |
| 25 to 29 Minutes | 0 | 0.0% |
| 30 to 34 Minutes | 57 | 19.9% |
| 35 to 39 Minutes | 0 | 0.0% |
| 40 to 44 Minutes | 0 | 0.0% |
| 45 to 59 Minutes | 0 | 0.0% |
| 60 to 89 Minutes | 10 | 3.5% |
| 90 or more Minutes | 0 | 0.0% |
Commute Time by Sex in Myrtle Springs
The most common commute times in Myrtle Springs are 10 to 14 minutes (75 commuters, 35.7%) for males and 30 to 34 minutes (57 commuters, 75.0%) for females.
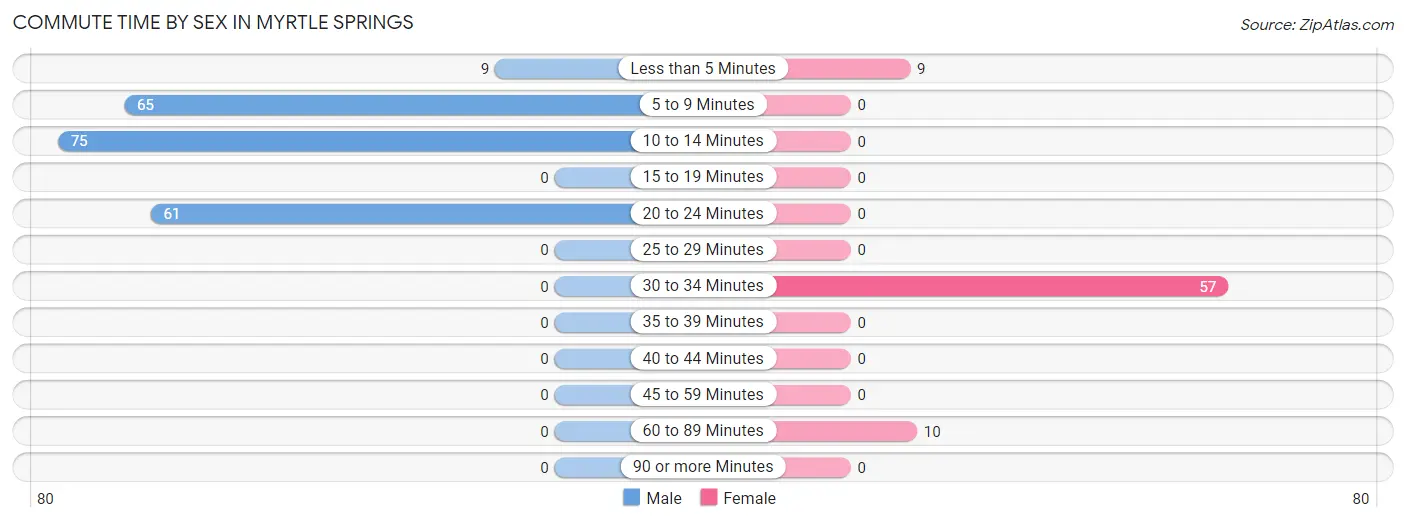
| Commute Time | Male | Female |
| Less than 5 Minutes | 9 (4.3%) | 9 (11.8%) |
| 5 to 9 Minutes | 65 (30.9%) | 0 (0.0%) |
| 10 to 14 Minutes | 75 (35.7%) | 0 (0.0%) |
| 15 to 19 Minutes | 0 (0.0%) | 0 (0.0%) |
| 20 to 24 Minutes | 61 (29.0%) | 0 (0.0%) |
| 25 to 29 Minutes | 0 (0.0%) | 0 (0.0%) |
| 30 to 34 Minutes | 0 (0.0%) | 57 (75.0%) |
| 35 to 39 Minutes | 0 (0.0%) | 0 (0.0%) |
| 40 to 44 Minutes | 0 (0.0%) | 0 (0.0%) |
| 45 to 59 Minutes | 0 (0.0%) | 0 (0.0%) |
| 60 to 89 Minutes | 0 (0.0%) | 10 (13.2%) |
| 90 or more Minutes | 0 (0.0%) | 0 (0.0%) |
Time of Departure to Work by Sex in Myrtle Springs
The most frequent times of departure to work in Myrtle Springs are 12:00 PM to 3:59 PM (75, 35.7%) for males and 4:00 PM to 11:59 PM (57, 75.0%) for females.
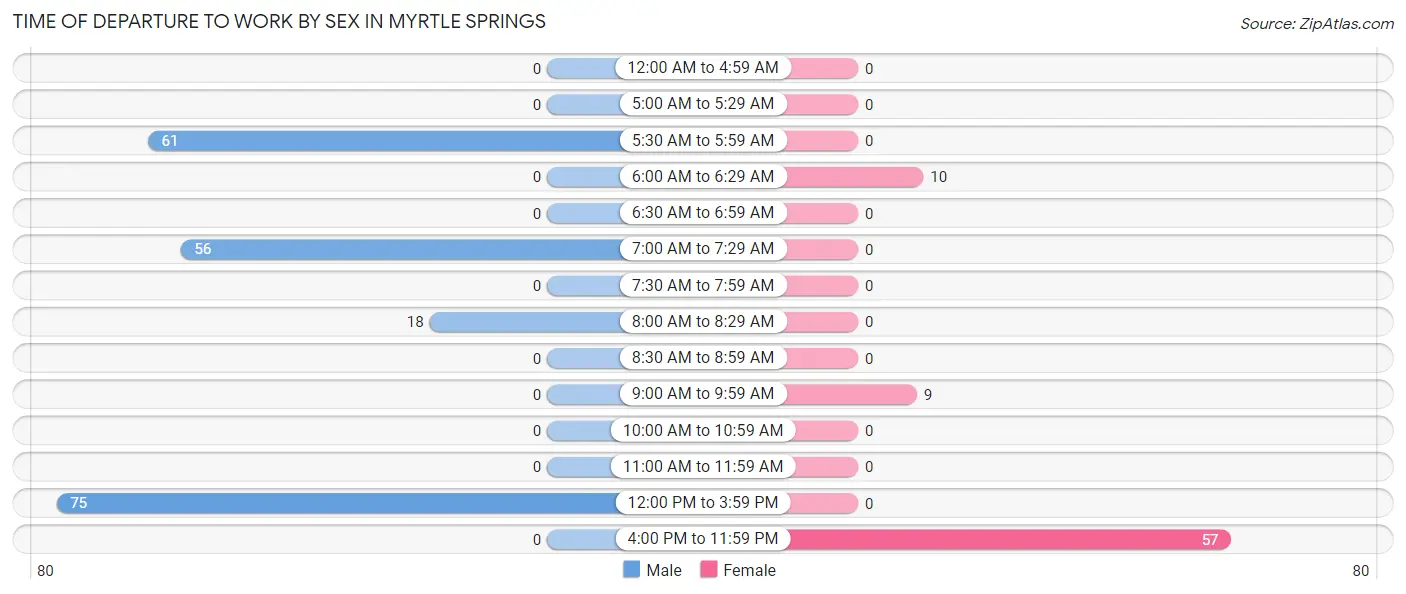
| Time of Departure | Male | Female |
| 12:00 AM to 4:59 AM | 0 (0.0%) | 0 (0.0%) |
| 5:00 AM to 5:29 AM | 0 (0.0%) | 0 (0.0%) |
| 5:30 AM to 5:59 AM | 61 (29.0%) | 0 (0.0%) |
| 6:00 AM to 6:29 AM | 0 (0.0%) | 10 (13.2%) |
| 6:30 AM to 6:59 AM | 0 (0.0%) | 0 (0.0%) |
| 7:00 AM to 7:29 AM | 56 (26.7%) | 0 (0.0%) |
| 7:30 AM to 7:59 AM | 0 (0.0%) | 0 (0.0%) |
| 8:00 AM to 8:29 AM | 18 (8.6%) | 0 (0.0%) |
| 8:30 AM to 8:59 AM | 0 (0.0%) | 0 (0.0%) |
| 9:00 AM to 9:59 AM | 0 (0.0%) | 9 (11.8%) |
| 10:00 AM to 10:59 AM | 0 (0.0%) | 0 (0.0%) |
| 11:00 AM to 11:59 AM | 0 (0.0%) | 0 (0.0%) |
| 12:00 PM to 3:59 PM | 75 (35.7%) | 0 (0.0%) |
| 4:00 PM to 11:59 PM | 0 (0.0%) | 57 (75.0%) |
| Total | 210 (100.0%) | 76 (100.0%) |
Housing Occupancy in Myrtle Springs
Occupancy by Ownership in Myrtle Springs
Of the total 356 dwellings in Myrtle Springs, owner-occupied units account for 155 (43.5%), while renter-occupied units make up 201 (56.5%).
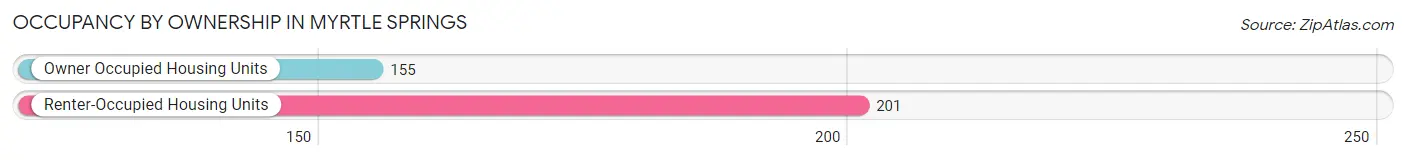
| Occupancy | # Housing Units | % Housing Units |
| Owner Occupied Housing Units | 155 | 43.5% |
| Renter-Occupied Housing Units | 201 | 56.5% |
| Total Occupied Housing Units | 356 | 100.0% |
Occupancy by Household Size in Myrtle Springs
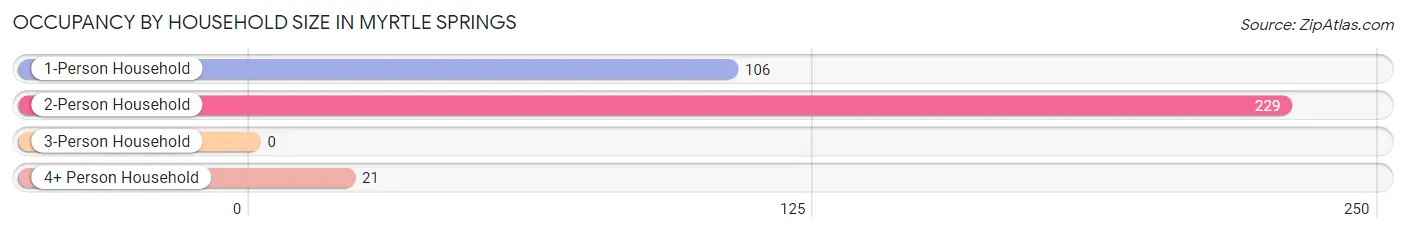
| Household Size | # Housing Units | % Housing Units |
| 1-Person Household | 106 | 29.8% |
| 2-Person Household | 229 | 64.3% |
| 3-Person Household | 0 | 0.0% |
| 4+ Person Household | 21 | 5.9% |
| Total Housing Units | 356 | 100.0% |
Occupancy by Ownership by Household Size in Myrtle Springs
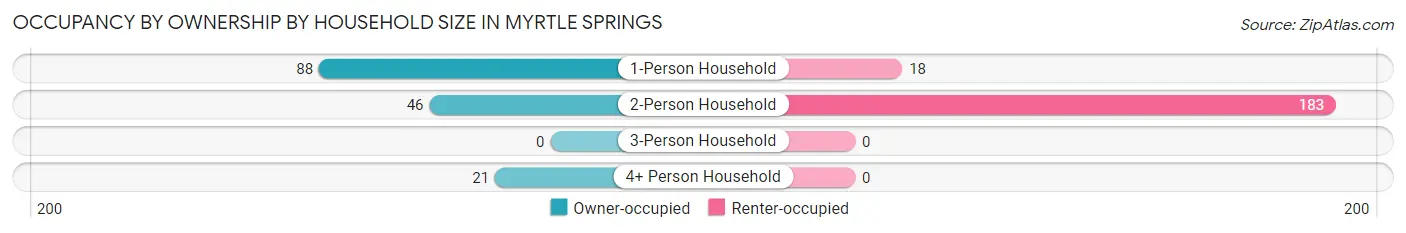
| Household Size | Owner-occupied | Renter-occupied |
| 1-Person Household | 88 (83.0%) | 18 (17.0%) |
| 2-Person Household | 46 (20.1%) | 183 (79.9%) |
| 3-Person Household | 0 (0.0%) | 0 (0.0%) |
| 4+ Person Household | 21 (100.0%) | 0 (0.0%) |
| Total Housing Units | 155 (43.5%) | 201 (56.5%) |
Occupancy by Educational Attainment in Myrtle Springs
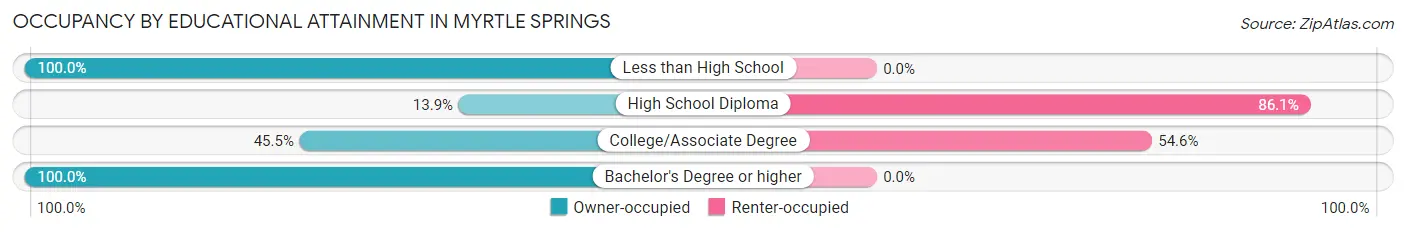
| Household Size | Owner-occupied | Renter-occupied |
| Less than High School | 21 (100.0%) | 0 (0.0%) |
| High School Diploma | 15 (13.9%) | 93 (86.1%) |
| College/Associate Degree | 90 (45.5%) | 108 (54.5%) |
| Bachelor's Degree or higher | 29 (100.0%) | 0 (0.0%) |
Occupancy by Age of Householder in Myrtle Springs
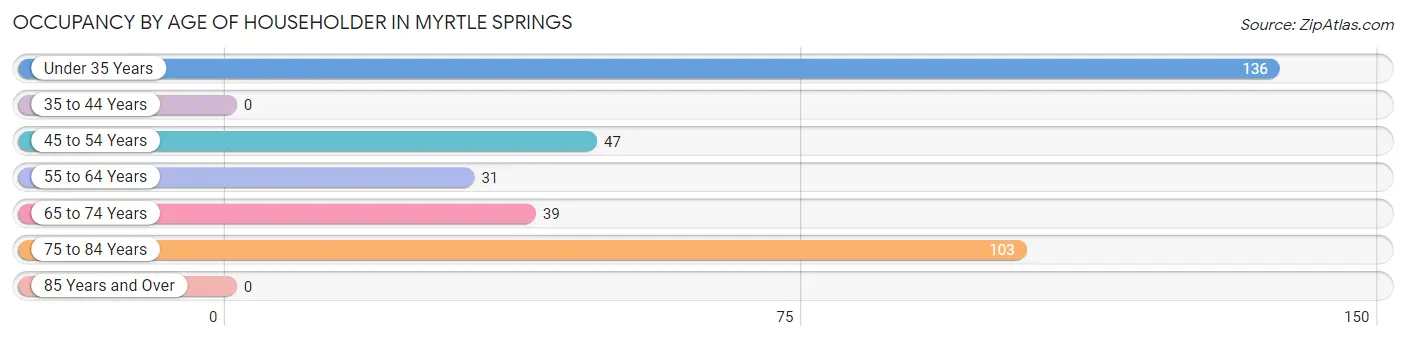
| Age Bracket | # Households | % Households |
| Under 35 Years | 136 | 38.2% |
| 35 to 44 Years | 0 | 0.0% |
| 45 to 54 Years | 47 | 13.2% |
| 55 to 64 Years | 31 | 8.7% |
| 65 to 74 Years | 39 | 11.0% |
| 75 to 84 Years | 103 | 28.9% |
| 85 Years and Over | 0 | 0.0% |
| Total | 356 | 100.0% |
Housing Finances in Myrtle Springs
Median Income by Occupancy in Myrtle Springs
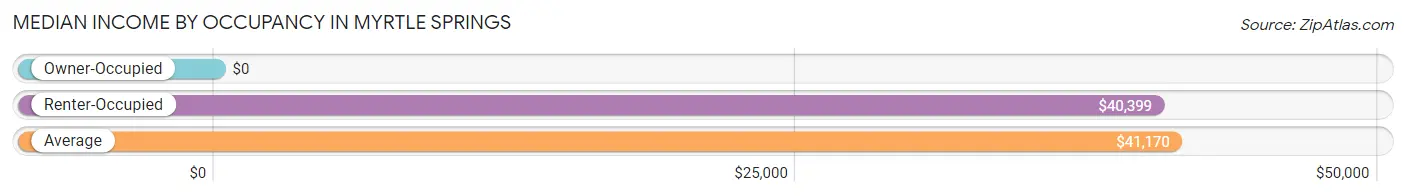
| Occupancy Type | # Households | Median Income |
| Owner-Occupied | 155 (43.5%) | $0 |
| Renter-Occupied | 201 (56.5%) | $40,399 |
| Average | 356 (100.0%) | $41,170 |
Occupancy by Householder Income Bracket in Myrtle Springs
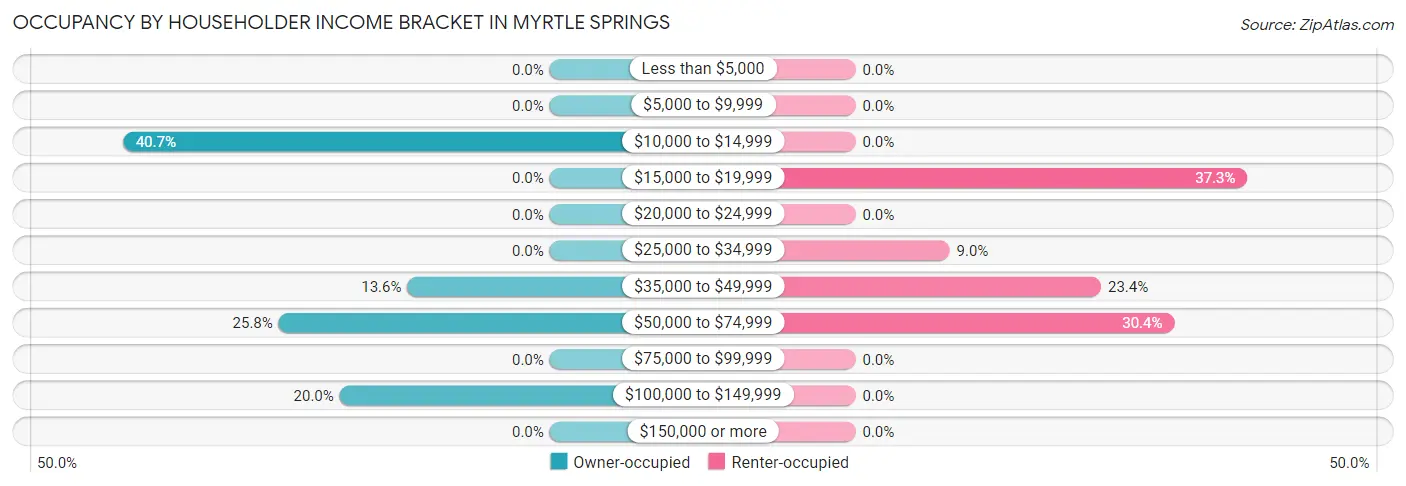
| Income Bracket | Owner-occupied | Renter-occupied |
| Less than $5,000 | 0 (0.0%) | 0 (0.0%) |
| $5,000 to $9,999 | 0 (0.0%) | 0 (0.0%) |
| $10,000 to $14,999 | 63 (40.6%) | 0 (0.0%) |
| $15,000 to $19,999 | 0 (0.0%) | 75 (37.3%) |
| $20,000 to $24,999 | 0 (0.0%) | 0 (0.0%) |
| $25,000 to $34,999 | 0 (0.0%) | 18 (9.0%) |
| $35,000 to $49,999 | 21 (13.6%) | 47 (23.4%) |
| $50,000 to $74,999 | 40 (25.8%) | 61 (30.3%) |
| $75,000 to $99,999 | 0 (0.0%) | 0 (0.0%) |
| $100,000 to $149,999 | 31 (20.0%) | 0 (0.0%) |
| $150,000 or more | 0 (0.0%) | 0 (0.0%) |
| Total | 155 (100.0%) | 201 (100.0%) |
Monthly Housing Cost Tiers in Myrtle Springs
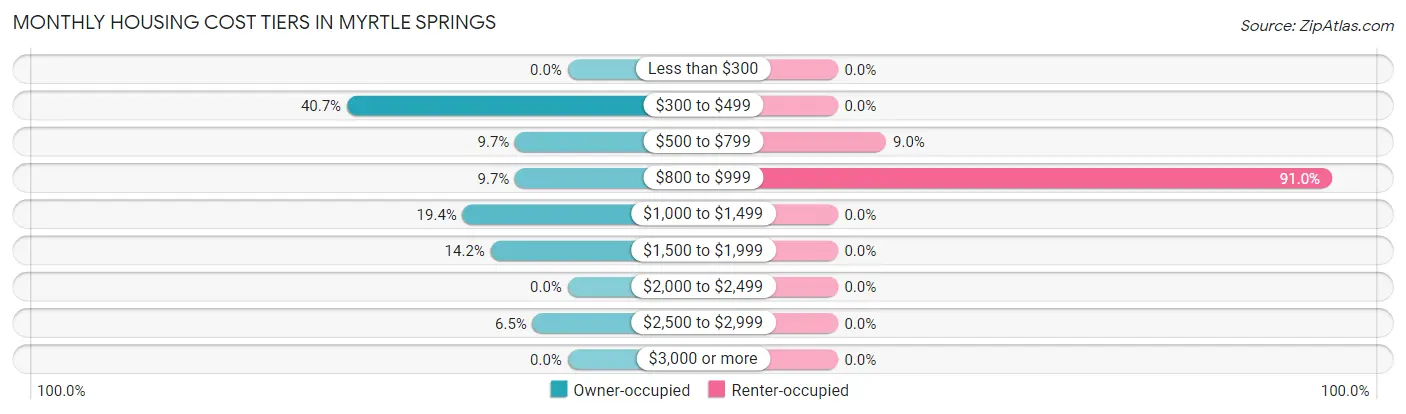
| Monthly Cost | Owner-occupied | Renter-occupied |
| Less than $300 | 0 (0.0%) | 0 (0.0%) |
| $300 to $499 | 63 (40.6%) | 0 (0.0%) |
| $500 to $799 | 15 (9.7%) | 18 (9.0%) |
| $800 to $999 | 15 (9.7%) | 183 (91.0%) |
| $1,000 to $1,499 | 30 (19.4%) | 0 (0.0%) |
| $1,500 to $1,999 | 22 (14.2%) | 0 (0.0%) |
| $2,000 to $2,499 | 0 (0.0%) | 0 (0.0%) |
| $2,500 to $2,999 | 10 (6.5%) | 0 (0.0%) |
| $3,000 or more | 0 (0.0%) | 0 (0.0%) |
| Total | 155 (100.0%) | 201 (100.0%) |
Physical Housing Characteristics in Myrtle Springs
Housing Structures in Myrtle Springs
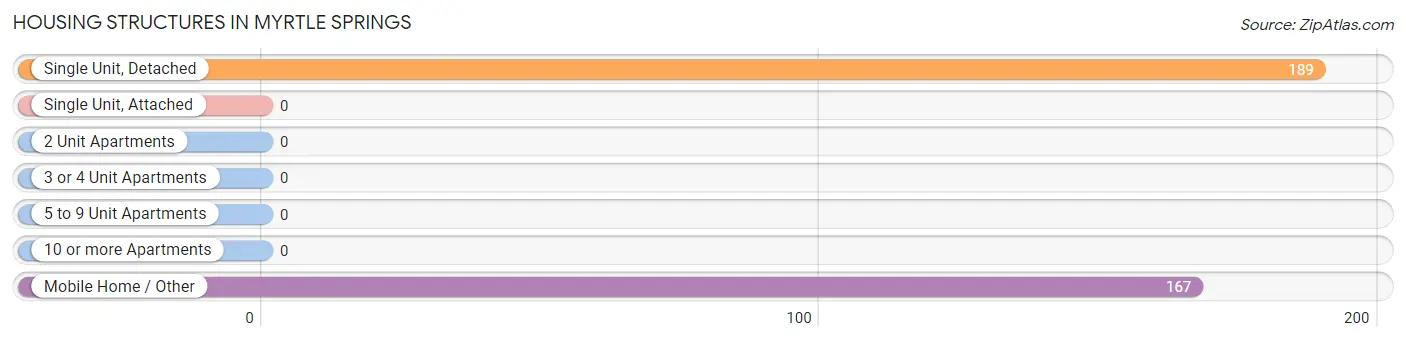
| Structure Type | # Housing Units | % Housing Units |
| Single Unit, Detached | 189 | 53.1% |
| Single Unit, Attached | 0 | 0.0% |
| 2 Unit Apartments | 0 | 0.0% |
| 3 or 4 Unit Apartments | 0 | 0.0% |
| 5 to 9 Unit Apartments | 0 | 0.0% |
| 10 or more Apartments | 0 | 0.0% |
| Mobile Home / Other | 167 | 46.9% |
| Total | 356 | 100.0% |
Housing Structures by Occupancy in Myrtle Springs
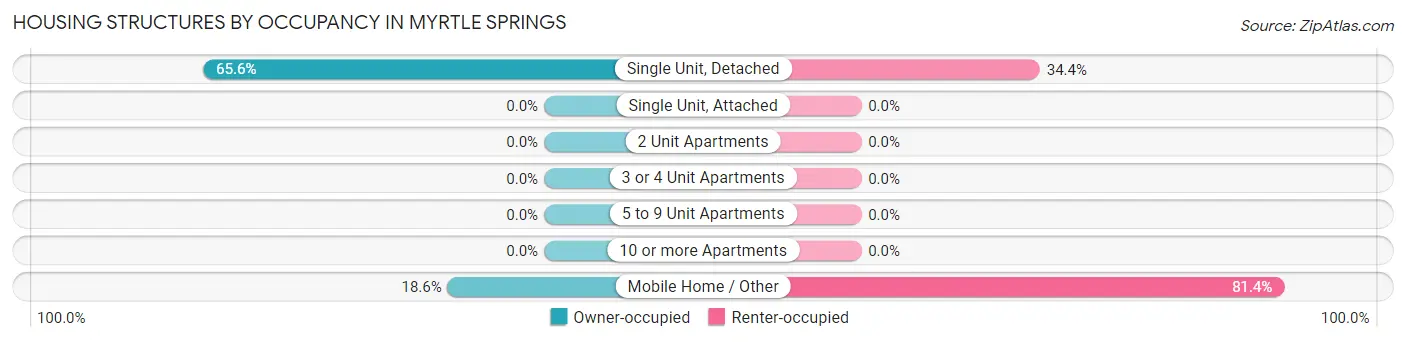
| Structure Type | Owner-occupied | Renter-occupied |
| Single Unit, Detached | 124 (65.6%) | 65 (34.4%) |
| Single Unit, Attached | 0 (0.0%) | 0 (0.0%) |
| 2 Unit Apartments | 0 (0.0%) | 0 (0.0%) |
| 3 or 4 Unit Apartments | 0 (0.0%) | 0 (0.0%) |
| 5 to 9 Unit Apartments | 0 (0.0%) | 0 (0.0%) |
| 10 or more Apartments | 0 (0.0%) | 0 (0.0%) |
| Mobile Home / Other | 31 (18.6%) | 136 (81.4%) |
| Total | 155 (43.5%) | 201 (56.5%) |
Housing Structures by Number of Rooms in Myrtle Springs
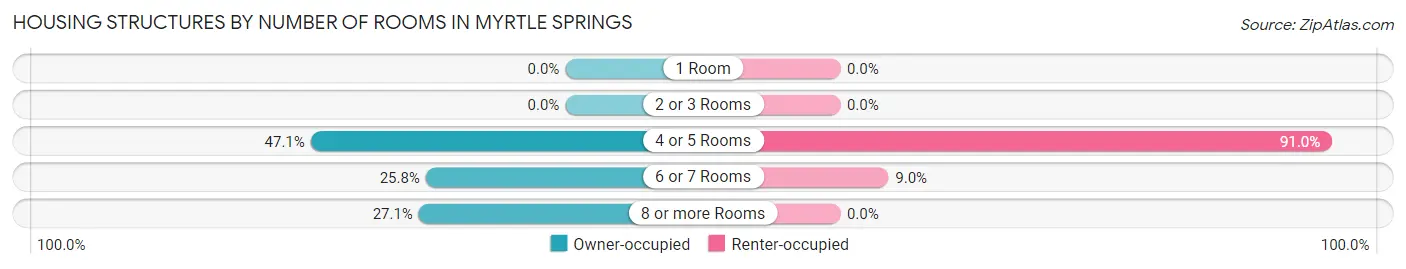
| Number of Rooms | Owner-occupied | Renter-occupied |
| 1 Room | 0 (0.0%) | 0 (0.0%) |
| 2 or 3 Rooms | 0 (0.0%) | 0 (0.0%) |
| 4 or 5 Rooms | 73 (47.1%) | 183 (91.0%) |
| 6 or 7 Rooms | 40 (25.8%) | 18 (9.0%) |
| 8 or more Rooms | 42 (27.1%) | 0 (0.0%) |
| Total | 155 (100.0%) | 201 (100.0%) |
Housing Structure by Heating Type in Myrtle Springs
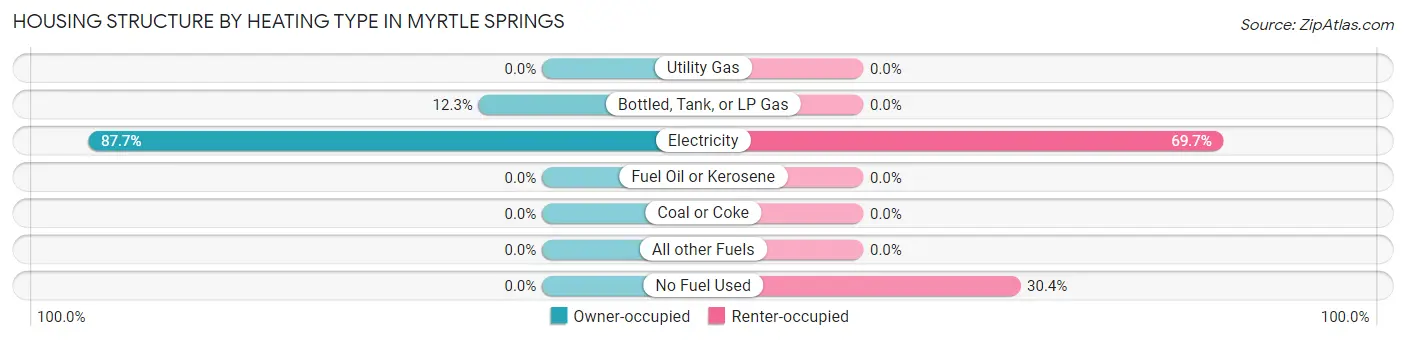
| Heating Type | Owner-occupied | Renter-occupied |
| Utility Gas | 0 (0.0%) | 0 (0.0%) |
| Bottled, Tank, or LP Gas | 19 (12.3%) | 0 (0.0%) |
| Electricity | 136 (87.7%) | 140 (69.7%) |
| Fuel Oil or Kerosene | 0 (0.0%) | 0 (0.0%) |
| Coal or Coke | 0 (0.0%) | 0 (0.0%) |
| All other Fuels | 0 (0.0%) | 0 (0.0%) |
| No Fuel Used | 0 (0.0%) | 61 (30.3%) |
| Total | 155 (100.0%) | 201 (100.0%) |
Household Vehicle Usage in Myrtle Springs
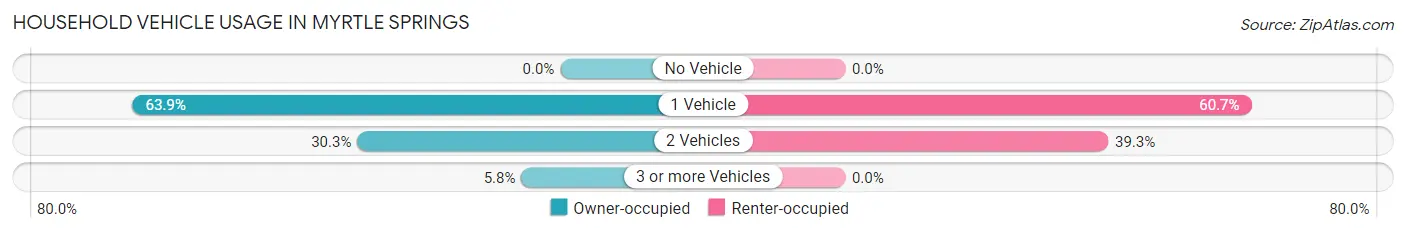
| Vehicles per Household | Owner-occupied | Renter-occupied |
| No Vehicle | 0 (0.0%) | 0 (0.0%) |
| 1 Vehicle | 99 (63.9%) | 122 (60.7%) |
| 2 Vehicles | 47 (30.3%) | 79 (39.3%) |
| 3 or more Vehicles | 9 (5.8%) | 0 (0.0%) |
| Total | 155 (100.0%) | 201 (100.0%) |
Real Estate & Mortgages in Myrtle Springs
Real Estate and Mortgage Overview in Myrtle Springs
| Characteristic | Without Mortgage | With Mortgage |
| Housing Units | 102 | 53 |
| Median Property Value | $164,300 | $0 |
| Median Household Income | - | - |
| Monthly Housing Costs | $481 | $0 |
| Real Estate Taxes | - | - |
Property Value by Mortgage Status in Myrtle Springs
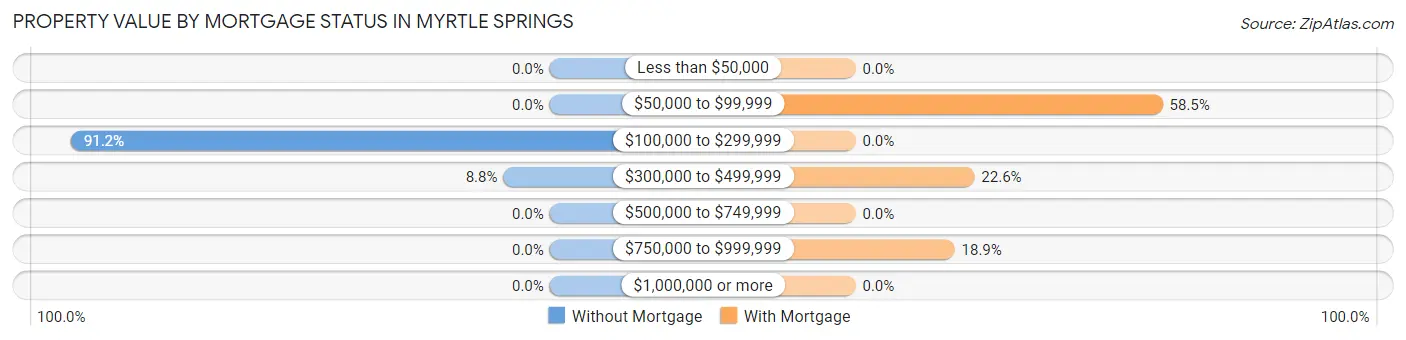
| Property Value | Without Mortgage | With Mortgage |
| Less than $50,000 | 0 (0.0%) | 0 (0.0%) |
| $50,000 to $99,999 | 0 (0.0%) | 31 (58.5%) |
| $100,000 to $299,999 | 93 (91.2%) | 0 (0.0%) |
| $300,000 to $499,999 | 9 (8.8%) | 12 (22.6%) |
| $500,000 to $749,999 | 0 (0.0%) | 0 (0.0%) |
| $750,000 to $999,999 | 0 (0.0%) | 10 (18.9%) |
| $1,000,000 or more | 0 (0.0%) | 0 (0.0%) |
| Total | 102 (100.0%) | 53 (100.0%) |
Household Income by Mortgage Status in Myrtle Springs
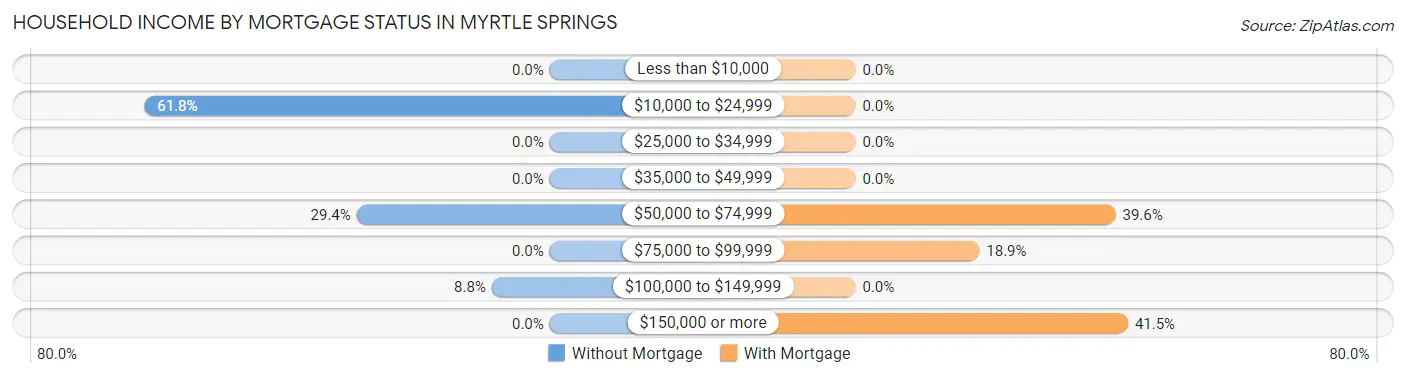
| Household Income | Without Mortgage | With Mortgage |
| Less than $10,000 | 0 (0.0%) | 0 (0.0%) |
| $10,000 to $24,999 | 63 (61.8%) | 0 (0.0%) |
| $25,000 to $34,999 | 0 (0.0%) | 0 (0.0%) |
| $35,000 to $49,999 | 0 (0.0%) | 0 (0.0%) |
| $50,000 to $74,999 | 30 (29.4%) | 21 (39.6%) |
| $75,000 to $99,999 | 0 (0.0%) | 10 (18.9%) |
| $100,000 to $149,999 | 9 (8.8%) | 0 (0.0%) |
| $150,000 or more | 0 (0.0%) | 22 (41.5%) |
| Total | 102 (100.0%) | 53 (100.0%) |
Property Value to Household Income Ratio in Myrtle Springs
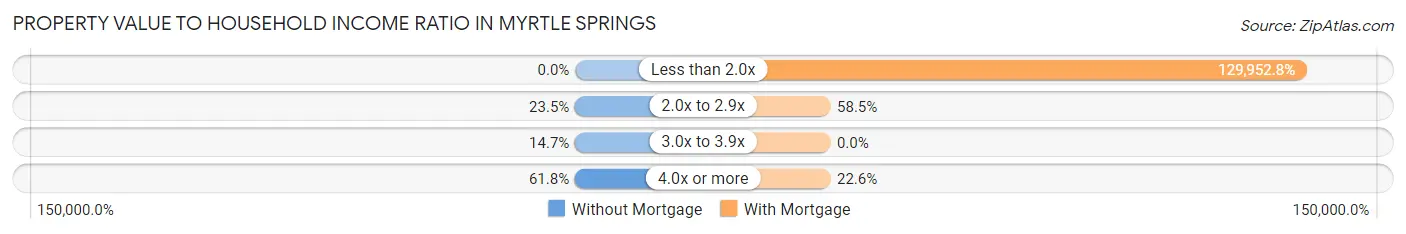
| Value-to-Income Ratio | Without Mortgage | With Mortgage |
| Less than 2.0x | 0 (0.0%) | 68,875 (129,952.8%) |
| 2.0x to 2.9x | 24 (23.5%) | 31 (58.5%) |
| 3.0x to 3.9x | 15 (14.7%) | 0 (0.0%) |
| 4.0x or more | 63 (61.8%) | 12 (22.6%) |
| Total | 102 (100.0%) | 53 (100.0%) |
Real Estate Taxes by Mortgage Status in Myrtle Springs
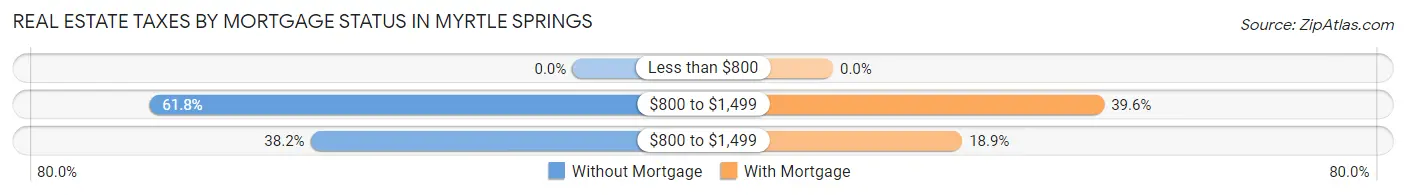
| Property Taxes | Without Mortgage | With Mortgage |
| Less than $800 | 0 (0.0%) | 0 (0.0%) |
| $800 to $1,499 | 63 (61.8%) | 21 (39.6%) |
| $800 to $1,499 | 39 (38.2%) | 10 (18.9%) |
| Total | 102 (100.0%) | 53 (100.0%) |
Health & Disability in Myrtle Springs
Health Insurance Coverage by Age in Myrtle Springs
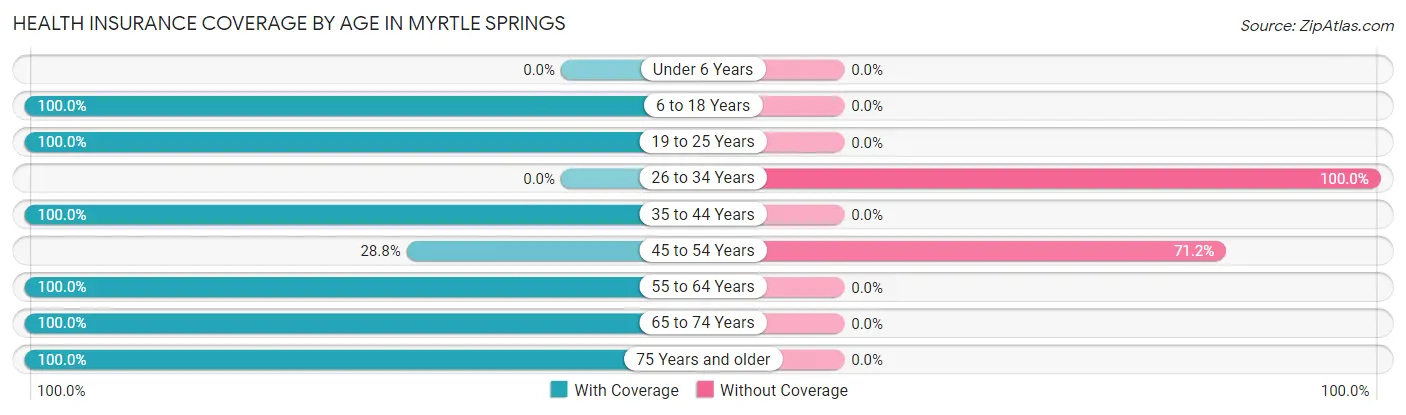
| Age Bracket | With Coverage | Without Coverage |
| Under 6 Years | 0 (0.0%) | 0 (0.0%) |
| 6 to 18 Years | 42 (100.0%) | 0 (0.0%) |
| 19 to 25 Years | 62 (100.0%) | 0 (0.0%) |
| 26 to 34 Years | 0 (0.0%) | 193 (100.0%) |
| 35 to 44 Years | 48 (100.0%) | 0 (0.0%) |
| 45 to 54 Years | 19 (28.8%) | 47 (71.2%) |
| 55 to 64 Years | 31 (100.0%) | 0 (0.0%) |
| 65 to 74 Years | 58 (100.0%) | 0 (0.0%) |
| 75 Years and older | 128 (100.0%) | 0 (0.0%) |
| Total | 388 (61.8%) | 240 (38.2%) |
Health Insurance Coverage by Citizenship Status in Myrtle Springs
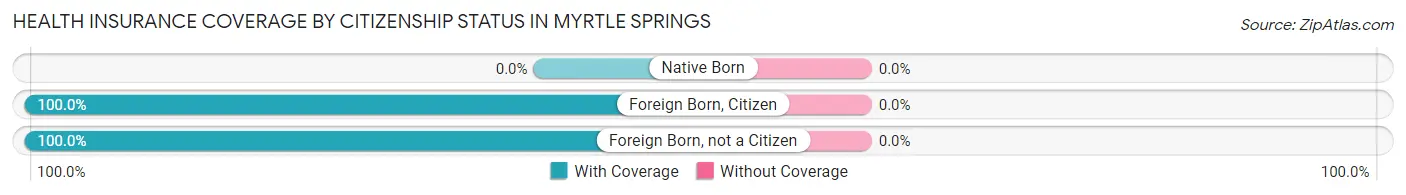
| Citizenship Status | With Coverage | Without Coverage |
| Native Born | 0 (0.0%) | 0 (0.0%) |
| Foreign Born, Citizen | 42 (100.0%) | 0 (0.0%) |
| Foreign Born, not a Citizen | 62 (100.0%) | 0 (0.0%) |
Health Insurance Coverage by Household Income in Myrtle Springs
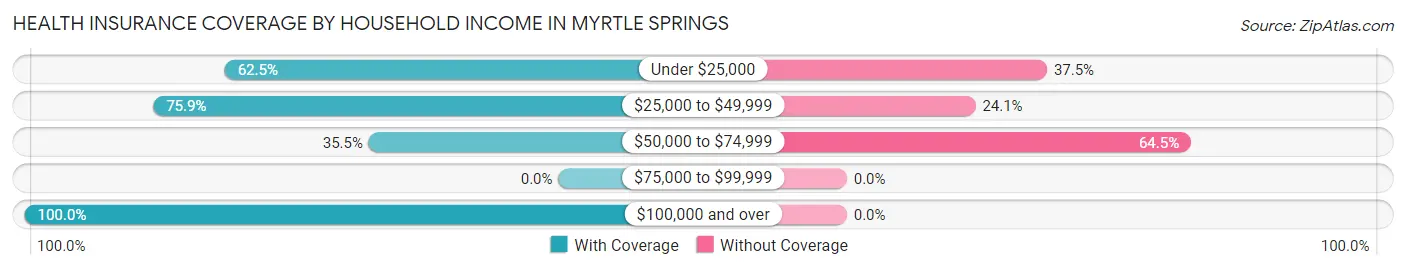
| Household Income | With Coverage | Without Coverage |
| Under $25,000 | 125 (62.5%) | 75 (37.5%) |
| $25,000 to $49,999 | 148 (75.9%) | 47 (24.1%) |
| $50,000 to $74,999 | 65 (35.5%) | 118 (64.5%) |
| $75,000 to $99,999 | 0 (0.0%) | 0 (0.0%) |
| $100,000 and over | 50 (100.0%) | 0 (0.0%) |
Public vs Private Health Insurance Coverage by Age in Myrtle Springs
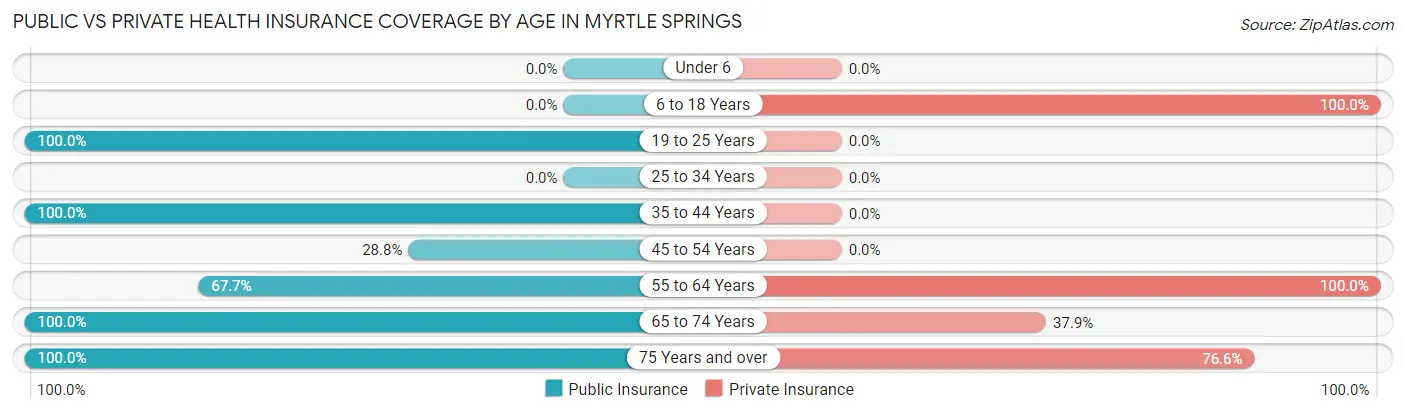
| Age Bracket | Public Insurance | Private Insurance |
| Under 6 | 0 (0.0%) | 0 (0.0%) |
| 6 to 18 Years | 0 (0.0%) | 42 (100.0%) |
| 19 to 25 Years | 62 (100.0%) | 0 (0.0%) |
| 25 to 34 Years | 0 (0.0%) | 0 (0.0%) |
| 35 to 44 Years | 48 (100.0%) | 0 (0.0%) |
| 45 to 54 Years | 19 (28.8%) | 0 (0.0%) |
| 55 to 64 Years | 21 (67.7%) | 31 (100.0%) |
| 65 to 74 Years | 58 (100.0%) | 22 (37.9%) |
| 75 Years and over | 128 (100.0%) | 98 (76.6%) |
| Total | 336 (53.5%) | 193 (30.7%) |
Disability Status by Sex by Age in Myrtle Springs
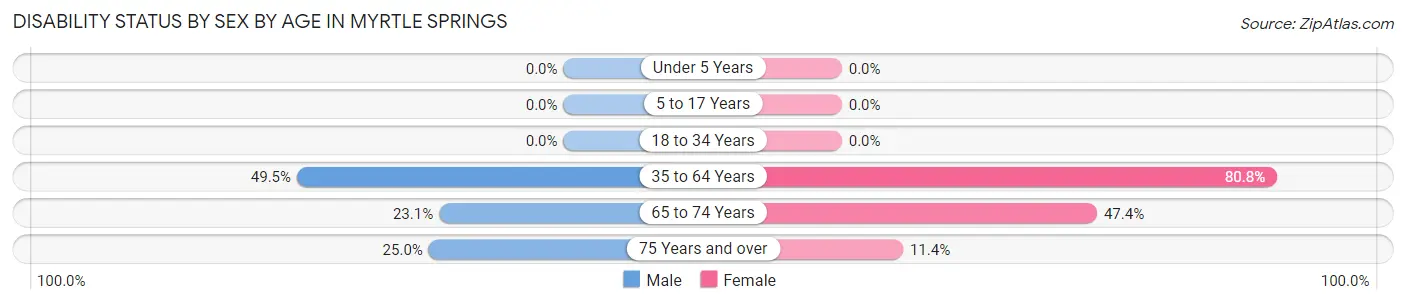
| Age Bracket | Male | Female |
| Under 5 Years | 0 (0.0%) | 0 (0.0%) |
| 5 to 17 Years | 0 (0.0%) | 0 (0.0%) |
| 18 to 34 Years | 0 (0.0%) | 0 (0.0%) |
| 35 to 64 Years | 46 (49.5%) | 42 (80.8%) |
| 65 to 74 Years | 9 (23.1%) | 9 (47.4%) |
| 75 Years and over | 10 (25.0%) | 10 (11.4%) |
Disability Class by Sex by Age in Myrtle Springs
Disability Class: Hearing Difficulty
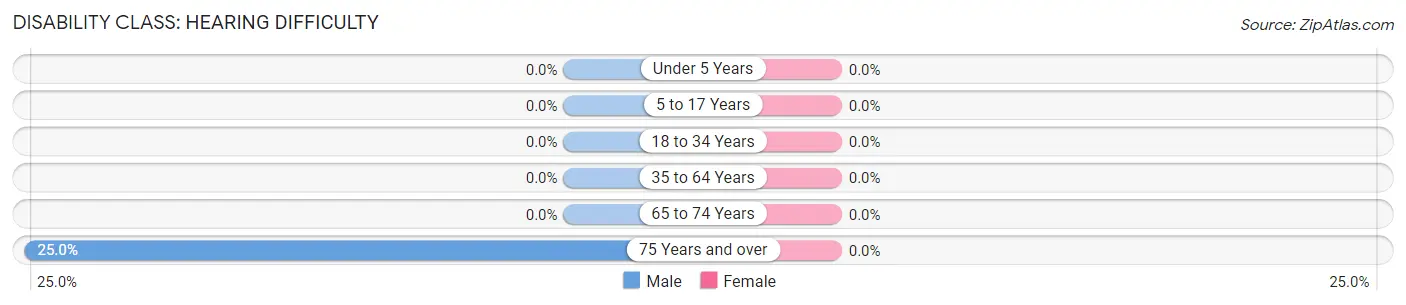
| Age Bracket | Male | Female |
| Under 5 Years | 0 (0.0%) | 0 (0.0%) |
| 5 to 17 Years | 0 (0.0%) | 0 (0.0%) |
| 18 to 34 Years | 0 (0.0%) | 0 (0.0%) |
| 35 to 64 Years | 0 (0.0%) | 0 (0.0%) |
| 65 to 74 Years | 0 (0.0%) | 0 (0.0%) |
| 75 Years and over | 10 (25.0%) | 0 (0.0%) |
Disability Class: Vision Difficulty
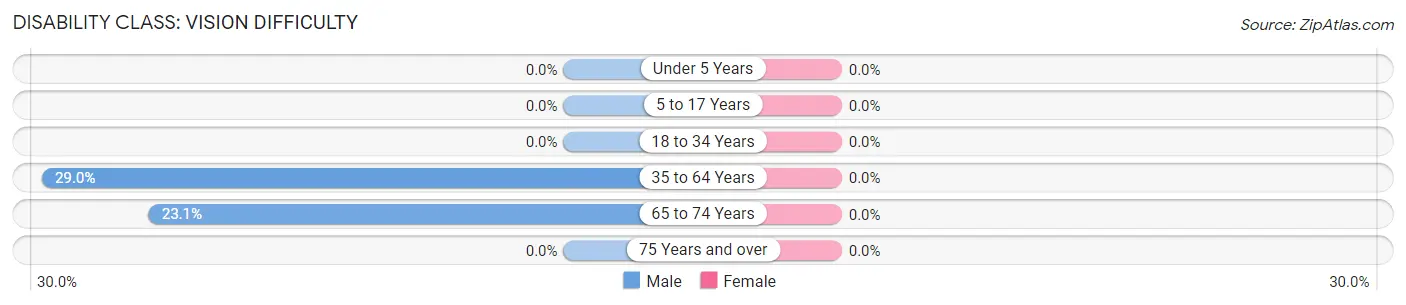
| Age Bracket | Male | Female |
| Under 5 Years | 0 (0.0%) | 0 (0.0%) |
| 5 to 17 Years | 0 (0.0%) | 0 (0.0%) |
| 18 to 34 Years | 0 (0.0%) | 0 (0.0%) |
| 35 to 64 Years | 27 (29.0%) | 0 (0.0%) |
| 65 to 74 Years | 9 (23.1%) | 0 (0.0%) |
| 75 Years and over | 0 (0.0%) | 0 (0.0%) |
Disability Class: Cognitive Difficulty
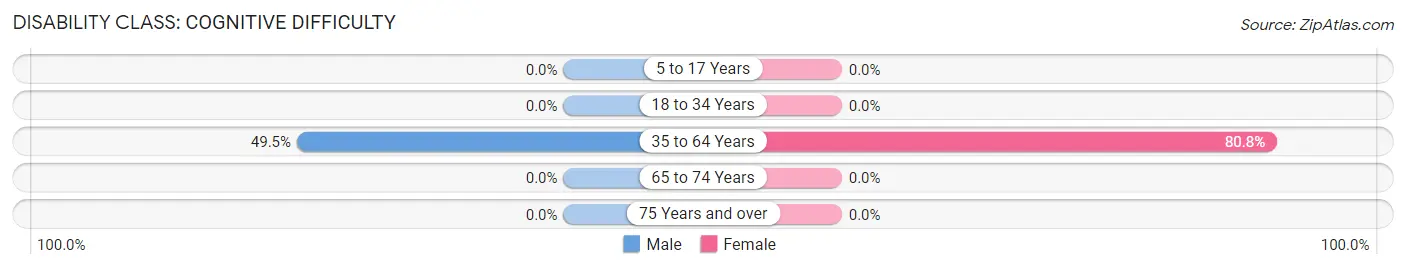
| Age Bracket | Male | Female |
| 5 to 17 Years | 0 (0.0%) | 0 (0.0%) |
| 18 to 34 Years | 0 (0.0%) | 0 (0.0%) |
| 35 to 64 Years | 46 (49.5%) | 42 (80.8%) |
| 65 to 74 Years | 0 (0.0%) | 0 (0.0%) |
| 75 Years and over | 0 (0.0%) | 0 (0.0%) |
Disability Class: Ambulatory Difficulty
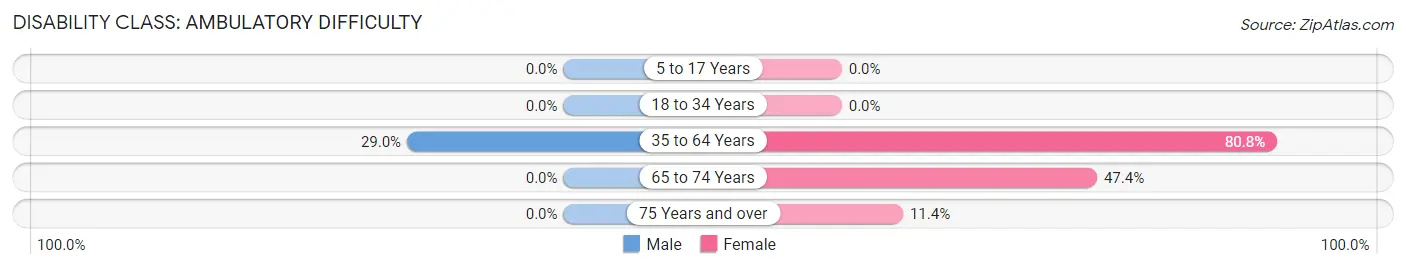
| Age Bracket | Male | Female |
| 5 to 17 Years | 0 (0.0%) | 0 (0.0%) |
| 18 to 34 Years | 0 (0.0%) | 0 (0.0%) |
| 35 to 64 Years | 27 (29.0%) | 42 (80.8%) |
| 65 to 74 Years | 0 (0.0%) | 9 (47.4%) |
| 75 Years and over | 0 (0.0%) | 10 (11.4%) |
Disability Class: Self-Care Difficulty
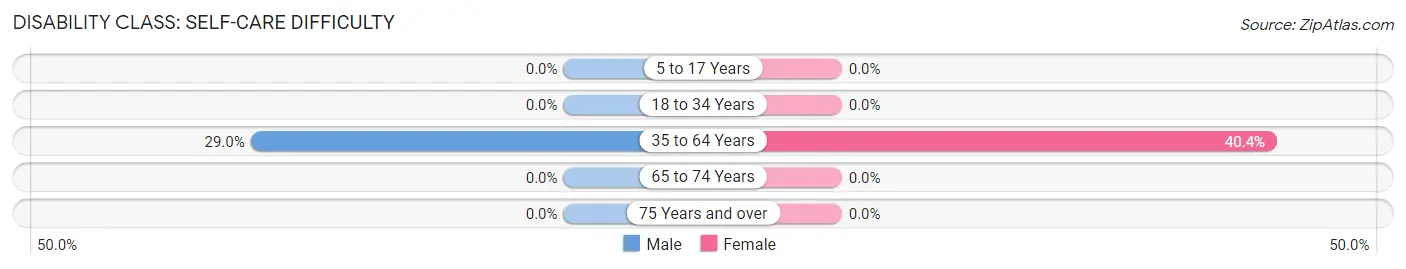
| Age Bracket | Male | Female |
| 5 to 17 Years | 0 (0.0%) | 0 (0.0%) |
| 18 to 34 Years | 0 (0.0%) | 0 (0.0%) |
| 35 to 64 Years | 27 (29.0%) | 21 (40.4%) |
| 65 to 74 Years | 0 (0.0%) | 0 (0.0%) |
| 75 Years and over | 0 (0.0%) | 0 (0.0%) |
Technology Access in Myrtle Springs
Computing Device Access in Myrtle Springs
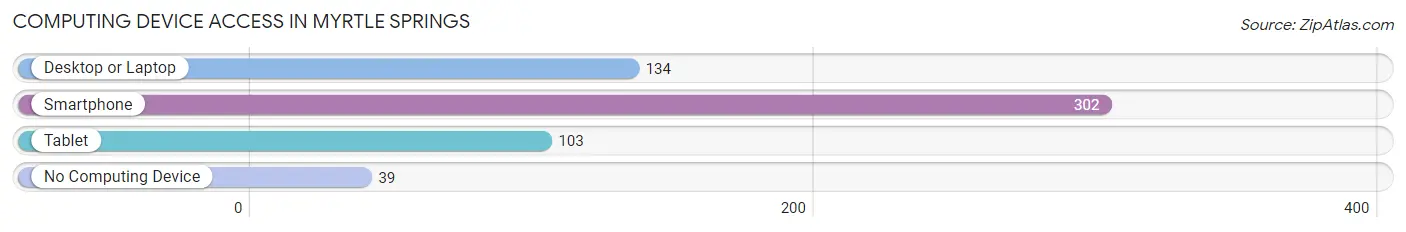
| Device Type | # Households | % Households |
| Desktop or Laptop | 134 | 37.6% |
| Smartphone | 302 | 84.8% |
| Tablet | 103 | 28.9% |
| No Computing Device | 39 | 11.0% |
| Total | 356 | 100.0% |
Internet Access in Myrtle Springs
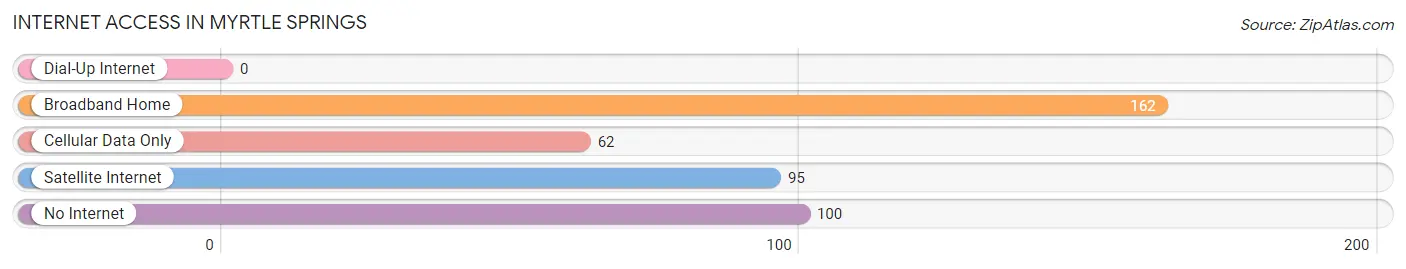
| Internet Type | # Households | % Households |
| Dial-Up Internet | 0 | 0.0% |
| Broadband Home | 162 | 45.5% |
| Cellular Data Only | 62 | 17.4% |
| Satellite Internet | 95 | 26.7% |
| No Internet | 100 | 28.1% |
| Total | 356 | 100.0% |
Myrtle Springs Summary
Myrtle Springs is a small town located in the state of Texas, in the United States. It is situated in the northeast corner of the state, in the county of Van Zandt. The town is located on the banks of the Sabine River, and is part of the Tyler metropolitan area. The population of Myrtle Springs was estimated to be 1,093 in 2019.
History
Myrtle Springs was founded in 1845 by a group of settlers from the nearby town of Canton. The town was named after the myrtle trees that grew in abundance in the area. The settlers built a log cabin and a small store, and the town quickly grew. By the late 1800s, Myrtle Springs had become a thriving community, with a post office, a school, a church, and several businesses.
In the early 1900s, the town was a popular destination for tourists, who came to enjoy the natural beauty of the area. The town was also known for its mineral springs, which were believed to have healing properties.
In the 1950s, the town began to decline as the population moved away to larger cities. However, in recent years, the town has seen a resurgence in popularity, as people have moved back to the area to enjoy the small-town atmosphere and the natural beauty of the area.
Geography
Myrtle Springs is located in the northeast corner of Texas, in the county of Van Zandt. The town is situated on the banks of the Sabine River, and is part of the Tyler metropolitan area. The town is surrounded by rolling hills and lush forests, and is home to several lakes and rivers.
The climate in Myrtle Springs is humid subtropical, with hot summers and mild winters. The average temperature in the summer is around 90°F, and the average temperature in the winter is around 50°F.
Economy
Myrtle Springs is a small town, and the economy is largely based on tourism and agriculture. The town is home to several small businesses, including restaurants, shops, and a few small manufacturing companies.
The town is also home to several farms, which produce a variety of crops, including cotton, corn, and soybeans. The town is also home to several wineries, which produce a variety of wines.
Demographics
As of 2019, the population of Myrtle Springs was estimated to be 1,093. The population is largely white (90.2%), with small percentages of African American (4.2%), Hispanic (2.7%), and Asian (1.2%) residents. The median household income in the town is $41,944, and the median age is 44.
Conclusion
Myrtle Springs is a small town located in the northeast corner of Texas. The town was founded in 1845, and has a long history of being a popular tourist destination. The town is home to several small businesses, farms, and wineries, and the economy is largely based on tourism and agriculture. The population of Myrtle Springs is largely white, with small percentages of African American, Hispanic, and Asian residents. The median household income in the town is $41,944, and the median age is 44.
Common Questions
What is Per Capita Income in Myrtle Springs?
Per Capita income in Myrtle Springs is $23,477.
What is the Median Family Income in Myrtle Springs?
Median Family Income in Myrtle Springs is $48,690.
What is the Median Household income in Myrtle Springs?
Median Household Income in Myrtle Springs is $41,170.
What is Inequality or Gini Index in Myrtle Springs?
Inequality or Gini Index in Myrtle Springs is 0.36.
What is the Total Population of Myrtle Springs?
Total Population of Myrtle Springs is 628.
What is the Total Male Population of Myrtle Springs?
Total Male Population of Myrtle Springs is 350.
What is the Total Female Population of Myrtle Springs?
Total Female Population of Myrtle Springs is 278.
What is the Ratio of Males per 100 Females in Myrtle Springs?
There are 125.90 Males per 100 Females in Myrtle Springs.
What is the Ratio of Females per 100 Males in Myrtle Springs?
There are 79.43 Females per 100 Males in Myrtle Springs.
What is the Median Population Age in Myrtle Springs?
Median Population Age in Myrtle Springs is 36.8 Years.
What is the Average Family Size in Myrtle Springs
Average Family Size in Myrtle Springs is 2.3 People.
What is the Average Household Size in Myrtle Springs
Average Household Size in Myrtle Springs is 1.8 People.
How Large is the Labor Force in Myrtle Springs?
There are 286 People in the Labor Forcein in Myrtle Springs.
What is the Percentage of People in the Labor Force in Myrtle Springs?
48.8% of People are in the Labor Force in Myrtle Springs.