Quail Creek, TX Map & Demographics
Quail Creek Map
Quail Creek Overview
$39,292
PER CAPITA INCOME
$76,776
AVG FAMILY INCOME
$75,556
AVG HOUSEHOLD INCOME
29.7%
WAGE / INCOME GAP [ % ]
70.3¢/ $1
WAGE / INCOME GAP [ $ ]
0.45
INEQUALITY / GINI INDEX
1,301
TOTAL POPULATION
616
MALE POPULATION
685
FEMALE POPULATION
89.93
MALES / 100 FEMALES
111.20
FEMALES / 100 MALES
43.4
MEDIAN AGE
2.5
AVG FAMILY SIZE
2.4
AVG HOUSEHOLD SIZE
656
LABOR FORCE [ PEOPLE ]
59.7%
PERCENT IN LABOR FORCE
12.8%
UNEMPLOYMENT RATE
Income in Quail Creek
Income Overview in Quail Creek
Per Capita Income in Quail Creek is $39,292, while median incomes of families and households are $76,776 and $75,556 respectively.
| Characteristic | Number | Measure |
| Per Capita Income | 1,301 | $39,292 |
| Median Family Income | 461 | $76,776 |
| Mean Family Income | 461 | $110,992 |
| Median Household Income | 544 | $75,556 |
| Mean Household Income | 544 | $99,928 |
| Income Deficit | 461 | $0 |
| Wage / Income Gap (%) | 1,301 | 29.73% |
| Wage / Income Gap ($) | 1,301 | 70.27¢ per $1 |
| Gini / Inequality Index | 1,301 | 0.45 |
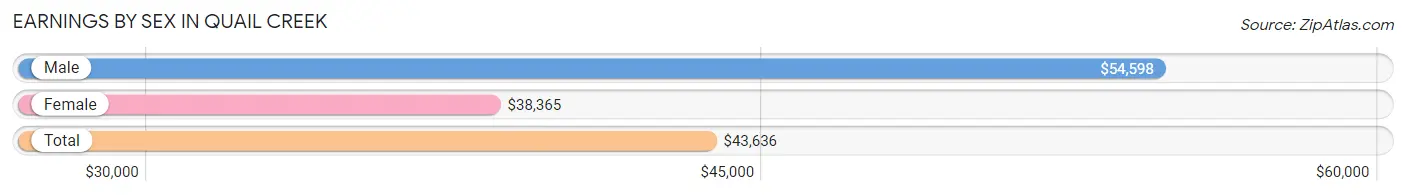
Earnings by Sex in Quail Creek
Average Earnings in Quail Creek are $43,636, $54,598 for men and $38,365 for women, a difference of 29.7%.
| Sex | Number | Average Earnings |
| Male | 343 (51.7%) | $54,598 |
| Female | 321 (48.3%) | $38,365 |
| Total | 664 (100.0%) | $43,636 |
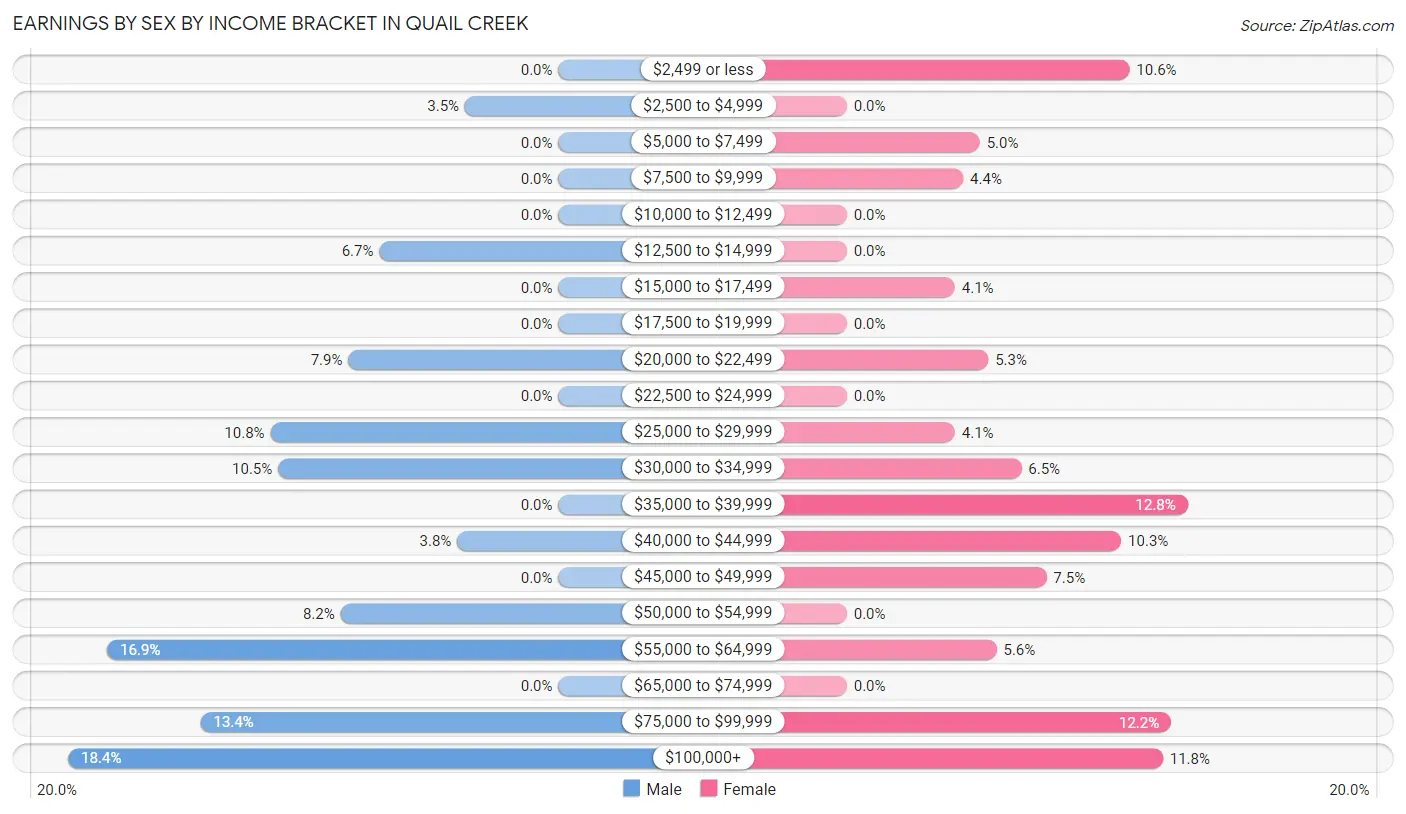
Earnings by Sex by Income Bracket in Quail Creek
The most common earnings brackets in Quail Creek are $100,000+ for men (63 | 18.4%) and $35,000 to $39,999 for women (41 | 12.8%).
| Income | Male | Female |
| $2,499 or less | 0 (0.0%) | 34 (10.6%) |
| $2,500 to $4,999 | 12 (3.5%) | 0 (0.0%) |
| $5,000 to $7,499 | 0 (0.0%) | 16 (5.0%) |
| $7,500 to $9,999 | 0 (0.0%) | 14 (4.4%) |
| $10,000 to $12,499 | 0 (0.0%) | 0 (0.0%) |
| $12,500 to $14,999 | 23 (6.7%) | 0 (0.0%) |
| $15,000 to $17,499 | 0 (0.0%) | 13 (4.1%) |
| $17,500 to $19,999 | 0 (0.0%) | 0 (0.0%) |
| $20,000 to $22,499 | 27 (7.9%) | 17 (5.3%) |
| $22,500 to $24,999 | 0 (0.0%) | 0 (0.0%) |
| $25,000 to $29,999 | 37 (10.8%) | 13 (4.1%) |
| $30,000 to $34,999 | 36 (10.5%) | 21 (6.5%) |
| $35,000 to $39,999 | 0 (0.0%) | 41 (12.8%) |
| $40,000 to $44,999 | 13 (3.8%) | 33 (10.3%) |
| $45,000 to $49,999 | 0 (0.0%) | 24 (7.5%) |
| $50,000 to $54,999 | 28 (8.2%) | 0 (0.0%) |
| $55,000 to $64,999 | 58 (16.9%) | 18 (5.6%) |
| $65,000 to $74,999 | 0 (0.0%) | 0 (0.0%) |
| $75,000 to $99,999 | 46 (13.4%) | 39 (12.1%) |
| $100,000+ | 63 (18.4%) | 38 (11.8%) |
| Total | 343 (100.0%) | 321 (100.0%) |
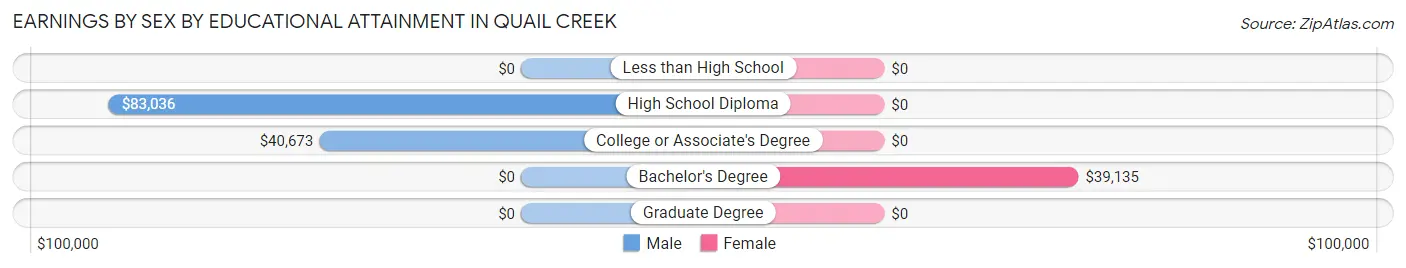
Earnings by Sex by Educational Attainment in Quail Creek
Average earnings in Quail Creek are $55,972 for men and $42,803 for women, a difference of 23.5%. Men with an educational attainment of high school diploma enjoy the highest average annual earnings of $83,036, while those with college or associate's degree education earn the least with $40,673. Women with an educational attainment of bachelor's degree earn the most with the average annual earnings of $39,135, while those with bachelor's degree education have the smallest earnings of $39,135.
| Educational Attainment | Male Income | Female Income |
| Less than High School | - | - |
| High School Diploma | $83,036 | $0 |
| College or Associate's Degree | $40,673 | $0 |
| Bachelor's Degree | - | - |
| Graduate Degree | - | - |
| Total | $55,972 | $42,803 |
Family Income in Quail Creek
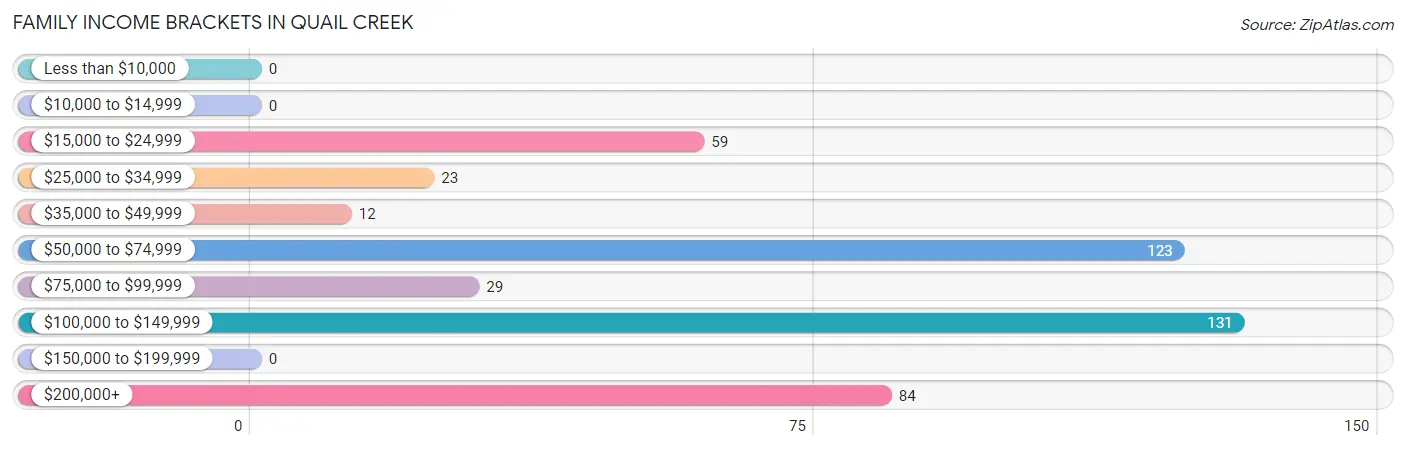
Family Income Brackets in Quail Creek
According to the Quail Creek family income data, there are 131 families falling into the $100,000 to $149,999 income range, which is the most common income bracket and makes up 28.4% of all families.
| Income Bracket | # Families | % Families |
| Less than $10,000 | 0 | 0.0% |
| $10,000 to $14,999 | 0 | 0.0% |
| $15,000 to $24,999 | 59 | 12.8% |
| $25,000 to $34,999 | 23 | 5.0% |
| $35,000 to $49,999 | 12 | 2.6% |
| $50,000 to $74,999 | 123 | 26.7% |
| $75,000 to $99,999 | 29 | 6.3% |
| $100,000 to $149,999 | 131 | 28.4% |
| $150,000 to $199,999 | 0 | 0.0% |
| $200,000+ | 84 | 18.2% |
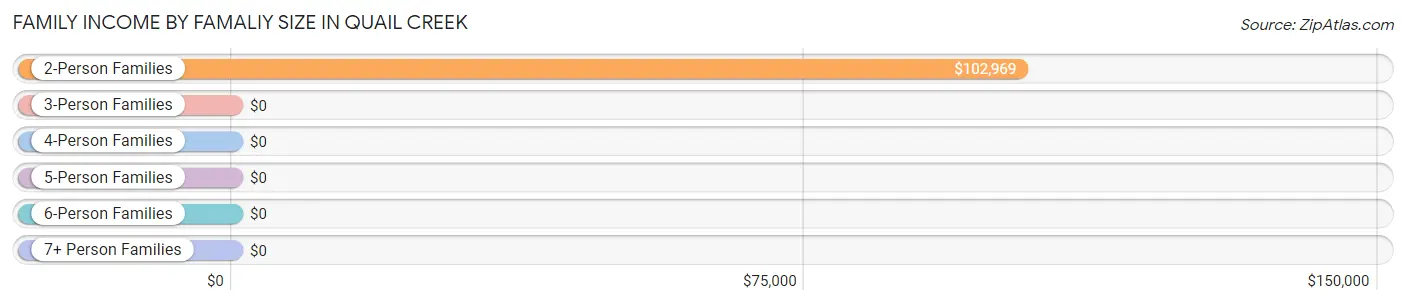
Family Income by Famaliy Size in Quail Creek
2-person families (283 | 61.4%) account for the highest median family income in Quail Creek with $102,969 per family, while 2-person families (283 | 61.4%) have the highest median income of $51,484 per family member.
| Income Bracket | # Families | Median Income |
| 2-Person Families | 283 (61.4%) | $102,969 |
| 3-Person Families | 94 (20.4%) | $0 |
| 4-Person Families | 42 (9.1%) | $0 |
| 5-Person Families | 28 (6.1%) | $0 |
| 6-Person Families | 14 (3.0%) | $0 |
| 7+ Person Families | 0 (0.0%) | $0 |
| Total | 461 (100.0%) | $76,776 |
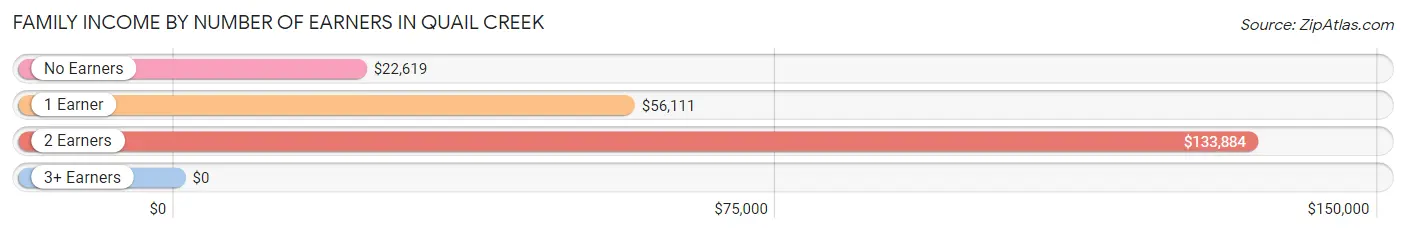
Family Income by Number of Earners in Quail Creek
| Number of Earners | # Families | Median Income |
| No Earners | 78 (16.9%) | $22,619 |
| 1 Earner | 164 (35.6%) | $56,111 |
| 2 Earners | 193 (41.9%) | $133,884 |
| 3+ Earners | 26 (5.6%) | $0 |
| Total | 461 (100.0%) | $76,776 |
Household Income in Quail Creek
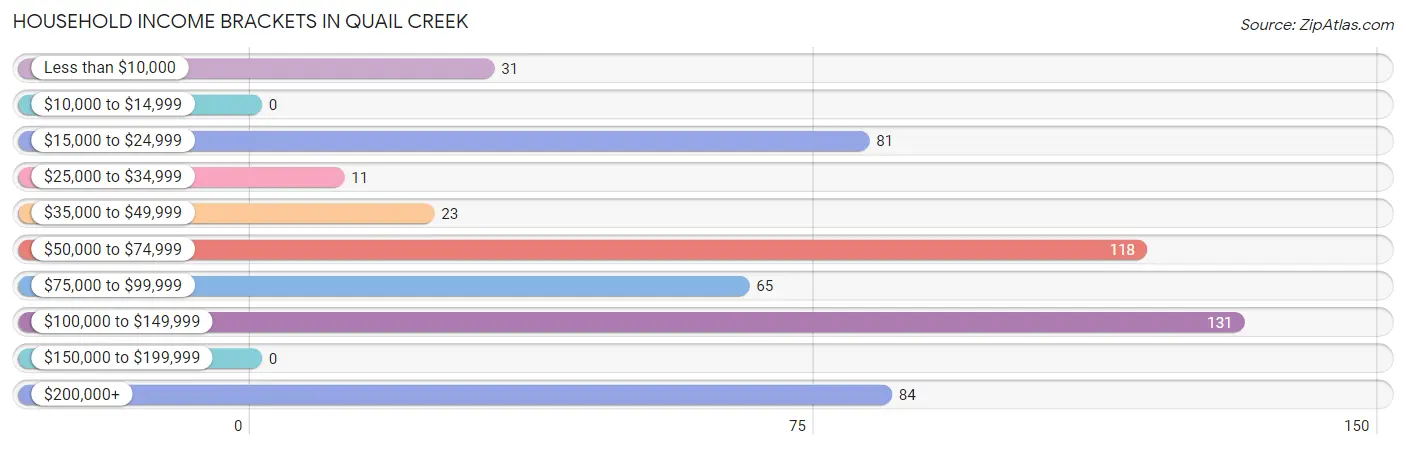
Household Income Brackets in Quail Creek
With 131 households falling in the category, the $100,000 to $149,999 income range is the most frequent in Quail Creek, accounting for 24.1% of all households.
| Income Bracket | # Households | % Households |
| Less than $10,000 | 31 | 5.7% |
| $10,000 to $14,999 | 0 | 0.0% |
| $15,000 to $24,999 | 81 | 14.9% |
| $25,000 to $34,999 | 11 | 2.0% |
| $35,000 to $49,999 | 23 | 4.2% |
| $50,000 to $74,999 | 118 | 21.7% |
| $75,000 to $99,999 | 65 | 11.9% |
| $100,000 to $149,999 | 131 | 24.1% |
| $150,000 to $199,999 | 0 | 0.0% |
| $200,000+ | 84 | 15.4% |
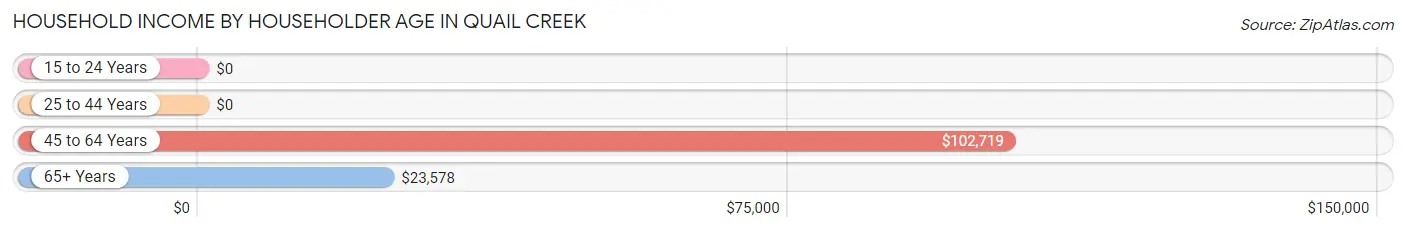
Household Income by Householder Age in Quail Creek
The median household income in Quail Creek is $75,556, with the highest median household income of $102,719 found in the 45 to 64 years age bracket for the primary householder. A total of 199 households (36.6%) fall into this category.
| Income Bracket | # Households | Median Income |
| 15 to 24 Years | 0 (0.0%) | $0 |
| 25 to 44 Years | 202 (37.1%) | $0 |
| 45 to 64 Years | 199 (36.6%) | $102,719 |
| 65+ Years | 143 (26.3%) | $23,578 |
| Total | 544 (100.0%) | $75,556 |
Poverty in Quail Creek
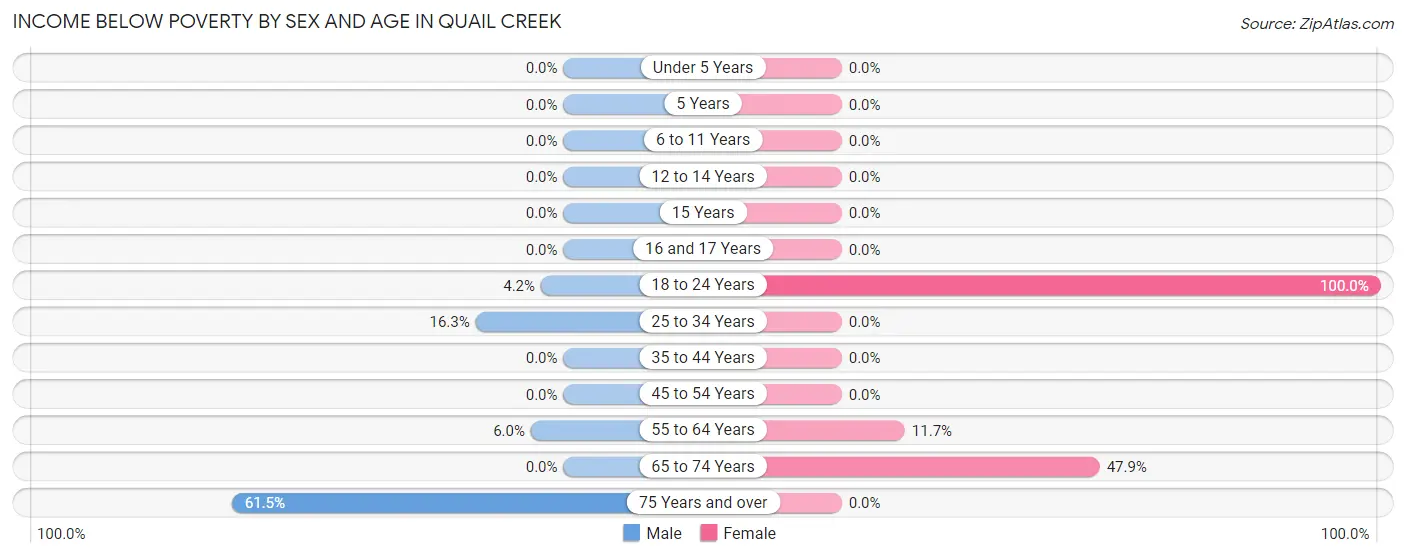
Income Below Poverty by Sex and Age in Quail Creek
With 9.2% poverty level for males and 12.1% for females among the residents of Quail Creek, 75 year old and over males and 18 to 24 year old females are the most vulnerable to poverty, with 32 males (61.5%) and 25 females (100.0%) in their respective age groups living below the poverty level.
| Age Bracket | Male | Female |
| Under 5 Years | 0 (0.0%) | 0 (0.0%) |
| 5 Years | 0 (0.0%) | 0 (0.0%) |
| 6 to 11 Years | 0 (0.0%) | 0 (0.0%) |
| 12 to 14 Years | 0 (0.0%) | 0 (0.0%) |
| 15 Years | 0 (0.0%) | 0 (0.0%) |
| 16 and 17 Years | 0 (0.0%) | 0 (0.0%) |
| 18 to 24 Years | 1 (4.2%) | 25 (100.0%) |
| 25 to 34 Years | 15 (16.3%) | 0 (0.0%) |
| 35 to 44 Years | 0 (0.0%) | 0 (0.0%) |
| 45 to 54 Years | 0 (0.0%) | 0 (0.0%) |
| 55 to 64 Years | 9 (6.0%) | 13 (11.7%) |
| 65 to 74 Years | 0 (0.0%) | 45 (47.9%) |
| 75 Years and over | 32 (61.5%) | 0 (0.0%) |
| Total | 57 (9.2%) | 83 (12.1%) |
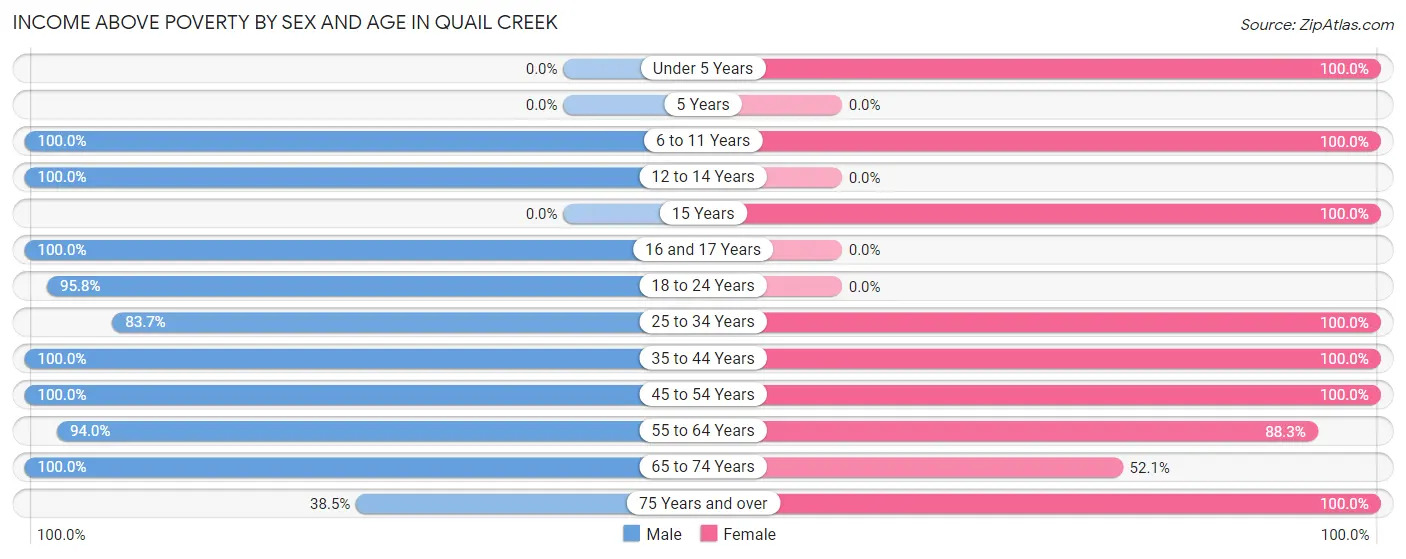
Income Above Poverty by Sex and Age in Quail Creek
According to the poverty statistics in Quail Creek, males aged 6 to 11 years and females aged under 5 years are the age groups that are most secure financially, with 100.0% of males and 100.0% of females in these age groups living above the poverty line.
| Age Bracket | Male | Female |
| Under 5 Years | 0 (0.0%) | 36 (100.0%) |
| 5 Years | 0 (0.0%) | 0 (0.0%) |
| 6 to 11 Years | 39 (100.0%) | 95 (100.0%) |
| 12 to 14 Years | 11 (100.0%) | 0 (0.0%) |
| 15 Years | 0 (0.0%) | 22 (100.0%) |
| 16 and 17 Years | 7 (100.0%) | 0 (0.0%) |
| 18 to 24 Years | 23 (95.8%) | 0 (0.0%) |
| 25 to 34 Years | 77 (83.7%) | 136 (100.0%) |
| 35 to 44 Years | 112 (100.0%) | 86 (100.0%) |
| 45 to 54 Years | 77 (100.0%) | 58 (100.0%) |
| 55 to 64 Years | 140 (94.0%) | 98 (88.3%) |
| 65 to 74 Years | 53 (100.0%) | 49 (52.1%) |
| 75 Years and over | 20 (38.5%) | 22 (100.0%) |
| Total | 559 (90.7%) | 602 (87.9%) |
Income Below Poverty Among Married-Couple Families in Quail Creek
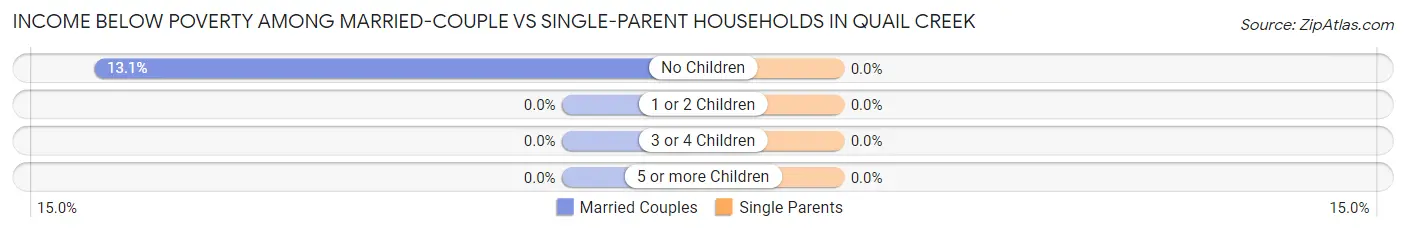
The poverty statistics for married-couple families in Quail Creek show that 10.0% or 38 of the total 382 families live below the poverty line. Families with no children have the highest poverty rate of 13.1%, comprising of 38 families. On the other hand, families with 1 or 2 children have the lowest poverty rate of 0.0%, which includes 0 families.

| Children | Above Poverty | Below Poverty |
| No Children | 253 (86.9%) | 38 (13.1%) |
| 1 or 2 Children | 49 (100.0%) | 0 (0.0%) |
| 3 or 4 Children | 42 (100.0%) | 0 (0.0%) |
| 5 or more Children | 0 (0.0%) | 0 (0.0%) |
| Total | 344 (90.0%) | 38 (10.0%) |
Income Below Poverty Among Single-Parent Households in Quail Creek
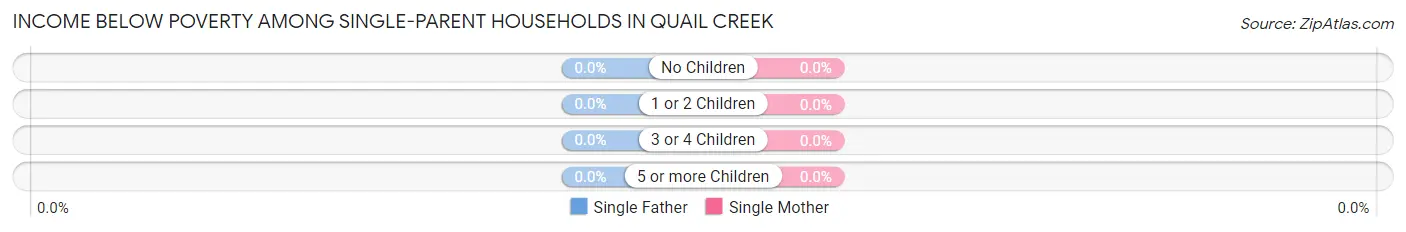
| Children | Single Father | Single Mother |
| No Children | 0 (0.0%) | 0 (0.0%) |
| 1 or 2 Children | 0 (0.0%) | 0 (0.0%) |
| 3 or 4 Children | 0 (0.0%) | 0 (0.0%) |
| 5 or more Children | 0 (0.0%) | 0 (0.0%) |
| Total | 0 (0.0%) | 0 (0.0%) |
Income Below Poverty Among Married-Couple vs Single-Parent Households in Quail Creek
| Children | Married-Couple Families | Single-Parent Households |
| No Children | 38 (13.1%) | 0 (0.0%) |
| 1 or 2 Children | 0 (0.0%) | 0 (0.0%) |
| 3 or 4 Children | 0 (0.0%) | 0 (0.0%) |
| 5 or more Children | 0 (0.0%) | 0 (0.0%) |
| Total | 38 (10.0%) | 0 (0.0%) |
Race in Quail Creek
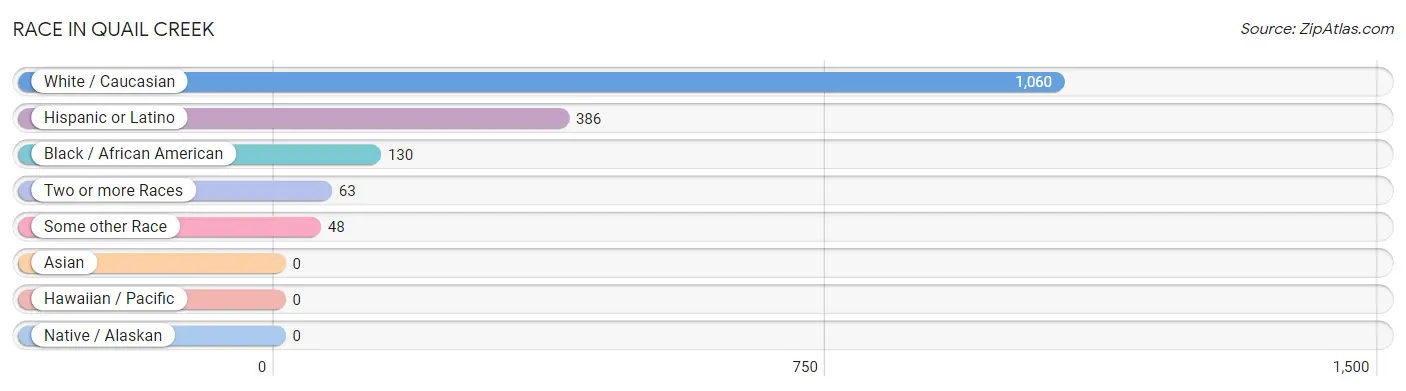
The most populous races in Quail Creek are White / Caucasian (1,060 | 81.5%), Hispanic or Latino (386 | 29.7%), and Black / African American (130 | 10.0%).
| Race | # Population | % Population |
| Asian | 0 | 0.0% |
| Black / African American | 130 | 10.0% |
| Hawaiian / Pacific | 0 | 0.0% |
| Hispanic or Latino | 386 | 29.7% |
| Native / Alaskan | 0 | 0.0% |
| White / Caucasian | 1,060 | 81.5% |
| Two or more Races | 63 | 4.8% |
| Some other Race | 48 | 3.7% |
| Total | 1,301 | 100.0% |
Ancestry in Quail Creek
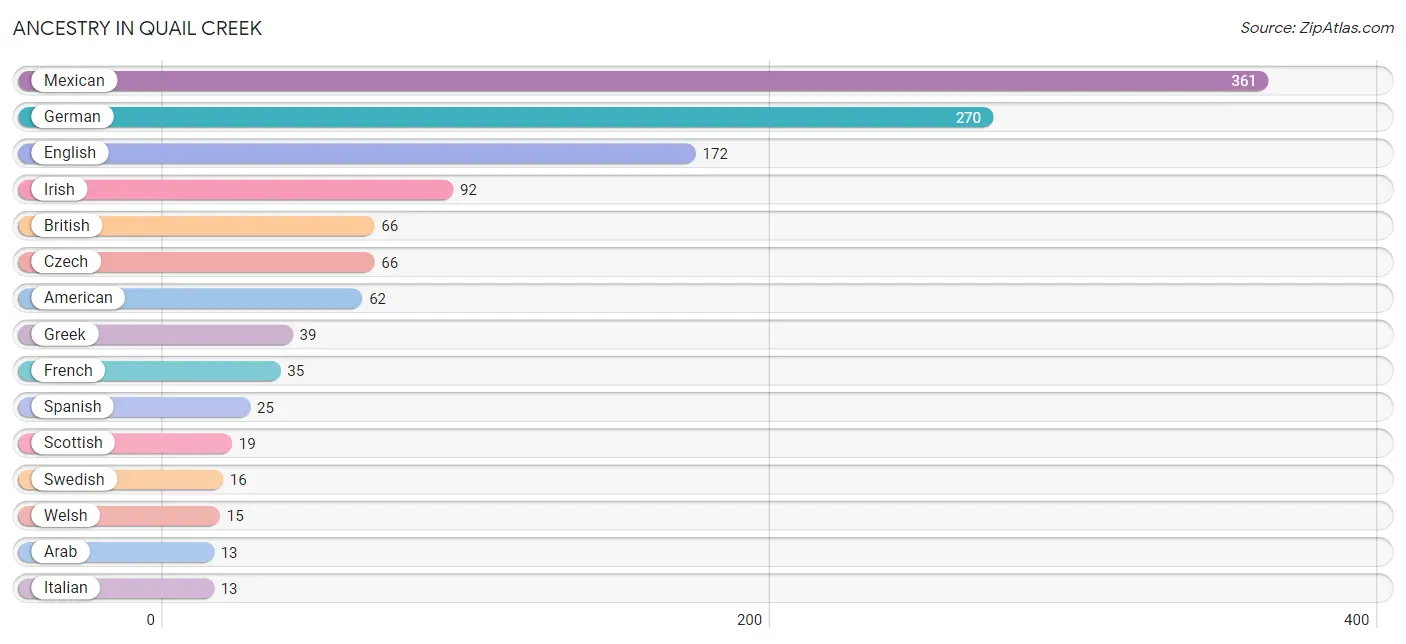
The most populous ancestries reported in Quail Creek are Mexican (361 | 27.8%), German (270 | 20.7%), English (172 | 13.2%), Irish (92 | 7.1%), and British (66 | 5.1%), together accounting for 73.9% of all Quail Creek residents.
| Ancestry | # Population | % Population |
| American | 62 | 4.8% |
| Arab | 13 | 1.0% |
| British | 66 | 5.1% |
| Choctaw | 9 | 0.7% |
| Czech | 66 | 5.1% |
| Eastern European | 12 | 0.9% |
| English | 172 | 13.2% |
| French | 35 | 2.7% |
| German | 270 | 20.7% |
| Greek | 39 | 3.0% |
| Irish | 92 | 7.1% |
| Italian | 13 | 1.0% |
| Mexican | 361 | 27.8% |
| Scotch-Irish | 8 | 0.6% |
| Scottish | 19 | 1.5% |
| Spanish | 25 | 1.9% |
| Swedish | 16 | 1.2% |
| Syrian | 13 | 1.0% |
| Welsh | 15 | 1.1% | View All 19 Rows |
Immigrants in Quail Creek
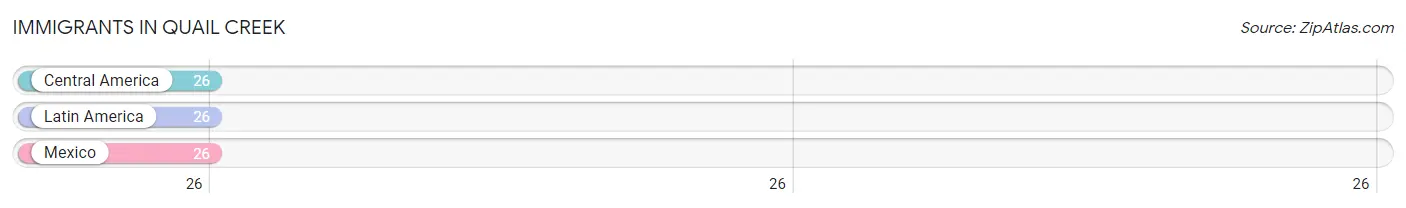
The most numerous immigrant groups reported in Quail Creek came from Central America (26 | 2.0%), Latin America (26 | 2.0%), and Mexico (26 | 2.0%), together accounting for 6.0% of all Quail Creek residents.
| Immigration Origin | # Population | % Population |
| Central America | 26 | 2.0% |
| Latin America | 26 | 2.0% |
| Mexico | 26 | 2.0% | View All 3 Rows |
Sex and Age in Quail Creek
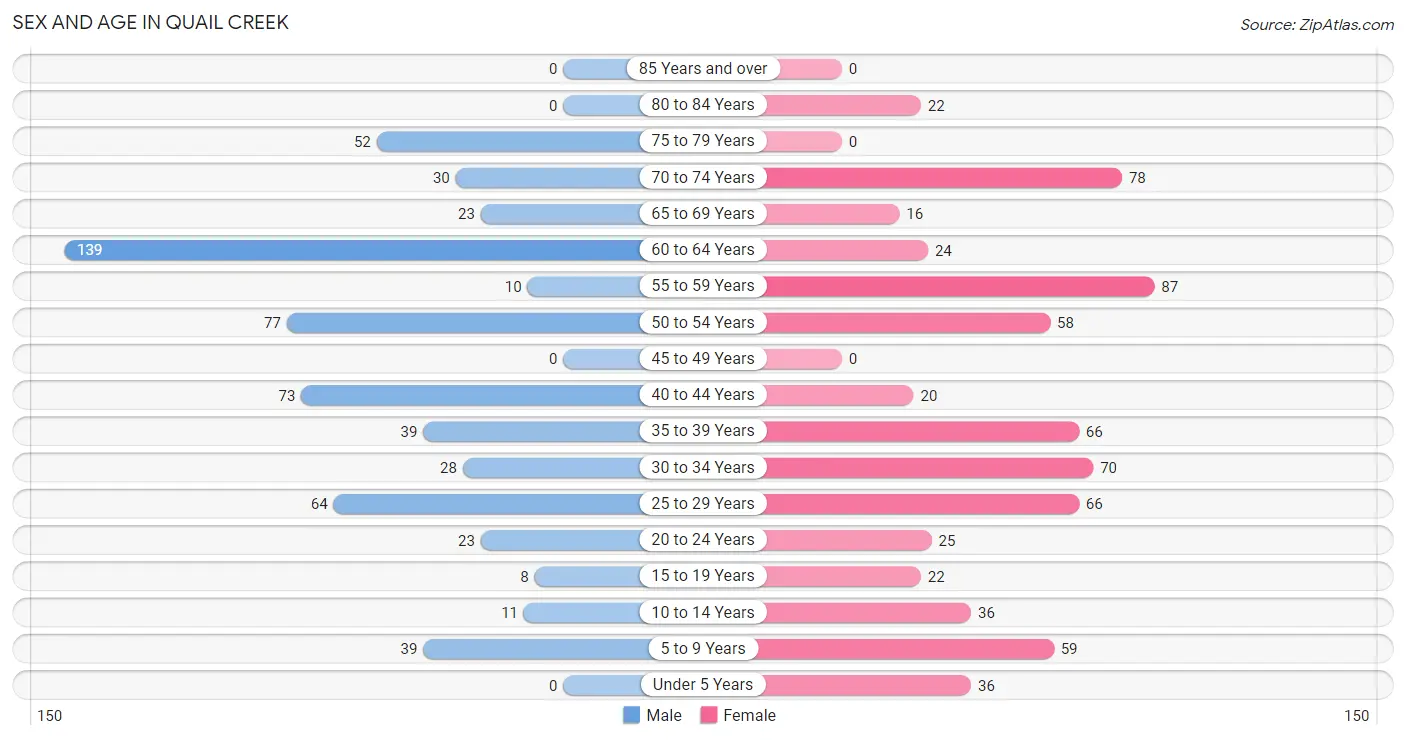
Sex and Age in Quail Creek
The most populous age groups in Quail Creek are 60 to 64 Years (139 | 22.6%) for men and 55 to 59 Years (87 | 12.7%) for women.
| Age Bracket | Male | Female |
| Under 5 Years | 0 (0.0%) | 36 (5.3%) |
| 5 to 9 Years | 39 (6.3%) | 59 (8.6%) |
| 10 to 14 Years | 11 (1.8%) | 36 (5.3%) |
| 15 to 19 Years | 8 (1.3%) | 22 (3.2%) |
| 20 to 24 Years | 23 (3.7%) | 25 (3.6%) |
| 25 to 29 Years | 64 (10.4%) | 66 (9.6%) |
| 30 to 34 Years | 28 (4.5%) | 70 (10.2%) |
| 35 to 39 Years | 39 (6.3%) | 66 (9.6%) |
| 40 to 44 Years | 73 (11.8%) | 20 (2.9%) |
| 45 to 49 Years | 0 (0.0%) | 0 (0.0%) |
| 50 to 54 Years | 77 (12.5%) | 58 (8.5%) |
| 55 to 59 Years | 10 (1.6%) | 87 (12.7%) |
| 60 to 64 Years | 139 (22.6%) | 24 (3.5%) |
| 65 to 69 Years | 23 (3.7%) | 16 (2.3%) |
| 70 to 74 Years | 30 (4.9%) | 78 (11.4%) |
| 75 to 79 Years | 52 (8.4%) | 0 (0.0%) |
| 80 to 84 Years | 0 (0.0%) | 22 (3.2%) |
| 85 Years and over | 0 (0.0%) | 0 (0.0%) |
| Total | 616 (100.0%) | 685 (100.0%) |
Families and Households in Quail Creek
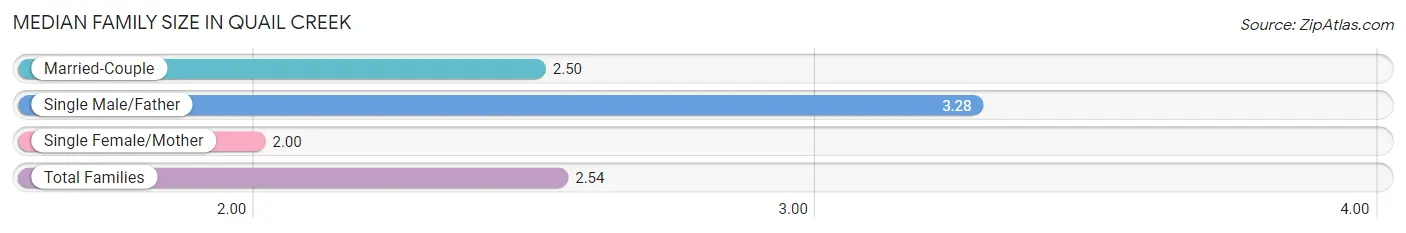
Median Family Size in Quail Creek
The median family size in Quail Creek is 2.54 persons per family, with single male/father families (46 | 10.0%) accounting for the largest median family size of 3.28 persons per family. On the other hand, single female/mother families (33 | 7.2%) represent the smallest median family size with 2.00 persons per family.
| Family Type | # Families | Family Size |
| Married-Couple | 382 (82.9%) | 2.50 |
| Single Male/Father | 46 (10.0%) | 3.28 |
| Single Female/Mother | 33 (7.2%) | 2.00 |
| Total Families | 461 (100.0%) | 2.54 |
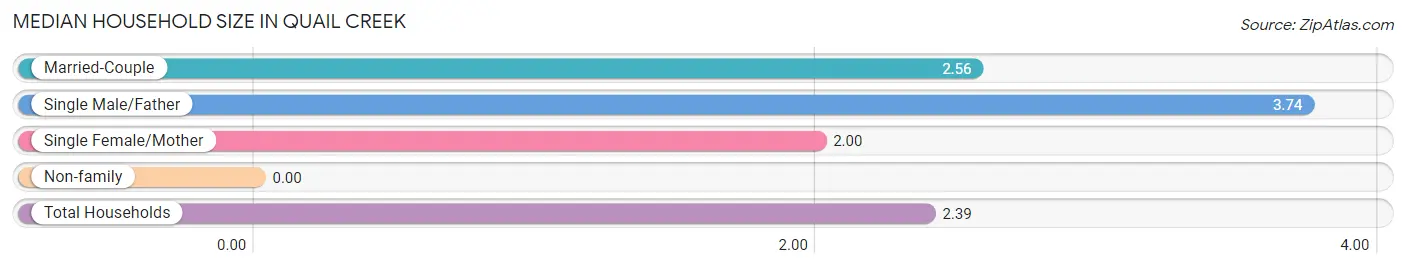
Median Household Size in Quail Creek
| Household Type | # Households | Household Size |
| Married-Couple | 382 (70.2%) | 2.56 |
| Single Male/Father | 46 (8.5%) | 3.74 |
| Single Female/Mother | 33 (6.1%) | 2.00 |
| Non-family | 83 (15.3%) | - |
| Total Households | 544 (100.0%) | 2.39 |
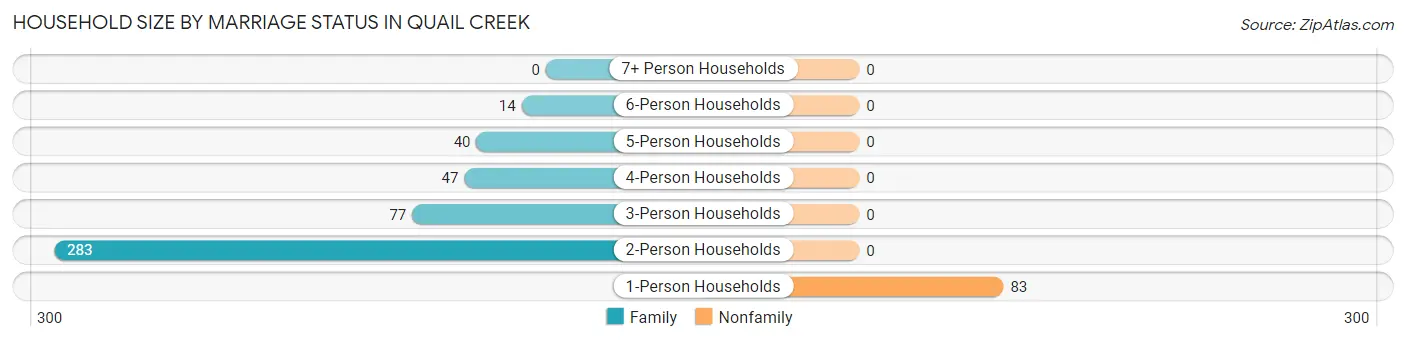
Household Size by Marriage Status in Quail Creek
Out of a total of 544 households in Quail Creek, 461 (84.7%) are family households, while 83 (15.3%) are nonfamily households. The most numerous type of family households are 2-person households, comprising 283, and the most common type of nonfamily households are 1-person households, comprising 83.
| Household Size | Family Households | Nonfamily Households |
| 1-Person Households | - | 83 (15.3%) |
| 2-Person Households | 283 (52.0%) | 0 (0.0%) |
| 3-Person Households | 77 (14.1%) | 0 (0.0%) |
| 4-Person Households | 47 (8.6%) | 0 (0.0%) |
| 5-Person Households | 40 (7.3%) | 0 (0.0%) |
| 6-Person Households | 14 (2.6%) | 0 (0.0%) |
| 7+ Person Households | 0 (0.0%) | 0 (0.0%) |
| Total | 461 (84.7%) | 83 (15.3%) |
Female Fertility in Quail Creek
Fertility by Age in Quail Creek
Average fertility rate in Quail Creek is 102.0 births per 1,000 women. Women in the age bracket of 20 to 34 years have the highest fertility rate with 174.0 births per 1,000 women. Women in the age bracket of 20 to 34 years acount for 100.0% of all women with births.
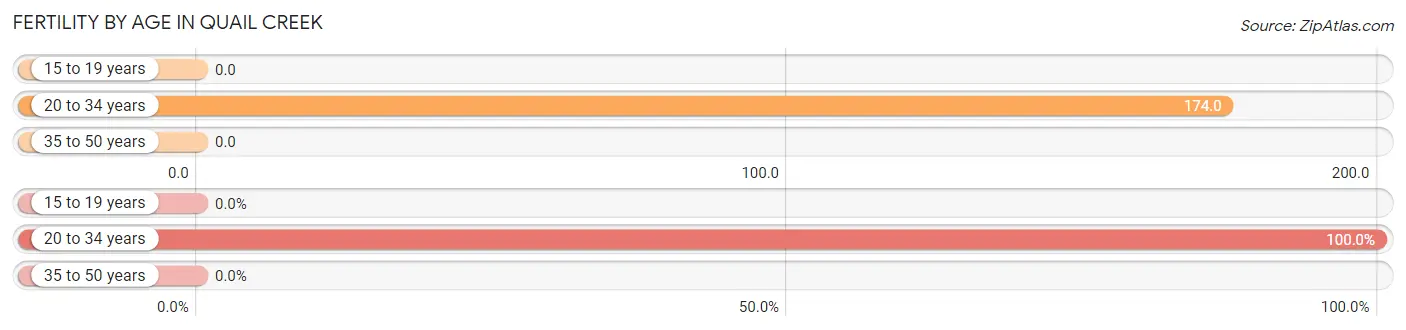
| Age Bracket | Women with Births | Births / 1,000 Women |
| 15 to 19 years | 0 (0.0%) | 0.0 |
| 20 to 34 years | 28 (100.0%) | 174.0 |
| 35 to 50 years | 0 (0.0%) | 0.0 |
| Total | 28 (100.0%) | 102.0 |
Fertility by Age by Marriage Status in Quail Creek
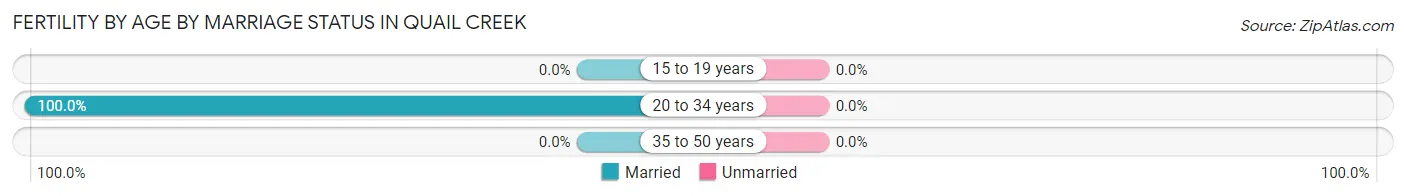
| Age Bracket | Married | Unmarried |
| 15 to 19 years | 0 (0.0%) | 0 (0.0%) |
| 20 to 34 years | 28 (100.0%) | 0 (0.0%) |
| 35 to 50 years | 0 (0.0%) | 0 (0.0%) |
| Total | 28 (100.0%) | 0 (0.0%) |
Fertility by Education in Quail Creek
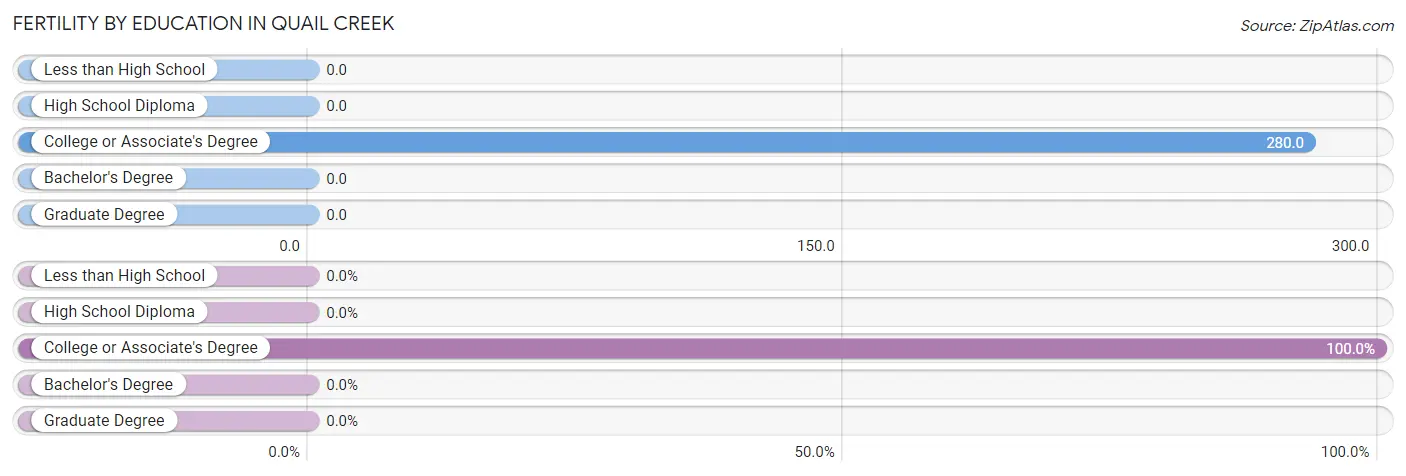
| Educational Attainment | Women with Births | Births / 1,000 Women |
| Less than High School | 0 (0.0%) | 0.0 |
| High School Diploma | 0 (0.0%) | 0.0 |
| College or Associate's Degree | 28 (100.0%) | 280.0 |
| Bachelor's Degree | 0 (0.0%) | 0.0 |
| Graduate Degree | 0 (0.0%) | 0.0 |
| Total | 28 (100.0%) | 102.0 |
Fertility by Education by Marriage Status in Quail Creek
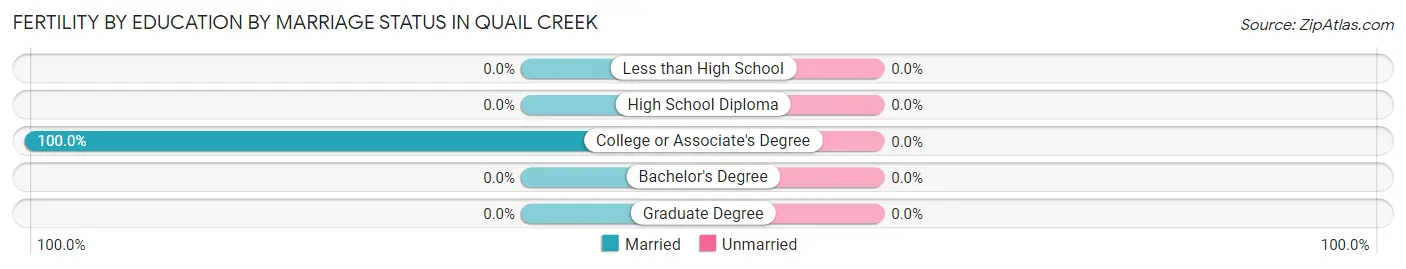
| Educational Attainment | Married | Unmarried |
| Less than High School | 0 (0.0%) | 0 (0.0%) |
| High School Diploma | 0 (0.0%) | 0 (0.0%) |
| College or Associate's Degree | 28 (100.0%) | 0 (0.0%) |
| Bachelor's Degree | 0 (0.0%) | 0 (0.0%) |
| Graduate Degree | 0 (0.0%) | 0 (0.0%) |
| Total | 28 (100.0%) | 0 (0.0%) |
Employment Characteristics in Quail Creek
Employment by Class of Employer in Quail Creek
Among the 571 employed individuals in Quail Creek, private company employees (299 | 52.4%), local government employees (100 | 17.5%), and not-for-profit organizations (65 | 11.4%) make up the most common classes of employment.
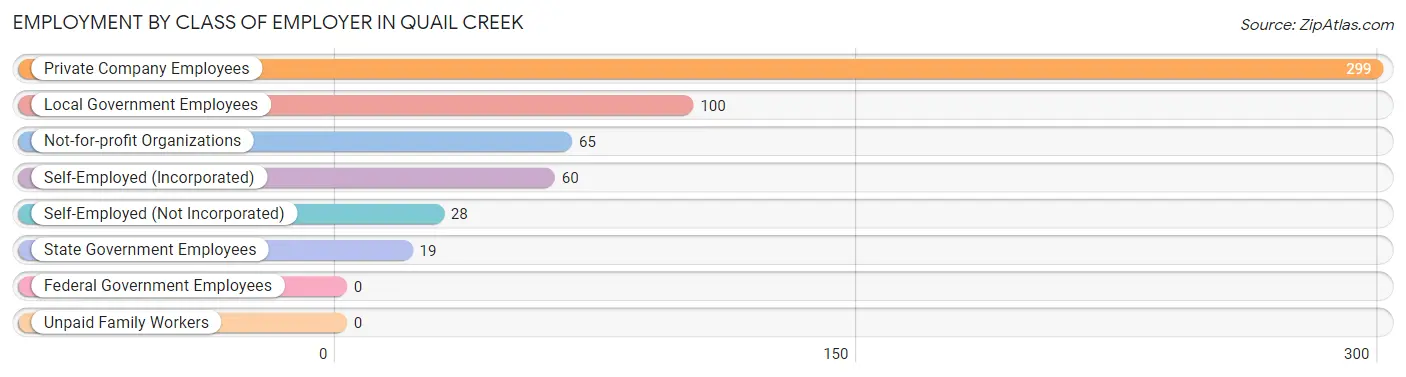
| Employer Class | # Employees | % Employees |
| Private Company Employees | 299 | 52.4% |
| Self-Employed (Incorporated) | 60 | 10.5% |
| Self-Employed (Not Incorporated) | 28 | 4.9% |
| Not-for-profit Organizations | 65 | 11.4% |
| Local Government Employees | 100 | 17.5% |
| State Government Employees | 19 | 3.3% |
| Federal Government Employees | 0 | 0.0% |
| Unpaid Family Workers | 0 | 0.0% |
| Total | 571 | 100.0% |
Employment Status by Age in Quail Creek
According to the labor force statistics for Quail Creek, out of the total population over 16 years of age (1,098), 59.7% or 656 individuals are in the labor force, with 12.8% or 84 of them unemployed. The age group with the highest labor force participation rate is 30 to 34 years, with 100.0% or 98 individuals in the labor force. Within the labor force, the 16 to 19 years age range has the highest percentage of unemployed individuals, with 100.0% or 7 of them being unemployed.
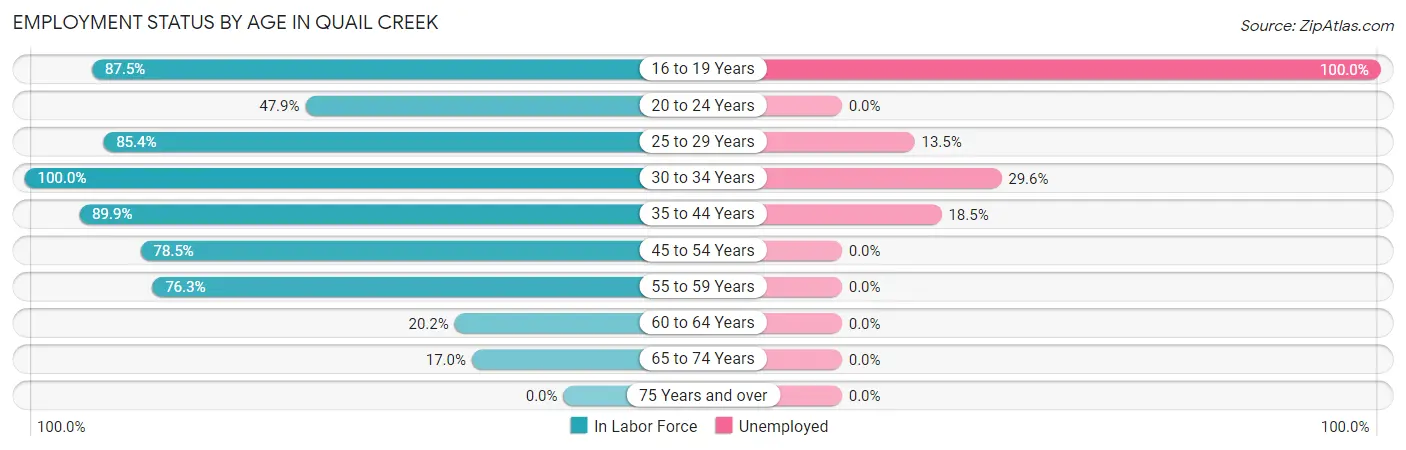
| Age Bracket | In Labor Force | Unemployed |
| 16 to 19 Years | 7 (87.5%) | 7 (100.0%) |
| 20 to 24 Years | 23 (47.9%) | 0 (0.0%) |
| 25 to 29 Years | 111 (85.4%) | 15 (13.5%) |
| 30 to 34 Years | 98 (100.0%) | 29 (29.6%) |
| 35 to 44 Years | 178 (89.9%) | 33 (18.5%) |
| 45 to 54 Years | 106 (78.5%) | 0 (0.0%) |
| 55 to 59 Years | 74 (76.3%) | 0 (0.0%) |
| 60 to 64 Years | 33 (20.2%) | 0 (0.0%) |
| 65 to 74 Years | 25 (17.0%) | 0 (0.0%) |
| 75 Years and over | 0 (0.0%) | 0 (0.0%) |
| Total | 656 (59.7%) | 84 (12.8%) |
Employment Status by Educational Attainment in Quail Creek
According to labor force statistics for Quail Creek, 73.1% of individuals (600) out of the total population between 25 and 64 years of age (821) are in the labor force, with 12.8% or 77 of them being unemployed. The group with the highest labor force participation rate are those with the educational attainment of bachelor's degree or higher, with 90.0% or 180 individuals in the labor force. Within the labor force, individuals with bachelor's degree or higher education have the highest percentage of unemployment, with 26.7% or 48 of them being unemployed.
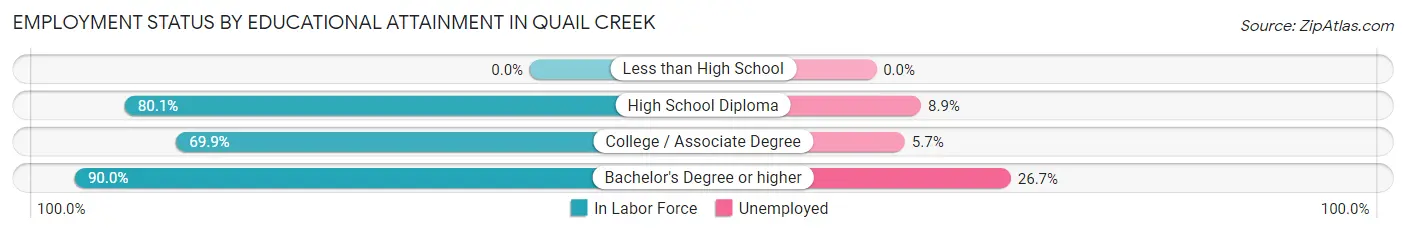
| Educational Attainment | In Labor Force | Unemployed |
| Less than High School | 0 (0.0%) | 0 (0.0%) |
| High School Diploma | 157 (80.1%) | 17 (8.9%) |
| College / Associate Degree | 263 (69.9%) | 21 (5.7%) |
| Bachelor's Degree or higher | 180 (90.0%) | 53 (26.7%) |
| Total | 600 (73.1%) | 105 (12.8%) |
Employment Occupations by Sex in Quail Creek
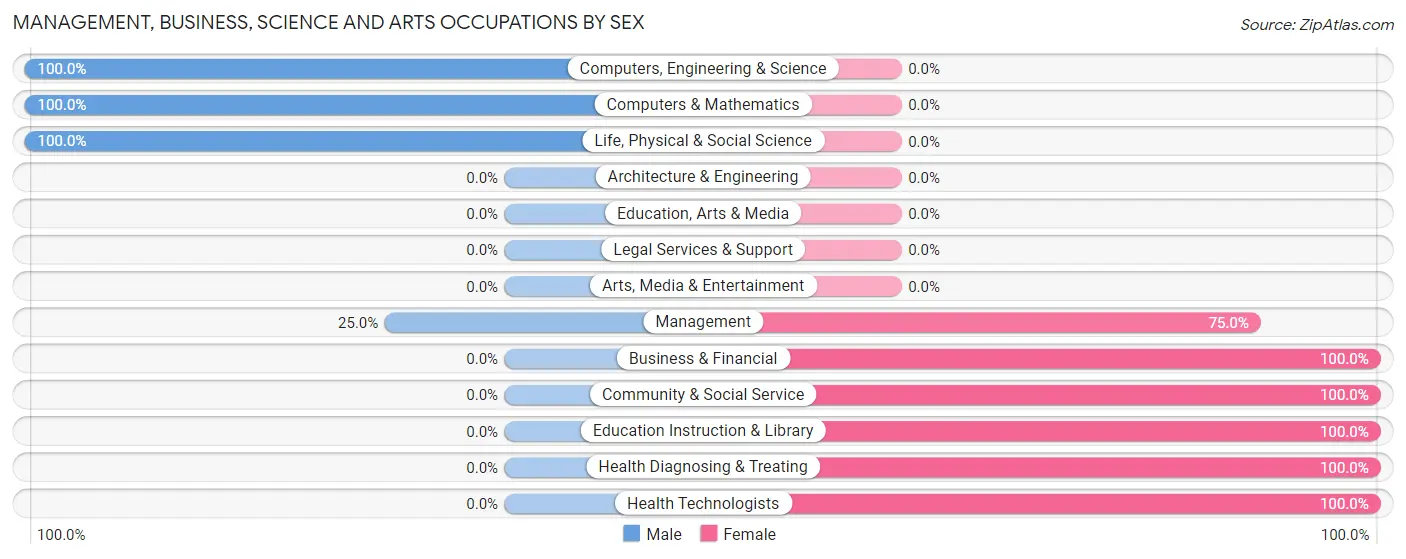
Management, Business, Science and Arts Occupations
The most common Management, Business, Science and Arts occupations in Quail Creek are Health Diagnosing & Treating (85 | 14.9%), Health Technologists (72 | 12.6%), Management (56 | 9.8%), Computers, Engineering & Science (54 | 9.5%), and Community & Social Service (34 | 5.9%).
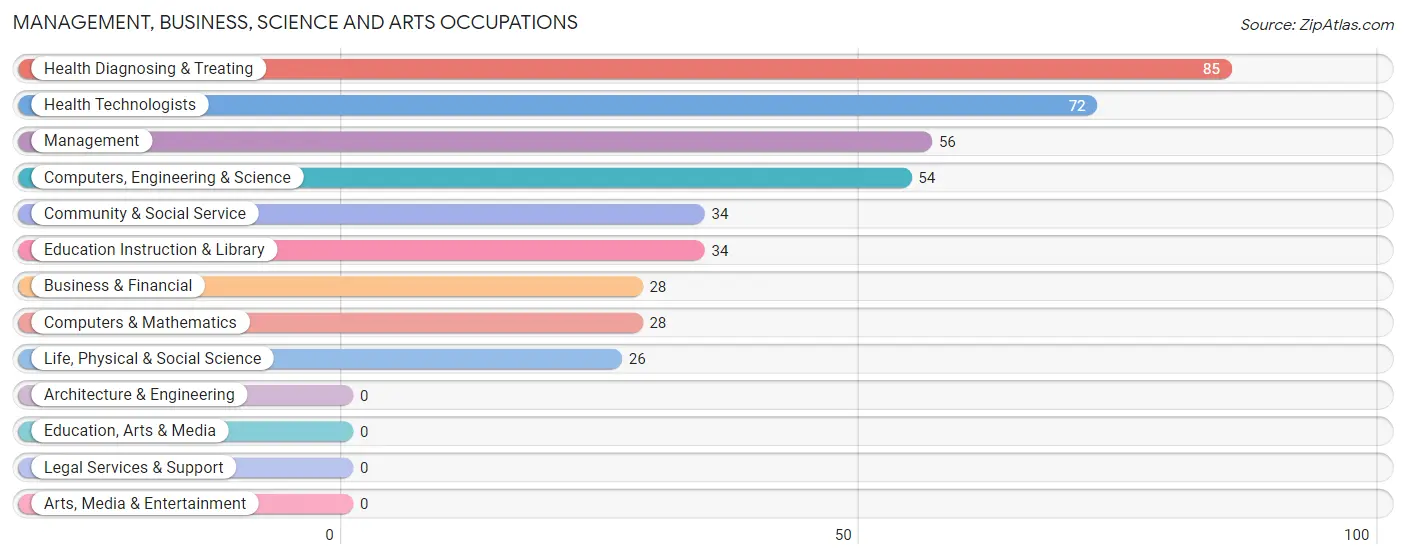
Management, Business, Science and Arts Occupations by Sex
Within the Management, Business, Science and Arts occupations in Quail Creek, the most male-oriented occupations are Computers, Engineering & Science (100.0%), Computers & Mathematics (100.0%), and Life, Physical & Social Science (100.0%), while the most female-oriented occupations are Business & Financial (100.0%), Community & Social Service (100.0%), and Education Instruction & Library (100.0%).
| Occupation | Male | Female |
| Management | 14 (25.0%) | 42 (75.0%) |
| Business & Financial | 0 (0.0%) | 28 (100.0%) |
| Computers, Engineering & Science | 54 (100.0%) | 0 (0.0%) |
| Computers & Mathematics | 28 (100.0%) | 0 (0.0%) |
| Architecture & Engineering | 0 (0.0%) | 0 (0.0%) |
| Life, Physical & Social Science | 26 (100.0%) | 0 (0.0%) |
| Community & Social Service | 0 (0.0%) | 34 (100.0%) |
| Education, Arts & Media | 0 (0.0%) | 0 (0.0%) |
| Legal Services & Support | 0 (0.0%) | 0 (0.0%) |
| Education Instruction & Library | 0 (0.0%) | 34 (100.0%) |
| Arts, Media & Entertainment | 0 (0.0%) | 0 (0.0%) |
| Health Diagnosing & Treating | 0 (0.0%) | 85 (100.0%) |
| Health Technologists | 0 (0.0%) | 72 (100.0%) |
| Total (Category) | 68 (26.5%) | 189 (73.5%) |
| Total (Overall) | 331 (58.0%) | 240 (42.0%) |
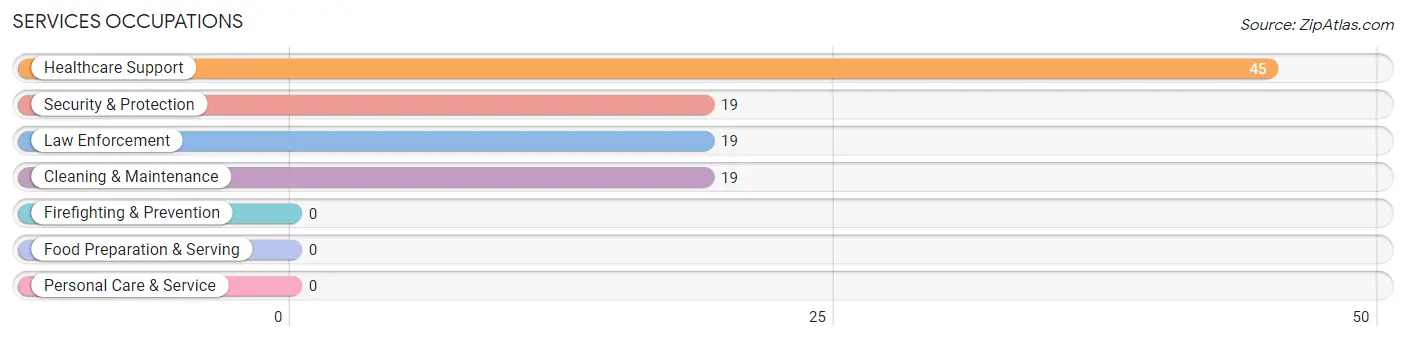
Services Occupations
The most common Services occupations in Quail Creek are Healthcare Support (45 | 7.9%), Security & Protection (19 | 3.3%), Law Enforcement (19 | 3.3%), and Cleaning & Maintenance (19 | 3.3%).
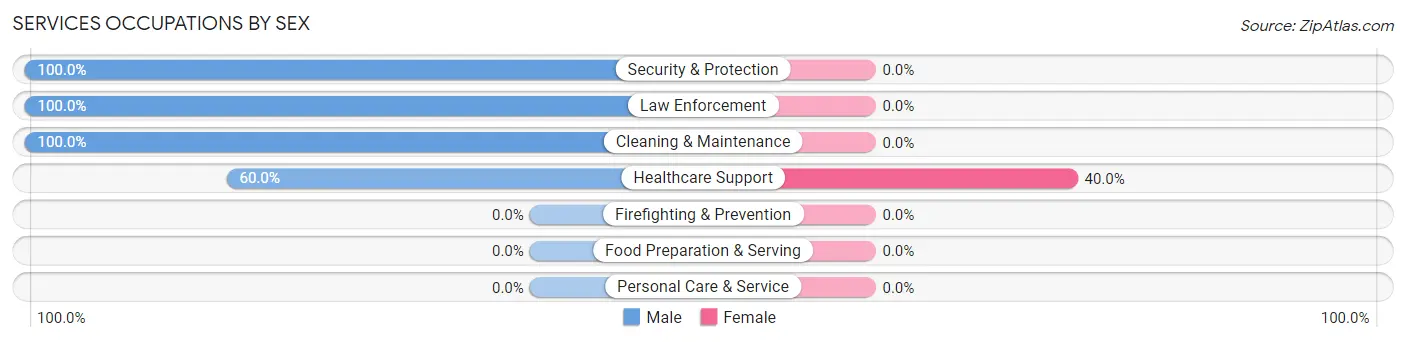
Services Occupations by Sex
| Occupation | Male | Female |
| Healthcare Support | 27 (60.0%) | 18 (40.0%) |
| Security & Protection | 19 (100.0%) | 0 (0.0%) |
| Firefighting & Prevention | 0 (0.0%) | 0 (0.0%) |
| Law Enforcement | 19 (100.0%) | 0 (0.0%) |
| Food Preparation & Serving | 0 (0.0%) | 0 (0.0%) |
| Cleaning & Maintenance | 19 (100.0%) | 0 (0.0%) |
| Personal Care & Service | 0 (0.0%) | 0 (0.0%) |
| Total (Category) | 65 (78.3%) | 18 (21.7%) |
| Total (Overall) | 331 (58.0%) | 240 (42.0%) |
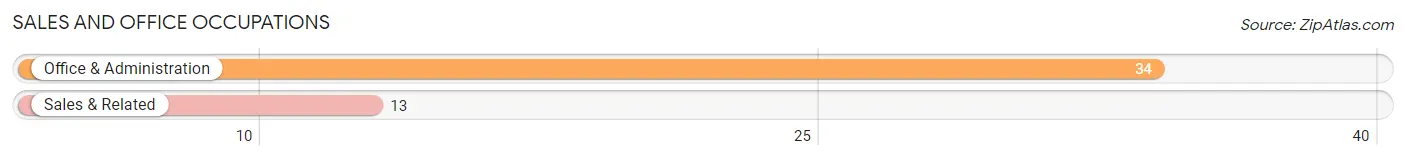
Sales and Office Occupations
The most common Sales and Office occupations in Quail Creek are Office & Administration (34 | 5.9%), and Sales & Related (13 | 2.3%).
Sales and Office Occupations by Sex

| Occupation | Male | Female |
| Sales & Related | 13 (100.0%) | 0 (0.0%) |
| Office & Administration | 18 (52.9%) | 16 (47.1%) |
| Total (Category) | 31 (66.0%) | 16 (34.0%) |
| Total (Overall) | 331 (58.0%) | 240 (42.0%) |
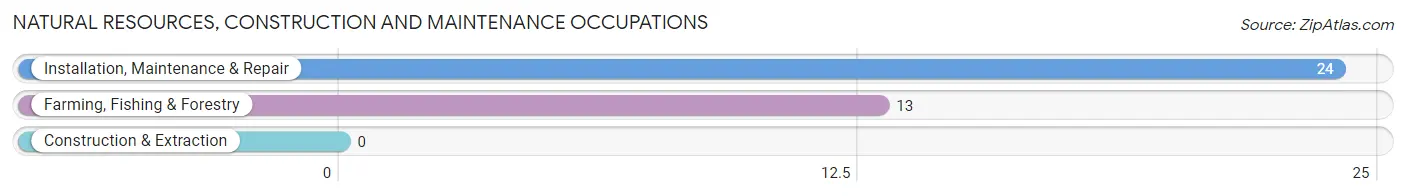
Natural Resources, Construction and Maintenance Occupations
The most common Natural Resources, Construction and Maintenance occupations in Quail Creek are Installation, Maintenance & Repair (24 | 4.2%), and Farming, Fishing & Forestry (13 | 2.3%).
Natural Resources, Construction and Maintenance Occupations by Sex
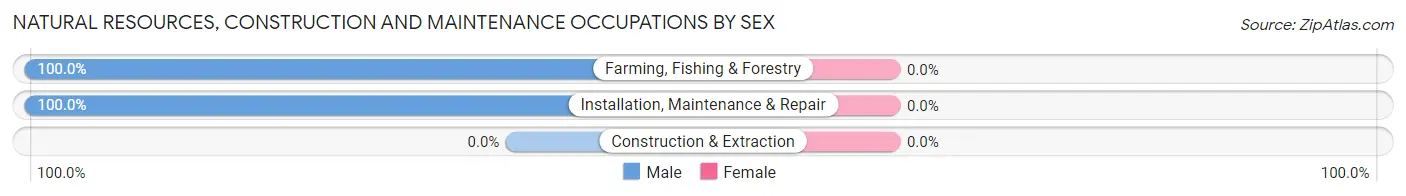
| Occupation | Male | Female |
| Farming, Fishing & Forestry | 13 (100.0%) | 0 (0.0%) |
| Construction & Extraction | 0 (0.0%) | 0 (0.0%) |
| Installation, Maintenance & Repair | 24 (100.0%) | 0 (0.0%) |
| Total (Category) | 37 (100.0%) | 0 (0.0%) |
| Total (Overall) | 331 (58.0%) | 240 (42.0%) |
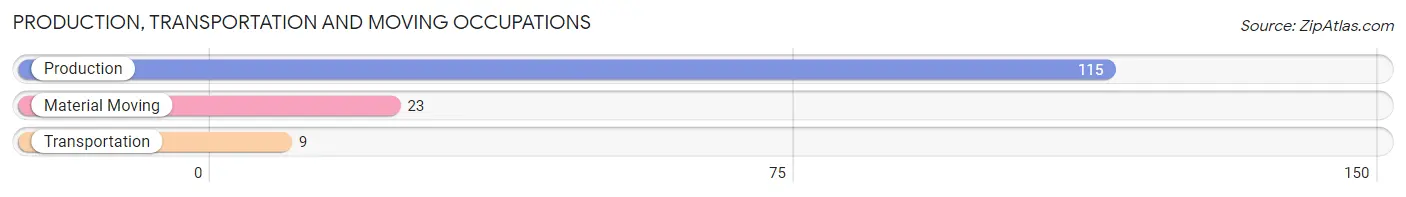
Production, Transportation and Moving Occupations
The most common Production, Transportation and Moving occupations in Quail Creek are Production (115 | 20.1%), Material Moving (23 | 4.0%), and Transportation (9 | 1.6%).
Production, Transportation and Moving Occupations by Sex
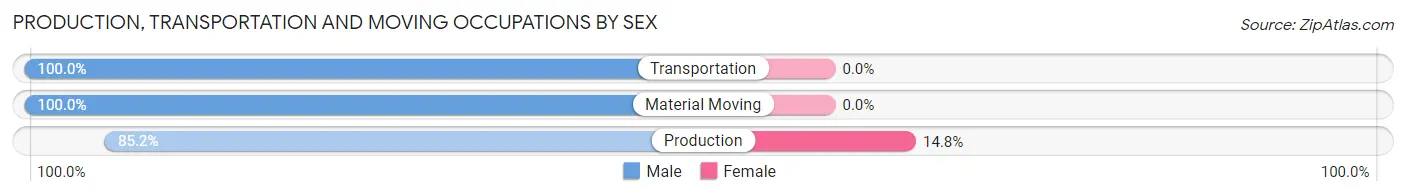
| Occupation | Male | Female |
| Production | 98 (85.2%) | 17 (14.8%) |
| Transportation | 9 (100.0%) | 0 (0.0%) |
| Material Moving | 23 (100.0%) | 0 (0.0%) |
| Total (Category) | 130 (88.4%) | 17 (11.6%) |
| Total (Overall) | 331 (58.0%) | 240 (42.0%) |
Employment Industries by Sex in Quail Creek
Employment Industries in Quail Creek
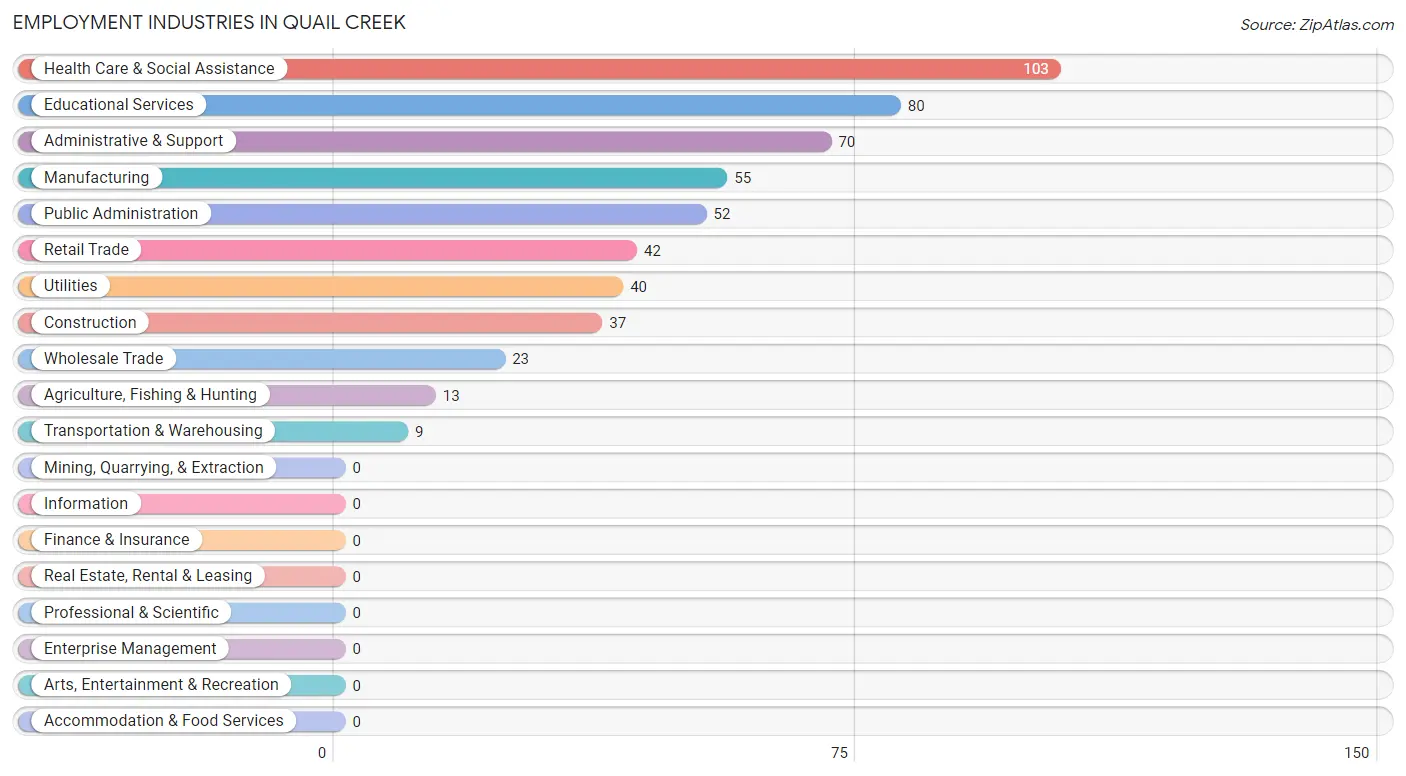
The major employment industries in Quail Creek include Health Care & Social Assistance (103 | 18.0%), Educational Services (80 | 14.0%), Administrative & Support (70 | 12.3%), Manufacturing (55 | 9.6%), and Public Administration (52 | 9.1%).
Employment Industries by Sex in Quail Creek
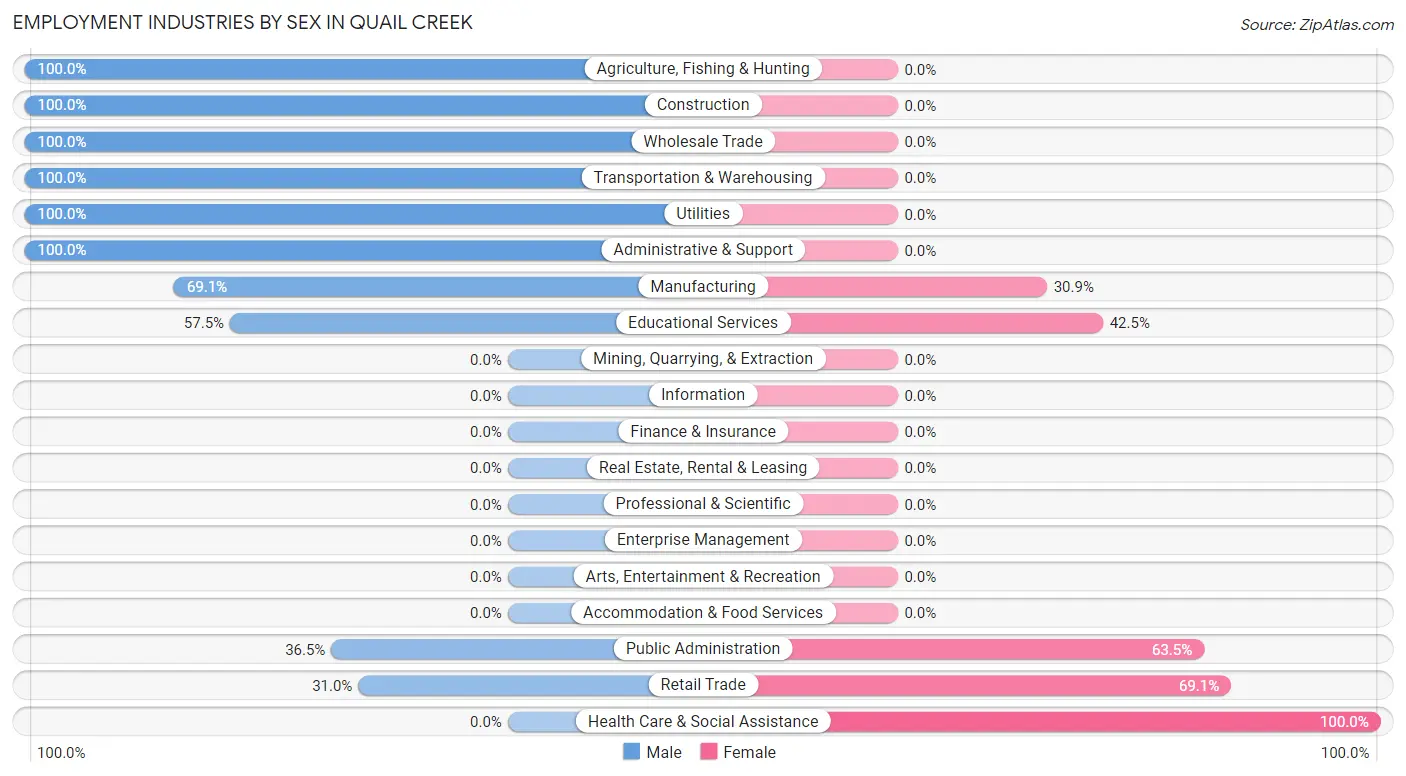
The Quail Creek industries that see more men than women are Agriculture, Fishing & Hunting (100.0%), Construction (100.0%), and Wholesale Trade (100.0%), whereas the industries that tend to have a higher number of women are Health Care & Social Assistance (100.0%), Retail Trade (69.1%), and Public Administration (63.5%).
| Industry | Male | Female |
| Agriculture, Fishing & Hunting | 13 (100.0%) | 0 (0.0%) |
| Mining, Quarrying, & Extraction | 0 (0.0%) | 0 (0.0%) |
| Construction | 37 (100.0%) | 0 (0.0%) |
| Manufacturing | 38 (69.1%) | 17 (30.9%) |
| Wholesale Trade | 23 (100.0%) | 0 (0.0%) |
| Retail Trade | 13 (30.9%) | 29 (69.1%) |
| Transportation & Warehousing | 9 (100.0%) | 0 (0.0%) |
| Utilities | 40 (100.0%) | 0 (0.0%) |
| Information | 0 (0.0%) | 0 (0.0%) |
| Finance & Insurance | 0 (0.0%) | 0 (0.0%) |
| Real Estate, Rental & Leasing | 0 (0.0%) | 0 (0.0%) |
| Professional & Scientific | 0 (0.0%) | 0 (0.0%) |
| Enterprise Management | 0 (0.0%) | 0 (0.0%) |
| Administrative & Support | 70 (100.0%) | 0 (0.0%) |
| Educational Services | 46 (57.5%) | 34 (42.5%) |
| Health Care & Social Assistance | 0 (0.0%) | 103 (100.0%) |
| Arts, Entertainment & Recreation | 0 (0.0%) | 0 (0.0%) |
| Accommodation & Food Services | 0 (0.0%) | 0 (0.0%) |
| Public Administration | 19 (36.5%) | 33 (63.5%) |
| Total | 331 (58.0%) | 240 (42.0%) |
Education in Quail Creek
School Enrollment in Quail Creek
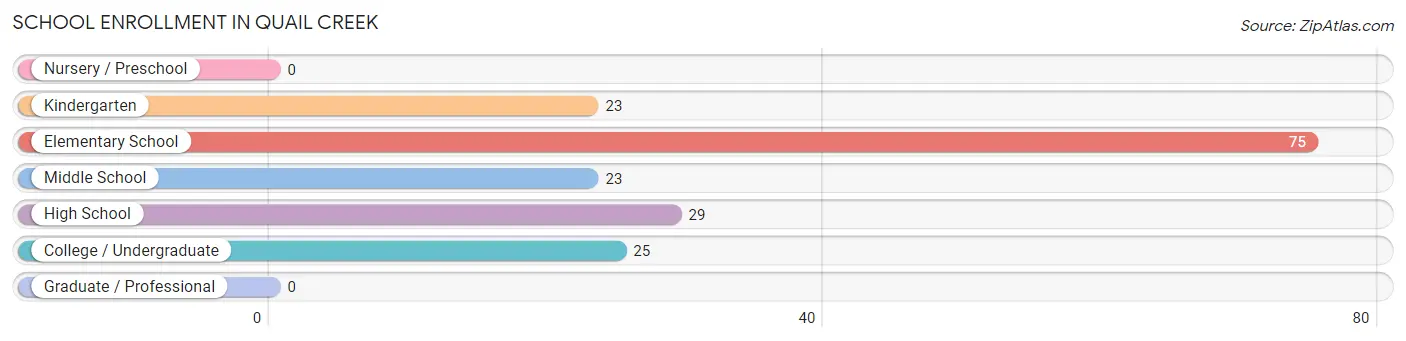
The most common levels of schooling among the 175 students in Quail Creek are elementary school (75 | 42.9%), high school (29 | 16.6%), and college / undergraduate (25 | 14.3%).
| School Level | # Students | % Students |
| Nursery / Preschool | 0 | 0.0% |
| Kindergarten | 23 | 13.1% |
| Elementary School | 75 | 42.9% |
| Middle School | 23 | 13.1% |
| High School | 29 | 16.6% |
| College / Undergraduate | 25 | 14.3% |
| Graduate / Professional | 0 | 0.0% |
| Total | 175 | 100.0% |
School Enrollment by Age by Funding Source in Quail Creek
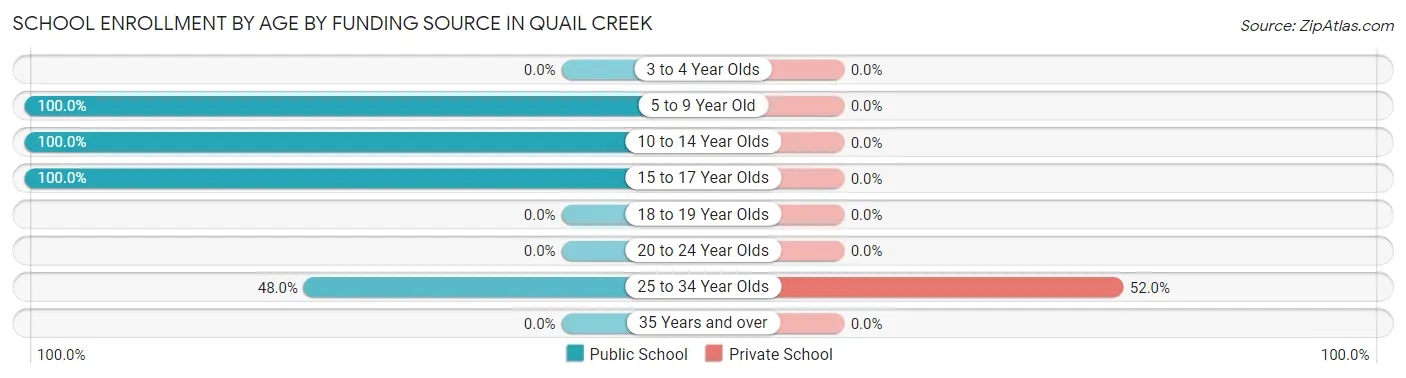
Out of a total of 175 students who are enrolled in schools in Quail Creek, 13 (7.4%) attend a private institution, while the remaining 162 (92.6%) are enrolled in public schools. The age group of 25 to 34 year olds has the highest likelihood of being enrolled in private schools, with 13 (52.0% in the age bracket) enrolled. Conversely, the age group of 5 to 9 year old has the lowest likelihood of being enrolled in a private school, with 74 (100.0% in the age bracket) attending a public institution.
| Age Bracket | Public School | Private School |
| 3 to 4 Year Olds | 0 (0.0%) | 0 (0.0%) |
| 5 to 9 Year Old | 74 (100.0%) | 0 (0.0%) |
| 10 to 14 Year Olds | 47 (100.0%) | 0 (0.0%) |
| 15 to 17 Year Olds | 29 (100.0%) | 0 (0.0%) |
| 18 to 19 Year Olds | 0 (0.0%) | 0 (0.0%) |
| 20 to 24 Year Olds | 0 (0.0%) | 0 (0.0%) |
| 25 to 34 Year Olds | 12 (48.0%) | 13 (52.0%) |
| 35 Years and over | 0 (0.0%) | 0 (0.0%) |
| Total | 162 (92.6%) | 13 (7.4%) |
Educational Attainment by Field of Study in Quail Creek
Liberal arts & history (54 | 25.2%), education (38 | 17.8%), bio, nature & agricultural (33 | 15.4%), arts & humanities (33 | 15.4%), and computers & mathematics (28 | 13.1%) are the most common fields of study among 214 individuals in Quail Creek who have obtained a bachelor's degree or higher.
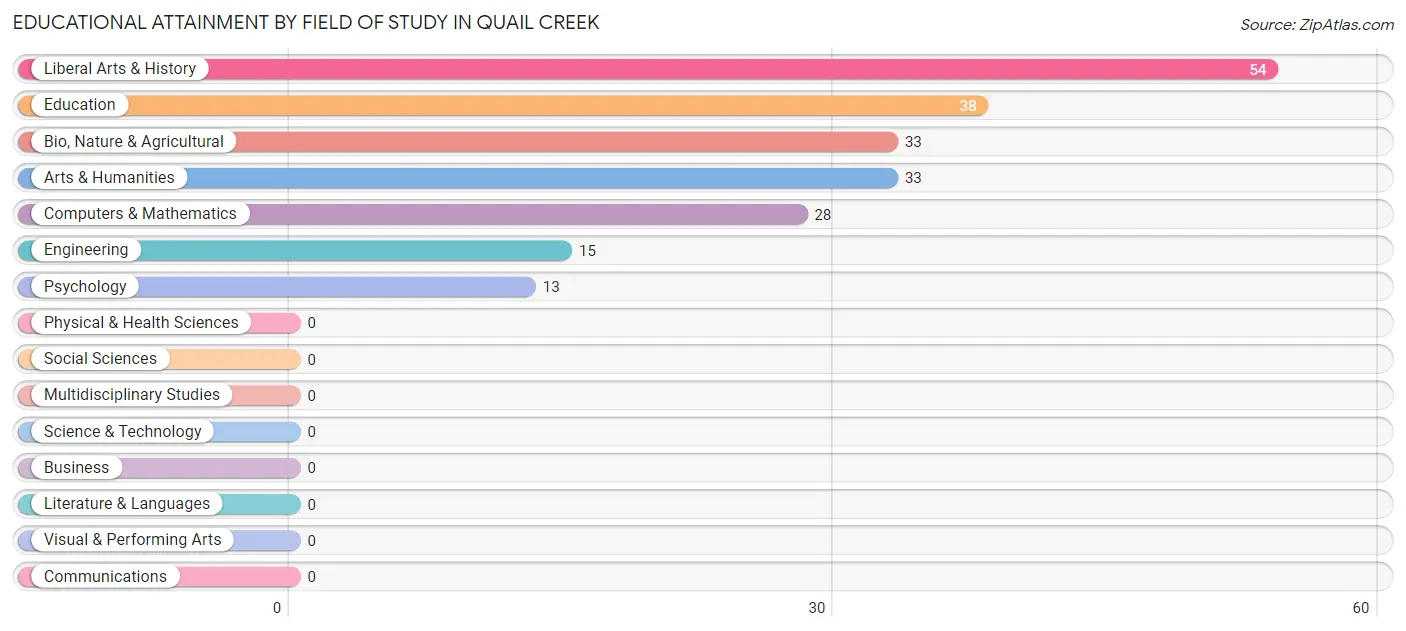
| Field of Study | # Graduates | % Graduates |
| Computers & Mathematics | 28 | 13.1% |
| Bio, Nature & Agricultural | 33 | 15.4% |
| Physical & Health Sciences | 0 | 0.0% |
| Psychology | 13 | 6.1% |
| Social Sciences | 0 | 0.0% |
| Engineering | 15 | 7.0% |
| Multidisciplinary Studies | 0 | 0.0% |
| Science & Technology | 0 | 0.0% |
| Business | 0 | 0.0% |
| Education | 38 | 17.8% |
| Literature & Languages | 0 | 0.0% |
| Liberal Arts & History | 54 | 25.2% |
| Visual & Performing Arts | 0 | 0.0% |
| Communications | 0 | 0.0% |
| Arts & Humanities | 33 | 15.4% |
| Total | 214 | 100.0% |
Transportation & Commute in Quail Creek
Vehicle Availability by Sex in Quail Creek
The most prevalent vehicle ownership categories in Quail Creek are males with 2 vehicles (227, accounting for 68.6%) and females with 2 vehicles (193, making up 94.6%).
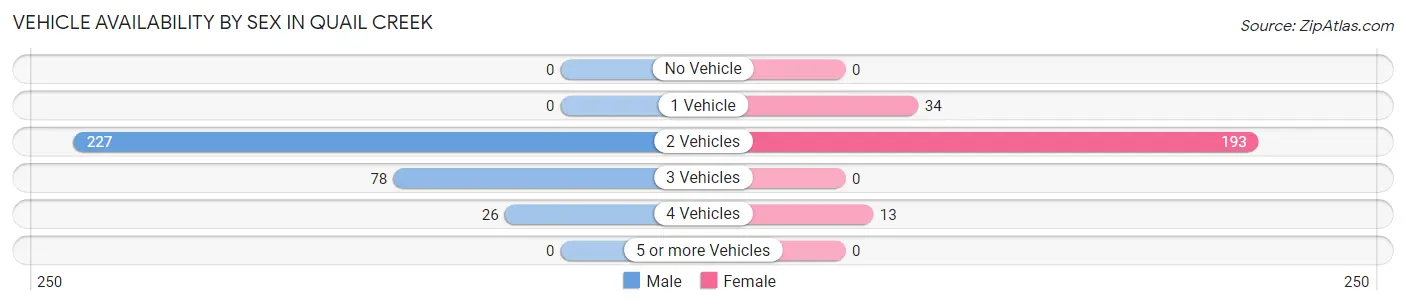
| Vehicles Available | Male | Female |
| No Vehicle | 0 (0.0%) | 0 (0.0%) |
| 1 Vehicle | 0 (0.0%) | 34 (14.2%) |
| 2 Vehicles | 227 (68.6%) | 193 (80.4%) |
| 3 Vehicles | 78 (23.6%) | 0 (0.0%) |
| 4 Vehicles | 26 (7.9%) | 13 (5.4%) |
| 5 or more Vehicles | 0 (0.0%) | 0 (0.0%) |
| Total | 331 (100.0%) | 240 (100.0%) |
Commute Time in Quail Creek
The most frequently occuring commute durations in Quail Creek are 20 to 24 minutes (183 commuters, 34.4%), 10 to 14 minutes (91 commuters, 17.1%), and 45 to 59 minutes (82 commuters, 15.4%).
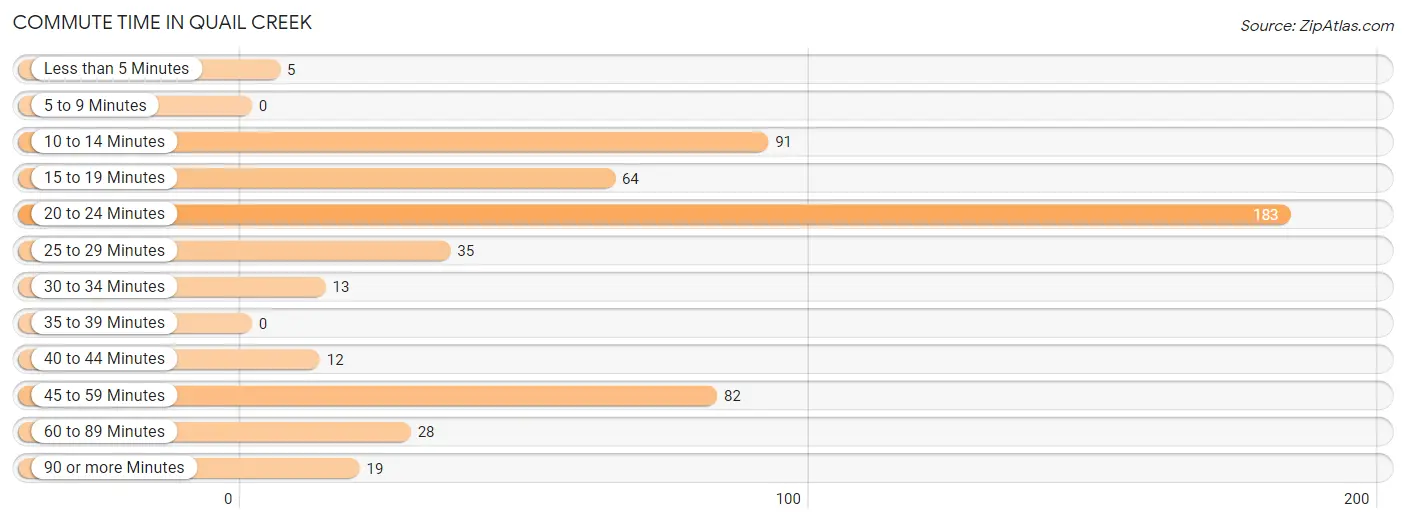
| Commute Time | # Commuters | % Commuters |
| Less than 5 Minutes | 5 | 0.9% |
| 5 to 9 Minutes | 0 | 0.0% |
| 10 to 14 Minutes | 91 | 17.1% |
| 15 to 19 Minutes | 64 | 12.0% |
| 20 to 24 Minutes | 183 | 34.4% |
| 25 to 29 Minutes | 35 | 6.6% |
| 30 to 34 Minutes | 13 | 2.4% |
| 35 to 39 Minutes | 0 | 0.0% |
| 40 to 44 Minutes | 12 | 2.3% |
| 45 to 59 Minutes | 82 | 15.4% |
| 60 to 89 Minutes | 28 | 5.3% |
| 90 or more Minutes | 19 | 3.6% |
Commute Time by Sex in Quail Creek
The most common commute times in Quail Creek are 20 to 24 minutes (116 commuters, 35.0%) for males and 20 to 24 minutes (67 commuters, 33.3%) for females.
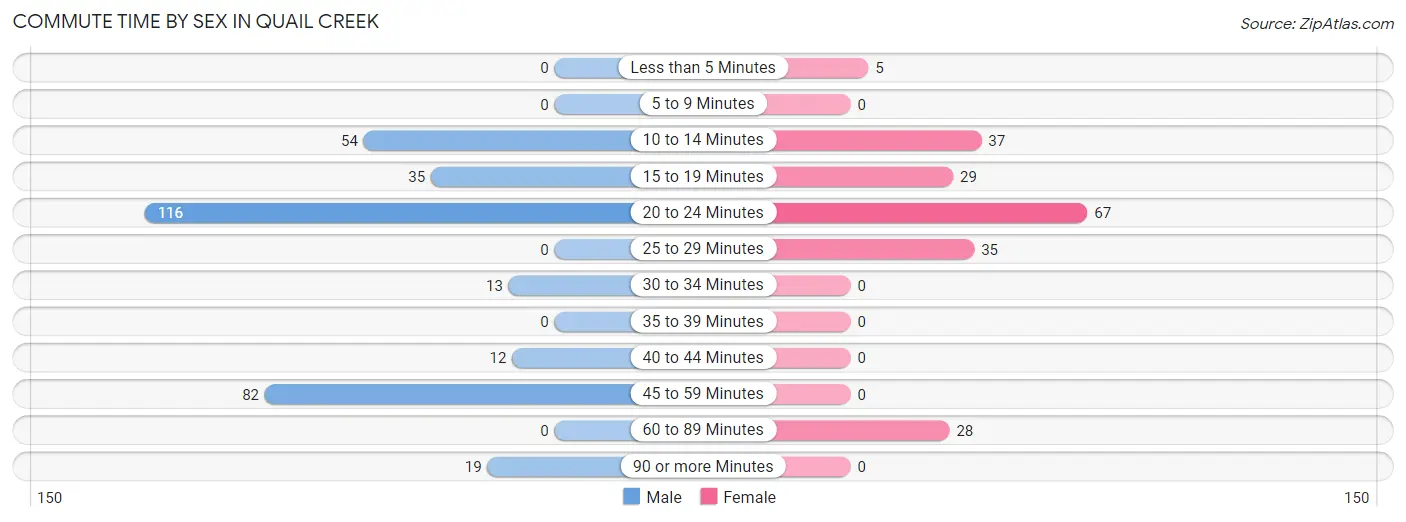
| Commute Time | Male | Female |
| Less than 5 Minutes | 0 (0.0%) | 5 (2.5%) |
| 5 to 9 Minutes | 0 (0.0%) | 0 (0.0%) |
| 10 to 14 Minutes | 54 (16.3%) | 37 (18.4%) |
| 15 to 19 Minutes | 35 (10.6%) | 29 (14.4%) |
| 20 to 24 Minutes | 116 (35.0%) | 67 (33.3%) |
| 25 to 29 Minutes | 0 (0.0%) | 35 (17.4%) |
| 30 to 34 Minutes | 13 (3.9%) | 0 (0.0%) |
| 35 to 39 Minutes | 0 (0.0%) | 0 (0.0%) |
| 40 to 44 Minutes | 12 (3.6%) | 0 (0.0%) |
| 45 to 59 Minutes | 82 (24.8%) | 0 (0.0%) |
| 60 to 89 Minutes | 0 (0.0%) | 28 (13.9%) |
| 90 or more Minutes | 19 (5.7%) | 0 (0.0%) |
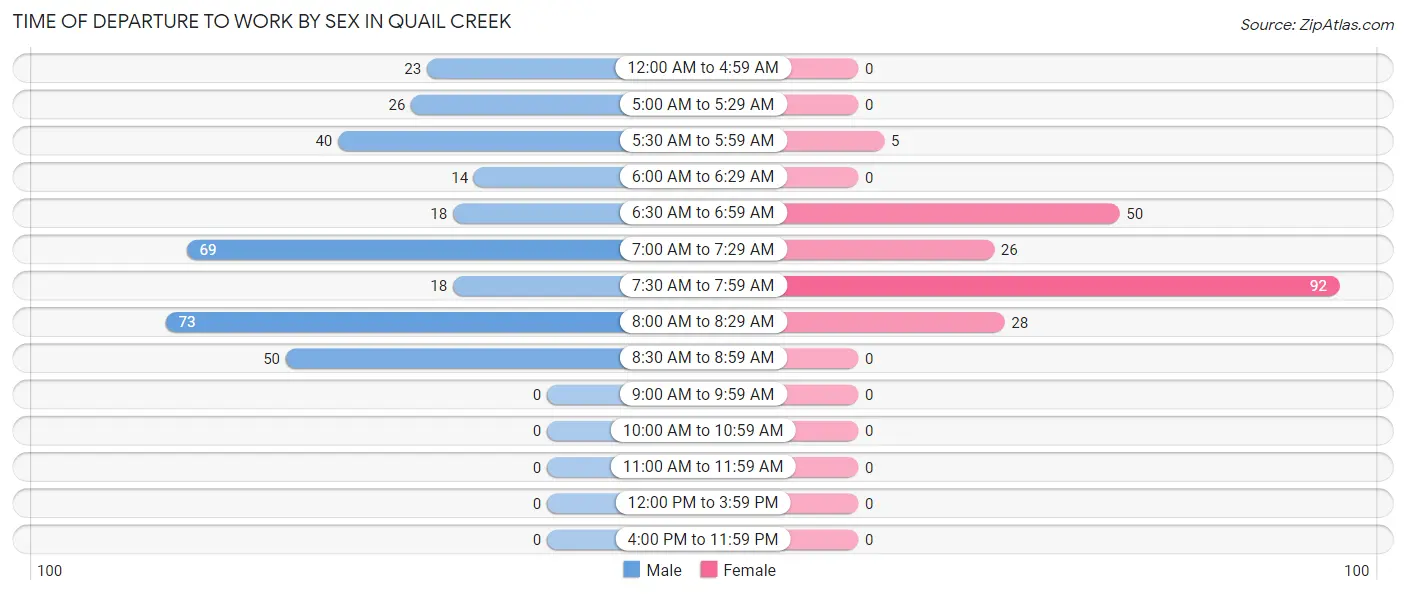
Time of Departure to Work by Sex in Quail Creek
The most frequent times of departure to work in Quail Creek are 8:00 AM to 8:29 AM (73, 22.1%) for males and 7:30 AM to 7:59 AM (92, 45.8%) for females.
| Time of Departure | Male | Female |
| 12:00 AM to 4:59 AM | 23 (7.0%) | 0 (0.0%) |
| 5:00 AM to 5:29 AM | 26 (7.9%) | 0 (0.0%) |
| 5:30 AM to 5:59 AM | 40 (12.1%) | 5 (2.5%) |
| 6:00 AM to 6:29 AM | 14 (4.2%) | 0 (0.0%) |
| 6:30 AM to 6:59 AM | 18 (5.4%) | 50 (24.9%) |
| 7:00 AM to 7:29 AM | 69 (20.8%) | 26 (12.9%) |
| 7:30 AM to 7:59 AM | 18 (5.4%) | 92 (45.8%) |
| 8:00 AM to 8:29 AM | 73 (22.1%) | 28 (13.9%) |
| 8:30 AM to 8:59 AM | 50 (15.1%) | 0 (0.0%) |
| 9:00 AM to 9:59 AM | 0 (0.0%) | 0 (0.0%) |
| 10:00 AM to 10:59 AM | 0 (0.0%) | 0 (0.0%) |
| 11:00 AM to 11:59 AM | 0 (0.0%) | 0 (0.0%) |
| 12:00 PM to 3:59 PM | 0 (0.0%) | 0 (0.0%) |
| 4:00 PM to 11:59 PM | 0 (0.0%) | 0 (0.0%) |
| Total | 331 (100.0%) | 201 (100.0%) |
Housing Occupancy in Quail Creek
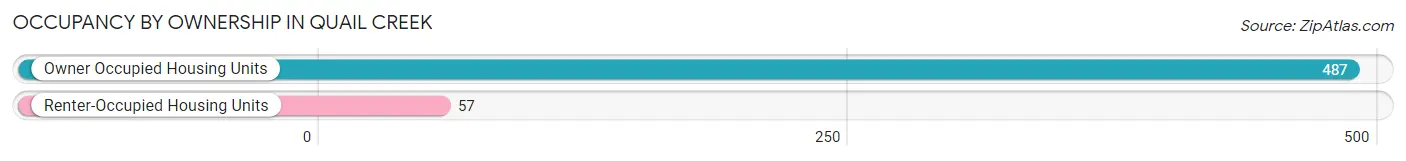
Occupancy by Ownership in Quail Creek
Of the total 544 dwellings in Quail Creek, owner-occupied units account for 487 (89.5%), while renter-occupied units make up 57 (10.5%).
| Occupancy | # Housing Units | % Housing Units |
| Owner Occupied Housing Units | 487 | 89.5% |
| Renter-Occupied Housing Units | 57 | 10.5% |
| Total Occupied Housing Units | 544 | 100.0% |
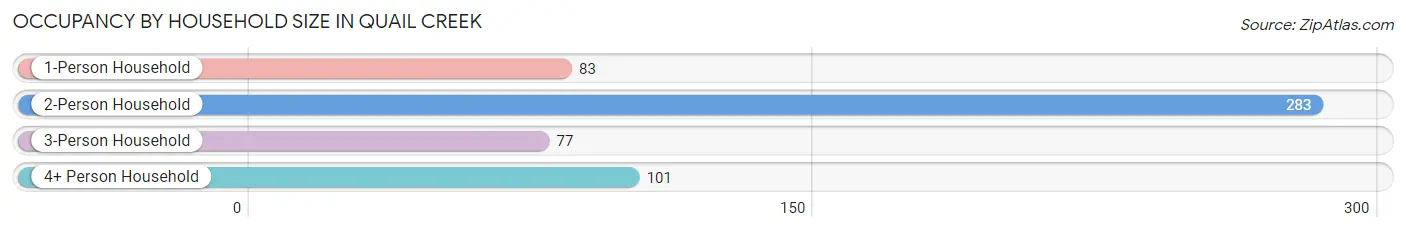
Occupancy by Household Size in Quail Creek
| Household Size | # Housing Units | % Housing Units |
| 1-Person Household | 83 | 15.3% |
| 2-Person Household | 283 | 52.0% |
| 3-Person Household | 77 | 14.1% |
| 4+ Person Household | 101 | 18.6% |
| Total Housing Units | 544 | 100.0% |
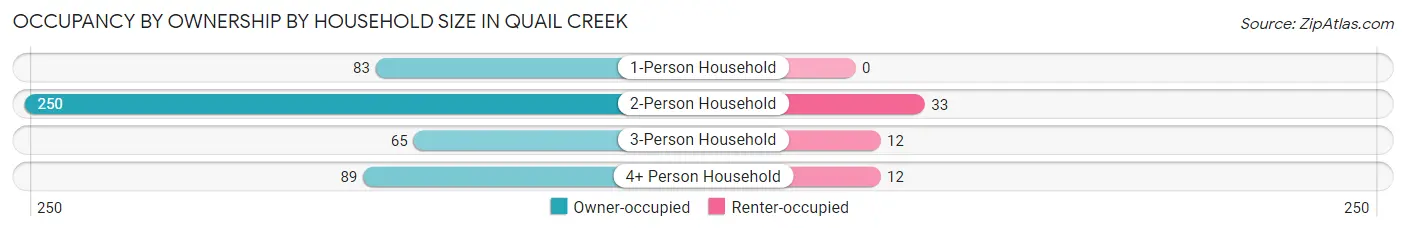
Occupancy by Ownership by Household Size in Quail Creek
| Household Size | Owner-occupied | Renter-occupied |
| 1-Person Household | 83 (100.0%) | 0 (0.0%) |
| 2-Person Household | 250 (88.3%) | 33 (11.7%) |
| 3-Person Household | 65 (84.4%) | 12 (15.6%) |
| 4+ Person Household | 89 (88.1%) | 12 (11.9%) |
| Total Housing Units | 487 (89.5%) | 57 (10.5%) |
Occupancy by Educational Attainment in Quail Creek
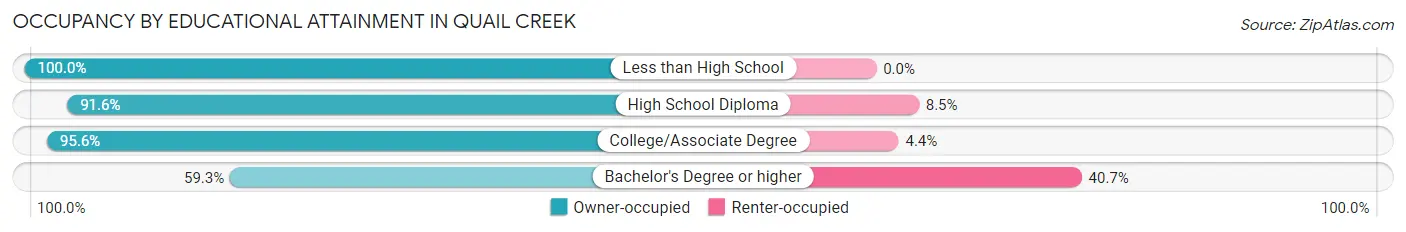
| Household Size | Owner-occupied | Renter-occupied |
| Less than High School | 50 (100.0%) | 0 (0.0%) |
| High School Diploma | 130 (91.5%) | 12 (8.5%) |
| College/Associate Degree | 259 (95.6%) | 12 (4.4%) |
| Bachelor's Degree or higher | 48 (59.3%) | 33 (40.7%) |
Occupancy by Age of Householder in Quail Creek
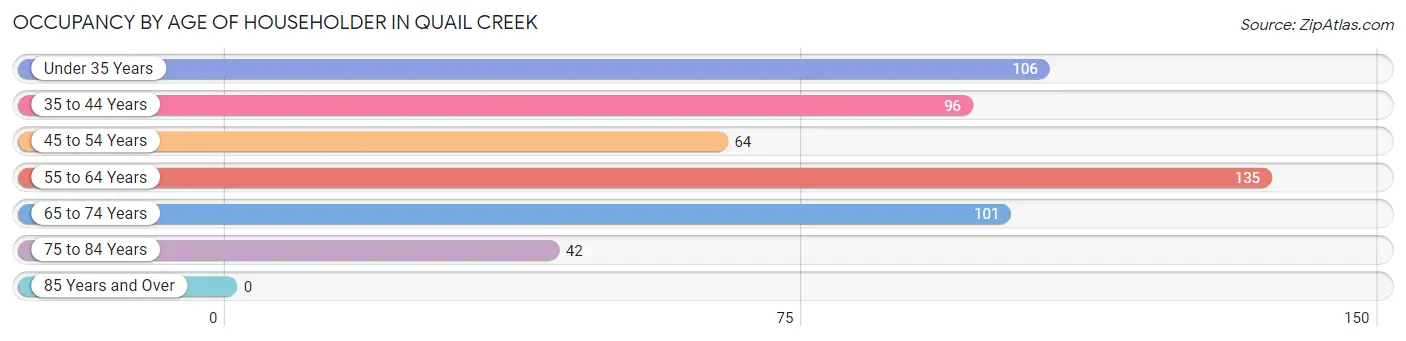
| Age Bracket | # Households | % Households |
| Under 35 Years | 106 | 19.5% |
| 35 to 44 Years | 96 | 17.6% |
| 45 to 54 Years | 64 | 11.8% |
| 55 to 64 Years | 135 | 24.8% |
| 65 to 74 Years | 101 | 18.6% |
| 75 to 84 Years | 42 | 7.7% |
| 85 Years and Over | 0 | 0.0% |
| Total | 544 | 100.0% |
Housing Finances in Quail Creek
Median Income by Occupancy in Quail Creek
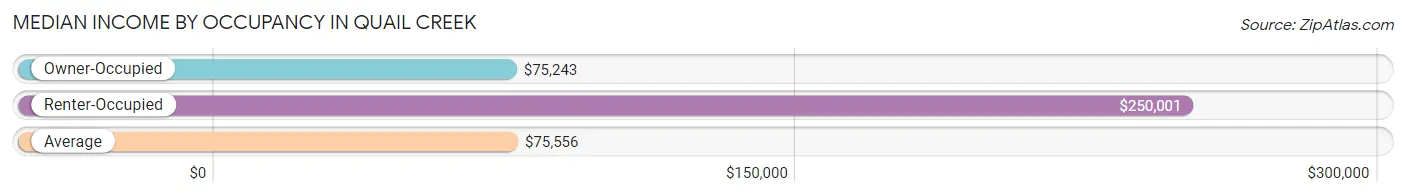
| Occupancy Type | # Households | Median Income |
| Owner-Occupied | 487 (89.5%) | $75,243 |
| Renter-Occupied | 57 (10.5%) | $250,001 |
| Average | 544 (100.0%) | $75,556 |
Occupancy by Householder Income Bracket in Quail Creek
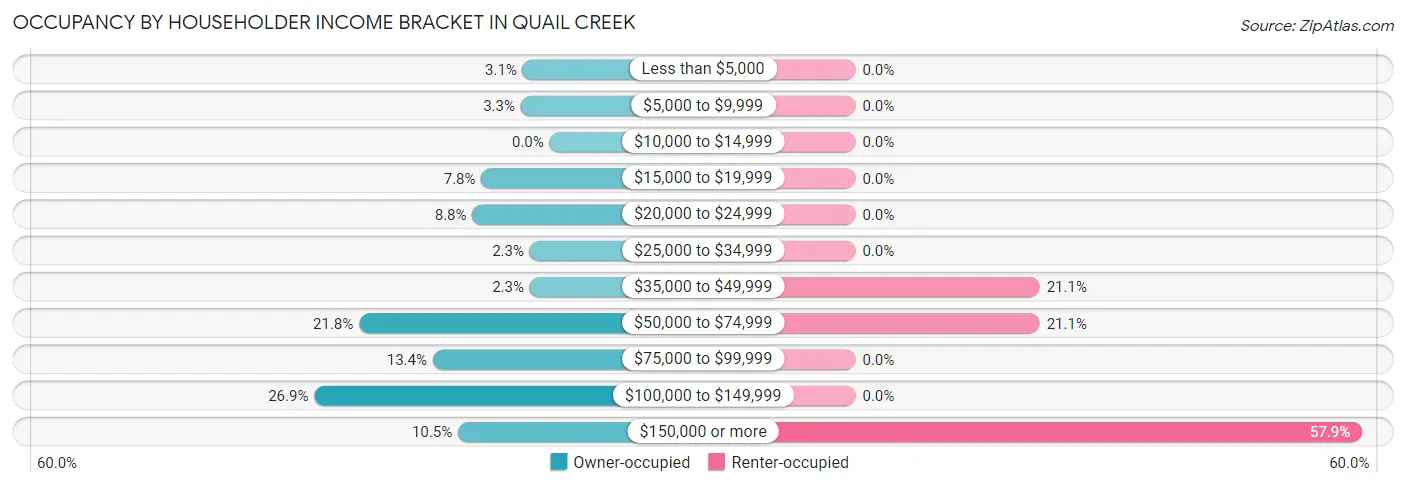
| Income Bracket | Owner-occupied | Renter-occupied |
| Less than $5,000 | 15 (3.1%) | 0 (0.0%) |
| $5,000 to $9,999 | 16 (3.3%) | 0 (0.0%) |
| $10,000 to $14,999 | 0 (0.0%) | 0 (0.0%) |
| $15,000 to $19,999 | 38 (7.8%) | 0 (0.0%) |
| $20,000 to $24,999 | 43 (8.8%) | 0 (0.0%) |
| $25,000 to $34,999 | 11 (2.3%) | 0 (0.0%) |
| $35,000 to $49,999 | 11 (2.3%) | 12 (21.0%) |
| $50,000 to $74,999 | 106 (21.8%) | 12 (21.0%) |
| $75,000 to $99,999 | 65 (13.4%) | 0 (0.0%) |
| $100,000 to $149,999 | 131 (26.9%) | 0 (0.0%) |
| $150,000 or more | 51 (10.5%) | 33 (57.9%) |
| Total | 487 (100.0%) | 57 (100.0%) |
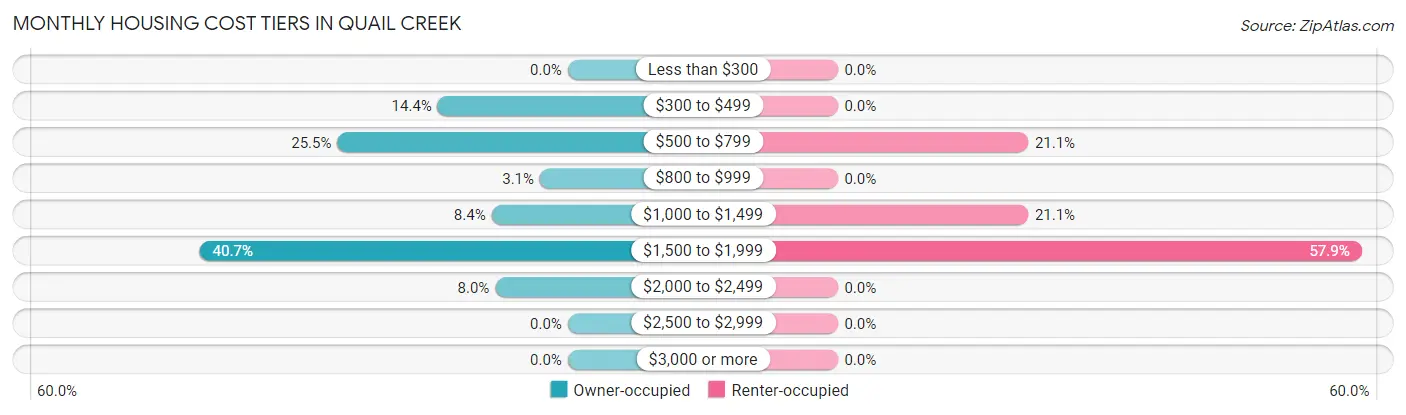
Monthly Housing Cost Tiers in Quail Creek
| Monthly Cost | Owner-occupied | Renter-occupied |
| Less than $300 | 0 (0.0%) | 0 (0.0%) |
| $300 to $499 | 70 (14.4%) | 0 (0.0%) |
| $500 to $799 | 124 (25.5%) | 12 (21.0%) |
| $800 to $999 | 15 (3.1%) | 0 (0.0%) |
| $1,000 to $1,499 | 41 (8.4%) | 12 (21.0%) |
| $1,500 to $1,999 | 198 (40.7%) | 33 (57.9%) |
| $2,000 to $2,499 | 39 (8.0%) | 0 (0.0%) |
| $2,500 to $2,999 | 0 (0.0%) | 0 (0.0%) |
| $3,000 or more | 0 (0.0%) | 0 (0.0%) |
| Total | 487 (100.0%) | 57 (100.0%) |
Physical Housing Characteristics in Quail Creek
Housing Structures in Quail Creek
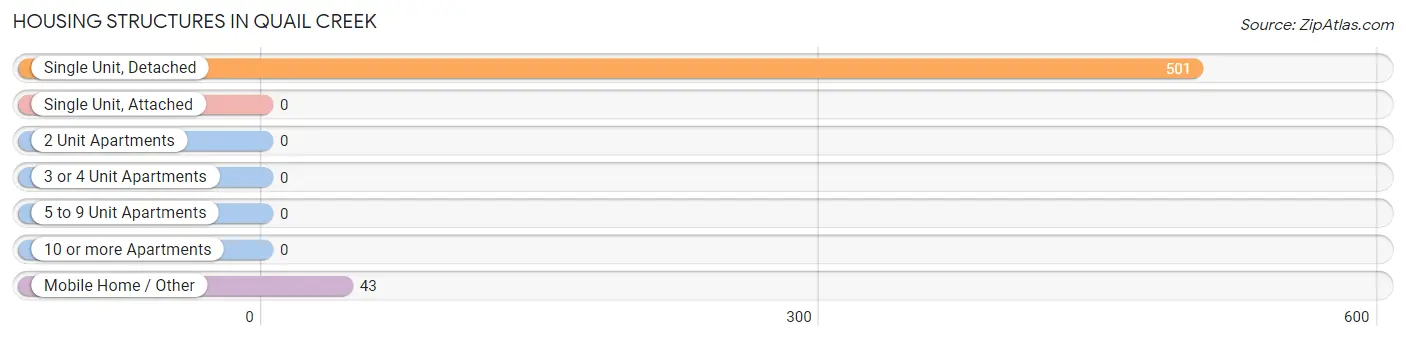
| Structure Type | # Housing Units | % Housing Units |
| Single Unit, Detached | 501 | 92.1% |
| Single Unit, Attached | 0 | 0.0% |
| 2 Unit Apartments | 0 | 0.0% |
| 3 or 4 Unit Apartments | 0 | 0.0% |
| 5 to 9 Unit Apartments | 0 | 0.0% |
| 10 or more Apartments | 0 | 0.0% |
| Mobile Home / Other | 43 | 7.9% |
| Total | 544 | 100.0% |
Housing Structures by Occupancy in Quail Creek
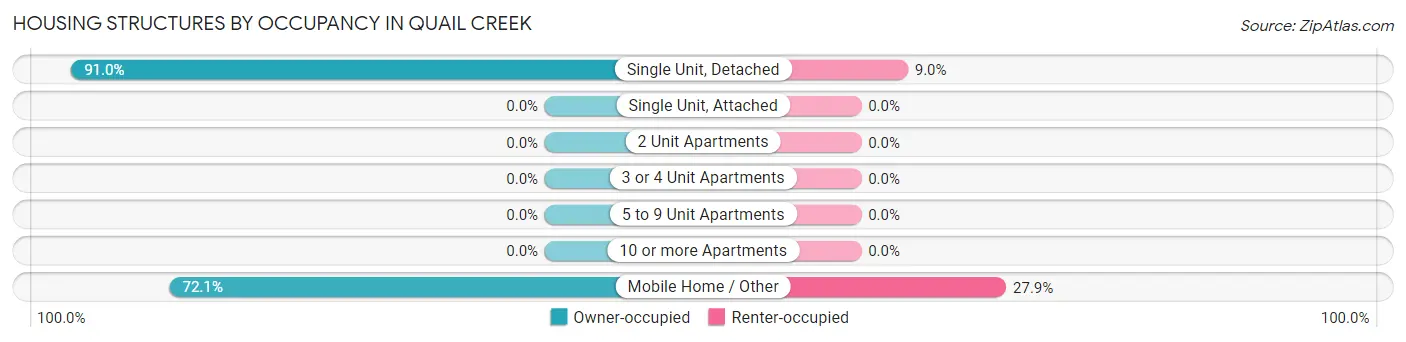
| Structure Type | Owner-occupied | Renter-occupied |
| Single Unit, Detached | 456 (91.0%) | 45 (9.0%) |
| Single Unit, Attached | 0 (0.0%) | 0 (0.0%) |
| 2 Unit Apartments | 0 (0.0%) | 0 (0.0%) |
| 3 or 4 Unit Apartments | 0 (0.0%) | 0 (0.0%) |
| 5 to 9 Unit Apartments | 0 (0.0%) | 0 (0.0%) |
| 10 or more Apartments | 0 (0.0%) | 0 (0.0%) |
| Mobile Home / Other | 31 (72.1%) | 12 (27.9%) |
| Total | 487 (89.5%) | 57 (10.5%) |
Housing Structures by Number of Rooms in Quail Creek
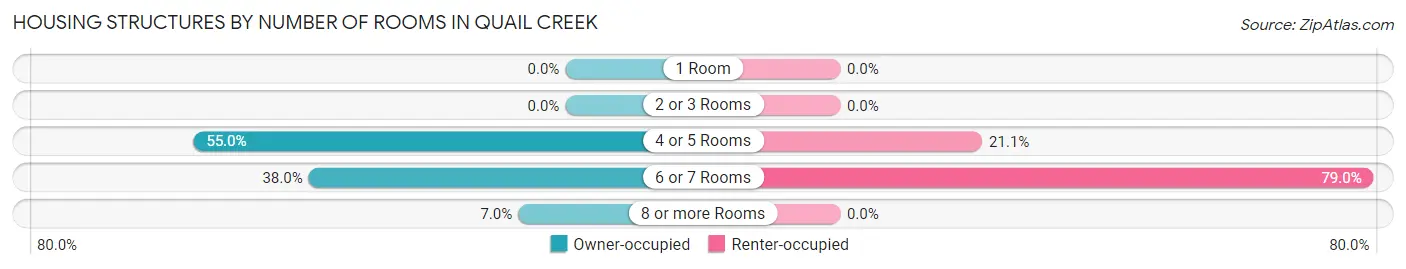
| Number of Rooms | Owner-occupied | Renter-occupied |
| 1 Room | 0 (0.0%) | 0 (0.0%) |
| 2 or 3 Rooms | 0 (0.0%) | 0 (0.0%) |
| 4 or 5 Rooms | 268 (55.0%) | 12 (21.0%) |
| 6 or 7 Rooms | 185 (38.0%) | 45 (78.9%) |
| 8 or more Rooms | 34 (7.0%) | 0 (0.0%) |
| Total | 487 (100.0%) | 57 (100.0%) |
Housing Structure by Heating Type in Quail Creek
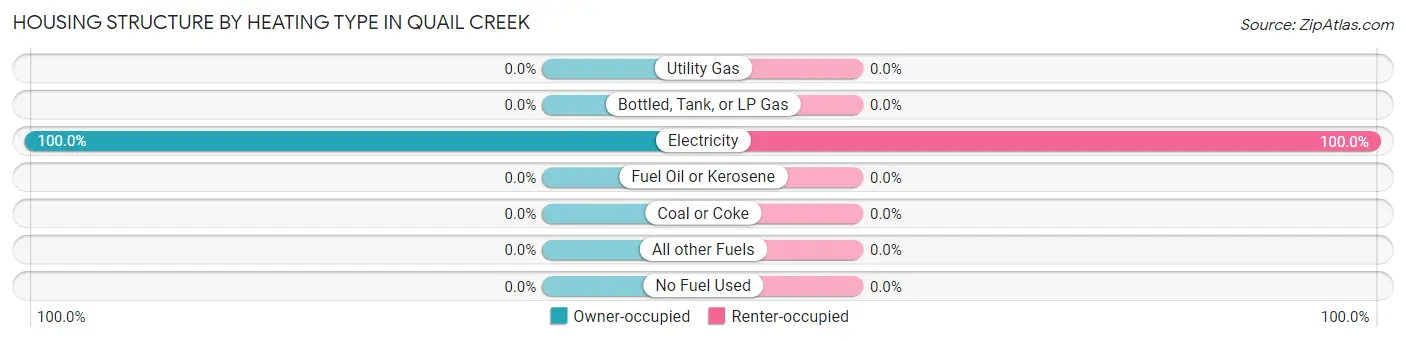
| Heating Type | Owner-occupied | Renter-occupied |
| Utility Gas | 0 (0.0%) | 0 (0.0%) |
| Bottled, Tank, or LP Gas | 0 (0.0%) | 0 (0.0%) |
| Electricity | 487 (100.0%) | 57 (100.0%) |
| Fuel Oil or Kerosene | 0 (0.0%) | 0 (0.0%) |
| Coal or Coke | 0 (0.0%) | 0 (0.0%) |
| All other Fuels | 0 (0.0%) | 0 (0.0%) |
| No Fuel Used | 0 (0.0%) | 0 (0.0%) |
| Total | 487 (100.0%) | 57 (100.0%) |
Household Vehicle Usage in Quail Creek
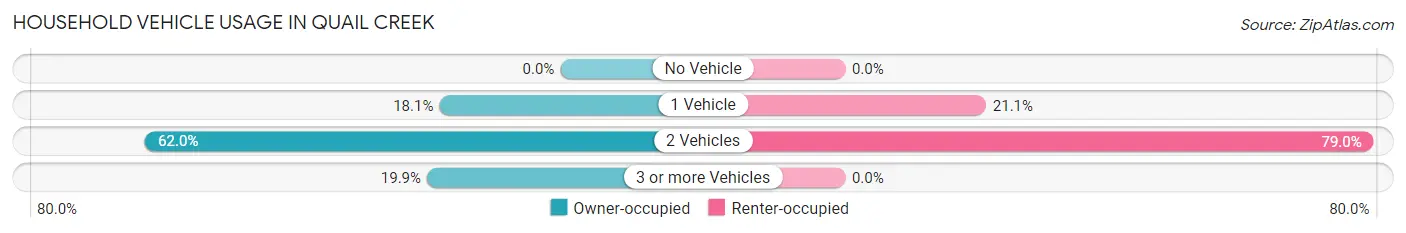
| Vehicles per Household | Owner-occupied | Renter-occupied |
| No Vehicle | 0 (0.0%) | 0 (0.0%) |
| 1 Vehicle | 88 (18.1%) | 12 (21.0%) |
| 2 Vehicles | 302 (62.0%) | 45 (78.9%) |
| 3 or more Vehicles | 97 (19.9%) | 0 (0.0%) |
| Total | 487 (100.0%) | 57 (100.0%) |
Real Estate & Mortgages in Quail Creek
Real Estate and Mortgage Overview in Quail Creek
| Characteristic | Without Mortgage | With Mortgage |
| Housing Units | 198 | 289 |
| Median Property Value | $142,900 | $189,300 |
| Median Household Income | - | - |
| Monthly Housing Costs | $556 | $0 |
| Real Estate Taxes | $3,163 | $11 |
Property Value by Mortgage Status in Quail Creek
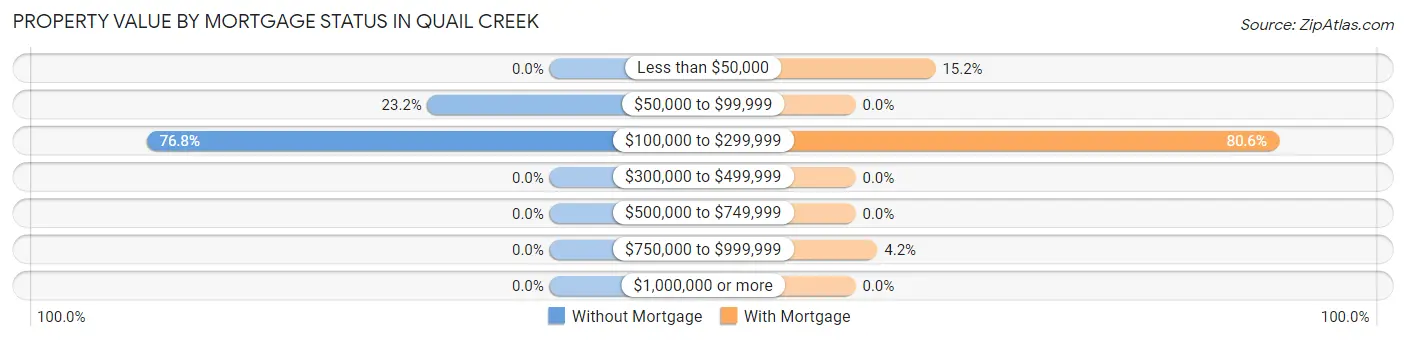
| Property Value | Without Mortgage | With Mortgage |
| Less than $50,000 | 0 (0.0%) | 44 (15.2%) |
| $50,000 to $99,999 | 46 (23.2%) | 0 (0.0%) |
| $100,000 to $299,999 | 152 (76.8%) | 233 (80.6%) |
| $300,000 to $499,999 | 0 (0.0%) | 0 (0.0%) |
| $500,000 to $749,999 | 0 (0.0%) | 0 (0.0%) |
| $750,000 to $999,999 | 0 (0.0%) | 12 (4.2%) |
| $1,000,000 or more | 0 (0.0%) | 0 (0.0%) |
| Total | 198 (100.0%) | 289 (100.0%) |
Household Income by Mortgage Status in Quail Creek
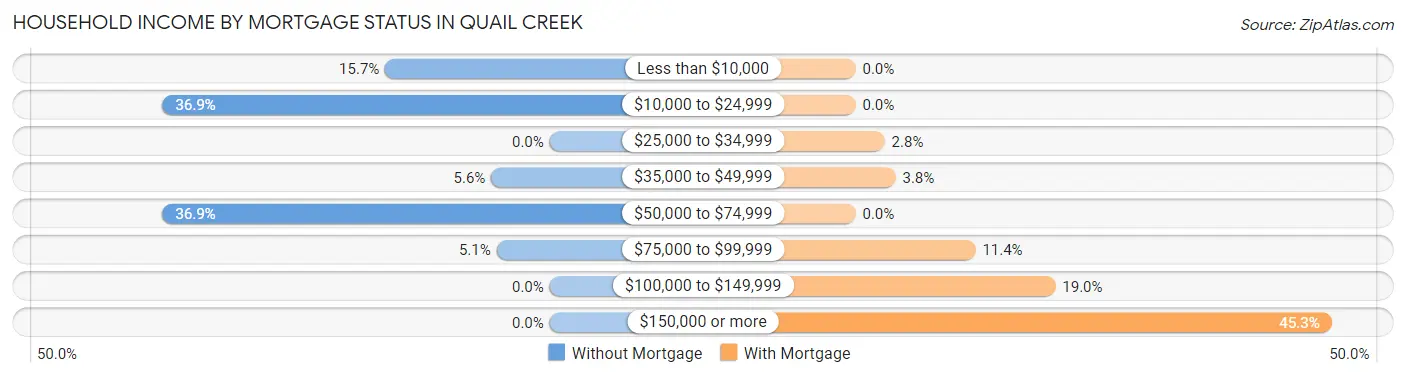
| Household Income | Without Mortgage | With Mortgage |
| Less than $10,000 | 31 (15.7%) | 0 (0.0%) |
| $10,000 to $24,999 | 73 (36.9%) | 0 (0.0%) |
| $25,000 to $34,999 | 0 (0.0%) | 8 (2.8%) |
| $35,000 to $49,999 | 11 (5.6%) | 11 (3.8%) |
| $50,000 to $74,999 | 73 (36.9%) | 0 (0.0%) |
| $75,000 to $99,999 | 10 (5.1%) | 33 (11.4%) |
| $100,000 to $149,999 | 0 (0.0%) | 55 (19.0%) |
| $150,000 or more | 0 (0.0%) | 131 (45.3%) |
| Total | 198 (100.0%) | 289 (100.0%) |
Property Value to Household Income Ratio in Quail Creek
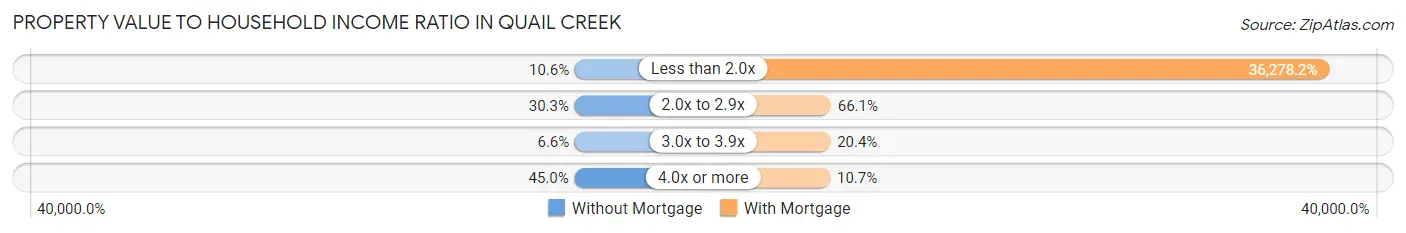
| Value-to-Income Ratio | Without Mortgage | With Mortgage |
| Less than 2.0x | 21 (10.6%) | 104,844 (36,278.2%) |
| 2.0x to 2.9x | 60 (30.3%) | 191 (66.1%) |
| 3.0x to 3.9x | 13 (6.6%) | 59 (20.4%) |
| 4.0x or more | 89 (45.0%) | 31 (10.7%) |
| Total | 198 (100.0%) | 289 (100.0%) |
Real Estate Taxes by Mortgage Status in Quail Creek
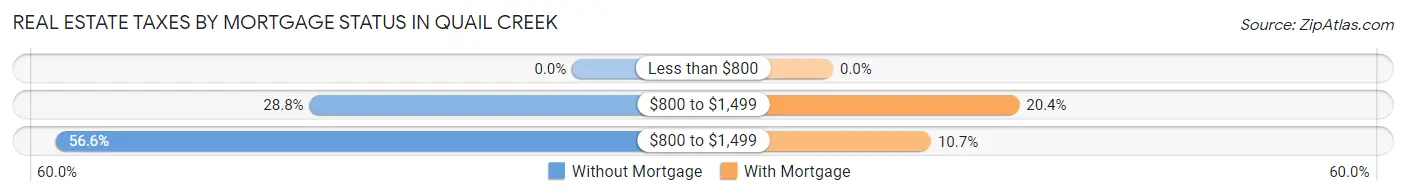
| Property Taxes | Without Mortgage | With Mortgage |
| Less than $800 | 0 (0.0%) | 0 (0.0%) |
| $800 to $1,499 | 57 (28.8%) | 59 (20.4%) |
| $800 to $1,499 | 112 (56.6%) | 31 (10.7%) |
| Total | 198 (100.0%) | 289 (100.0%) |
Health & Disability in Quail Creek
Health Insurance Coverage by Age in Quail Creek
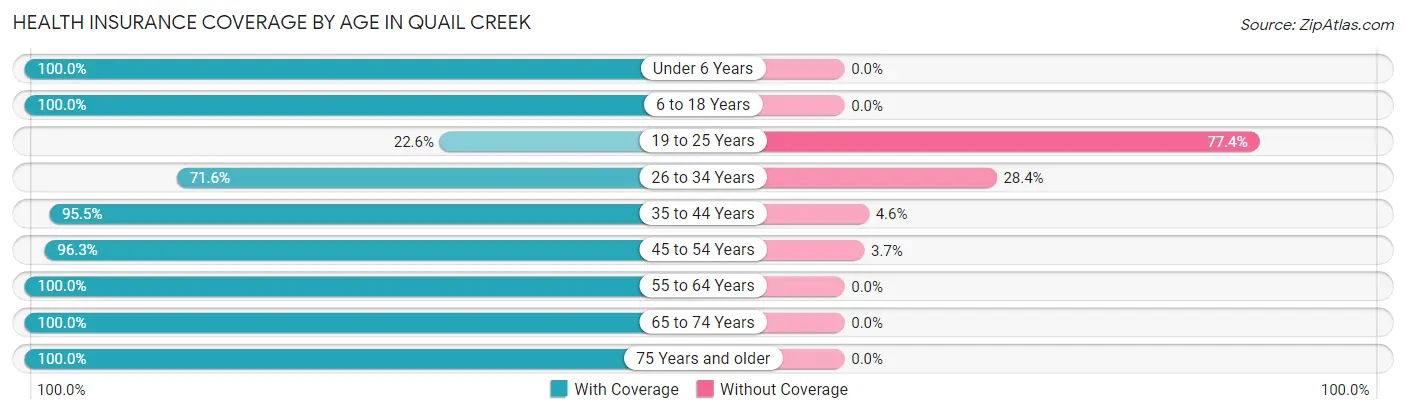
| Age Bracket | With Coverage | Without Coverage |
| Under 6 Years | 36 (100.0%) | 0 (0.0%) |
| 6 to 18 Years | 174 (100.0%) | 0 (0.0%) |
| 19 to 25 Years | 14 (22.6%) | 48 (77.4%) |
| 26 to 34 Years | 154 (71.6%) | 61 (28.4%) |
| 35 to 44 Years | 189 (95.5%) | 9 (4.5%) |
| 45 to 54 Years | 130 (96.3%) | 5 (3.7%) |
| 55 to 64 Years | 260 (100.0%) | 0 (0.0%) |
| 65 to 74 Years | 147 (100.0%) | 0 (0.0%) |
| 75 Years and older | 74 (100.0%) | 0 (0.0%) |
| Total | 1,178 (90.5%) | 123 (9.5%) |
Health Insurance Coverage by Citizenship Status in Quail Creek
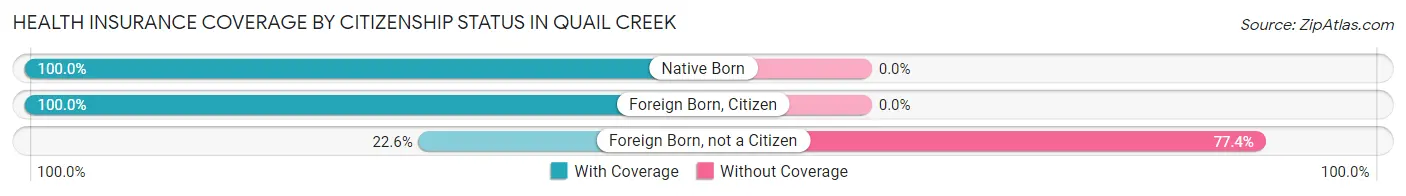
| Citizenship Status | With Coverage | Without Coverage |
| Native Born | 36 (100.0%) | 0 (0.0%) |
| Foreign Born, Citizen | 174 (100.0%) | 0 (0.0%) |
| Foreign Born, not a Citizen | 14 (22.6%) | 48 (77.4%) |
Health Insurance Coverage by Household Income in Quail Creek
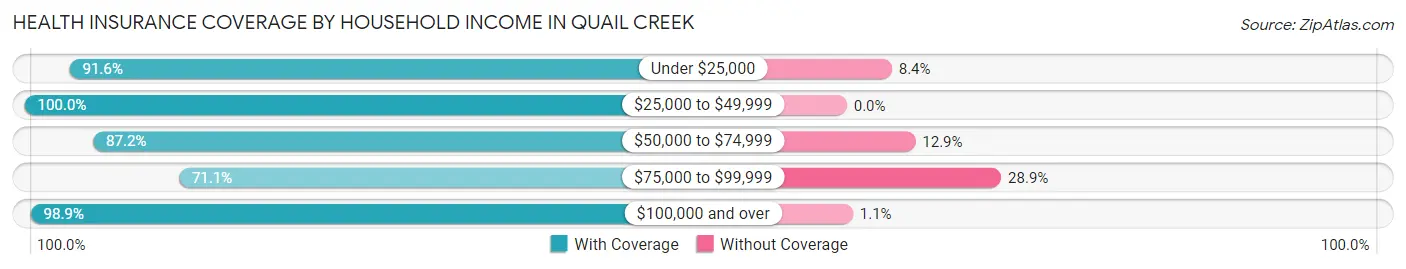
| Household Income | With Coverage | Without Coverage |
| Under $25,000 | 163 (91.6%) | 15 (8.4%) |
| $25,000 to $49,999 | 85 (100.0%) | 0 (0.0%) |
| $50,000 to $74,999 | 373 (87.2%) | 55 (12.9%) |
| $75,000 to $99,999 | 118 (71.1%) | 48 (28.9%) |
| $100,000 and over | 438 (98.9%) | 5 (1.1%) |
Public vs Private Health Insurance Coverage by Age in Quail Creek
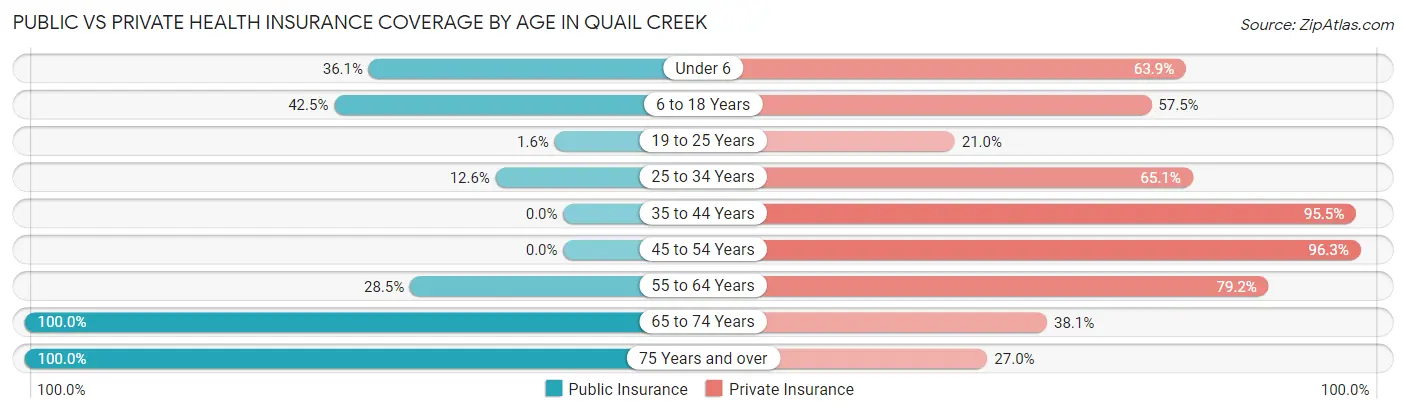
| Age Bracket | Public Insurance | Private Insurance |
| Under 6 | 13 (36.1%) | 23 (63.9%) |
| 6 to 18 Years | 74 (42.5%) | 100 (57.5%) |
| 19 to 25 Years | 1 (1.6%) | 13 (21.0%) |
| 25 to 34 Years | 27 (12.6%) | 140 (65.1%) |
| 35 to 44 Years | 0 (0.0%) | 189 (95.5%) |
| 45 to 54 Years | 0 (0.0%) | 130 (96.3%) |
| 55 to 64 Years | 74 (28.5%) | 206 (79.2%) |
| 65 to 74 Years | 147 (100.0%) | 56 (38.1%) |
| 75 Years and over | 74 (100.0%) | 20 (27.0%) |
| Total | 410 (31.5%) | 877 (67.4%) |
Disability Status by Sex by Age in Quail Creek
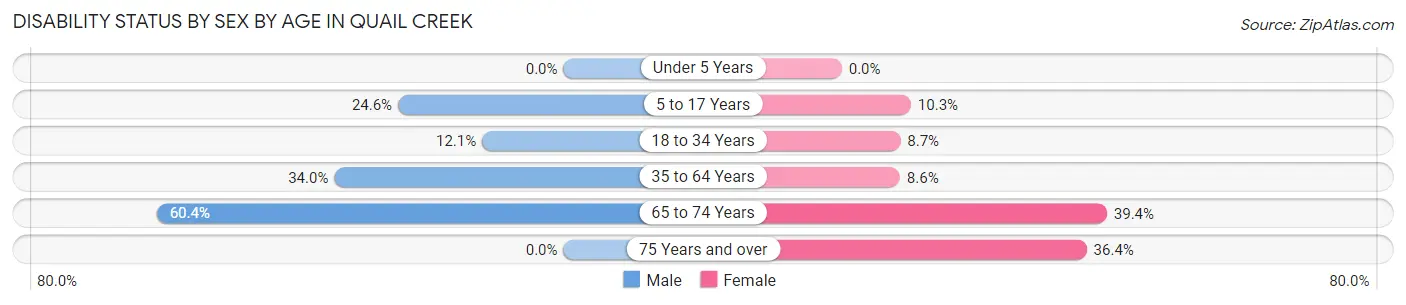
| Age Bracket | Male | Female |
| Under 5 Years | 0 (0.0%) | 0 (0.0%) |
| 5 to 17 Years | 14 (24.6%) | 12 (10.3%) |
| 18 to 34 Years | 14 (12.1%) | 14 (8.7%) |
| 35 to 64 Years | 115 (34.0%) | 22 (8.6%) |
| 65 to 74 Years | 32 (60.4%) | 37 (39.4%) |
| 75 Years and over | 0 (0.0%) | 8 (36.4%) |
Disability Class by Sex by Age in Quail Creek
Disability Class: Hearing Difficulty
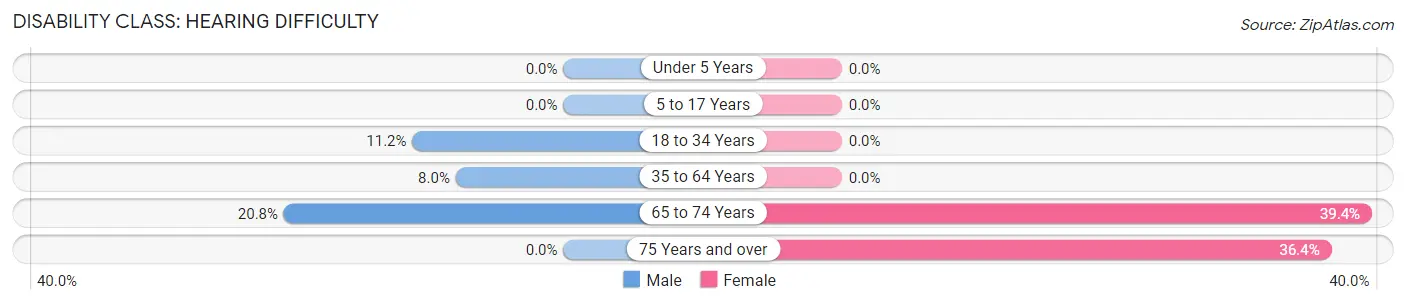
| Age Bracket | Male | Female |
| Under 5 Years | 0 (0.0%) | 0 (0.0%) |
| 5 to 17 Years | 0 (0.0%) | 0 (0.0%) |
| 18 to 34 Years | 13 (11.2%) | 0 (0.0%) |
| 35 to 64 Years | 27 (8.0%) | 0 (0.0%) |
| 65 to 74 Years | 11 (20.7%) | 37 (39.4%) |
| 75 Years and over | 0 (0.0%) | 8 (36.4%) |
Disability Class: Vision Difficulty
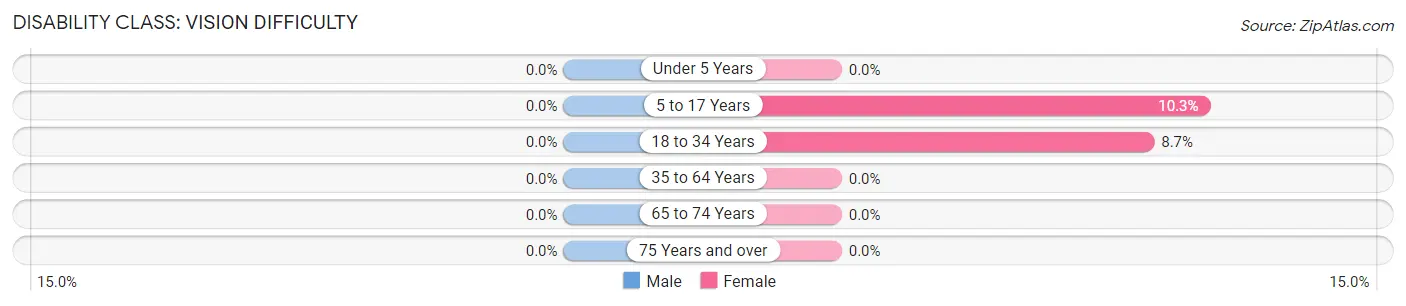
| Age Bracket | Male | Female |
| Under 5 Years | 0 (0.0%) | 0 (0.0%) |
| 5 to 17 Years | 0 (0.0%) | 12 (10.3%) |
| 18 to 34 Years | 0 (0.0%) | 14 (8.7%) |
| 35 to 64 Years | 0 (0.0%) | 0 (0.0%) |
| 65 to 74 Years | 0 (0.0%) | 0 (0.0%) |
| 75 Years and over | 0 (0.0%) | 0 (0.0%) |
Disability Class: Cognitive Difficulty
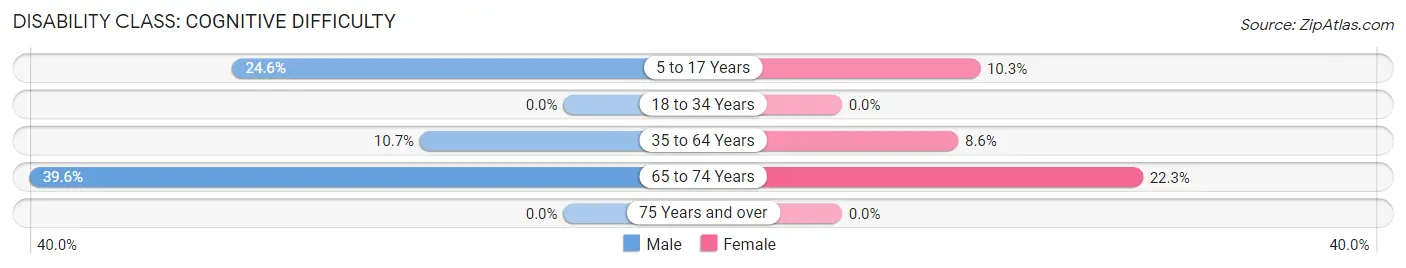
| Age Bracket | Male | Female |
| 5 to 17 Years | 14 (24.6%) | 12 (10.3%) |
| 18 to 34 Years | 0 (0.0%) | 0 (0.0%) |
| 35 to 64 Years | 36 (10.6%) | 22 (8.6%) |
| 65 to 74 Years | 21 (39.6%) | 21 (22.3%) |
| 75 Years and over | 0 (0.0%) | 0 (0.0%) |
Disability Class: Ambulatory Difficulty
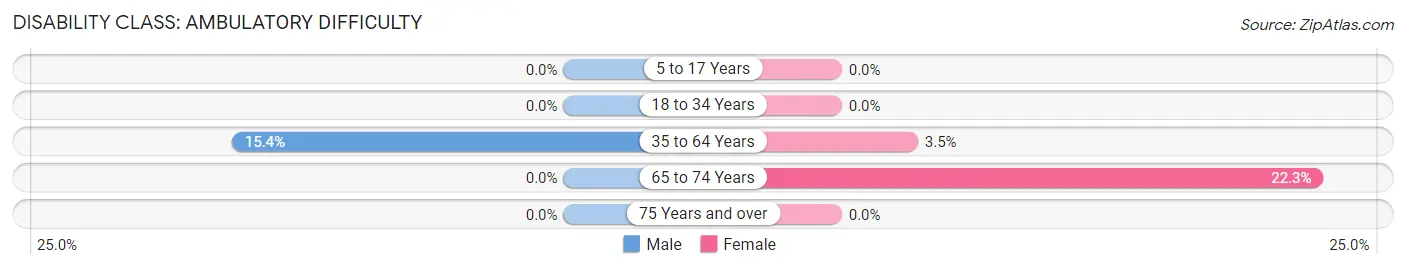
| Age Bracket | Male | Female |
| 5 to 17 Years | 0 (0.0%) | 0 (0.0%) |
| 18 to 34 Years | 0 (0.0%) | 0 (0.0%) |
| 35 to 64 Years | 52 (15.4%) | 9 (3.5%) |
| 65 to 74 Years | 0 (0.0%) | 21 (22.3%) |
| 75 Years and over | 0 (0.0%) | 0 (0.0%) |
Disability Class: Self-Care Difficulty
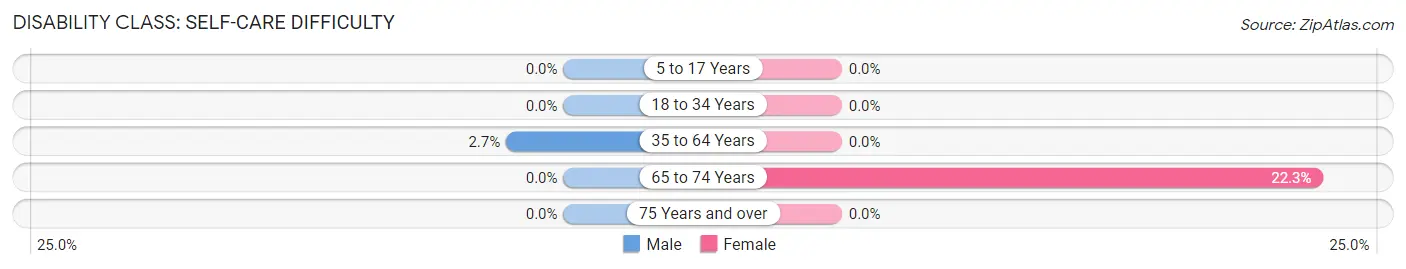
| Age Bracket | Male | Female |
| 5 to 17 Years | 0 (0.0%) | 0 (0.0%) |
| 18 to 34 Years | 0 (0.0%) | 0 (0.0%) |
| 35 to 64 Years | 9 (2.7%) | 0 (0.0%) |
| 65 to 74 Years | 0 (0.0%) | 21 (22.3%) |
| 75 Years and over | 0 (0.0%) | 0 (0.0%) |
Technology Access in Quail Creek
Computing Device Access in Quail Creek
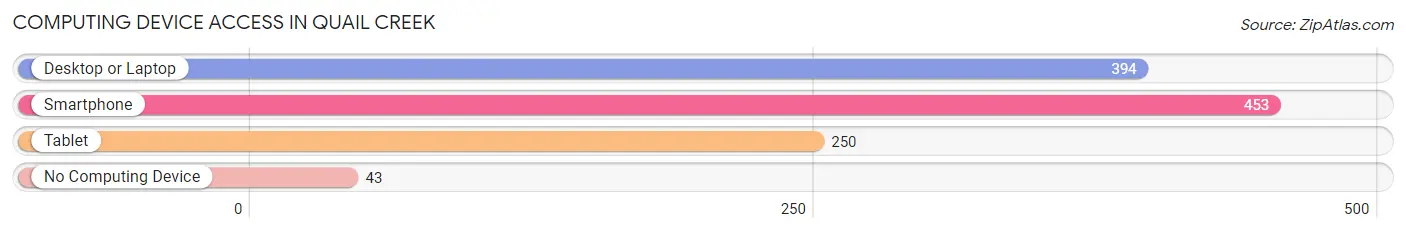
| Device Type | # Households | % Households |
| Desktop or Laptop | 394 | 72.4% |
| Smartphone | 453 | 83.3% |
| Tablet | 250 | 46.0% |
| No Computing Device | 43 | 7.9% |
| Total | 544 | 100.0% |
Internet Access in Quail Creek
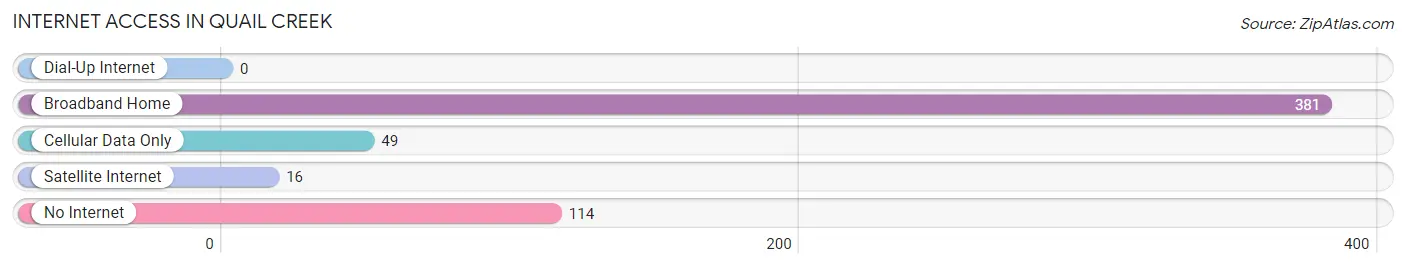
| Internet Type | # Households | % Households |
| Dial-Up Internet | 0 | 0.0% |
| Broadband Home | 381 | 70.0% |
| Cellular Data Only | 49 | 9.0% |
| Satellite Internet | 16 | 2.9% |
| No Internet | 114 | 21.0% |
| Total | 544 | 100.0% |
Quail Creek Summary
Quail Creek is a small unincorporated community located in the western part of Texas, in the county of Hays. It is situated about 25 miles south of Austin, the state capital. The population of Quail Creek was estimated to be around 1,000 people in 2000.
History
The area that is now Quail Creek was first settled in the late 1800s by German immigrants. The town was originally called “Kuhl”, after the German word for “cool”. The name was changed to Quail Creek in the early 1900s, when the local post office was established.
The town was a small farming community for many years, with the main crops being cotton, corn, and hay. In the 1950s, the town began to grow as more people moved to the area. The population increased from around 500 in 1950 to over 1,000 in 2000.
Geography
Quail Creek is located in the western part of Texas, in the county of Hays. It is situated about 25 miles south of Austin, the state capital. The town is located in the Hill Country region of Texas, which is characterized by rolling hills and limestone outcroppings.
The climate in Quail Creek is generally mild, with hot summers and cool winters. The average annual temperature is around 70 degrees Fahrenheit. The average annual rainfall is around 30 inches.
Economy
The economy of Quail Creek is largely based on agriculture. The main crops grown in the area are cotton, corn, and hay. The town also has a few small businesses, such as a grocery store, a hardware store, and a few restaurants.
The town is also home to a few small manufacturing companies, such as a furniture factory and a metal fabrication plant. The town also has a few small service businesses, such as a gas station and a car repair shop.
Demographics
The population of Quail Creek was estimated to be around 1,000 people in 2000. The town is predominantly white, with around 95% of the population being Caucasian. The remaining 5% of the population is made up of African Americans, Hispanics, and Native Americans.
The median household income in Quail Creek is around $35,000 per year. The median home value is around $100,000. The town has a low unemployment rate, with only around 4% of the population being unemployed.
Conclusion
Quail Creek is a small unincorporated community located in the western part of Texas, in the county of Hays. It is situated about 25 miles south of Austin, the state capital. The population of Quail Creek was estimated to be around 1,000 people in 2000. The town is predominantly white, with around 95% of the population being Caucasian. The economy of Quail Creek is largely based on agriculture, with the main crops being cotton, corn, and hay. The town also has a few small businesses, such as a grocery store, a hardware store, and a few restaurants. The median household income in Quail Creek is around $35,000 per year. The town has a low unemployment rate, with only around 4% of the population being unemployed.
Common Questions
What is Per Capita Income in Quail Creek?
Per Capita income in Quail Creek is $39,292.
What is the Median Family Income in Quail Creek?
Median Family Income in Quail Creek is $76,776.
What is the Median Household income in Quail Creek?
Median Household Income in Quail Creek is $75,556.
What is Income or Wage Gap in Quail Creek?
Income or Wage Gap in Quail Creek is 29.7%.
Women in Quail Creek earn 70.3 cents for every dollar earned by a man.
What is Inequality or Gini Index in Quail Creek?
Inequality or Gini Index in Quail Creek is 0.45.
What is the Total Population of Quail Creek?
Total Population of Quail Creek is 1,301.
What is the Total Male Population of Quail Creek?
Total Male Population of Quail Creek is 616.
What is the Total Female Population of Quail Creek?
Total Female Population of Quail Creek is 685.
What is the Ratio of Males per 100 Females in Quail Creek?
There are 89.93 Males per 100 Females in Quail Creek.
What is the Ratio of Females per 100 Males in Quail Creek?
There are 111.20 Females per 100 Males in Quail Creek.
What is the Median Population Age in Quail Creek?
Median Population Age in Quail Creek is 43.4 Years.
What is the Average Family Size in Quail Creek
Average Family Size in Quail Creek is 2.5 People.
What is the Average Household Size in Quail Creek
Average Household Size in Quail Creek is 2.4 People.
How Large is the Labor Force in Quail Creek?
There are 656 People in the Labor Forcein in Quail Creek.
What is the Percentage of People in the Labor Force in Quail Creek?
59.7% of People are in the Labor Force in Quail Creek.
What is the Unemployment Rate in Quail Creek?
Unemployment Rate in Quail Creek is 12.8%.